UNITED STATES
SECURITIES AND EXCHANGE COMMISSION
Washington, D.C. 20549
FORM N-CSR
CERTIFIED SHAREHOLDER REPORT OF REGISTERED
MANAGEMENT INVESTMENT COMPANIES
Investment Company Act file number | 811-09645 |
|
Columbia Funds Series Trust |
(Exact name of registrant as specified in charter) |
|
One Financial Center, Boston, Massachusetts | | 02111 |
(Address of principal executive offices) | | (Zip code) |
|
James R. Bordewick, Jr., Esq. Columbia Management Advisors, LLC One Financial Center Boston, MA 02111 |
(Name and address of agent for service) |
|
Registrant’s telephone number, including area code: | 1-617-426-3750 | |
|
Date of fiscal year end: | February 28 | |
|
Date of reporting period: | February 28, 2009 | |
| | | | | | | | |
Form N-CSR is to be used by management investment companies to file reports with the Commission not later than 10 days after the transmission to stockholders of any report that is required to be transmitted to stockholders under Rule 30e-1 under the Investment Company Act of 1940 (17 CFR 270.30e-1). The Commission may use the information provided on Form N-CSR in its regulatory, disclosure review, inspection, and policymaking roles.
A registrant is required to disclose the information specified by Form N-CSR, and the Commission will make this information public. A registrant is not required to respond to the collection of information contained in Form N-CSR unless the Form displays a currently valid Office of Management and Budget ("OMB") control number. Please direct comments concerning the accuracy of the information collection burden estimate and any suggestions for reducing the burden to Secretary, Securities and Exchange Commission, 450 Fifth Street, NW, Washington, DC 20549-0609. The OMB has reviewed this collection of information under the clearance requirements of 44 U.S.C. § 3507.
Item 1. Reports to Stockholders.
Columbia Management®
Annual Report
February 28, 2009
Stock Funds
g Columbia Convertible Securities Fund
g Columbia Large Cap Value Fund
g Columbia Mid Cap Value Fund
g Columbia Small Cap Value Fund II
g Columbia Marsico Growth Fund
g Columbia Large Cap Core Fund
g Columbia Marsico Focused Equities Fund
g Columbia Marsico 21st Century Fund
g Columbia Small Cap Growth Fund II
| NOT FDIC INSURED | | May Lose Value | |
|
| NOT BANK ISSUED | | No Bank Guarantee | |
|
Table of Contents
| Economic Update | | | 1 | | |
|
Columbia Convertible
Securities Fund | | | 3 | | |
|
| Columbia Large Cap Value Fund | | | 8 | | |
|
| Columbia Mid Cap Value Fund | | | 13 | | |
|
Columbia Small Cap
Value Fund II | | | 18 | | |
|
| Columbia Marsico Growth Fund | | | 23 | | |
|
| Columbia Large Cap Core Fund | | | 28 | | |
|
Columbia Marsico Focused
Equities Fund | | | 33 | | |
|
Columbia Marsico
21st Century Fund | | | 38 | | |
|
Columbia Small Cap Growth
Fund II | | | 43 | | |
|
| Investment Portfolios | | | 48 | | |
|
| Financial Statements | | | 80 | | |
|
| Notes to Financial Statements | | | 144 | | |
|
Report of Independent Registered
Public Accounting Firm | | | 162 | | |
|
| Federal Income Tax Information | | | 163 | | |
|
| Fund Governance | | | 164 | | |
|
Board Consideration and
Re-Approval of Investment Advisory
and Sub-Advisory Agreements | | | 168 | | |
|
Summary of Management Fee
Evaluation by Independent
Fee Consultant | | | 172 | | |
|
Important Information About
This Report | | | 177 | | |
|
The views expressed in this report reflect the current views of the respective parties. These views are not guarantees of future performance and involve certain risks, uncertainties and assumptions that are difficult to predict so actual outcomes and results may differ significantly from the views expressed. These views are subject to change at any time based upon economic, market or other conditions and the respective parties disclaim any responsibility to update such views. These views may not be relied on as investment advice and, because investment decisions for a Columbia Fund are based on numerous factors, may not be relied on as an indication of trading intent on behalf of any particular Columbia Fund. References to specific securities should not be construed as a recommendation or investment advice.
President's Message

Dear Shareholder:
Recent events have shown great volatility in the markets and uncertainty in the economy. During these challenging times, it becomes even more important to focus on long-term horizons and key investment tools that can help manage volatility. This may be the time to reflect on your investment goals and evaluate your portfolio to ensure you are positioned for any potential market rebound.
A long-term financial plan can serve as a road map and guide you through the necessary steps designed to meet your financial goals. Your financial plan should take into account your investment goals, time horizon, overall financial situation, risk tolerance and willingness to ride out market volatility. Your investment professional can be a key resource as you work through this process. The knowledge and experience of an investment professional can help as you create or reevaluate your investment strategy.
The importance of diversification
Although diversification does not ensure a profit or guarantee against loss, a diversified portfolio can be a strategy for successful long-term investing. Diversification refers to the mix of investments within a portfolio. A mutual fund can contribute to portfolio diversification given that a mutual fund's portfolio represents several investments. Additionally, the way you allocate your money among stocks, bonds and cash, and geographically between foreign and domestic investments, can help to reduce risks. Diversification can result in multiple investments where the positive performance of certain holdings can offset any negative performance from other holdings. Having a diversified portfolio doesn't mean that the value of the portfolio will never go down, but rather helps strike a balance between risk and reward.
Reevaluate your strategy
An annual review of your investments is a key opportunity to determine if your investment needs have changed or if you need minor adjustments to rebalance your portfolio. Life events like a birth, marriage, home improvement, or change in employment can have a major affect on your spending and goals. Ask yourself how your spending or goals have changed and factor this into your financial plan. Are you using automated investments or payroll deductions to help keep your savings on track? Are you able to set aside additional savings or increase your 401(k) plan contributions? If during your review you find that your investments in any one category (e.g., stocks, bonds or cash) have grown too large based on your diversification plan, you may want to consider redirecting future investments to get back on track.
History has shown that the U.S. stock market has been remarkably resilient1. Volatility can lead to opportunity. Patience and a commitment to your long-term financial plan may position you to potentially benefit over your investment horizon. We appreciate your business and continued support of Columbia Funds.
Sincerely,

J. Kevin Connaughton
President, Columbia Funds
The board of trustees elected J. Kevin Connaughton president of Columbia Funds on January 16, 2009.
1The Dow Jones Industrial Average is the most widely used indicator of the overall condition of the stock market. The Dow Jones Industrial Average Index is a price-weighted average of 30 actively traded blue-chip stocks as selected by the editors of the Wall Street Journal. Indices are not investments, do not incur fees or expenses and are not professionally managed. It is not possible to invest directly in an index.
Economic Update – Stock Funds
The pace of economic growth ground to a halt during the 12-month period that began March 1, 2008 and ended February 28, 2009. The National Bureau of Economic Research reported that the U.S. economy had slipped into recession late in 2007 and the downturn was even sharper than anticipated. Fourth quarter 2008 growth was estimated at negative 6.3%—the worst quarter on record for the U.S. economy since 1982.
A host of factors weighed on consumers and businesses alike. The most severe housing downturn in decades showed no sign of abating as inventories of homes for sale rose, home prices declined and tighter credit standards, the result of continued turmoil in the subprime mortgage market, made it more difficult for homebuyers to qualify for loans. The labor market has contracted for 14 consecutive months, driving the unemployment rate to 8.1%, the highest rate since 1983. An estimated 3.6 million jobs have been lost since the recession commenced late in 2007, with announced layoffs likely to drive that number even higher in 2009. Manufacturing activity slowed and consumer spending declined, resulting in one of the weakest holiday seasons in decades. However, sales in chain stores showed a glimmer of hope in February, edging lower but holding up much better than analysts predicted. Wholesale clubs and discounters actually registered a gain for the month, underscoring the migration toward frugality among Americans hit hard by job, investment and home equity losses.
A weakening economy and turmoil in the financial markets took a toll on consumer confidence, which continued to set new all-time lows for the 40-year history of the monthly survey. Consumer confidence is surveyed monthly by The Conference Board.
In an effort to restore confidence in the capital markets, loosen the reins on credit and shore up economic growth, the Federal Reserve Board (the Fed) brought a key short-term rate—the Federal Funds Rate—down from 3.00% to a target between zero and 0.25% during the 12-month period—a record low. However, the Fed's efforts went largely unrewarded. In fact, the one bright spot during this period of uncertainty was lower energy and commodity prices. With oil trading near $40 per barrel at the end of the period, gasoline prices have come down from $4 per gallon or more last summer to around $2 per gallon in recent months.
Stocks retreat as economic outlook darkens
Against a shifting economic backdrop, the U.S. stock market lost 43.32% for the 12-month period, as measured by the S&P 500 Index. Losses extended across all market caps and both growth and value, although growth stocks held up better than value stocks, as measured by their respective Russell indices.1 Stock markets outside the U.S. suffered even greater losses. The MSCI EAFE Index, a broad gauge of stock market performance in foreign developed markets, lost 50.22% (in U.S. dollars) for the
1The Russell 1000 Index measures the performance of 1,000 of the largest US companies, based on market capitalization. The Russell Midcap Index measures the performance of the 800 smallest companies in the Russell 1000 Index, as ranked by total market capitalization. The Russell 2000 Index measures the performance of the 2,000 smallest of the 3,000 largest US companies, based on market capitalization.
Indices are not investments, do not incur fees or expenses and are not professionally managed. It is not possible to invest directly in an index. Securities in the fund may not match those in an index.
Summary
For the 12-month period that ended February 28, 2009
g The broad U.S. stock market, as measured by the S&P 500 Index, returned negative 43.32%. Stock markets outside the United States returned negative 50.22%, as measured (in U.S. dollars) by the MSCI EAFE Index.
| S&P Index | | MSCI Index | |
|
 | |  | |
|
g Despite volatility in many segments of the bond market, the Barclays Capital U.S. Aggregate Bond Index delivered a modest gain. High-yield bonds lost significant ground, as measured by the Merrill Lynch High Yield U.S. Corporates, Cash Pay Index. Municipals recovered from an early setback, as measured by the Barclays Municipal Bond Index.
Barclays
Aggregate Index | | Merrill
Lynch Index | |
|
 | |  | |
|
Barclays
Municipal Index | | | |
|
 | | | |
|
The Standard & Poor's (S&P) 500 Index tracks the performance of 500 widely held, large-capitalization US stocks.
The Morgan Stanley Capital International (MSCI) Europe, Australasia, Far East (EAFE) Index is a free float-adjusted market capitalization index
1
Economic Update (continued) – Stock Funds
that is designed to measure developed market equity performance, excluding the US and Canada.
The Barclays Capital U.S. Aggregate Bond Index (formerly the Lehman Brothers U.S. Aggregate Bond Index) is a market value-weighted index that tracks the daily price, coupon, pay-downs and total return performance of fixed-rate, publicly placed, dollar-denominated and non-convertible investment grade debt issues with at least $250 million par amount outstanding and with at least one year to final maturity.
The Merrill Lynch High Yield U.S. Corporates, Cash Pay Index tracks the performance of non-investment-grade corporate bonds. As of 01/01/2009, Merrill Lynch & Co., Inc. is a wholly-owned subsidiary of Bank of America Corporation and an affiliate of Columbia Management.
The Barclays Capital Municipal Bond Index (formerly the Lehman Brothers Municipal Bond Index) is considered representative of the broad market for investment-grade, tax-exempt bonds with maturities of at least one year.
Indices are not investments, do not incur fees or expenses and are not professionally managed. It is not possible to invest directly in an index. Securities in the fund may not match those in an index.
period. Emerging stock markets, which generally have had a strong run over the past several years, were also caught in the downdraft. As investors backed away from risk, emerging markets suffered most of all. The MSCI Emerging Markets Index returned negative 56.03% (in U.S. dollars).2
Some bond sectors deliver positive returns
The U.S. bond market seesawed during the 12-month period but several sectors managed to deliver modest gains as investors sought refuge from the volatile stock market. Treasury prices rose and yields declined as the economy faltered and stock market volatility increased. The benchmark 10-year U.S. Treasury yield ended the period at just over 3.0%. In this environment, the Barclays Capital U.S. Aggregate Bond Index returned 2.06%. High-yield bonds took a beating as economic prospects weakened and default fears rose. The Merrill Lynch High Yield U.S. Corporates, Cash Pay Index returned negative 22.97%. The municipal market suffered a setback early in 2008, then rebounded strongly. The Barclays Capital Municipal Bond Index returned 5.18% for the 12-month period.
Past performance is no guarantee of future results.
2The MSCI Emerging Markets Index is a widely accepted index composed of a sample of companies from 25 countries representing the global emerging stock markets.
Indices are not investments, do not incur fees or expenses and are not professionally managed. It is not possible to invest directly in an index. Securities in the fund may not match those in an index.
2
Fund Profile – Columbia Convertible Securities Fund
Summary
g For the 12-month period that ended February 28, 2009, the fund's Class A shares returned negative 30.64% without sales charge.
g In a challenging environment for nearly all financial markets, the fund performed better than its benchmark and peer group average, losing approximately five percentage points less than its benchmark, the Merrill Lynch All Convertible All Qualities Index1 and approximately two percentage points less than its peer group average, the Lipper Convertible Securities Funds Classification2.
g The fund performed better than its benchmark and peer group average by taking a cautious approach to economically vulnerable sectors.
Portfolio Management
Yanfang (Emma) Yan, lead manager of the fund since July 2001 and has been associated with the advisor or its predecessors or affiliate organizations since 2001.
Richard Dahlberg has co-managed the fund since May 2004 and has been associated with the advisor or its predecessors or affiliate organizations since 2003.
Yan Jin has co-managed the fund since March 2006 and has been associated with the advisor or its predecessors or affiliate organizations since 2002.
1The Merrill Lynch All Convertibles All Qualities Index measures the performance of US dollar-denominated convertible securities of issuers not currently in bankruptcy. Securities in the index have a total market value greater than $50 million at issuance. Indices are not investments, do not incur fees or expenses and are not professionally managed. It is not possible to invest directly in an index. Securities in the fund may not match those in an index.
As of 01/01/2009, Merrill Lynch & Co., Inc. is a wholly-owned subsidiary of Bank of America Corporation and an affiliate of Columbia Management.
2Lipper Inc., a widely respected data provider in the industry, calculates an average total return (assuming reinvestment of distributions) for mutual funds with investment objectives similar to those of the fund. Lipper makes no adjustment for the effect of sales loads.
Performance data quoted represents past performance and current performance may be lower or higher. Past performance is no guarantee of future results. The investment return and principal value will fluctuate so that shares, when redeemed, may be worth more or less than the original cost. Please visit www.columbiafunds.com for daily and most recent month-end performance updates.
Summary
1-year return as of 02/28/09
| | | –30.64% | |
|
| |  | | | Class A shares
(without sales charge) | |
|
| | | –35.69% | |
|
| |  | | | Merrill Lynch All Convertibles All Qualities Index | |
|
3
Performance Information – Columbia Convertible Securities Fund
Performance data quoted represents past performance and current performance may be lower or higher. Past performance is no guarantee of future results. The investment return and principal value will fluctuate so that shares, when redeemed, may be worth more or less than the original cost. Please visit www.columbiafunds.com for daily and most recent month-end performance updates.
Annual operating expense ratio (%)*
| Class A | | | 1.22 | | |
| Class B | | | 1.97 | | |
| Class C | | | 1.97 | | |
| Class Z | | | 0.97 | | |
*The annual operating expense ratio is as stated in the fund's prospectus that is current as of the date of this report. Differences in expense ratios disclosed elsewhere in this report may result from including fee waivers and expense reimbursements as well as different time periods used in calculating the ratios.
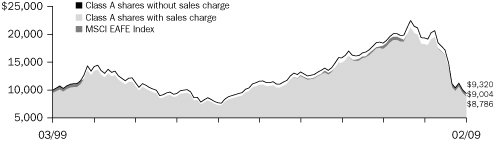
Performance of a $10,000 investment 03/01/99 – 02/28/09 ($)
The chart above shows the change in value of a hypothetical $10,000 investment in Class A shares of Columbia Convertible Securities Fund during the stated time period, and does not reflect the deduction of taxes that a shareholder may pay on fund distributions or on the redemption of fund shares. The Merrill Lynch All Convertibles All Qualities Index measures the performance of US dollar-denominated convertible securities of issuers not currently in bankruptcy. Securities in the index have a market value greater than $50 million at issuance. Indices are not investments, do not incur fees or expenses and are not professionally managed. It is not possible to invest directly in an index. Securities in the fund may not match those in an index. As of 01/01/2009, Merrill Lynch & Co., Inc. is a wholly owned subsidiary of Bank of America Corporation and an affiliate of Columbia Management.
Performance of a $10,000 investment 03/01/99 – 02/28/09 ($)
| Sales charge | | without | | with | |
| Class A | | | 13,344 | | | | 12,575 | | |
| Class B | | | 12,384 | | | | 12,384 | | |
| Class C | | | 12,390 | | | | 12,390 | | |
| Class Z | | | 13,820 | | | | n/a | | |
Average annual total return as of 02/28/09 (%)
| Share class | | A | | B | | C | | Z | |
| Inception | | 09/25/87 | | 07/15/98 | | 10/21/96 | | 05/21/99 | |
| Sales charge | | without | | with | | without | | with | | without | | with | | without | |
| 1-year | | | –30.64 | | | | –34.63 | | | | –31.14 | | | | –34.47 | | | | –31.13 | | | | –31.79 | | | | –30.43 | | |
| 5-year | | | –2.96 | | | | –4.10 | | | | –3.68 | | | | –3.95 | | | | –3.68 | | | | –3.68 | | | | –2.70 | | |
| 10-year | | | 2.93 | | | | 2.32 | | | | 2.16 | | | | 2.16 | | | | 2.17 | | | | 2.17 | | | | 3.29 | | |
Average annual total return as of 03/31/09 (%)
| Share class | | A | | B | | C | | Z | |
| Sales charge | | without | | with | | without | | with | | without | | with | | without | |
| 1-year | | | –25.93 | | | | –30.21 | | | | –26.49 | | | | –30.04 | | | | –26.47 | | | | –27.18 | | | | –25.67 | | |
| 5-year | | | –2.17 | | | | –3.32 | | | | –2.91 | | | | –3.17 | | | | –2.89 | | | | –2.89 | | | | –1.90 | | |
| 10-year | | | 3.18 | | | | 2.57 | | | | 2.41 | | | | 2.41 | | | | 2.41 | | | | 2.41 | | | | 3.55 | | |
The "with sales charge" returns include the maximum initial sales charge of 5.75% for Class A shares, the applicable contingent deferred sales charge of 5.00% in the first year, declining to 1.00% in the sixth year, and eliminated thereafter for Class B shares and 1.00% for Class C shares for the first year only. The "without sales charge" returns do not include the effect of sales charges. If they had, returns would be lower.
Performance results reflect any fee waivers or reimbursements of fund expenses by the investment advisor and/or any of its affiliates. Absent these fee waivers or expense reimbursement arrangements, performance results would have been lower.
All results shown assume the reinvestment of distributions. Class Z shares are sold at net asset value with no distribution and service (Rule 12b-1) fees. Class Z shares have limited eligibility and the investment minimum requirements may vary. Please see the fund's prospectus for details. Performance for different share classes will vary based on differences in sales charges and fees associated with each class.
The tables do not reflect the deduction of taxes that a shareholder may pay on fund distributions or on the redemption of fund shares.
Class Z shares commenced operations on May 21, 1999 and have no performance prior to that date. Performance prior to May 21, 1999 is that of Class A shares at net asset value, which reflect distribution and service (Rule 12b-1) fees of 0.25%. These distribution and service (Rule 12b-1) fees are not applicable to Class Z shares.
4
Understanding Your Expenses – Columbia Convertible Securities Fund
As a fund shareholder, you incur two types of costs. There are transaction costs, which generally include sales charges on purchases and may include redemption fees or exchange fees. There are also ongoing costs, which generally include investment advisory fees, distribution and service (Rule 12b-1) fees and other fund expenses. The information on this page is intended to help you understand the ongoing costs of investing in the fund and to compare these costs with the ongoing costs of investing in other mutual funds.
Analyzing your fund's expenses by share class
To illustrate these ongoing costs, we have provided an example and calculated the expenses paid by investors in each share class during the period. The information in the following table is based on an initial investment of $1,000, which is invested at the beginning of the period and held for the entire period. Expense information is calculated two ways and each method provides you with different information. The amount listed in the "Actual" column is calculated using the fund's actual operating expenses and total return for the period. The amount listed in the "Hypothetical" column for each share class assumes that the return each year is 5% before expenses and is calculated based on the fund's actual operating expenses. You should not use the hypothetical account values and expenses to estimate either your actual account balance at the end of the period or the expenses you paid during this period.
Compare with other funds
Since all mutual funds are required to include the same hypothetical calculations about expenses in shareholder reports, you can use this information to compare the ongoing cost of investing in the fund with other funds. To do so, compare the 5% hypothetical example with the 5% hypothetical examples that appear in the shareholder reports of other funds. As you compare hypothetical examples of other funds, it is important to note that hypothetical examples are meant to highlight the ongoing costs of investing in a fund and do not reflect any transaction costs, such as sales charges, redemption fees or exchange fees.
Estimating your actual expenses
To estimate the expenses that you paid over the period, first you will need your account balance at the end of the period:
g For shareholders who receive their account statements from Columbia Management Services, Inc., your account balance is available online at www.columbiafunds.com or by calling Shareholder Services at 800.345.6611.
g For shareholders who receive their account statements from their financial intermediary, contact your financial intermediary to obtain your account balance.
1. Divide your ending account balance by $1,000. For example, if an account balance was $8,600 at the end of the period, the result would be 8.6.
2. In the section of the table below titled "Expenses paid during the period," locate the amount for your share class. You will find this number in the column labeled "Actual." Multiply this number by the result from step 1. Your answer is an estimate of the expenses you paid on your account during the period.
If the value of your account falls below the minimum initial investment requirement applicable to you, your account generally will be subject to a $20 annual fee. This fee is not included in the accompanying table. If you are subject to the fee, keep it in mind when you are estimating the ongoing expenses of investing in the fund and when comparing the expenses of this fund with other funds.
09/01/08 – 02/28/09
| | | Account value at the
beginning of the period ($) | | Account value at the
end of the period ($) | | Expenses paid
during the period ($) | | Fund's annualized
expense ratio (%) | |
| | | Actual | | Hypothetical | | Actual | | Hypothetical | | Actual | | Hypothetical | | Actual | |
| Class A | | | 1,000.00 | | | | 1,000.00 | | | | 729.00 | | | | 1,018.79 | | | | 5.19 | | | | 6.06 | | | | 1.21 | | |
| Class B | | | 1,000.00 | | | | 1,000.00 | | | | 726.62 | | | | 1,015.08 | | | | 8.39 | | | | 9.79 | | | | 1.96 | | |
| Class C | | | 1,000.00 | | | | 1,000.00 | | | | 726.81 | | | | 1,015.08 | | | | 8.39 | | | | 9.79 | | | | 1.96 | | |
| Class Z | | | 1,000.00 | | | | 1,000.00 | | | | 730.68 | | | | 1,020.03 | | | | 4.12 | | | | 4.81 | | | | 0.96 | | |
Expenses paid during the period are equal to the annualized expense ratio for the share class, multiplied by the average account value over the period, then multiplied by the number of days in the fund's most recent fiscal half-year and divided by 365.
Had the investment advisor and/or any of its affiliates not waived fees or reimbursed a portion of expenses, account value at the end of the period would have been reduced.
It is important to note that the expense amounts shown in the table are meant to highlight only ongoing costs of investing in the fund and do not reflect any transaction costs, such as sales charges, redemption fees or exchange fees. Therefore, the hypothetical examples provided may not help you determine the relative total costs of owning shares of different funds. If these transaction costs were included, your costs would have been higher.
5
Portfolio Managers' Report – Columbia Convertible Securities Fund
Performance data quoted represents past performance and current performance may be lower or higher. Past performance is no guarantee of future results. The investment return and principal value will fluctuate so that shares, when redeemed, may be worth more or less than the original cost. Please visit www.columbiafunds.com for daily and most recent month-end performance updates.
Net asset value per share
as of 02/28/09 ($)
| Class A | | | 9.93 | | |
| Class B | | | 9.77 | | |
| Class C | | | 9.91 | | |
| Class Z | | | 9.94 | | |
Distributions declared per share
03/01/08 – 02/28/09 ($)
| Class A | | | 0.53 | | |
| Class B | | | 0.43 | | |
| Class C | | | 0.43 | | |
| Class Z | | | 0.57 | | |
For the 12-month period that ended February 28, 2009, the fund's Class A shares returned negative 30.64% without sales charge. Its benchmark, the Merrill Lynch All Convertibles All Qualities Index,1 returned negative 35.69%. The average return of funds in its peer group, the Lipper Convertible Securities Funds Classification,2 was negative 32.87%. The fund held up better than its benchmark and peer group average by taking a cautious approach to economically vulnerable sectors, such as those linked to financials, consumer spending, energy and materials.
Defensive moves helped temper declines
As the economy weakened early in the 12-month period, we began to position the portfolio more defensively. We cut back financial holdings sharply as the housing and credit crises deepened, exiting beleaguered institutions such as Fannie Mae and Lehman Brothers Holdings, which helped the fund sidestep the losses that followed. Expanding unemployment and shrinking home values led us to downplay companies that are dependent on consumer spending, such as the troubled auto industry. We also reduced holdings in energy and materials, sectors where we viewed rising commodity prices as unsustainable. Although some of these moves proved premature, the fund's reduced position in energy and materials aided performance when worsening economic data brought lower prices. We bolstered stakes in health care and technology. In the defense industry, the fund booked solid gains when an Italian company paid a large premium over market price for DRS Technologies, a supplier of defense technology systems for governments. In addition, defense contractor Lockheed Martin retired its convertible debt, issuing stock at an attractive price to bondholders. We later sold these shares at much higher levels, realizing significant profits.
Disappointments in industrials, health care and housing
The fund had more exposure to industrials than its benchmark. This positioning, plus some individual shortfalls, hampered results. Bonds of Covanta Holding, a waste collection company that also operates a global network of waste-to-energy and power projects, declined in last summer's steep sell-off in the energy sector. We retained Covanta for its potential as an alternative energy provider whose waste collection business dovetails with its power-generating unit. We also cut back on Trinity Industries, and General Cable, both of which suffered because of their housing-related businesses. Health care, which held up substantially better than other sectors, also generated disappointing returns for the fund. Hologic, maker of diagnostic and other equipment targeting women's health, was a major disappointment. Resource constraints have led hospitals to postpone purchases of mammography and other
1The Merrill Lynch All Convertibles All Qualities Index measures the performance of US dollar-denominated convertible securities of issuers not currently in bankruptcy. Securities in the index have a total market value greater than $50 million at issuance. Indices are not investments, do not incur fees or expenses and are not professionally managed. It is not possible to invest directly in an index. Securities in the fund may not match those in an index.
As of 01/01/2009, Merrill Lynch & Co., Inc. is a wholly-owned subsidiary of Bank of America Corporation and an affiliate of Columbia Management.
2Lipper Inc., a widely respected data provider in the industry, calculates an average total return (assuming reinvestment of distributions) for mutual funds with investment objectives similar to those of the fund. Lipper makes no adjustment for the effect of sales loads.
6
Portfolio Managers' Report (continued) – Columbia Convertible Securities Fund
costly devices, clouding Hologic's growth prospects. We scaled back holdings because Hologic's excellent technology and strong industry position were not enough to overcome our misgivings about management's ability to confront this very challenging environment.
Opportunities amid the challenges
Periods of illiquidity and turbulence made this the most difficult period in memory for investors in convertible securities. Following stretches of indiscriminate selling, yields on good quality convertibles rivaled those of non-convertible junk bonds, giving little or no value to the conversion option. Convertibles began to recover in the first quarter of 2009 as historically depressed values attracted both equity and fixed-income investors. Valuations remain extremely attractive, in our opinion. But we believe that broader forces, such as the timing of an economic recovery and renewed investor confidence, will determine future direction. We are optimistic that government actions around the world have the potential to end the global slowdown in economic growth. Yet, frozen credit markets and reluctant consumers present daunting challenges to this outlook.
As a result, we have maintained the fund's defensive positioning and focused security selection on companies with healthy finances, good cash flow and attractive convertible characteristics. Such companies appear well-positioned to weather the current downturn and to prosper when conditions improve. We have continued to favor technology and health care for their potential to grow in better times.
Portfolio holdings and characteristics are subject to change periodically and may not be representative of current holdings and characteristics. The outlook for this fund may differ from that presented for other Columbia Funds.
Most convertible securities are not investment grade and are therefore more speculative than higher-rated securities.
Top 5 sectors
as of 02/28/09 (%)
| Health Care | | | 26.6 | | |
| Information Technology | | | 19.7 | | |
| Financials | | | 12.9 | | |
| Energy | | | 9.3 | | |
| Industrials | | | 8.5 | | |
Top 10 holdings
as of 02/28/09 (%)
| Transocean | | | 3.5 | | |
| Mylan | | | 2.5 | | |
| Fisher Scientific International | | | 2.4 | | |
| L-3 Communications | | | 2.4 | | |
| Liberty Media | | | 1.7 | | |
| EMC | | | 1.6 | | |
| Sybase | | | 1.6 | | |
| Crown Castle International | | | 1.5 | | |
| Wells Fargo | | | 1.5 | | |
| Molson Coors Brewing | | | 1.5 | | |
Holdings discussed in this report
as of 02/28/09 (%)
| Covanta Holding | | | 1.4 | | |
| Trinity Industries | | | 0.4 | | |
| General Cable | | | 1.1 | | |
| Hologic | | | 1.3 | | |
The fund is actively managed and the composition of its portfolio will change over time. Information provided is calculated as a percentage of net assets.
7
Fund Profile – Columbia Large Cap Value Fund
Performance data quoted represents past performance and current performance may be lower or higher. Past performance is no guarantee of future results. The investment return and principal value will fluctuate so that shares, when redeemed, may be worth more or less than the original cost. Please visit www.columbiafunds.com for daily and most recent month-end performance updates.
Summary
1-year return as of 02/28/09
| | –42.36% | |
|
| |  | | | Class A shares
(without sales charge) | |
|
| | –47.35% | |
|
| |  | | | Russell 1000 Value Index | |
|
Morningstar Style BoxTM

The Morningstar Style BoxTM reveals a fund's investment strategy. For equity funds, the vertical axis shows the market capitalization of the stocks owned and the horizontal axis shows investment style (value, blend or growth). Information shown is based on the most recent data provided by Morningstar.
Summary
g For the 12-month period that ended February 28, 2009, the fund's Class A shares returned negative 42.36% without sales charge.
g While performance was very disappointing in absolute terms, the fund did not lose as much as its benchmark, the Russell 1000 Value Index,1 or the average return of its peer group, the Lipper Large-Cap Value Funds Classification.2
g Stock selection, especially in the financials sector, helped the fund avoid more severe losses.
Portfolio Management
Lori J. Ensinger has co-managed the fund since August 2001 and has been associated with the advisor or its predecessors or affiliate organizations since 2001.
Diane L. Sobin has co-managed the fund since August 2001 and has been associated with the advisor or its predecessors or affiliate organizations since 2001.
David I. Hoffman has co-managed the fund since April 2004 and has been associated with the advisor or its predecessors or affiliate organizations since 2001.
Noah J. Petrucci has co-managed the fund since February 2002 and has been associated with the advisor or its predecessors or affiliate organizations since 2002.
1The Russell 1000 Value Index measures the performance of those Russell 1000 Index companies with lower price-to-book ratios and lower forecasted growth values. Indices are not investments, do not incur fees or expenses and are not professionally managed. It is not possible to invest directly in an index. Securities in the fund may not match those in the index.
2Lipper Inc., a widely respected data provider in the industry, calculates an average total return (assuming reinvestment of distributions) for mutual funds with investment objectives similar to those of the fund. Lipper makes no adjustment for the effect of sales loads.
8
Performance Information – Columbia Large Cap Value Fund
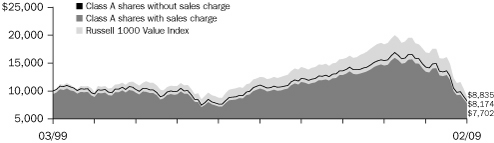
Performance of a $10,000 investment 03/01/99 – 02/28/09 ($)
The chart above shows the change in value of a hypothetical $10,000 investment in Class A shares of Columbia Large Cap Value Fund during the stated time period, and does not reflect the deduction of taxes that a shareholder may pay on fund distributions or on the redemption of fund shares. The Russell 1000 Value Index measures the performance of those Russell 1000 Index companies with lower price-to-book ratios and lower forecasted growth values. Indices are not investments, do not incur fees or expenses and are not professionally managed. It is not possible to invest directly in an index. Securities in the fund may not match those in an index.
Performance of a $10,000 investment 03/01/99 – 02/28/09 ($)
| Sales charge | | without | | with | |
| Class A | | | 8,174 | | | | 7,702 | | |
| Class B | | | 7,570 | | | | 7,570 | | |
| Class C | | | 7,577 | | | | 7,577 | | |
| Class R | | | 8,102 | | | | n/a | | |
| Class Z | | | 8,384 | | | | n/a | | |
Average annual total return as of 02/28/09 (%)
| Share class | | A | | B | | C | | R | | Z | |
| Inception | | 12/06/89 | | 06/07/93 | | 06/17/92 | | 01/23/06 | | 09/19/89 | |
| Sales charge | | without | | with | | without | | with | | without | | with | | without | | without | |
| 1-year | | | –42.36 | | | | –45.65 | | | | –42.84 | | | | –45.66 | | | | –42.84 | | | | –43.40 | | | | –42.54 | | | | –42.27 | | |
| 5-year | | | –5.78 | | | | –6.89 | | | | –6.51 | | | | –6.81 | | | | –6.50 | | | | –6.50 | | | | –5.94 | | | | –5.56 | | |
| 10-year | | | –2.00 | | | | –2.58 | | | | –2.74 | | | | –2.74 | | | | –2.74 | | | | –2.74 | | | | –2.08 | | | | –1.75 | | |
Average annual total return as of 03/31/09 (%)
| Share class | | A | | B | | C | | R | | Z | |
| Sales charge | | without | | with | | without | | with | | without | | with | | without | | without | |
| 1-year | | | –37.66 | | | | –41.27 | | | | –38.19 | | | | –41.25 | | | | –38.19 | | | | –38.80 | | | | –37.90 | | | | –37.52 | | |
| 5-year | | | –4.08 | | | | –5.20 | | | | –4.82 | | | | –5.13 | | | | –4.81 | | | | –4.81 | | | | –4.26 | | | | –3.84 | | |
| 10-year | | | –1.53 | | | | –2.11 | | | | –2.28 | | | | –2.28 | | | | –2.28 | | | | –2.28 | | | | –1.62 | | | | –1.27 | | |
The "with sales charge" returns include the maximum initial sales charge of 5.75% for Class A shares, the applicable contingent deferred sales charge of 5.00% in the first year, declining to 1.00% in the sixth year and eliminated thereafter for Class B shares and 1.00% for Class C shares for the first year only. The "without sales charge" returns do not include the effect of sales charges. If they had, returns would be lower.
Performance results reflect any fee waivers or reimbursements of fund expenses by the investment advisor and/or any of its affiliates. Absent these fee waivers or expense reimbursement arrangements, performance results would have been lower.
All results shown assume reinvestment of distributions. Class Z shares are sold at net asset value with no distribution and service (Rule 12b-1) fees. Class R shares are sold at net asset value with distribution and service (Rule 12b-1) fees. Class R and Class Z shares have limited eligibility and the investment minimum requirements may vary. Please see the fund's prospectus for details. Performance for different share classes will vary based on differences in sales charges and fees associated with each class.
The tables do not reflect the deduction of taxes that a shareholder may pay on fund distributions or on the redemption of fund shares.
The returns for Class R shares include the returns for Class A shares prior to January 23, 2006, the date on which Class R shares were initially offered by the fund. If differences in expenses had been reflected, the returns would have been lower, since Class R shares are subject to higher distribution and service (Rule 12b-1) fees.
Performance data quoted represents past performance and current performance may be lower or higher. Past performance is no guarantee of future results. The investment return and principal value will fluctuate so that shares, when redeemed, may be worth more or less than the original cost. Please visit www.columbiafunds.com for daily and most recent month-end performance updates.
Annual operating expense ratio (%)*
| Class A | | | 1.04 | | |
| Class B | | | 1.79 | | |
| Class C | | | 1.79 | | |
| Class R | | | 1.29 | | |
| Class Z | | | 0.79 | | |
*The annual operating expense ratio is as stated in the fund's prospectus that is current as of the date of this report. Differences in expense ratios disclosed elsewhere in this report may result from including fee waivers and expense reimbursements as well as different time periods used in calculating the ratios.
9
Understanding Your Expenses – Columbia Large Cap Value Fund
Estimating your actual expenses
To estimate the expenses that you paid over the period, first you will need your account balance at the end of the period:
g For shareholders who receive their account statements from Columbia Management Services, Inc., your account balance is available online at www.columbiafunds.com or by calling Shareholder Services at 800.345.6611.
g For shareholders who receive their account statements from their financial intermediary, contact your financial intermediary to obtain your account balance.
1. Divide your ending account balance by $1,000. For example, if an account balance was $8,600 at the end of the period, the result would be 8.6.
2. In the section of the table below titled "Expenses paid during the period," locate the amount for your share class. You will find this number in the column labeled "Actual." Multiply this number by the result from step 1. Your answer is an estimate of the expenses you paid on your account during the period.
If the value of your account falls below the minimum initial investment requirement applicable to you, your account generally will be subject to a $20 annual fee. This fee is not included in the accompanying table. If you are subject to the fee, keep it in mind when you are estimating the ongoing expenses of investing in the fund and when comparing the expenses of this fund with other funds.
As a fund shareholder, you incur two types of costs. There are transaction costs, which generally include sales charges on purchases and may include redemption fees or exchange fees. There are also ongoing costs, which generally include investment advisory fees, distribution and service (Rule 12b-1) fees and other fund expenses. The information on this page is intended to help you understand the ongoing costs of investing in the fund and to compare these costs with the ongoing costs of investing in other mutual funds.
Analyzing your fund's expenses by share class
To illustrate these ongoing costs, we have provided an example and calculated the expenses paid by investors in each share class during the period. The information in the following table is based on an initial investment of $1,000, which is invested at the beginning of the period and held for the entire period. Expense information is calculated two ways and each method provides you with different information. The amount listed in the "Actual" column is calculated using the fund's actual operating expenses and total return for the period. The amount listed in the "Hypothetical" column for each share class assumes that the return each year is 5% before expenses and is calculated based on the fund's actual operating expenses. You should not use the hypothetical account values and expenses to estimate either your actual account balance at the end of the period or the expenses you paid during this period.
Compare with other funds
Since all mutual funds are required to include the same hypothetical calculations about expenses in shareholder reports, you can use this information to compare the ongoing cost of investing in the fund with other funds. To do so, compare the 5% hypothetical example with the 5% hypothetical examples that appear in the shareholder reports of other funds. As you compare hypothetical examples of other funds, it is important to note that hypothetical examples are meant to highlight the ongoing costs of investing in a fund and do not reflect any transaction costs, such as sales charges, redemption fees or exchange fees.
09/01/08 – 02/28/09
| | | Account value at the
beginning of the period ($) | | Account value at the
end of the period ($) | | Expenses paid
during the period ($) | | Fund's annualized
expense ratio (%) | |
| | | Actual | | Hypothetical | | Actual | | Hypothetical | | Actual | | Hypothetical | | Actual | |
| Class A | | | 1,000.00 | | | | 1,000.00 | | | | 605.02 | | | | 1,019.64 | | | | 4.14 | | | | 5.21 | | | | 1.04 | | |
| Class B | | | 1,000.00 | | | | 1,000.00 | | | | 602.89 | | | | 1,015.92 | | | | 7.11 | | | | 8.95 | | | | 1.79 | | |
| Class C | | | 1,000.00 | | | | 1,000.00 | | | | 602.40 | | | | 1,015.92 | | | | 7.11 | | | | 8.95 | | | | 1.79 | | |
| Class R | | | 1,000.00 | | | | 1,000.00 | | | | 603.88 | | | | 1,018.40 | | | | 5.13 | | | | 6.46 | | | | 1.29 | | |
| Class Z | | | 1,000.00 | | | | 1,000.00 | | | | 605.62 | | | | 1,020.88 | | | | 3.15 | | | | 3.96 | | | | 0.79 | | |
Expenses paid during the period are equal to the annualized expense ratio for the share class, multiplied by the average account value over the period, then multiplied by the number of days in the fund's most recent fiscal half-year and divided by 365.
Had the investment advisor and/or any of its affiliates not waived fees or reimbursed a portion of expenses, account value at the end of the period would have been reduced.
It is important to note that the expense amounts shown in the table are meant to highlight only ongoing costs of investing in the fund and do not reflect any transaction costs, such as sales charges, redemption fees or exchange fees. Therefore, the hypothetical examples provided may not help you determine the relative total costs of owning shares of different funds. If these transaction costs were included, your costs would have been higher.
10
Portfolio Managers' Report – Columbia Large Cap Value Fund
For the 12-month period that ended February 28, 2009, the fund's Class A shares returned negative 42.36% without sales charge. By comparison, its benchmark, the Russell 1000 Value Index,1 returned negative 47.35%. The average return of funds in its peer group, the Lipper Large-Cap Value Funds Classification,2 was negative 45.13% over the same period. The fund was hit hard along with the market, as global economic growth slowed, major financial companies collapsed, credit froze and commodity prices plummeted. Almost without exception, no sector escaped the downturn, which did the most damage to financials, materials and industrials stocks. Our focus on large companies with greater stability in their profit margins and minimal reliance on the capital markets, however, helped the fund avoid some of the worst performers in the Russell benchmark.
Stemming losses in financials
The fund's biggest losses came from financials, which fell sharply but did not decline as much as the negative 67% returned by financials in the Russell index. In the bank and brokerage segments, we steered clear of names such as Bear Stearns Companies and Lehman Brothers Holdings, the latter of which went bankrupt during the period. Instead, we targeted banks with strong risk management and solid balance sheets, including JPMorgan Chase. Although a major detractor in absolute terms, the stock did not fall nearly as much as the sector average. Within insurance, we cut our losses by selling American International Group (AIG) about halfway through its slide. Our focus was on insurance brokers, which benefited from improved fee structures and a pick-up in demand as corporate customers scrambled for advice in the wake of AIG's problems.
Taking the edge off declines in consumer discretionary and technology
The fund's consumer discretionary and technology stocks also posted steep declines, but held up better than those in the index. In consumer discretionary, we targeted stocks that appealed to value-conscious consumers. Among the better performers were McDonald's, which picked up added share after enhancing its menu options, and Kohl's, a moderately priced apparel retailer. The fund further benefited from our decision to avoid home builders and suppliers, autos and auto parts, and media, all of which came under tremendous pressure as the economy weakened and spending slowed.
In technology, our focus was on companies with recurring revenues from software and services. Stocks that declined less than the sector average included EMC, whose data storage offerings remained in strong demand, and Hewlett-Packard, which benefited from adding more of a software and service component to its enterprise printer business.
1The Russell 1000 Value Index measures the performance of those Russell 1000 Index companies with lower price-to-book ratios and lower forecasted growth values. Indices are not investments, do not incur fees or expenses and are not professionally managed. It is not possible to invest directly in an index. Securities in the fund may not match those in an index.
2Lipper Inc., a widely respected data provider in the industry, calculates an average total return (assuming reinvestment of distributions) for mutual funds with investment objectives similar to those of the fund. Lipper makes no adjustment for the effect of sales loads.
Performance data quoted represents past performance and current performance may be lower or higher. Past performance is no guarantee of future results. The investment return and principal value will fluctuate so that shares, when redeemed, may be worth more or less than the original cost. Please visit www.columbiafunds.com for daily and most recent month-end performance updates.
Net asset value per share
as of 02/28/09 ($)
| Class A | | | 7.00 | | |
| Class B | | | 6.75 | | |
| Class C | | | 6.75 | | |
| Class R | | | 6.99 | | |
| Class Z | | | 7.01 | | |
Distributions declared per share
03/01/08 – 02/28/09 ($)
| Class A | | | 0.19 | | |
| Class B | | | 0.11 | | |
| Class C | | | 0.11 | | |
| Class R | | | 0.16 | | |
| Class Z | | | 0.22 | | |
11
Portfolio Managers' Report (continued) – Columbia Large Cap Value Fund
Top 5 sectors
as of 02/28/09 (%)
| Financials | | | 18.9 | | |
| Energy | | | 18.9 | | |
| Health Care | | | 12.6 | | |
| Consumer Staples | | | 10.2 | | |
| Information Technology | | | 7.0 | | |
Top 10 holdings
as of 02/28/09 (%)
| Exxon Mobil | | | 5.2 | | |
| AT&T | | | 4.2 | | |
| JPMorgan Chase | | | 2.8 | | |
| Amgen | | | 2.5 | | |
| Johnson & Johnson | | | 2.3 | | |
| U.S. Bancorp | | | 2.2 | | |
| Aon | | | 2.1 | | |
| Goldman Sachs Group | | | 2.1 | | |
| Procter & Gamble | | | 2.0 | | |
| Chevron | | | 2.0 | | |
Holdings discussed in this report
as of 02/28/09 (%)
| JPMorgan Chase | | | 2.8 | | |
| McDonald's | | | 1.8 | | |
| Kohl's | | | 1.4 | | |
| EMC | | | 1.5 | | |
| Hewlett-Packard | | | 1.0 | | |
| Amgen | | | 2.5 | | |
The fund is actively managed and the composition of its portfolio will change over time. Information provided is calculated as a percentage of net assets.
Lagging performance in more defensive sectors
The fund underperformed the index in some of the sectors that suffered the least damage in the downturn. In consumer staples, the fund was hurt by its exposure early in the period to protein-based food producers such as Tyson Foods and Smithfield Foods, which suffered from oversupply as global demand fell. We sold both positions. Energy stock selection further detracted from relative returns, largely because of an above-average exposure to natural gas stocks and disappointing performance from some integrated energy names. In utilities, a modest underweight hampered returns. The fund was further hindered by a below-average stake in health care, a function of our concern over the lack of promising new products from large-cap pharmaceutical companies. Offsetting this underweight was positive stock selection, led by Amgen, a large biotechnology company, whose rally was driven by its promising new anti-inflammatory drugs.
Expanding investment opportunities
As both profit margins and valuations reach trough levels, more and more companies are falling into our investment universe. We see some opportunities already emerging in the consumer discretionary and industrials sectors. We believe the fund is well positioned, with global exposure in industrials and materials and a focus within financials on companies with the potential for more normal earnings levels once the markets stabilize.
Portfolio holdings and characteristics are subject to change periodically and may not be representative of current holdings and characteristics. The outlook for this fund may differ from that presented for other Columbia Funds.
Equity securities are affected by stock market fluctuations that occur in response to economic and business developments.
Value stocks are securities of companies that may have experienced adverse business or industry developments or may be subject to special risks that have caused the stocks to be out of favor. The price of the company's stock may not approach the value the manager has placed on it.
12
Fund Profile – Columbia Mid Cap Value Fund
Summary
g For the 12-month period that ended February 28, 2009, the fund's Class A shares returned negative 47.05% without sales charge.
g This return was in line with the fund's benchmark, the Russell Midcap Value Index,1 and behind the average return of its peer group, the Lipper Mid-Cap Value Funds Classification.2
g Stocks across the market declined sharply with the biggest losses coming from the consumer discretionary, financials and energy sectors.
Portfolio Management
Lori J. Ensinger has co-managed the fund since November 2001 and has been associated with the advisor or its predecessors or affiliate organizations since 2001.
Diane L. Sobin has co-managed the fund since November 2001 and has been associated with the advisor or its predecessors or affiliate organizations since 2001.
David I. Hoffman has co-managed the fund since April 2004 and has been associated with the advisor or its predecessors or affiliate organizations since 2001.
Noah J. Petrucci has co-managed the fund since February 2002 and has been associated with the advisor or its predecessors or affiliate organizations since 2002.
1The Russell Midcap Value Index measures the performance of those Russell Midcap Index companies with lower price-to-book ratios and lower forecasted growth values. Indices are not investments, do not incur fees or expenses and are not professionally managed. It is not possible to invest directly in an index. Securities in the fund may not match those in an index.
2Lipper Inc., a widely respected data provider in the industry, calculates an average total return (assuming reinvestment of distributions) for mutual funds with investment objectives similar to those of the fund. Lipper makes no adjustment for the effect of sales loads.
Performance data quoted represents past performance and current performance may be lower or higher. Past performance is no guarantee of future results. The investment return and principal value will fluctuate so that shares, when redeemed, may be worth more or less than the original cost. Please visit www.columbiafunds.com for daily and most recent month-end performance updates.
Summary
1-year return as of 02/28/09
| | | –47.05% | |
|
| |  | | | Class A shares
(without sales charge) | |
|
| | | –47.66% | |
|
| |  | | | Russell Midcap Value Index | |
|
Morningstar Style BoxTM
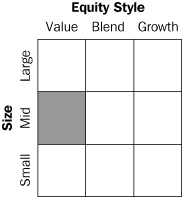
The Morningstar Style BoxTM reveals a fund's investment strategy. For equity funds, the vertical axis shows the market capitalization of the stocks owned and the horizontal axis shows investment style (value, blend or growth). Information shown is based on the most recent data provided by Morningstar.
13
Performance Information – Columbia Mid Cap Value Fund
Performance data quoted represents past performance and current performance may be lower or higher. Past performance is no guarantee of future results. The investment return and principal value will fluctuate so that shares, when redeemed, may be worth more or less than the original cost. Please visit www.columbiafunds.com for daily and most recent month-end performance updates.
Annual operating expense ratio (%)*
| Class A | | | 1.12 | | |
| Class B | | | 1.87 | | |
| Class C | | | 1.87 | | |
| Class R | | | 1.37 | | |
| Class Z | | | 0.87 | | |
*The annual operating expense ratio is as stated in the fund's prospectus that is current as of the date of this report. Differences in expense ratios disclosed elsewhere in this report may result from including fee waivers and expense reimbursements as well as different time periods used in calculating the ratios.
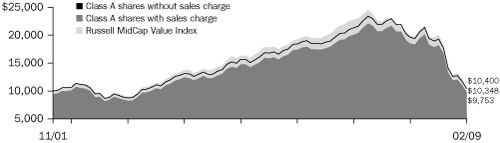
Performance of a $10,000 investment 11/20/01 – 02/28/09 ($)
The chart above shows the change in value of a hypothetical $10,000 investment in Class A shares of Columbia Mid Cap Value Fund during the stated time period, and does not reflect the deduction of taxes that a shareholder may pay on fund distributions or on the redemption of fund shares. The Russell Midcap Value Index measures the performance of those Russell Midcap Index companies with lower price-to-book ratios and lower forecasted growth values. Indices are not investments, do not incur fees or expenses and are not professionally managed. It is not possible to invest directly in an index. Securities in the fund may not match those in an index.
Performance of a $10,000 investment 11/20/01 – 02/28/09 ($)
| Sales charge | | without | | with | |
| Class A | | | 10,348 | | | | 9,753 | | |
| Class B | | | 9,799 | | | | 9,799 | | |
| Class C | | | 9,797 | | | | 9,797 | | |
| Class R | | | 10,270 | | | | n/a | | |
| Class Z | | | 10,534 | | | | n/a | | |
Average annual total return as of 02/28/09 (%)
| Share class | | A | | B | | C | | R | | Z | |
| Inception | | 11/20/01 | | 11/20/01 | | 11/20/01 | | 01/23/06 | | 11/20/01 | |
| Sales charge | | without | | with | | without | | with | | without | | with | | without | | without | |
| 1-year | | | –47.05 | | | | –50.09 | | | | –47.41 | | | | –50.03 | | | | –47.42 | | | | –47.94 | | | | –47.13 | | | | –46.87 | | |
| 5-year | | | –4.62 | | | | –5.75 | | | | –5.34 | | | | –5.60 | | | | –5.34 | | | | –5.34 | | | | –4.77 | | | | –4.39 | | |
| Life | | | 0.47 | | | | –0.34 | | | | –0.28 | | | | –0.28 | | | | –0.28 | | | | –0.28 | | | | 0.37 | | | | 0.72 | | |
Average annual total return as of 03/31/09 (%)
| Share class | | A | | B | | C | | R | | Z | |
| Sales charge | | without | | with | | without | | with | | without | | with | | without | | without | |
| 1-year | | | –42.19 | | | | –45.51 | | | | –42.65 | | | | –45.51 | | | | –42.60 | | | | –43.17 | | | | –42.35 | | | | –42.06 | | |
| 5-year | | | –2.97 | | | | –4.11 | | | | –3.71 | | | | –3.98 | | | | –3.70 | | | | –3.70 | | | | –3.13 | | | | –2.73 | | |
| Life | | | 1.54 | | | | 0.72 | | | | 0.78 | | | | 0.78 | | | | 0.79 | | | | 0.79 | | | | 1.42 | | | | 1.79 | | |
The "with sales charge" returns include the maximum initial sales charge of 5.75% for Class A, the applicable contingent deferred sales charge of 5.00% in the first year, declining to 1.00% in the sixth year and eliminated thereafter for Class B shares and 1.00% for Class C shares for the first year only. The "without sales charge" returns do not include the effect of sales charges. If they had, returns would be lower.
Performance results reflect any fee waivers or reimbursements of fund expenses by the investment advisor and/or any of its affiliates. Absent these fee waivers or expense reimbursement arrangements, performance results would have been lower.
All results shown assume reinvestment of distributions. Class Z shares are sold at net asset value with no distribution and service (Rule 12b-1) fees. Class R shares are sold at net asset value with distribution and service (Rule 12b-1) fees. Class R and Class Z shares have limited eligibility and the investment minimum requirements may vary. Please see the fund's prospectus for details. Performance for different share classes will vary based on differences in sales charges and fees associated with each class.
The tables do not reflect the deduction of taxes that a shareholder may pay on fund distributions or on the redemption of fund shares.
The returns for Class R shares include the returns of Class A shares prior to January 23, 2006, the date on which Class R shares were initially offered by the fund. If differences in expenses had been reflected, the returns shown would have been lower, since Class R shares are subject to higher distribution and service (Rule 12b-1) fees.
14
Understanding Your Expenses – Columbia Mid Cap Value Fund
As a fund shareholder, you incur two types of costs. There are transaction costs, which generally include sales charges on purchases and may include redemption fees or exchange fees. There are also ongoing costs, which generally include investment advisory fees, distribution and service (Rule 12b-1) fees and other fund expenses. The information on this page is intended to help you understand the ongoing costs of investing in the fund and to compare these costs with the ongoing costs of investing in other mutual funds.
Analyzing your fund's expenses by share class
To illustrate these ongoing costs, we have provided an example and calculated the expenses paid by investors in each share class during the period. The information in the following table is based on an initial investment of $1,000, which is invested at the beginning of the period and held for the entire period. Expense information is calculated two ways and each method provides you with different information. The amount listed in the "Actual" column is calculated using the fund's actual operating expenses and total return for the period. The amount listed in the "Hypothetical" column for each share class assumes that the return each year is 5% before expenses and is calculated based on the fund's actual operating expenses. You should not use the hypothetical account values and expenses to estimate either your actual account balance at the end of the period or the expenses you paid during this period.
Compare with other funds
Since all mutual funds are required to include the same hypothetical calculations about expenses in shareholder reports, you can use this information to compare the ongoing cost of investing in the fund with other funds. To do so, compare the 5% hypothetical example with the 5% hypothetical examples that appear in the shareholder reports of other funds. As you compare hypothetical examples of other funds, it is important to note that hypothetical examples are meant to highlight the ongoing costs of investing in a fund and do not reflect any transaction costs, such as sales charges, redemption fees or exchange fees.
Estimating your actual expenses
To estimate the expenses that you paid over the period, first you will need your account balance at the end of the period:
g For shareholders who receive their account statements from Columbia Management Services, Inc., your account balance is available online at www.columbiafunds.com or by calling Shareholder Services at 800.345.6611.
g For shareholders who receive their account statements from their financial intermediary, contact your financial intermediary to obtain your account balance.
1. Divide your ending account balance by $1,000. For example, if an account balance was $8,600 at the end of the period, the result would be 8.6.
2. In the section of the table below titled "Expenses paid during the period," locate the amount for your share class. You will find this number in the column labeled "Actual." Multiply this number by the result from step 1. Your answer is an estimate of the expenses you paid on your account during the period.
If the value of your account falls below the minimum initial investment requirement applicable to you, your account generally will be subject to a $20 annual fee. This fee is not included in the accompanying table. If you are subject to the fee, keep it in mind when you are estimating the ongoing expenses of investing in the fund and when comparing the expenses of this fund with other funds.
09/01/08 – 02/28/09
| | | Account value at the
beginning of the period ($) | | Account value at the
end of the period ($) | | Expenses paid
during the period ($) | | Fund's annualized
expense ratio (%) | |
| | | Actual | | Hypothetical | | Actual | | Hypothetical | | Actual | | Hypothetical | | Actual | |
| Class A | | | 1,000.00 | | | | 1,000.00 | | | | 538.08 | | | | 1,018.50 | | | | 4.84 | | | | 6.36 | | | | 1.27 | | |
| Class B | | | 1,000.00 | | | | 1,000.00 | | | | 536.69 | | | | 1,014.78 | | | | 7.70 | | | | 10.09 | | | | 2.02 | | |
| Class C | | | 1,000.00 | | | | 1,000.00 | | | | 536.19 | | | | 1,014.78 | | | | 7.69 | | | | 10.09 | | | | 2.02 | | |
| Class R | | | 1,000.00 | | | | 1,000.00 | | | | 537.78 | | | | 1,017.26 | | | | 5.80 | | | | 7.60 | | | | 1.52 | | |
| Class Z | | | 1,000.00 | | | | 1,000.00 | | | | 539.22 | | | | 1,019.74 | | | | 3.89 | | | | 5.11 | | | | 1.02 | | |
Expenses paid during the period are equal to the annualized expense ratio for the share class, multiplied by the average account value over the period, then multiplied by the number of days in the fund's most recent fiscal half-year and divided by 365.
It is important to note that the expense amounts shown in the table are meant to highlight only ongoing costs of investing in the fund and do not reflect any transaction costs, such as sales charges, redemption fees or exchange fees. Therefore, the hypothetical examples provided may not help you determine the relative total costs of owning shares of different funds. If these transaction costs were included, your costs would have been higher.
15
Portfolio Managers' Report – Columbia Mid Cap Value Fund
Performance data quoted represents past performance and current performance may be lower or higher. Past performance is no guarantee of future results. The investment return and principal value will fluctuate so that shares, when redeemed, may be worth more or less than the original cost. Please visit www.columbiafunds.com for daily and most recent month-end performance updates.
Net asset value per share
as of 02/28/09 ($)
| Class A | | | 6.87 | | |
| Class B | | | 6.73 | | |
| Class C | | | 6.75 | | |
| Class R | | | 6.87 | | |
| Class Z | | | 6.88 | | |
Distributions declared per share
03/01/08 – 02/28/09 ($)
| Class A | | | 0.11 | | |
| Class B | | | 0.04 | | |
| Class C | | | 0.04 | | |
| Class R | | | 0.09 | | |
| Class Z | | | 0.14 | | |
For the 12-month period that ended February 28, 2009, the fund's Class A shares returned negative 47.05% without sales charge, compared to a return of negative 47.66% for its benchmark, the Russell Midcap Value Index.1 The average return of the fund's peer group, the Lipper Mid-Cap Value Funds Classification,2 was negative 44.88% over the same time period. The stock market was extremely volatile, as the global economy slowed, credit problems spread and investor sentiment became increasingly negative. Only cash kept investors whole. Sector weights and a small cash position helped stem losses, but stock selection was disappointing. Our focus remained on companies with improving business prospects, as evidenced by rising revenues, the power to raise prices and volume growth.
Biggest damage from industrials and energy
Industrials and energy were among the fund's worst performing sectors, falling 60% or more over the year. While we trimmed our stakes in each sector last summer, we did not reduce industrials enough, given the global credit freeze that occurred late in 2008. Heavy exposure to aerospace, where we thought companies would benefit from the long-term nature of their contracts, further hampered returns. Among our biggest detractors was Textron, which is exposed to aerospace through its Cessna division, but also owns Bell Helicopter and a financial subsidiary. The stock declined more than expected as investors became concerned about the cash needs of company's financing subsidiary.
In energy, Williams Companies, a natural gas pipeline and distribution company, plunged as the credit markets shut down and delayed the company's plan to unlock the value of some of its assets. Energy stocks reached such low levels that we later began adding back to our position, leaving the fund with more exposure to energy than the index at period end.
Further disappointments from health care and consumer discretionary
Stock selection in the more defensive sector health care sector also hurt returns. Among the biggest detractors was Varian, a medical equipment company with exposure to the more economically-sensitive industrials sector. In the consumer discretionary sector, where the fund had less exposure than the index, we avoided some of the weakest industries, including home builders and media. However, certain retail and leisure investments plunged, as consumer spending slowed. Most notable were department stores Saks Inc. and Macy's, which we sold before the period's end. Elsewhere in the portfolio, Weyerhaeuser, a timber company, was dragged down with
1The Russell Midcap Value Index measures the performance of those Russell Midcap Index companies with lower price-to-book ratios and lower forecasted growth values. Indices are not investments, do not incur fees or expenses and are not professionally managed. It is not possible to invest directly in an index. Securities in the fund may not match those in an index.
2Lipper Inc., a widely respected data provider in the industry, calculates an average total return (assuming reinvestment of distributions) for mutual funds with investment objectives similar to those of the fund. Lipper makes no adjustment for the effect of sales loads.
16
Portfolio Managers' Report (continued) – Columbia Mid Cap Value Fund
paper companies and homebuilders, and NCR, a technology company, was hurt by slowing demand for its self-checkout machines.
Fund's financials held up better than the index
The fund's position in financials fell sharply but not as much as those in the index. Stock selection helped stem losses, led by an overweight in well-managed, mid-cap conservative banks with good capital structures. In addition, Lazard and Greenhill & Co., investment banks focused on merger-and-acquisition and restructuring advice, benefited from growing demand and a lack of exposure to trading operations. We took profits in Lazard. The fund was also well positioned with underweights in the real estate investment trust and life insurance segments. However, an investment in Ameriprise Financial (formerly American Express Financial) hurt because investors lumped it in with insurers that have run into trouble with variable annuities guarantees. Ameriprise has taken a more conservative approach to its variable annuities and the company has other businesses that we believe are sound. As a result, we have retained the stock on ex pectations for its future prospects.
Near-term uncertainty ahead
The near-term outlook for the economy remains weak. However, we expect government spending programs to help eventually to stabilize the financial system and provide relief to consumers. As both the number of jobs being lost and the pace of the economic slowdown decelerates, we believe that investors will begin buying more economically sensitive companies. To that end, we have already begun adding to beaten-down consumer discretionary and materials stocks. As we search through the valuation opportunities, we plan to keep our focus on companies whose revenues are accelerating and profit margins are improving.
Portfolio holdings and characteristics are subject to change periodically and may not be representative of current holdings and characteristics. The outlook for the fund may differ from that presented for other Columbia Funds.
Equity investments are affected by stock market fluctuations that occur in response to economic and business developments.
Investing in mid-cap stocks may present special risks, including possible illiquidity and greater price volatility than stocks of larger, more established companies.
Top 5 sectors
as of 02/28/09 (%)
| Financials | | | 25.7 | | |
| Utilities | | | 14.0 | | |
| Consumer Discretionary | | | 11.2 | | |
| Consumer Staples | | | 10.5 | | |
| Energy | | | 7.8 | | |
Top 10 holdings
as of 02/28/09 (%)
| PG&E | | | 2.9 | | |
| Marsh & McLennan | | | 2.1 | | |
| TCF Financial | | | 2.0 | | |
| Sempra Energy | | | 1.9 | | |
| Cullen/Frost Bankers | | | 1.8 | | |
| Reinsurance Group of America | | | 1.8 | | |
| ACE | | | 1.7 | | |
| Ameriprise Financial | | | 1.7 | | |
| Xcel Energy | | | 1.6 | | |
| Wisconsin Energy | | | 1.6 | | |
Holdings discussed in this report
as of 02/28/09 (%)
| Textron | | | 0.3 | | |
| Williams Companies | | | 1.5 | | |
| Varian | | | 0.1 | | |
| Weyerhaeuser | | | 1.4 | | |
| NCR | | | 0.9 | | |
| Greenhill & Co. | | | 0.8 | | |
| Ameriprise Financial | | | 1.7 | | |
The fund is actively managed and the composition of its portfolio will change over time. Information provided is calculated as a percentage of net assets.
17
Fund Profile – Columbia Small Cap Value Fund II
Performance data quoted represents past performance and current performance may be lower or higher. Past performance is no guarantee of future results. The investment return and principal value will fluctuate so that shares, when redeemed, may be worth more or less than the original cost. Please visit www.columbiafunds.com for daily and most recent month-end performance updates.
Summary
1-year return as of 02/28/09
| | | –44.03% | |
|
| |  | | | Class A shares
(without sales charge) | |
|
| | | –43.03% | |
|
| |  | | | Russell 2000 Value Index | |
|
Morningstar Style BoxTM
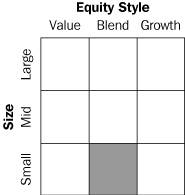
The Morningstar Style BoxTM reveals a fund's investment strategy. For equity funds, the vertical axis shows the market capitalization of the stocks owned and the horizontal axis shows investment style (value, blend or growth). Information shown is based on the most recent data provided by Morningstar.
Summary
g For the 12-month period that ended February 28, 2009, the fund's Class A shares returned negative 44.03% without sales charge.
g In a period of sharply declining stock prices, the fund performed slightly below its benchmark, the Russell 2000 Value Index1 and the average return of its peer group, the Lipper Small-Cap Value Funds Classification average2 for the period.
g Stock selection in the industrials, consumer staples and technology sectors hampered the fund's returns while stock selection in energy, consumer discretionary, health care and financials aided returns.
Portfolio Management
Christian K. Stadlinger has co-managed the fund since April 2002 and has been associated with the advisor or its predecessors or affiliate organizations since 2002.
Jarl Ginsberg has co-managed the fund since February 2003 and has been associated with the advisor or its predecessors or affiliate organizations since 2003.
1The Russell 2000 Value Index tracks the performance of those Russell 2000 Index companies with lower price-to-book ratios and lower forecasted growth values. Indices are not investments, do not incur fees or expenses and are not professionally managed. It is not possible to invest directly in an index. Securities in the fund may not match those in an index.
2Lipper Inc., a widely respected data provider in the industry, calculates an average total return (assuming reinvestment of distributions) for mutual funds with investment objectives similar to those of the fund. Lipper makes no adjustment for the effect of sales loads.
18
Performance Information – Columbia Small Cap Value Fund II
Performance of a $10,000 investment 05/01/02 – 02/28/09 ($)
The chart above shows the change in value of a hypothetical $10,000 investment in Class A shares of Columbia Small Cap Value Fund II during the stated time period, and does not reflect the deduction of taxes that a shareholder may pay on fund distributions or on the redemption of fund shares. The Russell 2000 Value Index measures the performance of those Russell 2000 Index companies with lower price-to-book ratios and lower forecasted growth values. Indices are not investments, do not incur fees or expenses and are not professionally managed. It is not possible to invest directly in an index. Securities in the fund may not match those in an index.
Performance of a $10,000 investment 05/01/02 – 02/28/09 ($)
| Sales charge | | without | | with | |
| Class A | | | 9,567 | | | | 9,017 | | |
| Class B | | | 9,085 | | | | 9,085 | | |
| Class C | | | 9,089 | | | | 9,089 | | |
| Class R | | | 9,478 | | | | n/a | | |
| Class Z | | | 9,736 | | | | n/a | | |
Performance data quoted represents past performance and current performance may be lower or higher. Past performance is no guarantee of future results. The investment return and principal value will fluctuate so that shares, when redeemed, may be worth more or less than the original cost. Please visit www.columbiafunds.com for daily and most recent month-end performance updates.
Annual operating expense ratio (%)*
| Class A | | | 1.33 | | |
| Class B | | | 2.08 | | |
| Class C | | | 2.08 | | |
| Class R | | | 1.58 | | |
| Class Z | | | 1.08 | | |
*The annual operating expense ratio is as stated in the fund's prospectus that is current as of the date of this report and includes the expenses incurred by the investment companies in which the fund invests. Differences in expense ratios disclosed elsewhere in this report may result from including fee waivers and expense reimbursements as well as different time periods used in calculating the ratios.
Average annual total return as of 02/28/09 (%)
| Share class | | A | | B | | C | | R | | Z | |
| Inception | | 05/01/02 | | 05/01/02 | | 05/01/02 | | 01/23/06 | | 05/01/02 | |
| Sales charge | | without | | with | | without | | with | | without | | with | | without | | without | |
| 1-year | | | –44.03 | | | | –47.23 | | | | –44.46 | | | | –47.22 | | | | –44.41 | | | | –44.96 | | | | –44.18 | | | | –43.87 | | |
| 5-year | | | –4.88 | | | | –6.00 | | | | –5.61 | | | | –5.88 | | | | –5.61 | | | | –5.61 | | | | –5.06 | | | | –4.65 | | |
| Life | | | –0.65 | | | | –1.50 | | | | –1.39 | | | | –1.39 | | | | –1.39 | | | | –1.39 | | | | –0.78 | | | | –0.39 | | |
Average annual total return as of 03/31/09 (%)
| Share class | | A | | B | | C | | R | | Z | |
| Sales charge | | without | | with | | without | | with | | without | | with | | without | | without | |
| 1-year | | | –39.93 | | | | –43.40 | | | | –40.44 | | | | –43.40 | | | | –40.47 | | | | –41.07 | | | | –40.08 | | | | –39.79 | | |
| 5-year | | | –3.44 | | | | –4.58 | | | | –4.18 | | | | –4.46 | | | | –4.20 | | | | –4.20 | | | | –3.61 | | | | –3.21 | | |
| Life | | | 0.59 | | | | –0.26 | | | | –0.17 | | | | –0.17 | | | | –0.18 | | | | –0.18 | | | | 0.46 | | | | 0.84 | | |
The "with sales charge" returns include the maximum initial sales charge of 5.75% for Class A shares, the applicable contingent deferred sales charge of 5.00% in the first year, declining to 1.00% in the sixth year and eliminated thereafter for Class B shares and 1.00% for Class C shares for the first year only. The "without sales charge" returns do not include the effect of sales charges. If they had, returns would be lower.
Performance results reflect any fee waivers or reimbursements of fund expenses by the investment advisor and/or any of its affiliates. Absent these fee waivers or expense reimbursement arrangements, performance results would have been lower.
All results shown assume reinvestment of distributions. Class Z shares are sold at net asset value with no distribution and service (Rule 12b-1) fees. Class R shares are sold at net asset value with distribution and service (Rule 12b-1) fees. Class R and Class Z shares have limited eligibility and the investment minimum requirements may vary. Please see the fund's prospectus for details. Performance for different share classes will vary based on differences in sales charges and fees associated with each class.
The tables do not reflect the deduction of taxes that a shareholder may pay on fund distributions or on the redemption of fund shares.
The returns for Class R shares include the returns of Class A shares prior to January 23, 2006, the date on which Class R shares were initially offered by the fund. If differences in expenses had been reflected, the returns shown would have been lower, since Class R shares are subject to higher distribution and service (Rule 12b-1) fees.
19
Understanding Your Expenses – Columbia Small Cap Value Fund II
Estimating your actual expenses
To estimate the expenses that you paid over the period, first you will need your account balance at the end of the period:
g For shareholders who receive their account statements from Columbia Management Services, Inc., your account balance is available online at www.columbiafunds.com or by calling Shareholder Services at 800.345.6611.
g For shareholders who receive their account statements from their financial intermediary, contact your financial intermediary to obtain your account balance.
1. Divide your ending account balance by $1,000. For example, if an account balance was $8,600 at the end of the period, the result would be 8.6.
2. In the section of the table below titled "Expenses paid during the period," locate the amount for your share class. You will find this number in the column labeled "Actual." Multiply this number by the result from step 1. Your answer is an estimate of the expenses you paid on your account during the period.
If the value of your account falls below the minimum initial investment requirement applicable to you, your account generally will be subject to a $20 annual fee. This fee is not included in the accompanying table. If you are subject to the fee, keep it in mind when you are estimating the ongoing expenses of investing in the fund and when comparing the expenses of this fund with other funds.
As a fund shareholder, you incur two types of costs. There are transaction costs, which generally include sales charges on purchases and may include redemption fees or exchange fees. There are also ongoing costs, which generally include investment advisory fees, distribution and service (Rule 12b-1) fees and other fund expenses. The information on this page is intended to help you understand the ongoing costs of investing in the fund and to compare these costs with the ongoing costs of investing in other mutual funds.
Analyzing your fund's expenses by share class
To illustrate these ongoing costs, we have provided an example and calculated the expenses paid by investors in each share class during the period. The information in the following table is based on an initial investment of $1,000, which is invested at the beginning of the period and held for the entire period. Expense information is calculated two ways and each method provides you with different information. The amount listed in the "Actual" column is calculated using the fund's actual operating expenses and total return for the period. The amount listed in the "Hypothetical" column for each share class assumes that the return each year is 5% before expenses and is calculated based on the fund's actual operating expenses. You should not use the hypothetical account values and expenses to estimate either your actual account balance at the end of the period or the expenses you paid during this period.
Compare with other funds
Since all mutual funds are required to include the same hypothetical calculations about expenses in shareholder reports, you can use this information to compare the ongoing cost of investing in the fund with other funds. To do so, compare the 5% hypothetical example with the 5% hypothetical examples that appear in the shareholder reports of other funds. As you compare hypothetical examples of other funds, it is important to note that hypothetical examples are meant to highlight the ongoing costs of investing in a fund and do not reflect any transaction costs, such as sales charges, redemption fees or exchange fees.
09/01/08 – 02/28/09
| | | Account value at the
beginning of the period ($) | | Account value at the
end of the period ($) | | Expenses paid
during the period ($) | | Fund's annualized
expense ratio (%) | |
| | | Actual | | Hypothetical | | Actual | | Hypothetical | | Actual | | Hypothetical | | Actual | |
| Class A | | | 1,000.00 | | | | 1,000.00 | | | | 529.80 | | | | 1,018.00 | | | | 5.20 | | | | 6.85 | | | | 1.37 | | |
| Class B | | | 1,000.00 | | | | 1,000.00 | | | | 527.61 | | | | 1,014.28 | | | | 8.03 | | | | 10.59 | | | | 2.12 | | |
| Class C | | | 1,000.00 | | | | 1,000.00 | | | | 528.41 | | | | 1,014.28 | | | | 8.03 | | | | 10.59 | | | | 2.12 | | |
| Class R | | | 1,000.00 | | | | 1,000.00 | | | | 529.00 | | | | 1,016.76 | | | | 6.14 | | | | 8.10 | | | | 1.62 | | |
| Class Z | | | 1,000.00 | | | | 1,000.00 | | | | 530.79 | | | | 1,019.24 | | | | 4.25 | | | | 5.61 | | | | 1.12 | | |
Expenses paid during the period are equal to the annualized expense ratio for the share class, multiplied by the average account value over the period, then multiplied by the number of days in the fund's most recent fiscal half-year and divided by 365.
It is important to note that the expense amounts shown in the table are meant to highlight only ongoing costs of investing in the fund and do not reflect any transaction costs, such as sales charges, redemption fees or exchange fees. Therefore, the hypothetical examples provided may not help you determine the relative total costs of owning shares of different funds. If these transaction costs were included, your costs would have been higher.
20
Portfolio Managers' Report – Columbia Small Cap Value Fund II
For the 12-month period that ended February 28, 2009, the fund's Class A shares returned negative 44.03% without sales charge, compared with a return of negative 43.03% for its benchmark, the Russell 2000 Value Index.1 The Lipper Small-Cap Value Funds Classification average,2 a peer comparison, returned negative 43.94% over the same time period. Stock selection in the industrials, consumer staples and technology sectors hampered the fund's returns while stock selection in energy, consumer discretionary, health care and financials aided returns.
Financial crisis, weak economic growth weigh on stocks
Small-cap stocks fell as a financial crisis rooted in last-year's subprime mortgage market collapse continued and economic growth turned negative in 2008. However, small caps did not lose as much ground as large caps, which did not provide their typical "safe haven" relative to small caps in a negative market environment. The energy, consumer discretionary and materials sectors each lost more than 50%. In addition, the financials sector, which represents over one-third of the Russell index's assets, declined over 40%. Against this backdrop, we remained focused on attractively valued stocks of companies with improving business prospects, including revenues, profit margins and earnings.
Stock selection, sector weights hampered returns from industrials
The fund had more exposure to industrials than its Russell benchmark, and its industrials holdings declined more than the sector average. Within industrials, we favored aerospace suppliers, which we thought would benefit from the industry's long-term contracts and strong order backlogs. Instead, BE Aerospace, which focuses on aircraft interiors, and Carpenter Technology, which makes titanium fasteners, fell sharply, as investors anticipated that a steep recession would hamper orders for new aircraft. We exited Carpenter, as it was no longer a match with our strategy. Solar cell manufacturer JA Solar Holdings also declined, as falling oil and gas prices weakened interest in alternative energy.
Further losses from consumer staples and technology
The fund's consumer staples stocks also underperformed the benchmark, led by Great Atlantic & Pacific (A&P) Tea, a New York grocery chain that acquired a major competitor. Investors drove A&P's stock lower because the company carried a higher level of debt than most of its peers. Stock selection in technology and an underweight in the sector further hampered returns versus the index. Among the leading detractors was Insight Enterprises, Inc., a North American distributor of hardware and software products. As corporate technology spending began to slow, Insight shares declined and we sold the position because it no longer offered the opportunity we seek from companies in the portfolio.
1The Russell 2000 Value Index tracks the performance of those Russell 2000 Index companies with lower price-to-book ratios and lower forecasted growth values. Indices are not investments, do not incur fees or expenses and are not professionally managed. It is not possible to invest directly in an index. Securities in the fund may not match those in an index.
2Lipper Inc., a widely respected data provider in the industry, calculates an average total return (assuming reinvestment of distributions) for mutual funds with investment objectives similar to those of the fund. Lipper makes no adjustment for the effect of sales loads.
Performance data quoted represents past performance and current performance may be lower or higher. Past performance is no guarantee of future results. The investment return and principal value will fluctuate so that shares, when redeemed, may be worth more or less than the original cost. Please visit www.columbiafunds.com for daily and most recent month-end performance updates.
Net asset value per share
as of 02/28/09 ($)
| Class A | | | 6.74 | | |
| Class B | | | 6.49 | | |
| Class C | | | 6.49 | | |
| Class R | | | 6.72 | | |
| Class Z | | | 6.78 | | |
Distributions declared per share
03/01/08 – 02/28/09 ($)
| Class A | | | 0.11 | | |
| Class B | | | 0.04 | | |
| Class C | | | 0.04 | | |
| Class R | | | 0.09 | | |
| Class Z | | | 0.14 | | |
21
Portfolio Managers' Report (continued) – Columbia Small Cap Value Fund II
Top 5 sectors
as of 02/28/09 (%)
| Financials | | | 29.6 | | |
| Industrials | | | 16.2 | | |
| Health Care | | | 10.0 | | |
| Information Technology | | | 9.6 | | |
| Consumer Discretionary | | | 8.0 | | |
Top 10 holdings
as of 02/28/09 (%)
| New Jersey Resources | | | 1.5 | | |
| Atmos Energy | | | 1.4 | | |
| Watson Wyatt Worldwide | | | 1.4 | | |
| Argo Group International | | | 1.4 | | |
| Westar Energy | | | 1.4 | | |
| Platinum Underwriter Holdings | | | 1.4 | | |
| Knight Cap Group | | | 1.4 | | |
| Crown Holdings | | | 1.3 | | |
| First Horizon National | | | 1.3 | | |
| Papa John's International | | | 1.3 | | |
Holdings discussed in this report
as of 02/28/09 (%)
| BE Aerospace | | | 0.7 | | |
| JA Solar Holdings | | | 0.3 | | |
| Great Atlantic & Pacific Tea | | | 0.6 | | |
| Knight Capital Group | | | 1.4 | | |
| Hot Topic | | | 1.1 | | |
| EXCO Resources | | | 0.9 | | |
The fund is actively managed and the composition of its portfolio will change over time. Information provided is calculated as a percentage of net assets.
Less severe losses in financials, health care and consumer discretionary sector
Although the fund's financial stocks were down sharply, they did not lose as much ground as those in the fund's Russell benchmark. Below-average exposure to the banking industry and a focus on better capitalized banks helped the fund stem losses as more speculative names within the industry took the hardest hits. In addition, gains came from stocks such as Knight Capital Group, a trading firm that profited as trading volumes increased.
In addition to financials, losses in the health care and consumer discretionary sectors were not as steep as in the index. In fact, Datascope, a medical equipment company, rallied nicely after a premium buyout offer and was sold before the end of the reporting period. Most consumer discretionary stocks suffered declines as consumer spending slowed. Among the fund's biggest casualties was Tenneco, an auto parts supplier that sells to the major car companies. Gains from Hot Topic, a retail store chain catering to the "gothic" fashion look, helped offset some of these losses. Hot Topic shares climbed amid an increase in same store sales. Elsewhere, strong performers included Massey Energy, a coal producer, and EXCO Resources, an oil and gas exploration company in east Texas. We sold both Tenneco and Massey before the end of the period.
Staying with a time-tested discipline
No one can predict when the economy and the investment markets will improve. We recognize that highly speculative stocks could take off in a market rally without a corresponding improvement in underlying business fundamentals. However, we believe that our long-term strategy of looking for inexpensive stocks where we see upward inflection points in the business prospects of the underlying companies will stand the test of time.
Portfolio holdings and characteristics are subject to change periodically and may not be representative of current holdings and characteristics. The outlook for this fund may differ from that presented for other Columbia Funds.
Equity investments are affected by stock market fluctuations that occur in response to economic and business developments.
Value stocks are securities of companies that may have experienced adverse business or industry developments or may be subject to special risks that have caused the stocks to be out of favor. The price of the company's stock may not approach the value the manager has placed on it.
Investments in small-cap stocks may be subject to greater volatility and price fluctuations because they may be thinly traded and less liquid than investments in larger companies.
22
Fund Profile – Columbia Marsico Growth Fund
Summary
g For the 12-month period that ended February 28, 2009, the fund's Class A shares returned negative 44.21% without sales charge.
g In an environment of weak economic growth and declining stock prices, the fund performed slightly below its benchmark, the S&P 500 Index1 and the average return of its peer group, the Lipper Large-Cap Growth Funds Classification for the period.2
g Below index weights in health care and consumer staples stocks, along with stock selection in energy, telecommunication services, consumer discretionary and consumer staples sectors, detracted from performance relative to the index.
Portfolio Management
Thomas F. Marsico has managed the fund or its master portfolio since December 1997 and is Chief Invesment Officer of Marsico Capital Management, LLC ("MCM"), investment sub-advisor to the fund.3
Columbia Management Advisors, LLC ("CMA") has retained MCM to serve as investment sub-advisor to the fund. As investment sub-advisor, MCM makes the investment decisions and manages the fund subject to the oversight of CMA and the fund's Board of Trustees. MCM is an investment advisor registered with the Securities and Exchange Commission and is an independently-owned investment management firm.
1The Standard and Poor's (S&P) 500 Index tracks the performance of 500 widely held large-capitalization US stocks. Indices are not investments, do not incur fees or expenses and are not professionally managed. It is not possible to invest directly in an index. Securities in the fund may not match those in an index.
2Lipper Inc., a widely respected data provider in the industry, calculates an average total return (assuming reinvestment of distributions) for mutual funds with investment objectives similar to those of the fund. Lipper makes no adjustment for the effect of sales loads
3Effective November 10, 2008, the fund converted to a stand-alone fund. Prior to November 10, 2008, the fund operated in a master-feeder structure.
Performance data quoted represents past performance and current performance may be lower or higher. Past performance is no guarantee of future results. The investment return and principal value will fluctuate so that shares, when redeemed, may be worth more or less than the original cost. Please visit www.columbiafunds.com for daily and most recent month-end performance updates.
Summary
1-year return as of 02/28/09
| | | –44.21% | |
|
| |  | | | Class A shares
(without sales charges) | |
|
| | | –43.32% | |
|
| |  | | | S&P 500 Index | |
|
Morningstar Style BoxTM
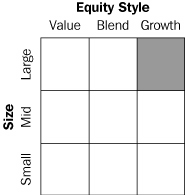
The Morningstar Style BoxTM reveals a fund's investment strategy. For equity funds, the vertical axis shows the market capitalization of the stocks owned, and the horizontal axis shows investment style (value, blend or growth). Information shown is based on the most recent data provided by Morningstar.
23
Performance Information – Columbia Marsico Growth Fund
Performance data quoted represents past performance and current performance may be lower or higher. Past performance is no guarantee of future results. The investment return and principal value will fluctuate so that shares, when redeemed, may be worth more or less than the original cost. Please visit www.columbiafunds.com for daily and most recent month-end performance updates.
Annual operating expense ratio (%)*
| Class A | | | 1.22 | | |
| Class B | | | 1.97 | | |
| Class C | | | 1.97 | | |
| Class R | | | 1.47 | | |
| Class Z | | | 0.97 | | |
*The annual operating expense ratio is as stated in the fund's prospectus that is current as of the date of this report. Differences in expense ratios disclosed elsewhere in this report may result from including fee waivers and expense reimbursements as well as different time periods used in calculating the ratios.
Performance of a $10,000 investment 03/01/99 – 02/28/09 ($)
The chart above shows the change in value of a hypothetical $10,000 investment in Class A shares of Columbia Marsico Growth Fund during the stated time period, and does not reflect the deduction of taxes that a shareholder may pay on fund distributions or on the redemption of fund shares. The Standard & Poor's (S&P) 500 Index tracks the performance of 500 widely held, large-capitalization US stocks. Indices are not investments, do not incur fees or expenses and are not professionally managed. It is not possible to invest directly in an index. Securities in the fund may not match those in an index.
Performance of a $10,000 investment 03/01/99 – 02/28/09 ($)
| Sales charge | | without | | with | |
| Class A | | | 8,060 | | | | 7,594 | | |
| Class B | | | 7,475 | | | | 7,475 | | |
| Class C | | | 7,478 | | | | 7,478 | | |
| Class R | | | 7,982 | | | | n/a | | |
| Class Z | | | 8,261 | | | | n/a | | |
Average annual total return as of 02/28/09 (%)
| Share class | | A | | B | | C | | R | | Z | |
| Inception | | 12/31/97 | | 12/31/97 | | 12/31/97 | | 01/23/06 | | 12/31/97 | |
| Sales charge | | without | | with | | without | | with | | without | | with | | without | | without | |
| 1-year | | | –44.21 | | | | –47.42 | | | | –44.66 | | | | –47.43 | | | | –44.64 | | | | –45.20 | | | | –44.36 | | | | –44.09 | | |
| 5-year | | | –6.49 | | | | –7.60 | | | | –7.20 | | | | –7.57 | | | | –7.19 | | | | –7.19 | | | | –6.67 | | | | –6.26 | | |
| 10-year | | | –2.13 | | | | –2.71 | | | | –2.87 | | | | –2.87 | | | | –2.86 | | | | –2.86 | | | | –2.23 | | | | –1.89 | | |
Average annual total return as of 03/31/09 (%)
| Share class | | A | | B | | C | | R | | Z | |
| Sales charge | | without | | with | | without | | with | | without | | with | | without | | without | |
| 1-year | | | –39.40 | | | | –42.87 | | | | –39.88 | | | | –42.89 | | | | –39.84 | | | | –40.44 | | | | –39.57 | | | | –39.25 | | |
| 5-year | | | –5.26 | | | | –6.37 | | | | –5.98 | | | | –6.36 | | | | –5.97 | | | | –5.97 | | | | –5.45 | | | | –5.02 | | |
| 10-year | | | –2.02 | | | | –2.59 | | | | –2.75 | | | | –2.75 | | | | –2.74 | | | | –2.74 | | | | –2.11 | | | | –1.77 | | |
The "with sales charge" returns include the maximum initial sales charge of 5.75% for Class A shares, the applicable contingent deferred sales charge of 5.00% in the first year, declining to 1.00% in the sixth year, and eliminated thereafter for Class B shares and 1.00% for Class C shares for the first year only. The "without sales charge" returns do not include the effect of sales charges. If they had, returns would be lower.
Performance results reflect any fee waivers or reimbursements of fund expenses by the investment advisor and/or any of its affiliates. Absent these fee waivers or expense reimbursement arrangements, performance results would have been lower.
All results shown assume reinvestment of distribution. Class Z shares are sold at net asset value with no distribution and service (Rule 12b-1) fees. Class R shares are sold at net asset value with distribution and service (Rule 12b-1) fees. Class R and Class Z shares have limited eligibility and the investment minimum requirements may vary. Please see the fund's prospectus for details. Performance for different share classes will vary based on differences in sales charges and fees associated with each class.
The tables do not reflect the deduction of taxes that a shareholder may pay on fund distributions or on the redemption of fund shares.
The returns for Class R shares include the returns of Class A shares prior to January 23, 2006, the date on which Class R shares were initially offered by the fund. These returns have not been restated to reflect any differences in expenses between Class A shares and Class R shares. If differences in expenses had been reflected, the returns shown would have been lower, since Class R shares are subject to higher distribution and service (Rule 12b-1) fees.
24
Understanding Your Expenses – Columbia Marsico Growth Fund
As a fund shareholder, you incur two types of costs. There are transaction costs, which generally include sales charges on purchases and may include redemption fees or exchange fees. There are also ongoing costs, which generally include investment advisory fees, distribution and service (Rule 12b-1) fees and other fund expenses. The information on this page is intended to help you understand the ongoing costs of investing in the fund and to compare these costs with the ongoing costs of investing in other mutual funds.
Analyzing your fund's expenses by share class
To illustrate these ongoing costs, we have provided an example and calculated the expenses paid by investors in each share class during the period. The information in the following table is based on an initial investment of $1,000, which is invested at the beginning of the period and held for the entire period. Expense information is calculated two ways and each method provides you with different information. The amount listed in the "Actual" column is calculated using the fund's actual operating expenses and total return for the period. The amount listed in the "Hypothetical" column for each share class assumes that the return each year is 5% before expenses and is calculated based on the fund's actual operating expenses. You should not use the hypothetical account values and expenses to estimate either your actual account balance at the end of the period or the expenses you paid during this period.
Compare with other funds
Since all mutual funds are required to include the same hypothetical calculations about expenses in shareholder reports, you can use this information to compare the ongoing cost of investing in the fund with other funds. To do so, compare the 5% hypothetical example with the 5% hypothetical examples that appear in the shareholder reports of other funds. As you compare hypothetical examples of other funds, it is important to note that hypothetical examples are meant to highlight the ongoing costs of investing in a fund and do not reflect any transaction costs, such as sales charges, redemption fees or exchange fees.
Estimating your actual expenses
To estimate the expenses that you paid over the period, first you will need your account balance at the end of the period:
g For shareholders who receive their account statements from Columbia Management Services, Inc., your account balance is available online at www.columbiafunds.com or by calling Shareholder Services at 800.345.6611.
g For shareholders who receive their account statements from their financial intermediary, contact your financial intermediary to obtain your account balance.
1. Divide your ending account balance by $1,000. For example, if an account balance was $8,600 at the end of the period, the result would be 8.6.
2. In the section of the table below titled "Expenses paid during the period," locate the amount for your share class. You will find this number in the column labeled "Actual." Multiply this number by the result from step 1. Your answer is an estimate of the expenses you paid on your account during the period.
If the value of your account falls below the minimum initial investment requirement applicable to you, your account generally will be subject to a $20 annual fee. This fee is not included in the accompanying table. If you are subject to the fee, keep it in mind when you are estimating the ongoing expenses of investing in the fund and when comparing the expenses of this fund with other funds.
09/01/08 – 02/28/09
| | | Account value at the
beginning of the period ($) | | Account value at the
end of the period ($) | | Expenses paid
during the period ($) | | Fund's annualized
expense ratio (%) | |
| | | Actual | | Hypothetical | | Actual | | Hypothetical | | Actual | | Hypothetical | | Actual | |
| Class A | | | 1,000.00 | | | | 1,000.00 | | | | 582.81 | | | | 1,018.30 | | | | 5.14 | | | | 6.56 | | | | 1.31 | | |
| Class B | | | 1,000.00 | | | | 1,000.00 | | | | 580.18 | | | | 1,014.58 | | | | 8.07 | | | | 10.29 | | | | 2.06 | | |
| Class C | | | 1,000.00 | | | | 1,000.00 | | | | 580.58 | | | | 1,014.58 | | | | 8.07 | | | | 10.29 | | | | 2.06 | | |
| Class R | | | 1,000.00 | | | | 1,000.00 | | | | 581.82 | | | | 1,017.06 | | | | 6.12 | | | | 7.80 | | | | 1.56 | | |
| Class Z | | | 1,000.00 | | | | 1,000.00 | | | | 583.20 | | | | 1,019.54 | | | | 4.16 | | | | 5.31 | | | | 1.06 | | |
Expenses paid during the period are equal to the annualized expense ratio for the share class, multiplied by the average account value over the period, then multiplied by the number of days in the fund's most recent fiscal half-year and divided by 365.
Had the investment advisor and/or any of its affiliates not waived fees or reimbursed a portion of expenses, account value at the end of the period would have been reduced.
It is important to note that the expense amounts shown in the table are meant to highlight only ongoing costs of investing in the fund and do not reflect any transaction costs, such as sales charges, redemption fees or exchange fees. Therefore, the hypothetical examples provided may not help you determine the relative total costs of owning shares of different funds. If these transaction costs were included, your costs would have been higher.
25
Portfolio Manager's Report – Columbia Marsico Growth Fund
Performance data quoted represents past performance and current performance may be lower or higher. Past performance is no guarantee of future results. The investment return and principal value will fluctuate so that shares, when redeemed, may be worth more or less than the original cost. Please visit www.columbiafunds.com for daily and most recent month-end performance updates.
Net asset value per share
as of 02/28/09 ($)
| Class A | | | 11.30 | | |
| Class B | | | 10.42 | | |
| Class C | | | 10.44 | | |
| Class R | | | 11.20 | | |
| Class Z | | | 11.47 | | |
Distributions declared per share
03/01/08 – 02/28/09 ($)
| Class A | | | 0.01 | | |
| Class Z | | | 0.10 | | |
For the 12-month period that ended February 28, 2009, the fund's Class A shares returned negative 44.21% without sales charge. The fund's benchmark, the S&P 500 Index,1 returned negative 43.32%. The average return of the fund's peer group, the Lipper Large-Cap Growth Funds Classification,2 was negative 40.77%. Sector allocation and stock selection hampered the fund's relative return for the period.
Sector allocation and stock selection drove relative results
With lower exposure to health care and consumer staples, which held up better than the overall market during the period, and higher exposure to materials, industrials and banks, which were weak performers, the fund lost more ground than the index during the period. Keep in mind that sector-level weights generally should be considered a residual of the fund's stock selection process rather than a major proactive facet of its investment strategy.
Stock selection within the energy, telecommunication services and consumer discretionary sectors also hampered the fund's return. The fund's energy positions detracted materially from performance, specifically Petroleo Brasileiro SA, Schlumberger (prior to being sold) and Transocean. Wireless telecommunication services providers China Mobile and Mexico-based America Movil S.A.B. de C.V. also declined sharply during the period and both positions were sold prior to the period's end. Certain consumer discretionary positions also struggled, including Las Vegas Sands, Wynn Resorts Ltd. and Lowe's Cos.
Stemming losses in a declining market
Stock selection in the financials, materials and information technology sectors helped the fund's return. The fund's collective financials positions posted a return of negative 55% compared to a 71% loss for financials within the S&P 500 Index. Similarly, in the materials sector, the fund's collective positions returned negative 39% as compared to negative 55% for materials stocks within the index. In the information technology sector, the fund benefited from relatively strong performance from Nortel Networks, which posted a positive return prior to being sold, and from International Business Machines. Elsewhere in the portfolio, Genentech, Amazon.com, Schering-Plough and Tesco all gained ground. Amazon.com and Tesco were sold. Throughout the reporting period, the fund's cash and cash equivalents averaged nearly 8% of net assets, which helped cushion the fund in a declining market environment.
1The Standard and Poor's (S&P) 500 Index tracks the performance of 500 widely held large-capitalization US stocks. Indices are not investments, do not incur fees or expenses and are not professionally managed. It is not possible to invest directly in an index. Securities in the fund may not match those in an index.
2Lipper Inc., a widely respected data provider in the industry, calculates an average total return (assuming reinvestment of distributions) for mutual funds with investment objectives similar to those of the fund. Lipper makes no adjustment for the effect of sales loads.
26
Portfolio Manager's Report (continued) – Columbia Marsico Growth Fund
Going forward
At the end of the period, the fund's largest sector weights were in the information technology, consumer discretionary, industrials and health care sectors. During the period, information technology and consumer staples holdings increased while energy and financials holdings decreased. The fund had little or no exposure to utilities or telecommunication services. Sector allocation changes were primarily the result of the fund's stock selection process.
Source for all statistical data—Columbia Management Advisors, LLC.
Source for all stock-specific commentary—Marsico Capital Management, LLC.
Portfolio holdings and characteristics are subject to change periodically and may not be representative of current holdings and characteristics. The outlook for the fund may differ from that presented for other Columbia Funds.
The fund generally holds a core position of between 35 and 50 common stocks. By maintaining a relatively focused portfolio, the fund may be subject to a greater risk than a fund that is less focused. The fund can invest up to 25% of its assets in foreign securities.
International investing may involve certain risks, including currency fluctuations, risks associated with possible differences in financial accounting standards and other monetary and political risks. Significant levels of foreign taxes, including potentially confiscatory levels of taxation and withholding taxes, may also apply to some foreign investments.
Top 5 sectors
as of 02/28/09 (%)
| Information Technology | | | 20.2 | | |
| Consumer Discretionary | | | 18.2 | | |
| Industrials | | | 13.4 | | |
| Health Care | | | 12.8 | | |
| Consumer Staples | | | 9.1 | | |
Top 10 holdings
as of 02/28/09 (%)
| McDonald's | | | 9.0 | | |
| Genentech | | | 6.2 | | |
| Visa | | | 4.4 | | |
| MasterCard | | | 4.3 | | |
| Lockheed Martin | | | 4.3 | | |
| Monsanto | | | 4.3 | | |
| Union Pacific | | | 3.7 | | |
| Google | | | 3.5 | | |
| Transocean | | | 3.5 | | |
| Wal-Mart Stores | | | 3.5 | | |
Holdings discussed in this report
as of 02/28/09 (%)
| Petroleo Brasileiro SA | | | 1.5 | | |
| Transocean | | | 3.5 | | |
| Las Vegas Sands | | | 0.4 | | |
| Wynn Resorts | | | 1.1 | | |
| Lowe's Cos. | | | 2.0 | | |
International Business
Machines | | | 1.3 | | |
| Genentech | | | 6.2 | | |
| Schering-Plough | | | 1.3 | | |
The fund is actively managed and the composition of its portfolio will change over time. Information provided is calculated as a percentage of net assets.
27
Fund Profile – Columbia Large Cap Core Fund
Performance data quoted represents past performance and current performance may be lower or higher. Past performance is no guarantee of future results. The investment return and principal value will fluctuate so that shares, when redeemed, may be worth more or less than the original cost. Please visit www.columbiafunds.com for daily and most recent month-end performance updates.
Summary
1-year return as of 02/28/09
| | –40.12% | |
|
| |  | | | Class A shares
(without sales charge) | |
|
| | –43.32% | |
|
| |  | | | S&P 500 Index | |
|
Morningstar Style BoxTM

The Morningstar Style BoxTM reveals a fund's investment strategy. For equity funds, the vertical axis shows the market capitalization of the stocks owned, and the horizontal axis shows investment style (value, blend or growth.) Information shown is based on the most recent data provided by Morningstar.
Summary
g For the 12-month period that ended February 28, 2009, the fund's Class A shares returned negative 40.12% without sales charge.
g While its overall return was negative, the fund outperformed both the S&P 500 Index1 and the average return of its peer group, the Lipper Large-Cap Core Funds Classification.2
g The fund's focus on large, high quality companies with strong balance sheets helped relative performance in a tough economic environment.
Portfolio Management
Peter Santoro has been the lead manager since March 2008 and has co-managed the fund since July 2004, and has been associated with the advisor or its predecessors or affiliate organizations since 2003.
Craig Leopold has co-managed the fund since July 2004, and has been associated with the advisor or its predecessors or affiliate organizations since 2003.
1The Standard and Poor's (S&P) 500 Index tracks the performance of 500 widely held large-capitalization US stocks. Indices are not investments, do not incur fees or expenses and are not professionally managed. It is not possible to invest directly in an index. Securities in the fund may not match those in an index.
2Lipper Inc., a widely respected data provider in the industry, calculates an average total return (assuming reinvestment of distributions) for mutual funds with investment objectives similar to those of the fund. Lipper makes no adjustment for the effect of sales loads.
28
Performance Information – Columbia Large Cap Core Fund
Performance of a $10,000 investment 03/01/99 – 02/28/09 ($)
The chart above shows the change in value of a hypothetical $10,000 investment in Class A shares of Columbia Large Cap Core Fund during the stated time period, and does not reflect the deduction of taxes that a shareholder may pay on fund distributions or on the redemption of fund shares. The Standard & Poor's (S&P) 500 Index tracks the performance of 500 widely held, large-capitalization US stocks. Indices are not investments, do not incur fees or expenses and are not professionally managed. It is not possible to invest directly in an index. Securities in the fund may not match those in an index.
Performance of a $10,000 investment 03/01/99 – 02/28/09 ($)
| Sales charge | | without | | with | |
| Class A | | | 6,859 | | | | 6,462 | | |
| Class B | | | 6,383 | | | | 6,383 | | |
| Class C | | | 6,378 | | | | 6,378 | | |
| Class Z | | | 7,005 | | | | n/a | | |
Average annual total return as of 02/28/09 (%)
| Share class | | A | | B | | C | | Z | |
| Inception | | 08/02/99 | | 08/02/99 | | 08/02/99 | | 10/02/98 | |
| Sales charge | | without | | with | | without | | with | | without | | with | | without | |
| 1-year | | | –40.12 | | | | –43.55 | | | | –40.51 | | | | –43.42 | | | | –40.58 | | | | –41.17 | | | | –39.95 | | |
| 5-year | | | –5.44 | | | | –6.54 | | | | –6.13 | | | | –6.48 | | | | –6.15 | | | | –6.15 | | | | –5.18 | | |
| 10-year | | | –3.70 | | | | –4.27 | | | | –4.39 | | | | –4.39 | | �� | | –4.40 | | | | –4.40 | | | | –3.50 | | |
Average annual total return as of 03/31/09 (%)
| Share class | | A | | B | | C | | Z | |
| Sales charge | | without | | with | | without | | with | | without | | with | | without | |
| 1-year | | | –35.21 | | | | –38.93 | | | | –35.74 | | | | –38.89 | | | | –35.74 | | | | –36.37 | | | | –35.04 | | |
| 5-year | | | –3.74 | | | | –4.87 | | | | –4.48 | | | | –4.84 | | | | –4.47 | | | | –4.47 | | | | –3.50 | | |
| 10-year | | | –3.44 | | | | –4.01 | | | | –4.16 | | | | –4.16 | | | | –4.15 | | | | –4.15 | | | | –3.25 | | |
The "with sales charge" returns include the maximum initial sales charge of 5.75% for Class A shares, the applicable contingent deferred sales charge of 5.00% in the first year, declining to 1.00% in the sixth year and eliminated thereafter for Class B shares and 1.00% for Class C shares for the first year only. The "without sales charge" returns do not include the effect of sales charges. If they had, returns would be lower.
Performance results reflect any fee waivers or reimbursements of fund expenses by the investment advisor and/or any of its affiliates. Absent these fee waivers or expense reimbursement arrangements, performance results would have been lower.
All results shown assume reinvestment of distributions. Class Z shares are sold at net asset value with no distribution and service (Rule 12b-1) fees. Class Z shares have limited eligibility and the investment minimum requirements may vary. Please see the fund's prospectus for details. Performance for different share classes will vary based on differences in sales charges and fees associated with each class.
The tables do not reflect the deduction of taxes that a shareholder may pay on fund distributions or on the redemption of fund shares.
Class A, Class B and Class C shares commenced operations on August 2, 1999 and have no performance prior to that date. Performance prior to August 2, 1999 is that of Class Z shares, which do not have any distribution and service (Rule 12b-1) fees. If Class A, Class B and Class C shares distribution and service (Rule 12b-1) fees had been reflected, total returns would have been lower.
Performance data quoted represents past performance and current performance may be lower or higher. Past performance is no guarantee of future results. The investment return and principal value will fluctuate so that shares, when redeemed, may be worth more or less than the original cost. Please visit www.columbiafunds.com for daily and most recent month-end performance updates.
Annual operating expense ratio (%)*
| Class A | | | 1.09 | | |
| Class B | | | 1.84 | | |
| Class C | | | 1.84 | | |
| Class Z | | | 0.84 | | |
*The annual operating expense ratio is as stated in the fund's prospectus that is current as of the date of this report. Differences in expense ratios disclosed elsewhere in this report may result from including fee waivers and expense reimbursements as well as different time periods used in calculating the ratios.
29
Understanding Your Expenses – Columbia Large Cap Core Fund
Estimating your actual expenses
To estimate the expenses that you paid over the period, first you will need your account balance at the end of the period:
g For shareholders who receive their account statements from Columbia Management Services, Inc., your account balance is available online at www.columbiafunds.com or by calling Shareholder Services at 800.345.6611.
g For shareholders who receive their account statements from their financial intermediary, contact your financial intermediary to obtain your account balance.
1. Divide your ending account balance by $1,000. For example, if an account balance was $8,600 at the end of the period, the result would be 8.6.
2. In the section of the table below titled "Expenses paid during the period," locate the amount for your share class. You will find this number in the column labeled "Actual." Multiply this number by the result from step 1. Your answer is an estimate of the expenses you paid on your account during the period.
If the value of your account falls below the minimum initial investment requirement applicable to you, your account generally will be subject to a $20 annual fee. This fee is not included in the accompanying table. If you are subject to the fee, keep it in mind when you are estimating the ongoing expenses of investing in the fund and when comparing the expenses of this fund with other funds.
As a fund shareholder, you incur two types of costs. There are transaction costs, which generally include sales charges on purchases and may include redemption fees or exchange fees. There are also ongoing costs, which generally include investment advisory fees, distribution and service (Rule 12b-1) fees and other fund expenses. The information on this page is intended to help you understand the ongoing costs of investing in the fund and to compare these costs with the ongoing costs of investing in other mutual funds.
Analyzing your fund's expenses by share class
To illustrate these ongoing costs, we have provided an example and calculated the expenses paid by investors in each share class during the period. The information in the following table is based on an initial investment of $1,000, which is invested at the beginning of the period and held for the entire period. Expense information is calculated two ways and each method provides you with different information. The amount listed in the "Actual" column is calculated using the fund's actual operating expenses and total return for the period. The amount listed in the "Hypothetical" column for each share class assumes that the return each year is 5% before expenses and is calculated based on the fund's actual operating expenses. You should not use the hypothetical account values and expenses to estimate either your actual account balance at the end of the period or the expenses you paid during this period.
Compare with other funds
Since all mutual funds are required to include the same hypothetical calculations about expenses in shareholder reports, you can use this information to compare the ongoing cost of investing in the fund with other funds. To do so, compare the 5% hypothetical example with the 5% hypothetical examples that appear in the shareholder reports of other funds. As you compare hypothetical examples of other funds, it is important to note that hypothetical examples are meant to highlight the ongoing costs of investing in a fund and do not reflect any transaction costs, such as sales charges, redemption fees or exchange fees.
09/01/08 – 02/28/09
| | | Account value at the
beginning of the period ($) | | Account value at the
end of the period ($) | | Expenses paid
during the period ($) | | Fund's annualized
expense ratio (%) | |
| | | Actual | | Hypothetical | | Actual | | Hypothetical | | Actual | | Hypothetical | | Actual | |
| Class A | | | 1,000.00 | | | | 1,000.00 | | | | 611.22 | | | | 1,018.89 | | | | 4.75 | | | | 5.96 | | | | 1.19 | | |
| Class B | | | 1,000.00 | | | | 1,000.00 | | | | 609.98 | | | | 1,015.17 | | | | 7.74 | | | | 9.69 | | | | 1.94 | | |
| Class C | | | 1,000.00 | | | | 1,000.00 | | | | 609.19 | | | | 1,015.17 | | | | 7.74 | | | | 9.69 | | | | 1.94 | | |
| Class Z | | | 1,000.00 | | | | 1,000.00 | | | | 612.81 | | | | 1,020.13 | | | | 3.76 | | | | 4.71 | | | | 0.94 | | |
Expenses paid during the period are equal to the annualized expense ratio for the share class, multiplied by the average account value over the period, then multiplied by the number of days in the fund's most recent fiscal half-year and divided by 365.
It is important to note that the expense amounts shown in the table are meant to highlight only ongoing costs of investing in the fund and do not reflect any transaction costs, such as sales charges, redemption fees or exchange fees. Therefore, the hypothetical examples provided may not help you determine the relative total costs of owning shares of different funds. If these transaction costs were included, your costs would have been higher.
30
Portfolio Managers' Report – Columbia Large Cap Core Fund
For the 12-month period that ended February 28, 2009, the fund's Class A shares returned negative 40.12% without sales charge. In a difficult environment, the fund held up better than its benchmark, the S&P 500 Index,1 which returned negative 43.32%, and the average return of its peer group, the Lipper Large-Cap Core Funds Classification,2 which was negative 42.66%. Stock selection in the financials, consumer discretionary and industrials sectors helped the fund's relative returns. Against a backdrop of reduced debt financing options, only the fittest companies were able to take advantage of the low interest rates that prevailed. The fund focused on company balance sheets and sought to identify companies focused on capital preservation and efficiency initiatives in the challenging economic environment.
Financials, consumer discretionary and industrials positions helped stem losses
In response to a weakening economic environment, the fund sought to identify companies with good debt ratings and adequate liquidity that appeared well positioned for a future economic recovery. This strategy served the fund well, helping it stem losses in the hard-hit financials and consumer discretionary areas. In the financials sector, which lost nearly 60% during the period, companies whose shares lost 30% or 40% looked good by comparison. For example, property and casualty insurer ACE took advantage of disruptions in the property/casualty business by writing new business and taking market share in the wake of AIG's struggles. As AIG restructured, insurance broker Aon obtained better pricing and enhanced its balance sheet. Shares of Aon experienced a modest loss compared to many of its peers. Among diversified banks, JPMorgan Chase gave up a significant percentage of its value but it fared better than many of its competitors because of its strong balance sheet.
The fund also took into consideration the business focus of its holdings, seeking exposure to companies that produced or sold moderately priced goods. We actively sought out companies that we believed would take a disproportionate share of the wallets of cautious consumers. Among consumer stocks, moderately priced retailers such as Kohl's, Dollar Tree and TJX generated positive returns for the fund. The fund took profits and sold Kohl's while an overweight in Dollar Tree and TJX also aided relative returns. Similarly, McDonald's shares were nearly flat for the period, which aided returns. This approach also helped in the industrials sector, as we avoided companies that make big ticket items, such as airplanes, in favor of companies that provide more basic products to many industries. One example is fluid control producer Parker Hannifin, which supplies fluids for truck hydraulics. The Parker Hannifin shares dropped modestly comp ared to the 48% loss posted by industrials overall within the fund.
1The Standard & Poor's (S&P) 500 Index tracks the performance of 500 widely held, large-capitalization US stocks. Indices are not investments, do not incur fees or expenses and are not professionally managed. It is not possible to invest directly in an index. Securities in the fund may not match those in an index.
2Lipper Inc., a widely respected data provider in the industry, calculates an average total return (assuming reinvestment of distributions) for mutual funds with investment objectives similar to those of the fund. Lipper makes no adjustment for the effect of sales loads.
Performance data quoted represents past performance and current performance may be lower or higher. Past performance is no guarantee of future results. The investment return and principal value will fluctuate so that shares, when redeemed, may be worth more or less than the original cost. Please visit www.columbiafunds.com for daily and most recent month-end performance updates.
Net asset value per share
as of 02/28/09 ($)
| Class A | | | 7.95 | | |
| Class B | | | 7.71 | | |
| Class C | | | 7.70 | | |
| Class Z | | | 7.93 | | |
Distributions declared per share
03/01/08 – 02/28/09 ($)
| Class A | | | 0.35 | | |
| Class B | | | 0.27 | | |
| Class C | | | 0.27 | | |
| Class Z | | | 0.41 | | |
31
Portfolio Managers' Report (continued) – Columbia Large Cap Core Fund
Top 5 sectors
as of 02/28/09 (%)
| Information Technology | | | 17.2 | | |
| Health Care | | | 16.0 | | |
| Energy | | | 13.7 | | |
| Consumer Staples | | | 12.5 | | |
| Financials | | | 10.6 | | |
Top 10 holdings
as of 02/28/09 (%)
| Exxon Mobil | | | 3.3 | | |
| Chevron | | | 3.2 | | |
| Microsoft | | | 2.7 | | |
| Wyeth | | | 2.5 | | |
| AT&T | | | 2.3 | | |
| JPMorgan Chase | | | 2.2 | | |
| Wal-Mart Stores | | | 2.0 | | |
| Philip Morris International | | | 1.9 | | |
| Goldman Sachs Group | | | 1.9 | | |
| Hewlett-Packard | | | 1.8 | | |
| Apple | | | 1.7 | | |
Holdings discussed in this report
as of 02/28/09 (%)
| ACE | | | 0.5 | | |
| Aon | | | 0.5 | | |
| JPMorgan Chase | | | 2.2 | | |
| Dollar Tree | | | 0.4 | | |
| TJX | | | 0.8 | | |
| McDonald's | | | 0.8 | | |
| Parker Hannifin | | | 0.7 | | |
| Avon Products | | | 0.9 | | |
The fund is actively managed and the composition of its portfolio will change over time. Information provided is calculated as a percentage of net assets.
Exposure to global markets and currencies detracted from performance
During the period, a few individual holdings were disappointments. In the consumer staples sector, Avon Products was hurt by a slowdown in global consumer spending. Because much of the firm's business comes from international markets, a stronger U.S. dollar further eroded the company's financial position because many of its costs are denominated in dollars. A global economic slowdown also disproportionately affected the business prospects of cell phone maker Nokia, which has significant exposure to the African and Indian markets where per capita income is lower and the economic downturn has had a larger impact on consumer decisions. We subsequently sold the stock.
Positioned for continued volatility
We remain focused on high quality companies with strong balance sheets that we believe are well-positioned relative to their industry. By drawing on three independent research sources—fundamental research, quantitative models and the input of our portfolio management team—and by employing a disciplined valuation process, we are seeking companies that are positioned to capitalize on an eventual economic recovery.
Portfolio holdings and characteristics are subject to change periodically and may not be representative of current holdings and characteristics. The outlook for the fund may differ from that presented for other Columbia Funds.
Equity securities affected by stock market fluctuations that occur in response to economic and business developments.
International investing may involve certain risks, including currency fluctuations, risks associated with possible differences in financial accounting standards and other monetary and political risks. Significant levels of foreign taxes, including potentially confiscatory levels of taxation and withholding taxes, may also apply to some foreign investments.
32
Fund Profile – Columbia Marsico Focused Equities Fund
Summary
g For the 12-month period that ended February 28, 2009, the fund's Class A shares returned negative 40.73% without sales charge.
g In an environment of weak economic growth and declining stock prices, the fund performed slightly better than its benchmark, the S&P 500 Index1 and the average return of its peer group, the Lipper Large-Cap Growth Funds Classification for the period.2
g Stock selection and an average 9% cash position during the period helped the fund stem losses during a challenging period for all investors.
Portfolio Management
Thomas F. Marsico has managed the fund since December 1997 and is Chief Investment Officer of Marsico Capital Management, LLC ("MCM"), investment sub-advisor to the fund.
Columbia Management Advisors, LLC ("CMA") has retained MCM to serve as investment sub-advisor to the fund. As investment sub-advisor, MCM makes the investment decisions and manages the fund subject to the oversight of CMA and the fund's Board of Trustees. MCM is an investment advisor registered with the Securities and Exchange Commission and is an independently owned investment management firm.
1The Standard and Poor's (S&P) 500 Index tracks the performance of 500 widely held large-capitalization US stocks. Indices are not investments, do not incur fees or expenses and are not professionally managed. It is not possible to invest directly in an index. Securities in the fund may not match those in an index.
2Lipper Inc., a widely respected data provider in the industry, calculates an average total return (assuming reinvestment of distributions) for mutual funds with investment objectives similar to those of the fund. Lipper makes no adjustment for the effect of sales loads.
Performance data quoted represents past performance and current performance may be lower or higher. Past performance is no guarantee of future results. The investment return and principal value will fluctuate so that shares, when redeemed, may be worth more or less than the original cost. Please visit www.columbiafunds.com for daily and most recent month-end performance updates.
Summary
1-year return as of 02/28/09
| | | –40.73% | |
|
| |  | | | Class A shares
(without sales charge) | |
|
| | | –43.32% | |
|
| |  | | | S&P 500 Index | |
|
Morningstar Style BoxTM

The Morningstar Style BoxTM reveals a fund's investment strategy. For equity funds, the vertical axis shows the market capitalization of the stocks owned, and the horizontal axis shows investment style (value, blend or growth.) Information shown is based on the most recent data provided by Morningstar.
33
Performance Information – Columbia Marsico Focused Equities Fund
Performance data quoted represents past performance and current performance may be lower or higher. Past performance is no guarantee of future results. The investment return and principal value will fluctuate so that shares, when redeemed, may be worth more or less than the original cost. Please visit www.columbiafunds.com for daily and most recent month-end performance updates.
Annual operating expense ratio (%)*
| Class A | | | 1.26 | | |
| Class B | | | 2.01 | | |
| Class C | | | 2.01 | | |
| Class Z | | | 1.01 | | |
*The annual operating expense ratio is as stated in the fund's prospectus that is current as of the date of this report. Differences in expense ratios disclosed elsewhere in this report may result from including fee waivers and expense reimbursements as well as different time periods used in calculating the ratios.
Performance of a $10,000 investment 03/01/99 – 02/28/09 ($)
The chart above shows the change in value of a hypothetical $10,000 investment in Class A shares of Columbia Marsico Focused Equities Fund during the stated time period, and does not reflect the deduction of taxes that a shareholder may pay on fund distributions or on the redemption of fund shares. The Standard & Poor's (S&P) 500 Index tracks the performance of 500 widely held large-capitalization US stocks. Indices are not investments, do not incur fees or expenses and are not professionally managed. It is not possible to invest directly in an index. Securities in the fund may not match those in an index.
Performance of a $10,000 investment 03/01/99 – 02/28/09 ($)
| Sales charge | | without | | with | |
| Class A | | | 8,530 | | | | 8,040 | | |
| Class B | | | 7,919 | | | | 7,919 | | |
| Class C | | | 7,919 | | | | 7,919 | | |
| Class Z | | | 8,756 | | | | n/a | | |
Average annual total return as of 02/28/09 (%)
| Share class | | A | | B | | C | | Z | |
| Inception | | 12/31/97 | | 12/31/97 | | 12/31/97 | | 12/31/97 | |
| Sales charge | | without | | with | | without | | with | | without | | with | | without | |
| 1-year | | | –40.73 | | | | –44.15 | | | | –41.21 | | | | –44.15 | | | | –41.18 | | | | –41.77 | | | | –40.60 | | |
| 5-year | | | –5.15 | | | | –6.27 | | | | –5.87 | | | | –6.24 | | | | –5.86 | | | | –5.86 | | | | –4.92 | | |
| 10-year | | | –1.58 | | | | –2.16 | | | | –2.31 | | | | –2.31 | | | | –2.31 | | | | –2.31 | | | | –1.32 | | |
Average annual total return as of 03/31/09 (%)
| Share class | | A | | B | | C | | Z | |
| Sales charge | | without | | with | | without | | with | | without | | with | | without | |
| 1-year | | | –35.92 | | | | –39.60 | | | | –36.38 | | | | –39.56 | | | | –36.37 | | | | –37.01 | | | | –35.75 | | |
| 5-year | | | –3.96 | | | | –5.09 | | | | –4.67 | | | | –5.05 | | | | –4.67 | | | | –4.67 | | | | –3.72 | | |
| 10-year | | | –1.80 | | | | –2.38 | | | | –2.52 | | | | –2.52 | | | | –2.52 | | | | –2.52 | | | | –1.54 | | |
The "with sales charge" returns include the maximum initial sales charge of 5.75% for Class A shares, the applicable contingent deferred sales charge of 5.00% in the first year, declining to 1.00% in the sixth year, and eliminated thereafter for Class B shares and 1.00% for Class C shares for the first year only. The "without sales charge" returns do not include the effect of sales charges. If they had, returns would be lower.
Performance results reflect any fee waivers or reimbursements of fund expenses by the investment advisor and/or any of its affiliates. Absent these fee waivers or expense reimbursement arrangements, performance results would have been lower.
All results shown assume reinvestment of distributions. Class Z shares are sold at net asset value with no distribution and service (Rule 12b-1) fees. Class Z shares have limited eligibility and the investment minimum requirements may vary. Please see the fund's prospectus for details. Performance for different share classes will vary based on differences in sales charges and fees associated with each class.
The tables do not reflect the deduction of taxes that a shareholder may pay on fund distributions or on the redemption of fund shares.
34
Understanding Your Expenses – Columbia Marsico Focused Equities Fund
As a fund shareholder, you incur two types of costs. There are transaction costs, which generally include sales charges on purchases and may include redemption fees or exchange fees. There are also ongoing costs, which generally include investment advisory fees, distribution and service (Rule 12b-1) fees and other fund expenses. The information on this page is intended to help you understand the ongoing costs of investing in the fund and to compare these costs with the ongoing costs of investing in other mutual funds.
Analyzing your fund's expenses by share class
To illustrate these ongoing costs, we have provided an example and calculated the expenses paid by investors in each share class during the period. The information in the following table is based on an initial investment of $1,000, which is invested at the beginning of the period and held for the entire period. Expense information is calculated two ways and each method provides you with different information. The amount listed in the "Actual" column is calculated using the fund's actual operating expenses and total return for the period. The amount listed in the "Hypothetical" column for each share class assumes that the return each year is 5% before expenses and is calculated based on the fund's actual operating expenses. You should not use the hypothetical account values and expenses to estimate either your actual account balance at the end of the period or the expenses you paid during this period.
Compare with other funds
Since all mutual funds are required to include the same hypothetical calculations about expenses in shareholder reports, you can use this information to compare the ongoing cost of investing in the fund with other funds. To do so, compare the 5% hypothetical example with the 5% hypothetical examples that appear in the shareholder reports of other funds. As you compare hypothetical examples of other funds, it is important to note that hypothetical examples are meant to highlight the ongoing costs of investing in a fund and do not reflect any transaction costs, such as sales charges, redemption fees or exchange fees.
Estimating your actual expenses
To estimate the expenses that you paid over the period, first you will need your account balance at the end of the period:
g For shareholders who receive their account statements from Columbia Management Services, Inc., your account balance is available online at www.columbiafunds.com or by calling Shareholder Services at 800.345.6611.
g For shareholders who receive their account statements from their financial intermediary, contact your financial intermediary to obtain your account balance.
1. Divide your ending account balance by $1,000. For example, if an account balance was $8,600 at the end of the period, the result would be 8.6.
2. In the section of the table below titled "Expenses paid during the period," locate the amount for your share class. You will find this number in the column labeled "Actual." Multiply this number by the result from step 1. Your answer is an estimate of the expenses you paid on your account during the period.
If the value of your account falls below the minimum initial investment requirement applicable to you, your account generally will be subject to a $20 annual fee. This fee is not included in the accompanying table. If you are subject to the fee, keep it in mind when you are estimating the ongoing expenses of investing in the fund and when comparing the expenses of this fund with other funds.
09/01/08 – 02/28/09
| | | Account value at the
beginning of the period ($) | | Account value at the
end of the period ($) | | Expenses paid
during the period ($) | | Fund's annualized
expense ratio (%) | |
| | | Actual | | Hypothetical | | Actual | | Hypothetical | | Actual | | Hypothetical | | Actual | |
| Class A | | | 1,000.00 | | | | 1,000.00 | | | | 604.48 | | | | 1,018.30 | | | | 5.21 | | | | 6.56 | | | | 1.31 | | |
| Class B | | | 1,000.00 | | | | 1,000.00 | | | | 602.00 | | | | 1,014.58 | | | | 8.18 | | | | 10.29 | | | | 2.06 | | |
| Class C | | | 1,000.00 | | | | 1,000.00 | | | | 602.20 | | | | 1,014.58 | | | | 8.18 | | | | 10.29 | | | | 2.06 | | |
| Class Z | | | 1,000.00 | | | | 1,000.00 | | | | 605.02 | | | | 1,019.54 | | | | 4.22 | | | | 5.31 | | | | 1.06 | | |
Expenses paid during the period are equal to the annualized expense ratio for the share class, multiplied by the average account value over the period, then multiplied by the number of days in the fund's most recent fiscal half-year and divided by 365.
Had the investment advisor and/or any of its affiliates not waived fees or reimbursed a portion of expenses, account value at the end of the period would have been reduced.
It is important to note that the expense amounts shown in the table are meant to highlight only ongoing costs of investing in the fund and do not reflect any transaction costs, such as sales charges, redemption fees or exchange fees. Therefore, the hypothetical examples provided may not help you determine the relative total costs of owning shares of different funds. If these transaction costs were included, your costs would have been higher.
35
Portfolio Manager's Report – Columbia Marsico Focused Equities Fund
Performance data quoted represents past performance and current performance may be lower or higher. Past performance is no guarantee of future results. The investment return and principal value will fluctuate so that shares, when redeemed, may be worth more or less than the original cost. Please visit www.columbiafunds.com for daily and most recent month-end performance updates.
Net asset value per share
as of 02/28/09 ($)
| Class A | | | 12.76 | | |
| Class B | | | 11.80 | | |
| Class C | | | 11.84 | | |
| Class Z | | | 13.02 | | |
Distributions declared per share
03/01/08 – 02/28/09 ($)
| Class A | | | 0.04 | | |
| Class Z | | | 0.10 | | |
For the 12-month period that ended February 28, 2009, the fund's Class A shares returned negative 40.73% without sales charge. The fund's benchmark, the S&P 500 Index,1 returned negative 43.32%. The average return of the fund's peer group, the Lipper Large-Cap Growth Funds Classification,2 was negative 40.77%. Stock selection and the fund's cash position helped it stem some losses during a period of sharply declining stock prices. Sector allocations delivered mixed results.
A challenging period for stocks
In an environment of weak economic growth, rising unemployment and declining stock prices, there was no place for equity funds to hide during the period. However, stock selection helped the fund stem losses as several of the fund's sectors held up much better than the corresponding sectors within the S&P 500 Index, including financials, information technology, industrials, materials and health care. In the financials sector, the fund's collective financials positions posted a return of negative 49%. While this was weak in absolute terms, the fund's financials positions fared well compared to the S&P 500 Index financials sector, which declined more than 71%. In the information technology sector, financial transaction processor Visa generated a solid positive return while the losses posted by computer and consulting company International Business Machines and software producer Oracle were modest compared to losses for the overall sector. Likewise, in the industrials sector, the fund's positions posted a return of negative 41% compared to negative 54% for the industrials in the index. And in the materials sector, the fund's collective positions returned negative 39% compared to negative 55% for materials in the index.
In health care, strong performances by drug developers Schering-Plough and Genentech helped returns. In addition, the fund's cash position, which averaged 9% during the period, helped offset losses incurred elsewhere in the portfolio.
By contrast, the fund lost some ground relative to the index because it had less exposure than the index to sectors that held up better than the market overall, namely consumer staples, telecommunication services and utilities. In addition, stock selection in the consumer discretionary, energy and telecommunication services sectors hurt returns. In the consumer discretionary sector, hotel/casino operators Las Vegas Sands and Wynn Resorts and home improvement retailer Lowe's Cos., were among the largest detractors from performance. Additionally, the fund's energy positions, including Petroleo Brasileiro SA, Transocean Ltd., and Schlumberger hurt returns. (Schlumberger was sold prior to period-end).Finally, wireless telecommunication services providers China Mobile and Mexico-based America Movil S.A.B. de C.V. declined sharply during the period. (Both positions were sold prior to period end.)
1The Standard & Poor's (S&P) 500 Index tracks the performance of 500 widely held, large capitalization US stocks. Indices are not investments, do not incur fees or expenses and are not professionally managed. It is not possible to invest directly in an index. Securities in the fund may not match those in an index.
2Lipper Inc., a widely respected data provider in the industry, calculates an average total return (assuming reinvestment of distributions) for mutual funds with investment objectives similar to those of the fund. Lipper makes no adjustment for the effect of sales loads.
36
Portfolio Manager's Report (continued) – Columbia Marsico Focused Equities Fund
Looking ahead
Going into the next period, the fund's most significant sector weights included information technology, health care, consumer discretionary and industrials. At the end of the period, the fund had little or no exposure to either telecommunication services or utilities.
Source for all statistical data—Columbia Management Advisors, LLC.
Source for all stock-specific commentary—Marsico Capital Management, LLC.
Portfolio holdings and characteristics are subject to change periodically and may not be representative of current holdings and characteristics. The outlook for this fund may differ from that presented for other Columbia Funds.
Equity securities are affected by stock market fluctuations that occur in response to economic and business developments.
The fund normally will hold a core portfolio of between 20 and 30 common stocks. By maintaining a relatively non-diversified portfolio, the fund may be subject to a greater risk than a fund that is less focused. The fund may invest up to 25% of its total assets in foreign securities.
International investing may involve certain risks, including currency fluctuations, risks associated with possible differences in financial accounting standards and other monetary and political risks. Significant levels of foreign taxes, including potentially confiscatory levels of taxation and withholding taxes, may also apply to some foreign investments.
Some of the countries in which the fund invests are considered emerging economies, which means there may be greater risks associated with investing there than in more developed countries. In addition, concentration of investments in a single region may result in greater volatility.
Top 5 sectors
as of 02/28/09 (%)
| Information Technology | | | 24.0 | | |
| Consumer Discretionary | | | 15.5 | | |
| Health Care | | | 15.0 | | |
| Industrials | | | 14.4 | | |
| Consumer Staples | | | 9.1 | | |
Top 10 holdings
as of 02/28/09 (%)
| McDonald's | | | 10.5 | | |
| Genentech | | | 8.1 | | |
| Visa | | | 7.0 | | |
| Union Pacific | | | 5.4 | | |
| Wal-Mart Stores | | | 5.1 | | |
| MasterCard | | | 4.8 | | |
| Goldman Sachs Group | | | 4.8 | | |
| Monsanto | | | 4.7 | | |
| Lockheed Martin | | | 4.3 | | |
| Transocean | | | 4.2 | | |
Holdings discussed in this report
as of 02/28/09 (%)
| Visa | | | 7.0 | | |
| International Business | |
| Machines | | | 1.4 | | |
| Oracle | | | 0.3 | | |
| Schering-Plough | | | 1.2 | | |
| Genentech | | | 8.1 | | |
| Las Vegas Sands | | | 0.4 | | |
| Wynn Resorts | | | 1.3 | | |
| Lowe's Cos. | | | 2.8 | | |
| Petroleo Brasileiro SA | | | 1.1 | | |
| Transocean | | | 4.2 | | |
The fund is actively managed and the composition of its portfolio will change over time. Information provided is calculated as a percentage of net assets.
37
Fund Profile – Columbia Marsico 21st Century Fund
Performance data quoted represents past performance and current performance may be lower or higher. Past performance is no guarantee of future results. The investment return and principal value will fluctuate so that shares, when redeemed, may be worth more or less than the original cost. Please visit www.columbiafunds.com for daily and most recent month-end performance updates.
Summary
1-year return as of 02/28/09
| | | –49.76% | |
|
| |  | | | Class A shares
(without sales charge) | |
|
| | | –43.51% | |
|
| |  | | | Russell 3000 Index | |
|
Morningstar Style BoxTM

The Morningstar Style BoxTM reveals a fund's investment strategy. For equity funds, the vertical axis shows the market capitalization of the stocks owned and the horizontal axis shows investment style (value, blend or growth). Information shown is based on the most recent data provided by Morningstar.
Summary
g For the 12-month period that ended February 28, 2009, the fund's Class A shares returned negative 49.76% without sales charge.
g In a period of sharply declining stock prices, the fund underperformed its benchmark, the Russell 3000 Index1 and the average return of its peer group, the Lipper Multi-Cap Growth Funds Classification for the period.2
g Stock selection in consumer discretionary, health care and consumer staples sectors detracted from the fund's relative performance. Allocations to financials and health care were a further drag on the fund's return.
Portfolio Management
Corydon J. Gilchrist has managed the fund since February 2003. He is with Marsico Capital Management, LLC ("MCM"), investment sub-advisor to the fund.
Columbia Management Advisors, LLC ("CMA") has retained MCM to serve as investment sub-advisor to the fund. As investment sub-advisor, MCM makes the investment decisions and manages the fund subject to the oversight of CMA and the fund's Board of Trustees. MCM is an investment advisor registered with the Securities and Exchange Commission and is an independently owned investment management firm.
1The Russell 3000 Index measures the performance of 3,000 of the largest US companies based on market capitalization. Indices are not investments, do not incur fees or expenses and are not professionally managed. It is not possible to invest directly in an index. Securities in the fund may not match those in an index.
2Lipper Inc., a widely respected data provider in the industry, calculates an average total return (assuming reinvestment of distributions) for mutual funds with investment objectives similar to those of the fund. Lipper makes no adjustment for the effect of sales loads.
38
Performance Information – Columbia Marsico 21st Century Fund
Performance of a $10,000 investment 04/10/00 – 02/28/09 ($)
The chart above shows the change in value of a hypothetical $10,000 investment in Class A shares of Columbia Marsico 21st Century Fund during the stated time period, and does not reflect the deduction of taxes that a shareholder may pay on fund distributions or on the redemption of fund shares. The Russell 3000 Index measures the performance of 3,000 of the largest US companies, based on market capitalization. Indices are not investments, do not incur fees or expenses, and are not professionally managed. It is not possible to invest directly in an index. Securities in the fund may not match those in an index.
Performance of a $10,000 investment 04/10/00 – 02/28/09 ($)
| Sales charge | | without | | with | |
| Class A | | | 7,722 | | | | 7,278 | | |
| Class B | | | 7,233 | | | | 7,233 | | |
| Class C | | | 7,222 | | | | 7,222 | | |
| Class R | | | 7,658 | | | | n/a | | |
| Class Z | | | 7,903 | | | | n/a | | |
Performance data quoted represents past performance and current performance may be lower or higher. Past performance is no guarantee of future results. The investment return and principal value will fluctuate so that shares, when redeemed, may be worth more or less than the original cost. Please visit www.columbiafunds.com for daily and most recent month-end performance updates.
Annual operating expense ratio (%)*
| Class A | | | 1.24 | | |
| Class B | | | 1.99 | | |
| Class C | | | 1.99 | | |
| Class R | | | 1.49 | | |
| Class Z | | | 0.99 | | |
*The annual operating expense ratio is as stated in the fund's prospectus that is current as of the date of this report. Differences in expense ratios disclosed elsewhere in this report may result from including fee waivers and expense reimbursements as well as different time periods used in calculating the ratios.
Average annual total return as of 02/28/09 (%)
| Share class | | A | | B | | C | | R | | Z | |
| Inception | | 04/10/00 | | 04/10/00 | | 04/10/00 | | 01/23/06 | | 04/10/00 | |
| Sales charge | | without | | with | | without | | with | | without | | with | | without | | without | |
| 1-year | | | –49.76 | | | | –52.66 | | | | –50.07 | | | | –52.57 | | | | –50.14 | | | | –50.64 | | | | –49.90 | | | | –49.59 | | |
| 5-year | | | –4.26 | | | | –5.39 | | | | –4.96 | | | | –5.33 | | | | –4.97 | | | | –4.97 | | | | –4.42 | | | | –4.02 | | |
| Life | | | –2.87 | | | | –3.51 | | | | –3.58 | | | | –3.58 | | | | –3.59 | | | | –3.59 | | | | –2.96 | | | | –2.61 | | |
Average annual total return as of 03/31/09 (%)
| Share class | | A | | B | | C | | R | | Z | |
| Sales charge | | without | | with | | without | | with | | without | | with | | without | | without | |
| 1-year | | | –46.28 | | | | –49.37 | | | | –46.69 | | | | –49.35 | | | | –46.76 | | | | –47.29 | | | | –46.42 | | | | –46.20 | | |
| 5-year | | | –3.56 | | | | –4.69 | | | | –4.29 | | | | –4.65 | | | | –4.31 | | | | –4.31 | | | | –3.72 | | | | –3.33 | | |
| Life | | | –2.33 | | | | –2.97 | | | | –3.06 | | | | –3.06 | | | | –3.07 | | | | –3.07 | | | | –2.42 | | | | –2.09 | | |
The "with sales charge" returns include the maximum initial sales charge of 5.75% for Class A shares, the applicable contingent deferred sales charge of 5.00% in the first year, declining to 1.00% in the sixth year and eliminated thereafter for Class B shares and 1.00% for Class C shares for the first year only. The "without sales charge" returns do not include the effect of sales charges. If they had, returns would be lower.
Performance results reflect any fee waivers or reimbursement of fund expenses by the investment advisor and/or any of its affiliates. Absent these fee waivers or expense reimbursement arrangements, performance results would have been lower.
All results shown assume reinvestment of distributions. Class Z shares are sold at net asset value with no distribution and service (Rule 12b-1) fees. Class R shares are sold at net asset value with distribution and service (Rule 12b-1) fees. Class R and Class Z shares have limited eligibility and the investment minimum requirements may vary. Please see the fund's prospectus for details. Performance for different share classes will vary based on differences in sales charges and fees associated with each class.
The tables do not reflect the deduction of taxes that a shareholder may pay on fund distributions or on the redemption of fund shares.
The returns for Class R include the returns of Class A prior to January 23, 2006, the date on which Class R shares were initially offered by the fund. If differences in expenses had been reflected, the returns would have been lower, since Class R shares are subject to higher distribution and service (Rule 12b-1) fees.
39
Understanding Your Expenses – Columbia Marsico 21st Century Fund
Estimating your actual expenses
To estimate the expenses that you paid over the period, first you will need your account balance at the end of the period:
g For shareholders who receive their account statements from Columbia Management Services, Inc., your account balance is available online at www.columbiafunds.com or by calling Shareholder Services at 800.345.6611.
g For shareholders who receive their account statements from their financial intermediary, contact your financial intermediary to obtain your account balance.
1. Divide your ending account balance by $1,000. For example, if an account balance was $8,600 at the end of the period, the result would be 8.6.
2. In the section of the table below titled "Expenses paid during the period," locate the amount for your share class. You will find this number in the column labeled "Actual." Multiply this number by the result from step 1. Your answer is an estimate of the expenses you paid on your account during the period.
If the value of your account falls below the minimum initial investment requirement applicable to you, your account generally will be subject to a $20 annual fee. This fee is not included in the accompanying table. If you are subject to the fee, keep it in mind when you are estimating the ongoing expenses of investing in the fund and when comparing the expenses of this fund with other funds.
As a fund shareholder, you incur two types of costs. There are transaction costs, which generally include sales charges on purchases and may include redemption fees or exchange fees. There are also ongoing costs, which generally include investment advisory fees, distribution and service (Rule 12b-1) fees and other fund expenses. The information on this page is intended to help you understand the ongoing costs of investing in the fund and to compare these costs with the ongoing costs of investing in other mutual funds.
Analyzing your fund's expenses by share class
To illustrate these ongoing costs, we have provided an example and calculated the expenses paid by investors in each share class during the period. The information in the following table is based on an initial investment of $1,000, which is invested at the beginning of the period and held for the entire period. Expense information is calculated two ways and each method provides you with different information. The amount listed in the "Actual" column is calculated using the fund's actual operating expenses and total return for the period. The amount listed in the "Hypothetical" column for each share class assumes that the return each year is 5% before expenses and is calculated based on the fund's actual operating expenses. You should not use the hypothetical account values and expenses to estimate either your actual account balance at the end of the period or the expenses you paid during this period.
Compare with other funds
Since all mutual funds are required to include the same hypothetical calculations about expenses in shareholder reports, you can use this information to compare the ongoing cost of investing in the fund with other funds. To do so, compare the 5% hypothetical example with the 5% hypothetical examples that appear in the shareholder reports of other funds. As you compare hypothetical examples of other funds, it is important to note that hypothetical examples are meant to highlight the ongoing costs of investing in a fund and do not reflect any transaction costs, such as sales charges, redemption fees or exchange fees.
09/01/08 – 02/28/09
| | | Account value at the
beginning of the period ($) | | Account value at the
end of the period ($) | | Expenses paid
during the period ($) | | Fund's annualized
expense ratio (%) | |
| | | Actual | | Hypothetical | | Actual | | Hypothetical | | Actual | | Hypothetical | | Actual | |
| Class A | | | 1,000.00 | | | | 1,000.00 | | | | 532.38 | | | | 1,018.05 | | | | 5.17 | | | | 6.80 | | | | 1.36 | | |
| Class B | | | 1,000.00 | | | | 1,000.00 | | | | 531.09 | | | | 1,014.33 | | | | 8.01 | | | | 10.54 | | | | 2.11 | | |
| Class C | | | 1,000.00 | | | | 1,000.00 | | | | 530.69 | | | | 1,014.33 | | | | 8.01 | | | | 10.54 | | | | 2.11 | | |
| Class R | | | 1,000.00 | | | | 1,000.00 | | | | 531.68 | | | | 1,016.81 | | | | 6.11 | | | | 8.05 | | | | 1.61 | | |
| Class Z | | | 1,000.00 | | | | 1,000.00 | | | | 533.71 | | | | 1,019.29 | | | | 4.22 | | | | 5.56 | | | | 1.11 | | |
Expenses paid during the period are equal to the annualized expense ratio for the share class, multiplied by the average account value over the period, then multiplied by the number of days in the fund's most recent fiscal half-year and divided by 365.
Had the investment advisor and/or any of its affiliates not waived fees or reimbursed a portion of expenses, account value at the end of the period would have been reduced.
It is important to note that the expense amounts shown in the table are meant to highlight only ongoing costs of investing in the fund and do not reflect any transaction costs, such as sales charges, redemption fees or exchange fees. Therefore, the hypothetical examples provided may not help you determine the relative total costs of owning shares of different funds. If these transaction costs were included, your costs would have been higher.
40
Portfolio Manager's Report – Columbia Marsico 21st Century Fund
For the 12-month period that ended February 28, 2009, the fund's Class A shares returned negative 49.76% without sales charge. The fund underperformed its benchmark, the Russell 3000 Index,1 which returned negative 43.51%. The fund's return was lower than the average return of its peer group, the Lipper Multi-Cap Growth Funds Classification,2 which was negative 42.49%. Stock selection in consumer discretionary, health care and consumer staples sectors detracted from performance. Allocations to financials and health care were a further drag on the fund's return.
In a weak market, stock selection and sector allocations weighed on returns
In the consumer discretionary sector, Las Vegas Sands and Wynn Resorts were weak performers, as was retailer Saks, Inc. In the health care sector, Amylin Pharmaceuticals, Intuitive Surgical and UnitedHealth Group all experienced sharp declines before they were sold. Costco Wholesale and Heineken Holding N.V. detracted from performance in the fund's consumer staples sector.
Relative performance was additionally hampered by some of the fund's sector weights. Even though the fund cut back its allocation to financials, it had more exposure than the index to the weak-performing sector. It had less exposure than the index to health care, which held up somewhat better than many other sectors in the sharp market decline. The fund's health care weight increased during the period, as did its exposure to information technology. Sector level weights generally should be considered a residual of the fund's stock selection process rather than a major proactive facet of its investment strategy.
Cash and stock selection in economically sensitive sectors cushioned the fall
Although all sectors of the market experienced severe losses, the fund's positions in information technology, materials and industrials lost significantly less, on average, than those sectors within the index. In the industrials sector, for example, AECOM Technology and First Solar experienced modest single digit declines. DRS Technologies gained while the overall industrials sector was down for the period. DRS and First Solar were sold. An average cash position of 12% helped to cushion the fund in a difficult market environment. Several of the fund's holdings bucked the negative trend and posted gains, including Southwestern Energy Co., Credit Suisse Group AG, People's United Financial and Anheuser-Busch InBev. Southwestern Energy and Credit Suisse were sold prior to the period's end.
1The Russell 3000 Index measures the performance of 3,000 of the largest US companies based on market capitalization. Indices are not investments, do not incur fees or expenses and are not professionally managed. It is not possible to invest directly in an index. Securities in the fund may not match those in an index.
2Lipper Inc., a widely respected data provider in the industry, calculates an average total return (assuming reinvestment of distributions) for mutual funds with investment objectives similar to those of the fund. Lipper makes no adjustment for the effect of sales loads.
Performance data quoted represents past performance and current performance may be lower or higher. Past performance is no guarantee of future results. The investment return and principal value will fluctuate so that shares, when redeemed, may be worth more or less than the original cost. Please visit www.columbiafunds.com for daily and most recent month-end performance updates.
Net asset value per share
as of 02/28/09 ($)
| Class A | | | 7.31 | | |
| Class B | | | 6.92 | | |
| Class C | | | 6.91 | | |
| Class R | | | 7.29 | | |
| Class Z | | | 7.44 | | |
41
Portfolio Manager's Report (continued) – Columbia Marsico 21st Century Fund
Top 5 sectors
as of 02/28/09 (%)
| Information Technology | | | 21.6 | | |
| Industrials | | | 15.2 | | |
| Financials | | | 13.1 | | |
| Consumer Staples | | | 11.1 | | |
| Health Care | | | 11.0 | | |
Top 10 holdings
as of 02/28/09 (%)
| MasterCard | | | 7.9 | | |
| Costco Wholesale | | | 6.3 | | |
| Monsanto | | | 5.1 | | |
| Gilead Sciences | | | 4.7 | | |
| Vesta Wind Systems A/S | | | 4.2 | | |
| Canadian National Railway | | | 4.1 | | |
| Heineken Holding | | | 3.5 | | |
| Home Depot | | | 3.4 | | |
| Raytheon | | | 3.4 | | |
| Visa | | | 3.1 | | |
Holdings discussed in this report
as of 02/28/09 (%)
| Las Vegas Sands | | | 0.3 | | |
| Wynn Resorts | | | 1.1 | | |
| Saks | | | 0.7 | | |
| Costco Wholesale | | | 6.3 | | |
| Heineken Holding NV | | | 3.5 | | |
| AECOM Technology | | | 2.1 | | |
| People's United Financial | | | 2.4 | | |
| Anheuser-Busch InBev | | | 1.3 | | |
The fund is actively managed and the composition of its portfolio will change over time. Information provided is calculated as a percentage of net assets.
Going forward
At the end of the period, the fund emphasized investments in the information technology, industrials, financials, consumer staples, health care and consumer discretionary sectors. It had little or no exposure to the telecommunication services, energy and utilities sectors. The fund's cash and cash equivalent positions was approximately 12% of the fund's net assets.
Source for all statistical data—Columbia Management Advisors, LLC.
Source for all stock-specific commentary—Marsico Capital Management, LLC.
Portfolio holdings and characteristics are subject to change periodically and may not be representative of current holdings and characteristics. The outlook for this fund may differ from that presented for other Columbia Funds.
Equity securities are affected by stock market fluctuations that occur in response to economic and business developments.
The fund may invest without limit in foreign securities, including emerging markets securities. International investing may involve certain risks, including currency fluctuations, risks associated with possible differences in financial accounting standards and other monetary and political risks. Significant levels of foreign taxes, including potentially confiscatory levels of taxation and withholding taxes, may also apply to some foreign investments.
Some of the countries in which the fund invests are considered emerging economies, which means there may be greater risks associated with investing there than in more developed countries. In addition, concentration of investments in a single region may result in greater volatility.
42
Fund Profile – Columbia Small Cap Growth Fund II
Summary
g For the 12-month period that ended February 28, 2009, the fund's Class A shares returned negative 43.33% without sales charge.
g The fund underperformed the Russell 2000 Growth Index1 and performed in line with its peer group, the Lipper Small Cap Growth Funds Classification.2
g The negative performance of the fund, its benchmark and peer group reflected an extremely difficult market environment. Stock selection in health care, financials and materials further eroded the fund's relative returns.
Portfolio Management
Daniele M. Donahoe has co-managed the fund since December 2005 and has been associated with the advisor or its predecessors or affiliate organizations since 2002.
Jon Michael Morgan has co-managed the fund since December 2005 and has been associated with the advisor or its predecessors or affiliate organizations since 2000.
Christian F. Pineno has co-managed the fund since October 2006 and previously from January 1997 to December 2005 and has been associated with the advisor or its predecessors or affiliate organizations since 1995.
1The Russell 2000 Growth Index measures the performance of those Russell 2000 Index companies with higher price-to-book ratios and higher forecasted growth values. Indices are not investments, do not incur fees or expenses and are not professionally managed. It is not possible to invest directly in an index. Securities in the fund may not match those in an index.
2Lipper Inc., a widely respected data provider in the industry, calculates an average total return (assuming reinvestment of distributions) for mutual funds with investment objectives similar to those of the fund. Lipper makes no adjustment for the effect of sales loads.
Performance data quoted represents past performance and current performance may be lower or higher. Past performance is no guarantee of future results. The investment return and principal value will fluctuate so that shares, when redeemed, may be worth more or less than the original cost. Please visit www.columbiafunds.com for daily and most recent month-end performance updates.
Summary
1-year return as of 02/28/09
| | | –43.33% | |
|
| |  | | | Class A shares
(without sales charge) | |
|
| | | –41.94% | |
|
| |  | | | Russell 2000 Growth Index | |
|
Morningstar Style BoxTM

The Morningstar Style BoxTM reveals a fund's investment strategy. For equity funds, the vertical axis shows the market capitalization of the stocks owned, and the horizontal axis shows investment style (value, blend or growth). Information shown is based on the most recent data provided by Morningstar.
43
Performance Information – Columbia Small Cap Growth Fund II
Performance data quoted represents past performance and current performance may be lower or higher. Past performance is no guarantee of future results. The investment return and principal value will fluctuate so that shares, when redeemed, may be worth more or less than the original cost. Please visit www.columbiafunds.com for daily and most recent month-end performance updates.
Annual operating expense ratio (%)*
| Class A | | | 1.27 | | |
| Class B | | | 2.02 | | |
| Class C | | | 2.02 | | |
| Class Z | | | 1.02 | | |
*The annual operating expense ratio is as stated in the fund's prospectus that is current as of the date of this report. Differences in expense ratios disclosed elsewhere in this report may result from including fee waivers and expense reimbursements as well as different time periods used in calculating the ratios.
Performance of a $10,000 investment 03/01/99 – 02/28/09 ($)
The chart above shows the change in value of a hypothetical $10,000 investment in Class A shares of Columbia Small Cap Growth Fund II during the stated time period, and does not reflect the deduction of taxes that a shareholder may pay on fund distributions or on the redemption of fund shares. The Russell 2000 Growth Index measures the performance of those Russell 2000 Index companies with higher price-to-book ratios and higher forecasted growth values. Indices are not investments, do not incur fees or expenses and are not professionally managed. It is not possible to invest directly in an index. Securities in the fund may not match those in an index.
Performance of a $10,000 investment 03/01/99 – 02/28/09 ($)
| Sales charge | | without | | with | |
| Class A | | | 10,427 | | | | 9,829 | | |
| Class B | | | 9,683 | | | | 9,683 | | |
| Class C | | | 9,683 | | | | 9,683 | | |
| Class Z | | | 10,675 | | | | n/a | | |
Average annual total return as of 02/28/09 (%)
| Share class | | A | | B | | C | | Z | |
| Inception | | 12/12/95 | | 12/12/95 | | 09/22/97 | | 12/12/95 | |
| Sales charge | | without | | with | | without | | with | | without | | with | | without | |
| 1-year | | | –43.33 | | | | –46.57 | | | | –43.75 | | | | –46.56 | | | | –43.74 | | | | –44.31 | | | | –43.23 | | |
| 5-year | | | –7.22 | | | | –8.32 | | | | –7.93 | | | | –8.13 | | | | –7.93 | | | | –7.93 | | | | –7.01 | | |
| 10-year | | | 0.42 | | | | –0.17 | | | | –0.32 | | | | –0.32 | | | | –0.32 | | | | –0.32 | | | | 0.65 | | |
Average annual total return as of 03/31/09 (%)
| Share class | | A | | B | | C | | Z | |
| Sales charge | | without | | with | | without | | with | | without | | with | | without | |
| 1-year | | | –38.62 | | | | –42.16 | | | | –39.08 | | | | –42.13 | | | | –39.08 | | | | –39.69 | | | | –38.44 | | |
| 5-year | | | –5.73 | | | | –6.84 | | | | –6.42 | | | | –6.63 | | | | –6.43 | | | | –6.43 | | | | –5.48 | | |
| 10-year | | | 1.05 | | | | 0.45 | | | | 0.31 | | | | 0.31 | | | | 0.31 | | | | 0.31 | | | | 1.30 | | |
The "with sales charge" returns include the maximum initial sales charge of 5.75% for Class A shares, the applicable contingent deferred sales charge of 5.00% in the first year, declining to 1.00% in the sixth year and eliminated thereafter for Class B shares and 1.00% for Class C shares for the first year only. The "without sales charge" returns do not include the effect of sales charges. If they had, returns would be lower.
Performance results reflect any fee waivers or reimbursements of fund expenses by the investment advisor and/or any of its affiliates. Absent these fee waivers or expense reimbursement arrangements, performance results would have been lower.
All results shown assume reinvestment of distributions. Class Z shares are sold at net asset value with no distribution and service (Rule 12b-1) fees. Class Z shares have limited eligibility and the investment minimum requirements may vary. Please see the fund's prospectus for details. Performance for different share classes will vary based on differences in sales charges and fees associated with each class.
The tables do not reflect the deduction of taxes that a shareholder may pay on fund distributions or on the redemption of fund shares.
44
Understanding Your Expenses – Columbia Small Cap Growth Fund II
As a fund shareholder, you incur two types of costs. There are transaction costs, which generally include sales charges on purchases and may include redemption fees or exchange fees. There are also ongoing costs, which generally include investment advisory fees, distribution and service (Rule 12b-1) fees and other fund expenses. The information on this page is intended to help you understand the ongoing costs of investing in the fund and to compare these costs with the ongoing costs of investing in other mutual funds.
Analyzing your fund's expenses by share class
To illustrate these ongoing costs, we have provided an example and calculated the expenses paid by investors in each share class during the period. The information in the following table is based on an initial investment of $1,000, which is invested at the beginning of the period and held for the entire period. Expense information is calculated two ways and each method provides you with different information. The amount listed in the "Actual" column is calculated using the fund's actual operating expenses and total return for the period. The amount listed in the "Hypothetical" column for each share class assumes that the return each year is 5% before expenses and is calculated based on the fund's actual operating expenses. You should not use the hypothetical account values and expenses to estimate either your actual account balance at the end of the period or the expenses you paid during this period.
Compare with other funds
Since all mutual funds are required to include the same hypothetical calculations about expenses in shareholder reports, you can use this information to compare the ongoing cost of investing in the fund with other funds. To do so, compare the 5% hypothetical example with the 5% hypothetical examples that appear in the shareholder reports of other funds. As you compare hypothetical examples of other funds, it is important to note that hypothetical examples are meant to highlight the ongoing costs of investing in a fund and do not reflect any transaction costs, such as sales charges, redemption fees or exchange fees.
Estimating your actual expenses
To estimate the expenses that you paid over the period, first you will need your account balance at the end of the period:
g For shareholders who receive their account statements from Columbia Management Services, Inc., your account balance is available online at www.columbiafunds.com or by calling Shareholder Services at 800.345.6611.
g For shareholders who receive their account statements from their financial intermediary, contact your financial intermediary to obtain your account balance.
1. Divide your ending account balance by $1,000. For example, if an account balance was $8,600 at the end of the period, the result would be 8.6.
2. In the section of the table below titled "Expenses paid during the period," locate the amount for your share class. You will find this number in the column labeled "Actual." Multiply this number by the result from step 1. Your answer is an estimate of the expenses you paid on your account during the period.
If the value of your account falls below the minimum initial investment requirement applicable to you, your account generally will be subject to a $20 annual fee. This fee is not included in the accompanying table. If you are subject to the fee, keep it in mind when you are estimating the ongoing expenses of investing in the fund and when comparing the expenses of this fund with other funds.
09/01/08 – 02/28/09
| | | Account value at the
beginning of the period ($) | | Account value at the
end of the period ($) | | Expenses paid
during the period ($) | | Fund's annualized
expense ratio (%) | |
| | | Actual | | Hypothetical | | Actual | | Hypothetical | | Actual | | Hypothetical | | Actual | |
| Class A | | | 1,000.00 | | | | 1,000.00 | | | | 521.32 | | | | 1,018.40 | | | | 4.87 | | | | 6.46 | | | | 1.29 | | |
| Class B | | | 1,000.00 | | | | 1,000.00 | | | | 519.58 | | | | 1,014.68 | | | | 7.69 | | | | 10.19 | | | | 2.04 | | |
| Class C | | | 1,000.00 | | | | 1,000.00 | | | | 519.09 | | | | 1,014.68 | | | | 7.68 | | | | 10.19 | | | | 2.04 | | |
| Class Z | | | 1,000.00 | | | | 1,000.00 | | | | 521.32 | | | | 1,019.64 | | | | 3.92 | | | | 5.21 | | | | 1.04 | | |
Expenses paid during the period are equal to the annualized expense ratio for the share class, multiplied by the average account value over the period, then multiplied by the number of days in the fund's most recent fiscal half-year and divided by 365.
Had the investment advisor and/or any of its affiliates not waived fees or reimbursed a portion of expenses, account value at the end of the period would have been reduced.
It is important to note that the expense amounts shown in the table are meant to highlight only ongoing costs of investing in the fund and do not reflect any transaction costs, such as sales charges, redemption fees or exchange fees. Therefore, the hypothetical examples provided may not help you determine the relative total costs of owning shares of different funds. If these transaction costs were included, your costs would have been higher.
45
Portfolio Managers' Report – Columbia Small Cap Growth Fund II
Performance data quoted represents past performance and current performance may be lower or higher. Past performance is no guarantee of future results. The investment return and principal value will fluctuate so that shares, when redeemed, may be worth more or less than the original cost. Please visit www.columbiafunds.com for daily and most recent month-end performance updates.
Net asset value per share
as of 02/28/09 ($)
| Class A | | | 5.99 | | |
| Class B | | | 5.31 | | |
| Class C | | | 5.44 | | |
| Class Z | | | 6.25 | | |
For the 12-month period that ended February 28, 2009, the fund's Class A shares returned negative 43.33% without sales charge. The Russell 2000 Growth Index1 returned negative 41.94%. The average return of the fund's peer group, the Lipper Small Cap Growth Funds Classification,2 was negative 43.38%. The fund's return relative to the index was hurt by stock selection in the health care, financials and materials sectors. We believe that positive performance from certain consumer discretionary, energy and telecom services holdings helped the fund hold up marginally better than the average fund in its peer group.
Health care, financials and materials disappointed
Several holdings in the health care sector underperformed the market, hurting the fund's relative returns. Among these were surgical device maker ArthroCare, which lost favor with investors when it restated its financial performance for multiple years, and Hologic, which was hurt as the weak economic environment eroded sales of its digital mammography equipment. We subsequently sold both stocks. In the financials sector, inter-broker/dealer GFI Group lost a group of credit derivatives brokers to a competitor, and asset manager Waddell & Reed Financial lost ground as the stock market eroded both the current value of its assets under management and the expected revenues of the firm's broker/dealer arm. We exited GFI Group. In the materials sector, Solutia and Koppers Holdings were hurt by rising materials costs and weak demand. Hecla Mining also detracted from returns. The company suffered as demand for precious metals weakene d. We subsequently sold the stock.
Positive performers across sectors helped offset some losses
In the consumer discretionary sector, for-profit education stocks, Strayer Education, Inc. and Capella Education posted gains for the period. The fund had more exposure to them than the index, which amplified the positive impact of the gains on relative performance. Both companies benefited as unemployment rose and job-seekers sought additional education. The fund subsequently sold its position in Strayer. Another consumer discretionary stock that benefited in the weak economic environment was Netflix, which continued to experience rising consumer demand for its inexpensive mail and streaming video movie rental services. The stock of Marvel Entertainment, Inc. was bolstered by its hit movie "Iron Man." In the technology sector, Olympic ad sales boosted the stock of Chinese online media portal Sohu.com. In telecom services, wireless data provider Syniverse Holdings produced solid revenues on rapid growth of Internet data use. Whi le the stock was down for the period, it held up better than the overall telecom sector.
1The Russell 2000 Growth Index measures the performance of those Russell 2000 Index companies with higher price-to-book ratios and higher forecasted growth values. Indices are not investments, do not incur fees or expenses and are not professionally managed. It is not possible to invest directly in an index. Securities in the fund may not match those in an index.
2Lipper Inc., a widely respected data provider in the industry, calculates an average total return (assuming reinvestment of distributions) for mutual funds with investment objectives similar to those of the fund. Lipper makes no adjustment for the effect of sales loads.
46
Portfolio Managers' Report (continued) – Columbia Small Cap Growth Fund II
Timely moves in the energy sector
Alpha Natural Resources and Walter Industries, both of which produce metallurgical coal used in steel production, contributed positive returns early in the period, and we sold them into strength before energy stocks took a hit late in 2008. Both companies benefited from a burgeoning demand for steel as emerging markets built infrastructure. Oil drilling service provider W-H Energy Services was another solid performer for the fund. The company was acquired by a competitor and is no longer in the portfolio. Energy exploration company Comstock Resources, Inc. proved more resilient to declining prices because of a positive production profile and strong balance sheet. Although Comstock shares declined in value, they lost far less than the energy sector overall.
Cautiously anticipating an economic recovery
Although many small growth company shares lost significant value as stocks declined broadly over the past year, companies in industries that are less sensitive to the economic environment and those with more defensive business models were hurt less in the downdraft. Against this backdrop and in light of continued economic weakness, we are striving to maintain a cautious, defensive approach while at the same time positioning the fund to participate in a potential upturn in the economy. As a result, we are slowly establishing positions in selected companies with more economic sensitivity on the expectation that such companies have the potential to be the first movers when the economy reaches a recovery phase.
Portfolio holdings and characteristics are subject to change periodically and may not be representative of current holdings and characteristics. The outlook for the fund may differ from that presented for other Columbia Funds.
Equity investments are affected by stock market fluctuations that occur in response to economic and business developments.
Investments in small-cap stocks may be subject to greater volatility and price fluctuations because they may be thinly traded and less liquid than investments in larger companies.
Top 5 sectors
as of 02/28/09 (%)
| Health Care | | | 25.5 | | |
| Information Technology | | | 23.5 | | |
| Industrials | | | 17.0 | | |
| Consumer Discretionary | | | 13.0 | | |
| Energy | | | 5.9 | | |
Top 10 holdings
as of 02/28/09 (%)
| Waste Connections | | | 1.7 | | |
| Capella Education | | | 1.5 | | |
| Wright Medical Group | | | 1.5 | | |
| Meridian Bioscience | | | 1.5 | | |
| Onyx Pharmaceuticals | | | 1.4 | | |
| Equinix | | | 1.4 | | |
| CACI International | | | 1.3 | | |
| Polycom | | | 1.2 | | |
| Syniverse Holdings | | | 1.2 | | |
| Alexion Pharmaceuticals | | | 1.2 | | |
Holdings discussed in this report
as of 02/28/09 (%)
| Waddell & Reed Financial | | | 0.5 | | |
| Solutia | | | 0.3 | | |
| Koppers Holdings | | | 0.5 | | |
| Capella Education | | | 1.5 | | |
| Netflix | | | 0.9 | | |
| Marvel Entertainment | | | 0.7 | | |
| Sohu.com | | | 0.9 | | |
| Syniverse Holdings | | | 1.2 | | |
| Comstock Resources | | | 1.1 | | |
The fund is actively managed and the composition of its portfolio will change over time. Information provided is calculated as a percentage of net assets.
47
Investment Portfolio – Columbia Convertible Securities Fund
February 28, 2009
| Convertible Bonds – 79.4% | |
| | | Par ($) | | Value ($) | |
| Consumer Discretionary – 5.8% | |
| Hotels, Restaurants & Leisure – 1.3% | |
| Carnival Corp. | |
| (a) 0.500% 04/29/33 | |
| (0.000% 10/29/09) | | | 2,350,000 | | | | 1,489,312 | | |
| International Game Technology | |
| 2.600% 12/15/36 (b) | | | 1,648,000 | | | | 1,594,440 | | |
| 2.600% 12/15/36 | | | 2,002,000 | | | | 1,936,935 | | |
| Hotels, Restaurants & Leisure Total | | | 5,020,687 | | |
| Leisure Equipment & Products – 0.5% | |
| Eastman Kodak Co. | |
| 3.375% 10/15/33 | | | 2,870,000 | | | | 2,048,463 | | |
| Leisure Equipment & Products Total | | | 2,048,463 | | |
| Media – 3.5% | |
| Interpublic Group of Companies, Inc. | |
| 4.250% 03/15/23 | | | 5,940,000 | | | | 4,061,475 | | |
| Liberty Media Corp. | |
| 3.125% 03/30/23 | | | 9,607,000 | | | | 6,784,944 | | |
| Omnicom Group, Inc. | |
| (c) 07/31/32 | | | 2,900,000 | | | | 2,791,250 | | |
| Media Total | | | 13,637,669 | | |
| Specialty Retail – 0.5% | |
| Best Buy Co., Inc. | |
| 2.250% 01/15/22 | | | 2,425,000 | | | | 2,170,375 | | |
| Specialty Retail Total | | | 2,170,375 | | |
| Consumer Discretionary Total | | | 22,877,194 | | |
| Consumer Staples – 2.1% | |
| Beverages – 1.5% | |
| Molson Coors Brewing Co. | |
| 2.500% 07/30/13 | | | 5,690,000 | | | | 5,818,025 | | |
| Beverages Total | | | 5,818,025 | | |
| Tobacco – 0.6% | |
| Vector Group Ltd. | |
| (c) 06/15/26 (d) | | | 2,900,000 | | | | 2,639,000 | | |
| Tobacco Total | | | 2,639,000 | | |
| Consumer Staples Total | | | 8,457,025 | | |
| Energy – 8.6% | |
| Energy Equipment & Services – 6.6% | |
| Cameron International Corp. | |
| 2.500% 06/15/26 | | | 2,840,000 | | | | 2,811,600 | | |
| | | Par ($) | | Value ($) | |
| Hornbeck Offshore Services, Inc. | |
| (a) 1.625% 11/15/26 (b) | |
| (1.375% 11/15/13) | | | 5,000,000 | | | | 3,025,000 | | |
| (a) 1.625% 11/15/26 | |
| (1.375% 11/15/13) | | | 1,180,000 | | | | 713,900 | | |
| Nabors Industries, Inc. | |
| 0.940% 05/15/11 | | | 4,870,000 | | | | 4,194,287 | | |
| Schlumberger Ltd. | |
| 2.125% 06/01/23 | | | 960,000 | | | | 1,186,800 | | |
| Transocean, Inc. | |
| 1.500% 12/15/37 | | | 6,615,000 | | | | 5,300,269 | | |
| 1.625% 12/15/37 | | | 9,720,000 | | | | 8,662,950 | | |
| Energy Equipment & Services Total | | | 25,894,806 | | |
| Oil, Gas & Consumable Fuels – 2.0% | |
| Chesapeake Energy Corp. | |
| 2.750% 11/15/35 | | | 5,563,000 | | | | 3,852,377 | | |
| Massey Energy Co. | |
| 3.250% 08/01/15 | | | 2,900,000 | | | | 1,841,500 | | |
| Peabody Energy Corp. | |
| 4.750% 12/15/41 | | | 3,395,000 | | | | 2,300,113 | | |
| Oil, Gas & Consumable Fuels Total | | | 7,993,990 | | |
| Energy Total | | | 33,888,796 | | |
| Financials – 7.3% | |
| Capital Markets – 0.5% | |
| BlackRock, Inc. (f) | |
| 2.625% 02/15/35 | | | 1,800,000 | | | | 2,045,250 | | |
| Capital Markets Total | | | 2,045,250 | | |
| Commercial Banks – 0.9% | |
| National City Corp. | |
| 4.000% 02/01/11 | | | 3,870,000 | | | | 3,478,163 | | |
| Commercial Banks Total | | | 3,478,163 | | |
| Diversified Financial Services – 0.2% | |
| NASDAQ OMX Group, Inc. | |
| 2.500% 08/15/13 (b) | | | 1,000,000 | | | | 795,000 | | |
| Diversified Financial Services Total | | | 795,000 | | |
| Insurance – 1.3% | |
| Prudential Financial, Inc. | |
| 0.366% 12/15/37 (d) | | | 3,855,000 | | | | 3,710,437 | | |
| USF&G Corp. | |
| (c) 03/03/09 | | | 1,600,000 | | | | 1,600,000 | | |
| Insurance Total | | | 5,310,437 | | |
| Real Estate Investment Trusts (REITs) – 4.4% | |
| Alexandria Real Estate Equities, Inc. | |
| 3.700% 01/15/27 (b) | | | 5,000,000 | | | | 3,368,750 | | |
See Accompanying Notes to Financial Statements.
48
Columbia Convertible Securities Fund
February 28, 2009
| Convertible Bonds (continued) | |
| | | Par ($) | | Value ($) | |
| Boston Properties LP | |
| 2.875% 02/15/37 | | | 970,000 | | | | 742,050 | | |
| 3.750% 05/15/36 | | | 3,893,000 | | | | 2,890,552 | | |
| Prologis | |
| 2.250% 04/01/37 (b) | | | 4,830,000 | | | | 2,553,862 | | |
| 2.250% 04/01/37 | | | 1,170,000 | | | | 618,638 | | |
| Rayonier TRS Holdings, Inc. | |
| 3.750% 10/15/12 (b) | | | 2,000,000 | | | | 1,745,000 | | |
| Vornado Realty Trust | |
| 3.625% 11/15/26 | | | 6,740,000 | | | | 5,366,725 | | |
| Real Estate Investment Trusts (REITs) Total | | | 17,285,577 | | |
| Financials Total | | | 28,914,427 | | |
| Health Care – 25.5% | |
| Biotechnology – 7.3% | |
| Alexion Pharmaceuticals, Inc. | |
| 1.375% 02/01/12 | | | 950,000 | | | | 2,074,563 | | |
| Amgen, Inc. | |
| 0.125% 02/01/11 (b) | | | 2,982,000 | | | | 2,739,712 | | |
| 0.125% 02/01/11 | | | 500,000 | | | | 459,375 | | |
| 0.375% 02/01/13 (b) | | | 3,030,000 | | | | 2,681,550 | | |
| 0.375% 02/01/13 | | | 3,774,000 | | | | 3,339,990 | | |
| Gilead Sciences, Inc. | |
| 0.500% 05/01/11 | | | 2,860,000 | | | | 3,492,775 | | |
| Invitrogen Corp. | |
| 2.000% 08/01/23 | | | 3,860,000 | | | | 4,028,875 | | |
| 3.250% 06/15/25 | | | 4,886,000 | | | | 4,556,195 | | |
| Isis Pharmaceuticals, Inc. | |
| 2.625% 02/15/27 (b) | | | 1,000,000 | | | | 1,007,500 | | |
| 2.625% 02/15/27 | | | 935,000 | | | | 942,013 | | |
| PDL BioPharma, Inc. | |
| 2.000% 02/15/12 | | | 1,927,000 | | | | 1,452,476 | | |
| Vertex Pharmaceuticals, Inc. | |
| 4.750% 02/15/13 | | | 1,450,000 | | | | 1,990,125 | | |
| Biotechnology Total | | | 28,765,149 | | |
| Health Care Equipment & Supplies – 8.5% | |
| Beckman Coulter, Inc. | |
| 2.500% 12/15/36 (b) | | | 220,000 | | | | 199,100 | | |
| 2.500% 12/15/36 | | | 3,835,000 | | | | 3,470,675 | | |
| China Medical Technologies, Inc. | |
| 4.000% 08/15/13 | | | 5,700,000 | | | | 2,807,250 | | |
| Fisher Scientific International, Inc. | |
| 3.250% 03/01/24 | | | 8,127,000 | | | | 9,478,114 | | |
| Hologic, Inc. | |
| (a) 2.000% 12/15/37 | |
| (0.000% 12/15/13) | | | 7,750,000 | | | | 5,037,500 | | |
| Integra LifeSciences Holdings Corp. | |
| 2.750% 06/01/10 (b) | | | 3,000,000 | | | | 2,666,250 | | |
| | | Par ($) | | Value ($) | |
| Medtronic, Inc. | |
| 1.500% 04/15/11 (b) | | | 5,975,000 | | | | 5,511,937 | | |
| 1.500% 04/15/11 | | | 4,760,000 | | | | 4,391,100 | | |
| Health Care Equipment & Supplies Total | | | 33,561,926 | | |
| Health Care Providers & Services – 1.9% | |
| Chemed Corp. | |
| 1.875% 05/15/14 (b) | | | 2,250,000 | | | | 1,659,375 | | |
| Emdeon Corp. | |
| 3.125% 09/01/25 | | | 1,925,000 | | | | 1,643,469 | | |
| Henry Schein, Inc. | |
| 3.000% 08/15/34 (b) | | | 3,980,000 | | | | 4,049,650 | | |
| Health Care Providers & Services Total | | | 7,352,494 | | |
| Health Care Technology – 1.1% | |
| Inverness Medical Innovations, Inc. | |
| 3.000% 05/15/16 (b) | | | 6,000,000 | | | | 4,545,000 | | |
| Health Care Technology Total | | | 4,545,000 | | |
| Life Sciences Tool & Services – 0.8% | |
| Millipore Corp. | |
| 3.750% 06/01/26 | | | 3,515,000 | | | | 3,233,800 | | |
| Life Sciences Tool & Services Total | | | 3,233,800 | | |
| Pharmaceuticals – 5.9% | |
| Allergan, Inc. | |
| 1.500% 04/01/26 (b) | | | 4,180,000 | | | | 3,991,900 | | |
| 1.500% 04/01/26 | | | 2,035,000 | | | | 1,943,425 | | |
| Mylan, Inc. | |
| 1.250% 03/15/12 | | | 3,050,000 | | | | 2,565,812 | | |
| 3.750% 09/15/15 (b) | | | 7,000,000 | | | | 7,385,000 | | |
| Sepracor, Inc. | |
| (c) 10/15/24 | | | 4,730,000 | | | | 4,552,625 | | |
| Teva Pharmaceutical Finance Co., BV | |
| 1.750% 02/01/26 | | | 1,935,000 | | | | 2,051,100 | | |
| Wyeth | |
| 0.965% 01/15/24 (d) | | | 905,000 | | | | 894,140 | | |
| Pharmaceuticals Total | | | 23,384,002 | | |
| Health Care Total | | | 100,842,371 | | |
| Industrials – 7.9% | |
| Aerospace & Defense – 2.3% | |
| L-3 Communications Corp. | |
| 3.000% 08/01/35 | | | 9,566,000 | | | | 9,302,935 | | |
| Aerospace & Defense Total | | | 9,302,935 | | |
| Airlines – 0.8% | |
| Continental Airlines, Inc. | |
| 5.000% 06/15/23 | | | 3,875,000 | | | | 3,250,156 | | |
| Airlines Total | | | 3,250,156 | | |
See Accompanying Notes to Financial Statements.
49
Columbia Convertible Securities Fund
February 28, 2009
| Convertible Bonds (continued) | |
| | | Par ($) | | Value ($) | |
| Commercial Services & Supplies – 2.4% | |
| Covanta Holding Corp. | |
| 1.000% 02/01/27 | | | 6,900,000 | | | | 5,614,875 | | |
| Waste Connections, Inc. | |
| 3.750% 04/01/26 | | | 3,823,000 | | | | 3,727,425 | | |
| Commercial Services & Supplies Total | | | 9,342,300 | | |
| Electrical Equipment – 1.7% | |
| General Cable Corp. | |
| 1.000% 10/15/12 (b) | | | 5,500,000 | | | | 3,719,375 | | |
| 1.000% 10/15/12 | | | 1,000,000 | | | | 676,250 | | |
| Suntech Power Holdings Co. Ltd. | |
| 0.250% 02/15/12 | | | 2,820,000 | | | | 2,294,775 | | |
| Electrical Equipment Total | | | 6,690,400 | | |
| Machinery – 0.7% | |
| Barnes Group, Inc. | |
| 3.750% 08/01/25 | | | 1,167,000 | | | | 962,775 | | |
| Trinity Industries, Inc. | |
| 3.875% 06/01/36 | | | 3,795,000 | | | | 1,641,338 | | |
| Machinery Total | | | 2,604,113 | | |
| Total Industrials | | | 31,189,904 | | |
| Information Technology – 19.7% | |
| Communications Equipment – 2.3% | |
| Arris Group, Inc. | |
| 2.000% 11/15/26 | | | 2,435,000 | | | | 1,656,043 | | |
| CommScope, Inc. | |
| 1.000% 03/15/24 | | | 1,000,000 | | | | 990,000 | | |
| Comverse Technology, Inc. | |
| (c) 05/15/23 | | | 2,430,000 | | | | 2,393,550 | | |
| Lucent Technologies, Inc. | |
| 2.875% 06/15/23 | | | 4,640,000 | | | | 3,932,400 | | |
| Communications Equipment Total | | | 8,971,993 | | |
| Computers & Peripherals – 3.3% | |
| EMC Corp. | |
| 1.750% 12/01/11 | | | 6,370,000 | | | | 6,139,088 | | |
| Maxtor Corp. | |
| 6.800% 04/30/10 | | | 5,947,000 | | | | 5,553,011 | | |
| NetApp, Inc. | |
| 1.750% 06/01/13 (b) | | | 2,000,000 | | | | 1,562,500 | | |
| Computers & Peripherals Total | | | 13,254,599 | | |
| Electronic Equipment & Instruments – 1.8% | |
| Avnet, Inc. | |
| 2.000% 03/15/34 | | | 3,768,000 | | | | 3,749,160 | | |
| L-1 Identity Solutions, Inc. | |
| 3.750% 05/15/27 (b) | | | 5,000,000 | | | | 3,212,500 | | |
| Electronic Equipment & Instruments Total | | | 6,961,660 | | |
| | | Par ($) | | Value ($) | |
| Internet Software & Services – 1.3% | |
| Akamai Technologies, Inc. | |
| 1.000% 12/15/33 | | | 925,000 | | | | 1,177,063 | | |
| Digital River, Inc. | |
| 1.250% 01/01/24 | | | 1,900,000 | | | | 1,902,375 | | |
| Equinix, Inc. | |
| 2.500% 04/15/12 | | | 2,550,000 | | | | 1,992,187 | | |
| Internet Software & Services Total | | | 5,071,625 | | |
| IT Services – 2.2% | |
| CSG Systems International, Inc. | |
| 2.500% 06/15/24 (b) | | | 4,000,000 | | | | 3,485,000 | | |
| DST Systems, Inc. | |
| 4.125% 08/15/23 (b) | | | 3,930,000 | | | | 3,684,375 | | |
| VeriFone Holdings, Inc. | |
| 1.375% 06/15/12 (b) | | | 3,000,000 | | | | 1,410,000 | | |
| IT Services Total | | | 8,579,375 | | |
| Semiconductors & Semiconductor Equipment – 4.3% | |
| Intel Corp. | |
| 2.950% 12/15/35 (b) | | | 4,125,000 | | | | 3,181,406 | | |
| 2.950% 12/15/35 | | | 4,743,000 | | | | 3,658,039 | | |
| Linear Technology Corp. | |
| 3.125% 05/01/27 (b) | | | 565,000 | | | | 530,394 | | |
| 3.125% 05/01/27 | | | 2,745,000 | | | | 2,576,869 | | |
| ON Semiconductor Corp. | |
| 2.625% 12/15/26 | | | 3,935,000 | | | | 2,483,969 | | |
| Xilinx, Inc. | |
| 3.125% 03/15/37 | | | 6,810,000 | | | | 4,758,487 | | |
Semiconductors & Semiconductor
Equipment Total | | | 17,189,164 | | |
| Software – 4.5% | |
| Amdocs Ltd. | |
| 0.500% 03/15/24 | | | 3,890,000 | | | | 3,860,825 | | |
| Lawson Software, Inc. | |
| 2.500% 04/15/12 (b) | | | 3,000,000 | | | | 2,340,000 | | |
Shanda Interactive
Entertainment Ltd. | |
| 2.000% 09/15/11 (b) | | | 1,500,000 | | | | 1,668,750 | | |
| Sybase, Inc. | |
| 1.750% 02/22/25 (b) | | | 5,240,000 | | | | 6,130,800 | | |
| Symantec Corp. | |
| 0.750% 06/15/11 (b) | | | 4,000,000 | | | | 3,745,000 | | |
| Software Total | | | 17,745,375 | | |
| Information Technology Total | | | 77,773,791 | | |
| Telecommunication Services – 1.5% | |
| Wireless Telecommunication Services – 1.5% | |
| Nextel Communications, Inc. | |
| 5.250% 01/15/10 | | | 4,540,000 | | | | 4,267,600 | | |
See Accompanying Notes to Financial Statements.
50
Columbia Convertible Securities Fund
February 28, 2009
| Convertible Bonds (continued) | |
| | | Par ($) | | Value ($) | |
| NII Holdings, Inc. | |
| 2.750% 08/15/25 | | | 1,875,000 | | | | 1,645,313 | | |
| Wireless Telecommunication Services Total | | | 5,912,913 | | |
| Telecommunication Services Total | | | 5,912,913 | | |
| Utilities – 1.0% | |
| Multi-Utilities – 1.0% | |
| CMS Energy Corp. | |
| 2.875% 12/01/24 | | | 3,940,000 | | | | 3,861,200 | | |
| Multi-Utilities Total | | | 3,861,200 | | |
| Utilities Total | | | 3,861,200 | | |
Total Convertible Bonds
(cost of $372,670,606) | | | 313,717,621 | | |
| Convertible Preferred Stocks – 9.3% | |
| | | Shares | | | |
| Consumer Discretionary – 0.1% | |
| Household Durables – 0.1% | |
| Newell Financial Trust I, 5.250% | | | 14,000 | | | | 264,600 | | |
| Household Durables Total | | | 264,600 | | |
| Consumer Discretionary Total | | | 264,600 | | |
| Consumer Non-Cyclical – 0.4% | |
| Food Products – 0.4% | |
| Bunge Ltd., 4.875% | | | 22,000 | | | | 1,452,000 | | |
| Food Products Total | | | 1,452,000 | | |
| Consumer Non-Cyclical Total | | | 1,452,000 | | |
| Energy – 0.7% | |
| Oil, Gas & Consumable Fuels – 0.7% | |
| El Paso Corp., 4.990% (b) | | | 4,660 | | | | 2,865,900 | | |
| Oil, Gas & Consumable Fuels Total | | | 2,865,900 | | |
| Energy Total | | | 2,865,900 | | |
| Financials – 4.5% | |
| Banks – 0.7% | |
| Credit Suisse/New York, 8.000% (e) | | | 326,037 | | | | 2,585,473 | | |
| Banks Total | | | 2,585,473 | | |
| | | Shares | | Value ($) | |
| Commercial Banks – 1.5% | |
| Wells Fargo & Co., 7.500% | | | 12,802 | | | | 5,888,920 | | |
| Commercial Banks Total | | | 5,888,920 | | |
| Insurance – 0.7% | |
| Alleghany Corp., 5.750% | | | 12,160 | | | | 2,915,893 | | |
| Insurance Total | | | 2,915,893 | | |
| Real Estate Investment Trusts (REITs) – 1.6% | |
Alexandria Real Estate Equities,
Inc., Series D, 7.000% | | | 136,000 | | | | 1,496,000 | | |
| Digital Realty Trust, LP, 5.500% | | | 214,500 | | | | 3,981,656 | | |
Entertainment Properties
Trust, 5.750% | | | 147,000 | | | | 1,043,700 | | |
| Real Estate Investment Trusts (REITs) Total | | | 6,521,356 | | |
| Financials Total | | | 17,911,642 | | |
| Health Care – 0.5% | |
| Pharmaceuticals – 0.5% | |
| Schering-Plough Corp., 6.000% | | | 12,600 | | | | 2,142,000 | | |
| Pharmaceuticals Total | | | 2,142,000 | | |
| Health Care Total | | | 2,142,000 | | |
| Industrials – 0.6% | |
| Road & Rail – 0.6% | |
| Kansas City Southern, 5.125% | | | 3,191 | | | | 2,181,846 | | |
| Road & Rail Total | | | 2,181,846 | | |
| Total Industrials | | | 2,181,846 | | |
| Materials – 1.0% | |
| Chemicals – 0.1% | |
| Celanese Corp., 4.250% | | | 36,500 | | | | 477,420 | | |
| Chemicals Total | | | 477,420 | | |
| Metals & Mining – 0.9% | |
Freeport-McMoRan Copper &
Gold, Inc., 5.500% | | | 2,910 | | | | 2,240,700 | | |
| Vale Capital Ltd., 5.500% | | | 49,600 | | | | 1,430,960 | | |
| Metals & Mining Total | | | 3,671,660 | | |
| Materials Total | | | 4,149,080 | | |
See Accompanying Notes to Financial Statements.
51
Columbia Convertible Securities Fund
February 28, 2009
| Convertible Preferred Stocks (continued) | |
| | | Shares | | Value ($) | |
| Telecommunication Services – 1.5% | |
| Wireless Telecommunication Services – 1.5% | |
Crown Castle International
Corp., 6.250% | | | 137,185 | | | | 5,950,400 | | |
| Wireless Telecommunication Services Total | | | 5,950,400 | | |
| Telecommunication Services Total | | | 5,950,400 | | |
Total Convertible Preferred Stocks
(cost of $59,020,072) | | | 36,917,468 | | |
| Common Stocks – 1.3% | |
| Financials – 0.0% | |
| Insurance – 0.0% | |
| MetLife, Inc. | | | 3 | | | | 48 | | |
| Insurance Total | | | 48 | | |
| Financials Total | | | 48 | | |
| Health Care – 0.6% | |
| Pharmaceuticals – 0.6% | |
Teva Pharmaceutical Industries
Ltd., ADR | | | 55,000 | | | | 2,451,900 | | |
| Pharmaceuticals Total | | | 2,451,900 | | |
| Health Care Total | | | 2,451,900 | | |
| Utilities – 0.7% | |
| Electric Utilities – 0.7% | |
| FPL Group, Inc. | | | 62,000 | | | | 2,810,460 | | |
| Electric Utilities Total | | | 2,810,460 | | |
| Utilities Total | | | 2,810,460 | | |
Total Common Stocks
(cost of $5,121,092) | | | 5,262,408 | | |
| Investment Companies – 1.1% | |
| Financials – 1.1% | |
| Capital Markets – 0.3% | |
iShares Barclays Aggregate
Bond Fund | | | 10,000 | | | | 1,006,900 | | |
| Capital Markets Total | | | 1,006,900 | | |
| | | Shares | | Value ($) | |
| Diversified Financial Services – 0.8% | |
iShares iBoxx Investment Grade
Corporate Bond Fund | | | 35,000 | | | | 3,295,600 | | |
| Diversified Financial Services Total | | | 3,295,600 | | |
| Financials Total | | | 4,302,500 | | |
Total Investment Companies
(cost of $4,375,868) | | | 4,302,500 | | |
| Short-Term Obligation – 8.9% | |
| | | Par ($) | | | |
Repurchase agreement with
Fixed Income Clearing Corp.,
dated 02/27/09, due 03/02/09
at 0.210%, collateralized by a
U.S. Government Agency
Obligation maturing 01/08/10,
market value $35,674,800
(repurchase proceeds
$34,975,612) | | | 34,975,000 | | | | 34,975,000 | | |
Total Short-Term Obligation
(cost of $34,975,000) | | | 34,975,000 | | |
Total Investments – 100.0%
(cost of $476,162,638) (g) | | | 395,174,997 | | |
| Other Assets & Liabilities, Net – 0.0% | | | 11,193 | | |
| Net Assets – 100.0% | | | 395,186,190 | | |
Notes to Investment Portfolio:
(a) Step bond. Shown parenthetically is the next interest rate to be paid and the date the Fund will begin accruing at this rate.
(b) Security exempt from registration pursuant to Rule 144A under the Securities Act of 1933. These securities may be resold in transactions exempt from registration, normally to qualified institutional buyers. At February 28, 2009, these securities, which are not illiquid, amounted to $87,055,026, which represents 22.0% of net assets.
(c) Zero coupon bond.
(d) The interest rate shown on floating rate or variable rate securities reflects the rate at February 28, 2009.
(e) Non-income producing security.
(f) Investments in affiliates during the year ended February 28, 2009:
| Security name: BlackRock, Inc. | |
| Shares as of 02/29/08: | | | – | | |
| Shares purchased: | | | 1,800,000 | | |
| Shares sold: | | | – | | |
| Shares as of 02/28/09: | | | 1,800,000 | | |
| Net realized gain (loss): | | $ | – | | |
| Interest income earned: | | $ | 40,556 | | |
| Value at end of period: | | $ | 2,045,250 | | |
(g) Cost for federal income tax purposes is $476,303,991.
See Accompanying Notes to Financial Statements.
52
Columbia Convertible Securities Fund
February 28, 2009
For the year ended February 28, 2009, transactions in written option contracts were as follows:
| | | Number of
contracts | | Premium
received | |
| Options outstanding at February 29, 2008 | | | – | | | $ | – | | |
| Options written | | | 2,410 | | | | 1,978,136 | | |
Options terminated in closing
purchase transactions | | | (2,360 | ) | | | (1,831,022 | ) | |
| Options exercised | | | (50 | ) | | | (147,114 | ) | |
| Options expired | | | – | | | | – | | |
| Options outstanding at February 28, 2009 | | | – | | | $ | – | | |
At February 28, 2009, the asset allocation of the Fund was as follows:
| Asset Allocation (Unaudited) | | % of
Net Assets | |
| Convertible Bonds | | | 79.4 | | |
| Convertible Preferred Stocks | | | 9.3 | | |
| Common Stocks | | | 1.3 | | |
| | | | 90.0 | | |
| Investment Companies | | | 1.1 | | |
| Short-Term Obligation | | | 8.9 | | |
| Other Assets & Liabilities, Net | | | (0.0 | )* | |
| | | | 100.0 | | |
* Rounds to less than 0.1%.
| Acronym | | Name | |
| ADR | | American Depositary Receipt | |
|
See Accompanying Notes to Financial Statements.
53
Investment Portfolio – Columbia Large Cap Value Fund
February 28, 2009
| Common Stocks – 98.0% | |
| | | Shares | | Value ($) | |
| Consumer Discretionary – 6.9% | |
| Hotels, Restaurants & Leisure – 2.5% | |
| Carnival Corp. | | | 583,800 | | | | 11,419,128 | | |
| McDonald's Corp. | | | 608,219 | | | | 31,779,443 | | |
| Hotels, Restaurants & Leisure Total | | | 43,198,571 | | |
| Multiline Retail – 1.4% | |
| Kohl's Corp. (a) | | | 708,300 | | | | 24,889,662 | | |
| Multiline Retail Total | | | 24,889,662 | | |
| Specialty Retail – 1.9% | |
| Bed Bath & Beyond, Inc. (a) | | | 306,900 | | | | 6,536,970 | | |
| Lowe's Companies, Inc. | | | 1,649,600 | | | | 26,129,664 | | |
| Specialty Retail Total | | | 32,666,634 | | |
| Textiles, Apparel & Luxury Goods – 1.1% | |
| VF Corp. | | | 383,100 | | | | 19,882,890 | | |
| Textiles, Apparel & Luxury Goods Total | | | 19,882,890 | | |
| Consumer Discretionary Total | | | 120,637,757 | | |
| Consumer Staples – 10.2% | |
| Beverages – 1.4% | |
| Diageo PLC, ADR | | | 504,498 | | | | 23,454,112 | | |
| Beverages Total | | | 23,454,112 | | |
| Food & Staples Retailing – 2.6% | |
| Sysco Corp. | | | 810,500 | | | | 17,425,750 | | |
| Wal-Mart Stores, Inc. | | | 563,900 | | | | 27,766,436 | | |
| Food & Staples Retailing Total | | | 45,192,186 | | |
| Food Products – 2.1% | |
| ConAgra Foods, Inc. | | | 1,173,500 | | | | 17,696,380 | | |
| General Mills, Inc. | | | 216,700 | | | | 11,372,416 | | |
| J.M. Smucker Co. | | | 219,200 | | | | 8,136,704 | | |
| Food Products Total | | | 37,205,500 | | |
| Household Products – 2.0% | |
| Procter & Gamble Co. | | | 711,000 | | | | 34,248,870 | | |
| Household Products Total | | | 34,248,870 | | |
| Personal Products – 1.1% | |
| Avon Products, Inc. | | | 1,080,697 | | | | 19,009,461 | | |
| Personal Products Total | | | 19,009,461 | | |
| Tobacco – 1.0% | |
| Philip Morris International, Inc. | | | 532,677 | | | | 17,828,699 | | |
| Tobacco Total | | | 17,828,699 | | |
| Consumer Staples Total | | | 176,938,828 | | |
| | | Shares | | Value ($) | |
| Energy – 18.9% | |
| Energy Equipment & Services – 2.8% | |
| Halliburton Co. | | | 1,267,098 | | | | 20,666,369 | | |
| Smith International, Inc. | | | 241,200 | | | | 5,180,976 | | |
| Transocean Ltd. (a) | | | 377,700 | | | | 22,575,129 | | |
| Energy Equipment & Services Total | | | 48,422,474 | | |
| Oil, Gas & Consumable Fuels – 16.1% | |
| Chevron Corp. | | | 563,600 | | | | 34,216,156 | | |
| ConocoPhillips | | | 687,080 | | | | 25,662,438 | | |
| El Paso Corp. | | | 1,037,000 | | | | 6,999,750 | | |
| EOG Resources, Inc. | | | 301,300 | | | | 15,077,052 | | |
| Exxon Mobil Corp. | | | 1,330,528 | | | | 90,342,851 | | |
| Hess Corp. | | | 572,900 | | | | 31,331,901 | | |
| Marathon Oil Corp. | | | 647,300 | | | | 15,062,671 | | |
| Newfield Exploration Co. (a) | | | 251,400 | | | | 4,859,562 | | |
| Occidental Petroleum Corp. | | | 577,900 | | | | 29,975,673 | | |
| Petroleo Brasileiro SA, ADR | | | 543,300 | | | | 15,065,709 | | |
| Williams Companies, Inc. | | | 984,300 | | | | 11,122,590 | | |
| Oil, Gas & Consumable Fuels Total | | | 279,716,353 | | |
| Energy Total | | | 328,138,827 | | |
| Financials – 18.9% | |
| Capital Markets – 3.6% | |
| Goldman Sachs Group, Inc. | | | 392,700 | | | | 35,767,116 | | |
| Morgan Stanley | | | 498,500 | | | | 9,740,690 | | |
| State Street Corp. | | | 695,800 | | | | 17,582,866 | | |
| Capital Markets Total | | | 63,090,672 | | |
| Commercial Banks – 4.5% | |
PNC Financial Services
Group, Inc. | | | 596,279 | | | | 16,302,268 | | |
| U.S. Bancorp | | | 2,648,982 | | | | 37,906,933 | | |
| Wells Fargo & Co. | | | 2,002,114 | | | | 24,225,579 | | |
| Commercial Banks Total | | | 78,434,780 | | |
| Diversified Financial Services – 2.9% | |
| JPMorgan Chase & Co. | | | 2,157,910 | | | | 49,308,244 | | |
| Diversified Financial Services Total | | | 49,308,244 | | |
| Insurance – 5.8% | |
| ACE Ltd. | | | 651,476 | | | | 23,785,389 | | |
| Aon Corp. | | | 947,100 | | | | 36,217,104 | | |
| Axis Capital Holdings Ltd. | | | 397,800 | | | | 8,902,764 | | |
Hartford Financial Services
Group, Inc. | | | 521,717 | | | | 3,182,473 | | |
See Accompanying Notes to Financial Statements.
54
Columbia Large Cap Value Fund
February 28, 2009
| Common Stocks (continued) | |
| | | Shares | | Value ($) | |
Marsh & McLennan
Companies, Inc. | | | 1,151,500 | | | | 20,646,395 | | |
| Prudential Financial, Inc. | | | 506,500 | | | | 8,311,665 | | |
| Insurance Total | | | 101,045,790 | | |
| Real Estate Investment Trusts (REITs) – 2.1% | |
| Plum Creek Timber Co., Inc. | | | 701,000 | | | | 18,387,230 | | |
| Rayonier, Inc. | | | 672,400 | | | | 17,885,840 | | |
| Real Estate Investment Trusts (REITs) Total | | | 36,273,070 | | |
| Financials Total | | | 328,152,556 | | |
| Health Care – 11.9% | |
| Biotechnology – 2.5% | |
| Amgen, Inc. (a) | | | 878,000 | | | | 42,960,540 | | |
| Biotechnology Total | | | 42,960,540 | | |
| Health Care Providers & Services – 2.8% | |
| McKesson Corp. | | | 493,700 | | | | 20,251,574 | | |
| Medco Health Solutions, Inc. (a) | | | 715,400 | | | | 29,030,932 | | |
| Health Care Providers & Services Total | | | 49,282,506 | | |
| Life Sciences Tools & Services – 1.8% | |
| Life Technologies Corp. (a) | | | 314,300 | | | | 9,161,845 | | |
| Thermo Fisher Scientific, Inc. (a) | | | 631,900 | | | | 22,912,694 | | |
| Life Sciences Tools & Services Total | | | 32,074,539 | | |
| Pharmaceuticals – 4.8% | |
| Abbott Laboratories | | | 455,400 | | | | 21,558,636 | | |
| Johnson & Johnson | | | 787,600 | | | | 39,380,000 | | |
| Schering-Plough Corp. | | | 1,256,900 | | | | 21,857,491 | | |
| Pharmaceuticals Total | | | 82,796,127 | | |
| Health Care Total | | | 207,113,712 | | |
| Industrials – 6.3% | |
| Aerospace & Defense – 4.4% | |
| Goodrich Corp. | | | 408,200 | | | | 13,527,748 | | |
L-3 Communications Holdings,
Inc. | | | 375,100 | | | | 25,375,515 | | |
| Northrop Grumman Corp. | | | 351,000 | | | | 13,113,360 | | |
| United Technologies Corp. | | | 585,380 | | | | 23,901,065 | | |
| Aerospace & Defense Total | | | 75,917,688 | | |
| Construction & Engineering – 1.2% | |
| KBR, Inc. | | | 1,733,800 | | | | 21,845,880 | | |
| Construction & Engineering Total | | | 21,845,880 | | |
| Machinery – 0.7% | |
| Eaton Corp. | | | 325,800 | | | | 11,777,670 | | |
| Machinery Total | | | 11,777,670 | | |
| Industrials Total | | | 109,541,238 | | |
| | | Shares | | Value ($) | |
| Information Technology – 7.0% | |
| Computers & Peripherals – 3.6% | |
| EMC Corp. (a) | | | 2,450,700 | | | | 25,732,350 | | |
| Hewlett-Packard Co. | | | 604,580 | | | | 17,550,957 | | |
International Business
Machines Corp. | | | 213,900 | | | | 19,685,217 | | |
| Computers & Peripherals Total | | | 62,968,524 | | |
| Semiconductors & Semiconductor Equipment – 1.8% | |
| Intel Corp. | | | 769,800 | | | | 9,807,252 | | |
| Intersil Corp., Class A | | | 905,200 | | | | 9,151,572 | | |
Marvell Technology
Group Ltd. (a) | | | 524,449 | | | | 3,938,612 | | |
| Texas Instruments, Inc. | | | 586,800 | | | | 8,420,580 | | |
Semiconductors & Semiconductor
Equipment Total | | | 31,318,016 | | |
| Software – 1.6% | |
| BMC Software, Inc. (a) | | | 912,500 | | | | 27,037,375 | | |
| Software Total | | | 27,037,375 | | |
| Information Technology Total | | | 121,323,915 | | |
| Materials – 5.4% | |
| Chemicals – 2.9% | |
| E.I. Du Pont de Nemours & Co. | | | 709,900 | | | | 13,317,724 | | |
| Monsanto Co. | | | 254,000 | | | | 19,372,580 | | |
Potash Corp. of Saskatchewan,
Inc. | | | 210,700 | | | | 17,692,479 | | |
| Chemicals Total | | | 50,382,783 | | |
| Metals & Mining – 2.2% | |
| Allegheny Technologies, Inc. | | | 111,300 | | | | 2,189,271 | | |
Freeport-McMoRan Copper &
Gold, Inc. | | | 578,500 | | | | 17,597,970 | | |
| Nucor Corp. | | | 562,700 | | | | 18,934,855 | | |
| Metals & Mining Total | | | 38,722,096 | | |
| Paper & Forest Products – 0.3% | |
| Weyerhaeuser Co. | | | 233,300 | | | | 5,636,528 | | |
| Paper & Forest Products Total | | | 5,636,528 | | |
| Materials Total | | | 94,741,407 | | |
| Telecommunication Services – 5.7% | |
| Diversified Telecommunication Services – 5.7% | |
| AT&T, Inc. | | | 3,090,651 | | | | 73,464,774 | | |
| Verizon Communications, Inc. | | | 932,102 | | | | 26,592,870 | | |
Diversified Telecommunication
Services Total | | | 100,057,644 | | |
| Telecommunication Services Total | | | 100,057,644 | | |
See Accompanying Notes to Financial Statements.
55
Columbia Large Cap Value Fund
February 28, 2009
| Common Stocks (continued) | |
| | | Shares | | Value ($) | |
| Utilities – 6.8% | |
| Electric Utilities – 3.7% | |
| Exelon Corp. | | | 462,900 | | | | 21,858,138 | | |
| FPL Group, Inc. | | | 603,100 | | | | 27,338,523 | | |
| Northeast Utilities | | | 287,800 | | | | 6,305,698 | | |
| Southern Co. | | | 281,400 | | | | 8,529,234 | | |
| Electric Utilities Total | | | 64,031,593 | | |
| Independent Power Producers & Energy Traders – 0.0% | |
| Dynegy, Inc. (a) | | | 10,642 | | | | 13,835 | | |
Independent Power Producers &
Energy Traders Total | | | 13,835 | | |
| Multi-Utilities – 3.1% | |
| PG&E Corp. | | | 764,743 | | | | 29,228,477 | | |
Public Service Enterprise
Group, Inc. | | | 408,690 | | | | 11,153,150 | | |
| Wisconsin Energy Corp. | | | 331,900 | | | | 13,216,258 | | |
| Multi-Utilities Total | | | 53,597,885 | | |
| Utilities Total | | | 117,643,313 | | |
Total Common Stocks
(cost of $2,258,518,710) | | | 1,704,289,197 | | |
| Convertible Preferred Stocks – 1.5% | |
| Health Care – 0.7% | |
| Pharmaceuticals – 0.7% | |
| Schering-Plough Corp., 6.000% | | | 74,400 | | | | 12,648,000 | | |
| Pharmaceuticals Total | | | 12,648,000 | | |
| Health Care Total | | | 12,648,000 | | |
| Materials – 0.8% | |
| Metals & Mining – 0.8% | |
Freeport-McMoRan Copper &
Gold, Inc., 6.750% | | | 240,600 | | | | 12,968,340 | | |
| Metals & Mining Total | | | 12,968,340 | | |
| Materials Total | | | 12,968,340 | | |
Total Convertible Preferred Stocks
(cost of $29,747,282) | | | 25,616,340 | | |
| Short-Term Obligation – 0.6% | |
| | | Par ($) | | Value ($) | |
Repurchase agreement with
Fixed Income Clearing Corp.,
dated 02/27/09, due 03/02/09
at 0.210%, collateralized by
U.S. Government Agency
Obligations with various
maturities to 01/22/13,
market value $9,831,569
(repurchase proceeds
$9,634,169) | | | 9,634,000 | | | | 9,634,000 | | |
Total Short-Term Obligation
(cost of $9,634,000) | | | 9,634,000 | | |
Total Investments – 100.1%
(cost of $2,297,899,992) (b) | | | 1,739,539,537 | | |
| Other Assets & Liabilities, Net – (0.1)% | | | (1,034,047 | ) | |
| Net Assets – 100.0% | | | 1,738,505,490 | | |
Notes to Investment Portfolio:
(a) Non-income producing security.
(b) Cost for federal income tax purposes is $2,316,797,302.
For the year ended February 28, 2009, transactions in written option contracts were as follows:
| | | Number of
contracts | | Premium
received | |
| Options outstanding at February 29, 2008 | | | – | | | $ | – | | |
| Options written | | | 5,144 | | | | 1,040,195 | | |
Options terminated in closing
purchase transactions | | | (3,782 | ) | | | (690,163 | ) | |
| Options exercised | | | – | | | | – | | |
| Options expired | | | (1,362 | ) | | | (350,032 | ) | |
| Options outstanding at February 28, 2009 | | | – | | | $ | – | | |
At February 28, 2009, the Fund held investments in the following sectors:
| Sector (Unaudited) | | % of
Net Assets | |
| Financials | | | 18.9 | | |
| Energy | | | 18.9 | | |
| Health Care | | | 12.6 | | |
| Consumer Staples | | | 10.2 | | |
| Information Technology | | | 7.0 | | |
| Consumer Discretionary | | | 6.9 | | |
| Utilities | | | 6.8 | | |
| Industrials | | | 6.3 | | |
| Materials | | | 6.2 | | |
| Telecommunication Services | | | 5.7 | | |
| | | | 99.5 | | |
| Short-Term Obligation | | | 0.6 | | |
| Other Assets & Liabilities, Net | | | (0.1 | ) | |
| | | | 100.0 | | |
| Acronym | | Name | |
| ADR | | American Depositary Receipt | |
|
See Accompanying Notes to Financial Statements.
56
Investment Portfolio – Columbia Mid Cap Value Fund
February 28, 2009
| Common Stocks – 96.8% | |
| | | Shares | | Value ($) | |
| Consumer Discretionary – 11.2% | |
| Auto Components – 1.8% | |
| BorgWarner, Inc. | | | 1,482,000 | | | | 25,564,500 | | |
| Johnson Controls, Inc. | | | 2,046,700 | | | | 23,291,446 | | |
| Auto Components Total | | | 48,855,946 | | |
| Distributors – 0.7% | |
| Genuine Parts Co. | | | 738,000 | | | | 20,767,320 | | |
| Distributors Total | | | 20,767,320 | | |
| Hotels, Restaurants & Leisure – 1.2% | |
| Royal Caribbean Cruises Ltd. | | | 2,368,000 | | | | 14,208,000 | | |
Starwood Hotels & Resorts
Worldwide, Inc. | | | 1,529,700 | | | | 17,729,223 | | |
| Hotels, Restaurants & Leisure Total | | | 31,937,223 | | |
| Household Durables – 0.7% | |
| Stanley Works | | | 736,600 | | | | 19,711,416 | | |
| Household Durables Total | | | 19,711,416 | | |
| Leisure Equipment & Products – 1.3% | |
| Hasbro, Inc. | | | 1,577,800 | | | | 36,115,842 | | |
| Leisure Equipment & Products Total | | | 36,115,842 | | |
| Media – 0.9% | |
Regal Entertainment Group,
Class A | | | 2,460,200 | | | | 25,192,448 | | |
| Media Total | | | 25,192,448 | | |
| Specialty Retail – 3.5% | |
| Bed Bath & Beyond, Inc. (a) | | | 784,500 | | | | 16,709,850 | | |
| GameStop Corp., Class A (a) | | | 775,200 | | | | 20,868,384 | | |
| Gap, Inc. | | | 2,866,300 | | | | 30,927,377 | | |
| Ross Stores, Inc. | | | 1,003,100 | | | | 29,611,512 | | |
| Specialty Retail Total | | | 98,117,123 | | |
| Textiles, Apparel & Luxury Goods – 1.1% | |
| Polo Ralph Lauren Corp. | | | 887,600 | | | | 30,595,572 | | |
| Textiles, Apparel & Luxury Goods Total | | | 30,595,572 | | |
| Consumer Discretionary Total | | | 311,292,890 | | |
| Consumer Staples – 10.5% | |
| Beverages – 2.3% | |
Fomento Economico Mexicano
SAB de CV, ADR | | | 1,417,500 | | | | 32,659,200 | | |
| Pepsi Bottling Group, Inc. | | | 1,634,900 | | | | 30,245,650 | | |
| Beverages Total | | | 62,904,850 | | |
| Food & Staples Retailing – 1.5% | |
| BJ's Wholesale Club, Inc. (a) | | | 750,800 | | | | 22,433,904 | | |
| | | Shares | | Value ($) | |
| Kroger Co. | | | 983,700 | | | | 20,333,079 | | |
| Food & Staples Retailing Total | | | 42,766,983 | | |
| Food Products – 4.2% | |
| ConAgra Foods, Inc. | | | 1,897,600 | | | | 28,615,808 | | |
| Dean Foods Co. (a) | | | 1,852,700 | | | | 37,887,715 | | |
| Hershey Co. | | | 728,100 | | | | 24,529,689 | | |
| JM Smucker Co. | | | 566,400 | | | | 21,024,768 | | |
| Smithfield Foods, Inc. (a) | | | 658,000 | | | | 5,165,300 | | |
| Food Products Total | | | 117,223,280 | | |
| Household Products – 1.0% | |
| Clorox Co. | | | 542,800 | | | | 26,380,080 | | |
| Household Products Total | | | 26,380,080 | | |
| Personal Products – 1.5% | |
| Avon Products, Inc. | | | 1,365,000 | | | | 24,010,350 | | |
Estee Lauder Companies, Inc.,
Class A | | | 822,600 | | | | 18,631,890 | | |
| Personal Products Total | | | 42,642,240 | | |
| Consumer Staples Total | | | 291,917,433 | | |
| Energy – 7.8% | |
| Energy Equipment & Services – 2.0% | |
Complete Production Services,
Inc. (a) | | | 1,205,342 | | | | 3,676,293 | | |
| National-Oilwell Varco, Inc. (a) | | | 887,416 | | | | 23,720,630 | | |
| Noble Corp. | | | 1,174,700 | | | | 28,885,873 | | |
| Energy Equipment & Services Total | | | 56,282,796 | | |
| Oil, Gas & Consumable Fuels – 5.8% | |
| Cabot Oil & Gas Corp. | | | 1,175,100 | | | | 23,936,787 | | |
| El Paso Corp. | | | 3,217,900 | | | | 21,720,825 | | |
| Forest Oil Corp. (a) | | | 626,800 | | | | 8,888,024 | | |
| Hess Corp. | | | 422,400 | | | | 23,101,056 | | |
| Newfield Exploration Co. (a) | | | 1,172,800 | | | | 22,670,224 | | |
| Peabody Energy Corp. | | | 876,000 | | | | 20,734,920 | | |
| Williams Companies, Inc. | | | 3,624,200 | | | | 40,953,460 | | |
| Oil, Gas & Consumable Fuels Total | | | 162,005,296 | | |
| Energy Total | | | 218,288,092 | | |
| Financials – 25.4% | |
| Capital Markets – 3.0% | |
| Ameriprise Financial, Inc. | | | 2,995,200 | | | | 47,743,488 | | |
| Greenhill & Co., Inc. | | | 324,668 | | | | 20,973,553 | | |
| T. Rowe Price Group, Inc. | | | 578,300 | | | | 13,150,542 | | |
| Capital Markets Total | | | 81,867,583 | | |
See Accompanying Notes to Financial Statements.
57
Columbia Mid Cap Value Fund
February 28, 2009
| Common Stocks (continued) | |
| | | Shares | | Value ($) | |
| Commercial Banks – 9.4% | |
| Bank of Hawaii Corp. | | | 1,273,500 | | | | 40,802,940 | | |
| City National Corp. | | | 956,600 | | | | 30,687,728 | | |
| Comerica, Inc. | | | 2,537,700 | | | | 38,090,877 | | |
| Cullen/Frost Bankers, Inc. | | | 1,176,950 | | | | 50,655,928 | | |
| KeyCorp | | | 2,389,400 | | | | 16,749,694 | | |
| Marshall & Ilsley Corp. | | | 1,420,398 | | | | 6,505,423 | | |
| SVB Financial Group (a) | | | 962,500 | | | | 15,736,875 | | |
| TCF Financial Corp. | | | 4,536,300 | | | | 55,615,038 | | |
| Zions Bancorporation | | | 701,050 | | | | 6,568,838 | | |
| Commercial Banks Total | | | 261,413,341 | | |
| Insurance – 7.8% | |
| ACE Ltd. | | | 1,316,566 | | | | 48,067,825 | | |
| Aon Corp. | | | 804,200 | | | | 30,752,608 | | |
Marsh & McLennan
Companies, Inc. | | | 3,228,000 | | | | 57,878,040 | | |
Platinum Underwriters
Holdings Ltd. | | | 1,120,400 | | | | 31,416,016 | | |
Reinsurance Group of
America, Inc. | | | 1,825,600 | | | | 49,656,320 | | |
| Insurance Total | | | 217,770,809 | | |
| Real Estate Investment Trusts (REITs) – 5.2% | |
Alexandria Real Estate
Equities, Inc. | | | 727,900 | | | | 29,086,884 | | |
| Boston Properties, Inc. | | | 501,500 | | | | 18,600,635 | | |
Equity Residential
Property Trust | | | 842,100 | | | | 14,820,960 | | |
| Plum Creek Timber Co., Inc. | | | 1,194,700 | | | | 31,336,981 | | |
| ProLogis | | | 1,223,700 | | | | 7,085,223 | | |
| Rayonier, Inc. | | | 1,648,400 | | | | 43,847,440 | | |
| Real Estate Investment Trusts (REITs) Total | | | 144,778,123 | | |
| Financials Total | | | 705,829,856 | | |
| Health Care – 6.8% | |
| Health Care Equipment & Supplies – 4.4% | |
| Beckman Coulter, Inc. | | | 752,700 | | | | 33,751,068 | | |
| Cooper Companies, Inc. | | | 775,100 | | | | 17,044,449 | | |
| Hospira, Inc. (a) | | | 1,329,300 | | | | 30,839,760 | | |
| Teleflex, Inc. | | | 812,600 | | | | 38,598,500 | | |
| Health Care Equipment & Supplies Total | | | 120,233,777 | | |
| Health Care Providers & Services – 2.3% | |
| AmerisourceBergen Corp. | | | 837,200 | | | | 26,589,472 | | |
Community Health Systems,
Inc. (a) | | | 1,098,300 | | | | 17,968,188 | | |
Universal Health Services,
Inc., Class B | | | 540,100 | | | | 19,891,883 | | |
| Health Care Providers & Services Total | | | 64,449,543 | | |
| | | Shares | | Value ($) | |
| Life Sciences Tools & Services – 0.1% | |
| Varian, Inc. (a) | | | 147,272 | | | | 3,332,765 | | |
| Life Sciences Tools & Services Total | | | 3,332,765 | | |
| Health Care Total | | | 188,016,085 | | |
| Industrials – 7.8% | |
| Aerospace & Defense – 2.4% | |
| AerCap Holdings NV (a) | | | 1,943,700 | | | | 6,278,151 | | |
| Alliant Techsystems, Inc. (a) | | | 251,300 | | | | 17,756,858 | | |
L-3 Communications
Holdings, Inc. | | | 384,200 | | | | 25,991,130 | | |
Spirit Aerosystems
Holdings, Inc., Class A (a) | | | 1,617,823 | | | | 16,048,804 | | |
| Aerospace & Defense Total | | | 66,074,943 | | |
| Airlines – 0.3% | |
| Delta Air Lines, Inc. (a) | | | 1,810,300 | | | | 9,105,809 | | |
| Airlines Total | | | 9,105,809 | | |
| Construction & Engineering – 0.7% | |
Jacobs Engineering Group,
Inc. (a) | | | 554,400 | | | | 18,705,456 | | |
| Construction & Engineering Total | | | 18,705,456 | | |
| Electrical Equipment – 0.9% | |
| Cooper Industries Ltd., Class A | | | 1,184,300 | | | | 24,976,887 | | |
| Electrical Equipment Total | | | 24,976,887 | | |
| Industrial Conglomerates – 0.3% | |
| Textron, Inc. | | | 1,592,900 | | | | 8,999,885 | | |
| Industrial Conglomerates Total | | | 8,999,885 | | |
| Machinery – 2.0% | |
| Harsco Corp. | | | 455,200 | | | | 9,404,432 | | |
| Kennametal, Inc. | | | 1,260,600 | | | | 20,572,992 | | |
| Parker Hannifin Corp. | | | 757,000 | | | | 25,261,090 | | |
| Machinery Total | | | 55,238,514 | | |
| Marine – 0.6% | |
| Alexander & Baldwin, Inc. | | | 918,100 | | | | 17,251,099 | | |
| Marine Total | | | 17,251,099 | | |
| Road & Rail – 0.6% | |
| Canadian Pacific Railway Ltd. | | | 545,600 | | | | 15,391,376 | | |
| Road & Rail Total | | | 15,391,376 | | |
| Industrials Total | | | 215,743,969 | | |
| Information Technology – 6.6% | |
| Computers & Peripherals – 1.6% | |
| Diebold, Inc. | | | 973,200 | | | | 21,527,184 | | |
| NCR Corp. (a) | | | 3,120,100 | | | | 24,711,192 | | |
See Accompanying Notes to Financial Statements.
58
Columbia Mid Cap Value Fund
February 28, 2009
| Common Stocks (continued) | |
| | | Shares | | Value ($) | |
Seagate Technology, Inc., Escrow
Shares (b) | | | 105,800 | | | | 1,058 | | |
| Computers & Peripherals Total | | | 46,239,434 | | |
| Electronic Equipment, Instruments & Components – 2.1% | |
| Agilent Technologies, Inc. (a) | | | 904,800 | | | | 12,549,576 | | |
| Arrow Electronics, Inc. (a) | | | 1,493,000 | | | | 24,828,590 | | |
Mettler-Toledo International,
Inc. (a) | | | 387,600 | | | | 20,662,956 | | |
Electronic Equipment, Instruments &
Components Total | | | 58,041,122 | | |
| Internet Software & Services – 0.6% | |
| VeriSign, Inc. (a) | | | 886,600 | | | | 17,137,978 | | |
| Internet Software & Services Total | | | 17,137,978 | | |
| Semiconductors & Semiconductor Equipment – 0.6% | |
| Intersil Corp., Class A | | | 671,800 | | | | 6,791,898 | | |
Marvell Technology
Group Ltd. (a) | | | 852,965 | | | | 6,405,767 | | |
| Verigy Ltd. (a) | | | 529,769 | | | | 3,660,704 | | |
Semiconductors & Semiconductor
Equipment Total | | | 16,858,369 | | |
| Software – 1.7% | |
| Activision Blizzard, Inc. (a) | | | 726,766 | | | | 7,289,463 | | |
| Citrix Systems, Inc. (a) | | | 783,000 | | | | 16,114,140 | | |
| Synopsys, Inc. (a) | | | 1,257,600 | | | | 23,429,088 | | |
| Software Total | | | 46,832,691 | | |
| Information Technology Total | | | 185,109,594 | | |
| Materials – 6.7% | |
| Chemicals – 2.8% | |
| Air Products & Chemicals, Inc. | | | 682,200 | | | | 31,551,750 | | |
| Albemarle Corp. | | | 1,065,900 | | | | 20,625,165 | | |
| PPG Industries, Inc. | | | 815,300 | | | | 25,323,218 | | |
| Chemicals Total | | | 77,500,133 | | |
| Containers & Packaging – 2.1% | |
| Crown Holdings, Inc. (a) | | | 1,387,600 | | | | 29,250,608 | | |
| Packaging Corp. of America | | | 2,722,000 | | | | 28,825,980 | | |
| Containers & Packaging Total | | | 58,076,588 | | |
| Metals & Mining – 0.4% | |
| Allegheny Technologies, Inc. | | | 620,500 | | | | 12,205,235 | | |
| Metals & Mining Total | | | 12,205,235 | | |
| Paper & Forest Products – 1.4% | |
| Weyerhaeuser Co. | | | 1,656,600 | | | | 40,023,456 | | |
| Paper & Forest Products Total | | | 40,023,456 | | |
| Materials Total | | | 187,805,412 | | |
| | | Shares | | Value ($) | |
| Utilities – 14.0% | |
| Electric Utilities – 4.0% | |
American Electric Power Co.,
Inc. | | | 733,000 | | | | 20,560,650 | | |
| Entergy Corp. | | | 321,700 | | | | 21,679,363 | | |
| FPL Group, Inc. | | | 857,600 | | | | 38,875,008 | | |
| Northeast Utilities | | | 1,332,500 | | | | 29,195,075 | | |
| Electric Utilities Total | | | 110,310,096 | | |
| Gas Utilities – 1.0% | |
| AGL Resources, Inc. | | | 983,700 | | | | 27,287,838 | | |
| Gas Utilities Total | | | 27,287,838 | | |
| Multi-Utilities – 9.0% | |
| PG&E Corp. | | | 2,091,500 | | | | 79,937,130 | | |
Public Service Enterprise
Group, Inc. | | | 1,009,100 | | | | 27,538,339 | | |
| Sempra Energy | | | 1,299,300 | | | | 54,011,901 | | |
| Wisconsin Energy Corp. | | | 1,114,400 | | | | 44,375,408 | | |
| Xcel Energy, Inc. | | | 2,533,400 | | | | 44,942,516 | | |
| Multi-Utilities Total | | | 250,805,294 | | |
| Utilities Total | | | 388,403,228 | | |
Total Common Stocks
(cost of $4,317,323,480) | | | 2,692,406,559 | | |
| Convertible Preferred Stock – 0.7% | |
| Materials – 0.7% | |
| Metals & Mining – 0.7% | |
Freeport-McMoRan Copper &
Gold, Inc., 6.750% | | | 368,800 | | | | 19,878,320 | | |
| Metals & Mining Total | | | 19,878,320 | | |
| Materials Total | | | 19,878,320 | | |
Total Convertible Preferred Stock
(cost of $15,229,945) | | | 19,878,320 | | |
| Convertible Bond – 0.3% | |
| | | Par ($) | | | |
| Financials – 0.3% | |
| Real Estate Investment Trusts (REITs) – 0.3% | |
| Vornado Realty Trust | |
| 3.625% 11/15/26 | | | 10,743,000 | | | | 8,554,114 | | |
| Real Estate Investment Trusts (REITs) Total | | | 8,554,114 | | |
| Financials Total | | | 8,554,114 | | |
Total Convertible Bond
(cost of $8,525,010) | | | 8,554,114 | | |
See Accompanying Notes to Financial Statements.
59
Columbia Mid Cap Value Fund
February 28, 2009
| Short-Term Obligation – 2.0% | |
| | | Par ($) | | Value ($) | |
Repurchase agreement with
Fixed Income Clearing Corp.,
dated 02/27/09, due 03/02/09
at 0.210%, collateralized by a
U.S. Government Agency
Obligations with various
maturities to 06/24/11,
market value $56,837,963
(repurchase proceeds
$55,722,975) | | | 55,722,000 | | | | 55,722,000 | | |
Total Short-Term Obligation
(cost of $55,722,000) | | | 55,722,000 | | |
Total Investments – 99.8%
(cost of $4,396,800,435) (c) | | | 2,776,560,993 | | |
| Other Assets & Liabilities, Net – 0.2% | | | 5,251,985 | | |
| Net Assets – 100.0% | | | 2,781,812,978 | | |
Notes to Investment Portfolio:
(a) Non-income producing security.
(b) Represents fair value as determined in good faith under procedures approved by the Board of Trustees.
(c) Cost for federal income tax purposes is $4,415,113,016.
For the year ended February 28, 2009, transactions in written option contracts were as follows:
| | | Number of
contracts | | Premium
received | |
| Options outstanding at February 29, 2008 | | | – | | | $ | – | | |
| Options written | | | 6,046 | | | | 5,444,600 | | |
Options terminated in closing
purchase transactions | | | – | | | | – | | |
| Options exercised | | | – | | | | – | | |
| Options expired | | | (6,046 | ) | | | (5,444,600 | ) | |
| Options outstanding at February 28, 2009 | | | – | | | $ | – | | |
At February 28, 2009, the Fund held investments in the following sectors:
| Sector (Unaudited) | | % of
Net Assets | |
| Financials | | | 25.7 | | |
| Utilities | | | 14.0 | | |
| Consumer Discretionary | | | 11.2 | | |
| Consumer Staples | | | 10.5 | | |
| Energy | | | 7.8 | | |
| Industrials | | | 7.8 | | |
| Materials | | | 7.4 | | |
| Health Care | | | 6.8 | | |
| Information Technology | | | 6.6 | | |
| | | | 97.8 | | |
| Short-Term Obligation | | | 2.0 | | |
| Other Assets & Liabilities, Net | | | 0.2 | | |
| | | | 100.0 | | |
| Acronym | | Name | |
| ADR | | American Depositary Receipt | |
|
See Accompanying Notes to Financial Statements.
60
Investment Portfolio – Columbia Small Cap Value Fund II
February 28, 2009
| Common Stocks – 96.0% | |
| | | Shares | | Value ($) | |
| Consumer Discretionary – 8.0% | |
| Diversified Consumer Services – 0.6% | |
Stewart Enterprises, Inc.,
Class A | | | 2,030,000 | | | | 4,709,600 | | |
| Diversified Consumer Services Total | | | 4,709,600 | | |
| Hotels, Restaurants & Leisure – 2.1% | |
| Bally Technologies, Inc. (a) | | | 350,000 | | | | 6,510,000 | | |
| Papa John's International, Inc. (a) | | | 466,200 | | | | 10,326,330 | | |
| Hotels, Restaurants & Leisure Total | | | 16,836,330 | | |
| Household Durables – 1.8% | |
| Helen of Troy Ltd. (a) | | | 750,000 | | | | 7,530,000 | | |
| Tupperware Brands Corp. | | | 528,163 | | | | 7,489,351 | | |
| Household Durables Total | | | 15,019,351 | | |
| Media – 0.9% | |
World Wrestling Entertainment,
Inc. | | | 778,000 | | | | 7,546,600 | | |
| Media Total | | | 7,546,600 | | |
| Specialty Retail – 1.5% | |
| Brown Shoe Co., Inc. | | | 850,000 | | | | 3,034,500 | | |
| HOT Topic, Inc. (a) | | | 1,000,000 | | | | 8,880,000 | | |
| Pier 1 Imports, Inc. (a) | | | 2,350,000 | | | | 493,500 | | |
| Specialty Retail Total | | | 12,408,000 | | |
| Textiles, Apparel & Luxury Goods – 1.1% | |
| Warnaco Group, Inc. (a) | | | 410,000 | | | | 8,876,500 | | |
| Textiles, Apparel & Luxury Goods Total | | | 8,876,500 | | |
| Consumer Discretionary Total | | | 65,396,381 | | |
| Consumer Staples – 6.9% | |
| Food & Staples Retailing – 1.6% | |
Great Atlantic & Pacific Tea Co.,
Inc. (a) | | | 1,250,000 | | | | 5,087,500 | | |
| Winn-Dixie Stores, Inc. (a) | | | 780,000 | | | | 7,542,600 | | |
| Food & Staples Retailing Total | | | 12,630,100 | | |
| Food Products – 2.7% | |
American Italian Pasta Co.,
Class A (a) | | | 211,000 | | | | 6,475,590 | | |
| Corn Products International, Inc. | | | 290,000 | | | | 5,849,300 | | |
| Sanderson Farms, Inc. | | | 290,000 | | | | 10,013,700 | | |
| Food Products Total | | | 22,338,590 | | |
| Personal Products – 1.4% | |
| Inter Parfums, Inc. | | | 780,000 | | | | 4,258,800 | | |
| Nu Skin Enterprises, Inc., Class A | | | 710,000 | | | | 6,674,000 | | |
| Personal Products Total | | | 10,932,800 | | |
| | | Shares | | Value ($) | |
| Tobacco – 1.2% | |
| Universal Corp. | | | 342,500 | | | | 9,843,450 | | |
| Tobacco Total | | | 9,843,450 | | |
| Consumer Staples Total | | | 55,744,940 | | |
| Energy – 3.7% | |
| Energy Equipment & Services – 0.8% | |
Complete Production Services,
Inc. (a) | | | 509,515 | | | | 1,554,021 | | |
| Oil States International, Inc. (a) | | | 400,000 | | | | 5,328,000 | | |
| Energy Equipment & Services Total | | | 6,882,021 | | |
| Oil, Gas & Consumable Fuels – 2.9% | |
| EXCO Resources, Inc. (a) | | | 830,000 | | | | 7,561,300 | | |
| General Maritime Corp. | | | 704,085 | | | | 6,477,582 | | |
| Nordic American Tanker Shipping | | | 270,000 | | | | 6,893,100 | | |
| Stone Energy Corp. (a) | | | 189,000 | | | | 748,440 | | |
| Swift Energy Co. (a) | | | 247,000 | | | | 1,775,930 | | |
| Oil, Gas & Consumable Fuels Total | | | 23,456,352 | | |
| Energy Total | | | 30,338,373 | | |
| Financials – 29.6% | |
| Capital Markets – 2.3% | |
| Apollo Investment Corp. | | | 864,300 | | | | 3,569,559 | | |
Knight Capital Group, Inc.,
Class A (a) | | | 635,000 | | | | 11,169,650 | | |
| Stifel Financial Corp. (a) | | | 127,000 | | | | 4,183,380 | | |
| Capital Markets Total | | | 18,922,589 | | |
| Commercial Banks – 9.5% | |
| Bancorpsouth, Inc. | | | 475,000 | | | | 8,849,250 | | |
| Community Bank System, Inc. | | | 560,000 | | | | 9,581,600 | | |
| East West Bancorp, Inc. | | | 510,000 | | | | 3,626,100 | | |
| First Horizon National Corp. | | | 1,138,737 | | | | 10,442,218 | | |
| First Midwest Bancorp, Inc. | | | 460,500 | | | | 3,462,960 | | |
| Fulton Financial Corp. | | | 970,000 | | | | 6,033,400 | | |
| Independent Bank Corp. | | | 425,900 | | | | 6,243,694 | | |
| Pacific Capital Bancorp | | | 49,043 | | | | 355,071 | | |
| Prosperity Bancshares, Inc. | | | 295,000 | | | | 7,528,400 | | |
| Susquehanna Bancshares, Inc. | | | 475,000 | | | | 4,165,750 | | |
| TCF Financial Corp. | | | 660,000 | | | | 8,091,600 | | |
| Texas Capital Bancshares, Inc. (a) | | | 400,000 | | | | 3,896,000 | | |
| Umpqua Holdings Corp. | | | 675,000 | | | | 5,737,500 | | |
| Commercial Banks Total | | | 78,013,543 | | |
| Insurance – 8.1% | |
Argo Group International
Holdings Ltd. (a) | | | 405,000 | | | | 11,473,650 | | |
See Accompanying Notes to Financial Statements.
61
Columbia Small Cap Value Fund II
February 28, 2009
| Common Stocks (continued) | |
| | | Shares | | Value ($) | |
| Arthur J. Gallagher & Co. | | | 505,000 | | | | 8,014,350 | | |
| Aspen Insurance Holdings Ltd. | | | 461,000 | | | | 10,045,190 | | |
Delphi Financial Group, Inc.,
Class A | | | 90,958 | | | | 985,985 | | |
| First American Corp. | | | 405,000 | | | | 9,383,850 | | |
| Max Capital Group Ltd. | | | 330,600 | | | | 5,454,900 | | |
National Financial Partners
Corp. | | | 1,500,000 | | | | 3,735,000 | | |
| NYMAGIC, Inc. | | | 160,000 | | | | 1,924,800 | | |
Platinum Underwriters
Holdings Ltd. | | | 400,000 | | | | 11,216,000 | | |
| Zenith National Insurance Corp. | | | 165,000 | | | | 3,628,350 | | |
| Insurance Total | | | 65,862,075 | | |
| Real Estate Investment Trusts (REITs) – 7.5% | |
Alexandria Real Estate Equities,
Inc. | | | 206,000 | | | | 8,231,760 | | |
| Capstead Mortgage Corp. | | | 775,145 | | | | 7,766,953 | | |
| Digital Realty Trust, Inc. | | | 295,000 | | | | 8,817,550 | | |
| LaSalle Hotel Properties | | | 845,000 | | | | 4,495,400 | | |
| LTC Properties, Inc. | | | 450,000 | | | | 7,677,000 | | |
Mid-America Apartment
Communities, Inc. | | | 275,000 | | | | 7,108,750 | | |
OMEGA Healthcare Investors,
Inc. | | | 695,000 | | | | 9,125,350 | | |
Tanger Factory Outlet Centers,
Inc. | | | 280,000 | | | | 7,728,000 | | |
| Real Estate Investment Trusts (REITs) Total | | | 60,950,763 | | |
| Thrifts & Mortgage Finance – 2.2% | |
| Brookline Bancorp, Inc. | | | 825,000 | | | | 7,243,500 | | |
First Niagara Financial
Group, Inc. | | | 750,000 | | | | 8,715,000 | | |
| MGIC Investment Corp. | | | 807,100 | | | | 1,840,188 | | |
| Thrifts & Mortgage Finance Total | | | 17,798,688 | | |
| Financials Total | | | 241,547,658 | | |
| Health Care – 10.0% | |
| Health Care Equipment & Supplies – 4.1% | |
| CONMED Corp. (a) | | | 430,000 | | | | 5,843,700 | | |
| Cooper Companies, Inc. | | | 240,000 | | | | 5,277,600 | | |
| Haemonetics Corp. (a) | | | 146,100 | | | | 7,798,818 | | |
| Invacare Corp. | | | 610,000 | | | | 9,784,400 | | |
| STERIS Corp. | | | 205,000 | | | | 4,727,300 | | |
| Health Care Equipment & Supplies Total | | | 33,431,818 | | |
| Health Care Providers & Services – 5.1% | |
| Centene Corp. (a) | | | 550,000 | | | | 9,339,000 | | |
| Kindred Healthcare, Inc. (a) | | | 465,435 | | | | 6,697,610 | | |
| Magellan Health Services, Inc. (a) | | | 279,000 | | | | 9,251,640 | | |
| | | Shares | | Value ($) | |
| Owens & Minor, Inc. | | | 208,403 | | | | 7,025,265 | | |
| PharMerica Corp. (a) | | | 551,031 | | | | 9,246,300 | | |
| Health Care Providers & Services Total | | | 41,559,815 | | |
| Life Sciences Tools & Services – 0.8% | |
| Varian, Inc. (a) | | | 300,000 | | | | 6,789,000 | | |
| Life Sciences Tools & Services Total | | | 6,789,000 | | |
| Health Care Total | | | 81,780,633 | | |
| Industrials – 16.2% | |
| Aerospace & Defense – 2.6% | |
| BE Aerospace, Inc. (a) | | | 740,000 | | | | 5,520,400 | | |
| Esterline Technologies Corp. (a) | | | 290,000 | | | | 7,348,600 | | |
| Triumph Group, Inc. | | | 230,000 | | | | 8,307,600 | | |
| Aerospace & Defense Total | | | 21,176,600 | | |
| Airlines – 1.4% | |
| AirTran Holdings, Inc. (a) | | | 1,290,000 | | | | 3,857,100 | | |
| Delta Air Lines, Inc. (a) | | | 880,000 | | | | 4,426,400 | | |
| UAL Corp. (a) | | | 590,000 | | | | 2,896,900 | | |
| Airlines Total | | | 11,180,400 | | |
| Building Products – 0.4% | |
| Insteel Industries, Inc. | | | 500,000 | | | | 3,150,000 | | |
| Building Products Total | | | 3,150,000 | | |
| Commercial Services & Supplies – 4.2% | |
| ABM Industries, Inc. | | | 695,000 | | | | 8,499,850 | | |
| Bowne & Co., Inc. | | | 414,920 | | | | 655,574 | | |
| Brink's Co. | | | 241,000 | | | | 5,752,670 | | |
| Comfort Systems USA, Inc. | | | 820,000 | | | | 7,806,400 | | |
| Cornell Companies, Inc. (a) | | | 550,000 | | | | 8,382,000 | | |
| Deluxe Corp. | | | 375,000 | | | | 2,895,000 | | |
| Commercial Services & Supplies Total | | | 33,991,494 | | |
| Construction & Engineering – 1.7% | |
| EMCOR Group, Inc. (a) | | | 488,000 | | | | 7,520,080 | | |
| Shaw Group, Inc. (a) | | | 279,300 | | | | 6,518,862 | | |
| Construction & Engineering Total | | | 14,038,942 | | |
| Electrical Equipment – 1.4% | |
| AZZ, Inc. (a) | | | 380,000 | | | | 7,691,200 | | |
| C&D Technologies, Inc. (a) | | | 1,245,000 | | | | 1,518,900 | | |
JA Solar Holdings Co., Ltd.,
ADR (a) | | | 1,250,000 | | | | 2,537,500 | | |
| Electrical Equipment Total | | | 11,747,600 | | |
| Machinery – 0.4% | |
| AGCO Corp. (a) | | | 215,000 | | | | 3,685,100 | | |
| Machinery Total | | | 3,685,100 | | |
See Accompanying Notes to Financial Statements.
62
Columbia Small Cap Value Fund II
February 28, 2009
| Common Stocks (continued) | |
| | | Shares | | Value ($) | |
| Marine – 0.3% | |
| Diana Shipping, Inc. | | | 180,000 | | | | 2,111,400 | | |
| Marine Total | | | 2,111,400 | | |
| Professional Services – 2.0% | |
| CBIZ, Inc. (a) | | | 750,000 | | | | 5,145,000 | | |
Watson Wyatt Worldwide, Inc.,
Class A | | | 236,000 | | | | 11,589,960 | | |
| Professional Services Total | | | 16,734,960 | | |
| Road & Rail – 0.6% | |
| Werner Enterprises, Inc. | | | 345,000 | | | | 4,698,900 | | |
| Road & Rail Total | | | 4,698,900 | | |
| Trading Companies & Distributors – 1.2% | |
| GATX Corp. | | | 375,000 | | | | 6,851,250 | | |
| Houston Wire & Cable Co. | | | 505,500 | | | | 3,007,725 | | |
| Trading Companies & Distributors Total | | | 9,858,975 | | |
| Industrials Total | | | 132,374,371 | | |
| Information Technology – 9.6% | |
| Communications Equipment – 1.3% | |
Brocade Communications Systems,
Inc. (a) | | | 2,200,000 | | | | 6,116,000 | | |
| Ciena Corp. (a) | | | 900,000 | | | | 4,833,000 | | |
| Communications Equipment Total | | | 10,949,000 | | |
| Electronic Equipment, Instruments & Components – 3.0% | |
| Anixter International, Inc. (a) | | | 110,000 | | | | 3,235,100 | | |
| MTS Systems Corp. | | | 300,000 | | | | 7,092,000 | | |
| NAM TAI Electronics, Inc. | | | 750,000 | | | | 2,437,500 | | |
| Rofin-Sinar Technologies, Inc. (a) | | | 500,000 | | | | 7,325,000 | | |
| Rogers Corp. (a) | | | 240,600 | | | | 4,390,950 | | |
Electronic Equipment, Instruments &
Components Total | | | 24,480,550 | | |
| Semiconductors & Semiconductor Equipment – 2.9% | |
| FEI Co. (a) | | | 510,000 | | | | 7,298,100 | | |
| IXYS Corp. | | | 900,000 | | | | 7,587,000 | | |
| Skyworks Solutions, Inc. (a) | | | 1,240,000 | | | | 8,060,000 | | |
| Ultra Clean Holdings (a) | | | 800,000 | | | | 936,000 | | |
Semiconductors & Semiconductor
Equipment Total | | | 23,881,100 | | |
| Software – 2.4% | |
| Ariba, Inc. (a) | | | 976,000 | | | | 8,540,000 | | |
| Lawson Software, Inc. (a) | | | 1,450,000 | | | | 5,568,000 | | |
| Mentor Graphics Corp. (a) | | | 1,154,900 | | | | 5,116,207 | | |
| Software Total | | | 19,224,207 | | |
| Information Technology Total | | | 78,534,857 | | |
| | | Shares | | Value ($) | |
| Materials – 6.9% | |
| Chemicals – 2.1% | |
| Olin Corp. | | | 600,000 | | | | 6,264,000 | | |
| OM Group, Inc. (a) | | | 295,000 | | | | 4,572,500 | | |
| Rockwood Holdings, Inc. (a) | | | 1,000,000 | | | | 5,890,000 | | |
| Chemicals Total | | | 16,726,500 | | |
| Construction Materials – 0.8% | |
| Eagle Materials, Inc. | | | 350,000 | | | | 6,674,500 | | |
| Construction Materials Total | | | 6,674,500 | | |
| Containers & Packaging – 2.4% | |
| Crown Holdings, Inc. (a) | | | 500,000 | | | | 10,540,000 | | |
| Rock-Tenn Co., Class A | | �� | 310,000 | | | | 8,559,100 | | |
| Containers & Packaging Total | | | 19,099,100 | | |
| Metals & Mining – 0.9% | |
Schnitzer Steel Industries, Inc.,
Class A | | | 127,000 | | | | 3,637,280 | | |
| Steel Dynamics, Inc. | | | 455,000 | | | | 3,799,250 | | |
| Metals & Mining Total | | | 7,436,530 | | |
| Paper & Forest Products – 0.7% | |
Schweitzer-Mauduit International,
Inc. | | | 388,454 | | | | 5,904,501 | | |
| Paper & Forest Products Total | | | 5,904,501 | | |
| Materials Total | | | 55,841,131 | | |
| Telecommunication Services – 0.8% | |
| Diversified Telecommunication Services – 0.8% | |
| Cincinnati Bell, Inc. (a) | | | 3,800,000 | | | | 6,308,000 | | |
Diversified Telecommunication
Services Total | | | 6,308,000 | | |
| Telecommunication Services Total | | | 6,308,000 | | |
| Utilities – 4.3% | |
| Electric Utilities – 1.4% | |
| Westar Energy, Inc. | | | 675,000 | | | | 11,407,500 | | |
| Electric Utilities Total | | | 11,407,500 | | |
| Gas Utilities – 2.9% | |
| Atmos Energy Corp. | | | 535,000 | | | | 11,679,050 | | |
| New Jersey Resources Corp. | | | 345,000 | | | | 12,099,150 | | |
| Gas Utilities Total | | | 23,778,200 | | |
| Utilities Total | | | 35,185,700 | | |
Total Common Stocks
(cost of $1,280,978,871) | | | 783,052,044 | | |
See Accompanying Notes to Financial Statements.
63
Columbia Small Cap Value Fund II
February 28, 2009
| Short-Term Obligation – 4.2% | |
| | | Par ($) | | Value ($) | |
Repurchase agreement with
Fixed Income Clearing Corp.,
dated 02/27/09, due 03/02/09
at 0.210%, collateralized by a
U.S. Government Agency
Obligation maturing 01/22/13,
market value $35,263,069
(repurchase proceeds
$34,571,605) | | | 34,571,000 | | | | 34,571,000 | | |
Total Short-Term Obligation
(cost of $34,571,000) | | | 34,571,000 | | |
Total Investments – 100.2%
(cost of $1,315,549,871) (b) | | | 817,623,044 | | |
| Other Assets & Liabilities, Net – (0.2)% | | | (1,503,916 | ) | |
| Net Assets – 100.0% | | | 816,119,128 | | |
Notes to Investment Portfolio:
(a) Non-income producing security.
(b) Cost for federal income tax purposes is $1,330,296,835.
At February 28, 2009, the Fund held investments in the following sectors:
| Sector (Unaudited) | | % of
Net Assets | |
| Financials | | | 29.6 | | |
| Industrials | | | 16.2 | | |
| Health Care | | | 10.0 | | |
| Information Technology | | | 9.6 | | |
| Consumer Discretionary | | | 8.0 | | |
| Consumer Staples | | | 6.9 | | |
| Materials | | | 6.9 | | |
| Utilities | | | 4.3 | | |
| Energy | | | 3.7 | | |
| Telecommunication Services | | | 0.8 | | |
| | | | 96.0 | | |
| Short-Term Obligation | | | 4.2 | | |
| Other Assets & Liabilities, Net | | | (0.2 | ) | |
| | | | 100.0 | | |
| Acronym | | Name | |
| ADR | | American Depositary Receipt | |
|
See Accompanying Notes to Financial Statements.
64
Investment Portfolio – Columbia Marsico Growth Fund
February 28, 2009
| Common Stocks – 94.3% | |
| | | Shares | | Value ($) | |
| Consumer Discretionary – 18.2% | |
| Hotels, Restaurants & Leisure – 13.4% | |
| Las Vegas Sands Corp. (a) | | | 5,951,909 | | | | 13,570,353 | | |
| McDonald's Corp. | | | 5,436,895 | | | | 284,077,764 | | |
| Wynn Resorts Ltd. (a) | | | 1,619,291 | | | | 33,924,146 | | |
| Yum! Brands, Inc. | | | 3,501,212 | | | | 92,011,851 | | |
| Hotels, Restaurants & Leisure Total | | | 423,584,114 | | |
| Multiline Retail – 0.5% | |
| Target Corp. | | | 504,322 | | | | 14,277,356 | | |
| Multiline Retail Total | | | 14,277,356 | | |
| Specialty Retail – 2.0% | |
| Lowe's Companies, Inc. | | | 3,999,100 | | | | 63,345,744 | | |
| Specialty Retail Total | | | 63,345,744 | | |
| Textiles, Apparel & Luxury Goods – 2.3% | |
| NIKE, Inc., Class B | | | 1,741,257 | | | | 72,314,403 | | |
| Textiles, Apparel & Luxury Goods Total | | | 72,314,403 | | |
| Consumer Discretionary Total | | | 573,521,617 | | |
| Consumer Staples – 9.1% | |
| Food & Staples Retailing – 9.1% | |
| Costco Wholesale Corp. | | | 1,674,161 | | | | 70,883,977 | | |
| CVS Caremark Corp. | | | 4,104,114 | | | | 105,639,894 | | |
| Wal-Mart Stores, Inc. | | | 2,229,948 | | | | 109,802,639 | | |
| Food & Staples Retailing Total | | | 286,326,510 | | |
| Consumer Staples Total | | | 286,326,510 | | |
| Energy – 5.0% | |
| Energy Equipment & Services – 3.5% | |
| Transocean Ltd. (a) | | | 1,837,614 | | | | 109,834,189 | | |
| Energy Equipment & Services Total | | | 109,834,189 | | |
| Oil, Gas & Consumable Fuels – 1.5% | |
| Petroleo Brasileiro SA, ADR | | | 1,727,589 | | | | 47,906,043 | | |
| Oil, Gas & Consumable Fuels Total | | | 47,906,043 | | |
| Energy Total | | | 157,740,232 | | |
| Financials – 6.8% | |
| Capital Markets – 2.7% | |
| Goldman Sachs Group, Inc. | | | 943,290 | | | | 85,914,853 | | |
| Capital Markets Total | | | 85,914,853 | | |
| Commercial Banks – 3.0% | |
Industrial & Commercial
Bank of China, Class H | | | 140,859,000 | | | | 57,758,502 | | |
| | | Shares | | Value ($) | |
| U.S. Bancorp | | | 2,441,267 | | | | 34,934,531 | | |
| Commercial Banks Total | | | 92,693,033 | | |
| Real Estate Management & Development – 1.1% | |
| St. Joe Co. (a) | | | 1,884,154 | | | | 34,649,592 | | |
Real Estate Management &
Development Total | | | 34,649,592 | | |
| Financials Total | | | 213,257,478 | | |
| Health Care – 12.8% | |
| Biotechnology – 7.7% | |
| Genentech, Inc. (a) | | | 2,277,090 | | | | 194,805,050 | | |
| Genzyme Corp. (a) | | | 160,916 | | | | 9,804,612 | | |
| Gilead Sciences, Inc. (a) | | | 881,454 | | | | 39,489,139 | | |
| Biotechnology Total | | | 244,098,801 | | |
| Health Care Providers & Services – 1.2% | |
| UnitedHealth Group, Inc. | | | 1,852,153 | | | | 36,394,806 | | |
| Health Care Providers & Services Total | | | 36,394,806 | | |
| Pharmaceuticals – 3.9% | |
| Abbott Laboratories | | | 1,060,383 | | | | 50,198,531 | | |
| Johnson & Johnson | | | 666,476 | | | | 33,323,800 | | |
| Schering-Plough Corp. | | | 2,361,828 | | | | 41,072,189 | | |
| Pharmaceuticals Total | | | 124,594,520 | | |
| Health Care Total | | | 405,088,127 | | |
| Industrials – 13.4% | |
| Aerospace & Defense – 7.5% | |
| General Dynamics Corp. | | | 2,318,635 | | | | 101,602,586 | | |
| Lockheed Martin Corp. | | | 2,142,703 | | | | 135,225,986 | | |
| Aerospace & Defense Total | | | 236,828,572 | | |
| Machinery – 0.3% | |
| Deere & Co. | | | 352,133 | | | | 9,680,136 | | |
| Machinery Total | | | 9,680,136 | | |
| Road & Rail – 5.6% | |
| Norfolk Southern Corp. | | | 1,869,944 | | | | 59,314,624 | | |
| Union Pacific Corp. | | | 3,071,407 | | | | 115,239,190 | | |
| Road & Rail Total | | | 174,553,814 | | |
| Industrials Total | | | 421,062,522 | | |
| Information Technology – 20.2% | |
| Communications Equipment – 2.9% | |
| QUALCOMM, Inc. | | | 2,682,255 | | | | 89,667,785 | | |
| Communications Equipment Total | | | 89,667,785 | | |
See Accompanying Notes to Financial Statements.
65
Columbia Marsico Growth Fund
February 28, 2009
| Common Stocks (continued) | |
| | | Shares | | Value ($) | |
| Computers & Peripherals – 4.8% | |
| Apple, Inc. (a) | | | 1,228,999 | | | | 109,761,901 | | |
International Business
Machines Corp. | | | 455,631 | | | | 41,931,721 | | |
| Computers & Peripherals Total | | | 151,693,622 | | |
| Internet Software & Services – 3.5% | |
| Google, Inc., Class A (a) | | | 329,973 | | | | 111,527,574 | | |
| Internet Software & Services Total | | | 111,527,574 | | |
| IT Services – 8.7% | |
| MasterCard, Inc., Class A | | | 863,005 | | | | 136,380,680 | | |
| Visa, Inc., Class A | | | 2,449,474 | | | | 138,909,671 | | |
| IT Services Total | | | 275,290,351 | | |
| Software – 0.3% | |
| Oracle Corp. (a) | | | 580,260 | | | | 9,017,240 | | |
| Software Total | | | 9,017,240 | | |
| Information Technology Total | | | 637,196,572 | | |
| Materials – 8.8% | |
| Chemicals – 8.8% | |
| Air Products & Chemicals, Inc. | | | 583,670 | | | | 26,994,738 | | |
| Monsanto Co. | | | 1,768,642 | | | | 134,894,325 | | |
Potash Corp. of Saskatchewan,
Inc. | | | 369,862 | | | | 31,057,312 | | |
| Praxair, Inc. | | | 1,474,861 | | | | 83,698,362 | | |
| Chemicals Total | | | 276,644,737 | | |
| Materials Total | | | 276,644,737 | | |
Total Common Stocks
(cost of $3,437,693,155) | | | 2,970,837,795 | | |
| Preferred Stock – 0.3% | |
| Financials – 0.3% | |
| Commercial Banks – 0.3% | |
| Wells Fargo & Co. | | | 696,350 | | | | 10,549,703 | | |
| Commercial Banks Total | | | 10,549,703 | | |
| Financials Total | | | 10,549,703 | | |
Total Preferred Stock
(cost of $13,383,445) | | | 10,549,703 | | |
| Short-Term Obligation – 4.2% | |
| | | Par ($) | | Value ($) | |
Repurchase agreement with
Fixed Income Clearing Corp.,
dated 02/27/09, due 03/02/09
at 0.210%, collateralized by a
U.S. Government Agency
Obligation, maturing 02/05/14,
market value $135,036,825
(repurchase proceeds
$132,387,317) | | | 132,385,000 | | | | 132,385,000 | | |
Total Short-Term Obligation
(cost of $132,385,000) | | | 132,385,000 | | |
Total Investments – 98.8%
(cost of $3,583,461,600) (b) | | | 3,113,772,498 | | |
| Other Assets & Liabilities, Net – 1.2% | | | 37,820,562 | | |
| Net Assets – 100.0% | | | 3,151,593,060 | | |
Notes to Investment Portfolio:
(a) Non-income producing security.
(b) Cost for federal income tax purposes is $3,643,279,347.
At February 28, 2009, the Fund held investments in the following sectors:
| Sector (Unaudited) | | % of
Net Assets | |
| Information Technology | | | 20.2 | | |
| Consumer Discretionary | | | 18.2 | | |
| Industrials | | | 13.4 | | |
| Health Care | | | 12.8 | | |
| Consumer Staples | | | 9.1 | | |
| Materials | | | 8.8 | | |
| Financials | | | 7.1 | | |
| Energy | | | 5.0 | | |
| | | | 94.6 | | |
| Short-Term Obligation | | | 4.2 | | |
| Other Assets & Liabilities, Net | | | 1.2 | | |
| | | | 100.0 | | |
| Acronym | | Name | |
| ADR | | American Depositary Receipt | |
|
See Accompanying Notes to Financial Statements.
66
Investment Portfolio – Columbia Large Cap Core Fund
February 28, 2009
| Common Stocks – 99.4% | |
| | | Shares | | Value ($) | |
| Consumer Discretionary – 8.7% | |
| Distributors – 0.4% | |
| Genuine Parts Co. | | | 130,010 | | | | 3,658,481 | | |
| Distributors Total | | | 3,658,481 | | |
| Hotels, Restaurants & Leisure – 1.8% | |
| Burger King Holdings, Inc. | | | 192,780 | | | | 4,142,842 | | |
| McDonald's Corp. | | | 121,974 | | | | 6,373,142 | | |
Starwood Hotels & Resorts
Worldwide, Inc. | | | 361,275 | | | | 4,187,177 | | |
| Hotels, Restaurants & Leisure Total | | | 14,703,161 | | |
| Media – 2.6% | |
| Comcast Corp., Class A | | | 676,330 | | | | 8,832,870 | | |
| DIRECTV Group, Inc. (a) | | | 204,373 | | | | 4,075,198 | | |
| Time Warner, Inc. | | | 1,062,820 | | | | 8,109,316 | | |
| Media Total | | | 21,017,384 | | |
| Multiline Retail – 0.4% | |
| Dollar Tree, Inc. (a) | | | 88,791 | | | | 3,446,867 | | |
| Multiline Retail Total | | | 3,446,867 | | |
| Specialty Retail – 3.0% | |
| Gap, Inc. | | | 393,230 | | | | 4,242,952 | | |
| Lowe's Companies, Inc. | | | 365,186 | | | | 5,784,546 | | |
| Sherwin-Williams Co. | | | 65,930 | | | | 3,029,483 | | |
| Staples, Inc. | | | 309,166 | | | | 4,931,198 | | |
| TJX Companies, Inc. | | | 281,060 | | | | 6,259,206 | | |
| Specialty Retail Total | | | 24,247,385 | | |
| Textiles, Apparel & Luxury Goods – 0.5% | |
| Polo Ralph Lauren Corp. | | | 112,528 | | | | 3,878,840 | | |
| Textiles, Apparel & Luxury Goods Total | | | 3,878,840 | | |
| Consumer Discretionary Total | | | 70,952,118 | | |
| Consumer Staples – 12.5% | |
| Beverages – 2.4% | |
| Diageo PLC, ADR | | | 106,300 | | | | 4,941,887 | | |
| Hansen Natural Corp. (a) | | | 62,710 | | | | 2,086,989 | | |
| Molson Coors Brewing Co., Class B | | | 80,740 | | | | 2,844,470 | | |
| PepsiCo, Inc. | | | 201,178 | | | | 9,684,709 | | |
| Beverages Total | | | 19,558,055 | | |
| Food & Staples Retailing – 2.7% | |
| Kroger Co. | | | 283,999 | | | | 5,870,259 | | |
| Wal-Mart Stores, Inc. | | | 322,674 | | | | 15,888,468 | | |
| Food & Staples Retailing Total | | | 21,758,727 | | |
| Household Products – 3.4% | |
| Colgate-Palmolive Co. | | | 128,900 | | | | 7,757,202 | | |
| Kimberly-Clark Corp. | | | 163,577 | | | | 7,706,112 | | |
| | | Shares | | Value ($) | |
| Procter & Gamble Co. | | | 262,241 | | | | 12,632,149 | | |
| Household Products Total | | | 28,095,463 | | |
| Personal Products – 1.6% | |
| Avon Products, Inc. | | | 416,648 | | | | 7,328,839 | | |
Estée Lauder Companies, Inc.,
Class A | | | 145,480 | | | | 3,295,122 | | |
Mead Johnson Nutrition Co.,
Class A (a) | | | 90,241 | | | | 2,489,749 | | |
| Personal Products Total | | | 13,113,710 | | |
| Tobacco – 2.4% | |
| Altria Group, Inc. | | | 229,965 | | | | 3,550,660 | | |
| Philip Morris International, Inc. | | | 471,992 | | | | 15,797,572 | | |
| Tobacco Total | | | 19,348,232 | | |
| Consumer Staples Total | | | 101,874,187 | | |
| Energy – 13.7% | |
| Energy Equipment & Services – 1.3% | |
| Noble Corp. | | | 250,983 | | | | 6,171,672 | | |
| Weatherford International Ltd. (a) | | | 451,320 | | | | 4,815,585 | | |
| Energy Equipment & Services Total | | | 10,987,257 | | |
| Oil, Gas & Consumable Fuels – 12.4% | |
| Apache Corp. | | | 152,692 | | | | 9,022,570 | | |
| Chevron Corp. | | | 423,517 | | | | 25,711,717 | | |
| Exxon Mobil Corp. | | | 392,517 | | | | 26,651,904 | | |
| Hess Corp. | | | 145,480 | | | | 7,956,301 | | |
| Marathon Oil Corp. | | | 169,410 | | | | 3,942,171 | | |
| Occidental Petroleum Corp. | | | 122,950 | | | | 6,377,416 | | |
| Peabody Energy Corp. | | | 109,150 | | | | 2,583,581 | | |
| Total SA, ADR | | | 130,760 | | | | 6,171,872 | | |
| Ultra Petroleum Corp. (a) | | | 123,865 | | | | 4,352,616 | | |
| XTO Energy, Inc. | | | 244,360 | | | | 7,736,438 | | |
| Oil, Gas & Consumable Fuels Total | | | 100,506,586 | | |
| Energy Total | | | 111,493,843 | | |
| Financials – 10.6% | |
| Capital Markets – 3.8% | |
| Goldman Sachs Group, Inc. | | | 172,400 | | | | 15,702,192 | | |
| Morgan Stanley (b) | | | 428,440 | | | | 8,371,718 | | |
| State Street Corp. | | | 260,039 | | | | 6,571,185 | | |
| Capital Markets Total | | | 30,645,095 | | |
| Commercial Banks – 2.0% | |
| PNC Financial Services Group, Inc. | | | 282,009 | | | | 7,710,126 | | |
| U.S. Bancorp (b) | | | 572,040 | | | | 8,185,892 | | |
| Commercial Banks Total | | | 15,896,018 | | |
See Accompanying Notes to Financial Statements.
67
Columbia Large Cap Core Fund
February 28, 2009
| Common Stocks (continued) | |
| | | Shares | | Value ($) | |
| Diversified Financial Services – 2.2% | |
| JPMorgan Chase & Co. | | | 797,170 | | | | 18,215,335 | | |
| Diversified Financial Services Total | | | 18,215,335 | | |
| Insurance – 2.6% | |
| ACE Ltd. | | | 115,781 | | | | 4,227,164 | | |
| Aon Corp. | | | 112,454 | | | | 4,300,241 | | |
| Axis Capital Holdings Ltd. | | | 102,246 | | | | 2,288,265 | | |
| MetLife, Inc. | | | 257,463 | | | | 4,752,767 | | |
| Prudential Financial, Inc. | | | 188,470 | | | | 3,092,793 | | |
| Reinsurance Group of America, Inc. | | | 87,030 | | | | 2,367,216 | | |
| Insurance Total | | | 21,028,446 | | |
| Financials Total | | | 85,784,894 | | |
| Health Care – 16.0% | |
| Biotechnology – 2.8% | |
| Amgen, Inc. (a) | | | 240,167 | | | | 11,751,372 | | |
| Genentech, Inc. (a) | | | 27,411 | | | | 2,345,011 | | |
| Gilead Sciences, Inc. (a) | | | 190,734 | | | | 8,544,883 | | |
| Biotechnology Total | | | 22,641,266 | | |
| Health Care Equipment & Supplies – 2.2% | |
| Baxter International, Inc. | | | 132,453 | | | | 6,743,182 | | |
| Medtronic, Inc. | | | 241,660 | | | | 7,150,720 | | |
| Zimmer Holdings, Inc. (a) | | | 113,966 | | | | 3,991,089 | | |
| Health Care Equipment & Supplies Total | | | 17,884,991 | | |
| Health Care Providers & Services – 3.2% | |
| CIGNA Corp. | | | 149,340 | | | | 2,353,598 | | |
| Express Scripts, Inc. (a) | | | 165,441 | | | | 8,321,682 | | |
Laboratory Corp. of America
Holdings (a) | | | 53,118 | | | | 2,922,021 | | |
| McKesson Corp. | | | 96,240 | | | | 3,947,765 | | |
| Medco Health Solutions, Inc. (a) | | | 113,010 | | | | 4,585,946 | | |
| Omnicare, Inc. | | | 151,250 | | | | 3,921,913 | | |
| Health Care Providers & Services Total | | | 26,052,925 | | |
| Life Sciences Tools & Services – 1.0% | |
| Covance, Inc. (a) | | | 84,600 | | | | 3,213,108 | | |
| Thermo Fisher Scientific, Inc. (a) | | | 138,090 | | | | 5,007,143 | | |
| Life Sciences Tools & Services Total | | | 8,220,251 | | |
| Pharmaceuticals – 6.8% | |
| Abbott Laboratories | | | 273,734 | | | | 12,958,567 | | |
| AstraZeneca PLC, ADR | | | 147,220 | | | | 4,650,680 | | |
| Bristol-Myers Squibb Co. | | | 492,641 | | | | 9,069,521 | | |
| Johnson & Johnson | | | 154,754 | | | | 7,737,700 | | |
| Wyeth | | | 506,050 | | | | 20,656,961 | | |
| Pharmaceuticals Total | | | 55,073,429 | | |
| Health Care Total | | | 129,872,862 | | |
| | | Shares | | Value ($) | |
| Industrials – 10.0% | |
| Aerospace & Defense – 3.9% | |
| Honeywell International, Inc. | | | 279,050 | | | | 7,486,911 | | |
| L-3 Communications Holdings, Inc. | | | 55,966 | | | | 3,786,100 | | |
| Lockheed Martin Corp. | | | 75,653 | | | | 4,774,461 | | |
| Northrop Grumman Corp. | | | 110,228 | | | | 4,118,118 | | |
| Precision Castparts Corp. | | | 54,635 | | | | 3,028,418 | | |
| United Technologies Corp. | | | 202,183 | | | | 8,255,132 | | |
| Aerospace & Defense Total | | | 31,449,140 | | |
| Air Freight & Logistics – 0.9% | |
United Parcel Service, Inc.,
Class B | | | 182,090 | | | | 7,498,466 | | |
| Air Freight & Logistics Total | | | 7,498,466 | | |
| Commercial Services & Supplies – 0.5% | |
| Waste Management, Inc. | | | 164,063 | | | | 4,429,701 | | |
| Commercial Services & Supplies Total | | | 4,429,701 | | |
| Electrical Equipment – 0.3% | |
| Emerson Electric Co. | | | 97,720 | | | | 2,614,010 | | |
| Electrical Equipment Total | | | 2,614,010 | | |
| Industrial Conglomerates – 1.3% | |
| General Electric Co. | | | 1,211,377 | | | | 10,308,818 | | |
| Industrial Conglomerates Total | | | 10,308,818 | | |
| Machinery – 0.7% | |
| Parker Hannifin Corp. | | | 167,908 | | | | 5,603,090 | | |
| Machinery Total | | | 5,603,090 | | |
| Professional Services – 0.6% | |
| Dun & Bradstreet Corp. | | | 61,810 | | | | 4,572,086 | | |
| Professional Services Total | | | 4,572,086 | | |
| Road & Rail – 1.3% | |
| Union Pacific Corp. | | | 283,996 | | | | 10,655,530 | | |
| Road & Rail Total | | | 10,655,530 | | |
| Trading Companies & Distributors – 0.5% | |
| W.W. Grainger, Inc. | | | 63,517 | | | | 4,202,285 | | |
| Trading Companies & Distributors Total | | | 4,202,285 | | |
| Industrials Total | | | 81,333,126 | | |
| Information Technology – 17.2% | |
| Communications Equipment – 1.2% | |
| Corning, Inc. | | | 503,310 | | | | 5,309,920 | | |
| QUALCOMM, Inc. | | | 131,364 | | | | 4,391,499 | | |
| Communications Equipment Total | | | 9,701,419 | | |
See Accompanying Notes to Financial Statements.
68
Columbia Large Cap Core Fund
February 28, 2009
| Common Stocks (continued) | |
| | | Shares | | Value ($) | |
| Computers & Peripherals – 6.1% | |
| Apple, Inc. (a) | | | 155,636 | | | | 13,899,851 | | |
| EMC Corp. (a) | | | 770,161 | | | | 8,086,690 | | |
| Hewlett-Packard Co. | | | 493,417 | | | | 14,323,896 | | |
International Business Machines
Corp. | | | 109,872 | | | | 10,111,520 | | |
| NetApp, Inc. (a) | | | 239,130 | | | | 3,213,907 | | |
| Computers & Peripherals Total | | | 49,635,864 | | |
| Electronic Equipment, Instruments &Components – 0.6% | |
| Agilent Technologies, Inc. (a) | | | 160,340 | | | | 2,223,916 | | |
| Dolby Laboratories, Inc., Class A (a) | | | 81,677 | | | | 2,291,040 | | |
| Electronic Equipment & Instruments Total | | | 4,514,956 | | |
| Internet Software & Services – 0.8% | |
| Google, Inc., Class A (a) | | | 20,321 | | | | 6,868,295 | | |
| Internet Software & Services Total | | | 6,868,295 | | |
| IT Services – 0.5% | |
Affiliated Computer Services, Inc.,
Class A (a) | | | 83,820 | | | | 3,908,527 | | |
| IT Services Total | | | 3,908,527 | | |
| Semiconductors & Semiconductor Equipment – 3.5% | |
| Analog Devices, Inc. | | | 286,168 | | | | 5,334,172 | | |
| Intel Corp. | | | 903,671 | | | | 11,512,769 | | |
| Marvell Technology Group Ltd. (a) | | | 547,320 | | | | 4,110,373 | | |
| Texas Instruments, Inc. | | | 261,790 | | | | 3,756,686 | | |
| Xilinx, Inc. | | | 232,290 | | | | 4,106,887 | | |
Semiconductors & Semiconductor
Equipment Total | | | 28,820,887 | | |
| Software – 4.5% | |
| Activision Blizzard, Inc. (a) | | | 551,844 | | | | 5,534,995 | | |
| Adobe Systems, Inc. (a) | | | 210,820 | | | | 3,520,694 | | |
| Microsoft Corp. | | | 1,359,569 | | | | 21,957,039 | | |
| Symantec Corp. (a) | | | 380,180 | | | | 5,257,890 | | |
| Software Total | | | 36,270,618 | | |
| Information Technology Total | | | 139,720,566 | | |
| Materials – 2.7% | |
| Chemicals – 2.1% | |
| Monsanto Co. | | | 103,597 | | | | 7,901,343 | | |
| Potash Corp. of Saskatchewan, Inc. | | | 29,390 | | | | 2,467,878 | | |
| Praxair, Inc. | | | 111,290 | | | | 6,315,708 | | |
| Chemicals Total | | | 16,684,929 | | |
| Containers & Packaging – 0.1% | |
| Packaging Corp. of America | | | 116,580 | | | | 1,234,582 | | |
| Containers & Packaging Total | | | 1,234,582 | | |
| | | Shares | | Value ($) | |
| Metals & Mining – 0.5% | |
| Rio Tinto PLC, ADR | | | 29,990 | | | | 3,058,980 | | |
| United States Steel Corp. | | | 67,250 | | | | 1,322,808 | | |
| Metals & Mining Total | | | 4,381,788 | | |
| Materials Total | | | 22,301,299 | | |
| Telecommunication Services – 3.7% | |
| Diversified Telecommunication Services – 3.2% | |
| AT&T, Inc. | | | 796,472 | | | | 18,932,140 | | |
| Verizon Communications, Inc. | | | 231,008 | | | | 6,590,658 | | |
| Diversified Telecommunication Services Total | | | 25,522,798 | | |
| Wireless Telecommunication Services – 0.5% | |
Rogers Communications, Inc.,
Class B | | | 178,162 | | | | 4,179,680 | | |
| Wireless Telecommunication Services Total | | | 4,179,680 | | |
| Telecommunication Services Total | | | 29,702,478 | | |
| Utilities – 4.3% | |
| Electric Utilities – 2.6% | |
| Exelon Corp. | | | 195,600 | | | | 9,236,232 | | |
| FirstEnergy Corp. | | | 128,239 | | | | 5,457,852 | | |
| FPL Group, Inc. | | | 139,016 | | | | 6,301,595 | | |
| Electric Utilities Total | | | 20,995,679 | | |
| Multi-Utilities – 1.7% | |
| PG&E Corp. | | | 208,260 | | | | 7,959,697 | | |
| Public Service Enterprise Group, Inc. | | | 215,870 | | | | 5,891,093 | | |
| Multi-Utilities Total | | | 13,850,790 | | |
| Utilities Total | | | 34,846,469 | | |
Total Common Stocks
(cost of $970,551,566) | | | 807,881,842 | | |
See Accompanying Notes to Financial Statements.
69
Columbia Large Cap Core Fund
February 28, 2009
| Short-Term Obligation – 0.2% | |
| | | Par ($) | | Value ($) | |
Repurchase agreement with
Fixed Income Clearing Corp.,
dated 02/27/09, due 03/02/09
at 0.210%, collateralized by a
U.S. Government Agency
Obligation maturing 09/18/17,
market value $1,662,000
(repurchase proceeds
$1,626,028) | | | 1,626,000 | | | | 1,626,000 | | |
Total Short-Term Obligation
(cost of $1,626,000) | | | 1,626,000 | | |
Total Investments – 99.6%
(cost of $972,177,566) (c) | | | 809,507,842 | | |
| Other Assets & Liabilities, Net – 0.4% | | | 3,369,530 | | |
| Net Assets – 100.0% | | | 812,877,372 | | |
Notes to Investment Portfolio:
(a) Non-income producing security.
(b) All or a portion of these securities are pledged as collateral for open written option contracts.
(c) Cost for federal income tax purposes is $995,014,731.
At February 28, 2009, the Fund had the following written call options:
| Name of Issuer | | Strike
Price | | Number of
Contracts | | Expiration
Date | | Premium | | Value | |
| Morgan Stanley | | $ | 26.0 | | | | 760 | | | 03/21/09 | | $ | 56,240 | | | $ | 22,800 | | |
| U.S. Bancorp | | | 17.5 | | | | 860 | | | 03/21/09 | | | 37,839 | | | | 34,400 | | |
| Total written call options (proceeds $94,079) | | $ | 57,200 | | |
For the year ended February, 28, 2009, transactions in written option contracts were as follows:
| | | Number of
contracts | | Premium
received | |
| Options outstanding at February 29, 2008 | | | 1,000 | | | $ | 68,328 | | |
| Options written | | | 27,105 | | | | 1,788,620 | | |
Options terminated in closing
purchase transactions | | | (710 | ) | | | (51,370 | ) | |
| Options exercised | | | (1,570 | ) | | | (109,767 | ) | |
| Options expired | | | (24,205 | ) | | | (1,601,732 | ) | |
| Options outstanding at February 28, 2009 | | | 1,620 | | | $ | 94,079 | | |
At February 28, 2009, the Fund held investments in the following sectors:
| Sector (Unaudited) | | % of
Net Assets | |
| Information Technology | | | 17.2 | | |
| Health Care | | | 16.0 | | |
| Energy | | | 13.7 | | |
| Consumer Staples | | | 12.5 | | |
| Financials | | | 10.6 | | |
| Industrials | | | 10.0 | | |
| Consumer Discretionary | | | 8.7 | | |
| Utilities | | | 4.3 | | |
| Telecommunication Services | | | 3.7 | | |
| Materials | | | 2.7 | | |
| | | | 99.4 | | |
| Short-Term Obligation | | | 0.2 | | |
| Other Assets & Liabilities, Net | | | 0.4 | | |
| | | | 100.0 | | |
| Acronym | | Name | |
| ADR | | American Depositary Receipt | |
|
See Accompanying Notes to Financial Statements.
70
Investment Portfolio – Columbia Marsico Focused Equities Fund
February 28, 2009
| Common Stocks – 98.5% | |
| | | Shares | | Value ($) | |
| Consumer Discretionary – 15.5% | |
| Hotels, Restaurants & Leisure – 12.2% | |
| Las Vegas Sands Corp. (a) | | | 4,736,599 | | | | 10,799,446 | | |
| McDonald's Corp. | | | 5,057,378 | | | | 264,248,001 | | |
| Wynn Resorts Ltd. (a) | | | 1,543,014 | | | | 32,326,143 | | |
| Hotels, Restaurants & Leisure Total | | | 307,373,590 | | |
| Multiline Retail – 0.5% | |
| Target Corp. | | | 400,675 | | | | 11,343,109 | | |
| Multiline Retail Total | | | 11,343,109 | | |
| Specialty Retail – 2.8% | |
| Lowe's Companies, Inc. | | | 4,458,624 | | | | 70,624,604 | | |
| Specialty Retail Total | | | 70,624,604 | | |
| Consumer Discretionary Total | | | 389,341,303 | | |
| Consumer Staples – 9.1% | |
| Food & Staples Retailing – 9.1% | |
| CVS Caremark Corp. | | | 3,974,581 | | | | 102,305,715 | | |
| Wal-Mart Stores, Inc. | | | 2,586,856 | | | | 127,376,789 | | |
| Food & Staples Retailing Total | | | 229,682,504 | | |
| Consumer Staples Total | | | 229,682,504 | | |
| Energy – 5.3% | |
| Energy Equipment & Services – 4.2% | |
| Transocean Ltd. (a) | | | 1,748,395 | | | | 104,501,569 | | |
| Energy Equipment & Services Total | | | 104,501,569 | | |
| Oil, Gas & Consumable Fuels – 1.1% | |
| Petroleo Brasileiro SA, ADR | | | 1,016,223 | | | | 28,179,864 | | |
| Oil, Gas & Consumable Fuels Total | | | 28,179,864 | | |
| Energy Total | | | 132,681,433 | | |
| Financials – 8.2% | |
| Capital Markets – 4.8% | |
| Goldman Sachs Group, Inc. | | | 1,319,804 | | | | 120,207,749 | | |
| Capital Markets Total | | | 120,207,749 | | |
| Commercial Banks – 3.4% | |
Industrial & Commercial
Bank of China, Class H | | | 112,096,400 | | | | 45,964,547 | | |
| U.S. Bancorp | | | 2,725,724 | | | | 39,005,110 | | |
| Commercial Banks Total | | | 84,969,657 | | |
| Financials Total | | | 205,177,406 | | |
| | | Shares | | Value ($) | |
| Health Care – 15.0% | |
| Biotechnology – 10.9% | |
| Genentech, Inc. (a) | | | 2,365,432 | | | | 202,362,707 | | |
| Gilead Sciences, Inc. (a) | | | 1,613,860 | | | | 72,300,928 | | |
| Biotechnology Total | | | 274,663,635 | | |
| Pharmaceuticals – 4.1% | |
| Abbott Laboratories | | | 838,630 | | | | 39,700,744 | | |
| Johnson & Johnson | | | 652,053 | | | | 32,602,650 | | |
| Schering-Plough Corp. | | | 1,752,845 | | | | 30,481,975 | | |
| Pharmaceuticals Total | | | 102,785,369 | | |
| Health Care Total | | | 377,449,004 | | |
| Industrials – 14.4% | |
| Aerospace & Defense – 7.4% | |
| General Dynamics Corp. | | | 1,817,455 | | | | 79,640,878 | | |
| Lockheed Martin Corp. | | | 1,694,607 | | | | 106,946,648 | | |
| Aerospace & Defense Total | | | 186,587,526 | | |
| Road & Rail – 7.0% | |
| Norfolk Southern Corp. | | | 1,270,589 | | | | 40,303,083 | | |
| Union Pacific Corp. | | | 3,604,599 | | | | 135,244,555 | | |
| Road & Rail Total | | | 175,547,638 | | |
| Industrials Total | | | 362,135,164 | | |
| Information Technology – 24.0% | |
| Communications Equipment – 3.1% | |
| QUALCOMM, Inc. | | | 2,349,303 | | | | 78,537,199 | | |
| Communications Equipment Total | | | 78,537,199 | | |
| Computers & Peripherals – 4.7% | |
| Apple, Inc. (a) | | | 941,093 | | | | 84,049,016 | | |
International Business
Machines Corp. | | | 373,594 | | | | 34,381,856 | | |
| Computers & Peripherals Total | | | 118,430,872 | | |
| Internet Software & Services – 4.0% | |
| Google, Inc., Class A (a) | | | 295,382 | | | | 99,836,162 | | |
| Internet Software & Services Total | | | 99,836,162 | | |
| IT Services – 11.9% | |
| MasterCard, Inc., Class A | | | 769,528 | | | | 121,608,510 | | |
| Visa, Inc., Class A | | | 3,105,125 | | | | 176,091,638 | | |
| IT Services Total | | | 297,700,148 | | |
| Software – 0.3% | |
| Oracle Corp. (a) | | | 460,529 | | | | 7,156,621 | | |
| Software Total | | | 7,156,621 | | |
| Information Technology Total | | | 601,661,002 | | |
See Accompanying Notes to Financial Statements.
71
Columbia Marsico Focused Equities Fund
February 28, 2009
| Common Stocks (continued) | |
| | | Shares | | Value ($) | |
| Materials – 7.0% | |
| Chemicals – 7.0% | |
| Monsanto Co. | | | 1,549,010 | | | | 118,142,993 | | |
Potash Corp. of
Saskatchewan, Inc. | | | 674,152 | | | | 56,608,543 | | |
| Chemicals Total | | | 174,751,536 | | |
| Materials Total | | | 174,751,536 | | |
Total Common Stocks
(cost of $2,763,966,950) | | | 2,472,879,352 | | |
| Short-Term Obligation – 2.7% | |
| | | Par ($) | | | |
Repurchase agreement with
Fixed Income Clearing Corp.,
dated 02/27/09, due 03/02/09
at 0.210%, collateralized by
U.S. Government Agency
Obligations with various
maturities to 11/21/12,
market value $68,466,844
(repurchase proceeds
$67,124,175) | | | 67,123,000 | | | | 67,123,000 | | |
Total Short-Term Obligation
(cost of $67,123,000) | | | 67,123,000 | | |
Total Investments – 101.2%
(cost of $2,831,089,950) (b) | | | 2,540,002,352 | | |
| Other Assets & Liabilities, Net – (1.2)% | | | (29,927,923 | ) | |
| Net Assets – 100.0% | | | 2,510,074,429 | | |
Notes to Investment Portfolio:
(a) Non-income producing security.
(b) Cost for federal income tax purposes is $2,897,075,564.
At February 28, 2009, the Fund held investments in the following sectors:
| Sector (Unaudited) | | % of
Net Assets | |
| Information Technology | | | 24.0 | | |
| Consumer Discretionary | | | 15.5 | | |
| Health Care | | | 15.0 | | |
| Industrials | | | 14.4 | | |
| Consumer Staples | | | 9.1 | | |
| Financials | | | 8.2 | | |
| Materials | | | 7.0 | | |
| Energy | | | 5.3 | | |
| | | | 98.5 | | |
| Short-Term Obligation | | | 2.7 | | |
| Other Assets & Liabilities, Net | | | (1.2 | ) | |
| | | | 100.0 | | |
| Acronym | | Name | |
| ADR | | American Depositary Receipt | |
|
See Accompanying Notes to Financial Statements.
72
Investment Portfolio – Columbia Marsico 21st Century Fund
February 28, 2009
| Common Stocks – 92.5% | |
| | | Shares | | Value ($) | |
| Consumer Discretionary – 9.6% | |
| Hotels, Restaurants & Leisure – 3.0% | |
| Las Vegas Sands Corp. (a) | | | 4,785,149 | | | | 10,910,140 | | |
| Vail Resorts, Inc. (a)(b) | | | 3,091,100 | | | | 58,359,968 | | |
| Wynn Resorts Ltd. (a) | | | 1,843,563 | | | | 38,622,645 | | |
| Hotels, Restaurants & Leisure Total | | | 107,892,753 | | |
| Internet & Catalog Retail – 2.0% | |
| Amazon.com, Inc. (a) | | | 895,977 | | | | 58,050,350 | | |
| Blue Nile, Inc. (a) | | | 511,629 | | | | 12,212,584 | | |
| Internet & Catalog Retail Total | | | 70,262,934 | | |
| Multiline Retail – 0.7% | |
| Saks, Inc. (a)(b) | | | 10,442,103 | | | | 25,374,310 | | |
| Multiline Retail Total | | | 25,374,310 | | |
| Specialty Retail – 3.9% | |
| Home Depot, Inc. | | | 5,893,266 | | | | 123,110,327 | | |
| J Crew Group, Inc. (a) | | | 1,542,911 | | | | 17,373,178 | | |
| Specialty Retail Total | | | 140,483,505 | | |
| Consumer Discretionary Total | | | 344,013,502 | | |
| Consumer Staples – 11.1% | |
| Beverages – 4.8% | |
| Anheuser-Busch InBev NV | | | 1,724,279 | | | | 47,653,816 | | |
| Heineken Holding NV | | | 5,392,883 | | | | 125,558,344 | | |
| Beverages Total | | | 173,212,160 | | |
| Food & Staples Retailing – 6.3% | |
| Costco Wholesale Corp. | | | 5,387,054 | | | | 228,087,866 | | |
| Food & Staples Retailing Total | | | 228,087,866 | | |
| Consumer Staples Total | | | 401,300,026 | | |
| Energy – 2.7% | |
| Oil, Gas & Consumable Fuels – 2.7% | |
| Petroleo Brasileiro SA, ADR | | | 3,560,459 | | | | 98,731,528 | | |
| Oil, Gas & Consumable Fuels Total | | | 98,731,528 | | |
| Energy Total | | | 98,731,528 | | |
| Financials – 13.1% | |
| Capital Markets – 4.1% | |
| Charles Schwab Corp. | | | 7,076,937 | | | | 89,947,869 | | |
| Jefferies Group, Inc. | | | 5,838,747 | | | | 57,745,208 | | |
| Capital Markets Total | | | 147,693,077 | | |
| Commercial Banks – 3.6% | |
| City National Corp. | | | 1,663,130 | | | | 53,353,210 | | |
| | | Shares | | Value ($) | |
| U.S. Bancorp | | | 2,212,611 | | | | 31,662,464 | | |
| Wells Fargo & Co. | | | 3,828,673 | | | | 46,326,943 | | |
| Commercial Banks Total | | | 131,342,617 | | |
| Diversified Financial Services – 3.0% | |
| JPMorgan Chase & Co. | | | 4,736,601 | | | | 108,231,333 | | |
| Diversified Financial Services Total | | | 108,231,333 | | |
| Thrifts & Mortgage Finance – 2.4% | |
| People's United Financial, Inc. | | | 4,902,806 | | | | 85,357,853 | | |
| Thrifts & Mortgage Finance Total | | | 85,357,853 | | |
| Financials Total | | | 472,624,880 | | |
| Health Care – 11.0% | |
| Biotechnology – 8.6% | |
| Celgene Corp. (a) | | | 1,238,946 | | | | 55,418,055 | | |
| Genzyme Corp. (a) | | | 1,458,553 | | | | 88,869,634 | | |
| Gilead Sciences, Inc. (a) | | | 3,738,523 | | | | 167,485,830 | | |
| Biotechnology Total | | | 311,773,519 | | |
| Health Care Technology – 0.8% | |
| athenahealth, Inc. (a) | | | 1,092,421 | | | | 27,834,887 | | |
| Health Care Technology Total | | | 27,834,887 | | |
| Pharmaceuticals – 1.6% | |
| Perrigo Co. | | | 1,027,055 | | | | 20,633,535 | | |
Roche Holding AG,
Genusschein Shares | | | 323,325 | | | | 36,758,751 | | |
| Pharmaceuticals Total | | | 57,392,286 | | |
| Health Care Total | | | 397,000,692 | | |
| Industrials – 15.2% | |
| Aerospace & Defense – 3.3% | |
| Raytheon Co. | | | 3,018,551 | | | | 120,651,483 | | |
| Aerospace & Defense Total | | | 120,651,483 | | |
| Construction & Engineering – 2.1% | |
| AECOM Technology Corp. (a) | | | 3,055,872 | | | | 74,960,540 | | |
| Construction & Engineering Total | | | 74,960,540 | | |
| Electrical Equipment – 5.2% | |
Energy Conversion Devices,
Inc. (a) | | | 1,606,338 | | | | 35,226,993 | | |
| Vestas Wind Systems A/S (a) | | | 3,427,856 | | | | 151,072,396 | | |
| Electrical Equipment Total | | | 186,299,389 | | |
| Professional Services – 0.5% | |
Duff & Phelps Corp.,
Class A (a) | | | 1,226,303 | | | | 16,972,034 | | |
| Professional Services Total | | | 16,972,034 | | |
See Accompanying Notes to Financial Statements.
73
Columbia Marsico 21st Century Fund
February 28, 2009
| Common Stocks (continued) | |
| | | Shares | | Value ($) | |
| Road & Rail – 4.1% | |
| Canadian National Railway Co. | | | 4,533,892 | | | | 146,626,067 | | |
| Road & Rail Total | | | 146,626,067 | | |
| Industrials Total | | | 545,509,513 | | |
| Information Technology – 21.6% | |
| Communications Equipment – 2.3% | |
| QUALCOMM, Inc. | | | 2,493,466 | | | | 83,356,568 | | |
| Communications Equipment Total | | | 83,356,568 | | |
| Computers & Peripherals – 2.2% | |
| Apple, Inc. (a) | | | 872,804 | | | | 77,950,125 | | |
| Computers & Peripherals Total | | | 77,950,125 | | |
| Internet Software & Services – 3.1% | |
| Google, Inc., Class A (a) | | | 332,227 | | | | 112,289,404 | | |
| Internet Software & Services Total | | | 112,289,404 | | |
| IT Services – 11.1% | |
| MasterCard, Inc., Class A | | | 1,807,718 | | | | 285,673,676 | | |
| Visa, Inc., Class A | | | 1,982,802 | | | | 112,444,701 | | |
| IT Services Total | | | 398,118,377 | | |
| Software – 2.9% | |
| Citrix Systems, Inc. (a) | | | 5,072,649 | | | | 104,395,117 | | |
| Software Total | | | 104,395,117 | | |
| Information Technology Total | | | 776,109,591 | | |
| Materials – 5.7% | |
| Chemicals – 5.1% | |
| Monsanto Co. | | | 2,419,041 | | | | 184,500,257 | | |
| Chemicals Total | | | 184,500,257 | | |
| Construction Materials ��� 0.6% | |
| Martin Marietta Materials, Inc. | | | 266,374 | | | | 20,393,593 | | |
| Construction Materials Total | | | 20,393,593 | | |
| Materials Total | | | 204,893,850 | | |
| | | Shares | | Value ($) | |
| Telecommunication Services – 2.5% | |
| Wireless Telecommunication Services – 2.5% | |
American Tower Corp.,
Class A (a) | | | 730,309 | | | | 21,266,598 | | |
Crown Castle International
Corp. (a) | | | 3,917,041 | | | | 68,704,899 | | |
| Wireless Telecommunication Services Total | | | 89,971,497 | | |
| Telecommunication Services Total | | | 89,971,497 | | |
Total Common Stocks
(cost of $4,398,729,731) | | | 3,330,155,079 | | |
| Short-Term Obligation – 11.6% | |
| | | Par ($) | | | |
Repurchase agreement with
Fixed Income Clearing Corp.,
dated 02/27/09, due 03/02/09
at 0.210%, collateralized by
U.S. Government Agency
Obligations with various
maturities to 09/18/17,
market value $426,133,738
(repurchase proceeds
$417,785,311) | | | 417,778,000 | | | | 417,778,000 | | |
Total Short-Term Obligation
(cost of $417,778,000) | | | 417,778,000 | | |
Total Investments – 104.1%
(cost of $4,816,507,731) (c) | | | 3,747,933,079 | | |
| Other Assets & Liabilities, Net – (4.1)% | | | (149,256,108 | ) | |
| Net Assets – 100.0% | | | 3,598,676,971 | | |
Notes to Investment Portfolio:
(a) Non-income producing security.
(b) An affiliate may include any company in which the Fund owns five percent or more of its outstanding voting shares. Transactions in these affiliated companies during the twelve months ended February 28, 2009, are as follows:
| Security name: BorgWarner, Inc. | |
| Shares as of 2/29/08: | | | 4,295,220 | | |
| Shares purchased: | | | 840,619 | | |
| Shares sold: | | | (5,135,839 | ) | |
| Shares as of 2/28/09: | | | – | | |
| Net realized loss: | | $ | (6,373,849 | ) | |
| Dividend income earned: | | $ | 564,942 | | |
| Value at end of period: | | $ | – | | |
See Accompanying Notes to Financial Statements.
74
Columbia Marsico 21st Century Fund
February 28, 2009
| Security name: Saks, Inc. | |
| Shares as of 2/29/08: | | | 12,465,379 | | |
| Shares purchased: | | | 4,188,344 | | |
| Shares sold: | | | (6,211,620 | ) | |
| Shares as of 2/28/09: | | | 10,442,103 | | |
| Net realized loss: | | $ | (87,706,532 | ) | |
| Dividend income earned: | | $ | – | | |
| Value at end of period: | | $ | 25,374,310 | | |
| Security name: St. Joe Co. | |
| Shares as of 2/29/08: | | | 5,561,507 | | |
| Shares purchased: | | | – | | |
| Shares sold: | | | (5,561,507 | ) | |
| Shares as of 2/28/09: | | | – | | |
| Net realized loss: | | $ | (77,496,957 | ) | |
| Dividend income earned: | | $ | – | | |
| Value at end of period: | | $ | – | | |
| Security name: Vail Resorts, Inc. | |
| Shares as of 2/29/08: | | | 2,953,317 | | |
| Shares purchased: | | | 241,896 | | |
| Shares sold: | | | (104,113 | ) | |
| Shares as of 2/28/09: | | | 3,091,100 | | |
| Net realized loss: | | $ | (4,304,677 | ) | |
| Dividend income earned: | | $ | – | | |
| Value at end of period: | | $ | 58,359,968 | | |
(c) Cost for federal income tax purposes is $5,414,824,402.
At February 28, 2009, the Fund held investments in the following sectors:
| Sector (Unaudited) | | % of
Net Assets | |
| Information Technology | | | 21.6 | | |
| Industrials | | | 15.2 | | |
| Financials | | | 13.1 | | |
| Consumer Staples | | | 11.1 | | |
| Health Care | | | 11.0 | | |
| Consumer Discretionary | | | 9.6 | | |
| Materials | | | 5.7 | | |
| Energy | | | 2.7 | | |
| Telecommunication Services | | | 2.5 | | |
| | | | 92.5 | | |
| Short-Term Obligation | | | 11.6 | | |
| Other Assets & Liabilities, Net | | | (4.1 | ) | |
| | | | 100.0 | | |
| Acronym | | Name | |
| ADR | | American Depositary Receipt | |
|
See Accompanying Notes to Financial Statements.
75
Investment Portfolio – Columbia Small Cap Growth Fund II
February 28, 2009
| Common Stocks – 97.9% | |
| | | Shares | | Value ($) | |
| Consumer Discretionary – 13.0% | |
| Diversified Consumer Services – 3.8% | |
Brink's Home Security Holdings,
Inc. (a) | | | 83,580 | | | | 1,752,673 | | |
| Capella Education Co. (a) | | | 64,737 | | | | 3,590,314 | | |
| Corinthian Colleges, Inc. (a) | | | 76,520 | | | | 1,507,444 | | |
| Jackson Hewitt Tax Service, Inc. | | | 296,980 | | | | 2,221,410 | | |
| Diversified Consumer Services Total | | | 9,071,841 | | |
| Hotels, Restaurants & Leisure – 2.3% | |
| Bally Technologies, Inc. (a) | | | 137,920 | | | | 2,565,312 | | |
| Panera Bread Co., Class A (a) | | | 40,680 | | | | 1,791,547 | | |
| Red Robin Gourmet Burgers, Inc. (a) | | | 87,970 | | | | 1,250,054 | | |
| Hotels, Restaurants & Leisure Total | | | 5,606,913 | | |
| Internet & Catalog Retail – 0.9% | |
| Netflix, Inc. (a) | | | 61,820 | | | | 2,234,175 | | |
| Internet & Catalog Retail Total | | | 2,234,175 | | |
| Media – 1.9% | |
| Arbitron, Inc. | | | 111,420 | | | | 1,441,775 | | |
| Marvel Entertainment, Inc. (a) | | | 66,720 | | | | 1,725,379 | | |
| VisionChina Media, Inc., ADR (a) | | | 217,970 | | | | 1,320,898 | | |
| Media Total | | | 4,488,052 | | |
| Specialty Retail – 2.4% | |
| Aeropostale, Inc. (a) | | | 57,880 | | | | 1,342,237 | | |
| Chico's FAS, Inc. (a) | | | 403,490 | | | | 1,827,810 | | |
| Citi Trends, Inc. (a) | | | 115,760 | | | | 1,412,272 | | |
| Tractor Supply Co. (a) | | | 33,050 | | | | 1,032,482 | | |
| Specialty Retail Total | | | 5,614,801 | | |
| Textiles, Apparel & Luxury Goods – 1.7% | |
| Fossil, Inc. (a) | | | 100,940 | | | | 1,273,863 | | |
| Phillips-Van Heusen Corp. | | | 98,000 | | | | 1,623,860 | | |
| Volcom, Inc. (a) | | | 146,200 | | | | 1,163,752 | | |
| Textiles, Apparel & Luxury Goods Total | | | 4,061,475 | | |
| Consumer Discretionary Total | | | 31,077,257 | | |
| Consumer Staples – 3.1% | |
| Food & Staples Retailing – 0.4% | |
| Casey's General Stores, Inc. | | | 49,790 | | | | 991,319 | | |
| Food & Staples Retailing Total | | | 991,319 | | |
| Food Products – 1.9% | |
| Flowers Foods, Inc. | | | 86,600 | | | | 1,932,046 | | |
| Sanderson Farms, Inc. | | | 37,067 | | | | 1,279,923 | | |
| TreeHouse Foods, Inc. (a) | | | 47,240 | | | | 1,260,836 | | |
| Food Products Total | | | 4,472,805 | | |
| | | Shares | | Value ($) | |
| Personal Products – 0.8% | |
| Chattem, Inc. (a) | | | 30,799 | | | | 1,953,581 | | |
| Personal Products Total | | | 1,953,581 | | |
| Consumer Staples Total | | | 7,417,705 | | |
| Energy – 5.9% | |
| Energy Equipment & Services – 1.7% | |
| IHS, Inc., Class A (a) | | | 57,524 | | | | 2,342,952 | | |
| Pioneer Drilling Co. (a) | | | 210,030 | | | | 806,515 | | |
| T-3 Energy Services, Inc. (a) | | | 89,770 | | | | 988,368 | | |
| Energy Equipment & Services Total | | | 4,137,835 | | |
| Oil, Gas & Consumable Fuels – 4.2% | |
| Arena Resources, Inc. (a) | | | 97,510 | | | | 2,088,664 | | |
| Comstock Resources, Inc. (a) | | | 83,220 | | | | 2,532,385 | | |
| Concho Resources, Inc. (a) | | | 136,060 | | | | 2,714,397 | | |
| Encore Acquisition Co. (a) | | | 50,440 | | | | 1,012,835 | | |
| Penn Virginia Corp. | | | 59,700 | | | | 826,845 | | |
| Whiting Petroleum Corp. (a) | | | 36,500 | | | | 850,450 | | |
| Oil, Gas & Consumable Fuels Total | | | 10,025,576 | | |
| Energy Total | | | 14,163,411 | | |
| Financials – 5.0% | |
| Capital Markets – 1.6% | |
| Greenhill & Co., Inc. | | | 20,560 | | | | 1,328,176 | | |
| Stifel Financial Corp. (a) | | | 37,804 | | | | 1,245,264 | | |
Waddell & Reed Financial, Inc.,
Class A | | | 91,360 | | | | 1,290,003 | | |
| Capital Markets Total | | | 3,863,443 | | |
| Commercial Banks – 0.5% | |
| Pinnacle Financial Partners, Inc. (a) | | | 67,271 | | | | 1,334,657 | | |
| Commercial Banks Total | | | 1,334,657 | | |
| Consumer Finance – 0.6% | |
| World Acceptance Corp. (a) | | | 94,530 | | | | 1,385,810 | | |
| Consumer Finance Total | | | 1,385,810 | | |
| Diversified Financial Services – 0.7% | |
Portfolio Recovery Associates,
Inc. (a) | | | 70,221 | | | | 1,584,186 | | |
| Diversified Financial Services Total | | | 1,584,186 | | |
| Insurance – 0.2% | |
Platinum Underwriters
Holdings Ltd. | | | 18,950 | | | | 531,358 | | |
| Insurance Total | | | 531,358 | | |
See Accompanying Notes to Financial Statements.
76
Columbia Small Cap Growth Fund II
February 28, 2009
| Common Stocks (continued) | |
| | | Shares | | Value ($) | |
| Real Estate Investment Trusts (REITs) – 1.4% | |
| BioMed Realty Trust, Inc. | | | 121,080 | | | | 1,032,812 | | |
| Home Properties, Inc. | | | 43,672 | | | | 1,159,055 | | |
| National Retail Properties, Inc. | | | 79,360 | | | | 1,140,403 | | |
| Real Estate Investment Trusts (REITs) Total | | | 3,332,270 | | |
| Financials Total | | | 12,031,724 | | |
| Health Care – 25.5% | |
| Biotechnology – 9.3% | |
| Alexion Pharmaceuticals, Inc. (a) | | | 83,230 | | | | 2,846,466 | | |
| Array Biopharma, Inc. (a) | | | 264,044 | | | | 823,817 | | |
| BioMarin Pharmaceutical, Inc. (a) | | | 147,771 | | | | 1,773,252 | | |
| Isis Pharmaceuticals, Inc. (a) | | | 64,580 | | | | 830,499 | | |
| Martek Biosciences Corp. | | | 24,740 | | | | 463,380 | | |
| Myriad Genetics, Inc. (a) | | | 35,450 | | | | 2,795,233 | | |
| Onyx Pharmaceuticals, Inc. (a) | | | 110,683 | | | | 3,319,383 | | |
| OSI Pharmaceuticals, Inc. (a) | | | 73,490 | | | | 2,506,009 | | |
Regeneron Pharmaceuticals,
Inc. (a) | | | 147,644 | | | | 2,103,927 | | |
| Rigel Pharmaceuticals, Inc. (a) | | | 122,050 | | | | 639,542 | | |
| Seattle Genetics, Inc. (a) | | | 245,613 | | | | 1,972,272 | | |
| United Therapeutics Corp. (a) | | | 34,597 | | | | 2,321,805 | | |
| Biotechnology Total | | | 22,395,585 | | |
| Health Care Equipment & Supplies – 7.9% | |
China Medical Technologies,
Inc., ADR | | | 80,460 | | | | 1,048,394 | | |
| Haemonetics Corp. (a) | | | 36,960 | | | | 1,972,925 | | |
| Immucor, Inc. (a) | | | 84,359 | | | | 1,893,016 | | |
| Masimo Corp. (a) | | | 68,126 | | | | 1,702,469 | | |
| Meridian Bioscience, Inc. | | | 175,950 | | | | 3,529,557 | | |
| NuVasive, Inc. (a) | | | 63,510 | | | | 1,800,508 | | |
| Quidel Corp. (a) | | | 85,357 | | | | 942,341 | | |
| STERIS Corp. | | | 56,620 | | | | 1,305,657 | | |
| Thoratec Corp. (a) | | | 51,630 | | | | 1,179,229 | | |
| Wright Medical Group, Inc. (a) | | | 237,585 | | | | 3,471,117 | | |
| Health Care Equipment & Supplies Total | | | 18,845,213 | | |
| Health Care Providers & Services – 4.9% | |
| Alliance Imaging, Inc. (a) | | | 322,341 | | | | 2,643,196 | | |
| Amedisys, Inc. (a) | | | 24,410 | | | | 798,451 | | |
| inVentiv Health, Inc. (a) | | | 170,950 | | | | 1,736,852 | | |
| MWI Veterinary Supply, Inc. (a) | | | 60,621 | | | | 1,528,862 | | |
| Owens & Minor, Inc. | | | 74,870 | | | | 2,523,868 | | |
| Psychiatric Solutions, Inc. (a) | | | 147,633 | | | | 2,500,903 | | |
| Health Care Providers & Services Total | | | 11,732,132 | | |
| Life Sciences Tools & Services – 2.6% | |
| Albany Molecular Research, Inc. (a) | | | 107,590 | | | | 932,805 | | |
| | | Shares | | Value ($) | |
Bio-Rad Laboratories, Inc.,
Class A (a) | | | 32,893 | | | | 1,832,140 | | |
| Dionex Corp. (a) | | | 34,770 | | | | 1,626,889 | | |
| ICON PLC, ADR (a) | | | 56,490 | | | | 1,159,175 | | |
| Sequenom, Inc. (a) | | | 53,770 | | | | 786,655 | | |
| Life Sciences Tools & Services Total | | | 6,337,664 | | |
| Pharmaceuticals – 0.8% | |
| Eurand NV (a) | | | 203,663 | | | | 1,934,798 | | |
| Pharmaceuticals Total | | | 1,934,798 | | |
| Health Care Total | | | 61,245,392 | | |
| Industrials – 17.0% | |
| Aerospace & Defense – 2.3% | |
| HEICO Corp. | | | 54,390 | | | | 1,326,028 | | |
| Stanley, Inc. (a) | | | 73,373 | | | | 2,275,297 | | |
| Teledyne Technologies, Inc. (a) | | | 81,033 | | | | 1,856,466 | | |
| Aerospace & Defense Total | | | 5,457,791 | | |
| Air Freight & Logistics – 1.0% | |
| HUB Group, Inc., Class A (a) | | | 131,441 | | | | 2,360,680 | | |
| Air Freight & Logistics Total | | | 2,360,680 | | |
| Commercial Services & Supplies – 4.7% | |
| Brink's Co. | | | 95,940 | | | | 2,290,088 | | |
| Clean Harbors, Inc. (a) | | | 12,070 | | | | 586,360 | | |
| Geo Group, Inc. (a) | | | 176,940 | | | | 2,091,431 | | |
| Mobile Mini, Inc. (a) | | | 221,940 | | | | 2,163,915 | | |
| Waste Connections, Inc. (a) | | | 167,450 | | | | 3,992,008 | | |
| Commercial Services & Supplies Total | | | 11,123,802 | | |
| Construction & Engineering – 1.4% | |
| EMCOR Group, Inc. (a) | | | 127,740 | | | | 1,968,474 | | |
| Granite Construction, Inc. | | | 36,080 | | | | 1,283,726 | | |
| Construction & Engineering Total | | | 3,252,200 | | |
| Electrical Equipment – 3.0% | |
| AZZ, Inc. (a) | | | 47,470 | | | | 960,793 | | |
| Energy Conversion Devices, Inc. (a) | | | 42,210 | | | | 925,665 | | |
| II-VI, Inc. (a) | | | 106,237 | | | | 1,908,017 | | |
| Polypore International, Inc. (a) | | | 116,577 | | | | 565,398 | | |
| Regal-Beloit Corp. | | | 66,820 | | | | 1,916,398 | | |
| Woodward Governor Co. | | | 54,400 | | | | 936,768 | | |
| Electrical Equipment Total | | | 7,213,039 | | |
| Machinery – 1.8% | |
| Badger Meter, Inc. | | | 45,380 | | | | 1,139,038 | | |
| Nordson Corp. | | | 29,156 | | | | 725,984 | | |
| Wabtec Corp. | | | 92,648 | | | | 2,479,261 | | |
| Machinery Total | | | 4,344,283 | | |
See Accompanying Notes to Financial Statements.
77
Columbia Small Cap Growth Fund II
February 28, 2009
| Common Stocks (continued) | |
| | | Shares | | Value ($) | |
| Marine – 0.3% | |
| Genco Shipping & Trading Ltd. | | | 62,797 | | | | 770,519 | | |
| Marine Total | | | 770,519 | | |
| Professional Services – 1.3% | |
| Exponent, Inc. (a) | | | 57,570 | | | | 1,293,598 | | |
| Huron Consulting Group, Inc. (a) | | | 45,030 | | | | 1,858,388 | | |
| Professional Services Total | | | 3,151,986 | | |
| Road & Rail – 0.5% | |
| Old Dominion Freight Line, Inc. (a) | | | 57,070 | | | | 1,243,555 | | |
| Road & Rail Total | | | 1,243,555 | | |
| Trading Companies & Distributors – 0.7% | |
| Beacon Roofing Supply, Inc. (a) | | | 158,000 | | | | 1,733,260 | | |
| Trading Companies & Distributors Total | | | 1,733,260 | | |
| Industrials Total | | | 40,651,115 | | |
| Information Technology – 23.5% | |
| Communications Equipment – 3.7% | |
| Arris Group, Inc. (a) | | | 272,173 | | | | 1,665,699 | | |
Comtech Telecommunications
Corp. (a) | | | 46,490 | | | | 1,756,857 | | |
| Digi International, Inc. (a) | | | 119,797 | | | | 857,746 | | |
| Polycom, Inc. (a) | | | 220,730 | | | | 2,935,709 | | |
| Riverbed Technology, Inc. (a) | | | 160,330 | | | | 1,678,655 | | |
| Communications Equipment Total | | | 8,894,666 | | |
| Electronic Equipment, Instruments & Components – 1.1% | |
| Brightpoint, Inc. (a) | | | 539,390 | | | | 2,114,409 | | |
| Daktronics, Inc. | | | 69,580 | | | | 477,319 | | |
Electronic Equipment, Instruments &
Components Total | | | 2,591,728 | | |
| Internet Software & Services – 5.0% | |
| comScore, Inc. (a) | | | 155,150 | | | | 1,399,453 | | |
| Digital River, Inc. (a) | | | 75,890 | | | | 1,815,289 | | |
| Equinix, Inc. (a) | | | 69,902 | | | | 3,244,152 | | |
| Sohu.com, Inc. (a) | | | 42,910 | | | | 2,119,754 | | |
Switch & Data Facilities Co.,
Inc. (a) | | | 263,770 | | | | 1,622,185 | | |
| Websense, Inc. (a) | | | 154,260 | | | | 1,721,542 | | |
| Internet Software & Services Total | | | 11,922,375 | | |
| IT Services – 2.6% | |
| CACI International, Inc., Class A (a) | | | 71,171 | | | | 3,043,984 | | |
Mantech International Corp.,
Class A (a) | | | 18,160 | | | | 947,407 | | |
| TeleTech Holdings, Inc. (a) | | | 251,947 | | | | 2,181,861 | | |
| IT Services Total | | | 6,173,252 | | |
| | | Shares | | Value ($) | |
| Semiconductors & Semiconductor Equipment – 4.8% | |
| Cabot Microelectronics Corp. (a) | | | 62,910 | | | | 1,294,688 | | |
| Cavium Networks, Inc. (a) | | | 130,600 | | | | 1,242,006 | | |
| Hittite Microwave Corp. (a) | | | 58,200 | | | | 1,605,156 | | |
| Microsemi Corp. (a) | | | 167,300 | | | | 1,691,403 | | |
| MKS Instruments, Inc. (a) | | | 76,550 | | | | 963,765 | | |
| Monolithic Power Systems, Inc. (a) | | | 192,350 | | | | 2,490,932 | | |
| Skyworks Solutions, Inc. (a) | | | 365,430 | | | | 2,375,295 | | |
Semiconductors & Semiconductor
Equipment Total | | | 11,663,245 | | |
| Software – 6.3% | |
| ANSYS, Inc. (a) | | | 82,490 | | | | 1,663,823 | | |
| Concur Technologies, Inc. (a) | | | 66,770 | | | | 1,401,502 | | |
| EPIQ Systems, Inc. (a) | | | 73,935 | | | | 1,247,284 | | |
| Informatica Corp. (a) | | | 145,398 | | | | 1,875,634 | | |
| Micros Systems, Inc. (a) | | | 125,400 | | | | 2,016,432 | | |
| Net 1 UEPS Technologies, Inc. (a) | | | 159,215 | | | | 2,303,841 | | |
| Sybase, Inc. (a) | | | 98,785 | | | | 2,684,976 | | |
| Wind River Systems, Inc. (a) | | | 243,110 | | | | 1,835,481 | | |
| Software Total | | | 15,028,973 | | |
| Information Technology Total | | | 56,274,239 | | |
| Materials – 2.5% | |
| Chemicals – 1.3% | |
| Koppers Holdings, Inc. | | | 86,266 | | | | 1,152,514 | | |
| NewMarket Corp. | | | 35,930 | | | | 1,242,100 | | |
| Solutia, Inc. (a) | | | 178,830 | | | | 670,612 | | |
| Chemicals Total | | | 3,065,226 | | |
| Construction Materials – 0.1% | |
| Texas Industries, Inc. | | | 20,370 | | | | 327,957 | | |
| Construction Materials Total | | | 327,957 | | |
| Containers & Packaging – 0.8% | |
| Greif, Inc., Class A | | | 60,240 | | | | 1,852,380 | | |
| Containers & Packaging Total | | | 1,852,380 | | |
| Metals & Mining – 0.3% | |
| Compass Minerals International, Inc. | | | 13,810 | | | | 721,158 | | |
| Metals & Mining Total | | | 721,158 | | |
| Materials Total | | | 5,966,721 | | |
| Telecommunication Services – 1.6% | |
| Diversified Telecommunication Services – 0.4% | |
| tw telecom, Inc. (a) | | | 114,920 | | | | 923,957 | | |
| Diversified Telecommunication Services Total | | | 923,957 | | |
See Accompanying Notes to Financial Statements.
78
Columbia Small Cap Growth Fund II
February 28, 2009
| Common Stocks (continued) | |
| | | Shares | | Value ($) | |
| Wireless Telecommunication Services – 1.2% | |
| Syniverse Holdings, Inc. (a) | | | 190,846 | | | | 2,887,500 | | |
| Wireless Telecommunication Services Total | | | 2,887,500 | | |
| Telecommunication Services Total | | | 3,811,457 | | |
| Utilities – 0.8% | |
| Electric Utilities – 0.8% | |
| ITC Holdings Corp. | | | 52,050 | | | | 1,922,206 | | |
| Electric Utilities Total | | | 1,922,206 | | |
| Utilities Total | | | 1,922,206 | | |
Total Common Stocks
(cost of $338,464,183) | | | 234,561,227 | | |
| Short-Term Obligation – 1.3% | |
| | | Par ($) | | | |
Repurchase agreement with
Fixed Income Clearing Corp.,
dated 02/27/09, due 03/02/09
at 0.190%, collateralized by a
U.S. Treasury Obligation
maturing 05/15/16, market value
$3,194,912 (repurchase
proceeds $3,128,050) | | | 3,128,000 | | | | 3,128,000 | | |
Total Short-Term Obligation
(cost of $3,128,000) | | | 3,128,000 | | |
Total Investments – 99.2%
(cost of $341,592,183) (b) | | | 237,689,227 | | |
| Other Assets & Liabilities, Net – 0.8% | | | 1,912,665 | | |
| Net Assets – 100.0% | | | 239,601,892 | | |
Notes to Investment Portfolio:
(a) Non-income producing security.
(b) Cost for federal income tax purposes is $344,417,429.
At February 28, 2009, the Fund held investments in the following sectors:
| Sector (Unaudited) | | % of
Net Assets | |
| Health Care | | | 25.5 | | |
| Information Technology | | | 23.5 | | |
| Industrials | | | 17.0 | | |
| Consumer Discretionary | | | 13.0 | | |
| Energy | | | 5.9 | | |
| Financials | | | 5.0 | | |
| Consumer Staples | | | 3.1 | | |
| Materials | | | 2.5 | | |
| Telecommunication Services | | | 1.6 | | |
| Utilities | | | 0.8 | | |
| | | | 97.9 | | |
| Short-Term Obligation | | | 1.3 | | |
| Other Assets & Liabilities, Net | | | 0.8 | | |
| | | | 100.0 | | |
For the year ended February 28, 2009, transactions in written option contracts were as follows:
| | | Number of
contracts | | Premium
received | |
| Options outstanding at February 29, 2008 | | | – | | | $ | – | | |
| Options written | | | 843 | | | | 119,637 | | |
Options terminated in closing
purchase transactions | | | (328 | ) | | | (11,152 | ) | |
| Options exercised | | | – | | | | – | | |
| Options expired | | | (515 | ) | | | (108,485 | ) | |
| Options outstanding at February 28, 2009 | | | – | | | $ | – | | |
| Acronym | | Name | |
| ADR | | American Depositary Receipt | |
|
See Accompanying Notes to Financial Statements.
79
Statements of Assets and Liabilities – Stock Funds
February 28, 2009
| | | ($) | | ($) | | ($) | | ($) | | ($) | |
| | | Columbia
Convertible
Securities
Fund | | Columbia
Large Cap
Value
Fund | | Columbia
Mid Cap
Value
Fund | | Columbia
Small Cap
Value
Fund II | | Columbia
Marsico
Growth
Fund | |
| Assets | |
| Unaffiliated investments, at identified cost | | | 437,561,106 | | | | 2,288,265,992 | | | | 4,341,078,435 | | | | 1,280,978,871 | | | | 3,451,076,600 | | |
| Affiliated investments, at identified cost | | | 3,626,532 | | | | — | | | | — | | | | — | | | | — | | |
| Repurchase agreements, at identified cost | | | 34,975,000 | | | | 9,634,000 | | | | 55,722,000 | | | | 34,571,000 | | | | 132,385,000 | | |
| Total investments, at cost | | | 476,162,638 | | | | 2,297,899,992 | | | | 4,396,800,435 | | | | 1,315,549,871 | | | | 3,583,461,600 | | |
| Unaffiliated investments, at value | | | 358,154,747 | | | | 1,729,905,537 | | | | 2,720,838,993 | | | | 783,052,044 | | | | 2,981,387,498 | | |
| Affiliated investments, at value | | | 2,045,250 | | | | — | | | | — | | | | — | | | | — | | |
| Repurchase agreements, at value | | | 34,975,000 | | | | 9,634,000 | | | | 55,722,000 | | | | 34,571,000 | | | | 132,385,000 | | |
| Total investments, at value | | | 395,174,997 | | | | 1,739,539,537 | | | | 2,776,560,993 | | | | 817,623,044 | | | | 3,113,772,498 | | |
| Cash | | | 239 | | | | 562 | | | | 333 | | | | 851 | | | | 886 | | |
| Receivable for: | |
| Investments sold | | | 2,499,658 | | | | 6,256,916 | | | | 2,398,140 | | | | 16,744,228 | | | | 49,288,821 | | |
| Fund shares sold | | | 207,494 | | | | 3,374,799 | | | | 6,127,279 | | | | 3,886,343 | | | | 6,101,569 | | |
| Dividends | | | 440,256 | | | | 6,277,908 | | | | 7,685,214 | | | | 1,167,447 | | | | 9,131,407 | | |
| Interest | | | 2,345,499 | | | | 112 | | | | 115,317 | | | | 403 | | | | 1,544 | | |
| Foreign tax reclaims | | | — | | | | — | | | | — | | | | — | | | | — | | |
| Trustees' deferred compensation plan | | | — | | | | 54,556 | | | | 36,658 | | | | — | | | | — | | |
| Other assets | | | 6,500 | | | | 34,980 | | | | 53,431 | | | | 16,097 | | | | 107,272 | | |
| Total Assets | | | 400,674,643 | | | | 1,755,539,370 | | | | 2,792,977,365 | | | | 839,438,413 | | | | 3,178,403,997 | | |
| Liabilities | |
Written options, at value (premium of $—, $—, $—, $—, $—,
$94,079, $—, $— and $—, respectively) | | | — | | | | — | | | | — | | | | — | | | | — | | |
| Payable for: | |
| Investments purchased | | | 3,766,647 | | | | 9,183,823 | | | | — | | | | 20,461,680 | | | | 6,224,242 | | |
| Fund shares repurchased | | | 945,903 | | | | 5,631,082 | | | | 7,379,632 | | | | 1,636,015 | | | | 15,920,105 | | |
| Investment advisory fee | | | 216,830 | | | | 764,794 | | | | 1,290,444 | | | | 472,582 | | | | 1,695,700 | | |
| Administration fee | | | 49,242 | | | | 231,328 | | | | 387,961 | | | | 106,967 | | | | 570,425 | | |
| Transfer agent fee | | | 29,315 | | | | 516,904 | | | | 1,271,140 | | | | 385,157 | | | | 1,157,261 | | |
| Trustees' fees | | | 59,143 | | | | 84,358 | | | | 28,842 | | | | 30,266 | | | | 102,413 | | |
| Pricing and bookkeeping fees | | | 9,764 | | | | 11,854 | | | | 11,920 | | | | 11,939 | | | | 12,276 | | |
| Custody fee | | | 6,999 | | | | 12,891 | | | | 13,729 | | | | 6,415 | | | | 43,199 | | |
| Distribution and service fees | | | 77,833 | | | | 288,369 | | | | 448,930 | | | | 79,684 | | | | 685,971 | | |
| Reports to shareholders | | | 141,486 | | | | 195,842 | | | | 246,238 | | | | 72,855 | | | | 344,507 | | |
| Chief compliance officer expenses | | | 132 | | | | 332 | | | | 304 | | | | 186 | | | | 396 | | |
| Trustees' deferred compensation plan | | | — | | | | 54,556 | | | | 36,658 | | | | — | | | | — | | |
| Other liabilities | | | 185,159 | | | | 57,747 | | | | 48,589 | | | | 55,539 | | | | 54,442 | | |
| Total Liabilities | | | 5,488,453 | | | | 17,033,880 | | | | 11,164,387 | | | | 23,319,285 | | | | 26,810,937 | | |
| Net Assets | | | 395,186,190 | | | | 1,738,505,490 | | | | 2,781,812,978 | | | | 816,119,128 | | | | 3,151,593,060 | | |
| Net Assets Consist of | |
| Paid-in capital | | | 603,811,343 | | | | 3,010,265,486 | | | | 5,090,750,323 | | | | 1,537,387,629 | | | | 5,082,892,972 | | |
| Undistributed (Overdistributed) net investment income | | | 2,244,719 | | | | 4,361,462 | | | | (48,094 | ) | | | — | | | | 14,420,279 | | |
| Accumulated net investment loss | | | — | | | | — | | | | — | | | | — | | | | — | | |
| Accumulated net realized loss | | | (129,882,231 | ) | | | (717,761,003 | ) | | | (688,649,809 | ) | | | (223,341,674 | ) | | | (1,476,030,924 | ) | |
| Net unrealized appreciation (depreciation) on: | |
| Investments | | | (80,987,641 | ) | | | (558,360,455 | ) | | | (1,620,239,442 | ) | | | (497,926,827 | ) | | | (469,689,102 | ) | |
| Foreign currency translations | | | — | | | | — | | | | — | | | | — | | | | (165 | ) | |
| Written options | | | — | | | | — | | | | — | | | | — | | | | — | | |
| Net Assets | | | 395,186,190 | | | | 1,738,505,490 | | | | 2,781,812,978 | | | | 816,119,128 | | | | 3,151,593,060 | | |
See Accompanying Notes to Financial Statements.
80
| | | ($) | | ($) | | ($) | | ($) | |
| | | Columbia
Large Cap
Core
Fund | | Columbia
Marsico
Focused Equities
Fund | | Columbia
Marsico 21st
Century
Fund | | Columbia
Small Cap
Growth
Fund II | |
| Assets | |
| Unaffiliated investments, at identified cost | | | 970,551,566 | | | | 2,763,966,950 | | | | 4,088,151,730 | | | | 338,464,183 | | |
| Affiliated investments, at identified cost | | | — | | | | — | | | | 310,578,001 | | | | — | | |
| Repurchase agreements, at identified cost | | | 1,626,000 | | | | 67,123,000 | | | | 417,778,000 | | | | 3,128,000 | | |
| Total investments, at cost | | | 972,177,566 | | | | 2,831,089,950 | | | | 4,816,507,731 | | | | 341,592,183 | | |
| Unaffiliated investments, at value | | | 807,881,842 | | | | 2,472,879,352 | | | | 3,246,420,801 | | | | 234,561,227 | | |
| Affiliated investments, at value | | | — | | | | — | | | | 83,734,278 | | | | — | | |
| Repurchase agreements, at value | | | 1,626,000 | | | | 67,123,000 | | | | 417,778,000 | | | | 3,128,000 | | |
| Total investments, at value | | | 809,507,842 | | | | 2,540,002,352 | | | | 3,747,933,079 | | | | 237,689,227 | | |
| Cash | | | 22 | | | | 85 | | | | 149 | | | | 739 | | |
| Receivable for: | |
| Investments sold | | | 43,317,018 | | | | 22,704,924 | | | | 3,023,547 | | | | 3,753,621 | | |
| Fund shares sold | | | 3,661,256 | | | | 3,249,975 | | | | 3,707,207 | | | | 2,898,340 | | |
| Dividends | | | 3,127,630 | | | | 8,109,798 | | | | 4,852,867 | | | | 73,391 | | |
| Interest | | | 19 | | | | 783 | | | | 4,874 | | | | 33 | | |
| Foreign tax reclaims | | | 5,471 | | | | — | | | | 103,565 | | | | — | | |
| Trustees' deferred compensation plan | | | — | | | | — | | | | — | | | | 20,888 | | |
| Other assets | | | 15,111 | | | | 47,425 | | | | 82,913 | | | | 54,031 | | |
| Total Assets | | | 859,634,369 | | | | 2,574,115,342 | | | | 3,759,708,201 | | | | 244,490,270 | | |
| Liabilities | |
Written options, at value (premium of $—, $—, $—, $—, $—,
$94,079, $—, $— and $—, respectively) | | | 57,200 | | | | — | | | | — | | | | — | | |
| Payable for: | |
| Investments purchased | | | 42,120,008 | | | | 48,628,022 | | | | 135,037,354 | | | | 3,421,326 | | |
| Fund shares repurchased | | | 3,752,081 | | | | 11,527,623 | | | | 19,557,994 | | | | 1,103,606 | | |
| Investment advisory fee | | | 393,641 | | | | 1,373,865 | | | | 1,922,645 | | | | 141,304 | | |
| Administration fee | | | 104,065 | | | | 449,963 | | | | 656,484 | | | | 17,515 | | |
| Transfer agent fee | | | 129,577 | | | | 903,137 | | | | 1,844,457 | | | | 32,519 | | |
| Trustees' fees | | | 66,906 | | | | 54,508 | | | | 37,920 | | | | 45,508 | | |
| Pricing and bookkeeping fees | | | 12,485 | | | | 12,133 | | | | 12,276 | | | | 6,497 | | |
| Custody fee | | | 6,658 | | | | 31,884 | | | | 47,787 | | | | 2,382 | | |
| Distribution and service fees | | | 24,476 | | | | 581,915 | | | | 1,061,080 | | | | 24,286 | | |
| Reports to shareholders | | | 41,805 | | | | 424,253 | | | | 806,345 | | | | 28,545 | | |
| Chief compliance officer expenses | | | 226 | | | | 338 | | | | 591 | | | | 115 | | |
| Trustees' deferred compensation plan | | | — | | | | — | | | | — | | | | 20,888 | | |
| Other liabilities | | | 47,869 | | | | 53,272 | | | | 46,297 | | | | 43,887 | | |
| Total Liabilities | | | 46,756,997 | | | | 64,040,913 | | | | 161,031,230 | | | | 4,888,378 | | |
| Net Assets | | | 812,877,372 | | | | 2,510,074,429 | | | | 3,598,676,971 | | | | 239,601,892 | | |
| Net Assets Consist of | |
| Paid-in capital | | | 1,289,188,571 | | | | 3,558,264,879 | | | | 7,570,386,975 | | | | 464,642,162 | | |
| Undistributed (Overdistributed) net investment income | | | 4,797,751 | | | | 3,795,338 | | | | 69,338 | | | | — | | |
| Accumulated net investment loss | | | — | | | | — | | | | — | | | | (21,025 | ) | |
| Accumulated net realized loss | | | (318,475,267 | ) | | | (760,898,064 | ) | | | (2,903,194,180 | ) | | | (121,116,289 | ) | |
| Net unrealized appreciation (depreciation) on: | |
| Investments | | | (162,669,724 | ) | | | (291,087,598 | ) | | | (1,068,574,652 | ) | | | (103,902,956 | ) | |
| Foreign currency translations | | | (838 | ) | | | (126 | ) | | | (10,510 | ) | | | — | | |
| Written options | | | 36,879 | | | | — | | | | — | | | | — | | |
| Net Assets | | �� | 812,877,372 | | | | 2,510,074,429 | | | | 3,598,676,971 | | | | 239,601,892 | | |
See Accompanying Notes to Financial Statements.
81
Statements of Assets and Liabilities – Stock Funds
February 28, 2009 (continued)
| | | Columbia
Convertible
Securities
Fund | | Columbia
Large Cap
Value
Fund | | Columbia
Mid Cap
Value
Fund | | Columbia
Small Cap
Value
Fund II | | Columbia
Marsico
Growth
Fund | |
| Class A | |
| Net assets | | $ | 154,986,578 | | | $ | 672,425,970 | | | $ | 966,439,772 | | | $ | 235,871,142 | | | $ | 1,383,437,952 | | |
| Shares outstanding | | | 15,601,175 | | | | 96,060,470 | | | | 140,709,689 | | | | 34,981,199 | | | | 122,462,982 | | |
| Net asset value per share (a) | | $ | 9.93 | | | $ | 7.00 | | | $ | 6.87 | | | $ | 6.74 | | | $ | 11.30 | | |
| Maximum sales charge | | | 5.75 | % | | | 5.75 | % | | | 5.75 | % | | | 5.75 | % | | | 5.75 | % | |
| Maximum offering price per share (b) | | $ | 10.54 | | | $ | 7.43 | | | $ | 7.29 | | | $ | 7.15 | | | $ | 11.99 | | |
| Class B | |
| Net assets | | $ | 31,792,390 | | | $ | 127,488,612 | | | $ | 66,254,380 | | | $ | 2,373,100 | | | $ | 44,407,261 | | |
| Shares outstanding | | | 3,253,580 | | | | 18,881,122 | | | | 9,851,299 | | | | 365,473 | | | | 4,259,691 | | |
| Net asset value and offering price per share (a) | | $ | 9.77 | | | $ | 6.75 | | | $ | 6.73 | | | $ | 6.49 | | | $ | 10.42 | | |
| Class C | |
| Net assets | | $ | 18,239,047 | | | $ | 31,090,838 | | | $ | 144,369,899 | | | $ | 22,159,199 | | | $ | 384,024,814 | | |
| Shares outstanding | | | 1,840,393 | | | | 4,603,637 | | | | 21,388,741 | | | | 3,415,412 | | | | 36,789,311 | | |
| Net asset value and offering price per share (a) | | $ | 9.91 | | | $ | 6.75 | | | $ | 6.75 | | | $ | 6.49 | | | $ | 10.44 | | |
| Class R | |
| Net assets | | | — | | | $ | 147,455 | | | $ | 145,227,394 | | | $ | 14,764,936 | | | $ | 9,940,876 | | |
| Shares outstanding | | | — | | | | 21,082 | | | | 21,153,292 | | | | 2,195,796 | | | | 887,640 | | |
| Net asset value, offering and redemption price per share | | | — | | | $ | 6.99 | | | $ | 6.87 | | | $ | 6.72 | | | $ | 11.20 | | |
| Class Z | |
| Net assets | | $ | 190,168,175 | | | $ | 907,352,615 | | | $ | 1,459,521,533 | | | $ | 540,950,751 | | | $ | 1,329,782,157 | | |
| Shares outstanding | | | 19,135,267 | | | | 129,391,725 | | | | 212,230,488 | | | | 79,782,545 | | | | 115,920,176 | | |
| Net asset value, offering and redemption price per share | | $ | 9.94 | | | $ | 7.01 | | | $ | 6.88 | | | $ | 6.78 | | | $ | 11.47 | | |
(a) Redemption price per share is equal to net asset value less any applicable contingent deferred sales charge.
(b) On sales of $50,000 or more the offering price is reduced.
See Accompanying Notes to Financial Statements.
82
| | | Columbia
Large Cap
Core
Fund | | Columbia
Marsico
Focused Equities
Fund | | Columbia
Marsico 21st
Century
Fund | | Columbia
Small Cap
Growth
Fund II | |
| Class A | |
| Net assets | | $ | 95,713,770 | | | $ | 1,312,381,831 | | | $ | 1,967,386,374 | | | $ | 90,646,805 | | |
| Shares outstanding | | | 12,035,160 | | | | 102,862,217 | | | | 268,973,212 | | | | 15,143,423 | | |
| Net asset value per share (a) | | $ | 7.95 | | | $ | 12.76 | | | $ | 7.31 | | | $ | 5.99 | | |
| Maximum sales charge | | | 5.75 | % | | | 5.75 | % | | | 5.75 | % | | | 5.75 | % | |
| Maximum offering price per share (b) | | $ | 8.44 | | | $ | 13.54 | | | $ | 7.76 | | | $ | 6.36 | | |
| Class B | |
| Net assets | | $ | 3,299,964 | | | $ | 64,936,844 | | | $ | 95,889,070 | | | $ | 3,362,275 | | |
| Shares outstanding | | | 428,270 | | | | 5,501,768 | | | | 13,866,433 | | | | 633,507 | | |
| Net asset value and offering price per share (a) | | $ | 7.71 | | | $ | 11.80 | | | $ | 6.92 | | | $ | 5.31 | | |
| Class C | |
| Net assets | | $ | 1,559,193 | | | $ | 258,190,855 | | | $ | 622,097,525 | | | $ | 2,081,366 | | |
| Shares outstanding | | | 202,445 | | | | 21,808,062 | | | | 89,974,710 | | | | 382,745 | | |
| Net asset value and offering price per share (a) | | $ | 7.70 | | | $ | 11.84 | | | $ | 6.91 | | | $ | 5.44 | | |
| Class R | |
| Net assets | | | — | | | | — | | | $ | 42,429,461 | | | | — | | |
| Shares outstanding | | | — | | | | — | | | | 5,816,571 | | | | — | | |
| Net asset value, offering and redemption price per share | | | — | | | | — | | | $ | 7.29 | | | | — | | |
| Class Z | |
| Net assets | | $ | 712,304,445 | | | $ | 874,564,899 | | | $ | 870,874,541 | | | $ | 143,511,446 | | |
| Shares outstanding | | | 89,861,501 | | | | 67,165,783 | | | | 117,052,808 | | | | 22,944,583 | | |
| Net asset value, offering and redemption price per share | | $ | 7.93 | | | $ | 13.02 | | | $ | 7.44 | | | $ | 6.25 | | |
See Accompanying Notes to Financial Statements.
83
Statements of Operations – Stock Funds
For the Year Ended February 28, 2009
| | | ($) | | ($) | | ($) | | ($) | | ($) | |
| | | Columbia
Convertible
Securities
Fund | | Columbia
Large Cap
Value
Fund | | Columbia
Mid Cap
Value
Fund | | Columbia
Small Cap
Value
Fund II | | Columbia
Marsico
Growth
Fund | |
| Investment Income | |
| Dividends | | | 8,701,650 | | | | 76,340,999 | | | | 84,603,568 | | | | 27,490,135 | | | | 23,405,984 | | |
| Dividends from affiliates | | | — | | | | — | | | | — | | | | — | | | | — | | |
| Interest | | | 11,699,182 | | | | 515,921 | | | | 2,684,750 | | | | 693,149 | | | | 110,273 | | |
| Interest from affiliates | | | 40,556 | | | | — | | | | — | | | | — | | | | — | | |
| Securities lending | | | — | | | | 803,072 | | | | 1,069,657 | | | | — | | | | — | | |
| Foreign taxes withheld | | | (9,412 | ) | | | (9,353 | ) | | | (78,809 | ) | | | — | | | | — | | |
| Allocated from Master Portfolio (a): | |
| Dividends | | | — | | | | — | | | | — | | | | — | | | | 55,450,680 | | |
| Interest | | | — | | | | — | | | | — | | | | — | | | | 6,096,768 | | |
| Foreign taxes withheld | | | — | | | | — | | | | — | | | | — | | | | (600,869 | ) | |
| Expenses (b) | | | — | | | | — | | | | — | | | | — | | | | (29,840,798 | ) | |
| Total Investment Income | | | 20,431,976 | | | | 77,650,639 | | | | 88,279,166 | | | | 28,183,284 | | | | 54,622,038 | | |
| Expenses | |
| Investment advisory fee | | | 3,723,034 | | | | 13,798,451 | | | | 22,018,205 | | | | 7,949,823 | | | | 7,022,977 | | |
| Administration fee | | | 867,215 | | | | 4,741,946 | | | | 6,836,190 | | | | 1,901,446 | | | | 7,346,572 | | |
| Distribution fee: | |
| Class B | | | 399,154 | | | | 1,844,022 | | | | 996,979 | | | | 33,107 | | | | 630,657 | | |
| Class C | | | 215,590 | | | | 403,736 | | | | 1,971,349 | | | | 321,000 | | | | 5,241,321 | | |
| Class R | | | — | | | | 1,111 | | | | 629,252 | | | | 101,224 | | | | 65,161 | | |
| Service fee: | |
| Class A | | | 547,551 | | | | 2,642,082 | | | | 3,844,990 | | | | 960,498 | | | | 6,310,819 | | |
| Class B | | | 133,058 | | | | 616,274 | | | | 330,827 | | | | 11,033 | | | | 210,218 | | |
| Class C | | | 71,947 | | | | 134,812 | | | | 653,616 | | | | 107,117 | | | | 1,747,107 | | |
| Transfer agent fee | | | 718,293 | | | | 4,875,119 | | | | 7,211,488 | | | | 1,848,111 | | | | 7,199,191 | | |
| Pricing and bookkeeping fees | | | 136,127 | | | | 141,105 | | | | 141,486 | | | | 141,609 | | | | 60,038 | | |
| Trustees' fees | | | (12,717 | ) | | | (14,917 | ) | | | 1,327 | | | | 1,410 | | | | (33,685 | ) | |
| Custody fee | | | 33,797 | | | | 74,162 | | | | 98,738 | | | | 52,421 | | | | 47,465 | | |
| Chief compliance officer expenses | | | 821 | | | | 1,645 | | | | 2,091 | | | | 1,081 | | | | 2,582 | | |
| Other expenses | | | 283,619 | | | | 792,759 | | | | 1,617,265 | | | | 513,148 | | | | 1,391,223 | | |
| Expenses before interest expense | | | 7,117,489 | | | | 30,052,307 | | | | 46,353,803 | | | | 13,943,028 | | | | 37,241,646 | | |
| Interest expense | | | 188 | | | | 1,614 | | | | — | | | | — | | | | — | | |
| Total Expenses | | | 7,117,677 | | | | 30,053,921 | | | | 46,353,803 | | | | 13,943,028 | | | | 37,241,646 | | |
| Fees waived by transfer agent | | | (178,957 | ) | | | (1,428,137 | ) | | | — | | | | — | | | | (922,419 | ) | |
Fees waived or expenses reimbursed by investment advisor
and/or administrator | | | — | | | | (200,002 | ) | | | — | | | | — | | | | — | | |
| Expense reductions | | | (5,896 | ) | | | (45,392 | ) | | | (34,722 | ) | | | (4,450 | ) | | | (5,324 | ) | |
| Net Expenses | | | 6,932,824 | | | | 28,380,390 | | | | 46,319,081 | | | | 13,938,578 | | | | 36,313,903 | | |
| Net Investment Income (Loss) | | | 13,499,152 | | | | 49,270,249 | | | | 41,960,085 | | | | 14,244,706 | | | | 18,308,135 | | |
(a) Allocated from Master Portfolio for the period March 1, 2008 through November 9, 2008.
(b) Expenses allocated from Master Portfolio include the Fund's pro-rata portion of the master portfolio's investment advisory, administration, pricing and bookkeeping, Trustees' fees and other expenses.
See Accompanying Notes to Financial Statements.
84
| | | ($) | | ($) | | ($) | | ($) | |
| | | Columbia
Large Cap
Core
Fund | | Columbia
Marsico
Focused Equities
Fund | | Columbia
Marsico 21st
Century
Fund | | Columbia
Small Cap
Growth
Fund II | |
| Investment Income | |
| Dividends | | | 27,762,098 | | | | 58,885,965 | | | | 82,337,459 | | | | 1,720,639 | | |
| Dividends from affiliates | | | — | | | | — | | | | 564,942 | | | | — | | |
| Interest | | | 127,886 | | | | 5,495,390 | | | | 13,383,647 | | | | 169,479 | | |
| Interest from affiliates | | | — | | | | — | | | | — | | | | — | | |
| Securities lending | | | 131,448 | | | | — | | | | — | | | | — | | |
| Foreign taxes withheld | | | (136,645 | ) | | | (334,322 | ) | | | (1,851,699 | ) | | | — | | |
| Allocated from Master Portfolio (a): | |
| Dividends | | | — | | | | — | | | | — | | | | — | | |
| Interest | | | — | | | | — | | | | — | | | | — | | |
| Foreign taxes withheld | | | — | | | | — | | | | — | | | | — | | |
| Expenses (b) | | | — | | | | — | | | | — | | | | — | | |
| Total Investment Income | | | 27,884,787 | | | | 64,047,033 | | | | 94,434,349 | | | | 1,890,118 | | |
| Expenses | |
| Investment advisory fee | | | 6,940,605 | | | | 24,822,825 | | | | 41,722,631 | | | | 2,821,583 | | |
| Administration fee | | | 1,967,356 | | | | 8,469,821 | | | | 15,005,283 | | | | 372,770 | | |
| Distribution fee: | |
| Class B | | | 57,015 | | | | 963,686 | | | | 1,318,559 | | | | 50,602 | | |
| Class C | | | 13,668 | | | | 3,162,660 | | | | 8,778,460 | | | | 25,203 | | |
| Class R | | | — | | | | — | | | | 266,232 | | | | — | | |
| Service fee: | |
| Class A | | | 364,045 | | | | 5,677,780 | | | | 10,315,683 | | | | 379,609 | | |
| Class B | | | 18,874 | | | | 319,195 | | | | 439,322 | | | | 16,868 | | |
| Class C | | | 4,569 | | | | 1,054,217 | | | | 2,925,549 | | | | 8,401 | | |
| Transfer agent fee | | | 1,798,737 | | | | 6,553,766 | | | | 11,226,971 | | | | 731,527 | | |
| Pricing and bookkeeping fees | | | 144,115 | | | | 143,367 | | | | 144,160 | | | | 100,308 | | |
| Trustees' fees | | | (6,287 | ) | | | (2,549 | ) | | | 4,168 | | | | (3,969 | ) | |
| Custody fee | | | 41,838 | | | | 246,620 | | | | 507,510 | | | | 24,628 | | |
| Chief compliance officer expenses | | | 1,113 | | | | 2,073 | | | | 3,359 | | | | 744 | | |
| Other expenses | | | 294,110 | | | | 1,420,254 | | | | 2,939,683 | | | | 272,944 | | |
| Expenses before interest expense | | | 11,639,758 | | | | 52,833,715 | | | | 95,597,570 | | | | 4,801,218 | | |
| Interest expense | | | 450 | | | | — | | | | — | | | | 194 | | |
| Total Expenses | | | 11,640,208 | | | | 52,833,715 | | | | 95,597,570 | | | | 4,801,412 | | |
| Fees waived by transfer agent | | | (658 | ) | | | (1,884,767 | ) | | | (1,902,656 | ) | | | (212,249 | ) | |
Fees waived or expenses reimbursed by investment advisor
and/or administrator | | | — | | | | (224,668 | ) | | | (415,508 | ) | | | — | | |
| Expense reductions | | | (4,115 | ) | | | (10,930 | ) | | | (7,030 | ) | | | (23,623 | ) | |
| Net Expenses | | | 11,635,435 | | | | 50,713,350 | | | | 93,272,376 | | | | 4,565,540 | | |
| Net Investment Income (Loss) | | | 16,249,352 | | | | 13,333,683 | | | | 1,161,973 | | | | (2,675,422 | ) | |
See Accompanying Notes to Financial Statements.
85
Statements of Operations (continued) – Stock Funds
For the Year Ended February 28, 2009
| | | ($) | | ($) | | ($) | | ($) | | ($) | |
| | | Columbia
Convertible
Securities
Fund | | Columbia
Large Cap
Value
Fund | | Columbia
Mid Cap
Value
Fund | | Columbia
Small Cap
Value
Fund II | | Columbia
Marsico
Growth
Fund | |
Net Realized and Unrealized Gain (Loss) on Investments,
Foreign Currency and Written Options | |
| Net realized gain (loss) on: | |
| Unaffiliated investments | | | (129,315,633 | ) | | | (611,241,428 | ) | | | (608,782,997 | ) | | | (209,071,640 | ) | | | (512,183,428 | ) | |
| Affiliated investments | | | — | | | | — | | | | — | | | | — | | | | — | | |
| Foreign currency transactions | | | (47,037 | ) | | | — | | | | (21,624 | ) | | | — | | | | (11,066 | ) | |
| Written options | | | 326,403 | | | | (1,424,616 | ) | | | 5,444,600 | | | | — | | | | — | | |
| Allocated from Master Portfolio (a): | |
| Investments | | | — | | | | — | | | | — | | | | — | | | | (757,554,576 | ) | |
| Foreign currency transactions | | | — | | | | — | | | | — | | | | — | | | | 45,480 | | |
| Net realized loss | | | (129,036,267 | ) | | | (612,666,044 | ) | | | (603,360,021 | ) | | | (209,071,640 | ) | | | (1,269,703,590 | ) | |
| Net change in unrealized appreciation (depreciation) on: | |
| Investments | | | (87,305,705 | ) | | | (812,203,175 | ) | | | (1,841,821,869 | ) | | | (448,879,414 | ) | | | (228,610,603 | ) | |
| Written options | | | — | | | | — | | | | — | | | | — | | | | — | | |
| Foreign currency translations | | | 2 | | | | — | | | | — | | | | — | | | | (165 | ) | |
| Allocated from Master Portfolio on investments (a) | | | — | | | | — | | | | — | | | | — | | | | (1,204,052,673 | ) | |
| Net change in unrealized appreciation (depreciation) | | | (87,305,703 | ) | | | (812,203,175 | ) | | | (1,841,821,869 | ) | | | (448,879,414 | ) | | | (1,432,663,441 | ) | |
| Net Loss | | | (216,341,970 | ) | | | (1,424,869,219 | ) | | | (2,445,181,890 | ) | | | (657,951,054 | ) | | | (2,702,367,031 | ) | |
| Net Decrease Resulting from Operations | | | (202,842,818 | ) | | | (1,375,598,970 | ) | | | (2,403,221,805 | ) | | | (643,706,348 | ) | | | (2,684,058,896 | ) | |
(a) Allocated from Master Portfolio for the period March 1, 2008 through November 9, 2008.
See Accompanying Notes to Financial Statements.
86
| | | ($) | | ($) | | ($) | | ($) | |
| | | Columbia
Large Cap
Core
Fund | | Columbia
Marsico
Focused Equities
Fund | | Columbia
Marsico 21st
Century
Fund | | Columbia
Small Cap
Growth
Fund II | |
Net Realized and Unrealized Gain (Loss) on Investments,
Foreign Currency and Written Options | |
| Net realized gain (loss) on: | |
| Unaffiliated investments | | | (324,114,620 | ) | | | (741,615,753 | ) | | | (2,662,113,956 | ) | | | (96,507,677 | ) | |
| Affiliated investments | | | — | | | | — | | | | (175,882,015 | ) | | | — | | |
| Foreign currency transactions | | | (15,096 | ) | | | 810 | | | | (598,392 | ) | | | — | | |
| Written options | | | 1,741,395 | | | | — | | | | — | | | | 85,197 | | |
| Allocated from Master Portfolio (a): | |
| Investments | | | — | | | | — | | | | — | | | | — | | |
| Foreign currency transactions | | | — | | | | — | | | | — | | | | — | | |
| Net realized loss | | | (322,388,321 | ) | | | (741,614,943 | ) | | | (2,838,594,363 | ) | | | (96,422,480 | ) | |
| Net change in unrealized appreciation (depreciation) on: | |
| Investments | | | (264,491,059 | ) | | | (1,125,212,229 | ) | | | (1,264,844,147 | ) | | | (92,844,643 | ) | |
| Written options | | | 17,309 | | | | — | | | | — | | | | — | | |
| Foreign currency translations | | | (838 | ) | | | (126 | ) | | | (63,529 | ) | | | — | | |
| Allocated from Master Portfolio on investments (a) | | | — | | | | — | | | | — | | | | — | | |
| Net change in unrealized appreciation (depreciation) | | | (264,474,588 | ) | | | (1,125,212,355 | ) | | | (1,264,907,676 | ) | | | (92,844,643 | ) | |
| Net Loss | | | (586,862,909 | ) | | | (1,866,827,298 | ) | | | (4,103,502,039 | ) | | | (189,267,123 | ) | |
| Net Decrease Resulting from Operations | | | (570,613,557 | ) | | | (1,853,493,615 | ) | | | (4,102,340,066 | ) | | | (191,942,545 | ) | |
See Accompanying Notes to Financial Statements.
87
Statements of Changes in Net Assets – Stock Funds
| Increase (Decrease) in Net Assets | | Columbia Convertible Securities Fund | | Columbia Large Cap Value Fund | | Columbia Mid Cap Value Fund | |
| | Year Ended
February 28,
2009 ($) | | Year Ended
February 29,
2008 ($) | | Year Ended
February 28,
2009 ($) | | Year Ended
February 29,
2008 ($) | | Year Ended
February 28,
2009 ($) | | Year Ended
February 29,
2008 ($) | |
| Operations | |
| Net investment income | | | 13,499,152 | | | | 18,807,277 | | | | 49,270,249 | | | | 58,979,507 | | | | 41,960,085 | | | | 36,652,784 | | |
Net realized gain (loss) on investments, foreign currency transactions
and written options | | | (129,036,267 | ) | | | 76,809,060 | | | | (612,666,044 | ) | | | 176,760,167 | | | | (603,360,021 | ) | | | (19,481,615 | ) | |
Net change in unrealized appreciation (depreciation)
on investments, foreign currency translations and written options | | | (87,305,703 | ) | | | (84,485,787 | ) | | | (812,203,175 | ) | | | (512,655,679 | ) | | | (1,841,821,869 | ) | | | (428,629,886 | ) | |
| Net increase (decrease) resulting from operations | | | (202,842,818 | ) | | | 11,130,550 | | | | (1,375,598,970 | ) | | | (276,916,005 | ) | | | (2,403,221,805 | ) | | | (411,458,717 | ) | |
| Distributions to Shareholders | |
| From net investment income: | |
| Class A | | | (5,270,952 | ) | | | (7,102,330 | ) | | | (19,145,155 | ) | | | (20,315,665 | ) | | | (14,592,923 | ) | | | (16,143,151 | ) | |
| Class B | | | (854,908 | ) | | | (1,392,641 | ) | | | (2,456,302 | ) | | | (3,512,010 | ) | | | (342,482 | ) | | | (681,123 | ) | |
| Class C | | | (458,548 | ) | | | (718,576 | ) | | | (544,756 | ) | | | (642,491 | ) | | | (716,943 | ) | | | (1,025,280 | ) | |
| Class R | | | — | | | | — | | | | (3,471 | ) | | | (203 | ) | | | (1,302,697 | ) | | | (180,097 | ) | |
| Class Z | | | (7,466,421 | ) | | | (13,568,291 | ) | | | (31,407,396 | ) | | | (38,940,277 | ) | | | (24,983,415 | ) | | | (25,696,921 | ) | |
| From net realized gains: | |
| Class A | | | (4,064,506 | ) | | | (25,069,229 | ) | | | — | | | | (152,456,911 | ) | | | — | | | | (88,780,917 | ) | |
| Class B | | | (1,034,439 | ) | | | (7,221,483 | ) | | | — | | | | (51,804,513 | ) | | | — | | | | (13,539,824 | ) | |
| Class C | | | (550,003 | ) | | | (3,680,029 | ) | | | — | | | | (9,707,160 | ) | | | — | | | | (17,827,694 | ) | |
| Class R | | | — | | | | — | | | | — | | | | (2,299 | ) | | | — | | | | (1,034,990 | ) | |
| Class Z | | | (5,220,906 | ) | | | (41,462,573 | ) | | | — | | | | (246,418,961 | ) | | | — | | | | (113,230,299 | ) | |
| From return of capital: | |
| Class A | | | — | | | | — | | | | — | | | | — | | | | (1,449,913 | ) | | | — | | |
| Class B | | | — | | | | — | | | | — | | | | — | | | | (124,768 | ) | | | — | | |
| Class C | | | — | | | | — | | | | — | | | | — | | | | (246,286 | ) | | | — | | |
| Class R | | | — | | | | — | | | | — | | | | — | | | | (118,045 | ) | | | — | | |
| Class Z | | | — | | | | — | | | | — | | | | — | | | | (1,910,378 | ) | | | — | | |
| Total distributions to shareholders | | | (24,920,683 | ) | | | (100,215,152 | ) | | | (53,557,080 | ) | | | (523,800,490 | ) | | | (45,787,850 | ) | | | (278,140,296 | ) | |
| Net Capital Stock Transactions | | | (152,638,001 | ) | | | (226,661,887 | ) | | | (417,626,088 | ) | | | 124,396,100 | | | | 900,396,673 | | | | 1,453,561,785 | | |
| Total increase (decrease) in net assets | | | (380,401,502 | ) | | | (315,746,489 | ) | | | (1,846,782,138 | ) | | | (676,320,395 | ) | | | (1,548,612,982 | ) | | | 763,962,772 | | |
| Net Assets | |
| Beginning of period | | | 775,587,692 | | | | 1,091,334,181 | | | | 3,585,287,628 | | | | 4,261,608,023 | | | | 4,330,425,960 | | | | 3,566,463,188 | | |
| End of period | | | 395,186,190 | | | | 775,587,692 | | | | 1,738,505,490 | | | | 3,585,287,628 | | | | 2,781,812,978 | | | | 4,330,425,960 | | |
| Undistributed (Overdistributed) net investment income at end of period | | | 2,244,719 | | | | 2,091,009 | | | | 4,361,462 | | | | 8,648,292 | | | | (48,094 | ) | | | (48,093 | ) | |
See Accompanying Notes to Financial Statements.
88
See Accompanying Notes to Financial Statements.
89
Statements of Changes in Net Assets – Stock Funds
| Increase (Decrease) in Net Assets | | Columbia Small Cap Value Fund II | | Columbia Marsico Growth Fund | |
| | | Year Ended
February 28,
2009 ($) | | Year Ended
February 29,
2008 ($) | | Year Ended
February 28,
2009 ($) | | Period
April 1, 2007
through
February 29,
2008 ($)(a) | | Year Ended
March 31,
2007 ($)(b)(c) | |
| Operations | |
| Net investment income (loss) | | | 14,244,706 | | | | 4,696,114 | | | | 18,308,135 | | | | 15,225,103 | | | | (2,372,427 | ) | |
| Net realized gain (loss) on: | |
Investments, foreign currency
transactions and written options | | | (209,071,640 | ) | | | 6,228,088 | | | | (512,194,494 | ) | | | — | | | | — | | |
Allocated from Master Portfolio
on investments and foreign
currency transactions | | | — | | | | — | | | | (757,509,096 | )(d) | | | (29,841,908 | ) | | | 14,262,414 | | |
Net change in unrealized
appreciation (depreciation) on: | |
Investments, foreign currency
translations and written options | | | (448,879,414 | ) | | | (118,437,521 | ) | | | (228,610,768 | ) | | | — | | | | — | | |
Allocated from Master Portfolio
on investments | | | — | | | | — | | | | (1,204,052,673 | )(d) | | | (19,917,690 | ) | | | 182,981,005 | | |
Net increase (decrease) resulting
from operations | | | (643,706,348 | ) | | | (107,513,319 | ) | | | (2,684,058,896 | ) | | | (34,534,495 | ) | | | 194,870,992 | | |
| Distributions to Shareholders | |
| From net investment income: | |
| Class A | | | (3,853,806 | ) | | | (1,007,789 | ) | | | (1,121,074 | ) | | | (1,572,499 | ) | | | — | | |
| Class B | | | (14,111 | ) | | | — | | | | — | | | | — | | | | — | | |
| Class C | | | (137,499 | ) | | | — | | | | — | | | | — | | | | — | | |
| Class R | | | (176,638 | ) | | | (9,454 | ) | | | — | | | | — | | | | — | | |
| Class Z | | | (10,573,772 | ) | | | (3,047,689 | ) | | | (10,691,108 | ) | | | (5,520,020 | ) | | | — | | |
| From net realized gains: | |
| Class A | | | — | | | | (9,010,697 | ) | | | — | | | | — | | | | — | | |
| Class B | | | — | | | | (170,971 | ) | | | — | | | | — | | | | — | | |
| Class C | | | — | | | | (1,232,463 | ) | | | — | | | | — | | | | — | | |
| Class R | | | — | | | | (226,728 | ) | | | — | | | | — | | | | — | | |
| Class Z | | | — | | | | (16,911,273 | ) | | | — | | | | — | | | | — | | |
| Total distributions to shareholders | | | (14,755,826 | ) | | | (31,617,064 | ) | | | (11,812,182 | ) | | | (7,092,519 | ) | | | — | | |
| Net Capital Stock Transactions | | | 386,461,833 | | | | 693,036,135 | | | | (533,595,368 | ) | | | 700,693,005 | | | | 1,245,140,560 | | |
| Total increase (decrease) in net assets | | | (272,000,341 | ) | | | 553,905,752 | | | | (3,229,466,446 | ) | | | 659,065,991 | | | | 1,440,011,552 | | |
| Net Assets | |
| Beginning of period | | | 1,088,119,469 | | | | 534,213,717 | | | | 6,381,059,506 | | | | 5,721,993,515 | | | | 4,281,981,963 | | |
| End of period | | | 816,119,128 | | | | 1,088,119,469 | | | | 3,151,593,060 | | | | 6,381,059,506 | | | | 5,721,993,515 | | |
Undistributed net investment
income at end of period | | | — | | | | 327,401 | | | | 14,420,279 | | | | 8,101,460 | | | | — | | |
(a) The Fund changed its fiscal year end from March 31 to February 29.
(b) On August 22, 2005, the Fund's Investor A, Investor B, Investor C and Primary A Shares were renamed Class A, Class B, Class C and Class Z shares, respectively.
(c) Class R shares commenced operations on January 23, 2006.
(d) Allocated from Master Portfolio for the period March 1, 2008 through November 9, 2008.
See Accompanying Notes to Financial Statements.
90
| Increase (Decrease) in Net Assets | | Columbia Large Cap Core Fund | |
| | | Year Ended
February 28,
2009 ($) | | Period
April 1, 2007
through
February 29,
2008 ($)(a) | | Year Ended
March 31,
2007 ($) | |
| Operations | |
| Net investment income (loss) | | | 16,249,352 | | | | 15,735,065 | | | | 19,077,951 | | |
| Net realized gain (loss) on: | |
Investments, foreign currency
transactions and written options | | | (322,388,321 | ) | | | — | | | | — | | |
Allocated from Master Portfolio
on investments and foreign
currency transactions | | | — | | | | 88,047,468 | | | | 99,693,173 | | |
Net change in unrealized
appreciation (depreciation) on: | |
Investments, foreign currency
translations and written options | | | (264,474,588 | ) | | | — | | | | — | | |
Allocated from Master Portfolio
on investments | | | — | | | | (125,208,595 | ) | | | 67,700,837 | | |
Net increase (decrease) resulting
from operations | | | (570,613,557 | ) | | | (21,426,062 | ) | | | 186,471,961 | | |
| Distributions to Shareholders | |
| From net investment income: | |
| Class A | | | (1,116,833 | ) | | | (1,681,067 | ) | | | (1,217,262 | ) | |
| Class B | | | (6,962 | ) | | | (3,091 | ) | | | — | | |
| Class C | | | (2,486 | ) | | | (421 | ) | | | — | | |
| Class R | | | — | | | | — | | | | — | | |
| Class Z | | | (13,375,007 | ) | | | (18,855,818 | ) | | | (14,355,861 | ) | |
| From net realized gains: | |
| Class A | | | (3,135,999 | ) | | | (9,451,221 | ) | | | — | | |
| Class B | | | (178,970 | ) | | | (975,308 | ) | | | — | | |
| Class C | | | (38,993 | ) | | | (127,164 | ) | | | — | | |
| Class R | | | — | | | | — | | | | — | | |
| Class Z | | | (23,631,658 | ) | | | (71,674,414 | ) | | | — | | |
| Total distributions to shareholders | | | (41,486,908 | ) | | | (102,768,504 | ) | | | (15,573,123 | ) | |
| Net Capital Stock Transactions | | | (48,603,594 | ) | | | (100,015,556 | ) | | | (67,657,359 | ) | |
| Total increase (decrease) in net assets | | | (660,704,059 | ) | | | (224,210,122 | ) | | | 103,241,479 | | |
| Net Assets | |
| Beginning of period | | | 1,473,581,431 | | | | 1,697,791,553 | | | | 1,594,550,074 | | |
| End of period | | | 812,877,372 | | | | 1,473,581,431 | | | | 1,697,791,553 | | |
Undistributed net investment
income at end of period | | | 4,797,751 | | | | 3,109,304 | | | | 7,923,504 | | |
See Accompanying Notes to Financial Statements.
91
Statements of Changes in Net Assets – Stock Funds
| Increase (Decrease) in Net Assets | | Columbia Marsico Focused Equities Fund | | Columbia Marsico
21st Century Fund | |
| | | Year Ended
February 28,
2009 ($) | | Period
April 1, 2007
through
February 29,
2008 ($)(a) | | Year Ended
March 31,
2007 ($) | | Year Ended
February 28,
2009 ($) | | Year Ended
February 29,
2008 ($) | |
| Operations | |
| Net investment income (loss) | | | 13,333,683 | | | | 1,932,428 | | | | (12,083,552 | ) | | | 1,161,973 | | | | 3,713,568 | | |
Net realized gain (loss) on investments, foreign currency transactions
and written options | | | (741,614,943 | ) | | | 260,532,250 | (b) | | | 108,564,189 | (b) | | | (2,838,594,363 | ) | | | 95,361,757 | | |
Net change in unrealized appreciation (depreciation) on investments
and foreign currency translations | | | (1,125,212,355 | ) | | | (264,190,430 | )(b) | | | 50,550,519 | (b) | | | (1,264,907,676 | ) | | | (101,168,377 | ) | |
| Net increase (decrease) resulting from operations | | | (1,853,493,615 | ) | | | (1,725,752 | ) | | | 147,031,156 | | | | (4,102,340,066 | ) | | | (2,093,052 | ) | |
| Distributions to Shareholders | |
| From net investment income: | |
| Class A | | | (5,115,178 | ) | | | — | | | | — | | | | — | | | | — | | |
| Class Z | | | (5,515,027 | ) | | | — | | | | — | | | | — | | | | — | | |
| From net realized gains: | |
| Class A | | | — | | | | (29,557,009 | ) | | | — | | | | — | | | | (144,234,091 | ) | |
| Class B | | | — | | | | (2,999,444 | ) | | | — | | | | — | | | | (7,389,354 | ) | |
| Class C | | | — | | | | (6,618,301 | ) | | | — | | | | — | | | | (40,106,834 | ) | |
| Class R | | | — | | | | — | | | | — | | | | — | | | | (862,368 | ) | |
| Class Z | | | — | | | | (15,214,419 | ) | | | — | | | | — | | | | (40,716,151 | ) | |
| From return of capital: | |
| Class A | | | — | | | | — | | | | — | | | | — | | | | (7,088,885 | ) | |
| Class B | | | — | | | | — | | | | — | | | | — | | | | (356,841 | ) | |
| Class C | | | — | | | | — | | | | — | | | | — | | | | (1,863,945 | ) | |
| Class R | | | — | | | | — | | | | — | | | | — | | | | (40,179 | ) | |
| Class Z | | | — | | | | — | | | | — | | | | — | | | | (2,037,395 | ) | |
| Total distributions to shareholders | | | (10,630,205 | ) | | | (54,389,173 | ) | | | — | | | | — | | | | (244,696,043 | ) | |
| Net Capital Stock Transactions | | | (154,351,441 | ) | | | (82,873,771 | ) | | | 394,435,941 | | | | (671,895,304 | ) | | | 4,589,786,604 | | |
| Redemption Fees | | | — | | | | — | | | | — | | | | 4,836 | | | | — | | |
| Total increase (decrease) in net assets | | | (2,018,475,261 | ) | | | (138,988,696 | ) | | | 541,467,097 | | | | (4,774,230,534 | ) | | | 4,342,997,509 | | |
| Net Assets | |
| Beginning of period | | | 4,528,549,690 | | | | 4,667,538,386 | | | | 4,126,071,289 | | | | 8,372,907,505 | | | | 4,029,909,996 | | |
| End of period | | | 2,510,074,429 | | | | 4,528,549,690 | | | | 4,667,538,386 | | | | 3,598,676,971 | | | | 8,372,907,505 | | |
| Undistributed (Overdistributed) net investment income at end of period | | | 3,795,338 | | | | 1,091,449 | | | | — | | | | 69,338 | | | | (494,242 | ) | |
| Accumulated net investment loss, at end of period | | | — | | | | — | | | | — | | | | — | | | | — | | |
(a) The Fund changed its fiscal year end from March 31 to February 29.
(b) Allocated from Master Portfolio.
See Accompanying Notes to Financial Statements.
92
| Increase (Decrease) in Net Assets | | Columbia Small Cap Growth Fund II | |
| | | Year Ended
February 28,
2009 ($) | | Period
April 1, 2007
through
February 29,
2008 ($)(a) | | Year Ended
March 31,
2007 ($) | |
| Operations | |
| Net investment income (loss) | | | (2,675,422 | ) | | | (3,901,658 | ) | | | (3,524,413 | ) | |
Net realized gain (loss) on investments, foreign currency transactions
and written options | | | (96,422,480 | ) | | | 65,006,047 | (b) | | | 80,035,024 | (b) | |
Net change in unrealized appreciation (depreciation) on investments
and foreign currency translations | | | (92,844,643 | ) | | | (83,341,513 | )(b) | | | (56,894,366 | )(b) | |
| Net increase (decrease) resulting from operations | | | (191,942,545 | ) | | | (22,237,124 | ) | | | 19,616,245 | | |
| Distributions to Shareholders | |
| From net investment income: | |
| Class A | | | — | | | | — | | | | — | | |
| Class Z | | | — | | | | — | | | | — | | |
| From net realized gains: | |
| Class A | | | — | | | | (39,414,514 | ) | | | (35,804,093 | ) | |
| Class B | | | — | | | | (2,330,413 | ) | | | (3,314,131 | ) | |
| Class C | | | — | | | | (911,125 | ) | | | (1,015,314 | ) | |
| Class R | | | — | | | | — | | | | — | | |
| Class Z | | | — | | | | (69,034,420 | ) | | | (67,841,701 | ) | |
| From return of capital: | |
| Class A | | | — | | | | (307,541 | ) | | | — | | |
| Class B | | | — | | | | (25,269 | ) | | | — | | |
| Class C | | | — | | | | (7,626 | ) | | | — | | |
| Class R | | | — | | | | — | | | | — | | |
| Class Z | | | — | | | | (526,879 | ) | | | — | | |
| Total distributions to shareholders | | | — | | | | (112,557,787 | ) | | | (107,975,239 | ) | |
| Net Capital Stock Transactions | | | (34,904,286 | ) | | | (2,193,983 | ) | | | 211,423,714 | | |
| Redemption Fees | | | — | | | | — | | | | — | | |
| Total increase (decrease) in net assets | | | (226,846,831 | ) | | | (136,988,894 | ) | | | 123,064,720 | | |
| Net Assets | |
| Beginning of period | | | 466,448,723 | | | | 603,437,617 | | | | 480,372,897 | | |
| End of period | | | 239,601,892 | | | | 466,448,723 | | | | 603,437,617 | | |
| Undistributed (Overdistributed) net investment income at end of period | | | — | | | | — | | | | — | | |
| Accumulated net investment loss, at end of period | | | (21,025 | ) | | | (21,024 | ) | | | (21,025 | ) | |
See Accompanying Notes to Financial Statements.
93
Statements of Changes in Net Assets – Capital Stock Activity
| | | Columbia Convertible Securities Fund | |
| | | Year Ended
February 28, 2009 | | Year Ended
February 29, 2008 | |
| | | Shares | | Dollars ($) | | Shares | | Dollars ($) | |
| Class A | |
| Subscriptions | | | 1,537,088 | | | | 19,225,058 | | | | 1,194,127 | | | | 19,865,254 | | |
| Distributions reinvested | | | 630,014 | | | | 8,392,735 | | | | 1,800,972 | | | | 28,979,125 | | |
| Redemptions | | | (4,976,825 | ) | | | (59,899,716 | ) | | | (4,323,102 | ) | | | (71,548,751 | ) | |
| Net decrease | | | (2,809,723 | ) | | | (32,281,923 | ) | | | (1,328,003 | ) | | | (22,704,372 | ) | |
| Class B | |
| Subscriptions | | | 43,091 | | | | 520,935 | | | | 103,277 | | | | 1,685,398 | | |
| Distributions reinvested | | | 120,139 | | | | 1,598,938 | | | | 463,181 | | | | 7,335,277 | | |
| Redemptions | | | (1,962,040 | ) | | | (23,690,229 | ) | | | (1,582,848 | ) | | | (25,763,614 | ) | |
| Net decrease | | | (1,798,810 | ) | | | (21,570,356 | ) | | | (1,016,390 | ) | | | (16,742,939 | ) | |
| Class C | |
| Subscriptions | | | 181,821 | | | | 2,206,238 | | | | 254,369 | | | | 4,173,628 | | |
| Distributions reinvested | | | 40,032 | | | | 537,080 | | | | 140,312 | | | | 2,251,244 | | |
| Redemptions | | | (959,617 | ) | | | (11,363,854 | ) | | | (1,001,300 | ) | | | (16,514,647 | ) | |
| Net decrease | | | (737,764 | ) | | | (8,620,536 | ) | | | (606,619 | ) | | | (10,089,775 | ) | |
| Class Z | |
| Subscriptions | | | 3,541,043 | | | | 41,202,000 | | | | 2,529,928 | | | | 40,288,815 | | |
| Distributions reinvested | | | 251,496 | | | | 3,377,945 | | | | 950,909 | | | | 15,265,535 | | |
| Redemptions | | | (10,738,824 | ) | | | (134,745,131 | ) | | | (14,163,418 | ) | | | (232,679,151 | ) | |
| Net decrease | | | (6,946,285 | ) | | | (90,165,186 | ) | | | (10,682,581 | ) | | | (177,124,801 | ) | |
See Accompanying Notes to Financial Statements.
94
Statements of Changes in Net Assets – Capital Stock Activity
| | | Columbia Large Cap Value Fund | |
| | | Year Ended
February 28, 2009 | | Year Ended
February 29, 2008 | |
| | | Shares | | Dollars ($) | | Shares | | Dollars ($) | |
| Class A | |
| Subscriptions | | | 21,665,197 | | | | 223,674,367 | | | | 22,243,412 | | | | 328,672,241 | | |
| Distributions reinvested | | | 1,758,660 | | | | 18,227,584 | | | | 11,396,499 | | | | 164,077,105 | | |
| Redemptions | | | (29,409,824 | ) | | | (296,101,412 | ) | | | (19,453,404 | ) | | | (285,116,282 | ) | |
| Net increase (decrease) | | | (5,985,967 | ) | | | (54,199,461 | ) | | | 14,186,507 | | | | 207,633,064 | | |
| Class B | |
| Subscriptions | | | 326,080 | | | | 3,333,007 | | | | 526,982 | | | | 7,645,706 | | |
| Distributions reinvested | | | 231,092 | | | | 2,247,279 | | | | 3,638,150 | | | | 50,781,585 | | |
| Redemptions | | | (10,677,747 | ) | | | (108,032,276 | ) | | | (13,091,406 | ) | | | (186,861,514 | ) | |
| Net decrease | | | (10,120,575 | ) | | | (102,451,990 | ) | | | (8,926,274 | ) | | | (128,434,223 | ) | |
| Class C | |
| Subscriptions | | | 364,182 | | | | 3,317,906 | | | | 353,843 | | | | 4,995,046 | | |
| Distributions reinvested | | | 48,057 | | | | 465,605 | | | | 639,867 | | | | 8,915,073 | | |
| Redemptions | | | (1,703,376 | ) | | | (16,777,002 | ) | | | (1,539,169 | ) | | | (21,876,113 | ) | |
| Net decrease | | | (1,291,137 | ) | | | (12,993,491 | ) | | | (545,459 | ) | | | (7,965,994 | ) | |
| Class R | |
| Subscriptions | | | 6,275 | | | | 66,917 | | | | 18,735 | | | | 231,914 | | |
| Distributions reinvested | | | 342 | | | | 3,472 | | | | 177 | | | | 2,502 | | |
| Redemptions | | | (4,602 | ) | | | (42,622 | ) | | | (596 | ) | | | (7,568 | ) | |
| Net increase | | | 2,015 | | | | 27,767 | | | | 18,316 | | | | 226,848 | | |
| Class Z | |
| Subscriptions | | | 19,753,607 | | | | 193,882,402 | | | | 22,337,178 | | | | 324,629,741 | | |
| Distributions reinvested | | | 1,620,276 | | | | 17,041,733 | | | | 10,484,152 | | | | 151,158,304 | | |
| Redemptions | | | (45,713,915 | ) | | | (458,933,048 | ) | | | (29,041,302 | ) | | | (422,851,640 | ) | |
| Net increase (decrease) | | | (24,340,032 | ) | | | (248,008,913 | ) | | | 3,780,028 | | | | 52,936,405 | | |
See Accompanying Notes to Financial Statements.
95
Statements of Changes in Net Assets – Capital Stock Activity
| | | Columbia Mid Cap Value Fund | |
| | | Year Ended
February 28, 2009 | | Year Ended
February 29, 2008 | |
| | | Shares | | Dollars ($) | | Shares | | Dollars ($) | |
| Class A | |
| Subscriptions | | | 63,025,926 | | | | 710,570,981 | | | | 64,975,385 | | | | 979,757,519 | | |
| Distributions reinvested | | | 1,381,260 | | | | 13,959,126 | | | | 6,052,841 | | | | 92,487,165 | | |
| Redemptions | | | (51,586,325 | ) | | | (543,348,700 | ) | | | (28,390,287 | ) | | | (421,608,056 | ) | |
| Net increase | | | 12,820,861 | | | | 181,181,407 | | | | 42,637,939 | | | | 650,636,628 | | |
| Class B | |
| Subscriptions | | | 486,582 | | | | 5,324,226 | | | | 1,273,786 | | | | 19,233,284 | | |
| Distributions reinvested | | | 49,269 | | | | 424,638 | | | | 865,521 | | | | 13,021,755 | | |
| Redemptions | | | (4,612,237 | ) | | | (49,295,036 | ) | | | (5,290,636 | ) | | | (78,141,175 | ) | |
| Net decrease | | | (4,076,386 | ) | | | (43,546,172 | ) | | | (3,151,329 | ) | | | (45,886,136 | ) | |
| Class C | |
| Subscriptions | | | 4,675,275 | | | | 53,297,733 | | | | 11,723,200 | | | | 176,273,782 | | |
| Distributions reinvested | | | 80,247 | | | | 692,328 | | | | 870,816 | | | | 13,117,454 | | |
| Redemptions | | | (8,023,598 | ) | | | (84,629,721 | ) | | | (4,554,756 | ) | | | (66,160,887 | ) | |
| Net increase (decrease) | | | (3,268,076 | ) | | | (30,639,660 | ) | | | 8,039,260 | | | | 123,230,349 | | |
| Class R | |
| Subscriptions | | | 23,356,150 | | | | 276,733,469 | | | | 3,645,901 | | | | 54,054,076 | | |
| Distributions reinvested | | | 149,023 | | | | 1,389,675 | | | | 77,728 | | | | 1,177,061 | | |
| Redemptions | | | (5,880,050 | ) | | | (57,901,376 | ) | | | (677,938 | ) | | | (10,031,589 | ) | |
| Net increase | | | 17,625,123 | | | | 220,221,768 | | | | 3,045,691 | | | | 45,199,548 | | |
| Class Z | |
| Subscriptions | | | 103,345,236 | | | | 1,106,675,936 | | | | 67,967,013 | | | | 1,018,740,348 | | |
| Distributions reinvested | | | 1,705,562 | | | | 17,485,955 | | | | 5,337,007 | | | | 81,528,741 | | |
| Redemptions | | | (53,426,936 | ) | | | (550,982,561 | ) | | | (28,106,338 | ) | | | (419,887,693 | ) | |
| Net increase | | | 51,623,862 | | | | 573,179,330 | | | | 45,197,682 | | | | 680,381,396 | | |
See Accompanying Notes to Financial Statements.
96
Statements of Changes in Net Assets – Capital Stock Activity
| | | Columbia Small Cap Value Fund II | |
| | | Year Ended
February 28, 2009 | | Year Ended
February 29, 2008 | |
| | | Shares | | Dollars ($) | | Shares | | Dollars ($) | |
| Class A | |
| Subscriptions | | | 20,089,474 | | | | 226,503,868 | | | | 27,644,028 | | | | 380,355,429 | | |
| Distributions reinvested | | | 418,878 | | | | 3,313,340 | | | | 561,873 | | | | 7,751,541 | | |
| Redemptions | | | (15,667,900 | ) | | | (165,929,455 | ) | | | (6,618,760 | ) | | | (90,027,146 | ) | |
| Net increase | | | 4,840,452 | | | | 63,887,753 | | | | 21,587,141 | | | | 298,079,824 | | |
| Class B | |
| Subscriptions | | | 21,059 | | | | 244,977 | | | | 248,850 | | | | 3,364,906 | | |
| Distributions reinvested | | | 1,639 | | | | 12,509 | | | | 11,796 | | | | 157,652 | | |
| Redemptions | | | (104,159 | ) | | | (1,042,426 | ) | | | (93,109 | ) | | | (1,229,245 | ) | |
| Net increase (decrease) | | | (81,461 | ) | | | (784,940 | ) | | | 167,537 | | | | 2,293,313 | | |
| Class C | |
| Subscriptions | | | 779,636 | | | | 9,057,660 | | | | 2,947,430 | | | | 39,462,802 | | |
| Distributions reinvested | | | 10,819 | | | | 82,444 | | | | 45,580 | | | | 604,842 | | |
| Redemptions | | | (1,321,666 | ) | | | (12,766,148 | ) | | | (317,833 | ) | | | (4,078,404 | ) | |
| Net increase (decrease) | | | (531,211 | ) | | | (3,626,044 | ) | | | 2,675,177 | | | | 35,989,240 | | |
| Class R | |
| Subscriptions | | | 1,601,357 | | | | 18,451,317 | | | | 1,169,425 | | | | 15,776,792 | | |
| Distributions reinvested | | | 20,180 | | | | 159,220 | | | | 15,561 | | | | 212,396 | | |
| Redemptions | | | (563,596 | ) | | | (5,924,133 | ) | | | (172,033 | ) | | | (2,308,360 | ) | |
| Net increase | | | 1,057,941 | | | | 12,686,404 | | | | 1,012,953 | | | | 13,680,828 | | |
| Class Z | |
| Subscriptions | | | 44,863,675 | | | | 507,257,666 | | | | 35,179,843 | | | | 479,780,580 | | |
| Distributions reinvested | | | 902,574 | | | | 7,263,771 | | | | 900,560 | | | | 12,478,370 | | |
| Redemptions | | | (19,250,966 | ) | | | (200,222,777 | ) | | | (11,005,425 | ) | | | (149,266,020 | ) | |
| Net increase | | | 26,515,283 | | | | 314,298,660 | | | | 25,074,978 | | | | 342,992,930 | | |
See Accompanying Notes to Financial Statements.
97
Statements of Changes in Net Assets – Capital Stock Activity
| | | Columbia Marsico Growth Fund | |
| | | Year Ended
February 28, 2009 | | Period April 1, 2007 through
February 29, 2008 (a) | | Year Ended
March 31, 2007 | |
| | | Shares | | Dollars ($) | | Shares | | Dollars ($) | | Shares | | Dollars ($) | |
| Class A | |
| Subscriptions | | | 44,433,644 | | | | 737,416,581 | | | | 45,928,245 | | | | 995,567,639 | | | | 60,395,634 | | | | 1,171,277,592 | | |
| Distributions reinvested | | | 41,341 | | | | 850,804 | | | | 50,829 | | | | 1,183,799 | | | | — | | | | — | | |
| Redemptions | | | (71,244,738 | ) | | | (1,085,177,038 | ) | | | (29,470,460 | ) | | | (639,137,133 | ) | | | (27,890,172 | ) | | | (541,450,685 | ) | |
| Net increase (decrease) | | | (26,769,753 | ) | | | (346,909,653 | ) | | | 16,508,614 | | | | 357,614,305 | | | | 32,505,462 | | | | 629,826,907 | | |
| Class B | |
| Subscriptions | | | 346,662 | | | | 5,152,434 | | | | 600,243 | | | | 12,206,192 | | | | 1,079,970 | | | | 19,644,631 | | |
| Redemptions | | | (2,368,905 | ) | | | (37,708,743 | ) | | | (2,613,943 | ) | | | (52,536,957 | ) | | | (3,586,506 | ) | | | (65,140,241 | ) | |
| Net decrease | | | (2,022,243 | ) | | | (32,556,309 | ) | | | (2,013,700 | ) | | | (40,330,765 | ) | | | (2,506,536 | ) | | | (45,495,610 | ) | |
| Class C | |
| Subscriptions | | | 5,250,529 | | | | 81,358,143 | | | | 9,970,602 | | | | 203,018,671 | | | | 13,248,498 | | | | 242,642,650 | | |
| Redemptions | | | (15,710,796 | ) | | | (234,848,981 | ) | | | (6,688,612 | ) | | | (134,818,959 | ) | | | (6,172,836 | ) | | | (112,412,407 | ) | |
| Net increase (decrease) | | | (10,460,267 | ) | | | (153,490,838 | ) | | | 3,281,990 | | | | 68,199,712 | | | | 7,075,662 | | | | 130,230,243 | | |
| Class R | |
| Subscriptions | | | 477,406 | | | | 8,309,058 | | | | 580,363 | | | | 12,552,740 | | | | 218,904 | | | | 4,295,458 | | |
| Redemptions | | | (178,853 | ) | | | (2,803,300 | ) | | | (173,463 | ) | | | (3,806,171 | ) | | | (37,235 | ) | | | (736,233 | ) | |
| Net increase | | | 298,553 | | | | 5,505,758 | | | | 406,900 | | | | 8,746,569 | | | | 181,669 | | | | 3,559,225 | | |
| Class Z | |
| Subscriptions | | | 44,726,222 | | | | 685,650,148 | | | | 31,073,560 | | | | 687,219,506 | | | | 38,387,022 | | | | 763,389,561 | | |
| Distributions reinvested | | | 314,478 | | | | 5,402,432 | | | | 100,711 | | | | 2,387,847 | | | | — | | | | — | | |
| Redemptions | | | (42,322,825 | ) | | | (697,196,906 | ) | | | (17,304,037 | ) | | | (383,144,169 | ) | | | (12,037,095 | ) | | | (236,369,766 | ) | |
| Net increase (decrease) | | | 2,717,875 | | | | (6,144,326 | ) | | | 13,870,234 | | | | 306,463,184 | | | | 26,349,927 | | | | 527,019,795 | | |
(a) The Fund changed its fiscal year end from March 31 to February 29.
See Accompanying Notes to Financial Statements.
98
Statements of Changes in Net Assets – Capital Stock Activity
| | | Columbia Large Cap Core Fund | |
| | | Year Ended
February 28, 2009 | | Period April 1, 2007 through
February 29, 2008 (a) | | Year Ended
March 31, 2007 | |
| | | Shares | | Dollars ($) | | Shares | | Dollars ($) | | Shares | | Dollars ($) | |
| Class A | |
| Subscriptions | | | 1,289,189 | | | | 14,602,665 | | | | 918,012 | | | | 14,139,949 | | | | 590,121 | | | | 8,241,999 | | |
| Distributions reinvested | | | 336,825 | | | | 4,066,822 | | | | 682,527 | | | | 10,557,341 | | | | 80,749 | | | | 1,156,423 | | |
| Redemptions | | | (2,220,014 | ) | | | (25,294,199 | ) | | | (2,038,612 | ) | | | (31,322,586 | ) | | | (2,687,393 | ) | | | (37,631,283 | ) | |
| Net decrease | | | (594,000 | ) | | | (6,624,712 | ) | | | (438,073 | ) | | | (6,625,296 | ) | | | (2,016,523 | ) | | | (28,232,861 | ) | |
| Class B | |
| Subscriptions | | | 50,979 | | | | 507,280 | | | | 47,105 | | | | 695,233 | | | | 65,903 | | | | 892,588 | | |
| Distributions reinvested | | | 13,297 | | | | 171,564 | | | | 60,149 | | | | 903,340 | | | | — | | | | — | | |
| Redemptions | | | (637,074 | ) | | | (7,542,554 | ) | | | (879,369 | ) | | | (13,063,805 | ) | | | (729,002 | ) | | | (9,921,962 | ) | |
| Net decrease | | | (572,798 | ) | | | (6,863,710 | ) | | | (772,115 | ) | | | (11,465,232 | ) | | | (663,099 | ) | | | (9,029,374 | ) | |
| Class C | |
| Subscriptions | | | 87,290 | | | | 813,728 | | | | 24,384 | | | | 358,299 | | | | 109,510 | | | | 1,482,121 | | |
| Distributions reinvested | | | 2,756 | | | | 35,150 | | | | 7,605 | | | | 114,080 | | | | — | | | | — | | |
| Redemptions | | | (51,475 | ) | | | (566,462 | ) | | | (661,122 | ) | | | (9,695,068 | ) | | | (400,084 | ) | | | (5,474,022 | ) | |
| Net increase (decrease) | | | 38,571 | | | | 282,416 | | | | (629,133 | ) | | | (9,222,689 | ) | | | (290,574 | ) | | | (3,991,901 | ) | |
| Class Z | |
| Subscriptions | | | 16,804,269 | | | | 180,656,299 | | | | 12,194,717 | | | | 184,300,348 | | | | 12,410,783 | | | | 174,002,439 | | |
| Distributions reinvested | | | 1,345,926 | | | | 16,804,649 | | | | 2,896,715 | | | | 44,762,872 | | | | 279,199 | | | | 3,925,475 | | |
| Redemptions | | | (22,430,533 | ) | | | (232,858,536 | ) | | | (19,516,526 | ) | | | (301,765,559 | ) | | | (14,782,222 | ) | | | (204,331,137 | ) | |
| Net decrease | | | (4,280,338 | ) | | | (35,397,588 | ) | | | (4,425,094 | ) | | | (72,702,339 | ) | | | (2,092,240 | ) | | | (26,403,223 | ) | |
(a) The Fund changed its fiscal year end from March 31 to February 29.
See Accompanying Notes to Financial Statements.
99
Statements of Changes in Net Assets – Capital Stock Activity
| | | Columbia Marsico Focused Equities Fund | |
| | | Year Ended
February 28, 2009 | | Period April 1, 2007 through
February 29, 2008 (a) | | Year Ended
March 31, 2007 | |
| | | Shares | | Dollars ($) | | Shares | | Dollars ($) | | Shares | | Dollars ($) | |
| Class A | |
| Subscriptions | | | 68,650,195 | | | | 1,203,374,318 | | | | 34,171,399 | | | | 792,922,966 | | | | 44,224,369 | | | | 927,566,929 | | |
| Distributions reinvested | | | 247,808 | | | | 3,560,998 | | | | 821,737 | | | | 20,600,955 | | | | — | | | | — | | |
| Redemptions | | | (82,964,256 | ) | | | (1,329,128,330 | ) | | | (32,154,427 | ) | | | (739,761,837 | ) | | | (27,805,936 | ) | | | (584,078,634 | ) | |
| Net increase (decrease) | | | (14,066,253 | ) | | | (122,193,014 | ) | | | 2,838,709 | | | | 73,762,084 | | | | 16,418,433 | | | | 343,488,295 | | |
| Class B | |
| Subscriptions | | | 274,964 | | | | 4,508,854 | | | | 428,221 | | | | 9,263,287 | | | | 680,653 | | | | 13,377,347 | | |
| Distributions reinvested | | | — | | | | — | | | | 92,818 | | | | 2,166,374 | | | | — | | | | — | | |
| Redemptions | | | (4,547,035 | ) | | | (80,502,395 | ) | | | (7,826,138 | ) | | | (168,492,556 | ) | | | (9,211,930 | ) | | | (182,050,208 | ) | |
| Net decrease | | | (4,272,071 | ) | | | (75,993,541 | ) | | | (7,305,099 | ) | | | (157,062,895 | ) | | | (8,531,277 | ) | | | (168,672,861 | ) | |
| Class C | |
| Subscriptions | | | 3,062,920 | | | | 50,325,254 | | | | 3,991,988 | | | | 87,040,989 | | | | 7,103,099 | | | | 140,691,307 | | |
| Distributions reinvested | | | — | | | | — | | | | 112,348 | | | | 2,630,064 | | | | — | | | | — | | |
| Redemptions | | | (7,223,270 | ) | | | (118,765,016 | ) | | | (6,585,137 | ) | | | (141,732,279 | ) | | | (5,305,846 | ) | | | (104,879,402 | ) | |
| Net increase (decrease) | | | (4,160,350 | ) | | | (68,439,762 | ) | | | (2,480,801 | ) | | | (52,061,226 | ) | | | 1,797,253 | | | | 35,811,905 | | |
| Class Z | |
| Subscriptions | | | 35,635,168 | | | | 585,520,995 | | | | 14,157,469 | | | | 336,948,705 | | | | 16,645,474 | | | | 358,425,223 | | |
| Distributions reinvested | | | 258,336 | | | | 4,064,120 | | | | 426,797 | | | | 10,921,748 | | | | — | | | | — | | |
| Redemptions | | | (26,996,159 | ) | | | (477,310,239 | ) | | | (12,455,469 | ) | | | (295,382,187 | ) | | | (8,191,907 | ) | | | (174,616,621 | ) | |
| Net increase | | | 8,897,345 | | | | 112,274,876 | | | | 2,128,797 | | | | 52,488,266 | | | | 8,453,567 | | | | 183,808,602 | | |
(a) The Fund changed its fiscal year end from March 31 to February 29.
See Accompanying Notes to Financial Statements.
100
Statements of Changes in Net Assets – Capital Stock Activity
| | | Columbia Marsico 21st Century Fund | |
| | | Year Ended
February 28, 2009 | | Year Ended
February 29, 2008 | |
| | | Shares | | Dollars ($) | | Shares | | Dollars ($) | |
| Class A | |
| Subscriptions | | | 105,611,474 | | | | 1,310,056,381 | | | | 218,471,779 | | | | 3,382,791,885 | | |
| Distributions reinvested | | | — | | | | — | | | | 8,021,537 | | | | 131,190,508 | | |
| Redemptions | | | (184,568,865 | ) | | | (1,956,959,802 | ) | | | (51,789,903 | ) | | | (801,953,279 | ) | |
| Net increase (decrease) | | | (78,957,391 | ) | | | (646,903,421 | ) | | | 174,703,413 | | | | 2,712,029,114 | | |
| Class B | |
| Subscriptions | | | 2,612,075 | | | | 31,983,995 | | | | 6,350,469 | | | | 94,797,703 | | |
| Distributions reinvested | | | — | | | | — | | | | 410,465 | | | | 6,404,466 | | |
| Redemptions | | | (5,376,566 | ) | | | (61,678,675 | ) | | | (2,305,121 | ) | | | (34,211,051 | ) | |
| Net increase (decrease) | | | (2,764,491 | ) | | | (29,694,680 | ) | | | 4,455,813 | | | | 66,991,118 | | |
| Class C | |
| Subscriptions | | | 21,938,434 | | | | 266,205,652 | | | | 61,166,392 | | | | 916,871,861 | | |
| Distributions reinvested | | | — | | | | — | | | | 1,714,146 | | | | 26,823,520 | | |
| Redemptions | | | (34,296,625 | ) | | | (353,567,760 | ) | | | (8,021,346 | ) | | | (119,017,169 | ) | |
| Net increase (decrease) | | | (12,358,191 | ) | | | (87,362,108 | ) | | | 54,859,192 | | | | 824,678,212 | | |
| Class R | |
| Subscriptions | | | 4,058,699 | | | | 47,957,625 | | | | 3,554,488 | | | | 56,369,041 | | |
| Distributions reinvested | | | — | | | | — | | | | 49,206 | | | | 816,311 | | |
| Redemptions | | | (1,526,441 | ) | | | (17,254,066 | ) | | | (626,250 | ) | | | (9,935,990 | ) | |
| Net increase | | | 2,532,258 | | | | 30,703,559 | | | | 2,977,444 | | | | 47,249,362 | | |
| Class Z | |
| Subscriptions | | | 68,444,092 | | | | 766,777,581 | | | | 71,559,002 | | | | 1,138,361,056 | | |
| Distributions reinvested | | | — | | | | — | | | | 1,668,109 | | | | 27,797,736 | | |
| Redemptions | | | (60,742,453 | ) | | | (705,416,235 | ) | | | (14,566,510 | ) | | | (227,319,994 | ) | |
| Net increase | | | 7,701,639 | | | | 61,361,346 | | | | 58,660,601 | | | | 938,838,798 | | |
See Accompanying Notes to Financial Statements.
101
Statements of Changes in Net Assets – Capital Stock Activity
| | | Columbia Small Cap Growth Fund II | |
| | | Year Ended
February 28, 2009 | | Period April 1, 2007 through
February 29, 2008 (a) | | Year Ended
March 31, 2007 | |
| | | Shares | | Dollars ($) | | Shares | | Dollars ($) | | Shares | | Dollars ($) | |
| Class A | |
| Subscriptions | | | 1,585,697 | | | | 16,089,431 | | | | 674,818 | | | | 9,015,261 | | | | 846,115 | | | | 12,194,803 | | |
Proceeds received in
connection with merger | | | — | | | | — | | | | — | | | | — | | | | 5,195,908 | | | | 68,880,727 | | |
| Distributions reinvested | | | — | | | | — | | | | 2,933,444 | | | | 37,391,410 | | | | 2,521,813 | | | | 33,418,724 | | |
| Redemptions | | | (2,875,860 | ) | | | (25,149,538 | ) | | | (2,206,733 | ) | | | (29,658,542 | ) | | | (2,119,338 | ) | | | (30,091,164 | ) | |
| Net increase (decrease) | | | (1,290,163 | ) | | | (9,060,107 | ) | | | 1,401,529 | | | | 16,748,129 | | | | 6,444,498 | | | | 84,403,090 | | |
| Class B | |
| Subscriptions | | | 38,276 | | | | 341,230 | | | | 30,449 | | | | 383,220 | | | | 45,625 | | | | 643,544 | | |
Proceeds received in
connection with merger | | | — | | | | — | | | | — | | | | — | | | | 164,721 | | | | 2,001,422 | | |
| Distributions reinvested | | | — | | | | — | | | | 185,173 | | | | 2,114,074 | | | | 243,591 | | | | 2,943,154 | | |
| Redemptions | | | (377,670 | ) | | | (3,162,007 | ) | | | (285,389 | ) | | | (3,412,264 | ) | | | (412,258 | ) | | | (5,316,334 | ) | |
| Net increase (decrease) | | | (339,394 | ) | | | (2,820,777 | ) | | | (69,767 | ) | | | (914,970 | ) | | | 41,679 | | | | 271,786 | | |
| Class C | |
| Subscriptions | | | 165,308 | | | | 1,457,640 | | | | 99,669 | | | | 1,257,806 | | | | 99,293 | | | | 1,297,619 | | |
Proceeds received in
connection with merger | | | — | | | | — | | | | — | | | | — | | | | 63,412 | | | | 784,361 | | |
| Distributions reinvested | | | — | | | | — | | | | 54,572 | | | | 637,339 | | | | 51,267 | | | | 632,012 | | |
| Redemptions | | | (163,956 | ) | | | (1,411,760 | ) | | | (165,275 | ) | | | (2,018,570 | ) | | | (91,917 | ) | | | (1,195,372 | ) | |
| Net increase (decrease) | | | 1,352 | | | | 45,880 | | | | (11,034 | ) | | | (123,425 | ) | | | 122,055 | | | | 1,518,620 | | |
| Class Z | |
| Subscriptions | | | 5,454,785 | | | | 48,504,604 | | | | 4,677,412 | | | | 65,149,293 | | | | 4,060,420 | | | | 57,665,124 | | |
Proceeds received in
connection with merger | | | — | | | | — | | | | — | | | | — | | | | 8,210,911 | | | | 112,435,820 | | |
| Distributions reinvested | | | — | | | | — | | | | 2,121,835 | | | | 28,157,140 | | | | 1,389,406 | | | | 19,020,642 | | |
| Redemptions | | | (7,927,067 | ) | | | (71,573,886 | ) | | | (7,836,611 | ) | | | (111,210,150 | ) | | | (4,310,537 | ) | | | (63,891,368 | ) | |
| Net increase (decrease) | | | (2,472,282 | ) | | | (23,069,282 | ) | | | (1,037,364 | ) | | | (17,903,717 | ) | | | 9,350,200 | | | | 125,230,218 | | |
(a) The Fund changed its fiscal year end from March 31 to February 29.
See Accompanying Notes to Financial Statements.
102
Financial Highlights – Columbia Convertible Securities Fund
Selected data for a share outstanding throughout each period is as follows:
| | | Year
Ended
February 28, | | Year
Ended
February 29, | | Period
Ended
February 28, | | Year Ended March 31, | |
| Class A Shares | | 2009 | | 2008 | | 2007 (a) | | 2006 (b) | | 2005 | | 2004 | |
| Net Asset Value, Beginning of Period | | $ | 14.90 | | | $ | 16.62 | | | $ | 17.59 | | | $ | 17.35 | | | $ | 17.33 | | | $ | 13.77 | | |
| Income from Investment Operations: | |
| Net investment income (c) | | | 0.29 | | | | 0.32 | | | | 0.35 | | | | 0.41 | | | | 0.43 | | | | 0.47 | | |
Net realized and unrealized gain (loss)
on investments, foreign currency and
written options | | | (4.73 | ) | | | (0.27 | ) | | | 0.91 | | | | 1.32 | | | | 0.24 | | | | 3.53 | | |
| Total from investment operations | | | (4.44 | ) | | | 0.05 | | | | 1.26 | | | | 1.73 | | | | 0.67 | | | | 4.00 | | |
| Less Distributions to Shareholders: | |
| From net investment income | | | (0.30 | ) | | | (0.38 | ) | | | (0.43 | ) | | | (0.42 | ) | | | (0.50 | ) | | | (0.44 | ) | |
| From net realized gains | | | (0.23 | ) | | | (1.39 | ) | | | (1.80 | ) | | | (1.07 | ) | | | (0.15 | ) | | | — | | |
| Total distributions to shareholders | | | (0.53 | ) | | | (1.77 | ) | | | (2.23 | ) | | | (1.49 | ) | | | (0.65 | ) | | | (0.44 | ) | |
| Net Asset Value, End of Period | | $ | 9.93 | | | $ | 14.90 | | | $ | 16.62 | | | $ | 17.59 | | | $ | 17.35 | | | $ | 17.33 | | |
| Total return (d)(e) | | | (30.64 | )% | | | (0.22 | )% | | | 7.96 | %(f) | | | 10.54 | % | | | 3.87 | % | | | 29.32 | % | |
Ratios to Average Net Assets/
Supplemental Data: | |
| Net expenses before interest expense (g) | | | 1.21 | % | | | 1.18 | % | | | 1.16 | %(h) | | | 1.09 | % | | | 1.16 | % | | | 1.19 | %(i) | |
| Interest expense (j) | | | — | % | | | — | % | | | — | %(h) | | | — | % | | | — | % | | | — | % | |
| Net expenses (g) | | | 1.21 | % | | | 1.18 | % | | | 1.16 | %(h) | | | 1.09 | % | | | 1.16 | % | | | 1.19 | %(i) | |
| Waiver/Reimbursement | | | 0.03 | % | | | 0.01 | % | | | 0.01 | %(h) | | | 0.06 | %(k) | | | 0.03 | %(k) | | | 0.03 | %(k) | |
| Net investment income (g) | | | 2.33 | % | | | 1.91 | % | | | 2.25 | %(h) | | | 2.39 | % | | | 2.50 | % | | | 2.94 | % | |
| Portfolio turnover rate | | | 92 | % | | | 77 | % | | | 44 | %(f) | | | 40 | % | | | 37 | % | | | 91 | % | |
| Net assets, end of period (000's) | | $ | 154,987 | | | $ | 274,370 | | | $ | 328,023 | | | $ | 352,010 | | | $ | 373,390 | | | $ | 398,485 | | |
(a) The Fund changed its fiscal year end from March 31 to February 28. Per share data and total return reflect activity from April 1, 2006 through February 28, 2007.
(b) On August 22, 2005, the Fund's Investor A shares were renamed Class A shares.
(c) Per share data was calculated using the average shares outstanding during the period.
(d) Total return at net asset value assuming all distributions reinvested and no initial sales charge or contingent deferred sales charge.
(e) Had the investment advisor and/or any of its affiliates not waived fees or reimbursed a portion of expenses, total return would have been reduced.
(f) Not annualized.
(g) The benefits derived from expense reductions had an impact of less than 0.01%.
(h) Annualized.
(i) The reimbursement from the investment advisor had an impact of less than 0.01%.
(j) Rounds to less than 0.01%.
(k) Bank of America Corporation assumed certain non-recurring costs. Absent these non-recurring costs, the waiver/reimbursement ratio would have been -%, -% and 0.01% for the periods ended March 31, 2006, March 31, 2005 and March 31, 2004, respectively.
See Accompanying Notes to Financial Statements.
103
Financial Highlights – Columbia Convertible Securities Fund
Selected data for a share outstanding throughout each period is as follows:
| | | Year
Ended
February 28, | | Year
Ended
February 29, | | Period
Ended
February 28, | | Year Ended March 31, | |
| Class B Shares | | 2009 | | 2008 | | 2007 (a) | | 2006 (b) | | 2005 | | 2004 | |
| Net Asset Value, Beginning of Period | | $ | 14.66 | | | $ | 16.37 | | | $ | 17.38 | | | $ | 17.16 | | | $ | 17.15 | | | $ | 13.64 | | |
| Income from Investment Operations: | |
| Net investment income (c) | | | 0.19 | | | | 0.19 | | | | 0.23 | | | | 0.28 | | | | 0.30 | | | | 0.35 | | |
Net realized and unrealized gain (loss)
on investments, foreign currency and
written options | | | (4.65 | ) | | | (0.26 | ) | | | 0.90 | | | | 1.30 | | | | 0.23 | | | | 3.48 | | |
| Total from investment operations | | | (4.46 | ) | | | (0.07 | ) | | | 1.13 | | | | 1.58 | | | | 0.53 | | | | 3.83 | | |
| Less Distributions to Shareholders: | |
| From net investment income | | | (0.20 | ) | | | (0.25 | ) | | | (0.34 | ) | | | (0.29 | ) | | | (0.37 | ) | | | (0.32 | ) | |
| From net realized gains | | | (0.23 | ) | | | (1.39 | ) | | | (1.80 | ) | | | (1.07 | ) | | | (0.15 | ) | | | — | | |
| Total distributions to shareholders | | | (0.43 | ) | | | (1.64 | ) | | | (2.14 | ) | | | (1.36 | ) | | | (0.52 | ) | | | (0.32 | ) | |
| Net Asset Value, End of Period | | $ | 9.77 | | | $ | 14.66 | | | $ | 16.37 | | | $ | 17.38 | | | $ | 17.16 | | | $ | 17.15 | | |
| Total return (d)(e) | | | (31.14 | )% | | | (0.92 | )% | | | 7.19 | %(f) | | | 9.72 | % | | | 3.08 | % | | | 28.30 | % | |
Ratios to Average Net Assets/
Supplemental Data: | |
| Net expenses before interest expense (g) | | | 1.96 | % | | | 1.93 | % | | | 1.91 | %(h) | | | 1.84 | % | | | 1.91 | % | | | 1.94 | %(i) | |
| Interest expense (j) | | | — | % | | | — | % | | | — | %(h) | | | — | % | | | — | % | | | — | % | |
| Net expenses (g) | | | 1.96 | % | | | 1.93 | % | | | 1.91 | %(h) | | | 1.84 | % | | | 1.91 | % | | | 1.94 | %(i) | |
| Waiver/Reimbursement | | | 0.03 | % | | | 0.01 | % | | | 0.01 | %(h) | | | 0.06 | %(k) | | | 0.03 | %(k) | | | 0.03 | %(k) | |
| Net investment income (g) | | | 1.53 | % | | | 1.16 | % | | | 1.50 | %(h) | | | 1.64 | % | | | 1.75 | % | | | 2.19 | % | |
| Portfolio turnover rate | | | 92 | % | | | 77 | % | | | 44 | %(f) | | | 40 | % | | | 37 | % | | | 91 | % | |
| Net assets, end of period (000's) | | $ | 31,792 | | | $ | 74,074 | | | $ | 99,360 | | | $ | 116,566 | | | $ | 143,194 | | | $ | 154,322 | | |
(a) The Fund changed its fiscal year end from March 31 to February 28. Per share data and total return reflect activity from April 1, 2006 through February 28, 2007.
(b) On August 22, 2005, the Fund's Investor B shares were renamed Class B shares.
(c) Per share data was calculated using the average shares outstanding during the period.
(d) Total return at net asset value assuming all distributions reinvested and no contingent deferred sales charge.
(e) Had the investment advisor and/or any of its affiliates not waived fees or reimbursed a portion of expenses, total return would have been reduced.
(f) Not annualized.
(g) The benefits derived from expense reductions had an impact of less than 0.01%.
(h) Annualized.
(i) The reimbursement from the investment advisor had an impact of less than 0.01%.
(j) Rounds to less than 0.01%.
(k) Bank of America Corporation assumed certain non-recurring costs. Absent these non-recurring costs, the waiver/reimbursement ratio would have been -%, -% and 0.01% for the periods ended March 31, 2006, March 31, 2005 and March 31, 2004, respectively.
See Accompanying Notes to Financial Statements.
104
Financial Highlights – Columbia Convertible Securities Fund
Selected data for a share outstanding throughout each period is as follows:
| | | Year
Ended
February 28, | | Year
Ended
February 29, | | Period
Ended
February 28, | | Year Ended March 31, | |
| Class C Shares | | 2009 | | 2008 | | 2007 (a) | | 2006 (b) | | 2005 | | 2004 | |
| Net Asset Value, Beginning of Period | | $ | 14.86 | | | $ | 16.58 | | | $ | 17.57 | | | $ | 17.34 | | | $ | 17.31 | | | $ | 13.77 | | |
| Income from Investment Operations: | |
| Net investment income (c) | | | 0.20 | | | | 0.19 | | | | 0.23 | | | | 0.28 | | | | 0.30 | | | | 0.35 | | |
Net realized and unrealized gain (loss)
on investments, foreign currency and
written options | | | (4.72 | ) | | | (0.27 | ) | | | 0.92 | | | | 1.31 | | | | 0.25 | | | | 3.52 | | |
| Total from investment operations | | | (4.52 | ) | | | (0.08 | ) | | | 1.15 | | | | 1.59 | | | | 0.55 | | | | 3.87 | | |
| Less Distributions to Shareholders: | |
| From net investment income | | | (0.20 | ) | | | (0.25 | ) | | | (0.34 | ) | | | (0.29 | ) | | | (0.37 | ) | | | (0.33 | ) | |
| From net realized gains | | | (0.23 | ) | | | (1.39 | ) | | | (1.80 | ) | | | (1.07 | ) | | | (0.15 | ) | | | — | | |
| Total distributions to shareholders | | | (0.43 | ) | | | (1.64 | ) | | | (2.14 | ) | | | (1.36 | ) | | | (0.52 | ) | | | (0.33 | ) | |
| Net Asset Value, End of Period | | $ | 9.91 | | | $ | 14.86 | | | $ | 16.58 | | | $ | 17.57 | | | $ | 17.34 | | | $ | 17.31 | | |
| Total return (d)(e) | | | (31.13 | )% | | | (0.97 | )% | | | 7.23 | %(f) | | | 9.68 | % | | | 3.16 | % | | | 28.31 | % | |
Ratios to Average Net Assets/
Supplemental Data: | |
| Net expenses before interest expense (g) | | | 1.96 | % | | | 1.93 | % | | | 1.91 | %(h) | | | 1.84 | % | | | 1.91 | % | | | 1.94 | %(i) | |
| Interest expense (j) | | | — | % | | | — | % | | | — | %(h) | | | — | % | | | — | % | | | — | % | |
| Net expenses (g) | | | 1.96 | % | | | 1.93 | % | | | 1.91 | %(h) | | | 1.84 | % | | | 1.91 | % | | | 1.94 | %(i) | |
| Waiver/Reimbursement | | | 0.03 | % | | | 0.01 | % | | | 0.01 | %(h) | | | 0.06 | %(k) | | | 0.03 | %(k) | | | 0.03 | %(k) | |
| Net investment income (g) | | | 1.54 | % | | | 1.16 | % | | | 1.50 | %(h) | | | 1.64 | % | | | 1.75 | % | | | 2.19 | % | |
| Portfolio turnover rate | | | 92 | % | | | 77 | % | | | 44 | %(f) | | | 40 | % | | | 37 | % | | | 91 | % | |
| Net assets, end of period (000's) | | $ | 18,239 | | | $ | 38,320 | | | $ | 52,794 | | | $ | 57,193 | | | $ | 66,844 | | | $ | 71,205 | | |
(a) The Fund changed its fiscal year end from March 31 to February 28. Per share data and total return reflect activity from April 1, 2006 through February 28, 2007.
(b) On August 22, 2005, the Fund's Investor C shares were renamed Class C shares.
(c) Per share data was calculated using the average shares outstanding during the period.
(d) Total return at net asset value assuming all distributions reinvested and no contingent deferred sales charge.
(e) Had the investment advisor and/or any of its affiliates not waived fees or reimbursed a portion of expenses, total return would have been reduced.
(f) Not annualized.
(g) The benefits derived from expense reductions had an impact of less than 0.01%.
(h) Annualized.
(i) The reimbursement from the investment advisor had an impact of less than 0.01%.
(j) Rounds to less than 0.01%.
(k) Bank of America Corporation assumed certain non-recurring costs. Absent these non-recurring costs, the waiver/reimbursement ratio would have been -%, -% and 0.01% for the periods ended March 31, 2006, March 31, 2005 and March 31, 2004, respectively.
See Accompanying Notes to Financial Statements.
105
Financial Highlights – Columbia Convertible Securities Fund
Selected data for a share outstanding throughout each period is as follows:
| | | Year
Ended
February 28, | | Year
Ended
February 29, | | Period
Ended
February 28, | | Year Ended March 31, | |
| Class Z Shares | | 2009 | | 2008 | | 2007 (a) | | 2006 (b) | | 2005 | | 2004 | |
| Net Asset Value, Beginning of Period | | $ | 14.91 | | | $ | 16.62 | | | $ | 17.59 | | | $ | 17.35 | | | $ | 17.32 | | | $ | 13.77 | | |
| Income from Investment Operations: | |
| Net investment income (c) | | | 0.33 | | | | 0.36 | | | | 0.39 | | | | 0.46 | | | | 0.48 | | | | 0.51 | | |
Net realized and unrealized gain (loss)
on investments, foreign currency and
written options | | | (4.74 | ) | | | (0.26 | ) | | | 0.91 | | | | 1.31 | | | | 0.24 | | | | 3.52 | | |
| Total from investment operations | | | (4.41 | ) | | | 0.10 | | | | 1.30 | | | | 1.77 | | | | 0.72 | | | | 4.03 | | |
| Less Distributions to Shareholders: | |
| From net investment income | | | (0.34 | ) | | | (0.42 | ) | | | (0.47 | ) | | | (0.46 | ) | | | (0.54 | ) | | | (0.48 | ) | |
| From net realized gains | | | (0.23 | ) | | | (1.39 | ) | | | (1.80 | ) | | | (1.07 | ) | | | (0.15 | ) | | | — | | |
| Total distributions to shareholders | | | (0.57 | ) | | | (1.81 | ) | | | (2.27 | ) | | | (1.53 | ) | | | (0.69 | ) | | | (0.48 | ) | |
| Net Asset Value, End of Period | | $ | 9.94 | | | $ | 14.91 | | | $ | 16.62 | | | $ | 17.59 | | | $ | 17.35 | | | $ | 17.32 | | |
| Total return (d)(e) | | | (30.43 | )% | | | 0.10 | % | | | 8.16 | %(f) | | | 10.81 | % | | | 4.18 | % | | | 29.54 | % | |
Ratios to Average Net Assets/
Supplemental Data: | |
| Net expenses before interest expense (g) | | | 0.96 | % | | | 0.93 | % | | | 0.91 | %(h) | | | 0.84 | % | | | 0.91 | % | | | 0.94 | %(i) | |
| Interest expense (j) | | | — | % | | | — | % | | | — | %(h) | | | — | % | | | — | % | | | — | % | |
| Net expenses (g) | | | 0.96 | % | | | 0.93 | % | | | 0.91 | %(h) | | | 0.84 | % | | | 0.91 | % | | | 0.94 | %(i) | |
| Waiver/Reimbursement | | | 0.03 | % | | | 0.01 | % | | | 0.01 | %(h) | | | 0.06 | %(k) | | | 0.03 | %(k) | | | 0.03 | %(k) | |
| Net investment income (g) | | | 2.56 | % | | | 2.16 | % | | | 2.50 | %(h) | | | 2.64 | % | | | 2.75 | % | | | 3.19 | % | |
| Portfolio turnover rate | | | 92 | % | | | 77 | % | | | 44 | %(f) | | | 40 | % | | | 37 | % | | | 91 | % | |
| Net assets, end of period (000's) | | $ | 190,168 | | | $ | 388,824 | | | $ | 611,157 | | | $ | 775,758 | | | $ | 924,893 | | | $ | 962,284 | | |
(a) The Fund changed its fiscal year end from March 31 to February 28. Per share data and total return reflect activity from April 1, 2006 through February 28, 2007.
(b) On August 22, 2005, the Fund's Investor Z shares were renamed Class Z shares.
(c) Per share data was calculated using the average shares outstanding during the period.
(d) Total return at net asset value assuming all distributions reinvested.
(e) Had the investment advisor and/or any of its affiliates not waived fees or reimbursed a portion of expenses, total return would have been reduced.
(f) Not annualized.
(g) The benefits derived from expense reductions had an impact of less than 0.01%.
(h) Annualized.
(i) The reimbursement from the investment advisor had an impact of less than 0.01%.
(j) Rounds to less than 0.01%.
(k) Bank of America Corporation assumed certain non-recurring costs. Absent these non-recurring costs, the waiver/reimbursement ratio would have been -%, -% and 0.01% for the periods ended March 31, 2006, March 31, 2005 and March 31, 2004, respectively.
See Accompanying Notes to Financial Statements.
106
Financial Highlights – Columbia Large Cap Value Fund
Selected data for a share outstanding throughout each period is as follows:
| | | Year
Ended
February 28, | | Year
Ended
February 29, | | Period
Ended
February 28, | | Year Ended March 31, | |
| Class A Shares | | 2009 | | 2008 | | 2007 (a) | | 2006 (b) | | 2005 | | 2004 | |
| Net Asset Value, Beginning of Period | | $ | 12.37 | | | $ | 15.16 | | | $ | 14.60 | | | $ | 13.10 | | | $ | 11.84 | | | $ | 8.46 | | |
| Income from Investment Operations: | |
| Net investment income (c) | | | 0.18 | | | | 0.20 | | | | 0.17 | | | | 0.19 | | | | 0.17 | | | | 0.14 | | |
Net realized and unrealized gain (loss)
on investments, foreign currency and
written options | | | (5.36 | ) | | | (1.14 | ) | | | 1.37 | | | | 1.64 | | | | 1.26 | | | | 3.36 | | |
| Total from investment operations | | | (5.18 | ) | | | (0.94 | ) | | | 1.54 | | | | 1.83 | | | | 1.43 | | | | 3.50 | | |
| Less Distributions to Shareholders: | |
| From net investment income | | | (0.19 | ) | | | (0.22 | ) | | | (0.12 | ) | | | (0.16 | ) | | | (0.17 | ) | | | (0.12 | ) | |
| From net realized gains | | | — | | | | (1.63 | ) | | | (0.86 | ) | | | (0.17 | ) | | | — | | | | — | | |
| Total distributions to shareholders | | | (0.19 | ) | | | (1.85 | ) | | | (0.98 | ) | | | (0.33 | ) | | | (0.17 | ) | | | (0.12 | ) | |
| Net Asset Value, End of Period | | $ | 7.00 | | | $ | 12.37 | | | $ | 15.16 | | | $ | 14.60 | | | $ | 13.10 | | | $ | 11.84 | | |
| Total return (d)(e) | | | (42.36 | )% | | | (7.55 | )% | | | 11.09 | %(f) | | | 14.15 | % | | | 12.16 | % | | | 41.51 | % | |
Ratios to Average Net Assets/
Supplemental Data: | |
| Net expenses before interest expense (g) | | | 1.04 | % | | | 0.99 | % | | | 1.01 | %(h) | | | 0.96 | % | | | 1.02 | % | | | 1.14 | %(i) | |
| Interest expense | | | — | %(j) | | | — | | | | — | | | | — | | | | — | | | | — | %(j) | |
| Net expenses (g) | | | 1.04 | % | | | 0.99 | % | | | 1.01 | %(h) | | | 0.96 | % | | | 1.02 | % | | | 1.14 | %(i) | |
| Waiver/Reimbursement | | | 0.06 | % | | | 0.06 | % | | | 0.05 | %(h) | | | 0.09 | %(k) | | | 0.13 | %(k) | | | 0.07 | %(k) | |
| Net investment income (g) | | | 1.68 | % | | | 1.37 | % | | | 1.27 | %(h) | | | 1.36 | % | | | 1.41 | % | | | 1.24 | % | |
| Portfolio turnover rate | | | 61 | % | | | 62 | % | | | 66 | %(f) | | | 59 | % | | | 52 | % | | | 69 | % | |
| Net assets, end of period (000's) | | $ | 672,426 | | | $ | 1,262,700 | | | $ | 1,332,311 | | | $ | 1,066,456 | | | $ | 292,037 | | | $ | 211,227 | | |
(a) The Fund changed its fiscal year end from March 31 to February 28. Per share data and total return reflect activity from April 1, 2006 through February 28, 2007.
(b) On August 22, 2005, the Fund's Investor A shares were renamed Class A shares.
(c) Per share data was calculated using the average shares outstanding during the period.
(d) Total return at net asset value assuming all distributions reinvested and no initial sales charge or contingent deferred sales charge.
(e) Had the investment advisor and/or any of its affiliates not waived fees or reimbursed a portion of expenses, total return would have been reduced.
(f) Not annualized.
(g) The benefits derived from expense reductions had an impact of less than 0.01%.
(h) Annualized.
(i) The reimbursement from investment advisor had an impact of less than 0.01%.
(j) Rounds to less than 0.01%.
(k) Bank of America Corporation assumed certain non-recurring costs. Absent these non-recurring costs, the waiver/reimbursement ratio would have been 0.03%, 0.10% and 0.04% for the periods ended March 31, 2006, March 31, 2005 and March 31, 2004, respectively.
See Accompanying Notes to Financial Statements.
107
Financial Highlights – Columbia Large Cap Value Fund
Selected data for a share outstanding throughout each period is as follows:
| | | Year
Ended
February 28, | | Year
Ended
February 29, | | Period
Ended
February 28, | | Year Ended March 31, | |
| Class B Shares | | 2009 | | 2008 | | 2007 (a) | | 2006 (b) | | 2005 | | 2004 | |
| Net Asset Value, Beginning of Period | | $ | 11.94 | | | $ | 14.69 | | | $ | 14.19 | | | $ | 12.75 | | | $ | 11.53 | | | $ | 8.25 | | |
| Income from Investment Operations: | |
| Net investment income (c) | | | 0.09 | | | | 0.09 | | | | 0.07 | | | | 0.08 | | | | 0.08 | | | | 0.05 | | |
Net realized and unrealized gain (loss)
on investments, foreign currency and
written options | | | (5.17 | ) | | | (1.10 | ) | | | 1.34 | | | | 1.59 | | | | 1.22 | | | | 3.27 | | |
| Total from investment operations | | | (5.08 | ) | | | (1.01 | ) | | | 1.41 | | | | 1.67 | | | | 1.30 | | | | 3.32 | | |
| Less Distributions to Shareholders: | |
| From net investment income | | | (0.11 | ) | | | (0.11 | ) | | | (0.05 | ) | | | (0.06 | ) | | | (0.08 | ) | | | (0.04 | ) | |
| From net realized gains | | | — | | | | (1.63 | ) | | | (0.86 | ) | | | (0.17 | ) | | | — | | | | — | | |
| Total distributions to shareholders | | | (0.11 | ) | | | (1.74 | ) | | | (0.91 | ) | | | (0.23 | ) | | | (0.08 | ) | | | (0.04 | ) | |
| Net Asset Value, End of Period | | $ | 6.75 | | | $ | 11.94 | | | $ | 14.69 | | | $ | 14.19 | | | $ | 12.75 | | | $ | 11.53 | | |
| Total return (d)(e) | | | (42.84 | )% | | | (8.24 | )% | | | 10.38 | %(f) | | | 13.22 | % | | | 11.31 | % | | | 40.30 | % | |
Ratios to Average Net Assets/
Supplemental Data: | |
| Net expenses before interest expense (g) | | | 1.79 | % | | | 1.74 | % | | | 1.76 | %(h) | | | 1.71 | % | | | 1.77 | % | | | 1.89 | %(i) | |
| Interest expense | | | — | %(j) | | | — | | | | — | | | | — | | | | — | | | | — | %(j) | |
| Net expenses (g) | | | 1.79 | % | | | 1.74 | % | | | 1.76 | %(h) | | | 1.71 | % | | | 1.77 | % | | | 1.89 | %(i) | |
| Waiver/Reimbursement | | | 0.06 | % | | | 0.06 | % | | | 0.05 | %(h) | | | 0.09 | %(k) | | | 0.13 | %(k) | | | 0.07 | %(k) | |
| Net investment income (g) | | | 0.89 | % | | | 0.60 | % | | | 0.52 | %(h) | | | 0.60 | % | | | 0.66 | % | | | 0.49 | % | |
| Portfolio turnover rate | | | 61 | % | | | 62 | % | | | 66 | %(f) | | | 59 | % | | | 52 | % | | | 69 | % | |
| Net assets, end of period (000's) | | $ | 127,489 | | | $ | 346,218 | | | $ | 557,033 | | | $ | 693,558 | | | $ | 84,756 | | | $ | 87,314 | | |
(a) The Fund changed its fiscal year end from March 31 to February 28. Per share data and total return reflect activity from April 1, 2006 through February 28, 2007.
(b) On August 22, 2005, the Fund's Investor B shares were renamed Class B shares.
(c) Per share data was calculated using the average shares outstanding during the period.
(d) Total return at net asset value assuming all distributions reinvested and no contingent deferred sales charge.
(e) Had the investment advisor and/or any of its affiliates not waived fees or reimbursed a portion of expenses, total return would have been reduced.
(f) Not annualized.
(g) The benefits derived from expense reductions had an impact of less than 0.01%.
(h) Annualized.
(i) The reimbursement from investment advisor had an impact of less than 0.01%.
(j) Rounds to less than 0.01%.
(k) Bank of America Corporation assumed certain non-recurring costs. Absent these non-recurring costs, the waiver/reimbursement ratio would have been 0.03%, 0.10% and 0.04% for the periods ended March 31, 2006, March 31, 2005 and March 31, 2004, respectively.
See Accompanying Notes to Financial Statements.
108
Financial Highlights – Columbia Large Cap Value Fund
Selected data for a share outstanding throughout each period is as follows:
| | | Year
Ended
February 28, | | Year
Ended
February 29, | | Period
Ended
February 28, | | Year Ended March 31, | |
| Class C Shares | | 2009 | | 2008 | | 2007 (a) | | 2006 (b) | | 2005 | | 2004 | |
| Net Asset Value, Beginning of Period | | $ | 11.94 | | | $ | 14.69 | | | $ | 14.19 | | | $ | 12.75 | | | $ | 11.52 | | | $ | 8.24 | | |
| Income from Investment Operations: | |
| Net investment income (c) | | | 0.09 | | | | 0.09 | | | | 0.07 | | | | 0.08 | | | | 0.08 | | | | 0.05 | | |
Net realized and unrealized gain (loss)
on investments, foreign currency and
written options | | | (5.17 | ) | | | (1.10 | ) | | | 1.34 | | | | 1.59 | | | | 1.22 | | | | 3.27 | | |
| Total from investment operations | | | (5.08 | ) | | | (1.01 | ) | | | 1.41 | | | | 1.67 | | | | 1.30 | | | | 3.32 | | |
| Less Distributions to Shareholders: | |
| From net investment income | | | (0.11 | ) | | | (0.11 | ) | | | (0.05 | ) | | | (0.06 | ) | | | (0.07 | ) | | | (0.04 | ) | |
| From net realized gains | | | — | | | | (1.63 | ) | | | (0.86 | ) | | | (0.17 | ) | | | — | | | | — | | |
| Total distributions to shareholders | | | (0.11 | ) | | | (1.74 | ) | | | (0.91 | ) | | | (0.23 | ) | | | (0.07 | ) | | | (0.04 | ) | |
| Net Asset Value, End of Period | | $ | 6.75 | | | $ | 11.94 | | | $ | 14.69 | | | $ | 14.19 | | | $ | 12.75 | | | $ | 11.52 | | |
| Total return (d)(e) | | | (42.84 | )% | | | (8.24 | )% | | | 10.38 | %(f) | | | 13.22 | % | | | 11.36 | % | | | 40.29 | % | |
Ratios to Average Net Assets/
Supplemental Data: | |
| Net expenses before interest expense (g) | | | 1.79 | % | | | 1.74 | % | | | 1.76 | %(h) | | | 1.71 | % | | | 1.77 | % | | | 1.89 | %(i) | |
| Interest expense | | | — | %(j) | | | — | | | | — | | | | — | | | | — | | | | — | %(j) | |
| Net expenses (g) | | | 1.79 | % | | | 1.74 | % | | | 1.76 | %(h) | | | 1.71 | % | | | 1.77 | % | | | 1.89 | %(i) | |
| Waiver/Reimbursement | | | 0.06 | % | | | 0.06 | % | | | 0.05 | %(h) | | | 0.09 | %(k) | | | 0.13 | %(k) | | | 0.07 | %(k) | |
| Net investment income (g) | | | 0.90 | % | | | 0.60 | % | | | 0.52 | %(h) | | | 0.60 | % | | | 0.66 | % | | | 0.49 | % | |
| Portfolio turnover rate | | | 61 | % | | | 62 | % | | | 66 | %(f) | | | 59 | % | | | 52 | % | | | 69 | % | |
| Net assets, end of period (000's) | | $ | 31,091 | | | $ | 70,383 | | | $ | 94,600 | | | $ | 98,884 | | | $ | 17,210 | | | $ | 28,832 | | |
(a) The Fund changed its fiscal year end from March 31 to February 28. Per share data and total return reflect activity from April 1, 2006 through February 28, 2007.
(b) On August 22, 2005, the Fund's Investor C shares were renamed Class C shares.
(c) Per share data was calculated using the average shares outstanding during the period.
(d) Total return at net asset value assuming all distributions reinvested and no contingent deferred sales charge.
(e) Had the investment advisor and/or any of its affiliates not waived fees or reimbursed a portion of expenses, total return would have been reduced.
(f) Not annualized.
(g) The benefits derived from expense reductions had an impact of less than 0.01%.
(h) Annualized.
(i) The reimbursement from investment advisor had an impact of less than 0.01%.
(j) Rounds to less than 0.01%.
(k) Bank of America Corporation assumed certain non-recurring costs. Absent these non-recurring costs, the waiver/reimbursement ratio would have been 0.03%, 0.10% and 0.04% for the periods ended March 31, 2006, March 31, 2005 and March 31, 2004, respectively.
See Accompanying Notes to Financial Statements.
109
Financial Highlights – Columbia Large Cap Value Fund
Selected data for a share outstanding throughout each period is as follows:
| Class R Shares | | Year
Ended
February 28,
2009 | | Year
Ended
February 29,
2008 | | Period
Ended
February 28,
2007 (a) | | Period
Ended
March 31,
2006 (b) | |
| Net Asset Value, Beginning of Period | | $ | 12.36 | | | $ | 15.15 | | | $ | 14.59 | | | $ | 14.05 | | |
| Income from Investment Operations: | |
| Net investment income (c) | | | 0.15 | | | | 0.22 | | | | 0.14 | | | | 0.04 | | |
Net realized and unrealized gain (loss) on investments,
foreign currency and written options | | | (5.36 | ) | | | (1.19 | ) | | | 1.38 | | | | 0.53 | | |
| Total from investment operations | | | (5.21 | ) | | | (0.97 | ) | | | 1.52 | | | | 0.57 | | |
| Less Distributions to Shareholders: | |
| From net investment income | | | (0.16 | ) | | | (0.19 | ) | | | (0.10 | ) | | | (0.03 | ) | |
| From net realized gains | | | — | | | | (1.63 | ) | | | (0.86 | ) | | | — | | |
| Total distributions to shareholders | | | (0.16 | ) | | | (1.82 | ) | | | (0.96 | ) | | | (0.03 | ) | |
| Net Asset Value, End of Period | | $ | 6.99 | | | $ | 12.36 | | | $ | 15.15 | | | $ | 14.59 | | |
| Total return (d)(e) | | | (42.54 | )% | | | (7.79 | )% | | | 10.90 | %(f) | | | 4.05 | %(f) | |
| Ratios to Average Net Assets/Supplemental Data: | |
| Net expenses before interest expense (g) | | | 1.29 | % | | | 1.24 | % | | | 1.26 | %(h) | | | 1.25 | %(h) | |
| Interest expense | | | — | %(i) | | | — | | | | — | | | | — | | |
| Net expenses (g) | | | 1.29 | % | | | 1.24 | % | | | 1.26 | %(h) | | | 1.25 | %(h) | |
| Waiver/Reimbursement | | | 0.06 | % | | | 0.06 | % | | | 0.05 | %(h) | | | 0.16 | %(h)(j) | |
| Net investment income (g) | | | 1.45 | % | | | 1.63 | % | | | 1.02 | %(h) | | | 1.33 | %(h) | |
| Portfolio turnover rate | | | 61 | % | | | 62 | % | | | 66 | %(f) | | | 59 | %(f) | |
| Net assets, end of period (000's) | | $ | 147 | | | $ | 236 | | | $ | 11 | | | $ | 10 | | |
(a) The Fund changed its fiscal year end from March 31 to February 28. Per share data and total return reflect activity from April 1, 2006 through February 28, 2007.
(b) Class R shares commenced operations on January 23, 2006. Per share data and total return reflect activity from that date.
(c) Per share data was calculated using the average shares outstanding during the period.
(d) Total return at net asset value assuming all distributions reinvested.
(e) Had the investment advisor and/or any of its affiliates not waived fees or reimbursed a portion of expenses, total return would have been reduced.
(f) Not annualized.
(g) The benefits derived from expense reductions had an impact of less than 0.01%.
(h) Annualized.
(i) Rounds to less than 0.01%.
(j) Bank of America Corporation assumed certain non-recurring costs. Absent these non-recurring costs, the waiver/reimbursement ratio would have been 0.10% for the period ended March 31, 2006.
See Accompanying Notes to Financial Statements.
110
Financial Highlights – Columbia Large Cap Value Fund
Selected data for a share outstanding throughout each period is as follows:
| | | Year
Ended
February 28, | | Year
Ended
February 29, | | Period
Ended
February 28, | | Year Ended March 31, | |
| Class Z Shares | | 2009 | | 2008 | | 2007 (a) | | 2006 (b) | | 2005 | | 2004 | |
| Net Asset Value, Beginning of Period | | $ | 12.40 | | | $ | 15.19 | | | $ | 14.61 | | | $ | 13.12 | | | $ | 11.85 | | | $ | 8.48 | | |
| Income from Investment Operations: | |
| Net investment income (c) | | | 0.20 | | | | 0.24 | | | | 0.21 | | | | 0.22 | | | | 0.20 | | | | 0.16 | | |
Net realized and unrealized gain (loss)
on investments, foreign currency and
written options | | | (5.39 | ) | | | (1.14 | ) | | | 1.38 | | | | 1.63 | | | | 1.27 | | | | 3.36 | | |
| Total from investment operations | | | (5.19 | ) | | | (0.90 | ) | | | 1.59 | | | | 1.85 | | | | 1.47 | | | | 3.52 | | |
| Less Distributions to Shareholders: | |
| From net investment income | | | (0.22 | ) | | | (0.26 | ) | | | (0.15 | ) | | | (0.19 | ) | | | (0.20 | ) | | | (0.15 | ) | |
| From net realized gains | | | — | | | | (1.63 | ) | | | (0.86 | ) | | | (0.17 | ) | | | — | | | | — | | |
| Total distributions to shareholders | | | (0.22 | ) | | | (1.89 | ) | | | (1.01 | ) | | | (0.36 | ) | | | (0.20 | ) | | | (0.15 | ) | |
| Increase from Regulatory Settlements | | | 0.02 | | | | — | | | | — | | | | — | | | | — | | | | — | | |
| Net Asset Value, End of Period | | $ | 7.01 | | | $ | 12.40 | | | $ | 15.19 | | | $ | 14.61 | | | $ | 13.12 | | | $ | 11.85 | | |
| Total return (d)(e) | | | (42.27 | )% | | | (7.29 | )% | | | 11.42 | %(f) | | | 14.33 | % | | | 12.51 | % | | | 41.63 | % | |
Ratios to Average Net Assets/
Supplemental Data: | |
| Net expenses before interest expense (g) | | | 0.79 | % | | | 0.74 | % | | | 0.76 | %(h) | | | 0.71 | % | | | 0.77 | % | | | 0.89 | %(i) | |
| Interest expense | | | — | %(j) | | | — | | | | — | | | | — | | | | — | | | | — | %(j) | |
| Net expenses (g) | | | 0.79 | % | | | 0.74 | % | | | 0.76 | %(h) | | | 0.71 | % | | | 0.77 | % | | | 0.89 | %(i) | |
| Waiver/Reimbursement | | | 0.06 | % | | | 0.06 | % | | | 0.05 | %(h) | | | 0.09 | %(k) | | | 0.13 | %(k) | | | 0.07 | %(k) | |
| Net investment income (g) | | | 1.91 | % | | | 1.61 | % | | | 1.52 | %(h) | | | 1.60 | % | | | 1.66 | % | | | 1.49 | % | |
| Portfolio turnover rate | | | 61 | % | | | 62 | % | | | 66 | %(f) | | | 59 | % | | | 52 | % | | | 69 | % | |
| Net assets, end of period (000's) | | $ | 907,353 | | | $ | 1,905,752 | | | $ | 2,277,652 | | | $ | 2,009,115 | | | $ | 1,376,691 | | | $ | 1,101,872 | | |
(a) The Fund changed its fiscal year end from March 31 to February 28. Per share data and total return reflect activity from April 1, 2006 through February 28, 2007.
(b) On August 22, 2005, the Fund's Primary A shares were renamed Class Z shares.
(c) Per share data was calculated using the average shares outstanding during the period.
(d) Total return at net asset value assuming all distributions reinvested.
(e) Had the investment advisor and/or any of its affiliates not waived fees or reimbursed a portion of expenses, total return would have been reduced.
(f) Not annualized.
(g) The benefits derived from expense reductions had an impact of less than 0.01%.
(h) Annualized.
(i) The reimbursement from investment advisor had an impact less than 0.01%.
(j) Rounds to less than 0.01%.
(k) Bank of America Corporation assumed certain non-recurring costs. Absent these non-recurring costs, the waiver/reimbursement ratio would have been 0.03%, 0.10% and 0.04% for the periods ended March 31, 2006, March 31, 2005 and March 31, 2004, respectively.
See Accompanying Notes to Financial Statements.
111
Financial Highlights – Columbia Mid Cap Value Fund
Selected data for a share outstanding throughout each period is as follows:
| | | Year
Ended
February 28, | | Year
Ended
February 29, | | Period
Ended
February 28, | | Year Ended March 31, | |
| Class A Shares | | 2009 | | 2008 | | 2007 (a) | | 2006 (b) | | 2005 | | 2004 | |
| Net Asset Value, Beginning of Period | | $ | 13.12 | | | $ | 15.21 | | | $ | 15.01 | | | $ | 14.02 | | | $ | 12.77 | | | $ | 8.71 | | |
| Income from Investment Operations: | |
| Net investment income (c) | | | 0.11 | | | | 0.13 | | | | 0.10 | | | | 0.11 | | | | 0.13 | | | | 0.09 | | |
Net realized and unrealized gain (loss)
on investments, foreign currency and
written options | | | (6.25 | ) | | | (1.19 | ) | | | 1.67 | | | | 2.47 | | | | 2.23 | (d) | | | 4.06 | | |
| Total from investment operations | | | (6.14 | ) | | | (1.06 | ) | | | 1.77 | | | | 2.58 | | | | 2.36 | | | | 4.15 | | |
| Less Distributions to Shareholders: | |
| From net investment income | | | (0.10 | ) | | | (0.16 | ) | | | (0.06 | ) | | | (0.07 | ) | | | (0.12 | ) | | | (0.09 | ) | |
| From net realized gains | | | — | | | | (0.87 | ) | | | (1.51 | ) | | | (1.52 | ) | | | (1.00 | ) | | | — | | |
| From return of capital | | | (0.01 | ) | | | — | | | | — | | | | — | | | | — | | | | — | | |
| Total distributions to shareholders | | | (0.11 | ) | | | (1.03 | ) | | | (1.57 | ) | | | (1.59 | ) | | | (1.12 | ) | | | (0.09 | ) | |
| Increase due to capital contributions | | | — | | | | — | | | | — | | | | — | | | | 0.01 | | | | — | | |
| Net Asset Value, End of Period | | $ | 6.87 | | | $ | 13.12 | | | $ | 15.21 | | | $ | 15.01 | | | $ | 14.02 | | | $ | 12.77 | | |
| Total return (e) | | | (47.05 | )% | | | (7.88 | )% | | | 13.09 | %(f) | | | 20.24 | % | | | 19.90 | %(g) | | | 47.80 | % | |
Ratios to Average Net Assets/
Supplemental Data: | |
| Net expenses before interest expense (h) | | | 1.17 | % | | | 1.10 | % | | | 1.12 | %(i) | | | 1.08 | % | | | 1.20 | % | | | 1.28 | % | |
| Interest expense | | | — | | | | — | | | | — | | | | — | | | | — | %(j) | | | — | | |
| Net expenses (h) | | | 1.17 | % | | | 1.10 | % | | | 1.12 | %(i) | | | 1.08 | % | | | 1.20 | % | | | 1.28 | % | |
| Net investment income (h) | | | 0.97 | % | | | 0.83 | % | | | 0.76 | %(i) | | | 0.80 | % | | | 0.99 | % | | | 0.79 | % | |
| Portfolio turnover rate | | | 46 | % | | | 24 | % | | | 53 | %(f) | | | 41 | % | | | 61 | % | | | 79 | % | |
| Net assets, end of period (000's) | | $ | 966,440 | | | $ | 1,677,414 | | | $ | 1,296,803 | | | $ | 874,429 | | | $ | 10,258 | | | $ | 8,121 | | |
(a) The Fund changed its fiscal year end from March 31 to February 28. Per share data and total return reflect activity from April 1, 2006 through February 28, 2007.
(b) On August 22, 2005, the Fund's Investor A shares were renamed Class A shares.
(c) Per share data was calculated using the average shares outstanding during the period.
(d) The effect of the investment advisor's reimbursement for the Fund exceeding certain investment restrictions is included in the net realized and unrealized gain (loss) on investments (per share). The effect of this reimbursement was to increase net realized and unrealized gain (loss) on investments by $0.01.
(e) Total return at net asset value assuming all distributions reinvested and no initial sales charge or contingent deferred sales charge.
(f) Not annualized.
(g) Without the effect of the investment advisor's reimbursement for the Fund exceeding certain investment restrictions total return would have been 19.81%.
(h) The benefits derived from expense reductions had an impact of less than 0.01%.
(i) Annualized.
(j) Rounds to less than 0.01%.
See Accompanying Notes to Financial Statements.
112
Financial Highlights – Columbia Mid Cap Value Fund
Selected data for a share outstanding throughout each period is as follows:
| | | Year
Ended
February 28, | | Year
Ended
February 29, | | Period
Ended
February 28, | | Year Ended March 31, | |
| Class B Shares | | 2009 | | 2008 | | 2007 (a) | | 2006 (b) | | 2005 | | 2004 | |
| Net Asset Value, Beginning of Period | | $ | 12.86 | | | $ | 14.94 | | | $ | 14.80 | | | $ | 13.89 | | | $ | 12.70 | | | $ | 8.67 | | |
| Income from Investment Operations: | |
| Net investment income (c) | | | 0.02 | | | | 0.03 | | | | — | (d) | | | 0.01 | | | | 0.03 | | | | — | (d) | |
Net realized and unrealized gain (loss)
on investments, foreign currency and
written options | | | (6.11 | ) | | | (1.19 | ) | | | 1.65 | | | | 2.43 | | | | 2.20 | (e) | | | 4.05 | | |
| Total from investment operations | | | (6.09 | ) | | | (1.16 | ) | | | 1.65 | | | | 2.44 | | | | 2.23 | | | | 4.05 | | |
| Less Distributions to Shareholders: | |
| From net investment income | | | (0.03 | ) | | | (0.05 | ) | | | — | (d) | | | (0.01 | ) | | | (0.05 | ) | | | (0.02 | ) | |
| From net realized gains | | | — | | | | (0.87 | ) | | | (1.51 | ) | | | (1.52 | ) | | | (1.00 | ) | | | — | | |
| From return of capital | | | (0.01 | ) | | | — | | | | — | | | | — | | | | — | | | | — | | |
| Total distributions to shareholders | | | (0.04 | ) | | | (0.92 | ) | | | (1.51 | ) | | | (1.53 | ) | | | (1.05 | ) | | | (0.02 | ) | |
| Increase due to capital contributions | | | — | | | | — | | | | — | | | | — | | | | 0.01 | | | | — | | |
| Net Asset Value, End of Period | | $ | 6.73 | | | $ | 12.86 | | | $ | 14.94 | | | $ | 14.80 | | | $ | 13.89 | | | $ | 12.70 | | |
| Total return (f) | | | (47.41 | )% | | | (8.61 | )% | | | 12.36 | %(g) | | | 19.32 | % | | | 18.91 | %(h) | | | 46.56 | % | |
Ratios to Average Net Assets/
Supplemental Data: | |
| Net expenses before interest expense (i) | | | 1.92 | % | | | 1.85 | % | | | 1.87 | %(j) | | | 1.84 | % | | | 1.95 | % | | | 2.03 | % | |
| Interest expense | | | — | | | | — | | | | — | | | | — | | | | — | %(k) | | | — | | |
| Net expenses (i) | | | 1.92 | % | | | 1.85 | % | | | 1.87 | %(j) | | | 1.84 | % | | | 1.95 | % | | | 2.03 | % | |
| Net investment income (loss) (i) | | | 0.18 | % | | | 0.18 | % | | | (0.02 | )%(j) | | | 0.05 | % | | | 0.24 | % | | | 0.04 | % | |
| Portfolio turnover rate | | | 46 | % | | | 24 | % | | | 53 | %(g) | | | 41 | % | | | 61 | % | | | 79 | % | |
| Net assets, end of period (000's) | | $ | 66,254 | | | $ | 179,087 | | | $ | 255,123 | | | $ | 312,587 | | | $ | 4,447 | | | $ | 3,650 | | |
(a) The Fund changed its fiscal year end from March 31 to February 28. Per share data and total return reflect activity from April 1, 2006 through February 28, 2007.
(b) On August 22, 2005, the Fund's Investor B shares were renamed Class B shares.
(c) Per share data was calculated using the average shares outstanding during the period.
(d) Rounds to less than $0.01 per share.
(e) The effect of the investment advisor's reimbursement for the Fund exceeding certain investment restrictions is included in the net realized and unrealized gain (loss) on investments (per share). The effect of this reimbursement was to increase net realized and unrealized gain (loss) on investments by $0.01.
(f) Total return at net asset value assuming all distributions reinvested and no contingent deferred sales charge.
(g) Not annualized.
(h) Without the effect of the investment advisor's reimbursement for the Fund exceeding certain investment restrictions total return would have been 18.82%.
(i) The benefits derived from expense reductions had an impact of less than 0.01%.
(j) Annualized.
(k) Rounds to less than 0.01%.
See Accompanying Notes to Financial Statements.
113
Financial Highlights – Columbia Mid Cap Value Fund
Selected data for a share outstanding throughout each period is as follows:
| | | Year
Ended
February 28, | | Year
Ended
February 29, | | Period
Ended
February 28, | | Year Ended March 31, | |
| Class C Shares | | 2009 | | 2008 | | 2007 (a) | | 2006 (b) | | 2005 | | 2004 | |
| Net Asset Value, Beginning of Period | | $ | 12.90 | | | $ | 14.99 | | | $ | 14.84 | | | $ | 13.93 | | | $ | 12.73 | | | $ | 8.69 | | |
| Income from Investment Operations: | |
| Net investment income (c) | | | 0.02 | | | | 0.01 | | | | — | (d) | | | 0.01 | | | | 0.05 | | | | — | (d) | |
Net realized and unrealized gain (loss)
on investments, foreign currency and
written options | | | (6.13 | ) | | | (1.18 | ) | | | 1.66 | | | | 2.43 | | | | 2.19 | (e) | | | 4.05 | | |
| Total from investment operations | | | (6.11 | ) | | | (1.17 | ) | | | 1.66 | | | | 2.44 | | | | 2.24 | | | | 4.05 | | |
| Less Distributions to Shareholders: | |
| From net investment income | | | (0.03 | ) | | | (0.05 | ) | | | — | (d) | | | (0.01 | ) | | | (0.05 | ) | | | (0.01 | ) | |
| From net realized gains | | | — | | | | (0.87 | ) | | | (1.51 | ) | | | (1.52 | ) | | | (1.00 | ) | | | — | | |
| From return of capital | | | (0.01 | ) | | | — | | | | — | | | | — | | | | — | | | | — | | |
| Total distributions to shareholders | | | (0.04 | ) | | | (0.92 | ) | | | (1.51 | ) | | | (1.53 | ) | | | (1.05 | ) | | | (0.01 | ) | |
| Increase due to capital contributions | | | — | | | | — | | | | — | | | | — | | | | 0.01 | | | | — | | |
| Net Asset Value, End of Period | | $ | 6.75 | | | $ | 12.90 | | | $ | 14.99 | | | $ | 14.84 | | | $ | 13.93 | | | $ | 12.73 | | |
| Total return (f) | | | (47.42 | )% | | | (8.65 | )% | | | 12.40 | %(g) | | | 19.25 | % | | | 18.97 | %(h) | | | 46.66 | % | |
Ratios to Average Net Assets/
Supplemental Data: | |
| Net expenses before interest expense (i) | | | 1.92 | % | | | 1.85 | % | | | 1.87 | %(j) | | | 1.84 | % | �� | | 1.95 | % | | | 2.03 | % | |
| Interest expense | | | — | | | | — | | | | — | | | | — | | | | — | %(k) | | | — | | |
| Net expenses (i) | | | 1.92 | % | | | 1.85 | % | | | 1.87 | %(j) | | | 1.84 | % | | | 1.95 | % | | | 2.03 | % | |
| Net investment income (i) | | | 0.19 | % | | | 0.07 | % | | | 0.03 | %(j) | | | 0.05 | % | | | 0.36 | % | | | 0.04 | % | |
| Portfolio turnover rate | | | 46 | % | | | 24 | % | | | 53 | %(g) | | | 41 | % | | | 61 | % | | | 79 | % | |
| Net assets, end of period (000's) | | $ | 144,370 | | | $ | 318,190 | | | $ | 249,067 | | | $ | 123,789 | | | $ | 944 | | | $ | 684 | | |
(a) The Fund changed its fiscal year end from March 31 to February 28. Per share data and total return reflect activity from April 1, 2006 through February 28, 2007.
(b) On August 22, 2005, the Fund's Investor C shares were renamed Class C shares.
(c) Per share data was calculated using the average shares outstanding during the period.
(d) Rounds to less than $0.01 per share.
(e) The effect of the investment advisor's reimbursement for the Fund exceeding certain investment restrictions is included in the net realized and unrealized gain (loss) on investments (per share). The effect of this reimbursement was to increase net realized and unrealized gain (loss) on investments by $0.01.
(f) Total return at net asset value assuming all distributions reinvested and no contingent deferred sales charge.
(g) Not annualized.
(h) Without the effect of the investment advisor's reimbursement for the Fund exceeding certain investment restrictions total return would have been 18.88%.
(i) The benefits derived from expense reductions had an impact of less than 0.01%.
(j) Annualized.
(k) Rounds to less than 0.01%.
See Accompanying Notes to Financial Statements.
114
Financial Highlights – Columbia Mid Cap Value Fund
Selected data for a share outstanding throughout each period is as follows:
| Class R Shares | | Year
Ended
February 28,
2009 | | Year
Ended
February 29,
2008 | | Period
Ended
February 28,
2007 (a) | | Period
Ended
March 31,
2006 (b) | |
| Net Asset Value, Beginning of Period | | $ | 13.11 | | | $ | 15.21 | | | $ | 15.01 | | | $ | 14.25 | | |
| Income from Investment Operations: | |
| Net investment income (c) | | | 0.09 | | | | 0.05 | | | | 0.08 | | | | 0.01 | | |
Net realized and unrealized gain (loss) on investments,
foreign currency and written options | | | (6.24 | ) | | | (1.16 | ) | | | 1.66 | | | | 0.75 | | |
| Total from investment operations | | | (6.15 | ) | | | (1.11 | ) | | | 1.74 | | | | 0.76 | | |
| Less Distributions to Shareholders: | |
| From net investment income | | | (0.08 | ) | | | (0.12 | ) | | | (0.03 | ) | | | — | (d) | |
| From net realized gains | | | — | | | | (0.87 | ) | | | (1.51 | ) | | | — | | |
| From return of capital | | | (0.01 | ) | | | — | | | | — | | | | — | | |
| Total distributions to shareholders | | | (0.09 | ) | | | (0.99 | ) | | | (1.54 | ) | | | — | (d) | |
| Net Asset Value, End of Period | | $ | 6.87 | | | $ | 13.11 | | | $ | 15.21 | | | $ | 15.01 | | |
| Total return (e) | | | (47.13 | )% | | | (8.17 | )% | | | 12.86 | %(f) | | | 5.36 | %(f) | |
| Ratios to Average Net Assets/Supplemental Data: | |
| Net expenses (g) | | | 1.42 | % | | | 1.35 | % | | | 1.37 | %(h) | | | 1.44 | %(h) | |
| Net investment income (g) | | | 0.94 | % | | | 0.35 | % | | | 0.61 | %(h) | | | 0.44 | %(h) | |
| Portfolio turnover rate | | | 46 | % | | | 24 | % | | | 53 | %(f) | | | 41 | %(f) | |
| Net assets, end of period (000's) | | $ | 145,227 | | | $ | 46,252 | | | $ | 7,337 | | | $ | 10 | | |
(a) The Fund changed its fiscal year end from March 31 to February 28. Per share data and total return reflect activity from April 1, 2006 through February 28, 2007.
(b) The Fund's Class R shares commenced operations on January 23, 2006. Per share data and total return reflect activity from that date.
(c) Per share data was calculated using the average shares outstanding during the period.
(d) Rounds to less than $0.01 per share.
(e) Total return at net asset value assuming all distributions reinvested.
(f) Not annualized.
(g) The benefits derived from expense reductions had an impact of less than 0.01%.
(h) Annualized.
See Accompanying Notes to Financial Statements.
115
Financial Highlights – Columbia Mid Cap Value Fund
Selected data for a share outstanding throughout each period is as follows:
| | | Year
Ended
February 28, | | Year
Ended
February 29, | | Period
Ended
February 28, | | Year Ended March 31, | |
| Class Z Shares | | 2009 | | 2008 | | 2007 (a) | | 2006 (b) | | 2005 | | 2004 | |
| Net Asset Value, Beginning of Period | | $ | 13.13 | | | $ | 15.23 | | | $ | 15.03 | | | $ | 14.04 | | | $ | 12.79 | | | $ | 8.72 | | |
| Income from Investment Operations: | |
| Net investment income (c) | | | 0.14 | | | | 0.17 | | | | 0.13 | | | | 0.13 | | | | 0.16 | | | | 0.12 | | |
Net realized and unrealized gain (loss)
on investments, foreign currency and
written options | | | (6.25 | ) | | | (1.21 | ) | | | 1.68 | | | | 2.49 | | | | 2.23 | (d) | | | 4.07 | | |
| Total from investment operations | | | (6.11 | ) | | | (1.04 | ) | | | 1.81 | | | | 2.62 | | | | 2.39 | | | | 4.19 | | |
| Less Distributions to Shareholders: | |
| From net investment income | | | (0.13 | ) | | | (0.19 | ) | | | (0.10 | ) | | | (0.11 | ) | | | (0.15 | ) | | | (0.12 | ) | |
| From net realized gains | | | — | | | | (0.87 | ) | | | (1.51 | ) | | | (1.52 | ) | | | (1.00 | ) | | | — | | |
| From return of capital | | | (0.01 | ) | | | — | | | | — | | | | — | | | | — | | | | — | | |
| Total distributions to shareholders | | | (0.14 | ) | | | (1.06 | ) | | | (1.61 | ) | | | (1.63 | ) | | | (1.15 | ) | | | (0.12 | ) | |
| Increase Due to Capital Contributions | | | — | | | | — | | | | — | | | | — | | | | 0.01 | | | | — | | |
| Net Asset Value, End of Period | | $ | 6.88 | | | $ | 13.13 | | | $ | 15.23 | | | $ | 15.03 | | | $ | 14.04 | | | $ | 12.79 | | |
| Total return (e) | | | (46.87 | )% | | | (7.70 | )% | | | 13.36 | %(f) | | | 20.49 | % | | | 20.16 | %(g) | | | 48.18 | % | |
Ratios to Average Net Assets/
Supplemental Data: | |
| Net expenses before interest expense (h) | | | 0.92 | % | | | 0.85 | % | | | 0.87 | %(i) | | | 0.84 | % | | | 0.95 | % | | | 1.03 | % | |
| Interest expense | | | — | | | | — | | | | — | | | | — | | | | — | %(j) | | | — | | |
| Net expenses (h) | | | 0.92 | % | | | 0.85 | % | | | 0.87 | %(i) | | | 0.84 | % | | | 0.95 | % | | | 1.03 | % | |
| Net investment income (h) | | | 1.23 | % | | | 1.10 | % | | | 1.00 | %(i) | | | 0.94 | % | | | 1.24 | % | | | 1.04 | % | |
| Portfolio turnover rate | | | 46 | % | | | 24 | % | | | 53 | %(f) | | | 41 | % | | | 61 | % | | | 79 | % | |
| Net assets, end of period (000's) | | $ | 1,459,522 | | | $ | 2,109,483 | | | $ | 1,758,133 | | | $ | 1,415,664 | | | $ | 591,318 | | | $ | 492,327 | | |
(a) The Fund changed its fiscal year end from March 31 to February 28. Per share data and total return reflect activity from April 1, 2006 through February 28, 2007.
(b) On August 22, 2005, the Fund's Primary A shares were renamed Class Z shares.
(c) Per share data was calculated using the average shares outstanding during the period.
(d) The effect of the investment advisor's reimbursement for the Fund exceeding certain investment restrictions is included in the net realized and unrealized gain (loss) on investments (per share). The effect of this reimbursement was to increase net realized and unrealized gain (loss) on investments by $0.01.
(e) Total return at net asset value assuming all distributions reinvested.
(f) Not annualized.
(g) Without the effect of the investment advisor's reimbursement for the Fund exceeding certain investment restrictions total return would have been 20.07%.
(h) The benefits derived from expense reductions had an impact of less than 0.01%.
(i) Annualized.
(j) Rounds to less than 0.01%.
See Accompanying Notes to Financial Statements.
116
Financial Highlights – Columbia Small Cap Value Fund II
Selected data for a share outstanding throughout each period is as follows:
| | | Year
Ended
February 28, | | Year
Ended
February 29, | | Period
Ended
February 28, | | Year Ended March 31, | |
| Class A Shares | | 2009 | | 2008 | | 2007 (a) | | 2006 (b) | | 2005 | | 2004 | |
| Net Asset Value, Beginning of Period | | $ | 12.21 | | | $ | 13.86 | | | $ | 14.12 | | | $ | 12.52 | | | $ | 12.26 | | | $ | 7.71 | | |
| Income from Investment Operations: | |
| Net investment income (loss) (c) | | | 0.11 | | | | 0.06 | | | | 0.03 | | | | 0.04 | | | | (0.04 | ) | | | (0.01 | ) | |
Net realized and unrealized gain (loss)
on investments and foreign currency | | | (5.47 | ) | | | (1.21 | ) | | | 0.65 | | | | 2.98 | | | | 1.47 | | | | 4.67 | | |
| Total from investment operations | | | (5.36 | ) | | | (1.15 | ) | | | 0.68 | | | | 3.02 | | | | 1.43 | | | | 4.66 | | |
| Less Distributions to Shareholders: | |
| From net investment income | | | (0.11 | ) | | | (0.05 | ) | | | (0.01 | ) | | | (0.03 | ) | | | — | | | | (0.02 | ) | |
| From net realized gains | | | — | | | | (0.45 | ) | | | (0.93 | ) | | | (1.39 | ) | | | (1.17 | ) | | | (0.09 | ) | |
| Total distributions to shareholders | | | (0.11 | ) | | | (0.50 | ) | | | (0.94 | ) | | | (1.42 | ) | | | (1.17 | ) | | | (0.11 | ) | |
| Net Asset Value, End of Period | | $ | 6.74 | | | $ | 12.21 | | | $ | 13.86 | | | $ | 14.12 | | | $ | 12.52 | | | $ | 12.26 | | |
| Total return (d) | | | (44.03 | )% | | | (8.74 | )% | | | 5.49 | %(e) | | | 26.14 | % | | | 13.42 | %(f) | | | 60.64 | %(f) | |
Ratios to Average Net Assets/
Supplemental Data: | |
| Net expenses before interest expense (g) | | | 1.28 | % | | | 1.26 | % | | | 1.27 | %(h) | | | 1.23 | % | | | 1.47 | % | | | 1.55 | % | |
| Interest expense | | | — | | | | — | | | | — | | | | — | | | | — | %(i) | | | — | | |
| Net expenses (g) | | | 1.28 | % | | | 1.26 | % | | | 1.27 | %(h) | | | 1.23 | % | | | 1.47 | % | | | 1.55 | % | |
| Waiver/Reimbursement | | | — | | | | — | | | | — | | | | — | | | | 0.02 | % | | | 0.05 | % | |
| Net investment income (loss) (g) | | | 1.05 | % | | | 0.46 | % | | | 0.25 | %(h) | | | 0.33 | % | | | (0.30 | )% | | | (0.10 | )% | |
| Portfolio turnover rate | | | 56 | % | | | 41 | % | | | 61 | %(e) | | | 80 | % | | | 61 | % | | | 111 | % | |
| Net assets, end of period (000's) | | $ | 235,871 | | | $ | 368,060 | | | $ | 118,549 | | | $ | 8,646 | | | $ | 4,868 | | | $ | 3,840 | | |
(a) The Fund changed its fiscal year end from March 31 to February 28. Per share data and total return reflect activity from April 1, 2006 through February 28, 2007.
(b) On August 22, 2005, the Fund's Investor A shares were renamed Class A shares.
(c) Per share data was calculated using the average shares outstanding during the period.
(d) Total return at net asset value assuming all distributions reinvested and no initial sales charge or contingent deferred sales charge.
(e) Not annualized.
(f) Had the investment advisor and/or any of its affiliates not waived fees or reimbursed a portion of expenses, total return would have been reduced.
(g) The benefits derived from expense reductions had an impact of less than 0.01%.
(h) Annualized.
(i) Rounds to less than 0.01%.
See Accompanying Notes to Financial Statements.
117
Financial Highlights – Columbia Small Cap Value Fund II
Selected data for a share outstanding throughout each period is as follows:
| | | Year
Ended
February 28, | | Year
Ended
February 29, | | Period
Ended
February 28, | | Year Ended March 31, | |
| Class B Shares | | 2009 | | 2008 | | 2007 (a) | | 2006 (b) | | 2005 | | 2004 | |
| Net Asset Value, Beginning of Period | | $ | 11.74 | | | $ | 13.41 | | | $ | 13.76 | | | $ | 12.28 | | | $ | 12.13 | | | $ | 7.68 | | |
| Income from Investment Operations: | |
| Net investment income (loss) (c) | | | 0.03 | | | | (0.04 | ) | | | (0.06 | ) | | | (0.05 | ) | | | (0.12 | ) | | | (0.09 | ) | |
Net realized and unrealized gain (loss)
on investments and foreign currency | | | (5.24 | ) | | | (1.18 | ) | | | 0.64 | | | | 2.90 | | | | 1.44 | | | | 4.63 | | |
| Total from investment operations | | | (5.21 | ) | | | (1.22 | ) | | | 0.58 | | | | 2.85 | | | | 1.32 | | | | 4.54 | | |
| Less Distributions to Shareholders: | |
| From net investment income | | | (0.04 | ) | | | — | | | | — | | | | — | | | | — | | | | — | | |
| From net realized gains | | | — | | | | (0.45 | ) | | | (0.93 | ) | | | (1.37 | ) | | | (1.17 | ) | | | (0.09 | ) | |
| Total distributions to shareholders | | | (0.04 | ) | | | (0.45 | ) | | | (0.93 | ) | | | (1.37 | ) | | | (1.17 | ) | | | (0.09 | ) | |
| Net Asset Value, End of Period | | $ | 6.49 | | | $ | 11.74 | | | $ | 13.41 | | | $ | 13.76 | | | $ | 12.28 | | | $ | 12.13 | | |
| Total return (d) | | | (44.46 | )% | | | (9.49 | )% | | | 4.82 | %(e) | | | 25.12 | % | | | 12.59 | %(f) | | | 59.34 | %(f) | |
Ratios to Average Net Assets/
Supplemental Data: | |
| Net expenses before interest expense (g) | | | 2.03 | % | | | 2.01 | % | | | 2.02 | %(h) | | | 1.98 | % | | | 2.22 | % | | | 2.30 | % | |
| Interest expense | | | — | | | | — | | | | — | | | | — | | | | — | %(i) | | | — | | |
| Net expenses (g) | | | 2.03 | % | | | 2.01 | % | | | 2.02 | %(h) | | | 1.98 | % | | | 2.22 | % | | | 2.30 | % | |
| Waiver/Reimbursement | | | — | | | | — | | | | — | | | | — | | | | 0.02 | % | | | 0.05 | % | |
| Net investment income (loss) (g) | | | 0.29 | % | | | (0.28 | )% | | | (0.53 | )%(h) | | | (0.43 | )% | | | (1.05 | )% | | | (0.85 | )% | |
| Portfolio turnover rate | | | 56 | % | | | 41 | % | | | 61 | %(e) | | | 80 | % | | | 61 | % | | | 111 | % | |
| Net assets, end of period (000's) | | $ | 2,373 | | | $ | 5,248 | | | $ | 3,746 | | | $ | 2,158 | | | $ | 1,569 | | | $ | 1,395 | | |
(a) The Fund changed its fiscal year end from March 31 to February 28. Per share data and total return reflect activity from April 1, 2006 through February 28, 2007.
(b) On August 22, 2005, the Fund's Investor B shares were renamed Class B shares.
(c) Per share data was calculated using the average shares outstanding during the period.
(d) Total return at net asset value assuming all distributions reinvested and no contingent deferred sales charge.
(e) Not annualized.
(f) Had the investment advisor and/or any of its affiliates not waived fees or reimbursed a portion of expenses, total return would have been reduced.
(g) The benefits derived from expense reductions had an impact of less than 0.01%.
(h) Annualized.
(i) Rounds to less than 0.01%.
See Accompanying Notes to Financial Statements.
118
Financial Highlights – Columbia Small Cap Value Fund II
Selected data for a share outstanding throughout each period is as follows:
| | | Year
Ended
February 28, | | Year
Ended
February 29, | | Period
Ended
February 28, | | Year Ended March 31, | |
| Class C Shares | | 2009 | | 2008 | | 2007 (a) | | 2006 (b) | | 2005 | | 2004 | |
| Net Asset Value, Beginning of Period | | $ | 11.73 | | | $ | 13.40 | | | $ | 13.75 | | | $ | 12.27 | | | $ | 12.13 | | | $ | 7.67 | | |
| Income from Investment Operations: | |
| Net investment income (loss) (c) | | | 0.03 | | | | (0.04 | ) | | | (0.06 | ) | | | (0.04 | ) | | | (0.12 | ) | | | (0.09 | ) | |
Net realized and unrealized gain (loss)
on investments and foreign currency | | | (5.23 | ) | | | (1.18 | ) | | | 0.64 | | | | 2.89 | | | | 1.43 | | | | 4.64 | | |
| Total from investment operations | | | (5.20 | ) | | | (1.22 | ) | | | 0.58 | | | | 2.85 | | | | 1.31 | | | | 4.55 | | |
| Less Distributions to Shareholders: | |
| From net investment income | | | (0.04 | ) | | | — | | | | — | | | | — | | | | — | | | | — | | |
| From net realized gains | | | — | | | | (0.45 | ) | | | (0.93 | ) | | | (1.37 | ) | | | (1.17 | ) | | | (0.09 | ) | |
| Total distributions to shareholders | | | (0.04 | ) | | | (0.45 | ) | | | (0.93 | ) | | | (1.37 | ) | | | (1.17 | ) | | | (0.09 | ) | |
| Net Asset Value, End of Period | | $ | 6.49 | | | $ | 11.73 | | | $ | 13.40 | | | $ | 13.75 | | | $ | 12.27 | | | $ | 12.13 | | |
| Total return (d) | | | (44.41 | )% | | | (9.49 | )% | | | 4.83 | %(e) | | | 25.14 | % | | | 12.51 | %(f) | | | 59.54 | %(f) | |
Ratios to Average Net Assets/
Supplemental Data: | |
| Net expenses before interest expense (g) | | | 2.03 | % | | | 2.01 | % | | | 2.02 | %(h) | | | 1.98 | % | | | 2.22 | % | | | 2.30 | % | |
| Interest expense | | | — | | | | — | | | | — | | | | — | | | | — | %(i) | | | — | | |
| Net expenses (g) | | | 2.03 | % | | | 2.01 | % | | | 2.02 | %(h) | | | 1.98 | % | | | 2.22 | % | | | 2.30 | % | |
| Waiver/Reimbursement | | | — | | | | — | | | | — | | | | — | | | | 0.02 | % | | | 0.05 | % | |
| Net investment income (loss) (g) | | | 0.29 | % | | | (0.29 | )% | | | (0.49 | )%(h) | | | (0.32 | )% | | | (1.05 | )% | | | (0.85 | )% | |
| Portfolio turnover rate | | | 56 | % | | | 41 | % | | | 61 | %(e) | | | 80 | % | | | 61 | % | | | 111 | % | |
| Net assets, end of period (000's) | | $ | 22,159 | | | $ | 46,303 | | | $ | 17,032 | | | $ | 1,671 | | | $ | 370 | | | $ | 278 | | |
(a) The Fund changed its fiscal year end from March 31 to February 28. Per share data and total return reflect activity from April 1, 2006 through February 28, 2007.
(b) On August 22, 2005, the Fund's Investor C shares were renamed Class C shares.
(c) Per share data was calculated using the average shares outstanding during the period.
(d) Total return at net asset value assuming all distributions reinvested and no contingent deferred sales charge.
(e) Not annualized.
(f) Had the investment advisor and/or any of its affiliates not waived fees or reimbursed a portion of expenses, total return would have been reduced.
(g) The benefits derived from expense reductions had an impact of less than 0.01%.
(h) Annualized.
(i) Rounds to less than 0.01%.
See Accompanying Notes to Financial Statements.
119
Financial Highlights – Columbia Small Cap Value Fund II
Selected data for a share outstanding throughout each period is as follows:
| Class R Shares | | Year
Ended
February 28,
2009 | | Year
Ended
February 29,
2008 | | Period
Ended
February 28,
2007 (a) | | Period
Ended
March 31,
2006 (b) | |
| Net Asset Value, Beginning of Year | | $ | 12.17 | | | $ | 13.83 | | | $ | 14.11 | | | $ | 12.93 | | |
| Income from Investment Operations: | |
| Net investment income (c) | | | 0.09 | | | | 0.03 | | | | — | (d) | | | — | | |
Net realized and unrealized gain (loss) on investments and
foreign currency | | | (5.45 | ) | | | (1.22 | ) | | | 0.65 | | | | 1.18 | | |
| Total from investment operations | | | (5.36 | ) | | | (1.19 | ) | | | 0.65 | | | | 1.18 | | |
| Less Distributions to Shareholders: | |
| From net investment income | | | (0.09 | ) | | | (0.02 | ) | | | — | | | | — | | |
| From net realized gains | | | — | | | | (0.45 | ) | | | (0.93 | ) | | | — | | |
| Total distributions to shareholders | | | (0.09 | ) | | | (0.47 | ) | | | (0.93 | ) | | | — | | |
| Net Asset Value, End of Year | | $ | 6.72 | | | $ | 12.17 | | | $ | 13.83 | | | $ | 14.11 | | |
| Total return (e) | | | (44.18 | )% | | | (9.03 | )% | | | 5.22 | %(f) | | | 9.13 | %(f) | |
| Ratios to Average Net Assets/Supplemental Data: | |
| Net expenses (g) | | | 1.53 | % | | | 1.51 | % | | | 1.52 | %(h) | | | 1.36 | %(h) | |
| Net investment income (loss) (g) | | | 0.82 | % | | | 0.20 | % | | | (0.02 | )%(h) | | | 0.03 | %(h) | |
| Portfolio turnover rate | | | 56 | % | | | 41 | % | | | 61 | %(f) | | | 80 | %(f) | |
| Net assets, end of period (000's) | | $ | 14,765 | | | $ | 13,851 | | | $ | 1,727 | | | $ | 11 | | |
(a) The Fund changed its fiscal year end from March 31 to February 28. Per share data and total return reflect activity from April 1, 2006 through February 28, 2007.
(b) Class R shares commenced operations January 23, 2006. Per share data and total return reflect activity from that date.
(c) Per share data was calculated using the average shares outstanding during the period.
(d) Rounds to less than $0.01 per share.
(e) Total return at net asset value assuming all distributions reinvested.
(f) Not annualized.
(g) The benefits derived from expense reductions had an impact of less than 0.01%.
(h) Annualized.
See Accompanying Notes to Financial Statements.
120
Financial Highlights – Columbia Small Cap Value Fund II
Selected data for a share outstanding throughout each period is as follows:
| | | Year
Ended
February 28, | | Year
Ended
February 29, | | Period
Ended
February 28, | | Year Ended March 31, | |
| Class Z Shares | | 2009 | | 2008 | | 2007 (a) | | 2006 (b) | | 2005 | | 2004 | |
| Net Asset Value, Beginning of Period | | $ | 12.29 | | | $ | 13.95 | | | $ | 14.21 | | | $ | 12.60 | | | $ | 12.30 | | | $ | 7.73 | | |
| Income from Investment Operations: | |
| Net investment income (loss) (c) | | | 0.14 | | | | 0.10 | | | | 0.06 | | | | 0.07 | | | | (0.01 | ) | | | 0.02 | | |
Net realized and unrealized gain (loss)
on investments and foreign currency | | | (5.51 | ) | | | (1.23 | ) | | | 0.67 | | | | 3.00 | | | | 1.48 | | | | 4.67 | | |
| Total from investment operations | | | (5.37 | ) | | | (1.13 | ) | | | 0.73 | | | | 3.07 | | | | 1.47 | | | | 4.69 | | |
| Less Distributions to Shareholders: | |
| From net investment income | | | (0.14 | ) | | | (0.08 | ) | | | (0.06 | ) | | | (0.06 | ) | | | — | (d) | | | (0.03 | ) | |
| From net realized gains | | | — | | | | (0.45 | ) | | | (0.93 | ) | | | (1.40 | ) | | | (1.17 | ) | | | (0.09 | ) | |
| Total distributions to shareholders | | | (0.14 | ) | | | (0.53 | ) | | | (0.99 | ) | | | (1.46 | ) | | | (1.17 | ) | | | (0.12 | ) | |
| Net Asset Value, End of Period | | $ | 6.78 | | | $ | 12.29 | | | $ | 13.95 | | | $ | 14.21 | | | $ | 12.60 | | | $ | 12.30 | | |
| Total return (e) | | | (43.87 | )% | | | (8.55 | )% | | | 5.77 | %(f) | | | 26.43 | % | | | 13.72 | %(g) | | | 60.96 | %(g) | |
Ratios to Average Net Assets/
Supplemental Data: | |
| Net expenses before interest expense (h) | | | 1.03 | % | | | 1.01 | % | | | 1.02 | %(i) | | | 0.98 | % | | | 1.22 | % | | | 1.30 | % | |
| Interest expense | | | — | | | | — | | | | — | | | | — | | | | — | %(j) | | | — | | |
| Net expenses (h) | | | 1.03 | % | | | 1.01 | % | | | 1.02 | %(i) | | | 0.98 | % | | | 1.22 | % | | | 1.30 | % | |
| Waiver/Reimbursement | | | — | | | | — | | | | — | | | | — | | | | 0.02 | % | | | 0.05 | % | |
| Net investment income (loss) (h) | | | 1.33 | % | | | 0.71 | % | | | 0.47 | %(i) | | | 0.56 | % | | | (0.05 | )% | | | 0.15 | % | |
| Portfolio turnover rate | | | 56 | % | | | 41 | % | | | 61 | %(f) | | | 80 | % | | | 61 | % | | | 111 | % | |
| Net assets, end of period (000's) | | $ | 540,951 | | | $ | 654,658 | | | $ | 393,160 | | | $ | 238,856 | | | $ | 197,829 | | | $ | 151,556 | | |
(a) The Fund changed its fiscal year end from March 31 to February 28. Per share data and total return reflect activity from April 1, 2006 through February 28, 2007.
(b) On August 22, 2005, the Fund's Primary A shares were renamed Class Z shares.
(c) Per share data was calculated using the average shares outstanding during the period.
(d) Rounds to less than $0.01 per share.
(e) Total return at net asset value assuming all distributions reinvested.
(f) Not annualized.
(g) Had the investment advisor and/or any of its affiliates not waived fees or reimbursed a portion of expenses, total return would have been reduced.
(h) The benefits derived from expense reductions had an impact of less than 0.01%.
(i) Annualized.
(j) Rounds to less than 0.01%.
See Accompanying Notes to Financial Statements.
121
Financial Highlights – Columbia Marsico Growth Fund
Selected data for a share outstanding throughout each period is as follows:
| | | Year
Ended
February 28, | | Period
Ended
February 29, | | Year Ended March 31, | |
| Class A Shares (a) | | 2009 (b) | | 2008 (c) | | 2007 | | 2006 (d) | | 2005 | | 2004 | |
| Net Asset Value, Beginning of Period | | $ | 20.26 | | | $ | 20.22 | | | $ | 19.53 | | | $ | 17.04 | | | $ | 15.80 | | | $ | 11.86 | | |
| Income from Investment Operations: | |
| Net investment income (loss) (e) | | | 0.06 | | | | 0.06 | | | | — | (f) | | | (0.03 | ) | | | (0.03 | ) | | | (0.06 | ) | |
Net realized and unrealized gain (loss)
on investments and foreign currency | | | (9.01 | ) | | | (0.01 | ) | | | 0.69 | | | | 2.52 | | | | 1.27 | | | | 4.00 | | |
| Total from investment operations | | | (8.95 | ) | | | 0.05 | | | | 0.69 | | | | 2.49 | | | | 1.24 | | | | 3.94 | | |
| Less Distributions to Shareholders: | |
| From net investment income | | | (0.01 | ) | | | (0.01 | ) | | | — | | | | — | | | | — | | | | — | | |
| Net Asset Value, End of Period | | $ | 11.30 | | | $ | 20.26 | | | $ | 20.22 | | | $ | 19.53 | | | $ | 17.04 | | | $ | 15.80 | | |
| Total return (g)(h) | | | (44.21 | )% | | | 0.24 | %(i) | | | 3.53 | % | | | 14.61 | % | | | 7.85 | % | | | 33.22 | % | |
Ratios to Average Net Assets/
Supplemental Data: | |
| Net expenses | | | 1.24 | %(j) | | | 1.20 | %(j)(k) | | | 1.22 | %(j) | | | 1.21 | % | | | 1.30 | % | | | 1.37 | % | |
| Waiver/Reimbursement | | | 0.02 | % | | | 0.01 | %(k) | | | 0.01 | % | | | 0.06 | %(l) | | | 0.03 | %(l) | | | 0.02 | %(l) | |
| Net investment income (loss) | | | 0.36 | %(j) | | | 0.29 | %(j)(k) | | | 0.01 | %(j) | | | (0.15 | )% | | | (0.21 | )% | | | (0.42 | )% | |
| Portfolio turnover rate | | | 21 | %(i)(m) | | | — | | | | — | | | | — | | | | — | | | | — | | |
Turnover of Columbia Marsico Growth
Master Portfolio | | | 54 | %(i) | | | 58 | %(i) | | | 42 | % | | | 62 | % | | | 62 | % | | | 94 | % | |
| Net assets, end of period (000's) | | $ | 1,383,438 | | | $ | 3,024,016 | | | $ | 2,864,153 | | | $ | 1,956,822 | | | $ | 988,948 | | | $ | 546,537 | | |
(a) The per share amounts and percentages reflect income and expenses assuming inclusion of the Fund's proportionate share of the income and expenses of Columbia Marsico Growth Master Portfolio.
(b) Effective November 10, 2008, the Fund converted to a stand-alone fund. Prior to Novermber 10, 2008, the Fund operated in a master-feeder structure.
(c) The Fund changed its fiscal year end from March 31 to February 29. Per share data and total return reflect activity from April 1, 2007 through February 29, 2008.
(d) On August 22, 2005, the Fund's Investor A shares were renamed Class A shares.
(e) Per share data was calculated using the average shares outstanding during the period.
(f) Rounds to less than $0.01.
(g) Total return at net asset value assuming all distributions reinvested and no initial sales charge or contingent deferred sales charge.
(h) Had the investment advisor and/or any of its affiliates not waived fees or reimbursed a portion of expenses, total return would have been reduced.
(i) Not annualized.
(j) The benefits derived from expense reductions had an impact of less than 0.01%.
(k) Annualized.
(l) Bank of America Corporation assumed certain non-recurring costs. Absent these non-recurring costs, the waiver/reimbursement ratio would have been -%, -% and -% for the years ended March 31, 2006, March 31, 2005 and March 31, 2004, respectively.
(m) Amount represents results after the Fund's conversion to a stand-alone structure on November 10, 2008.
See Accompanying Notes to Financial Statements.
122
Financial Highlights – Columbia Marsico Growth Fund
Selected data for a share outstanding throughout each period is as follows:
| | | Year
Ended
February 28, | | Period
Ended
February 29, | | Year Ended March 31, | |
| Class B Shares (a) | | 2009 (b) | | 2008 (c) | | 2007 | | 2006 (d) | | 2005 | | 2004 | |
| Net Asset Value, Beginning of Period | | $ | 18.83 | | | $ | 18.92 | | | $ | 18.40 | | | $ | 16.18 | | | $ | 15.12 | | | $ | 11.43 | | |
| Income from Investment Operations: | |
| Net investment loss (e) | | | (0.06 | ) | | | (0.09 | ) | | | (0.13 | ) | | | (0.15 | ) | | | (0.15 | ) | | | (0.16 | ) | |
Net realized and unrealized gain (loss)
on investments and foreign currency | | | (8.35 | ) | | | — | (f) | | | 0.65 | | | | 2.37 | | | | 1.21 | | | | 3.85 | | |
| Total from investment operations | | | (8.41 | ) | | | (0.09 | ) | | | 0.52 | | | | 2.22 | | | | 1.06 | | | | 3.69 | | |
| Net Asset Value, End of Period | | $ | 10.42 | | | $ | 18.83 | | | $ | 18.92 | | | $ | 18.40 | | | $ | 16.18 | | | $ | 15.12 | | |
| Total return (g)(h) | | | (44.66 | )% | | | (0.48 | )%(i) | | | 2.83 | % | | | 13.72 | % | | | 7.01 | % | | | 32.28 | % | |
Ratios to Average Net Assets/
Supplemental Data: | |
| Net expenses | | | 1.99 | %(j) | | | 1.95 | %(j)(k) | | | 1.97 | %(j) | | | 1.96 | % | | | 2.05 | % | | | 2.12 | % | |
| Waiver/Reimbursement | | | 0.02 | % | | | 0.01 | %(k) | | | 0.01 | % | | | 0.06 | %(l) | | | 0.03 | %(l) | | | 0.02 | %(l) | |
| Net investment loss | | | (0.39 | )%(j) | | | (0.46 | )%(j)(k) | | | (0.71 | )%(j) | | | (0.85 | )% | | | (0.96 | )% | | | (1.17 | )% | |
| Portfolio turnover rate | | | 21 | %(i)(m) | | | — | | | | — | | | | — | | | | — | | | | — | | |
Turnover of Columbia Marsico Growth
Master Portfolio | | | 54 | %(i) | | | 58 | %(i) | | | 42 | % | | | 62 | % | | | 62 | % | | | 94 | % | |
| Net assets, end of period (000's) | | $ | 44,407 | | | $ | 118,307 | | | $ | 156,923 | | | $ | 198,749 | | | $ | 194,668 | | | $ | 200,270 | | |
(a) The per share amounts and percentages reflect income and expenses assuming inclusion of the Fund's proportionate share of the income and expenses of Columbia Marsico Growth Master Portfolio.
(b) Effective November 10, 2008, the Fund converted to a stand-alone fund. Prior to Novermber 10, 2008, the Fund operated in a master-feeder structure.
(c) The Fund changed its fiscal year end from March 31 to February 29. Per share data and total return reflect activity from April 1, 2007 through February 29, 2008.
(d) On August 22, 2005, the Fund's Investor B shares were renamed Class B shares.
(e) Per share data was calculated using the average shares outstanding during the period.
(f) Rounds to less than $0.01 per share.
(g) Total return at net asset value assuming no contingent deferred sales charge.
(h) Had the investment advisor and/or any of its affiliates not waived fees or reimbursed a portion of expenses, total return would have been reduced.
(i) Not annualized.
(j) The benefits derived from expense reductions had an impact of less than 0.01%.
(k) Annualized.
(l) Bank of America Corporation assumed certain non-recurring costs. Absent these non-recurring costs, the waiver/reimbursement ratio would have been -%, -% and -% for the years ended March 31, 2006, March 31, 2005 and March 31, 2004, respectively.
(m) Amount represents results after the Fund's conversion to a stand-alone structure on November 10, 2008.
See Accompanying Notes to Financial Statements.
123
Financial Highlights – Columbia Marsico Growth Fund
Selected data for a share outstanding throughout each period is as follows:
| | | Year
Ended
February 28, | | Period
Ended
February 29, | | Year Ended March 31, | |
| Class C Shares (a) | | 2009 (b) | | 2008 (c) | | 2007 | | 2006 (d) | | 2005 | | 2004 | |
| Net Asset Value, Beginning of Period | | $ | 18.86 | | | $ | 18.94 | | | $ | 18.43 | | | $ | 16.20 | | | $ | 15.14 | | | $ | 11.44 | | |
| Income from Investment Operations: | |
| Net investment loss (e) | | | (0.06 | ) | | | (0.08 | ) | | | (0.13 | ) | | | (0.15 | ) | | | (0.15 | ) | | | (0.17 | ) | |
Net realized and unrealized gain (loss)
on investments and foreign currency | | | (8.36 | ) | | | — | (f) | | | 0.64 | | | | 2.38 | | | | 1.21 | | | | 3.87 | | |
| Total from investment operations | | | (8.42 | ) | | | (0.08 | ) | | | 0.51 | | | | 2.23 | | | | 1.06 | | | | 3.70 | | |
| Net Asset Value, End of Period | | $ | 10.44 | | | $ | 18.86 | | | $ | 18.94 | | | $ | 18.43 | | | $ | 16.20 | | | $ | 15.14 | | |
| Total return (g)(h) | | | (44.64 | )% | | | (0.42 | )%(i) | | | 2.77 | % | | | 13.77 | % | | | 7.00 | % | | | 32.34 | % | |
Ratios to Average Net Assets/
Supplemental Data: | |
| Net expenses | | | 1.99 | %(j) | | | 1.95 | %(j)(k) | | | 1.97 | %(j) | | | 1.96 | % | | | 2.05 | % | | | 2.12 | % | |
| Waiver/Reimbursement | | | 0.02 | % | | | 0.01 | %(k) | | | 0.01 | % | | | 0.06 | %(l) | | | 0.03 | %(l) | | | 0.02 | %(l) | |
| Net investment loss | | | (0.39 | )%(j) | | | (0.46 | )%(j)(k) | | | (0.74 | )%(j) | | | (0.89 | )% | | | (0.96 | )% | | | (1.17 | )% | |
| Portfolio turnover rate | | | 21 | %(i)(m) | | | — | | | | — | | | | — | | | | — | | | | — | | |
Turnover of Columbia Marsico Growth
Master Portfolio | | | 54 | %(i) | | | 58 | %(i) | | | 42 | % | | | 62 | % | | | 62 | % | | | 94 | % | |
| Net assets, end of period (000's) | | $ | 384,025 | | | $ | 891,076 | | | $ | 832,852 | | | $ | 679,735 | | | $ | 352,016 | | | $ | 177,599 | | |
(a) The per share amounts and percentages reflect income and expenses assuming inclusion of the Fund's proportionate share of the income and expenses of Columbia Marsico Growth Master Portfolio.
(b) Effective November 10, 2008, the Fund converted to a stand-alone fund. Prior to Novermber 10, 2008, the Fund operated in a master-feeder structure.
(c) The Fund changed its fiscal year end from March 31 to February 29. Per share data and total return reflect activity from April 1, 2007 through February 29, 2008.
(d) On August 22, 2005, the Fund's Investor C shares were renamed Class C shares.
(e) Per share data was calculated using the average shares outstanding during the period.
(f) Rounds to less than $0.01 per share.
(g) Total return at net asset value assuming no contingent deferred sales charge.
(h) Had the investment advisor and/or any of its affiliates not waived fees or reimbursed a portion of expenses, total return would have been reduced.
(i) Not annualized.
(j) The benefits derived from expense reductions had an impact of less than 0.01%.
(k) Annualized.
(l) Bank of America Corporation assumed certain non-recurring costs. Absent these non-recurring costs, the waiver/reimbursement ratio would have been -%, -% and -% for the years ended March 31, 2006, March 31, 2005 and March 31, 2004, respectively.
(m) Amount represents results after the Fund's conversion to a stand-alone structure on November 10, 2008.
See Accompanying Notes to Financial Statements.
124
Financial Highlights – Columbia Marsico Growth Fund
Selected data for a share outstanding throughout each period is as follows:
| Class R Shares (a) | | Year
Ended
February 28,
2009 (b) | | Period
Ended
February 29,
2008 (c) | | Year
Ended
March 31,
2007 | | Period
Ended
March 31,
2006 (d) | |
| Net Asset Value, Beginning of Period | | $ | 20.13 | | | $ | 20.14 | | | $ | 19.49 | | | $ | 18.89 | | |
| Income from Investment Operations: | |
| Net investment income (loss) (e) | | | 0.02 | | | | 0.01 | | | | (0.08 | ) | | | (0.01 | ) | |
Net realized and unrealized gain on investments and
foreign currency | | | (8.95 | ) | | | (0.02 | ) | | | 0.73 | | | | 0.61 | | |
| Total from investment operations | | | (8.93 | ) | | | (0.01 | ) | | | 0.65 | | | | 0.60 | | |
| Net Asset Value, End of Period | | $ | 11.20 | | | $ | 20.13 | | | $ | 20.14 | | | $ | 19.49 | | |
| Total return (f)(g) | | | (44.36 | )% | | | (0.05 | )%(h) | | | 3.34 | % | | | 3.18 | %(h) | |
| Ratios to Average Net Assets/Supplemental Data: | |
| Net expenses | | | 1.49 | %(i) | | | 1.45 | %(i)(j) | | | 1.47 | %(i) | | | 1.54 | %(j) | |
| Waiver/Reimbursement | | | 0.02 | % | | | 0.01 | %(j) | | | 0.01 | % | | | 0.07 | %(j)(k) | |
| Net investment income (loss) | | | 0.15 | %(i) | | | 0.06 | %(i)(j) | | | (0.42 | )%(i) | | | (0.35 | )%(j) | |
| Portfolio turnover rate | | | 21 | %(h)(l) | | | — | | | | — | | | | — | | |
| Turnover of Columbia Marsico Growth Master Portfolio | | | 54 | %(h) | | | 58 | %(h) | | | 42 | % | | | 62 | %(h) | |
| Net assets, end of period (000's) | | $ | 9,941 | | | $ | 11,860 | | | $ | 3,669 | | | $ | 10 | | |
(a) The per share amounts and percentages reflect income and expenses assuming inclusion of the Fund's proportionate share of the income and expenses of Columbia Marsico Growth Master Portfolio.
(b) Effective November 10, 2008, the Fund converted to a stand-alone fund. Prior to Novermber 10, 2008, the Fund operated in a master-feeder structure.
(c) The Fund changed its fiscal year end from March 31 to February 29. Per share data and total return reflect activity from April 1, 2007 through February 29, 2008.
(d) Class R shares commenced operations on January 23, 2006.
(e) Per share data was calculated using the average shares outstanding during the period.
(f) Total return at net asset value.
(g) Had the investment advisor and/or any of its affiliates not waived fees or reimbursed a portion of expenses, total return would have been reduced.
(h) Not annualized.
(i) The benefits derived from expense reductions had an impact of less than 0.01%.
(j) Annualized.
(k) Bank of America Corporation assumed certain non-recurring costs. Absent these non-recurring costs, the waiver/reimbursement ratio would have been 0.01% for the period ended March 31, 2006.
(l) Amount represents results after the Fund's conversion to a stand-alone structure on November 10, 2008.
See Accompanying Notes to Financial Statements.
125
Financial Highlights – Columbia Marsico Growth Fund
Selected data for a share outstanding throughout each period is as follows:
| | | Year
Ended
February 28, | | Period
Ended
February 29, | | Year Ended March 31, | |
| Class Z Shares (a) | | 2009 (b) | | 2008 (c) | | 2007 | | 2006 (d) | | 2005 | | 2004 | |
| Net Asset Value, Beginning of Period | | $ | 20.63 | | | $ | 20.58 | | | $ | 19.82 | | | $ | 17.25 | | | $ | 15.96 | | | $ | 11.95 | | |
| Income from Investment Operations: | |
| Net investment income (loss) (e) | | | 0.11 | | | | 0.11 | | | | 0.05 | | | | 0.02 | | | | 0.01 | | | | (0.02 | ) | |
Net realized and unrealized gain (loss)
on investments and foreign currency | | | (9.17 | ) | | | (0.01 | ) | | | 0.71 | | | | 2.55 | | | | 1.28 | | | | 4.03 | | |
| Total from investment operations | | | (9.06 | ) | | | 0.10 | | | | 0.76 | | | | 2.57 | | | | 1.29 | | | | 4.01 | | |
| Less Distributions to Shareholders: | |
| From net investment income | | | (0.10 | ) | | | (0.05 | ) | | | — | | | | — | | | | — | | | | — | | |
| Net Asset Value, End of Period | | $ | 11.47 | | | $ | 20.63 | | | $ | 20.58 | | | $ | 19.82 | | | $ | 17.25 | | | $ | 15.96 | | |
| Total return (f)(g) | | | (44.09 | )% | | | 0.46 | %(h) | | | 3.83 | % | | | 14.90 | % | | | 8.08 | % | | | 33.56 | % | |
Ratios to Average Net Assets/
Supplemental Data: | |
| Net expenses | | | 0.99 | %(i) | | | 0.95 | %(i)(j) | | | 0.97 | %(i) | | | 0.96 | % | | | 1.05 | % | | | 1.12 | % | |
| Waiver/Reimbursement | | | 0.02 | % | | | 0.01 | %(j) | | | 0.01 | % | | | 0.06 | %(k) | | | 0.03 | %(k) | | | 0.02 | %(k) | |
| Net investment income (loss) | | | 0.63 | %(i) | | | 0.54 | %(i)(j) | | | 0.25 | %(i) | | | 0.11 | % | | | 0.04 | % | | | (0.17 | )% | |
| Portfolio turnover rate | | | 21 | %(h)(l) | | | — | | | | — | | | | — | | | | — | | | | — | | |
Turnover of Columbia Marsico Growth
Master Portfolio | | | 54 | %(h) | | | 58 | %(h) | | | 42 | % | | | 62 | % | | | 62 | % | | | 94 | % | |
| Net assets, end of period (000's) | | $ | 1,329,782 | | | $ | 2,335,800 | | | $ | 2,044,397 | | | $ | 1,446,667 | | | $ | 774,996 | | | $ | 371,942 | | |
(a) The per share amounts and percentages reflect income and expenses assuming inclusion of the Fund's proportionate share of the income and expenses of Columbia Marsico Growth Master Portfolio.
(b) Effective November 10, 2008, the Fund converted to a stand-alone fund. Prior to Novermber 10, 2008, the Fund operated in a master-feeder structure.
(c) The Fund changed its fiscal year end from March 31 to February 29. Per share data and total return reflect activity from April 1, 2007 through February 29, 2008.
(d) On August 22, 2005, the Fund's Primary A shares were renamed Class Z shares.
(e) Per share data was calculated using the average shares outstanding during the period.
(f) Total return at net asset value assuming all distributions reinvested.
(g) Had the investment advisor and/or any of its affiliates not waived fees or reimbursed a portion of expenses, total return would have been reduced.
(h) Not annualized.
(i) The benefits derived from expense reductions had an impact of less than 0.01%.
(j) Annualized.
(k) Bank of America Corporation assumed certain non-recurring costs. Absent these non-recurring costs, the waiver/reimbursement ratio would have been -%, -% and -% for the years ended March 31, 2006, March 31, 2005 and March 31, 2004, respectively.
(l) Amount represents results after the Fund's conversion to a stand-alone structure on November 10, 2008.
See Accompanying Notes to Financial Statements.
126
Financial Highlights – Columbia Large Cap Core Fund
Selected data for a share outstanding throughout each period is as follows:
| | | Year
Ended
February 28, | | Period
Ended
February 29, | | Year Ended March 31, | |
| Class A Shares | | 2009 | | 2008 (a)(b)(c) | | 2007 (a) | | 2006 (a)(d) | | 2005 (a) | | 2004 (a) | |
| Net Asset Value, Beginning of Period | | $ | 13.66 | | | $ | 14.86 | | | $ | 13.35 | | | $ | 12.00 | | | $ | 11.55 | | | $ | 8.76 | | |
| Income from Investment Operations: | |
| Net investment income (e) | | | 0.13 | | | | 0.11 | | | | 0.14 | | | | 0.11 | | | | 0.10 | | | | 0.03 | | |
Net realized and unrealized gain (loss)
on investments, foreign currency and
written options | | | (5.49 | ) | | | (0.41 | ) | | | 1.46 | | | | 1.35 | | | | 0.45 | (f) | | | 2.79 | | |
| Total from investment operations | | | (5.36 | ) | | | (0.30 | ) | | | 1.60 | | | | 1.46 | | | | 0.55 | | | | 2.82 | | |
| Less Distributions to Shareholders: | |
| From net investment income | | | (0.10 | ) | | | (0.14 | ) | | | (0.09 | ) | | | (0.11 | ) | | | (0.10 | ) | | | (0.03 | ) | |
| From net realized gains | | | (0.25 | ) | | | (0.76 | ) | | | — | | | | — | | | | — | | | | — | | |
| Total distributions to shareholders | | | (0.35 | ) | | | (0.90 | ) | | | (0.09 | ) | | | (0.11 | ) | | | (0.10 | ) | | | (0.03 | ) | |
| Net Asset Value, End of Period | | $ | 7.95 | | | $ | 13.66 | | | $ | 14.86 | | | $ | 13.35 | | | $ | 12.00 | | | $ | 11.55 | | |
| Total return (g) | | | (40.12 | )%(i) | | | (2.69 | )%(h) | | | 12.00 | % | | | 12.19 | %(i) | | | 4.71 | %(i)(j) | | | 32.21 | %(i) | |
Ratios to Average Net Assets/
Supplemental Data: | |
| Net expenses before interest expense | | | 1.15 | %(k) | | | 1.07 | %(k)(l) | | | 1.05 | %(k) | | | 1.03 | % | | | 1.12 | %(m) | | | 1.18 | %(m) | |
| Interest expense | | | — | %(n) | | | — | %(l)(n) | | | — | %(n) | | | — | | | | — | %(n) | | | — | | |
| Net expenses | | | 1.15 | %(k) | | | 1.07 | %(k)(l) | | | 1.05 | %(k) | | | 1.03 | % | | | 1.12 | %(m) | | | 1.18 | %(m) | |
| Waiver/Reimbursement | | | — | %(n) | | | — | | | | — | | | | 0.06 | %(o) | | | 0.03 | %(o) | | | 0.03 | %(o) | |
| Net investment income | | | 1.10 | %(k) | | | 0.81 | %(k)(l) | | | 0.98 | %(k) | | | 0.86 | % | | | 0.89 | % | | | 0.27 | % | |
| Portfolio turnover rate | | | 156 | % | | | — | %(h)(n)(p) | | | — | | | | — | | | | — | | | | — | | |
Turnover of Columbia Large Cap Core
Master Portfolio | | | — | | | | 98 | %(h) | | | 148 | % | | | 106 | % | | | 122 | % | | | 47 | % | |
| Net assets, end of period (000's) | | $ | 95,714 | | | $ | 172,569 | | | $ | 194,203 | | | $ | 201,359 | | | $ | 213,513 | | | $ | 245,616 | | |
(a) The per share amounts and percentages reflect income and expenses assuming inclusion of the Fund's proportionate share of the income and expenses of Columbia Large Cap Core Master Portfolio.
(b) The Fund changed its fiscal year end from March 31 to February 29. Per share data and total return reflect activity from April 1, 2007 through February 29, 2008.
(c) Effective February 28, 2008, the Fund converted to a stand-alone fund. Prior to February 28, 2008, the Fund operated in a master-feeder structure.
(d) On August 22, 2005, the Fund's Investor A shares were renamed Class A shares.
(e) Per share data was calculated using the average shares outstanding during the period.
(f) The effect of the investment advisor's reimbursement for the Fund exceeding certain investment restrictions is included in the net realized and unrealized gain (loss) on investments (per share). The effect of this reimbursement was less than $0.01.
(g) Total return at net asset value assuming all distributions reinvested and no initial sales charge or contingent deferred sales charge.
(h) Not annualized.
(i) Had the investment advisor and/or any of its affiliates not waived fees or reimbursed a portion of expenses, total return would have been reduced.
(j) Without the effect from the investment advisor's reimbursement for the Fund exceeding certain investment restrictions, total return would have been 4.70%.
(k) The benefits derived from expense reductions had an impact of less than 0.01%.
(l) Annualized.
(m) The reimbursement from the investment advisor had an impact of les than 0.01%.
(n) Rounds to less than 0.01%.
(o) Bank of America Corporation assumed certain non-recurring costs. Absent these non-recurring costs, the waiver/reimbursement ratio would have been -%, 0.01% and -% for the fiscal years ended March 31, 2006, March 31, 2005 and March 31, 2004, respectively.
(p) Amount represents results after the Fund's conversion to a stand-alone structure on February 28, 2008.
See Accompanying Notes to Financial Statements.
127
Financial Highlights – Columbia Large Cap Core Fund
Selected data for a share outstanding throughout each period is as follows:
| | | Year
Ended
February 28, | | Period
Ended
February 29, | | Year Ended March 31, | |
| Class B Shares | | 2009 | | 2008 (a)(b)(c) | | 2007 (a) | | 2006 (a)(d) | | 2005 (a) | | 2004 (a) | |
| Net Asset Value, Beginning of Period | | $ | 13.23 | | | $ | 14.39 | | | $ | 12.95 | | | $ | 11.65 | | | $ | 11.21 | | | $ | 8.54 | | |
| Income from Investment Operations: | |
| Net investment income (loss) (e) | | | 0.03 | | | | — | (f) | | | 0.03 | | | | 0.01 | | | | 0.02 | | | | (0.05 | ) | |
Net realized and unrealized gain (loss)
on investments, foreign currency and
written options | | | (5.28 | ) | | | (0.40 | ) | | | 1.41 | | | | 1.31 | | | | 0.42 | (g) | | | 2.72 | | |
| Total from investment operations | | | (5.25 | ) | | | (0.40 | ) | | | 1.44 | | | | 1.32 | | | | 0.44 | | | | 2.67 | | |
| Less Distributions to Shareholders: | |
| From net investment income | | | (0.02 | ) | | | — | (f) | | | — | | | | (0.02 | ) | | | — | (f) | | | — | | |
| From net realized gains | | | (0.25 | ) | | | (0.76 | ) | | | — | | | | — | | | | — | | | | — | | |
| Total distributions to shareholders | | | (0.27 | ) | | | (0.76 | ) | | | — | | | | (0.02 | ) | | | — | (f) | | | — | | |
| Net Asset Value, End of Period | | $ | 7.71 | | | $ | 13.23 | | | $ | 14.39 | | | $ | 12.95 | | | $ | 11.65 | | | $ | 11.21 | | |
| Total return (h) | | | (40.51 | )%(j) | | | (3.34 | )%(i) | | | 11.12 | % | | | 11.33 | %(j) | | | 3.93 | %(j)(k) | | | 31.26 | %(j) | |
Ratios to Average Net Assets/
Supplemental Data: | |
| Net expenses before interest expense | | | 1.90 | %(l) | | | 1.82 | %(l)(m) | | | 1.80 | %(l) | | | 1.78 | % | | | 1.87 | %(n) | | | 1.93 | %(n) | |
| Interest expense | | | — | %(o) | | | — | %(l)(o) | | | — | %(o) | | | — | | | | — | %(o) | | | — | | |
| Net expenses | | | 1.90 | %(l) | | | 1.82 | %(l)(m) | | | 1.80 | %(l) | | | 1.78 | % | | | 1.87 | %(n) | | | 1.93 | %(n) | |
| Waiver/Reimbursement | | | — | %(o) | | | — | | | | — | | | | 0.06 | %(p) | | | 0.03 | %(p) | | | 0.03 | %(p) | |
| Net investment income (loss) | | | 0.28 | %(l) | | | 0.03 | %(l)(m) | | | 0.21 | %(l) | | | 0.11 | % | | | 0.14 | % | | | (0.48 | )% | |
| Portfolio turnover rate | | | 156 | % | | | — | %(i)(o)(q) | | | — | | | | — | | | | — | | | | — | | |
Turnover of Columbia Large Cap Core
Master Portfolio | | | — | | | | 98 | %(i) | | | 148 | % | | | 106 | % | | | 122 | % | | | 47 | % | |
| Net assets, end of period (000's) | | $ | 3,300 | | | $ | 13,247 | | | $ | 25,523 | | | $ | 31,542 | | | $ | 37,140 | | | $ | 44,571 | | |
(a) The per share amounts and percentages reflect income and expenses assuming inclusion of the Fund's proportionate share of the income and expenses of Columbia Large Cap Core Master Portfolio.
(b) The Fund changed its fiscal year end from March 31 to February 29. Per share data and total return reflect activity from April 1, 2007 through February 29, 2008.
(c) Effective February 28, 2008, the Fund converted to a stand-alone fund. Prior to February 28, 2008, the Fund operated in a master-feeder structure.
(d) On August 22, 2005, the Fund's Investor B shares were renamed Class B shares.
(e) Per share data was calculated using the average shares outstanding during the period.
(f) Rounds to less than $0.01 per share.
(g) The effect of the investment advisor's reimbursement for the Fund exceeding certain investment restrictions is included in the net realized and unrealized gain (loss) on investments (per share). The effect of this reimbursement was less than $0.01.
(h) Total return at net asset value assuming all distributions reinvested and no contingent deferred sales charge.
(i) Not annualized.
(j) Had the investment advisor and/or any of its affiliates not waived fees or reimbursed a portion of expenses, total return would have been reduced.
(k) Without the effect from the investment advisor's reimbursement for the Fund exceeding certain investment restrictions, total return would have been 3.92%.
(l) The benefits derived from expense reductions had an impact of less than 0.01%.
(m) Annualized.
(n) The reimbursement from the investment advisor had an impact of les than 0.01%.
(o) Rounds to less than 0.01%.
(p) Bank of America Corporation assumed certain non-recurring costs. Absent these non-recurring costs, the waiver/reimbursement ratio would have been -%, 0.01% and -% for the fiscal years ended March 31, 2006, March 31, 2005 and March 31, 2004, respectively.
(q) Amount represents results after the Fund's conversion to a stand-alone structure on February 28, 2008.
See Accompanying Notes to Financial Statements.
128
Financial Highlights – Columbia Large Cap Core Fund
Selected data for a share outstanding throughout each period is as follows:
| | | Year
Ended
February 28, | | Period
Ended
February 29, | | Year Ended March 31, | |
| Class C Shares | | 2009 | | 2008 (a)(b)(c) | | 2007 (a) | | 2006 (a)(d) | | 2005 (a) | | 2004 (a) | |
| Net Asset Value, Beginning of Period | | $ | 13.23 | | | $ | 14.39 | | | $ | 12.94 | | | $ | 11.64 | | | $ | 11.21 | | | $ | 8.54 | | |
| Income from Investment Operations: | |
| Net investment income (loss) (e) | | | 0.04 | | | | 0.01 | | | | 0.03 | | | | 0.01 | | | | 0.02 | | | | (0.05 | ) | |
Net realized and unrealized gain (loss)
on investments, foreign currency and
written options | | | (5.30 | ) | | | (0.41 | ) | | | 1.42 | | | | 1.31 | | | | 0.42 | (f) | | | 2.72 | | |
| Total from investment operations | | | (5.26 | ) | | | (0.40 | ) | | | 1.45 | | | | 1.32 | | | | 0.44 | | | | 2.67 | | |
| Less Distributions to Shareholders: | |
| From net investment income | | | (0.02 | ) | | | — | (g) | | | — | | | | (0.02 | ) | | | (0.01 | ) | | | — | | |
| From net realized gains | | | (0.25 | ) | | | (0.76 | ) | | | — | | | | — | | | | — | | | | — | | |
| Total distributions to shareholders | | | (0.27 | ) | | | (0.76 | ) | | | — | | | | (0.02 | ) | | | (0.01 | ) | | | — | | |
| Net Asset Value, End of Period | | $ | 7.70 | | | $ | 13.23 | | | $ | 14.39 | | | $ | 12.94 | | | $ | 11.64 | | | $ | 11.21 | | |
| Total return (h) | | | (40.58 | )%(j) | | | (3.34 | )%(i) | | | 11.21 | % | | | 11.34 | %(j) | | | 3.91 | %(j)(k) | | | 31.26 | %(j) | |
Ratios to Average Net Assets/
Supplemental Data: | |
| Net expenses before interest expense | | | 1.90 | %(l) | | | 1.82 | %(l)(m) | | | 1.80 | %(l) | | | 1.78 | % | | | 1.87 | %(n) | | | 1.93 | %(n) | |
| Interest expense | | | — | %(o) | | | — | %(l)(o) | | | — | %(o) | | | — | | | | — | %(o) | | | — | | |
| Net expenses | | | 1.90 | %(l) | | | 1.82 | %(l)(m) | | | 1.80 | %(l) | | | 1.78 | % | | | 1.87 | %(n) | | | 1.93 | %(n) | |
| Waiver/Reimbursement | | | — | %(o) | | | — | | | | — | | | | 0.06 | %(p) | | | 0.03 | %(p) | | | 0.03 | %(p) | |
| Net investment income (loss) | | | 0.39 | %(l) | | | 0.04 | %(l)(m) | | | 0.21 | %(l) | | | 0.11 | % | | | 0.14 | % | | | (0.48 | )% | |
| Portfolio turnover rate | | | 156 | % | | | — | %(i)(o)(q) | | | — | | | | — | | | | — | | | | — | | |
Turnover of Columbia Large Cap Core
Master Portfolio | | | — | | | | 98 | %(i) | | | 148 | % | | | 106 | % | | | 122 | % | | | 47 | % | |
| Net assets, end of period (000's) | | $ | 1,559 | | | $ | 2,168 | | | $ | 11,413 | | | $ | 14,026 | | | $ | 14,899 | | | $ | 16,702 | | |
(a) The per share amounts and percentages reflect income and expenses assuming inclusion of the Fund's proportionate share of the income and expenses of Columbia Large Cap Core Master Portfolio.
(b) The Fund changed its fiscal year end from March 31 to February 29. Per share data and total return reflect activity from April 1, 2007 through February 29, 2008.
(c) Effective February 28, 2008, the Fund converted to a stand-alone fund. Prior to February 28, 2008, the Fund operated in a master-feeder structure.
(d) On August 22, 2005, the Fund's Investor C shares were renamed Class C shares.
(e) Per share data was calculated using the average shares outstanding during the period.
(f) The effect of the investment advisor's reimbursement for the Fund exceeding certain investment restrictions is included in the net realized and unrealized gain (loss) on investments (per share). The effect of this reimbursement was less than $0.01.
(g) Rounds to less than $0.01 per share.
(h) Total return at net asset value assuming all distributions reinvested and no contingent deferred sales charge.
(i) Not annualized.
(j) Had the investment advisor and/or any of its affiliates not waived fees or reimbursed a portion of expenses, total return would have been reduced.
(k) Without the effect from the investment advisor's reimbursement for the Fund exceeding certain investment restrictions, total return would have been 3.92%.
(l) The benefits derived from expense reductions had an impact of less than 0.01%.
(m) Annualized.
(n) The reimbursement from the investment advisor had an impact of les than 0.01%.
(o) Rounds to less than 0.01%.
(p) Bank of America Corporation assumed certain non-recurring costs. Absent these non-recurring costs, the waiver/reimbursement ratio would have been -%, 0.01% and -% for the fiscal years ended March 31, 2006, March 31, 2005 and March 31, 2004, respectively.
(q) Amount represents results after the Fund's conversion to a stand-alone structure on February 28, 2008.
See Accompanying Notes to Financial Statements.
129
Financial Highlights – Columbia Large Cap Core Fund
Selected data for a share outstanding throughout each period is as follows:
| | | Year
Ended
February 28, | | Period
Ended
February 29, | | Year Ended March 31, | |
| Class Z Shares | | 2009 | | 2008 (a)(b)(c) | | 2007 (a) | | 2006 (a)(d) | | 2005 (a) | | 2004 (a) | |
| Net Asset Value, Beginning of Period | | $ | 13.66 | | | $ | 14.88 | | | $ | 13.39 | | | $ | 12.03 | | | $ | 11.58 | | | $ | 8.78 | | |
| Income from Investment Operations: | |
| Net investment income (e) | | | 0.16 | | | | 0.15 | | | | 0.17 | | | | 0.14 | | | | 0.13 | | | | 0.05 | | |
Net realized and unrealized gain (loss)
on investments, foreign currency and
written options | | | (5.48 | ) | | | (0.41 | ) | | | 1.47 | | | | 1.36 | | | | 0.45 | (f) | | | 2.81 | | |
| Total from investment operations | | | (5.32 | ) | | | (0.26 | ) | | | 1.64 | | | | 1.50 | | | | 0.58 | | | | 2.86 | | |
| Less Distributions to Shareholders: | |
| From net investment income | | | (0.16 | ) | | | (0.20 | ) | | | (0.15 | ) | | | (0.14 | ) | | | (0.13 | ) | | | (0.06 | ) | |
| From net realized gains | | | (0.25 | ) | | | (0.76 | ) | | | — | | | | — | | | | — | | | | — | | |
| Total distributions to shareholders | | | (0.41 | ) | | | (0.96 | ) | | | (0.15 | ) | | | (0.14 | ) | | | (0.13 | ) | | | (0.06 | ) | |
| Net Asset Value, End of Period | | $ | 7.93 | | | $ | 13.66 | | | $ | 14.88 | | | $ | 13.39 | | | $ | 12.03 | | | $ | 11.58 | | |
| Total return (g) | | | (39.95 | )%(i) | | | (2.43 | )%(h) | | | 12.28 | % | | | 12.50 | %(i) | | | 4.98 | %(i)(j) | | | 32.58 | %(i) | |
Ratios to Average Net Assets/
Supplemental Data: | |
| Net expenses before interest expense | | | 0.90 | %(k) | | | 0.82 | %(k)(l) | | | 0.80 | %(k) | | | 0.78 | % | | | 0.87 | %(m) | | | 0.93 | %(m) | |
| Interest expense | | | — | %(n) | | | — | %(l)(n) | | | — | %(n) | | | — | | | | — | | | | — | | |
| Net expenses | | | 0.90 | %(k) | | | 0.82 | %(k)(l) | | | 0.80 | %(k) | | | 0.78 | % | | | 0.87 | %(m) | | | 0.93 | %(m) | |
| Waiver/Reimbursement | | | — | %(n) | | | — | | | | — | | | | 0.06 | %(o) | | | 0.03 | %(o) | | | 0.03 | %(o) | |
| Net investment income | | | 1.35 | %(k) | | | 1.06 | %(k)(l) | | | 1.23 | %(k) | | | 1.11 | % | | | 1.14 | % | | | 0.52 | % | |
| Portfolio turnover rate | | | 156 | % | | | — | %(h)(n)(p) | | | — | | | | — | | | | — | | | | — | | |
Turnover of Columbia Large Cap Core
Master Portfolio | | | — | | | | 98 | %(h) | | | 148 | % | | | 106 | % | | | 122 | % | | | 47 | % | |
| Net assets, end of period (000's) | | $ | 712,304 | | | $ | 1,285,598 | | | $ | 1,466,653 | | | $ | 1,347,623 | | | $ | 1,187,622 | | | $ | 1,517,644 | | |
(a) The per share amounts and percentages reflect income and expenses assuming inclusion of the Fund's proportionate share of the income and expenses of Columbia Large Cap Core Master Portfolio.
(b) The Fund changed its fiscal year end from March 31 to February 29. Per share data and total return reflect activity from April 1, 2007 through February 29, 2008.
(c) Effective February 28, 2008, the Fund converted to a stand-alone fund. Prior to February 28, 2008, the Fund operated in a master-feeder structure.
(d) On August 22, 2005, the Fund's Primary A shares were renamed Class Z shares.
(e) Per share data was calculated using the average shares outstanding during the period.
(f) The effect of the investment advisor's reimbursement for the Fund exceeding certain investment restrictions is included in the net realized and unrealized gain (loss) on investments (per share). The effect of this reimbursement was less than $0.01.
(g) Total return at net asset value assuming all distributions reinvested.
(h) Not annualized.
(i) Had the investment advisor and/or any of its affiliates not waived fees or reimbursed a portion of expenses, total return would have been reduced.
(j) Without the effect from the investment advisor's reimbursement for the Fund exceeding certain investment restrictions, total return would have been 4.70%.
(k) The benefits derived from expense reductions had an impact of less than 0.01%.
(l) Annualized.
(m) The reimbursement from the investment advisor had an impact of les than 0.01%.
(n) Rounds to less than 0.01%.
(o) Bank of America Corporation assumed certain non-recurring costs. Absent these non-recurring costs, the waiver/reimbursement ratio would have been -%, 0.01% and -% for the fiscal years ended March 31, 2006, March 31, 2005 and March 31, 2004, respectively.
(p) Amount represents results after the Fund's conversion to a stand-alone structure on February 28, 2008.
See Accompanying Notes to Financial Statements.
130
Financial Highlights – Columbia Marsico Focused Equities Fund
Selected data for a share outstanding throughout each period is as follows:
| | | Year
Ended
February 28, | | Period
Ended
February 29, | | Year Ended March 31, | |
| Class A Shares | | 2009 | | 2008 (a)(b)(d) | | 2007 (d) | | 2006 (c)(d) | | 2005 (d) | | 2004 (d) | |
| Net Asset Value, Beginning of Period | | $ | 21.59 | | | $ | 21.81 | | | $ | 21.10 | | | $ | 17.67 | | | $ | 16.79 | | | $ | 12.70 | | |
| Income from Investment Operations: | |
| Net investment income (loss) (e) | | | 0.07 | | | | 0.02 | | | | (0.04 | ) | | | (0.05 | ) | | | (0.06 | ) | | | (0.08 | ) | |
Net realized and unrealized gain (loss)
on investments and foreign currency | | | (8.86 | ) | | | 0.02 | | | | 0.75 | | | | 3.48 | | | | 0.94 | | | | 4.17 | | |
| Total from investment operations | | | (8.79 | ) | | | 0.04 | | | | 0.71 | | | | 3.43 | | | | 0.88 | | | | 4.09 | | |
| Less Distributions to Shareholders: | |
| From net investment income | | | (0.04 | ) | | | — | | | | — | | | | — | | | | — | | | | — | | |
| From net realized gains | | | — | | | | (0.26 | ) | | | — | | | | — | | | | — | | | | — | | |
| Total distributions to shareholders | | | (0.04 | ) | | | (0.26 | ) | | | — | | | | — | | | | — | | | | — | | |
| Net Asset Value, End of Period | | $ | 12.76 | | | $ | 21.59 | | | $ | 21.81 | | | $ | 21.10 | | | $ | 17.67 | | | $ | 16.79 | | |
| Total return (f)(g) | | | (40.73 | )% | | | 0.00 | %(h) | | | 3.36 | % | | | 19.41 | % | | | 5.24 | % | | | 32.20 | % | |
Ratios to Average Net Assets/
Supplemental Data: | |
| Net expenses before interest expense (i) | | | 1.26 | % | | | 1.22 | %(j) | | | 1.24 | % | | | 1.22 | % | | | 1.30 | % | | | 1.34 | % | |
| Interest expense | | | — | | | | — | %(j)(k) | | | — | | | | — | | | | — | | | | — | | |
| Net expenses (i) | | | 1.26 | % | | | 1.22 | %(j) | | | 1.24 | % | | | 1.22 | % | | | 1.30 | % | | | 1.34 | % | |
| Waiver/Reimbursement | | | 0.05 | % | | | 0.03 | %(j) | | | 0.04 | % | | | 0.08 | %(l) | | | 0.03 | %(l) | | | 0.03 | %(l) | |
| Net investment income (loss) (i) | | | 0.37 | % | | | 0.11 | %(j) | | | (0.19 | )% | | | (0.27 | )% | | | (0.37 | )% | | | (0.49 | )% | |
| Portfolio turnover rate | | | 85 | % | | | — | %(h)(k)(m) | | | — | | | | — | | | | — | | | | — | | |
Turnover of Columbia Marsico Focused
Equities Master Portfolio | | | — | | | | 82 | %(h) | | | 52 | % | | | 71 | % | | | 89 | % | | | 96 | % | |
| Net assets, end of period (000's) | | $ | 1,312,382 | | | $ | 2,524,540 | | | $ | 2,488,288 | | | $ | 2,061,076 | | | $ | 1,256,948 | | | $ | 1,030,985 | | |
(a) The Fund changed its fiscal year end from March 31 to February 29. Per share data and total return reflect activity from April 1, 2007 through February 29, 2008.
(b) Effective February 28, 2008, the Fund converted to a stand-alone fund. Prior to February 28, 2008, the Fund operated in a master-feeder structure.
(c) On August 22, 2005, the Fund's Investor A shares were renamed Class A shares.
(d) The per share amounts and percentages reflect income and expenses assuming inclusion of the Fund's proportionate share of the income and expenses of Columbia Marsico Focused Equities Master Portfolio.
(e) Per share data was calculated using the average shares outstanding during the period.
(f) Total return at net asset value assuming all distributions reinvested and no initial sales charge or contingent deferred sales charge.
(g) Had the investment advisor and/or any of its affiliates not waived fees or reimbursed a portion of expenses, total return would have been reduced.
(h) Not annualized.
(i) The benefits derived from expense reductions had an impact of less than 0.01%.
(j) Annualized.
(k) Rounds to less than 0.01%.
(l) Bank of America Corporation assumed certain non-recurring costs. Absent these non-recurring costs, the waiver/reimbursement ratio would have been 0.02%, -% and -% for the years ended March 31, 2006, March 31, 2005 and March 31, 2004, respectively.
(m) Amount represents results after the Fund's conversion to a stand-alone structure on February 28, 2008.
See Accompanying Notes to Financial Statements.
131
Financial Highlights – Columbia Marsico Focused Equities Fund
Selected data for a share outstanding throughout each period is as follows:
| | | Year
Ended
February 28, | | Period
Ended
February 29, | | Year Ended March 31, | |
| Class B Shares | | 2009 | | 2008 (a)(b)(d) | | 2007 (d) | | 2006 (c)(d) | | 2005 (d) | | 2004 (d) | |
| Net Asset Value, Beginning of Period | | $ | 20.07 | | | $ | 20.42 | | | $ | 19.91 | | | $ | 16.80 | | | $ | 16.08 | | | $ | 12.25 | | |
| Income from Investment Operations: | |
| Net investment loss (e) | | | (0.07 | ) | | | (0.13 | ) | | | (0.17 | ) | | | (0.18 | ) | | | (0.18 | ) | | | (0.19 | ) | |
Net realized and unrealized gain (loss)
on investments and foreign currency | | | (8.20 | ) | | | 0.04 | | | | 0.68 | | | | 3.29 | | | | 0.90 | | | | 4.02 | | |
| Total from investment operations | | | (8.27 | ) | | | (0.09 | ) | | | 0.51 | | | | 3.11 | | | | 0.72 | | | | 3.83 | | |
| Less Distributions to Shareholders: | |
| From net realized gains | | | — | | | | (0.26 | ) | | | — | | | | — | | | | — | | | | — | | |
| Net Asset Value, End of Period | | $ | 11.80 | | | $ | 20.07 | | | $ | 20.42 | | | $ | 19.91 | | | $ | 16.80 | | | $ | 16.08 | | |
| Total return (f)(g) | | | (41.21 | )% | | | (0.64 | )%(h) | | | 2.56 | % | | | 18.51 | % | | | 4.48 | % | | | 31.27 | % | |
Ratios to Average Net Assets/
Supplemental Data: | |
| Net expenses before interest expense (i) | | | 2.01 | % | | | 1.97 | %(j) | | | 1.99 | % | | | 1.97 | % | | | 2.05 | % | | | 2.09 | % | |
| Interest expense | | | — | | | | — | %(j)(k) | | | — | | | | — | | | | — | | | | — | | |
| Net expenses (i) | | | 2.01 | % | | | 1.97 | %(j) | | | 1.99 | % | | | 1.97 | % | | | 2.05 | % | | | 2.09 | % | |
| Waiver/Reimbursement | | | 0.05 | % | | | 0.03 | %(j) | | | 0.04 | % | | | 0.08 | %(l) | | | 0.03 | %(l) | | | 0.03 | %(l) | |
| Net investment loss (i) | | | (0.40 | )% | | | (0.67 | )%(j) | | | (0.85 | )% | | | (1.01 | )% | | | (1.12 | )% | | | (1.24 | )% | |
| Portfolio turnover rate | | | 85 | % | | | — | %(h)(k)(m) | | | — | | | | — | | | | — | | | | — | | |
Turnover of Columbia Marsico Focused
Equities Master Portfolio | | | — | | | | 82 | %(h) | | | 52 | % | | | 71 | % | | | 89 | % | | | 96 | % | |
| Net assets, end of period (000's) | | $ | 64,937 | | | $ | 196,114 | | | $ | 348,836 | | | $ | 509,933 | | | $ | 517,489 | | | $ | 576,884 | | |
(a) The Fund changed its fiscal year end from March 31 to February 29. Per share data and total return reflect activity from April 1, 2007 through February 29, 2008.
(b) Effective February 28, 2008, the Fund converted to a stand-alone fund. Prior to February 28, 2008, the Fund operated in a master-feeder structure.
(c) On August 22, 2005, the Fund's Investor B shares were renamed Class B shares.
(d) The per share amounts and percentages reflect income and expenses assuming inclusion of the Fund's proportionate share of the income and expenses of Columbia Marsico Focused Equities Master Portfolio.
(e) Per share data was calculated using the average shares outstanding during the period.
(f) Total return at net asset value assuming all distributions reinvested and no contingent deferred sales charge.
(g) Had the investment advisor and/or any of its affiliates not waived fees or reimbursed a portion of expenses, total return would have been reduced.
(h) Not annualized.
(i) The benefits derived from expense reductions had an impact of less than 0.01%.
(j) Annualized.
(k) Rounds to less than 0.01%.
(l) Bank of America Corporation assumed certain non-recurring costs. Absent these non-recurring costs, the waiver/reimbursement ratio would have been 0.02%, -% and -% for the years ended March 31, 2006, March 31, 2005 and March 31, 2004, respectively.
(m) Amount represents results after the Fund's conversion to a stand-alone structure on February 28, 2008.
See Accompanying Notes to Financial Statements.
132
Financial Highlights – Columbia Marsico Focused Equities Fund
Selected data for a share outstanding throughout each period is as follows:
| | | Year
Ended
February 28, | | Period
Ended
February 29, | | Year Ended March 31, | |
| Class C Shares | | 2009 | | 2008 (a)(b)(d) | | 2007 (d) | | 2006 (c)(d) | | 2005 (d) | | 2004 (d) | |
| Net Asset Value, Beginning of Period | | $ | 20.13 | | | $ | 20.49 | | | $ | 19.97 | | | $ | 16.85 | | | $ | 16.13 | | | $ | 12.29 | | |
| Income from Investment Operations: | |
| Net investment loss (e) | | | (0.07 | ) | | | (0.15 | ) | | | (0.18 | ) | | | (0.19 | ) | | | (0.18 | ) | | | (0.19 | ) | |
Net realized and unrealized gain (loss)
on investments and foreign currency | | | (8.22 | ) | | | 0.05 | | | | 0.70 | | | | 3.31 | | | | 0.90 | | | | 4.03 | | |
| Total from investment operations | | | (8.29 | ) | | | (0.10 | ) | | | 0.52 | | | | 3.12 | | | | 0.72 | | | | 3.84 | | |
| Less Distributions to Shareholders: | |
| From net realized gains | | | — | | | | (0.26 | ) | | | — | | | | — | | | | — | | | | — | | |
| Net Asset Value, End of Period | | $ | 11.84 | | | $ | 20.13 | | | $ | 20.49 | | | $ | 19.97 | | | $ | 16.85 | | | $ | 16.13 | | |
| Total return (f)(g) | | | (41.18 | )% | | | (0.69 | )%(h) | | | 2.60 | % | | | 18.52 | % | | | 4.46 | % | | | 31.24 | % | |
Ratios to Average Net Assets/
Supplemental Data: | |
| Net expenses before interest expense (i) | | | 2.01 | % | | | 1.97 | %(j) | | | 1.99 | % | | | 1.97 | % | | | 2.05 | % | | | 2.09 | % | |
| Interest expense | | | — | | | | — | %(j)(k) | | | — | | | | — | | | | — | | | | — | | |
| Net expenses (i) | | | 2.01 | % | | | 1.97 | %(j) | | | 1.99 | % | | | 1.97 | % | | | 2.05 | % | | | 2.09 | % | |
| Waiver/Reimbursement | | | 0.05 | % | | | 0.03 | %(j) | | | 0.04 | % | | | 0.08 | %(l) | | | 0.03 | %(l) | | | 0.03 | %(l) | |
| Net investment loss (i) | | | (0.38 | )% | | | (0.74 | )%(j) | | | (0.92 | )% | | | (1.01 | )% | | | (1.12 | )% | | | (1.24 | )% | |
| Portfolio turnover rate | | | 85 | % | | | — | %(h)(k)(m) | | | — | | | | — | | | | — | | | | — | | |
Turnover of Columbia Marsico Focused
Equities Master Portfolio | | | — | | | | 82 | %(h) | | | 52 | % | | | 71 | % | | | 89 | % | | | 96 | % | |
| Net assets, end of period (000's) | | $ | 258,191 | | | $ | 522,644 | | | $ | 582,805 | | | $ | 532,250 | | | $ | 382,989 | | | $ | 342,885 | | |
(a) The Fund changed its fiscal year end from March 31 to February 29. Per share data and total return reflect activity from April 1, 2007 through February 29, 2008.
(b) Effective February 28, 2008, the Fund converted to a stand-alone fund. Prior to February 28, 2008, the Fund operated in a master-feeder structure.
(c) On August 22, 2005, the Fund's Investor C shares were renamed Class C shares.
(d) The per share amounts and percentages reflect income and expenses assuming inclusion of the Fund's proportionate share of the income and expenses of Columbia Marsico Focused Equities Master Portfolio.
(e) Per share data was calculated using the average shares outstanding during the period.
(f) Had the investment advisor and/or any of its affiliates not waived fees or reimbursed a portion of expenses, total return would have been reduced.
(g) Total return at net asset value assuming all distributions reinvested and no contingent deferred sales charge.
(h) Not annualized.
(i) The benefits derived from expense reductions had an impact of less than 0.01%.
(j) Annualized.
(k) Rounds to less than 0.01%.
(l) Bank of America Corporation assumed certain non-recurring costs. Absent these non-recurring costs, the waiver/reimbursement ratio would have been 0.02%, -% and -% for the years ended March 31, 2006, March 31, 2005 and March 31, 2004, respectively.
(m) Amount represents results after the Fund's conversion to a stand-alone structure on February 28, 2008.
See Accompanying Notes to Financial Statements.
133
Financial Highlights – Columbia Marsico Focused Equities Fund
Selected data for a share outstanding throughout each period is as follows:
| | | Year
Ended
February 28, | | Period
Ended
February 29, | | Year Ended March 31, | |
| Class Z Shares | | 2009 | | 2008 (a)(b)(d) | | 2007 (d) | | 2006 (c)(d) | | 2005 (d) | | 2004 (d) | |
| Net Asset Value, Beginning of Period | | $ | 22.06 | | | $ | 22.22 | | | $ | 21.45 | | | $ | 17.92 | | | $ | 16.98 | | | $ | 12.81 | | |
| Income from Investment Operations: | |
| Net investment income (loss) (e) | | | 0.13 | | | | 0.09 | | | | 0.01 | | | | — | (f) | | | (0.02 | ) | | | (0.04 | ) | |
Net realized and unrealized gain (loss)
on investments and foreign currency | | | (9.07 | ) | | | 0.01 | | | | 0.76 | | | | 3.53 | | | | 0.96 | | | | 4.21 | | |
| Total from investment operations | | | (8.94 | ) | | | 0.10 | | | | 0.77 | | | | 3.53 | | | | 0.94 | | | | 4.17 | | |
| Less Distributions to Shareholders: | |
| From net investment income | | | (0.10 | ) | | | — | | | | — | | | | — | | | | — | | | | — | | |
| From net realized gains | | | — | | | | (0.26 | ) | | | — | | | | — | | | | — | | | | — | | |
| Total distributions to shareholders | | | (0.10 | ) | | | (0.26 | ) | | | — | | | | — | | | | — | | | | — | | |
| Net Asset Value, End of Period | | $ | 13.02 | | | $ | 22.06 | | | $ | 22.22 | | | $ | 21.45 | | | $ | 17.92 | | | $ | 16.98 | | |
| Total return (g)(h) | | | (40.60 | )% | | | 0.27 | %(i) | | | 3.59 | % | | | 19.70 | % | | | 5.54 | % | | | 32.55 | % | |
Ratios to Average Net Assets/
Supplemental Data: | |
| Net expenses before interest expense (j) | | | 1.01 | % | | | 0.97 | %(k) | | | 0.99 | % | | | 0.97 | % | | | 1.05 | % | | | 1.09 | % | |
| Interest expense | | | — | | | | — | %(k)(l) | | | — | | | | — | | | | — | | | | — | | |
| Net expenses (j) | | | 1.01 | % | | | 0.97 | %(k) | | | 0.99 | % | | | 0.97 | % | | | 1.05 | % | | | 1.09 | % | |
| Waiver/Reimbursement | | | 0.05 | % | | | 0.03 | %(k) | | | 0.04 | % | | | 0.08 | %(m) | | | 0.03 | %(m) | | | 0.03 | %(m) | |
| Net investment income (loss) (j) | | | 0.65 | % | | | 0.40 | %(k) | | | 0.06 | % | | | (0.01 | )% | | | (0.12 | )% | | | (0.24 | )% | |
| Portfolio turnover rate | | | 85 | % | | | — | %(i)(l)(n) | | | — | | | | — | | | | — | | | | — | | |
Turnover of Columbia Marsico Focused
Equities Master Portfolio | | | — | | | | 82 | %(i) | | | 52 | % | | | 71 | % | | | 89 | % | | | 96 | % | |
| Net assets, end of period (000's) | | $ | 874,565 | | | $ | 1,285,252 | | | $ | 1,247,610 | | | $ | 1,022,812 | | | $ | 751,124 | | | $ | 701,306 | | |
(a) The Fund changed its fiscal year end from March 31 to February 29. Per share data and total return reflect activity from April 1, 2007 through February 29, 2008.
(b) Effective February 28, 2008, the Fund converted to a stand-alone fund. Prior to February 28, 2008, the Fund operated in a master-feeder structure.
(c) On August 22, 2005, the Fund's Primary A shares were renamed Class Z shares.
(d) The per share amounts and percentages reflect income and expenses assuming inclusion of the Fund's proportionate share of the income and expenses of Columbia Marsico Focused Equities Master Portfolio.
(e) Per share data was calculated using the average shares outstanding during the period.
(f) Rounds to less than $0.01 per share.
(g) Total return at net asset value assuming all distributions reinvested.
(h) Had the investment advisor and/or any of its affiliates not waived fees or reimbursed a portion of expenses, total return would have been reduced.
(i) Not annualized.
(j) The benefits derived from expense reductions had an impact of less than 0.01%.
(k) Annualized.
(l) Rounds to less than 0.01%.
(m) Bank of America Corporation assumed certain non-recurring costs. Absent these non-recurring costs, the waiver/reimbursement ratio would have been 0.02%, -% and -% for the years ended March 31, 2006, March 31, 2005 and March 31, 2004, respectively.
(n) Amount represents results after the Fund's conversion to a stand-alone structure on February 28, 2008.
See Accompanying Notes to Financial Statements.
134
Financial Highlights – Columbia Marsico 21st Century Fund
Selected data for a share outstanding throughout each period is as follows:
| | | Year
Ended
February 28, | | Year
Ended
February 29, | | Period
Ended
February 28, | | Year Ended March 31, | |
| Class A Shares | | 2009 | | 2008 | | 2007 (a) | | 2006 (b) | | 2005 | | 2004 | |
| Net Asset Value, Beginning of Period | | $ | 14.55 | | | $ | 14.28 | | | $ | 13.58 | | | $ | 10.61 | | | $ | 9.70 | | | $ | 6.19 | | |
| Income from Investment Operations: | |
| Net investment income (loss) (c) | | | 0.01 | | | | 0.02 | | | | 0.11 | (d) | | | (0.03 | ) | | | (0.05 | ) | | | (0.05 | ) | |
Net realized and unrealized gain (loss)
on investments and foreign currency | | | (7.25 | ) | | | 0.77 | (e) | | | 0.89 | | | | 3.00 | | | | 0.96 | | | | 3.56 | | |
| Total from investment operations | | | (7.24 | ) | | | 0.79 | | | | 1.00 | | | | 2.97 | | | | 0.91 | | | | 3.51 | | |
| Less Distributions to Shareholders: | |
| From net investment income | | | — | | | | — | | | | (0.10 | ) | | | — | (f) | | | — | | | | — | | |
| From net realized gains | | | — | | | | (0.49 | ) | | | (0.20 | ) | | | — | | | | — | | | | — | | |
| From return of capital | | | — | | | | (0.03 | ) | | | — | | | | — | | | | — | | | | — | | |
| Total distributions to shareholders | | | — | | | | (0.52 | ) | | | (0.30 | ) | | | — | (f) | | | — | | | | — | | |
| Redemption Fees: | |
| Redemption fees added to paid-in-capital | | | — | (c)(f) | | | — | | | | — | | | | — | | | | — | | | | — | | |
| Net Asset Value, End of Period | | $ | 7.31 | | | $ | 14.55 | | | $ | 14.28 | | | $ | 13.58 | | | $ | 10.61 | | | $ | 9.70 | | |
| Total return (g) | | | (49.76 | )%(h) | | | 5.16 | %(h) | | | 7.59 | %(h)(i) | | | 28.04 | %(h) | | | 9.38 | % | | | 56.70 | % | |
Ratios to Average Net Assets/
Supplemental Data: | |
| Net expenses before interest expense (j) | | | 1.25 | % | | | 1.20 | % | | | 1.26 | %(k) | | | 1.31 | % | | | 1.40 | % | | | 1.49 | % | |
| Interest expense | | | — | | | | — | | | | — | | | | — | | | | — | %(l) | | | — | %(l) | |
| Net expenses (j) | | | 1.25 | % | | | 1.20 | % | | | 1.26 | %(k) | | | 1.31 | % | | | 1.40 | % | | | 1.49 | % | |
| Waiver/Reimbursement | | | 0.04 | % | | | 0.02 | % | | | 0.02 | %(k) | | | 0.01 | % | | | — | | | | — | | |
| Net investment income (loss) (j) | | | 0.12 | % | | | 0.15 | % | | | 0.84 | %(k) | | | (0.22 | )% | | | (0.50 | )% | | | (0.59 | )% | |
| Portfolio turnover rate | | | 152 | % | | | 113 | % | | | 86 | %(i) | | | 141 | % | | | 130 | % | | | 204 | % | |
| Net assets, end of period (000's) | | $ | 1,967,386 | | | $ | 5,062,299 | | | $ | 2,474,268 | | | $ | 675,287 | | | $ | 187,094 | | | $ | 48,630 | | |
(a) The Fund changed its fiscal year end from March 31 to February 28. Per share data and total return reflect activity from April 1, 2006 through February 28, 2007.
(b) On August 22, 2005, the Fund's Investor A shares were renamed Class A shares.
(c) Per share data was calculated using the average shares outstanding during the period.
(d) Net investment income per share reflects special dividends. The effect of these dividends amounted to $0.08 per share.
(e) The amount shown for a share outstanding does not correspond with the aggregate net loss on investments for the period due to timing of repurchases of Fund shares in relation to fluctuating market values of the investments of the Fund.
(f) Rounds to less than $0.01 per share.
(g) Total return at net asset value assuming all distributions reinvested and no initial sales charge or contingent deferred sales charge.
(h) Had the investment advisor and/or any of its affiliates not waived fees or reimbursed a portion of expenses, total return would have been reduced.
(i) Not annualized.
(j) The benefits derived from expense reductions had an impact of less than 0.01%, except for the period ended February 28, 2007 and the year ended March 31, 2006, which had an impact of 0.07% and 0.08%, respectively.
(k) Annualized.
(l) Rounds to less than 0.01%.
See Accompanying Notes to Financial Statements.
135
Financial Highlights – Columbia Marsico 21st Century Fund
Selected data for a share outstanding throughout each period is as follows:
| | | Year
Ended
February 28, | | Year
Ended
February 29, | | Period
Ended
February 28, | | Year Ended March 31, | |
| Class B Shares | | 2009 | | 2008 | | 2007 (a) | | 2006 (b) | | 2005 | | 2004 | |
| Net Asset Value, Beginning of Period | | $ | 13.86 | | | $ | 13.73 | | | $ | 12.99 | | | $ | 10.22 | | | $ | 9.42 | | | $ | 6.05 | | |
| Income from Investment Operations: | |
| Net investment income (loss) (c) | | | (0.07 | ) | | | (0.08 | ) | | | — | (d)(e) | | | (0.11 | ) | | | (0.12 | ) | | | (0.13 | ) | |
Net realized and unrealized gain (loss)
on investments and foreign currency | | | (6.87 | ) | | | 0.73 | (f) | | | 0.88 | | | | 2.88 | | | | 0.92 | | | | 3.50 | | |
| Total from investment operations | | | (6.94 | ) | | | 0.65 | | | | 0.88 | | | | 2.77 | | | | 0.80 | | | | 3.37 | | |
| Less Distributions to Shareholders: | |
| From net investment income | | | — | | | | — | | | | (0.02 | ) | | | — | | | | — | | | | — | | |
| From net realized gains | | | — | | | | (0.49 | ) | | | (0.12 | ) | | | — | | | | — | | | | — | | |
| From return of capital | | | — | | | | (0.03 | ) | | | — | | | | — | | | | — | | | | — | | |
| Total distributions to shareholders | | | — | | | | (0.52 | ) | | | (0.14 | ) | | | — | | | | — | | | | — | | |
| Redemption Fees: | |
| Redemption fees added to paid-in-capital | | | — | (c)(e) | | | — | | | | — | | | | — | | | | — | | | | — | | |
| Net Asset Value, End of Period | | $ | 6.92 | | | $ | 13.86 | | | $ | 13.73 | | | $ | 12.99 | | | $ | 10.22 | | | $ | 9.42 | | |
| Total return (g) | | | (50.07 | )%(h) | | | 4.34 | %(h) | | | 6.88 | %(h)(i) | | | 27.10 | %(h) | | | 8.49 | % | | | 55.70 | % | |
Ratios to Average Net Assets/
Supplemental Data: | |
| Net expenses before interest expense (j) | | | 2.00 | % | | | 1.95 | % | | | 2.01 | %(k) | | | 2.06 | % | | | 2.15 | % | | | 2.24 | % | |
| Interest expense | | | — | | | | — | | | | — | | | | — | | | | — | %(l) | | | — | %(l) | |
| Net expenses (j) | | | 2.00 | % | | | 1.95 | % | | | 2.01 | %(k) | | | 2.06 | % | | | 2.15 | % | | | 2.24 | % | |
| Waiver/Reimbursement | | | 0.04 | % | | | 0.02 | % | | | 0.02 | %(k) | | | 0.01 | % | | | — | | | | — | | |
| Net investment loss (j) | | | (0.63 | )% | | | (0.56 | )% | | | (0.02 | )%(k) | | | (0.96 | )% | | | (1.25 | )% | | | (1.34 | )% | |
| Portfolio turnover rate | | | 152 | % | | | 113 | % | | | 86 | %(i) | | | 141 | % | | | 130 | % | | | 204 | % | |
| Net assets, end of period (000's) | | $ | 95,889 | | | $ | 230,505 | | | $ | 167,144 | | | $ | 97,006 | | | $ | 60,495 | | | $ | 48,277 | | |
(a) The Fund changed its fiscal year end from March 31 to February 28. Per share data and total return reflect activity from April 1, 2006 through February 28, 2007.
(b) On August 22, 2005, the Fund's Investor B shares were renamed Class B shares.
(c) Per share data was calculated using the average shares outstanding during the period.
(d) Net investment income per share reflects special dividends. The effect of these dividends amounted to $0.08 per share.
(e) Rounds to less than $0.01 per share.
(f) The amount shown for a share outstanding does not correspond with the aggregate net loss on investments for the period due to timing of repurchases of Fund shares in relation to fluctuating market values of the investments of the Fund.
(g) Total return at net asset value assuming all distributions reinvested and no contingent deferred sales charge.
(h) Had the investment advisor and/or any of its affiliates not waived fees or reimbursed a portion of expenses, total return would have been reduced.
(i) Not annualized.
(j) The benefits derived from expense reductions had an impact of less than 0.01%, except for the period ended February 28, 2007 and the year ended March 31, 2006, which had an impact of 0.07% and 0.08%, respectively.
(k) Annualized.
(l) Rounds to less than 0.01%.
See Accompanying Notes to Financial Statements.
136
Financial Highlights – Columbia Marsico 21st Century Fund
Selected data for a share outstanding throughout each period is as follows:
| | | Year
Ended
February 28, | | Year
Ended
February 29, | | Period
Ended
February 28, | | Year Ended March 31, | |
| Class C Shares | | 2009 | | 2008 | | 2007 (a) | | 2006 (b) | | 2005 | | 2004 | |
| Net Asset Value, Beginning of Period | | $ | 13.86 | | | $ | 13.73 | | | $ | 12.99 | | | $ | 10.22 | | | $ | 9.42 | | | $ | 6.05 | | |
| Income from Investment Operations: | |
| Net investment income (loss) (c) | | | (0.07 | ) | | | (0.09 | ) | | | 0.01 | (d) | | | (0.11 | ) | | | (0.12 | ) | | | (0.13 | ) | |
Net realized and unrealized gain (loss)
on investments and foreign currency | | | (6.88 | ) | | | 0.74 | (e) | | | 0.87 | | | | 2.88 | | | | 0.92 | | | | 3.50 | | |
| Total from investment operations | | | (6.95 | ) | | | 0.65 | | | | 0.88 | | | | 2.77 | | | | 0.80 | | | | 3.37 | | |
| Less Distributions to Shareholders: | |
| From net investment income | | | — | | | | — | | | | (0.02 | ) | | | — | | | | — | | | | — | | |
| From net realized gains | | | — | | | | (0.49 | ) | | | (0.12 | ) | | | — | | | | — | | | | — | | |
| From return of capital | | | — | | | | (0.03 | ) | | | — | | | | — | | | | — | | | | — | | |
| Total distributions to shareholders | | | — | | | | (0.52 | ) | | | (0.14 | ) | | | — | | | | — | | | | — | | |
| Redemption Fees: | |
| Redemption fees added to paid-in-capital | | | — | (c)(f) | | | — | | | | — | | | | — | | | | — | | | | — | | |
| Net Asset Value, End of Period | | $ | 6.91 | | | $ | 13.86 | | | $ | 13.73 | | | $ | 12.99 | | | $ | 10.22 | | | $ | 9.42 | | |
| Total return (g) | | | (50.14 | )%(h) | | | 4.34 | %(h) | | | 6.88 | %(h)(i) | | | 27.10 | %(h) | | | 8.49 | % | | | 55.70 | % | |
Ratios to Average Net Assets/
Supplemental Data: | |
| Net expenses before interest expense (j) | | | 2.00 | % | | | 1.95 | % | | | 2.01 | %(k) | | | 2.06 | % | | | 2.15 | % | | | 2.24 | % | |
| Interest expense | | | — | | | | — | | | | — | | | | — | | | | — | %(l) | | | — | %(l) | |
| Net expenses (j) | | | 2.00 | % | | | 1.95 | % | | | 2.01 | %(k) | | | 2.06 | % | | | 2.15 | % | | | 2.24 | % | |
| Waiver/Reimbursement | | | 0.04 | % | | | 0.02 | % | | | 0.02 | %(k) | | | 0.01 | % | | | — | | | | — | | |
| Net investment income (loss) (j) | | | (0.63 | )% | | | (0.60 | )% | | | 0.11 | %(k) | | | (0.96 | )% | | | (1.25 | )% | | | (1.34 | )% | |
| Portfolio turnover rate | | | 152 | % | | | 113 | % | | | 86 | %(i) | | | 141 | % | | | 130 | % | | | 204 | % | |
| Net assets, end of period (000's) | | $ | 622,098 | | | $ | 1,418,014 | | | $ | 651,596 | | | $ | 157,286 | | | $ | 38,460 | | | $ | 14,700 | | |
(a) The Fund changed its fiscal year end from March 31 to February 28. Per share data and total return reflect activity from April 1, 2006 through February 28, 2007.
(b) On August 22, 2005, the Fund's Investor C shares were renamed Class C shares.
(c) Per share data was calculated using the average shares outstanding during the period.
(d) Net investment income per share reflects special dividends. The effect of these dividends amounted to $0.08 per share.
(e) The amount shown for a share outstanding does not correspond with the aggregate net loss on investments for the period due to timing of repurchases of Fund shares in relation to fluctuating market values of the investments of the Fund.
(f) Rounds to less than $0.01 per share.
(g) Total return at net asset value assuming all distributions reinvested and no contingent deferred sales charge.
(h) Had the investment advisor and/or any of its affiliates not waived fees or reimbursed a portion of expenses, total return would have been reduced.
(i) Not annualized.
(j) The benefits derived from expense reductions had an impact of less than 0.01%, except for the period ended February 28, 2007 and the year ended March 31, 2006, which had an impact of 0.07% and 0.08%, respectively.
(k) Annualized.
(l) Rounds to less than 0.01%.
See Accompanying Notes to Financial Statements.
137
Financial Highlights – Columbia Marsico 21st Century Fund
Selected data for a share outstanding throughout each period is as follows:
| Class R Shares | | Year
Ended
February 28,
2009 | | Year
Ended
February 29,
2008 | | Period
Ended
February 28,
2007 (a) | | Period
Ended
March 31,
2006 (b) | |
| Net Asset Value, Beginning of Period | | $ | 14.55 | | | $ | 14.32 | | | $ | 13.58 | | | $ | 12.53 | | |
| Income from Investment Operations: | |
| Net investment income (loss) (c) | | | (0.02 | ) | | | (0.02 | ) | | | 0.16 | (d) | | | (0.02 | ) | |
Net realized and unrealized gain (loss) on investments and
foreign currency | | | (7.24 | ) | | | 0.77 | (e) | | | 0.81 | | | | 1.07 | | |
| Total from investment operations | | | (7.26 | ) | | | 0.75 | | | | 0.97 | | | | 1.05 | | |
| Less Distributions to Shareholders: | |
| From net investment income | | | — | | | | — | | | | (0.06 | ) | | | — | | |
| From net realized gains | | | — | | | | (0.49 | ) | | | — | | | | — | (f) | |
| From return of capital | | | — | | | | (0.03 | ) | | | (0.17 | ) | | | — | | |
| Total distributions to shareholders | | | — | | | | (0.52 | ) | | | (0.23 | ) | | | — | (f) | |
| Redemption Fees: | |
| Redemption fees added to paid-in-capital | | | — | (c)(f) | | | — | | | | — | | | | — | | |
| Net Asset Value, End of Period | | $ | 7.29 | | | $ | 14.55 | | | $ | 14.32 | | | $ | 13.58 | | |
| Total return (g)(h) | | | (49.90 | )% | | | 4.87 | % | | | 7.38 | %(i) | | | 8.38 | %(i) | |
| Ratios to Average Net Assets/Supplemental Data: | |
| Net expenses (j) | | | 1.50 | % | | | 1.45 | % | | | 1.51 | %(k) | | | 1.63 | %(k) | |
| Waiver/Reimbursement | | | 0.04 | % | | | 0.02 | % | | | 0.02 | %(k) | | | 0.03 | %(k) | |
| Net investment income (loss) (j) | | | (0.13 | )% | | | (0.15 | )% | | | 1.25 | %(k) | | | (0.91 | )%(k) | |
| Portfolio turnover rate | | | 152 | % | | | 113 | % | | | 86 | %(i) | | | 141 | %(i) | |
| Net assets, end of period (000's) | | $ | 42,429 | | | $ | 47,777 | | | $ | 4,394 | | | $ | 11 | | |
(a) The Fund changed its fiscal year end from March 31 to February 28. Per share data and total return reflect activity from April 1, 2006 through February 28, 2007.
(b) Class R shares commenced operations on January 23, 2006.
(c) Per share data was calculated using the average shares outstanding during the period.
(d) Net investment income per share reflects special dividends. The effect of these dividends amounted to $0.08 per share.
(e) The amount shown for a share outstanding does not correspond with the aggregate net loss on investments for the period due to timing of repurchases of Fund shares in relation to fluctuating market values of the investments of the Fund.
(f) Rounds to less than $0.01 per share.
(g) Total return at net asset value assuming all distributions reinvested.
(h) Had the investment advisor and/or any of its affiliates not waived fees or reimbursed a portion of expenses, total return would have been reduced.
(i) Not annualized.
(j) The benefits derived from expense reductions had an impact of less than 0.01%, except for the period ended February 28, 2007 and the year ended March 31, 2006, which had an impact of 0.07% and 0.08%, respectively.
(k) Annualized.
See Accompanying Notes to Financial Statements.
138
Financial Highlights – Columbia Marsico 21st Century Fund
Selected data for a share outstanding throughout each period is as follows:
| | | Year
Ended
February 28, | | Year
Ended
February 29, | | Period
Ended
February 28, | | Year Ended March 31, | |
| Class Z Shares | | 2009 | | 2008 | | 2007 (a) | | 2006 (b) | | 2005 | | 2004 | |
| Net Asset Value, Beginning of Period | | $ | 14.76 | | | $ | 14.45 | | | $ | 13.76 | | | $ | 10.75 | | | $ | 9.80 | | | $ | 6.24 | | |
| Income from Investment Operations: | |
| Net investment income (loss) (c) | | | 0.05 | | | | 0.07 | | | | 0.13 | (d) | | | — | (e) | | | (0.03 | ) | | | (0.03 | ) | |
Net realized and unrealized gain (loss)
on investments and foreign currency | | | (7.37 | ) | | | 0.76 | (f) | | | 0.91 | | | | 3.04 | | | | 0.98 | | | | 3.59 | | |
| Total from investment operations | | | (7.32 | ) | | | 0.83 | | | | 1.04 | | | | 3.04 | | | | 0.95 | | | | 3.56 | | |
| Less Distributions to Shareholders: | |
| From net investment income | | | — | | | | — | | | | (0.12 | ) | | | (0.03 | ) | | | — | | | | — | | |
| From net realized gains | | | — | | | | (0.49 | ) | | | (0.23 | ) | | | — | | | | — | | | | — | | |
| From return of capital | | | — | | | | (0.03 | ) | | | — | | | | — | | | | — | | | | — | | |
| Total distributions to shareholders | | | — | | | | (0.52 | ) | | | (0.35 | ) | | | (0.03 | ) | | | — | | | | — | | |
| Redemption Fees: | |
| Redemption fees added to paid-in-capital | | | — | (c)(e) | | | — | | | | — | | | | — | | | | — | | | | — | | |
| Net Asset Value, End of Period | | $ | 7.44 | | | $ | 14.76 | | | $ | 14.45 | | | $ | 13.76 | | | $ | 10.75 | | | $ | 9.80 | | |
| Total return (g) | | | (49.59 | )%(h) | | | 5.38 | %(h) | | | 7.84 | %(h)(i) | | | 28.33 | %(h) | | | 9.69 | % | | | 57.05 | % | |
Ratios to Average Net Assets/
Supplemental Data: | |
| Net expenses before interest expense (j) | | | 1.00 | % | | | 0.95 | % | | | 1.01 | %(k) | | | 1.06 | % | | | 1.15 | % | | | 1.24 | % | |
| Interest expense | | | — | | | | — | | | | — | | | | — | | | | — | %(l) | | | — | %(l) | |
| Net expenses (j) | | | 1.00 | % | | | 0.95 | % | | | 1.01 | %(k) | | | 1.06 | % | | | 1.15 | % | | | 1.24 | % | |
| Waiver/Reimbursement | | | 0.04 | % | | | 0.02 | % | | | 0.02 | %(k) | | | 0.01 | % | | | — | | | | — | | |
| Net investment income (loss) (j) | | | 0.37 | % | | | 0.41 | % | | | 1.03 | %(k) | | | 0.04 | % | | | (0.25 | )% | | | (0.34 | )% | |
| Portfolio turnover rate | | | 152 | % | | | 113 | % | | | 86 | %(i) | | | 141 | % | | | 130 | % | | | 204 | % | |
| Net assets, end of period (000's) | | $ | 870,875 | | | $ | 1,614,313 | | | $ | 732,508 | | | $ | 274,594 | | | $ | 114,896 | | | $ | 37,027 | | |
(a) The Fund changed its fiscal year end from March 31 to February 28. Per share data and total return reflect activity from April 1, 2006 through February 28, 2007.
(b) On August 22, 2005, the Fund's Primary A shares were renamed Class Z shares.
(c) Per share data was calculated using the average shares outstanding during the period.
(d) Net investment income per share reflect special dividends. The effect of these dividends amounted to less than $0.08 per share.
(e) Rounds to less than $0.01 per share.
(f) The amount shown for a share outstanding does not correspond with the aggregate net loss on investments for the period due to timing of repurchases of Fund shares in relation to fluctuating market values of the investment of the Fund.
(g) Total return at net asset value assuming all distributions reinvested.
(h) Had the investment advisor and/or any of its affiliates not waived fees or reimbursed a portion of expenses, total return would have been reduced.
(i) Not annualized.
(j) The benefits derived from expense reductions had an impact of less than 0.01%, except for the period ended February 28, 2007 and the year ended March 31, 2006, which had an impact of 0.07% and 0.08%, respectively.
(k) Annualized.
(l) Rounds to less than 0.01%.
See Accompanying Notes to Financial Statements.
139
Financial Highlights – Columbia Small Cap Growth Fund II
Selected data for a share outstanding throughout each period is as follows:
| | | Year
Ended
February 28, | | Period
Ended
February 29, | | Year Ended March 31, | |
| Class A Shares | | 2009 | | 2008 (a)(b)(c) | | 2007 (a) | | 2006 (a)(d) | | 2005 (a) | | 2004 (a) | |
| Net Asset Value, Beginning of Period | | $ | 10.57 | | | $ | 13.79 | | | $ | 17.56 | | | $ | 15.06 | | | $ | 15.04 | | | $ | 9.96 | | |
| Income from Investment Operations: | |
| Net investment loss (e) | | | (0.07 | ) | | | (0.10 | ) | | | (0.12 | ) | | | (0.13 | ) | | | (0.14 | ) | | | (0.13 | ) | |
Net realized and unrealized gain (loss)
on investments | | | (4.51 | ) | | | (0.41 | ) | | | (0.24 | )(f) | | | 4.51 | | | | 0.16 | | | | 5.21 | | |
| Total from investment operations | | | (4.58 | ) | | | (0.51 | ) | | | (0.36 | ) | | | 4.38 | | | | 0.02 | | | | 5.08 | | |
| Less Distributions to Shareholders: | |
| From net realized gains | | | — | | | | (2.69 | ) | | | (3.41 | ) | | | (1.88 | ) | | | — | | | | — | | |
| Return of capital | | | — | | | | (0.02 | ) | | | — | | | | — | | | | — | | | | — | | |
| Total distributions to shareholders | | | — | | | | (2.71 | ) | | | (3.41 | ) | | | (1.88 | ) | | | — | | | | — | | |
| Net Asset Value, End of Period | | $ | 5.99 | | | $ | 10.57 | | | $ | 13.79 | | | $ | 17.56 | | | $ | 15.06 | | | $ | 15.04 | | |
| Total return (g)(h) | | | (43.33 | )% | | | (6.45 | )%(i) | | | (0.03 | )% | | | 30.90 | % | | | 0.13 | % | | | 51.00 | % | |
Ratios to Average Net Assets/
Supplemental Data: | |
| Net expenses before interest expense | | | 1.27 | %(j) | | | 1.20 | %(j)(k) | | | 1.23 | %(j) | | | 1.24 | % | | | 1.32 | % | | | 1.38 | %(l) | |
| Interest expense | | | — | %(m) | | | — | %(k)(m) | | | — | | | | — | | | | — | | | | — | %(m) | |
| Net expenses | | | 1.27 | %(j) | | | 1.20 | %(j)(k) | | | 1.23 | %(j) | | | 1.24 | % | | | 1.32 | % | | | 1.38 | %(l) | |
| Waiver/Reimbursement | | | 0.05 | % | | | 0.04 | %(k) | | | 0.03 | % | | | 0.07 | %(n) | | | 0.08 | %(n) | | | 0.12 | %(n) | |
| Net investment loss | | | (0.80 | )%(j) | | | (0.85 | )%(j)(k) | | | (0.81 | )%(j) | | | (0.84 | )% | | | (0.96 | )% | | | (1.00 | )% | |
| Portfolio turnover rate | | | 130 | % | | | 3 | %(i)(o) | | | — | | | | — | | | | — | | | | 40 | %(p) | |
Turnover of Columbia Small Cap Growth
Master Portfolio | | | — | | | | 199 | %(i) | | | 188 | % | | | 117 | % | | | 59 | % | | | 26 | %(i) | |
| Net assets, end of period (000's) | | $ | 90,647 | | | $ | 173,675 | | | $ | 207,258 | | | $ | 150,761 | | | $ | 132,400 | | | $ | 212,854 | | |
(a) The per share amounts and percentages reflect income and expenses assuming inclusion of the Fund's proportionate share of the income and expenses of Columbia Small Cap Growth Master Portfolio.
(b) The Fund changed its fiscal year end from March 31 to February 29. Per share data and total return reflect activity from April 1, 2007 through February 29, 2008.
(c) Effective February 28, 2008, the Fund converted to a stand-alone fund. Prior to February 28, 2008 the Fund operated in a master-feeder structure.
(d) On August 22, 2005, the Fund's Investor A shares were renamed Class A shares.
(e) Per share data was calculated using the average shares outstanding during the period.
(f) The amount shown for a share outstanding does not correspond with the aggregate net gain on investments for the year due to the timing of sales and repurchases of Fund shares in relation to fluctuating market values of the investments of the Columbia Small Cap Growth Master Portfolio.
(g) Total return at net asset value assuming all distributions reinvested and no initial sales charge or contingent deferred sales charge.
(h) Had the investment advisor and/or any of its affiliates not waived fees or reimbursed a portion of expenses, total return would have been reduced.
(i) Not annualized.
(j) The benefits derived from expense reductions had an impact of less than 0.01%.
(k) Annualized.
(l) The reimbursement from the investment advisor had an impact of 0.02%.
(m) Rounds to less than 0.01%.
(n) Bank of America Corporation assumed certain non-recurring costs. Absent these non-recurring costs, the waiver/reimbursement ratio would have been 0.01%, 0.05% and 0.09% for the years ended March 31, 2006, March 31, 2005 and March 31, 2004, respectively.
(o) Amount represents results after the Fund's conversion to a stand-alone structure on February 28, 2008.
(p) Amount represents results prior to conversion to a master-feeder structure on November 1, 2003.
See Accompanying Notes to Financial Statements.
140
Financial Highlights – Columbia Small Cap Growth Fund II
Selected data for a share outstanding throughout each period is as follows:
| | | Year
Ended
February 28, | | Period
Ended
February 29, | | Year Ended March 31, | |
| Class B Shares | | 2009 | | 2008 (a)(b)(c) | | 2007 (a) | | 2006 (a)(d) | | 2005 (a) | | 2004 (a) | |
| Net Asset Value, Beginning of Period | | $ | 9.44 | | | $ | 12.49 | | | $ | 16.21 | | | $ | 14.13 | | | $ | 14.22 | | | $ | 9.49 | | |
| Income from Investment Operations: | |
| Net investment loss (e) | | | (0.13 | ) | | | (0.13 | ) | | | (0.21 | ) | | | (0.24 | ) | | | (0.24 | ) | | | (0.22 | ) | |
Net realized and unrealized gain (loss)
on investments | | | (4.00 | ) | | | (0.40 | ) | | | (0.22 | )(f) | | | 4.20 | | | | 0.15 | | | | 4.95 | | |
| Total from investment operations | | | (4.13 | ) | | | (0.53 | ) | | | (0.43 | ) | | | 3.96 | | | | (0.09 | ) | | | 4.73 | | |
| Less Distributions to Shareholders: | |
| From net realized gains | | | — | | | | (2.50 | ) | | | (3.29 | ) | | | (1.88 | ) | | | — | | | | — | | |
| Return of capital | | | — | | | | (0.02 | ) | | | — | | | | — | | | | — | | | | — | | |
| Total distributions to shareholders | | | — | | | | (2.52 | ) | | | (3.29 | ) | | | (1.88 | ) | | | — | | | | — | | |
| Net Asset Value, End of Period | | $ | 5.31 | | | $ | 9.44 | | | $ | 12.49 | | | $ | 16.21 | | | $ | 14.13 | | | $ | 14.22 | | |
| Total return (g)(h) | | | (43.75 | )% | | | (7.15 | )%(i) | | | (0.69 | )% | | | 29.92 | % | | | (0.63 | )% | | | 49.84 | % | |
Ratios to Average Net Assets/
Supplemental Data: | |
| Net expenses before interest expense | | | 2.02 | %(j) | | | 1.95 | %(j)(k) | | | 1.98 | %(j) | | | 1.99 | % | | | 2.07 | % | | | 2.13 | %(l) | |
| Interest expense | | | — | %(m) | | | — | %(k)(m) | | | — | | | | — | | | | — | | | | — | %(m) | |
| Net expenses | | | 2.02 | %(j) | | | 1.95 | %(j)(k) | | | 1.98 | %(j) | | | 1.99 | % | | | 2.07 | % | | | 2.13 | %(l) | |
| Waiver/Reimbursement | | | 0.05 | % | | | 0.04 | %(k) | | | 0.03 | % | | | 0.07 | %(n) | | | 0.08 | %(n) | | | 0.12 | %(n) | |
| Net investment loss | | | (1.54 | )%(j) | | | (1.60 | )%(j)(k) | | | (1.58 | )%(j) | | | (1.59 | )% | | | (1.73 | )% | | | (1.75 | )% | |
| Portfolio turnover rate | | | 130 | % | | | 3 | %(i)(o) | | | — | | | | — | | | | — | | | | 40 | %(p) | |
Turnover of Columbia Small Cap Growth
Master Portfolio | | | — | | | | 199 | %(i) | | | 188 | % | | | 117 | % | | | 59 | % | | | 26 | %(i) | |
| Net assets, end of period (000's) | | $ | 3,362 | | | $ | 9,184 | | | $ | 13,018 | | | $ | 16,229 | | | $ | 16,131 | | | $ | 19,367 | | |
(a) The per share amounts and percentages reflect income and expenses assuming inclusion of the Fund's proportionate share of the income and expenses of Columbia Small Cap Growth Master Portfolio.
(b) The Fund changed its fiscal year end from March 31 to February 29. Per share data and total return reflect activity from April 1, 2007 through February 29, 2008.
(c) Effective February 28, 2008, the Fund converted to a stand-alone fund. Prior to February 28, 2008 the Fund operated in a master-feeder structure.
(d) On August 22, 2005, the Fund's Investor B shares were renamed Class B shares.
(e) Per share data was calculated using the average shares outstanding during the period.
(f) The amount shown for a share outstanding does not correspond with the aggregate net gain on investments for the year due to the timing of sales and repurchases of Fund shares in relation to fluctuating market values of the investments of the Columbia Small Cap Growth Master Portfolio.
(g) Total return at net asset value assuming all distributions reinvested and no contingent deferred sales charge.
(h) Had the investment advisor and/or any of its affiliates not waived fees or reimbursed a portion of expenses, total return would have been reduced.
(i) Not annualized.
(j) The benefits derived from expense reductions had an impact of less than 0.01%.
(k) Annualized.
(l) The reimbursement from the investment advisor had an impact of 0.02%.
(m) Rounds to less than 0.01%.
(n) Bank of America Corporation assumed certain non-recurring costs. Absent these non-recurring costs, the waiver/reimbursement ratio would have been 0.01%, 0.05% and 0.09% for the years ended March 31, 2006, March 31, 2005 and March 31, 2004, respectively.
(o) Amount represents results after the Fund's conversion to a stand-alone structure on February 28, 2008.
(p) Amount represents results prior to conversion to a master-feeder structure on November 1, 2003.
See Accompanying Notes to Financial Statements.
141
Financial Highlights – Columbia Small Cap Growth Fund II
Selected data for a share outstanding throughout each period is as follows:
| | | Year
Ended
February 28, | | Period
Ended
February 29, | | Year Ended March 31, | |
| Class C Shares | | 2009 | | 2008 (a)(b)(c) | | 2007 (a) | | 2006 (a)(d) | | 2005 (a) | | 2004 (a) | |
| Net Asset Value, Beginning of Period | | $ | 9.67 | | | $ | 12.74 | | | $ | 16.47 | | | $ | 14.33 | | | $ | 14.42 | | | $ | 9.62 | | |
| Income from Investment Operations: | |
| Net investment loss (e) | | | (0.13 | ) | | | (0.17 | ) | | | (0.21 | ) | | | (0.24 | ) | | | (0.24 | ) | | | (0.22 | ) | |
Net realized and unrealized gain (loss)
on investments | | | (4.10 | ) | | | (0.38 | ) | | | (0.23 | )(f) | | | 4.26 | | | | 0.15 | | | | 5.02 | | |
| Total from investment operations | | | (4.23 | ) | | | (0.55 | ) | | | (0.44 | ) | | | 4.02 | | | | (0.09 | ) | | | 4.80 | | |
| Less Distributions to Shareholders: | |
| From net realized gains | | | — | | | | (2.50 | ) | | | (3.29 | ) | | | (1.88 | ) | | | — | | | | — | | |
| From return of capital | | | — | | | | (0.02 | ) | | | — | | | | — | | | | — | | | | — | | |
| Total distributions to shareholders | | | — | | | | (2.52 | ) | | | (3.29 | ) | | | (1.88 | ) | | | — | | | | — | | |
| Net Asset Value, End of Period | | $ | 5.44 | | | $ | 9.67 | | | $ | 12.74 | | | $ | 16.47 | | | $ | 14.33 | | | $ | 14.42 | | |
| Total return (g)(h) | | | (43.74 | )% | | | (7.17 | )%(i) | | | (0.74 | )% | | | 29.93 | % | | | (0.62 | )% | | | 49.90 | % | |
Ratios to Average Net Assets/
Supplemental Data: | |
| Net expenses before interest expense | | | 2.02 | %(j) | | | 1.95 | %(j)(k) | | | 1.98 | %(j) | | | 1.99 | % | | | 2.07 | % | | | 2.13 | %(l) | |
| Interest expense | | | — | %(m) | | | — | %(k)(m) | | | — | | | | — | | | | — | | | | — | %(m) | |
| Net expenses | | | 2.02 | %(j) | | | 1.95 | %(j)(k) | | | 1.98 | %(j) | | | 1.99 | % | | | 2.07 | % | | | 2.13 | %(l) | |
| Waiver/Reimbursement | | | 0.05 | % | | | 0.04 | %(k) | | | 0.03 | % | | | 0.07 | %(n) | | | 0.08 | %(n) | | | 0.12 | %(n) | |
| Net investment loss | | | (1.55 | )%(j) | | | (1.60 | )%(j)(k) | | | (1.57 | )%(j) | | | (1.59 | )% | | | (1.73 | )% | | | (1.75 | )% | |
| Portfolio turnover rate | | | 130 | % | | | 3 | %(i)(o) | | | — | | | | — | | | | — | | | | 40 | %(p) | |
Turnover of Columbia Small Cap Growth
Master Portfolio | | | — | | | | 199 | %(i) | | | 188 | % | | | 117 | % | | | 59 | % | | | 26 | %(i) | |
| Net assets, end of period (000's) | | $ | 2,081 | | | $ | 3,689 | | | $ | 4,998 | | | $ | 4,452 | | | $ | 3,651 | | | $ | 5,454 | | |
(a) The per share amounts and percentages reflect income and expenses assuming inclusion of the Fund's proportionate share of the income and expenses of Columbia Small Cap Growth Master Portfolio.
(b) The Fund changed its fiscal year end from March 31 to February 29. Per share data and total return reflect activity from April 1, 2007 through February 29, 2008.
(c) Effective February 28, 2008, the Fund converted to a stand-alone fund. Prior to February 28, 2008 the Fund operated in a master-feeder structure.
(d) On August 22, 2005, the Fund's Investor C shares were renamed Class C shares.
(e) Per share data was calculated using the average shares outstanding during the period.
(f) The amount shown for a share outstanding does not correspond with the aggregate net gain on investments for the year due to the timing of sales and repurchases of Fund shares in relation to fluctuating market values of the investments of the Columbia Small Cap Growth Master Portfolio.
(g) Total return at net asset value assuming all distributions reinvested and no contingent deferred sales charge.
(h) Had the investment advisor and/or any of its affiliates not waived fees or reimbursed a portion of expenses, total return would have been reduced.
(i) Not annualized.
(j) The benefits derived from expense reductions had an impact of less than 0.01%.
(k) Annualized.
(l) The reimbursement from the investment advisor had an impact of 0.02%.
(m) Rounds to less than 0.01%.
(n) Bank of America Corporation assumed certain non-recurring costs. Absent these non-recurring costs, the waiver/reimbursement ratio would have been 0.01%, 0.05% and 0.09% for the years ended March 31, 2006, March 31, 2005 and March 31, 2004, respectively.
(o) Amount represents results after the Fund's conversion to a stand-alone structure on February 28, 2008.
(p) Amount represents results prior to conversion to a master-feeder structure on November 1, 2003.
See Accompanying Notes to Financial Statements.
142
Financial Highlights – Columbia Small Cap Growth Fund II
Selected data for a share outstanding throughout each period is as follows:
| | | Year
Ended
February 28, | | Period
Ended
February 29, | | Year Ended March 31, | |
| Class Z Shares | | 2009 | | 2008 (a)(b)(c) | | 2007 (a) | | 2006 (a)(d) | | 2005 (a) | | 2004 (a) | |
| Net Asset Value, Beginning of Period | | $ | 11.01 | | | $ | 14.30 | | | $ | 18.06 | | | $ | 15.40 | | | $ | 15.35 | | | $ | 10.14 | | |
| Income from Investment Operations: | |
| Net investment loss (e) | | | (0.05 | ) | | | (0.07 | ) | | | (0.08 | ) | | | (0.10 | ) | | | (0.11 | ) | | | (0.10 | ) | |
Net realized and unrealized gain (loss)
on investments | | | (4.71 | ) | | | (0.44 | ) | | | (0.23 | )(f) | | | 4.64 | | | | 0.16 | | | | 5.31 | | |
| Total from investment operations | | | (4.76 | ) | | | (0.51 | ) | | | (0.31 | ) | | | 4.54 | | | | 0.05 | | | | 5.21 | | |
| Less Distributions to Shareholders: | |
| From net realized gains | | | — | | | | (2.76 | ) | | | (3.45 | ) | | | (1.88 | ) | | | — | | | | — | | |
| From return of capital | | | — | | | | (0.02 | ) | | | — | | | | — | | | | — | | | | — | | |
| Total distributions to shareholders | | | — | | | | (2.78 | ) | | | (3.45 | ) | | | (1.88 | ) | | | — | | | | — | | |
| Net Asset Value, End of Year | | $ | 6.25 | | | $ | 11.01 | | | $ | 14.30 | | | $ | 18.06 | | | $ | 15.40 | | | $ | 15.35 | | |
| Total return (g)(h) | | | (43.23 | )% | | | (6.31 | )%(i) | | | 0.33 | % | | | 31.26 | % | | | 0.33 | % | | | 51.38 | % | |
Ratios to Average Net Assets/
Supplemental Data: | |
| Net expenses before interest expense | | | 1.02 | %(j) | | | 0.95 | %(j)(k) | | | 0.98 | %(j) | | | 0.99 | % | | | 1.07 | % | | | 1.13 | %(l) | |
| Interest expense | | | — | %(m) | | | — | %(k)(m) | | | — | | | | — | | | | — | | | | — | %(m) | |
| Net expenses | | | 1.02 | %(j) | | | 0.95 | %(j)(k) | | | 0.98 | %(j) | | | 0.99 | % | | | 1.07 | % | | | 1.13 | %(l) | |
| Waiver/Reimbursement | | | 0.05 | % | | | 0.04 | %(k) | | | 0.03 | % | | | 0.07 | %(n) | | | 0.08 | %(n) | | | 0.12 | %(n) | |
| Net investment loss | | | (0.54 | )%(j) | | | (0.59 | )%(j)(k) | | | (0.56 | )%(j) | | | (0.59 | )% | | | (0.73 | )% | | | (0.75 | )% | |
| Portfolio turnover rate | | | 130 | % | | | 3 | %(i)(o) | | | — | | | | — | | | | — | | | | 40 | %(p) | |
Turnover of Columbia Small Cap Growth
Master Portfolio | | | — | | | | 199 | %(i) | | | 188 | % | | | 117 | % | | | 59 | % | | | 26 | %(i) | |
| Net assets, end of period (000's) | | $ | 143,511 | | | $ | 279,900 | | | $ | 378,164 | | | $ | 308,930 | | | $ | 360,975 | | | $ | 509,419 | | |
(a) The per share amounts and percentages reflect income and expenses assuming inclusion of the Fund's proportionate share of the income and expenses of Columbia Small Cap Growth Master Portfolio.
(b) The Fund changed its fiscal year end from March 31 to February 29. Per share data and total return reflect activity from April 1, 2007 through February 29, 2008.
(c) Effective February 28, 2008, the Fund converted to a stand-alone fund. Prior to February 28, 2008 the Fund operated in a master-feeder structure.
(d) On August 22, 2005, the Fund's Investor Z shares were renamed Class Z shares.
(e) Per share data was calculated using the average shares outstanding during the period.
(f) The amount shown for a share outstanding does not correspond with the aggregate net gain on investments for the year due to the timing of sales and repurchases of Fund shares in relation to fluctuating market values of the investments of the Columbia Small Cap Growth Master Portfolio.
(g) Total return at net asset value assuming all distributions reinvested.
(h) Had the investment advisor and/or any of its affiliates not waived fees or reimbursed a portion of expenses, total return would have been reduced.
(i) Not annualized.
(j) The benefits derived from expense reductions had an impact of less than 0.01%.
(k) Annualized.
(l) The reimbursement from the investment advisor had an impact of 0.02%.
(m) Rounds to less than 0.01%.
(n) Bank of America Corporation assumed certain non-recurring costs. Absent these non-recurring costs, the waiver/reimbursement ratio would have been 0.01%, 0.05% and 0.09% for the years ended March 31, 2006, March 31, 2005 and March 31, 2004, respectively.
(o) Amount represents results after the Fund's conversion to a stand-alone structure on February 28, 2008.
(p) Amount represents results prior to conversion to a master-feeder structure on November 1, 2003.
See Accompanying Notes to Financial Statements.
143
Notes to Financial Statements – Stock Funds
February 28, 2009
Note 1. Organization
Columbia Funds Series Trust (the "Trust") is registered under the Investment Company Act of 1940, as amended (the "1940 Act"), as an open-end management investment company. Information presented in these financial statements pertains to the following series of the Trust (each a "Fund" and collectively, the "Funds"):
Columbia Convertible Securities Fund
Columbia Large Cap Value Fund
Columbia Mid Cap Value Fund
Columbia Small Cap Value Fund II
Columbia Marsico Growth Fund
Columbia Large Cap Core Fund
Columbia Marsico Focused Equities Fund
Columbia Marsico 21st Century Fund
Columbia Small Cap Growth Fund II
Investment Objectives
Columbia Convertible Securities Fund seeks total return, consisting of capital appreciation and current income. Columbia Large Cap Value Fund, Columbia Mid Cap Value Fund, Columbia Small Cap Value Fund II and Columbia Large Cap Core Fund each seek long-term capital appreciation. Columbia Marsico Growth Fund, Columbia Marsico Focused Equities Fund, Columbia Marsico 21st Century Fund and Columbia Small Cap Growth Fund II each seek long-term growth of capital.
Prior to November 10, 2008, Columbia Marsico Growth Fund (the "Former Feeder Fund") operated in a master-feeder structure, investing all or substantially all of its assets in Columbia Marsico Growth Master Portfolio (the "Master Portfolio"). Effective November 10, 2008, Columbia Marsico Growth Fund redeemed in-kind its investment in Columbia Marsico Growth Master Portfolio and converted into a stand-alone fund, investing directly in individual portfolio securities rather than in the master portfolio.
Fund Shares
The Trust may issue an unlimited number of shares. Columbia Convertible Securities Fund, Columbia Large Cap Core Fund, Columbia Marsico Focused Equities Fund and Columbia Small Cap Growth Fund II each offer four classes of shares: Class A, Class B, Class C and Class Z shares. Columbia Large Cap Value Fund, Columbia Mid Cap Value Fund, Columbia Small Cap Value Fund II, Columbia Marsico Growth Fund and Columbia Marsico 21st Century Fund each offer five classes of shares: Class A, Class B, Class C, Class R and Class Z shares. Each share class has its own expense structure and sales charges, as applicable. Beginning on or about June 22, 2009 each Fund will no longer accept investments in Class B shares from new or existing investors in each Fund's Class B shares except in connection with the reinvestment of any dividend and/or capital gain distributions in each Fund's Class B shares and exchanges by existing Class B share holders of the other Columbia Funds.
Class A shares are subject to a maximum front-end sales charge of 5.75% based on the amount of initial investment. Class A shares purchased without an initial sales charge in accounts aggregating $1 million to $50 million at the time of purchase are subject to a 1.00% contingent deferred sales charge ("CDSC") if the shares are sold within one year after purchase. Class B shares are subject to a maximum CDSC of 5.00% based upon the holding period after purchase. Class B shares will convert to Class A shares eight years after purchase. Class C shares are subject to a 1.00% CDSC on shares sold within one year after purchase. Class R and Class Z shares are offered continuously at net asset value. There are certain restrictions on the purchase of Class R and Class Z shares, as described in the Funds' prospectuses.
Note 2. Significant Accounting Policies
The preparation of financial statements in accordance with accounting principles generally accepted in the United States of America ("GAAP") requires management to make certain estimates and assumptions that affect the reported amounts of assets and liabilities, the disclosure of contingent assets and liabilities at the date of the financial statements and the reported amounts of revenue and expenses during the reporting period. Actual results could differ from those estimates. The following is a summary of significant accounting policies consistently followed by the Funds in the preparation of their financial statements.
Security Valuation
Equity securities and exchange-traded funds are valued at the last sale price on the principal exchange on which they trade, except for securities traded on the NASDAQ, which are valued at the NASDAQ official close price. Unlisted securities or listed securities for which there were no sales during the day
144
Stock Funds, February 28, 2009 (continued)
are valued at the closing bid price on such exchanges or over-the-counter markets.
Debt securities and exchange-traded funds generally are valued by pricing services approved by the Trust's Board of Trustees, based upon market transactions for normal, institutional-size trading units of similar securities. The services may use various pricing techniques which take into account appropriate factors such as yield, quality, coupon rate, maturity, type of issue, trading characteristics and other data, as well as broker quotes. Debt securities for which quotations are readily available are valued at an over-the-counter or exchange bid quotation.
Short-term investments maturing in 60 days or less are valued at amortized cost, which approximates market value.
Investments in other open-end investment companies are valued at net asset value.
Purchased options are valued at the last reported sale price, or in the absence of a sale, at the last quoted bid price. Written options are valued at the last reported sale price, or in the absence of a sale, at the last quoted ask price.
Foreign securities are generally valued at the last sale price on the foreign exchange or market on which they trade. If any foreign share prices are not readily available as a result of limited share activity, the securities are valued at the last sale price of the local shares in the principal market in which such securities are normally traded.
Generally, trading in foreign securities is substantially completed each day at various times prior to the close of the New York Stock Exchange ("NYSE"). The values of such securities used in computing the net asset value of the Funds' shares are determined as of such times. Foreign currency exchange rates are generally determined at 4:00 p.m. Eastern (U.S.) time. Occasionally, events affecting the values of such foreign securities and such exchange rates may occur between the times at which they are determined and the close of the customary trading session of the NYSE, which would not be reflected in the computation of the Funds' net asset values. If events materially affecting the values of such foreign securities occur and it is determined that market quotations are not reliable, then these foreign securities will be valued at their fair value using procedures approved by the Board of Trustees.
Investments for which market quotations are not readily available, or that have quotations which management believes are not reliable, are valued at fair value as determined in good faith under consistently applied procedures established by and under the general supervision of the Board of Trustees. If a security is valued at fair value, such value is likely to be different from the last quoted market price for the security.
On March 1, 2008, the Funds adopted Statement of Financial Accounting Standards No. 157, Fair Value Measurements ("SFAS 157"). SFAS 157 establishes a hierarchy that prioritizes the inputs to valuation techniques used to measure fair value giving the highest priority to unadjusted quoted prices in active markets for identical securities (level 1 measurements) and the lowest priority to unobservable inputs (level 3 measurements) when market prices are not readily available or reliable. The three levels of the fair value hierarchy under SFAS 157 are described below:
• Level 1 – quoted prices in active markets for identical securities
• Level 2 – prices determined using other significant observable inputs (including quoted prices for similar securities, interest rates, prepayment speeds, credit risk and others)
• Level 3 – prices determined using significant unobservable inputs. In situations where quoted prices or observable inputs are unavailable or less reliable, unobservable inputs may be used. Unobservable inputs may include management's own assumptions about the factors market participants would use in pricing an investment.
The inputs or methodology used for valuing securities are not necessarily an indication of the risk associated with investing in those securities.
The following tables summarize the inputs used, as of February 28, 2009, in valuing each Fund's assets:
Columbia Convertible Securities Fund
| Valuation Inputs | | Investments in
Securities | | Other Financial
Instruments | |
| Level 1 – Quoted Prices | | $ | 26,345,981 | | | $ | — | | |
Level 2 – Other Significant
Observable Inputs | | | 368,829,016 | | | | — | | |
Level 3 – Significant
Unobservable Inputs | | | — | | | | — | | |
| Total | | $ | 395,174,997 | | | $ | — | | |
145
Stock Funds, February 28, 2009 (continued)
The following table reconciles asset balances for the year ending February 28, 2009 in which significant unobservable inputs (Level 3) were used in determining value:
Columbia Convertible Securities Fund (cont'd)
| | | Investments in
Securities | | Other Financial
Instruments | |
Balance as of
February 29, 2008 | | $ | 4,752,561 | | | $ | — | | |
Accretion of Discounts/
Amortization of Premiums | | | — | | | | — | | |
| Realized gain(loss) | | | (171,950 | ) | | | — | | |
Change in unrealized
appreciation
(depreciation) | | | 31,350 | | | | — | | |
| Net purchases/sales | | | (4,611,961 | ) | | | — | | |
Transfers in and/or
out of Level 3 | | | — | | | | — | | |
Balance as of
February 28, 2009 | | $ | — | | | $ | — | | |
The information in the above reconciliation represents fiscal year to date activity for any securities identified as using Level 3 inputs at either the beginning or the end of the current fiscal period.
Columbia Large Cap Value Fund
| Valuation Inputs | | Investments in
Securities | | Other Financial
Instruments | |
| Level 1 – Quoted Prices | | $ | 1,729,905,537 | | | $ | — | | |
Level 2 – Other Significant
Observable Inputs | | | 9,634,000 | | | | — | | |
Level 3 – Significant
Unobservable Inputs | | | — | | | | — | | |
| Total | | $ | 1,739,539,537 | | | $ | — | | |
Columbia Mid Cap Value Fund
| Valuation Inputs | | Investments in
Securities | | Other Financial
Instruments | |
| Level 1 – Quoted Prices | | $ | 2,712,283,821 | | | $ | — | | |
Level 2 – Other Significant
Observable Inputs | | | 64,276,114 | | | | — | | |
Level 3 – Significant
Unobservable Inputs | | | 1,058 | | | | — | | |
| Total | | $ | 2,776,560,993 | | | $ | — | | |
The following table reconciles asset balances for the year ending February 28, 2009 in which significant unobservable inputs (Level 3) were used in determining value:
Columbia Mid Cap Value Fund (cont'd)
| | | Investments in
Securities | | Other Financial
Instruments | |
Balance as of
February 29, 2008 | | $ | 1,058 | | | $ | — | | |
Accretion of Discounts/
Amortization of Premiums | | | — | | | | — | | |
| Realized gain(loss) | | | — | | | | — | | |
Change in unrealized
appreciation
(depreciation) | | | — | | | | — | | |
| Net purchases/sales | | | — | | | | — | | |
Transfers in and/or
out of Level 3 | | | — | | | | — | | |
Balance as of
February 28, 2009 | | $ | 1,058 | | | $ | — | | |
The information in the above reconciliation represents fiscal year to date activity for any securities identified as using Level 3 inputs at either the beginning or the end of the current fiscal period.
There was no change in unrealized gains or losses attributable to securities owned at February 28, 2009 which were valued using significant unobservable inputs (Level 3).
Columbia Small Cap Value Fund II
| Valuation Inputs | | Investments in
Securities | | Other Financial
Instruments | |
| Level 1 – Quoted Prices | | $ | 783,052,044 | | | $ | — | | |
Level 2 – Other Significant
Observable Inputs | | | 34,571,000 | | | | — | | |
Level 3 – Significant
Unobservable Inputs | | | — | | | | — | | |
| Total | | $ | 817,623,044 | | | $ | — | | |
Columbia Marsico Growth Fund
| Valuation Inputs | | Investments in
Securities | | Other Financial
Instruments | |
| Level 1 – Quoted Prices | | $ | 2,923,628,996 | | | $ | — | | |
Level 2 – Other Significant
Observable Inputs | | | 190,143,502 | | | | — | | |
Level 3 – Significant
Unobservable Inputs | | | — | | | | — | | |
| Total | | $ | 3,113,772,498 | | | $ | — | | |
146
Stock Funds, February 28, 2009 (continued)
The Fund's assets assigned to the Level 2 input category include certain foreign securities for which a third party statistical pricing service may be employed for purposes of fair market valuation.
Columbia Large Cap Core Fund
| Valuation Inputs | | Investments in
Securities | | Other Financial
Instruments* | |
| Level 1 – Quoted Prices | | $ | 807,881,842 | | | $ | 57,200 | | |
Level 2 – Other Significant
Observable Inputs | | | 1,626,000 | | | | — | | |
Level 3 – Significant
Unobservable Inputs | | | — | | | | — | | |
| Total | | $ | 809,507,842 | | | $ | 57,200 | | |
* Other financial instruments consist of written option contracts which are not included in the investment portfolio.
Columbia Marsico Focused Equities Fund
| Valuation Inputs | | Investments in
Securities | | Other Financial
Instruments | |
| Level 1 – Quoted Prices | | $ | 2,426,914,805 | | | $ | — | | |
Level 2 – Other Significant
Observable Inputs | | | 113,087,547 | | | | — | | |
Level 3 – Significant
Unobservable Inputs | | | — | | | | — | | |
| Total | | $ | 2,540,002,352 | | | $ | — | | |
Columbia Marsico 21st Century Fund
| Valuation Inputs | | Investments in
Securities | | Other Financial
Instruments | |
| Level 1 – Quoted Prices | | $ | 2,969,111,772 | | | $ | — | | |
Level 2 – Other Significant
Observable Inputs | | | 778,821,307 | | | | — | | |
Level 3 – Significant
Unobservable Inputs | | | — | | | | — | | |
| Total | | $ | 3,747,933,079 | | | $ | — | | |
Columbia Small Cap Growth Fund II
| Valuation Inputs | | Investments in
Securities | | Other Financial
Instruments | |
| Level 1 – Quoted Prices | | $ | 234,561,227 | | | $ | — | | |
Level 2 – Other Significant
Observable Inputs | | | 3,128,000 | | | | — | | |
Level 3 – Significant
Unobservable Inputs | | | — | | | | — | | |
| Total | | $ | 237,689,227 | | | $ | — | | |
Security Transactions
Security transactions are accounted for on the trade date. Cost is determined and gains (losses) are based upon the specific identification method for both financial statement and federal income tax purposes.
In March 2008, Statement of Financial Accounting Standards No. 161, Disclosures about Derivative Instruments and Hedging Activities—an amendment of FASB Statement No. 133 ("SFAS 161"), was issued. SFAS 161 is effective for fiscal years and interim periods beginning after November 15, 2008. SFAS 161 requires additional discussion about the reporting entity's derivative instruments and hedging activities, by providing for qualitative disclosures about the objectives and strategies for using derivatives, quantitative data about the fair value of and gains and losses on derivative contracts, and details of credit-risk-related contingent features in their derivative contracts. Management is evaluating the impact the application of SFAS 161 will have on the Funds' financial stateme nt disclosures.
Options
Each Fund may write call and put options on securities it owns or in which it may invest. Writing put options tends to increase a Fund's exposure to the underlying instrument. Writing call options tends to decrease a Fund's exposure to the underlying instrument. When a Fund writes a call or put option, an amount equal to the premium received is recorded as a liability and subsequently marked-to-market to reflect the current value of the option written. Premiums received from writing options which expire are treated as realized gains. Premiums received from writing options which are exercised or closed are added to the proceeds or offset against the amounts paid on the underlying security transaction to determine the realized gain or loss. Each Fund, as a writer of an option, has no control over whether the underlying security may be sold (call) or purchased (put) and as a result bears the market risk of an unfavorable change in the price of the security underlying the written option. There is the risk that a Fund may not be able to enter into a closing transaction because of an illiquid market. The Funds' custodian will set aside cash or liquid portfolio securities equal to the amount of the written option contract commitment in a separate account.
Each Fund may also purchase put and call options. Purchasing call options tends to increase a Fund's exposure to
147
Stock Funds, February 28, 2009 (continued)
the underlying instrument. Purchasing put options tends to decrease a Fund's exposure to the underlying instrument. The Funds may pay a premium, which is included in the Funds' Statements of Assets and Liabilities as an investment and subsequently marked-to-market to reflect the current value of the option. The risk associated with purchasing put and call options is limited to the premium paid. Premiums paid for purchasing options which expire are treated as realized losses. Premiums paid for purchasing options which are exercised are added to the amounts paid (call) or offset against the proceeds (put) on the underlying security to determine the realized gain or loss. If a Fund enters into a closing transaction, the Fund will realize a gain or loss, depending on whether the proceeds from the closing transaction are greater or less than the cost of the option.
Repurchase Agreements
Each Fund may engage in repurchase agreement transactions with institutions that Columbia Management Advisors, LLC ("Columbia"), the Funds' investment advisor, has determined are creditworthy. Each Fund, through its custodian, receives delivery of the underlying securities collateralizing a repurchase agreement. Columbia is responsible for determining that the collateral is at least equal, at all times, to the value of the repurchase obligation including interest. A repurchase agreement transaction involves certain risks in the event of default or insolvency of the counterparty. These risks include possible delays in or restrictions on each Fund's ability to dispose of the underlying securities and a possible decline in the value of the underlying securities during the period while the Funds seek to assert their rights.
Foreign Currency Translations and Transactions
The values of all assets and liabilities quoted in foreign currencies are translated into U.S. dollars at that day's exchange rates. Net realized and unrealized gains (losses) on foreign currency transactions include gains (losses) arising from the fluctuation in exchange rates between trade and settlement dates on securities transactions, gains (losses) arising from the disposition of foreign currency and currency gains (losses) between the accrual and payment dates on dividends, interest income and foreign withholding taxes.
For financial statement purposes, the Funds do not distinguish that portion of gains (losses) on investments which is due to changes in foreign exchange rates from that which is due to changes in market prices of the investments. Such fluctuations are included with the net realized and unrealized gains (losses) on investments on the Statements of Operations.
Income Recognition
Corporate actions and dividend income are recorded on the ex-date except for certain foreign securities which are recorded as soon after the ex-date as the Funds become aware of such, net of any non-reclaimable tax withholdings.
Distributions received from real estate investment trusts (REITs) in excess of their income are recorded as a reduction of the cost of the related investments. If the Funds no longer own the applicable securities, any distributions received in excess of income are recorded as realized gains.
Interest income is recorded on the accrual basis. Premium and discount are amortized and accreted, respectively, on all debt securities except for premiums attributable to the conversion feature on convertible securities.
Expenses
General expenses of the Trust are allocated to the Funds and other series of the Trust based upon relative net assets or other expense allocation methodologies determined by the nature of the expense. Expenses directly attributable to a Fund are charged to such Fund.
Determination of Class Net Asset Value
All income, expenses (other than class-specific expenses, as shown on the Statements of Operations) and realized and unrealized gains (losses) are allocated to each class of a Fund on a daily basis for purposes of determining the net asset value of each class. Income and expenses are allocated to each class based on the settled shares method, while realized and unrealized gains (losses) are allocated based on the relative net assets of each class.
Prior to November 10, 2008, Columbia Marsico Growth Fund recorded its proportionate share of investment income, realized and unrealized gains and losses and expenses reported by its Master Portfolio on a daily basis. The
148
Stock Funds, February 28, 2009 (continued)
investment income, realized and unrealized gains and losses and expenses were allocated daily to investors of the Master Portfolio based upon the relative value of their investment in the Master Portfolio.
Federal Income Tax Status
Each Fund intends to qualify each year as a "regulated investment company" under Subchapter M of the Internal Revenue Code, as amended, and will distribute substantially all of its taxable income, if any, for its tax year, and as such will not be subject to federal income taxes. In addition, each Fund intends to distribute in each calendar year substantially all of its net investment income, capital gains and certain other amounts, if any, such that each Fund should not be subject to federal excise tax. Therefore, no federal income or excise tax provision is recorded.
Distributions to Shareholders
Distributions from net investment income for Columbia Convertible Securities Fund, Columbia Large Cap Value Fund and Columbia Mid Cap Value Fund, if any, are declared and distributed quarterly. Distributions from net investment income for the remaining Funds, if any, are declared and distributed annually. The Funds may, however, declare and pay distributions from net investment income more frequently. Net realized capital gains, if any, are distributed at least annually for all Funds. Income distributions and capital gain distributions are determined in accordance with federal income tax regulations which may differ from GAAP.
Indemnification
In the normal course of business, each Fund enters into contracts that contain a variety of representations and warranties and which provide general indemnities. A Fund's maximum exposure under these arrangements is unknown because this would involve future claims against a Fund. Also, under the Trust's organizational documents and by contract, the Trustees and officers of the Trust are indemnified against certain liabilities that may arise out of actions relating to their duties to the Trust. However, based on experience, the Funds expect the risk of loss due to these representations, warranties and indemnities to be minimal.
Note 3. Federal Tax Information
The timing and character of income and capital gain distributions are determined in accordance with income tax regulations, which may differ from GAAP. Reclassifications are made to each Fund's capital accounts for permanent tax differences to reflect income and gains available for distribution (or available capital loss carryforwards) under income tax regulations.
For the year ended February 28, 2009, permanent book and tax basis differences resulting primarily from differing treatments for allocation from Master Portfolio, foreign currency transactions, distribution reclassifications, expired capital loss carryforwards, adjustments on certain convertible preferred securities, wash sales adjustments, partnership adjustments, net operating loss and redemption based payments treated as dividends paid deductions were identified and reclassified among the components of the Funds' net assets as follows:
| | | Undistributed/
(Overdistributed)
Net Investment
Income | | Accumulated
Net Realized
Gain/Loss | | Paid-In Capital | |
| Columbia Convertible Securities Fund | | $ | 705,387 | | | $ | (705,384 | ) | | $ | (3 | ) | |
| Columbia Large Cap Value Fund | | | 1 | | | | (1 | ) | | | — | | |
| Columbia Mid Cap Value Fund | | | (21,626 | ) | | | 21,625 | | | | 1 | | |
| Columbia Small Cap Value Fund II | | | 183,719 | | | | (250,906 | ) | | | 67,187 | | |
| Columbia Marsico Growth Fund | | | (177,134 | ) | | | 247,385 | | | | (70,251 | ) | |
| Columbia Large Cap Core Fund | | | (59,617 | ) | | | 5,344,686 | | | | (5,285,069 | ) | |
| Columbia Marsico Focused Equities Fund | | | 411 | | | | (73,203 | ) | | | 72,792 | | |
| Columbia Marsico 21st Century Fund | | | (598,393 | ) | | | 598,394 | | | | (1 | ) | |
| Columbia Small Cap Growth Fund II | | | 2,675,421 | | | | 3 | | | | (2,675,424 | ) | |
149
Stock Funds, February 28, 2009 (continued)
Net investment income and net realized gains (losses), as disclosed on the Statements of Operations, and net assets were not affected by these reclassifications.
The tax character of distributions paid during the year ended February 28, 2009 and period ended February 29, 2008 was as follows:
| | | February 28, 2009 | |
| | | Ordinary
Income* | | Long-Term
Capital Gains | | Tax Return
of Capital | |
| Columbia Convertible Securities Fund | | $ | 14,240,428 | | | $ | 10,680,255 | | | $ | — | | |
| Columbia Large Cap Value Fund | | | 53,557,080 | | | | — | | | | — | | |
| Columbia Mid Cap Value Fund | | | 41,938,460 | | | | — | | | | 3,849,390 | | |
| Columbia Small Cap Value Fund II | | | 14,755,826 | | | | — | | | | — | | |
| Columbia Marsico Growth Fund | | | 11,812,182 | | | | — | | | | — | | |
| Columbia Large Cap Core Fund | | | 14,545,809 | | | | 26,941,099 | | | | — | | |
| Columbia Marsico Focused Equities Fund | | | 10,630,205 | | | | — | | | | — | | |
| Columbia Marsico 21st Century Fund | | | — | | | | — | | | | — | | |
| Columbia Small Cap Growth Fund II | | | — | | | | — | | | | — | | |
| | | February 29, 2008 | |
| | | Ordinary
Income* | | Long-Term
Capital Gains | | Tax Return
of Capital | |
| Columbia Convertible Securities Fund | | $ | 29,993,669 | | | $ | 70,221,483 | | | $ | — | | |
| Columbia Large Cap Value Fund | | | 103,225,705 | | | | 420,574,785 | | | | — | | |
| Columbia Mid Cap Value Fund | | | 75,351,135 | | | | 202,789,161 | | | | — | | |
| Columbia Small Cap Value Fund II | | | 10,648,125 | | | | 20,968,939 | | | | — | | |
| Columbia Marsico Growth Fund | | | 7,092,519 | | | | — | | | | — | | |
| Columbia Large Cap Core Fund | | | 20,540,397 | | | | 82,228,107 | | | | — | | |
| Columbia Marsico Focused Equities Fund | | | 855,093 | | | | 53,534,080 | | | | — | | |
| Columbia Marsico 21st Century Fund | | | 159,778,617 | | | | 73,530,181 | | | | 11,387,245 | | |
| Columbia Small Cap Growth Fund II | | | 52,446,305 | | | | 59,244,167 | | | | 867,315 | | |
* For tax purposes short-term capital gain distributions, if any, are considered ordinary income distributions.
150
Stock Funds, February 28, 2009 (continued)
As of February 28, 2009, the components of distributable earnings on a tax basis were as follows:
| | | Undistributed
Ordinary
Income | | Undistributed
Long-Term
Capital Gains | | Net Unrealized
Depreciation* | |
| Columbia Convertible Securities Fund | | $ | 2,245,954 | | | $ | — | | | $ | (81,128,994 | ) | |
| Columbia Large Cap Value Fund | | | 4,434,318 | | | | — | | | | (577,257,765 | ) | |
| Columbia Mid Cap Value Fund | | | — | | | | — | | | | (1,638,552,023 | ) | |
| Columbia Small Cap Value Fund II | | | — | | | | — | | | | (512,673,791 | ) | |
| Columbia Marsico Growth Fund | | | 14,420,278 | | | | — | | | | (529,506,849 | ) | |
| Columbia Large Cap Core Fund | | | 4,797,751 | | | | — | | | | (185,506,889 | ) | |
| Columbia Marsico Focused Equities Fund | | | 3,795,338 | | | | — | | | | (357,073,212 | ) | |
| Columbia Marsico 21st Century Fund | | | 24,200 | | | | — | | | | (1,666,891,323 | ) | |
| Columbia Small Cap Growth Fund II | | | — | | | | — | | | | (106,728,202 | ) | |
* The differences between book-basis and tax-basis net unrealized appreciation/depreciation are primarily due to deferral of losses from wash sales and identified straddle loss deferrals.
Unrealized appreciation and depreciation at February 28, 2009, based on cost of investments for federal income tax purposes were:
| | | Unrealized
Appreciation | | Unrealized
Depreciation | | Net
Unrealized
Depreciation | |
| Columbia Convertible Securities Fund | | $ | 5,770,486 | | | $ | (86,899,480 | ) | | $ | (81,128,994 | ) | |
| Columbia Large Cap Value Fund | | | 111,964,358 | | | | (689,222,123 | ) | | | (577,257,765 | ) | |
| Columbia Mid Cap Value Fund | | | 76,996,553 | | | | (1,715,548,576 | ) | | | (1,638,552,023 | ) | |
| Columbia Small Cap Value Fund II | | | 15,509,275 | | | | (528,183,066 | ) | | | (512,673,791 | ) | |
| Columbia Marsico Growth Fund | | | 253,370,137 | | | | (782,876,986 | ) | | | (529,506,849 | ) | |
| Columbia Large Cap Core Fund | | | 19,319,390 | | | | (204,826,279 | ) | | | (185,506,889 | ) | |
| Columbia Marsico Focused Equities Fund | | | 259,039,768 | | | | (616,112,980 | ) | | | (357,073,212 | ) | |
| Columbia Marsico 21st Century Fund | | | 147,925,743 | | | | (1,814,817,066 | ) | | | (1,666,891,323 | ) | |
| Columbia Small Cap Growth Fund II | | | 7,314,883 | | | | (114,043,085 | ) | | | (106,728,202 | ) | |
The following capital loss carryforwards, determined as of February 28, 2009, may be available to reduce taxable income arising from future net realized gains on investments, if any, to the extent permitted by the Internal Revenue Code:
| | | Expiring in | |
| | | 2010 | | 2011 | | 2013 | | 2017 | | Total | |
| Columbia Convertible Securities Fund | | $ | — | | | $ | — | | | $ | — | | | $ | 71,063,081 | | | $ | 71,063,081 | | |
| Columbia Large Cap Value Fund | | | — | | | | 4,189,476 | | | | — | | | | 383,028,117 | | | | 387,217,593 | | |
| Columbia Mid Cap Value Fund | | | — | | | | — | | | | — | | | | 311,073,387 | | | | 311,073,387 | | |
| Columbia Small Cap Value Fund II | | | — | | | | — | | | | — | | | | 70,573,610 | | | | 70,573,610 | | |
151
Stock Funds, February 28, 2009 (continued)
| | | Expiring in | |
| | | 2010 | | 2011 | | 2013 | | 2017 | | Total | |
| Columbia Marsico Growth Fund | | $ | 11,995,864 | | | $ | 38,422,781 | | | $ | 30,480,049 | | | $ | 847,030,869 | | | $ | 927,929,563 | | |
| Columbia Large Cap Core Fund | | | — | | | | — | | | | — | | | | 112,956,820 | | | | 112,956,820 | | |
| Columbia Marsico Focused Equities Fund | | | — | | | | — | | | | — | | | | 262,876,521 | | | | 262,876,521 | | |
| Columbia Marsico 21st Century Fund | | | — | | | | — | | | | — | | | | 1,181,576,157 | | | | 1,181,576,157 | | |
| Columbia Small Cap Growth Fund II | | | — | | | | — | | | | — | | | | 60,327,000 | | | | 60,327,000 | | |
Capital loss carryforwards of $1,479,676 expired during the year ended February 28, 2009 for Columbia Marsico Growth Fund. Expired capital loss carryforwards are recorded as a reduction of paid-in capital.
Under current tax rules, certain currency and capital losses realized after October 31 may be deferred and treated as occurring on the first day of the following fiscal year. As of February 28, 2009, post-October capital losses were as follows:
| | | Post-October
Loss | |
| Columbia Convertible Securities Fund | | $ | 58,679,031 | | |
| Columbia Large Cap Value Fund | | | 311,646,100 | | |
| Columbia Mid Cap Value Fund | | | 359,263,842 | | |
| Columbia Small Cap Value Fund II | | | 138,021,100 | | |
| Columbia Marsico Growth Fund | | | 488,283,613 | | |
| Columbia Large Cap Core Fund | | | 182,681,282 | | |
| Columbia Marsico Focused Equities Fund | | | 432,035,929 | | |
| Columbia Marsico 21st Century Fund | | | 1,123,301,353 | | |
| Columbia Small Cap Growth Fund II | | | 57,964,041 | | |
Under Financial Accounting Standards Board ("FASB") Interpretation No. 48, Accounting for Uncertainty in Income Taxes—an Interpretation of FASB Statement No. 109 ("FIN 48"), management determines whether a tax position of the Funds is more likely than not to be sustained upon examination by the applicable taxing authority, including resolution of any related appeals or litigation processes, based on the technical merits of the position. The tax benefit to be recognized is measured as the largest amount of benefit that is greater than fifty percent likely of being realized upon ultimate settlement. Management has evaluated the known implications of FIN 48 on its computation of net assets for each Fund. As a result of this evaluation, management has concluded that FIN 48 did no t have any effect on the Funds' financial statements. However, management's conclusions regarding FIN 48 may be subject to review and adjustment at a later date based on factors including, but not limited to, further implementation guidance from the FASB, new tax laws, regulations, and administrative interpretations (including relevant court decisions). The Funds' federal tax returns for the prior three fiscal years remain subject to examination by the Internal Revenue Service. The Funds are not aware of any tax positions for which it is reasonably possible that the total amounts of unrecognized tax benefits will significantly change in the next twelve months.
Note 4. Fees and Compensation Paid to Affiliates
Investment Advisory Fee
Columbia, an indirect, wholly owned subsidiary of Bank of America Corporation ("BOA"), provides investment advisory services to the Funds. In rendering investment advisory services to the Funds except for Columbia Marsico Growth Fund, Columbia Marsico Focused Equities Fund and Columbia Marsico 21st Century Fund, Columbia may use the portfolio management and research resources of Columbia
152
Stock Funds, February 28, 2009 (continued)
Management Pte. Ltd., an affiliate of Columbia. Columbia receives a monthly investment advisory fee based on each Fund's average daily net assets at the following annual rates:
| | | First
$500
Million | | $500 Million
to $1
Billion | | $1 Billion
to $1.5
Billion | | $1.5 Billion
to $3
Billion | | $3 Billion
to $6
Billion | | Over
$6 Billion | |
| Columbia Convertible Securities Fund | | | 0.65 | % | | | 0.60 | % | | | 0.55 | % | | | 0.50 | % | | | 0.50 | % | | | 0.50 | % | |
| Columbia Large Cap Value Fund | | | 0.60 | % | | | 0.55 | % | | | 0.43 | % | | | 0.43 | % | | | 0.43 | % | | | 0.41 | % | |
| Columbia Mid Cap Value Fund | | | 0.65 | % | | | 0.60 | % | | | 0.55 | % | | | 0.50 | % | | | 0.50 | % | | | 0.50 | % | |
| Columbia Small Cap Value Fund II | | | 0.70 | % | | | 0.65 | % | | | 0.60 | % | | | 0.60 | % | | | 0.60 | % | | | 0.60 | % | |
| Columbia Marsico Growth Fund | | | 0.75 | % | | | 0.70 | % | | | 0.65 | % | | | 0.60 | % | | | 0.58 | % | | | 0.56 | % | |
| Columbia Large Cap Core Fund | | | 0.60 | % | | | 0.55 | % | | | 0.50 | % | | | 0.45 | % | | | 0.43 | % | | | 0.41 | % | |
| Columbia Marsico Focused Equities Fund | | | 0.75 | % | | | 0.70 | % | | | 0.65 | % | | | 0.60 | % | | | 0.58 | % | | | 0.56 | % | |
| Columbia Marsico 21st Century Fund | | | 0.75 | % | | | 0.70 | % | | | 0.65 | % | | | 0.60 | % | | | 0.58 | % | | | 0.56 | % | |
| Columbia Small Cap Growth Fund II | | | 0.70 | % | | | 0.65 | % | | | 0.60 | % | | | 0.60 | % | | | 0.60 | % | | | 0.60 | % | |
Prior to November 10, 2008, the Former Feeder Fund paid for investment advisory and sub-advisory services indirectly through its investment in the Master Portfolio at the same rate as shown above.
For the year ended February 28, 2009, the effective investment advisory fee rates for the Funds, net of any fee waivers, as a percentage of each Fund's average daily net assets, were as follows:
| | | Effective
Fee Rate | |
| Columbia Convertible Securities Fund | | | 0.64 | % | |
| Columbia Large Cap Value Fund | | | 0.48 | % | |
| Columbia Mid Cap Value Fund | | | 0.54 | % | |
| Columbia Small Cap Value Fund II | | | 0.66 | % | |
| Columbia Marsico Growth Fund | | | 0.13 | % | |
| Columbia Large Cap Core Fund | | | 0.56 | % | |
| Columbia Marsico Focused Equities Fund | | | 0.63 | % | |
| Columbia Marsico 21st Century Fund | | | 0.61 | % | |
| Columbia Small Cap Growth Fund II | | | 0.70 | % | |
Sub-Advisory Fee
Marsico Capital Management, LLC ("Marsico") has been retained by Columbia to serve as the investment sub-advisor to Columbia Marsico Growth Fund, Columbia Marsico Focused Equities Fund and Columbia Marsico 21st Century Fund. As the sub-advisor, and subject to the oversight of Columbia and the Funds' Board of Trustees, Marsico is responsible for the daily investment operations, including placing all orders for the purchase and sale of the portfolio securities for these Funds. Columbia, from the investment advisory fee it receives, pays Marsico a monthly sub-advisory fee.
Marsico is entitled to receive a monthly sub-advisory fee for its services provided to Columbia Marsico Growth Fund, Columbia Marsico Focused Equities Fund and Columbia Marsico 21st Century Fund at the following annual rates:
| Fund Average Daily Net Assets* | | Fee Rate | |
| Assets up to $18 billion | | | 0.45 | % | |
Assets in excess of $18 billion
and up to $21 billion | | | 0.40 | % | |
| Assets in excess of $21 billion | | | 0.35 | % | |
* For purposes of the calculation, "Assets" are aggregate assets sub-advised by Marsico in the following Columbia Funds: (i) Columbia Marsico Growth Fund; (ii) Columbia Marsico Focused Equities Fund; (iii) Columbia Marsico 21st Century Fund; (iv) Columbia Marsico Growth Fund, Variable Series; (v) Columbia Marsico Focused Equities Fund, Variable Series; (vi) Columbia Marsico 21st Century Fund, Variable Series; and (vii) any future Columbia U.S. equity fund sub-advised by Marsico as the Advisor and Marsico mutually agree in writing.
Administration Fee
Columbia provides administrative and other services to the Funds for a monthly administration fee based on each Fund's average daily net assets at the following annual rates, less the
153
Stock Funds, February 28, 2009 (continued)
fees payable by the Funds as described under the Pricing and Bookkeeping Fees note below:
| | | Annual
Fee Rate | |
| Columbia Convertible Securities Fund | | | 0.170 | % | |
| Columbia Large Cap Value Fund | | | 0.170 | % | |
| Columbia Mid Cap Value Fund | | | 0.170 | % | |
| Columbia Small Cap Value Fund II | | | 0.170 | % | |
| Columbia Marsico Growth Fund | | | 0.220 | % | |
| Columbia Large Cap Core Fund | | | 0.170 | % | |
| Columbia Marsico Focused Equities Fund | | | 0.220 | % | |
| Columbia Marsico 21st Century Fund | | | 0.220 | % | |
| Columbia Small Cap Growth Fund II | | | 0.117 | % | |
Prior to November 10, 2008, the Former Feeder Fund paid a portion of the administration fees directly at an annual fee of 0.120% and paid a portion indirectly though its investment in the Master Portfolio.
For the year ended February 28, 2009, Columbia Marsico Growth Fund's effective administration fee rate was 0.14% of the Fund's average daily net assets.
Columbia has contractually agreed to waive a portion of its administration fee for Columbia Large Cap Value Fund through June 30, 2009, at an annual rate of 0.04% of the Fund's average daily net assets up to $500 million.
Pricing and Bookkeeping Fees
The Funds have entered into a Financial Reporting Services Agreement (the "Financial Reporting Services Agreement") with State Street Bank & Trust Company ("State Street") and Columbia pursuant to which State Street provides financial reporting services to the Funds. The Funds have also entered into an Accounting Services Agreement (collectively with the Financial Reporting Services Agreement, the "State Street Agreements") with State Street and Columbia pursuant to which State Street provides accounting services to the Funds. Under the State Street Agreements, each Fund pays State Street an annual fee of $38,000 paid monthly plus an additional monthly fee based on an annualized percentage rate of average daily net assets of each Fund for the month. The aggregate fee for each Fund will not exceed $140,000 per year (exclusive of out-of-pocket expenses and charges). The Funds also reimburse State Street for certain out-of-pock et expenses and charges.
The Funds have entered into a Pricing and Bookkeeping Oversight and Services Agreement (the "Services Agreement") with Columbia. Under the Services Agreement, Columbia provides services related to Fund expenses and the requirements of the Sarbanes-Oxley Act of 2002, and provides oversight of the accounting and financial reporting services provided by State Street. Under the Services Agreement, the Funds reimburse Columbia for out-of-pocket expenses.
Prior to November 10, 2008, the Former Feeder Fund paid a portion of the pricing and bookkeeping indirectly though its investment in the Master Portfolio.
Transfer Agent Fee
Columbia Management Services, Inc. (the "Transfer Agent"), an affiliate of Columbia and an indirect, wholly owned subsidiary of BOA, provides shareholder services to the Funds and has contracted with Boston Financial Data Services ("BFDS") to serve as sub-transfer agent. The Transfer Agent is entitled to receive a fee for its services, paid monthly, at the annual rate of $17.34 per open account plus reimbursement of certain sub-transfer agent fees paid by the Transfer Agent (exclusive of BFDS fees), calculated based on assets held in omnibus accounts and intended to recover the cost of payments to other parties (including affiliates of BOA) for services to those accounts. The Transfer Agent pays the fees of BFDS for services as sub-transfer agent and is not entitled to reimbursement for such fees from the Funds.
The Transfer Agent may also retain, as additional compensation for its services, fees for wire, telephone and redemption orders, Individual Retirement Account ("IRA") trustee agent fees and account transcript fees due to the Transfer Agent from shareholders of the Funds and credits (net of bank charges) earned with respect to balances in accounts the Transfer Agent maintains in connection with its services to the Funds. The Transfer Agent also receives reimbursement for certain out-of-pocket expenses.
The Transfer Agent has voluntarily agreed to waive a portion of its fees for accounts other than omnibus accounts, so that transfer agent fees (exclusive of out-of-pocket expenses and sub-transfer agent fees) will not exceed 0.02% annually for
154
Stock Funds, February 28, 2009 (continued)
each Fund except Columbia Mid Cap Value Fund and Columbia Small Cap Value Fund II. The Transfer Agent, at its discretion, may revise or discontinue this arrangement at any time.
An annual minimum account balance fee of $20 may apply to certain accounts with a value below each Fund's initial minimum investment requirements to reduce the impact of small accounts on transfer agent fees. These minimum account balance fees are recorded as part of expense reductions on the Statements of Operations. For the year ended February 28, 2009, these minimum account balance fees reduced total expenses of the Funds as follows:
| | | Minimum
Account
Balance Fee | |
| Columbia Convertible Securities Fund | | $ | 3,253 | | |
| Columbia Large Cap Value Fund | | | 44,536 | | |
| Columbia Mid Cap Value Fund | | | 24,120 | | |
| Columbia Small Cap Value Fund II | | | 500 | | |
| Columbia Marsico Growth Fund | | | 5,251 | | |
| Columbia Large Cap Core Fund | | | 2,184 | | |
| Columbia Marsico Focused Equities Fund | | | 8,616 | | |
| Columbia Marsico 21st Century Fund | | | 2,815 | | |
| Columbia Small Cap Growth Fund II | | | 19,872 | | |
Underwriting Discounts, Service and Distribution Fees
Columbia Management Distributors, Inc. (the "Distributor"), an affiliate of Columbia and an indirect, wholly owned subsidiary of BOA, is the principal underwriter of the Funds' shares. For the year ended February 28, 2009, the Distributor has retained net underwriting discounts on sales of Class A shares and received net CDSC fees on Class A, Class B and Class C share redemptions as follows:
| | | Front-End Sales Charge | | CDSC | |
| | | Class A | | Class A | | Class B | | Class C | |
| Columbia Convertible Securities Fund | | $ | 7,724 | | | $ | 1 | | | $ | 64,574 | | | $ | 2,957 | | |
| Columbia Large Cap Value Fund | | | 28,738 | | | | 1,218 | | | | 221,885 | | | | 2,847 | | |
| Columbia Mid Cap Value Fund | | | 123,752 | | | | 4,161 | | | | 191,561 | | | | 82,583 | | |
| Columbia Small Cap Value Fund II | | | 11,037 | | | | 2,620 | | | | 13,646 | | | | 18,619 | | |
| Columbia Marsico Growth Fund | | | 92,056 | | | | 1,349 | | | | 215,743 | | | | 157,908 | | |
| Columbia Large Cap Core Fund | | | 8,288 | | | | 12 | | | | 4,423 | | | | 128 | | |
| Columbia Marsico Focused Equities Fund | | | 63,141 | | | | 6,937 | | | | 207,952 | | | | 58,825 | | |
| Columbia Marsico 21st Century Fund | | | 642,263 | | | | 41,274 | | | | 516,184 | | | | 531,406 | | |
| Columbia Small Cap Growth Fund II | | | 6,104 | | | | 4 | | | | 6,115 | | | | 795 | | |
The Trust has adopted shareholder servicing plans and distribution plans for the Class B and Class C shares of each Fund and a combined distribution and shareholder servicing plan for Class A shares of each Fund. The Trust has also adopted a distribution plan for Class R shares of Columbia Large Cap Value Fund, Columbia Mid Cap Value Fund, Columbia Small Cap Value Fund II, Columbia Marsico Growth Fund and Columbia Marsico 21st Century Fund. The shareholder servicing plans permit the Funds to compensate or reimburse servicing agents for the shareholder services they have provided. The distribution plans, adopted pursuant to Rule 12b-1 under the 1940 Act, permit the Funds to compensate or reimburse the Distributor and/or selling agents for activities or expenses primarily intended to result in the sale of the classes' shares. Payments are made at an annual rate and paid monthly, as a percentage of average daily
155
Stock Funds, February 28, 2009 (continued)
net assets, set from time to time by the Board of Trustees, and are charged as expenses of each Fund directly to the applicable share class. A substantial portion of the expenses incurred pursuant to these plans is paid to affiliates of BOA and the Distributor.
The annual rates in effect and plan limits, as a percentage of average daily net assets are as follows:
| | | Current
Rate | | Plan
Limit | |
Class A Combined Distribution
and Shareholder Servicing Plan | | | 0.25 | % | | | 0.25 | % | |
Class B and Class C
Shareholder Servicing Plans | | | 0.25 | % | | | 0.25 | % | |
Class B and Class C
Distribution Plans | | | 0.75 | % | | | 0.75 | % | |
| Class R Distribution Plan | | | 0.50 | % | | | 0.50 | % | |
Expense Limits and Fee Waivers
Columbia has contractually agreed to bear a portion of the Funds' expenses through June 30, 2009, for Columbia Small Cap Value Fund II and Columbia Small Cap Growth Fund II so that the Funds' ordinary operating expenses (excluding any distribution and service fees, brokerage commissions, interest, taxes and extraordinary expenses, but including custodian charges relating to overdrafts, if any), after giving effect to any balance credits from the Funds' custodian, do not exceed the following annual rates, based on each Fund's average daily net assets:
| | | Annual Rate | |
| Columbia Small Cap Value Fund II | | | 1.30 | % | |
| Columbia Small Cap Growth Fund II | | | 1.15 | % | |
Prior to June 30, 2008, Columbia and or some of the Funds' other service providers contractually agreed to waive fees and/or reimburse certain expenses for Columbia Mid Cap Value Fund so that the expenses incurred by the Columbia Mid Cap Value Fund (exclusive of distribution and service fees, brokerage commissions, interest, taxes and extraordinary expenses, but inclusive of custodial charges relating to overdrafts, if any) after giving effect to any balance credits from the Fund's custodian, did not exceed the annual rate of 1.25% of the Fund's average daily net assets.
Effective May 1, 2009, Columbia has voluntarily agreed to bear a portion of the Funds' expenses so that the Funds' ordinary operating expenses (excluding any distribution and service fees, brokerage commissions, interest, taxes and extraordinary expenses, but including custodian charges relating to overdrafts, if any), after giving effect to any balance credits from the Funds' custodian, do not exceed the following annual rates, based on each Fund's average daily net assets:
| | | Annual Rate | |
| Columbia Convertible Securities Fund | | | 0.95 | % | |
| Columbia Large Cap Value Fund | | | 1.00 | % | |
| Columbia Mid Cap Value Fund | | | 1.05 | % | |
| Columbia Marsico Growth Fund | | | 1.20 | % | |
| Columbia Large Cap Core Fund | | | 1.00 | % | |
| Columbia Marsico Focused Equities Fund | | | 1.20 | % | |
| Columbia Marsico 21st Century Fund | | | 1.20 | % | |
Effective July 1, 2009, Columbia has voluntarily agreed to bear a portion of the Funds' expenses so that the Funds' ordinary operating expenses (excluding any distribution and service fees, brokerage commissions, interest, taxes and extraordinary expenses, but including custodian charges relating to overdrafts, if any), after giving effect to any balance credits from the Funds' custodian, do not exceed the following annual rates, based on each Fund's average daily net assets:
| | | Annual Rate | |
| Columbia Small Cap Value Fund II | | | 1.10 | % | |
| Columbia Small Cap Growth Fund II | | | 1.10 | % | |
To the extent that the Funds are not benefiting from a separate contractual expense limitation arrangement, Columbia has contractually agreed to waive a portion of its advisory fee for Columbia Marsico Focused Equities Fund and Columbia Marsico 21st Century Fund through June 30, 2009. Also effective November 10, 2008, Columbia has contractually agreed to waive a portion of its advisory fee for Columbia Marsico Growth Fund through June 30, 2009.
The waiver amount is calculated based on the difference between the dollar amount of sub-advisory fees that would have been payable to Marsico based on the annualized rate of 0.45% of the Fund's average daily net assets, and the dollar amount of sub-advisory fees calculated on a monthly basis based on the
156
Stock Funds, February 28, 2009 (continued)
annualized sub-advisory fee rates effective January 1, 2008 to which Marsico is entitled from the Fund which is described under the Sub-Advisory Fee note. The annualized fee rate of 0.45% represents the sub-advisory fee rate which Marsico was entitled to receive immediately prior to January 1, 2008.
The advisory fee waiver for Columbia Marsico Growth Fund, Columbia Marsico Focused Equities Fund and Columbia Marsico 21st Century Fund is calculated as follows:
| Fund Average Daily Net Assets* | | Advisory Fee Waiver | |
| Assets up to $18 billion | | | 0.00 | % | |
Assets in excess of $18 billion
and up to $21 billion | | | 0.05 | % | |
| Assets in excess of $21 billion | | | 0.10 | % | |
* For purposes of the calculation, "Assets" are aggregate assets sub-advised by Marsico in the following Columbia Funds: (i) Columbia Marsico Growth Fund; (ii) Columbia Marsico Focused Equities Fund; (iii) Columbia Marsico 21st Century Fund; (iv) Columbia Marsico Growth Fund, Variable Series; (v) Columbia Marsico Focused Equities Fund, Variable Series; (vi) Columbia Marsico 21st Century Fund, Variable Series and (vii) any future Columbia international equity fund sub-advised by Marsico as Columbia and Marsico mutually agree in writing.
For the year ended February 28, 2009, Columbia waived investment advisory fees of $224,668 and $415,508 for Columbia Marsico Focused Equities Fund and Columbia Marsico 21st Century Fund, respectively.
For the period November 10, 2008 through February 28, 2009, Columbia did not waive any advisory fees for Columbia Marsico Growth Fund.
Columbia and/or the Distributor are entitled to recover from Columbia Mid Cap Value Fund, Columbia Small Cap Value Fund II and Columbia Small Cap Growth Fund II any fees waived and/or expenses reimbursed for a three year period following the date of such fee waiver and/or reimbursement if such recovery does not cause a Fund's total operating expenses to exceed the expense limitations in effect at the time of recovery.
At February 28, 2009, no amounts were potentially recoverable from Columbia Mid Cap Value Fund, Columbia Small Cap Value Fund II and Columbia Small Cap Growth Fund II pursuant to this arrangement.
Fees Paid to Officers and Trustees
All officers of the Funds are employees of Columbia or its affiliates and, with the exception of the Funds' Chief Compliance Officer, receive no compensation from the Funds. The Board of Trustees has appointed a Chief Compliance Officer to the Funds in accordance with federal securities regulations. The Funds, along with other affiliated funds, pay their pro-rata share of the expenses associated with the Chief Compliance Officer. Each Fund's expenses for the Chief Compliance Officer will not exceed $15,000 per year.
The Trust's eligible Trustees may participate in a non-qualified deferred compensation plan which may be terminated at any time. Any payments to plan participants are paid solely out of the Funds' assets. Income earned on the plan participant's deferral account is based on the rate of return of the eligible mutual funds selected by the participant or, if no funds are selected, on the rate of return of Columbia Treasury Reserves, another portfolio of the Trust. The expense for the deferred compensation plan, which includes trustees' fees deferred during the current period as well as any gains or losses on the trustees' deferred compensation balances as a result of market fluctuations, is included in "Trustees' fees" on the Statements of Operations. The liability for the deferred compensation plan is included in "Trustees' fees" on the Statements of Assets and Liabilities.
As a result of fund mergers, certain Funds assumed the liabilities of the deferred compensation plan of the acquired fund, which are included in "Trustees' fees" on the Statements of Assets and Liabilities. The deferred compensation plan may be terminated at any time. Any payments to plan participants are paid solely out of the Funds' assets.
Note 5. Custody Credits
Each Fund has an agreement with its custodian bank under which custody fees may be reduced by balance credits. These credits are recorded as part of expense reductions on the Statements of Operations. The Funds could have invested a portion of the assets utilized in connection with the expense offset arrangement in an income-producing asset if they had not entered into such an agreement.
157
Stock Funds, February 28, 2009 (continued)
For the year ended February 28, 2009, these custody credits reduced total expenses for the Funds as follows:
| | | Custody
Credits | |
| Columbia Convertible Securities Fund | | $ | 2,643 | | |
| Columbia Large Cap Value Fund | | | 856 | | |
| Columbia Mid Cap Value Fund | | | 10,602 | | |
| Columbia Small Cap Value Fund II | | | 3,950 | | |
| Columbia Marsico Growth Fund | | | 73 | | |
| Columbia Large Cap Core Fund | | | 1,931 | | |
| Columbia Marsico Focused Equities Fund | | | 2,314 | | |
| Columbia Marsico 21st Century Fund | | | 4,215 | | |
| Columbia Small Cap Growth Fund II | | | 3,751 | | |
Note 6. Portfolio Information
For the year ended February 28, 2009, the cost of purchases and proceeds from sales of securities, excluding short-term obligations, for the Funds were as follows:
| | | U.S Government Securities | | Other Investment Securities | |
| | | Purchases | | Sales | | Purchases | | Sales | |
| Columbia Convertible Securities Fund | | $ | — | | | $ | — | | | $ | 515,591,388 | | | $ | 692,426,614 | | |
| Columbia Large Cap Value Fund | | | — | | | | 14,454,119 | | | | 1,723,816,536 | | | | 2,076,916,357 | | |
| Columbia Mid Cap Value Fund | | | — | | | | — | | | | 2,799,771,216 | | | | 1,803,683,955 | | |
| Columbia Small Cap Value Fund II | | | — | | | | — | | | | 1,043,747,193 | | | | 642,940,763 | | |
| Columbia Marsico Growth Fund | | | — | | | | — | | | | 794,149,534 | | | | 705,099,529 | | |
| Columbia Large Cap Core Fund | | | — | | | | — | | | | 1,927,293,534 | | | | 1,992,151,745 | | |
| Columbia Marsico Focused Equities Fund | | | — | | | | — | | | | 3,205,559,488 | | | | 3,016,225,442 | | |
| Columbia Marsico 21st Century Fund | | | — | | | | — | | | | 9,261,247,602 | | | | 9,263,485,099 | | |
| Columbia Small Cap Growth Fund II | | | — | | | | — | | | | 521,848,629 | | | | 559,159,345 | | |
For the period March 1, 2008 to November 9, 2008, the aggregate cost of purchases and proceeds from sales of securities, excluding short-term obligations, for the Master Portfolio in which the Former Feeder Fund invested were as follows:
| | | U.S Government Securities | | Other Investment Securities | |
| | | Purchases | | Sales | | Purchases | | Sales | |
| Columbia Marsico Growth Fund | | $ | — | | | $ | — | | | $ | 3,013,828,752 | | | $ | 3,151,950,162 | | |
158
Stock Funds, February 28, 2009 (continued)
Note 7. Redemption Fees
Columbia Marsico 21st Century Fund may impose a 2.00% redemption fee on the proceeds of fund shares that are redeemed within 60 days of purchase. The redemption fee is designed to offset brokerage commissions and other costs associated with short term trading of fund shares. The redemption fees, which are retained by the Fund, are accounted for as an addition to paid-in capital and are allocated to each class based on the relative net assets at the time of the redemption. For the year ended February 28, 2009, the redemption fees for Class A, Class B and Class C shares of Columbia Marsico 21st Century Fund amounted to $547, $1,075 and $3,214, respectively.
Note 8. Line of Credit
The Funds and other affiliated funds participate in a $280,000,000 committed, unsecured revolving line of credit provided by State Street. The maximum amount that may be borrowed by any fund is limited to the lesser of $200,000,000 and the Fund's borrowing limit set forth in the Fund's registration statement. Borrowings are available for short-term liquidity or temporary or emergency purposes.
Interest is charged to each participating fund based on the fund's borrowings at a rate per annum equal to the greater of the Federal Funds Rate plus 0.50% or the overnight LIBOR Rate plus 0.50%. In addition, an annual operations agency fee of $20,000, an amendment fee of 0.02% and a commitment fee of 0.12% per annum are accrued and apportioned among the participating funds pro rata based on their relative net assets.
Prior to October 16, 2008, the Funds and other affiliated funds participated in a $350,000,000 committed, unsecured revolving line of credit and a $150,000,000 uncommitted, unsecured line of credit, both provided by State Street. Interest on the committed line of credit was charged to each participating fund based on the fund's borrowings at a rate per annum equal to the Federal Funds Rate plus 0.50%. In addition, a commitment fee of 0.10% per annum was accrued and apportioned among the participating funds pro rata based on their relative net assets. Interest on the uncommitted line of credit was charged to each participating fund based on the fund's borrowings at a rate per annum equal to the Federal Funds Rate plus 0.375%. State Street charged an annual operations agency fee of $40,000 for the committed line of credit and was able to charge an annual administration fee of $15,000 for the uncommitted line of credit. The commitm ent fee, the operations agency fee and the administration fee were accrued and apportioned among the participating funds pro rata based on their relative net assets.
For the year ended February 28, 2009, the average daily loan balance outstanding on days where borrowing existed, and the weighted average interest rate of each Fund were as follows:
| | | Average
Borrowings | | Weighted
Average
Interest
Rates | |
Columbia Convertible
Securities Fund | | $ | 2,000,000 | | | | 3.38 | % | |
| Columbia Large Cap Value Fund | | | 5,500,000 | | | | 2.25 | | |
| Columbia Large Cap Core Fund | | | 1,400,000 | | | | 2.24 | | |
Columbia Small Cap
Growth Fund II | | | 500,000 | | | | 1.75 | | |
Note 9. Securities Lending
Each Fund may lend its securities to certain approved brokers, dealers and other financial institutions. Each loan is collateralized by cash, in an amount at least equal to the market value of the securities loaned plus accrued income from the investment of collateral. The market value of the loaned securities is determined at the close of business of the Funds and any additional required collateral is delivered to the Funds on the next business day. The collateral received is invested and the income generated by the investment of the collateral, net of any fees remitted to State Street as the lending agent and borrower rebates, is paid to the Funds. Generally, in the event of borrower default, the Funds have the right to use the collateral to offset any losses incurred. In the event the Funds are delayed or prevented from exercising their right to dispose of the collateral, there may be a potential loss to the Funds. The Funds bear the risk of loss with respect to the investment of collateral.
159
Stock Funds, February 28, 2009 (continued)
Note 10. Shares of Beneficial Interest
As of February 28, 2009, the Funds had shareholders whose shares were beneficially owned by participant accounts over which BOA and/or any of its affiliates had either sole or joint investment discretion. The percentages of shares of beneficial interest outstanding held therein are as follows:
| | | % of Shares
Outstanding
Held | |
| Columbia Convertible Securities Fund | | | 35.7 | | |
| Columbia Large Cap Value Fund | | | 35.1 | | |
| Columbia Mid Cap Value Fund | | | 11.9 | | |
| Columbia Small Cap Value Fund II | | | 23.3 | | |
| Columbia Marsico Growth Fund | | | 32.9 | | |
| Columbia Large Cap Core Fund | | | 60.9 | | |
| Columbia Marsico Focused Equities Fund | | | 26.0 | | |
| Columbia Marsico 21st Century Fund | | | 14.3 | | |
| Columbia Small Cap Growth Fund II | | | 34.3 | | |
As of February 28, 2009, the Funds had shareholders that held greater than 5% of the shares outstanding of a Fund, over which BOA and/or any of its affiliates did not have investment discretion. The number of accounts and the percentages of shares of beneficial interest outstanding held therein are as follows:
| | | Number of
Shareholders
Outstanding | | % of Shares
Outstanding
Held | |
| Columbia Mid Cap Value Fund | | | 1 | | | | 7.5 | | |
Columbia Small Cap
Value Fund ll | | | 4 | | | | 20.6 | | |
| Columbia Marsico Growth Fund | | | 2 | | | | 14.0 | | |
Columbia Marsico Focused
Equities Fund | | | 1 | | | | 11.5 | | |
Subscription and redemption activity of these accounts may have a significant effect on the operations of the Funds.
Note 11. Significant Risks and Contingencies
Foreign Securities Risk
There are certain additional risks involved when investing in foreign securities. These risks may involve foreign currency exchange rate fluctuations, adverse political and economic developments and the possible prevention of currency exchange or other foreign governmental laws or restrictions. In addition, the liquidity of foreign securities may be more limited than that of domestic securities.
Investments in emerging market countries are subject to additional risk. The risk of foreign investments is typically increased in less developed countries. These countries are also more likely to experience high levels of inflation, deflation or currency devaluation which could hurt their economies and securities markets.
Legal Proceedings
Columbia Management Advisors, LLC and Columbia Management Distributors, Inc. (collectively, the "Columbia Group") are subject to a settlement agreement with the New York Attorney General ("NYAG") (the "NYAG Settlement") and a settlement order with the SEC (the "SEC Order") on matters relating to mutual fund trading, each dated February 9, 2005. Under the terms of the SEC Order, the Columbia Group (or predecessor entities) agreed, among other things, to: pay disgorgement and civil money penalties collectively totaling $375 million; cease and desist from violations of the antifraud provisions and certain other provisions of the federal securities laws; maintain certain compliance and ethics oversight structures; and retain an independent consultant to review the Columbia Group's applicable supervisory, compliance, control and other policies and procedures. The NYAG Settlement, among other things, requires Columbia Management Advis ors, LLC and its affiliates to reduce management fees for certain funds in the Columbia family of mutual funds in a projected total of $160 million over five years through November 30, 2009 and to make certain disclosures to investors relating to expenses. In connection with the Columbia Group providing services to the Columbia Funds, the Columbia Funds have voluntarily undertaken to implement certain governance measures designed to maintain the independence of their boards of trustees and certain special consulting and compliance measures.
160
Stock Funds, February 28, 2009 (continued)
Pursuant to the SEC Order and related procedures, the $375 million in settlement amounts described above, of which approximately $90 million has been earmarked for certain Columbia Funds and their shareholders, is being distributed in accordance with a distribution plan developed by an independent distribution consultant and approved by the SEC on December 27, 2007. Distributions under the distribution plan began in mid-June 2008.
Civil Litigation
In connection with the events that resulted in the NYAG Settlement and SEC Order, various parties filed suits against Bank of America Corporation and certain of its affiliates, including Banc of America Capital Management, LLC ("BACAP," now known as Columbia Management Advisors, LLC) and BACAP Distributors, LLC (now known as Columbia Management Distributors, Inc.) (collectively "BAC"), Nations Funds Trust (now known as Columbia Funds Series Trust) and its Board of Trustees. On February 20, 2004, the Judicial Panel on Multidistrict Litigation transferred these cases and cases against other mutual fund companies based on similar allegations to the United States District Court in Maryland for consolidated or coordinated pretrial proceedings (the "MDL"). Subsequently, additional related cases were transferred to the MDL. On September 29, 2004, the plaintiffs in the MDL filed amended and consolidated complaints. One of these amended complaints is a putative class action that includes claims under the federal securities laws and state common law, and that names Nations Funds Trust, the Trustees, BAC and others as defendants. Another of the amended complaints is a derivative action purportedly on behalf of the Nations Funds Trust against BAC and others that asserts claims under federal securities laws and state common law. Nations Funds Trust is a nominal defendant in this action.
On February 25, 2005, BAC and other defendants filed motions to dismiss the claims in the pending cases. On December 15, 2005, BAC and others entered into a Stipulation of Settlement of the direct and derivative claims brought on behalf of the Nations Funds shareholders. The settlement is subject to court approval. If the settlement is approved, BAC would pay settlement administration costs and fees to plaintiffs' counsel as approved by the court. The stipulation has not yet been presented to the court for approval.
Note 12. Business Combinations and Mergers
As of the close of business on September 22, 2006, Columbia Small Company Equity Fund merged into Columbia Small Cap Growth Fund II. Columbia Small Cap Growth Fund II received a tax-free transfer of assets from Columbia Small Company Equity Fund as follows:
Shares
Issued | | Net Assets
Received | | Unrealized
Appreciation* | |
| | 13,634,952 | | | $ | 184,102,330 | | | $ | 11,128,807 | | |
Net Assets
of Columbia
Small Cap
Growth Fund II
Prior to
Combination | | Net Assets
of Columbia
Small Company
Equity Fund
Immediately
Prior to Combination | | Net Assets
of Columbia
Small Cap
Growth Fund II
Immediately
After Combination | |
| $ | 386,854,349 | | | $ | 184,102,330 | | | $ | 570,956,679 | | |
* Unrealized appreciation is included in the Net Assets Received.
161
Report of Independent Registered Public Accounting Firm
To the Shareholders and Trustees of Columbia Funds Series Trust
In our opinion, the accompanying statements of assets and liabilities, including the investment portfolios, and the related statements of operations and of changes in net assets and the financial highlights present fairly, in all material respects, the financial position of Columbia Convertible Securities Fund, Columbia Large Cap Value Fund, Columbia Mid Cap Value Fund, Columbia Small Cap Value Fund II, Columbia Marsico Growth Fund, Columbia Large Cap Core Fund, Columbia Marsico Focused Equities Fund, Columbia Marsico 21st Century Fund and Columbia Small Cap Growth Fund II (constituting part of Columbia Funds Series Trust, hereafter referred to as the "Funds") at February 28, 2009, the results of each of their operations, the changes in each of their net assets and the financial highlights for each of the periods indicated, in conformity with accounting principles generally accepted in the United States of America. Th ese financial statements and financial highlights (hereafter referred to as "financial statements") are the responsibility of the Funds' management. Our responsibility is to express an opinion on these financial statements based on our audits. We conducted our audits of these financial statements in accordance with the standards of the Public Company Accounting Oversight Board (United States). Those standards require that we plan and perform the audit to obtain reasonable assurance about whether the financial statements are free of material misstatement. An audit includes examining, on a test basis, evidence supporting the amounts and disclosures in the financial statements, assessing the accounting principles used and significant estimates made by management, and evaluating the overall financial statement presentation. We believe that our audits, which included confirmation of securities at February 28, 2009 by correspondence with the custodian and brokers, provide a reasonable basis for our opinion.
PricewaterhouseCoopers LLP
Boston, Massachusetts
April 22, 2009
162
Federal Income Tax Information (Unaudited)
Columbia Convertible Securities Fund
For non-corporate shareholders 43.35% or the maximum amount allowable under the Jobs and Growth Tax Relief Reconciliation Act of 2003, of ordinary income distributed by the Fund for the period March 1, 2008 to February 28, 2009 may represent qualified dividend income. Final information will be provided in your 2009 Form 1099-DIV.
59.12% of the ordinary income distributed by the Fund, for the year ended February 28, 2009, qualifies for the corporate dividends received deduction.
Columbia Large Cap Value Fund
For non-corporate shareholders 100.00% or the maximum amount allowable under the Jobs and Growth Tax Relief Reconciliation Act of 2003, of ordinary income distributed by the Fund for the period March 1, 2008 to February 28, 2009 may represent qualified dividend income. Final information will be provided in your 2009 Form 1099-DIV.
100.00% of the ordinary income distributed by the Fund, for the year ended February 28, 2009, qualifies for the corporate dividends received deduction.
Columbia Mid Cap Value Fund
For non-corporate shareholders 100.00% or the maximum amount allowable under the Jobs and Growth Tax Relief Reconciliation Act of 2003, of ordinary income distributed by the Fund for the period March 1, 2008 to February 28, 2009 may represent qualified dividend income. Final information will be provided in your 2009 Form 1099-DIV.
100.00% of the ordinary income distributed by the Fund, for the year ended February 28, 2009, qualifies for the corporate dividends received deduction.
Columbia Small Cap Value Fund II
The Fund hereby designates as a capital gain dividend with respect to the taxable year ended February 28, 2009, $194,724 or, if subsequently determined to be different, the net capital gain of such year.
For non-corporate shareholders 98.17% or the maximum amount allowable under the Jobs and Growth Tax Relief Reconciliation Act of 2003, of ordinary income distributed by the Fund for the period March 1, 2008 to February 28, 2009 may represent qualified dividend income. Final information will be provided in your 2009 Form 1099-DIV.
98.16% of the ordinary income distributed by the Fund, for the year ended February 28, 2009, qualifies for the corporate dividends received deduction.
Columbia Marsico Growth Fund
For non-corporate shareholders 100.00% or the maximum amount allowable under the Jobs and Growth Tax Relief Reconciliation Act of 2003, of ordinary income distributed by the Fund for the period March 1, 2008 to February 28, 2009 may represent qualified dividend income. Final information will be provided in your 2009 Form 1099-DIV.
100.00% of the ordinary income distributed by the Fund, for the year ended February 28, 2009, qualifies for the corporate dividends received deduction.
Columbia Large Cap Core Fund
For non-corporate shareholders 100.00% or the maximum amount allowable under the Jobs and Growth Tax Relief Reconciliation Act of 2003, of ordinary income distributed by the Fund for the period March 1, 2008 to February 28, 2009 may represent qualified dividend income. Final information will be provided in your 2009 Form 1099-DIV.
100.00% of the ordinary income distributed by the Fund, for the year ended February 28, 2009, qualifies for the corporate dividends received deduction.
Columbia Marsico Focused Equities Fund
For non-corporate shareholders 100.00% or the maximum amount allowable under the Jobs and Growth Tax Relief Reconciliation Act of 2003, of ordinary income distributed by the Fund for the period March 1, 2008 to February 28, 2009 may represent qualified dividend income. Final information will be provided in your 2009 Form 1099-DIV.
100.00% of the ordinary income distributed by the Fund, for the year ended February 28, 2009, qualifies for the corporate dividends received deduction.
163
Fund Governance
The Trustees serve terms of indefinite duration. The names, addresses and ages of the Trustees and officers of the Funds in the Columbia Funds Complex, the year each was first elected or appointed to office, their principal business occupations during at least the last five years, the number of Funds overseen by each Trustee and other directorships they hold are shown below. Each officer listed below serves as an officer of each Fund in the Columbia Funds Complex.
Independent Trustees
Name, Address and Age,
Position with Funds, Year First
Elected or Appointed to Office | | Principal Occupation(s) During Past Five Years, Number of Funds in the Columbia
Funds Complex Overseen by Trustee, Other Directorships Held
| |
| Edward J. Boudreau (Born 1944) | |
|
c/o Columbia Management
Advisors, LLC
One Financial Center
Boston, MA 02111
Trustee (since 2005) | | Managing Director—E.J. Boudreau & Associates (consulting), from 2000 through current; oversees 66; no other directorships held. | |
|
| William P. Carmichael (Born 1943) | |
|
c/o Columbia Management
Advisors, LLC
One Financial Center
Boston, MA 02111
Trustee (since 1999) | | Retired. Oversees 66; Director—Cobra Electronics Corporation (electronic equipment manufacturer); Director—Spectrum Brands, Inc. (consumer products); Director—Simmons Company (bedding); Director—The Finish Line (sportswear). | |
|
| William A. Hawkins (Born 1942) | |
|
c/o Columbia Management Advisors, LLC
One Financial Center
Boston, MA 02111
Trustee (since 2005) | | President and Chief Executive Officer—California General Bank, N.A., from January 2008 through current; President, Retail Banking—IndyMac Bancorp, Inc., from September 1999 to August 2003; oversees 66; no other directorships held. | |
|
| R. Glenn Hilliard (Born 1943) | |
|
c/o Columbia Management Advisors, LLC
One Financial Center
Boston, MA 02111
Trustee (since 2005) | | Chairman and Chief Executive Officer—Hilliard Group LLC (investing and consulting), from April 2003 through current; Non-Executive Director & Chairman—Conseco, Inc. (insurance), September 2003 through current; Executive Chairman—Conseco, Inc. (insurance), August 2004 through September 2005, Chairman and Chief Executive Officer—ING Americas, from 1999 through April 2003; oversees 66; Director—Conseco, Inc. (insurance). | |
|
| John J. Nagorniak (Born 1944) | |
|
c/o Columbia Management
Advisors, LLC
One Financial Center
Boston, MA 02111
Trustee (since 2008)` | | Retired. President and Director—Foxstone Financial, Inc. (consulting), 2000 through December 2007; Director—Mellon Financial Corporation affiliates (investing), 2000 through 2007; Chairman—Franklin Portfolio Associates (investing—Mellon affiliate), 1982 through 2007; oversees 66; Director—MIT Investment Company; Trustee—MIT 401k Plan; Trustee and Chairman—Research Foundation of CFA Institute. | |
|
164
Fund Governance (continued)
Independent Trustees (continued)
Name, Address and Age,
Position with Funds, Year First
Elected or Appointed to Office | | Principal Occupation(s) During Past Five Years, Number of Funds in the Columbia
Funds Complex Overseen by Trustee, Other Directorships Held
| |
| Anthony M. Santomero (Born 1946) | |
|
c/o Columbia Management Advisors, LLC
One Financial Center
Boston, MA 02111
Trustee (since 2008) | | Richard K. Mellon Professor Emeritus of Finance, The Wharton School, University of Pennsylvania, from 1972 through current; Senior Advisor—McKinsey & Company (consulting), July 2006 through December 2007; President and Chief Executive Officer—Federal Reserve Bank of Philadelphia, 2000 through April 2006; oversees 66; no other directorships held. | |
|
| Minor M. Shaw (Born 1947) | |
|
c/o Columbia Management Advisors, LLC
One Financial Center
Boston, MA 02111
Trustee (since 2003) | | President—Micco Corporation, Chairman—The Daniel-Mickel Foundation; oversees 66; Board Member—Piedmont Natural Gas. | |
|
The Statement of Additional Information includes additional information about the Trustees of the Funds and is available, without charge, upon request by calling 800-345-6611.
165
Fund Governance (continued)
Officers
Name, Address and Year of Birth,
Position with Columbia Funds,
Year First Elected or
Appointed to Office | | Principal Occupation(s) During Past Five Years
| |
| J. Kevin Connaughton (Born 1964) | |
|
One Financial Center
Boston, MA 02111
President (since 2009) | | Managing Director of Columbia Management Advisors, LLC since December 2004; Senior Vice President and Chief Financial Officer—Columbia Funds, from June 2008 to January 2009; Treasurer—Columbia Funds, from October 2003 to May 2008; Treasurer—the Liberty Funds, Stein Roe Funds and Liberty All-Star Funds, December 2000—December 2006; Senior Vice President—Columbia Management Advisors, LLC, from April 2003 to December 2004; President—Columbia Funds, Liberty Funds and Stein Roe Funds, February 2004 to October 2004; Treasurer—Galaxy Funds, September 2002 to December 2005; Treasurer, December 2002 to December 2004, and President, February 2004 to December 2004—Columbia Management Multi-Strategy Hedge Fund, LLC; and a senior officer of various other Bank of America-affiliated entities, including other registered and unregistered funds | |
|
| James R. Bordewick, Jr. (Born 1959) | |
|
One Financial Center
Boston, MA 02111
Senior Vice President, Secretary and Chief Legal Officer (since 2006) | | Associate General Counsel, Bank of America since April 2005; Senior Vice President and Associate General Counsel, MFS Investment Management (investment management) prior to April 2005. | |
|
| Linda J. Wondrack (Born 1964) | |
|
One Financial Center
Boston, MA 02111
Senior Vice President and
Chief Compliance Officer (since 2007) | | Director (Columbia Management Group LLC and Investment Product Group Compliance), Bank of America since June 2005; Director of Corporate Compliance and Conflicts Officer, MFS Investment Management (investment management), August 2004 to May 2005; Managing Director, Deutsche Asset Management (investment management) prior to August 2004. | |
|
| Michael G. Clarke (Born 1969) | |
|
One Financial Center
Boston, MA 02111
Senior Vice President and
Chief Financial Officer (since 2009) | | Director of Fund Administration of the Advisor since January 2006; Managing Director of the Advisor September 2004 to December 2005; Vice President Fund Administration June 2002 to September 2004. | |
|
| Jeffrey R. Coleman (Born 1969) | |
|
One Financial Center
Boston, MA 02111
Treasurer (since 2008) | | Director of Fund Administration of the Advisor since January 2006; Fund Controller of the Advisor from October 2004 to January 2006; Vice President of CDC IXIS Asset Management Services, Inc. (investment management) from August 2000 to September 2004. | |
|
| Joseph F. DiMaria (Born 1968) | |
|
One Financial Center
Boston, MA 02111
Chief Accounting Officer (since 2008) | | Director of Fund Administration of the Advisor since January 2006; Head of Tax/Compliance and Assistant Treasurer of the Advisor from November 2004 to December 2005; Director of Trustee Administration (Sarbanes-Oxley) of the Advisor from May 2003 to October 2004. | |
|
166
Fund Governance (continued)
Officers (continued)
Name, Address and Year of Birth,
Position with Columbia Funds,
Year First Elected or
Appointed to Office | | Principal Occupation(s) During Past Five Years
| |
| Julian Quero (Born 1967) | |
|
One Financial Center
Boston, MA 02111
Deputy Treasurer (since 2008) | | Senior Tax Manager of the Advisor since August 2006; Senior Compliance Manager of the Advisor from April 2002 to August 2006. | |
|
| Barry S. Vallan (Born 1969) | |
|
One Financial Center
Boston, MA 02111
Controller (since 2006) | | Vice President—Fund Treasury of the Advisor since October 2004; Vice President—Trustee Reporting of the Advisor from April 2002 to October 2004. | |
|
167
Board Consideration and Re-Approval of Investment Advisory and Sub-Advisory Agreements
The Boards of Trustees of Columbia Funds Series Trust and Columbia Funds Master Investment Trust, LLC (the "Boards"), including a majority of the Trustees who have no direct or indirect interest in the investment advisory and sub-advisory agreements and are not "interested persons" of the Trusts, as defined in the Investment Company Act of 1940 (the "1940 Act") (the "Independent Trustees"), are required annually to review and re-approve the existing investment advisory and sub-advisory agreements and approve any newly proposed terms therein. In this regard, the Boards reviewed and re-approved, during the most recent six months covered by this report, (i) investment advisory agreements with Columbia Management Advisors, LLC ("CMA") for Columbia Convertible Securities Fund, Columbia Large Cap Value Fund, Columbia Mid Cap Value Fund, Columbia Small Cap Value Fund II, Columbia Marsico Growth Fund1, Columbia Large Cap Core Fund, Columbia Marsico Focused Equities Fund, Columbia Marsico 21st Century Fund and Columbia Small Cap Growth Fund II; and (ii) investment sub-advisory agreements with Marsico Capital Management ("Marsico Capital" or the "Sub-Adviser") for Columbia Marsico Focused Equities Fund, Columbia Marsico 21st Century Fund and Columbia Marsico Growth Fund. The investment advisory agreements with CMA and the investment sub-advisory agreements with Marsico Capital are each referred to as an "Advisory Agreement" and collectively referred to as the "Advisory Agreements." The funds identified above are each referred to as a "Fund" and collectively referred to as the "Funds."
More specifically, at meetings held on November 10-11, 2008, the Boards, including the Independent Trustees advised by their independent legal counsel, considered the factors and reached the conclusions described below relating to the selection of CMA and the Sub-Adviser and the re-approval of the Advisory Agreements. The Boards also reviewed and considered a report prepared and provided by the Independent Fee Consultant (the "Consultant") appointed by the Independent Trustees pursuant to an assurance of discontinuance entered into with the New York Attorney General ("NYAG") to settle a civil complaint filed by the NYAG relating to trading in mutual fund shares (the "NYAG Settlement"). During the fee review process, the Consultant's role was to manage the review process to ensure that fees are negotiated in a manner that is at arms' length and reasonable. Th e Consultant found that the fee negotiation process was, to the extent practicable, at arms' length and reasonable and consistent with the requirements of the NYAG Settlement. A summary of the Consultant's report is available at www.columbiafunds.com.
In preparation for the November meetings, the Boards met in August for review and discussion of the materials described below. The Investment Committees of the Boards also met in June to discuss each Fund's performance with its respective portfolio manager(s). In addition to these meetings, the Investment Committees receive and discuss performance reports at their quarterly meetings. The Contracts Review Committees also provided support in managing and coordinating the process by which the Boards reviewed the Advisory Agreements. The Boards' review and conclusions are based on comprehensive consideration of all information presented to them and are not the result of any single controlling factor.
Nature, Extent and Quality of Services. The Boards received and considered various data and information regarding the nature, extent and quality of services provided to the Funds by CMA and the Sub-Adviser under the Advisory Agreements. The most recent investment adviser registration forms ("Forms ADV") for CMA and the Sub-Adviser were made available to the Boards, as were CMA's and the Sub-Adviser's responses to a detailed series of requests submitted by the Independent Trustees' independent legal counsel on behalf of such Trustees. The Boards reviewed and analyzed those materials, which included, among other things, information about the background and experience of senior management and investment personnel of CMA and the Sub-Adviser.
In addition, the Boards considered the investment and legal compliance programs of the Funds, CMA and the Sub-Adviser, including their compliance policies and procedures and reports of the Funds' Chief Compliance Officer.
The Boards evaluated the ability of CMA and the Sub-Adviser, based on their resources, reputation and other attributes, to attract and retain qualified investment professionals,
1At a meeting held in May 2008, the Boards voted to take various actions to convert Columbia Marsico Growth Fund (the "Feeder Fund") into a stand-alone fund, investing directly in individual portfolio securities rather than in Columbia Marsico Growth Master Portfolio. Among other actions, the Board of Trustees of Columbia Funds Series Trust adopted an advisory agreement with CMA and a sub-advisory agreement with Marsico Capital for the Feeder Fund on the same terms as were in place at the Master Portfolio level. In recognition of the Feeder Fund's conversion into a stand-alone fund, the Boards' review discussed herein was applied at the Feeder Fund-level. The conversion took place on November 7, 2008.
168
including research, advisory and supervisory personnel. In this regard, the Boards considered information regarding CMA's compensation program for its personnel involved in the management of the Funds. The Boards also considered CMA's investment in further developing its research and trading departments.
Based on the above factors, together with those referenced below, the Boards concluded that they were satisfied with the nature, extent and quality of the investment advisory services provided to each of the Funds by CMA and the Sub-Adviser.
Fund Performance and Expenses. The Boards considered the performance results for each of the Funds over multiple measurement periods. They also considered these results in comparison to the performance results of the group of funds that was determined by Lipper Inc. ("Lipper") to be the most similar to a given Fund (the "Peer Group") and to the performance of a broader universe of relevant funds as determined by Lipper (the "Universe"), as well as to each Fund's benchmark index. Lipper is an independent provider of investment company data. The Boards were provided with a description of the methodology used by Lipper to select the mutual funds in each Fund's Peer Group and Universe and considered potential imprecision resulting from the selection methodology. The Boards also considered certain risk-adjusted performance data.
The Boards received and considered statistical information regarding each Fund's total expense ratio and its various components, including contractual advisory fees, actual advisory fees, actual non-management fees, Rule 12b-1 and non-Rule 12b-1 service fees, fee waivers/caps and/or expense reimbursements. The Boards also considered comparisons of these fees to the expense information for each Fund's Peer Group and Universe, which comparative data was provided by Lipper. For certain Funds, Lipper determined that the composition of the Peer Group and/or Universe for expenses would differ from the composition for performance to provide a more accurate basis of comparison. The Boards also considered Lipper data that ranked each Fund based on: (i) each Fund's one-year performance compared to actual management fees; (ii) each Fund's one-year performance compared to total expenses; (iii) each Fund's three-year performance compared to actual management fees; and (iv) each Fund's three-year performance compared to total expenses.
Investment Advisory and Sub-Advisory Fee Rates. The Boards reviewed and considered the proposed contractual investment advisory fee rates together with the administration fee rates payable by the Funds to CMA for investment advisory services (the "Contractual Management Rates"). The Boards also reviewed and considered the proposed contractual investment sub-advisory fee rates (the "Sub-Advisory Agreement Rates") payable by CMA to the Sub-Adviser for investment sub-advisory services. In addition, the Boards reviewed and considered the proposed fee waiver/cap arrangements applicable to the Contractual Management Rates and considered the Contractual Management Rates after taking the waivers/caps into account (the "Actual Management Rates"). The Boards noted that, on a complex-wide basis, CMA had reduced annual management fees by at least $32 million per year pursuant to the NYAG Settlement. The Boards also noted reductions in net advisory rates and/or total expenses of certain funds across the fund complex. Additionally, the Boards received and afforded specific attention to information comparing the Contractual Management Rates and Actual Management Rates with those of the other funds in their respective Peer Groups.
For certain Funds highlighted as meeting agreed-upon criteria for warranting further review, the Boards engaged in further analysis with regard to approval of the Funds' Advisory Agreements. The Boards engaged in further review of Columbia Convertible Securities Fund because its Actual Management Rate and total expense ratio were appreciably above the median range of its Peer Group and its performance over some periods was appreciably below the median range of its Universe. However, the Boards noted factors such as the positive performance of the Fund relative to its performance Universe over some periods, that outweighed the factors noted above.
The Boards also engaged in further review of Columbia Marsico 21st Century Fund because its Actual Management Rate was appreciably above the median range of its Peer Group. However, the Boards noted such factors as performance that was above the median of its performance Universe and total expenses that were below the median of its expense Universe, that outweighed the factor noted above. The Boards separately considered Columbia Marsico Focused Equities Fund and Columbia Marsico Growth Fund because their Actual Management Rates and total expense ratios were appreciably above the median range of their respective Peer
169
Groups and their performance over some periods was below the median range of their respective Peer Groups. However, the Boards noted factors such as each Fund's out-performance of the median of their respective Peer Groups and performance Universes in other measurement periods, as well as each Fund's breakpoint compensation schedule and waiver, that outweighed the factors noted above.
The Boards concluded that the factors noted above supported the Contractual Management Rates and the Actual Management Rates, and the approval of the Advisory Agreements for all of the Funds.
With regard to the Funds with a sub-adviser, the Boards also reviewed the Sub-Advisory Agreement Rates, including comparative fee information provided by the Adviser and the Adviser's recommendation that the Boards re-approve the Advisory Agreements with Marsico Capital. The Boards also considered a new breakpoint fee schedule, charged by Marsico Capital, which serves as Sub-Adviser to certain of the Funds, as well as a corresponding waiver of Contractual Management Rates, both of which were implemented on January 1, 2008. The Boards concluded that the Sub-Advisory Agreement Rates are fair and equitable, based on their consideration of the factors described above.
Profitability. The Boards received and considered a detailed profitability analysis of CMA based on the Contractual Management Rates and the Actual Management Rates, as well as on other relationships between the Funds and other funds in the complex on the one hand and CMA affiliates on the other. The analysis included complex-wide and per-Fund information and a comparison of results using alternative allocation methodologies. The Boards concluded that, in light of the costs of providing investment management and other services, the profits and other ancillary benefits that CMA and its affiliates received from providing these services were not unreasonable.
Economies of Scale. The Boards received and considered information regarding whether there have been economies of scale with respect to the management of the Funds, whether the Funds have appropriately benefited from any economies of scale and whether there is potential for realization of any further economies of scale. Most particularly, CMA provided information showing that, as a percentage of fund assets, CMA's complex-wide revenues, expenses and profits declined over a four-year period during which fund assets increased by 39% and the shareholder benefit over a two-year period increased from 33% to 41% of the Adviser's total profits. The Boards concluded that any potential economies of scale are shared fairly with Fund shareholders, most particularly through breakpoints and fe e waiver arrangements.
The Boards acknowledged the inherent limitations of any analysis of an investment adviser's economies of scale, stemming largely from the Boards' understanding that economies of scale are realized, if at all, by an investment adviser across a variety of products and services, not just with respect to a single fund.
Information About Services to Other Clients. The Boards also received and considered information about the nature and extent of services and fee rates offered by CMA and the Sub-Adviser to their other clients, including separate accounts and institutional investors. In this regard, the Boards concluded that, where the Contractual Management Rates, Sub-Advisory Agreement Rates and Actual Management Rates were appreciably above the range of the fee rates offered to other CMA and Sub-Adviser clients, based on information provided by CMA and the Sub-Adviser, the costs associated with managing and operating a registered investment company provided a justification for the higher fee rates charged to the Funds.
Other Benefits to CMA and the Sub-Adviser. The Boards received and considered information regarding any "fall-out" or ancillary benefits received by CMA and its affiliates and the Sub-Adviser as a result of their relationship with the Funds. Such benefits could include, among others, benefits attributable to CMA's and the Sub-Adviser's relationships with the Funds (such as soft-dollar credits) and benefits potentially derived from an increase in CMA's and the Sub-Adviser's business as a result of their relationship with the Funds (such as the ability to market to shareholders other financial products offered by CMA and its affiliates or a Sub-Adviser).
The Boards considered the effectiveness of the policies of the Funds in achieving the best execution of portfolio transactions, whether and to what extent soft dollar credits are sought and how any such credits are utilized, any benefits that may be realized by using an affiliated broker, the extent to which efforts are made to recapture transaction costs, and the controls applicable to brokerage allocation procedures. The
170
Boards also reviewed CMA's and the Sub-Adviser's methods for allocating portfolio investment opportunities among the Funds and other clients. The Boards concluded that the benefits were not unreasonable.
Other Factors and Broader Review. As discussed above, the Boards review materials received from CMA and the Sub-Adviser annually as part of the re-approval process under Section 15(c) of the 1940 Act. The Boards also review and assess the quality of the services the Funds receive throughout the year. In this regard, the Boards and their Committees review reports of CMA and the Sub-Adviser at each of their quarterly meetings, which include, among other things, Fund performance reports. In addition, the Boards and their Committees confer with portfolio managers at various times throughout the year including, most particularly, in the June Investment Committee meeting.
Conclusion. After considering the above-described factors, based on their deliberations and their evaluation of the information provided, the Boards concluded that the compensation payable to CMA and the Sub-Adviser under the Advisory Agreements is fair and equitable. Accordingly, the Boards unanimously re-approved the Advisory Agreements.
171
Summary of Management Fee Evaluation by
Independent Fee Consultant
EXCERPTS FROM REPORT OF INDEPENDENT FEE CONSULTANT TO THE FUNDS SUPERVISED BY THE COLUMBIA NATIONS BOARD
Prepared pursuant to the February 9, 2005
Assurance of Discontinuance among the
Office of Attorney General of New York State,
Columbia Management Advisors, LLC and
Columbia Management Distributors, Inc.
November 12, 2008
I. Overview
On February 9, 2005, Columbia Management Advisors, LLC ("CMA") and Columbia Management Distributors, Inc.1 ("CMD") agreed to the New York Attorney General's Assurance of Discontinuance ("AOD"). Among other matters, the AOD stipulates that CMA may manage or advise a Columbia Fund ("Columbia Fund" and together with all such funds or a group of such funds as the "Columbia Funds") only if the Independent Members of the Columbia Fund's Board of Trustees appoint a Senior Officer or retain an Independent Fee Consultant ("IFC") who is to manage the process by which proposed management fees are negotiated. The AOD further stipulates that the Senior Officer or IFC is to prepare a written annual evaluation of the fee negotiation process.
With effect from January 1, 2007, the Independent Members of the Board of Trustees for certain Columbia Funds known collectively as the "Nations Funds" (the "Trustees") retained me as IFC for the Nations Funds.2 In this capacity, I have prepared the fourth annual written evaluation of the fee negotiation process. As was the case with last year's report (the "2007 Report") my immediate predecessor as IFC, John Rea, provided invaluable assistance in the preparation of this year's report.
A. Role of the Independent Fee Consultant
The AOD charges the IFC with "managing the process by which proposed management fees...to be charged the Columbia Fund are negotiated so that they are negotiated in a manner which is at arms' length and reasonable and consistent with this Assurance of Discontinuance." The AOD also provides that CMA "may manage or advise a Columbia Fund only if the reasonableness of the proposed management fees is determined by the Board of Trustees...using...an annual independent written evaluation prepared by or under the direction of...the Independent Fee Consultant." Therefore, the AOD makes clear that the IFC does not supplant the Trustees in negotiating management fees with CMA, nor does the IFC substitute his or her judgment for that of the Trustees with respect to the reasonableness of proposed fees or any other matter that is committed to the business judgment of the Trustees.
B. Elements Involved in Managing the Fee Negotiation Process
In preparing the report required by the AOD, the IFC must consider at least the following six factors set forth in the AOD:
1. The nature and quality of CMA's services, including the Fund's performance;
2. Management fees (including any components thereof) charged by other mutual fund companies for like services;
3. Possible economies of scale as the Fund grows larger;
4. Management fees (including any components thereof) charged to institutional and other clients of CMA for like services;
5. Costs to CMA and its affiliates of supplying services pursuant to the management fee agreements, excluding any intra-corporate profit; and
6. Profit margins of CMA and its affiliates from supplying such services.
C. Organization of the Annual Evaluation
This report, like last year's, focuses on the six factors and contains a section for each factor except that CMA's costs and profits from managing the Funds have been combined into a single section. In addition to a discussion of these factors, the report offers recommendations to improve the fee review process in future years. A review of the status of recommendations made in the 2007 Report is being provided separately with the materials for the November meeting.
1 CMA and CMD are subsidiaries of Columbia Management Group, LLC ("CMG"), and are the successors to the entities named in the AOD.
2 I have no material relationship with Bank of America, CMG or any of its affiliates, aside from serving as IFC, and I am aware of no material relationship with any of their affiliates. I retained John Rea, an independent economic consultant, to assist me with this report.
Unless otherwise stated or required by the context, this report covers only the Nations Funds, which are also referred as the "Funds."
172
II. Summary of Findings
A. General
1. Based upon my examination of the information supplied by CMG in the light of the six factors set forth in the AOD, I conclude that the Trustees have the relevant information necessary to evaluate the reasonableness of the proposed management fees for each Nations Fund.
2. In my view, the process by which the proposed management fees of the Funds have been negotiated in 2008 thus far has been, to the extent practicable, at arms' length and reasonable and consistent with the AOD.
B. Nature and Quality of Services, Including Performance
3. The performance of the Funds has been relatively good for the most recent 1-, 3- and 5-year periods. The strongest records were posted by the Funds in the Active Equity and Quantitative Strategies Groups and by the sub-advised Funds. The 5-year performance rankings of the subadvised Funds were particularly strong, with all such Funds in the top two performance quintiles.
4. The 1- and 3-year performance records of the Funds declined slightly from 2007 to 2008, while the 5-year performance records improved year-over-year. Most Funds changed their 1-year performance quintile year-over-year, while the 5-year rankings were, as expected, much more stable, with less than half the Funds moving to a different 5-year performance quintile.
5. The performance of the actively-managed equity and sub-advised Funds against their benchmarks was strong, especially for the 1- and 3-year performance periods. However, no fixed-income Fund with a reliable benchmark exceeded it on a net basis in any performance period. Money market Funds do not have such benchmarks and therefore were excluded from this analysis.
6. The Nations equity Funds' overall performance adjusted for risk was strong. The performance of 13 of the 19 actively-managed Funds included in the risk analysis bettered the median in 3-year performance adjusted and unadjusted for risk. No relationship between risk and return was detected for fixed-income Funds.
7. The industry-standard procedure used by third parties such as Lipper and Morningstar to construct the performance universe in which each Fund's performance is ranked relative to comparable funds tends to bias a Fund's ranking upward within that universe. The bias occurs because either no-12b-1-fee or A share classes of the Funds are compared to the performance universe that includes all share classes of competitive multi-class funds. Therefore, the procedure ranks shares with zero or 25 basis point 12b-1 fees against classes of competitive funds with 12b-1 fees of up to 100 basis points. Correcting this bias by limiting the performance universe to classes of competitive funds with comparable 12b-1 fees in most cases lowers the relative performance for the Funds but does not call into question the general finding that the Nations Funds' performance has been strong.
8. A small number of Funds have consistently underperformed their peers in each of the past four years, depending on the exact criteria used to measure long-term underperformance. For example, one Fund has had below-median 1- and 3-year performance in each of the past four years; one additional Fund had below-median 3-year performance for those years.
9. The services performed by CMG professionals beyond portfolio management, such as compliance, legal, information technology, risk management, finance and fund administration, are critical to the success of the Funds and appear to be of high quality.
C. Management Fees Charged by Other Mutual Fund Companies
10. The Funds' management fees and total expenses are generally low relative to those of their peers, with the exception of subadvised Funds. Almost two-third of the Funds ranked in the two least expensive quintiles for total expenses and just over half were in those quintiles for actual management fees. Funds with lower actual management fees tended to have lower relative total expenses. All fixed-income Funds had total expenses in the two least expensive quintiles.
11. Generally, the Nations Funds with the highest relative fees and expenses are sub-advised. All eight Nations Funds with fifth-quintile total expense rankings were sub-advised. The actual management fees of 11 of the 14 sub-advised
173
Funds were in the fourth and fifth quintile. The average management fees of the sub-advised Funds were typically 20 points higher than internally-managed equity Funds. CMA presented data suggesting that such differentials were consistent with industry practice.
12. The management fees of the internally-advised Nations Funds are generally in line with those of Columbia Funds overseen by the Atlantic and Acorn/Wanger Boards of Trustees.
D. Trustees' Fee and Performance Evaluation Process
13. The Trustees' evaluation process identified 20 Funds in 2008 for further review based upon their relative performance or expenses or both. When compared in filtered universes, three more Funds met the criteria for review.
E. Potential Economies of Scale
14. CMG has prepared a memo for the Trustees containing its views on the sources and sharing of potential economies of scale. CMG views economies of scale as arising at the complex level and would regard estimates of scale economies for individual funds as unreliable. In its analysis, CMG did not identify specific sources of economies of scale or provide any estimates of any economies of scale that might arise from future asset growth. CMG's analysis included measures taken by the Trustees and CMG that seek to share any potential economies of scale through breakpoints in management fee schedules, expense reimbursements, fee waivers, enhanced shareholder services, fund mergers, and operational consolidation.
15. An examination of the management fee schedules of a selected number of the Nations Funds suggests that, as a general matter, the breakpoint schedules of these Funds are not out of line with those of competitors. A similar examination of five other Nations Funds in 2007 led to the same conclusion.
F. Management Fees Charged to Institutional Clients
16. CMG has provided Trustees with comparisons of mutual fund management fees and institutional fees based upon standardized fee schedules and actual fees. The results show that, consistent with industry practice, institutional fees are generally lower than the Funds' management fees. However, because the services provided and risks borne by the manager are more extensive for mutual funds than for institutional accounts, the differences are of limited value in assisting the Trustees in their review of the reasonableness of the Funds' management fees.
G. Revenues, Expenses, and Profits
17. The activity-based cost allocation methodology ("ABC") employed by CMG to allocate costs for purposes of calculating Fund profitability, both direct and indirect, for purposes of calculating Fund profitability is thoughtful and detailed. For comparison, CMG proposed a change to the method by which indirect expenses were allocated. Under this "hybrid" method, such costs are allocated to Funds 50% by assets and 50% per fund. Allocating indirect expenses equally to each Fund has an intuitive logic, as each Fund regardless of size has certain expenses, such as preparing and printing prospectuses and financial statements.
18. The materials provided on CMG's revenues and expenses with respect to the Funds and the methodology underlying their construction generally form a sufficient basis for Trustees to evaluate CMG's expenses and profitability for each Fund.
19. In 2007, CMG's complex-wide pre-tax margins on the Nations Funds were close to the industry average before distribution and below average when distribution revenues and expenses were included, based on limited data available about publicly-held mutual fund managers. However, as is to be expected in a complex comprising 65 Funds, some Nations Funds have higher pre-tax profit margins, when calculated solely with respect to management revenues and expenses, while other Nations Funds operate at a loss. A pro forma analysis of the complex's profitability taking into account expenses incurred in 2008 associated with support of the money market funds sharply reduced the profitability of the Nations Funds. There is a positive relationship between fund size and profitability, with smaller Funds generally operating at a loss.
174
20. CMG shares a fixed percentage of its management fee revenues with an affiliate, U.S. Trust, Bank of America Private Wealth Management, to compensate that affiliate for services it performs with respect to Nations Fund assets held for the benefit of its customers. Based on our analysis of the services provided by the affiliate, we believe all such payments should be regarded as a distribution expense, except for any portion attributable to payments by CMG for performance of sub-transfer agency or sub-accounting functions.
III. Recommendations
1) Criteria for review. The Trustees may wish to consider modifying the criteria for classifying a fund as a "Review Fund" to include criteria that focus exclusively on performance without regard to expense or fee levels. For example, a Fund whose one-year or three-year performance was median or below for four consecutive years could be treated as a Review Fund. Applying such criteria would add two Funds to the list of Review Funds.
2) Profitability data. CMG should present to the Trustees each year the profitability of each Fund, each investment style, and each complex (of which Nations is one) calculated as follows:
Exhibit 1. Management-only profitability should be calculated without reference to any Private Bank expense.
Exhibit 2. Profitability excluding distribution (which essentially covers the management and transfer agency functions) should be adjusted by removing from the expense calculation any portion of the Private Bank payment not attributable to the performance by the Private Bank of sub-transfer agency or sub-accounting functions.
Exhibit 3. Total profitability, including distribution: No adjustment for Private Bank expenses should be made, because all such expenses represent legitimate fund expenses to be taken into account in calculating CMG's profit margin including distribution.
Exhibit 4. Distribution only: This should include all Private Bank expenses other than those attributable to sub-transfer agency services.
Therefore, the following data need not be provided:
1. Adjusting total profitability data for Private Bank expenses
2. Adjusting profitability excluding distribution by backing out all Private Bank expenses.
3) Economies of scale. CMG and the IFC should continue to work on methods for more precisely quantifying to the extent possible the sources and magnitude of any economies of scale as CMG's mutual fund assets under management increase, to the extent that the data allows for meaningful year-over-year comparisons. The framework suggested in Section IV.D.4 may prove to be a useful model for such an analysis.
4) Competitive breakpoint analysis. As part of the annual fee evaluation process, the breakpoints of a select group of Nations Funds (which would differ each year) should continue to be compared to those of industry rivals to ensure that the Funds' breakpoint schedules remain within industry norms. As breakpoint schedules change relatively little each year, performing such a comparison for all Funds each year would not be an efficient use of Trustee and CMG resources.
5) Cost allocation methodology. CMG's point that the current ABC system of allocating indirect expenses creates anomalous results in several cases, including sub-advised Funds, is well-taken. We would like to work with CMG over the forthcoming year on alternatives to the current system of allocating indirect expenses that (1) resolve the anomalies, (2) limit the amount of incremental effort on CMG's part and (3) remain faithful to the general principle that expenses should be allocated by time and effort to the extent reasonably possible.
6) Management fee disparities. CMG and the Nations Trustees, as part of any future study of management fees, should analyze any differences in management fee schedules between Funds managed in similar investment styles. As part of that analysis, CMG should provide an explanation for any significant fee differences among comparable funds
175
across fund families managed by CMA, such as differences in the management styles of different Funds included the same Lipper category. Finally, whenever CMG proposes a management fee change or an expense cap for any mutual fund managed by CMA that is comparable to any Nations Fund, CMG should provide the Trustees with sufficient information about the proposal to allow the Trustees to assess the applicability of the proposed change to the relevant Nations Fund or Funds.
7) Tax-exempt Fund expense data. The expense rankings of certain tax-exempt Funds were adversely affected by including certain investment-related interest expenses that Lipper excluded in calculating the expense ratios of competitors. We recommend that CMG follow the Lipper practice and exclude such interest expenses from data submitted to Lipper to avoid unfairly disadvantaging the tax-exempt Funds.
8) Reduction of volume of paper documents submitted. The effort to rationalize and simplify the data presented to the Trustees and the process by which that data was prepared and organized was regarded as a success by all parties. We should continue to look for opportunities to reduce and simplify the presentation of 15(c) data, especially in the area of Fund and manager profitability. The Fund "Dashboard" volume presents a large volume of Fund data on a single page. If it is continued, the Trustees may wish to consider receiving the underlying Lipper data on CD, rather than the current paper volumes.
* * *
Respectfully submitted,
Steven E. Asher
176
Important Information About This Report – Stock Funds
The funds mail one shareholder report to each shareholder address. If you would like more than one report, please call shareholder services at 1-800-345-6611 and additional reports will be sent to you. This report has been prepared for shareholders of Stock Funds.
A description of the policies and procedures that each fund uses to determine how to vote proxies and a copy of each fund's voting records are available (i) at www.columbiamanagement.com; (ii) on the Securities and Exchange Commission's website at www.sec.gov, and (iii) without charge, upon request, by calling 1-800-368-0346. Information regarding how each fund voted proxies relating to portfolio securities during the 12-month period ended June 30 is available from the SEC's website. Information regarding how each fund voted proxies relating to portfolio securities is also available from the website, www.columbiamanagement.com.
Each fund files a complete schedule of portfolio holdings with the SEC for the first and third quarters of each fiscal year on Form N-Q. Each fund's Form N-Q is available on the SEC's website at www.sec.gov and may be reviewed and copied at the SEC's Public Reference Room in Washington, DC. Information on the operation of the Public Reference Room may be obtained by calling 1-800-SEC-0330.
Please read and consider the investment objectives, risks, charges and expenses for any fund carefully before investing. For a prospectus which contains this and other important information about a fund, contact your Columbia Management representative or financial advisor or go to www.columbiamanagement.com.
Columbia Management Group, LLC ("Columbia Management") is the investment management division of Bank of America Corporation. Columbia Management entities furnish investment management services and product for institutional and individual investors. Columbia Funds are distributed by Columbia Management Distributors, Inc., member of FINRA, SIPC, part of Columbia Management and an affiliate of Bank of America Corporation.
| Transfer Agent | |
|
Columbia Management Services, Inc.
P.O. Box 8081
Boston, MA 02266-8081
800.345.6611 | |
|
| Distributor | |
|
Columbia Management
Distributors, Inc.
One Financial Center
Boston, MA 02111 | |
|
| Investment Advisor | |
|
Columbia Management Advisors, LLC
100 Federal Street
Boston, MA 02110 | |
|
177
Columbia Management®
One Financial Center
Boston, MA 02111-2621
PRSRT STD
U.S. Postage
PAID
Holliston, MA
Permit NO. 20
Columbia Management®
Stock Funds
Annual Report, February 28, 2009
©2009 Columbia Management Distributors, Inc.
One Financial Center, Boston, MA 02111-2621
800-345-6611 www.columbiafunds.com
SHC-42/8450-0209 (04/09) 09-76243
Columbia Management®
Annual Report
February 28, 2009
International/Global
Stock Funds
g Columbia Global Value Fund
g Columbia International Value Fund
g Columbia Marsico Global Fund
g Columbia Marsico International Opportunities Fund
g Columbia Multi-Advisor International Equity Fund
| NOT FDIC INSURED | | May Lose Value | |
|
| NOT BANK ISSUED | | No Bank Guarantee | |
|
Table of Contents
| Economic Update | | | 1 | | |
|
| Columbia Global Value Fund | | | 3 | | |
|
| Columbia International Value Fund | | | 8 | | |
|
| Columbia Marsico Global Fund | | | 13 | | |
|
| Columbia Marsico International Opportunities Fund | | | 18 | | |
|
| Columbia Multi-Advisor International Equity Fund | | | 23 | | |
|
| Investment Portfolios | | | 28 | | |
|
| Financial Statements | | | 41 | | |
|
Report of Independent Registered
Public Accounting Firm | | | 89 | | |
|
| Federal Income Tax Information | | | 90 | | |
|
Columbia International Value
Master Portfolio | | | 91 | | |
|
| Investment Portfolio | | | 92 | | |
|
| Financial Statements | | | 95 | | |
|
Report of Independent Registered
Public Accounting Firm | | | 106 | | |
|
| Fund Governance | | | 107 | | |
|
Board Consideration and
Re-Approval of Investment
Advisory and Sub-Advisory
Agreements | | | 110 | | |
|
Summary of Management Fee
Evaluation by Independent
Fee Consultant | | | 114 | | |
|
Important Information About
This Report | | | 121 | | |
|
The views expressed in this report reflect the current views of the respective parties. These views are not guarantees of future performance and involve certain risks, uncertainties and assumptions that are difficult to predict, so actual outcomes and results may differ significantly from the views expressed. These views are subject to change at any time based upon economic, market or other conditions and the respective parties disclaim any responsibility to update such views. These views may not be relied on as investment advice and, because investment decisions for a Columbia Fund are based on numerous factors, may not be relied on as an indication of trading intent on behalf of any particular Columbia Fund. References to specific securities should not be construed as a recommendation or investment advice.
President's Message

Dear Shareholder:
Recent events have shown great volatility in the markets and uncertainty in the economy. During these challenging times, it becomes even more important to focus on long-term horizons and key investment tools that can help manage volatility. This may be the time to reflect on your investment goals and evaluate your portfolio to ensure you are positioned for any potential market rebound.
A long-term financial plan can serve as a road map and guide you through the necessary steps designed to meet your financial goals. Your financial plan should take into account your investment goals, time horizon, overall financial situation, risk tolerance and willingness to ride out market volatility. Your investment professional can be a key resource as you work through this process. The knowledge and experience of an investment professional can help as you create or reevaluate your investment strategy.
The importance of diversification
Although diversification does not ensure a profit or guarantee against loss, a diversified portfolio can be a strategy for successful long-term investing. Diversification refers to the mix of investments within a portfolio. A mutual fund can contribute to portfolio diversification given that a mutual fund's portfolio represents several investments. Additionally, the way you allocate your money among stocks, bonds and cash, and geographically between foreign and domestic investments, can help to reduce risks. Diversification can result in multiple investments where the positive performance of certain holdings can offset any negative performance from other holdings. Having a diversified portfolio doesn't mean that the value of the portfolio will never go down, but rather helps strike a balance between risk and reward.
Reevaluate your strategy
An annual review of your investments is a key opportunity to determine if your investment needs have changed or if you need minor adjustments to rebalance your portfolio. Life events like a birth, marriage, home improvement, or change in employment can have a major affect on your spending and goals. Ask yourself how your spending or goals have changed and factor this into your financial plan. Are you using automated investments or payroll deductions to help keep your savings on track? Are you able to set aside additional savings or increase your 401(k) plan contributions? If during your review you find that your investments in any one category (e.g., stocks, bonds or cash) have grown too large based on your diversification plan, you may want to consider redirecting future investments to get back on track.
History has shown that the U.S. stock market has been remarkably resilient1. Volatility can lead to opportunity. Patience and a commitment to your long-term financial plan may position you to potentially benefit over your investment horizon. We appreciate your business and continued support of Columbia Funds.
Sincerely,

J. Kevin Connaughton
President, Columbia Funds
The board of trustees elected J. Kevin Connaughton president of Columbia Funds on January 16, 2009.
1The Dow Jones Industrial Average is the most widely used indicator of the overall condition of the stock market. The Dow Jones Industrial Average Index is a price-weighted average of 30 actively traded blue-chip stocks as selected by the editors of the Wall Street Journal. Indices are not investments, do not incur fees or expenses and are not professionally managed. It is not possible to invest directly in an index.
Economic Update – International/Global Stock Funds
The pace of economic growth slowed around the world during the 12-month period that began March 1, 2008 and ended February 28, 2009. Most major developed economies slipped into recession in 2008, with little relief in sight for the first half of 2009. In the United States, the downturn was even sharper than anticipated. Fourth quarter 2008 growth was reported at negative 6.3%—the worst quarter on record for the US economy since 1982. The United Kingdom, Germany, Japan, South Korea and Singapore are also in recession. Although emerging markets have largely avoided recession, the global slowdown has taken the steam out of their economic growth as exports to developed markets fell off sharply.
Global financial system in tangles
Troubles that began in the US subprime mortgage market spread across Europe and entangled the world's financial systems during the 12-month period. A meltdown within the US financial sector claimed several major institutions and led others to seek bailouts, restructuring or both. Central banks around the world stepped in to infuse liquidity as credit dried up in 2008. Conditions have since eased, but more rigorous lending standards have severely limited access to credit in both developed and emerging markets, further hampering economic growth.
In the United States, unemployment has risen sharply over the past year, putting pressure on consumer spending. Western Europe and Japan, which rely heavily on exports, have experienced sharp declines in export trade. A weak housing market prevails in the United States and the United Kingdom. Even China's economy has exhibited signs of weakness. In the last quarter of 2008, annualized gross domestic product fell to 6.8%, compared to more than 13% in 2007.1 An estimated 20 million jobs have been lost in China, according to moodys.com. India reported a loss of 3 million jobs due to shrinking exports.
Many central banks have reduced short-term borrowing rates while governments have increased spending in an effort to stimulate economic growth. However, these efforts may not be rewarded until later this year or next. The only other spark in this otherwise dark outlook is that commodity prices have fallen, easing one heavy burden on consumer budgets.
Stock markets experience sharp declines
Against this weak economic backdrop, the US stock market lost 43.32% for the 12-month period, as measured by the S&P 500 Index.2 Losses extended across all market caps
1UBS Investment Research, Asian Economic Monitor, March 2009.
2The Standard & Poor's (S&P 500) Index tracks the performance of 500 widely held, large-capitalization US stocks.
Indices are not investments, do not incur fees or expenses and are not professionally managed. It is not possible to invest directly in an index. Securities in the fund may not match those in an index.
Summary
For the 12-month period that ended February 28, 2009
g Stock markets across the world fell sharply, as measured in U.S. dollars by the MSCI World Index and the MSCI EAFE Index. A rising dollar further depressed losses in foreign markets.
MSCI
World Index | | MSCI
EAFE Index | |
|
 | |  | |
|
The Morgan Stanley Capital International (MSCI) World Index tracks the performance of global stocks.
The Morgan Stanley Capital International (MSCI) Europe, Australasia, Far East (EAFE) Index is a free float-adjusted market capitalization index that is designed to measure developed market equity performance excluding the US and Canada.
Indices are not investments, do not incur fees or expenses and are not professionally managed. It is not possible to invest directly in an index. Securities in the fund may not match those in an index.
1
Economic Update – International/Global Stock Funds
and both growth and value, although growth stocks held up slightly better than value stocks, as measured by their respective Russell indices.3 Stock markets outside the United States suffered even greater losses. The MSCI World Index,4 which includes the US market, returned negative 47.12%. The MSCI EAFE Index,5 a broad gauge of stock market performance in foreign developed markets, lost 50.22% (in U.S. dollars) for the period. Emerging stock markets, which generally have had a strong run over the past several years, were also caught in the downdraft. As investors backed away from risk, emerging markets suffered significant declines. The MSCI Emerging Markets Index6 returned negative 56.03% (in US dollars). However, foreign stock market performance showed some improvement in the final month of the period, outperforming US stocks for the first time in a year. Emerging market indexes gen erally suffered smaller downturns in February than did the other major indices.
Past performance is no guarantee of future results.
3The Russell 1000 Growth Index measures the performance of those Russell 1000 Index companies with higher price-to-book ratios and higher forecasted growth values. The Russell 1000 Value Index measures the performance of those companies in the Russell 1000 Index with lower price-to-book ratios and lower forecasted growth values. The Russell 2000 Growth Index measures the performance of those Russell 2000 Index companies with higher price-to-book ratios and higher forecasted growth values. The Russell 2000 Value Index measures the performance of those Russell 2000 Index companies with lower price-to-book ratios and lower forecasted growth values. The Russell 3000 Index Growth Index measures the performance of those Russell 3000 Index companies with higher price-to-book ratios and higher forecasted growth values. The Russell 3000 Value Index measures the performance of those Russell 3000 Index companies with lower price - -to-book ratios and lower forecasted growth values. The Russell Midcap Growth Index measures the performance of those Russell Midcap companies with higher price-to-book ratios and higher forecasted growth values. The Russell Midcap Value Index measures the performance of those Russell Midcap Index companies with lower price-to-book ratios and lower forecasted growth values.
4The Morgan Stanley Capital International (MSCI) World Index tracks the performance of global stocks.
5The Morgan Stanley Capital International (MSCI) Europe, Australasia, Far East (EAFE) Index is a free float-adjusted market capitalization index that is designed to measure developed market equity performance excluding the US and Canada.
6The MSCI Emerging Markets Index is a widely accepted index composed of a sample of companies from 25 countries representing the global emerging stock markets.
Indices are not investments, do not incur fees or expenses and are not professionally managed. It is not possible to invest directly in an index. Securities in the fund may not match those in an index.
2
Fund Profile – Columbia Global Value Fund
Summary
g For the 12-month period that ended February 28, 2009, the fund's Class A shares returned negative 51.34% without sales charge.
g In a difficult environment for stocks in all markets, the fund and its benchmark, the MSCI World Index1, sustained notable losses.
g Stock selection in the financial services and consumer discretionary sectors and sector weights, which were a residual of stock selection, generally accounted for much of the performance shortfall relative to the index.
Portfolio Management
Columbia Management Advisors, LLC ("CMA") is an SEC-registered investment adviser and indirect, wholly owned subsidiary of Bank of America Corporation. CMA has retained Brandes Investment Partners, L.P. ("Brandes") to serve as an investment subadvisor. As the investment subadvisor, Brandes manages the fund on a day-to-day basis. Brandes is an SEC-registered investment adviser and unaffiliated with Bank of America Corporation.
The following are the six voting members of Brandes' Large Cap Investment Committee who are jointly responsible for making day-to-day investment decisions for the fund: Glenn Carlson, Brent Woods, Amelia Morris, Keith Colestock, W. James Brown and Brent Fredberg. Chief Executive Officer (CEO) Glenn Carlson has been with Brandes since 1996, serving as Managing Partner from 1996-2002, co-CEO from 2002-2004, and CEO since 2004. Brent Woods has been Managing Director of Investments since 2002, and served as Managing Partner from 1998-2002. Amelia Morris has served as Director of Investments since 2004, and served as a Senior Research Analyst from 1998-2004. Keith Colestock has served as Director of Investments since 2004, and served as a Senior Research Analyst from 2001-2004. W. James Brown has served as Director of Investments since 2004, and served as a Senior Research Analyst from 1996-2004. Brent Fredberg has served as a Senior Research Analyst since 2003, and served as an Analyst from 1999-2003.
1The Morgan Stanley Capital International (MSCI) World Index tracks the performance of global stocks. Indices are not investments, do not incur fees or expenses and are not professionally managed. It is not possible to invest directly in an index. Securities in the fund may not match those in an index.
Performance data quoted represents past performance and current performance may be lower or higher. Past performance is no guarantee of future results. The investment return and principal value will fluctuate so that shares, when redeemed, may be worth more or less than the original cost. Please visit www.columbiafunds.com for daily and most recent month-end performance updates.
Summary
1-year return as of 02/28/09
| | | –51.34% | |
|
| |  | | | Class A shares
(without sales charge) | |
|
| | | –47.12% | |
|
| |  | | | MSCI World Index | |
|
Morningstar Style BoxTM

The Morningstar Style BoxTM reveals a fund's investment strategy. For equity funds, the vertical axis shows the market capitalization of the stocks owned, and the horizontal axis shows a fund's investment style (value, blend or growth). Information shown is based on the most recent data provided by Morningstar.
3
Performance Information – Columbia Global Value Fund
Performance data quoted represents past performance and current performance may be lower or higher. Past performance is no guarantee of future results. The investment return and principal value will fluctuate so that shares, when redeemed, may be worth more or less than the original cost. Please visit www.columbiafunds.com for daily and most recent month-end performance updates.
Annual operating expense ratio (%)*
| Class A | | | 1.52 | | |
| Class B | | | 2.27 | | |
| Class C | | | 2.27 | | |
| Class Z | | | 1.27 | | |
*The annual operating expense ratio is as stated in the fund's prospectus that is current as of the date of this report. Differences in expense ratios disclosed elsewhere in this report may result from including fee waivers and expense reimbursements as well as different time periods used in calculating the ratios.
Performance of a $10,000 investment 04/16/01 – 02/28/09 ($)
The chart above shows the change in value of a hypothetical $10,000 investment in Class A shares of Columbia Global Value Fund during the stated time period, and does not reflect the deduction of taxes that a shareholder may pay on fund distributions or on the redemption of fund shares. The Morgan Stanley Capital International (MSCI) World Index tracks the performance of global stocks. Indices are not investments, do not incur fees or expenses and are not professionally managed. It is not possible to invest directly in an index. Securities in the fund may not match those in an index.
Performance of a $10,000 investment 04/16/01 – 02/28/09 ($)
| Sales charge | | without | | with | |
| Class A | | | 8,251 | | | | 7,777 | | |
| Class B | | | 7,797 | | | | 7,797 | | |
| Class C | | | 7,796 | | | | 7,796 | | |
| Class Z | | | 8,436 | | | | n/a | | |
Average annual total return as of 02/28/09 (%)
| Share class | | A | | B | | C | | Z | |
| Inception | | 04/16/01 | | 04/16/01 | | 04/16/01 | | 04/16/01 | |
| Sales charge | | without | | with | | without | | with | | without | | with | | without | |
| 1-year | | | –51.34 | | | | –54.14 | | | | –51.61 | | | | –53.81 | | | | –51.61 | | | | –52.05 | | | | –51.10 | | |
| 5-year | | | –8.12 | | | | –9.20 | | | | –8.78 | | | | –8.97 | | | | –8.78 | | | | –8.78 | | | | –7.87 | | |
| Life | | | –2.41 | | | | –3.14 | | | | –3.11 | | | | –3.11 | | | | –3.11 | | | | –3.11 | | | | –2.14 | | |
Average annual total return as of 03/31/09 (%)
| Share class | | A | | B | | C | | Z | |
| Sales charge | | without | | with | | without | | with | | without | | with | | without | |
| 1-year | | | –45.10 | | | | –48.28 | | | | –45.62 | | | | –48.09 | | | | –45.62 | | | | –46.11 | | | | –44.96 | | |
| 5-year | | | –6.49 | | | | –7.59 | | | | –7.21 | | | | –7.41 | | | | –7.22 | | | | –7.22 | | | | –6.25 | | |
| Life | | | –1.41 | | | | –2.14 | | | | –2.16 | | | | –2.16 | | | | –2.16 | | | | –2.16 | | | | –1.15 | | |
The "with sales charge" returns include the maximum initial sales charge of 5.75% for Class A shares and the applicable contingent deferred sales charge of 5.00% in the first year, declining to 1.00% in the sixth year and eliminated thereafter for Class B shares and 1.00% for Class C shares for the first year only. The "without sales charge" returns do not include the effect of sales charges. If they had, returns would be lower.
Performance results reflect any fee waivers or reimbursements of fund expenses by the investment advisor and/or any of its affiliates. Absent these fee waivers or expense reimbursement arrangements, performance results would have been lower.
All results shown assume reinvestment of distributions. Class Z shares are sold at net asset value with no distribution and service (Rule 12b-1) fees. Class Z shares have limited eligibility and the investment minimum requirements may vary. Please see the fund's prospectus for details. Performance for different share classes will vary based on differences in sales charges and fees associated with each class.
The tables do not reflect the deduction of taxes that a shareholder may pay on fund distributions or on the redemption of fund shares.
4
Understanding Your Expenses – Columbia Global Value Fund
As a fund shareholder, you incur two types of costs. There are transaction costs, which generally include sales charges on purchases and may include redemption fees or exchange fees. There are also ongoing costs, which generally include investment advisory fees, distribution and service (Rule 12b-1) fees and other fund expenses. The information on this page is intended to help you understand the ongoing costs of investing in the fund and to compare these costs with the ongoing costs of investing in other mutual funds.
Analyzing your fund's expenses by share class
To illustrate these ongoing costs, we have provided an example and calculated the expenses paid by investors in each share class during the period. The information in the following table is based on an initial investment of $1,000, which is invested at the beginning of the period and held for the entire period. Expense information is calculated two ways and each method provides you with different information. The amount listed in the "Actual" column is calculated using the fund's actual operating expenses and total return for the period. The amount listed in the "Hypothetical" column for each share class assumes that the return each year is 5% before expenses and is calculated based on the fund's actual operating expenses. You should not use the hypothetical account values and expenses to estimate either your actual account balance at the end of the period or the expenses you paid during this period.
Compare with other funds
Since all mutual funds are required to include the same hypothetical calculations about expenses in shareholder reports, you can use this information to compare the ongoing cost of investing in the fund with other funds. To do so, compare the 5% hypothetical example with the 5% hypothetical examples that appear in the shareholder reports of other funds. As you compare hypothetical examples of other funds, it is important to note that hypothetical examples are meant to highlight the ongoing costs of investing in a fund and do not reflect any transaction costs, such as sales charges, redemption fees or exchange fees.
Estimating your actual expenses
To estimate the expenses that you paid over the period, first you will need your account balance at the end of the period:
g For shareholders who receive their account statements from Columbia Management Services, Inc., your account balance is available online at www.columbiafunds.com or by calling Shareholder Services at 800.345.6611.
g For shareholders who receive their account statements from their financial intermediary, contact your financial intermediary to obtain your account balance.
1. Divide your ending account balance by $1,000. For example, if an account balance was $8,600 at the end of the period, the result would be 8.6.
2. In the section of the table below titled "Expenses paid during the period," locate the amount for your share class. You will find this number in the column labeled "Actual." Multiply this number by the result from step 1. Your answer is an estimate of the expenses you paid on your account during the period.
If the value of your account falls below the minimum initial investment requirement applicable to you, your account generally will be subject to a $20 annual fee. This fee is not included in the accompanying table. If you are subject to the fee, keep it in mind when you are estimating the ongoing expenses of investing in the fund and when comparing the expenses of this fund with other funds.
09/01/08 – 02/28/09
| | | Account value at the
beginning of the period ($) | | Account value at the
end of the period ($) | | Expenses paid
during the period ($) | | Fund's annualized
expense ratio (%) | |
| | | Actual | | Hypothetical | | Actual | | Hypothetical | | Actual | | Hypothetical | | Actual | |
| Class A | | | 1,000.00 | | | | 1,000.00 | | | | 541.20 | | | | 1,016.86 | | | | 6.11 | | | | 8.00 | | | | 1.60 | | |
| Class B | | | 1,000.00 | | | | 1,000.00 | | | | 540.01 | | | | 1,013.14 | | | | 8.97 | | | | 11.73 | | | | 2.35 | | |
| Class C | | | 1,000.00 | | | | 1,000.00 | | | | 540.01 | | | | 1,013.14 | | | | 8.97 | | | | 11.73 | | | | 2.35 | | |
| Class Z | | | 1,000.00 | | | | 1,000.00 | | | | 542.19 | | | | 1,018.10 | | | | 5.16 | | | | 6.76 | | | | 1.35 | | |
Expenses paid during the period are equal to the annualized expense ratio for the share class, multiplied by the average account value over the period, then multiplied by the number of days in the fund's most recent fiscal half-year and divided by 365.
Had the investment advisor and/or any of its affiliates not waived fees or reimbursed a portion of expenses, account value at the end of the period would have been reduced.
It is important to note that the expense amounts shown in the table are meant to highlight only ongoing costs of investing in the fund and do not reflect any transaction costs, such as sales charges, redemption fees or exchange fees. Therefore, the hypothetical examples provided may not help you determine the relative total costs of owning shares of different funds. If these transaction costs were included, your costs would have been higher.
5
Portfolio Managers' Report – Columbia Global Value Fund
Performance data quoted represents past performance and current performance may be lower or higher. Past performance is no guarantee of future results. The investment return and principal value will fluctuate so that shares, when redeemed, may be worth more or less than the original cost. Please visit www.columbiafunds.com for daily and most recent month-end performance updates.
Net asset value per share
as of 02/28/09 ($)
| Class A | | | 4.14 | | |
| Class B | | | 3.98 | | |
| Class C | | | 3.98 | | |
| Class Z | | | 4.18 | | |
Distributions declared per share
03/01/08 – 02/28/09 ($)
| Class A | | | 0.79 | | |
| Class B | | | 0.79 | | |
| Class C | | | 0.79 | | |
| Class Z | | | 0.82 | | |
For the 12-month period that ended February 28, 2009, the fund's Class A shares returned negative 51.34% without sales charge. The fund trailed its benchmark, the MSCI World Index,2 which fell 47.12% over the same period. In a difficult environment for stocks in most markets, stock selection in the financial services and consumer discretionary sectors and fund exposure to certain industries accounted for much of the performance shortfall relative to the index.
Stock selection and industry weights hampered relative returns
Share price declines for fund holdings in the commercial banks, thrifts & mortgage finance and diversified financial services industries proved the greatest detriment to overall results during the period. Within these industries, National City, a U.S.-based commercial bank; Washington Mutual, an American thrifts & mortgage finance company; and Citigroup, a U.S.-based diversified financial services firm, weighed on the fund's performance. National City and Washington Mutual were sold before the end of the reporting period. In addition, holdings in the automobiles and media industries posted negative performance.
The fund had more exposure than the index to commercial banks and insurance stocks, which also weighed on performance relative to the MSCI World Index.
The fund's US holdings also detracted from returns, specifically publisher Gannett and Washington Mutual, a thrifts & mortgage finance company.
Some positive performers helped offset declines
As stock prices fell sharply across all markets, there were few sources of positive performance. Amgen, a U.S.-based biotechnology firm, and Nippon Telegraph & Telephone, a diversified telecommunication services company based in Japan, delivered solid results for the period. Amgen was sold before the end of the reporting period. In addition, the fund benefited from its overweight position (relative to the index) in the diversified telecommunication services and pharmaceuticals industries.
Stock selection in the United Kingdom helped relative performance. U.K. pharmaceutical companies AstraZeneca PLC and GlaxoSmithKline PLC both experienced modest declines compared to the index.
Portfolio changes
During the period, we sold positions in Amgen, General Motors and Marsh & McLennan Cos., an insurance firm, to pursue what we believe to be more attractive opportunities. We also sold our positions in three US thrifts & mortgage finance companies: Fannie Mae, Federal Home Loan Mortgage, and Washington Mutual, as corporate reorganization events changed what we believed to be the intrinsic values of these firms. During the period, we also purchased what we believed to be more
2The Morgan Stanley Capital International (MSCI) World Index tracks the performance of global stocks. Indices are not investments, do not incur fees or expenses and are not professionally managed. It is not possible to invest directly in an index. Securities in the fund may not match those in an index.
6
Portfolio Managers' Report (continued) – Columbia Global Value Fund
attractive opportunities. One such addition to the portfolio was US-based Dow Chemical.
Looking ahead
Despite disappointing returns amid a very difficult environment in 2008, we remain optimistic, given the fundamental strengths and high margins of safety for holdings. Throughout the year, we reassessed holdings across the portfolios to account for the worldwide crisis of confidence. Valuations for current holdings reflect the potential effects of the economic difficulties companies may face in the coming years, yet we still see potential opportunity for these securities.
As of February 28, 2009, the fund's most substantial weights were in the United States and in the diversified telecommunication services industry. Fund weights are the result of individual stock selection.
The foregoing reflects the thoughts and opinions of Brandes Investment Partners® exclusively and is subject to change without notice.
Brandes Investment Partners® is a registered trademark of Brandes Investment Partners, L.P. in the United States and Canada.
Source for all statistical data: Columbia Management Advisors, LLC.
Source for all stock-specific commentary: Brandes
Portfolio holdings and characteristics are subject to change periodically and may not be representative of current holdings and characteristics. The outlook for the fund may differ from those presented for other Columbia Funds.
Equity investments are affected by stock market fluctuations that occur in response to economic and business developments.
International investing may involve certain risks, including currency fluctuations, risks associated with possible differences in financial accounting standards and other monetary and political risks. Significant levels of foreign taxes, including potentially confiscatory levels of taxation and withholding taxes, may also apply to some foreign investments.
Some of the countries in which the fund invests are considered emerging economies, which means there may be greater risks associated with investing there than in more developed countries. In addition, concentration of investments in a single region may result in greater volatility.
Top 5 sectors
as of 02/28/09 (%)
| Telecommunication Services | | | 21.3 | | |
| Health Care | | | 20.7 | | |
| Financials | | | 20.3 | | |
| Information Technology | | | 16.5 | | |
| Consumer Staples | | | 10.1 | | |
Top 10 holdings
as of 02/28/09 (%)
| Telecom Italia | | | 3.9 | | |
| Deutsche Telekom AG | | | 3.8 | | |
| PNC Financial Services Group | | | 3.4 | | |
| Home Depot | | | 3.4 | | |
| Wyeth | | | 3.3 | | |
| Sanofi-Aventis | | | 3.2 | | |
| Nippon Telegraph & Telephone | | | 3.2 | | |
| Verizon Communications | | | 2.9 | | |
Mitsui Sumitomo
Insurance Group Holdings | | | 2.8 | | |
| Ericsson | | | 2.8 | | |
Holdings discussed in this report
as of 02/28/09 (%)
| Citigroup | | | 0.4 | | |
| Gannett | | | 0.7 | | |
| Nippon Telegraph & Telephone | | | 3.2 | | |
| AstraZeneca PLC | | | 2.6 | | |
| GlaxoSmithKline PLC | | | 2.6 | | |
| Dow Chemical | | | 0.3 | | |
The fund is actively managed and the composition of its portfolio will change over time. Information provided is calculated as a percentage of net assets.
7
Fund Profile – Columbia International Value Fund
Performance data quoted represents past performance and current performance may be lower or higher. Past performance is no guarantee of future results. The investment return and principal value will fluctuate so that shares, when redeemed, may be worth more or less than the original cost. Please visit www.columbiafunds.com for daily and most recent month-end performance updates.
Summary
1-year return as of 02/28/09
| | –42.59% | |
|
| |  | | | Class A shares
(without sales charge) | |
|
| | | | | –50.22% | |
|
| |  | | | MSCI EAFE Index | |
|
Morningstar Style BoxTM

The Morningstar Style BoxTM reveals a fund's investment strategy. For equity funds, the vertical axis shows the market capitalization of the stocks owned, and the horizontal axis shows a fund's investment style (value, blend or growth). Information shown is based on the most recent data provided by Morningstar.
Summary
g For the 12-month period that ended February 28, 2009, the fund's Class A shares returned negative 42.59% without sales charge.
g In a difficult period for all foreign stock markets, the fund held up better than its benchmark, the MSCI EAFE Index1.
g Stock selection across several key industries and sector allocation, which is a residual of the stock-specific investment process, aided returns relative to the fund's benchmark.
Portfolio Management
Columbia Management Advisors, LLC ("CMA") is an SEC-registered investment adviser and indirect, wholly owned subsidiary of Bank of America Corporation. CMA has retained Brandes Investment Partners, L.P. ("Brandes") to serve as an investment subadvisor. As the investment subadvisor, Brandes manages the master portfolio on a day-to-day basis. Brandes is an SEC-registered investment adviser and unaffiliated with Bank of America Corporation.
The following are the six voting members of Brandes' Large Cap Investment Committee who are jointly responsible for making day-to-day investment decisions for the master portfolio: Glenn Carlson, Brent Woods, Amelia Morris, Keith Colestock, W. James Brown and Brent Fredberg. Chief Executive Officer (CEO) Glenn Carlson has been with Brandes since 1996, serving as Managing Partner from 1996-2002, co-CEO from 2002-2004, and CEO since 2004. Brent Woods has been Managing Director of Investments since 2002, and served as Managing Partner from 1998-2002. Amelia Morris has served as Director of Investments since 2004, and served as a Senior Research Analyst from 1998-2004. Keith Colestock has served as Director of Investments since 2004, and served as a Senior Research Analyst from 2001-2004. W. James Brown has served as Director of Investments since 2004, and served as a Senior Research Analyst from 1996-2004. Brent Fredberg has served as a Senior Research Analyst since 2003, and served as an Analyst from 1999-2003.
1The Morgan Stanley Capital International (MSCI) Europe, Australasia, Far East (EAFE) Index is a free float-adjusted market capitalization index that is designed to measure developed market equity performance excluding the US and Canada. Indices are not investments, do not incur fees or expenses and are not professionally managed. It is not possible to invest directly in an index. Securities in the fund may not match those in an index.
8
Performance Information – Columbia International Value Fund
Performance of a $10,000 investment 03/01/99 – 02/28/09 ($)
The chart above shows the change in value of a hypothetical $10,000 investment in Class A shares of Columbia International Value Fund during the stated time period, and does not reflect the deduction of taxes that a shareholder may pay on fund distributions or on the redemption of fund shares. The Morgan Stanley Capital International (MSCI) Europe, Australasia, Far East (EAFE) Index is a free float-adjusted market capitalization index that is designed to measure developed market equity performance excluding the US and Canada. Indices are not investments, do not incur fees or expenses and are not professionally managed. It is not possible to invest directly in an index. Securities in the fund may not match those in an index.
Performance of a $10,000 investment 03/01/99 – 02/28/09 ($)
| Sales charge | | without | | with | |
| Class A | | | 16,642 | | | | 15,682 | | |
| Class B | | | 15,419 | | | | 15,419 | | |
| Class C | | | 15,427 | | | | 15,427 | | |
| Class Z | | | 17,056 | | | | n/a | | |
Performance data quoted represents past performance and current performance may be lower or higher. Past performance is no guarantee of future results. The investment return and principal value will fluctuate so that shares, when redeemed, may be worth more or less than the original cost. Please visit www.columbiafunds.com for daily and most recent month-end performance updates.
Annual operating expense ratio (%)*
| Class A | | | 1.34 | | |
| Class B | | | 2.09 | | |
| Class C | | | 2.09 | | |
| Class Z | | | 1.09 | | |
*The annual operating expense ratio is as stated in the fund's prospectus that is current as of the date of this report. Differences in expense ratios disclosed elsewhere in this report may result from including fee waivers and expense reimbursements as well as different time periods used in calculating the ratios.
Average annual total return as of 02/28/09 (%)
| Share class | | A | | B | | C | | Z | |
| Inception | | 12/27/95 | | 05/22/98 | | 06/15/98 | | 12/27/95 | |
| Sales charge | | without | | with | | without | | with | | without | | with | | without | |
| 1-year | | | –42.59 | | | | –45.90 | | | | –43.01 | | | | –45.48 | | | | –43.00 | | | | –43.49 | | | | –42.41 | | |
| 5-year | | | –1.79 | | | | –2.95 | | | | –2.53 | | | | –2.73 | | | | –2.52 | | | | –2.52 | | | | –1.54 | | |
| 10-year | | | 5.23 | | | | 4.60 | | | | 4.43 | | | | 4.43 | | | | 4.43 | | | | 4.43 | | | | 5.48 | | |
Average annual total return as of 03/31/09 (%)
| Share class | | A | | B | | C | | Z | |
| Sales charge | | without | | with | | without | | with | | without | | with | | without | |
| 1-year | | | –37.66 | | | | –41.25 | | | | –38.12 | | | | –40.80 | | | | –38.13 | | | | –38.67 | | | | –37.45 | | |
| 5-year | | | –0.83 | | | | –1.99 | | | | –1.56 | | | | –1.76 | | | | –1.57 | | | | –1.57 | | | | –0.56 | | |
| 10-year | | | 5.07 | | | | 4.45 | | | | 4.27 | | | | 4.27 | | | | 4.27 | | | | 4.27 | | | | 5.33 | | |
The "with sales charge" returns include the maximum initial sales charge of 5.75% for Class A shares and the applicable contingent deferred sales charge of 5.00% in the first year, declining to 1.00% in the sixth year and eliminated thereafter for Class B shares and 1.00% for Class C shares for the first year only. The "without sales charge" returns do not include the effect of sales charges. If they had, returns would be lower.
Performance results reflect any fee waivers or reimbursements of fund expenses by the investment advisor and/or any of its affiliates. Absent these fee waivers or expense reimbursement arrangements, performance results would have been lower.
All results shown assume reinvestment of distributions. Class Z shares are sold at net asset value with no distribution and service (Rule 12b-1) fees. Class Z shares have limited eligibility and the investment minimum requirements may vary. Please see the fund's prospectus for details. Performance for different share classes will vary based on differences in sales charges and fees associated with each class.
The tables do not reflect the deduction of taxes that a shareholder may pay on fund distributions or on the redemption of fund shares.
9
Understanding Your Expenses – Columbia International Value Fund
Estimating your actual expenses
To estimate the expenses that you paid over the period, first you will need your account balance at the end of the period:
g For shareholders who receive their account statements from Columbia Management Services, Inc., your account balance is available online at www.columbiafunds.com or by calling Shareholder Services at 800.345.6611.
g For shareholders who receive their account statements from their financial intermediary, contact your financial intermediary to obtain your account balance.
1. Divide your ending account balance by $1,000. For example, if an account balance was $8,600 at the end of the period, the result would be 8.6.
2. In the section of the table below titled "Expenses paid during the period," locate the amount for your share class. You will find this number in the column labeled "Actual." Multiply this number by the result from step 1. Your answer is an estimate of the expenses you paid on your account during the period.
If the value of your account falls below the minimum initial investment requirement applicable to you, your account generally will be subject to a $20 annual fee. This fee is not included in the accompanying table. If you are subject to the fee, keep it in mind when you are estimating the ongoing expenses of investing in the fund and when comparing the expenses of this fund with other funds.
As a fund shareholder, you incur two types of costs. There are transaction costs, which generally include sales charges on purchases and may include redemption fees or exchange fees. There are also ongoing costs, which generally include investment advisory fees, distribution and service (Rule 12b-1) fees and other fund expenses. The information on this page is intended to help you understand the ongoing costs of investing in the fund and to compare these costs with the ongoing costs of investing in other mutual funds.
Analyzing your fund's expenses by share class
To illustrate these ongoing costs, we have provided an example and calculated the expenses paid by investors in each share class during the period. The information in the following table is based on an initial investment of $1,000, which is invested at the beginning of the period and held for the entire period. Expense information is calculated two ways and each method provides you with different information. The amount listed in the "Actual" column is calculated using the fund's actual operating expenses and total return for the period. The amount listed in the "Hypothetical" column for each share class assumes that the return each year is 5% before expenses and is calculated based on the fund's actual operating expenses. You should not use the hypothetical account values and expenses to estimate either your actual account balance at the end of the period or the expenses you paid during this period.
Compare with other funds
Since all mutual funds are required to include the same hypothetical calculations about expenses in shareholder reports, you can use this information to compare the ongoing cost of investing in the fund with other funds. To do so, compare the 5% hypothetical example with the 5% hypothetical examples that appear in the shareholder reports of other funds. As you compare hypothetical examples of other funds, it is important to note that hypothetical examples are meant to highlight the ongoing costs of investing in a fund and do not reflect any transaction costs, such as sales charges, redemption fees or exchange fees.
09/01/08 – 02/28/09
| | | Account value at the
beginning of the period ($) | | Account value at the
end of the period ($) | | Expenses paid
during the period ($) | | Fund's annualized
expense ratio (%) | |
| | | Actual | | Hypothetical | | Actual | | Hypothetical | | Actual | | Hypothetical | | Actual | |
| Class A | | | 1,000.00 | | | | 1,000.00 | | | | 611.82 | | | | 1,017.85 | | | | 5.59 | | | | 7.00 | | | | 1.40 | | |
| Class B | | | 1,000.00 | | | | 1,000.00 | | | | 609.68 | | | | 1,014.13 | | | | 8.58 | | | | 10.74 | | | | 2.15 | | |
| Class C | | | 1,000.00 | | | | 1,000.00 | | | | 609.78 | | | | 1,014.13 | | | | 8.58 | | | | 10.74 | | | | 2.15 | | |
| Class Z | | | 1,000.00 | | | | 1,000.00 | | | | 613.01 | | | | 1,019.09 | | | | 4.60 | | | | 5.76 | | | | 1.15 | | |
Expenses paid during the period are equal to the annualized expense ratio for the share class, multiplied by the average account value over the period, then multiplied by the number of days in the fund's most recent fiscal half-year and divided by 365.
It is important to note that the expense amounts shown in the table are meant to highlight only ongoing costs of investing in the fund and do not reflect any transaction costs, such as sales charges, redemption fees or exchange fees. Therefore, the hypothetical examples provided may not help you determine the relative total costs of owning shares of different funds. If these transaction costs were included, your costs would have been higher.
10
Portfolio Managers' Report – Columbia International Value Fund
For the 12-month period that ended February 28, 2009, the fund's Class A shares returned negative 42.59% without sales charge. In a difficult period for stock markets around the world, the fund held up better than its benchmark, the MSCI EAFE Index,2 which returned negative 50.22% over the same period. Stock selection and industry allocation, which is a residual of the stock-specific investment process, generally accounted for the performance difference in favor of the fund.
Stemming losses in a difficult market environment
Amid market declines that affected all major sectors, stock selection, and the residual industry and country exposure that resulted from this stock selection, helped the fund stem its losses. The fund had more exposure than the index to the pharmaceuticals industry, which hurt relative performance. In addition, stock selection in the commercial banks industry helped relative performance. The fund's food & staples retailing holdings declined, but the losses the fund sustained were not as severe as those of the index.
The fund's holdings in the commercial banks and diversified telecommunication services industries were the largest detractors from performance. Stocks in these industries with the largest impact on performance included Mizuho Financial Group, a commercial bank in Japan; Mitsubishi UFJ Financial Group, a Japan-based commercial bank; and Deutsche Telekom, a German diversified telecommunication services firm. The fund had no exposure to the energy sector, which also detracted from performance relative to the benchmark.
From a country perspective, holdings based in Japan and France were the largest detractors from performance for the period, including Takefuji, a Japan-based consumer finance company; Mitsui Sumitomo Insurance Group Holdings, a Japan-based insurance firm; and Alcatel-Lucent, a French-based communications equipment company. Stock selection in the United Kingdom helped relative returns. AstraZeneca, a U.K. pharmaceuticals company, was one of the better performers in the pharmaceuticals industry, even though it lost value for the period.
Stock-specific research drove portfolio changes
During the period, we sold Samsung Electronics, a South Korea-based semiconductors & semiconductor equipment company and Nortel Networks, a Canada-based communications equipment firm. We purchased what we believed to be more attractive opportunities in BASF S.E., a Germany-based chemicals company; Nissan Motor, a Japan-based auto manufacture; and TDK, an electronic equipment & instruments firm based in Japan, all of which were added to the fund during the period.
2The Morgan Stanley Capital International (MSCI) Europe, Australasia, Far East (EAFE) Index is a free float-adjusted market capitalization index that is designed to measure developed market equity performance excluding the US and Canada. Indices are not investments, do not incur fees or expenses and are not professionally managed. It is not possible to invest directly in an index. Securities in the fund may not match those in an index.
Performance data quoted represents past performance and current performance may be lower or higher. Past performance is no guarantee of future results. The investment return and principal value will fluctuate so that shares, when redeemed, may be worth more or less than the original cost. Please visit www.columbiafunds.com for daily and most recent month-end performance updates.
Net asset value per share
as of 02/28/09 ($)
| Class A | | | 9.40 | | |
| Class B | | | 9.09 | | |
| Class C | | | 9.08 | | |
| Class Z | | | 9.49 | | |
Distributions declared per share
03/01/08 – 02/28/09 ($)
| Class A | | | 2.24 | | |
| Class B | | | 2.14 | | |
| Class C | | | 2.14 | | |
| Class Z | | | 2.28 | | |
11
Portfolio Managers' Report (continued) – Columbia International Value Fund
Top 5 sectors
as of 02/28/09 (%)
| Telecommunications Services | | | 27.6 | | |
| Financials | | | 17.6 | | |
| Health Care | | | 16.1 | | |
| Information Technology | | | 14.1 | | |
| Consumer Staples | | | 9.1 | | |
Top 10 holdings
as of 02/28/09 (%)
| Deutsche Telekom | | | 4.4 | | |
| Ericsson | | | 4.1 | | |
| Sanofi-Aventis | | | 3.6 | | |
| Ono Pharmaceutical | | | 3.4 | | |
| Portugal Telecom | | | 3.3 | | |
| AstraZeneca | | | 3.1 | | |
| Nippon Telegraph & Telephone | | | 3.0 | | |
| GlaxoSmithKline | | | 2.7 | | |
| Mitsubishi UFJ Financial Group | | | 2.7 | | |
| Rohm Co., Ltd | | | 2.6 | | |
Holdings discussed in this report
as of 02/28/09 (%)
| Mizuho Financial Group | | | 2.2 | | |
| Mitsubishi UFJ Financial | |
| Group | | | 2.7 | | |
| Deutsche Telekom | | | 4.4 | | |
| Takefuji | | | 0.4 | | |
Mitsui Sumitomo Insurance
Group Holdings | | | 2.5 | | |
| Alcatel-Lucent | | | 0.9 | | |
| AstraZeneca | | | 3.1 | | |
| BASF S.E. | | | 1.6 | | |
| Nissan Motor | | | 0.3 | | |
| TDK | | | 0.5 | | |
The master portfolio is actively managed and the composition of its portfolio will change over time. Information provided is calculated as a percentage of net assets.
The fund is a feeder fund that invests all or substantially all of its assets in a master portfolio. Holdings information referenced in this section is that of the master portfolio.
Looking ahead
While the past 12 months have been among the most difficult for stocks in nearly 100 years, we firmly believe that many of today's security prices fail to reflect the solid long-term business prospects of many companies. We believe that pronounced levels of fear can create potential opportunity for long-term investors and that many stocks have the potential for price increases when fear subsides.
We remain focused on building portfolios that include what we believe are the best opportunities for long-term appreciation. We appreciate your trust and will continue to work diligently on behalf of our shareholders to position the fund's assets for long term gains despite a difficult environment.
The foregoing reflects the thoughts and opinions of Brandes Investment Partners® exclusively and is subject to change without notice.
Brandes Investment Partners® is a registered trademark of Brandes Investment Partners, L.P. in the United States and Canada.
Source for all statistical data: CMA
Source for all stock-specific commentary: Brandes
Portfolio holdings and characteristics are subject to change periodically and may not be representative of current holdings and characteristics. The outlook for the master portfolio may differ from that presented for other Columbia Funds.
Equity investments are affected by stock market fluctuations that occur in response to economic and business developments.
International investing may involve certain risks, including currency fluctuation, risks associated with possible differences in financial accounting standards and other monetary and political risks. Significant levels of foreign taxes, including potentially confiscatory levels of taxation and withholding taxes, may also apply to some foreign investments.
Some of the countries in which the fund invests are considered emerging economies, which means there may be greater risks associated with investing there than in more developed countries. In addition, concentration of investments in a single region may result in greater volatility.
12
Fund Profile – Columbia Marsico Global Fund
Summary
g For the 10-month period from the fund's inception (April 30, 2008) through February 28, 2009, the fund's Class A shares returned negative 50.20% without sales charge.
g In a period of declining global economic growth and plummeting stock prices, the fund, its benchmark and peer group average all lost approximately 50% of their value.
g Sector allocations in health care, telecommunication services, energy and utilities, combined with stock selection in the consumer staples sector, dampened results relative to the index.
Portfolio Management
Corydon J. Gilchrist has managed the fund since April 2008. He is with Marsico Capital Management, LLC, investment sub-advisor to the fund.
James G. Gendelman has managed the fund since April 2008. He is with Marsico Capital Management, LLC, investment sub-advisor to the fund.
Thomas F. Marsico has managed the fund since April 2008. He is with Marsico Capital Management, LLC, investment sub-advisor to the fund.
Columbia Management Advisors, LLC ("CMA") has retained Marsico Capital Management, LLC ("MCM") to serve as investment sub-advisor to the fund. As investment sub-advisor, MCM makes the day to day investment decisions for the fund. MCM is an investment advisor registered with the Securities and Exchange Commission MCM is not affiliated with Bank of America.
1The Morgan Stanley Capital International (MSCI) All Country World Index (ACWI) is a free float-adjusted market capitalization index that is designed to measure equity market performance in the global developed and emerging markets. Indices are not investments, do not incur fees or expenses and are not professionally managed. It is not possible to invest directly in an index. Securities in the fund may not match those in an index.
Performance data quoted represents past performance and current performance may be lower or higher. Past performance is no guarantee of future results. The investment return and principal value will fluctuate so that shares, when redeemed, may be worth more or less than the original cost. Please visit www.columbiafunds.com for daily and most recent month-end performance updates.
Summary
Life (cumulative) return as of 02/28/09
| | –50.20% | |
|
| |  | | | Class A shares
(without sales charge) | |
|
| | | | | –49.95% | |
|
| |  | | | MSCI All Country World Index1 | |
|
13
Performance Information – Columbia Marsico Global Fund
Performance data quoted represents past performance and current performance may be lower or higher. Past performance is no guarantee of future results. The investment return and principal value will fluctuate so that shares, when redeemed, may be worth more or less than the original cost. Please visit www.columbiafunds.com for daily and most recent month-end performance updates.
Annual operating expense ratio (%)*
| Class A | | | 3.51 | | |
| Class C | | | 4.26 | | |
| Class R | | | 3.76 | | |
| Class Z | | | 3.26 | | |
Annual operating expense ratio
after contractual waivers (%)*
| Class A | | | 1.60 | | |
| Class C | | | 2.35 | | |
| Class R | | | 1.85 | | |
| Class Z | | | 1.35 | | |
*The annual operating expense ratio and annual operating expense ratio after contractual waivers are as stated in the fund's prospectus that is current as of the date of this report. The contractual waiver expires 06/30/10. Differences in expense ratios disclosed elsewhere in this report may result from including fee waivers and expense reimbursements as well as different time periods used in calculating the ratios.
Performance of a $10,000 investment 04/30/08 – 02/28/09 ($)
The chart above shows the change in value of a hypothetical $10,000 investment in Class A shares of Columbia Marsico Global Fund during the stated time period, and does not reflect the deduction of taxes that a shareholder may pay on fund distributions or on the redemption of fund shares. The Morgan Stanley Capital International (MSCI) All Country World Index (ACWI) is a free float-adjusted market capitalization index that is designed to measure equity market performance in the global developed and emerging markets. Indices are not investments, do not incur fees or expenses and are not professionally managed. It is not possible to invest directly in an index. Securities in the fund may not match those in an index.
Performance of a $10,000 investment 04/30/08 – 02/28/09 ($)
| Sales charge | | without | | with | |
| Class A | | | 4,980 | | | | 4,694 | | |
| Class C | | | 4,950 | | | | 4,901 | | |
| Class R | | | 4,970 | | | | n/a | | |
| Class Z | | | 4,990 | | | | n/a | | |
Average annual total return as of 02/28/09 (%)
| Share class | | A | | C | | R | | Z | |
| Inception | | 04/30/08 | | 04/30/08 | | 04/30/08 | | 04/30/08 | |
| Sales charge | | without | | with | | without | | with | | without | | without | |
| Life (cumulative) | | | –50.20 | | | | –53.06 | | | | –50.50 | | | | –51.00 | | | | –50.30 | | | | –50.10 | | |
Average annual total return as of 03/31/09 (%)
| Share class | | A | | C | | R | | Z | |
| Sales charge | | without | | with | | without | | with | | without | | without | |
| Life (cumulative) | | | –47.80 | | | | –50.80 | | | | –48.20 | | | | –48.72 | | | | –47.90 | | | | –47.70 | | |
The "with sales charge" returns include the maximum initial sales charge of 5.75% for Class A shares and 1.00% for Class C shares for the first year only. The "without sales charge" returns do not include the effect of sales charges. If they had, returns would be lower.
Performance results reflect any fee waivers or reimbursements of fund expenses by the investment advisor and/or any of its affiliates. Absent these fee waivers or expense reimbursement arrangements, performance results would have been lower.
All results shown assume reinvestment of distributions. Class Z shares are sold at net asset value with no distribution and service (Rule 12b-1) fees. Class R shares are sold at net asset value with distribution and service (Rule 12b-1) fees. Class R and Class Z shares have limited eligibility and the investment minimum requirements may vary. Please see the fund's prospectus for details. Performance for different share classes will vary based on differences in sales charges and fees associated with each class.
The tables do not reflect the deduction of taxes that a shareholder may pay on fund distributions or on the redemption of fund shares.
14
Understanding Your Expenses – Columbia Marsico Global Fund
As a fund shareholder, you incur two types of costs. There are transaction costs, which generally include sales charges on purchases and may include redemption fees or exchange fees. There are also ongoing costs, which generally include investment advisory fees, distribution and service (Rule 12b-1) fees and other fund expenses. The information on this page is intended to help you understand the ongoing costs of investing in the fund and to compare these costs with the ongoing costs of investing in other mutual funds.
Analyzing your fund's expenses by share class
To illustrate these ongoing costs, we have provided an example and calculated the expenses paid by investors in each share class during the period. The information in the following table is based on an initial investment of $1,000, which is invested at the beginning of the period and held for the entire period. Expense information is calculated two ways and each method provides you with different information. The amount listed in the "Actual" column is calculated using the fund's actual operating expenses and total return for the period. The amount listed in the "Hypothetical" column for each share class assumes that the return each year is 5% before expenses and is calculated based on the fund's actual operating expenses. You should not use the hypothetical account values and expenses to estimate either your actual account balance at the end of the period or the expenses you paid during this period.
Compare with other funds
Since all mutual funds are required to include the same hypothetical calculations about expenses in shareholder reports, you can use this information to compare the ongoing cost of investing in the fund with other funds. To do so, compare the 5% hypothetical example with the 5% hypothetical examples that appear in the shareholder reports of other funds. As you compare hypothetical examples of other funds, it is important to note that hypothetical examples are meant to highlight the ongoing costs of investing in a fund and do not reflect any transaction costs, such as sales charges, redemption fees or exchange fees.
Estimating your actual expenses
To estimate the expenses that you paid over the period, first you will need your account balance at the end of the period:
g For shareholders who receive their account statements from Columbia Management Services, Inc., your account balance is available online at www.columbiafunds.com or by calling Shareholder Services at 800.345.6611.
g For shareholders who receive their account statements from their financial intermediary, contact your financial intermediary to obtain your account balance.
1. Divide your ending account balance by $1,000. For example, if an account balance was $8,600 at the end of the period, the result would be 8.6.
2. In the section of the table below titled "Expenses paid during the period," locate the amount for your share class. You will find this number in the column labeled "Actual." Multiply this number by the result from step 1. Your answer is an estimate of the expenses you paid on your account during the period.
If the value of your account falls below the minimum initial investment requirement applicable to you, your account generally will be subject to a $20 annual fee. This fee is not included in the accompanying table. If you are subject to the fee, keep it in mind when you are estimating the ongoing expenses of investing in the fund and when comparing the expenses of this fund with other funds.
09/01/08 – 02/28/09
| | | Account value at the
beginning of the period ($) | | Account value at the
end of the period ($) | | Expenses paid
during the period ($) | | Fund's annualized
expense ratio (%) | |
| | | Actual | | Hypothetical | | Actual | | Hypothetical | | Actual | | Hypothetical | | Actual | |
| Class A | | | 1,000.00 | | | | 1,000.00 | | | | 547.30 | | | | 1,016.86 | | | | 6.14 | | | | 8.00 | | | | 1.60 | | |
| Class C | | | 1,000.00 | | | | 1,000.00 | | | | 545.81 | | | | 1,013.14 | | | | 9.01 | | | | 11.73 | | | | 2.35 | | |
| Class R | | | 1,000.00 | | | | 1,000.00 | | | | 546.81 | | | | 1,015.62 | | | | 7.10 | | | | 9.25 | | | | 1.85 | | |
| Class Z | | | 1,000.00 | | | | 1,000.00 | | | | 548.39 | | | | 1,018.10 | | | | 5.18 | | | | 6.76 | | | | 1.35 | | |
Expenses paid during the period are equal to the annualized expense ratio for the share class, multiplied by the average account value over the period, then multiplied by the number of days in the fund's most recent fiscal half-year and divided by 365.
Had the investment advisor and/or any of its affiliates not waived fees or reimbursed a portion of expenses, account value at the end of the period would have been reduced.
It is important to note that the expense amounts shown in the table are meant to highlight only ongoing costs of investing in the fund and do not reflect any transaction costs, such as sales charges, redemption fees or exchange fees. Therefore, the hypothetical examples provided may not help you determine the relative total costs of owning shares of different funds. If these transaction costs were included, your costs would have been higher.
15
Portfolio Managers' Report – Columbia Marsico Global Fund
Performance data quoted represents past performance and current performance may be lower or higher. Past performance is no guarantee of future results. The investment return and principal value will fluctuate so that shares, when redeemed, may be worth more or less than the original cost. Please visit www.columbiafunds.com for daily and most recent month-end performance updates.
Net asset value per share
as of 02/28/09 ($)
| Class A | | | 4.98 | | |
| Class C | | | 4.95 | | |
| Class R | | | 4.97 | | |
| Class Z | | | 4.99 | | |
For the 10-month period from the fund's inception on April 30, 2008, through February 28, 2009, the fund's Class A shares returned negative 50.20% without sales charge. The fund's benchmark, the MSCI All Country World Index (ACWI), returned negative 49.95%.1 The average return of the fund's peer group, the Lipper Global Multi-Cap Growth Funds Classification, was negative 50.26%.2 Sector allocations in health care, telecommunication services, energy and utilities, combined with stock selection in the consumer staples and consumer discretionary sectors, dampened results relative to the index.
Sector allocations and stock selection affected performance
Overall sector allocations of the fund detracted from performance compared to the benchmark index. Lack of exposure to the strong-performing telecommunication services and utilities sectors hurt returns. In the industrials sector, which was one of the weakest performers during the period, the fund had more exposure than the index.
Stock selection in the consumer staples, consumer discretionary and financials sectors also detracted from performance. In consumer staples, Heineken Holding N.V. and Costco Wholesale declined sharply. Similarly, the fund's positions in Starwood Hotels & Resorts Worldwide (prior to being sold), Live Nation (prior to being sold), and Li & Fung Ltd. detracted from performance in the consumer discretionary sector. In the financials sector, Wells Fargo, Credit Suisse Group AG (prior to being sold), JPMorgan Chase, U.S. Bancorp, and SunTrust Banks (prior to being sold) all performed poorly. Other individual holdings that had a material, negative effect on performance included Vestas Wind Systems A/S, Apple, Goldman Sachs Group and Shaw Group (prior to being sold).
Stock selection in key sectors helped stem losses
The fund benefited from stock selection in industrials, information technology, materials and financials. The fund had less exposure to the weak-performing materials sector than the index, which amplified the positive impact of stock selection. Shifting currency values and an average cash position of 14% also helped cushion the fund as the market declined. On average, the fund had more exposure to the US market than the MSCI ACWI Index, which helped the fund as the US dollar strengthened.
In the materials sector, the fund experienced a 46% compared to a 60% loss for the sector within the index. The fund's financial positions also held up somewhat better than financials within the index.
1The Morgan Stanley Capital International (MSCI) All Country World Index (ACWI) is a free float-adjusted market capitalization weighted index that is designed to measure the equity market performance of developed and emerging markets. Indices are not investments, do not incur fees or expenses and are not professionally managed. It is not possible to invest directly in an index. Securities in the fund may not match those in an index.
2Lipper Inc., a widely respected data provider in the industry, calculates an average total return (assuming reinvestment of distributions) for mutual funds with investment objectives similar to those of the fund. Lipper makes no adjustment for the effect of sales loads.
16
Portfolio Managers' Report (continued) – Columbia Marsico Global Fund
There were few sources of positive performance during the period. However, Hitachi Construction Machinery, Anheuser-Busch InBev NV and Deutsche Bank AG posted gains for the period. Holdings of Hitachi and Deutsche Bank were sold during the period.
Looking ahead
During the period, the fund increased exposure to some of its most significant sector allocations: information technology, consumer staples and health care. Industrials also represented a sizeable allocation for the fund at the end of the period, although the sector's weight was cut back somewhat. Exposure to financials, consumer discretionary and telecommunication services sectors also declined. At the end of the period, the fund had no exposure to utilities and only a small position in telecommunication services. The fund's largest country allocations included the United States, Switzerland, the United Kingdom and Denmark. Country-level weights are generally a residual of the fund's stock selection process rather than a major, proactive facet of its investment strategy.
Source for all statistical data—Columbia Management Advisors, LLC.
Source for all stock-specific commentary—Marsico Capital Management, LLC.
Portfolio holdings and characteristics are subject to change periodically and may not be representative of current holdings and characteristics. The outlook for the fund may differ from that presented for other Columbia Funds.
Equity investments are affected by stock market fluctuations that occur in response to economic and business developments.
International investing may involve certain risks, including currency fluctuations, risks associated with possible differences in financial accounting standards and other monetary and political risks. Significant levels of foreign taxes, including potentially confiscatory levels of taxation and withholding taxes, may also apply to some foreign investments.
Some of the countries in which the fund invests are considered emerging economies, which means there may be greater risks associated with investing there than in more developed countries. In addition, concentration of investments in a single region may result in greater volatility.
Top 5 sectors
as of 02/28/09 (%)
| Information Technology | | | 17.3 | | |
| Consumer Staples | | | 16.3 | | |
| Industrials | | | 15.4 | | |
| Health Care | | | 13.0 | | |
| Financials | | | 9.6 | | |
Top 10 holdings
as of 02/28/09 (%)
| MasterCard | | | 6.6 | | |
| Monsanto | | | 4.9 | | |
| Costco Wholesale | | | 4.7 | | |
| Vestas Wind Systems | | | 4.5 | | |
| Gilead Sciences | | | 3.9 | | |
| Tesco | | | 3.6 | | |
| Canadian National Railway | | | 3.2 | | |
| Petroleo Brasileiro | | | 3.1 | | |
| JPMorgan Chase | | | 3.0 | | |
| Lonza Group AG | | | 3.0 | | |
Holdings discussed in this report
as of 02/28/09 (%)
| Heineken Holding NV | | | 2.4 | | |
| Costco Wholesale | | | 4.7 | | |
| Li & Fung Ltd. | | | 2.0 | | |
| Wells Fargo | | | 1.7 | | |
| JPMorgan Chase | | | 3.0 | | |
| U.S. Bancorp | | | 1.4 | | |
| Vestas Wind Systems | | | 4.5 | | |
| Apple | | | 2.1 | | |
| Goldman Sachs Group | | | 2.1 | | |
| Anheuser-Busch InBev | | | 2.5 | | |
The fund is actively managed and the composition of its portfolio will change over time. Information provided is calculated as a percentage of net assets.
17
Fund Profile – Columbia Marsico International Opportunities Fund
Performance data quoted represents past performance and current performance may be lower or higher. Past performance is no guarantee of future results. The investment return and principal value will fluctuate so that shares, when redeemed, may be worth more or less than the original cost. Please visit www.columbiafunds.com for daily and most recent month-end performance updates.
Summary
1-year return as of 02/28/09
| | –53.26% | |
|
| |  | | | Class A shares
(without sales charge) | |
|
| | | | | –50.22% | |
|
| |  | | | MSCI EAFE Index1 | |
|
Morningstar Style BoxTM
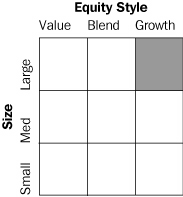
The Morningstar Style BoxTM reveals a fund's investment strategy. For equity funds, the vertical axis shows the market capitalization of the stocks owned, and the horizontal axis shows a fund's investment style (value, blend or growth). Information shown is based on the most recent data provided by Morningstar.
1The Morgan Stanley Capital International (MSCI) Europe, Australasia, Far East (EAFE) Index is a free float-adjusted market capitalization index that is designed to measure developed market equity performance excluding the US and Canada.
Indices are not investments, do not incur fees or expenses and are not professionally managed. It is not possible to invest directly in an index. Securities in the fund may not match those in an index.
Summary
g For the 12-month period that ended February 28, 2009, the fund's Class A shares returned negative 53.26% without sales charge.
g In an environment of slowing global economic growth and declining stock prices, the fund, its benchmark and peer group average all lost more than 50% for the period.
g Stock selection and sector allocation hampered the fund's performance relative to its benchmark.
Portfolio Management
James G. Gendelman has managed the fund since August 2000. He is with Marsico Capital Management, LLC, investment sub-advisor to the fund.
Columbia Management Advisors, LLC ("CMA") has retained Marsico Capital Management, LLC ("MCM") to serve as investment sub-advisor to the fund. As investment sub-advisor, MCM makes the day to day investment decisions for the fund. MCM is an investment advisor registered with the Securities and Exchange Commission, MCM is not affiliated with Bank of America.
18
Performance Information – Columbia Marsico International Opportunities Fund
Performance of a $10,000 investment 08/01/00 – 02/28/09 ($)
The chart above shows the change in value of a hypothetical $10,000 investment in Class A shares of Columbia Marsico International Opportunities Fund during the stated time period, and does not reflect the deduction of taxes that a shareholder may pay on fund distributions or on the redemption of fund shares, The Morgan Stanley Capital International (MSCI) Europe, Australasia, Far East (EAFE) index is a free float-adjusted market capitalization index that is designed to measure developed market equity performance excluding the US and Canada. Indices are not investments, do not incur fees or expenses and are not professionally managed. It is not possible to invest directly in an index. Securities in the fund may not match those in an index.
Performance of a $10,000 investment 08/01/00 – 02/28/09 ($)
| Sales charge | | without | | with | |
| Class A | | | 9,064 | | | | 8,543 | | |
| Class B | | | 8,494 | | | | 8,494 | | |
| Class C | | | 8,507 | | | | 8,507 | | |
| Class R | | | 8,991 | | | | n/a | | |
| Class Z | | | 9,253 | | | | n/a | | |
Average annual total return as of 02/28/09 (%)
| Share class | | A | | B | | C | | R | | Z | |
| Inception | | 08/01/00 | | 08/01/00 | | 08/01/00 | | 01/23/06 | | 08/01/00 | |
| Sales charge | | without | | with | | without | | with | | without | | with | | without | | without | |
| 1-year | | | –53.26 | | | | –55.94 | | | | –53.60 | | | | –55.90 | | | | –53.57 | | | | –54.03 | | | | –53.40 | | | | –53.17 | | |
| 5-year | | | –3.65 | | | | –4.79 | | | | –4.38 | | | | –4.67 | | | | –4.37 | | | | –4.37 | | | | –3.81 | | | | –3.44 | | |
| Life | | | –1.14 | | | | –1.82 | | | | –1.88 | | | | –1.88 | | | | –1.87 | | | | –1.87 | | | | –1.23 | | | | –0.90 | | |
Average annual total return as of 03/31/09 (%)
| Share class | | A | | B | | C | | R | | Z | |
| Sales charge | | without | | with | | without | | with | | without | | with | | without | | without | |
| 1-year | | | –49.24 | | | | –52.16 | | | | –49.57 | | | | –52.07 | | | | –49.61 | | | | –50.11 | | | | –49.31 | | | | –49.14 | | |
| 5-year | | | –2.89 | | | | –4.03 | | | | –3.61 | | | | –3.90 | | | | –3.61 | | | | –3.61 | | | | –3.02 | | | | –2.67 | | |
| Life | | | –0.44 | | | | –1.12 | | | | –1.17 | | | | –1.17 | | | | –1.18 | | | | –1.18 | | | | –0.51 | | | | –0.19 | | |
The "with sales charge" returns include the maximum initial sales charge of 5.75% for Class A shares, the applicable contingent deferred sales charge of 5.00% in the first year, declining to 1.00% in the sixth year and eliminated thereafter for Class B shares and 1.00% for Class C shares for the first year only. The "without sales charge" returns do not include the effect of sales charges. If they had, returns would be lower.
Performance results reflect any fee waivers or reimbursements of fund expenses by the investment advisor and/or any of its affiliates. Absent these fee waivers or expense reimbursement arrangements, performance results would have been lower.
All results shown assume reinvestment of distributions. Class Z shares are sold at net asset value with no distribution and service (Rule 12b-1) fees. Class R shares are sold at net asset value with distribution and service (Rule 12b-1) fees. Class R and Class Z shares have limited eligibility and the investment minimum requirements may vary. Please see the fund's prospectus for details. Performance for different share classes will vary based on differences in sales charges and fees associated with each class.
The tables do not reflect the deduction of taxes that a shareholder may pay on fund distributions or on the redemption of fund shares.
The returns for Class R shares include the returns for Class A shares prior to January 23, 2006, the date on which Class R shares were initially offered by the fund. If differences in expenses had been reflected, the returns would have been lower, since Class R shares are subject to a higher Rule 12b-1 fee.
Performance data quoted represents past performance and current performance may be lower or higher. Past performance is no guarantee of future results. The investment return and principal value will fluctuate so that shares, when redeemed, may be worth more or less than the original cost. Please visit www.columbiafunds.com for daily and most recent month-end performance updates.
Annual operating expense ratio (%)*
| Class A | | | 1.47 | | |
| Class B | | | 2.22 | | |
| Class C | | | 2.22 | | |
| Class R | | | 1.72 | | |
| Class Z | | | 1.22 | | |
*The annual operating expense ratio is as stated in the fund's prospectus that is current as of the date of this report. Differences in expense ratios disclosed elsewhere in this report may result from including fee waivers and expense reimbursements as well as different time periods used in calculating the ratios.
19
Understanding Your Expenses – Columbia Marsico International Opportunities Fund
Estimating your actual expenses
To estimate the expenses that you paid over the period, first you will need your account balance at the end of the period:
g For shareholders who receive their account statements from Columbia Management Services, Inc., your account balance is available online at www.columbiafunds.com or by calling Shareholder Services at 800.345.6611.
g For shareholders who receive their account statements from their financial intermediary, contact your financial intermediary to obtain your account balance.
1. Divide your ending account balance by $1,000. For example, if an account balance was $8,600 at the end of the period, the result would be 8.6.
2. In the section of the table below titled "Expenses paid during the period," locate the amount for your share class. You will find this number in the column labeled "Actual." Multiply this number by the result from step 1. Your answer is an estimate of the expenses you paid on your account during the period.
If the value of your account falls below the minimum initial investment requirement applicable to you, your account generally will be subject to a $20 annual fee. This fee is not included in the accompanying table. If you are subject to the fee, keep it in mind when you are estimating the ongoing expenses of investing in the fund and when comparing the expenses of this fund with other funds.
As a fund shareholder, you incur two types of costs. There are transaction costs, which generally include sales charges on purchases and may include redemption fees or exchange fees. There are also ongoing costs, which generally include investment advisory fees, distribution and service (Rule 12b-1) fees and other fund expenses. The information on this page is intended to help you understand the ongoing costs of investing in the fund and to compare these costs with the ongoing costs of investing in other mutual funds.
Analyzing your fund's expenses by share class
To illustrate these ongoing costs, we have provided an example and calculated the expenses paid by investors in each share class during the period. The information in the following table is based on an initial investment of $1,000, which is invested at the beginning of the period and held for the entire period. Expense information is calculated two ways and each method provides you with different information. The amount listed in the "Actual" column is calculated using the fund's actual operating expenses and total return for the period. The amount listed in the "Hypothetical" column for each share class assumes that the return each year is 5% before expenses and is calculated based on the fund's actual operating expenses. You should not use the hypothetical account values and expenses to estimate either your actual account balance at the end of the period or the expenses you paid during this period.
Compare with other funds
Since all mutual funds are required to include the same hypothetical calculations about expenses in shareholder reports, you can use this information to compare the ongoing cost of investing in the fund with other funds. To do so, compare the 5% hypothetical example with the 5% hypothetical examples that appear in the shareholder reports of other funds. As you compare hypothetical examples of other funds, it is important to note that hypothetical examples are meant to highlight the ongoing costs of investing in a fund and do not reflect any transaction costs, such as sales charges, redemption fees or exchange fees.
09/01/08 – 02/28/09
| | | Account value at the
beginning of the period ($) | | Account value at the
end of the period ($) | | Expenses paid
during the period ($) | | Fund's annualized
expense ratio (%) | |
| | | Actual | | Hypothetical | | Actual | | Hypothetical | | Actual | | Hypothetical | | Actual | |
| Class A | | | 1,000.00 | | | | 1,000.00 | | | | 530.99 | | | | 1,017.26 | | | | 5.77 | | | | 7.60 | | | | 1.52 | | |
| Class B | | | 1,000.00 | | | | 1,000.00 | | | | 529.00 | | | | 1,013.54 | | | | 8.61 | | | | 11.33 | | | | 2.27 | | |
| Class C | | | 1,000.00 | | | | 1,000.00 | | | | 529.40 | | | | 1,013.54 | | | | 8.61 | | | | 11.33 | | | | 2.27 | | |
| Class R | | | 1,000.00 | | | | 1,000.00 | | | | 529.90 | | | | 1,016.02 | | | | 6.71 | | | | 8.85 | | | | 1.77 | | |
| Class Z | | | 1,000.00 | | | | 1,000.00 | | | | 531.28 | | | | 1,018.50 | | | | 4.82 | | | | 6.36 | | | | 1.27 | | |
Expenses paid during the period are equal to the annualized expense ratio for the share class, multiplied by the average account value over the period, then multiplied by the number of days in the fund's most recent fiscal half-year and divided by 365.
It is important to note that the expense amounts shown in the table are meant to highlight only ongoing costs of investing in the fund and do not reflect any transaction costs, such as sales charges, redemption fees or exchange fees. Therefore, the hypothetical examples provided may not help you determine the relative total costs of owning shares of different funds. If these transaction costs were included, your costs would have been higher.
20
Portfolio Manager's Report – Columbia Marsico International Opportunities Fund
For the 12-month period that ended February 28, 2009, the fund's Class A shares returned negative 53.26% without sales charge. The fund's benchmark, the MSCI EAFE Index, returned negative 50.22%.1 The fund's return was lower than the negative 51.37% average return of its peer group, the Lipper International Multi-Cap Growth Funds Classification.2 The fund's performance was hampered by stock selection and sector allocations.
A challenging period for the world's stock markets
As global economic growth declined and a liquidity crisis continued to paralyze many of the world's capital markets, stock prices fell precipitously, giving equity funds no place to hide. In this environment, the fund performed generally in line with its comparative measures. It endured slightly larger losses because of stock selection within several sectors. Sector allocation also detracted from the fund's return. In the capital goods industry group within the industrials sector, Vestas Wind Systems A/S, Gamesa, Tecnologica, Alstom and Marubeni were weak performers for the period. In addition, the collective return of the fund's consumer discretionary, materials, telecommunication services and energy holdings significantly underperformed their respective benchmark sector returns. In financials, the fund had less exposure than the index. However, that did little to offset the disappointing returns from AXA SA (prior to being sol d), Credit Suisse Group AG and Julius Baer Holding AG. In the consumer discretionary sector, Las Vegas Sands lost 97% of its value. The fund had no exposure to utilities, which held up better than many other sectors, and that further detracted from returns.
Portfolio strengths measured in relative terms
In a declining market, stock selection in consumer staples, information technology and health care helped stem losses as stocks such as Anheuser-Busch InBev, Nortel Networks and Genentech generated positive returns. Nortel and Genentech were sold before the end of the period. The fund had more exposure to health care than its benchmark, which amplified the positive impact of its holdings. In addition, Continental AG, an auto parts manufacturer, Honda Motor and Samsung Electronics (prior to being sold) helped performance. Continental AG and Honda shares rose, and we sold Continental. Samsung sustained a small loss during the period. Fluctuations in world currencies and a stronger U.S. dollar also helped results. In addition, the fund held an average of 6% of its net assets in cash and cash equivalents, which helped preserve some capital during the period.
1The Morgan Stanley Capital International (MSCI) Europe, Australasia, Far East (EAFE) Index is a free float-adjusted market capitalization index that is designed to measure developed market equity performance excluding the US and Canada. Indices are not investments, do not incur fees or expenses and are not professionally managed. It is not possible to invest directly in an index. Securities in the fund may not match those in an index.
2Lipper Inc., a widely respected data provider in the industry, calculates an average total return (assuming reinvestment of distributions) for mutual funds with investment objectives similar to those of the fund. Lipper makes no adjustment for the effect of sales loads.
Performance data quoted represents past performance and current performance may be lower or higher. Past performance is no guarantee of future results. The investment return and principal value will fluctuate so that shares, when redeemed, may be worth more or less than the original cost. Please visit www.columbiafunds.com for daily and most recent month-end performance updates.
Net asset value per share
as of 02/28/09 ($)
| Class A | | | 6.76 | | |
| Class B | | | 6.38 | | |
| Class C | | | 6.39 | | |
| Class R | | | 6.73 | | |
| Class Z | | | 6.87 | | |
Distributions declared per share
03/01/08 – 02/28/09 ($)
| Class A | | | 0.12 | | |
| Class B | | | 0.12 | | |
| Class C | | | 0.12 | | |
| Class R | | | 0.12 | | |
| Class Z | | | 0.12 | | |
21
Portfolio Manager's Report (continued) – Columbia Marsico International Opportunities Fund
Top 5 sectors
as of 02/28/09 (%)
| Financials | | | 13.8 | | |
| Health Care | | | 13.1 | | |
| Industrials | | | 11.6 | | |
| Consumer Staples | | | 11.6 | | |
| Energy | | | 10.1 | | |
Top 10 holdings
as of 02/28/09 (%)
| Teva Pharmaceutical | |
| Industries | | | 4.0 | | |
| Vestas Wind Systems | | | 3.3 | | |
| Nintendo | | | 3.3 | | |
| Taiwan Semiconductor | |
| Manufacturing | | | 3.2 | | |
| Lonza Group AG | | | 3.1 | | |
| Rogers Communications | | | 3.1 | | |
| Tesco PLC | | | 3.1 | | |
| Nestle SA | | | 3.0 | | |
| CSL | | | 3.0 | | |
| Petroleo Brasileiro | | | 3.0 | | |
Holdings discussed in this report
as of 02/28/09 (%)
| Vestas Wind Systems A/S | | | 3.3 | | |
| Gamesa, Tecnologica | | | 2.1 | | |
| Alstom | | | 1.5 | | |
| Marubeni | | | 2.0 | | |
| Credit Suisse Group AG | | | 2.5 | | |
| Julius Baer Holding AG | | | 1.4 | | |
| Las Vegas Sands | | | 0.5 | | |
| Anheuser-Busch InBev | | | 2.4 | | |
| Honda Motor | | | 1.3 | | |
The fund is actively managed and the composition of its portfolio will change over time. Information provided is calculated as a percentage of net assets.
Looking ahead
The fund headed into the next period with an emphasis on financials, health care, industrials and consumer staples stocks. The fund's most significant country exposures were Switzerland, the United Kingdom, Japan and Brazil. Country-level exposure generally should be considered a residual of the fund's stock selection process rather than a major proactive facet of its investment strategy.
Source for all statistical data—Columbia Management Advisors, LLC.
Source for all stock-specific commentary—Marsico Capital Management, LLC.
Portfolio holdings and characteristics are subject to change periodically and may not be representative of current holdings and characteristics. The outlook for the fund may differ from that presented for other Columbia Funds.
Equity investments are affected by stock market fluctuations that occur in response to economic and business developments.
International investing may involve certain risks, including currency fluctuations, risks associated with possible differences in financial accounting standards and other monetary and political risks. Significant levels of foreign taxes, including potentially confiscatory levels of taxation and withholding taxes, may also apply to some foreign investments.
Some of the countries in which the fund invests are considered emerging economies, which means there may be greater risks associated with investing there than in more developed countries. In addition, concentration of investments in a single region may result in greater volatility.
22
Fund Profile – Columbia Multi-Advisor International Equity Fund
Summary
g For the 12-month period that ended February 28, 2009, the fund's Class A shares returned negative 51.87% without sales charge.
g The fund underperformed its benchmark, the MSCI EAFE Index1
g Unfavorable currency exposure and country allocations detracted from return in the Causeway-advised portion of the fund. Stock selection and an overweight in telecommunication services and an underweight in utilities held back performance in the Marsico-advised portion of the fund.
Portfolio Management
Columbia Multi-Advisor International Equity Fund is managed by Marsico Capital Management, LLC ("MCM") and Causeway Capital Management LLC ("Causeway"); both investment sub-advisors to the fund. Each sub-advisor manages approximately one-half of the fund's assets. James G. Gendelman manages MCM's portion of the fund. He has been with MCM since May 2000. Sarah Ketterer, Harry Hartford and James Doyle have co-managed Causeway's portion of the fund since May 2004 and have been with the firm since June 2001. Jonathan Eng has co-managed Causeway's portion of the fund since May 2004 and has been with the firm since July 2001. Kevin Durkin has co-managed the fund since January 2006 and has been with Causeway since June 2001.
Columbia Management Advisors, LLC ("CMA") has retained MCM and Causeway to serve as investment sub-advisors to the fund. As investment sub-advisors, MCM and Causeway make the day-to-day investment decisions for the fund. MCM and Causeway each is an investment advisor registered with the Securities and Exchange Commission. MCM and Causeway are not affiliated with Bank of America.
1The Morgan Stanley Capital International (MSCI) Europe, Australasia, Far East (EAFE) Index is a free float-adjusted market capitalization index that is designed to measure developed market equity performance excluding the US and Canada. Indices are not investments, do not incur fees or expenses and are not professionally managed. It is not possible to invest directly in an index. Securities in the fund may not match those in an index.
Performance data quoted represents past performance and current performance may be lower or higher. Past performance is no guarantee of future results. The investment return and principal value will fluctuate so that shares, when redeemed, may be worth more or less than the original cost. Please visit www.columbiafunds.com for daily and most recent month-end performance updates.
Summary
1-year return as of 02/28/09
| | | –51.87% | |
|
| |  | | | Class A shares
(without sales charge) | |
|
| | | –50.22% | |
|
| |  | | | MSCI EAFE Index | |
|
Morningstar Style BoxTM

The Morningstar Style BoxTM reveals a fund's investment strategy. For equity funds, the vertical axis shows the market capitalization of the stocks owned, and the horizontal axis shows a fund's investment style (value, blend or growth). Information shown is based on the most recent data provided by Morningstar.
23
Performance Information – Columbia Multi-Advisor International Equity Fund
Performance data quoted represents past performance and current performance may be lower or higher. Past performance is no guarantee of future results. The investment return and principal value will fluctuate so that shares, when redeemed, may be worth more or less than the original cost. Please visit www.columbiafunds.com for daily and most recent month-end performance updates.
Annual operating expense ratio (%)*
| Class A | | | 1.21 | | |
| Class B | | | 1.96 | | |
| Class C | | | 1.96 | | |
| Class R | | | 1.46 | | |
| Class Z | | | 0.96 | | |
*The annual operating expense ratio is as stated in the fund's prospectus that is current as of the date of this report. Differences in expense ratios disclosed elsewhere in this report may result from including fee waivers and expense reimbursements as well as different time periods used in calculating the ratios.
Performance of a $10,000 investment 03/01/99 – 02/28/09 ($)
The chart above shows the change in value of a hypothetical $10,000 investment in Class A shares of Columbia Multi-Advisor International Equity Fund during the stated time period, and does not reflect the deduction of taxes that a shareholder may pay on fund distributions or on the redemption of fund shares. The Morgan Stanley Capital International (MSCI) Europe, Australasia, Far East (EAFE) Index is a free float-adjusted market capitalization index that is designed to measure developed market equity performance excluding the US and Canada. Indices are not investments, do not incur fees or expenses and are not professionally managed. It is not possible to invest directly in an index. Securities in the fund may not match those in an index.
Performance of a $10,000 investment 03/01/99 – 02/28/09 ($)
| Sales charge | | without | | with | |
| Class A | | | 9,320 | | | | 8,786 | | |
| Class B | | | 8,551 | | | | 8,551 | | |
| Class C | | | 8,659 | | | | 8,659 | | |
| Class R | | | 9,246 | | | | n/a | | |
| Class Z | | | 9,465 | | | | n/a | | |
Average annual total return as of 02/28/09 (%)
| Share class | | A | | B | | C | | R | | Z | |
| Inception | | 06/03/92 | | 06/07/93 | | 06/17/92 | | 01/23/06 | | 12/02/91 | |
| Sales charge | | without | | with | | without | | with | | without | | with | | without | | without | |
| 1-year | | | –51.87 | | | | –54.64 | | | | –52.23 | | | | –54.59 | | | | –52.26 | | | | –52.73 | | | | –52.00 | | | | –51.76 | | |
| 5-year | | | –4.21 | | | | –5.34 | | | | –4.90 | | | | –5.20 | | | | –4.94 | | | | –4.94 | | | | –4.36 | | | | –3.97 | | |
| 10-year | | | –0.70 | | | | –1.29 | | | | –1.55 | | | | –1.55 | | | | –1.43 | | | | –1.43 | | | | –0.78 | | | | –0.55 | | |
Average annual total return as of 03/31/09 (%)
| Share class | | A | | B | | C | | R | | Z | |
| Sales charge | | without | | with | | without | | with | | without | | with | | without | | without | |
| 1-year | | | –48.18 | | | | –51.15 | | | | –48.58 | | | | –51.12 | | | | –48.60 | | | | –49.10 | | | | –48.31 | | | | –48.06 | | |
| 5-year | | | –3.12 | | | | –4.25 | | | | –3.84 | | | | –4.14 | | | | –3.85 | | | | –3.85 | | | | –3.27 | | | | –2.88 | | |
| 10-year | | | –0.43 | | | | –1.01 | | | | –1.29 | | | | –1.29 | | | | –1.15 | | | | –1.15 | | | | –0.51 | | | | –0.27 | | |
The "with sales charge" returns include the maximum initial sales charge of 5.75% for Class A shares, the applicable contingent deferred sales charge of 5.00% in the first year, declining to 1.00% in the sixth year and eliminated thereafter for Class B shares and 1.00% for Class C shares for the first year only. The "without sales charge" returns do not include the effect of sales charges. If they had, returns would be lower.
Performance results reflect any fee waivers or reimbursements of fund expenses by the investment advisor and/or any of its affiliates. Absent these fee waivers or expense reimbursement arrangements, performance results would have been lower.
All results shown assume reinvestment of distributions. Class Z shares are sold at net asset value with no distribution and service (Rule 12b-1) fees. Class R shares are sold at net asset value with distribution and service (Rule 12b-1) fees. Class R and Class Z shares have limited eligibility and the investment minimum requirements may vary. Please see the fund's prospectus for details. Performance for different share classes will vary based on differences in sales charges and fees associated with each class.
The tables do not reflect the deduction of taxes that a shareholder may pay on fund distributions or on the redemption of fund shares.
The inception date of the fund's Class R shares is January 23, 2006. Class R shares have no performance prior to their inception date. The performance shown for Class R shares prior to their inception date is that of Class A shares. If Class R shares fees and expenses were included, performance would be lower.
24
Understanding Your Expenses – Columbia Multi-Advisor International Equity Fund
As a fund shareholder, you incur two types of costs. There are transaction costs, which generally include sales charges on purchases and may include redemption fees or exchange fees. There are also ongoing costs, which generally include investment advisory fees, distribution and service (Rule 12b-1) fees and other fund expenses. The information on this page is intended to help you understand the ongoing costs of investing in the fund and to compare these costs with the ongoing costs of investing in other mutual funds.
Analyzing your fund's expenses by share class
To illustrate these ongoing costs, we have provided an example and calculated the expenses paid by investors in each share class during the period. The information in the following table is based on an initial investment of $1,000, which is invested at the beginning of the period and held for the entire period. Expense information is calculated two ways and each method provides you with different information. The amount listed in the "Actual" column is calculated using the fund's actual operating expenses and total return for the period. The amount listed in the "Hypothetical" column for each share class assumes that the return each year is 5% before expenses and is calculated based on the fund's actual operating expenses. You should not use the hypothetical account values and expenses to estimate either your actual account balance at the end of the period or the expenses you paid during this period.
Compare with other funds
Since all mutual funds are required to include the same hypothetical calculations about expenses in shareholder reports, you can use this information to compare the ongoing cost of investing in the fund with other funds. To do so, compare the 5% hypothetical example with the 5% hypothetical examples that appear in the shareholder reports of other funds. As you compare hypothetical examples of other funds, it is important to note that hypothetical examples are meant to highlight the ongoing costs of investing in a fund and do not reflect any transaction costs, such as sales charges, redemption fees or exchange fees.
Estimating your actual expenses
To estimate the expenses that you paid over the period, first you will need your account balance at the end of the period:
g For shareholders who receive their account statements from Columbia Management Services, Inc., your account balance is available online at www.columbiafunds.com or by calling Shareholder Services at 800.345.6611.
g For shareholders who receive their account statements from their financial intermediary, contact your financial intermediary to obtain your account balance.
1. Divide your ending account balance by $1,000. For example, if an account balance was $8,600 at the end of the period, the result would be 8.6.
2. In the section of the table below titled "Expenses paid during the period," locate the amount for your share class. You will find this number in the column labeled "Actual." Multiply this number by the result from step 1. Your answer is an estimate of the expenses you paid on your account during the period.
If the value of your account falls below the minimum initial investment requirement applicable to you, your account generally will be subject to a $20 annual fee. This fee is not included in the accompanying table. If you are subject to the fee, keep it in mind when you are estimating the ongoing expenses of investing in the fund and when comparing the expenses of this fund with other funds.
09/01/08 – 02/28/09
| | | Account value at the
beginning of the period ($) | | Account value at the
end of the period ($) | | Expenses paid
during the period ($) | | Fund's annualized
expense ratio (%) | |
| | | Actual | | Hypothetical | | Actual | | Hypothetical | | Actual | | Hypothetical | | Actual | |
| Class A | | | 1,000.00 | | | | 1,000.00 | | | | 542.49 | | | | 1,018.50 | | | | 4.86 | | | | 6.36 | | | | 1.27 | | |
| Class B | | | 1,000.00 | | | | 1,000.00 | | | | 540.81 | | | | 1,014.78 | | | | 7.72 | | | | 10.09 | | | | 2.02 | | |
| Class C | | | 1,000.00 | | | | 1,000.00 | | | | 540.11 | | | | 1,014.78 | | | | 7.71 | | | | 10.09 | | | | 2.02 | | |
| Class R | | | 1,000.00 | | | | 1,000.00 | | | | 541.90 | | | | 1,017.26 | | | | 5.81 | | | | 7.60 | | | | 1.52 | | |
| Class Z | | | 1,000.00 | | | | 1,000.00 | | | | 542.89 | | | | 1,019.74 | | | | 3.90 | | | | 5.11 | | | | 1.02 | | |
Expenses paid during the period are equal to the annualized expense ratio for the share class, multiplied by the average account value over the period, then multiplied by the number of days in the fund's most recent fiscal half-year and divided by 365.
It is important to note that the expense amounts shown in the table are meant to highlight only ongoing costs of investing in the fund and do not reflect any transaction costs, such as sales charges, redemption fees or exchange fees. Therefore, the hypothetical examples provided may not help you determine the relative total costs of owning shares of different funds. If these transaction costs were included, your costs would have been higher.
25
Portfolio Managers' Report – Columbia Multi-Advisor International Equity Fund
Performance data quoted represents past performance and current performance may be lower or higher. Past performance is no guarantee of future results. The investment return and principal value will fluctuate so that shares, when redeemed, may be worth more or less than the original cost. Please visit www.columbiafunds.com for daily and most recent month-end performance updates.
Net asset value per share
as of 02/28/09 ($)
| Class A | | | 7.44 | | |
| Class B | | | 6.82 | | |
| Class C | | | 6.73 | | |
| Class R | | | 7.44 | | |
| Class Z | | | 7.52 | | |
Distributions declared per share
03/01/08 – 02/28/09 ($)
| Class A | | | 0.26 | | |
| Class B | | | 0.19 | | |
| Class C | | | 0.19 | | |
| Class R | | | 0.23 | | |
| Class Z | | | 0.30 | | |
For the 12-month period that ended February 28, 2009, the fund's Class A shares returned negative 51.87% without sales charge. The fund's benchmark, the MSCI EAFE Index, returned negative 50.22%.1 The average return of the fund's peer group, the Lipper International Large Cap Core Funds Classification, was negative 50.96%.2 In the Causeway-advised portion of the fund, a combination of unfavorable currency exposure and country allocation held back performance relative to the benchmark. In the Marsico-advised portion of the fund, stock selection in several sectors hampered return. An overweight in the weak telecommunication services sector and an underweight in the utilities sector where some stocks were able to limit their losses also detracted from results.
Bank stocks detract from Causeway's relative returns
Bank stocks were the largest detractors from return, and the managers at Causeway sold Allied Irish Banks PLC, Royal Bank of Scotland Group PLC, HBOS in the United Kingdom and UniCredito Italiano in Italy. Other detractors included bank assurance company ING Groep NV in the Netherlands, power utility E.ON AG in the UK, industrial conglomerate Siemens AG in Germany, and shipbuilder Hyundai Heavy Industries in South Korea. These companies remain in the portfolio because the managers believe they are undervalued and have competitive upside potential.
Stock markets across the globe declined during the period, but some went down less than others and had a less negative impact on results. Within the portion of the fund advised by Causeway, three Japanese companies were noteworthy in this regard. In the information technology sector, Tokyo Electron Ltd., a semiconductor lithography manufacturer and in the industrials sector, Fanuc Ltd., an automatic equipment manufacturer, declined less than the benchmark and therefore helped relative performance. In the materials sector, Shin-Etsu Chemical, the world's largest silicon wafer producer, generated a positive return.
Industrials hamper Marsico's returns
Stocks in the industrials sector had the biggest negative impact on return, with Vestas Wind Systems A/S in Denmark, Gamesa, Tecnologica in Spain and Alstom in France declining dramatically. At the end of the period, all of these power generation companies remained in the portfolio. Positions in the consumer discretionary, materials and energy sectors significantly underperformed their respective benchmark sector returns.
During a period of steep declines, some individual stocks generated gains and worked to the fund's advantage. These included: automobile parts maker Continental AG in Germany, which we sold; global brewing company Anheuser-Busch InBev in Belgium; and energy company Transocean Ltd. in Switzerland. In a declining market, maintaining an average 8% position in cash and cash equivalents helped preserve
1The Morgan Stanley Capital International (MSCI) Europe, Australasia, Far East (EAFE) Index is a free float-adjusted market capitalization index that is designed to measure developed market equity performance excluding the US and Canada. Indices are not investments, do not incur fees or expenses and are not professionally managed. It is not possible to invest directly in an index. Securities in the fund may not match those in an index.
2Lipper Inc., a widely respected data provider in the industry, calculates an average total return (assuming reinvestment of distributions) for mutual funds with investment objectives similar to those of the fund. Lipper makes no adjustment for the effect of sales loads.
26
Portfolio Managers' Report (continued) – Columbia Multi-Advisor International Equity Fund
capital in the portfolio. While an underweight in the financials sector may have stemmed some losses, financial investments still posted negative results.
Managers evaluating stocks on a case-by-case basis
The managers at Causeway believe that the fiscal and monetary stimulus programs that governments around the world have put in place will eventually result in solutions to current economic problems. The managers have deliberately positioned the portfolio for a global economic recovery, using the proceeds from sales of defensive holdings in the health care and consumer staples areas to purchase high quality cyclical stocks. In this difficult market, the managers believe that the numerous world class companies trading at deep discounts to fair value present a once-in-a-generation investment opportunity. As a result, the focus of the Causeway portion of the fund is on high quality companies with the financial strength to dominate weaker industry peers, gain market share and prosper as the global economy moves into a recovery.
The primary sector allocations in the Marsico portion of the fund include financials, health care, consumer staples and industrials. The most significant country exposures are to Switzerland, the UK, Japan and Brazil. The stock-selection process at Marsico drives country exposure; it is not the result of any deliberate decision to overweight or underweight countries.
Sources for all statistical data—Columbia Management Advisors, LLC.
Source for all stock-specific commentary—Marsico Capital Management, LLC and Causeway Capital Management LLC.
Portfolio holdings and characteristics are subject to change periodically and may not be representative of current holdings and characteristics. The outlook for the fund may differ from those presented for other Columbia Funds.
Equity investments are affected by stock market fluctuations that occur in response to economic and business developments.
International investing may involve certain risks, including currency fluctuations, risks associated with possible differences in financial accounting standards and other monetary and political risks. Significant levels of foreign taxes, including potentially confiscatory levels of taxation and withholding taxes, may also apply to some foreign investments.
Some of the countries in which the fund invests are considered emerging economies, which means there may be greater risks associated with investing there than in more developed countries. In addition, concentration of investments in a single region may result in greater volatility.
Top 5 sectors
as of 02/28/09 (%)
| Industrials | | | 15.3 | | |
| Financials | | | 14.3 | | |
| Consumer Discretionary | | | 11.3 | | |
| Materials | | | 10.0 | | |
| Energy | | | 9.3 | | |
Top 10 holdings
as of 02/28/09 (%)
| Telefonica SA | | | 2.7 | | |
| Linde AG | | | 2.3 | | |
| Vodafone Group | | | 2.3 | | |
| Honda Motors | | | 2.2 | | |
| Teva Pharmceuticals | | | 2.1 | | |
| Credit Suisse Group | | | 1.7 | | |
| Vestas Wind Systems | | | 1.7 | | |
| Technip | | | 1.7 | | |
| Nintendo | | | 1.7 | | |
| Taiwan Semiconductor | |
| Manufacturing | | | 1.6 | | |
Holdings discussed in this report
as of 02/28/09 (%)
| ING Groep N.V. | | | 0.3 | | |
| E.ON AG | | | 1.3 | | |
| Siemens AG | | | 1.5 | | |
| Hyundai Heavy Industries | | | 1.1 | | |
| Tokyo Electron Ltd. | | | 1.5 | | |
| Fanuc Ltd. | | | 1.3 | | |
| Shin-Etsu Chemical | | | 0.8 | | |
| Vestas Wind Systems A/S | | | 1.7 | | |
| Gamesa, Tecnologica | | | 1.1 | | |
| Alstom | | | 0.8 | | |
| Anheuser-Busch InBev | | | 1.2 | | |
| Transocean Ltd. | | | 1.4 | | |
The fund is actively managed and the composition of its portfolio will change over time. Information provided is calculated as a percentage of net assets.
27
Investment Portfolio – Columbia Global Value Fund
February 28, 2009
| Common Stocks – 98.2% | |
| | | Shares | | Value ($) | |
| Consumer Discretionary – 7.4% | |
| Automobiles – 0.4% | |
| Ford Motor Co. (a) | | | 143,211 | | | | 286,422 | | |
| Automobiles Total | | | 286,422 | | |
| Leisure Equipment & Products – 0.8% | |
| Eastman Kodak Co. | | | 171,230 | | | | 546,223 | | |
| Leisure Equipment & Products Total | | | 546,223 | | |
| Media – 0.7% | |
| Gannett Co., Inc. | | | 141,600 | | | | 458,784 | | |
| Media Total | | | 458,784 | | |
| Multiline Retail – 2.1% | |
| Marks & Spencer Group PLC | | | 360,219 | | | | 1,345,950 | | |
| Multiline Retail Total | | | 1,345,950 | | |
| Specialty Retail – 3.4% | |
| Home Depot, Inc. | | | 105,300 | | | | 2,199,717 | | |
| Specialty Retail Total | | | 2,199,717 | | |
| Consumer Discretionary Total | | | 4,837,096 | | |
| Consumer Staples – 10.1% | |
| Food & Staples Retailing – 6.4% | |
| Carrefour SA | | | 18,500 | | | | 627,964 | | |
| Koninklijke Ahold NV | | | 76,660 | | | | 861,066 | | |
| Safeway, Inc. | | | 92,100 | | | | 1,703,850 | | |
| SUPERVALU, Inc. | | | 23,186 | | | | 361,933 | | |
| Wm. Morrison Supermarkets PLC | | | 177,232 | | | | 655,246 | | |
| Food & Staples Retailing Total | | | 4,210,059 | | |
| Food Products – 3.7% | |
| Sara Lee Corp. | | | 135,760 | | | | 1,046,710 | | |
| Unilever NV | | | 70,700 | | | | 1,366,856 | | |
| Food Products Total | | | 2,413,566 | | |
| Consumer Staples Total | | | 6,623,625 | | |
| Financials – 20.3% | |
| Commercial Banks – 13.3% | |
| Fifth Third Bancorp | | | 147,925 | | | | 312,122 | | |
| Intesa Sanpaolo SpA | | | 501,378 | | | | 1,230,564 | | |
Mitsubishi UFJ Financial
Group, Inc. | | | 291,800 | | | | 1,357,418 | | |
| Mizuho Financial Group, Inc. | | | 748,000 | | | | 1,440,893 | | |
PNC Financial Services
Group, Inc. | | | 82,153 | | | | 2,246,063 | | |
Royal Bank of Scotland
Group PLC | | | 529,764 | | | | 175,951 | | |
| | | Shares | | Value ($) | |
Royal Bank of Scotland
Group PLC (b) | | | 13,580 | | | | 4,510 | | |
Sumitomo Mitsui Financial
Group, Inc. | | | 49,100 | | | | 1,594,826 | | |
| Wells Fargo & Co. | | | 25,159 | | | | 304,424 | | |
| Commercial Banks Total | | | 8,666,771 | | |
| Diversified Financial Services – 1.3% | |
| Bank of America Corp. (c) | | | 71,524 | | | | 282,520 | | |
| CIT Group, Inc. | | | 136,738 | | | | 335,008 | | |
| Citigroup, Inc. | | | 176,531 | | | | 264,797 | | |
| Diversified Financial Services Total | | | 882,325 | | |
| Insurance – 5.7% | |
| Aegon NV | | | 284,382 | | | | 1,037,952 | | |
Mitsui Sumitomo Insurance
Group Holdings, Inc. | | | 76,300 | | | | 1,852,872 | | |
| Tokio Marine Holdings, Inc. | | | 37,300 | | | | 863,753 | | |
| Insurance Total | | | 3,754,577 | | |
| Financials Total | | | 13,303,673 | | |
| Health Care – 20.7% | |
| Health Care Equipment & Supplies – 2.3% | |
| Boston Scientific Corp. (a) | | | 216,836 | | | | 1,522,189 | | |
| Health Care Equipment & Supplies Total | | | 1,522,189 | | |
| Health Care Providers & Services – 0.4% | |
| Tenet Healthcare Corp. (a) | | | 217,800 | | | | 241,758 | | |
| Health Care Providers & Services Total | | | 241,758 | | |
| Pharmaceuticals – 18.0% | |
| AstraZeneca PLC | | | 53,800 | | | | 1,727,561 | | |
| Bristol-Myers Squibb Co. | | | 90,192 | | | | 1,660,435 | | |
| Daiichi Sankyo Co., Ltd. | | | 47,100 | | | | 767,827 | | |
| GlaxoSmithKline PLC | | | 112,920 | | | | 1,728,106 | | |
| Pfizer, Inc. | | | 130,800 | | | | 1,610,148 | | |
| Sanofi-Aventis SA | | | 40,649 | | | | 2,108,463 | | |
| Wyeth | | | 52,400 | | | | 2,138,968 | | |
| Pharmaceuticals Total | | | 11,741,508 | | |
| Health Care Total | | | 13,505,455 | | |
| Information Technology – 16.5% | |
| Communications Equipment – 4.9% | |
| Alcatel-Lucent (a) | | | 697,000 | | | | 945,475 | | |
| Alcatel-Lucent, ADR (a) | | | 90,202 | | | | 118,165 | | |
| Motorola, Inc. | | | 93,600 | | | | 329,472 | | |
Telefonaktiebolaget LM Ericsson,
Class B | | | 216,420 | | | | 1,802,119 | | |
| Communications Equipment Total | | | 3,195,231 | | |
See Accompanying Notes to Financial Statements.
28
Columbia Global Value Fund
February 28, 2009
| Common Stocks (continued) | |
| | | Shares | | Value ($) | |
| Computers & Peripherals – 2.0% | |
| Dell, Inc. (a) | | | 151,610 | | | | 1,293,233 | | |
| Computers & Peripherals Total | | | 1,293,233 | | |
| Electronic Equipment, Instruments & Components – 1.9% | |
| FUJIFILM Holdings Corp. | | | 38,000 | | | | 724,218 | | |
| Hitachi Ltd. | | | 214,000 | | | | 543,798 | | |
Electronic Equipment, Instruments &
Components Total | | | 1,268,016 | | |
| IT Services – 0.1% | |
| Unisys Corp. (a) | | | 201,500 | | | | 72,540 | | |
| IT Services Total | | | 72,540 | | |
| Office Electronics – 1.9% | |
| Xerox Corp. | | | 235,300 | | | | 1,218,854 | | |
| Office Electronics Total | | | 1,218,854 | | |
| Semiconductors & Semiconductor Equipment – 4.4% | |
| Intel Corp. | | | 68,159 | | | | 868,346 | | |
| Micron Technology, Inc. (a) | | | 339,800 | | | | 1,094,156 | | |
| STMicroelectronics NV | | | 207,600 | | | | 920,357 | | |
Semiconductors & Semiconductor
Equipment Total | | | 2,882,859 | | |
| Software – 1.3% | |
| Microsoft Corp. | | | 54,600 | | | | 881,790 | | |
| Software Total | | | 881,790 | | |
| Information Technology Total | | | 10,812,523 | | |
| Materials – 1.9% | |
| Chemicals – 1.9% | |
| Akzo Nobel NV | | | 28,900 | | | | 1,023,482 | | |
| Dow Chemical Co. | | | 27,800 | | | | 199,048 | | |
| Chemicals Total | | | 1,222,530 | | |
| Materials Total | | | 1,222,530 | | |
| Telecommunication Services – 21.3% | |
| Diversified Telecommunication Services – 21.3% | |
| AT&T, Inc. | | | 62,827 | | | | 1,493,398 | | |
Brasil Telecom Participacoes
SA, ADR | | | 16,951 | | | | 531,583 | | |
Deutsche Telekom AG,
Registered Shares | | | 206,703 | | | | 2,506,487 | | |
| Fairpoint Communications, Inc. | | | 1,252 | | | | 2,466 | | |
| KT Corp., ADR | | | 26,920 | | | | 323,578 | | |
Nippon Telegraph &
Telephone Corp. | | | 48,000 | | | | 2,090,271 | | |
| | | Shares | | Value ($) | |
Tele Norte Leste Participacoes
SA, ADR | | | 44,200 | | | | 535,704 | | |
| Telecom Italia SpA | | | 2,076,493 | | | | 2,544,286 | | |
Telecom Italia SpA,
Savings Shares | | | 565,300 | | | | 543,228 | | |
| Telefonica SA | | | 42,374 | | | | 790,216 | | |
Telefonos de Mexico SA de CV,
ADR, Class L | | | 23,700 | | | | 325,638 | | |
Telmex Internacional
SAB de CV, ADR | | | 42,100 | | | | 321,223 | | |
| Verizon Communications, Inc. | | | 66,400 | | | | 1,894,392 | | |
Diversified Telecommunication
Services Total | | | 13,902,470 | | |
| Telecommunication Services Total | | | 13,902,470 | | |
Total Common Stocks
(cost of $142,505,533) | | | 64,207,372 | | |
| Convertible Bond – 0.8% | |
| | | Par ($) | | | |
| Technology – 0.8% | |
| Semiconductors – 0.8% | |
| Micron Technology, Inc. | |
| 1.875% 06/01/14 | | | 1,356,000 | | | | 520,365 | | |
| Semiconductors Total | | | 520,365 | | |
| Technology Total | | | 520,365 | | |
Convertible Bond
Total (cost of $1,356,000) | | | 520,365 | | |
Total Investments – 99.0%
(cost of $143,861,533) (d) | | | 64,727,737 | | |
| Other Assets & Liabilities, Net – 1.0% | | | 700,934 | | |
| Net Assets – 100.0% | | | 65,428,671 | | |
Notes to Investment Portfolio:
(a) Non-income producing security.
(b) Security exempt from registration pursuant to Rule 144A under the Securities Act of 1933. This security may be resold in transactions exempt from registration, normally to qualified institutional buyers. At February 28, 2009, this security, which is not illiquid, amounted to $4,510, which represents less than 0.1% of net assets.
(c) Investments in affiliates during the year ended February 28, 2009: Security name: Bank of America Corp.
| Shares as of 02/29/08: | | | – | | |
| Shares purchased | | | – | | |
| Shares from merger | | | 71,524 | | |
| Shares sold: | | | – | | |
| Shares as of 02/28/09: | | | 71,524 | | |
| Net realized gain (loss): | | $ | – | | |
| Dividend income earned: | | $ | 68,663 | | |
| Value at end of period: | | $ | 282,520 | | |
(d) Cost for federal income tax purposes is $143,861,536.
See Accompanying Notes to Financial Statements.
29
Columbia Global Value Fund
February 28, 2009
The Fund was invested in the following countries at February 28, 2009:
Summary of Securities
By Country (Unaudited) | | Value | | % of Total
Investments | |
| United States | | $ | 27,390,130 | | | | 42.3 | | |
| Japan | | | 11,235,876 | | | | 17.4 | | |
| United Kingdom | | | 5,637,324 | | | | 8.7 | | |
| Netherlands | | | 5,209,714 | | | | 8.0 | | |
| Italy | | | 4,318,078 | | | | 6.7 | | |
| France | | | 3,800,068 | | | | 5.9 | | |
| Germany | | | 2,506,487 | | | | 3.9 | | |
| Sweden | | | 1,802,118 | | | | 2.8 | | |
| Brazil | | | 1,067,287 | | | | 1.6 | | |
| Spain | | | 790,216 | | | | 1.2 | | |
| Mexico | | | 646,861 | | | | 1.0 | | |
| South Korea | | | 323,578 | | | | 0.5 | | |
| | | $ | 64,727,737 | | | | 100.0 | | |
Certain securities are listed by country of underlying exposure but may trade predominantly on another exchange.
| Acronym | | Name | |
| ADR | | American Depositary Receipt | |
|
See Accompanying Notes to Financial Statements.
30
Investment Portfolio – Columbia International Value Fund
February 28, 2009
| Investment Company – 100.1% | |
| | | Value ($) | |
Investment in Columbia Funds
Master Investment Trust, LLC,
Columbia International Value
Master Portfolio (a) | | | 1,154,902,526 | | |
| Total Investments – 100.1% | | | 1,154,902,526 | | |
| Other Assets & Liabilities, Net – (0.1)% | | | (1,191,614 | ) | |
| Net Assets – 100.0% | | | 1,153,710,912 | | |
Notes to Investment Portfolio:
(a) The financial statements of Columbia International Value Master Portfolio, including its investment portfolio, are included elsewhere within this report and should be read in conjunction with Columbia International Value Fund's financial statements.
Columbia International Value Fund invests only in Columbia International Value Master Portfolio. At February 28, 2009, Columbia International Value Fund owned 85.4% of Columbia International Value Master Portfolio. Columbia International Value Master Portfolio was invested in the following countries at February 28, 2009.
Summary of Securities
By Country (Unaudited) | | Value | | % of Total
Investments | |
| Japan | | $ | 405,162,148 | | | | 30.1 | | |
| United Kingdom | | | 175,995,229 | | | | 13.1 | | |
| France | | | 140,439,772 | | | | 10.4 | | |
| Netherlands | | | 115,800,880 | | | | 8.6 | | |
| Germany | | | 82,569,474 | | | | 6.1 | | |
| South Korea | | | 75,243,108 | | | | 5.6 | | |
| Brazil | | | 61,180,801 | | | | 4.6 | | |
| Sweden | | | 54,746,927 | | | | 4.1 | | |
| Italy | | | 50,557,143 | | | | 3.8 | | |
| Portugal | | | 44,899,187 | | | | 3.3 | | |
| Switzerland | | | 29,302,119 | | | | 2.2 | | |
| Mexico | | | 28,236,211 | | | | 2.1 | | |
| Taiwan | | | 20,206,899 | | | | 1.5 | | |
| Spain | | | 20,133,888 | | | | 1.5 | | |
| United States* | | | 15,670,000 | | | | 1.2 | | |
| Bermuda | | | 12,758,188 | | | | 0.9 | | |
| New Zealand | | | 12,621,275 | | | | 0.9 | | |
| | | $ | 1,345,523,249 | | | | 100.0 | | |
* Includes short-term obligation.
Certain securities are listed by country of underlying exposure but may trade predominantly on another exchange.
See Accompanying Notes to Financial Statements.
31
Investment Portfolio – Columbia Marsico Global Fund
February 28, 2009
| Common Stocks – 88.6% | |
| | | Shares | | Value ($) | |
| Consumer Discretionary – 6.9% | |
| Distributors – 2.0% | |
| Li & Fung Ltd. | | | 30,000 | | | | 66,613 | | |
| Distributors Total | | | 66,613 | | |
| Hotels, Restaurants & Leisure – 0.9% | |
| McDonald's Corp. | | | 595 | | | | 31,089 | | |
| Hotels, Restaurants & Leisure Total | | | 31,089 | | |
| Internet & Catalog Retail – 1.1% | |
| Amazon.com, Inc. (a) | | | 561 | | | | 36,347 | | |
| Internet & Catalog Retail Total | | | 36,347 | | |
| Specialty Retail – 2.9% | |
| Home Depot, Inc. | | | 4,529 | | | | 94,611 | | |
| Specialty Retail Total | | | 94,611 | | |
| Consumer Discretionary Total | | | 228,660 | | |
| Consumer Staples – 16.3% | |
| Beverages – 4.9% | |
| Anheuser-Busch InBev NV | | | 3,014 | | | | 83,298 | | |
| Heineken Holding NV | | | 3,427 | | | | 79,788 | | |
| Beverages Total | | | 163,086 | | |
| Food & Staples Retailing – 8.3% | |
| Costco Wholesale Corp. | | | 3,671 | | | | 155,430 | | |
| Tesco PLC | | | 25,283 | | | | 120,602 | | |
| Food & Staples Retailing Total | | | 276,032 | | |
| Food Products – 2.1% | |
| Nestle SA, Registered Shares | | | 2,093 | | | | 68,595 | | |
| Food Products Total | | | 68,595 | | |
| Household Products – 1.0% | |
| Reckitt Benckiser Group PLC | | | 888 | | | | 34,248 | | |
| Household Products Total | | | 34,248 | | |
| Consumer Staples Total | | | 541,961 | | |
| Energy – 3.1% | |
| Oil, Gas & Consumable Fuels – 3.1% | |
| Petroleo Brasileiro SA, ADR | | | 3,696 | | | | 102,490 | | |
| Oil, Gas & Consumable Fuels Total | | | 102,490 | | |
| Energy Total | | | 102,490 | | |
| Financials – 9.6% | |
| Capital Markets – 2.1% | |
| Goldman Sachs Group, Inc. | | | 759 | | | | 69,130 | | |
| Capital Markets Total | | | 69,130 | | |
| | | Shares | | Value ($) | |
| Commercial Banks – 4.5% | |
Industrial & Commercial Bank
of China, Class H | | | 119,000 | | | | 48,795 | | |
| U.S. Bancorp | | | 3,153 | | | | 45,120 | | |
| Wells Fargo & Co. | | | 4,709 | | | | 56,979 | | |
| Commercial Banks Total | | | 150,894 | | |
| Diversified Financial Services – 3.0% | |
| JPMorgan Chase & Co. | | | 4,405 | | | | 100,654 | | |
| Diversified Financial Services Total | | | 100,654 | | |
| Financials Total | | | 320,678 | | |
| Health Care – 13.0% | |
| Biotechnology – 7.8% | |
| Celgene Corp. (a) | | | 1,297 | | | | 58,015 | | |
| Genzyme Corp. (a) | | | 1,185 | | | | 72,202 | | |
| Gilead Sciences, Inc. (a) | | | 2,907 | | | | 130,233 | | |
| Biotechnology Total | | | 260,450 | | |
| Life Sciences Tools & Services – 3.0% | |
| Lonza Group AG, Registered Shares | | | 1,034 | | | | 99,436 | | |
| Life Sciences Tools & Services Total | | | 99,436 | | |
| Pharmaceuticals – 2.2% | |
| Perrigo Co. | | | 94 | | | | 1,888 | | |
Roche Holding AG, Genusschein
Shares | | | 607 | | | | 69,010 | | |
| Pharmaceuticals Total | | | 70,898 | | |
| Health Care Total | | | 430,784 | | |
| Industrials – 15.4% | |
| Aerospace & Defense – 0.9% | |
| Raytheon Co. | | | 742 | | | | 29,658 | | |
| Aerospace & Defense Total | | | 29,658 | | |
| Construction & Engineering – 1.3% | |
| Aecom Technology Corp. (a) | | | 1,806 | | | | 44,301 | | |
| Construction & Engineering Total | | | 44,301 | | |
| Electrical Equipment – 8.6% | |
| ABB Ltd., Registered Shares | | | 5,002 | | | | 61,100 | | |
| Energy Conversion Devices, Inc. (a) | | | 1,103 | | | | 24,189 | | |
| Gamesa Corp., Tecnologica SA | | | 3,818 | | | | 51,162 | | |
| Vestas Wind Systems A/S (a) | | | 3,400 | | | | 149,845 | | |
| Electrical Equipment Total | | | 286,296 | | |
| Marine – 0.5% | |
| Kuehne & Nagel International AG | | | 338 | | | | 16,324 | | |
| Marine Total | | | 16,324 | | |
See Accompanying Notes to Financial Statements.
32
Columbia Marsico Global Fund
February 28, 2009
| Common Stocks (continued) | |
| | | Shares | | Value ($) | |
| Road & Rail – 4.1% | |
| All America Latina Logistica SA | | | 8,099 | | | | 27,669 | | |
| Canadian National Railway Co. | | | 3,309 | | | | 107,013 | | |
| Road & Rail Total | | | 134,682 | | |
| Industrials Total | | | 511,261 | | |
| Information Technology – 17.3% | |
| Communications Equipment – 2.2% | |
| QUALCOMM, Inc. | | | 2,204 | | | | 73,680 | | |
| Communications Equipment Total | | | 73,680 | | |
| Computers & Peripherals – 2.0% | |
| Apple, Inc. (a) | | | 768 | | | | 68,590 | | |
| Computers & Peripherals Total | | | 68,590 | | |
| Internet Software & Services – 2.5% | |
| Google, Inc., Class A (a) | | | 247 | | | | 83,484 | | |
| Internet Software & Services Total | | | 83,484 | | |
| IT Services – 7.8% | |
| MasterCard, Inc., Class A | | | 1,380 | | | | 218,081 | | |
| Visa, Inc., Class A | | | 715 | | | | 40,548 | | |
| IT Services Total | | | 258,629 | | |
| Software – 2.8% | |
| Citrix Systems, Inc. (a) | | | 4,466 | | | | 91,910 | | |
| Software Total | | | 91,910 | | |
| Information Technology Total | | | 576,293 | | |
| Materials – 6.5% | |
| Chemicals – 5.8% | |
| Monsanto Co. | | | 2,137 | | | | 162,989 | | |
| Praxair, Inc. | | | 541 | | | | 30,702 | | |
| Chemicals Total | | | 193,691 | | |
| Metals & Mining – 0.7% | |
| BHP Billition PLC | | | 1,512 | | | | 23,940 | | |
| Metals & Mining Total | | | 23,940 | | |
| Materials Total | | | 217,631 | | |
| Telecommunication Services – 0.5% | |
| Wireless Telecommunication Services – 0.5% | |
| American Tower Corp., Class A (a) | | | 595 | | | | 17,326 | | |
| Wireless Telecommunication Services Total | | | 17,326 | | |
| Telecommunication Services Total | | | 17,326 | | |
Total Common Stocks
(cost of $3,907,994) | | | 2,947,084 | | |
| Short-Term Obligation – 25.0% | |
| | | Par ($) | | Value ($) | |
Repurchase agreement with
State Street Bank & Trust Co.,
dated 02/27/09, due 03/02/09
at 0.100%, collateralized by a
U.S. Government Agency
Obligation maturing 09/17/10,
market value $852,160
(repurchase proceeds
$832,007) | | | 832,000 | | | | 832,000 | | |
Total Short-Term Obligation
(cost of $832,000) | | | 832,000 | | |
Total Investments – 113.6%
(cost of $4,739,994) (b) | | | 3,779,084 | | |
| Other Assets & Liabilities, Net – (13.6)% | | | (452,435 | ) | |
| Net Assets – 100.0% | | | 3,326,649 | | |
Notes to Investment Portfolio:
(a) Non-income producing security.
(b) Cost for federal income tax purposes is $5,228,457.
The Fund was invested in the following countries at February 28, 2009:
| Country (Unaudited) | | Value | | % of Total
Investments | |
| United States* | | $ | 2,569,156 | | | | 68.0 | | |
| Switzerland | | | 314,465 | | | | 8.3 | | |
| United Kingdom | | | 178,790 | | | | 4.7 | | |
| Denmark | | | 149,845 | | | | 4.0 | | |
| Brazil | | | 130,159 | | | | 3.4 | | |
| Canada | | | 107,013 | | | | 2.8 | | |
| Belgium | | | 83,298 | | | | 2.2 | | |
| Netherlands | | | 79,788 | | | | 2.1 | | |
| Hong Kong | | | 66.613 | | | | 1.8 | | |
| Spain | | | 51,162 | | | | 1.4 | | |
| China | | | 48,795 | | | | 1.3 | | |
| | | $ | 3,779,084 | | | | 100.0 | | |
* Includes short-term obligation.
Certain securities are listed by country of underlying exposure but may trade predominantly on another exchange.
| Acronym | | Name | |
| ADR | | American Depositary Receipt | |
|
See Accompanying Notes to Financial Statements.
33
Investment Portfolio – Columbia Marsico International Opportunities Fund
February 28, 2009
| Common Stocks – 94.2% | |
| | | Shares | | Value ($) | |
| Consumer Discretionary – 8.7% | |
| Automobiles – 2.2% | |
| Bayerische Motoren Werke AG | | | 418,495 | | | | 10,478,305 | | |
| Honda Motor Co., Ltd. | | | 562,400 | | | | 13,772,591 | | |
| Automobiles Total | | | 24,250,896 | | |
| Hotels, Restaurants & Leisure – 2.3% | |
| Accor SA | | | 553,132 | | | | 19,936,058 | | |
| Las Vegas Sands Corp. (a) | | | 2,157,911 | | | | 4,920,037 | | |
| Hotels, Restaurants & Leisure Total | | | 24,856,095 | | |
| Household Durables – 1.2% | |
| Gafisa SA | | | 2,054,764 | | | | 8,514,975 | | |
| Panasonic Corp. | | | 396,000 | | | | 4,682,453 | | |
| Household Durables Total | | | 13,197,428 | | |
| Media – 0.5% | |
| JC Decaux SA | | | 387,808 | | | | 5,009,849 | | |
| Media Total | | | 5,009,849 | | |
| Specialty Retail – 2.1% | |
| Esprit Holdings Ltd. | | | 2,882,500 | | | | 15,703,636 | | |
| Hennes & Mauritz AB, Class B | | | 175,505 | | | | 6,576,396 | | |
| Specialty Retail Total | | | 22,280,032 | | |
| Textiles, Apparel & Luxury Goods – 0.4% | |
Compagnie Financiere
Richemont SA | | | 351,629 | | | | 4,643,901 | | |
| Textiles, Apparel & Luxury Goods Total | | | 4,643,901 | | |
| Consumer Discretionary Total | | | 94,238,201 | | |
| Consumer Staples – 11.6% | |
| Beverages – 4.5% | |
| Anheuser-Busch InBev NV | | | 929,806 | | | | 25,697,004 | | |
| Heineken NV | | | 843,027 | | | | 22,732,260 | | |
| Beverages Total | | | 48,429,264 | | |
| Food & Staples Retailing – 3.1% | |
| Tesco PLC | | | 6,920,706 | | | | 33,012,405 | | |
| Food & Staples Retailing Total | | | 33,012,405 | | |
| Food Products – 3.0% | |
| Nestle SA, Registered Shares | | | 982,296 | | | | 32,193,212 | | |
| Food Products Total | | | 32,193,212 | | |
| Household Products – 1.0% | |
| Reckitt Benckiser Group PLC | | | 291,193 | | | | 11,230,531 | | |
| Household Products Total | | | 11,230,531 | | |
| Consumer Staples Total | | | 124,865,412 | | |
| | | Shares | | Value ($) | |
| Energy – 10.1% | |
| Energy Equipment & Services – 2.9% | |
| Transocean Ltd. (a) | | | 514,632 | | | | 30,759,555 | | |
| Energy Equipment & Services Total | | | 30,759,555 | | |
| Oil, Gas & Consumable Fuels – 7.2% | |
| BG Group PLC | | | 1,205,167 | | | | 17,339,440 | | |
| BP PLC | | | 2,544,723 | | | | 16,329,865 | | |
| CNOOC Ltd. | | | 14,391,300 | | | | 12,618,657 | | |
| Petroleo Brasileiro SA, ADR | | | 1,148,139 | | | | 31,837,894 | | |
| Oil, Gas & Consumable Fuels Total | | | 78,125,856 | | |
| Energy Total | | | 108,885,411 | | |
| Financials – 13.8% | |
| Capital Markets – 4.8% | |
Credit Suisse Group AG,
Registered Shares | | | 1,081,730 | | | | 26,741,575 | | |
| Daiwa Securities Group, Inc. | | | 2,966,000 | | | | 10,393,688 | | |
| Julius Baer Holding AG | | | 633,766 | | | | 14,757,265 | | |
| Capital Markets Total | | | 51,892,528 | | |
| Commercial Banks – 6.8% | |
| BNP Paribas | | | 424,679 | | | | 13,992,674 | | |
| ICICI Bank Ltd., ADR | | | 832,937 | | | | 10,378,395 | | |
Industrial & Commercial Bank
of China, Class H | | | 20,301,500 | | | | 8,324,525 | | |
| Mizuho Financial Group, Inc. | | | 5,545,500 | | | | 10,682,453 | | |
Uniao de Bancos Brasileiros
SA, GDR | | | 567,471 | | | | 29,695,757 | | |
| Commercial Banks Total | | | 73,073,804 | | |
| Real Estate Management & Development – 2.2% | |
| CapitaLand Ltd. | | | 3,790,000 | | | | 4,848,457 | | |
| Cheung Kong Holdings Ltd. | | | 1,625,000 | | | | 13,378,840 | | |
Sumitomo Realty &
Development Co., Ltd. | | | 555,000 | | | | 5,436,549 | | |
Real Estate Management &
Development Total | | | 23,663,846 | | |
| Financials Total | | | 148,630,178 | | |
| Health Care – 13.1% | |
| Biotechnology – 3.9% | |
Actelion Ltd., Registered
Shares (a) | | | 223,170 | | | | 10,568,550 | | |
| CSL Ltd. | | | 1,366,107 | | | | 32,024,603 | | |
| Biotechnology Total | | | 42,593,153 | | |
See Accompanying Notes to Financial Statements.
34
Columbia Marsico International Opportunities Fund
February 28, 2009
| Common Stocks (continued) | |
| | | Shares | | Value ($) | |
| Life Sciences Tools & Services – 3.1% | |
Lonza Group AG,
Registered Shares | | | 347,971 | | | | 33,463,040 | | |
| Life Sciences Tools & Services Total | | | 33,463,040 | | |
| Pharmaceuticals – 6.1% | |
Roche Holding AG,
Genusschein Shares | | | 196,644 | | | | 22,356,415 | | |
Teva Pharmaceutical Industries
Ltd., ADR | | | 978,868 | | | | 43,637,935 | | |
| Pharmaceuticals Total | | | 65,994,350 | | |
| Health Care Total | | | 142,050,543 | | |
| Industrials – 11.6% | |
| Airlines – 0.5% | |
| Singapore Airlines Ltd. | | | 898,000 | | | | 5,906,406 | | |
| Airlines Total | | | 5,906,406 | | |
| Building Products – 1.0% | |
| Daikin Industries Ltd. | | | 461,424 | | | | 10,259,645 | | |
| Building Products Total | | | 10,259,645 | | |
| Electrical Equipment – 8.1% | |
| ABB Ltd., Registered Shares | | | 1,043,254 | | | | 12,743,599 | | |
| Alstom | | | 344,833 | | | | 16,515,983 | | |
| Gamesa Corp., Tecnologica SA | | | 1,662,267 | | | | 22,274,575 | | |
| Vestas Wind Systems A/S (a) | | | 808,546 | | | | 35,634,222 | | |
| Electrical Equipment Total | | | 87,168,379 | | |
| Trading Companies & Distributors – 2.0% | |
| Marubeni Corp. | | | 6,834,000 | | | | 21,707,465 | | |
| Trading Companies & Distributors Total | | | 21,707,465 | | |
| Industrials Total | | | 125,041,895 | | |
| Information Technology – 9.2% | |
| Electronic Equipment, Instruments & Components – 1.9% | |
HON HAI Precision Industry
Co., Ltd. | | | 10,271,600 | | | | 20,495,270 | | |
Electronic Equipment, Instruments &
Components Total | | | 20,495,270 | | |
| Semiconductors & Semiconductor Equipment – 4.0% | |
| ASML Holding NV | | | 559,193 | | | | 8,655,877 | | |
Taiwan Semiconductor
Manufacturing Co., Ltd., ADR | | | 4,578,756 | | | | 34,523,820 | | |
Semiconductors & Semiconductor
Equipment Total | | | 43,179,697 | | |
| | | Shares | | Value ($) | |
| Software – 3.3% | |
| Nintendo Co., Ltd. | | | 121,664 | | | | 35,516,239 | | |
| Software Total | | | 35,516,239 | | |
| Information Technology Total | | | 99,191,206 | | |
| Materials – 8.4% | |
| Chemicals – 4.6% | |
| Linde AG | | | 414,680 | | | | 26,800,727 | | |
Potash Corp. of Saskatchewan,
Inc. | | | 265,488 | | | | 22,293,027 | | |
| Chemicals Total | | | 49,093,754 | | |
| Construction Materials – 2.3% | |
| Cemex SA de CV, ADR, COP (a) | | | 4,605,172 | | | | 24,821,877 | | |
| Construction Materials Total | | | 24,821,877 | | |
| Metals & Mining – 1.5% | |
| Cia Vale do Rio Doce, ADR | | | 384,900 | | | | 4,961,361 | | |
| Rio Tinto PLC | | | 452,675 | | | | 11,671,374 | | |
| Metals & Mining Total | | | 16,632,735 | | |
| Materials Total | | | 90,548,366 | | |
| Telecommunication Services – 7.7% | |
| Diversified Telecommunication Services – 2.3% | |
| Telefonica SA | | | 1,336,678 | | | | 24,927,179 | | |
Diversified Telecommunication
Services Total | | | 24,927,179 | | |
| Wireless Telecommunication Services – 5.4% | |
Rogers Communications, Inc.,
Class B | | | 1,419,890 | | | | 33,393,420 | | |
| Vodafone Group PLC | | | 13,648,161 | | | | 24,462,466 | | |
Wireless Telecommunication
Services Total | | | 57,855,886 | | |
| Telecommunication Services Total | | | 82,783,065 | | |
Total Common Stocks
(cost of $1,444,119,597) | | | 1,016,234,277 | | |
See Accompanying Notes to Financial Statements.
35
Columbia Marsico International Opportunities Fund
February 28, 2009
| Rights – 0.1% | |
| | | Units | | Value ($) | |
| Financials – 0.1% | |
| Real Estate Management & Development – 0.1% | |
CapitaLand Ltd.
Expiring 03/12/09 (a) | | | 1,895,000 | | | | 746,858 | | |
Real Estate Management &
Development Total | | | 746,858 | | |
| Industrials Total | | | 746,858 | | |
Total Rights
(cost of $1,250,377) | | | 746,858 | | |
| Short-Term Obligation – 3.9% | |
| | | Par ($) | | | |
Repurchase agreement with
Fixed Income Clearing Corp.,
dated 02/27/09, due 03/02/09
at 0.210%, collateralized by a
U.S. Government Agency
Obligation maturing 01/07/14,
market value $43,263,106
(repurchase proceeds
$42,412,742) | | | 42,412,000 | | | | 42,412,000 | | |
Total Short-Term Obligation
(cost of $42,412,000) | | | 42,412,000 | | |
Total Investments – 98.2%
(cost of $1,487,781,974) (b) | | | 1,059,393,135 | | |
| Other Assets & Liabilities, Net – 1.8% | | | 19,227,943 | | |
| Net Assets – 100.0% | | | 1,078,621,078 | | |
Notes to Investment Portfolio:
(a) Non-income producing security.
(b) Cost for federal income tax purposes is $1,593,113,459.
The Fund was invested in the following countries at February 28, 2009:
Summary of Securities
By Country (Unaudited) | | Value | | % of Total
Investments | |
| United States* | | $ | 280,241,659 | | | | 26.5 | | |
| Switzerland | | | 157,467,557 | | | | 14.9 | | |
| United Kingdom | | | 114,046,082 | | | | 10.8 | | |
| Japan | | | 112,451,083 | | | | 10.6 | | |
| France | | | 55,454,563 | | | | 5.2 | | |
| Hong Kong | | | 50,025,658 | | | | 4.7 | | |
| Spain | | | 47,201,753 | | | | 4.5 | | |
| Germany | | | 37,279,031 | | | | 3.5 | | |
| Denmark | | | 35,634,222 | | | | 3.4 | | |
| Canada | | | 33,393,420 | | | | 3.1 | | |
| Australia | | | 32,024,603 | | | | 3.0 | | |
| Netherlands | | | 31,388,137 | | | | 3.0 | | |
| Belgium | | | 25,697,004 | | | | 2.4 | | |
| Taiwan | | | 20,495,270 | | | | 1.9 | | |
| Singapore | | | 11,501,722 | | | | 1.1 | | |
| Brazil | | | 8,514,975 | | | | 0.8 | | |
| Sweden | | | 6,576,396 | | | | 0.6 | | |
| | | $ | 1,059,393,135 | | | | 100.0 | | |
* Includes short-term obligation.
Certain securities are listed by country of underlying exposure but may trade predominantly on other exchanges.
| Acronym | | Name | |
| ADR | | American Depositary Receipt | |
|
| COP | | Certificates of Participation | |
|
| GDR | | Global Depositary Receipt | |
|
See Accompanying Notes to Financial Statements.
36
Investment Portfolio – Columbia Multi-Advisor International Equity Fund
February 28, 2009
| Common Stocks – 94.1% | |
| | | Shares | | Value ($) | |
| Consumer Discretionary – 11.3% | |
| Automobiles – 3.4% | |
| Bayerische Motoren Werke AG | | | 237,473 | | | | 5,945,864 | | |
| Honda Motor Co., Ltd. | | | 1,077,900 | | | | 26,396,650 | | |
| Yamaha Motor Co., Ltd. | | | 909,300 | | | | 7,891,563 | | |
| Automobiles Total | | | 40,234,077 | | |
| Hotels, Restaurants & Leisure – 2.1% | |
| Accor SA | | | 300,424 | | | | 10,827,922 | | |
| Las Vegas Sands Corp. (a) | | | 1,184,911 | | | | 2,701,597 | | |
| OPAP SA | | | 442,886 | | | | 11,431,504 | | |
| Hotels, Restaurants & Leisure Total | | | 24,961,023 | | |
| Household Durables – 0.8% | |
| Gafisa SA | | | 1,116,031 | | | | 4,624,851 | | |
| Haseko Corp. | | | 8,320,500 | | | | 2,898,683 | | |
| Panasonic Corp. | | | 189,000 | | | | 2,234,807 | | |
| Household Durables Total | | | 9,758,341 | | |
| Leisure Equipment & Products – 1.0% | |
| Sankyo Co., Ltd. | | | 253,300 | | | | 11,523,664 | | |
| Leisure Equipment & Products Total | | | 11,523,664 | | |
| Media – 1.1% | |
| JC Decaux SA | | | 215,372 | | | | 2,782,256 | | |
| Reed Elsevier NV | | | 836,903 | | | | 9,404,561 | | |
| Media Total | | | 12,186,817 | | |
| Specialty Retail – 1.1% | |
| Esprit Holdings Ltd. | | | 1,635,600 | | | | 8,910,622 | | |
| Hennes & Mauritz AB, Class B | | | 95,322 | | | | 3,571,836 | | |
| Specialty Retail Total | | | 12,482,458 | | |
| Textiles, Apparel & Luxury Goods – 1.8% | |
Compagnie Financiere
Richemont SA | | | 860,583 | | | | 11,365,566 | | |
Yue Yuen Industrial
Holdings Ltd. | | | 2,892,333 | | | | 5,415,257 | | |
Yue Yuen Industrial
Holdings Ltd. (b) | | | 2,341,000 | | | | 4,383,008 | | |
| Textiles, Apparel & Luxury Goods Total | | | 21,163,831 | | |
| Consumer Discretionary Total | | | 132,310,211 | | |
| Consumer Staples – 7.2% | |
| Beverages – 2.5% | |
| Anheuser-Busch InBev NV | | | 521,582 | | | | 14,414,937 | | |
| C&C Group PLC | | | 2,224,771 | | | | 2,623,022 | | |
| Heineken NV | | | 472,903 | | | | 12,751,850 | | |
| Beverages Total | | | 29,789,809 | | |
| | | Shares | | Value ($) | |
| Food & Staples Retailing – 1.6% | |
| Tesco PLC | | | 3,903,881 | | | | 18,621,872 | | |
| Food & Staples Retailing Total | | | 18,621,872 | | |
| Food Products – 1.5% | |
| Nestle SA, Registered Shares | | | 542,967 | | | | 17,794,892 | | |
| Food Products Total | | | 17,794,892 | | |
| Household Products – 0.6% | |
| Reckitt Benckiser Group PLC | | | 164,054 | | | | 6,327,122 | | |
| Household Products Total | | | 6,327,122 | | |
| Tobacco – 1.0% | |
| British American Tobacco PLC | | | 472,259 | | | | 12,149,268 | | |
| Tobacco Total | | | 12,149,268 | | |
| Consumer Staples Total | | | 84,682,963 | | |
| Energy – 9.3% | |
| Energy Equipment & Services – 4.2% | |
| Aker Kvaerner ASA | | | 1,594,951 | | | | 8,623,565 | | |
| Precision Drilling Trust | | | 1,667,245 | | | | 4,835,823 | | |
| Technip SA | | | 596,193 | | | | 19,590,951 | | |
| Transocean Ltd. (a) | | | 283,109 | | | | 16,921,425 | | |
| Energy Equipment & Services Total | | | 49,971,764 | | |
| Oil, Gas & Consumable Fuels – 5.1% | |
| BG Group PLC | | | 668,202 | | | | 9,613,812 | | |
| BP PLC | | | 1,408,003 | | | | 9,035,364 | | |
| CNOOC Ltd. | | | 7,724,089 | | | | 6,772,677 | | |
| Petroleo Brasileiro SA, ADR | | | 634,001 | | | | 17,580,848 | | |
| Royal Dutch Shell PLC, Class A | | | 161,743 | | | | 3,565,814 | | |
| Royal Dutch Shell PLC, Class B | | | 617,536 | | | | 13,119,520 | | |
| Oil, Gas & Consumable Fuels Total | | | 59,688,035 | | |
| Energy Total | | | 109,659,799 | | |
| Financials – 14.3% | |
| Capital Markets – 3.4% | |
Credit Suisse Group AG,
Registered Shares | | | 814,530 | | | | 20,136,092 | | |
| Daiwa Securities Group, Inc. | | | 1,664,000 | | | | 5,831,118 | | |
| Julius Baer Holding AG | | | 351,967 | | | | 8,195,565 | | |
| UBS AG, Registered Shares (a) | | | 542,592 | | | | 5,129,775 | | |
| Capital Markets Total | | | 39,292,550 | | |
| Commercial Banks – 5.5% | |
| BNP Paribas | | | 387,729 | | | | 12,775,215 | | |
| HSBC Holdings PLC | | | 998,708 | | | | 7,333,925 | | |
| ICICI Bank Ltd., ADR | | | 472,646 | | | | 5,889,169 | | |
See Accompanying Notes to Financial Statements.
37
Columbia Multi-Advisor International Equity Fund
February 28, 2009
| Common Stocks (continued) | |
| | | Shares | | Value ($) | |
Industrial & Commercial Bank
of China, Class H | | | 11,222,000 | | | | 4,601,523 | | |
Mitsubishi UFJ Financial
Group, Inc. | | | 2,319,500 | | | | 10,790,030 | | |
| Mizuho Financial Group, Inc. | | | 3,116,100 | | | | 6,002,631 | | |
Unibanco - Uniao de Bancos
Brasileiros SA, SDR | | | 320,860 | | | | 16,790,604 | | |
| Commercial Banks Total | | | 64,183,097 | | |
| Diversified Financial Services – 0.3% | |
| ING Groep NV | | | 860,395 | | | | 3,998,748 | | |
| Diversified Financial Services Total | | | 3,998,748 | | |
| Insurance – 4.0% | |
| Aviva PLC | | | 1,863,898 | | | | 7,711,551 | | |
| AXA SA | | | 682,837 | | | | 6,351,396 | | |
| Manulife Financial Corp. | | | 804,008 | | | | 8,152,573 | | |
| Manulife Financial Corp. (c) | | | 64,526 | | | | 654,288 | | |
| Sony Financial Holdings, Inc. | | | 5,042 | | | | 13,199,765 | | |
| Sony Financial Holdings, Inc. (b) | | | 390 | | | | 1,021,005 | | |
Zurich Financial Services AG,
Registered Shares | | | 72,412 | | | | 10,324,676 | | |
| Insurance Total | | | 47,415,254 | | |
| Real Estate Management & Development – 1.1% | |
| CapitaLand Ltd. | | | 2,127,000 | | | | 2,721,021 | | |
| Cheung Kong Holdings Ltd. | | | 873,000 | | | | 7,187,524 | | |
Sumitomo Realty &
Development Co., Ltd. | | | 308,000 | | | | 3,017,040 | | |
Real Estate Management &
Development Total | | | 12,925,585 | | |
| Financials Total | | | 167,815,234 | | |
| Health Care – 9.0% | |
| Biotechnology – 2.0% | |
Actelion Ltd., Registered
Shares (a) | | | 124,190 | | | | 5,881,204 | | |
| CSL Ltd. | | | 775,189 | | | | 18,172,163 | | |
| Biotechnology Total | | | 24,053,367 | | |
| Life Sciences Tools & Services – 1.6% | |
Lonza Group AG, Registered
Shares | | | 191,605 | | | | 18,425,920 | | |
| Life Sciences Tools & Services Total | | | 18,425,920 | | |
| Pharmaceuticals – 5.4% | |
| Bayer AG | | | 188,613 | | | | 9,105,467 | | |
| Novartis AG, Registered Shares | | | 181,116 | | | | 6,607,711 | | |
Roche Holding AG,
Genusschein Shares | | | 111,780 | | | | 12,708,245 | | |
| Sanofi-Aventis SA | | | 143,748 | | | | 7,456,208 | | |
| | | Shares | | Value ($) | |
| Sanofi-Aventis SA (b) | | | 50,150 | | | | 2,601,280 | | |
Teva Pharmaceutical Industries
Ltd., ADR | | | 556,428 | | | | 24,805,560 | | |
| Pharmaceuticals Total | | | 63,284,471 | | |
| Health Care Total | | | 105,763,758 | | |
| Industrials – 15.3% | |
| Aerospace & Defense – 1.1% | |
| BAE Systems PLC | | | 2,547,893 | | | | 13,550,702 | | |
| Aerospace & Defense Total | | | 13,550,702 | | |
| Air Freight & Logistics – 1.5% | |
Deutsche Post AG, Registered
Shares | | | 631,195 | | | | 6,113,509 | | |
| TNT NV | | | 772,545 | | | | 11,258,134 | | |
| Air Freight & Logistics Total | | | 17,371,643 | | |
| Airlines – 0.9% | |
| Singapore Airlines Ltd. | | | 1,581,000 | | | | 10,398,695 | | |
| Airlines Total | | | 10,398,695 | | |
| Building Products – 0.5% | |
| Daikin Industries Ltd. | | | 253,888 | | | | 5,645,135 | | |
| Building Products Total | | | 5,645,135 | | |
| Construction & Engineering – 1.5% | |
| Vinci SA | | | 532,093 | | | | 17,366,572 | | |
| Construction & Engineering Total | | | 17,366,572 | | |
| Electrical Equipment – 4.1% | |
| ABB Ltd., Registered Shares | | | 566,625 | | | | 6,921,461 | | |
| Alstom | | | 187,290 | | | | 8,970,367 | | |
| Gamesa Corp., Tecnologica SA | | | 922,031 | | | | 12,355,324 | | |
| Vestas Wind Systems A/S (a) | | | 456,847 | | | | 20,134,151 | | |
| Electrical Equipment Total | | | 48,381,303 | | |
| Industrial Conglomerates – 2.1% | |
Koninklijke Philips
Electronics NV | | | 480,736 | | | | 7,761,385 | | |
| Siemens AG, Registered Shares | | | 339,540 | | | | 17,360,124 | | |
| Industrial Conglomerates Total | | | 25,121,509 | | |
| Machinery – 2.4% | |
| Fanuc Ltd. | | | 234,900 | | | | 15,644,756 | | |
| Hyundai Heavy Industries | | | 109,243 | | | | 12,645,103 | | |
| Machinery Total | | | 28,289,859 | | |
| Marine – 0.2% | |
| Stolt-Nielsen SA | | | 317,364 | | | | 1,968,793 | | |
| Marine Total | | | 1,968,793 | | |
See Accompanying Notes to Financial Statements.
38
Columbia Multi-Advisor International Equity Fund
February 28, 2009
| Common Stocks (continued) | |
| | | Shares | | Value ($) | |
| Professional Services – 0.1% | |
| Michael Page International PLC | | | 399,154 | | | | 1,232,858 | | |
| Professional Services Total | | | 1,232,858 | | |
| Trading Companies & Distributors – 0.9% | |
| Marubeni Corp. | | | 3,448,000 | | | | 10,952,200 | | |
| Trading Companies & Distributors Total | | | 10,952,200 | | |
| Industrials Total | | | 180,279,269 | | |
| Information Technology – 7.2% | |
| Electronic Equipment, Instruments & Components – 0.9% | |
HON HAI Precision Industry
Co., Ltd. | | | 5,484,250 | | | | 10,942,909 | | |
Electronic Equipment, Instruments &
Components Total | | | 10,942,909 | | |
| Semiconductors & Semiconductor Equipment – 4.6% | |
| ASML Holding NV | | | 1,103,459 | | | | 17,080,694 | | |
Taiwan Semiconductor
Manufacturing Co., Ltd., ADR | | | 2,538,679 | | | | 19,141,640 | | |
| Tokyo Electron Ltd. | | | 510,900 | | | | 17,484,564 | | |
Semiconductors & Semiconductor
Equipment Total | | | 53,706,898 | | |
| Software – 1.7% | |
| Nintendo Co., Ltd. | | | 66,700 | | | | 19,471,110 | | |
| Software Total | | | 19,471,110 | | |
| Information Technology Total | | | 84,120,917 | | |
| Materials – 10.0% | |
| Chemicals – 6.5% | |
| Akzo Nobel NV | | | 502,954 | | | | 17,811,914 | | |
| Linde AG | | | 417,474 | | | | 26,981,303 | | |
Mitsubishi Gas
Chemical Co., Inc. | | | 2,482,000 | | | | 9,892,904 | | |
Potash Corp. of
Saskatchewan, Inc. | | | 149,851 | | | | 12,582,988 | | |
| Shin-Etsu Chemical Co., Ltd. | | | 209,300 | | | | 9,457,585 | | |
| Chemicals Total | | | 76,726,694 | | |
| Construction Materials – 1.8% | |
| Cemex SA de CV, ADR, COP (a) | | | 2,617,766 | | | | 14,109,759 | | |
| CRH PLC | | | 361,920 | | | | 7,455,892 | | |
| Construction Materials Total | | | 21,565,651 | | |
| | | Shares | | Value ($) | |
| Metals & Mining – 1.7% | |
| Cia Vale do Rio Doce, ADR | | | 213,100 | | | | 2,746,859 | | |
| Rio Tinto PLC | | | 648,272 | | | | 16,714,475 | | |
| Metals & Mining Total | | | 19,461,334 | | |
| Materials Total | | | 117,753,679 | | |
| Telecommunication Services – 8.7% | |
| Diversified Telecommunication Services – 4.8% | |
| France Telecom | | | 388,964 | | | | 8,782,274 | | |
| France Telecom SA (b) | | | 290,760 | | | | 6,564,962 | | |
| Telefonica SA | | | 1,684,368 | | | | 31,411,111 | | |
| TELUS Corp. | | | 379,339 | | | | 9,487,948 | | |
Diversified Telecommunication
Services Total | | | 56,246,295 | | |
| Wireless Telecommunication Services – 3.9% | |
Rogers Communications, Inc.,
Class B | | | 804,138 | | | | 18,911,971 | | |
| Vodafone Group PLC | | | 14,850,542 | | | | 26,617,570 | | |
Wireless Telecommunication
Services Total | | | 45,529,541 | | |
| Telecommunication Services Total | | | 101,775,836 | | |
| Utilities – 1.8% | |
| Electric Utilities – 1.8% | |
| E.ON AG | | | 583,638 | | | | 15,101,504 | | |
| Electricite de France | | | 151,147 | | | | 5,922,870 | | |
| Electric Utilities Total | | | 21,024,374 | | |
| Utilities Total | | | 21,024,374 | | |
Total Common Stocks
(cost of $1,613,090,866) | | | 1,105,186,040 | | |
| Rights – 0.0% | | Units | | | |
| Financials – 0.0% | |
| Real Estate Management & Development – 0.0% | |
CapitaLand Ltd.
Expiring 03/12/09 (a) | | | 1,063,500 | | | | 419,147 | | |
| Real Estate Management & Development Total | | | 419,147 | | |
| Financials Total | | | 419,147 | | |
Total Rights
(cost of $699,453) | | | 419,147 | | |
See Accompanying Notes to Financial Statements.
39
Columbia Multi-Advisor International Equity Fund
February 28, 2009
| Short-Term Obligation – 5.0% | |
| | | Par ($) | | Value ($) | |
Repurchase agreement with
Fixed Income Clearing Corp.,
dated 02/27/09, due 03/02/09
at 0.210%, collateralized by a
U.S. Government Agency
Obligation maturing 10/05/11,
market value $60,241,425
(repurchase proceeds
$59,054,033) | | | 59,053,000 | | | | 59,053,000 | | |
Total Short-Term Obligation
(cost of $59,053,000) | | | 59,053,000 | | |
Total Investments – 99.1%
(cost of $1,672,843,319) (d) | | | 1,164,658,187 | | |
| Other Assets & Liabilities, Net – 0.9% | | | 10,433,577 | | |
| Net Assets – 100.0% | | | 1,175,091,764 | | |
Notes to Investment Portfolio:
(a) Non-income producing security.
(b) Security exempt from registration pursuant to Rule 144A under the Securities Act of 1933. These securities may be resold in transactions exempt from registration, normally on foreign exchanges or to qualified institutional buyers. As of February 28, 2009, these securities, which are not illiquid, amounted to $14,570,255 which represents 1.2% of net assets.
(c) Security exempt from registration pursuant to Regulation D under the Securities Act of 1933. As of February 28, 2009, this security amounted to $654,288, which represents 0.1% of net assets.
(d) Cost for federal income tax purposes is $1,756,208,821.
The Fund was invested in the following countries at February 28, 2009:
Summary of Securities
By Country (Unaudited) | | Value | | % of Total
Investments | |
| Japan | | $ | 179,355,211 | | | | 15.4 | | |
| United Kingdom | | | 145,593,852 | | | | 12.5 | | |
| Switzerland | | | 140,412,531 | | | | 12.1 | | |
| France | | | 109,992,273 | | | | 9.4 | | |
| Germany | | | 80,607,771 | | | | 6.9 | | |
| Netherlands | | | 80,067,286 | | | | 6.9 | | |
| United States* | | | 61,754,597 | | | | 5.3 | | |
| Canada | | | 54,625,591 | | | | 4.7 | | |
| Spain | | | 43,766,435 | | | | 3.8 | | |
| Brazil | | | 41,743,161 | | | | 3.6 | | |
| Hong Kong | | | 32,669,089 | | | | 2.8 | | |
| Taiwan | | | 30,084,549 | | | | 2.6 | | |
| Israel | | | 24,805,560 | | | | 2.1 | | |
| Denmark | | | 20,134,151 | | | | 1.7 | | |
| Australia | | | 18,172,163 | | | | 1.5 | | |
| Belgium | | | 14,414,937 | | | | 1.2 | | |
| Mexico | | | 14,109,759 | | | | 1.2 | | |
| Singapore | | | 13,538,863 | | | | 1.2 | | |
| South Korea | | | 12,645,103 | | | | 1.1 | | |
| Greece | | | 11,431,504 | | | | 1.0 | | |
| Ireland | | | 10,078,914 | | | | 0.9 | | |
| Norway | | | 8,623,565 | | | | 0.7 | | |
| India | | | 5,889,169 | | | | 0.5 | | |
| China | | | 4,601,523 | | | | 0.4 | | |
| Sweden | | | 3,571,837 | | | | 0.3 | | |
| Luxembourg | | | 1,968,793 | | | | 0.2 | | |
| | | $ | 1,164,658,187 | | | | 100.0 | | |
* Includes short-term obligation.
Certain securities are listed by country of underlying exposure but may trade predominantly on another exchange.
| Acronym | | Name | |
| | ADR | | | American Depositary Receipt | |
|
| | COP | | | Certificates of Participation | |
|
See Accompanying Notes to Financial Statements.
40
Statements of Assets and Liabilities – International/Global Stock Funds
February 28, 2009
| | | ($) | | ($) | | ($) | | ($) | | ($) | |
| | | Columbia
Global
Value
Fund | | Columbia
International
Value
Fund | | Columbia
Marsico
Global
Fund | | Columbia
Marsico
International
Opportunities
Fund | | Columbia
Multi-Advisor
International
Equity
Fund | |
| Assets | |
| Unaffiliated investments, at identified cost | | | 135,413,646 | | | | — | | | | 3,907,994 | | | | 1,445,369,974 | | | | 1,613,790,319 | | |
| Affiliated investments, at identified cost | | | 8,447,887 | | | | — | | | | — | | | | — | | | | — | | |
| Repurchase agreement | | | — | | | | — | | | | 832,000 | | | | 42,412,000 | | | | 59,053,000 | | |
Investment in Columbia International Value
Master Portfolio, at identified cost | | | — | | | | 2,134,723,538 | | | | — | | | | — | | | | — | | |
| Total investments, at identified cost | | | 143,861,533 | | | | 2,134,723,538 | | | | 4,739,994 | | | | 1,487,781,974 | | | | 1,672,843,319 | | |
| Unaffiliated investments, at value | | | 64,445,217 | | | | — | | | | 2,947,084 | | | | 1,016,981,135 | | | | 1,105,605,187 | | |
| Affiliated investments, at value | | | 282,520 | | | | — | | | | — | | | | — | | | | — | | |
| Repurchase agreement | | | — | | | | — | | | | 832,000 | | | | 42,412,000 | | | | 59,053,000 | | |
Investment in Columbia International Value
Master Portfolio, at value | | | — | | | | 1,154,902,526 | | | | — | | | | — | | | | — | | |
| Total investments, at value | | | 64,727,737 | | | | 1,154,902,526 | | | | 3,779,084 | | | | 1,059,393,135 | | | | 1,164,658,187 | | |
| Cash | | | — | | | | — | | | | 937 | | | | 551 | | | | 1,433 | | |
Foreign currency (cost of $15,784, $—, $—,
$2,865,773 and $1,183,433, respectively) | | | 15,757 | | | | — | | | | — | | | | 2,750,606 | | | | 1,154,992 | | |
| Receivable for: | |
| Investments sold | | | 1,067,035 | | | | — | | | | 51,807 | | | | 21,160,547 | | | | 10,048,134 | | |
| Fund shares sold | | | 2,456 | | | | 1,100,345 | | | | — | | | | 1,815,264 | | | | 6,110,970 | | |
| Dividends | | | 371,646 | | | | — | | | | 7,546 | | | | 1,890,201 | | | | 2,464,671 | | |
| Interest | | | 6,356 | | | | — | | | | 5 | | | | 495 | | | | 689 | | |
| Foreign tax reclaims | | | 148,790 | | | | — | | | | 1,545 | | | | 2,229,937 | | | | 1,600,260 | | |
| Other assets | | | 1,694 | | | | — | | | | 57 | | | | 28,269 | | | | 23,404 | | |
| Total Assets | | | 66,341,471 | | | | 1,156,002,871 | | | | 3,840,981 | | | | 1,089,269,005 | | | | 1,186,062,740 | | |
| Liabilities | |
| Payable to custodian bank | | | 238,801 | | | | — | | | | — | | | | — | | | | — | | |
Expense reimbursement due to
investment advisor | | | — | | | | — | | | | 208,595 | | | | — | | | | — | | |
| Payable for: | |
| Investments purchased | | | — | | | | — | | | | 162,948 | | | | 3,269,678 | | | | 4,730,957 | | |
| Fund shares repurchased | | | 424,865 | | | | 1,580,165 | | | | 20,843 | | | | 4,538,810 | | | | 4,671,778 | | |
| Investment advisory fee | | | 61,979 | | | | — | | | | 2,202 | | | | 779,784 | | | | 657,714 | | |
| Administration fee | | | 7,423 | | | | 160,412 | | | | — | | | | 189,215 | | | | 158,937 | | |
| Transfer agent fee | | | 21,740 | | | | 325,850 | | | | 10,877 | | | | 674,446 | | | | 378,300 | | |
| Trustees' fees | | | 35,761 | | | | 21,696 | | | | 2,541 | | | | 38,325 | | | | 73,016 | | |
| Audit fee | | | 46,521 | | | | 18,060 | | | | 33,883 | | | | 37,433 | | | | 35,414 | | |
| Legal fee | | | 9,319 | | | | 5,135 | | | | 6,716 | | | | 11,542 | | | | 10,297 | | |
| Pricing and bookkeeping fees | | | 5,779 | | | | 3,167 | | | | 1,447 | | | | 13,422 | | | | 13,773 | | |
| Custody fee | | | 7,196 | | | | 559 | | | | 3,400 | | | | 140,204 | | | | 142,388 | | |
| Distribution and service fees | | | 32,458 | | | | 113,520 | | | | 1,237 | | | | 87,848 | | | | 5,586 | | |
| Reports to shareholders | | | 16,656 | | | | 62,280 | | | | 22,327 | | | | 124,029 | | | | 89,739 | | |
| Chief compliance officer expenses | | | 107 | | | | 216 | | | | 99 | | | | 342 | | | | 309 | | |
| Other liabilities | | | 4,195 | | | | 899 | | | | 37,217 | | | | 742,849 | | | | 2,768 | | |
| Total Liabilities | | | 912,800 | | | | 2,291,959 | | | | 514,332 | | | | 10,647,927 | | | | 10,970,976 | | |
| Net Assets | | | 65,428,671 | | | | 1,153,710,912 | | | | 3,326,649 | | | | 1,078,621,078 | | | | 1,175,091,764 | | |
| Net Assets Consist of | |
| Paid-in capital | | | 176,348,200 | | | | 2,166,357,458 | | | | 6,395,401 | | | | 2,309,384,023 | | | | 2,198,420,153 | | |
Undistributed (Overdistributed) net
investment income | | | 3,424,873 | | | | (418,865 | ) | | | — | | | | 26,783,663 | | | | 29,410,962 | | |
| Accumulated net investment loss | | | — | | | | — | | | | (86 | ) | | | — | | | | — | | |
| Accumulated net realized loss | | | (35,214,738 | ) | | | (32,406,669 | ) | | | (2,107,648 | ) | | | (828,763,722 | ) | | | (544,286,634 | ) | |
| Unrealized appreciation (depreciation) on: | |
| Investments | | | (79,133,796 | ) | | | (979,821,012 | ) | | | (960,910 | ) | | | (428,388,839 | ) | | | (508,185,132 | ) | |
| Foreign currency translations | | | 4,132 | | | | — | | | | (108 | ) | | | (394,047 | ) | | | (267,585 | ) | |
| Net Assets | | | 65,428,671 | | | | 1,153,710,912 | | | | 3,326,649 | | | | 1,078,621,078 | | | | 1,175,091,764 | | |
See Accompanying Notes to Financial Statements.
41
Statements of Assets and Liabilities – International/Global Stock Funds
February 28, 2009 (continued)
| | | Columbia
Global
Value
Fund | | Columbia
International
Value
Fund | | Columbia
Marsico
Global
Fund | | Columbia
Marsico
International
Opportunities
Fund | | Columbia
Multi-Advisor
International
Equity
Fund | |
| Class A | |
| Net assets | | $ | 16,031,143 | | | $ | 241,096,509 | | | $ | 1,112,525 | | | $ | 198,011,596 | | | $ | 16,935,833 | | |
| Shares outstanding | | | 3,869,460 | | | | 25,641,482 | | | | 223,460 | | | | 29,299,822 | | | | 2,277,039 | | |
| Net asset value per share (a)(b) | | $ | 4.14 | | | $ | 9.40 | | | $ | 4.98 | | | $ | 6.76 | | | $ | 7.44 | | |
| Maximum sales charge | | | 5.75 | % | | | 5.75 | % | | | 5.75 | % | | | 5.75 | % | | | 5.75 | % | |
| Maximum offering price per share (c) | | $ | 4.39 | | | $ | 9.97 | | | $ | 5.28 | | | $ | 7.17 | | | $ | 7.89 | | |
| Class B | |
| Net assets | | $ | 7,407,568 | | | $ | 18,742,597 | | | | — | | | $ | 15,281,222 | | | $ | 1,097,815 | | |
| Shares outstanding | | | 1,862,515 | | | | 2,061,319 | | | | — | | | | 2,395,011 | | | | 161,079 | | |
Net asset value and offering
price per share (a)(b) | | $ | 3.98 | | | $ | 9.09 | | | | — | | | $ | 6.38 | | | $ | 6.82 | | |
| Class C | |
| Net assets | | $ | 21,374,684 | | | $ | 49,749,947 | | | $ | 886,353 | | | $ | 38,667,621 | | | $ | 1,348,532 | | |
| Shares outstanding | | | 5,374,119 | | | | 5,479,374 | | | | 179,169 | | | | 6,055,185 | | | | 200,292 | | |
Net asset value and offering
price per share (a)(b) | | $ | 3.98 | | | $ | 9.08 | | | $ | 4.95 | | | $ | 6.39 | | | $ | 6.73 | | |
| Class R | |
| Net assets | | | — | | | | — | | | $ | 621,127 | | | $ | 2,592,386 | | | $ | 111,648 | | |
| Shares outstanding | | | — | | | | — | | | | 125,032 | | | | 384,958 | | | | 15,012 | | |
Net asset value and offering
price per share (b) | | | — | | | | — | | | $ | 4.97 | | | $ | 6.73 | | | $ | 7.44 | | |
| Class Z | |
| Net assets | | $ | 20,615,276 | | | $ | 844,121,859 | | | $ | 706,644 | | | $ | 824,068,253 | | | $ | 1,155,597,936 | | |
| Shares outstanding | | | 4,930,545 | | | | 88,976,235 | | | | 141,647 | | | | 119,927,087 | | | | 153,625,068 | | |
Net asset value and offering
price per share (b) | | $ | 4.18 | | | $ | 9.49 | | | $ | 4.99 | | | $ | 6.87 | | | $ | 7.52 | | |
(a) Redemption price per share is equal to net asset value less any applicable contingent deferred sales charge.
(b) Redemption price per share is equal to net asset value less any applicable redemption fees.
(c) On sales of $50,000 or more the offering price is reduced.
See Accompanying Notes to Financial Statements.
42
Statements of Operations – International/Global Stock Funds
For the Year Ended February 28, 2009
| | | ($) | | ($) | | ($) | | ($) | | ($) | |
| | | Columbia
Global
Value
Fund | | Columbia
International
Value
Fund | | Columbia
Marsico
Global
Fund (a) | | Columbia
Marsico
International
Opportunities
Fund | | Columbia
Multi-Advisor
International
Equity
Fund | |
| Investment Income | |
| Dividends | | | 6,513,694 | | | | — | | | | 61,092 | | | | 66,162,655 | | | | 72,491,619 | | |
| Dividends from affiliates | | | 68,663 | | | | — | | | | — | | | | — | | | | — | | |
| Interest | | | 40,657 | | | | — | | | | 5,750 | | | | 2,538,684 | | | | 1,785,063 | | |
| Securities lending | | | 364,458 | | | | — | | | | — | | | | — | | | | — | | |
| Foreign taxes withheld | | | (473,218 | ) | | | — | | | | (2,209 | ) | | | (6,007,443 | ) | | | (6,858,349 | ) | |
| Allocated from Master Portfolio: | |
| Dividends | | | — | | | | 103,219,011 | | | | — | | | | — | | | | — | | |
| Interest | | | — | | | | 196,167 | | | | — | | | | — | | | | — | | |
| Securities lending | | | — | | | | 7,053,177 | | | | — | | | | — | | | | — | | |
| Foreign taxes withheld | | | — | | | | (14,615,374 | ) | | | — | | | | — | | | | — | | |
| Expenses (b) | | | — | | | | (18,241,143 | ) | | | — | | | | — | | | | — | | |
| Total Income | | | 6,514,254 | | | | 77,611,838 | | | | 64,633 | | | | 62,693,896 | | | | 67,418,333 | | |
| Expenses | |
| Investment advisory fee | | | 1,445,555 | | | | — | | | | 30,317 | | | | 19,536,182 | | | | 12,759,354 | | |
| Administration fee | | | 211,052 | | | | 3,627,490 | | | | — | | | | 5,232,450 | | | | 3,345,352 | | |
| Distribution fee: | |
| Class B | | | 118,682 | | | | 315,168 | | | | — | | | | 238,006 | | | | 17,247 | | |
| Class C | | | 370,937 | | | | 703,872 | | | | 7,006 | | | | 613,481 | | | | 20,920 | | |
| Class R | | | — | | | | — | | | | 3,997 | | | | 16,978 | | | | 818 | | |
| Service fee: | |
| Class A | | | 142,661 | | | | 1,424,337 | | | | 2,894 | | | | 1,156,404 | | | | 80,055 | | |
| Class B | | | 39,559 | | | | 105,127 | | | | — | | | | 79,335 | | | | 5,758 | | |
| Class C | | | 123,651 | | | | 234,813 | | | | 2,335 | | | | 204,494 | | | | 6,974 | | |
| Transfer agent fee | | | 236,745 | | | | 2,229,374 | | | | 11,896 | | | | 4,261,182 | | | | 3,134,146 | | |
| Pricing and bookkeeping fees | | | 72,500 | | | | 38,000 | | | | 16,411 | | | | 150,412 | | | | 153,963 | | |
| Trustees' fees | | | (6,327 | ) | | | (2,911 | ) | | | 14,943 | | | | (9,365 | ) | | | 10,901 | | |
| Custody fee | | | 44,560 | | | | 3,642 | | | | 16,938 | | | | 972,584 | | | | 896,336 | | |
| Registration fees | | | 20,232 | | | | 42,921 | | | | 92,930 | | | | 104,640 | | | | 48,725 | | |
| Audit fee | | | 56,029 | | | | 26,605 | | | | 41,430 | | | | 48,999 | | | | 55,063 | | |
| Legal fees | | | 60,262 | | | | 31,730 | | | | 33,582 | | | | 34,408 | | | | 59,414 | | |
| Reports to shareholders | | | 55,432 | | | | 191,353 | | | | 53,970 | | | | 444,470 | | | | 281,319 | | |
| Chief compliance officer expenses | | | 640 | | | | 1,329 | | | | 546 | | | | 1,645 | | | | 1,460 | | |
| Other expenses | | | 8,956 | | | | 15,692 | | | | 10,573 | | | | 79,422 | | | | 67,642 | | |
| Expenses before interest expense | | | 3,001,126 | | | | 8,988,542 | | | | 339,768 | | | | 33,165,727 | | | | 20,945,447 | | |
| Interest expense | | | 4,371 | | | | — | | | | — | | | | — | | | | — | | |
Interest expense allocated from
Master Portfolio | | | — | | | | 46,796 | | | | — | | | | — | | | | — | | |
| Total Expenses | | | 3,005,497 | | | | 9,035,338 | | | | 339,768 | | | | 33,165,727 | | | | 20,945,447 | | |
| Fees waived by transfer agent | | | (48,202 | ) | | | — | | | | — | | | | — | | | | — | | |
Fees waived or expenses reimbursed by
investment advisor | | | — | | | | — | | | | (272,206 | ) | | | — | | | | — | | |
| Expense reductions | | | (300 | ) | | | (1,262 | ) | | | (205 | ) | | | (1,518 | ) | | | (2,270 | ) | |
| Net Expenses | | | 2,956,995 | | | | 9,034,076 | | | | 67,357 | | | | 33,164,209 | | | | 20,943,177 | | |
| Net Investment Income (Loss) | | | 3,557,259 | | | | 68,577,762 | | | | (2,724 | ) | | | 29,529,687 | | | | 46,475,156 | | |
(a) The Fund commenced operations on April 30, 2008. Amounts shown reflect activity for the period April 30, 2008 through February 28, 2009.
(b) Expenses allocated from Master Portfolio include the Fund's pro-rata portion of the Master Portfolio's investment advisory, administration, pricing and bookkeeping, Trustees' fees and other expenses.
See Accompanying Notes to Financial Statements.
43
Statements of Operations – International/Global Stock Funds
For the Year Ended February 28, 2009 (continued)
| | | ($) | | ($) | | ($) | | ($) | | ($) | |
| | |
Columbia
Global
Value
Fund | |
Columbia
International
Value
Fund | |
Columbia
Marsico
Global
Fund (a) | | Columbia
Marsico
International
Opportunities
Fund | | Columbia
Multi-Advisor
International
Equity
Fund | |
Net Realized and Unrealized Gain (Loss)
on Investments and Foreign Currency | |
| Net realized gain (loss) on: | |
| Investments | | | (35,214,738 | ) | | | — | | | | (2,107,648 | ) | | | (807,383,069 | ) | | | (530,521,612 | ) | |
| Foreign currency transactions | | | (52,294 | ) | | | — | | | | (2,574 | ) | | | (2,082,850 | ) | | | (1,453,592 | ) | |
| Allocated from Master Portfolio: | |
| Investments | | | — | | | | 1,681,019 | | | | — | | | | — | | | | — | | |
| Foreign currency transactions | | | — | | | | (1,068,878 | ) | | | — | | | | — | | | | — | | |
| Net realized gain (loss) | | | (35,267,032 | ) | | | 612,141 | | | | (2,110,222 | ) | | | (809,465,919 | ) | | | (531,975,204 | ) | |
Net change in unrealized appreciation
(depreciation) on: | |
| Investments | | | (61,324,339 | ) | | | — | | | | (960,910 | ) | | | (902,126,387 | ) | | | (857,536,605 | ) | |
| Foreign currency translations | | | (25,068 | ) | | | — | | | | (108 | ) | | | (985,055 | ) | | | (563,225 | ) | |
| Allocated from Master Portfolio: | |
| Investments | | | — | | | | (1,063,640,866 | ) | | | — | | | | — | | | | — | | |
| Foreign currency translations | | | — | | | | (2,046 | ) | | | — | | | | — | | | | — | | |
Net change in unrealized
appreciation (depreciation) | | | (61,349,407 | ) | | | (1,063,642,912 | ) | | | (961,018 | ) | | | (903,111,442 | ) | | | (858,099,830 | ) | |
| Net Loss | | | (96,616,439 | ) | | | (1,063,030,771 | ) | | | (3,071,240 | ) | | | (1,712,577,361 | ) | | | (1,390,075,034 | ) | |
| Net Decrease Resulting from Operations | | | (93,059,180 | ) | | | (994,453,009 | ) | | | (3,073,964 | ) | | | (1,683,047,674 | ) | | | (1,343,599,878 | ) | |
See Accompanying Notes to Financial Statements.
44
This page intentionally left blank.
Statements of Changes in Net Assets – International/Global Stock Funds
| Increase (Decrease) in Net Assets | | Columbia
Global Value Fund | | Columbia
International Value Fund | |
| | | Year
Ended
February 28,
2009 ($) | | Year
Ended
February 29,
2008 ($) | | Year
Ended
February 28,
2009 ($) | | Period
April 1, 2007
Through
February 29,
2008 ($)(a) | | Year
Ended
March 31,
2007 ($) | |
| Operations | |
| Net investment income (loss) | | | 3,557,259 | | | | 4,494,028 | | | | 68,577,762 | (c) | | | 98,584,032 | (c) | | | 49,800,001 | (c) | |
| Net realized gain (loss) on investments and foreign currency transactions | | | (35,267,032 | ) | | | 76,289,565 | | | | 612,141 | (c) | | | 699,612,547 | (c) | | | 527,564,282 | (c) | |
| Net change in unrealized appreciation (depreciation) on investments and foreign currency translations | | | (61,349,407 | ) | | | (109,491,579 | ) | | | (1,063,642,912 | )(c) | | | (1,006,343,991 | )(c) | | | 153,551,812 | (c) | |
| Net increase (decrease) resulting from operations | | | (93,059,180 | ) | | | (28,707,986 | ) | | | (994,453,009 | ) | | | (208,147,412 | ) | | | 730,916,095 | | |
| Distributions to Shareholders | |
| From net investment income: | |
| Class A | | | — | | | | (1,567,658 | ) | | | (15,716,871 | ) | | | (27,918,974 | ) | | | (14,062,577 | ) | |
| Class B | | | — | | | | (249,270 | ) | | | (961,592 | ) | | | (1,850,854 | ) | | | (831,862 | ) | |
| Class C | | | — | | | | (780,753 | ) | | | (2,426,795 | ) | | | (3,327,093 | ) | | | (1,277,433 | ) | |
| Class R | | | — | | | | — | | | | — | | | | — | | | | — | | |
| Class Z | | | (167,262 | ) | | | (1,934,018 | ) | | | (48,475,840 | ) | | | (67,852,888 | ) | | | (38,271,216 | ) | |
| From net realized gains: | |
| Class A | | | (6,633,069 | ) | | | (23,179,285 | ) | | | (70,649,622 | ) | | | (208,438,120 | ) | | | (133,186,314 | ) | |
| Class B | | | (1,846,971 | ) | | | (6,609,269 | ) | | | (4,728,265 | ) | | | (18,635,133 | ) | | | (14,213,607 | ) | |
| Class C | | | (5,823,816 | ) | | | (20,675,384 | ) | | | (10,603,426 | ) | | | (31,809,203 | ) | | | (21,458,685 | ) | |
| Class R | | | — | | | | — | | | | — | | | | — | | | | — | | |
| Class Z | | | (4,631,685 | ) | | | (23,227,721 | ) | | | (153,916,735 | ) | | | (482,123,535 | ) | | | (327,372,752 | ) | |
| From return of capital: | |
| Class A | | | — | | | | — | | | | (287,483 | ) | | | — | | | | — | | |
| Class B | | | — | | | | — | | | | (21,779 | ) | | | — | | | | — | | |
| Class C | | | — | | | | — | | | | (46,825 | ) | | | — | | | | — | | |
| Class Z | | | — | | | | — | | | | (732,864 | ) | | | — | | | | — | | |
| Total distributions to shareholders | | | (19,102,803 | ) | | | (78,223,358 | ) | | | (308,568,097 | ) | | | (841,955,800 | ) | | | (550,674,446 | ) | |
| Net Capital Stock Transactions | | | (69,889,382 | ) | | | (7,040,838 | ) | | | (491,788,857 | ) | | | (8,396,283 | ) | | | (52,838,946 | ) | |
| Redemption Fees | | | 1,213 | | | | 2,569 | | | | 46,200 | | | | 46,621 | | | | 23,212 | | |
| Net increase (decrease) in net assets | | | (182,050,152 | ) | | | (113,969,613 | ) | | | (1,794,763,763 | ) | | | (1,058,452,874 | ) | | | 127,425,915 | | |
| Net Assets | |
| Beginning of period | | | 247,478,823 | | | | 361,448,436 | | | | 2,948,474,675 | | | | 4,006,927,549 | | | | 3,879,501,634 | | |
| End of period | | | 65,428,671 | | | | 247,478,823 | | | | 1,153,710,912 | | | | 2,948,474,675 | | | | 4,006,927,549 | | |
| Undistributed (Overdistributed) net investment income, at end of period | | | 3,424,873 | | | | 136,018 | | | | (418,865 | ) | | | (639,760 | ) | | | (868,572 | ) | |
| Accumulated net investment loss, at end of period | | | — | | | | — | | | | — | | | | — | | | | — | | |
(a) The Fund changed its fiscal year end from March 31 to February 29.
(b) The Fund commenced operations on April 30, 2008.
(c) Allocated from Master Portfolio.
See Accompanying Notes to Financial Statements.
46
| Increase (Decrease) in Net Assets | | Columbia
Marsico
Global Fund | | Columbia
Marsico International
Opportunities Fund | | Columbia Multi-Advisor
International Equity Fund | |
| | | Period
Ended
February 28,
2009 ($)(b) | | Year
Ended
February 28,
2009 ($) | | Year
Ended
February 29,
2008 ($) | | Year
Ended
February 28,
2009 ($) | | Year
Ended
February 29,
2008 ($) | |
| Operations | |
| Net investment income (loss) | | | (2,724 | ) | | | 29,529,687 | | | | 36,955,043 | | | | 46,475,156 | | | | 47,405,791 | | |
| Net realized gain (loss) on investments and foreign currency transactions | | | (2,110,222 | ) | | | (809,465,919 | ) | | | 307,575,410 | | | | (531,975,204 | ) | | | 250,994,849 | | |
| Net change in unrealized appreciation (depreciation) on investments and foreign currency translations | | | (961,018 | ) | | | (903,111,442 | ) | | | (25,235,273 | ) | | | (858,099,830 | ) | | | (161,536,794 | ) | |
| Net increase (decrease) resulting from operations | | | (3,073,964 | ) | | | (1,683,047,674 | ) | | | 319,295,180 | | | | (1,343,599,878 | ) | | | 136,863,846 | | |
| Distributions to Shareholders | |
| From net investment income: | |
| Class A | | | — | | | | — | | | | (6,000,204 | ) | | | (158,648 | ) | | | (686,104 | ) | |
| Class B | | | — | | | | — | | | | (182,059 | ) | | | — | | | | (37,636 | ) | |
| Class C | | | — | | | | — | | | | (427,958 | ) | | | — | | | | (39,622 | ) | |
| Class R | | | — | | | | — | | | | (28,304 | ) | | | (528 | ) | | | (2,602 | ) | |
| Class Z | | | — | | | | — | | | | (31,597,573 | ) | | | (16,730,152 | ) | | | (46,387,190 | ) | |
| From net realized gains: | |
| Class A | | | — | | | | (5,202,687 | ) | | | (63,183,126 | ) | | | (512,920 | ) | | | (5,210,962 | ) | |
| Class B | | | — | | | | (370,849 | ) | | | (5,237,440 | ) | | | (40,298 | ) | | | (506,006 | ) | |
| Class C | | | — | | | | (963,694 | ) | | | (12,094,981 | ) | | | (50,546 | ) | | | (509,045 | ) | |
| Class R | | | — | | | | (34,263 | ) | | | (362,700 | ) | | | (2,479 | ) | | | (16,475 | ) | |
| Class Z | | | — | | | | (20,805,912 | ) | | | (282,135,527 | ) | | | (31,250,024 | ) | | | (303,780,102 | ) | |
| From return of capital: | |
| Class A | | | — | | | | — | | | | — | | | | — | | | | — | | |
| Class B | | | — | | | | — | | | | — | | | | — | | | | — | | |
| Class C | | | — | | | | — | | | | — | | | | — | | | | — | | |
| Class Z | | | — | | | | — | | | | — | | | | — | | | | — | | |
| Total distributions to shareholders | | | — | | | | (27,377,405 | ) | | | (401,249,872 | ) | | | (48,745,595 | ) | | | (357,175,744 | ) | |
| Net Capital Stock Transactions | | | 6,400,396 | | | | (459,278,854 | ) | | | 425,971,698 | | | | (31,050,681 | ) | | | 414,955,380 | | |
| Redemption Fees | | | 217 | | | | 235,668 | | | | 171,065 | | | | 166,089 | | | | 100,210 | | |
| Net increase (decrease) in net assets | | | 3,326,649 | | | | (2,169,468,265 | ) | | | 344,188,071 | | | | (1,423,230,065 | ) | | | 194,743,692 | | |
| Net Assets | |
| Beginning of period | | | — | | | | 3,248,089,343 | | | | 2,903,901,272 | | | | 2,598,321,829 | | | | 2,403,578,137 | | |
| End of period | | | 3,326,649 | | | | 1,078,621,078 | | | | 3,248,089,343 | | | | 1,175,091,764 | | | | 2,598,321,829 | | |
| Undistributed (Overdistributed) net investment income, at end of period | | | — | | | | 26,783,663 | | | | (243,027 | ) | | | 29,410,962 | | | | 1,525,298 | | |
| Accumulated net investment loss, at end of period | | | (86 | ) | | | — | | | | — | | | | — | | | | — | | |
See Accompanying Notes to Financial Statements.
47
Statements of Changes in Net Assets – Capital Stock Activity
| | | Columbia Global Value Fund | |
| | | Year Ended
February 28, 2009 | | Year Ended
February 29, 2008 | |
| | | Shares | | Dollars ($) | | Shares | | Dollars ($) | |
| Class A | |
| Subscriptions | | | 865,805 | | | | 6,593,927 | | | | 1,068,641 | | | | 12,280,663 | | |
| Distributions reinvested | | | 517,133 | | | | 4,219,803 | | | | 1,409,664 | | | | 15,698,266 | | |
| Redemptions | | | (6,655,682 | ) | | | (40,173,276 | ) | | | (1,839,496 | ) | | | (22,637,914 | ) | |
| Net increase (decrease) | | | (5,272,744 | ) | | | (29,359,546 | ) | | | 638,809 | | | | 5,341,015 | | |
| Class B | |
| Subscriptions | | | 42,932 | | | | 335,049 | | | | 122,757 | | | | 1,334,049 | | |
| Distributions reinvested | | | 177,419 | | | | 1,396,290 | | | | 469,136 | | | | 5,100,186 | | |
| Redemptions | | | (893,872 | ) | | | (5,834,103 | ) | | | (542,419 | ) | | | (6,566,242 | ) | |
| Net increase (decrease) | | | (673,521 | ) | | | (4,102,764 | ) | | | 49,474 | | | | (132,007 | ) | |
| Class C | |
| Subscriptions | | | 215,776 | | | | 1,698,276 | | | | 608,059 | | | | 6,607,458 | | |
| Distributions reinvested | | | 492,408 | | | | 3,875,249 | | | | 1,269,712 | | | | 13,771,241 | | |
| Redemptions | | | (3,337,025 | ) | | | (21,170,736 | ) | | | (1,299,441 | ) | | | (14,921,991 | ) | |
| Net increase (decrease) | | | (2,628,841 | ) | | | (15,597,211 | ) | | | 578,330 | | | | 5,456,708 | | |
| Class Z | |
| Subscriptions | | | 1,946,837 | | | | 8,797,728 | | | | 174,778 | | | | 2,476,861 | | |
| Distributions reinvested | | | 141,253 | | | | 1,159,690 | | | | 523,401 | | | | 5,903,524 | | |
| Redemptions | | | (4,269,948 | ) | | | (30,787,279 | ) | | | (2,240,452 | ) | | | (26,086,939 | ) | |
| Net decrease | | | (2,181,858 | ) | | | (20,829,861 | ) | | | (1,542,273 | ) | | | (17,706,554 | ) | |
(a) The Fund changed its fiscal year end from March 31 to February 29.
See Accompanying Notes to Financial Statements.
48
| | | Columbia International Value Fund | |
| | | Year Ended
February 28, 2009 | | Period April 1, 2007
through
February 29, 2008 (a) | | Year Ended
March 31, 2007 | |
| | | Shares | | Dollars ($) | | Shares | | Dollars ($) | | Shares | | Dollars ($) | |
| Class A | |
| Subscriptions | | | 5,188,262 | | | | 80,701,279 | | | | 6,963,850 | | | | 167,927,752 | | | | 8,880,356 | | | | 221,294,787 | | |
| Distributions reinvested | | | 4,682,704 | | | | 72,546,804 | | | | 9,033,316 | | | | 200,011,381 | | | | 5,124,801 | | | | 122,140,018 | | |
| Redemptions | | | (30,092,388 | ) | | | (455,400,344 | ) | | | (11,402,581 | ) | | | (269,881,480 | ) | | | (13,194,201 | ) | | | (330,986,223 | ) | |
| Net increase (decrease) | | | (20,221,422 | ) | | | (302,152,261 | ) | | | 4,594,585 | | | | 98,057,653 | | | | 810,956 | | | | 12,448,582 | | |
| Class B | |
| Subscriptions | | | 45,185 | | | | 681,538 | | | | 109,653 | | | | 2,387,237 | | | | 78,369 | | | | 1,825,379 | | |
| Distributions reinvested | | | 314,164 | | | | 4,676,823 | | | | 769,033 | | | | 16,698,978 | | | | 527,817 | | | | 12,265,228 | | |
| Redemptions | | | (1,870,593 | ) | | | (28,024,189 | ) | | | (1,659,578 | ) | | | (38,345,749 | ) | | | (935,890 | ) | | | (22,742,025 | ) | |
| Net increase (decrease) | | | (1,511,244 | ) | | | (22,665,828 | ) | | | (780,892 | ) | | | (19,259,534 | ) | | | (329,704 | ) | | | (8,651,418 | ) | |
| Class C | |
| Subscriptions | | | 242,479 | | | | 3,574,333 | | | | 468,652 | | | | 10,111,547 | | | | 309,929 | | | | 7,245,205 | | |
| Distributions reinvested | | | 597,194 | | | | 8,774,413 | | | | 1,073,059 | | | | 23,122,601 | | | | 659,733 | | | | 15,324,874 | | |
| Redemptions | | | (2,276,085 | ) | | | (31,995,645 | ) | | | (1,346,352 | ) | | | (31,293,914 | ) | | | (1,135,070 | ) | | | (27,767,999 | ) | |
| Net increase (decrease) | | | (1,436,412 | ) | | | (19,646,899 | ) | | | 195,359 | | | | 1,940,234 | | | | (165,408 | ) | | | (5,197,920 | ) | |
| Class Z | |
| Subscriptions | | | 23,409,638 | | | | 347,508,796 | | | | 3,639,693 | | | | 86,356,426 | | | | 1,879,407 | | | | 46,956,866 | | |
| Distributions reinvested | | | 8,033,128 | | | | 120,862,229 | | | | 13,242,447 | | | | 296,255,061 | | | | 7,900,734 | | | | 189,194,368 | | |
| Redemptions | | | (41,267,291 | ) | | | (615,694,894 | ) | | | (19,414,198 | ) | | | (471,746,123 | ) | | | (11,511,055 | ) | | | (287,589,424 | ) | |
| Net decrease | | | (9,824,525 | ) | | | (147,323,869 | ) | | | (2,532,058 | ) | | | (89,134,636 | ) | | | (1,730,914 | ) | | | (51,438,190 | ) | |
See Accompanying Notes to Financial Statements.
49
Statements of Changes in Net Assets – Capital Stock Activity
| | | Columbia Marsico Global Fund | | Columbia Marsico International Opportunities Fund | |
| | | Period Ended
February 28, 2009 (a) | | Year Ended
February 28, 2009 | | Year Ended
February 29, 2008 | |
| | | Shares | | Dollars ($) | | Shares | | Dollars ($) | | Shares | | Dollars ($) | |
| Class A | |
| Subscriptions | | | 241,432 | | | | 2,213,067 | | | | 13,475,313 | | | | 159,192,848 | | | | 15,417,945 | | | | 245,380,080 | | |
| Distributions reinvested | | | — | | | | — | | | | 327,476 | | | | 4,754,957 | | | | 3,961,661 | | | | 62,848,181 | | |
| Redemptions | | | (17,972 | ) | | | (115,674 | ) | | | (25,620,827 | ) | | | (233,324,059 | ) | | | (8,697,841 | ) | | | (136,048,578 | ) | |
| Net increase (decrease) | | | 223,460 | | | | 2,097,393 | | | | (11,818,038 | ) | | | (69,376,254 | ) | | | 10,681,765 | | | | 172,179,683 | | |
| Class B | |
| Subscriptions | | | — | | | | — | | | | 331,625 | | | | 3,946,145 | | | | 618,773 | | | | 9,325,803 | | |
| Distributions reinvested | | | — | | | | — | | | | 23,218 | | | | 320,175 | | | | 303,053 | | | | 4,580,606 | | |
| Redemptions | | | — | | | | — | | | | (1,147,897 | ) | | | (11,572,046 | ) | | | (611,315 | ) | | | (9,240,833 | ) | |
| Net increase (decrease) | | | — | | | | — | | | | (793,054 | ) | | | (7,305,726 | ) | | | 310,511 | | | | 4,665,576 | | |
| Class C | |
| Subscriptions | | | 191,782 | | | | 1,718,833 | | | | 1,236,446 | | | | 14,495,661 | | | | 2,443,130 | | | | 36,990,703 | | |
| Distributions reinvested | | | — | | | | — | | | | 51,163 | | | | 705,538 | | | | 581,617 | | | | 8,799,576 | | |
| Redemptions | | | (12,613 | ) | | | (88,797 | ) | | | (3,125,022 | ) | | | (29,145,367 | ) | | | (1,211,536 | ) | | | (18,180,319 | ) | |
| Net increase (decrease) | | | 179,169 | | | | 1,630,036 | | | | (1,837,413 | ) | | | (13,944,168 | ) | | | 1,813,211 | | | | 27,609,960 | | |
| Class R | |
| Subscriptions | | | 125,032 | | | | 1,250,177 | | | | 282,635 | | | | 3,014,362 | | | | 220,431 | | | | 3,443,611 | | |
| Distributions reinvested | | | — | | | | — | | | | 2,314 | | | | 33,555 | | | | 24,255 | | | | 384,691 | | |
| Redemptions | | | — | | | | — | | | | (155,739 | ) | | | (1,676,928 | ) | | | (126,202 | ) | | | (2,014,871 | ) | |
| Net increase | | | 125,032 | | | | 1,250,177 | | | | 129,210 | | | | 1,370,989 | | | | 118,484 | | | | 1,813,431 | | |
| Class Z | |
| Subscriptions | | | 141,647 | | | | 1,422,790 | | | | 29,968,893 | | | | 355,905,964 | | | | 34,078,759 | | | | 544,925,397 | | |
| Distributions reinvested | | | — | | | | — | | | | 459,765 | | | | 6,781,537 | | | | 5,717,686 | | | | 91,962,656 | | |
| Redemptions | | | — | | | | — | | | | (78,938,540 | ) | | | (732,711,196 | ) | | | (25,785,783 | ) | | | (417,185,005 | ) | |
| Net increase (decrease) | | | 141,647 | | | | 1,422,790 | | | | (48,509,882 | ) | | | (370,023,695 | ) | | | 14,010,662 | | | | 219,703,048 | | |
(a) The Fund commenced operations on April 30, 2008.
See Accompanying Notes to Financial Statements.
50
| | | Columbia Multi-Advisor International Equity Fund | |
| | | Year Ended
February 28, 2009 | | Year Ended
February 29, 2008 | |
| | | Shares | | Dollars ($) | | Shares | | Dollars ($) | |
| Class A | |
| Subscriptions | | | 303,061 | | | | 4,101,058 | | | | 279,307 | | | | 5,013,967 | | |
| Distributions reinvested | | | 42,175 | | | | 554,054 | | | | 274,882 | | | | 4,766,717 | | |
| Redemptions | | | (710,083 | ) | | | (7,743,019 | ) | | | (416,613 | ) | | | (7,445,176 | ) | |
| Net increase (decrease) | | | (364,847 | ) | | | (3,087,907 | ) | | | 137,576 | | | | 2,335,508 | | |
| Class B | |
| Subscriptions | | | 30,582 | | | | 351,078 | | | | 42,538 | | | | 694,899 | | |
| Distributions reinvested | | | 2,408 | | | | 34,273 | | | | 28,416 | | | | 454,115 | | |
| Redemptions | | | (117,000 | ) | | | (1,367,398 | ) | | | (114,525 | ) | | | (1,882,359 | ) | |
| Net increase (decrease) | | | (84,010 | ) | | | (982,047 | ) | | | (43,571 | ) | | | (733,345 | ) | |
| Class C | |
| Subscriptions | | | 38,313 | | | | 416,847 | | | | 63,769 | | | | 1,039,478 | | |
| Distributions reinvested | | | 2,181 | | | | 30,637 | | | | 20,804 | | | | 328,159 | | |
| Redemptions | | | (110,481 | ) | | | (1,137,680 | ) | | | (38,964 | ) | | | (628,565 | ) | |
| Net increase (decrease) | | | (69,987 | ) | | | (690,196 | ) | | | 45,609 | | | | 739,072 | | |
| Class R | |
| Subscriptions | | | 3,071 | | | | 34,167 | | | | 10,813 | | | | 192,947 | | |
| Distributions reinvested | | | 177 | | | | 2,416 | | | | 944 | | | | 16,160 | | |
| Redemptions | | | (688 | ) | | | (7,675 | ) | | | — | | | | — | | |
| Net increase | | | 2,560 | | | | 28,908 | | | | 11,757 | | | | 209,107 | | |
| Class Z | |
| Subscriptions | | | 38,249,816 | | | | 449,368,814 | | | | 29,780,555 | | | | 529,844,907 | | |
| Distributions reinvested | | | 1,836,310 | | | | 23,496,332 | | | | 9,513,725 | | | | 166,769,150 | | |
| Redemptions | | | (46,138,899 | ) | | | (499,184,585 | ) | | | (15,647,030 | ) | | | (284,209,019 | ) | |
| Net increase (decrease) | | | (6,052,773 | ) | | | (26,319,439 | ) | | | 23,647,250 | | | | 412,405,038 | | |
See Accompanying Notes to Financial Statements.
51
Financial Highlights – Columbia Global Value Fund
Selected data for a share outstanding throughout each period is as follows:
| | | Year
Ended
February 28, | | Year
Ended
February 29, | | Period
Ended
February 28, | | Year Ended March 31, | |
| Class A Shares | | 2009 | | 2008 | | 2007 (a) | | 2006 (b) | | 2005 | | 2004 | |
| Net Asset Value, Beginning of Period | | $ | 9.33 | | | $ | 13.43 | | | $ | 12.64 | | | $ | 11.98 | | | $ | 12.04 | | | $ | 7.18 | | |
| Income from Investment Operations: | |
| Net investment income (c) | | | 0.18 | | | | 0.19 | (d) | | | 0.14 | | | | 0.16 | | | | 0.11 | | | | 0.05 | | |
Net realized and unrealized gain (loss)
on investments and foreign currency | | | (4.58 | ) | | | (1.21 | ) | | | 2.07 | | | | 1.76 | | | | 0.85 | | | | 4.96 | | |
| Total from investment operations | | | (4.40 | ) | | | (1.02 | ) | | | 2.21 | | | | 1.92 | | | | 0.96 | | | | 5.01 | | |
| Less Distributions to Shareholders: | |
| From net investment income | | | — | | | | (0.19 | ) | | | (0.12 | ) | | | (0.17 | ) | | | (0.11 | ) | | | (0.04 | ) | |
| From net realized gains | | | (0.79 | ) | | | (2.89 | ) | | | (1.30 | ) | | | (1.09 | ) | | | (0.91 | ) | | | (0.11 | ) | |
| Total distributions to shareholders | | | (0.79 | ) | | | (3.08 | ) | | | (1.42 | ) | | | (1.26 | ) | | | (1.02 | ) | | | (0.15 | ) | |
| Redemption Fees: | |
| Redemption fees added to paid-in-capital (e) | | | — | | | | — | | | | — | | | | — | | | | — | | | | — | | |
| Net Asset Value, End of Period | | $ | 4.14 | | | $ | 9.33 | | | $ | 13.43 | | | $ | 12.64 | | | $ | 11.98 | | | $ | 12.04 | | |
| Total return (f) | | | (51.34 | )%(g) | | | (10.43 | )%(g) | | | 19.27 | %(g)(h) | | | 16.97 | % | | | 8.64 | % | | | 70.00 | % | |
Ratios to Average Net Assets/
Supplemental Data: | |
| Net expenses before interest expense (i) | | | 1.60 | % | | | 1.51 | % | | | 1.53 | %(j) | | | 1.45 | % | | | 1.52 | % | | | 1.55 | % | |
| Interest expense | | | — | %(k) | | | — | %(k) | | | — | %(j)(k) | | | — | %(k) | | | — | | | | — | | |
| Net expenses (i) | | | 1.60 | % | | | 1.51 | % | | | 1.53 | %(j) | | | 1.45 | % | | | 1.52 | % | | | 1.55 | % | |
| Waiver/Reimbursement | | | 0.03 | % | | | 0.01 | % | | | 0.01 | %(j) | | | — | | | | — | | | | — | | |
| Net investment income | | | 2.45 | %(i) | | | 1.50 | %(i) | | | 1.17 | %(j) | | | 1.32 | % | | | 0.94 | % | | | 0.44 | % | |
| Portfolio turnover rate | | | 10 | % | | | 38 | % | | | 12 | %(h) | | | 16 | % | | | 18 | % | | | 28 | % | |
| Net assets, end of period (000's) | | $ | 16,031 | | | $ | 85,257 | | | $ | 114,224 | | | $ | 119,611 | | | $ | 126,679 | | | $ | 127,609 | | |
(a) The Fund changed its fiscal year end from March 31 to February 28. Per share data and total return reflect activity from April 1, 2006 through February 28, 2007.
(b) On August 22, 2005, the Fund's Investor A shares were renamed Class A shares.
(c) Per share data was calculated using the average shares outstanding during the period.
(d) Net investment income per share reflects a special dividend. The effect of this dividend amounted to $0.05 per share.
(e) Rounds to less than $0.01 per share.
(f) Total return at net asset value assuming all distributions reinvested and no initial sales charge or contingent deferred sales charge.
(g) Had the investment advisor and/or any of its affiliates not waived fees or reimbursed a portion of expenses, total return would have been reduced.
(h) Not annualized.
(i) The benefits derived from expense reductions had an impact of less than 0.01%.
(j) Annualized.
(k) Rounds to less than 0.01%.
See Accompanying Notes to Financial Statements.
52
Financial Highlights – Columbia Global Value Fund
Selected data for a share outstanding throughout each period is as follows:
| | | Year
Ended
February 28, | | Year
Ended
February 29, | | Period
Ended
February 28, | | Year Ended March 31, | |
| Class B Shares | | 2009 | | 2008 | | 2007 (a) | | 2006 (b) | | 2005 | | 2004 | |
| Net Asset Value, Beginning of Period | | $ | 9.05 | | | $ | 13.12 | | | $ | 12.40 | | | $ | 11.78 | | | $ | 11.86 | | | $ | 7.11 | | |
| Income from Investment Operations: | |
| Net investment income (loss) (c) | | | 0.12 | | | | 0.10 | (d) | | | 0.05 | | | | 0.07 | | | | 0.02 | | | | (0.03 | ) | |
Net realized and unrealized gain (loss)
on investments and foreign currency | | | (4.40 | ) | | | (1.17 | ) | | | 2.02 | | | | 1.71 | | | | 0.84 | | | | 4.89 | | |
| Total from investment operations | | | (4.28 | ) | | | (1.07 | ) | | | 2.07 | | | | 1.78 | | | | 0.86 | | | | 4.86 | | |
| Less Distributions to Shareholders: | |
| From net investment income | | | — | | | | (0.11 | ) | | | (0.05 | ) | | | (0.07 | ) | | | (0.03 | ) | | | — | | |
| From net realized gains | | | (0.79 | ) | | | (2.89 | ) | | | (1.30 | ) | | | (1.09 | ) | | | (0.91 | ) | | | (0.11 | ) | |
| Total distributions to shareholders | | | (0.79 | ) | | | (3.00 | ) | | | (1.35 | ) | | | (1.16 | ) | | | (0.94 | ) | | | (0.11 | ) | |
| Redemption Fees: | |
| Redemption fees added to paid-in-capital | | | — | (e) | | | — | (e) | | | — | (e) | | | — | (e) | | | — | | | | — | (e) | |
| Net Asset Value, End of Period | | $ | 3.98 | | | $ | 9.05 | | | $ | 13.12 | | | $ | 12.40 | | | $ | 11.78 | | | $ | 11.86 | | |
| Total return (f) | | | (51.61 | )%(g) | | | (11.08 | )%(g) | | | 18.44 | %(g)(h) | | | 16.08 | % | | | 7.85 | % | | | 68.56 | % | |
Ratios to Average Net Assets/
Supplemental Data: | |
| Net expenses before interest expense (i) | | | 2.35 | % | | | 2.26 | % | | | 2.28 | %(j) | | | 2.20 | % | | | 2.27 | % | | | 2.30 | % | |
| Interest expense | | | — | %(k) | | | — | %(k) | | | — | %(j)(k) | | | — | %(k) | | | — | | | | — | | |
| Net expenses (i) | | | 2.35 | % | | | 2.26 | % | | | 2.28 | %(j) | | | 2.20 | % | | | 2.27 | % | | | 2.30 | % | |
| Waiver/Reimbursement | | | 0.03 | % | | | 0.01 | % | | | 0.01 | %(j) | | | — | | | | — | | | | — | | |
| Net investment income (loss) | | | 1.67 | %(i) | | | 0.76 | %(i) | | | 0.41 | %(j) | | | 0.58 | % | | | 0.19 | % | | | (0.31 | )% | |
| Portfolio turnover rate | | | 10 | % | | | 38 | % | | | 12 | %(h) | | | 16 | % | | | 18 | % | | | 28 | % | |
| Net assets, end of period (000's) | | $ | 7,408 | | | $ | 22,943 | | | $ | 32,635 | | | $ | 32,564 | | | $ | 34,324 | | | $ | 35,343 | | |
(a) The Fund changed its fiscal year end from March 31 to February 28. Per share data and total return reflect activity from April 1, 2006 through February 28, 2007.
(b) On August 22, 2005, the Fund's Investor B shares were renamed Class B shares.
(c) Per share data was calculated using the average shares outstanding during the period.
(d) Net investment income per share reflects a special dividend. The effect of this dividend amounted to $0.05 per share.
(e) Rounds to less than $0.01 per share.
(f) Total return at net asset value assuming all distributions reinvested and no contingent deferred sales charge.
(g) Had the investment advisor and/or any of its affiliates not waived fees or reimbursed a portion of expenses, total return would have been reduced.
(h) Not annualized.
(i) The benefits derived from expense reductions had an impact of less than 0.01%.
(j) Annualized.
(k) Rounds to less than 0.01%.
See Accompanying Notes to Financial Statements.
53
Financial Highlights – Columbia Global Value Fund
Selected data for a share outstanding throughout each period is as follows:
| | | Year
Ended
February 28, | | Year
Ended
February 29, | | Period
Ended
February 28, | | Year Ended March 31, | |
| Class C Shares | | 2009 | | 2008 | | 2007 (a) | | 2006 (b) | | 2005 | | 2004 | |
| Net Asset Value, Beginning of Period | | $ | 9.05 | | | $ | 13.13 | | | $ | 12.41 | | | $ | 11.78 | | | $ | 11.86 | | | $ | 7.11 | | |
| Income from Investment Operations: | |
| Net investment income (loss) (c) | | | 0.12 | | | | 0.09 | (d) | | | 0.04 | | | | 0.07 | | | | 0.02 | | | | (0.03 | ) | |
Net realized and unrealized gain (loss)
on investments and foreign currency | | | (4.40 | ) | | | (1.17 | ) | | | 2.03 | | | | 1.72 | | | | 0.84 | | | | 4.89 | | |
| Total from investment operations | | | (4.28 | ) | | | (1.08 | ) | | | 2.07 | | | | 1.79 | | | | 0.86 | | | | 4.86 | | |
| Less Distributions to Shareholders: | |
| From net investment income | | | — | | | | (0.11 | ) | | | (0.05 | ) | | | (0.07 | ) | | | (0.03 | ) | | | — | | |
| From net realized gains | | | (0.79 | ) | | | (2.89 | ) | | | (1.30 | ) | | | (1.09 | ) | | | (0.91 | ) | | | (0.11 | ) | |
| Total distributions to shareholders | | | (0.79 | ) | | | (3.00 | ) | | | (1.35 | ) | | | (1.16 | ) | | | (0.94 | ) | | | (0.11 | ) | |
| Redemption Fees: | |
| Redemption fees added to paid-in-capital | | | — | (e) | | | — | (e) | | | — | (e) | | | — | (e) | | | — | | | | — | (e) | |
| Net Asset Value, End of Period | | $ | 3.98 | | | $ | 9.05 | | | $ | 13.13 | | | $ | 12.41 | | | $ | 11.78 | | | $ | 11.86 | | |
| Total return (f) | | | (51.61 | )%(g) | | | (11.14 | )%(g) | | | 18.44 | %(g)(h) | | | 16.16 | % | | | 7.84 | % | | | 68.56 | % | |
Ratios to Average Net Assets/
Supplemental Data: | |
| Net expenses before interest expense (i) | | | 2.35 | % | | | 2.26 | % | | | 2.28 | %(j) | | | 2.20 | % | | | 2.27 | % | | | 2.30 | % | |
| Interest expense | | | — | %(k) | | | — | %(k) | | | — | %(j)(k) | | | — | %(k) | | | — | | | | — | | |
| Net expenses (i) | | | 2.35 | % | | | 2.26 | % | | | 2.28 | %(j) | | | 2.20 | % | | | 2.27 | % | | | 2.30 | % | |
| Waiver/Reimbursement | | | 0.03 | % | | | 0.01 | % | | | 0.01 | %(j) | | | — | | | | — | | | | — | | |
| Net investment income (loss) | | | 1.69 | %(i) | | | 0.74 | %(i) | | | 0.39 | %(j) | | | 0.58 | % | | | 0.19 | % | | | (0.31 | )% | |
| Portfolio turnover rate | | | 10 | % | | | 38 | % | | | 12 | %(h) | | | 16 | % | | | 18 | % | | | 28 | % | |
| Net assets, end of period (000's) | | $ | 21,375 | | | $ | 72,405 | | | $ | 97,465 | | | $ | 92,558 | | | $ | 98,850 | | | $ | 101,025 | | |
(a) The Fund changed its fiscal year end from March 31 to February 28. Per share data and total return reflect activity from April 1, 2006 through February 28, 2007.
(b) On August 22, 2005, the Fund's Investor C shares were renamed Class C shares.
(c) Per share data was calculated using the average shares outstanding during the period.
(d) Net investment income per share reflects a special dividend. The effect of this dividend amounted to $0.05 per share.
(e) Rounds to less than $0.01 per share.
(f) Total return at net asset value assuming all distributions reinvested and no contingent deferred sales charge.
(g) Had the investment advisor and/or any of its affiliates not waived fees or reimbursed a portion of expenses, total return would have been reduced.
(h) Not annualized.
(i) The benefits derived from expense reductions had an impact of less than 0.01%.
(j) Annualized.
(k) Rounds to less than 0.01%.
See Accompanying Notes to Financial Statements.
54
Financial Highlights – Columbia Global Value Fund
Selected data for a share outstanding throughout each period is as follows:
| | | Year
Ended
February 28, | | Year
Ended
February 29, | | Period
Ended
February 28, | | Year Ended March 31, | |
| Class Z Shares | | 2009 | | 2008 | | 2007 (a) | | 2006 (b) | | 2005 | | 2004 | |
| Net Asset Value, Beginning of Period | | $ | 9.40 | | | $ | 13.53 | | | $ | 12.72 | | | $ | 12.04 | | | $ | 12.10 | | | $ | 7.21 | | |
| Income from Investment Operations: | |
| Net investment income (c) | | | 0.21 | | | | 0.23 | (d) | | | 0.17 | | | | 0.20 | | | | 0.14 | | | | 0.07 | | |
Net realized and unrealized gain (loss)
on investments and foreign currency | | | (4.61 | ) | | | (1.23 | ) | | | 2.09 | | | | 1.77 | | | | 0.85 | | | | 4.99 | | |
| Total from investment operations | | | (4.40 | ) | | | (1.00 | ) | | | 2.26 | | | | 1.97 | | | | 0.99 | | | | 5.06 | | |
| Less Distributions to Shareholders: | |
| From net investment income | | | (0.03 | ) | | | (0.24 | ) | | | (0.15 | ) | | | (0.20 | ) | | | (0.14 | ) | | | (0.06 | ) | |
| From net realized gains | | | (0.79 | ) | | | (2.89 | ) | | | (1.30 | ) | | | (1.09 | ) | | | (0.91 | ) | | | (0.11 | ) | |
| Total distributions to shareholders | | | (0.82 | ) | | | (3.13 | ) | | | (1.45 | ) | | | (1.29 | ) | | | (1.05 | ) | | | (0.17 | ) | |
| Redemption Fees: | |
| Redemption fees added to paid-in-capital (e) | | | — | | | | — | | | | — | | | | — | | | | — | | | | — | | |
| Net Asset Value, End of Period | | $ | 4.18 | | | $ | 9.40 | | | $ | 13.53 | | | $ | 12.72 | | | $ | 12.04 | | | $ | 12.10 | | |
| Total return (f) | | | (51.10 | )%(g) | | | (10.26 | )%(g) | | | 19.54 | %(g)(h) | | | 17.34 | % | | | 8.84 | % | | | 70.38 | % | |
Ratios to Average Net Assets/
Supplemental Data: | |
| Net expenses before interest expense (i) | | | 1.35 | % | | | 1.26 | % | | | 1.28 | %(j) | | | 1.20 | % | | | 1.27 | % | | | 1.30 | % | |
| Interest expense | | | — | %(k) | | | — | %(k) | | | — | %(j)(k) | | | — | %(k) | | | — | | | | — | | |
| Net expenses (i) | | | 1.35 | % | | | 1.26 | % | | | 1.28 | %(j) | | | 1.20 | % | | | 1.27 | % | | | 1.30 | % | |
| Waiver/Reimbursement | | | 0.03 | % | | | 0.01 | % | | | 0.01 | %(j) | | | — | | | | — | | | | — | | |
| Net investment income | | | 2.81 | %(i) | | | 1.77 | %(i) | | | 1.42 | %(j) | | | 1.60 | % | | | 1.19 | % | | | 0.69 | % | |
| Portfolio turnover rate | | | 10 | % | | | 38 | % | | | 12 | %(h) | | | 16 | % | | | 18 | % | | | 28 | % | |
| Net assets, end of period (000's) | | $ | 20,615 | | | $ | 66,875 | | | $ | 117,125 | | | $ | 117,072 | | | $ | 134,337 | | | $ | 144,242 | | |
(a) The Fund changed its fiscal year end from March 31 to February 28. Per share data and total return reflect activity from April 1, 2006 through February 28, 2007.
(b) On August 22, 2005, the Fund's Primary A shares were renamed Class Z shares.
(c) Per share data was calculated using the average shares outstanding during the period.
(d) Net investment income per share reflects a special dividend. The effect of this dividend amounted to $0.05 per share.
(e) Rounds to less than $0.01 per share.
(f) Total return at net asset value assuming all distributions reinvested.
(g) Had the investment advisor and/or any of its affiliates not waived fees or reimbursed a portion of expenses, total return would have been reduced.
(h) Not annualized.
(i) The benefits derived from expense reductions had an impact of less than 0.01%.
(j) Annualized.
(k) Rounds to less than 0.01%.
See Accompanying Notes to Financial Statements.
55
Financial Highlights – Columbia International Value Fund
Selected data for a share outstanding throughout each period is as follows:
| | | Year
Ended
February 28, | | Period
Ended
February 29, | | Year Ended March 31, | |
| Class A Shares (a) | | 2009 | | 2008 (b) | | 2007 | | 2006 (c) | | 2005 | | 2004 | |
| Net Asset Value, Beginning of Period | | $ | 18.95 | | | $ | 26.02 | | | $ | 24.97 | | | $ | 22.34 | | | $ | 20.64 | | | $ | 11.62 | | |
| Income from Investment Operations: | |
| Net investment income (d) | | | 0.52 | | | | 0.65 | | | | 0.29 | | | | 0.31 | | | | 0.23 | | | | 0.15 | | |
Net realized and unrealized gain (loss)
on investments and foreign currency | | | (7.83 | ) | | | (1.95 | ) | | | 4.34 | | | | 4.73 | | | | 2.51 | | | | 9.04 | | |
| Total from investment operations | | | (7.31 | ) | | | (1.30 | ) | | | 4.63 | | | | 5.04 | | | | 2.74 | | | | 9.19 | | |
| Less Distributions to Shareholders: | |
| From net investment income | | | (0.53 | ) | | | (0.68 | ) | | | (0.34 | ) | | | (0.35 | ) | | | (0.25 | ) | | | (0.17 | ) | |
| From net realized gains | | | (1.70 | ) | | | (5.09 | ) | | | (3.24 | ) | | | (2.06 | ) | | | (0.79 | ) | | | — | | |
| From return of capital | | | (0.01 | ) | | | — | | | | — | | | | — | | | | — | | | | — | | |
| Total distributions to shareholders | | | (2.24 | ) | | | (5.77 | ) | | | (3.58 | ) | | | (2.41 | ) | | | (1.04 | ) | | | (0.17 | ) | |
| Redemption Fees: | |
| Redemption fees added to paid-in-capital (e) | | | — | | | | — | | | | — | | | | — | | | | — | | | | — | | |
| Net Asset Value, End of Period | | $ | 9.40 | | | $ | 18.95 | | | $ | 26.02 | | | $ | 24.97 | | | $ | 22.34 | | | $ | 20.64 | | |
| Total return (f) | | | (42.59 | )% | | | (7.28 | )%(g) | | | 20.46 | % | | | 24.28 | % | | | 13.38 | % | | | 79.17 | % | |
Ratios to Average Net Assets/
Supplemental Data: | |
| Net expenses before interest expense | | | 1.38 | %(h) | | | 1.32 | %(h)(i) | | | 1.30 | %(h) | | | 1.27 | % | | | 1.33 | % | | | 1.36 | % | |
| Interest expense | | | — | %(j) | | | — | %(i)(j) | | | — | %(j) | | | — | %(j) | | | — | | | | — | | |
| Net expenses | | | 1.38 | %(h) | | | 1.32 | %(h)(i) | | | 1.30 | %(h) | | | 1.27 | % | | | 1.33 | % | | | 1.36 | % | |
| Waiver/Reimbursement | | | — | | | | — | | | | — | | | | 0.06 | %(k) | | | 0.07 | %(k) | | | 0.09 | %(k) | |
| Net investment income | | | 3.31 | %(h) | | | 2.71 | %(h)(i) | | | 1.15 | % | | | 1.38 | % | | | 1.10 | % | | | 0.89 | % | |
| Net assets, end of period (000's) | | $ | 241,097 | | | $ | 868,942 | | | $ | 1,073,616 | | | $ | 1,010,361 | | | $ | 906,848 | | | $ | 792,857 | | |
(a) The per share amounts and percentages reflect income and expenses assuming inclusion of the Fund's proportionate share of the income and expenses of Columbia International Value Master Portfolio.
(b) The Fund changed its fiscal year end from March 31 to February 29. Per share data and total return reflect activity from April 1, 2007 through February 29, 2008.
(c) On August 22, 2005, the Fund's Investor A shares were renamed Class A shares.
(d) Per share data was calculated using the average shares outstanding during the period.
(e) Rounds to less than $0.01 per share.
(f) Total return at net asset value assuming all distributions reinvested and no initial sales charge or contingent deferred sales charge.
(g) Not annualized.
(h) The benefits derived from expense reductions had an impact of less than 0.01%.
(i) Annualized.
(j) Rounds to less than 0.01%.
(k) Bank of America Corporation assumed certain non-recurring costs. Absent these non-recurring costs, the waiver/reimbursement ratio would have been -%, 0.04% and 0.06% for the years March 31, 2006, March 31, 2005 and March 31, 2004, respectively.
See Accompanying Notes to Financial Statements.
56
Financial Highlights – Columbia International Value Fund
Selected data for a share outstanding throughout each period is as follows:
| | | Year
Ended
February 28, | | Period
Ended
February 29, | | Year Ended March 31, | |
| Class B Shares (a) | | 2009 | | 2008 (b) | | 2007 | | 2006 (c) | | 2005 | | 2004 | |
| Net Asset Value, Beginning of Period | | $ | 18.39 | | | $ | 25.43 | | | $ | 24.54 | | | $ | 22.00 | | | $ | 20.35 | | | $ | 11.47 | | |
| Income from Investment Operations: | |
| Net investment income (d) | | | 0.37 | | | | 0.49 | | | | 0.11 | | | | 0.15 | | | | 0.08 | | | | 0.02 | | |
Net realized and unrealized gain (loss)
on investments and foreign currency | | | (7.53 | ) | | | (1.91 | ) | | | 4.22 | | | | 4.63 | | | | 2.45 | | | | 8.91 | | |
| Total from investment operations | | | (7.16 | ) | | | (1.42 | ) | | | 4.33 | | | | 4.78 | | | | 2.53 | | | | 8.93 | | |
| Less Distributions to Shareholders: | |
| From net investment income | | | (0.43 | ) | | | (0.53 | ) | | | (0.20 | ) | | | (0.18 | ) | | | (0.09 | ) | | | (0.05 | ) | |
| From net realized gains | | | (1.70 | ) | | | (5.09 | ) | | | (3.24 | ) | | | (2.06 | ) | | | (0.79 | ) | �� | | — | | |
| From return of capital | | | (0.01 | ) | | | — | | | | — | | | | — | | | | — | | | | — | | |
| Total distributions to shareholders | | | (2.14 | ) | | | (5.62 | ) | | | (3.44 | ) | | | (2.24 | ) | | | (0.88 | ) | | | (0.05 | ) | |
| Redemption Fees: | |
| Redemption fees added to paid-in-capital (e) | | | — | | | | — | | | | — | | | | — | | | | — | | | | — | | |
| Net Asset Value, End of Period | | $ | 9.09 | | | $ | 18.39 | | | $ | 25.43 | | | $ | 24.54 | | | $ | 22.00 | | | $ | 20.35 | | |
| Total return (f) | | | (43.01 | )% | | | (7.90 | )%(g) | | | 19.51 | % | | | 23.36 | % | | | 12.54 | % | | | 77.89 | % | |
Ratios to Average Net Assets/
Supplemental Data: | |
| Net expenses before interest expense | | | 2.13 | %(h) | | | 2.07 | %(h)(i) | | | 2.05 | %(h) | | | 2.02 | % | | | 2.08 | % | | | 2.11 | % | |
| Interest expense | | | — | %(j) | | | — | %(i)(j) | | | — | %(j) | | | — | %(j) | | | — | | | | — | | |
| Net expenses | | | 2.13 | %(h) | | | 2.07 | %(h)(i) | | | 2.05 | %(h) | | | 2.02 | % | | | 2.08 | % | | | 2.11 | % | |
| Waiver/Reimbursement | | | — | | | | — | | | | — | | | | 0.06 | %(k) | | | 0.07 | %(k) | | | 0.09 | %(k) | |
| Net investment income | | | 2.43 | %(h) | | | 2.10 | %(h)(i) | | | 0.45 | % | | | 0.67 | % | | | 0.35 | % | | | 0.14 | % | |
| Net assets, end of period (000's) | | $ | 18,743 | | | $ | 65,705 | | | $ | 110,726 | | | $ | 114,932 | | | $ | 111,402 | | | $ | 112,798 | | |
(a) The per share amounts and percentages reflect income and expenses assuming inclusion of the Fund's proportionate share of the income and expenses of Columbia International Value Master Portfolio.
(b) The Fund changed its fiscal year end from March 31 to February 29. Per share data and total return reflect activity from April 1, 2007 through February 29, 2008.
(c) On August 22, 2005, the Fund's Investor B shares were renamed Class B shares.
(d) Per share data was calculated using the average shares outstanding during the period.
(e) Rounds to less than $0.01 per share.
(f) Total return at net asset value assuming all distributions reinvested and no contingent deferred sales charge.
(g) Not annualized.
(h) The benefits derived from expense reductions had an impact of less than 0.01%.
(i) Annualized.
(j) Rounds to less than 0.01%.
(k) Bank of America Corporation assumed certain non-recurring costs. Absent these non-recurring costs, the waiver/reimbursement ratio would have been -%, 0.04% and 0.06% for the years March 31, 2006, March 31, 2005 and March 31, 2004, respectively.
See Accompanying Notes to Financial Statements.
57
Financial Highlights – Columbia International Value Fund
Selected data for a share outstanding throughout each period is as follows:
| | | Year
Ended
February 28, | | Period
Ended
February 29, | | Year Ended March 31, | |
| Class C Shares (a) | | 2009 | | 2008 (b) | | 2007 | | 2006 (c) | | 2005 | | 2004 | |
| Net Asset Value, Beginning of Period | | $ | 18.37 | | | $ | 25.40 | | | $ | 24.52 | | | $ | 21.98 | | | $ | 20.33 | | | $ | 11.46 | | |
| Income from Investment Operations: | |
| Net investment income (d) | | | 0.34 | | | | 0.46 | | | | 0.10 | | | | 0.15 | | | | 0.08 | | | | 0.02 | | |
Net realized and unrealized gain (loss)
on investments and foreign currency | | | (7.49 | ) | | | (1.87 | ) | | | 4.22 | | | | 4.63 | | | | 2.45 | | | | 8.90 | | |
| Total from investment operations | | | (7.15 | ) | | | (1.41 | ) | | | 4.32 | | | | 4.78 | | | | 2.53 | | | | 8.92 | | |
| Less Distributions to Shareholders: | |
| From net investment income | | | (0.43 | ) | | | (0.53 | ) | | | (0.20 | ) | | | (0.18 | ) | | | (0.09 | ) | | | (0.05 | ) | |
| From net realized gains | | | (1.70 | ) | | | (5.09 | ) | | | (3.24 | ) | | | (2.06 | ) | | | (0.79 | ) | | | — | | |
| From return of capital | | | (0.01 | ) | | | — | | | | — | | | | — | | | | — | | | | — | | |
| Total distributions to shareholders | | | (2.14 | ) | | | (5.62 | ) | | | (3.44 | ) | | | (2.24 | ) | | | (0.88 | ) | | | (0.05 | ) | |
| Redemption Fees: | |
| Redemption fees added to paid-in-capital (e) | | | — | | | | — | | | | — | | | | — | | | | — | | | | — | | |
| Net Asset Value, End of Period | | $ | 9.08 | | | $ | 18.37 | | | $ | 25.40 | | | $ | 24.52 | | | $ | 21.98 | | | $ | 20.33 | | |
| Total return (f) | | | (43.00 | )% | | | (7.86 | )%(g) | | | 19.48 | % | | | 23.38 | % | | | 12.54 | % | | | 77.85 | % | |
Ratios to Average Net Assets/
Supplemental Data: | |
| Net expenses before interest expense | | | 2.13 | %(h) | | | 2.07 | %(h)(i) | | | 2.05 | %(h) | | | 2.02 | % | | | 2.08 | % | | | 2.11 | % | |
| Interest expense | | | — | %(j) | | | — | %(i)(j) | | | — | %(j) | | | — | %(j) | | | — | | | | — | | |
| Net expenses | | | 2.13 | %(h) | | | 2.07 | %(h)(i) | | | 2.05 | %(h) | | | 2.02 | % | | | 2.08 | % | | | 2.11 | % | |
| Waiver/Reimbursement | | | — | | | | — | | | | — | | | | 0.06 | %(k) | | | 0.07 | %(k) | | | 0.09 | %(k) | |
| Net investment income | | | 2.28 | %(h) | | | 1.99 | %(h)(i) | | | 0.42 | % | | | 0.67 | % | | | 0.35 | % | | | 0.14 | % | |
| Net assets, end of period (000's) | | $ | 49,750 | | | $ | 127,020 | | | $ | 170,731 | | | $ | 168,819 | | | $ | 162,797 | | | $ | 170,702 | | |
(a) The per share amounts and percentages reflect income and expenses assuming inclusion of the Fund's proportionate share of the income and expenses of Columbia International Value Master Portfolio.
(b) The Fund changed its fiscal year end from March 31 to February 29. Per share data and total return reflect activity from April 1, 2007 through February 29, 2008.
(c) On August 22, 2005, the Fund's Investor C shares were renamed Class C shares.
(d) Per share data was calculated using the average shares outstanding during the period.
(e) Rounds to less than $0.01 per share.
(f) Total return at net asset value assuming all distributions reinvested and no contingent deferred sales charge.
(g) Not annualized.
(h) The benefits derived from expense reductions had an impact of less than 0.01%.
(i) Annualized.
(j) Rounds to less than 0.01%.
(k) Bank of America Corporation assumed certain non-recurring costs. Absent these non-recurring costs, the waiver/reimbursement ratio would have been -%, 0.04% and 0.06% for the years March 31, 2006, March 31, 2005 and March 31, 2004, respectively.
See Accompanying Notes to Financial Statements.
58
Financial Highlights – Columbia International Value Fund
Selected data for a share outstanding throughout each period is as follows:
| | | Year
Ended
February 28, | | Period
Ended
February 29, | | Year Ended March 31, | |
| Class Z Shares (a) | | 2009 | | 2008 (b) | | 2007 | | 2006 (c) | | 2005 | | 2004 | |
| Net Asset Value, Beginning of Period | | $ | 19.10 | | | $ | 26.17 | | | $ | 25.09 | | | $ | 22.42 | | | $ | 20.71 | | | $ | 11.65 | | |
| Income from Investment Operations: | |
| Net investment income (d) | | | 0.50 | | | | 0.73 | | | | 0.36 | | | | 0.38 | | | | 0.29 | | | | 0.19 | | |
Net realized and unrealized gain (loss)
on investments and foreign currency | | | (7.83 | ) | | | (1.98 | ) | | | 4.35 | | | | 4.75 | | | | 2.51 | | | | 9.07 | | |
| Total from investment operations | | | (7.33 | ) | | | (1.25 | ) | | | 4.71 | | | | 5.13 | | | | 2.80 | | | | 9.26 | | |
| Less Distributions to Shareholders: | |
| From net investment income | | | (0.57 | ) | | | (0.73 | ) | | | (0.39 | ) | | | (0.40 | ) | | | (0.30 | ) | | | (0.20 | ) | |
| From net realized gains | | | (1.70 | ) | | | (5.09 | ) | | | (3.24 | ) | | | (2.06 | ) | | | (0.79 | ) | | | — | | |
| From return of capital | | | (0.01 | ) | | | — | | | | — | | | | — | | | | — | | | | — | | |
| Total distributions to shareholders | | | (2.28 | ) | | | (5.82 | ) | | | (3.63 | ) | | | (2.46 | ) | | | (1.09 | ) | | | (0.20 | ) | |
| Redemption Fees: | |
| Redemption fees added to paid-in-capital (e) | | | — | | | | — | | | | — | | | | — | | | | — | | | | — | | |
| Net Asset Value, End of Period | | $ | 9.49 | | | $ | 19.10 | | | $ | 26.17 | | | $ | 25.09 | | | $ | 22.42 | | | $ | 20.71 | | |
| Total return (f) | | | (42.41 | )% | | | (7.05 | )%(g) | | | 20.70 | % | | | 24.66 | % | | | 13.63 | % | | | 79.67 | % | |
Ratios to Average Net Assets/
Supplemental Data: | |
| Net expenses before interest expense | | | 1.13 | %(h) | | | 1.07 | %(h)(i) | | | 1.05 | %(h) | | | 1.02 | % | | | 1.08 | % | | | 1.11 | % | |
| Interest expense | | | — | %(j) | | | — | %(i)(j) | | | — | %(j) | | | — | %(j) | | | — | | | | — | | |
| Net expenses | | | 1.13 | %(h) | | | 1.07 | %(h)(i) | | | 1.05 | %(h) | | | 1.02 | % | | | 1.08 | % | | | 1.11 | % | |
| Waiver/Reimbursement | | | — | | | | — | | | | — | | | | 0.06 | %(k) | | | 0.07 | %(k) | | | 0.09 | %(k) | |
| Net investment income | | | 3.20 | %(h) | | | 3.04 | %(h)(i) | | | 1.43 | % | | | 1.69 | % | | | 1.35 | % | | | 1.14 | % | |
| Net assets, end of period (000's) | | $ | 844,122 | | | $ | 1,886,808 | | | $ | 2,651,855 | | | $ | 2,585,390 | | | $ | 2,577,677 | | | $ | 2,488,701 | | |
(a) The per share amounts and percentages reflect income and expenses assuming inclusion of the Fund's proportionate share of the income and expenses of Columbia International Value Master Portfolio.
(b) The Fund changed its fiscal year end from March 31 to February 29. Per share data and total return reflect activity from April 1, 2007 through February 29, 2008.
(c) On August 22, 2005, the Fund's Primary A shares were renamed Class Z shares.
(d) Per share data was calculated using the average shares outstanding during the period.
(e) Rounds to less than $0.01 per share.
(f) Total return at net asset value assuming all distributions reinvested.
(g) Not annualized.
(h) The benefits derived from expense reductions had an impact of less than 0.01%.
(i) Annualized.
(j) Rounds to less than 0.01%.
(k) Bank of America Corporation assumed certain non-recurring costs. Absent these non-recurring costs, the waiver/reimbursement ratio would have been -%, 0.04% and 0.06% for the years March 31, 2006, March 31, 2005 and March 31, 2004, respectively.
See Accompanying Notes to Financial Statements.
59
Financial Highlights – Columbia Marsico Global Fund
Selected data for a share outstanding throughout the period is as follows:
| Class A Shares | | Period Ended
February 28,
2009 (a) | |
| Net Asset Value, Beginning of Period | | $ | 10.00 | | |
| Income from Investment Operations: | |
| Net investment income (b) | | | 0.01 | | |
| Net realized and unrealized loss on investments and foreign currency | | | (5.03 | ) | |
| Total from investment operations | | | (5.02 | ) | |
| Redemption Fees: | |
| Redemption fees added to paid-in-capital (c) | | | — | | |
| Net Asset Value, End of Period | | $ | 4.98 | | |
| Total return (d)(e)(f) | | | (50.20 | )% | |
| Ratios to Average Net Assets/Supplemental Data: | |
| Net expenses (g)(h) | | | 1.60 | % | |
| Waiver/Reimbursement (g) | | | 7.19 | % | |
| Net investment income (g)(h) | | | 0.09 | % | |
| Portfolio turnover rate (e) | | | 168 | % | |
| Net assets, end of period (000's) | | $ | 1,113 | | |
(a) Class A shares commenced operations on April 30, 2008. Per share data and total return reflect activity from that date.
(b) Per share data was calculated using the average shares outstanding during the period.
(c) Rounds to less than $0.01 per share.
(d) Total return at net asset value assuming no initial sales charge or contingent deferred sales charge.
(e) Not annualized.
(f) Had the investment advisor and/or any of its affiliates not waived fees or reimbursed a portion of expenses, total return would have been reduced.
(g) Annualized.
(h) The benefits derived from expense reductions had an impact of 0.01%.
See Accompanying Notes to Financial Statements.
60
Financial Highlights – Columbia Marsico Global Fund
Selected data for a share outstanding throughout the period is as follows:
| Class C Shares | | Period Ended
February 28,
2009 (a) | |
| Net Asset Value, Beginning of Period | | $ | 10.00 | | |
| Income from Investment Operations: | |
| Net investment loss (b) | | | (0.04 | ) | |
| Net realized and unrealized loss on investments and foreign currency | | | (5.01 | ) | |
| Total from investment operations | | | (5.05 | ) | |
| Redemption Fees: | |
| Redemption fees added to paid-in-capital (c) | | | — | | |
| Net Asset Value, End of Period | | $ | 4.95 | | |
| Total return (d)(e)(f) | | | (50.50 | )% | |
| Ratios to Average Net Assets/Supplemental Data: | |
| Net expenses (g)(h) | | | 2.35 | % | |
| Waiver/Reimbursement (g) | | | 7.19 | % | |
| Net investment loss (g)(h) | | | (0.63 | )% | |
| Portfolio turnover rate (e) | | | 168 | % | |
| Net assets, end of period (000's) | | $ | 886 | | |
(a) Class C shares commenced operations on April 30, 2008. Per share data and total return reflect activity from that date.
(b) Per share data was calculated using the average shares outstanding during the period.
(c) Rounds to less than $0.01 per share.
(d) Total return at net asset value assuming no contingent deferred sales charge.
(e) Not annualized.
(f) Had the investment advisor and/or any of its affiliates not waived fees or reimbursed a portion of expenses, total return would have been reduced.
(g) Annualized.
(h) The benefits derived from expense reductions had an impact of 0.01%.
See Accompanying Notes to Financial Statements.
61
Financial Highlights – Columbia Marsico Global Fund
Selected data for a share outstanding throughout the period is as follows:
| Class R Shares | | Period Ended
February 28,
2009 (a) | |
| Net Asset Value, Beginning of Period | | $ | 10.00 | | |
| Income from Investment Operations: | |
| Net investment loss (b) | | | (0.01 | ) | |
| Net realized and unrealized loss on investments and foreign currency | | | (5.02 | ) | |
| Total from investment operations | | | (5.03 | ) | |
| Redemption Fees: | |
| Redemption fees added to paid-in-capital (c) | | | — | | |
| Net Asset Value, End of Year | | $ | 4.97 | | |
| Total return (d)(e)(f) | | | (50.30 | )% | |
| Ratios to Average Net Assets/Supplemental Data: | |
| Net expenses (g)(h) | | | 1.85 | % | |
| Waiver/Reimbursement (g) | | | 7.19 | % | |
| Net investment loss (g)(h) | | | (0.12 | )% | |
| Portfolio turnover rate (e) | | | 168 | % | |
| Net assets, end of period (000's) | | $ | 621 | | |
(a) Class R shares commenced operations on April 30, 2008. Per share data and total return reflect activity from that date.
(b) Per share data was calculated using the average shares outstanding during the period.
(c) Rounds to less than $0.01 per share.
(d) Total return at net asset value.
(e) Not annualized.
(f) Had the investment advisor and/or any of its affiliates not waived fees or reimbursed a portion of expenses, total return would have been reduced.
(g) Annualized.
(h) The benefits derived from expense reductions had an impact of 0.01%.
See Accompanying Notes to Financial Statements.
62
Financial Highlights – Columbia Marsico Global Fund
Selected data for a share outstanding throughout the period is as follows:
| Class Z Shares | | Period Ended
February 28,
2009 (a) | |
| Net Asset Value, Beginning of Period | | $ | 10.00 | | |
| Income from Investment Operations: | |
| Net investment income (b) | | | 0.02 | | |
| Net realized and unrealized loss on investments and foreign currency | | | (5.03 | ) | |
| Total from investment operations | | | (5.01 | ) | |
| Redemption Fees: | |
| Redemption fees added to paid-in-capital (c) | | | — | | |
| Net Asset Value, End of Period | | $ | 4.99 | | |
| Total return (d)(e)(f) | | | (50.10 | )% | |
| Ratios to Average Net Assets/Supplemental Data: | |
| Net expenses (g)(h) | | | 1.35 | % | |
| Waiver/Reimbursement (g) | | | 7.19 | % | |
| Net investment loss (g)(h) | | | 0.35 | % | |
| Portfolio turnover rate (e) | | | 168 | % | |
| Net assets, end of period (000's) | | $ | 707 | | |
(a) Class Z shares commenced operations on April 30, 2008. Per share data and total return reflect activity from that date.
(b) Per share data was calculated using the average shares outstanding during the period.
(c) Rounds to less than $0.01 per share.
(d) Total return at net asset value.
(e) Not annualized.
(f) Had the investment advisor and/or any of its affiliates not waived fees or reimbursed a portion of expenses, total return would have been reduced.
(g) Annualized.
(h) The benefits derived from expense reductions had an impact of 0.01%.
See Accompanying Notes to Financial Statements.
63
Financial Highlights – Columbia Marsico International Opportunities Fund
Selected data for a share outstanding throughout each period is as follows:
| | | Year
Ended
February 28, | | Year
Ended
February 29, | | Period
Ended
February 28, | | Year Ended March 31, | |
| Class A Shares | | 2009 | | 2008 | | 2007 (a) | | 2006 (b) | | 2005 | | 2004 | |
| Net Asset Value, Beginning of Period | | $ | 14.58 | | | $ | 14.85 | | | $ | 14.67 | | | $ | 11.41 | | | $ | 11.05 | | | $ | 6.93 | | |
| Income from Investment Operations: | |
| Net investment income (c) | | | 0.12 | (d) | | | 0.14 | (e) | | | — | (f) | | | 0.09 | | | | 0.05 | | | | — | (f) | |
Net realized and unrealized gain (loss)
on investments and foreign currency | | | (7.82 | ) | | | 1.54 | | | | 1.38 | | | | 3.74 | | | | 0.51 | | | | 4.20 | | |
| Total from investment operations | | | (7.70 | ) | | | 1.68 | | | | 1.38 | | | | 3.83 | | | | 0.56 | | | | 4.20 | | |
| Less Distributions to Shareholders: | |
| From net investment income | | | — | | | | (0.16 | ) | | | (0.04 | ) | | | (0.10 | ) | | | (0.04 | ) | | | — | | |
| From net realized gains | | | (0.12 | ) | | | (1.79 | ) | | | (1.16 | ) | | | (0.47 | ) | | | (0.16 | ) | | | (0.08 | ) | |
| Total distributions to shareholders | | | (0.12 | ) | | | (1.95 | ) | | | (1.20 | ) | | | (0.57 | ) | | | (0.20 | ) | | | (0.08 | ) | |
| Redemption Fees: | |
| Redemption fees added to paid-in-capital (f) | | | — | | | | — | | | | — | | | | — | | | | — | | | | — | | |
| Net Asset Value, End of Period | | $ | 6.76 | | | $ | 14.58 | | | $ | 14.85 | | | $ | 14.67 | | | $ | 11.41 | | | $ | 11.05 | | |
| Total return (g) | | | (53.26 | )% | | | 10.55 | % | | | 10.52 | %(h) | | | 35.26 | % | | | 5.24 | % | | | 60.87 | % | |
Ratios to Average Net Assets/
Supplemental Data: | |
| Net expenses before interest expense (i) | | | 1.52 | % | | | 1.44 | % | | | 1.40 | %(j) | | | 1.34 | % | | | 1.37 | % | | | 1.42 | % | |
| Interest expense | | | — | | | | — | | | | — | %(j)(k) | | | — | %(k) | | | — | %(k) | | | — | | |
| Net expenses (i) | | | 1.52 | % | | | 1.44 | % | | | 1.40 | %(j) | | | 1.34 | % | | | 1.37 | % | | | 1.42 | % | |
| Net investment income (loss) | | | 1.05 | %(i) | | | 0.90 | %(i) | | | (0.03 | )%(j) | | | 0.74 | % | | | 0.47 | % | | | (0.04 | )% | |
| Portfolio turnover rate | | | 117 | % | | | 116 | % | | | 109 | %(h) | | | 118 | % | | | 165 | % | | | 121 | % | |
| Net assets, end of period (000's) | | $ | 198,012 | | | $ | 599,356 | | | $ | 452,047 | | | $ | 150,043 | | | $ | 52,794 | | | $ | 19,785 | | |
(a) The Fund changed its fiscal year end from March 31 to February 28. Per share data and total return reflect activity from April 1, 2006 through February 28, 2007.
(b) On August 22, 2005, the Fund's Investor A shares were renamed Class A shares.
(c) Per share data was calculated using the average shares outstanding during the period.
(d) Net investment income per share reflects special dividends. The effect of these dividends amounted to $0.03 per share.
(e) Net investment income per share reflects special dividends. The effect of these dividends amounted to $0.04 per share.
(f) Rounds to less than $0.01 per share.
(g) Total return at net asset value assuming all distributions reinvested and no initial sales charge or contingent deferred sales charge.
(h) Not annualized.
(i) The benefits derived from expense reductions had an impact of less than 0.01%.
(j) Annualized.
(k) Rounds to less than 0.01%.
See Accompanying Notes to Financial Statements.
64
Financial Highlights – Columbia Marsico International Opportunities Fund
Selected data for a share outstanding throughout each period is as follows:
| | | Year
Ended
February 28, | | Year
Ended
February 29, | | Period
Ended
February 28, | | Year Ended March 31, | |
| Class B Shares | | 2009 | | 2008 | | 2007 (a) | | 2006 (b) | | 2005 | | 2004 | |
| Net Asset Value, Beginning of Period | | $ | 13.87 | | | $ | 14.23 | | | $ | 14.17 | | | $ | 11.05 | | | $ | 10.75 | | | $ | 6.79 | | |
| Income from Investment Operations: | |
| Net investment income (loss) (c) | | | 0.03 | (d) | | | 0.03 | (e) | | | (0.08 | ) | | | 0.01 | | | | (0.03 | ) | | | (0.07 | ) | |
Net realized and unrealized gain (loss)
on investments and foreign currency | | | (7.40 | ) | | | 1.46 | | | | 1.30 | | | | 3.59 | | | | 0.49 | | | | 4.11 | | |
| Total from investment operations | | | (7.37 | ) | | | 1.49 | | | | 1.22 | | | | 3.60 | | | | 0.46 | | | | 4.04 | | |
| Less Distributions to Shareholders: | |
| From net investment income | | | — | | | | (0.06 | ) | | | — | | | | (0.01 | ) | | | — | | | | — | | |
| From net realized gains | | | (0.12 | ) | | | (1.79 | ) | | | (1.16 | ) | | | (0.47 | ) | | | (0.16 | ) | | | (0.08 | ) | |
| Total distributions to shareholders | | | (0.12 | ) | | | (1.85 | ) | | | (1.16 | ) | | | (0.48 | ) | | | (0.16 | ) | | | (0.08 | ) | |
| Redemption Fees: | |
| Redemption fees added to paid-in-capital (f) | | | — | | | | — | | | | — | | | | — | | | | — | | | | — | | |
| Net Asset Value, End of Period | | $ | 6.38 | | | $ | 13.87 | | | $ | 14.23 | | | $ | 14.17 | | | $ | 11.05 | | | $ | 10.75 | | |
| Total return (g) | | | (53.60 | )% | | | 9.68 | % | | | 9.76 | %(h) | | | 34.22 | % | | | 4.45 | % | | | 59.77 | % | |
Ratios to Average Net Assets/
Supplemental Data: | |
| Net expenses before interest expense (i) | | | 2.27 | % | | | 2.19 | % | | | 2.15 | %(j) | | | 2.09 | % | | | 2.12 | % | | | 2.17 | % | |
| Interest expense | | | — | | | | — | | | | — | %(j)(k) | | | — | %(k) | | | — | | | | — | | |
| Net expenses (i) | | | 2.27 | % | | | 2.19 | % | | | 2.15 | %(j) | | | 2.09 | % | | | 2.12 | % | | | 2.17 | % | |
| Net investment income (loss) | | | 0.32 | %(i) | | | 0.22 | %(i) | | | (0.63 | )%(j) | | | 0.12 | % | | | (0.28 | )% | | | (0.79 | )% | |
| Portfolio turnover rate | | | 117 | % | | | 116 | % | | | 109 | %(h) | | | 118 | % | | | 165 | % | | | 121 | % | |
| Net assets, end of period (000's) | | $ | 15,281 | | | $ | 44,224 | | | $ | 40,953 | | | $ | 28,883 | | | $ | 16,618 | | | $ | 8,905 | | |
(a) The Fund changed its fiscal year end from March 31 to February 28. Per share data and total return reflect activity from April 1, 2006 through February 28, 2007.
(b) On August 22, 2005, the Fund's Investor B shares were renamed Class B shares.
(c) Per share data was calculated using the average shares outstanding during the period.
(d) Net investment income per share reflects special dividends. The effect of these dividends amounted to $0.03 per share.
(e) Net investment income per share reflects special dividends. The effect of these dividends amounted to $0.04 per share.
(f) Rounds to less than $0.01 per share.
(g) Total return at net asset value assuming all distributions reinvested and no contingent deferred sales charge.
(h) Not annualized.
(i) The benefits derived from expense reductions had an impact of less than 0.01%.
(j) Annualized.
(k) Rounds to less than 0.01%.
See Accompanying Notes to Financial Statements.
65
Financial Highlights – Columbia Marsico International Opportunities Fund
Selected data for a share outstanding throughout each period is as follows:
| | | Year
Ended
February 28, | | Year
Ended
February 29, | | Period
Ended
February 28, | | Year Ended March 31, | |
| Class C Shares | | 2009 | | 2008 | | 2007 (a) | | 2006 (b) | | 2005 | | 2004 | |
| Net Asset Value, Beginning of Period | | $ | 13.88 | | | $ | 14.24 | | | $ | 14.18 | | | $ | 11.05 | | | $ | 10.75 | | | $ | 6.80 | | |
| Income from Investment Operations: | |
| Net investment income (loss) (c) | | | 0.03 | (d) | | | 0.02 | (e) | | | (0.09 | ) | | | 0.01 | | | | (0.03 | ) | | | (0.07 | ) | |
Net realized and unrealized gain (loss)
on investments and foreign currency | | | (7.40 | ) | | | 1.47 | | | | 1.31 | | | | 3.60 | | | | 0.49 | | | | 4.10 | | |
| Total from investment operations | | | (7.37 | ) | | | 1.49 | | | | 1.22 | | | | 3.61 | | | | 0.46 | | | | 4.03 | | |
| Less Distributions to Shareholders: | |
| From net investment income | | | — | | | | (0.06 | ) | | | — | | | | (0.01 | ) | | | — | | | | — | | |
| From net realized gains | | | (0.12 | ) | | | (1.79 | ) | | | (1.16 | ) | | | (0.47 | ) | | | (0.16 | ) | | | (0.08 | ) | |
| Total distributions to shareholders | | | (0.12 | ) | | | (1.85 | ) | | | (1.16 | ) | | | (0.48 | ) | | | (0.16 | ) | | | (0.08 | ) | |
| Redemption Fees: | |
| Redemption fees added to paid-in-capital (f) | | | — | | | | — | | | | — | | | | — | | | | — | | | | — | | |
| Net Asset Value, End of Period | | $ | 6.39 | | | $ | 13.88 | | | $ | 14.24 | | | $ | 14.18 | | | $ | 11.05 | | | $ | 10.75 | | |
| Total return (g) | | | (53.57 | )% | | | 9.67 | % | | | 9.76 | %(h) | | | 34.32 | % | | | 4.45 | % | | | 59.53 | % | |
Ratios to Average Net Assets/
Supplemental Data: | |
| Net expenses before interest expense (i) | | | 2.27 | % | | | 2.19 | % | | | 2.15 | %(j) | | | 2.09 | % | | | 2.12 | % | | | 2.17 | % | |
| Interest expense | | | — | | | | — | | | | — | %(j)(k) | | | — | %(k) | | | — | | | | — | | |
| Net expenses (i) | | | 2.27 | % | | | 2.19 | % | | | 2.15 | %(j) | | | 2.09 | % | | | 2.12 | % | | | 2.17 | % | |
| Net investment income (loss) | | | 0.30 | %(i) | | | 0.16 | %(i) | | | (0.69 | )%(j) | | | 0.05 | % | | | (0.28 | )% | | | (0.79 | )% | |
| Portfolio turnover rate | | | 117 | % | | | 116 | % | | | 109 | %(h) | | | 118 | % | | | 165 | % | | | 121 | % | |
| Net assets, end of period (000's) | | $ | 38,668 | | | $ | 109,553 | | | $ | 86,563 | | | $ | 46,365 | | | $ | 19,530 | | | $ | 8,331 | | |
(a) The Fund changed its fiscal year end from March 31 to February 28. Per share data and total return reflect activity from April 1, 2006 through February 28, 2007.
(b) On August 22, 2005, the Fund's Investor C shares were renamed Class C shares.
(c) Per share data was calculated using the average shares outstanding during the period.
(d) Net investment income per share reflects special dividends. The effect of these dividends amounted to $0.03 per share.
(e) Net investment income per share reflects special dividends. The effect of these dividends amounted to $0.04 per share.
(f) Rounds to less than $0.01 per share.
(g) Total return at net asset value assuming all distributions reinvested and no contingent deferred sales charge.
(h) Not annualized.
(i) The benefits derived from expense reductions had an impact of less than 0.01%.
(j) Annualized.
(k) Rounds to less than 0.01%.
See Accompanying Notes to Financial Statements.
66
Financial Highlights – Columbia Marsico International Opportunities Fund
Selected data for a share outstanding throughout each period is as follows:
| Class R Shares | | Year
Ended
February 28,
2009 | | Year
Ended
February 29,
2008 | | Period
Ended
February 28,
2007 (a) | | Period
Ended
March 31,
2006 (b) | |
| Net Asset Value, Beginning of Period | | $ | 14.56 | | | $ | 14.84 | | | $ | 14.67 | | | $ | 13.76 | | |
| Income from Investment Operations: | |
| Net investment income (loss) (c) | | | 0.06 | (d) | | | 0.08 | (e) | | | (0.17 | ) | | | (0.01 | ) | |
Net realized and unrealized gain (loss)
on investments and foreign currency | | | (7.77 | ) | | | 1.56 | | | | 1.51 | | | | 0.92 | | |
| Total from investment operations | | | (7.71 | ) | | | 1.64 | | | | 1.34 | | | | 0.91 | | |
| Less Distributions to Shareholders: | |
| From net investment income | | | — | | | | (0.13 | ) | | | (0.01 | ) | | | — | | |
| From net realized gains | | | (0.12 | ) | | | (1.79 | ) | | | (1.16 | ) | | | — | | |
| Total distributions to shareholders | | | (0.12 | ) | | | (1.92 | ) | | | (1.17 | ) | | | — | | |
| Redemption Fees: | |
| Redemption fees added to paid-in-capital (f) | | | — | | | | — | | | | — | | | | — | | |
| Net Asset Value, End of Period | | $ | 6.73 | | | $ | 14.56 | | | $ | 14.84 | | | $ | 14.67 | | |
| Total return (g) | | | (53.40 | )% | | | 10.26 | % | | | 10.25 | %(h) | | | 6.61 | %(h) | |
| Ratios to Average Net Assets/Supplemental Data: | |
| Net expenses before interest expense (i) | | | 1.77 | % | | | 1.69 | % | | | 1.65 | %(j) | | | 1.64 | %(j) | |
| Interest expense | | | — | | | | — | | | | — | %(j)(k) | | | — | %(j)(k) | |
| Net expenses (i) | | | 1.77 | % | | | 1.69 | % | | | 1.65 | %(j) | | | 1.64 | %(j) | |
| Net investment income (loss) | | | 0.58 | %(i) | | | 0.51 | %(i) | | | (1.26 | )%(j) | | | (0.30 | )%(j) | |
| Portfolio turnover rate | | | 117 | % | | | 116 | % | | | 109 | %(h) | | | 118 | %(h) | |
| Net assets, end of period (000's) | | $ | 2,592 | | | $ | 3,724 | | | $ | 2,037 | | | $ | 11 | | |
(a) The Fund changed its fiscal year end from March 31 to February 28. Per share data and total return reflect activity from April 1, 2006 through February 28, 2007.
(b) Class R shares commenced operations on January 23, 2006.
(c) Per share data was calculated using the average shares outstanding during the period.
(d) Net investment income per share reflects special dividends. The effect of these dividends amounted to $0.03 per share.
(e) Net investment income per share reflects special dividends. The effect of these dividends amounted to $0.04 per share.
(f) Rounds to less than $0.01 per share.
(g) Total return at net asset value assuming all distributions reinvested.
(h) Not annualized.
(i) The benefits derived from expense reductions had an impact of less than 0.01%.
(j) Annualized.
(k) Rounds to less than 0.01%.
See Accompanying Notes to Financial Statements.
67
Financial Highlights – Columbia Marsico International Opportunities Fund
Selected data for a share outstanding throughout each period is as follows:
| | | Year
Ended
February 28, | | Year
Ended
February 29, | | Period
Ended
February 28, | | Year Ended March 31, | |
| Class Z Shares | | 2009 | | 2008 | | 2007 (a) | | 2006 (b) | | 2005 | | 2004 | |
| Net Asset Value, Beginning of Period | | $ | 14.79 | | | $ | 15.04 | | | $ | 14.83 | | | $ | 11.53 | | | $ | 11.15 | | | $ | 6.98 | | |
| Income from Investment Operations: | |
| Net investment income (c) | | | 0.15 | (d) | | | 0.20 | (e) | | | 0.05 | | | | 0.13 | | | | 0.08 | | | | 0.02 | | |
Net realized and unrealized gain (loss)
on investments and foreign currency | | | (7.95 | ) | | | 1.54 | | | | 1.39 | | | | 3.77 | | | | 0.52 | | | | 4.24 | | |
| Total from investment operations | | | (7.80 | ) | | | 1.74 | | | | 1.44 | | | | 3.90 | | | | 0.60 | | | | 4.26 | | |
| Less Distributions to Shareholders: | |
| From net investment income | | | — | | | | (0.20 | ) | | | (0.07 | ) | | | (0.13 | ) | | | (0.06 | ) | | | (0.01 | ) | |
| From net realized gains | | | (0.12 | ) | | | (1.79 | ) | | | (1.16 | ) | | | (0.47 | ) | | | (0.16 | ) | | | (0.08 | ) | |
| Total distributions to shareholders | | | (0.12 | ) | | | (1.99 | ) | | | (1.23 | ) | | | (0.60 | ) | | | (0.22 | ) | | | (0.09 | ) | |
| Redemption Fees: | |
| Redemption fees added to paid-in-capital (f) | | | — | | | | — | | | | — | | | | — | | | | — | | | | — | | |
| Net Asset Value, End of Period | | $ | 6.87 | | | $ | 14.79 | | | $ | 15.04 | | | $ | 14.83 | | | $ | 11.53 | | | $ | 11.15 | | |
| Total return (g) | | | (53.17 | )% | | | 10.77 | % | | | 10.81 | %(h) | | | 35.53 | % | | | 5.55 | % | | | 61.25 | % | |
Ratios to Average Net Assets/
Supplemental Data: | |
| Net expenses before interest expense (i) | | | 1.27 | % | | | 1.19 | % | | | 1.15 | %(j) | | | 1.09 | % | | | 1.12 | % | | | 1.17 | % | |
| Interest expense | | | — | | | | — | | | | — | %(j)(k) | | | — | %(k) | | | — | | | | — | | |
| Net expenses (i) | | | 1.27 | % | | | 1.19 | % | | | 1.15 | %(j) | | | 1.09 | % | | | 1.12 | % | | | 1.17 | % | |
| Net investment income | | | 1.32 | %(i) | | | 1.23 | %(i) | | | 0.37 | %(j) | | | 1.08 | % | | | 0.72 | % | | | 0.21 | % | |
| Portfolio turnover rate | | | 117 | % | | | 116 | % | | | 109 | %(h) | | | 118 | % | | | 165 | % | | | 121 | % | |
| Net assets, end of period (000's) | | $ | 824,068 | | | $ | 2,491,232 | | | $ | 2,322,301 | | | $ | 1,744,737 | | | $ | 991,889 | | | $ | 509,262 | | |
(a) The Fund changed its fiscal year end from March 31 to February 28. Per share data and total return reflect activity from April 1, 2006 through February 28, 2007.
(b) On August 22, 2005, the Fund's Primary A shares were renamed Class Z shares.
(c) Per share data was calculated using the average shares outstanding during the period.
(d) Net investment income per share reflects special dividends. The effect of these dividends amounted to $0.03 per share.
(e) Net investment income per share reflects special dividends. The effect of these dividends amounted to $0.04 per share.
(f) Rounds to less than $0.01 per share.
(g) Total return at net asset value assuming all distributions reinvested.
(h) Not annualized.
(i) The benefits derived from expense reductions had an impact of less than 0.01%.
(j) Annualized.
(k) Rounds to less than 0.01%.
See Accompanying Notes to Financial Statements.
68
Financial Highlights – Columbia Multi-Advisor International Equity Fund
Selected data for a share outstanding throughout each period is as follows:
| | | Year
Ended
February 28, | | Year
Ended
February 29, | | Period
Ended
February 28, | | Year Ended March 31, | |
| Class A Shares | | 2009 | | 2008 | | 2007 (a) | | 2006 (b) | | 2005 | | 2004 | |
| Net Asset Value, Beginning of Period | | $ | 15.77 | | | $ | 17.12 | | | $ | 16.39 | | | $ | 13.30 | | | $ | 12.00 | | | $ | 7.93 | | |
| Income from Investment Operations: | |
| Net investment income (c) | | | 0.26 | | | | 0.28 | | | | 0.16 | | | | 0.21 | | | | 0.13 | | | | 0.08 | | |
Net realized and unrealized gain (loss)
on investments and foreign currency | | | (8.33 | ) | | | 0.76 | | | | 1.91 | | | | 3.20 | | | | 1.18 | | | | 4.09 | | |
| Total from investment operations | | | (8.07 | ) | | | 1.04 | | | | 2.07 | | | | 3.41 | | | | 1.31 | | | | 4.17 | | |
| Less Distributions to Shareholders: | |
| From net investment income | | | (0.07 | ) | | | (0.28 | ) | | | (0.18 | ) | | | (0.27 | ) | | | (0.01 | ) | | | (0.10 | ) | |
| From net realized gains | | | (0.19 | ) | | | (2.11 | ) | | | (1.16 | ) | | | (0.05 | ) | | | — | | | | — | | |
| Total distributions to shareholders | | | (0.26 | ) | | | (2.39 | ) | | | (1.34 | ) | | | (0.32 | ) | | | (0.01 | ) | | | (0.10 | ) | |
| Redemption Fees: | |
| Redemption fees added to paid-in-capital (d) | | | — | | | | — | | | | — | | | | — | | | | — | | | | — | | |
| Net Asset Value, End of Period | | $ | 7.44 | | | $ | 15.77 | | | $ | 17.12 | | | $ | 16.39 | | | $ | 13.30 | | | $ | 12.00 | | |
| Total return (e) | | | (51.87 | )% | | | 5.14 | % | | | 13.55 | %(f) | | | 25.86 | % | | | 10.88 | % | | | 52.71 | % | |
Ratios to Average Net Assets/
Supplemental Data: | |
| Net expenses before interest expense | | | 1.27 | %(g) | | | 1.19 | %(g) | | | 1.15 | %(g)(h) | | | 1.14 | %(i) | | | 1.26 | %(g) | | | 1.37 | %(g) | |
| Interest expense | | | — | | | | — | %(j) | | | — | %(h)(j) | | | — | | | | — | %(j) | | | — | %(j) | |
| Net expenses | | | 1.27 | %(g) | | | 1.19 | %(g) | | | 1.15 | %(g)(h) | | | 1.14 | %(i) | | | 1.26 | %(g) | | | 1.37 | %(g) | |
| Waiver/Reimbursement | | | — | | | | — | | | | — | | | | 0.08 | %(k) | | | 0.12 | %(k) | | | 0.03 | %(k) | |
| Net investment income | | | 2.05 | %(g) | | | 1.56 | %(g) | | | 1.06 | %(h) | | | 1.43 | % | | | 1.01 | % | | | 0.74 | % | |
| Portfolio turnover rate | | | 83 | % | | | 78 | % | | | 73 | %(f) | | | 74 | % | | | 153 | % | | | 86 | % | |
| Net assets, end of period (000's) | | $ | 16,936 | | | $ | 41,660 | | | $ | 42,865 | | | $ | 39,330 | | | $ | 28,527 | | | $ | 27,396 | | |
(a) The Fund changed its fiscal year end from March 31 to February 28. Per share data and total return reflect activity from April 1, 2006 through February 28, 2007.
(b) On August 22, 2005, the Fund's Investor A shares were renamed Class A shares.
(c) Per share data was calculated using the average shares outstanding during the period.
(d) Rounds to less than $0.01 per share.
(e) Total return at net asset value assuming all distributions reinvested and no initial sales charge or contingent deferred sales charge.
(f) Not annualized.
(g) The benefits derived from expense reductions had an impact of less than 0.01%.
(h) Annualized.
(i) The benefits derived from expense reductions had an impact of 0.01%.
(j) Rounds to less than 0.01% per share.
(k) Bank of America Corporation assumed certain non-recurring costs. Absent these non-recurring costs, the waiver/reimbursement ratio would have been -%, 0.09% and 0.01% for the years ended March 31, 2006, March 31, 2005 and March 31, 2004, respectively.
See Accompanying Notes to Financial Statements.
69
Financial Highlights – Columbia Multi-Advisor International Equity Fund
Selected data for a share outstanding throughout each period is as follows:
| | | Year
Ended
February 28, | | Year
Ended
February 29, | | Period
Ended
February 28, | | Year Ended March 31, | |
| Class B Shares | | 2009 | | 2008 | | 2007 (a) | | 2006 (b) | | 2005 | | 2004 | |
| Net Asset Value, Beginning of Period | | $ | 14.47 | | | $ | 15.89 | | | $ | 15.31 | | | $ | 12.44 | | | $ | 11.30 | | | $ | 7.50 | | |
| Income from Investment Operations: | |
| Net investment income (loss) (c) | | | 0.17 | | | | 0.15 | | | | 0.05 | | | | 0.16 | | | | 0.03 | | | | — | (d) | |
Net realized and unrealized gain (loss)
on investments and foreign currency | | | (7.63 | ) | | | 0.70 | | | | 1.76 | | | | 2.92 | | | | 1.11 | | | | 3.85 | | |
| Total from investment operations | | | (7.46 | ) | | | 0.85 | | | | 1.81 | | | | 3.08 | | | | 1.14 | | | | 3.85 | | |
| Less Distributions to Shareholders: | |
| From net investment income | | | — | | | | (0.16 | ) | | | (0.07 | ) | | | (0.16 | ) | | | — | | | | (0.05 | ) | |
| From net realized gains | | | (0.19 | ) | | | (2.11 | ) | | | (1.16 | ) | | | (0.05 | ) | | | — | | | | — | | |
| Total distributions to shareholders | | | (0.19 | ) | | | (2.27 | ) | | | (1.23 | ) | | | (0.21 | ) | | | — | | | | (0.05 | ) | |
| Redemption Fees: | |
| Redemption fees added to paid-in-capital (d) | | | — | | | | — | | | | — | | | | — | | | | — | | | | — | | |
| Net Asset Value, End of Period | | $ | 6.82 | | | $ | 14.47 | | | $ | 15.89 | | | $ | 15.31 | | | $ | 12.44 | | | $ | 11.30 | | |
| Total return (e) | | | (52.23 | )% | | | 4.40 | % | | | 12.76 | %(f) | | | 24.96 | % | | | 10.09 | % | | | 51.39 | % | |
Ratios to Average Net Assets/
Supplemental Data: | |
| Net expenses before interest expense | | | 2.02 | %(g) | | | 1.94 | %(g) | | | 1.90 | %(g)(h) | | | 1.89 | %(i) | | | 2.01 | %(g) | | | 2.12 | %(g) | |
| Interest expense | | | — | | | | — | %(j) | | | — | %(h)(j) | | | — | | | | — | %(j) | | | — | %(j) | |
| Net expenses | | | 2.02 | %(g) | | | 1.94 | %(g) | | | 1.90 | %(g)(h) | | | 1.89 | %(i) | | | 2.01 | %(g) | | | 2.12 | %(g) | |
| Waiver/Reimbursement | | | — | | | | — | | | | — | | | | 0.08 | %(k) | | | 0.12 | %(k) | | | 0.03 | %(k) | |
| Net investment income (loss) | | | 1.44 | %(g) | | | 0.89 | %(g) | | | 0.36 | %(h) | | | 1.19 | % | | | 0.26 | % | | | (0.01 | )% | |
| Portfolio turnover rate | | | 83 | % | | | 78 | % | | | 73 | %(f) | | | 74 | % | | | 153 | % | | | 86 | % | |
| Net assets, end of period (000's) | | $ | 1,098 | | | $ | 3,545 | | | $ | 4,587 | | | $ | 4,712 | | | $ | 9,976 | | | $ | 9,956 | | |
(a) The Fund changed its fiscal year end from March 31 to February 28. Per share data and total return reflect activity from April 1, 2006 through February 28, 2007.
(b) On August 22, 2005, the Fund's Investor B shares were renamed Class B shares.
(c) Per share data was calculated using the average shares outstanding during the period.
(d) Rounds to less than $0.01 per share.
(e) Total return at net asset value assuming all distributions reinvested and no contingent deferred sales charge.
(f) Not annualized.
(g) The benefits derived from expense reductions had an impact of less than 0.01%.
(h) Annualized.
(i) The benefits derived from expense reductions had an impact of 0.01%.
(j) Rounds to less than 0.01% per share.
(k) Bank of America Corporation assumed certain non-recurring costs. Absent these non-recurring costs, the waiver/reimbursement ratio would have been -%, 0.09% and 0.01% for the years ended March 31, 2006, March 31, 2005 and March 31, 2004, respectively.
See Accompanying Notes to Financial Statements.
70
Financial Highlights – Columbia Multi-Advisor International Equity Fund
Selected data for a share outstanding throughout each period is as follows:
| | | Year
Ended
February 28, | | Year
Ended
February 29, | | Period
Ended
February 28, | | Year Ended March 31, | |
| Class C Shares | | 2009 | | 2008 | | 2007 (a) | | 2006 (b) | | 2005 | | 2004 | |
| Net Asset Value, Beginning of Period | | $ | 14.29 | | | $ | 15.72 | | | $ | 15.16 | | | $ | 12.32 | | | $ | 11.20 | | | $ | 7.43 | | |
| Income from Investment Operations: | |
| Net investment income (loss) (c) | | | 0.16 | | | | 0.13 | | | | 0.05 | | | | 0.09 | | | | 0.03 | | | | — | (d) | |
Net realized and unrealized gain (loss)
on investments and foreign currency | | | (7.53 | ) | | | 0.71 | | | | 1.74 | | | | 2.96 | | | | 1.09 | | | | 3.82 | | |
| Total from investment operations | | | (7.37 | ) | | | 0.84 | | | | 1.79 | | | | 3.05 | | | | 1.12 | | | | 3.82 | | |
| Less Distributions to Shareholders: | |
| From net investment income | | | — | | | | (0.16 | ) | | | (0.07 | ) | | | (0.16 | ) | | | — | | | | (0.05 | ) | |
| From net realized gains | | | (0.19 | ) | | | (2.11 | ) | | | (1.16 | ) | | | (0.05 | ) | | | — | | | | — | | |
| Total distributions to shareholders | | | (0.19 | ) | | | (2.27 | ) | | | (1.23 | ) | | | (0.21 | ) | | | — | | | | (0.05 | ) | |
| Redemption Fees: | |
| Redemption fees added to paid-in-capital (d) | | | — | | | | — | | | | — | | | | — | | | | — | | | | — | | |
| Net Asset Value, End of Period | | $ | 6.73 | | | $ | 14.29 | | | $ | 15.72 | | | $ | 15.16 | | | $ | 12.32 | | | $ | 11.20 | | |
| Total return (e) | | | (52.26 | )% | | | 4.37 | % | | | 12.75 | %(f) | | | 24.96 | % | | | 10.00 | % | | | 51.43 | % | |
Ratios to Average Net Assets/
Supplemental Data: | |
| Net expenses before interest expense | | | 2.02 | %(g) | | | 1.94 | %(g) | | | 1.90 | %(g)(h) | | | 1.89 | %(i) | | | 2.01 | %(g) | | | 2.12 | %(g) | |
| Interest expense | | | — | | | | — | %(j) | | | — | %(h)(j) | | | — | | | | — | %(j) | | | — | %(j) | |
| Net expenses | | | 2.02 | %(g) | | | 1.94 | %(g) | | | 1.90 | %(g)(h) | | | 1.89 | %(i) | | | 2.01 | %(g) | | | 2.12 | %(g) | |
| Waiver/Reimbursement | | | — | | | | — | | | | — | | | | 0.08 | %(k) | | | 0.12 | %(k) | | | 0.03 | %(k) | |
| Net investment income (loss) | | | 1.38 | %(g) | | | 0.79 | %(g) | | | 0.34 | %(h) | | | 0.70 | % | | | 0.26 | % | | | (0.01 | )% | |
| Portfolio turnover rate | | | 83 | % | | | 78 | % | | | 73 | %(f) | | | 74 | % | | | 153 | % | | | 86 | % | |
| Net assets, end of period (000's) | | $ | 1,349 | | | $ | 3,863 | | | $ | 3,533 | | | $ | 3,276 | | | $ | 2,563 | | | $ | 1,867 | | |
(a) The Fund changed its fiscal year end from March 31 to February 28. Per share data and total return reflect activity from April 1, 2006 through February 28, 2007.
(b) On August 22, 2005, the Fund's Investor C shares were renamed Class C shares.
(c) Per share data was calculated using the average shares outstanding during the period.
(d) Rounds to less than $0.01 per share.
(e) Total return at net asset value assuming all distributions reinvested and no contingent deferred sales charge.
(f) Not annualized.
(g) The benefits derived from expense reductions had an impact of less than 0.01%.
(h) Annualized.
(i) The benefits derived from expense reductions had an impact of 0.01%.
(j) Rounds to less than 0.01% per share.
(k) Bank of America Corporation assumed certain non-recurring costs. Absent these non-recurring costs, the waiver/reimbursement ratio would have been -%, 0.09% and 0.01% for the years ended March 31, 2006, March 31, 2005 and March 31, 2004, respectively.
See Accompanying Notes to Financial Statements.
71
Financial Highlights – Columbia Multi-Advisor International Equity Fund
Selected data for a share outstanding throughout each period is as follows:
| Class R Shares | | Year
Ended
February 28,
2009 | | Year
Ended
February 29,
2008 | | Period
Ended
February 28,
2007 (a) | | Period
Ended
March 31,
2006 (b) | |
| Net Asset Value, Beginning of Period | | $ | 15.76 | | | $ | 17.12 | | | $ | 16.38 | | | $ | 15.44 | | |
| Income from Investment Operations: | |
| Net investment income (c) | | | 0.21 | | | | 0.06 | | | | 0.12 | | | | 0.03 | | |
Net realized and unrealized gain (loss) on investments and
foreign currency | | | (8.30 | ) | | | 0.93 | | | | 1.91 | | | | 0.91 | | |
| Total from investment operations | | | (8.09 | ) | | | 0.99 | | | | 2.03 | | | | 0.94 | | |
| Less Distributions to Shareholders: | |
| From net investment income | | | (0.04 | ) | | | (0.24 | ) | | | (0.13 | ) | | | — | | |
| From net realized gains | | | (0.19 | ) | | | (2.11 | ) | | | (1.16 | ) | | | — | | |
| Total distributions to shareholders | | | (0.23 | ) | | | (2.35 | ) | | | (1.29 | ) | | | — | | |
| Redemption Fees: | |
| Redemption fees added to paid-in-capital (d) | | | — | | | | — | | | | — | | | | — | | |
| Net Asset Value, End of Period | | $ | 7.44 | | | $ | 15.76 | | | $ | 17.12 | | | $ | 16.38 | | |
| Total return (e) | | | (52.00 | )% | | | 4.87 | % | | | 13.31 | %(f) | | | 6.09 | %(f) | |
| Ratios to Average Net Assets/Supplemental Data: | |
| Net expenses before interest expense | | | 1.52 | %(g) | | | 1.44 | %(g) | | | 1.40 | %(g)(h) | | | 1.39 | %(h)(i) | |
| Interest expense | | | — | | | | — | %(j) | | | — | %(h)(j) | | | — | | |
| Net expenses | | | 1.52 | %(g) | | | 1.44 | %(g) | | | 1.40 | %(g)(h) | | | 1.39 | %(h)(i) | |
| Waiver/Reimbursement | | | — | | | | — | | | | — | | | | 0.08 | %(h)(k) | |
| Net investment income | | | 1.70 | %(g) | | | 0.31 | %(g) | | | 0.80 | %(h) | | | 0.85 | %(h) | |
| Portfolio turnover rate | | | 83 | % | | | 78 | % | | | 73 | %(f) | | | 74 | % | |
| Net assets, end of period (000's) | | $ | 112 | | | $ | 196 | | | $ | 12 | | | $ | 11 | | |
(a) The Fund changed its fiscal year end from March 31 to February 28. Per share data and total return reflect activity from April 1, 2006 through February 28, 2007.
(b) Class R shares commenced operations on January 23, 2006.
(c) Per share data was calculated using the average shares outstanding during the period.
(d) Rounds to less than $0.01 per share.
(e) Total return at net asset value assuming all distributions reinvested.
(f) Not annualized.
(g) The benefits derived from expense reductions had an impact of less than 0.01%.
(h) Annualized.
(i) The benefits derived from expense reductions had an impact of 0.01%.
(j) Rounds to less than 0.01% per share.
(k) Bank of America Corporation assumed certain non-recurring costs. Absent these non-recurring costs, the waiver/reimbursement ratio would have been -% for the period ended March 31, 2006.
See Accompanying Notes to Financial Statements.
72
Financial Highlights – Columbia Multi-Advisor International Equity Fund
Selected data for a share outstanding throughout each period is as follows:
| | | Year
Ended
February 28, | | Year
Ended
February 29, | | Period
Ended
February 28, | | Year Ended March 31, | |
| Class Z Shares | | 2009 | | 2008 | | 2007 (a) | | 2006 (b) | | 2005 | | 2004 | |
| Net Asset Value, Beginning of Period | | $ | 15.96 | | | $ | 17.29 | | | $ | 16.58 | | | $ | 13.44 | | | $ | 12.13 | | | $ | 8.01 | | |
| Income from Investment Operations: | |
| Net investment income (c) | | | 0.29 | | | | 0.32 | | | | 0.19 | | | | 0.24 | | | | 0.16 | | | | 0.13 | | |
Net realized and unrealized gain (loss)
on investments and foreign currency | | | (8.43 | ) | | | 0.78 | | | | 1.93 | | | | 3.25 | | | | 1.19 | | | | 4.11 | | |
| Total from investment operations | | | (8.14 | ) | | | 1.10 | | | | 2.12 | | | | 3.49 | | | | 1.35 | | | | 4.24 | | |
| Less Distributions to Shareholders: | |
| From net investment income | | | (0.11 | ) | | | (0.32 | ) | | | (0.25 | ) | | | (0.30 | ) | | | (0.04 | ) | | | (0.12 | ) | |
| From net realized gains | | | (0.19 | ) | | | (2.11 | ) | | | (1.16 | ) | | | (0.05 | ) | | | — | | | | — | | |
| Total distributions to shareholders | | | (0.30 | ) | | | (2.43 | ) | | | (1.41 | ) | | | (0.35 | ) | | | (0.04 | ) | | | (0.12 | ) | |
| Redemption Fees: | |
| Redemption fees added to paid-in-capital (d) | | | — | | | | — | | | | — | | | | — | | | | — | | | | — | | |
| Net Asset Value, End of Period | | $ | 7.52 | | | $ | 15.96 | | | $ | 17.29 | | | $ | 16.58 | | | $ | 13.44 | | | $ | 12.13 | | |
| Total return (e) | | | (51.76 | )% | | | 5.42 | % | | | 13.73 | %(f) | | | 26.24 | % | | | 11.10 | % | | | 53.06 | % | |
Ratios to Average Net Assets/
Supplemental Data: | |
| Net expenses before interest expense | | | 1.02 | %(g) | | | 0.94 | %(g) | | | 0.90 | %(g)(h) | | | 0.89 | %(i) | | | 1.01 | %(g) | | | 1.12 | %(g) | |
| Interest expense | | | — | | | | — | %(j) | | | — | %(h)(j) | | | — | | | | — | %(j) | | | — | %(j) | |
| Net expenses | | | 1.02 | %(g) | | | 0.94 | %(g) | | | 0.90 | %(g)(h) | | | 0.89 | %(i) | | | 1.01 | %(g) | | | 1.12 | %(g) | |
| Waiver/Reimbursement | | | — | | | | — | | | | — | | | | 0.08 | %(k) | | | 0.12 | %(k) | | | 0.03 | %(k) | |
| Net investment income | | | 2.28 | %(g) | | | 1.79 | %(g) | | | 1.26 | %(h) | | | 1.68 | % | | | 1.26 | % | | | 0.99 | % | |
| Portfolio turnover rate | | | 83 | % | | | 78 | % | | | 73 | %(f) | | | 74 | % | | | 153 | % | | | 86 | % | |
| Net assets, end of period (000's) | | $ | 1,155,598 | | | $ | 2,549,057 | | | $ | 2,352,583 | | | $ | 1,841,838 | | | $ | 1,199,712 | | | $ | 917,391 | | |
(a) The Fund changed its fiscal year end from March 31 to February 28. Per share data and total return reflect activity from April 1, 2006 through February 28, 2007.
(b) On August 22, 2005, the Fund's Primary A shares were renamed Class Z shares.
(c) Per share data was calculated using the average shares outstanding during the period.
(d) Rounds to less than $0.01 per share.
(e) Total return at net asset value assuming all distributions reinvested.
(f) Not annualized.
(g) The benefits derived from expense reductions had an impact of less than 0.01%.
(h) Annualized.
(i) The benefits derived from expense reductions had an impact of 0.01%.
(j) Rounds to less than 0.01% per share.
(k) Bank of America Corporation assumed certain non-recurring costs. Absent these non-recurring costs, the waiver/reimbursement ratio would have been -%, 0.09% and 0.01% for the years ended March 31, 2006, March 31, 2005 and March 31, 2004, respectively.
See Accompanying Notes to Financial Statements.
73
Notes to Financial Statements – International/Global Stock Funds
February 28, 2009
Note 1. Organization
Columbia Funds Series Trust (the "Trust") is registered under the Investment Company Act of 1940, as amended (the "1940 Act"), as an open-end investment company. Information presented in these financial statements pertains to the following series of the Trust (each a "Fund" and collectively, the "Funds"):
Columbia Global Value Fund
Columbia International Value Fund
Columbia Marsico Global Fund
Columbia Marsico International Opportunities Fund
Columbia Multi-Advisor International Equity Fund
Investment Objectives
Columbia Global Value Fund and Columbia International Value Fund each seek long-term capital appreciation. Columbia Marsico Global Fund and Columbia Marsico International Opportunities Fund each seek long-term growth of capital. Columbia Multi-Advisor International Equity Fund seeks long-term capital growth.
Columbia International Value Fund (the "Feeder Fund") seeks to achieve its investment objective by investing all or substantially all of its assets in Columbia International Value Master Portfolio (the "Master Portfolio"). The Master Portfolio is a series of Columbia Funds Master Investment Trust, LLC (the "Master Trust"). The Master Portfolio has the same investment objective as the Feeder Fund. The value of the Feeder Fund's investment in the Master Portfolio included on the Statements of Assets and Liabilities reflects the Feeder Fund's proportionate amount of beneficial interests in the net assets of the Master Portfolio which is equal to 85.4% at February 28, 2009. The financial statements of the Master Portfolio, including its investment portfolio, are included elsewhere within this report and should be read in conjunction with the Feeder Fund's financial statements. Another fund that is managed by Columbia Management Advi sors, LLC ("Columbia"), not registered under the 1940 Act, and whose financial statements are not presented here, also invests in the Master Portfolio.
Fund Shares
The Trust may issue an unlimited number of shares. Columbia Global Value Fund and Columbia International Value Fund each offer four classes of shares: Class A, Class B, Class C and Class Z shares. Columbia Marsico Global Fund offers four classes of shares: Class A, Class C, Class R and Class Z shares. Columbia Marsico International Opportunities Fund and Columbia Multi-Advisor International Equity Fund each offer five classes of shares: Class A, Class B, Class C, Class R and Class Z shares. Each share class has its own expense structure and sales charges, as applicable. Columbia Marsico Global Fund commenced operations on April 30, 2008. Subject to certain limited exceptions, Columbia Global Value Fund is no longer accepting new investments from current or prospective investors. Beginning March 31, 2009, Columbia International Value Fund will reopen for purchases from new and existing investors. Beginning on or about June 22, 20 09, the Funds will no longer accept investment in Class B shares from new or existing investors in the Funds' Class B shares, except in connection with the reinvestment of any dividend and/or capital gain distributions in Class B shares of the Funds and exchanges by existing Class B shareholders of the other Columbia Funds.
Class A shares are subject to a maximum front-end sales charge of 5.75% based on the amount of initial investment. Class A shares purchased without an initial sales charge in accounts aggregating $1 million to $50 million at the time of purchase are subject to a 1.00% contingent deferred sales charge ("CDSC") if the shares are sold within one year after purchase. Class B shares are subject to a maximum CDSC of 5.00% based upon the holding period after purchase. Class B shares will convert to Class A shares eight years after purchase. Class C shares are subject to a 1.00% CDSC on shares sold within one year after purchase. Class R and Class Z shares are offered continuously at net asset value. There are certain restrictions on the purchase of Class R and Class Z shares, as described in the Funds' prospectuses.
Note 2. Significant Accounting Policies
The preparation of financial statements in accordance with accounting principles generally accepted in the United States of America ("GAAP") requires management to make certain estimates and assumptions that affect the reported amounts of assets and liabilities, the disclosure of contingent assets and liabilities at the date of the financial statements and the reported amounts of revenue and expenses during the reporting period. Actual results could differ from those estimates. The following is a summary of significant accounting policies consistently followed by the Funds in the preparation of their financial statements.
74
International/Global Stock Funds, February 28, 2009 (continued)
Security Valuation
Equity securities are valued at the last sale price on the principal exchange on which they trade, except for securities traded on the NASDAQ, which are valued at the NASDAQ official close price. Unlisted securities or listed securities for which there were no sales during the day are valued at the closing bid price on such exchanges or over-the-counter markets.
Short-term investments maturing in 60 days or less are valued at amortized cost, which approximates market value.
Investments in other open-end investment companies are valued at net asset value.
Foreign securities are generally valued at the last sale price on the foreign exchange or market on which they trade. If any foreign share prices are not readily available as a result of limited share activity, the securities are valued at the last sale price of the local shares in the principal market in which such securities are normally traded.
Generally, trading in foreign securities is substantially completed each day at various times prior to the close of the New York Stock Exchange ("NYSE"). The values of such securities used in computing the net asset value of the Funds' shares are determined as of such times. Foreign currency exchange rates are generally determined at 4:00 p.m. Eastern (U.S.) time. Occasionally, events affecting the values of such foreign securities and such exchange rates may occur between the times at which they are determined and the close of the customary trading session of the NYSE, which would not be reflected in the computation of the Funds' net asset values. If events materially affecting the values of such foreign securities occur and it is determined that market quotations are not reliable, then these foreign securities will be valued at their fair value using procedures approved by the Board of Trustees.
Certain Funds may use a systematic fair valuation model provided by an independent third party to value securities principally traded in foreign markets in order to adjust for possible stale pricing that may occur between the close of the foreign exchanges and the time for valuation.
The Feeder Fund invests all or substantially all of its assets in the Master Portfolio. See the Notes to Financial Statements for the Master Portfolio included elsewhere in this report for the Master Portfolio's valuation policies.
Investments for which market quotations are not readily available, or that have quotations which management believes are not reliable, are valued at fair value as determined in good faith under consistently applied procedures established by and under the general supervision of the Board of Trustees. If a security is valued at fair value, such value is likely to be different from the last quoted market price for the security.
On March 1, 2008, the Funds adopted Statement of Financial Accounting Standards No. 157, Fair Value Measurements ("SFAS 157"), except for Columbia Marsico Global Fund which adopted SFAS 157 on April 30, 2008. SFAS 157 establishes a hierarchy that prioritizes the inputs to valuation techniques used to measure fair value giving the highest priority to unadjusted quoted prices in active markets for identical securities (level 1 measurements) and the lowest priority to unobservable inputs (level 3 measurements) when market prices are not readily available or reliable. The three levels of the fair value hierarchy under SFAS 157 are described below:
• Level 1 – quoted prices in active markets for identical securities
• Level 2 – prices determined using other significant observable inputs (including quoted prices for similar securities, interest rates, prepayment speeds, credit risk and others)
• Level 3 – prices determined using significant unobservable inputs. In situations where quoted prices or observable inputs are unavailable or less reliable, unobservable inputs may be used. Unobservable inputs may include management's own assumptions about the factors market participants would use in pricing an investment.
The inputs or methodology used for valuing securities are not necessarily an indication of the risk associated with investing in those securities.
The following tables summarize the inputs used, as of February 28, 2009, in valuing each Fund's assets:
Columbia Global Value Fund
| Valuation Inputs | | Investments in
Securities | | Other Financial
Instruments | |
| Level 1 – Quoted Prices | | $ | 29,025,657 | | | $ | — | | |
Level 2 – Other Significant
Observable Inputs | | | 35,702,080 | | | | — | | |
Level 3 – Significant
Unobservable Inputs | | | — | | | | — | | |
| Total | | $ | 64,727,737 | | | $ | — | | |
75
International/Global Stock Funds, February 28, 2009 (continued)
Columbia Marsico Global Fund
| Valuation Inputs | | Investments in
Securities | | Other Financial
Instruments | |
| Level 1 – Quoted Prices | | $ | 1,974,328 | | | $ | — | | |
Level 2 – Other Significant
Observable Inputs | | | 1,804,756 | | | | — | | |
Level 3 – Significant
Unobservable Inputs | | | — | | | | — | | |
| Total | | $ | 3,779,084 | | | $ | — | | |
Columbia Marsico International Opportunities Fund
| Valuation Inputs | | Investments in
Securities | | Other Financial
Instruments | |
| Level 1 – Quoted Prices | | $ | 279,738,055 | | | $ | — | | |
Level 2 – Other Significant
Observable Inputs | | | 778,908,222 | | | | — | | |
Level 3 – Significant
Unobservable Inputs | | | 746,858 | | | | — | | |
| Total | | $ | 1,059,393,135 | | | $ | — | | |
The following table reconciles asset balances for the year ending February 28, 2009, in which significant unobservable inputs (Level 3) were used in determining value:
Columbia Marsico International Opportunities Fund
| | | Investments in
Securities | | Other Financial
Instruments | |
Balance as of
February 29, 2008 | | $ | — | | | $ | — | | |
Accretion of Discounts/
Amortization of Premiums | | | — | | | | — | | |
| Realized gain(loss) | | | — | | | | — | | |
Change in unrealized
appreciation
(depreciation) | | | (503,519 | ) | | | — | | |
| Net purchases/sales | | | 1,250,377 | | | | — | | |
Transfers into and/or
out of Level 3 | | | — | | | | — | | |
Balance as of
February 28, 2009 | | $ | 746,858 | | | $ | — | | |
The information in the above reconciliation represents fiscal year to date activity for any securities identified as using Level 3 inputs at either the beginning or the end of the current fiscal period.
The change in unrealized loss attributable to securities owned at February 28, 2009 which were valued using significant unobservable inputs (Level 3) amounted to $(503,519). This amount is included in net change in unrealized depreciation on the Statements of Changes in Net Assets.
Columbia Multi-Advisor International Equity Fund
| Valuation Inputs | | Investments in
Securities | | Other Financial
Instruments | |
| Level 1 – Quoted Prices | | $ | 179,937,901 | | | $ | — | | |
Level 2 – Other Significant
Observable Inputs | | | 984,301,139 | | | | — | | |
Level 3 – Significant
Unobservable Inputs | | | 419,147 | | | | — | | |
| Total | | $ | 1,164,658,187 | | | $ | — | | |
The following table reconciles asset balances for the year ending February 28, 2009 in which significant unobservable inputs (Level 3) were used in determining value:
Columbia Multi-Advisor International Equity Fund
| | | Investments in
Securities | | Other Financial
Instruments | |
Balance as of
February 29, 2008 | | $ | — | | | $ | — | | |
Accretion of Discounts/
Amortization of Premiums | | | — | | | | — | | |
| Realized gain (loss) | | | — | | | | — | | |
Change in unrealized
appreciation
(depreciation) | | | (280,306 | ) | | | — | | |
| Net purchases/sales | | | 699,453 | | | | — | | |
Transfers into and/
or out of Level 3 | | | — | | | | — | | |
Balance as of
February 28, 2009 | | $ | 419,147 | | | $ | — | | |
The information in the above reconciliation represents fiscal year to date activity for any securities identified as using Level 3 inputs at either the beginning or the end of the current fiscal period.
The change in unrealized loss attributable to securities owned at February 28, 2009 which were valued using significant unobservable inputs (Level 3) amounted to $(280,306). This amount is included in net change in unrealized depreciation on the Statements of Changes in Net Assets.
Security Transactions
Security transactions are accounted for on the trade date. Cost is determined and gains (losses) are based upon the specific
76
International/Global Stock Funds, February 28, 2009 (continued)
identification method for both financial statement and federal income tax purposes.
In March 2008, Statement of Financial Accounting Standards No. 161, Disclosures about Derivative Instruments and Hedging Activities—an amendment of FASB Statement No. 133 ("SFAS 161"), was issued. SFAS 161 is effective for fiscal years and interim periods beginning after November 15, 2008. SFAS 161 requires additional discussion about the reporting entity's derivative instruments and hedging activities, by providing for qualitative disclosures about the objectives and strategies for using derivatives, quantitative data about the fair value of and gains and losses on derivative contracts, and details of credit-risk-related contingent features in their derivative contracts. Management is evaluating the impact the application of SFAS 161 will have on the Funds' financial stateme nt disclosures.
Repurchase Agreements
Each Fund may engage in repurchase agreement transactions with institutions that Columbia has determined are creditworthy. Each Fund, through its custodian, receives delivery of the underlying securities collateralizing a repurchase agreement. Columbia is responsible for determining that the collateral is at least equal, at all times, to the value of the repurchase obligation including interest. A repurchase agreement transaction involves certain risks in the event of default or insolvency of the counterparty. These risks include possible delays in or restrictions on each Fund's ability to dispose of the underlying securities and a possible decline in the value of the underlying securities during the period while the Funds seek to assert their rights.
Foreign Currency Translations and Transactions
The values of all assets and liabilities quoted in foreign currencies are translated into U.S. dollars at that day's exchange rates. Net realized and unrealized gains (losses) on foreign currency transactions include gains (losses) arising from the fluctuation in exchange rates between trade and settlement dates on securities transactions, gains (losses) arising from the disposition of foreign currency and currency gains (losses) between the accrual and payment dates on dividends, interest income and foreign withholding taxes.
For financial statement purposes, the Funds do not distinguish that portion of gains (losses) on investments which is due to changes in foreign exchange rates from that which is due to changes in market prices of the investments. Such fluctuations are included with the net realized and unrealized gains (losses) on investments on the Statements of Operations.
Income Recognition
Interest income is recorded on the accrual basis.
Corporate actions and dividend income are recorded on the ex-date except for certain foreign securities which are recorded as soon after the ex-date as the Funds become aware of such, net of any non-reclaimable tax withholdings.
Expenses
General expenses of the Trust are allocated to the Funds and other series of the Trust based upon relative net assets or other expense allocation methodologies determined by the nature of the expense. Expenses directly attributable to a Fund are charged to such Fund.
Determination of Class Net Asset Value
All income, expenses (other than class-specific expenses, as shown on the Statement of Operations) and realized and unrealized gains (losses) are allocated to each class of a Fund on a daily basis for purposes of determining the net asset value of each class. Income and expenses are allocated to each class based on the settled shares method, while realized and unrealized gains (losses) are allocated based on the relative net assets of each class.
The Feeder Fund records its proportionate share of investment income, realized and unrealized gains (losses) and expenses reported by the Master Portfolio on a daily basis. The investment income, realized and unrealized gains (losses) and expenses are allocated daily to investors of the Master Portfolio based upon the relative value of their investment in the Master Portfolio.
Federal Income Tax Status
Each Fund intends to qualify each year as a "regulated investment company" under Subchapter M of the Internal Revenue Code, as amended, and will distribute substantially all of its taxable income, if any, for its tax year, and as such will not be subject to federal income taxes. In addition, each
77
International/Global Stock Funds, February 28, 2009 (continued)
Fund intends to distribute in each calendar year substantially all of its net investment income, capital gains and certain other amounts, if any, such that each Fund should not be subject to federal excise tax. Therefore, no federal income or excise tax provision is recorded.
Foreign Capital Gains Taxes
Realized gains in certain countries may be subject to foreign taxes at the fund level, at rates ranging from approximately 10% to 15%. The Funds accrue for such foreign taxes on net realized and unrealized gains at the appropriate rate for each jurisdiction.
Distributions to Shareholders
Distributions from net investment income, if any, are declared and distributed annually by each of the Funds. The Funds may, however, declare and pay distributions from net investment income more frequently. Each Fund will distribute net realized capital gains (including net short-term capital gains) at least annually after the fiscal year in which the capital gains were earned, unless offset by any available capital loss carryforward. Income distributions and capital gain distributions are determined in accordance with federal income tax regulations which may differ from GAAP.
Indemnification
In the normal course of business, each Fund enters into contracts that contain a variety of representations and warranties and which provide general indemnities. A Fund's maximum exposure under these arrangements is unknown because this would involve future claims against a Fund. Also, under the Trust's organizational documents and by contract, the Trustees and officers of the Trust are indemnified against certain liabilities that may arise out of actions relating to their duties to the Trust. However, based on experience, the Funds expect the risk of loss due to these representations, warranties and indemnities to be minimal.
Note 3. Federal Tax Information
The timing and character of income and capital gain distributions are determined in accordance with income tax regulations, which may differ from GAAP. Reclassifications are made to each Fund's capital accounts for permanent tax differences to reflect income and gains available for distribution (or available capital loss carryforwards) under income tax regulations.
For the year ended February 28, 2009, permanent book and tax differences resulting primarily from non-deductible 12b-1 fees, differing treatments for net operating losses, distribution reclasses and foreign currency transactions were identified and reclassified among the components of the Funds' net assets as follows:
| | | Undistributed or
(Overdistributed) or
Accumulated Net
Investment Income
(Loss) | | Accumulated
Net Realized
Gain (Loss) | | Paid-In Capital | |
| Columbia Global Value Fund | | $ | (101,142 | ) | | $ | 101,142 | | | $ | — | | |
| Columbia International Value Fund | | | (775,769 | ) | | | 2,789,515 | | | | (2,013,746 | ) | |
| Columbia Marsico Global Fund | | | 2,638 | | | | 2,574 | | | | (5,212 | ) | |
| Columbia Marsico International Opportunities Fund | | | (2,502,997 | ) | | | 2,316,298 | | | | 186,699 | | |
| Columbia Multi-Advisor International Equity Fund | | | (1,700,164 | ) | | | 1,601,300 | | | | 98,864 | | |
Net investment income and net realized gains (losses), as disclosed on the Statements of Operations, and net assets were not affected by these reclassifications.
78
International/Global Stock Funds, February 28, 2009 (continued)
The tax character of distributions paid during the years ended February 28, 2009 and February 29, 2008 was as follows:
| | | February 28, 2009 | |
| | | Ordinary
Income* | | Long-Term
Capital Gains | | Tax Return
of Capital | |
| Columbia Global Value Fund | | $ | 233,979 | | | $ | 18,868,824 | | | $ | — | | |
| Columbia International Value Fund | | | 84,192,381 | | | | 223,286,765 | | | | 1,088,951 | | |
| Columbia Marsico Global Fund | | | — | | | | — | | | | — | | |
| Columbia Marsico International Opportunities Fund | | | 548,803 | | | | 26,828,602 | | | | — | | |
| Columbia Multi-Advisor International Equity Fund | | | 23,022,083 | | | | 25,723,512 | | | | — | | |
| | | February 29, 2008 | |
| | | Ordinary
Income* | | Long-Term
Capital Gains | |
| Columbia Global Value Fund | | $ | 6,974,982 | | | $ | 71,248,376 | | |
| Columbia International Value Fund | | | 137,509,112 | | | | 704,446,688 | | |
| Columbia Marsico International Opportunities Fund | | | 176,089,717 | | | | 225,160,155 | | |
| Columbia Multi-Advisor International Equity Fund | | | 139,534,678 | | | | 217,641,066 | | |
* For tax purposes short-term capital gains distributions, if any, are considered ordinary income distributions.
As of February 28, 2009, the components of distributable earnings on a tax basis were as follows:
| | | Undistributed
Ordinary
Income | | Undistributed
Long-Term
Capital Gains | | Net Unrealized
Appreciation
(Depreciation)* | |
| Columbia Global Value Fund | | $ | 3,425,967 | | | $ | — | | | $ | (79,133,799 | ) | |
| Columbia International Value Fund | | | — | | | | — | | | | (1,135,608,735 | ) | |
| Columbia Marsico Global Fund | | | — | | | | — | | | | (1,449,373 | ) | |
| Columbia Marsico International Opportunities Fund | | | 26,852,582 | | | | — | | | | (533,720,324 | ) | |
| Columbia Multi-Advisor International Equity Fund | | | 29,562,738 | | | | — | | | | (591,550,634 | ) | |
* The differences between book-basis and tax-basis net unrealized appreciation/depreciation are primarily due to deferral of losses from wash sales, changes in the value of assets and liabilities resulting from changes in exchange rates, and the realization for tax-purposes of unrealized gains on certain forward foreign currency contracts.
79
International/Global Stock Funds, February 28, 2009 (continued)
Unrealized appreciation and depreciation at February 28, 2009, based on cost of investments for federal income tax purposes, excluding any unrealized appreciation and depreciation from changes in the value of other assets and liabilities resulting from changes in exchange rates, were:
| | | Unrealized
Appreciation | | Unrealized
Depreciation | | Net
Unrealized
Appreciation
(Depreciation) | |
| Columbia Global Value Fund | | $ | 4,169,179 | | | $ | (83,302,978 | ) | | $ | (79,133,799 | ) | |
| Columbia International Value Fund | | | N/A* | | | | N/A* | | | | N/A* | | |
| Columbia Marsico Global Fund | | | 28,970 | | | | (1,478,343 | ) | | | (1,449,373 | ) | |
| Columbia Marsico International Opportunities Fund | | | 58,311,336 | | | | (592,031,660 | ) | | | (533,720,324 | ) | |
| Columbia Multi-Advisor International Equity Fund | | | 59,387,591 | | | | (650,938,225 | ) | | | (591,550,634 | ) | |
* See the Master Portfolio notes to financial statements for tax basis information.
The following capital loss carryforwards, determined as of February 28, 2009, may be available to reduce taxable income arising from future net realized gains on investments, if any, to the extent permitted by the Internal Revenue Code:
| | | Year of Expiration
2017 | |
| Columbia Global Value Fund | | $ | 18,857,402 | | |
| Columbia Marsico Global Fund | | | 698,414 | | |
| Columbia Marsico International | |
| Opportunities Fund | | | 417,923,082 | | |
Columbia Multi-Advisor
International Equity Fund | | | 250,073,781 | | |
Under current tax rules, certain currency and capital losses realized after October 31 may be deferred and treated as occurring on the first day of the following fiscal year. As of February 28, 2009, post-October capital losses as follows attributed to security transactions were deferred to March 1, 2009:
| Columbia Global Value Fund | | $ | 16,357,333 | | |
| Columbia International Value Fund | | | 32,406,638 | | |
| Columbia Marsico Global Fund | | | 920,771 | | |
Columbia Marsico International
Opportunities Fund | | | 305,509,157 | | |
Columbia Multi-Advisor International
Equity Fund | | | 210,847,351 | | |
Under Financial Accounting Standards Board ("FASB") Interpretation No. 48, Accounting for Uncertainty in Income Taxes—an Interpretation of FASB Statement No. 109 ("FIN 48"), management determines whether a tax position of the Funds is more likely than not to be sustained upon examination by the applicable taxing authority, including resolution of any related appeals or litigation processes, based on the technical merits of the position. The tax benefit to be recognized is measured as the largest amount of benefit that is greater than fifty percent likely of being realized upon ultimate settlement. Management has evaluated the known implications of FIN 48 on its computation of net assets for each Fund. As a result of this evaluation, management has concluded that FIN 48 did no t have any effect on the Funds' financial statements. However, management's conclusions regarding FIN 48 may be subject to review and adjustment at a later date based on factors including, but not limited to, further implementation guidance from the FASB, new tax laws, regulations, and administrative interpretations (including relevant court decisions). The Funds' federal tax returns for the prior three fiscal years remain subject to examination by the Internal Revenue Service. The Funds are not aware of any tax positions for which it is reasonably possible that the total amounts of unrecognized tax benefits will significantly change in the next twelve months.
80
International/Global Stock Funds, February 28, 2009 (continued)
Note 4. Fees and Compensation Paid to Affiliates
Investment Advisory Fee
Columbia, an indirect, wholly owned subsidiary of Bank of America Corporation ("BOA"), provides investment advisory services to the Funds. Columbia receives a monthly investment advisory fee based on each Fund's average daily net assets at the following annual rates:
| | | First
$500
Million | | $500 Million
to $1
Billion | | $1 Billion
to $1.5
Billion | | $1.5 Billion
to $3
Billion | | $3 Billion
to $6
Billion | | Over
$6 Billion | |
| Columbia Global Value Fund | | | 0.90 | % | | | 0.85 | % | | | 0.80 | % | | | 0.75 | % | | | 0.73 | % | | | 0.71 | % | |
| Columbia Marsico Global Fund | | | 0.80 | % | | | 0.80 | % | | | 0.80 | % | | | 0.80 | % | | | 0.80 | % | | | 0.80 | % | |
Columbia Marsico International
Opportunities Fund | | | 0.80 | % | | | 0.80 | % | | | 0.80 | % | | | 0.80 | % | | | 0.80 | % | | | 0.80 | % | |
Columbia Multi-Advisor
International Equity Fund | | | 0.70 | % | | | 0.65 | % | | | 0.60 | % | | | 0.55 | % | | | 0.53 | % | | | 0.51 | % | |
The Feeder Fund indirectly pays for investment advisory and sub-advisory services and a portion of the administrative services through its investment in the Master Portfolio. (See Notes to Financial Statements of the Master Portfolio.)
For the year ended February 28, 2009, the effective investment advisory fee rates for the Funds, net of any fee waivers, as a percentage of each Fund's average daily net assets, were as follows:
| | | Effective
Rates | |
| Columbia Global Value Fund | | | 0.90 | % | |
| Columbia Marsico Global Fund | | | 0.80 | % | |
Columbia Marsico International
Opportunities Fund | | | 0.80 | % | |
Columbia Multi-Advisor International
Equity Fund | | | 0.62 | % | |
Sub-Advisory Fee
Brandes Investment Partners, L.P. ("Brandes") has been retained by Columbia to serve as the investment sub-advisor to Columbia Global Value Fund. As the sub-advisor, and subject to the oversight of Columbia and the Fund's Board of Trustees, Brandes is responsible for the daily investment operations, including placing all orders for the purchase and sale of the portfolio securities for the Fund. Columbia, from the investment advisory fee it receives, pays Brandes a monthly sub-advisory fee.
Columbia Multi-Advisor International Equity Fund is a "multi-manager" fund, which means that it is managed by more than one sub-advisor. Causeway Capital Management LLC ("Causeway") and Marsico Capital Management, LLC ("Marsico") are co-investment sub-advisors of the Fund. Pursuant to the sub-advisory agreement, Columbia, from the investment advisory fee it receives, pays Causeway and Marsico a monthly sub-advisory fee.
Marsico has also been retained by Columbia to serve as the investment sub-advisor to Columbia Marsico Global Fund and Columbia Marsico International Opportunities Fund. Columbia, from the investment advisory fee it receives, pays Marsico a monthly sub-advisory fee.
Marsico is entitled to receive a monthly sub-advisory fee for its services provided to Columbia Multi-Advisor International
81
International/Global Stock Funds, February 28, 2009 (continued)
Equity Fund and Columbia Marsico International Opportunities Fund at the following annual rates:
| Average Daily Net Assets* | | Annual Fee Rate | |
| Assets up to $6 billion | | | 0.45 | % | |
Assets in excess of $6 billion
and up to $10 billion | | | 0.40 | % | |
| Assets in excess of $10 billion | | | 0.35 | % | |
* For purposes of the calculation, "Assets" are aggregate assets sub-advised by Marsico in the following Columbia Funds: (i) Columbia Marsico International Opportunities Fund; (ii) Columbia Multi-Advisor International Equity Fund; (iii) Columbia Marsico International Opportunities Fund, Variable Series; and (vi) any future Columbia international equity fund sub-advised by Marsico which the Advisor and Marsico mutually agree in writing.
Marsico is also entitled to receive a monthly sub-advisory fee for its services provided to Columbia Marsico Global Fund, based on the Fund's average daily net assets, at the following annual rates:
| Average Daily Net Assets | | Annual Fee Rate | |
| Assets up to $1.5 billion | | | 0.45 | % | |
Assets in excess of $1.5 billion
and up to $3 billion | | | 0.40 | % | |
| Assets in excess of $3 billion | | | 0.35 | % | |
Administration Fee
Columbia provides administrative and other services to the Funds for a monthly administration fee based on each Fund's average daily net assets at the following annual rates, less the fees payable by the Funds as described under the Pricing and Bookkeeping Fees note below:
| | | Annual
Fee Rate | |
| Columbia Global Value Fund | | | 0.17 | % | |
| Columbia International Value Fund | | | 0.17 | % | |
| Columbia Marsico Global Fund | | | 0.22 | % | |
Columbia Marsico International
Opportunities Fund | | | 0.22 | % | |
| Columbia Multi-Advisor International | |
| Equity Fund | | | 0.17 | % | |
Pricing and Bookkeeping Fees
The Funds have entered into a Financial Reporting Services Agreement (the "Financial Reporting Services Agreement") with State Street Bank and Trust Company ("State Street") and Columbia pursuant to which State Street provides financial reporting services to the Funds. The Funds have also entered into an Accounting Services Agreement (collectively with the Financial Reporting Services Agreement, the "State Street Agreements") with State Street and Columbia pursuant to which State Street provides accounting services to the Funds. Under the State Street Agreements, each Fund pays State Street an annual fee of $38,000 paid monthly. In addition, each Fund except Columbia International Value Fund pays State Street a monthly fee based on an annualized percentage rate of average daily net assets of each Fund for the month. The aggregate fee for each Fund except Columbia International Value Fund will not exceed $140,000 per year (exclus ive of out-of-pocket expenses and charges). In addition, Columbia Multi-Advisor International Equity Fund also pays a multi-manager fee of $3,000 for each investment sub-advisor managing a portion of the Fund. The Funds also reimburse State Street for certain out-of-pocket expenses and charges.
The Funds have entered into a Pricing and Bookkeeping Oversight and Services Agreement (the "Services Agreement") with Columbia. Under the Services Agreement, Columbia provides services related to Fund expenses and the requirements of the Sarbanes-Oxley Act of 2002, and provides oversight of the accounting and financial reporting services provided by State Street. Under the Services Agreement, the Funds reimburse Columbia for out-of-pocket expenses.
Transfer Agent Fee
Columbia Management Services, Inc. (the "Transfer Agent"), an affiliate of Columbia and an indirect, wholly owned subsidiary of BOA, provides shareholder services to the Funds and has contracted with Boston Financial Data Services ("BFDS") to serve as sub-transfer agent. The Transfer Agent is entitled to receive a fee for its services, paid monthly, at the annual rate of $17.34 per open account plus reimbursement of certain sub-transfer agent fees paid by the Transfer Agent (exclusive of BFDS fees), calculated based on assets held in omnibus accounts and intended to recover the cost of payments to other parties (including affiliates of BOA) for services to those accounts. The Transfer Agent pays the fees
82
International/Global Stock Funds, February 28, 2009 (continued)
of BFDS for services as sub-transfer agent and is not entitled to reimbursement for such fees from the Funds.
The Transfer Agent may also retain, as additional compensation for its services, fees for wire, telephone and redemption orders, Individual Retirement Account ("IRA") trustee agent fees and account transcript fees due to the Transfer Agent from shareholders of the Funds and credits (net of bank charges) earned with respect to balances in accounts the Transfer Agent maintains in connection with its services to the Funds. The Transfer Agent also receives reimbursement for certain out-of-pocket expenses.
The Transfer Agent has voluntarily agreed to waive a portion of its fees for accounts other than omnibus accounts, so that transfer agent fees (exclusive of out-of-pocket expenses and sub-transfer agent fees) will not exceed 0.02% annually for Columbia Global Value Fund. The Transfer Agent, at its discretion, may revise or discontinue this arrangement at any time.
An annual minimum account balance fee of up to $20 may apply to certain accounts with a value below each Fund's initial minimum investment requirements to reduce the impact of small accounts on transfer agent fees. These minimum account balance fees are recorded as part of expense reductions on the Statements of Operations. For the year ended February 28, 2009, these minimum account balance fees reduced total expenses of the Funds as follows:
| Columbia Global Value Fund | | $ | 300 | | |
| Columbia International Value Fund | | | 1,260 | | |
| Columbia Marsico International | |
| Opportunities Fund | | | 920 | | |
| Columbia Multi-Advisor International | |
| Equity Fund | | | 1,429 | | |
Underwriting Discounts, Service and Distribution Fees
Columbia Management Distributors, Inc. (the "Distributor"), an affiliate of Columbia and an indirect, wholly owned subsidiary of BOA, is the principal underwriter of the Funds' shares. For the year ended February 28, 2009, the Distributor has retained net underwriting discounts on sales of Class A shares and received net CDSC fees on Class A, Class B and Class C share redemptions as follows:
| | | Front End Sales Charge | | CDSC | |
| | | Class A | | Class A | | Class B | | Class C | |
| Columbia Global Value Fund | | $ | 77 | | | $ | — | | | $ | 15,805 | | | $ | 58 | | |
| Columbia International Value Fund | | | 123 | | | | — | | | | 6,436 | | | | 241 | | |
| Columbia Marsico Global Fund | | | 696 | | | | — | | | | — | | | | 606 | | |
Columbia Marsico International
Opportunities Fund | | | 49,770 | | | | 4,689 | | | | 72,437 | | | | 20,577 | | |
| Columbia Multi-Advisor International Equity Fund | | | 4,955 | | | | — | | | | 2,895 | | | | 155 | | |
The Trust has adopted shareholder servicing plans ("Servicing Plans") and distribution plans ("Distribution Plans") for the Class B and Class C shares of each Fund and a combined distribution and shareholder servicing plan for Class A shares of each Fund. The Trust has also adopted a distribution plan for Class R shares of Columbia Marsico Global Fund, Columbia Marsico International Opportunities Fund and Columbia Multi-Advisor International Equity Fund. The shareholder servicing plans permit the Funds to compensate or reimburse servicing agents for the shareholder services they have provided. The distribution plans, adopted pursuant to Rule 12b-1 under the 1940 Act, permit the Funds to compensate or reimburse the Distributor and/or selling agents for activities or expenses primarily intended to result in the sale of the classes' shares. Payments are made at an annual rate and paid monthly, as a percentage of average daily net a ssets, set from time to time by the Board of Trustees, and are charged as expenses of each Fund directly to the applicable share class. A substantial portion of the expenses incurred pursuant to these plans is paid to affiliates of BOA and the Distributor.
83
International/Global Stock Funds, February 28, 2009 (continued)
The annual rates in effect and plan limits, as a percentage of average daily net assets are as follows:
| | | Current
Rate | | Plan Limit | |
Class A Combined Distribution
and Shareholder Servicing Plan | | | 0.25 | % | | | 0.25 | % | |
Class B and Class C
Shareholder Servicing Plans | | | 0.25 | % | | | 0.25 | % | |
Class B and Class C
Distribution Plans | | | 0.75 | % | | | 0.75 | % | |
| Class R Distribution Plan | | | 0.50 | % | | | 0.50 | % | |
Expense Limits and Fee Waivers
Columbia has contractually agreed to waive fees and/or reimburse expenses through June 30, 2009 for Columbia Global Value Fund and Columbia Marsico International Opportunities Fund and through June 30, 2010 for Columbia Marsico Global Fund, so that the expenses incurred by the Funds (exclusive of distribution and service fees, brokerage commissions, interest, taxes and extraordinary expenses, but inclusive of custodial charges relating to overdrafts, if any) after giving effect to any balance credits from the Funds' custodian, will not exceed the following annual rates, based on each Fund's average daily net assets:
| | | Annual rate | |
| Columbia Global Value Fund | | | 1.40 | % | |
| Columbia Marsico Global Fund | | | 1.35 | % | |
| Columbia Marsico International | |
| Opportunities Fund | | | 1.50 | % | |
To the extent that the Funds are not benefiting from a separate contractual expense limitation arrangement, Columbia has contractually agreed to waive a portion of its advisory fee for Columbia Marsico International Opportunities Fund and Columbia Multi-Advisor International Equity Fund through June 30, 2009.
The waiver amount is calculated based on the difference between the dollar amount of sub-advisory fees that would have been payable to Marsico based on the annualized rate of 0.45% of the Fund's average daily net assets, and the dollar amount of sub-advisory fees calculated on a monthly basis based on the annualized sub-advisory fee rates effective January 1, 2008 to which Marsico is entitled from the Fund which is described under the preceding Sub-Advisory Fee note. The annualized fee rate of 0.45% represents the sub-advisory fee rate which Marsico was entitled to receive immediately prior to January 1, 2008.
In the absence of a separate contractual expense limitation arrangement, the advisory fee waiver for Columbia Marsico International Opportunities Fund and Columbia Multi-Advisor International Equity Fund would be calculated as follows:
| Average Daily Net Assets* | | Advisory Fee Waiver | |
| Assets up to $6 billion | | | 0.00 | % | |
Assets in excess of $6 billion
and up to $10 billion | | | 0.05 | % | |
| Assets in excess of $10 billion | | | 0.10 | % | |
* For purposes of the calculation, "Assets" are aggregate assets sub-advised by Marsico in the following Columbia Funds: (i) Columbia Marsico International Opportunities Fund; (ii) Columbia Multi-Advisor International Equity Fund; (iii) Columbia Marsico International Opportunities Fund, Variable Series; and (vi) any future Columbia international equity fund sub-advised by Marsico which the Advisor and Marsico mutually agree in writing.
Columbia and/or the Distributor are entitled to recover from Columbia Global Value Fund and Columbia Marsico Global Fund any fees waived and/or expenses reimbursed for a three year period following the date of such fee waiver and/or reimbursement if such recovery does not cause a Fund's total operating expenses to exceed the expense limitations in effect at the time of recovery.
At February 28, 2009, $272,206, expiring February 29, 2012 was potentially recoverable from Columbia Marsico Global Fund pursuant to this arrangement.
Fees Paid to Officers and Trustees
All officers of the Funds are employees of Columbia or its affiliates and, with the exception of the Funds' Chief Compliance Officer, receive no compensation from the Funds. The Board of Trustees has appointed a Chief Compliance Officer to the Funds in accordance with federal securities regulations. The Funds, along with other affiliated funds, pay their pro-rata share of the expenses associated with the Chief Compliance Officer. Each Fund's expenses for the Chief Compliance Officer will not exceed $15,000 per year.
84
International/Global Stock Funds, February 28, 2009 (continued)
The Trust's eligible Trustees may participate in a non-qualified deferred compensation plan which may be terminated at any time. Any payments to plan participants are paid solely out of the Funds' assets. Income earned on the plan participant's deferral account is based on the rate of return of the eligible mutual funds selected by the participant or, if no funds are selected, on the rate of return of Columbia Treasury Reserves, another portfolio of the Trust. The expense for the deferred compensation plan which includes trustees' fees deferred during the current period as well as any gains or losses on the trustees' deferred compensation balances as a result of market fluctuations, is included in "Trustees' fees" on the Statements of Operations. The liability for the deferred compensation plan is included in "Trustees' fees" on the Statements of Assets and Liabilities
Other Related Party Transactions
In connection with the purchase and sale of their securities during the period, the Funds used several brokers that are affiliates of BOA. Total brokerage commissions paid to affiliated brokers for the year ended February 28, 2009 were as follows:
| Fund | | Broker | | Amount | |
Columbia Global
Value Fund | | Bank of America
Securities | | $ | 2,907 | | |
Columbia Marsico
Fund | | International
Opportunities
Merrill Lynch* | | | 24,111 | | |
Columbia
Equity Fund | | Multi-Advisor
International
Merrill Lynch* | | | 25,227 | | |
* Effective January 1, 2009, Merrill Lynch is a wholly owned subsidiary of Bank of America Corporation and an affiliate of Columbia Management.
Note 5. Custody Credits
Each Fund has an agreement with its custodian bank under which custody fees may be reduced by balance credits. These credits are recorded as part of expense reductions on the Statements of Operations. The Funds could have invested a portion of the assets utilized in connection with the expense offset arrangement in an income-producing asset if they had not entered into such an agreement.
For the year ended February 28, 2009, these custody credits reduced total expenses for the Funds as follows:
| | | Custody
Credits | |
| Columbia International Value Fund | | $ | 2 | | |
| Columbia Marsico Global Fund | | | 205 | | |
| Columbia Marsico International | |
| Opportunities Fund | | | 598 | | |
| Columbia Multi-Advisor International Equity Fund | | | 841 | | |
Note 6. Portfolio Information
For the year ended February 28, 2009, the cost of purchases and proceeds from sales of securities, excluding short-term obligations, for the Funds were as follows:
| | | Purchases | | Sales | |
Columbia Global
Value Fund | | $ | 15,460,890 | | | $ | 100,357,737 | | |
| Columbia Marsico | | | | | | | | | |
| Global Fund | | | 12,638,072 | | | | 6,622,430 | | |
Columbia Marsico
International
Opportunities Fund | | |
2,657,756,395 | | | |
3,015,291,392 | | |
| Columbia Multi-Advisor | | | | | | | | | |
| International | | | | | | | | | |
| Equity Fund | | | 1,621,618,319 | | | | 1,640,105,805 | | |
Note 7. Redemption Fees
The Funds may impose a 2.00% redemption fee on the proceeds of fund shares that are redeemed within 60 days of purchase. The redemption fee is designed to offset brokerage commissions and other costs associated with short term trading of the fund shares. The redemption fees, which are retained by the Funds, are accounted for as an addition to paid-in capital and are allocated to each class of the Funds
85
International/Global Stock Funds, February 28, 2009 (continued)
based on the relative net assets at the time of the redemption. For the year ended February 28, 2009, the Funds assessed redemption fees as follows:
| | | Redemption Fee | |
| | | Class A | | Class B | | Class C | | Class R | | Class Z | |
| Columbia Global Value Fund | | $ | 438 | | | $ | 123 | | | $ | 383 | | | $ | — | | | $ | 269 | | |
| Columbia International Value Fund | | | 11,836 | | | | 885 | | | | 2,012 | | | | — | | | | 31,467 | | |
| Columbia Marsico Global Fund | | | 66 | | | | — | | | | 53 | | | | 46 | | | | 52 | | |
| Columbia Marsico International Opportunities Fund | | | 44,718 | | | | 3,049 | | | | 7,910 | | | | 179,625 | | | | 366 | | |
| Columbia Multi-Advisor International Equity Fund | | | 2,541 | | | | 178 | | | | 215 | | | | 14 | | | | 163,141 | | |
Note 8. Line of Credit
The Funds and other affiliated funds participate in a $280,000,000 committed, unsecured revolving line of credit provided by State Street. The maximum amount that may be borrowed by any fund is limited to the lesser of $200,000,000 and the Fund's borrowing limit set forth in the Fund's registration statement. Borrowings are available for short-term liquidity or temporary or emergency purposes.
Interest is charged to each participating fund based on the fund's borrowings at a rate per annum equal to the greater of the Federal Funds Rate plus 0.50% or the overnight LIBOR Rate plus 0.50%. In addition, an annual operations agency fee of $20,000, an amendment fee of 0.02% and a commitment fee of 0.12% per annum are accrued and apportioned among the participating funds pro rata based on their relative net assets. Prior to October 16, 2008, the Funds and other affiliated funds participated in a $350,000,000 committed, unsecured revolving line of credit and a $150,000,000 uncommitted, unsecured line of credit, both provided by State Street. Interest on the committed line of credit was charged to each participating fund based on the fund's borrowings at a rate per annum equal to the Federal Funds Rate plus 0.50%. In addition, a commitment fee of 0.10% per annum was accrued and apportioned among the participating funds pro rata based on their relative net assets. Interest on the uncommitted line of credit was charged to each participating fund based on the fund's borrowings at a rate per annum equal to the Federal Funds Rate plus 0.375%. State Street charged an annual operations agency fee of $40,000 for the committed line of credit and was able to charge an annual administration fee of $15,000 for the uncommitted line of credit. The commitment fee, the operations agency fee and the administration fee were accrued and apportioned among the participating funds pro rata based on their relative net assets.
For the year ended February 28, 2009, Columbia Global Value Fund borrowed under these arrangements. The average daily loan balance outstanding on days where borrowing existed was $943,396 at a weighted average interest rate of 1.033%.
Note 9. Securities Lending
Columbia Global Value Fund may lend its securities to certain approved brokers, dealers and other financial institutions. Each loan is collateralized by cash, in an amount at least equal to the market value of the securities loaned plus accrued income from the investment of collateral. The market value of the loaned securities is determined at the close of business of the Fund and any additional required collateral is delivered to the Fund on the next business day. The collateral received is invested and the income generated by the investment of the collateral, net of any fees remitted to State Street as the lending agent and borrower rebates, is paid to the Fund. Generally, in the event of borrower default, the Fund has the right to use the collateral to offset any losses incurred. In the event the Fund is delayed in or prevented from exercising its right to dispose of the collateral, there may be a potential loss to the Fund. The Fund bears the risk of loss with respect to the investment of collateral.
Note 10. Shares of Beneficial Interest
As of February 28, 2009, the Funds had shareholders whose shares were beneficially owned by participant accounts over which BOA and/or any of its affiliates had either sole or joint
86
International/Global Stock Funds, February 28, 2009 (continued)
investment discretion. The percentages of shares of beneficial interest outstanding held therein are as follows:
| | | % of Shares
Outstanding
Held | |
| Columbia Global Value Fund | | | 39.2 | | |
| Columbia International Value Fund | | | 35.3 | | |
| Columbia Marsico Global Fund | | | 74.7 | | |
Columbia Marsico International
Opportunities Fund | | | 49.9 | | |
Columbia Multi-Advisor International
Equity Fund | | | 75.3 | | |
As of February 28, 2009, the Funds had shareholders that held greater than 5% of the shares outstanding of a Fund, over which BOA and/or any of its affiliates did not have investment discretion. The number of accounts and the percentages of shares of beneficial interest outstanding held therein are as follows:
| | | Number of
Shareholders | | % of Shares
Outstanding
Held | |
Columbia International
Value Fund | | | 2 | | | | 19.6 | | |
Subscription and redemption activity of these accounts may have a significant effect on the operations of the Funds.
Note 11. Significant Risks and Contingencies
Foreign Securities Risk
There are certain additional risks involved when investing in foreign securities. These risks may involve foreign currency exchange rate fluctuations, adverse political and economic developments and the possible prevention of currency exchange or other foreign governmental laws or restrictions. In addition, the liquidity of foreign securities may be more limited than that of domestic securities.
Investments in emerging market countries are subject to additional risk. The risk of foreign investments is typically increased in less developed countries. These countries are also more likely to experience high levels of inflation, deflation or currency devaluation which could hurt their economies and securities markets.
Legal Proceedings
Columbia Management Advisors, LLC and Columbia Management Distributors, Inc. (collectively, the "Columbia Group") are subject to a settlement agreement with the New York Attorney General ("NYAG") (the "NYAG Settlement") and a settlement order with the SEC (the "SEC Order") on matters relating to mutual fund trading, each dated February 9, 2005. Under the terms of the SEC Order, the Columbia Group (or predecessor entities) agreed, among other things, to: pay disgorgement and civil money penalties collectively totaling $375 million; cease and desist from violations of the antifraud provisions and certain other provisions of the federal securities laws; maintain certain compliance and ethics oversight structures; and retain an independent consultant to review the Columbia Group's applicable supervisory, compliance, control and other policies and procedures. The NYAG Settlement, among other things, requires Columbia Management Advisors, LLC and its affiliates to reduce management fees for certain funds in the Columbia family of mutual funds in a projected total of $160 million over five years through November 30, 2009 and to make certain disclosures to investors relating to expenses. In connection with the Columbia Group providing services to the Columbia Funds, the Columbia Funds have voluntarily undertaken to implement certain governance measures designed to maintain the independence of their boards of trustees and certain special consulting and compliance measures.
Pursuant to the SEC Order and related procedures, the $375 million in settlement amounts described above, of which approximately $90 million has been earmarked for certain Columbia Funds and their shareholders, is being distributed in accordance with a distribution plan developed by an independent distribution consultant and approved by the SEC on December 27, 2007. Distributions under the distribution plan began in mid-June 2008.
Civil Litigation
In connection with the events that resulted in the NYAG Settlement and SEC Order, various parties filed suits against Bank of America Corporation and certain of its affiliates,
87
International/Global Stock Funds, February 28, 2009 (continued)
including Banc of America Capital Management, LLC ("BACAP," now known as Columbia Management Advisors, LLC) and BACAP Distributors, LLC (now known as Columbia Management Distributors, Inc.) (collectively "BAC"), Nations Funds Trust (now known as Columbia Funds Series Trust) and its Board of Trustees. On February 20, 2004, the Judicial Panel on Multidistrict Litigation transferred these cases and cases against other mutual fund companies based on similar allegations to the United States District Court in Maryland for consolidated or coordinated pretrial proceedings (the "MDL"). Subsequently, additional related cases were transferred to the MDL. On September 29, 2004, the plaintiffs in the MDL filed amended and consolidated complaints. One of these amended complaints is a putative class action that includes claims under the federal securities laws and state common law, and that names Nations Funds Trust, the Trustees, BAC and othe rs as defendants. Another of the amended complaints is a derivative action purportedly on behalf of the Nations Funds Trust against BAC and others that asserts claims under federal securities laws and state common law. Nations Funds Trust is a nominal defendant in this action.
On February 25, 2005, BAC and other defendants filed motions to dismiss the claims in the pending cases. On December 15, 2005, BAC and others entered into a Stipulation of Settlement of the direct and derivative claims brought on behalf of the Nations Funds shareholders. The settlement is subject to court approval. If the settlement is approved, BAC would pay settlement administration costs and fees to plaintiffs' counsel as approved by the court. The stipulation has not yet been presented to the court for approval.
Note 12. Subsequent Event
Effective May 1, 2009, Columbia has voluntarily agreed to waive fees and or reimburse expenses for Columbia Multi-Advisor International Equity Fund so that the expenses incurred by the Fund (exclusive of distribution and service fees, brokerage commissions, interest, taxes and extraordinary expenses, but inclusive of custodial charges relating to overdrafts, if any) after giving effect to any balance credits from the Funds' custodian, do not exceed 1.35% annually.
Effective July 1, 2009, Columbia has voluntarily agreed to waive fees and or reimburse expenses for Columbia Global Value Fund and Columbia Marsico International Opportunities Fund so that the expenses incurred by the Funds (exclusive of distribution and service fees, brokerage commissions, interest, taxes and extraordinary expenses, but inclusive of custodial charges relating to overdrafts, if any) after giving effect to any balance credits from the Funds' custodian, do not exceed 1.35% annually.
88
Report of Independent Registered Public Accounting Firm
To the Shareholders and Trustees of Columbia Funds Series Trust
In our opinion, the accompanying statements of assets and liabilities, including the investment portfolios, and the related statements of operations and of changes in net assets and the financial highlights present fairly, in all material respects, the financial position of Columbia Global Value Fund, Columbia International Value Fund, Columbia Marsico Global Fund, Columbia Marsico International Opportunities Fund and Columbia Multi-Advisor International Equity Fund (constituting series of Columbia Funds Series Trust, hereafter referred to as the "Funds") at February 28, 2009, the results of each of their operations for the period then ended, the changes in each of their net assets and the financial highlights for each of the periods indicated, in conformity with accounting principles generally accepted in the United States of America. These financial statements and the financial highlights (hereafter referred to as "financial s tatements") are the responsibility of the Funds' management. Our responsibility is to express an opinion on these financial statements based on our audits. We conducted our audits of these financial statements in accordance with the standards of the Public Company Accounting Oversight Board (United States). Those standards require that we plan and perform the audit to obtain reasonable assurance about whether the financial statements are free of material misstatement. An audit includes examining, on a test basis, evidence supporting the amounts and disclosures in the financial statements, assessing the accounting principles used and significant estimates made by management, and evaluating the overall financial statement presentation. We believe that our audits, which included confirmation of securities at February 28, 2009 by correspondence with the custodian and brokers, provide a reasonable basis for our opinion.
PricewaterhouseCoopers LLP
Boston, Massachusetts
April 22, 2009
89
Federal Income Tax Information (Unaudited)
Columbia Global Value Fund
Foreign taxes paid during the fiscal year ended February 28, 2009, of $252,326 ($0.02 per share) are expected to be passed through to shareholders. This entire amount will be eligible for shareholders to claim as a foreign tax credit.
Gross income derived from sources within foreign countries was $4,273,421 ($0.27 per share) for the fiscal year ended February 28, 2009.
50.43% of the ordinary income distributed by the Fund, for the year ended February 28, 2009, qualified for the corporate dividends received deduction.
For non-corporate shareholders 100% or the maximum amount allowable under the Jobs and Growth Tax Relief Reconciliation Act of 2003, of income distributed by the Fund for the period March 1, 2008 to February 28, 2009 may represent qualified dividend income. Final information will be provided in your 2009 1099-DIV Form.
Columbia International Value Fund
The Fund hereby designates as a capital gain dividend with respect to the taxable year ended February 28, 2009, $31,186,246, or, if subsequently determined to be different, the net capital gain of such year.
Foreign taxes paid during the fiscal year ended February 28, 2009, of $8,093,382 ($0.07 per share) are expected to be passed through to shareholders. This entire amount will be eligible for shareholders to claim as a foreign tax credit.
Gross income derived from sources within foreign countries was $102,928,167 ($0.84 per share) for the fiscal year ended February 28, 2009.
For non-corporate shareholders 73.69% or the maximum amount allowable under the Jobs and Growth Tax Relief Reconciliation Act of 2003, of income distributed by the Fund for the period March 1, 2008 to February 28, 2009 may represent qualified dividend income. Final information will be provided in your 2009 1099-DIV Form.
Columbia Marsico International Opportunities Fund
Foreign taxes paid during the fiscal year ended February 28, 2009, of $6,113,159 ($0.04 per share) are expected to be passed through to shareholders. This entire amount will be eligible for shareholders to claim as a foreign tax credit.
Gross income derived from sources within foreign countries was $66,132,265 ($0.42 per share) for the fiscal year ended February 28, 2009.
For non-corporate shareholders 98.95% or the maximum amount allowable under the Jobs and Growth Tax Relief Reconciliation Act of 2003, of income distributed by the Fund for the period March 1, 2008 to February 28, 2009 may represent qualified dividend income. Final information will be provided in your 2009 1099-DIV Form.
0.22% of the ordinary income distributed by the Fund, for the year ended February 28, 2009, qualified for the corporate dividends received deduction.
Columbia Multi-Advisor International Equity Fund
Foreign taxes paid during the fiscal year ended February 28, 2009, of $7,102,343 ($0.05 per share) are expected to be passed through to shareholders. This entire amount will be eligible for shareholders to claim as a foreign tax credit.
Gross income derived from sources within foreign countries was $72,118,511 ($0.46 per share) for the fiscal year ended February 28, 2009.
For non-corporate shareholders 81.17% or the maximum amount allowable under the Jobs and Growth Tax Relief Reconciliation Act of 2003, of income distributed by the Fund for the period March 1, 2008 to February 28, 2009 may represent qualified dividend income. Final information will be provided in your 2009 1099-DIV Form.
90
Columbia Funds Master Investment Trust, LLC
Columbia International Value Master Portfolio Annual Report
February 28, 2009
The following pages should be read in conjunction with Columbia International Value Fund's Annual Report.
91
Investment Portfolio – Columbia International Value Master Portfolio
February 28, 2009
| Common Stocks – 98.5% | |
| | | Shares | | Value ($) | |
| Consumer Discretionary – 5.5% | |
| Automobiles – 0.4% | |
| Nissan Motor Co., Ltd. | | | 1,330,900 | | | | 4,172,912 | | |
| Renault SA | | | 125,200 | | | | 1,829,275 | | |
| Automobiles Total | | | 6,002,187 | | |
| Household Durables – 1.1% | |
| Sony Corp. | | | 897,900 | | | | 15,346,044 | | |
| Household Durables Total | | | 15,346,044 | | |
| Media – 1.5% | |
British Sky Broadcasting
Group PLC | | | 1,083,100 | | | | 7,291,538 | | |
| ITV PLC | | | 37,586,400 | | | | 13,317,654 | | |
| Media Total | | | 20,609,192 | | |
| Multiline Retail – 1.4% | |
Marks & Spencer Group
PLC, ADR | | | 2,485,740 | | | | 18,494,651 | | |
| Multiline Retail Total | | | 18,494,651 | | |
| Specialty Retail – 1.1% | |
| Kingfisher PLC | | | 7,819,700 | | | | 14,161,276 | | |
| Specialty Retail Total | | | 14,161,276 | | |
| Consumer Discretionary Total | | | 74,613,350 | | |
| Consumer Staples – 9.1% | |
| Food & Staples Retailing – 6.9% | |
| Carrefour SA | | | 891,160 | | | | 30,249,543 | | |
| Koninklijke Ahold NV | | | 2,496,732 | | | | 28,043,957 | | |
| Seven & I Holdings Co., Ltd. | | | 504,000 | | | | 11,335,417 | | |
Wm. Morrison
Supermarkets PLC | | | 6,214,365 | | | | 22,975,177 | | |
| Food & Staples Retailing Total | | | 92,604,094 | | |
| Food Products – 2.2% | |
| Unilever NV | | | 1,536,504 | | | | 29,705,522 | | |
| Food Products Total | | | 29,705,522 | | |
| Consumer Staples Total | | | 122,309,616 | | |
| Financials – 17.6% | |
| Commercial Banks – 10.8% | |
| Barclays PLC | | | 4,818,407 | | | | 6,442,763 | | |
Chuo Mitsui Trust
Holdings, Inc. | | | 1,436,000 | | | | 4,458,302 | | |
| Credit Agricole SA | | | 717,100 | | | | 7,098,479 | | |
| Credit Agricole SA (a) | | | 239,032 | | | | 2,344,064 | | |
| | | Shares | | Value ($) | |
| HSBC Holdings PLC | | | 1,980,044 | | | | 13,925,128 | | |
Hypo Real Estate
Holding AG, ADR | | | 253,261 | | | | 344,182 | | |
| Intesa Sanpaolo SpA | | | 8,435,186 | | | | 20,703,018 | | |
Mitsubishi UFJ Financial
Group, Inc. | | | 7,873,531 | | | | 36,626,703 | | |
| Mizuho Financial Group, Inc. | | | 15,183,000 | | | | 29,247,441 | | |
| Natixis | | | 2,080,100 | | | | 2,900,751 | | |
| Natixis (a) | | | 3,244,946 | | | | 4,525,159 | | |
Royal Bank of Scotland
Group PLC | | | 681,186 | | | | 227,501 | | |
Royal Bank of Scotland
Group PLC (a) | | | 416,280 | | | | 137,002 | | |
Royal Bank of Scotland
Group PLC, ADR | | | 20,467 | | | | 127,305 | | |
| San-In Godo Bank Ltd. | | | 233,000 | | | | 1,671,192 | | |
Sumitomo Mitsui Financial
Group, Inc. | | | 250,100 | | | | 8,123,541 | | |
Yamaguchi Financial
Group, Inc. | | | 754,000 | | | | 6,659,644 | | |
| Commercial Banks Total | | | 145,562,175 | | |
| Consumer Finance – 0.6% | |
| Aiful Corp. | | | 2,149,600 | | | | 2,268,649 | | |
| Takefuji Corp. | | | 1,689,230 | | | | 5,677,211 | | |
| Consumer Finance Total | | | 7,945,860 | | |
| Insurance – 6.2% | |
| Aegon NV | | | 5,311,757 | | | | 19,387,130 | | |
Mitsui Sumitomo Insurance
Group Holdings, Inc. | | | 1,373,000 | | | | 33,341,974 | | |
| Sompo Japan Insurance, Inc. | | | 832,000 | | | | 4,202,838 | | |
| Tokio Marine Holdings, Inc. | | | 1,021,900 | | | | 23,664,061 | | |
| XL Capital Ltd., Class A | | | 880,000 | | | | 2,912,800 | | |
| Insurance Total | | | 83,508,803 | | |
| Financials Total | | | 237,016,838 | | |
| Health Care – 16.1% | |
| Pharmaceuticals – 16.1% | |
| AstraZeneca PLC | | | 1,309,785 | | | | 42,058,237 | | |
| Daiichi Sankyo Co., Ltd. | | | 852,600 | | | | 13,899,140 | | |
| GlaxoSmithKline PLC | | | 2,407,048 | | | | 36,836,998 | | |
| Ono Pharmaceutical Co., Ltd. | | | 990,900 | | | | 46,298,520 | | |
| Sanofi-Aventis SA | | | 930,686 | | | | 48,274,678 | | |
| Taisho Pharmaceutical Co., Ltd. | | | 382,000 | | | | 6,928,019 | | |
| Takeda Pharmaceutical Co., Ltd. | | | 565,400 | | | | 23,115,385 | | |
| Pharmaceuticals Total | | | 217,410,977 | | |
| Health Care Total | | | 217,410,977 | | |
See Accompanying Notes to Financial Statements.
92
Columbia International Value Master Portfolio
February 28, 2009
| Common Stocks (continued) | |
| | | Shares | | Value ($) | |
| Industrials – 1.2% | |
| Commercial Services & Supplies – 1.2% | |
| Contax Participacoes SA, ADR | | | 2,827,200 | | | | 2,588,867 | | |
| Dai Nippon Printing Co., Ltd. | | | 1,555,000 | | | | 13,367,949 | | |
| Commercial Services & Supplies Total | | | 15,956,816 | | |
| Industrials Total | | | 15,956,816 | | |
| Information Technology – 14.1% | |
| Communications Equipment – 5.0% | |
| Alcatel-Lucent (b) | | | 9,071,300 | | | | 12,305,151 | | |
Telefonaktiebolaget LM
Ericsson, Class B | | | 6,574,668 | | | | 54,746,928 | | |
| Communications Equipment Total | | | 67,052,079 | | |
| Computers & Peripherals – 0.7% | |
| NEC Corp. | | | 3,879,000 | | | | 9,260,792 | | |
| Computers & Peripherals Total | | | 9,260,792 | | |
| Electronic Equipment, Instruments & Components – 2.9% | |
| FUJIFILM Holdings Corp. | | | 693,405 | | | | 13,215,157 | | |
| Hitachi Ltd. | | | 3,889,000 | | | | 9,882,391 | | |
| TDK Corp. | | | 185,000 | | | | 6,198,576 | | |
| Tyco Electronics Ltd. | | | 1,038,543 | | | | 9,845,388 | | |
Electronic Equipment,
Instruments & Components Total | | | 39,141,512 | | |
| Semiconductors & Semiconductor Equipment – 5.5% | |
| Infineon Technologies AG (b) | | | 1,748,573 | | | | 1,052,958 | | |
| Rohm Co., Ltd. | | | 725,400 | | | | 35,156,944 | | |
| STMicroelectronics NV | | | 4,215,100 | | | | 18,686,896 | | |
| United Microelectronics Corp. | | | 90,032,817 | | | | 20,206,899 | | |
Semiconductors & Semiconductor
Equipment Total | | | 75,103,697 | | |
| Information Technology Total | | | 190,558,080 | | |
| Materials – 3.1% | |
| Chemicals – 3.1% | |
| Akzo Nobel NV | | | 564,100 | | | | 19,977,375 | | |
| BASF SE | | | 787,700 | | | | 21,929,404 | | |
| Chemicals Total | | | 41,906,779 | | |
| Materials Total | | | 41,906,779 | | |
| Telecommunication Services – 27.6% | |
| Diversified Telecommunication Services – 24.8% | |
Brasil Telecom Participacoes
SA, ADR | | | 232,523 | | | | 7,291,921 | | |
Deutsche Telekom AG,
Registered Shares | | | 4,885,600 | | | | 59,242,930 | | |
| | | Shares | | Value ($) | |
| France Telecom SA | | | 1,369,112 | | | | 30,912,672 | | |
| KT Corp., ADR | | | 1,730,090 | | | | 20,795,682 | | |
Nippon Telegraph &
Telephone Corp. | | | 942,500 | | | | 41,043,343 | | |
Portugal Telecom SGPS
SA, ADR | | | 5,584,476 | | | | 44,899,187 | | |
| Swisscom AG, ADR | | | 969,800 | | | | 29,302,119 | | |
Tele Norte Leste Participacoes
SA, ADR | | | 916,800 | | | | 11,111,616 | | |
Telecom Corp. of New Zealand
Ltd., ADR | | | 2,168,604 | | | | 12,621,275 | | |
| Telecom Italia SpA | | | 16,491,810 | | | | 20,207,093 | | |
Telecom Italia SpA,
Savings Shares | | | 10,039,010 | | | | 9,647,033 | | |
| Telefonica SA, ADR | | | 362,381 | | | | 20,133,888 | | |
Telefonos de Mexico SA de CV,
ADR, Class L | | | 1,158,962 | | | | 15,924,138 | | |
Telmex Internacional
SAB de CV, ADR | | | 1,613,640 | | | | 12,312,073 | | |
Diversified Telecommunication
Services Total | | | 335,444,970 | | |
| Wireless Telecommunication Services – 2.8% | |
| SK Telecom Co., Ltd. | | | 160,077 | | | | 19,573,144 | | |
| SK Telecom Co., Ltd., ADR | | | 917,839 | | | | 12,289,864 | | |
Telemig Celular
Participacoes SA | | | 20,203 | | | | 782,058 | | |
| Tim Participacoes SA, ADR | | | 127,738 | | | | 1,810,047 | | |
| Vivo Participacoes SA, ADR | | | 172,874 | | | | 2,802,288 | | |
| Wireless Telecommunication Services Total | | | 37,257,401 | | |
| Telecommunication Services Total | | | 372,702,371 | | |
| Utilities – 4.2% | |
| Electric Utilities – 4.2% | |
Centrais Electricas Brasileiras
SA, ADR | | | 3,221,667 | | | | 34,794,004 | | |
Korea Electric Power Corp.,
ADR (b) | | | 2,959,950 | | | | 22,584,418 | | |
| Electric Utilities Total | | | 57,378,422 | | |
| Utilities Total | | | 57,378,422 | | |
Total Common Stocks
(cost of $2,465,245,937) | | | 1,329,853,249 | | |
See Accompanying Notes to Financial Statements.
93
Columbia International Value Master Portfolio
February 28, 2009
| Short-Term Obligation – 1.2% | |
| | | Par ($) | | Value ($) | |
Repurchase agreement with
Fixed Income Clearing Corp.,
dated 02/27/09, due 03/02/09
at 0.190%, collateralized by
a U.S. Government Agency Obligation
maturing 12/03/13, market value
$15,985,515 (repurchase
proceeds $15,670,248) | | | 15,670,000 | | | | 15,670,000 | | |
Total Short-Term Obligation
(cost of $15,670,000) | | | 15,670,000 | | |
Total Investments – 99.7%
(cost of $2,480,915,937) (c) | | | 1,345,523,249 | | |
| Other Assets & Liabilities, Net – 0.3% | | | 4,689,145 | | |
| Net Assets – 100.0% | | | 1,350,212,394 | | |
Notes to Investment Portfolio:
(a) Securities exempt from registration pursuant to Rule 144A under the Securities Act of 1933. These securities may be resold in transactions exempt from registration, normally to qualified institutional buyers. At February 28, 2009, these securities, which are not illiquid, amounted to $7,006,225, which represents 0.5% of net assets.
(b) Non-income producing security.
(c) Cost for federal income tax purposes is $2,481,131,984.
The Master Portfolio was invested in the following countries at February 28, 2009.
Summary of Securities
By Country (Unaudited) | | Value | | % of Total
Investments | |
| Japan | | $ | 405,162,148 | | | | 30.1 | | |
| United Kingdom | | | 175,995,229 | | | | 13.1 | | |
| France | | | 140,439,772 | | | | 10.4 | | |
| Netherlands | | | 115,800,880 | | | | 8.6 | | |
| Germany | | | 82,569,474 | | | | 6.1 | | |
| South Korea | | | 75,243,108 | | | | 5.6 | | |
| Brazil | | | 61,180,801 | | | | 4.6 | | |
| Sweden | | | 54,746,927 | | | | 4.1 | | |
| Italy | | | 50,557,143 | | | | 3.8 | | |
| Portugal | | | 44,899,187 | | | | 3.3 | | |
| Switzerland | | | 29,302,119 | | | | 2.2 | | |
| Mexico | | | 28,236,211 | | | | 2.1 | | |
| Taiwan | | | 20,206,899 | | | | 1.5 | | |
| Spain | | | 20,133,888 | | | | 1.5 | | |
| United States* | | | 15,670,000 | | | | 1.2 | | |
| Bermuda | | | 12,758,188 | | | | 0.9 | | |
| New Zealand | | | 12,621,275 | | | | 0.9 | | |
| | | $ | 1,345,523,249 | | | | 100.0 | | |
* Includes short-term obligation.
Certain securities are listed by country of underlying exposure but may trade predominantly on another exchange.
| Acronym | | Name | |
| ADR | | American Depositary Receipt | |
|
See Accompanying Notes to Financial Statements.
94
Statement of Assets and Liabilities – Columbia International Value Master Portfolio
February 28, 2009
| | | | | ($) | |
| Assets | | Investments, at identified cost | | | 2,480,915,937 | | |
| | | Investments, at value | | | 1,345,523,249 | | |
| | | Cash | | | 828 | | |
| | | Foreign currency (cost of $320,481) | | | 319,926 | | |
| | | Receivable for: | | | | | |
| | | Dividends | | | 5,465,982 | | |
| | | Interest | | | 166 | | |
| | | Other assets | | | 29,808 | | |
| | | Total Assets | | | 1,351,339,959 | | |
| Liabilities | | Payable for: | | | | | |
| | | Investment advisory fee | | | 900,567 | | |
| | | Administration fee | | | 44,571 | | |
| | | Trustees' fees | | | 30,029 | | |
| | | Pricing and bookkeeping fees | | | 13,400 | | |
| | | Custody fee | | | 86,543 | | |
| | | Other liabilities | | | 52,455 | | |
| | | Total Liabilities | | | 1,127,565 | | |
| | | Net Assets | | | 1,350,212,394 | | |
See Accompanying Notes to Financial Statements.
95
Statement of Operations – Columbia International Value Master Portfolio
For the Year Ended February 28, 2009
| | | | | ($) | |
| Investment Income | | Dividends | | | 118,676,949 | | |
| | | Interest | | | 225,389 | | |
| | | Securities lending | | | 8,093,299 | | |
| | | Foreign taxes withheld | | | (16,794,293 | ) | |
| | | Total income | | | 110,201,344 | | |
| Expenses | | Investment advisory fee | | | 18,922,007 | | |
| | | Administration fee | | | 1,106,043 | | |
| | | Pricing and bookkeeping fees | | | 151,097 | | |
| | | Trustees' fees | | | (1,375 | ) | |
| | | Custody fee | | | 694,840 | | |
| | | Other expenses | | | 138,236 | | |
| | | Total expenses before interest expense | | | 21,010,848 | | |
| | | Interest expense | | | 53,780 | | |
| | | Total Expenses | | | 21,064,628 | | |
| | | Custody earnings credits | | | (1,789 | ) | |
| | | Net Expenses | | | 21,062,839 | | |
| | | Net Investment Income | | | 89,138,505 | | |
Net Realized and Unrealized
Gain (Loss) on Investments and
Foreign Currency | | Net realized gain (loss) on: | | | | | |
| | | Investments | | | 1,085,482 | | |
| | | Foreign currency transactions | | | (1,226,811 | ) | |
| | | Net realized loss | | | (141,329 | ) | |
| | | Net change in unrealized appreciation (depreciation) on: | | | | | |
| | | Investments | | | (1,226,650,695 | ) | |
| | | Foreign currency translations | | | (213,220 | ) | |
| | | Net change in unrealized appreciation (depreciation) | | | (1,226,863,915 | ) | |
| | | Net Loss | | | (1,227,005,244 | ) | |
| | | Net Decrease Resulting from Operations | | | (1,137,866,739 | ) | |
See Accompanying Notes to Financial Statements.
96
Statement of Changes in Net Assets – Columbia International Value Master Portfolio
| Increase (Decrease) in Net Assets | | | | Year Ended
February 28,
2009 ($) | | Period April 1,
2007 through
February 29,
2008 (a)($) | | Year Ended
March 31,
2007 ($) | |
| Operations | | Net investment income | | | 89,138,505 | | | | 128,026,083 | | | | 74,024,116 | | |
| | | Net realized gain (loss) on investments
and foreign currency transactions | | | (141,329 | ) | | | 798,187,040 | | | | 604,868,524 | | |
| | | Net change in unrealized appreciation
(depreciation) on investments
and foreign currency translations | | | (1,226,863,915 | ) | | | (1,151,105,385 | ) | | | 175,449,991 | | |
| | | Net Increase (Decrease) Resulting
from Operations | | | (1,137,866,739 | ) | | | (224,892,262 | ) | | | 854,342,631 | | |
| | | Contributions | | | 430,376,554 | | | | 342,330,292 | | | | 279,432,207 | | |
| | | Withdrawals | | | (1,334,632,286 | ) | | | (1,343,492,878 | ) | | | (974,514,599 | ) | |
| | | Net Increase (Decrease) in
Net Assets | | | (2,042,122,471 | ) | | | (1,226,054,848 | ) | | | 159,260,239 | | |
| Net Assets | | Beginning of period | | | 3,392,334,865 | | | | 4,618,389,713 | | | | 4,459,129,474 | | |
| | | End of period | | | 1,350,212,394 | | | | 3,392,334,865 | | | | 4,618,389,713 | | |
(a) The Master Portfolio changed its fiscal year end from March 31 to February 29.
See Accompanying Notes to Financial Statements.
97
Financial Highlights – Columbia International Value Master Portfolio
| | | Year
Ended
February 28, | | Period
Ended
February 29, | | Year Ended March 31, | |
| | | 2009 | | 2008 (a) | | 2007 | | 2006 | | 2005 | | 2004 | |
| Total return | | | (42.12 | )% | | | (6.79 | )%(b) | | | 20.95 | % | | | 24.88 | % | | | 13.85 | % | | | 79.88 | % | |
Ratios to Average Net Assets/
Supplemental Data: | |
| Net expenses before interest expense (c) | | | 0.84 | % | | | 0.81 | %(d) | | | 0.80 | % | | | 0.80 | % | | | 0.86 | % | | | 0.90 | % | |
| Interest expense (e) | | | — | % | | | — | %(d) | | | — | % | | | — | % | | | — | % | | | — | % | |
| Net expenses (c) | | | 0.84 | % | | | 0.81 | %(d) | | | 0.80 | % | | | 0.80 | % | | | 0.86 | % | | | 0.90 | % | |
| Waiver/Reimbursement | | | — | | | | — | | | | — | | | | — | | | | 0.05 | % | | | 0.06 | % | |
| Net investment income (c) | | | 3.58 | % | | | 3.27 | %(d) | | | 1.66 | % | | | 1.88 | % | | | 1.57 | % | | | 1.34 | % | |
| Portfolio turnover rate | | | 5 | % | | | 24 | %(b) | | | 19 | % | | | 20 | % | | | 21 | % | | | 15 | % | |
(a) The Master Portfolio changed its fiscal year end from March 31 to February 29. Per share data and total return reflects activity from April 1, 2007 through February 29, 2008.
(b) Not annualized.
(c) The benefits derived from custody credits had an impact of less than 0.01%.
(d) Annualized.
(e) Rounds to less than 0.01%.
See Accompanying Notes to Financial Statements.
98
Notes to Financial Statements – Columbia International Value Master Portfolio
February 28, 2009
Note 1. Organization
Columbia Funds Master Investment Trust, LLC (the "Master Trust") is registered under the Investment Company Act of 1940, as amended (the "1940 Act"), as an open-end management investment company. Information presented in these financial statements pertains only to Columbia International Value Master Portfolio (the "Master Portfolio").
The following investors were invested in the Master Portfolio at February 28, 2009:
| Columbia International Value Master Portfolio: | |
Columbia International
Value Fund (the "Feeder Fund") | | | 85.4 | % | |
Banc of America Capital Management
Funds VII, LLC—International Value Fund | | | 14.6 | % | |
This series of the Master Trust serves as a master portfolio for the Columbia International Value Fund that operates as a feeder fund in a master/feeder structure.
Note 2. Significant Accounting Policies
The preparation of financial statements in accordance with accounting principles generally accepted in the United States of America ("GAAP") requires management to make certain estimates and assumptions that affect the reported amounts of assets and liabilities, the disclosure of contingent assets and liabilities at the date of the financial statements and the reported amounts of revenue and expenses during the reporting period. Actual results could differ from those estimates. The following is a summary of significant accounting policies consistently followed by the Master Portfolio in the preparation of its financial statements.
Security Valuation
Equity securities are valued at the last sale price on the principal exchange on which they trade, except for securities traded on the NASDAQ, which are valued at the NASDAQ official close price. Unlisted securities or listed securities for which there were no sales during the day are valued at the closing bid price on such exchanges or over-the-counter markets.
Short-term investments maturing in 60 days or less are valued at amortized cost, which approximates market value.
Investments in other open-end investment companies are valued at net asset value.
Foreign securities are generally valued at the last sale price on the foreign exchange or market on which they trade. If any foreign share prices are not readily available as a result of limited share activity, the securities are valued at the last sale price of the local shares in the principal market in which such securities are normally traded.
Generally, trading in foreign securities is substantially completed each day at various times prior to the close of the New York Stock Exchange ("NYSE"). The values of such securities used in computing the net asset value of the Master Portfolio's shares are determined as of such times. Foreign currency exchange rates are generally determined at 4:00 p.m. Eastern (U.S.) time. Occasionally, events affecting the values of such foreign securities and such exchange rates may occur between the times at which they are determined and the close of the customary trading session of the NYSE, which would not be reflected in the computation of the Master Portfolio's net asset value. If events materially affecting the values of such foreign securities occur and it is determined that market quotations are not reliable, then these foreign securities will be valued at their fair value using procedures approved by the Board of Trustees.
The Master Portfolio may use a systematic fair valuation model provided by an independent third party to value securities principally traded in foreign markets in order to adjust for possible stale pricing that may occur between the close of the foreign exchanges and the time for valuation.
Investments for which market quotations are not readily available, or that have quotations which management believes are not reliable, are valued at fair value as determined in good faith under consistently applied procedures established by and under the general supervision of the Board of Trustees. If a security is valued at a fair value, such value is likely to be different from the last quoted market price for the security.
On March 1, 2008, the Master Portfolio adopted Statement of Financial Accounting Standards No. 157, Fair Value Measurements ("SFAS 157"). SFAS 157 establishes a hierarchy that prioritizes the inputs to valuation techniques used to measure fair value giving the highest priority to unadjusted quoted prices in active markets for identical securities (level 1 measurements) and the lowest priority to unobservable inputs
99
Columbia International Value Master Portfolio, February 28, 2009 (continued)
(level 3 measurements) when market prices are not readily available or reliable. The three levels of the fair value hierarchy under SFAS 157 are described below:
• Level 1 – quoted prices in active markets for identical securities
• Level 2 – prices determined using other significant observable inputs (including quoted prices for similar securities, interest rates, prepayment speeds, credit risk and others)
• Level 3 – prices determined using significant unobservable inputs. In situations where quoted prices or observable inputs are unavailable or less reliable, unobservable inputs may be used. Unobservable inputs may include management's own assumptions about the factors market participants would use in pricing an investment.
The inputs or methodology used for valuing securities are not necessarily an indication of the risk associated with investing in those securities.
The following table summarizes the inputs used, as of February 28, 2009, in valuing the Master Portfolio's assets:
| Valuation Inputs | | Investments in
Securities | | Other Financial
Instruments | |
| Level 1 – Quoted Prices | | $ | 233,037,953 | | | $ | — | | |
Level 2 – Other Significant
Observable Inputs | | | 1,112,485,296 | | | | — | | |
Level 3 – Significant
Unobservable Inputs | | | — | | | | — | | |
| Total | | $ | 1,345,523,249 | | | $ | — | | |
Security Transactions
Security transactions are accounted for on the trade date. Cost is determined and gains (losses) are based upon the specific identification method for both financial statement and federal income tax purposes.
In March 2008, Statement of Financial Accounting Standards No. 161, Disclosures about Derivative Instruments and Hedging Activities—an amendment of FASB Statement No. 133 ("SFAS 161"), was issued. SFAS 161 is effective for fiscal years and interim periods beginning after November 15, 2008. SFAS 161 requires additional discussion about the reporting entity's derivative instruments and hedging activities, by providing for qualitative disclosures about the objectives and strategies for using derivatives, quantitative data about the fair value of and gains and losses on derivative contracts, and details of credit-risk-related contingent features in their derivative contracts. Management is evaluating the impact the application of SFAS 161 will have on the Master Portfolio's finan cial statement disclosures.
Repurchase Agreements
The Master Portfolio may engage in repurchase agreement transactions with institutions that Columbia Management Advisors, LLC ("Columbia"), the Master Portfolio's investment advisor, has determined are creditworthy. The Master Portfolio, through its custodian, receives delivery of the underlying securities collateralizing a repurchase agreement. Columbia is responsible for determining that the collateral is at least equal, at all times, to the value of the repurchase obligation including interest. A repurchase agreement transaction involves certain risks in the event of default or insolvency of the counterparty. These risks include possible delays in or restrictions on the Master Portfolio's ability to dispose of the underlying securities and a possible decline in the value of the underlying securities during the period while the Master Portfolio seeks to assert its rights.
Restricted Securities
Restricted securities are securities that may only be resold upon registration under federal securities laws or in transactions exempt from registration. In some cases, the issuer of restricted securities has agreed to register such securities for resale at the issuer's expense either upon demand by the Master Portfolio or in connection with another registered offering of the securities. Many restricted securities may be resold in the secondary market in transactions exempt from registration. Such restricted securities may be determined to be liquid under criteria established by the Board of Trustees. The Master Portfolio will not incur any registration costs upon such resale.
Foreign Currency Translations and Transactions
The values of all assets and liabilities quoted in foreign currencies are translated into U.S. dollars at that day's exchange rates. Net realized and unrealized gains (losses) on foreign currency transactions include gains (losses) arising from the fluctuation in exchange rates between trade and
100
Columbia International Value Master Portfolio, February 28, 2009 (continued)
settlement dates on securities transactions, gains (losses) arising from the disposition of foreign currency and currency gains (losses) between the accrual and payment dates on dividends, interest income and foreign withholding taxes.
For financial statement purposes, the Master Portfolio does not distinguish that portion of gains (losses) on investments which is due to changes in foreign exchange rates from that which is due to changes in market prices of the investments. Such fluctuations are included with the net realized and unrealized gains (losses) on investments on the Statement of Operations.
Income Recognition
Interest income is recorded on the accrual basis. Premium and discount are amortized and accreted, respectively, on all debt securities, unless otherwise noted.
Corporate actions and dividend income are recorded on the ex-date except for certain foreign securities which are recorded as soon after the ex-date as the Master Portfolio becomes aware of such, net of any non-reclaimable tax withholdings.
Each investor in the Master Portfolio is treated as an owner of its proportionate share of the net assets, income, expenses, realized and unrealized gains (losses) of the Master Portfolio.
Federal Income Tax Status
The Master Portfolio is treated as a partnership for federal income tax purposes and therefore is not subject to federal income tax. Each investor in the Master Portfolio will be subject to taxation on its allocated share of the Master Portfolio's ordinary income and capital gains.
The Master Portfolio's assets, income and distributions will be managed in such a way that a Feeder Fund will be able to continue to qualify as a registered investment company by investing its assets through its Master Portfolio.
The Master Portfolio may be subject to foreign taxes on income, gains on investments or currency repatriation, a portion of which may be recoverable. The Master Portfolio accrues such taxes and recoveries as applicable, based upon its current interpretation of tax rules and regulations that exist in the market in which it invests.
Indemnification
In the normal course of business, the Master Portfolio enters into contracts that contain a variety of representations and warranties and which provide general indemnities. The Master Portfolio's maximum exposure under these arrangements is unknown because this would involve future claims against the Master Portfolio. Also, under the Master Trust's organizational documents and by contract, the Trustees and officers of the Master Trust are indemnified against certain liabilities that may arise out of actions relating to their duties to the Master Trust. However, based on experience, the Master Portfolio expects the risk of loss due to these representations, warranties and indemnities to be minimal.
Note 3. Federal Tax Information
Unrealized appreciation and depreciation at February 28, 2009, based on cost of investments for federal income tax purposes were:
| Unrealized appreciation | | $ | 80,573,348 | | |
| Unrealized depreciation | | | (1,216,182,083 | ) | |
| Net unrealized depreciation | | $ | (1,135,608,735 | ) | |
Under Financial Accounting Standards Board ("FASB") Interpretation No. 48, Accounting for Uncertainty in Income Taxes—an Interpretation of FASB Statement No. 109 ("FIN 48"), management determines whether a tax position of the Master Portfolio is more likely than not to be sustained upon examination by the applicable taxing authority, including resolution of any related appeals or litigation processes, based on the technical merits of the position. The tax benefit to be recognized is measured as the largest amount of benefit that is greater than fifty percent likely of being realized upon ultimate settlement. Management has evaluated the known implications of FIN 48 on its computation of net assets for the Master Portfolio. As a result of this evaluation, management has conclu ded that FIN 48 did not have any effect on the Master Portfolio's financial statements. However, management's conclusions regarding FIN 48 may be subject to review and adjustment at a later date based on factors including, but not limited to, further implementation guidance from the FASB, new tax laws, regulations, and administrative interpretations (including relevant court decisions). The
101
Columbia International Value Master Portfolio, February 28, 2009 (continued)
Master Portfolio's federal tax returns for the prior three fiscal years remain subject to examination by the Internal Revenue Service. The Master Portfolio is not aware of any tax positions for which it is reasonably possible that the total amounts of unrecognized tax benefits will significantly change in the next twelve months.
Note 4. Fees and Compensation Paid to Affiliates
Investment Advisory Fee
Columbia, an indirect, wholly owned subsidiary of Bank of America Corporation ("BOA"), provides investment advisory services to the Master Portfolio. Columbia receives a monthly investment advisory fee based on the average daily net assets of the Master Portfolio at the following annual rates:
| Average Daily Net Assets | | Annual Fee Rate | |
| First $500 million | | | 0.85 | % | |
| $500 million to $1 billion | | | 0.80 | % | |
| $1 billion to $1.5 billion | | | 0.75 | % | |
| $1.5 billion to $3 billion | | | 0.70 | % | |
| $3 billion to $6 billion | | | 0.68 | % | |
| Over $6 billion | | | 0.66 | % | |
For the year ended February 28, 2009, the effective investment advisory fee rate for the Master Portfolio was 0.76% of the Master Portfolio's average daily net assets.
Sub-Advisory Fee
Brandes Investment Partners, L.P. ("Brandes") has been retained by Columbia to serve as the investment sub-advisor to the Master Portfolio. As the sub-advisor, and subject to the oversight of Columbia and the Master Portfolio's Board of Trustees, Brandes is responsible for the daily investment operations, including placing all orders for the purchase and sale of the portfolio securities for the Master Portfolio. Columbia, from the investment advisory fee it receives, pays Brandes a monthly sub-advisory fee.
Administration Fee
Columbia provides administrative and other services to the Master Portfolio for a monthly administration fee at the annual rate of 0.05% of the Master Portfolio's average daily net assets less the fees payable by the Master Portfolio as described under the Pricing and Bookkeeping Fees note below.
Pricing and Bookkeeping Fees
The Master Portfolio has entered into a Financial Reporting Services Agreement (the "Financial Reporting Services Agreement") with State Street Bank & Trust Company ("State Street") and Columbia pursuant to which State Street provides financial reporting services to the Master Portfolio. The Master Portfolio has also entered into an Accounting Services Agreement (collectively with the Financial Reporting Services Agreement, the "State Street Agreements") with State Street and Columbia pursuant to which State Street provides accounting services to the Master Portfolio. Under the State Street Agreements, the Master Portfolio pays State Street an annual fee of $38,000 paid monthly plus an additional monthly fee based on an annualized percentage rate of average daily net assets of the Master Portfolio for the month. The aggregate fee will not exceed $140,000 per year (exclusive of out-of-pocket expenses and charges). The Master Portfolio also reimburses State Street for certain out-of-pocket expenses and charges.
The Master Portfolio has entered into a Pricing and Bookkeeping Oversight and Services Agreement (the "Services Agreement") with Columbia. Under the Services Agreement, Columbia provides services related to Master Portfolio expenses and the requirements of the Sarbanes-Oxley Act of 2002, and provides oversight of the accounting and financial reporting services provided by State Street. Under the Services Agreement, the Master Portfolio reimburses Columbia for out-of-pocket expenses.
Expense Limits and Fee Waivers
Columbia and/or some of the Master Portfolio's other service providers have voluntarily agreed to waive fees and/or reimburse the Master Portfolio for certain expenses so that total expenses (exclusive of brokerage commissions, interest, taxes and extraordinary expenses, but inclusive of custodial charges relating to overdrafts, if any) after giving effect to any balance credits from the Master Portfolio's custodian, will not exceed the annual rate of 0.90% of the Master Portfolio's average daily net assets. This arrangement may be modified or terminated by Columbia at any time.
102
Columbia International Value Master Portfolio, February 28, 2009 (continued)
Fees Paid to Officers and Trustees
All officers of the Master Portfolio are employees of Columbia or its affiliates and receive no compensation from the Master Portfolio. The Board of Trustees has appointed a Chief Compliance Officer to the Master Portfolio in accordance with federal securities regulations.
The Master Trust's eligible Trustees may participate in a non-qualified deferred compensation plan which may be terminated at any time. Any payments to plan participants are paid solely out of the Master Portfolio's assets. Income earned on the plan participant's deferral account is based on the rate of return of the eligible mutual funds selected by the participant or, if no funds are selected, on the rate of return of Columbia Treasury Reserves, a portfolio of Columbia Funds Series Trust. The expense for the deferred compensation plan which includes trustees' fees deferred during the current period as well as any gains or losses on the trustees' deferred compensation balances as a result of market fluctuations, is included in "Trustees' fees" on the Statement of Operations. The liability for the deferred compensation plan is included in "Trustees' fees" on the Statement of Assets and Liabilities
Note 5. Custody Credits
The Master Portfolio has an agreement with its custodian bank under which custody fees may be reduced by balance credits. These credits are recorded as a reduction of total expenses on the Statement of Operations. The Master Portfolio could have invested a portion of the assets utilized in connection with the expense offset arrangement in an income-producing asset if it had not entered into such an agreement.
For the year ended February 28, 2009, these custody credits reduced total expenses by $1,789 for the Master Portfolio.
Note 6. Portfolio Information
For the year ended February 28, 2009, the cost of purchases and proceeds from sales of securities, excluding short-term obligations, for the Master Portfolio were $134,881,506 and $949,921,684, respectively.
Note 7. Line of Credit
The Master Portfolio and other affiliated funds participate in a $280,000,000 committed, unsecured revolving line of credit provided by State Street. The maximum amount that may be borrowed by any fund is limited to the lesser of $200,000,000 and the Master Portfolio's borrowing limit set forth in the Master Portfolio's registration statement. Borrowings are available for short-term liquidity or temporary or emergency purposes.
Interest is charged to each participating fund based on the fund's borrowings at a rate per annum equal to the greater of the Federal Funds Rate plus 0.50% or the overnight LIBOR Rate plus 0.50%. In addition, an annual operations agency fee of $20,000, an amendment fee of 0.02% and a commitment fee of 0.12% per annum are accrued and apportioned among the participating funds pro rata based on their relative net assets. Prior to October 16, 2008, the Master Portfolio and other affiliated funds participated in a $350,000,000 committed, unsecured revolving line of credit and a $150,000,000 uncommitted, unsecured line of credit, both provided by State Street. Interest on the committed line of credit was charged to each participating fund based on the fund's borrowings at a rate per annum equal to the Federal Funds Rate plus 0.50%. In addition, a commitment fee of 0.10% per annum was accrued and apportioned among the participating fun ds pro rata based on their relative net assets. Interest on the uncommitted line of credit was charged to each participating fund based on the fund's borrowings at a rate per annum equal to the Federal Funds Rate plus 0.375%. State Street charged an annual operations agency fee of $40,000 for the committed line of credit and was able to charge an annual administration fee of $15,000 for the uncommitted line of credit. The commitment fee, the operations agency fee and the administration fee were accrued and apportioned among the participating funds pro rata based on their relative net assets.
For the year ended February 28, 2009, the average daily loan balance outstanding on days where borrowing existed was $9,212,963 at a weighted average interest rate of 1.766%
Note 8. Securities Lending
The Master Portfolio may lend its securities to certain approved brokers, dealers and other financial institutions. Each loan is collateralized by cash, in an amount at least equal to the market value of the securities loaned plus accrued income from the investment of collateral. The market value of the loaned securities is determined at the close of business of the Master Portfolio and any additional required collateral is delivered to the Master Portfolio on the next business day. The collateral received is invested and the income generated by the
103
Columbia International Value Master Portfolio, February 28, 2009 (continued)
investment of the collateral, net of any fees remitted to State Street as the lending agent and borrower rebates, is paid to the Master Portfolio. Generally, in the event of borrower default, the Master Portfolio has the right to use the collateral to offset any losses incurred. In the event the Master Portfolio is delayed or prevented from exercising its right to dispose of the collateral, there may be a potential loss to the Master Portfolio. The Master Portfolio bears the risk of loss with respect to the investment of collateral.
Note 9. Significant Risks and Contingencies
Foreign Securities Risk
There are certain additional risks involved when investing in foreign securities. These risks may involve foreign currency exchange rate fluctuations, adverse political and economic developments and the possible prevention of currency exchange or other foreign governmental laws or restrictions. In addition, the liquidity of foreign securities may be more limited than that of domestic securities.
Investments in emerging market countries are subject to additional risk. The risk of foreign investments is typically increased in less developed countries. These countries are also more likely to experience high levels of inflation, deflation or currency devaluation which could hurt their economies and securities markets.
Legal Proceedings
Columbia Management Advisors, LLC and Columbia Management Distributors, Inc. (collectively, the "Columbia Group") are subject to a settlement agreement with the New York Attorney General ("NYAG") (the "NYAG Settlement") and a settlement order with the SEC (the "SEC Order") on matters relating to mutual fund trading, each dated February 9, 2005. Under the terms of the SEC Order, the Columbia Group (or predecessor entities) agreed, among other things, to: pay disgorgement and civil money penalties collectively totaling $375 million; cease and desist from violations of the antifraud provisions and certain other provisions of the federal securities laws; maintain certain compliance and ethics oversight structures; and retain an independent consultant to review the Columbia Group's applicable supervisory, compliance, control and other policies and procedures. The NYAG Settlement, among other things, requires Columbia Management Advisors, LLC and its affiliates to reduce management fees for certain funds in the Columbia family of mutual funds in a projected total of $160 million over five years through November 30, 2009 and to make certain disclosures to investors relating to expenses. In connection with the Columbia Group providing services to the Columbia Funds, the Columbia Funds have voluntarily undertaken to implement certain governance measures designed to maintain the independence of their boards of trustees and certain special consulting and compliance measures.
Pursuant to the SEC Order and related procedures, the $375 million in settlement amounts described above, of which approximately $90 million has been earmarked for certain Columbia Funds and their shareholders, is being distributed in accordance with a distribution plan developed by an independent distribution consultant and approved by the SEC on December 27, 2007. Distributions under the distribution plan began in mid-June 2008.
Civil Litigation
In connection with the events that resulted in the NYAG Settlement and SEC Order, various parties filed suits against Bank of America Corporation and certain of its affiliates, including Banc of America Capital Management, LLC ("BACAP," now known as Columbia Management Advisors, LLC) and BACAP Distributors, LLC (now known as Columbia Management Distributors, Inc.) (collectively "BAC"), Nations Funds Trust (now known as Columbia Funds Series Trust) and its Board of Trustees. On February 20, 2004, the Judicial Panel on Multidistrict Litigation transferred these cases and cases against other mutual fund companies based on similar allegations to the United States District Court in Maryland for consolidated or coordinated pretrial proceedings (the "MDL"). Subsequently, additional related cases were transferred to the MDL. On September 29, 2004, the plaintiffs in the MDL filed amended and consolidated complaints. One of these amended complaints is a putative class action that includes claims under the federal securities laws and state common law, and that names Nations Funds Trust, the Trustees, BAC and others as defendants. Another of the amended complaints is a derivative action purportedly on behalf of the Nations Funds Trust against BAC and others that asserts claims under federal securities laws and state common law. Nations Funds Trust is a nominal defendant in this action.
104
Columbia International Value Master Portfolio, February 28, 2009 (continued)
On February 25, 2005, BAC and other defendants filed motions to dismiss the claims in the pending cases. On December 15, 2005, BAC and others entered into a Stipulation of Settlement of the direct and derivative claims brought on behalf of the Nations Funds shareholders. The settlement is subject to court approval. If the settlement is approved, BAC would pay settlement administration costs and fees to plaintiffs' counsel as approved by the court. The stipulation has not yet been presented to the court for approval.
105
Report of Independent Registered Public Accounting Firm
To the Holders and Trustees of Columbia Funds Master Investment Trust, LLC
In our opinion, the accompanying statement of assets and liabilities, including the investment portfolios, and the related statements of operations and of changes in net assets and the financial highlights present fairly, in all material respects, the financial position of Columbia International Value Master Portfolio (constituting a series of Columbia Funds Master Investment Trust, LLC hereafter referred to as the "Portfolio") at February 28, 2009, and the results of its operations for the year then ended, the changes in its net assets and the financial highlights for each of the periods indicated, in conformity with accounting principles generally accepted in the United States of America. These financial statements and financial highlights (hereafter referred to as "financial statements") are the responsibility of the Portfolio's management. Our responsibility is to express an opinion on these financial statements based on our audits. We conducted our audits of these financial statements in accordance with the standards of the Public Company Accounting Oversight Board (United States). Those standards require that we plan and perform the audit to obtain reasonable assurance about whether the financial statements are free of material misstatement. An audit includes examining, on a test basis, evidence supporting the amounts and disclosures in the financial statements, assessing the accounting principles used and significant estimates made by management, and evaluating the overall financial statement presentation. We believe that our audits, which included confirmation of securities at February 28, 2009 by correspondence with the custodian and brokers, provide a reasonable basis for our opinion.
PricewaterhouseCoopers LLP
Boston, Massachusetts
April 22, 2009
106
Fund Governance
The Trustees serve terms of indefinite duration. The names, addresses and ages of the Trustees and officers of the Funds in the Columbia Funds Complex, the year each was first elected or appointed to office, their principal business occupations during at least the last five years, the number of Funds overseen by each Trustee and other directorships they hold are shown below. Each officer listed below serves as an officer of each Funds in the Columbia Funds Complex.
Independent Trustees
Name, Address and Year of Birth,
Position with Funds, Year First
Elected or Appointed to Office | | Principal Occupation(s) During Past Five Years, Number of Portfolios in Columbia Funds
Complex Overseen by Trustee, Other Directorships Held | |
| Edward J. Boudreau (Born 1944) | |
|
c/o Columbia Management
Advisors, LLC
One Financial Center
Boston, MA 02111
Trustee (since 2005) | | Managing Director—E.J. Boudreau & Associates (consulting), from 2000 through current; oversees 66; no other directorships held. | |
|
| William P. Carmichael (Born 1943) | |
|
c/o Columbia Management
Advisors, LLC
One Financial Center
Boston, MA 02111
Trustee (since 1999) | | Retired. Oversees 66; Director—Cobra Electronics Corporation (electronic equipment manufacturer); Director—Spectrum Brands, Inc. (consumer products); Director—Simmons Company (bedding); Director—The Finish Line (sportswear). | |
|
| William A. Hawkins (Born 1942) | |
|
c/o Columbia Management
Advisors, LLC
One Financial Center
Boston, MA 02111
Trustee (since 2005) | | President and Chief Executive Officer—California General Bank, N.A., from January 2008 through current; President, Retail Banking—IndyMac Bancorp, Inc., from September 1999 to August 2003; oversees 66; no other directorships held. | |
|
| R. Glenn Hilliard (Born 1943) | |
|
c/o Columbia Management
Advisors, LLC
One Financial Center
Boston, MA 02111
Trustee (since 2005) | | Chairman and Chief Executive Officer—Hilliard Group LLC (investing and consulting), from April 2003 through current; Non-Executive Director & Chairman—Conseco, Inc. (insurance), September 2003 through current; Executive Chairman—Conseco, Inc. (insurance), August 2004 through September 2005, Chairman and Chief Executive Officer—ING Americas, from 1999 through April 2003; oversees 66; Director—Conseco, Inc. (insurance). | |
|
| John J. Nagorniak (Born 1944) | |
|
c/o Columbia Management
Advisors, LLC
One Financial Center
Boston, MA 02111
Trustee (since 2008) | | Retired. President and Director—Foxstone Financial, Inc. (consulting), 2000 through December 2007; Director—Mellon Financial Corporation affiliates (investing), 2000 through 2007; Chairman—Franklin Portfolio Associates (investing—Mellon affiliate), 1982 through 2007; oversees 66; Director—MIT Investment Company; Trustee—MIT 401k Plan; Trustee and Chairman—Research Foundation of CFA Institute. | |
|
107
Fund Governance (continued)
Independent Trustees (continued)
Name, Address and Age,
Position with Funds, Year First
Elected or Appointed to Office | | Principal Occupation(s) During Past Five Years, Number of Funds in Columbia Funds
Complex Overseen by Trustee, Other Directorships Held | |
| Anthony M. Santomero (Born 1946) | |
|
c/o Columbia Management
Advisors, LLC
One Financial Center
Boston, MA 02111
Trustee (since 2008) | | Richard K. Mellon Professor Emeritus of Finance, The Wharton School, University of Pennsylvania, through current; Senior Advisor—McKinsey & Company (consulting), July 2006 through December 2007; President and Chief Executive Officer—Federal Reserve Bank of Philadelphia, 2000 through April 2006; oversees 66; no other directorships held. | |
|
| Minor M. Shaw (Born 1947) | |
|
c/o Columbia Management
Advisors, LLC
One Financial Center
Boston, MA 02111
Trustee (since 2003) | | President—Micco Corporation, Chairman—The Daniel-Mickel Foundation; oversees 66; Board Member—Piedmont Natural Gas. | |
|
The Statement of Additional Information includes additional information about the Trustees of the Funds and is available, without charge, upon request by calling 800-345-6611.
Officers
Name, Address and Year of Birth,
Position with Columbia Funds,
Year First Elected or
Appointed to Office | | Principal Occupation(s) During Past Five Years
| |
| J. Kevin Connaughton (Born 1964) | |
|
One Financial Center
Boston, MA 02111
President (since 2009) | | Managing Director of Columbia Management Advisors, LLC since December 2004; Senior Vice President and Chief Financial Officer—Columbia Funds, from June 2008 to January 2009; Treasurer—Columbia Funds, from October 2003 to May 2008; Treasurer—the Liberty Funds, Stein Roe Funds and Liberty All-Star Funds, December 2000—December 2006; Senior Vice President—Columbia Management Advisors, LLC, from April 2003 to December 2004; President—Columbia Funds, Liberty Funds and Stein Roe Funds, February 2004 to October 2004; Treasurer—Galaxy Funds, September 2002 to December 2005; Treasurer, December 2002 to December 2004, and President, February 2004 to December 2004—Columbia Management Multi-Strategy Hedge Fund, LLC; and a senior officer of various other Bank of America-affiliated entities, including other registered and unregistered funds | |
|
| James R. Bordewick, Jr. (Born 1959) | |
|
One Financial Center
Boston, MA 02111
Senior Vice President, Secretary and Chief Legal Officer (since 2006) | | Associate General Counsel, Bank of America since April 2005; Senior Vice President and Associate General Counsel, MFS Investment Management (investment management) prior to April 2005. | |
|
108
Fund Governance (continued)
Officers (continued)
Name, Address and Year of Birth,
Position with Columbia Funds,
Year First Elected or
Appointed to Office | | Principal Occupation(s) During Past Five Years
| |
| Linda J. Wondrack (Born 1964) | |
|
One Financial Center
Boston, MA 02111
Senior Vice President and
Chief Compliance Officer (since 2007) | | Director (Columbia Management Group LLC and Investment Product Group Compliance), Bank of America since June 2005; Director of Corporate Compliance and Conflicts Officer, MFS Investment Management (investment management), August 2004 to May 2005; Managing Director, Deutsche Asset Management (investment management) prior to August 2004. | |
|
| Michael G. Clarke (Born 1969) | |
|
One Financial Center
Boston, MA 02111
Senior Vice President and
Chief Financial Officer (since 2009) | | Director of Fund Administration of the Advisor since January 2006; Managing Director of the Advisor September 2004 to December 2005; Vice President Fund Administration June 2002 to September 2004. | |
|
| Jeffrey R. Coleman (Born 1969) | |
|
One Financial Center
Boston, MA 02111
Treasurer (since 2006) | | Director of Fund Administration of the Advisor since January 2006; Fund Controller of the Advisor from October 2004 to January 2006; Vice President of CDC IXIS Asset Management Services, Inc. (investment management) from August 2000 to September 2004. | |
|
| Joseph F. DiMaria (Born 1968) | |
|
One Financial Center
Boston, MA 02111
Chief Accounting Officer (since 2008) | | Director of Fund Administration of the Advisor since January 2006; Head of Tax/Compliance and Assistant Treasurer of the Advisor from November 2004 to December 2005; Director of Trustee Administration (Sarbanes-Oxley) of the Advisor from May 2003 to October 2004. | |
|
| Julian Quero (Born 1967) | |
|
One Financial Center
Boston, MA 02111
Deputy Treasurer (since 2008) | | Senior Tax Manager of the Advisor since August 2006; Senior Compliance Manager of the Advisor from April 2002 to August 2006. | |
|
| Barry S. Vallan (Born 1969) | |
|
One Financial Center
Boston, MA 02111
Controller (since 2006) | | Vice President—Fund Treasury of the Advisor since October 2004; Vice President—Trustee Reporting of the Advisor from April 2002 to October 2004. | |
|
109
Board Consideration and Re-Approval of Investment Advisory and Sub-Advisory Agreements
The Boards of Trustees of Columbia Funds Series Trust and Columbia Funds Master Investment Trust, LLC (the "Boards"), including a majority of the Trustees who have no direct or indirect interest in the investment advisory and sub-advisory agreements and are not "interested persons" of the Trusts, as defined in the Investment Company Act of 1940 (the "1940 Act") (the "Independent Trustees"), are required annually to review and re-approve the existing investment advisory and sub-advisory agreements and approve any newly proposed terms therein. In this regard, the Boards reviewed and re-approved, during the most recent six months covered by this report, (i) investment advisory agreements with Columbia Management Advisors, LLC ("CMA") for Columbia Global Value Fund, Columbia International Value Master Portfolio, Columbia Multi-Advisor International Equity Fund, Columbia Marsico International Opportunities Fund and Columbia Marsico G lobal Fund; (ii) an investment sub-advisory agreement with Marsico Capital Management ("Marsico Capital") for Columbia Marsico International Opportunities Fund, Columbia Multi-Advisor International Equity Fund and Columbia Marsico Global Fund; (iii) investment sub-advisory agreements with Brandes Investment Partners, L.P. ("Brandes") for Columbia Global Value Fund and Columbia International Value Master Portfolio; and (iv) an investment sub-advisory agreement with Causeway Capital Management LLC ("Causeway Capital") for Columbia Multi-Advisor International Equity Fund. (Causeway Capital, together with Brandes and Marsico Capital, are hereafter referred to as the "Sub-Advisers"). The investment advisory agreements with CMA and the investment sub-advisory agreements with the Sub-Advisers are each referred to as an "Advisory Agreement" and collectively referred to as the "Advisory Agreements." The funds and master portfolio identified above are each referred to as a "Fund" and collectively referred to as the "F unds."
More specifically, at meetings held on November 10-11, 2008, the Boards, including the Independent Trustees advised by their independent legal counsel, considered the factors and reached the conclusions described below relating to the selection of CMA and the Sub-Advisers and the re-approval of the Advisory Agreements. The Boards also reviewed and considered a report prepared and provided by the Independent Fee Consultant (the "Consultant") appointed by the Independent Trustees pursuant to an assurance of discontinuance entered into with the New York Attorney General ("NYAG") to settle a civil complaint filed by the NYAG relating to trading in mutual fund shares (the "NYAG Settlement"). During the fee review process, the Consultant's role was to manage the review process to ensure that fees are negotiated in a manner that is at arms' length and reasonable. The Consultant found that the fee negotiation process was, to the extent practicable, at arms' length and reasonable and consistent with the requirements of the NYAG Settlement. A summary of the Consultant's report is available at http://www.columbiafunds.com.
In preparation for the November meetings, the Boards met in August for review and discussion of the materials described below. The Investment Committees of the Boards also met in June to discuss each Fund's performance with its respective portfolio manager(s). In addition to these meetings, the Investment Committees receive and discuss performance reports at their quarterly meetings. The Contracts Review Committees also provided support in managing and coordinating the process by which the Boards reviewed the Advisory Agreements. The Boards' review and conclusions are based on comprehensive consideration of all information presented to them and are not the result of any single controlling factor.
Nature, Extent and Quality of Services
The Boards received and considered various data and information regarding the nature, extent and quality of services provided to the Funds by CMA and the Sub-Advisers under the Advisory Agreements. The most recent investment adviser registration forms ("Forms ADV") for CMA and the Sub-Advisers were made available to the Boards, as were CMA's and the Sub-Advisers' responses to a detailed series of requests submitted by the Independent Trustees' independent legal counsel on behalf of such Trustees. The Boards reviewed and analyzed those materials, which included, among other things, information about the background and experience of senior management and investment personnel of CMA and the Sub-Advisers.
In addition, the Boards considered the investment and legal compliance programs of the Funds, CMA and the Sub-Advisers, including their compliance policies and procedures and reports of the Funds' Chief Compliance Officer.
The Boards evaluated the ability of CMA and the Sub-Advisers, based on their resources, reputation and other
110
attributes, to attract and retain qualified investment professionals, including research, advisory and supervisory personnel. In this regard, the Boards considered information regarding CMA's compensation program for its personnel involved in the management of the Funds. The Boards also considered CMA's investment in further developing its research and trading departments.
Based on the above factors, together with those referenced below, the Boards concluded that they were satisfied with the nature, extent and quality of the investment advisory services provided to each of the Funds by CMA and the Sub-Advisers.
Fund Performance and Expenses
The Boards considered the performance results for each of the Funds over multiple measurement periods.1 They also considered these results in comparison to the performance results of the group of funds that was determined by Lipper Inc. ("Lipper") to be the most similar to a given Fund (the "Peer Group") and to the performance of a broader universe of relevant funds as determined by Lipper (the "Universe"), as well as to each Fund's benchmark index. Lipper is an independent provider of investment company data. The Boards were provided with a description of the methodology used by Lipper to select the mutual funds in each Fund's Peer Group and Universe and considered potential imprecision resulting from the selection methodology. The Boards also considered certain risk-adjusted performance data.
The Boards received and considered statistical information regarding each Fund's total expense ratio and its various components, including contractual advisory fees, actual advisory fees, actual non-management fees, Rule 12b-1 and non-Rule 12b-1 service fees, fee waivers/caps and/or expense reimbursements. The Boards also considered comparisons of these fees to the expense information for each Fund's Peer Group and Universe, which comparative data was provided by Lipper. For certain Funds, Lipper determined that the composition of the Peer Group and/or Universe for expenses would differ from the composition for performance to provide a more accurate basis of comparison. The Boards also considered Lipper data that ranked each Fund based on: (i) each Fund's one-year performance compared to actual management fees; (ii) each Fund's one-year performance compared to total expenses; (iii) each Fund's three-year performance compared to actual management fees; and (iv) each Fund's three-year performance compared to total expenses.
Investment Advisory and Sub-Advisory Fee Rates
The Boards reviewed and considered the proposed contractual investment advisory fee rates together with the administration fee rates payable by the Funds to CMA for investment advisory services (the "Contractual Management Rates"). The Boards also reviewed and considered the proposed contractual investment sub-advisory fee rates (the "Sub-Advisory Agreement Rates") payable by CMA to the Sub-Advisers for investment sub-advisory services. In addition, the Boards reviewed and considered the proposed fee waiver/cap arrangements applicable to the Contractual Management Rates and considered the Contractual Management Rates after taking the waivers/caps into account (the "Actual Management Rates"). The Boards noted that, on a complex-wide basis, CMA had reduced annual management fees by at least $32 million per year pursuant to the NYAG Settlement. The Boards also noted reductions in net advisory rates and/or total expenses of certain funds across the fund complex. Additionally, the Boards received and afforded specific attention to information comparing the Contractual Management Rates and Actual Management Rates with those of the other funds in their respective Peer Groups.
For certain Funds highlighted as meeting agreed-upon criteria for warranting further review, the Boards engaged in further analysis with regard to approval of the Funds' Advisory Agreements. The Boards engaged in further review of Columbia Global Value Fund because its Actual Management Rate and total expense ratio were appreciably above the median range of its Peer Group and its performance over some periods was appreciably below the median range of its Peer Group. However, the Boards noted factors, such as the positive performance of the Fund over other periods and an Actual Management Rate and total expense ratio that were not appreciably above the median of the Fund's Peer Group, that outweighed the factors noted above. The Boards also engaged in further review of Columbia International Value Master Portfolio because its Actual Management Rate was appreciably above the median range of its Peer Group and its performance over some periods was
1 Columbia Marsico Global Fund is a new Fund that commenced operations on April 30, 2008. Consequently, the Boards did not give consideration to performance information for the Fund.
111
appreciably below the median range of its Peer Group. However, the Boards noted factors, such as the positive performance of the Fund over other periods and a total expense ratio that was below the median of its Universe, that outweighed the factors noted above.
The Boards concluded that the factors noted above supported the Contractual Management Rates and the Actual Management Rates, and the approval of the Advisory Agreements for all of the Funds.
With regard to the Funds with a sub-adviser, the Boards reviewed the Sub-Advisory Agreement Rates charged by Marsico Capital, Brandes and Causeway Capital, which serve as Sub-Adviser to certain of the Funds. The Boards reviewed comparative fee information provided by the Adviser and the Adviser's recommendation that the Boards re-approve the Advisory Agreements with Marsico Capital. The Boards also considered a new breakpoint fee schedule, charged by Marsico Capital, which serves as Sub-Adviser to certain of the Funds, as well as a corresponding waiver of Contractual Management Rates, both of which were implemented on January 1, 2008. The Boards concluded that the Sub-Advisory Agreement Rates are fair and equitable, based on their consideration of the factors described above.
Profitability
The Boards received and considered a detailed profitability analysis of CMA based on the Contractual Management Rates and the Actual Management Rates, as well as on other relationships between the Funds and other funds in the complex on the one hand and CMA affiliates on the other. The analysis included complex-wide and per-Fund information and a comparison of results using alternative allocation methodologies. The Boards concluded that, in light of the costs of providing investment management and other services, the profits and other ancillary benefits that CMA and its affiliates received from providing these services were not unreasonable.
Economies of Scale
The Boards received and considered information regarding whether there have been economies of scale with respect to the management of the Funds, whether the Funds have appropriately benefited from any economies of scale and whether there is potential for realization of any further economies of scale. Most particularly, CMA provided information showing that, as a percentage of fund assets, CMA's complex-wide revenues, expenses and profits declined over a four-year period during which fund assets increased by 39% and the shareholder benefit over a two-year period increased from 33% to 41% of the Adviser's total profits. The Boards concluded that any potential economies of scale are shared fairly with Fund shareholders, most particularly through breakpoints and fee waiver arrangements.
The Boards acknowledged the inherent limitations of any analysis of an investment adviser's economies of scale, stemming largely from the Boards' understanding that economies of scale are realized, if at all, by an investment adviser across a variety of products and services, not just with respect to a single fund.
Information About Services to Other Clients
The Boards also received and considered information about the nature and extent of services and fee rates offered by CMA and the Sub-Advisers to their other clients, including separate accounts and institutional investors. In this regard, the Boards concluded that, where the Contractual Management Rates, Sub-Advisory Agreement Rates and Actual Management Rates were appreciably above the range of the fee rates offered to other CMA and Sub-Adviser clients, based on information provided by CMA and the Sub-Advisers, the costs associated with managing and operating a registered investment company provided a justification for the higher fee rates charged to the Funds.
Other Benefits to CMA and the Sub-Advisers
The Boards received and considered information regarding any "fall-out" or ancillary benefits received by CMA and its affiliates and the Sub-Advisers as a result of their relationship with the Funds. Such benefits could include, among others, benefits attributable to CMA's and the Sub-Advisers' relationships with the Funds (such as soft-dollar credits) and benefits potentially derived from an increase in CMA's and the Sub-Advisers' business as a result of their relationship with the Funds (such as the ability to market to shareholders other financial products offered by CMA and its affiliates or a Sub-Adviser).
The Boards considered the effectiveness of the policies of the Funds in achieving the best execution of portfolio transactions, whether and to what extent soft dollar credits
112
are sought and how any such credits are utilized, any benefits that may be realized by using an affiliated broker, the extent to which efforts are made to recapture transaction costs, and the controls applicable to brokerage allocation procedures. The Boards also reviewed CMA's and the Sub-Advisers' methods for allocating portfolio investment opportunities among the Funds and other clients. The Boards concluded that the benefits were not unreasonable.
Other Factors and Broader Review
As discussed above, the Boards review materials received from CMA and the Sub-Advisers annually as part of the re-approval process under Section 15(c) of the 1940 Act. The Boards also review and assess the quality of the services the Funds receive throughout the year. In this regard, the Boards and their Committees review reports of CMA and the Sub-Advisers at each of their quarterly meetings, which include, among other things, Fund performance reports. In addition, the Boards and their Committees confer with portfolio managers at various times throughout the year including, most particularly, in the June Investment Committee meeting.
Conclusion
After considering the above-described factors, based on their deliberations and their evaluation of the information provided, the Boards concluded that the compensation payable to CMA and the Sub-Advisers under the Advisory Agreements is fair and equitable. Accordingly, the Boards unanimously re-approved the Advisory Agreements.
113
Summary of Management Fee Evaluation by
Independent Fee Consultant
EXCERPTS FROM REPORT OF INDEPENDENT FEE CONSULTANT TO THE FUNDS SUPERVISED BY THE COLUMBIA NATIONS BOARD
Prepared pursuant to the February 9, 2005
Assurance of Discontinuance among the
Office of Attorney General of New York State,
Columbia Management Advisors, LLC and
Columbia Management Distributors, Inc.
November 12, 2008
I. Overview
On February 9, 2005, Columbia Management Advisors, LLC ("CMA") and Columbia Management Distributors, Inc.1 ("CMD") agreed to the New York Attorney General's Assurance of Discontinuance ("AOD"). Among other matters, the AOD stipulates that CMA may manage or advise a Columbia Fund ("Columbia Fund" and together with all such funds or a group of such funds as the "Columbia Funds") only if the Independent Members of the Columbia Fund's Board of Trustees appoint a Senior Officer or retain an Independent Fee Consultant ("IFC") who is to manage the process by which proposed management fees are negotiated. The AOD further stipulates that the Senior Officer or IFC is to prepare a written annual evaluation of the fee negotiation process.
With effect from January 1, 2007, the Independent Members of the Board of Trustees for certain Columbia Funds known collectively as the "Nations Funds" (the "Trustees") retained me as IFC for the Nations Funds.2 In this capacity, I have prepared the fourth annual written evaluation of the fee negotiation process. As was the case with last year's report (the "2007 Report") my immediate predecessor as IFC, John Rea, provided invaluable assistance in the preparation of this year's report.
A. Role of the Independent Fee Consultant
The AOD charges the IFC with "managing the process by which proposed management fees...to be charged the Columbia Fund are negotiated so that they are negotiated in a manner which is at arms' length and reasonable and consistent with this Assurance of Discontinuance." The AOD also provides that CMA "may manage or advise a Columbia Fund only if the reasonableness of the proposed management fees is determined by the Board of Trustees...using...an annual independent written evaluation prepared by or under the direction of...the Independent Fee Consultant." Therefore, the AOD makes clear that the IFC does not supplant the Trustees in negotiating management fees with CMA, nor does the IFC substitute his or her judgment for that of the Trustees with respect to the reasonableness of proposed fees or any other matter that is committed to the business judgment of the Trustees.
B. Elements Involved in Managing the Fee Negotiation Process
In preparing the report required by the AOD, the IFC must consider at least the following six factors set forth in the AOD:
1. The nature and quality of CMA's services, including the Fund's performance;
2. Management fees (including any components thereof) charged by other mutual fund companies for like services;
3. Possible economies of scale as the Fund grows larger;
4. Management fees (including any components thereof) charged to institutional and other clients of CMA for like services;
5. Costs to CMA and its affiliates of supplying services pursuant to the management fee agreements, excluding any intra-corporate profit; and
6. Profit margins of CMA and its affiliates from supplying such services.
C. Organization of the Annual Evaluation
This report, like last year's, focuses on the six factors and contains a section for each factor except that that CMA's costs and profits from managing the Funds have been combined into a single section. In addition to a discussion of these factors, the report offers recommendations to improve the fee review process in future years. A review of the status of recommendations made in the 2007 Report is being provided separately with the materials for the November meeting.
1 CMA and CMD are subsidiaries of Columbia Management Group, LLC ("CMG"), and are the successors to the entities named in the AOD.
2 I have no material relationship with Bank of America, CMG or any of its affiliates, aside from serving as IFC, and I am aware of no material relationship with any of their affiliates. I retained John Rea, an independent economic consultant, to assist me with this report.
Unless otherwise stated or required by the context, this report covers only the Nations Funds, which are also referred as the "Funds."
114
II. Summary of Findings
A. General
1. Based upon my examination of the information supplied by CMG in the light of the six factors set forth in the AOD, I conclude that the Trustees have the relevant information necessary to evaluate the reasonableness of the proposed management fees for each Nations Fund.
2. In my view, the process by which the proposed management fees of the Funds have been negotiated in 2008 thus far has been, to the extent practicable, at arms' length and reasonable and consistent with the AOD.
B. Nature and Quality of Services, Including Performance
3. The performance of the Funds has been relatively good for the most recent 1-, 3- and 5-year periods. The strongest records were posted by the Funds in the Active Equity and Quantitative Strategies Groups and by the sub-advised Funds. The 5-year performance rankings of the subadvised Funds were particularly strong, with all such Funds in the top two performance quintiles.
4. The 1- and 3-year performance records of the Funds declined slightly from 2007 to 2008, while the 5-year performance records improved year-over-year. Most Funds changed their 1-year performance quintile year-over-year, while the 5-year rankings were, as expected, much more stable, with less than half the Funds moving to a different 5-year performance quintile.
5. The performance of the actively-managed equity and sub-advised Funds against their benchmarks was strong, especially for the 1- and 3-year performance periods. However, no fixed-income Fund with a reliable benchmark exceeded it on a net basis in any performance period. Money market Funds do not have such benchmarks and therefore were excluded from this analysis.
6. The Nations equity Funds' overall performance adjusted for risk was strong. The performance of 13 of the 19 actively-managed Funds included in the risk analysis bettered the median in 3-year performance adjusted and unadjusted for risk. No relationship between risk and return was detected for fixed-income Funds.
7. The industry-standard procedure used by third parties such as Lipper and Morningstar to construct the performance universe in which each Fund's performance is ranked relative to comparable funds tends to bias a Fund's ranking upward within that universe. The bias occurs because either no-12b-1-fee or A share classes of the Funds are compared to the performance universe that includes all share classes of competitive multi-class funds. Therefore, the procedure ranks shares with zero or 25 basis point 12b-1 fees against classes of competitive funds with 12b-1 fees of up to 100 basis points. Correcting this bias by limiting the performance universe to classes of competitive funds with comparable 12b-1 fees in most cases lowers the relative performance for the Funds but does not call into question the general finding that the Nations Funds' performance has been strong.
8. A small number of Funds have consistently underperformed their peers in each of the past four years, depending on the exact criteria used to measure long-term underperformance. For example, one Fund has had below-median 1- and 3-year performance in each of the past four years; one additional Fund had below-median 3-year performance for those years.
9. The services performed by CMG professionals beyond portfolio management, such as compliance, legal, information technology, risk management, finance and fund administration, are critical to the success of the Funds and appear to be of high quality.
C. Management Fees Charged by Other Mutual Fund Companies
10. The Funds' management fees and total expenses are generally low relative to those of their peers, with the exception of subadvised Funds. Almost two-third of the Funds ranked in the two least expensive quintiles for total expenses and just over half were in those quintiles for actual management fees. Funds with lower actual management fees tended to have lower relative total expenses. All fixed-income Funds had total expenses in the two least expensive quintiles.
11. Generally, the Nations Funds with the highest relative fees and expenses are sub-advised. All eight Nations Funds with fifth-quintile total expense rankings were sub-advised. The actual management fees of 11 of the 14 sub-advised
115
Funds were in the fourth and fifth quintile. The average management fees of the sub-advised Funds were typically 20 points higher than internally-managed equity Funds. CMA presented data suggesting that such differentials were consistent with industry practice.
12. The management fees of the internally-advised Nations Funds are generally in line with those of Columbia Funds overseen by the Atlantic and Acorn/Wanger Boards of Trustees.
D. Trustees' Fee and Performance Evaluation Process
13. The Trustees' evaluation process identified 20 Funds in 2008 for further review based upon their relative performance or expenses or both. When compared in filtered universes, three more Funds met the criteria for review.
E. Potential Economies of Scale
14. CMG has prepared a memo for the Trustees containing its views on the sources and sharing of potential economies of scale. CMG views economies of scale as arising at the complex level and would regard estimates of scale economies for individual funds as unreliable. In its analysis, CMG did not identify specific sources of economies of scale or provide any estimates of any economies of scale that might arise from future asset growth. CMG's analysis included measures taken by the Trustees and CMG that seek to share any potential economies of scale through breakpoints in management fee schedules, expense reimbursements, fee waivers, enhanced shareholder services, fund mergers, and operational consolidation.
15. An examination of the management fee schedules of a selected number of the Nations Funds suggests that, as a general matter, the breakpoint schedules of these Funds are not out of line with those of competitors. A similar examination of five other Nations Funds in 2007 led to the same conclusion.
F. Management Fees Charged to Institutional Clients
16. CMG has provided Trustees with comparisons of mutual fund management fees and institutional fees based upon standardized fee schedules and actual fees. The results show that, consistent with industry practice, institutional fees are generally lower than the Funds' management fees. However, because the services provided and risks borne by the manager are more extensive for mutual funds than for institutional accounts, the differences are of limited value in assisting the Trustees in their review of the reasonableness of the Funds' management fees.
G. Revenues, Expenses, and Profits
17. The activity-based cost allocation methodology ("ABC") employed by CMG to allocate costs for purposes of calculating Fund profitability, both direct and indirect, for purposes of calculating Fund profitability is thoughtful and detailed. For comparison, CMG proposed a change to the method by which indirect expenses were allocated. Under this "hybrid" method, such costs are allocated to Funds 50% by assets and 50% per fund. Allocating indirect expenses equally to each Fund has an intuitive logic, as each Fund regardless of size has certain expenses, such as preparing and printing prospectuses and financial statements.
18. The materials provided on CMG's revenues and expenses with respect to the Funds and the methodology underlying their construction generally form a sufficient basis for Trustees to evaluate CMG's expenses and profitability for each Fund.
19. In 2007, CMG's complex-wide pre-tax margins on the Nations Funds were close to the industry average before distribution and below average when distribution revenues and expenses were included, based on limited data available about publicly-held mutual fund managers. However, as is to be expected in a complex comprising 65 Funds, some Nations Funds have higher pre-tax profit margins, when calculated solely with respect to management revenues and expenses, while other Nations Funds operate at a loss. A pro forma analysis of the complex's profitability taking into account expenses incurred in 2008 associated with support of the money market funds sharply reduced the profitability of the Nations Funds. There is a positive relationship between fund size and profitability, with smaller Funds generally operating at a loss.
116
20. CMG shares a fixed percentage of its management fee revenues with an affiliate, U.S. Trust, Bank of America Private Wealth Management, to compensate that affiliate for services it performs with respect to Nations Fund assets held for the benefit of its customers. Based on our analysis of the services provided by the affiliate, we believe all such payments should be regarded as a distribution expense, except for any portion attributable to payments by CMG for performance of sub-transfer agency or sub-accounting functions.
III. Recommendations
1) Criteria for review. The Trustees may wish to consider modifying the criteria for classifying a fund as a "Review Fund" to include criteria that focus exclusively on performance without regard to expense or fee levels. For example, a Fund whose one-year or three-year performance was median or below for four consecutive years could be treated as a Review Fund. Applying such criteria would add two Funds to the list of Review Funds.
2) Profitability data. CMG should present to the Trustees each year the profitability of each Fund, each investment style, and each complex (of which Nations is one) calculated as follows:
Exhibit 1. Management-only profitability should be calculated without reference to any Private Bank expense.
Exhibit 2. Profitability excluding distribution (which essentially covers the management and transfer agency functions) should be adjusted by removing from the expense calculation any portion of the Private Bank payment not attributable to the performance by the Private Bank of sub-transfer agency or sub-accounting functions.
Exhibit 3. Total profitability, including distribution: No adjustment for Private Bank expenses should be made, because all such expenses represent legitimate fund expenses to be taken into account in calculating CMG's profit margin including distribution.
Exhibit 4. Distribution only: This should include all Private Bank expenses other than those attributable to sub-transfer agency services.
Therefore, the following data need not be provided:
1. Adjusting total profitability data for Private Bank expenses
2. Adjusting profitability excluding distribution by backing out all Private Bank expenses.
3) Economies of scale. CMG and the IFC should continue to work on methods for more precisely quantifying to the extent possible the sources and magnitude of any economies of scale as CMG's mutual fund assets under management increase, to the extent that the data allows for meaningful year-over-year comparisons. The framework suggested in Section IV.D.4 may prove to be a useful model for such an analysis.
4) Competitive breakpoint analysis. As part of the annual fee evaluation process, the breakpoints of a select group of Nations Funds (which would differ each year) should continue to be compared to those of industry rivals to ensure that the Funds' breakpoint schedules remain within industry norms. As breakpoint schedules change relatively little each year, performing such a comparison for all Funds each year would not be an efficient use of Trustee and CMG resources.
5) Cost allocation methodology. CMG's point that the current ABC system of allocating indirect expenses creates anomalous results in several cases, including sub-advised Funds, is well-taken. We would like to work with CMG over the forthcoming year on alternatives to the current system of allocating indirect expenses that (1) resolve the anomalies, (2) limit the amount of incremental effort on CMG's part and (3) remain faithful to the general principle that expenses should be allocated by time and effort to the extent reasonably possible.
6) Management fee disparities. CMG and the Nations Trustees, as part of any future study of management fees, should analyze any differences in management fee schedules between Funds managed in similar investment styles. As part of that analysis, CMG should provide an explanation for any significant fee differences among comparable funds
117
across fund families managed by CMA, such as differences in the management styles of different Funds included the same Lipper category. Finally, whenever CMG proposes a management fee change or an expense cap for any mutual fund managed by CMA that is comparable to any Nations Fund, CMG should provide the Trustees with sufficient information about the proposal to allow the Trustees to assess the applicability of the proposed change to the relevant Nations Fund or Funds.
7) Tax-exempt Fund expense data. The expense rankings of certain tax-exempt Funds were adversely affected by including certain investment-related interest expenses that Lipper excluded in calculating the expense ratios of competitors. We recommend that CMG follow the Lipper practice and exclude such interest expenses from data submitted to Lipper to avoid unfairly disadvantaging the tax-exempt Funds.
8) Reduction of volume of paper documents submitted. The effort to rationalize and simplify the data presented to the Trustees and the process by which that data was prepared and organized was regarded as a success by all parties. We should continue to look for opportunities to reduce and simplify the presentation of 15(c) data, especially in the area of Fund and manager profitability. The Fund "Dashboard" volume presents a large volume of Fund data on a single page. If it is continued, the Trustees may wish to consider receiving the underlying Lipper data on CD, rather than the current paper volumes.
* * *
Respectfully submitted,
Steven E. Asher
118
This page intentionally left blank.
This page intentionally left blank.
Important Information About This Report
The funds mail one shareholder report to each shareholder address. If you would like more than one report, please call shareholder services at 1-800-345-6611 and additional reports will be sent to you. This report has been prepared for shareholders of the International/Global Stock Funds listed on the front cover.
A description of the policies and procedures that each fund uses to determine how to vote proxies and a copy of each fund's voting records are available (i) at www.columbiamanagement.com; (ii) on the Securities and Exchange Commission's website at www.sec.gov, and (iii) without charge, upon request, by calling 1-800-368-0346. Information regarding how each fund voted proxies relating to portfolio securities during the 12-month period ended June 30 is available from the SEC's website. Information regarding how each fund voted proxies relating to portfolio securities is also available from the funds' website, www.columbiamanagement.com.
Each fund files a complete schedule of portfolio holdings with the SEC for the first and third quarters of each fiscal year on Form N-Q. Each fund's Form N-Q is available on the SEC's website at www.sec.gov and may be reviewed and copied at the SEC's Public Reference Room in Washington, DC. Information on the operation of the Public Reference Room may be obtained by calling 1-800-SEC-0330.
Please read and consider the investment objectives, risks, charges and expenses for any fund carefully before investing. For a prospectus which contains this and other important information about a fund, contact your Columbia Management representative or financial advisor or go to www.columbiamanagement.com.
Columbia Management Group, LLC ("Columbia Management") is the investment management division of Bank of America Corporation. Columbia Management entities furnish investment management services and product for institutional and individual investors. Columbia Funds are distributed by Columbia Management Distributors, Inc., member of FINRA, SIPC, part of Columbia Management and an affiliate of Bank of America Corporation.
| Transfer Agent | |
|
Columbia Management Services, Inc.
P.O. Box 8081
Boston, MA 02266-8081
800.345.6611 | |
|
| Distributor | |
|
Columbia Management
Distributors, Inc.
One Financial Center
Boston, MA 02111 | |
|
| Investment Advisor | |
|
Columbia Management Advisors, LLC
100 Federal Street
Boston, MA 02110 | |
|
121
Columbia Management®
One Financial Center
Boston, MA 02111-2621
PRSRT STD
U.S. Postage
PAID
Holliston, MA
Permit NO. 20
Columbia Management®
International/Global
Stock Funds
Annual Report, February 28, 2009
©2009 Columbia Management Distributors, Inc.
One Financial Center, Boston, MA 02111-2621
800-345-6611 www.columbiafunds.com
SHC-42/8545-0209 (04/09) 09/76253
Columbia Management®
Annual Report
February 28, 2009
Columbia Overseas Value Fund
| NOT FDIC INSURED | | May Lose Value | |
|
| NOT BANK ISSUED | | No Bank Guarantee | |
|
This page intentionally left blank.
Fund Profile – Columbia Overseas Value Fund
Summary
g For the 11-month period from the fund's inception on March 31, 2008 through February 28, 2009, the fund's Class Z shares returned negative 53.41% without sales charge.
g As economic conditions worsened around the world, the fund, its benchmark and the average fund in its peer group all lost more than 50% for the period.
g The fund's return was somewhat lower than its benchmark generally because it had less exposure to the energy sector.
Portfolio Management
Fred Copper has co-managed the fund since March 2008 and has been with the advisor or its predecessors or affiliate organizations since 2005.
Jasmine (Weili) Huang has co-managed the fund since March 2008 and has been with the advisor or its predecessors or affiliate organizations since 2003.
Timothy R. Anderson has co-managed the fund since March 2008 and has been with the advisor or its predecessors or affiliate organizations since 2006.
Paul J. DiGiacomo has co-managed the fund since March 2008 and has been with the advisor or its predecessors or affiliate organizations since 2006.
Daisuke Nomoto has co-managed the fund since March 2008 and has been with the advisor or its predecessors or affiliate organizations since 2005.
Performance data quoted represents past performance and current performance may be lower or higher. Past performance is no guarantee of future results. The investment return and principal value will fluctuate so that shares, when redeemed, may be worth more or less than the original cost. Please call 1-800-426-3750 for daily and most recent month-end performance updates.
Summary
Life (cumulative) return as of 02/28/09
| | –53.41% | |
|
| |  | | | Class Z shares
(without sales charge) | |
|
| | –51.18% | |
|
| |  | | | MSCI EAFE Value Index | |
|
Morningstar Style Box

The Morningstar Style Box reveals a fund's investment strategy. For equity funds, the vertical axis shows the market capitalization of the stocks owned, and the horizontal axis shows investment style (value, blend or growth). Information shown is based on the most recent data provided by Morningstar.
The Morgan Stanley Capital International (MSCI) Europe, Australasia, Far East (EAFE) Value Index is a subset of the MSCI EAFE Index, and constituents of the index include securities from Europe, Australasia and the Far East. The index generally represents approximately 50% of the free float-adjusted market capitalization of the underlying MSCI EAFE Index, and consists of those securities classified by Morgan Stanley Capital International, Inc. (MSCI) as most representing the value style, such as higher book value-to-price ratios, higher forward earnings-to-price ratios, higher dividend yields and lower forecasted growth rates than securities representing the growth style. Indices are not investments, do not incur fees or expenses and are not professionally managed. It is not possible to invest directly in an index. Securities in the fund may not match those in an index.
1
Economic Update – Columbia Overseas Value Fund
Summary
For the 12-month period that ended February 28, 2009
g Stock markets across the world fell sharply, as measured in U.S. dollars by the MSCI World Index and the MSCI EAFE Index. A rising dollar further depressed losses in foreign markets.
| MSCI World | | MSCI EAFE
Index | | Index | |
|
| | |  | |  | |
|
The pace of economic growth slowed around the world during the 12-month period that began March 1, 2008 and ended February 28, 2009. Most major developed economies slipped into recession in 2008, with little relief in sight for the first half of 2009. In the United States, the downturn was even sharper than anticipated. Fourth quarter 2008 growth was reported at negative 6.3%—the worst quarter on record for the U.S. economy since 1982. The United Kingdom, Germany, Japan, South Korea and Singapore are also in recession. Although emerging markets have largely avoided recession, the global slowdown has taken the steam out of their economic growth as exports to developed markets fell off sharply.
Global financial system in tangles
Troubles that began in the U.S. subprime mortgage market spread across Europe and entangled the world's financial systems during the 12-month period. A meltdown within the U.S. financial sector claimed several major institutions and led others to seek bailouts, restructuring or both. Central banks around the world stepped in to infuse liquidity as credit dried up in 2008. Conditions have since eased, but more rigorous lending standards have severely limited access to credit in both developed and emerging markets, further hampering economic growth.
In the United States, unemployment has risen sharply over the past year, putting pressure on consumer spending. Western Europe and Japan, which rely heavily on exports, have experienced sharp declines in export trade. A weak housing market prevails in the United States and the United Kingdom. Even China's economy has exhibited signs of weakness where, in the last quarter of 2008, annualized gross domestic product growth fell to 6.8%, compared to more than 13% in 2007.1 An estimated 20 million jobs have been lost in China, according to moodys.com. India reported a loss of 3 million jobs due to shrinking exports.
Many central banks have reduced short-term borrowing rates while governments have increased spending in an effort to stimulate economic growth. However, these efforts may not be rewarded until later this year or next. The only other spark in this otherwise dark outlook is that commodity prices have fallen, easing one heavy burden on consumer budgets.
Stock markets experience sharp declines
Against this weak economic backdrop, the U.S. stock market lost 43.32% for the 12-month period, as measured by the Standard & Poor's (S&P) 500 Index.2 Losses extended across all market capitalizations and both growth and value, although growth stocks
1UBS Investment Research, Asian Economic Monitor, March 2009.
2The Standard & Poor's (S&P) 500 Index tracks the performance of 500 widely held, large capitalization US stocks.
2
Economic Update (continued) – Columbia Overseas Value Fund
held up slightly better than value stocks, as measured by their respective Russell indices.3 Stock markets outside the United States suffered even greater losses. The MSCI World Index4, which includes the U.S. market, returned negative 47.12%. The MSCI EAFE Index5, a broad gauge of stock market performance in foreign developed markets, lost 50.22% (in U.S. dollars) for the period. Emerging stock markets, which generally have had a strong run over the past several years, were also caught in the downdraft. As investors backed away from risk, emerging markets suffered significant declines. The MSCI Emerging Markets Index6 returned negative 56.03% (in U.S. dollars). However, foreign stock market performance showed some improvement in the final month of the period, outperforming U.S. stocks for the first time in a year. Emerging market indexes generally suffered smaller downturns in Februar y than did the other major indices.
Past performance is no guarantee of future results.
3The Russell 1000 Growth Index measures the performance of those Russell 1000 Index companies with higher price-to-book ratios and higher forecasted growth values. The Russell 1000 Value Index measures the performance of those Russell 1000 Index companies with lower price-to-book ratios and lower forecasted growth values. The Russell 2000 Growth Index measures the performance of those Russell 2000 companies with higher price-to-book ratios and higher forecasted growth values. The Russell 2000 Value Index measures the performance of those Russell 2000 companies with lower price-to-book ratios and lower forecasted growth values. The Russell 3000 Growth Index measures the performance of those Russell 3000 Index companies with higher price-to-book ratios and higher forecasted grow th values. The Russell 3000 Value Index measures the performance of those Russell 3000 Index companies with lower price-to-book ratios and lower forecasted growth values. The Russell Midcap Growth Index measures the performance of those Russell Midcap companies with higher price-to-book ratios and higher forecasted growth values. The Russell Midcap Vaue Index measures the performance of those Russell Midcap companies with lower price-to-book ratios and lower forecasted growth values.
4The Morgan Stanley Capital International (MSCI) World Index tracks the performance of global stocks.
5The Morgan Stanley Capital International (MSCI) Europe, Australasia, Far East (EAFE) Index is a free float-adjusted market capitalization index that is designed to measure developed market equity performance, excluding the U.S. and Canada.
6The MSCI Emerging Markets Index is a widely accepted index composed of a sample of companies from 25 countries representing the global emerging stock markets.
Indices are not investments, do not incur fees or expenses and are not professionally managed. It is not possible to invest directly in an index. Securities in the fund may not match those in an index.
3
Performance Information – Columbia Overseas Value Fund
Performance data quoted represents past performance and current performance may be lower or higher. Past performance is no guarantee of future results. The investment return and principal value will fluctuate so that shares, when redeemed, may be worth more or less than the original cost. Please call 1-800-426-3750 for daily and most recent month-end performance updates.
Annual operating expense ratio (%)*
*The annual operating expense ratio is as stated in the fund's prospectus that is current as of the date of this report. Differences in expense ratios disclosed elsewhere in this report may result from including fee waivers and expense reimbursements as well as different time periods used in calculating the ratios.
Performance of a $10,000 investment 03/31/08 – 02/28/09 ($)
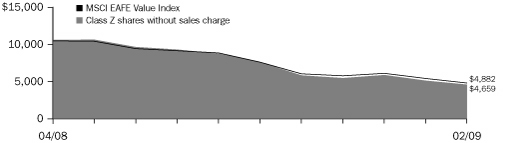 | |
|
The chart above shows the change in value of a hypothetical $10,000 investment in Class Z shares of Columbia Overseas Value Fund during the stated time period, and does not reflect the deduction of taxes that a shareholder may pay on fund distributions or on the redemption of fund shares. The Morgan Stanley Capital International (MSCI) Europe, Australasia, Far East (EAFE) Value Index is a subset of the MSCI EAFE Index, and constituents of the index include securities from Europe, Australasia and the Far East. The index generally represents approximately 50% of the free float-adjusted market capitalization of the underlying MSCI EAFE Index, and consists of those securities classified by Morgan Stanley Capital International, Inc. (MSCI) as most representing the value style, such as higher book value-to-price ratios, higher forward earnings-to-price ratios, higher dividend yields and lower forecasted growth rates than securities re presenting the growth style. Indices are not investments, do not incur fees or expenses and are not professionally managed. It is not possible to invest directly in an index. Securities in the fund may not match those in an index.
Performance of a $10,000 investment 03/31/08 – 02/28/09 ($)
| Sales charge | | without | | with | |
| Class Z | | | 4,659 | | | n/a | |
Average annual total return as of 02/28/09 (%)
| Share class | | Z | |
| Inception | | 03/31/08 | |
| Sales charge | | without | |
| Life (cumulative) | | | –53.41 | | |
Average annual total return as of 03/31/09 (%)
| Share class | | Z | |
| Sales charge | | without | |
| Life (cumulative) | | | –49.85 | | |
All results shown assume reinvestment of distributions. Class Z shares are sold at net asset value with no distribution and service (Rule 12b-1) fees. Class Z shares have limited eligibility and the investment minimum requirements may vary. Please see the fund's prospectus for details. Performance for different share classes will vary based on differences in sales charges and fees associated with each class.
Performance results reflect any fee waivers or reimbursements of fund expenses by the investment advisor and/or any of its affiliates. Absent these fee waivers or expense reimbursement arrangements, performance results would have been lower.
The tables do not reflect the deduction of taxes that a shareholder may pay on fund distributions or on the redemption of fund shares.
4
Understanding Your Expenses – Columbia Overseas Value Fund
As a fund shareholder, you incur two types of costs. There are transaction costs, which generally include sales charges on purchases and may include redemption fees or exchange fees. There are also ongoing costs, which generally include investment advisory fees, distribution and service (Rule 12b-1) fees and other fund expenses. The information on this page is intended to help you understand the ongoing costs of investing in the fund and to compare these costs with the ongoing costs of investing in other mutual funds.
Analyzing your fund's expenses by share class
To illustrate these ongoing costs, we have provided an example and calculated the expenses paid by investors in each share class during the period. The information in the following table is based on an initial investment of $1,000, which is invested at the beginning of the period and held for the entire period. Expense information is calculated two ways and each method provides you with different information. The amount listed in the "Actual" column is calculated using the fund's actual operating expenses and total return for the period. The amount listed in the "Hypothetical" column for each share class assumes that the return each year is 5% before expenses and is calculated based on the fund's actual operating expenses. You should not use the hypothetical account values and expenses to estimate either your actual account balance at the end of the period or the expenses you paid during this period.
Compare with other funds
Since all mutual funds are required to include the same hypothetical calculations about expenses in shareholder reports, you can use this information to compare the ongoing costs of investing in the fund with other funds. To do so, compare the 5% hypothetical example with the 5% hypothetical examples that appear in the shareholder reports of other funds. As you compare hypothetical examples of other funds, it is important to note that hypothetical examples are meant to highlight the ongoing costs of investing in a fund and do not reflect any transaction costs, such as sales charges, redemption fees or exchange fees.
Estimating your actual expenses
To estimate the expenses that you paid over the period, first you will need your account balance at the end of the period:
g For shareholders who receive their account statements from Columbia Management Services, Inc., your account balance is available by calling Shareholder Services at 800.426.3750.
g For shareholders who receive their account statements from their financial intermediary, contact your financial intermediary to obtain your account balance.
1. Divide your ending account balance by $1,000. For example, if an account balance was $8,600 at the end of the period, the result would be 8.6.
2. In the section of the table below titled "Expenses paid during the period," locate the amount for your share class. You will find this number in the column labeled "Actual." Multiply this number by the result from step 1. Your answer is an estimate of the expenses you paid on your account during the period.
If the value of your account falls below the minimum initial investment requirement applicable to you, your account generally will be subject to a $20 annual fee. This fee is not included in the accompanying table. If you are subject to the fee, keep it in mind when you are estimating the ongoing expenses of investing in the fund and when comparing the expenses of this fund with other funds.
09/01/08 – 02/28/09
| | | Account value at the
beginning of the period ($) | | Account value at the
end of the period ($) | | Expenses paid
during the period ($) | | Fund's annualized
expense ratio (%) | |
| | | Actual | | Hypothetical | | Actual | | Hypothetical | | Actual | | Hypothetical | | Actual | |
| Class Z | | | 1,000.00 | | | | 1,000.00 | | | | 525.88 | | | | 1,019.34 | | | | 4.16 | | | | 5.51 | | | | 1.10 | | |
Expenses paid during the period are equal to the annualized expense ratio for the share class, multiplied by the average account value over the period, then multiplied by the number of days in the fund's most recent fiscal half-year and divided by 365.
Had the investment advisor not waived fees or reimbursed a portion of expenses for Class Z shares, the account value at the end of the period would have been lower.
It is important to note that the expense amounts shown in the table are meant to highlight only ongoing costs of investing in the fund and do not reflect any transaction costs, such as sales charges, redemption fees or exchange fees. Therefore, the hypothetical examples provided may not help you determine the relative total costs of owning shares of different funds. If these transaction costs were included, your costs would have been higher.
5
Portfolio Managers' Report – Columbia Overseas Value Fund
Performance data quoted represents past performance and current performance may be lower or higher. Past performance is no guarantee of future results. The investment return and principal value will fluctuate so that shares, when redeemed, may be worth more or less than the original cost. Please call 1-800-426-3750 for daily and most recent month-end performance updates.
Net asset value per share
as of 02/28/09 ($)
Distributions declared per share
03/31/08 – 02/28/09 ($)
For the 11-month period from the fund's inception on March 31, 2008 through February 28, 2009, the fund's Class Z shares returned negative 53.41% without sales charge. The fund underperformed its benchmark, the MSCI EAFE Value Index1, which shed 51.18% over the same period. The average return for the fund's peer group, the Lipper International Large-Cap Value Funds Classification2, was negative 50.90%.The fund had less exposure than the benchmark to the energy sector, which generally accounted for the difference in performance. The energy sector is dominated by global mega cap companies with fairly stable cash flows and relatively high dividend yields. Because investors view such companies as defensive during turbulent times, they bid up the prices of these stocks and the fund's underweight in the sector hurt performance.
A difficult year for financials
During the period, the financials sector was hit hard as a liquidity crisis spread across the globe. In this environment, the portfolio's positions in Royal Bank of Scotland Group, which was partially nationalized because of balance sheet problems, and Emaar Properties, a developer in the United Arab Emirates, lost most of their value. Emaar was affected by the credit crisis and the downturn in property values in a slowing economy. We sold both stocks. However, insurance companies were less affected by problems in the credit markets; and the fund's overweight in this area was helpful to performance in that their stock prices did not decline as much as those of other financial sectors. For example, Brit Insurance Holdings PLC and Baloise-Holding AG fell on the order of 40% while financials overall declined more than 66% and Lancashire Holdings PLC in the United Kingdom reported a strong positive return. Insurance companies were a ided by higher and consistent premium payments. In the industrials sector, Harbin Power Equipment Co. Ltd., a Chinese power equipment manufacturer, was a disappointment. The company produces power generation and transmission equipment for utilities. In an environment of slowing economic growth and capital constraints, orders for such big-ticket items declined, and we sold the stock.
Certain consumer companies generated relatively strong returns
Late in the period, we began to sharpen our focus on defensive companies that we believe have the potential to do well in the difficult economic environment that exists around the world. Some of these companies turned in relatively strong returns for the fund. Shares of Toyo Suisan Kaisha Ltd., a manufacturer of processed food in Japan, rose strongly. As the cost of agricultural products fell, the company benefited from a decline in its operating expenses. Sony Corp. produced a double digit gain for the fund, and we took profits and sold the stock. Daiichikosho Co. Ltd., a Japanese manufacturer of karaoke equipment, and Dongfeng Motor Group Co. Ltd., an auto manufacturer in China, also helped relative returns. Both stocks lost value, but far less than the sector
1The Morgan Stanley Capital International Europe, Australasia, Far East (MSCI EAFE) Value Index is a subset of the MSCI EAFE Index, and constituents of the index include securities from Europe, Australasia and the Far East. The index generally represents approximately 50% of the free float-adjusted market capitalization of the underlying MSCI EAFE Index, and consists of those securities classified by Morgan Stanley Capital International, Inc. (MSCI) as most representing the value style, such as higher book value-to-price ratios, higher forward earnings-to-price ratios, higher dividend yields and lower forecasted growth rates than securities representing the growth style.
Indices are not investments, do not incur fees or expenses and are not professionally managed. It is not possible to invest directly in an index. Securities in the fund may not match those in an index.
2Lipper Inc., a widely respected data provider in the industry, calculates an average total return (assuming reinvestment of distributions) for mutual funds with investment objectives similar to those of the fund. Lipper makes no adjustment for the effect of sales loads.
6
Portfolio Managers' Report (continued) – Columbia Overseas Value Fund
overall. Daiichikosho had an extremely low valuation when we added it to the portfolio and was buoyed by strong product demand, as karaoke remains popular in Japan and is an inexpensive form of entertainment. Dongfeng Motor Group held up fairly well as demand for autos was stronger in China than in many other parts of the world.
Attractive buying opportunities
In the short term, we believe that volatility in the equity markets is likely to continue because of uncertainty regarding problems in the banking system and steps needed to emerge from the global recession. But the financial markets are forward looking, and they usually turn positive before the economy. Therefore, in these turbulent times, we are staying fully invested and are striving to take advantage of some of the most compelling investment opportunities we have ever seen. We are selecting stocks on a case-by-case basis, emphasizing companies with solid balance sheets that have little or no debt and that we believe have the potential to be profitable in the current slow-growth environment while offering good long-term business prospects. We have found such investments across all economic sectors and geographic areas.
Portfolio holdings and characteristics are subject to change periodically and may not be representative of current holdings and characteristics. The outlook for the fund may differ from that presented for other Columbia Funds.
Equity securities are affected by stock market fluctuations that occur in response to economic and business developments.
Value stocks are securities of companies that may have experienced adverse business or industry developments or may be subject to special risks that have caused the stocks to be out of favor. The price of the company's stock may not approach the value the manager has placed on it.
Top 5 sectors
as of 02/28/09 (%)
| Financials | | | 30.6 | | |
| Consumer Discretionary | | | 13.7 | | |
| Industrials | | | 11.1 | | |
| Telecommunications Services | | | 9.8 | | |
| Energy | | | 9.2 | | |
Top 10 holdings
as of 02/28/09 (%)
| Banco Santander SA | | | 2.6 | | |
| HSBC Holdings PLC | | | 2.6 | | |
| Vodafone Group PLC | | | 2.5 | | |
| Toyota Motor Corp. | | | 2.5 | | |
| Total SA | | | 2.2 | | |
| Sanofi-Aventis SA | | | 2.0 | | |
| Vivendi SA | | | 1.9 | | |
| NTT DoCoMo, Inc. | | | 1.8 | | |
Australia & New Zealand
Banking Group Ltd. | | | 1.6 | | |
Banco Bilbao Vizcaya
Argentaria SA | | | 1.6 | | |
Holdings discussed in this report
as of 02/28/09 (%)
| Brit Insurance Holdings PLC | | | 1.1 | | |
| Baloise-Holding AG | | | 1.2 | | |
| Lancashire Holdings PLC | | | 0.8 | | |
| Toyo Suisan Kaisha Ltd. | | | 1.0 | | |
| Daiichikosho Co. Ltd. | | | 1.0 | | |
Dongfeng Motor Group
Co. Ltd. | | | 0.5 | | |
The fund is actively managed and the composition of its portfolio will change over time. Information provided is calculated as a percentage of net assets.
7
Investment Portfolio – Columbia Overseas Value Fund
February 28, 2009
| Common Stocks – 102.2% | |
| | | Shares | | Value ($) | |
| Consumer Discretionary – 13.7% | |
| Automobiles – 4.7% | |
Daimler AG,
Registered Shares | | | 1,286 | | | | 29,362 | | |
Dongfeng Motor Group Co.,
Ltd., Class H | | | 60,000 | | | | 22,282 | | |
| Fuji Heavy Industries Ltd. | | | 7,000 | | | | 22,737 | | |
| Honda Motor Co., Ltd. | | | 1,100 | | | | 26,938 | | |
| Toyota Motor Corp. | | | 3,600 | | | | 117,301 | | |
| Automobiles Total | | | 218,620 | | |
| Diversified Consumer Services – 0.7% | |
| Benesse Corp. | | | 800 | | | | 32,051 | | |
| Diversified Consumer Services Total | | | 32,051 | | |
| Hotels, Restaurants & Leisure – 2.3% | |
Kuoni Reisen Holding AG,
Registered Shares | | | 138 | | | | 33,030 | | |
| OPAP SA | | | 1,371 | | | | 35,388 | | |
| Paddy Power PLC | | | 2,825 | | | | 39,395 | | |
| Hotels, Restaurants & Leisure Total | | | 107,813 | | |
| Household Durables – 0.6% | |
| JM AB | | | 6,379 | | | | 27,054 | | |
| Household Durables Total | | | 27,054 | | |
| Media – 2.8% | |
| Daiichikosho Co., Ltd. | | | 4,800 | | | | 45,101 | | |
| Vivendi SA | | | 3,617 | | | | 86,963 | | |
| Media Total | | | 132,064 | | |
| Specialty Retail – 1.8% | |
| Fast Retailing Co., Ltd. | | | 200 | | | | 20,390 | | |
| Game Group PLC | | | 21,899 | | | | 45,850 | | |
| Uss Co., Ltd. | | | 470 | | | | 19,119 | | |
| Specialty Retail Total | | | 85,359 | | |
| Textiles, Apparel & Luxury Goods – 0.8% | |
| Polo Ralph Lauren Corp. | | | 994 | | | | 34,263 | | |
| Textiles, Apparel & Luxury Goods Total | | | 34,263 | | |
| Consumer Discretionary Total | | | 637,224 | | |
| Consumer Staples – 3.4% | |
| Food & Staples Retailing – 1.6% | |
| FamilyMart Co., Ltd. | | | 1,200 | | | | 40,699 | | |
| Koninklijke Ahold NV | | | 2,783 | | | | 31,259 | | |
| Food & Staples Retailing Total | | | 71,958 | | |
| Food Products – 1.0% | |
| Toyo Suisan Kaisha Ltd. | | | 2,000 | | | | 47,749 | | |
| Food Products Total | | | 47,749 | | |
| | | Shares | | Value ($) | |
| Household Products – 0.8% | |
| Kao Corp. | | | 2,000 | | | | 38,260 | | |
| Household Products Total | | | 38,260 | | |
| Consumer Staples Total | | | 157,967 | | |
| Energy – 9.2% | |
| Energy Equipment & Services – 0.6% | |
| Noble Corp. | | | 1,062 | | | | 26,115 | | |
| Energy Equipment & Services Total | | | 26,115 | | |
| Oil, Gas & Consumable Fuels – 8.6% | |
Australian Worldwide
Exploration Ltd. | | | 25,449 | | | | 37,754 | | |
| BP PLC | | | 9,997 | | | | 64,152 | | |
| Centennial Coal Co., Ltd. | | | 13,985 | | | | 15,650 | | |
| CNOOC Ltd. | | | 25,000 | | | | 21,921 | | |
| ENI SpA | | | 1,758 | | | | 35,347 | | |
| Inpex Holdings, Inc. | | | 4 | | | | 27,788 | | |
| Repsol YPF SA | | | 1,389 | | | | 21,518 | | |
| Royal Dutch Shell PLC, Class B | | | 2,534 | | | | 53,835 | | |
| Total SA | | | 2,164 | | | | 102,823 | | |
Yanzhou Coal Mining Co.,
Ltd., Class H | | | 40,000 | | | | 23,107 | | |
| Oil, Gas & Consumable Fuels Total | | | 403,895 | | |
| Energy Total | | | 430,010 | | |
| Financials – 30.6% | |
| Capital Markets – 2.5% | |
Credit Suisse Group AG,
Registered Shares | | | 1,787 | | | | 44,176 | | |
| Intermediate Capital Group PLC | | | 3,837 | | | | 14,323 | | |
| Macquarie Group Ltd. | | | 1,423 | | | | 15,451 | | |
| Tokai Tokyo Securities Co., Ltd. | | | 24,000 | | | | 40,822 | | |
| Capital Markets Total | | | 114,772 | | |
| Commercial Banks – 17.5% | |
Australia & New Zealand
Banking Group Ltd. | | | 8,951 | | | | 76,183 | | |
Banco Bilbao Vizcaya
Argentaria SA | | | 10,223 | | | | 75,040 | | |
| Banco Santander SA | | | 19,518 | | | | 121,245 | | |
Bangkok Bank PCL, Foreign
Registered Shares | | | 13,900 | | | | 28,626 | | |
| Bank of China Ltd., Class H | | | 119,000 | | | | 33,297 | | |
| Barclays PLC | | | 30,098 | | | | 40,244 | | |
| BNP Paribas | | | 2,028 | | | | 66,820 | | |
| DBS Group Holdings Ltd. | | | 10,000 | | | | 50,654 | | |
| DnB NOR ASA | | | 7,600 | | | | 27,737 | | |
| HSBC Holdings PLC | | | 17,218 | | | | 121,090 | | |
Mitsubishi UFJ Financial
Group, Inc. | | | 7,800 | | | | 36,285 | | |
See Accompanying Notes to Financial Statements.
8
Columbia Overseas Value Fund
February 28, 2009
| Common Stocks (continued) | |
| Financials (continued) | |
| | | Shares | | Value ($) | |
| National Bank of Greece SA | | | 2,975 | | | | 37,037 | | |
| Nordea Bank AB | | | 2,938 | | | | 14,777 | | |
| Standard Chartered PLC | | | 3,609 | | | | 34,307 | | |
Sumitomo Mitsui Financial
Group, Inc. | | | 1,200 | | | | 38,977 | | |
Unibanco - Uniao de Bancos
Brasileiros SA, ADR | | | 307 | | | | 16,065 | | |
| Commercial Banks Total | | | 818,384 | | |
| Diversified Financial Services – 0.6% | |
| ING Groep NV | | | 6,479 | | | | 30,111 | | |
| Diversified Financial Services Total | | | 30,111 | | |
| Insurance – 6.8% | |
| Allianz SE, Registered Shares | | | 271 | | | | 18,425 | | |
Baloise Holding AG,
Registered Shares | | | 957 | | | | 54,523 | | |
| Brit Insurance Holdings PLC | | | 18,509 | | | | 50,345 | | |
| Lancashire Holdings Ltd. (a) | | | 5,146 | | | | 35,454 | | |
| MetLife, Inc. | | | 1,110 | | | | 20,491 | | |
Muenchener Rueckversicherungs-
Gesellschaft AG, Registered Shares | | | 257 | | | | 31,591 | | |
Platinum Underwriters
Holdings Ltd. | | | 1,221 | | | | 34,237 | | |
Zurich Financial Services AG,
Registered Shares | | | 516 | | | | 73,572 | | |
| Insurance Total | | | 318,638 | | |
| Real Estate Investment Trusts (REITs) – 0.7% | |
| Kiwi Income Property Trust | | | 66,711 | | | | 33,078 | | |
| Real Estate Investment Trusts (REITs) Total | | | 33,078 | | |
| Real Estate Management & Development – 2.5% | |
| Hongkong Land Holdings Ltd. | | | 22,000 | | | | 45,760 | | |
| Leopalace21 Corp. | | | 4,000 | | | | 22,624 | | |
| Swire Pacific Ltd., Class A | | | 7,500 | | | | 46,614 | | |
| Real Estate Management & Development Total | | | 114,998 | | |
| Financials Total | | | 1,429,981 | | |
| Health Care – 6.6% | |
| Health Care Providers & Services – 0.5% | |
| As One Corp. | | | 1,500 | | | | 25,268 | | |
| Health Care Providers & Services Total | | | 25,268 | | |
| Life Sciences Tools & Services – 0.4% | |
| Tecan Group AG, Registered Shares | | | 640 | | | | 17,506 | | |
| Life Sciences Tools & Services Total | | | 17,506 | | |
| Pharmaceuticals – 5.7% | |
| Astellas Pharma, Inc. | | | 1,500 | | | | 50,566 | | |
| AstraZeneca PLC | | | 823 | | | | 26,427 | | |
| Recordati SpA | | | 5,312 | | | | 27,274 | | |
| | | Shares | | Value ($) | |
| Sanofi-Aventis SA | | | 1,796 | | | | 93,158 | | |
| Takeda Pharmaceutical Co., Ltd. | | | 1,700 | | | | 69,502 | | |
| Pharmaceuticals Total | | | 266,927 | | |
| Health Care Total | | | 309,701 | | |
| Industrials – 11.1% | |
| Aerospace & Defense – 1.7% | |
| BAE Systems PLC | | | 9,847 | | | | 52,370 | | |
| Bombardier, Inc., Class B | | | 10,500 | | | | 24,430 | | |
| Aerospace & Defense Total | | | 76,800 | | |
| Airlines – 0.7% | |
Deutsche Lufthansa AG,
Registered Shares | | | 2,887 | | | | 31,842 | | |
| Airlines Total | | | 31,842 | | |
| Commercial Services & Supplies – 0.5% | |
| Aeon Delight Co., Ltd. | | | 1,800 | | | | 23,350 | | |
| Commercial Services & Supplies Total | | | 23,350 | | |
| Construction & Engineering – 2.4% | |
| Monadelphous Group Ltd. | | | 5,293 | | | | 24,200 | | |
| Outotec Oyj | | | 2,836 | | | | 42,533 | | |
| Toyo Engineering Corp. | | | 16,000 | | | | 44,265 | | |
| Construction & Engineering Total | | | 110,998 | | |
| Electrical Equipment – 1.5% | |
| Schneider Electric SA | | | 1,187 | | | | 71,930 | | |
| Electrical Equipment Total | | | 71,930 | | |
| Industrial Conglomerates – 1.2% | |
| DCC PLC | | | 1,769 | | | | 24,109 | | |
| Keppel Corp. Ltd. | | | 12,000 | | | | 33,881 | | |
| Industrial Conglomerates Total | | | 57,990 | | |
| Machinery – 1.2% | |
| Gildemeister AG | | | 1,781 | | | | 10,454 | | |
| Nabtesco Corp. | | | 7,000 | | | | 43,465 | | |
| Machinery Total | | | 53,919 | | |
| Professional Services – 1.0% | |
| Teleperformance | | | 1,680 | | | | 46,856 | | |
| Professional Services Total | | | 46,856 | | |
| Transportation Infrastructure – 0.9% | |
Zhejiang Expressway Co., Ltd.,
Class H | | | 66,000 | | | | 43,318 | | |
| Transportation Infrastructure Total | | | 43,318 | | |
| Industrials Total | | | 517,003 | | |
See Accompanying Notes to Financial Statements.
9
Columbia Overseas Value Fund
February 28, 2009
| Common Stocks (continued) | |
| | | Shares | | Value ($) | |
| Information Technology – 3.6% | |
| Electronic Equipment, Instruments & Components – 0.6% | |
| FUJIFILM Holdings Corp. | | | 1,400 | | | | 26,682 | | |
Electronic Equipment, Instruments &
Components Total | | | 26,682 | | |
| Internet Software & Services – 0.8% | |
| NetEase.com, Inc., ADR (a) | | | 1,709 | | | | 35,000 | | |
| Internet Software & Services Total | | | 35,000 | | |
| Office Electronics – 0.7% | |
| Canon, Inc. | | | 1,300 | | | | 33,834 | | |
| Office Electronics Total | | | 33,834 | | |
| Semiconductors & Semiconductor Equipment – 1.0% | |
| Macronix International | | | 146,479 | | | | 47,594 | | |
Semiconductors & Semiconductor
Equipment Total | | | 47,594 | | |
| Software – 0.5% | |
| NSD CO LTD | | | 3,900 | | | | 23,657 | | |
| Software Total | | | 23,657 | | |
| Information Technology Total | | | 166,767 | | |
| Materials – 7.3% | |
| Chemicals – 2.9% | |
| BASF SE | | | 1,415 | | | | 39,393 | | |
| Clariant AG, Registered Shares (a) | | | 5,985 | | | | 22,511 | | |
| Kansai Paint Co., Ltd. | | | 9,000 | | | | 46,939 | | |
| Nifco, Inc. | | | 2,900 | | | | 26,713 | | |
| Chemicals Total | | | 135,556 | | |
| Construction Materials – 0.6% | |
| Ciments Francais SA | | | 422 | | | | 29,451 | | |
| Construction Materials Total | | | 29,451 | | |
| Containers & Packaging – 0.9% | |
| Toyo Seikan Kaisha Ltd. | | | 3,100 | | | | 40,054 | | |
| Containers & Packaging Total | | | 40,054 | | |
| Metals & Mining – 2.9% | |
| Anglo American PLC | | | 2,402 | | | | 34,422 | | |
| BlueScope Steel Ltd. | | | 16,983 | | | | 24,217 | | |
| Norsk Hydro ASA | | | 4,000 | | | | 12,976 | | |
| Tokyo Steel Manufacturing Co., Ltd. | | | 2,100 | | | | 20,937 | | |
| Yamato Kogyo Co., Ltd. | | | 2,000 | | | | 41,498 | | |
| Metals & Mining Total | | | 134,050 | | |
| Materials Total | | | 339,111 | | |
| | | Shares | | Value ($) | |
| Telecommunication Services – 9.8% | |
| Diversified Telecommunication Services – 5.5% | |
| BCE, Inc. | | | 1,620 | | | | 31,618 | | |
| Belgacom SA | | | 1,351 | | | | 44,334 | | |
Deutsche Telekom AG,
Registered Shares | | | 2,182 | | | | 26,459 | | |
| France Telecom SA | | | 2,037 | | | | 45,992 | | |
Nippon Telegraph &
Telephone Corp. | | | 1,600 | | | | 69,676 | | |
| Telefonica O2 Czech Republic AS | | | 2,424 | | | | 41,134 | | |
| Diversified Telecommunication Services Total | | | 259,213 | | |
| Wireless Telecommunication Services – 4.3% | |
| NTT DoCoMo, Inc. | | | 52 | | | | 82,000 | | |
| Vodafone Group PLC | | | 65,769 | | | | 117,882 | | |
| Wireless Telecommunication Services Total | | | 199,882 | | |
| Telecommunication Services Total | | | 459,095 | | |
| Utilities – 6.9% | |
| Electric Utilities – 3.1% | |
| E.ON AG | | | 1,293 | | | | 33,456 | | |
| Enel SPA | | | 14,663 | | | | 73,334 | | |
| Okinawa Electric Power Co., Inc. | | | 600 | | | | 36,887 | | |
| Electric Utilities Total | | | 143,677 | | |
| Independent Power Producers & Energy Traders – 0.9% | |
| Drax Group PLC | | | 5,558 | | | | 41,296 | | |
Independent Power Producers & Energy
Traders Total | | | 41,296 | | |
| Multi-Utilities – 1.8% | |
| Centrica PLC | | | 10,111 | | | | 39,155 | | |
| United Utilities Group PLC | | | 6,409 | | | | 46,564 | | |
| Multi-Utilities Total | | | 85,719 | | |
| Water Utilities – 1.1% | |
Cia de Saneamento Basico do
Estado de Sao Paulo | | | 1,800 | | | | 18,095 | | |
| Guangdong Investment Ltd. | | | 76,000 | | | | 31,947 | | |
| Water Utilities Total | | | 50,042 | | |
| Utilities Total | | | 320,734 | | |
Total Common Stocks
(cost of $8,073,102) | | | 4,767,593 | | |
Total Investments – 102.2%
(cost of $8,073,102) (c) | | | 4,767,593 | | |
| Other Assets & Liabilities, Net – (2.2)% | | | (103,251 | ) | |
| Net Assets – 100.0% | | | 4,664,342 | | |
See Accompanying Notes to Financial Statements.
10
Columbia Overseas Value Fund
February 28, 2009
Notes to Investment Portfolio:
(a) Non-income producing security.
(b) Cost for federal income tax purposes is $8,115,714.
Forward foreign currency exchange contracts outstanding on February 28, 2009, are:
Forward
Foreign
Currency
Contracts
to Buy | | Value | | Aggregate
Face
Value | | Settlement
Date | | Unrealized
Appreciation
(Depreciation) | |
| AUD | | | | $ | 89,170 | | | $ | 90,156 | | | 04/30/09 | | $ | (986 | ) | |
| AUD | | | 10,190 | | | | 10,374 | | | 04/30/09 | | | (184 | ) | |
| AUD | | | 11,465 | | | | 11,570 | | | 04/30/09 | | | (105 | ) | |
| CAD | | | 7,075 | | | | 7,176 | | | 04/30/09 | | | (101 | ) | |
| CHF | | | 10,270 | | | | 10,374 | | | 04/30/09 | | | (104 | ) | |
| CHF | | | 25,676 | | | | 25,623 | | | 04/30/09 | | | 53 | | |
| CHF | | | 16,261 | | | | 16,310 | | | 04/30/09 | | | (49 | ) | |
| DKK | | | 13,078 | | | | 13,176 | | | 04/30/09 | | | (98 | ) | |
| EUR | | | 519,639 | | | | 523,529 | | | 04/30/09 | | | (3,890 | ) | |
| GBP | | | 57,258 | | | | 58,528 | | | 04/30/09 | | | (1,270 | ) | |
| GBP | | | 7,157 | | | | 7,102 | | | 04/30/09 | | | 55 | | |
| JPY | | | 9,786 | | | | 10,595 | | | 04/30/09 | | | (809 | ) | |
| JPY | | | 24,465 | | | | 26,488 | | | 04/30/09 | | | (2,023 | ) | |
| NOK | | | 15,760 | | | | 16,074 | | | 04/30/09 | | | (314 | ) | |
| SEK | | | 88,152 | | | | 95,200 | | | 04/30/09 | | | (7,048 | ) | |
| SEK | | | 9,992 | | | | 10,729 | | | 04/30/09 | | | (737 | ) | |
| | | | | $ | (17,610 | ) | |
Forward
Foreign
Currency
Contracts
to Sell | | Value | | Aggregate
Face
Value | | Settlement
Date | | Unrealized
Appreciation | |
| AUD | | | | $ | 21,018 | | | $ | 21,403 | | | 04/30/09 | | $ | 385 | | |
| CAD | | | 51,097 | | | | 52,875 | | | 04/30/09 | | | 1,778 | | |
| CAD | | | 10,219 | | | | 10,449 | | | 04/30/09 | | | 230 | | |
| CHF | | | 190,003 | | | | 190,771 | | | 04/30/09 | | | 768 | | |
| CZK | | | 47,535 | | | | 47,759 | | | 04/30/09 | | | 224 | | |
| EUR | | | 16,476 | | | | 16,702 | | | 04/30/09 | | | 226 | | |
| EUR | | | 43,092 | | | | 43,226 | | | 04/30/09 | | | 134 | | |
| EUR | | | 43,092 | | | | 43,245 | | | 04/30/09 | | | 153 | | |
| JPY | | | 9,786 | | | | 10,645 | | | 04/30/09 | | | 859 | | |
| JPY | | | 9,653 | | | | 10,019 | | | 04/30/09 | | | 366 | | |
| NZD | | | 25,944 | | | | 26,390 | | | 04/30/09 | | | 446 | | |
| SGD | | | 25,835 | | | | 26,529 | | | 04/30/09 | | | 694 | | |
| THB | | | 25,626 | | | | 26,551 | | | 04/30/09 | | | 925 | | |
| TWD | | | 40,927 | | | | 42,607 | | | 04/30/09 | | | 1,680 | | |
| | | | | $ | 8,868 | | |
The Fund was invested in the following countries at February 28, 2009:
Summary of Securities
By Country (Unaudited) | | Value ($) | | % of Total
Investments | |
| Japan | | | 1,282,132 | | | | 26.9 | | |
| United Kingdom | | | 817,715 | | | | 17.2 | | |
| France | | | 543,995 | | | | 11.4 | | |
| Switzerland | | | 245,319 | | | | 5.2 | | |
| Hong Kong | | | 222,485 | | | | 4.7 | | |
| Germany | | | 220,982 | | | | 4.6 | | |
| Spain | | | 217,803 | | | | 4.5 | | |
| Australia | | | 193,455 | | | | 4.0 | | |
| Italy | | | 135,955 | | | | 2.9 | | |
| Singapore | | | 130,296 | | | | 2.7 | | |
| United States | | | 115,106 | | | | 2.4 | | |
| Greece | | | 72,424 | | | | 1.5 | | |
| Ireland | | | 63,504 | | | | 1.3 | | |
| Netherlands | | | 61,371 | | | | 1.3 | | |
| Canada | | | 56,048 | | | | 1.2 | | |
| Taiwan | | | 47,594 | | | | 1.0 | | |
| Belgium | | | 44,334 | | | | 0.9 | | |
| Finland | | | 42,533 | | | | 0.9 | | |
| Sweden | | | 41,831 | | | | 0.9 | | |
| Czech Republic | | | 41,134 | | | | 0.9 | | |
| Norway | | | 40,713 | | | | 0.9 | | |
| China | | | 35,000 | | | | 0.7 | | |
| Brazil | | | 34,160 | | | | 0.7 | | |
| New Zealand | | | 33,078 | | | | 0.7 | | |
| Thailand | | | 28,626 | | | | 0.6 | | |
| | | $ | 4,767,593 | | | | 100.0 | % | |
Certain securities are listed by country of underlying exposure but may trade predominantly on another exchange.
| Acronym | | Name | |
| ADR | | American Depositary Receipt | |
| AUD | | Australian Dollar | |
| CAD | | Canadian Dollar | |
| CHF | | Swiss Franc | |
| CZK | | Czech Koruna | |
| DKK | | Danish Krone | |
| EUR | | Euro | |
| GBP | | Pound Sterling | |
| JPY | | Japanese Yen | |
| NOK | | Norwegian Krone | |
| NZD | | New Zealand Dollar | |
| SEK | | Swedish Krona | |
| SGD | | Singapore Dollar | |
| THB | | Thailand Baht | |
| TWD | | New Taiwan Dollar | |
See Accompanying Notes to Financial Statements.
11
Statement of Assets and Liabilities – Columbia Overseas Value Fund
February 28, 2009
| | | | | ($) | |
| Assets | | Investments, at cost | | | 8,073,102 | | |
| | | Investments, at value | | | 4,767,593 | | |
| | | Cash | | | 8,170 | | |
| | | Foreign currency (cost of $2,049) | | | 1,994 | | |
| | | Unrealized appreciation on forward foreign currency exchange contracts | | | 8,976 | | |
| | | Receivable for: | | | | | |
| | | Dividends | | | 7,432 | | |
| | | Foreign tax reclaims | | | 9,711 | | |
| | | Expense reimbursement due from investment advisor | | | 8,493 | | |
| | | Other assets | | | 91 | | |
| | | Total Assets | | | 4,812,460 | | |
| Liabilities | | Unrealized depreciation on forward foreign currency exchange contracts | | | 17,718 | | |
| | | Payable for: | | | | | |
| | | Investment advisory fee | | | 3,518 | | |
| | | Administration fee | | | — | | |
| | | Transfer agent fee | | | 487 | | |
| | | Trustees' fees | | | 933 | | |
| | | Audit fee | | | 52,044 | | |
| | | Pricing and bookkeeping fees | | | 2,014 | | |
| | | Custody fee | | | 4,996 | | |
| | | Legal fee | | | 6,946 | | |
| | | Reports to shareholders | | | 33,340 | | |
| | | Chief compliance officer expenses | | | 102 | | |
| | | Other liabilities | | | 26,020 | | |
| | | Total Liabilities | | | 148,118 | | |
| | | Net Assets | | | 4,664,342 | | |
| Net Assets Consist of | | Paid-in capital | | | 10,235,633 | | |
| | | Accumulated net investment loss | | | (3,584 | ) | |
| | | Accumulated net realized loss | | | (2,251,109 | ) | |
| | | Net unrealized appreciation (depreciation) on: | | | | | |
| | | Investments | | | (3,305,509 | ) | |
| | | Foreign currency translations | | | (11,089 | ) | |
| | | Net Assets | | | 4,664,342 | | |
| Class Z | | Net assets | | $ | 4,664,342 | | |
| | | Shares outstanding | | | 1,044,723 | | |
| | | Net asset value, offering and redemption price per share | | $ | 4.46 | | |
See Accompanying Notes to Financial Statements.
12
Statement of Operations – Columbia Overseas Value Fund
For the period March 31, 2008, through February 28, 2009
| | | | | ($) (a) | |
| Investment Income | | Dividends | | | 380,055 | | |
| | | Interest | | | 1,580 | | |
| | | Foreign taxes withheld | | | (34,091 | ) | |
| | | Total income | | | 347,544 | | |
| Expenses | | Investment advisory fee | | | 59,187 | | |
| | | Administration fee | | | — | | |
| | | Transfer agent fee | | | 525 | | |
| | | Pricing and bookkeeping fees | | | 14,124 | | |
| | | Trustees' fees | | | 13,461 | | |
| | | Custody fee | | | 28,866 | | |
| | | Audit fee | | | 59,591 | | |
| | | Legal fee | | | 38,484 | | |
| | | Reports to shareholders | | | 41,613 | | |
| | | Chief compliance officer expenses | | | 550 | | |
| | | Other expenses | | | 31,366 | | |
| | | Total Expenses | | | 287,767 | | |
| | | Fees waived or expenses reimbursed by investment advisor | | | (208,317 | ) | |
| | | Custody earnings credit | | | (97 | ) | |
| | | Net Expenses | | | 79,353 | | |
| | | Net Investment Income | | | 268,191 | | |
| Net Realized and Unrealized Gain (Loss) on Investments and Foreign Currency | |
| | | Net realized loss on: | | | | | |
| | | Investments | | | (2,251,109 | ) | |
| | | Foreign currency transactions and forward foreign currency
exchange contracts | | | (36,142 | ) | |
| | | Net realized loss | | | (2,287,251 | ) | |
| | | Net change in unrealized appreciation (depreciation) on: | | | | | |
| | | Investments | | | (3,305,509 | ) | |
| | | Foreign currency translations and forward foreign currency
exchange contracts | | | (11,089 | ) | |
| | | Net change in unrealized appreciation (depreciation) | | | (3,316,598 | ) | |
| | | Net Loss | | | (5,603,849 | ) | |
| | | Net Decrease Resulting from Operations | | | (5,335,658 | ) | |
(a) The Fund commenced operations on March 31, 2008.
See Accompanying Notes to Financial Statements.
13
Statement of Changes in Net Assets – Columbia Overseas Value Fund
| Increase (Decrease) in Net Assets | | | | Period Ended
February 28,
2009 (a) ($) | |
| Operations | | Net investment income | | | 268,191 | | |
| | | Net realized loss on investments, foreign currency transactions and
forward foreign currency exchange contracts | | | (2,287,251 | ) | |
| | | Net change in unrealized appreciation (depreciation) on investments,
foreign currency translations and forward foreign currency
exchange contracts | | | (3,316,598 | ) | |
| | | Net Decrease Resulting from Operations | | | (5,335,658 | ) | |
| Distributions to Shareholders | | From net investment income | | | (235,633 | ) | |
| | | From return of capital | | | (14,367 | ) | |
| | | Total Distributions to Shareholders | | | (250,000 | ) | |
| | | Net Capital Stock Transactions | | | 10,250,000 | | |
| | | Total Increase in Net Assets | | | 4,664,342 | | |
| Net Assets | | Beginning of period | | | — | | |
| | | End of period | | | 4,664,342 | | |
| | | Accumulated net investment loss at end of period | | | (3,584 | ) | |
| | | Capital Stock Activity | |
| | | Period Ended
February 28, 2009 (a) | |
| | | Shares | | Dollars ($) | |
| Class Z | |
| Subscriptions | | | 1,000,000 | | | | 10,000,000 | | |
| Distributions reinvested | | | 44,723 | | | | 250,000 | | |
| Net increase | | | 1,044,723 | | | | 10,250,000 | | |
(a) The Fund commenced operations on March 31, 2008.
See Accompanying Notes to Financial Statements.
14
Financial Highlights – Columbia Overseas Value Fund
Selected data for a share outstanding throughout the period is as follows:
| Class Z Shares | | Period Ended
February 28,
2009 (a) | |
| Net Asset Value, Beginning of Period | | $ | 10.00 | | |
| Income from Investment Operations: | |
| Net investment income (b) | | | 0.27 | | |
| Net realized and unrealized loss on investments and foreign currency | | | (5.56 | ) | |
| Total from investment operations | | | (5.29 | ) | |
| Less Distributions to Shareholders: | |
| From net investment income | | | (0.23 | ) | |
| From return of capital | | | (0.02 | ) | |
| Total distributions to shareholders | | | (0.25 | ) | |
| Net Asset Value, End of Period | | $ | 4.46 | | |
| Total return (c)(d)(e) | | | (53.41 | )% | |
| Ratios to Average Net Assets/Supplemental Data: | |
| Net expenses (f)(g) | | | 1.10 | % | |
| Waiver/Reimbursement (f) | | | 2.89 | % | |
| Net investment income (f)(g) | | | 3.72 | % | |
| Portfolio turnover rate (e) | | | 66 | % | |
| Net assets, end of period (000's) | | $ | 4,664 | | |
(a) The Fund commenced operations on March 31, 2008. Per share data and total return reflect activity from that date.
(b) Per share data was calculated using the average shares outstanding during the period.
(c) Total return at net asset value.
(d) Had the investment advisor not waived fees or reimbursed a portion of expenses, total return would have been reduced.
(e) Not annualized.
(f) Annualized.
(g) The benefits derived from custody credits had an impact of less than 0.01%.
See Accompanying Notes to Financial Statements.
15
Notes to Financial Statements – Columbia Overseas Value Fund
February 28, 2009
Note 1. Organization
Columbia Overseas Value Fund (the "Fund"), a series of Columbia Funds Series Trust (the "Trust"), is a diversified portfolio. The Trust is a Delaware statutory trust registered under the Investment Company Act of 1940, as amended (the "1940 Act"), as an open-end management investment company.
Investment Objective
The Fund seeks long-term capital appreciation.
Fund Shares
The Trust may issue an unlimited number of shares, and the Fund offers four classes of shares: Class A, Class C, Class R and Class Z shares. The Fund commenced operations on March 31, 2008. At February 28, 2009, only Class Z shares were offered.
Class A shares are subject to a maximum front-end sales charge of 5.75% based on the amount of initial investment. Class A shares purchased without an initial sales charge in accounts aggregating $1 million to $50 million at the time of purchase are subject to a 1.00% contingent deferred sales charge ("CDSC") if the shares are sold within one year after purchase. Class C shares are subject to a 1.00% CDSC on shares sold within one year after purchase. Class R and Class Z shares are offered continuously at net asset value. There are certain restrictions on the purchase of Class R and Class Z shares, as described in the Fund's prospectuses.
Note 2. Significant Accounting Policies
The preparation of financial statements in accordance with accounting principles generally accepted in the United States of America ("GAAP") requires management to make certain estimates and assumptions that affect the reported amounts of assets and liabilities, the disclosure of contingent assets and liabilities at the date of the financial statements and the reported amounts of revenue and expenses during the reporting period. Actual results could differ from those estimates. The following is a summary of significant accounting policies consistently followed by the Fund in the preparation of its financial statements.
Security Valuation
Equity securities are valued at the last sale price on the principal exchange on which they trade, except for securities traded on the NASDAQ, which are valued at the NASDAQ official close price. Unlisted securities or listed securities for which there were no sales during the day are valued at the closing bid price on such exchanges or over-the-counter markets.
Short-term investments maturing in 60 days or less are valued at amortized cost, which approximates market value.
Forward foreign currency exchange contracts are valued at the prevailing forward exchange rate of the underlying currencies.
Foreign securities are generally valued at the last sale price on the foreign exchange or market on which they trade. If any foreign share prices are not readily available as a result of limited share activity, the securities are valued at the last sale price of the local shares in the principal market in which such securities are normally traded.
Generally, trading in foreign securities is substantially completed each day at various times prior to the close of the New York Stock Exchange ("NYSE"). The values of such securities used in computing the net asset value of the Fund's shares are determined as of such times. Foreign currency exchange rates are generally determined at 4:00 p.m. Eastern (U.S.) time. Occasionally, events affecting the values of such foreign securities and such exchange rates may occur between the times at which they are determined and the close of the customary trading session of the NYSE, which would not be reflected in the computation of the Fund's net asset value. If events materially affecting the values of such foreign securities occur and it is determined that market quotations are not reliable, then these foreign securities will be valued at their fair value using procedures approved by the Board of Trustees.
The Fund may use a systematic fair valuation model provided by an independent third party to value securities principally traded in foreign markets in order to adjust for possible stale pricing that may occur between the close of the foreign exchanges and the time for valuation.
Investments for which market quotations are not readily available, or that have quotations which management believes are not reliable, are valued at fair value as determined in good faith under consistently applied procedures established by and under the general supervision of the Board of Trustees. If a security is valued at fair value, such value is likely to be different from the last quoted market price for the security.
16
Columbia Overseas Value Fund, February 28, 2009
Statement of Financial Accounting Standards No. 157, Fair Value Measurements ("SFAS 157") establishes a hierarchy that prioritizes the inputs to valuation techniques used to measure fair value giving the highest priority to unadjusted quoted prices in active markets for identical securities (level 1 measurements) and the lowest priority to unobservable inputs (level 3 measurements) when market prices are not readily available or reliable. The three levels of the fair value hierarchy under SFAS 157 are described below:
• Level 1 – quoted prices in active markets for identical securities
• Level 2 – prices determined using other significant observable inputs (including quoted prices for similar securities, interest rates, prepayment speeds, credit risk and others)
• Level 3 – prices determined using significant unobservable inputs. In situations where quoted prices or observable inputs are unavailable or less reliable, unobservable inputs may be used. Unobservable inputs may include management's own assumptions about the factors market participants would use in pricing an investment.
The inputs or methodology used for valuing securities are not necessarily an indication of the risk associated with investing in those securities.
The following table summarizes the inputs used, as of February 28, 2009, in valuing the Fund's assets:
| Valuation Inputs | | Investments
in Securities | | Other Financial
Instruments* | |
| Level 1 – Quoted Prices | | $ | 286,074 | | | | — | | |
Level 2 – Other Significant
Observable Inputs | | | 4,481,519 | | | $ | (8,742 | ) | |
Level 3 – Significant
Unobservable Inputs | | | — | | | | — | | |
| Total | | $ | 4,767,593 | | | $ | (8,742 | ) | |
* Other financial instruments consist of forward foreign currency exchange contracts which are not included in the investment portfolio.
The Fund's assets assigned to the Level 2 input category include certain foreign securities for which a third party statistical pricing service may be employed for purposes of fair market valuation.
Security Transactions
Security transactions are accounted for on the trade date. Cost is determined and gains (losses) are based upon the specific identification method for both financial statement and federal income tax purposes.
In March 2008, Statement of Financial Accounting Standards No. 161, Disclosures about Derivative Instruments and Hedging Activities—an amendment of FASB Statement No. 133 ("SFAS 161"), was issued. SFAS 161 is effective for fiscal years and interim periods beginning after November 15, 2008. SFAS 161 requires additional discussion about the reporting entity's derivative instruments and hedging activities, by providing for qualitative disclosures about the objectives and strategies for using derivatives, quantitative data about the fair value of and gains and losses on derivative contracts, and details of credit-risk-related contingent features in their derivative contracts. Management is evaluating the impact the application of SFAS 161 will have on the Fund's financial stateme nt disclosures.
Forward Foreign Currency Exchange Contracts
Forward foreign currency exchange contracts are agreements to exchange one currency for another at a future date at a specified price. These contracts are used to minimize the exposure to foreign exchange rate fluctuations during the period between trade and settlement date of the contract. The Fund may utilize forward foreign currency exchange contracts in connection with the settlement of purchases and sales of securities. The Fund may also enter into these contracts to hedge certain other foreign currency denominated assets. Contracts to buy generally are used to acquire exposure to foreign currencies, while contracts to sell are generally used to hedge the Fund's investments against currency fluctuations. Forward foreign currency exchange contracts are valued daily at the current exchange rate of the underlying currency, resulting in unrealized gains (losses) which become realized at the time the forward foreign currency exc hange contracts are closed or mature. Realized and unrealized gains (losses) arising from such transactions are included in net realized and unrealized gains (losses) on foreign currency transactions. The use of forward foreign currency exchange contracts does not eliminate fluctuations in the prices of the Fund's portfolio securities. While the maximum potential loss
17
Columbia Overseas Value Fund, February 28, 2009
from such contracts is the aggregate face value in U.S. dollars at the time the contract was opened, exposure is typically limited to the change in value of the contract (in U.S. dollars) over the period it remains open. The Fund could also be exposed to risk that counterparties of the contracts may be unable to fulfill the terms of the contracts.
Repurchase Agreements
The Fund may engage in repurchase agreement transactions with institutions that Columbia Management Advisors, LLC ("Columbia"), the Fund's investment advisor, has determined are creditworthy. The Fund, through its custodian, receives delivery of the underlying securities collateralizing a repurchase agreement. Columbia is responsible for determining that the collateral is at least equal, at all times, to the value of the repurchase obligation including interest. A repurchase agreement transaction involves certain risks in the event of default or insolvency of the counterparty. These risks include possible delays in or restrictions on the Fund's ability to dispose of the underlying securities and a possible decline in the value of the underlying securities during the period while the Fund seeks to assert its rights.
Foreign Currency Translations and Transactions
The values of all assets and liabilities quoted in foreign currencies are translated into U.S. dollars at that day's exchange rates. Net realized and unrealized gains (losses) on foreign currency transactions include gains (losses) arising from the fluctuation in exchange rates between trade and settlement dates on securities transactions, gains (losses) arising from the disposition of foreign currency and currency gains (losses) between the accrual and payment dates on dividends, interest income and foreign withholding taxes.
For financial statement purposes, the Fund does not distinguish that portion of gains (losses) on investments which is due to changes in foreign exchange rates from that which is due to changes in market prices of the investments. Such fluctuations are included with the net realized and unrealized gains (losses) on investments on the Statement of Operations.
Income Recognition
Interest income is recorded on the accrual basis. Corporate actions and dividend income are recorded on the ex-date except for certain foreign securities which are recorded as soon after the ex-date as the Fund becomes aware of such, net of any non-reclaimable tax withholdings.
Expenses
General expenses of the Trust are allocated to the Fund and the other series of the Trust based upon relative net assets or other expense allocation methodologies determined by the nature of the expense. Expenses directly attributable to the Fund are charged to the Fund.
Foreign Capital Gains Taxes
Realized gains in certain countries may be subject to foreign taxes at the fund level, at rates ranging from approximately 10% to 15%. The Fund accrues for such foreign taxes on net realized and unrealized gains at the appropriate rate for each jurisdiction.
Federal Income Tax Status
The Fund intends to qualify each year as a "regulated investment company" under Subchapter M of the Internal Revenue Code, as amended, and will distribute substantially all of its tax exempt or taxable income, if any, for its tax year, and as such will not be subject to federal income taxes. In addition, the Fund intends to distribute in each calendar year substantially all of its net investment income, capital gains and certain other amounts, if any, such that the Fund should not be subject to federal excise tax. Therefore, no federal income or excise tax provision is recorded.
Distributions to Shareholders
Distributions from net investment income, if any, are declared and distributed annually. The Fund may, however, declare and pay distributions from net investment income more frequently. The Fund will distribute net realized capital gains (including net short-term capital gains) at least annually after the fiscal year in which the capital gains were earned, unless offset by any available capital loss carryforward. Income distributions and capital gain distributions are determined in accordance with federal income tax regulations which may differ from GAAP.
18
Columbia Overseas Value Fund, February 28, 2009
Indemnification
In the normal course of business, the Fund enters into contracts that contain a variety of representations and warranties and which provide general indemnities. The Fund's maximum exposure under these arrangements is unknown because this would involve future claims against the Fund. Also, under the Trust's organizational documents and by contract, the Trustees and officers of the Trust are indemnified against certain liabilities that may arise out of actions relating to their duties to the Trust. However, based on experience, the Fund expects the risk of loss due to these representations, warranties and indemnities to be minimal.
Note 3. Federal Tax Information
The timing and character of income and capital gain distributions are determined in accordance with income tax regulations, which may differ from GAAP. Reclassifications are made to the Fund's capital accounts for permanent tax differences to reflect income and gains available for distribution (or available capital loss carryforwards) under income tax regulations.
For the year ended February 28, 2009, permanent book and tax basis differences resulting primarily from differing treatments for foreign currency transactions were identified and reclassified among the components of the Fund's net assets as follows:
Undistributed
Net Investment
Income | | Accumulated
Net Realized
Loss | | Paid-In Capital | |
| $ | (36,142 | ) | | $ | 36,142 | | | $ | — | | |
Net investment income and net realized gains (losses), as disclosed on the Statement of Operations, and net assets were not affected by this reclassification.
The tax character of distributions paid during the period ended February 28, 2009 was as follows:
| | | February 28, 2009 | |
| Distributions paid from: | | | | | |
| Ordinary Income* | | $ | 235,633 | | |
| Long-Term Capital Gains | | | — | | |
| Tax Return of Capital | | | 14,367 | | |
* For tax purposes short-term capital gains distributions, if any, are considered ordinary income distributions.
As of February 28, 2009, the components of distributable earnings on a tax basis were as follows:
Undistributed
Ordinary
Income | | Undistributed
Long-Term
Capital Gains | | Net Unrealized
Depreciation* | |
| $ | — | | | $ | — | | | $ | (3,348,121 | ) | |
* The differences between book-basis and tax-basis net unrealized depreciation are primarily due to deferral of losses from wash sales.
Unrealized appreciation and depreciation at February 28, 2009, based on cost of investments for federal income tax purposes and excluding any unrealized appreciation and depreciation from changes in the value of other assets and liabilities resulting from changes in exchange rates, were:
| Unrealized appreciation | | $ | 78,551 | | |
| Unrealized depreciation | | | (3,426,672 | ) | |
| Net unrealized depreciation | | $ | (3,348,121 | ) | |
The following capital loss carryforwards, determined as of February 28, 2009, may be available to reduce taxable income arising from future net realized gains on investments, if any, to the extent permitted by the Internal Revenue Code:
| Year of Expiration | | Capital Loss
Carryforwards | |
| | 2017 | | | $ | 584,061 | | |
19
Columbia Overseas Value Fund, February 28, 2009
Under current tax rules, certain currency and capital losses realized after October 31 may be deferred and treated as occurring on the first day of the following fiscal year. As of February 28, 2009, post-October currency losses of $15,526 and capital losses of $1,624,436 attributed to security transactions were deferred to March 1, 2009.
Under Financial Accounting Standards Board ("FASB") Interpretation No. 48, Accounting for Uncertainty in Income Taxes—an Interpretation of FASB Statement No. 109 ("FIN 48"), management determines whether a tax position of the Fund is more likely than not to be sustained upon examination by the applicable taxing authority, including resolution of any related appeals or litigation processes, based on the technical merits of the position. The tax benefit to be recognized is measured as the largest amount of benefit that is greater than fifty percent likely of being realized upon ultimate settlement. Management has evaluated the known implications of FIN 48 on the computation of net assets for the Fund. As a result of this evaluation, management has concluded that FIN 48 does not have any effect on the Fund's financial statements. However, management's conclusions regarding FIN 48 may be subject to review and adjustment at a later date based on factors including, but not limited to, further implementation guidance from the FASB, new tax laws, regulations, and administrative interpretations (including relevant court decisions). The Fund is not aware of any tax positions for which it is reasonably possible that the total amounts of unrecognized tax benefits will significantly change in the next twelve months.
Note 4. Fees and Compensation Paid to Affiliates
Investment Advisory Fee
Columbia, an indirect, wholly owned subsidiary of Bank of America Corporation ("BOA") provides investment advisory services to the Fund. In rendering investment advisory services to the Fund, Columbia may use the portfolio management and research resources of Columbia Management Pte. Ltd., an affiliate of Columbia. Columbia receives a monthly investment advisory fee at the annual rate of 0.82% of the Fund's average daily net assets.
Administration Fee
Columbia provides administrative and other services to the Fund for a monthly administration fee at the annual rate of 0.05% of the Fund's average daily net assets, less the fees payable by the Fund as described under the Pricing and Bookkeeping Fees note below.
Pricing and Bookkeeping Fees
The Fund has entered into a Financial Reporting Services Agreement (the "Financial Reporting Services Agreement") with State Street Bank & Trust Company ("State Street") and Columbia pursuant to which State Street provides financial reporting services to the Fund. The Fund has also entered into an Accounting Services Agreement (collectively with the Financial Reporting Services Agreement, the "State Street Agreements") with State Street and Columbia pursuant to which State Street provides accounting services to the Fund. Under the State Street Agreements, the Fund pays State Street an annual fee of $38,000 paid monthly plus an additional monthly fee based on an annualized percentage rate of average daily net assets of the Fund for the month. The aggregate fee will not exceed $140,000 per year (exclusive of out-of-pocket expenses and charges). The Fund also reimburses State Street for certain out-of-pocket expenses and charge s.
The Fund has entered into a Pricing and Bookkeeping Oversight and Services Agreement (the "Services Agreement") with Columbia. Under the Services Agreement, Columbia provides services related to Fund expenses and the requirements of the Sarbanes-Oxley Act of 2002, and provides oversight of the accounting and financial reporting services provided by State Street. Under the Services Agreement, the Fund reimburses Columbia for out-of-pocket expenses.
Transfer Agent Fee
Columbia Management Services, Inc. (the "Transfer Agent"), an affiliate of Columbia and an indirect, wholly owned subsidiary of BOA, provides shareholder services to the Fund and has contracted with Boston Financial Data Services ("BFDS") to serve as sub-transfer agent. The Transfer Agent is entitled to receive a fee for its services, paid monthly, at the annual rate of $17.34 per open account plus reimbursement of certain sub-transfer agent fees paid by the Transfer Agent (exclusive of BFDS fees), calculated based on assets held in
20
Columbia Overseas Value Fund, February 28, 2009
omnibus accounts and intended to recover the cost of payments to other parties (including affiliates of BOA) for services to those accounts. The Transfer Agent pays the fees of BFDS for services as sub-transfer agent and is not entitled to reimbursement for such fees from the Fund.
The Transfer Agent may also retain, as additional compensation for its services, fees for wire, telephone and redemption orders, Individual Retirement Account ("IRA") trustee agent fees and account transcript fees due to the Transfer Agent from shareholders of the Fund and credits (net of bank charges) earned with respect to balances in accounts the Transfer Agent maintains in connection with its services to the Fund. The Transfer Agent also receives reimbursement for certain out-of-pocket expenses.
An annual minimum account balance fee of up to $20 may apply to certain accounts with a value below the Fund's initial minimum investment requirements to reduce the impact of small accounts on transfer agent fees. These minimum account balance fees are recorded as part of expense reductions on the Statement of Operations. For the period ended February 28, 2009, no minimum account balance fees were charged by the Fund.
Underwriting Discounts, Service and Distribution Fees
Columbia Management Distributors, Inc. (the "Distributor"), an affiliate of Columbia and an indirect, wholly owned subsidiary of BOA, is the principal underwriter of the Fund's shares.
The Trust has adopted shareholder servicing plans ("Servicing Plans") for the Class A and Class C shares of the Fund and distribution plans ("Distribution Plans") for the Class C and Class R shares of the Fund. The shareholder servicing plans permit the Fund to compensate or reimburse servicing agents for the shareholder services they have provided. The distribution plans, adopted pursuant to Rule 12b-1 under the 1940 Act, permit the Fund to compensate or reimburse the Distributor and/or selling agents for activities or expenses primarily intended to result in the sale of the classes' shares. Payments are made at an annual rate and paid monthly, as a percentage of average daily net assets, set from time to time by the Board of Trustees, and are charged as expenses of the Fund directly to the applicable share class. A substantial portion of the expenses incurred pursuant to these plans is paid to affiliates of BOA and the Distrib utor.
The annual rates in effect and plan limits, as a percentage of average daily net assets are as follows:
| | | Current
Rate | | Plan Limit | |
Class A Shareholder
Servicing Plan | | | 0.25 | % | | | 0.25 | % | |
Class C Shareholder
Servicing Plan | | | 0.25 | % | | | 0.25 | % | |
| Class C Distribution Plan | | | 0.75 | % | | | 0.75 | % | |
| Class R Distribution Plan | | | 0.50 | % | | | 0.50 | % | |
Class A, Class C and Class R shares were not offered during the period.
Expense Limits and Fee Waivers
Columbia and/or some of the Fund's other service providers have voluntarily agreed to waive fees and/or reimburse the Fund for certain expenses so that total expenses (exclusive of distribution and service fees, brokerage commissions, interest, taxes and extraordinary expenses, if any) will not exceed 1.10% annually of the Fund's average daily net assets. This arrangement may be modified or terminated by Columbia at any time.
Effective May 1, 2009, the voluntarily expense limit will be changed from 1.10% to 1.15% annually of the Fund's average daily net assets.
Fees Paid to Officers and Trustees
All officers of the Fund are employees of Columbia or its affiliates and, with the exception of the Fund's Chief Compliance Officer, receive no compensation from the Fund. The Board of Trustees has appointed a Chief Compliance Officer to the Fund in accordance with federal securities regulations. The Fund, along with other affiliated funds, pays its pro-rata share of the expenses associated with the Chief Compliance Officer. The Fund's expenses for the Chief Compliance Officer will not exceed $15,000 per year.
The Trust's eligible Trustees may participate in a non-qualified deferred compensation plan which may be terminated at any time. Any payments to plan participants are paid solely out of the Fund's assets. Income earned on the plan participant's deferral account is based on the rate of
21
Columbia Overseas Value Fund, February 28, 2009
return of the eligible mutual funds selected by the participant or, if no funds are selected, on the rate of return of Columbia Treasury Reserves, another portfolio of the Trust. The expense for the deferred compensation plan, which includes trustees' fees deferred during the current period as well as any gains or losses on the trustees' deferred compensation balances as a result of market fluctuations, is included in "Trustees' fees" on the Statement of Operations. The liability for the deferred compensation plan is included in "Trustees' fees" on the Statement of Assets and Liabilities.
Note 5. Custody Credits
The Fund has an agreement with its custodian bank under which custody fees may be reduced by balance credits. These credits are recorded as part of expense reductions on the Statement of Operations. The Fund could have invested a portion of the assets utilized in connection with the expense offset arrangement in an income-producing asset if it had not entered into such an agreement.
Note 6. Portfolio Information
For the period ended February 28, 2009, the cost of purchases and proceeds from sales of securities, excluding short-term obligations, for the Fund were $15,532,281 and $5,209,603, respectively.
Note 7. Redemption Fees
The Fund may impose a 2.00% redemption fee on the proceeds of fund shares that are redeemed within 60 days of purchase. The redemption fee is designed to offset brokerage commissions and other costs associated with short term trading of the portfolio. The redemption fees, which are retained by the Fund, are accounted for as an addition to paid-in capital and are allocated to each class based on the relative net assets at the time of the redemption. For the period ended February 28, 2009, the Fund received no redemption fees.
Note 8. Line of Credit
The Fund and other affiliated funds participate in a $280,000,000 committed, unsecured revolving line of credit provided by State Street. The maximum amount that may be borrowed by any fund is limited to the lesser of $200,000,000 and the Fund's borrowing limit set forth in the Fund's registration statement. Borrowings are available for short-term liquidity or temporary or emergency purposes.
Interest is charged to each participating fund based on the fund's borrowings at a rate per annum equal to the greater of the Federal Funds Rate plus 0.50% or the overnight LIBOR Rate plus 0.50%. In addition, an annual operations agency fee of $20,000, an amendment fee of 0.02% and a commitment fee of 0.12% per annum are accrued and apportioned among the participating funds pro rata based on their relative net assets.
Prior to October 16, 2008, the Fund and other affiliated funds participated in a $350,000,000 committed, unsecured revolving line of credit and a $150,000,000 uncommitted, unsecured line of credit, both provided by State Street. Interest on the committed line of credit was charged to each participating fund based on the fund's borrowings at a rate per annum equal to the Federal Funds Rate plus 0.50%. In addition, a commitment fee of 0.10% per annum was accrued and apportioned among the participating funds pro rata based on their relative net assets. Interest on the uncommitted line of credit was charged to each participating fund based on the fund's borrowings at a rate per annum equal to the Federal Funds Rate plus 0.375%. State Street charged an annual operations agency fee of $40,000 for the committed line of credit and was able to charge an annual administration fee of $15,000 for the uncommitted line of credit. The commitme nt fee, the operations agency fee and the administration fee were accrued and apportioned among the participating funds pro rata based on their relative net assets.
For the period ended February 28, 2009, the Fund did not borrow under these arrangements.
Note 9. Securities Lending
The Fund may lend its securities to certain approved brokers, dealers and other financial institutions. Each loan is collateralized by cash, in an amount at least equal to the market value of the securities loaned plus accrued income from the investment of collateral. The market value of the loaned securities is determined at the close of business of the Fund and any additional required collateral is delivered to the Fund on the next business day. The collateral received is invested and the income generated by the investment of the collateral, net of any fees remitted to State Street as the lending agent and borrower rebates, is paid to the Fund. Generally, in the event of borrower default, the Fund has the
22
Columbia Overseas Value Fund, February 28, 2009
right to use the collateral to offset any losses incurred. In the event the Fund is delayed in or prevented from exercising its right to dispose of the collateral, there may be a potential loss to the Fund. The Fund bears the risk of loss with respect to the investment of collateral.
Note 10. Shares of Beneficial Interest
As of February 28, 2009, one shareholder (which was an affiliate of BOA) held 100% of the Fund's shares outstanding, over which BOA and/or any of its affiliates had sole investment discretion.
Subscription and redemption activity of this account may have a significant effect on the operations of the Fund.
Note 11. Significant Risks and Contingencies
Foreign Securities Risk
There are certain additional risks involved when investing in foreign securities. These risks may involve foreign currency exchange rate fluctuations, adverse political and economic developments and the possible prevention of currency exchange or other foreign governmental laws or restrictions. In addition, the liquidity of foreign securities may be more limited than that of domestic securities.
Investments in emerging market countries are subject to additional risk. The risk of foreign investments is typically increased in less developed countries. These countries are also more likely to experience high levels of inflation, deflation or currency devaluation which could hurt their economies and securities markets.
Legal Proceedings
Columbia Management Advisors, LLC and Columbia Management Distributors, Inc. (collectively, the "Columbia Group") are subject to a settlement agreement with the New York Attorney General ("NYAG") (the "NYAG Settlement") and a settlement order with the SEC (the "SEC Order") on matters relating to mutual fund trading, each dated February 9, 2005. Under the terms of the SEC Order, the Columbia Group (or predecessor entities) agreed, among other things, to: pay disgorgement and civil money penalties collectively totaling $375 million; cease and desist from violations of the antifraud provisions and certain other provisions of the federal securities laws; maintain certain compliance and ethics oversight structures; and retain an independent consultant to review the Columbia Group's applicable supervisory, compliance, control and other policies and procedures. The NYAG Settlement, among other things, requires Columbia Management Advis ors, LLC and its affiliates to reduce management fees for certain funds in the Columbia family of mutual funds in a projected total of $160 million over five years through November 30, 2009 and to make certain disclosures to investors relating to expenses. In connection with the Columbia Group providing services to the Columbia Funds, the Columbia Funds have voluntarily undertaken to implement certain governance measures designed to maintain the independence of their boards of trustees and certain special consulting and compliance measures.
Pursuant to the SEC Order and related procedures, the $375 million in settlement amounts described above, of which approximately $90 million has been earmarked for certain Columbia Funds and their shareholders, is being distributed in accordance with a distribution plan developed by an independent distribution consultant and approved by the SEC on December 27, 2007. Distributions under the distribution plan began in mid-June 2008.
Civil Litigation
In connection with the events that resulted in the NYAG Settlement and SEC Order, various parties filed suits against Bank of America Corporation and certain of its affiliates, including Banc of America Capital Management, LLC ("BACAP," now known as Columbia Management Advisors, LLC) and BACAP Distributors, LLC (now known as Columbia Management Distributors, Inc.) (collectively "BAC"), Nations Funds Trust (now known as Columbia Funds Series Trust) and its Board of Trustees. On February 20, 2004, the Judicial Panel on Multidistrict Litigation transferred these cases and cases against other mutual fund companies based on similar allegations to the United States District Court in Maryland for consolidated or coordinated pretrial proceedings (the "MDL"). Subsequently, additional related cases were transferred to the MDL. On September 29, 2004, the plaintiffs in the MDL filed amended and consolidated complaints. One of these amended complaints is a putative class action that includes claims under the federal securities laws and state common law, and that names Nations Funds Trust, the Trustees, BAC and others as defendants. Another of the amended complaints is a
23
Columbia Overseas Value Fund, February 28, 2009
derivative action purportedly on behalf of the Nations Funds Trust against BAC and others that asserts claims under federal securities laws and state common law. Nations Funds Trust is a nominal defendant in this action.
On February 25, 2005, BAC and other defendants filed motions to dismiss the claims in the pending cases. On December 15, 2005, BAC and others entered into a Stipulation of Settlement of the direct and derivative claims brought on behalf of the Nations Funds shareholders. The settlement is subject to court approval. If the settlement is approved, BAC would pay settlement administration costs and fees to plaintiffs' counsel as approved by the court. The stipulation has not yet been presented to the court for approval.
24
Federal Income Tax Information (Unaudited)
Foreign taxes paid during the period ended February 28, 2009, of $34,091 ($0.03 per share) are expected to be passed through to shareholders. This entire amount will be eligible for shareholders to claim as a foreign tax credit.
Gross income derived from sources within foreign countries was $379,329 ($0.36 per share) for the period ended February 28, 2009.
For non-corporate shareholders 100.00% or the maximum amount allowable under the Jobs and Growth Tax Relief Reconciliation Act of 2003, of income distributed by the Fund for the period March 31, 2008 to February 28, 2009 may represent qualified dividend income. Final information will be provided in your 2009 Form 1099-DIV.
25
Report of Independent Registered Public Accounting Firm
To the Trustees of Columbia Funds Series Trust and the Shareholders of Columbia Overseas Value Fund
In our opinion, the accompanying statement of assets and liabilities, including the investment portfolio, and the related statements of operations and of changes in net assets and the financial highlights present fairly, in all material respects, the financial position of Columbia Overseas Value Fund (the "Fund") (a series of Columbia Funds Series Trust) at February 28, 2009, and the results of its operations, the changes in its net assets and the financial highlights for the period March 31, 2008 (commencement of operations) through February 28, 2009 in conformity with accounting principles generally accepted in the United States of America. These financial statements and financial highlights (hereafter referred to as "financial statements") are the responsibility of the Fund's management. Our responsibility is to express an opinion on these financial statements based on our audit. We conducted our audit of these financial stat ements in accordance with the standards of the Public Company Accounting Oversight Board (United States). Those standards require that we plan and perform the audit to obtain reasonable assurance about whether the financial statements are free of material misstatement. An audit includes examining, on a test basis, evidence supporting the amounts and disclosures in the financial statements, assessing the accounting principles used and significant estimates made by management, and evaluating the overall financial statement presentation. We believe that our audit, which included confirmation of securities at February 28, 2009 by correspondence with the custodian and brokers, provides a reasonable basis for our opinion.
PricewaterhouseCoopers LLP
Boston, Massachusetts
April 22, 2009
26
Fund Governance
The Trustees serve terms of indefinite duration. The names, addresses and ages of the Trustees and officers of the Funds in the Columbia Funds Complex, the year each was first elected or appointed to office, their principal business occupations during at least the last five years, the number of Funds overseen by each Trustee and other directorships they hold are shown below. Each officer listed below serves as an officer of each Fund in the Columbia Funds Complex.
Independent Trustees
Name, Address and Age,
Position with Funds, Year First
Elected or Appointed to Office | | Principal Occupation(s) During Past Five Years, Number of Funds in the Columbia Funds
Complex Overseen by Trustee, Other Directorships Held | |
| Edward J. Boudreau (Born 1944) | |
|
c/o Columbia Management
Advisors, LLC
One Financial Center
Boston, MA 02111
Trustee (since 2005) | | Managing Director—E.J. Boudreau & Associates (consulting), from 2000 through current; oversees 66 funds; no other directorships held. | |
|
| William P. Carmichael (Born 1943) | |
|
c/o Columbia Management
Advisors, LLC
One Financial Center
Boston, MA 02111
Trustee (since 1999) | | Retired. Oversees 66 funds; Director—Cobra Electronics Corporation (electronic equipment manufacturer); Director—Spectrum Brands, Inc. (consumer products); Director—Simmons Company (bedding); Director—The Finish Line (sportswear). | |
|
| William A. Hawkins (Born 1942) | |
|
c/o Columbia Management
Advisors, LLC
One Financial Center
Boston, MA 02111
Trustee (since 2005) | | President and Chief Executive Officer—California General Bank, N.A., from January 2008 through current; President, Retail Banking—IndyMac Bancorp, Inc., from September 1999 to August 2003; oversees 66 funds; no other directorships held. | |
|
| R. Glenn Hilliard (Born 1943) | |
|
c/o Columbia Management
Advisors, LLC
One Financial Center
Boston, MA 02111
Trustee (since 2005) | | Chairman and Chief Executive Officer—Hilliard Group LLC (investing and consulting), from April 2003 through current; Non-Executive Director & Chairman—Conseco, Inc. (insurance), September 2003 through current; Executive Chairman—Conseco, Inc. (insurance), August 2004 through September 2005, Chairman and Chief Executive Officer—ING Americas, from 1999 through April 2003; oversees 66 funds; Director—Conseco, Inc. (insurance). | |
|
| John J. Nagorniak (Born 1944) | |
|
c/o Columbia Management
Advisors, LLC
One Financial Center
Boston, MA 02111
Trustee (since 2008) | | Retired. President and Director—Foxstone Financial, Inc. (consulting), 2000 through December 2007; Director—Mellon Financial Corporation affiliates (investing), 2000 through 2007; Chairman—Franklin Portfolio Associates (investing—Mellon affiliate), 1982 through 2007; oversees 66 funds; Director—MIT Investment Company; Trustee—MIT 401k Plan; Trustee and Chairman—Research Foundation of CFA Institute. | |
|
27
Fund Governance (continued)
Independent Trustees (continued)
Name, Address and Age,
Position with Funds, Year First
Elected or Appointed to Office | | Principal Occupation(s) During Past Five Years, Number of Funds in the Columbia Funds
Complex Overseen by Trustee, Other Directorships Held | |
| Anthony M. Santomero (Born 1946) | |
|
c/o Columbia Management
Advisors, LLC
One Financial Center
Boston, MA 02111
Trustee (since 2008) | | Richard K. Mellon Professor Emeritus of Finance, The Wharton School, University of Pennsylvania, from 1972 through current; Senior Advisor—McKinsey & Company (consulting), July 2006 through December 2007; President and Chief Executive Officer—Federal Reserve Bank of Philadelphia, 2000 through April 2006; oversees 66 funds; no other directorships held. | |
|
| Minor M. Shaw (Born 1947) | |
|
c/o Columbia Management
Advisors, LLC
One Financial Center
Boston, MA 02111
Trustee (since 2003) | | President—Micco Corporation, Chairman—The Daniel-Mickel Foundation; oversees 66 funds; Board Member—Piedmont Natural Gas. | |
|
The Statement of Additional Information includes additional information about the Trustees of the Funds and is available, without charge, upon request by calling 800-426-3750.
Officers
Name, Address and Year of Birth,
Position with Columbia Funds,
Year First Elected or
Appointed to Office | | Principal Occupation(s) During Past Five Years
| |
| J. Kevin Connaughton (Born 1964) | |
|
One Financial Center
Boston, MA 02111
President (since 2009) | | Managing Director of Columbia Management Advisors, LLC since December 2004; Senior Vice President and Chief Financial Officer—Columbia Funds, from June 2008 to January 2009; Treasurer—Columbia Funds, from October 2003 to May 2008; Treasurer—the Liberty Funds, Stein Roe Funds and Liberty All-Star Funds, December 2000—December 2006; Senior Vice President—Columbia Management Advisors, LLC, from April 2003 to December 2004; President—Columbia Funds, Liberty Funds and Stein Roe Funds, February 2004 to October 2004; Treasurer—Galaxy Funds, September 2002 to December 2005; Treasurer, December 2002 to December 2004, and President, February 2004 to December 2004—Columbia Management Multi-Strategy Hedge Fund, LLC; and a senior officer of various other Bank of America-affiliated entities, including other registered and unregistered funds | |
|
| James R. Bordewick, Jr. (Born 1959) | |
|
One Financial Center
Boston, MA 02111
Senior Vice President, Secretary and Chief Legal Officer (since 2006) | | Associate General Counsel, Bank of America since April 2005; Senior Vice President and Associate General Counsel, MFS Investment Management (investment management) prior to April 2005. | |
|
28
Fund Governance (continued)
Officers (continued)
Name, Address and Year of Birth,
Position with Columbia Funds,
Year First Elected or
Appointed to Office | | Principal Occupation(s) During Past Five Years
| |
| Linda J. Wondrack (Born 1964) | |
|
One Financial Center
Boston, MA 02111
Senior Vice President and
Chief Compliance Officer (since 2007) | | Director (Columbia Management Group LLC and Investment Product Group Compliance), Bank of America since June 2005; Director of Corporate Compliance and Conflicts Officer, MFS Investment Management (investment management), August 2004 to May 2005; Managing Director, Deutsche Asset Management (investment management) prior to August 2004. | |
|
| Michael G. Clarke (Born 1969) | |
|
One Financial Center
Boston, MA 02111
Senior Vice President and
Chief Financial Officer (since 2009) | | Director of Fund Administration of the Advisor since January 2006; Managing Director of the Advisor September 2004 to December 2005; Vice President Fund Administration June 2002 to September 2004. | |
|
| Jeffrey R. Coleman (Born 1969) | |
|
One Financial Center
Boston, MA 02111
Treasurer (since 2008) | | Director of Fund Administration of the Advisor since January 2006; Fund Controller of the Advisor from October 2004 to January 2006; Vice President of CDC IXIS Asset Management Services, Inc. (investment management) from August 2000 to September 2004. | |
|
| Joseph F. DiMaria (Born 1968) | |
|
One Financial Center
Boston, MA 02111
Chief Accounting Officer (since 2008) | | Director of Fund Administration of the Advisor since January 2006; Head of Tax/Compliance and Assistant Treasurer of the Advisor from November 2004 to December 2005; Director of Trustee Administration (Sarbanes-Oxley) of the Advisor from May 2003 to October 2004. | |
|
| Julian Quero (Born 1967) | |
|
One Financial Center
Boston, MA 02111
Deputy Treasurer (since 2008) | | Senior Tax Manager of the Advisor since August 2006; Senior Compliance Manager of the Advisor from April 2002 to August 2006. | |
|
| Barry S. Vallan (Born 1969) | |
|
One Financial Center
Boston, MA 02111
Controller (since 2006) | | Vice President—Fund Treasury of the Advisor since October 2004; Vice President—Trustee Reporting of the Advisor from April 2002 to October 2004. | |
|
29
Board Consideration and Re-Approval of Investment Advisory and Sub-Advisory Agreement
The Board of Trustees of Columbia Funds Series Trust (the "Board"), including a majority of the Trustees who have no direct or indirect interest in the investment advisory agreement and are not "interested persons" of the Trusts, as defined in the Investment Company Act of 1940 (the "1940 Act") (the "Independent Trustees"), are required annually to review and re-approve the existing investment advisory agreement and approve any newly proposed terms therein. In this regard, the Board reviewed and re-approved, during the most recent six months covered by this report, the investment advisory agreement with Columbia Management Advisors, LLC ("CMA") for Columbia Overseas Value Fund (the "Fund"). The investment advisory agreement with CMA is referred to as an "Advisory Agreement."
More specifically, at meetings held on November 10-11, 2008, the Board, including the Independent Trustees advised by their independent legal counsel, considered the factors and reached the conclusions described below relating to the selection of CMA and the re-approval of the Advisory Agreement. The Board also reviewed and considered a report prepared and provided by the Independent Fee Consultant (the "Consultant") appointed by the Independent Trustees pursuant to an assurance of discontinuance entered into with the New York Attorney General ("NYAG") to settle a civil complaint filed by the NYAG relating to trading in mutual fund shares (the "NYAG Settlement"). During the fee review process, the Consultant's role was to manage the review process to ensure that fees are negotiated in a manner that is at arms' length and reasonable. The Consultant found that the fee negotiation process was, to the extent practicable, at arms' le ngth and reasonable and consistent with the requirements of the NYAG Settlement. A summary of the Consultant's report is available at http://www.columbiafunds.com.
In preparation for the November meetings, the Board met in August for review and discussion of the materials described below. The Investment Committee of the Board also met in June to discuss each Fund's performance with its respective portfolio manager(s). In addition to these meetings, the Investment Committee receives and discusses performance reports at its quarterly meetings. The Contracts Review Committee of the Board also provided support in managing and coordinating the process by which the Board reviewed the Advisory Agreement. The Board's review and conclusions are based on comprehensive consideration of all information presented to them and are not the result of any single controlling factor.
Nature, Extent and Quality of Services. The Board received and considered various data and information regarding the nature, extent and quality of services provided to the Fund by CMA under the Advisory Agreement. The most recent investment adviser registration forms ("Forms ADV") for CMA were made available to the Board, as were CMA's responses to a detailed series of requests submitted by the Independent Trustees' independent legal counsel on behalf of such Trustees. The Board reviewed and analyzed those materials, which included, among other things, information about the background and experience of senior management and investment personnel of CMA.
In addition, the Board considered the investment and legal compliance programs of the Fund and CMA, including their compliance policies and procedures and reports of the Fund's' Chief Compliance Officer.
The Board evaluated the ability of CMA, based on its resources, reputation and other attributes, to attract and retain qualified investment professionals, including research, advisory and supervisory personnel. In this regard, the Board considered information regarding CMA's compensation program for its personnel involved in the management of the Fund. The Board also considered CMA's investment in further developing its research and trading departments.
Based on the above factors, together with those referenced below, the Board concluded that they were satisfied with the nature, extent and quality of the investment advisory services provided to the Fund by CMA.
Fund Performance and Expenses. The Fund is a new fund that commenced operations on March 31, 2008. Therefore, the Fund has a limited performance history. Consequently, the Board did not give consideration to performance information.
The Board received and considered statistical information regarding the Fund's total expense ratio and its various components, including contractual advisory fees, actual advisory fees, actual non-management fees, Rule 12b-1 and non-Rule 12b-1 service fees, fee waivers/caps and/or expense reimbursements. The Board also considered comparisons of these fees to the expense information for the Fund's Peer Group and Universe, which comparative data was provided by
30
Lipper. For the Fund, Lipper determined that the composition of the Peer Group and/or Universe for expenses would differ from the composition for performance to provide a more accurate basis of comparison.
Investment Advisory Fee Rates. The Board reviewed and considered the proposed contractual investment advisory fee rate together with the administration fee rate payable by the Fund to CMA for investment advisory services (the "Contractual Management Rate"). In addition, the Board reviewed and considered the proposed fee waiver/cap arrangements applicable to the Contractual Management Rate and considered the Contractual Management Rate after taking the waivers/caps into account (the "Actual Management Rate"). The Board noted that, on a complex-wide basis, CMA had reduced annual management fees by at least $32 million per year pursuant to the NYAG Settlement. The Board also noted reductions in net advisory rates and/or total expenses of certain funds across the fund complex. Additionally, the Board received and afforded specific attention to information comparing the Contractual Management Rate and Actual Management Rate with those of the other funds in the Peer Group.
The Board concluded that the factors noted above supported the Contractual Management Rate and the Actual Management Rate, and the approval of the Advisory Agreement for the Fund.
Profitability. The Board received and considered a detailed profitability analysis of CMA based on the Contractual Management Rate, as well as on other relationships between the Fund and other funds in the complex on the one hand and CMA affiliates on the other. The analysis included complex-wide and Fund information and a comparison of results using alternative allocation methodologies. The Board concluded that, in light of the costs of providing investment management and other services, the profits and other ancillary benefits that CMA and its affiliates received from providing these services were not unreasonable.
Economies of Scale. The Board received and considered information regarding whether there have been economies of scale with respect to the management of the Fund, whether the Fund has appropriately benefited from any economies of scale and whether there is potential for realization of any further economies of scale. Most particularly, CMA provided information showing that, as a percentage of fund assets, CMA's complex-wide revenues, expenses and profits declined over a four-year period during which fund assets increased by 39% and the shareholder benefit over a two-year period increased from 33% to 41% of the Adviser's total profits. The Board concluded that any potential economies of scale are shared fairly with Fund shareholders, most particularly through CMA's assumption of certain Fund expenses.
The Board acknowledged the inherent limitations of any analysis of an investment adviser's economies of scale, stemming largely from the Board's understanding that economies of scale are realized, if at all, by an investment adviser across a variety of products and services, not just with respect to a single fund.
Information About Services to Other Clients. The Board also received and considered information about the nature and extent of services and fee rates offered by CMA to its other clients, including separate accounts and institutional investors. In this regard, the Board concluded that, where the Contractual Management Rate and Actual Management Rate were appreciably above the range of the fee rates offered to other CMA clients, based on information provided by CMA, the costs associated with managing and operating a registered investment company provided a justification for the higher fee rates charged to the Fund.
Other Benefits to CMA. The Board received and considered information regarding any "fall-out" or ancillary benefits received by CMA and its affiliates as a result of their relationship with the Fund. Such benefits could include, among others, benefits attributable to CMA's relationships with the Fund (such as soft-dollar credits) and benefits potentially derived from an increase in CMA's business as a result of their relationship with the Fund (such as the ability to market to shareholders other financial products offered by CMA and its affiliates).
The Board considered the effectiveness of the policies of the Fund in achieving the best execution of portfolio transactions, whether and to what extent soft dollar credits are sought and how any such credits are utilized, any benefits that may be realized by using an affiliated broker, the extent to which efforts are made to recapture transaction costs, and the controls applicable to brokerage allocation procedures. The Board concluded that the benefits were not unreasonable.
31
Other Factors and Broader Review. As discussed above, the Board reviews materials received from CMA annually as part of the re-approval process under Section 15(c) of the 1940 Act. The Board also reviews and assesses the quality of the services the Fund receives throughout the year. In this regard, the Board and its Committees review reports of CMA at each of their quarterly meetings, which include, among other things, Fund performance reports. In addition, the Board and its Committees confer with portfolio managers at various times throughout the year including, most particularly, in the June Investment Committee meeting.
Conclusion. After considering the above-described factors, based on their deliberations and their evaluation of the information provided, the Board concluded that the compensation payable to CMA under the Advisory Agreement is fair and equitable. Accordingly, the Board unanimously re-approved the Advisory Agreement.
32
Summary of Management Fee Evaluation by
Independent Fee Consultant
EXCERPTS FROM REPORT OF INDEPENDENT FEE CONSULTANT TO THE FUNDS SUPERVISED BY THE COLUMBIA NATIONS BOARD
Prepared pursuant to the February 9, 2005
Assurance of Discontinuance among the
Office of Attorney General of New York State,
Columbia Management Advisors, LLC and
Columbia Management Distributors, Inc.
November 12, 2008
I. Overview
On February 9, 2005, Columbia Management Advisors, LLC ("CMA") and Columbia Management Distributors, Inc.1 ("CMD") agreed to the New York Attorney General's Assurance of Discontinuance ("AOD"). Among other matters, the AOD stipulates that CMA may manage or advise a Columbia Fund ("Columbia Fund" and together with all such funds or a group of such funds as the "Columbia Funds") only if the Independent Members of the Columbia Fund's Board of Trustees appoint a Senior Officer or retain an Independent Fee Consultant ("IFC") who is to manage the process by which proposed management fees are negotiated. The AOD further stipulates that the Senior Officer or IFC is to prepare a written annual evaluation of the fee negotiation process.
With effect from January 1, 2007, the Independent Members of the Board of Trustees for certain Columbia Funds known collectively as the "Nations Funds" (the "Trustees") retained me as IFC for the Nations Funds.2 In this capacity, I have prepared the fourth annual written evaluation of the fee negotiation process. As was the case with last year's report (the "2007 Report") my immediate predecessor as IFC, John Rea, provided invaluable assistance in the preparation of this year's report.
A. Role of the Independent Fee Consultant
The AOD charges the IFC with "managing the process by which proposed management fees...to be charged the Columbia Fund are negotiated so that they are negotiated in a manner which is at arms' length and reasonable and consistent with this Assurance of Discontinuance." The AOD also provides that CMA "may manage or advise a Columbia Fund only if the reasonableness of the proposed management fees is determined by the Board of Trustees...using...an annual independent written evaluation prepared by or under the direction of...the Independent Fee Consultant." Therefore, the AOD makes clear that the IFC does not supplant the Trustees in negotiating management fees with CMA, nor does the IFC substitute his or her judgment for that of the Trustees with respect to the reasonableness of proposed fees or any other matter that is committed to the business judgment of the Trustees.
B. Elements Involved in Managing the Fee Negotiation Process
In preparing the report required by the AOD, the IFC must consider at least the following six factors set forth in the AOD:
1. The nature and quality of CMA's services, including the Fund's performance;
2. Management fees (including any components thereof) charged by other mutual fund companies for like services;
3. Possible economies of scale as the Fund grows larger;
4. Management fees (including any components thereof) charged to institutional and other clients of CMA for like services;
5. Costs to CMA and its affiliates of supplying services pursuant to the management fee agreements, excluding any intra-corporate profit; and
6. Profit margins of CMA and its affiliates from supplying such services.
C. Organization of the Annual Evaluation
This report, like last year's, focuses on the six factors and contains a section for each factor except that CMA's costs and profits from managing the Funds have been combined into a single section. In addition to a discussion of these factors, the report offers recommendations to improve the fee review process in future years. A review of the status of recommendations made in the 2007 Report is being provided separately with the materials for the November meeting.
1 CMA and CMD are subsidiaries of Columbia Management Group, LLC ("CMG"), and are the successors to the entities named in the AOD.
2 I have no material relationship with Bank of America, CMG or any of its affiliates, aside from serving as IFC, and I am aware of no material relationship with any of their affiliates. I retained John Rea, an independent economic consultant, to assist me with this report.
Unless otherwise stated or required by the context, this report covers only the Nations Funds, which are also referred as the "Funds."
33
II. Summary of Findings
A. General
1. Based upon my examination of the information supplied by CMG in the light of the six factors set forth in the AOD, I conclude that the Trustees have the relevant information necessary to evaluate the reasonableness of the proposed management fees for each Nations Fund.
2. In my view, the process by which the proposed management fees of the Funds have been negotiated in 2008 thus far has been, to the extent practicable, at arms' length and reasonable and consistent with the AOD.
B. Nature and Quality of Services, Including Performance
3. The performance of the Funds has been relatively good for the most recent 1-, 3- and 5-year periods. The strongest records were posted by the Funds in the Active Equity and Quantitative Strategies Groups and by the sub-advised Funds. The 5-year performance rankings of the subadvised Funds were particularly strong, with all such Funds in the top two performance quintiles.
4. The 1- and 3-year performance records of the Funds declined slightly from 2007 to 2008, while the 5-year performance records improved year-over-year. Most Funds changed their 1-year performance quintile year-over-year, while the 5-year rankings were, as expected, much more stable, with less than half the Funds moving to a different 5-year performance quintile.
5. The performance of the actively-managed equity and sub-advised Funds against their benchmarks was strong, especially for the 1- and 3-year performance periods. However, no fixed-income Fund with a reliable benchmark exceeded it on a net basis in any performance period. Money market Funds do not have such benchmarks and therefore were excluded from this analysis.
6. The Nations equity Funds' overall performance adjusted for risk was strong. The performance of 13 of the 19 actively-managed Funds included in the risk analysis bettered the median in 3-year performance adjusted and unadjusted for risk. No relationship between risk and return was detected for fixed-income Funds.
7. The industry-standard procedure used by third parties such as Lipper and Morningstar to construct the performance universe in which each Fund's performance is ranked relative to comparable funds tends to bias a Fund's ranking upward within that universe. The bias occurs because either no-12b-1-fee or A share classes of the Funds are compared to the performance universe that includes all share classes of competitive multi-class funds. Therefore, the procedure ranks shares with zero or 25 basis point 12b-1 fees against classes of competitive funds with 12b-1 fees of up to 100 basis points. Correcting this bias by limiting the performance universe to classes of competitive funds with comparable 12b-1 fees in most cases lowers the relative performance for the Funds but does not call into question the general finding that the Nations Funds' performance has been strong.
8. A small number of Funds have consistently underperformed their peers in each of the past four years, depending on the exact criteria used to measure long-term underperformance. For example, one Fund has had below-median 1- and 3-year performance in each of the past four years; one additional Fund had below-median 3-year performance for those years.
9. The services performed by CMG professionals beyond portfolio management, such as compliance, legal, information technology, risk management, finance and fund administration, are critical to the success of the Funds and appear to be of high quality.
C. Management Fees Charged by Other Mutual Fund Companies
10. The Funds' management fees and total expenses are generally low relative to those of their peers, with the exception of subadvised Funds. Almost two-third of the Funds ranked in the two least expensive quintiles for total expenses and just over half were in those quintiles for actual management fees. Funds with lower actual management fees tended to have lower relative total expenses. All fixed-income Funds had total expenses in the two least expensive quintiles.
11. Generally, the Nations Funds with the highest relative fees and expenses are sub-advised. All eight Nations Funds with fifth-quintile total expense rankings were sub-advised. The actual management fees of 11 of the 14 sub-advised
34
Funds were in the fourth and fifth quintile. The average management fees of the sub-advised Funds were typically 20 points higher than internally-managed equity Funds. CMA presented data suggesting that such differentials were consistent with industry practice.
12. The management fees of the internally-advised Nations Funds are generally in line with those of Columbia Funds overseen by the Atlantic and Acorn/Wanger Boards of Trustees.
D. Trustees' Fee and Performance Evaluation Process
13. The Trustees' evaluation process identified 20 Funds in 2008 for further review based upon their relative performance or expenses or both. When compared in filtered universes, three more Funds met the criteria for review.
E. Potential Economies of Scale
14. CMG has prepared a memo for the Trustees containing its views on the sources and sharing of potential economies of scale. CMG views economies of scale as arising at the complex level and would regard estimates of scale economies for individual funds as unreliable. In its analysis, CMG did not identify specific sources of economies of scale or provide any estimates of any economies of scale that might arise from future asset growth. CMG's analysis included measures taken by the Trustees and CMG that seek to share any potential economies of scale through breakpoints in management fee schedules, expense reimbursements, fee waivers, enhanced shareholder services, fund mergers, and operational consolidation.
15. An examination of the management fee schedules of a selected number of the Nations Funds suggests that, as a general matter, the breakpoint schedules of these Funds are not out of line with those of competitors. A similar examination of five other Nations Funds in 2007 led to the same conclusion.
F. Management Fees Charged to Institutional Clients
16. CMG has provided Trustees with comparisons of mutual fund management fees and institutional fees based upon standardized fee schedules and actual fees. The results show that, consistent with industry practice, institutional fees are generally lower than the Funds' management fees. However, because the services provided and risks borne by the manager are more extensive for mutual funds than for institutional accounts, the differences are of limited value in assisting the Trustees in their review of the reasonableness of the Funds' management fees.
G. Revenues, Expenses, and Profits
17. The activity-based cost allocation methodology ("ABC") employed by CMG to allocate costs for purposes of calculating Fund profitability, both direct and indirect, for purposes of calculating Fund profitability is thoughtful and detailed. For comparison, CMG proposed a change to the method by which indirect expenses were allocated. Under this "hybrid" method, such costs are allocated to Funds 50% by assets and 50% per fund. Allocating indirect expenses equally to each Fund has an intuitive logic, as each Fund regardless of size has certain expenses, such as preparing and printing prospectuses and financial statements.
18. The materials provided on CMG's revenues and expenses with respect to the Funds and the methodology underlying their construction generally form a sufficient basis for Trustees to evaluate CMG's expenses and profitability for each Fund.
19. In 2007, CMG's complex-wide pre-tax margins on the Nations Funds were close to the industry average before distribution and below average when distribution revenues and expenses were included, based on limited data available about publicly-held mutual fund managers. However, as is to be expected in a complex comprising 65 Funds, some Nations Funds have higher pre-tax profit margins, when calculated solely with respect to management revenues and expenses, while other Nations Funds operate at a loss. A pro forma analysis of the complex's profitability taking into account expenses incurred in 2008 associated with support of the money market funds sharply reduced the profitability of the Nations Funds. There is a positive relationship between fund size and profitability, with smaller Funds generally operating at a loss.
35
20. CMG shares a fixed percentage of its management fee revenues with an affiliate, U.S. Trust, Bank of America Private Wealth Management, to compensate that affiliate for services it performs with respect to Nations Fund assets held for the benefit of its customers. Based on our analysis of the services provided by the affiliate, we believe all such payments should be regarded as a distribution expense, except for any portion attributable to payments by CMG for performance of sub-transfer agency or sub-accounting functions.
III. Recommendations
1) Criteria for review. The Trustees may wish to consider modifying the criteria for classifying a fund as a "Review Fund" to include criteria that focus exclusively on performance without regard to expense or fee levels. For example, a Fund whose one-year or three-year performance was median or below for four consecutive years could be treated as a Review Fund. Applying such criteria would add two Funds to the list of Review Funds.
2) Profitability data. CMG should present to the Trustees each year the profitability of each Fund, each investment style, and each complex (of which Nations is one) calculated as follows:
Exhibit 1. Management-only profitability should be calculated without reference to any Private Bank expense.
Exhibit 2. Profitability excluding distribution (which essentially covers the management and transfer agency functions) should be adjusted by removing from the expense calculation any portion of the Private Bank payment not attributable to the performance by the Private Bank of sub-transfer agency or sub-accounting functions.
Exhibit 3. Total profitability, including distribution: No adjustment for Private Bank expenses should be made, because all such expenses represent legitimate fund expenses to be taken into account in calculating CMG's profit margin including distribution.
Exhibit 4. Distribution only: This should include all Private Bank expenses other than those attributable to sub-transfer agency services.
Therefore, the following data need not be provided:
1. Adjusting total profitability data for Private Bank expenses
2. Adjusting profitability excluding distribution by backing out all Private Bank expenses.
3) Economies of scale. CMG and the IFC should continue to work on methods for more precisely quantifying to the extent possible the sources and magnitude of any economies of scale as CMG's mutual fund assets under management increase, to the extent that the data allows for meaningful year-over-year comparisons. The framework suggested in Section IV.D.4 may prove to be a useful model for such an analysis.
4) Competitive breakpoint analysis. As part of the annual fee evaluation process, the breakpoints of a select group of Nations Funds (which would differ each year) should continue to be compared to those of industry rivals to ensure that the Funds' breakpoint schedules remain within industry norms. As breakpoint schedules change relatively little each year, performing such a comparison for all Funds each year would not be an efficient use of Trustee and CMG resources.
5) Cost allocation methodology. CMG's point that the current ABC system of allocating indirect expenses creates anomalous results in several cases, including sub-advised Funds, is well-taken. We would like to work with CMG over the forthcoming year on alternatives to the current system of allocating indirect expenses that (1) resolve the anomalies, (2) limit the amount of incremental effort on CMG's part and (3) remain faithful to the general principle that expenses should be allocated by time and effort to the extent reasonably possible.
6) Management fee disparities. CMG and the Nations Trustees, as part of any future study of management fees, should analyze any differences in management fee schedules between Funds managed in similar investment styles. As part of that analysis, CMG should provide an explanation for any significant fee differences among comparable funds
36
across fund families managed by CMA, such as differences in the management styles of different Funds included the same Lipper category. Finally, whenever CMG proposes a management fee change or an expense cap for any mutual fund managed by CMA that is comparable to any Nations Fund, CMG should provide the Trustees with sufficient information about the proposal to allow the Trustees to assess the applicability of the proposed change to the relevant Nations Fund or Funds.
7) Tax-exempt Fund expense data. The expense rankings of certain tax-exempt Funds were adversely affected by including certain investment-related interest expenses that Lipper excluded in calculating the expense ratios of competitors. We recommend that CMG follow the Lipper practice and exclude such interest expenses from data submitted to Lipper to avoid unfairly disadvantaging the tax-exempt Funds.
8) Reduction of volume of paper documents submitted. The effort to rationalize and simplify the data presented to the Trustees and the process by which that data was prepared and organized was regarded as a success by all parties. We should continue to look for opportunities to reduce and simplify the presentation of 15(c) data, especially in the area of Fund and manager profitability. The Fund "Dashboard" volume presents a large volume of Fund data on a single page. If it is continued, the Trustees may wish to consider receiving the underlying Lipper data on CD, rather than the current paper volumes.
* * *
Respectfully submitted,
Steven E. Asher
37
This page intentionally left blank.
This page intentionally left blank.
This page intentionally left blank.
Important Information About This Report
The fund mails one shareholder report to each shareholder address. If you would like more than one report, please call shareholder services at 1-800-426-3750 and additional reports will be sent to you. This report has been prepared for shareholders of the Columbia Overseas Value Fund.
A description of the policies and procedures that the fund uses to determine how to vote proxies and a copy of the fund's voting records are available (i) at www.columbiamanagement.com; (ii) on the Securities and Exchange Commission's website at www.sec.gov; and (iii) without charge, upon request, by calling 1-800-368-0346. Information regarding how the fund voted proxies relating to portfolio securities during the 12-month period ended June 30 is available on the SEC's website. Information regarding how the fund voted proxies relating to portfolio securities is also available from the fund's website, www.columbiamanagement.com.
The fund files a complete schedule of portfolio holdings with the SEC for the first and third quarters of each fiscal year on Form N-Q. The fund's Form N-Q is available on the SEC's website at www.sec.gov and may be reviewed and copied at the SEC's Public Reference Room in Washington, DC. Information on the operation of the Public Reference Room may be obtained by calling 1-800-SEC-0330.
Please read and consider the investment objectives, risks, charges and expenses for any fund carefully before investing. For a prospectus which contains this and other important information about the fund, contact your Columbia Management representative at 1-800-426-3750.
Columbia Management Group, LLC ("Columbia Management") is the investment management division of Bank of America Corporation. Columbia Management entities furnish investment management services and products for institutional and individual investors. Columbia Funds are distributed by Columbia Management Distributors, Inc., member of FINRA, SIPC, part of Columbia Management and an affiliate of Bank of America Corporation.
Transfer Agent
Columbia Management Services, Inc.
P.O. Box 8081
Boston, MA 02266-8081
1-800-426-3750
Distributor
Columbia Management
Distributors, Inc.
One Financial Center
Boston, MA 02111
Investment Advisor
Columbia Management Advisors, LLC
100 Federal Street
Boston, MA 02110
41
Columbia Management®
One Financial Center
Boston, MA 02111-2621
PRSRT STD
U.S. Postage
PAID
Holliston, MA
Permit NO. 20
Columbia Management®
Columbia Overseas Value Fund
Annual Report, February 28, 2009
©2009 Columbia Management Distributors, Inc.
One Financial Center, Boston, MA 02111-2621
800-345-6611 www.columbiafunds.com
SHC-42/8544-0209 (04/09) 09/76244

Annual Report
February 28, 2009
Index Funds
| n | | Columbia Large Cap Index Fund |
| n | | Columbia Large Cap Enhanced Core Fund |
| n | | Columbia Mid Cap Index Fund |
| n | | Columbia Small Cap Index Fund |
| | |
| NOT FDIC INSURED | | May Lose Value |
| NOT BANK ISSUED | | No Bank Guarantee |
Table of contents
The views expressed in this report reflect the current views of the respective parties. These views are not guarantees of future performance and involve certain risks, uncertainties and assumptions that are difficult to predict so actual outcomes and results may differ significantly from the views expressed. These views are subject to change at any time based upon economic, market or other conditions and the respective parties disclaim any responsibility to update such views. These views may not be relied on as investment advice and, because investment decisions for a Columbia Fund are based on numerous factors, may not be relied on as an indication of trading intent on behalf of any particular Columbia Fund. References to specific company securities should not be construed as a recommendation or investment advice.
President’s Message

Dear Shareholder:
Recent events have shown great volatility in the markets and uncertainty in the economy. During these challenging times, it becomes even more important to focus on long-term horizons and key investment tools that can help manage volatility. This may be the time to reflect on your investment goals and evaluate your portfolio to ensure you are positioned for any potential market rebound.
A long-term financial plan can serve as a road map and guide you through the necessary steps designed to meet your financial goals. Your financial plan should take into account your investment goals, time horizon, overall financial situation, risk tolerance and willingness to ride out market volatility. Your investment professional can be a key resource as you work through this process. The knowledge and experience of an investment professional can help as you create or reevaluate your investment strategy.
The importance of diversification
Although diversification does not ensure a profit or guarantee against loss, a diversified portfolio can be a strategy for successful long-term investing. Diversification refers to the mix of investments within a portfolio. A mutual fund can contribute to portfolio diversification given that a mutual fund’s portfolio represents several investments. Additionally, the way you allocate your money among stocks, bonds and cash, and geographically between foreign and domestic investments, can help to reduce risks. Diversification can result in multiple investments where the positive performance of certain holdings can offset any negative performance from other holdings. Having a diversified portfolio doesn’t mean that the value of the portfolio will never go down, but rather helps strike a balance between risk and reward.
Reevaluate your strategy
An annual review of your investments is a key opportunity to determine if your investment needs have changed or if you need minor adjustments to rebalance your portfolio. Life events like a birth, marriage, home improvement, or change in employment can have a major affect on your spending and goals. Ask yourself how your spending or goals have changed and factor this into your financial plan. Are you using automated investments or payroll deductions to help keep your savings on track? Are you able to set aside additional savings or increase your 401(k) plan contributions? If during your review you find that your investments in any one category (e.g., stocks, bonds or cash) have grown too large based on your diversification plan, you may want to consider redirecting future investments to get back on track.
History has shown that the U.S. stock market has been remarkably resilient.¹ Volatility can lead to opportunity. Patience and a commitment to your long-term financial plan may position you to potentially benefit over your investment horizon. We appreciate your business and continued support of Columbia Funds.
Sincerely,

J. Kevin Connaughton
President, Columbia Funds
The board of trustees elected J. Kevin Connaughton president of Columbia Funds on January 16, 2009.
| ¹ | The Dow Jones Industrial Average is the most widely used indicator of the overall condition of the stock market. The Dow Jones Industrial Average Index is a price-weighted average of 30 actively traded blue-chip stocks as selected by the editors of the Wall Street Journal. Indices are not investments, do not incur fees or expenses and are not professionally managed. It is not possible to invest directly in an index. |
Economic Update
February 2009
Summary
For the 12-month period that ended February 28, 2009
| | n | | The broad U.S. stock market, as measured by the S&P 500 Index, returned negative 43.32%. Stock markets outside the United States returned negative 50.22%, as measured (in U.S. dollars) by the MSCI EAFE Index. | |
| | |
| S&P Index | | MSCI EAFE Index |
| |

| |
|
-43.32% | | -50.22% |
| | |
| | |
| | n | | Despite volatility in many segments of the bond market, the Barclays Capital U.S. Aggregate Bond Index delivered a modest gain. High-yield bonds lost significant ground, as measured by the Merrill Lynch High Yield U.S. Corporates, Cash Pay Index. Municipals recovered from an early setback, as measured by the Barclays Municipal Bond Index. | |
| | |
| Barclays Aggregate Index | | Merrill Lynch Index |
| |

| |
|
2.06% | | -22.97% |
| Barclays Municipal Index | | |
| |
| | |
5.18% | | |
The pace of economic growth ground to a halt during the 12-month period that began March 1, 2008 and ended February 28, 2009. The National Bureau of Economic Research reported that the U.S. economy had slipped into recession late in 2007 and the downturn was even sharper than anticipated. Fourth quarter 2008 growth was estimated at negative 6.3% — the worst quarter on record for the U.S. economy since 1982.
A host of factors weighed on consumers and businesses alike. The most severe housing downturn in decades showed no sign of abating as inventories of homes for sale rose, home prices declined and tighter credit standards, the result of continued turmoil in the subprime mortgage market, made it more difficult for homebuyers to qualify for loans. The labor market has contracted for 14 consecutive months, driving the unemployment rate to 8.1%, the highest rate since 1983. An estimated 3.6 million jobs have been lost since the recession commenced late in 2007, with announced layoffs likely to drive that number even higher in 2009. Manufacturing activity slowed and consumer spending declined, resulting in one of the weakest holiday seasons in decades. However, sales in chain stores showed a glimmer of hope in February, edging lower but holding up better than analysts predicted. Wholesale clubs and discounters registered a gain for the month, underscoring the migration toward frugality among Americans hit hard by job, investment and home equity losses.
A weakening economy and turmoil in the financial markets took a toll on consumer confidence, which continued to set new all-time lows for the 40-year history of the monthly survey. Consumer confidence is surveyed monthly by The Conference Board.
In an effort to restore confidence in the capital markets, loosen the reins on credit and shore up economic growth, the Federal Reserve Board (the Fed) brought a key short-term rate — the Federal Funds Rate — down from 3.00% to a target between zero and 0.25% during the 12-month period — a record low. However, the Fed’s efforts went largely unrewarded. The one bright spot during this period of uncertainty was lower energy and commodity prices. With oil trading near $40 per barrel at the end of the period, gasoline prices have come down from $4 per gallon or more last summer to around $2 per gallon in recent months.
Stocks retreat as economic outlook darkens
Against a shifting economic backdrop, the U.S. stock market lost 43.32% for the 12-month period, as measured by the S&P 500 Index.1 Losses extended across all market capitalizations and both growth and value, although growth stocks held up better than value stocks, as measured by their respective Russell indices.2 Stock markets outside the U.S. suffered even greater losses. The MSCI EAFE Index3, a broad gauge of stock market performance in foreign developed markets, lost 50.22% (in U.S. dollars) for the period. Emerging stock markets, which have had a strong run over the
1 | The S&P 500 Index tracks the performance of 500 widely held, large capitalization US stocks. |
2 | The Russell 1000® Index measures the performance of 1,000 of the largest US companies, based on market capitalization. The Russell Midcap Index measures the performance of the 800 smallest companies in the Russell 1000 Index, as ranked by total market capitalization. The Russell 2000 Index measures the performance of the 2,000 smallest of the 3,000 largest US companies, based on market capitalization. |
3 | The Morgan Stanley Capital International (MSCI) Europe, Australasia, Far East (EAFE) Index is a free float-adjusted market capitalization index that is designed to measure developed market equity performance, excluding the US and Canada. |
1
Economic Update (continued)
February 2009
past several years, were also caught in the downdraft. As investors backed away from risk, emerging markets suffered most of all. The MSCI Emerging Markets Index4 returned negative 56.03% (in U.S. dollars).
Bonds delivered a positive return
The U.S. bond market seesawed during the 12-month period but several sectors managed to deliver modest gains as investors sought refuge from the volatile stock market. Treasury prices rose and yields declined as the economy faltered and stock market volatility increased. The benchmark 10-year U.S. Treasury yield ended the period at just over 3.0%. In this environment, the Barclays Capital U.S. Aggregate Bond Index5 (formerly the Lehman Brothers U.S. Aggregate Bond Index) returned 2.06%. High-yield bonds took a beating as economic prospects weakened and default fears rose. The Merrill Lynch High Yield U.S. Corporates, Cash Pay Index6 returned negative 22.97%. The municipal market suffered a setback early in 2008, then rebounded strongly. The Barclays Capital Municipal Bond Index7 returned 5.18% for the 12-month period.
4 | The MSCI Emerging Markets Index is a widely accepted index composed of a sample of companies from 25 countries representing the global emerging stock markets. |
5 | The Barclays Capital U.S. Aggregate Bond Index is a market value-weighted index that tracks the daily price, coupon, pay-downs and total return performance of fixed-rate, publicly placed, dollar-denominated and non-convertible investment grade debt issues with at least $250 million par amount outstanding and with at least one year to final maturity. |
6 | The Merrill Lynch High Yield U.S. Corporates, Cash Pay Index is an index that tracks the performance of non-investment-grade corporate bonds. As of 01/01/2009, Merrill Lynch & Co., Inc. is a wholly-owned subsidiary of Bank of America Corporation and an affiliate of Columbia Management. |
7 | The Barlcays Capital Municipal Bond Index is considered representative of the broad market for investment-grade, tax-exempt bonds with maturities of at least one year. |
Indices are not investments, do not incur fees or expenses and are not professionally managed. It is not possible to invest directly in an index. Securities in the fund may not match those in an index.
Past performance is no guarantee of future results.
2
Fund Profile – Columbia Large Cap Index Fund
Performance data quoted represents past performance and current performance may be lower or higher. Past performance is no guarantee of future results. The investment return and principal value will fluctuate so that shares, when redeemed, may be worth more or less than the original cost. Please visit www.columbiafunds.com for daily and most recent month-end performance updates.
Summary
1-year return as of 02/28/09
| | |
| |
 | | –43.51% Class A shares |
| |
| | –43.32% S&P 500 Index |
|
Morningstar Style Box |
|
Equity Style |
|
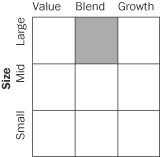
|
The Morningstar Style Box reveals a fund’s investment strategy. For equity funds the vertical axis shows the market capitalization of the stocks owned and the horizontal axis shows investment style (value, blend or growth). Information shown is based on the most recent data provided by Morningstar.
Summary
| n | | For the 12-month period that ended February 28, 2009, the fund’s Class A shares returned negative 43.51% without sales charge. |
n | | In a period of sharply declining stock prices, the fund generally tracked its benchmark, the S&P 500 Index1, and held up slightly better than the average fund in its peer group, the Lipper S&P 500 Index Objective Funds Classification.2 |
| n | | The portfolio is constructed to closely approximate the benchmark. |
Portfolio Management
Cheryl D’Hollander has co-managed the fund since February 2009 and has been with the advisor or its predecessors or affiliate organizations since 2003.
Peter S. Joo has co-managed the fund since February 2009 and has been with the advisor or its predecessors or affiliate organizations since 2005.
1 | The Standard & Poor’s (S&P) 500 Index tracks the performance of 500 widely held, large-capitalization US stocks. Indices are not investments, do not incur fees or expenses and are not professionally managed. It is not possible to invest directly in an index. Securities in the fund may not match those in an index. |
2 | Lipper Inc., a widely respected data provider in the industry, calculates an average total return (assuming reinvestment of distributions) for mutual funds with investment objectives similar to those of the fund. Lipper makes no adjustment for the effect of sales loads. |
3
Performance Information – Columbia Large Cap Index Fund
| | |
| Annual operating expense ratio (%)* |
| |
Class A | | 0.45 |
Class B | | 1.20 |
Class Z | | 0.20 |
Annual operating expense ratio
after contractual waivers (%)* |
| |
Class A | | 0.39 |
Class B | | 1.14 |
Class Z | | 0.14 |
| * | The annual operating expense ratio and annual operating expense ratio after contractual waivers are as stated in the fund’s prospectus that is current as of the date of this report. The contractual waiver expires 06/30/09. Differences in expense ratios disclosed elsewhere in this report may result from including fee waivers and expense reimbursements as well as different time periods used in calculating the ratios. |
Performance data quoted represents past performance and current performance may be lower or higher. Past performance is no guarantee of future results. The investment return and principal value will fluctuate so that shares, when redeemed, may be worth more or less than the original cost. Please visit www.columbiafunds.com for daily and most recent month-end performance updates.
| | |
| Performance of a $10,000 investment 03/01/99 – 02/28/09 ($) |
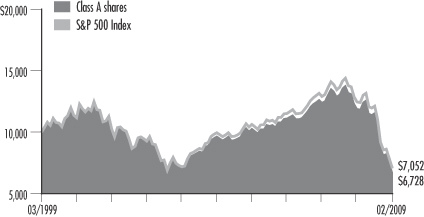
The chart above shows the change in value of a hypothetical $10,000 investment in Class A shares of Columbia Large Cap Index Fund during the stated time period, and does not reflect the deduction of taxes that a shareholder may pay on fund distributions or on the redemption of fund shares. The Standard & Poor’s (S&P) 500 Index tracks the performance of 500 widely held, large-capitalization US stocks. Indices are not investments, do not incur fees or expenses and are not professionally managed. It is not possible to invest directly in an index. Securities in the fund may not match those in an index.
| | | | |
| Performance of a $10,000 investment 03/01/99 – 02/28/09 ($) |
| Sales charge | | without | | with |
Class A | | 6,728 | | n/a |
Class B | | 6,560 | | 6,560 |
Class Z | | 6,900 | | n/a |
| | | | | | | | |
| Average annual total return as of 02/28/09 (%) |
| Share class | | A | | B | | Z |
| Inception | | 10/10/95 | | 09/23/05 | | 12/15/93 |
| Sales charge | | without | | without | | with | | without |
1-year | | –43.51 | | –43.94 | | –46.70 | | –43.37 |
5-year | | –6.97 | | –7.44 | | –7.80 | | –6.74 |
10-year | | –3.89 | | –4.13 | | –4.13 | | –3.64 |
| | | | | | | | |
| Average annual total return as of 03/31/09 (%) |
| Share class | | A | | B | | Z |
| Sales charge | | without | | without | | with | | without |
1-year | | –38.27 | | –38.75 | | –41.77 | | –38.11 |
5-year | | –5.10 | | –5.60 | | –5.96 | | –4.86 |
10-year | | –3.45 | | –3.70 | | –3.70 | | –3.20 |
The “with sales charge” returns include the applicable contingent deferred sales charge of 5.00% in the first year, declining to 1.00% in the sixth year and eliminated thereafter for Class B shares. The “without sales charge” returns do not include the effect of sales charges. If they had, returns would be lower.
Performance results reflect any fee waivers or reimbursements of fund expenses by the investment advisor and/or any of its affiliates. Absent these fee waivers or expense reimbursement arrangements, performance results would have been lower.
All results shown assume reinvestment of distributions. Class A shares are sold at net asset value. Class Z shares are sold at net asset value with no distribution and service (Rule 12b-1) fees. Class Z shares have limited eligibility and the investment minimum requirements may vary. Please see the fund’s prospectus for details. Performance for different share classes will vary based on differences in sales charges and fees associated with each class.
Class B shares commenced operations on September 23, 2005 and have no performance prior to that date. Performance prior to September 23, 2005 is that of Class A shares at net asset value with no distribution and service (12b-1 fees) of 0.25%. If Class B shares’ distribution and service (12b-1) fees had been reflected, total returns would have been lower.
The tables do not reflect the deduction of taxes that a shareholder may pay on fund distributions or on the redemption of fund shares.
4
Understanding Your Expenses – Columbia Large Cap Index Fund
Estimating your actual expenses
To estimate the expenses that you paid over the period, first you will need your account balance at the end of the period:
| | n | | For shareholders who receive their account statements from Columbia Management Services, Inc., your account balance is available online at www.columbiafunds.com or by calling Shareholder Services at 800.345.6611. | |
| | n | | For shareholders who receive their account statements from their brokerage firm, contact your brokerage firm to obtain your account balance. | |
| | 1. | Divide your ending account balance by $1,000. For example, if an account balance was $8,600 at the end of the period, the result would be 8.6. | |
| | 2. | In the section of the table below titled “Expenses paid during the period,” locate the amount for your share class. You will find this number in the column labeled “Actual.” Multiply this number by the result from step 1. Your answer is an estimate of the expenses you paid on your account during the period. | |
If the value of your account falls below the minimum initial investment requirement applicable to you, your account generally will be subject to a $20 annual fee. This fee is not included in the accompanying table. If you are subject to the fee, keep it in mind when you are estimating the ongoing expenses of investing in the fund and when comparing the expenses of this fund with other funds.
As a fund shareholder, you incur two types of costs. There are transaction costs and ongoing costs, which generally include investment advisory fees, distribution and service (Rule 12b-1) fees and other fund expenses. The information on this page is intended to help you understand the ongoing costs of investing in the fund and to compare these costs with the ongoing costs of investing in other mutual funds.
Analyzing your fund’s expenses by share class
To illustrate these ongoing costs, we have provided an example and calculated the expenses paid by investors in each share class during the period. The information in the following table is based on an initial investment of $1,000, which is invested at the beginning of the reporting period and held for the entire period. Expense information is calculated two ways and each method provides you with different information. The amount listed in the “Actual” column is calculated using the fund’s actual operating expenses and total return for the period. The amount listed in the “Hypothetical” column for each share class assumes that the return each year is 5% before expenses and is calculated based on the fund’s actual operating expenses. You should not use the hypothetical account values and expenses to estimate either your actual account balance at the end of the period or the expenses you paid during this reporting period.
Compare with other funds
Since all mutual funds are required to include the same hypothetical calculations about expenses in shareholder reports, you can use this information to compare the ongoing cost of investing in the fund with other funds. To do so, compare the 5% hypothetical example with the 5% hypothetical examples that appear in the shareholder reports of other funds. As you compare hypothetical examples of other funds, it is important to note that hypothetical examples are meant to highlight the ongoing costs of investing in a fund and do not reflect any transaction costs, such as sales charges, redemption fees or exchange fees.
| | | | | | | | | | | | | | |
| 09/01/08 – 02/28/09 | | | | | | |
| | | | |
| | | Account value at the
beginning of the period ($) | | Account value at the
end of the period ($) | | Expenses paid
during the period ($) | | Fund’s annualized
expense ratio (%) |
| | | Actual | | Hypothetical | | Actual | | Hypothetical | | Actual | | Hypothetical | | Actual |
Class A | | 1,000.00 | | 1,000.00 | | 580.92 | | 1,022.86 | | 1.53 | | 1.96 | | 0.39 |
Class B | | 1,000.00 | | 1,000.00 | | 578.89 | | 1,019.14 | | 4.46 | | 5.71 | | 1.14 |
Class Z | | 1,000.00 | | 1,000.00 | | 581.62 | | 1,024.10 | | 0.55 | | 0.70 | | 0.14 |
Expenses paid during the period are equal to the annualized expense ratio for the share class, multiplied by the average account value over the period, then multiplied by the number of days in the fund’s most recent fiscal half-year and divided by 365.
Had the investment advisor not waived fees or reimbursed a portion of expenses, account value at the end of the period would have been reduced.
It is important to note that the expense amounts shown in the table are meant to highlight only ongoing costs of investing in the fund and do not reflect any transaction costs, such as sales charges, redemption fees or exchange fees. Therefore, the hypothetical examples provided may not help you determine the relative total costs of owning shares of different funds. If these transaction costs were included, your costs would have been higher.
5
Portfolio Manager’s Report – Columbia Large Cap Index Fund
Performance data quoted represents past performance and current performance may be lower or higher. Past performance is no guarantee of future results. The investment return and principal value will fluctuate so that shares, when redeemed, may be worth more or less than the original cost. Please visit www.columbiafunds.com for daily and most recent month-end performance updates.
| | |
| Net asset value per share |
| |
as of 02/28/09 ($) | | |
Class A | | 14.14 |
Class B | | 14.20 |
Class Z | | 14.18 |
| | |
| Distributions declared per share |
| |
03/01/08 – 02/28/09 ($) | | |
Class A | | 0.41 |
Class B | | 0.25 |
Class Z | | 0.53 |
| | |
| Top 5 sectors |
| |
as of 02/28/09 (%) | | |
Information Technology | | 16.7 |
Health Care | | 15.6 |
Energy | | 13.8 |
Consumer Staples | | 13.4 |
Financials | | 9.8 |
Sector Breakdown is calculated as a percentage of net assets excluding short-term investments and securities lending collateral, if any.
For the 12-month period that ended February 28, 2009, the fund’s Class A shares returned negative 43.51% without sales charge. The S&P 500 Index returned negative 43.32%.1 The average return for the Lipper S&P 500 Index Objective Funds Classification was negative 43.54%.2 The fund seeks to approximate the benchmark weights of securities, industries and sectors represented in the S&P 500 Index. As such, its return was in line with the return of the index, after fees and expenses, which the index does not incur, and slightly ahead of the return of the average fund in its peer group.
A disappointing period for stocks
Over the past year, there were few winners in the stock market, as slower economic growth, a weak housing market, job losses and a deepening financial crisis weighed on investors. On a relative basis, the classic “defensive” sectors, including consumer staples, telecommunication services, health care and utilities, held up better than the rest of the sectors in the index. However, they too experienced double-digit declines. The two best-performing stocks for the 12-month period were in consumer staples: Anheuser-Busch, whose shares soared, and Wrigley, which gained significantly, both on news that they would be acquired at a premium to their existing stock prices. None of the stocks remained in the portfolio at the end of the period.
These standout performers were the exception for the period. A plunge in stock prices was led by financials, which declined 70% for the period, as some of the sector’s leading icons stumbled badly in the wake of a credit crisis that was rooted in the subprime mortgage market. Weak economic growth drove industrials and materials stocks down 50% or more, while energy stocks declined as the price of oil and natural gas plunged after hitting all-time highs. Among the hardest hit were American International Group (AIG), Washington Mutual, Inc., Lehman Brothers Holdings, Inc., Fannie Mae and Freddie Mac. Of the five, only AIG remained in the portfolio at the end of the period.
1 | The Standard & Poor’s (S&P) 500 Index tracks the performance of 500 widely held, large capitalization US stocks. Indices are not investments, do not incur fees or expenses and are not professionally managed. It is not possible to invest directly in an index. Securities in the fund may not match those in an index. |
2 | Lipper Inc., a widely respected data provider in the industry, calculates an average total return (assuming reinvestment of distributions) for mutual funds with investment objectives similar to those of the fund. Lipper makes no adjustment for the effect of sales loads. |
6
Portfolio Managers’ Report (continued) – Columbia Large Cap Index Fund
Looking ahead
With consumer spending in decline and job losses on the rise, the outlook for the U.S. economy is cloudy, at best, through the middle of 2009. However, history has shown that during previous economic cycles the stock market has risen well before an economic recovery takes hold. Investors have historically been willing to take on more risk in their portfolios while the economy is still in recession because they anticipate recovery and a more favorable investment environment. And when the stock market turns around, it has historically produced quick and substantial gains. Consider, for example, that even though the economy was still in the throes of major recessions in 1982 and 1991, the Standard & Poor’s 500 Index gained more than 21% and 30%, respectively, for those same years. There’s no guarantee that history will repeat itself. However, it may be easier to ride out volatility if you have a long-term perspective and remain focused on your goals.
Portfolio holdings and characteristics are subject to change periodically and may not be representative of current holdings and characteristics. The outlook for the fund may differ from that presented for other Columbia Funds.
Equity securities are affected by stock market fluctuations that occur in response to economic, business and other developments.
| | |
| Top 10 holdings |
| |
as of 2/28/09 (%) | | |
Exxon Mobil | | 5.2 |
Procter & Gamble | | 2.2 |
AT&T | | 2.1 |
Johnson & Johnson | | 2.1 |
International Business Machines | | 1.9 |
Microsoft | | 1.9 |
Chevron | | 1.8 |
Wal-Mart Stores | | 1.7 |
General Electric | | 1.3 |
Cisco Systems | | 1.3 |
Information provided is calculated as a percentage of net assets.
7
Fund Profile – Columbia Large Cap Enhanced Core Fund
Performance data quoted represents past performance and current performance may be lower or higher. Past performance is no guarantee of future results. The investment return and principal value will fluctuate so that shares, when redeemed, may be worth more or less than the original cost. Please visit www.columbiafunds.com for daily and most recent month-end performance updates.
Summary
1-year return as of 02/28/09
| | |
| |
| | –42.89% Class A shares |
| |
| | –43.32% S&P 500 Index |
|
Morningstar Style Box |
|
Equity Style |
|
|
The Morningstar Style Box reveals a fund’s investment strategy. For equity funds the vertical axis shows the market capitalization of the stocks owned and the horizontal axis shows investment style (value, blend or growth). Information shown is based on the most recent data provided by Morningstar.
Summary
| n | | For the 12-month period that ended February 28, 2009, the fund’s Class A shares returned negative 42.89% without sales charge. |
n | | In a difficult environment for stock markets around the world, the fund held up somewhat better than its benchmark, the S&P 500 Index1, but slightly underperformed the average fund in its peer group. |
| n | | Stock selection in the materials sector hampered returns while a decision to underweight financials and overweight health care benefited returns. |
Portfolio Management
Brian M. Condon has managed the fund since February 2009 and has been with the advisor or its predecessors or affiliate organizations since 1999.
1 | The Standard & Poor’s (S&P) 500 Index tracks the performance of 500 widely held, large-capitalization US stocks. Indices are not investments, do not incur fees or expenses and are not professionally managed. It is not possible to invest directly in an index. Securities in the fund may not match those in an index. |
8
Performance Information – Columbia Large Cap Enhanced Core Fund
Performance data quoted represents past performance and current performance may be lower or higher. Past performance is no guarantee of future results. The investment return and principal value will fluctuate so that shares, when redeemed, may be worth more or less than the original cost. Please visit www.columbiafunds.com for daily and most recent month-end performance updates.
|
| Performance of a $10,000 investment 03/01/99 – 02/28/09 ($) |

The chart above shows the change in value of a hypothetical $10,000 investment in Class A shares of Columbia Large Cap Enhanced Core Fund during the stated time period, and does not reflect the deduction of taxes that a shareholder may pay on fund distributions or on the redemption of fund shares. The Standard & Poor’s (S&P) 500 Index tracks the performance of 500 widely held, large-capitalization US stocks. Indices are not investments, do not incur fees or expenses and are not professionally managed. It is not possible to invest directly in an index. Securities in the fund may not match those in an index.
| | |
| Performance of a $10,000 investment 03/01/99 – 02/28/09 ($) |
Class A | | 6,996 |
Class R | | 6,939 |
Class Z | | 7,187 |
| | | | | | |
| Average annual total return as of 02/28/09 (%) |
| | | |
| Share class | | A | | R | | Z |
| Inception | | 07/31/96 | | 01/23/06 | | 07/31/96 |
1-year | | –42.89 | | –43.01 | | –42.69 |
5-year | | –6.77 | | –6.93 | | –6.53 |
10-year | | –3.51 | | –3.59 | | –3.25 |
| | | | | | |
| Average annual total return as of 03/31/09 (%) |
| | | |
| Share class | | A | | R | | Z |
1-year | | –37.46 | | –37.59 | | –37.27 |
5-year | | –5.06 | | –5.21 | | –4.80 |
10-year | | –3.10 | | –3.18 | | –2.84 |
| | |
| Annual operating expense ratio (%)* |
| |
Class A | | 0.79 |
Class R | | 1.04 |
Class Z | | 0.54 |
Annual operating expense ratio
after contractual waivers (%)* |
| |
Class A | | 0.75 |
Class R | | 1.00 |
Class Z | | 0.50 |
| * | The annual operating expense ratio and annual operating expense ratio after contractual waivers are as stated in the fund’s prospectus that is current as of the date of this report. The contractual waiver expires 06/30/09. Differences in expense ratios disclosed elsewhere in this report may result from including fee waivers and expense reimbursements as well as different time periods used in calculating the ratios. |
Performance results reflect any fee waivers or reimbursements of fund expenses by the investment advisor and/or any of its affiliates. Absent these fee waivers or expense reimbursement arrangements, performance results would have been lower.
All results shown assume reinvestment of distributions. Class R shares and Class Z shares, each sold at net asset value (NAV), have limited eligibility and the investment minimum requirement may vary. The returns for Class R shares include the returns for Class A shares prior to January 23, 2006, the date on which Class R shares were initially offered by the fund. If differences in expenses had been reflected, the returns would have been lower, since Class R shares are subject to a higher Rule 12b-1 fee. Only eligible investors may purchase Class R shares and Class Z shares of the fund, directly or by exchange. Please see the fund’s prospectus for details.
The tables do not reflect the deduction of taxes that a shareholder may pay on fund distributions or on the redemption of fund shares.
9
Understanding Your Expenses – Columbia Large Cap Enhanced Core Fund
Estimating your actual expenses
To estimate the expenses that you paid over the period, first you will need your account balance at the end of the period:
| | n | | For shareholders who receive their account statements from Columbia Management Services, Inc., your account balance is available online at www.columbiafunds.com or by calling Shareholder Services at 800.345.6611. | |
| | n | | For shareholders who receive their account statements from their brokerage firm, contact your brokerage firm to obtain your account balance. | |
| | 1. | Divide your ending account balance by $1,000. For example, if an account balance was $8,600 at the end of the period, the result would be 8.6. | |
| | 2. | In the section of the table below titled “Expenses paid during the period,” locate the amount for your share class. You will find this number in the column labeled “Actual.” Multiply this number by the result from step 1. Your answer is an estimate of the expenses you paid on your account during the period. | |
If the value of your account falls below the minimum initial investment requirement applicable to you, your account generally will be subject to a $20 annual fee. This fee is not included in the accompanying table. If you are subject to the fee, keep it in mind when you are estimating the ongoing expenses of investing in the fund and when comparing the expenses of this fund with other funds.
As a fund shareholder, you incur two types of costs. There are transaction costs and ongoing costs, which generally include investment advisory fees, distribution and service (Rule 12b-1) fees and other fund expenses. The information on this page is intended to help you understand the ongoing costs of investing in the fund and to compare these costs with the ongoing costs of investing in other mutual funds.
Analyzing your fund’s expenses by share class
To illustrate these ongoing costs, we have provided an example and calculated the expenses paid by investors in each share class during the period. The information in the following table is based on an initial investment of $1,000, which is invested at the beginning of the reporting period and held for the entire period. Expense information is calculated two ways and each method provides you with different information. The amount listed in the “Actual” column is calculated using the fund’s actual operating expenses and total return for the period. The amount listed in the “Hypothetical” column for each share class assumes that the return each year is 5% before expenses and is calculated based on the fund’s actual operating expenses. You should not use the hypothetical account values and expenses to estimate either your actual account balance at the end of the period or the expenses you paid during this reporting period.
Compare with other funds
Since all mutual funds are required to include the same hypothetical calculations about expenses in shareholder reports, you can use this information to compare the ongoing costs of investing in the fund with other funds. To do so, compare the 5% hypothetical example with the 5% hypothetical examples that appear in the shareholder reports of other funds. As you compare hypothetical examples of other funds, it is important to note that hypothetical examples are meant to highlight the ongoing costs of investing in a fund and do not reflect any transaction costs, such as sales charges, redemption fees or exchange fees.
| | | | | | | | | | | | | | |
| 09/01/08 – 02/28/09 |
| | | | |
| | | Account value at the
beginning of the period ($) | | Account value at the
end of the period ($) | | Expenses paid
during the period ($) | | Fund’s annualized
expense ratio (%) |
| | | Actual | | Hypothetical | | Actual | | Hypothetical | | Actual | | Hypothetical | | Actual |
Class A | | 1,000.00 | | 1,000.00 | | 589.80 | | 1,021.08 | | 2.96 | | 3.76 | | 0.75 |
Class R | | 1,000.00 | | 1,000.00 | | 589.60 | | 1,019.84 | | 3.94 | | 5.01 | | 1.00 |
Class Z | | 1,000.00 | | 1,000.00 | | 590.89 | | 1,022.32 | | 1.97 | | 2.51 | | 0.50 |
Expenses paid during the period are equal to the annualized expense ratio for the share class, multiplied by the average account value over the period, then multiplied by the number of days in the fund’s most recent fiscal half-year and divided by 365.
Had the investment advisor not waived fees or reimbursed a portion of expenses, account value at the end of the period would have been reduced.
It is important to note that the expense amounts shown in the table are meant to highlight only ongoing costs of investing in the fund. Therefore, the hypothetical examples provided may not help you determine the relative total costs of owning shares of different funds. If these transaction costs were included, your costs would have been higher.
10
Portfolio Manager’s Report – Columbia Large Cap Enhanced Core Fund
Performance data quoted represents past performance and current performance may be lower or higher. Past performance is no guarantee of future results. The investment return and principal value will fluctuate so that shares, when redeemed, may be worth more or less than the original cost. Please visit www.columbiafunds.com for daily and most recent month-end performance updates.
| | |
| Net asset value per share |
| |
as of 02/28/09 ($) | | |
Class A | | 7.24 |
Class R | | 7.24 |
Class Z | | 7.22 |
| | |
| Distributions declared per share |
| |
03/01/08 – 02/28/09 ($) | | |
Class A | | 0.16 |
Class R | | 0.13 |
Class Z | | 0.21 |
For the 12-month period that ended February 28, 2009, the fund’s Class A shares returned negative 42.89% without sales charge. The S&P 500 Index returned negative 43.32%.1 The average return of the fund’s peer group, the Lipper Large-Cap Core Funds Classification, was negative 42.66%.2 Stock selection and sector allocation decisions delivered mixed results for the period. Decisions to over or underweight individual securities are made within a quantitative framework that evaluates characteristics that we believe are important to performance, such as quality, valuation and a catalyst for change.
Stocks in economically sensitive sectors hampered returns
The fund’s positions in materials, industrials and consumer staples stocks detracted from performance during the period. Overweights relative to the index in Dow Chemical Co., CF Industries Holdings, Inc., Ryder Systems, Inc. and CSX Corp. resulted in lower returns than the index in these sectors as economic growth contracted and industrial activity slowed. We sold CF Industries and Ryder Systems before the end of the reporting period. Elsewhere in the portfolio, the fund lost ground relative to the index because it had more exposure to ProLogis and UnitedHealth Group, Inc. and no exposure to a leading beer and beverage producer that performed strongly during the period. We sold ProLogis.
Lower exposure in financials helped stem losses
As financial companies led the market downward, sustaining outsized losses for the period, the fund made up some ground by maintaining lower exposure than the index to the sector. We eliminated the fund’s position in Merrill Lynch & Co., Inc. when it was acquired by the adviser’s parent company, Bank of America Corp., and sustained only a modest loss during the period. We also had less exposure than the index to Citigroup, Inc. and General Electric Co., both of which lost significant ground as troubles in the financial industry continued. An overweight in health care aided performance. Mylan, Inc. and Amgen, Inc. generated gains for the fund during a period in which it was a challenge for any stock to gain ground. Biogen Idec, Inc. lost ground, but far less than the health care sector overall.
1 | The Standard & Poor’s (S&P) 500 Index tracks the performance of 500 widely held, large-capitalization US stocks. Indices are not investments, do not incur fees or expenses and are not professionally managed. It is not possible to invest directly in an index. Securities in the fund may not match those in an index. |
2 | Lipper Inc., a widely respected data provider in the industry, calculates an average total return (assuming reinvestment of distributions) for mutual funds with investment objectives similar to those of the fund. Lipper makes no adjustment for the effect of sales loads. |
11
Portfolio Manager’s Report (continued) – Columbia Large Cap Enhanced Core Fund
| | |
| Top 5 sectors | | |
| |
as of 02/28/09 (%) | | |
Information Technology | | 17.4 |
Health Care | | 15.7 |
Energy | | 13.9 |
Consumer Staples | | 13.4 |
Financials | | 9.9 |
| | |
| Top 10 holdings | | |
| |
as of 2/28/09 (%) | | |
Exxon Mobil | | 5.3 |
Procter & Gamble | | 2.7 |
Microsoft | | 2.6 |
Chevron | | 2.2 |
Johnson & Johnson | | 2.0 |
AT&T | | 1.9 |
Pfizer | | 1.8 |
Intel | | 1.8 |
Amgen | | 1.7 |
Cisco Systems | | 1.6 |
Information provided is calculated as a percentage of net assets.
Looking ahead
With consumer spending in decline and job losses on the rise, the outlook for the U.S. economy is cloudy, at best, through the middle of 2009. However, history has shown that during previous economic cycles the stock market has risen well before an economic recovery takes hold. Investors have historically been willing to take on more risk in their portfolios while the economy is still in recession because they anticipate recovery and a more favorable investment environment. And when the stock market turns around, it has historically produced quick and substantial gains. Consider, for example, that even though the economy was still in the throes of major recessions in 1982 and 1991, the Standard & Poor’s 500 Index gained more than 21% and 30%, respectively, for those same years. There’s no guarantee that history will repeat itself. However, it may be easier to ride out volatility if you have a long-term perspective and remain focused on your goals.
Portfolio holdings and characteristics are subject to change periodically and may not be representative of current holdings and characteristics. The outlook for the fund may differ from that presented for other Columbia Funds.
Equity securities are affected by stock market fluctuations that occur in response to economic, business and other developments.
12
Fund Profile – Columbia Mid Cap Index Fund
Performance data quoted represents past performance and current performance may be lower or higher. Past performance is no guarantee of future results. The investment return and principal value will fluctuate so that shares, when redeemed, may be worth more or less than the original cost. Please visit www.columbiafunds.com for daily and most recent month-end performance updates.
Summary
1-year return as of 02/28/09
| | |
| |
| | –42.11% Class A shares |
| |
| | –42.00% S&P MidCap 400 Index |
Morningstar Style Box
Equity Style
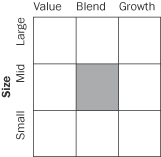
The Morningstar Style Box reveals a fund’s investment strategy. For equity funds the vertical axis shows the market capitalization of the stocks owned and the horizontal axis shows investment style (value, blend or growth). Information shown is based on the most recent data provided by Morningstar.
Summary
| n | | For the 12-month period that ended February 28, 2009, the fund’s Class A shares returned negative 42.11% without sales charge. |
n | | The fund generally tracked its benchmark, the S&P MidCap 400 Index1, after accounting for fees and expenses. In a difficult period for stocks overall, it held up somewhat better than the average fund in its peer group, the Lipper Mid-Cap Core Funds Classification2. |
| n | | The portfolio is constructed to closely approximate the benchmark. |
Portfolio Management
Cheryl D’Hollander has co-managed the fund since February 2009 and has been with the advisor or its predecessors or affiliate organizations since 2003.
Peter S. Joo has co-managed the fund since February 2009 and has been with the advisor or its predecessors or affiliate organizations since 2005.
1 | The Standard & Poor’s (S&P) MidCap 400 Index is a market-value weighted index that tracks the performance of 400 mid-cap US companies. Indices are not investments, do not incur fees or expenses and are not professionally managed. It is not possible to invest directly in an index. Securities in the fund may not match those in an index. |
2 | Lipper Inc., a widely respected data provider in the industry, calculates an average total return (assuming reinvestment of distributions) for mutual funds with investment objectives similar to those of the fund. Lipper makes no adjustment for the effect of sales loads. |
13
Performance Information – Columbia Mid Cap Index Fund
| | |
| Annual operating expense ratio (%)* |
| |
Class A | | 0.47 |
Class Z | | 0.22 |
Annual operating expense ratio
after contractual waivers (%)* |
| |
Class A | | 0.39 |
Class Z | | 0.14 |
| * | The annual operating expense ratio and annual operating expense ratio after contractual waivers are as stated in the fund’s prospectus that is current as of the date of this report. The contractual waiver expires 06/30/09. Differences in expense ratios disclosed elsewhere in this report may result from including fee waivers and expense reimbursements as well as different time periods used in calculating the ratios. |
Performance data quoted represents past performance and current performance may be lower or higher. Past performance is no guarantee of future results. The investment return and principal value will fluctuate so that shares, when redeemed, may be worth more or less than the original cost. Please visit www.columbiafunds.com for daily and most recent month-end performance updates.
| | | | |
| Performance of a $10,000 investment 05/31/00 – 02/28/09 ($) |

The chart above shows the change in value of a hypothetical $10,000 investment in Class A shares of Columbia Mid Cap Index Fund during the stated time period, and does not reflect the deduction of taxes that a shareholder may pay on fund distributions or on the redemption of fund shares. The Standard and Poor’s (S&P) MidCap 400 Index is a market value weighted index that tracks the performance of 400 mid-cap US companies. Indices are not investments, do not incur fees or expenses and are not professionally managed. It is not possible to invest directly in an index. Securities in the fund may not match those in an index.
| | | | |
| Performance of a $10,000 investment since inception – 02/28/09 ($) |
Class A | | | | 10,126 |
Class Z | | | | 9,863 |
| | | | |
| Average annual total return as of 02/28/09 (%) |
| | |
| Share class | | A | | Z |
| Inception | | 05/31/00 | | 03/31/00 |
1-year | | –42.11 | | –41.92 |
5-year | | –4.69 | | –4.45 |
Since inception | | 0.14 | | –0.15 |
| | | | |
| Average annual total return as of 03/31/09 (%) |
| | |
| Share class | | A | | Z |
1-year | | –36.15 | | –35.98 |
5-year | | –3.10 | | –2.84 |
Since inception | | 1.13 | | 0.82 |
Performance results reflect any fee waivers or reimbursements of fund expenses by the investment advisor and/or any of its affiliates. Absent these fee waivers or expense reimbursement arrangements, performance results would have been lower.
All results shown assume reinvestment of distributions. Class A shares are sold at net asset value. Class Z shares are sold at net asset value with no distribution and service (Rule 12b-1) fees. Class Z shares have limited eligibility and the investment minimum requirements may vary. Please see the fund’s prospectus for details. Performance for different share classes will vary based on differences in sales charges and fees associated with each class.
The tables do not reflect the deduction of taxes that a shareholder may pay on fund distributions or on the redemption of fund shares.
14
Understanding Your Expenses – Columbia Mid Cap Index Fund
As a fund shareholder, you incur two types of costs. There are transaction costs and ongoing costs, which generally include investment advisory fees, distribution and service (Rule 12b-1) fees and other fund expenses. The information on this page is intended to help you understand the ongoing costs of investing in the fund and to compare these costs with the ongoing costs of investing in other mutual funds.
Analyzing your fund’s expenses by share class
To illustrate these ongoing costs, we have provided an example and calculated the expenses paid by investors in each share class during the period. The information in the following table is based on an initial investment of $1,000 which is invested at the beginning of the reporting period and held for the entire period. Expense information is calculated two ways and each method provides you with different information. The amount listed in the “Actual” column is calculated using the fund’s actual operating expenses and total return for the period. The amount listed in the “Hypothetical” column for each share class assumes that the return each year is 5% before expenses and is calculated based on the fund’s actual operating expenses. You should not use the hypothetical account values and expenses to estimate either your actual account balance at the end of the period or the expenses you paid during this reporting period.
Compare with other funds
Since all mutual funds are required to include the same hypothetical calculations about expenses in shareholder reports, you can use this information to compare the ongoing costs of investing in the fund with other funds. To do so, compare the 5% hypothetical example with the 5% hypothetical examples that appear in the shareholder reports of other funds. As you compare hypothetical examples of other funds, it is important to note that hypothetical examples are meant to highlight the ongoing costs of investing in a fund and do not reflect any transaction costs, such as sales charges, redemption fees or exchange fees.
Estimating your actual expenses
To estimate the expenses that you paid over the period, first you will need your account balance at the end of the period:
| | n | | For shareholders who receive their account statements from Columbia Management Services, Inc., your account balance is available online at www.columbiafunds.com or by calling Shareholder Services at 800.345.6611. | |
| | n | | For shareholders who receive their account statements from their brokerage firm, contact your brokerage firm to obtain your account balance. | |
| | 1. | Divide your ending account balance by $1,000. For example, if an account balance was $8,600 at the end of the period, the result would be 8.6. | |
| | 2. | In the section of the table below titled “Expenses paid during the period,” locate the amount for your share class. You will find this number in the column labeled “Actual.” Multiply this number by the result from step 1. Your answer is an estimate of the expenses you paid on your account during the period. | |
If the value of your account falls below the minimum initial investment requirement applicable to you, your account generally will be subject to a $20 annual fee. This fee is not included in the accompanying table. If you are subject to the fee, keep it in mind when you are estimating the ongoing expenses of investing in the fund and when comparing the expenses of this fund with other funds.
| | | | | | | | | | | | | | |
| 09/01/08 – 02/28/09 |
| | | | |
| | | Account value at the
beginning of the period ($) | | Account value at the
end of the period ($) | | Expenses paid
during the period ($) | | Fund’s annualized
expense ratio (%) |
| | | Actual | | Hypothetical | | Actual | | Hypothetical | | Actual | | Hypothetical | | Actual |
Class A | | 1,000.00 | | 1,000.00 | | 556.18 | | 1,022.86 | | 1.50 | | 1.96 | | 0.39 |
Class Z | | 1,000.00 | | 1,000.00 | | 557.22 | | 1,024.10 | | 0.54 | | 0.70 | | 0.14 |
Expenses paid during the period are equal to the annualized expense ratio for the share class, multiplied by the average account value over the period, then multiplied by the number of days in the fund’s most recent fiscal half-year and divided by 365.
Had the investment advisor not waived fees or reimbursed a portion of expenses, account value at the end of the period would have been reduced.
It is important to note that the expense amounts shown in the table are meant to highlight only ongoing costs of investing in the fund. Therefore, the hypothetical examples provided may not help you determine the relative total costs of owning shares of different funds. If these transaction costs were included, your costs would have been higher.
15
Portfolio Manager’s Report – Columbia Mid Cap Index Fund
Performance data quoted represents past performance and current performance may be lower or higher. Past performance is no guarantee of future results. The investment return and principal value will fluctuate so that shares, when redeemed, may be worth more or less than the original cost. Please visit www.columbiafunds.com for daily and most recent month-end performance updates.
| | |
| Net asset value per share |
| |
as of 02/28/09 ($) | | |
Class A | | 5.73 |
Class Z | | 5.71 |
| | |
| Distribution declared per share |
| |
03/01/08 – 02/28/09 ($) | | |
Class A | | 0.70 |
Class Z | | 0.73 |
| | |
| Top 5 sectors |
| |
as of 02/28/09 (%) | | |
Financials | | 17.3 |
Consumer Discretionary | | 15.8 |
Industrials | | 13.8 |
Information Technology | | 13.7 |
Health Care | | 12.5 |
Sector Breakdown is calculated as a percentage of total investments excluding short-term investments and securities lending collateral, if any.
For the 12-month period that ended February 28, 2009, the fund’s Class A shares returned negative 42.11% without sales charge. The fund’s benchmark, the S&P MidCap 400 Index, returned negative 42.00%.1 The average return of the fund’s peer group, the Lipper Mid-Cap Core Funds Classification, was negative 43.67%.2 The fund seeks to approximate the benchmark weights of securities, industries and sectors represented in the S&P MidCap 400 Index. As such, its return was in line with the return of the index, after fees and expenses, which the index does not incur. In a period of sharply declining stock prices, it held up somewhat better than the average fund in its peer group.
A disappointing period for stocks
Over the past year, there were few winners in the stock market, as slower economic growth, a weak housing market, job losses and a deepening financial crisis weighed on investors. On a relative basis, classic “defensive” sectors, including utilities, consumer staples, health care and technology, held up better than the rest of the sectors in the index. However, they, experienced declines of 25% or more. The best-performing stocks for the 12-month period were education-related consumer discretionary stocks: Corinthian Colleges, Inc., ITT Educational Services, Inc. and Career Education Corp. generated outstanding gains as a weak job market beckoned workers to upgrade their skills. Dollar Tree, Inc., a discount store chain, resonated with budget-constrained consumers. In the health care sector, Millennium Pharmaceuticals and Vertex Pharmaceuticals, Inc. rose significantly.
These standout performers were the exception for the period. A general market plunge was led by energy stocks, which declined 62% as the price of oil and natural gas declined from all-time highs. Industrials and financials declined 45% for the period, as a weak economy and deepening credit crisis weighed on investors. However, consumer discretionary stocks claimed the worst performers for the period. ArvinMeritor, Inc., an automotive supply company, declined significantly on news of weak auto sales. Lear Corp., Borders Group, Inc., Modine Manufacturing Co. and Belo Corp. also suffered sharp declines. At the end of the period, only Belo remained in the portfolio, as others were removed from the Index.
1 | The Standard & Poor’s (S&P) MidCap 400 Index is a market-value weighted index that tracks the performance of 400 mid-cap US companies. Indices are not investments, do not incur fees or expenses and are not professionally managed. It is not possible to invest directly in an index. Securities in the fund may not match those in an index. |
2 | Lipper Inc., a widely respected data provider in the industry, calculates an average total return (assuming reinvestment of distributions) for mutual funds with investment objectives similar to those of the fund. Lipper makes no adjustment for the effect of sales loads. |
16
Portfolio Manager’s Report (continued) – Columbia Mid Cap Index Fund
| | |
| Top 10 holdings |
| |
as of 2/28/09 (%) | | |
Vertex Pharmaceuticals | | 0.8 |
O’Reilly Automotive | | 0.8 |
Everest Reinsurance Group | | 0.7 |
SAIC | | 0.7 |
Ross Stores | | 0.7 |
Roper Industries | | 0.6 |
Advance Auto Parts | | 0.6 |
ITT Educational Services | | 0.6 |
Dollar Tree | | 0.6 |
Fidelity National Financial | | 0.6 |
Information provided is calculated as a percentage of net assets.
Looking ahead
With consumer spending in decline and job losses on the rise, the outlook for the U.S. economy is cloudy, at best, through the middle of 2009. However, history has shown that during previous economic cycles the stock market has risen well before an economic recovery takes hold. Investors have historically been willing to take on more risk in their portfolios while the economy is still in recession because they anticipate recovery and a more favorable investment environment. There’s no guarantee that history will repeat itself. However, it may be easier to ride out volatility if you have a long-term perspective and remain focused on your goals.
Portfolio holdings and characteristics are subject to change periodically and may not be representative of current holdings and characteristics. The outlook for the fund may differ from that presented for other Columbia Funds.
Equity investments are affected by stock market fluctuations that occur in response to economic, business and other developments.
Stocks of mid-cap companies pose special risks, including possible illiquidity and greater price volatility than stocks of larger, more established companies.
17
Fund Profile – Columbia Small Cap Index Fund
Performance data quoted represents past performance and current performance may be lower or higher. Past performance is no guarantee of future results. The investment return and principal value will fluctuate so that shares, when redeemed, may be worth more or less than the original cost. Please visit www.columbiafunds.com for daily and most recent month-end performance updates.
Summary
1-year return as of 02/28/09
| | |
| |
| | –42.43% Class A shares |
| |
| | –42.54% S&P SmallCap 600 Index |
Morningstar Style Box
Equity Style

The Morningstar Style Box reveals a fund’s investment strategy. For equity funds the vertical axis shows the market capitalization of the stocks owned and the horizontal axis shows investment style (value, blend or growth). Information shown is based on the most recent data provided by Morningstar.
Summary
| n | | For the 12-month period that ended February 28, 2009, the fund’s Class A shares returned negative 42.43% without sales charge. |
n | | In a period of sharply declining stock prices, the fund generally tracked its benchmark, the S&P SmallCap 600 Index 1, and held up slightly better than the average fund in its peer group, the Lipper Small-Cap Core Funds Classification2. |
| n | | The portfolio is constructed to closely approximate the benchmark. |
Portfolio Management
Cheryl D’Hollander has co-managed the fund since February 2009 and has been with the advisor or its predecessors or affiliate organizations since 2003.
Peter S. Joo has co-managed the fund since February 2009 and has been with the advisor or its predecessors or affiliate organizations since 2005.
1 | The Standard & Poor’s (S&P) SmallCap 600 Index tracks the performance of 600 domestic companies traded on the New York Stock Exchange, the NYSE Amex and the NASDAQ. The S&P SmallCap 600 Index is heavily weighted with the stocks of companies with small market capitalizations. Indices are not investments, do not incur fees or expenses and are not professionally managed. It is not possible to invest directly in an index. Securities in the fund may not match those in an index. |
2 | Lipper Inc., a widely respected data provider in the industry, calculates an average total return (assuming reinvestment of distributions) for mutual funds with investment objectives similar to those of the fund. Lipper makes no adjustment for the effect of sales loads. |
18
Performance Information – Columbia Small Cap Index Fund
| | |
| Annual operating expense ratio (%)* |
| |
Class A | | 0.45 |
Class Z | | 0.20 |
| * | The annual operating expense ratio is as stated in the fund’s prospectus that is current as of the date of this report. Differences in expense ratios disclosed elsewhere in this report may result from including fee waivers and expense reimbursements as well as different time periods used in calculating the ratios. |
Performance data quoted represents past performance and current performance may be lower or higher. Past performance is no guarantee of future results. The investment return and principal value will fluctuate so that shares, when redeemed, may be worth more or less than the original cost. Please visit www.columbiafunds.com for daily and most recent month-end performance updates.
| | |
| Performance of a $10,000 investment 03/01/99 – 02/28/09 ($) |
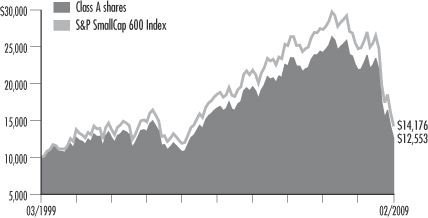
The chart above shows the change in value of a hypothetical $10,000 investment in Class A shares of Columbia Small Cap Index Fund during the stated time period, and does not reflect the deduction of taxes that a shareholder may pay on fund distributions or on the redemption of fund shares. The Standard and Poor’s (S&P) SmallCap 600 Index tracks the performance of 600 domestic companies traded on the New York Stock Exchange, the NYSE Amex and the NASDAQ. The S&P SmallCap 600 Index is heavily weighted with stocks of companies with small market capitalizations. Indices are not investments, do not incur fees or expenses and are not professionally managed. It is not possible to invest directly in an index. Securities in the fund may not match those in an index.
| | |
| Performance of a $10,000 investment 03/01/99 – 02/28/09 ($) |
Class A | | 12,553 |
Class Z | | 12,883 |
| | | | |
| Average annual total return as of 02/28/09 (%) |
| | |
| Share class | | A | | Z |
| Inception | | 10/15/96 | | 10/15/96 |
1-year | | –42.43 | | –42.28 |
5-year | | –5.50 | | –5.25 |
10-year | | 2.30 | | 2.57 |
| | | | |
| Average annual total return as of 03/31/09 (%) |
| | |
| Share class | | A | | Z |
1-year | | –37.98 | | –37.83 |
5-year | | –4.24 | | –4.00 |
10-year | | 3.11 | | 3.38 |
Performance results reflect any fee waivers or reimbursements of fund expenses by the investment advisor and/or any of its affiliates. Absent these fee waivers or expense reimbursement arrangements, performance results would have been lower.
All results shown assume reinvestment of distributions. Class A shares are sold at net asset value. Class Z shares are sold at net asset value with no distribution and service (Rule 12b-1) fees. Class Z shares have limited eligibility and the investment minimum requirements may vary. Please see the fund’s prospectus for details. Performance for different share classes will vary based on differences in sales charges and fees associated with each class.
The tables do not reflect the deduction of taxes that a shareholder may pay on fund distributions or on the redemption of fund shares.
19
Understanding Your Expenses – Columbia Small Cap Index Fund
Estimating your actual expenses
To estimate the expenses that you paid over the period, first you will need your account balance at the end of the period:
| | n | | For shareholders who receive their account statements from Columbia Management Services, Inc., your account balance is available online at www.columbiafunds.com or by calling Shareholder Services at 800.345.6611. | |
| | n | | For shareholders who receive their account statements from their brokerage firm, contact your brokerage firm to obtain your account balance. | |
| | 1. | Divide your ending account balance by $1,000. For example, if an account balance was $8,600 at the end of the period, the result would be 8.6. | |
| | 2. | In the section of the table below titled “Expenses paid during the period,” locate the amount for your share class, You will find this number in the column labeled “Actual”. Multiply this number by the result from step 1. Your answer is an estimate of the expenses you paid on your account during the period. | |
If the value of your account falls below the minimum initial investment requirement applicable to you, your account generally will be subject to a $20 annual fee. This fee is not included in the accompanying table. If you are subject to the fee, keep it in mind when you are estimating the ongoing expenses of investing in the fund and when comparing the expenses of this fund with other funds.
As a fund shareholder, you incur two types of costs. There are transaction costs and ongoing costs, which generally include investment advisory fees, distribution and service (Rule 12b-1) fees and other fund expenses. The information on this page is intended to help you understand the ongoing costs of investing in the fund and to compare these costs with the ongoing costs of investing in other mutual funds.
Analyzing your fund’s expenses by share class
To illustrate these ongoing costs, we have provided an example and calculated the expenses paid by investors in each share class during the period. The information in the following table is based on an initial investment of $1,000, which is invested at the beginning of the reporting period and held for the entire period. Expense information is calculated two ways and each method provides you with different information. The amount listed in the “Actual” column is calculated using the fund’s actual operating expenses and total return for the period. The amount listed in the “Hypothetical” column for each share class assumes that the return each year is 5% before expenses and is calculated based on the fund’s actual operating expenses. You should not use the hypothetical account values and expenses to estimate either your actual account balance at the end of the period or the expenses you paid during this reporting period.
Compare with other funds
Since all mutual funds are required to include the same hypothetical calculations about expenses in shareholder reports, you can use this information to compare the ongoing cost of investing in the fund with other funds. To do so, compare the 5% hypothetical example with the 5% hypothetical examples that appear in the shareholder reports of other funds. As you compare hypothetical examples of other funds, it is important to note that hypothetical examples are meant to highlight the ongoing costs of investing in a fund and do not reflect any transaction costs, such as sales charges, redemption fees or exchange fees.
| | | | | | | | | | | | | | |
| 09/01/08 – 02/28/09 |
| | | | |
| | | Account value at the
beginning of the period ($) | | Account value at the
end of the period ($) | | Expenses paid
during the period ($) | | Fund’s annualized
expense ratio (%) |
| | | Actual | | Hypothetical | | Actual | | Hypothetical | | Actual | | Hypothetical | | Actual |
Class A | | 1,000.00 | | 1,000.00 | | 537.19 | | 1,022.56 | | 1.72 | | 2.26 | | 0.45 |
Class Z | | 1,000.00 | | 1,000.00 | | 537.88 | | 1,023.80 | | 0.76 | | 1.00 | | 0.20 |
Expenses paid during the period are equal to the annualized expense ratio for the share class, multiplied by the average account value over the period, then multiplied by the number of days in the fund’s most recent fiscal half-year and divided by 365.
It is important to note that the expense amounts shown in the table are meant to highlight only ongoing costs of investing in the fund. Therefore, the hypothetical examples provided may not help you determine the relative total costs of owning shares of different funds. If these transaction costs were included, your costs would have been higher.
20
Portfolio Manager’s Report – Columbia Small Cap Index Fund
Performance data quoted represents past performance and current performance may be lower or higher. Past performance is no guarantee of future results. The investment return and principal value will fluctuate so that shares, when redeemed, may be worth more or less than the original cost. Please visit www.columbiafunds.com for daily and most recent month-end performance updates.
| | |
| Net asset value per share |
| |
as of 02/28/09 ($) | | |
Class A | | 8.58 |
Class Z | | 8.60 |
| | |
| Distribution declared per share |
| |
03/01/08 – 02/28/09 ($) | | |
Class A | | 2.04 |
Class Z | | 2.10 |
| | |
| Top 5 sectors |
| |
as of 02/28/09 (%) | | |
Financials | | 18.4 |
Industrials | | 18.2 |
Information Technology | | 17.9 |
Health Care | | 13.7 |
Consumer Discretionary | | 13.3 |
Sector Breakdown is calculated as a percentage of total investments excluding short-term investments and securities lending collateral, if any.
For the 12-month period that ended February 28, 2009, the fund’s Class A shares returned negative 42.43% without sales charge. The S&P SmallCap 600 Index returned negative 42.54%.1 The average return of the Lipper Small-Cap Core Funds Classification was negative 43.59%.2 The fund seeks to approximate the benchmark weights of securities, industries and sectors represented in the S&P SmallCap 600 Index. As such, its return was in line with the return of the index, after fees and expenses, which the index does not incur.
A disappointing period for stocks
Over the past year, there were few winners in the stock market, as slower economic growth, a weak housing market, job losses and a deepening financial crisis weighed on investors. On a relative basis, the classic “defensive” sectors, including utilities and consumer staples, held up better than the rest of the sectors in the index. Utilities stocks lost 6% and consumer staples were down 16% overall. Despite sharply falling energy prices, certain energy stocks were among the fund’s strong positive performers for the period. Massey Energy Co., a coal company, rose significantly and Patriot Coal Corp. gained significantly. In addition, Hot Topic, Inc., a trendy music and pop culture retailer, bucked the downward trend in the consumer discretionary sector, gaining significantly. Central Garden & Pet Co., Applied Signal Technology Inc. and Hilb Rogal & Hobbs, an insurance group that was acquired by a British insurance company and no longer remains in the portfolio, all reported notable gains or more for the period.
These standout performers were the exception for the period. A plunge in stock prices was led by materials and energy stocks, which lost 60%; telecommunication services, which declined 55% and financials, which were down 45%. However, the stocks that were hit hardest during the period were Crocs, Inc., Tween Brands, Inc. and Champion Enterprises, Inc. in the consumer discretionary sector. BankAtlantic Bancorp, Inc., Anchor BanCorp Wisconsin, Inc. and Guaranty Financial Group, Inc. in the financials sector each lost significant value for the period. BankAtlantic Bancorp is no longer in the portfolio because it is no longer in the index.
1 | The Standard and Poor’s (S&P) SmallCap 600 Index tracks the performance of 600 domestic companies traded on the New York Stock Exchange, the NYSE Amex and NASDAQ. The S&P SmallCap 600 is heavily weighted with the stocks of companies with small market capitalizations. Indices are not investments, do not incur fees or expenses and are not professionally managed. It is not possible to invest directly in an index. Securities in the fund may not match those in an index. |
2 | Lipper Inc., a widely respected data provider in the industry, calculates an average total return (assuming reinvestment of distributions) for mutual funds with investment objectives similar to those of the fund. Lipper makes no adjustment for the effect of sales loads. |
21
Portfolio Manager’s Report (continued) –Columbia Small Cap Index Fund
| | |
| Top 10 holdings |
| |
as of 2/28/09 (%) | | |
Watson Wyatt Worldwide | | 0.8 |
Atmos Energy | | 0.8 |
Piedmont Natural Gas | | 0.7 |
ProAssurance | | 0.6 |
Itron | | 0.6 |
New Jersey Resources | | 0.6 |
Senior Housing Properties Trust | | 0.6 |
Owens & Minor | | 0.6 |
Mednax | | 0.5 |
Haemonetics | | 0.5 |
Information provided is calculated as a percentage of net assets.
Looking ahead
With consumer spending in decline and job losses on the rise, the outlook for the U.S. economy is cloudy, at best, through the middle of 2009. However, history has shown that during previous economic cycles the stock market has risen well before an economic recovery takes hold. Investors have historically been willing to take on more risk in their portfolios while the economy is still in recession because they anticipate recovery and a more favorable investment environment. There’s no guarantee that history will repeat itself. However, it may be easier to ride out volatility if you have a long-term perspective and remain focused on your goals.
Portfolio holdings and characteristics are subject to change periodically and may not be representative of current holdings and characteristics. The outlook for the fund may differ from that presented for other Columbia Funds.
Equity investments are affected by stock market fluctuations that occur in response to economic, business and other developments.
Investments in small-cap stocks may be subject to greater volatility and price fluctuations because they may be thinly traded and less liquid than investments in larger companies.
22
Investment Portfolio – Columbia Large Cap Index Fund
February 28, 2009
Common Stocks – 96.0%
| | | | |
| | | Shares | | Value ($) |
| Consumer Discretionary – 8.1% | | | | |
Auto Components – 0.1% |
Goodyear Tire & Rubber Co. (a) | | 52,930 | | 235,009 |
Johnson Controls, Inc. | | 130,460 | | 1,484,635 |
| | | | |
Auto Components Total | | | | 1,719,644 |
| | |
Automobiles – 0.1% | | | | |
Ford Motor Co. (a) | | 524,425 | | 1,048,850 |
General Motors Corp. | | 134,020 | | 301,545 |
Harley-Davidson, Inc. | | 51,085 | | 515,959 |
| | | | |
Automobiles Total | | | | 1,866,354 |
| | |
Distributors – 0.1% | | | | |
Genuine Parts Co. | | 35,005 | | 985,041 |
| | | | |
Distributors Total | | | | 985,041 |
|
Diversified Consumer Services – 0.2% |
Apollo Group, Inc., Class A (a) | | 23,340 | | 1,692,150 |
H&R Block, Inc. | | 74,380 | | 1,420,658 |
| | | | |
Diversified Consumer Services Total | | 3,112,808 |
|
Hotels, Restaurants & Leisure – 1.5% |
Carnival Corp. | | 95,890 | | 1,875,608 |
Darden Restaurants, Inc. | | 30,450 | | 826,413 |
International Game Technology, Inc. | | 64,670 | | 570,389 |
Marriott International, Inc., Class A | | 64,340 | | 911,054 |
McDonald’s Corp. | | 244,690 | | 12,785,053 |
Starbucks Corp. (a) | | 161,460 | | 1,477,359 |
Starwood Hotels & Resorts Worldwide, Inc. | | 40,225 | | 466,208 |
Wyndham Worldwide Corp. | | 38,900 | | 143,541 |
Wynn Resorts Ltd. (a) | | 13,500 | | 282,825 |
Yum! Brands, Inc. | | 101,550 | | 2,668,734 |
| | | | |
Hotels, Restaurants & Leisure Total | | 22,007,184 |
|
Household Durables – 0.3% |
Black & Decker Corp. | | 13,225 | | 313,036 |
Centex Corp. | | 27,285 | | 169,440 |
D.R. Horton, Inc. | | 60,520 | | 511,394 |
Fortune Brands, Inc. | | 32,925 | | 781,969 |
Harman International Industries, Inc. | | 12,900 | | 136,998 |
KB Home | | 16,490 | | 146,761 |
Leggett & Platt, Inc. | | 34,270 | | 391,706 |
Lennar Corp., Class A | | 31,000 | | 207,080 |
Newell Rubbermaid, Inc. | | 60,860 | | 343,859 |
Pulte Homes, Inc. | | 46,890 | | 430,450 |
Snap-On, Inc. | | 12,560 | | 296,290 |
Stanley Works | | 17,250 | | 461,610 |
Whirlpool Corp. | | 16,169 | | 359,437 |
| | | | |
Household Durables Total | | | | 4,550,030 |
| | | | |
| | | Shares | | Value ($) |
Internet & Catalog Retail – 0.4% |
Amazon.com, Inc. (a) | | 70,600 | | 4,574,174 |
Expedia, Inc. (a) | | 46,000 | | 366,620 |
| | | | |
Internet & Catalog Retail Total | | | | 4,940,794 |
|
Leisure Equipment & Products – 0.1% |
Eastman Kodak Co. | | 58,950 | | 188,051 |
Hasbro, Inc. | | 27,215 | | 622,951 |
Mattel, Inc. | | 78,720 | | 932,045 |
| | | | |
Leisure Equipment & Products Total | | 1,743,047 |
|
Media – 2.3% |
CBS Corp., Class B | | 149,225 | | 637,191 |
Comcast Corp., Class A | | 632,209 | | 8,256,650 |
DIRECTV Group, Inc. (a) | | 119,900 | | 2,390,806 |
Gannett Co., Inc. | | 50,030 | | 162,097 |
Interpublic Group of Companies, Inc. (a) | | 104,654 | | 398,732 |
McGraw-Hill Companies, Inc. | | 69,050 | | 1,362,356 |
Meredith Corp. | | 7,970 | | 102,415 |
New York Times Co., Class A | | 25,550 | | 105,521 |
News Corp., Class A | | 504,840 | | 2,806,910 |
Omnicom Group, Inc. | | 68,210 | | 1,639,086 |
Scripps Networks Interactive Inc., Class A | | 19,800 | | 394,218 |
Time Warner, Inc. | | 787,485 | | 6,008,511 |
Viacom, Inc., Class B (a) | | 134,725 | | 2,073,418 |
Walt Disney Co. | | 406,360 | | 6,814,657 |
Washington Post Co., Class B | | 1,300 | | 468,637 |
| | | | |
Media Total | | | | 33,621,205 |
|
Multiline Retail – 0.7% |
Big Lots, Inc. (a) | | 17,995 | | 279,102 |
Family Dollar Stores, Inc. | | 30,690 | | 842,134 |
J.C. Penney Co., Inc. | | 48,770 | | 747,644 |
Kohl’s Corp. (a) | | 66,905 | | 2,351,042 |
Macy’s, Inc. | | 92,368 | | 726,936 |
Nordstrom, Inc. | | 34,980 | | 471,181 |
Sears Holdings Corp. (a) | | 12,190 | | 448,104 |
Target Corp. | | 165,250 | | 4,678,228 |
| | | | |
Multiline Retail Total | | | | 10,544,371 |
|
Specialty Retail – 1.9% |
Abercrombie & Fitch Co., Class A | | 19,100 | | 420,009 |
AutoNation, Inc. (a) | | 23,725 | | 236,776 |
Autozone, Inc. (a) | | 8,385 | | 1,192,599 |
Bed Bath & Beyond, Inc. (a) | | 57,025 | | 1,214,633 |
Best Buy Co., Inc. | | 74,125 | | 2,136,282 |
GameStop Corp., Class A (a) | | 36,000 | | 969,120 |
Gap, Inc. | | 102,380 | | 1,104,680 |
Home Depot, Inc. | | 372,215 | | 7,775,571 |
Limited Brands, Inc. | | 59,415 | | 456,901 |
See Accompanying Notes to Financial Statements.
23
Columbia Large Cap Index Fund
February 28, 2009
Common Stocks (continued)
| | | | |
| | | Shares | | Value ($) |
| Consumer Discretionary (continued) | | |
Specialty Retail (continued) | | | | |
Lowe’s Companies, Inc. | | 321,790 | | 5,097,154 |
Office Depot, Inc. (a) | | 60,340 | | 63,357 |
RadioShack Corp. | | 27,465 | | 201,318 |
Sherwin-Williams Co. | | 21,535 | | 989,533 |
Staples, Inc. | | 156,562 | | 2,497,164 |
Tiffany & Co. | | 26,975 | | 513,604 |
TJX Companies, Inc. | | 91,405 | | 2,035,589 |
| | | | |
Specialty Retail Total | | | | 26,904,290 |
| |
Textiles, Apparel & Luxury Goods – 0.4% | | |
Coach, Inc. (a) | | 71,740 | | 1,002,925 |
Jones Apparel Group, Inc. | | 18,320 | | 49,281 |
NIKE, Inc., Class B | | 86,130 | | 3,576,979 |
Polo Ralph Lauren Corp. | | 12,400 | | 427,428 |
V.F. Corp. | | 19,305 | | 1,001,929 |
| | | | |
Textiles, Apparel & Luxury Goods Total | | 6,058,542 |
| | | | |
Consumer Discretionary Total | | | | 118,053,310 |
| | | | |
| Consumer Staples – 12.9% | | | | |
Beverages – 2.7% | | | | |
Brown-Forman Corp., Class B | | 21,556 | | 926,477 |
Coca-Cola Co. | | 436,735 | | 17,840,625 |
Coca-Cola Enterprises, Inc. | | 69,610 | | 799,123 |
Constellation Brands, Inc., Class A (a) | | 42,770 | | 558,149 |
Dr Pepper Snapple Group, Inc. (a) | | 55,700 | | 782,585 |
Molson Coors Brewing Co., Class B | | 32,650 | | 1,150,259 |
Pepsi Bottling Group, Inc. | | 29,670 | | 548,895 |
PepsiCo, Inc. | | 340,910 | | 16,411,407 |
| | | | |
Beverages Total | | | | 39,017,520 |
| | |
Food & Staples Retailing – 3.4% | | | | |
Costco Wholesale Corp. | | 94,805 | | 4,014,044 |
CVS Caremark Corp. | | 315,244 | | 8,114,381 |
Kroger Co. | | 143,225 | | 2,960,461 |
Safeway, Inc. | | 94,100 | | 1,740,850 |
SUPERVALU, Inc. | | 46,446 | | 725,022 |
Sysco Corp. | | 131,495 | | 2,827,142 |
Wal-Mart Stores, Inc. | | 490,780 | | 24,166,007 |
Walgreen Co. | | 217,250 | | 5,183,585 |
Whole Foods Market, Inc. | | 30,800 | | 374,220 |
| | | | |
Food & Staples Retailing Total | | | | 50,105,712 |
| | |
Food Products – 1.9% | | | | |
Archer-Daniels-Midland Co. | | 140,780 | | 3,753,195 |
Campbell Soup Co. | | 45,130 | | 1,208,130 |
ConAgra Foods, Inc. | | 98,100 | | 1,479,348 |
Dean Foods Co. (a) | | 33,800 | | 691,210 |
| | | | |
| | | Shares | | Value ($) |
General Mills, Inc. | | 73,300 | | 3,846,784 |
H.J. Heinz Co. | | 69,035 | | 2,255,373 |
Hershey Co. | | 36,375 | | 1,225,474 |
J.M. Smucker Co. | | 26,047 | | 966,865 |
Kellogg Co. | | 55,260 | | 2,150,719 |
Kraft Foods, Inc., Class A | | 322,500 | | 7,346,550 |
McCormick & Co., Inc. Non-Voting Shares | | 28,585 | | 896,140 |
Sara Lee Corp. | | 155,160 | | 1,196,283 |
Tyson Foods, Inc., Class A | | 66,300 | | 558,909 |
| | | | |
Food Products Total | | | | 27,574,980 |
| | |
Household Products – 3.0% | | | | |
Clorox Co. | | 30,450 | | 1,479,870 |
Colgate-Palmolive Co. | | 110,815 | | 6,668,846 |
Kimberly-Clark Corp. | | 90,870 | | 4,280,886 |
Procter & Gamble Co. | | 655,402 | | 31,570,714 |
| | | | |
Household Products Total | | | | 44,000,316 |
| | |
Personal Products – 0.2% | | | | |
Avon Products, Inc. | | 93,605 | | 1,646,512 |
Estee Lauder Companies, Inc., Class A | | 25,400 | | 575,310 |
| | | | |
Personal Products Total | | | | 2,221,822 |
| | |
Tobacco – 1.7% | | | | |
Altria Group, Inc. | | 452,315 | | 6,983,744 |
Lorillard, Inc. | | 36,900 | | 2,156,436 |
Philip Morris International, Inc. | | 444,115 | | 14,864,529 |
Reynolds American, Inc. | | 37,140 | | 1,247,161 |
| | | | |
Tobacco Total | | | | 25,251,870 |
| | | | |
Consumer Staples Total | | | | 188,172,220 |
| | | | |
| Energy – 13.3% | | | | |
Energy Equipment & Services – 1.7% | | |
Baker Hughes, Inc. | | 67,470 | | 1,977,546 |
BJ Services Co. | | 64,080 | | 619,654 |
Cameron International Corp. (a) | | 48,200 | | 929,296 |
Diamond Offshore Drilling, Inc. | | 15,300 | | 958,392 |
ENSCO International, Inc. | | 31,100 | | 764,438 |
Halliburton Co. | | 196,170 | | 3,199,533 |
Nabors Industries Ltd. (a) | | 62,450 | | 606,389 |
National-Oilwell Varco, Inc. (a) | | 91,560 | | 2,447,399 |
Noble Corp. | | 57,920 | | 1,424,253 |
Rowan Companies, Inc. | | 24,805 | | 300,388 |
Schlumberger Ltd. | | 262,550 | | 9,992,653 |
Smith International, Inc. | | 48,000 | | 1,031,040 |
| | | | |
Energy Equipment & Services Total | | 24,250,981 |
See Accompanying Notes to Financial Statements.
24
Columbia Large Cap Index Fund
February 28, 2009
Common Stocks (continued)
| | | | |
| | | Shares | | Value ($) |
| Energy (continued) | | |
Oil, Gas & Consumable Fuels – 11.6% |
Anadarko Petroleum Corp. | | 100,780 | | 3,522,261 |
Apache Corp. | | 73,441 | | 4,339,629 |
Cabot Oil & Gas Corp. | | 22,700 | | 462,399 |
Chesapeake Energy Corp. | | 118,700 | | 1,856,468 |
Chevron Corp. | | 446,011 | | 27,077,328 |
ConocoPhillips | | 327,267 | | 12,223,422 |
CONSOL Energy, Inc. | | 39,800 | | 1,084,550 |
Devon Energy Corp. | | 96,980 | | 4,235,116 |
El Paso Corp. | | 153,960 | | 1,039,230 |
EOG Resources, Inc. | | 54,790 | | 2,741,692 |
Exxon Mobil Corp. (b) | | 1,116,570 | | 75,815,103 |
Hess Corp. | | 62,320 | | 3,408,281 |
Marathon Oil Corp. | | 154,882 | | 3,604,104 |
Massey Energy Co. | | 18,700 | | 215,985 |
Murphy Oil Corp. | | 41,800 | | 1,747,658 |
Noble Energy, Inc. | | 37,900 | | 1,725,966 |
Occidental Petroleum Corp. | | 177,810 | | 9,223,005 |
Peabody Energy Corp. | | 58,500 | | 1,384,695 |
Pioneer Natural Resources Co. | | 25,800 | | 376,422 |
Range Resources Corp. | | 34,100 | | 1,212,937 |
Southwestern Energy Co. (a) | | 75,400 | | 2,169,258 |
Spectra Energy Corp. | | 134,143 | | 1,743,859 |
Sunoco, Inc. | | 25,700 | | 859,665 |
Tesoro Corp. | | 30,400 | | 448,704 |
Valero Energy Corp. | | 113,260 | | 2,194,979 |
Williams Companies, Inc. | | 127,035 | | 1,435,495 |
XTO Energy, Inc. | | 126,593 | | 4,007,934 |
| | | | |
Oil, Gas & Consumable Fuels Total | | 170,156,145 |
| | | | |
Energy Total | | | | 194,407,126 |
| | | | |
| Financials – 9.4% | | | | |
Capital Markets – 2.2% | | | | |
American Capital Ltd. | | 45,400 | | 61,290 |
Ameriprise Financial, Inc. | | 47,545 | | 757,867 |
Bank of New York Mellon Corp. | | 251,890 | | 5,584,401 |
Charles Schwab Corp. | | 205,355 | | 2,610,062 |
E*TRADE Financial Corp. (a) | | 123,550 | | 98,840 |
Federated Investors, Inc., Class B | | 19,490 | | 367,581 |
Franklin Resources, Inc. | | 33,170 | | 1,519,186 |
Goldman Sachs Group, Inc. | | 97,075 | | 8,841,591 |
Invesco Ltd. | | 84,500 | | 965,835 |
Janus Capital Group, Inc. | | 34,650 | | 152,807 |
Legg Mason, Inc. | | 31,200 | | 400,296 |
Morgan Stanley | | 233,135 | | 4,555,458 |
Northern Trust Corp. | | 48,935 | | 2,718,339 |
State Street Corp. | | 94,870 | | 2,397,365 |
T. Rowe Price Group, Inc. | | 56,740 | | 1,290,268 |
| | | | |
Capital Markets Total | | | | 32,321,186 |
| | | | |
| | | Shares | | Value ($) |
Commercial Banks – 1.8% | | | | |
BB&T Corp. | | 121,305 | | 1,956,650 |
Comerica, Inc. | | 33,065 | | 496,306 |
Fifth Third Bancorp | | 126,775 | | 267,495 |
First Horizon National Corp. | | 45,054 | | 413,145 |
Huntington Bancshares, Inc. | | 80,390 | | 117,369 |
KeyCorp | | 108,645 | | 761,601 |
M&T Bank Corp. | | 16,930 | | 619,638 |
Marshall & Ilsley Corp. | | 57,184 | | 261,903 |
PNC Financial Services Group, Inc. | | 93,982 | | 2,569,468 |
Regions Financial Corp. | | 151,905 | | 519,515 |
SunTrust Banks, Inc. | | 77,770 | | 935,573 |
U.S. Bancorp | | 385,150 | | 5,511,497 |
Wells Fargo & Co. | | 926,409 | | 11,209,549 |
Zions Bancorporation | | 25,340 | | 237,436 |
| | | | |
Commercial Banks Total | | | | 25,877,145 |
| | |
Consumer Finance – 0.4% | | | | |
American Express Co. | | 254,625 | | 3,070,778 |
Capital One Financial Corp. | | 86,005 | | 1,036,360 |
Discover Financial Services | | 105,317 | | 603,466 |
SLM Corp. (a) | | 102,610 | | 472,006 |
| | | | |
Consumer Finance Total | | | | 5,182,610 |
| |
Diversified Financial Services – 2.2% | | |
Bank of America Corp. (c) | | 1,403,613 | | 5,544,271 |
CIT Group, Inc. | | 62,660 | | 153,517 |
Citigroup, Inc. | | 1,196,285 | | 1,794,428 |
CME Group, Inc. | | 14,700 | | 2,681,280 |
IntercontinentalExchange, Inc. (a) | | 15,900 | | 902,643 |
JPMorgan Chase & Co. | | 819,358 | | 18,722,330 |
Leucadia National Corp. (a) | | 38,900 | | 569,107 |
Moody’s Corp. | | 42,610 | | 764,850 |
NASDAQ OMX Group, Inc. (a) | | 29,900 | | 624,910 |
NYSE Euronext | | 58,200 | | 982,416 |
| | | | |
Diversified Financial Services Total | | 32,739,752 |
| | |
Insurance – 1.9% | | | | |
AFLAC, Inc. | | 102,360 | | 1,715,554 |
Allstate Corp. | | 117,675 | | 1,980,470 |
American International Group, Inc. | | 590,215 | | 247,890 |
Aon Corp. | | 59,230 | | 2,264,955 |
Assurant, Inc. | | 25,800 | | 526,320 |
Chubb Corp. | | 78,090 | | 3,048,634 |
Cincinnati Financial Corp. | | 35,622 | | 731,676 |
Genworth Financial, Inc., Class A | | 95,100 | | 115,071 |
Hartford Financial Services Group, Inc. | | 71,350 | | 435,235 |
See Accompanying Notes to Financial Statements.
25
Columbia Large Cap Index Fund
February 28, 2009
Common Stocks (continued)
| | | | |
| | | Shares | | Value ($) |
| Financials (continued) | | |
Insurance (continued) | | | | |
Lincoln National Corp. | | 56,172 | | 482,517 |
Loews Corp. | | 79,495 | | 1,577,976 |
Marsh & McLennan Companies, Inc. | | 112,865 | | 2,023,669 |
MBIA, Inc. (a) | | 41,335 | | 113,258 |
MetLife, Inc. | | 174,250 | | 3,216,655 |
Principal Financial Group, Inc. | | 56,950 | | 455,031 |
Progressive Corp. (a) | | 148,340 | | 1,716,294 |
Prudential Financial, Inc. | | 93,075 | | 1,527,361 |
Torchmark Corp. | | 18,630 | | 383,778 |
Travelers Companies, Inc. | | 128,356 | | 4,640,069 |
Unum Group | | 72,725 | | 740,340 |
XL Capital Ltd., Class A | | 72,650 | | 240,472 |
| | | | |
Insurance Total | | | | 28,183,225 |
|
Real Estate Investment Trusts (REITs) – 0.7% |
Apartment Investment & Management Co., Class A | | 28,935 | | 151,041 |
AvalonBay Communities, Inc. | | 17,434 | | 739,560 |
Boston Properties, Inc. | | 26,500 | | 982,885 |
Developers Diversified Realty Corp. | | 26,400 | | 77,880 |
Equity Residential Property Trust | | 59,760 | | 1,051,776 |
HCP, Inc. | | 55,500 | | 1,013,985 |
Health Care REIT, Inc. | | 22,700 | | 698,479 |
Host Hotels & Resorts, Inc. | | 114,700 | | 424,390 |
Kimco Realty Corp. | | 50,300 | | 445,155 |
Plum Creek Timber Co., Inc. | | 36,570 | | 959,231 |
ProLogis | | 58,295 | | 337,528 |
Public Storage, Inc. | | 27,500 | | 1,525,700 |
Simon Property Group, Inc. | | 49,525 | | 1,639,277 |
Vornado Realty Trust | | 30,200 | | 988,446 |
| | | | |
Real Estate Investment Trusts (REITs) Total | | 11,035,333 |
|
Real Estate Management & Development – 0.0% |
CB Richard Ellis Group, Inc., Class A (a) | | 49,000 | | 141,610 |
| | | | |
Real Estate Management & Development Total | | 141,610 |
|
Thrifts & Mortgage Finance – 0.2% |
Hudson City Bancorp, Inc. | | 114,400 | | 1,186,328 |
People’s United Financial, Inc. | | 76,300 | | 1,328,383 |
| | | | |
Thrifts & Mortgage Finance Total | | | | 2,514,711 |
| | | | |
Financials Total | | | | 137,995,572 |
| | | | |
| | | | |
| | | Shares | | Value ($) |
| Health Care – 15.0% | | | | |
Biotechnology – 2.2% | | | | |
Amgen, Inc. (a) | | 232,577 | | 11,379,993 |
Biogen Idec, Inc. (a) | | 64,022 | | 2,947,573 |
Celgene Corp. (a) | | 100,600 | | 4,499,838 |
Cephalon, Inc. (a) | | 15,000 | | 983,850 |
Genzyme Corp. (a) | | 59,380 | | 3,618,023 |
Gilead Sciences, Inc. (a) | | 201,980 | | 9,048,704 |
|
Biotechnology Total | | | | 32,477,981 |
|
Health Care Equipment & Supplies – 2.4% |
Baxter International, Inc. | | 136,155 | | 6,931,651 |
Becton, Dickinson & Co. | | 53,380 | | 3,303,688 |
Boston Scientific Corp. (a) | | 329,587 | | 2,313,701 |
C.R. Bard, Inc. | | 21,755 | | 1,746,056 |
Covidien Ltd. | | 110,576 | | 3,501,942 |
DENTSPLY International, Inc. | | 32,700 | | 756,024 |
Hospira, Inc. (a) | | 35,032 | | 812,742 |
Intuitive Surgical, Inc. (a) | | 8,600 | | 782,256 |
Medtronic, Inc. | | 245,430 | | 7,262,274 |
St. Jude Medical, Inc. (a) | | 75,550 | | 2,505,238 |
Stryker Corp. | | 53,200 | | 1,791,244 |
Varian Medical Systems, Inc. (a) | | 27,300 | | 832,923 |
Zimmer Holdings, Inc. (a) | | 49,305 | | 1,726,661 |
|
Health Care Equipment & Supplies Total | | 34,266,400 |
| |
Health Care Providers & Services – 2.2% | | |
Aetna, Inc. | | 101,200 | | 2,415,644 |
AmerisourceBergen Corp. | | 34,260 | | 1,088,098 |
Cardinal Health, Inc. | | 78,960 | | 2,562,252 |
CIGNA Corp. | | 60,305 | | 950,407 |
Coventry Health Care, Inc. (a) | | 32,750 | | 377,280 |
DaVita, Inc. (a) | | 22,800 | | 1,069,776 |
Express Scripts, Inc. (a) | | 54,300 | | 2,731,290 |
Humana, Inc. (a) | | 37,040 | | 876,737 |
Laboratory Corp. of America Holdings (a) | | 23,710 | | 1,304,287 |
McKesson Corp. | | 60,600 | | 2,485,812 |
Medco Health Solutions, Inc. (a) | | 109,342 | | 4,437,098 |
Patterson Companies, Inc. (a) | | 20,000 | | 361,400 |
Quest Diagnostics, Inc. | | 34,830 | | 1,596,259 |
Tenet Healthcare Corp. (a) | | 91,092 | | 101,112 |
UnitedHealth Group, Inc. | | 265,140 | | 5,210,001 |
WellPoint, Inc. (a) | | 111,780 | | 3,791,577 |
|
Health Care Providers & Services Total | | 31,359,030 |
| | |
Health Care Technology – 0.0% | | | | |
IMS Health, Inc. | | 39,900 | | 499,548 |
|
Health Care Technology Total | | | | 499,548 |
See Accompanying Notes to Financial Statements.
26
Columbia Large Cap Index Fund
February 28, 2009
Common Stocks (continued)
| | | | |
| | | Shares | | Value ($) |
| Health Care (continued) | | |
Life Sciences Tools & Services – 0.4% |
Life Technologies Corp. (a) | | 37,899 | | 1,104,756 |
Millipore Corp. (a) | | 12,095 | | 665,951 |
PerkinElmer, Inc. | | 25,935 | | 334,043 |
Thermo Fisher Scientific, Inc. (a) | | 92,205 | | 3,343,353 |
Waters Corp. (a) | | 21,545 | | 758,815 |
|
Life Sciences Tools & Services Total | | 6,206,918 |
| | |
Pharmaceuticals – 7.8% | | | | |
Abbott Laboratories | | 340,625 | | 16,125,188 |
Allergan, Inc. | | 67,520 | | 2,615,725 |
Bristol-Myers Squibb Co. | | 434,545 | | 7,999,974 |
Eli Lilly & Co. | | 219,655 | | 6,453,464 |
Forest Laboratories, Inc. (a) | | 66,120 | | 1,417,613 |
Johnson & Johnson | | 609,105 | | 30,455,250 |
King Pharmaceuticals, Inc. (a) | | 54,115 | | 397,204 |
Merck & Co., Inc. | | 464,075 | | 11,230,615 |
Mylan, Inc. (a) | | 66,845 | | 830,883 |
Pfizer, Inc. | | 1,480,175 | | 18,220,954 |
Schering-Plough Corp. | | 356,875 | | 6,206,056 |
Watson Pharmaceuticals, Inc. (a) | | 23,005 | | 650,351 |
Wyeth | | 292,290 | | 11,931,278 |
|
Pharmaceuticals Total | | | | 114,534,555 |
| | | | |
Health Care Total | | | | 219,344,432 |
| | | | |
| Industrials – 9.4% | | | | |
Aerospace & Defense – 2.6% | | | | |
Boeing Co. | | 160,865 | | 5,057,596 |
General Dynamics Corp. | | 85,620 | | 3,751,868 |
Goodrich Corp. | | 27,020 | | 895,443 |
Honeywell International, Inc. | | 159,445 | | 4,277,909 |
L-3 Communications Holdings, Inc. | | 26,220 | | 1,773,783 |
Lockheed Martin Corp. | | 73,105 | | 4,613,657 |
Northrop Grumman Corp. | | 71,813 | | 2,682,934 |
Precision Castparts Corp. | | 30,600 | | 1,696,158 |
Raytheon Co. | | 90,890 | | 3,632,873 |
Rockwell Collins, Inc. | | 34,730 | | 1,083,576 |
United Technologies Corp. | | 208,700 | | 8,521,221 |
|
Aerospace & Defense Total | | | | 37,987,018 |
| | |
Air Freight & Logistics – 1.0% | | | | |
C.H. Robinson Worldwide, Inc. | | 37,100 | | 1,535,198 |
Expeditors International of Washington, Inc. | | 46,500 | | 1,281,075 |
FedEx Corp. | | 68,290 | | 2,950,811 |
United Parcel Service, Inc., Class B | | 218,415 | | 8,994,330 |
|
Air Freight & Logistics Total | | | | 14,761,414 |
| | | | |
| | | Shares | | Value ($) |
Airlines – 0.1% | | | | |
Southwest Airlines Co. | | 162,350 | | 956,241 |
|
Airlines Total | | | | 956,241 |
| | |
Building Products – 0.0% | | | | |
Masco Corp. | | 78,985 | | 406,773 |
|
Building Products Total | | | | 406,773 |
| |
Commercial Services & Supplies – 0.6% | | |
Avery Dennison Corp. | | 23,330 | | 470,100 |
Cintas Corp. | | 28,850 | | 585,366 |
Iron Mountain, Inc. (a) | | 39,400 | | 732,052 |
Pitney Bowes, Inc. | | 45,265 | | 873,162 |
R.R. Donnelley & Sons Co. | | 45,025 | | 350,745 |
Republic Services, Inc. | | 70,500 | | 1,402,950 |
Stericycle, Inc. (a) | | 18,800 | | 902,024 |
Waste Management, Inc. | | 107,710 | | 2,908,170 |
|
Commercial Services & Supplies Total | | 8,224,569 |
| |
Construction & Engineering – 0.1% | | |
Fluor Corp. | | 39,830 | | 1,324,347 |
Jacobs Engineering Group, Inc. (a) | | 27,000 | | 910,980 |
|
Construction & Engineering Total | | 2,235,327 |
| | |
Electrical Equipment – 0.4% | | | | |
Cooper Industries Ltd., Class A | | 38,030 | | 802,053 |
Emerson Electric Co. | | 168,390 | | 4,504,432 |
Rockwell Automation, Inc. | | 31,105 | | 625,211 |
|
Electrical Equipment Total | | | | 5,931,696 |
| | |
Industrial Conglomerates – 2.0% | | | | |
3M Co. | | 152,130 | | 6,915,830 |
General Electric Co. (b) | | 2,305,640 | | 19,620,996 |
Textron, Inc. | | 52,970 | | 299,280 |
Tyco International Ltd. | | 103,776 | | 2,080,709 |
|
Industrial Conglomerates Total | | | | 28,916,815 |
| | |
Machinery – 1.5% | | | | |
Caterpillar, Inc. | | 132,440 | | 3,259,348 |
Cummins, Inc. | | 44,180 | | 918,944 |
Danaher Corp. | | 56,160 | | 2,850,682 |
Deere & Co. | | 93,760 | | 2,577,462 |
Dover Corp. | | 40,860 | | 1,019,048 |
Eaton Corp. | | 36,200 | | 1,308,630 |
Flowserve Corp. | | 12,400 | | 625,828 |
Illinois Tool Works, Inc. | | 86,370 | | 2,401,086 |
Ingersoll-Rand Co., Ltd., Class A | | 70,020 | | 992,884 |
ITT Corp. | | 39,830 | | 1,487,651 |
Manitowoc Co., Inc. | | 28,600 | | 117,260 |
Paccar, Inc. | | 79,592 | | 1,995,371 |
See Accompanying Notes to Financial Statements.
27
Columbia Large Cap Index Fund
February 28, 2009
Common Stocks (continued)
| | | | |
| | | Shares | | Value ($) |
| Industrials (continued) | | |
Machinery (continued) |
Pall Corp. | | 25,970 | | 617,307 |
Parker Hannifin Corp. | | 35,392 | | 1,181,031 |
|
Machinery Total | | | | 21,352,532 |
| | |
Professional Services – 0.1% | | | | |
Dun & Bradstreet Corp. | | 11,800 | | 872,846 |
Equifax, Inc. | | 27,685 | | 595,228 |
Monster Worldwide, Inc. (a) | | 27,095 | | 178,556 |
Robert Half International, Inc. | | 34,090 | | 523,963 |
|
Professional Services Total | | | | 2,170,593 |
| | |
Road & Rail – 0.9% | | | | |
Burlington Northern Santa Fe Corp. | | 61,640 | | 3,622,583 |
CSX Corp. | | 86,550 | | 2,136,054 |
Norfolk Southern Corp. | | 81,280 | | 2,578,201 |
Ryder System, Inc. | | 12,160 | | 277,978 |
Union Pacific Corp. | | 111,190 | | 4,171,849 |
|
Road & Rail Total | | | | 12,786,665 |
|
Trading Companies & Distributors – 0.1% |
Fastenal Co. | | 28,400 | | 855,408 |
W.W. Grainger, Inc. | | 14,215 | | 940,464 |
|
Trading Companies & Distributors Total | | 1,795,872 |
|
Industrials Total | | | | 137,525,515 |
| | | | |
| Information Technology – 16.7% | | | | |
| Communications Equipment – 2.7% | | |
Ciena Corp. (a) | | 19,818 | | 106,423 |
Cisco Systems, Inc. (a) | | 1,285,250 | | 18,726,092 |
Corning, Inc. | | 341,160 | | 3,599,238 |
Harris Corp. | | 29,500 | | 1,099,760 |
JDS Uniphase Corp. (a) | | 48,255 | | 133,184 |
Juniper Networks, Inc. (a) | | 115,900 | | 1,646,939 |
Motorola, Inc. | | 497,480 | | 1,751,130 |
QUALCOMM, Inc. | | 363,440 | | 12,149,799 |
Tellabs, Inc. (a) | | 87,350 | | 331,930 |
| | | | |
Communications Equipment Total | | 39,544,495 |
| | |
Computers & Peripherals – 4.9% | | | | |
Apple, Inc. (a) | | 195,090 | | 17,423,488 |
Dell, Inc. (a) | | 379,925 | | 3,240,760 |
EMC Corp. (a) | | 447,970 | | 4,703,685 |
Hewlett-Packard Co. | | 537,666 | | 15,608,444 |
International Business Machines Corp. | | 294,900 | | 27,139,647 |
Lexmark International, Inc., Class A (a) | | 17,185 | | 294,551 |
| | | | |
| | | Shares | | Value ($) |
NetApp, Inc. (a) | | 72,500 | | 974,400 |
QLogic Corp. (a) | | 28,080 | | 258,897 |
SanDisk Corp. (a) | | 49,600 | | 441,936 |
Seagate Technology, Inc., Escrow Shares (d) | | 64,266 | | 643 |
Sun Microsystems, Inc. (a) | | 162,126 | | 758,750 |
Teradata Corp. (a) | | 38,600 | | 596,756 |
| | | | |
Computers & Peripherals Total | | | | 71,441,957 |
|
Electronic Equipment, Instruments & Components – 0.3% |
Agilent Technologies, Inc. (a) | | 76,835 | | 1,065,701 |
Amphenol Corp., Class A | | 38,600 | | 981,212 |
FLIR Systems, Inc. (a) | | 30,400 | | 620,464 |
Jabil Circuit, Inc. | | 46,195 | | 191,247 |
Molex, Inc. | | 30,965 | | 352,072 |
Tyco Electronics Ltd. | | 100,476 | | 952,513 |
| | | | |
Electronic Equipment, Instruments & Components Total | | 4,163,209 |
| |
Internet Software & Services – 1.7% | | |
Akamai Technologies, Inc. (a) | | 37,100 | | 671,139 |
eBay, Inc. (a) | | 235,470 | | 2,559,559 |
Google, Inc., Class A (a) | | 52,500 | | 17,744,475 |
VeriSign, Inc. (a) | | 42,600 | | 823,458 |
Yahoo!, Inc. (a) | | 304,610 | | 4,029,990 |
| | | | |
Internet Software & Services Total | | 25,828,621 |
| | |
IT Services – 1.0% | | | | |
Affiliated Computer Services, Inc., Class A (a) | | 21,410 | | 998,348 |
Automatic Data Processing, Inc. | | 111,525 | | 3,808,579 |
Cognizant Technology Solutions Corp., Class A (a) | | 63,900 | | 1,175,760 |
Computer Sciences Corp. (a) | | 33,220 | | 1,154,063 |
Convergys Corp. (a) | | 26,825 | | 173,021 |
Fidelity National Information Services, Inc. | | 41,700 | | 729,750 |
Fiserv, Inc. (a) | | 35,120 | | 1,145,614 |
MasterCard, Inc., Class A | | 15,900 | | 2,512,677 |
Paychex, Inc. | | 70,460 | | 1,554,348 |
Total System Services, Inc. | | 43,200 | | 543,456 |
Western Union Co. | | 157,045 | | 1,752,622 |
| | | | |
IT Services Total | | | | 15,548,238 |
| | |
Office Electronics – 0.1% | | | | |
Xerox Corp. | | 190,025 | | 984,330 |
| | | | |
Office Electronics Total | | | | 984,330 |
|
Semiconductors & Semiconductor Equipment – 2.3% |
Advanced Micro Devices, Inc. (a) | | 133,555 | | 291,150 |
Altera Corp. | | 65,275 | | 1,000,666 |
Analog Devices, Inc. | | 63,875 | | 1,190,630 |
See Accompanying Notes to Financial Statements.
28
Columbia Large Cap Index Fund
February 28, 2009
Common Stocks (continued)
| | | | |
| | | Shares | | Value ($) |
| Information Technology (continued) | | |
Semiconductors & Semiconductor Equipment (continued) |
Applied Materials, Inc. | | 294,555 | | 2,712,852 |
Broadcom Corp., Class A (a) | | 97,450 | | 1,603,052 |
Intel Corp. | | 1,220,975 | | 15,555,221 |
KLA-Tencor Corp. | | 37,045 | | 639,026 |
Linear Technology Corp. | | 48,640 | | 1,060,352 |
LSI Corp. (a) | | 141,640 | | 410,756 |
MEMC Electronic Materials, Inc. (a) | | 49,300 | | 739,993 |
Microchip Technology, Inc. | | 39,900 | | 748,923 |
Micron Technology, Inc. (a) | | 167,655 | | 539,849 |
National Semiconductor Corp. | | 42,860 | | 467,174 |
Novellus Systems, Inc. (a) | | 21,485 | | 273,934 |
NVIDIA Corp. (a) | | 117,920 | | 976,378 |
Teradyne, Inc. (a) | | 37,170 | | 153,512 |
Texas Instruments, Inc. | | 284,570 | | 4,083,579 |
Xilinx, Inc. | | 60,135 | | 1,063,187 |
| | | | |
Semiconductors & Semiconductor Equipment Total | | 33,510,234 |
| | |
Software – 3.7% | | | | |
Adobe Systems, Inc. (a) | | 116,570 | | 1,946,719 |
Autodesk, Inc. (a) | | 49,690 | | 630,566 |
BMC Software, Inc. (a) | | 41,200 | | 1,220,756 |
CA, Inc. | | 86,504 | | 1,466,243 |
Citrix Systems, Inc. (a) | | 39,905 | | 821,245 |
Compuware Corp. (a) | | 54,090 | | 319,672 |
Electronic Arts, Inc. (a) | | 70,390 | | 1,148,061 |
Intuit, Inc. (a) | | 70,240 | | 1,600,770 |
McAfee, Inc. (a) | | 33,500 | | 936,325 |
Microsoft Corp. | | 1,679,320 | | 27,121,018 |
Novell, Inc. (a) | | 75,765 | | 239,417 |
Oracle Corp. (a) | | 859,965 | | 13,363,856 |
Salesforce.com, Inc. (a) | | 23,000 | | 644,000 |
Symantec Corp. (a) | | 183,530 | | 2,538,220 |
| | | | |
Software Total | | | | 53,996,868 |
| | | | |
Information Technology Total | | | | 245,017,952 |
| | | | |
| Materials – 3.0% | | | | |
Chemicals – 1.8% | | | | |
Air Products & Chemicals, Inc. | | 46,015 | | 2,128,194 |
CF Industries Holdings, Inc. | | 12,500 | | 804,125 |
Dow Chemical Co. | | 202,825 | | 1,452,227 |
E.I. Du Pont de Nemours & Co. | | 198,095 | | 3,716,262 |
Eastman Chemical Co. | | 15,950 | | 327,613 |
Ecolab, Inc. | | 36,825 | | 1,170,298 |
International Flavors & Fragrances, Inc. | | 17,290 | | 454,900 |
Monsanto Co. | | 120,244 | | 9,171,010 |
| | | | |
| | | Shares | | Value ($) |
PPG Industries, Inc. | | 36,005 | | 1,118,315 |
Praxair, Inc. | | 67,705 | | 3,842,259 |
Rohm and Haas Co. | | 27,395 | | 1,426,458 |
Sigma-Aldrich Corp. | | 27,500 | | 981,750 |
| | | | |
Chemicals Total | | | | 26,593,411 |
| | |
Construction Materials – 0.1% | | | | |
Vulcan Materials Co. | | 24,155 | | 1,000,258 |
| | | | |
Construction Materials Total | | | | 1,000,258 |
| | |
Containers & Packaging – 0.2% | | | | |
Ball Corp. | | 20,755 | | 836,219 |
Bemis Co., Inc. | | 21,905 | | 406,776 |
Owens-Illinois, Inc. (a) | | 36,600 | | 564,372 |
Pactiv Corp. (a) | | 28,850 | | 456,695 |
Sealed Air Corp. | | 34,630 | | 386,471 |
| | | | |
Containers & Packaging Total | | | | 2,650,533 |
| | |
Metals & Mining – 0.8% | | | | |
AK Steel Holding Corp. | | 24,600 | | 152,028 |
Alcoa, Inc. | | 175,660 | | 1,094,362 |
Allegheny Technologies, Inc. | | 21,140 | | 415,824 |
Freeport-McMoRan Copper & Gold, Inc. | | 90,210 | | 2,744,188 |
Newmont Mining Corp. | | 106,200 | | 4,421,106 |
Nucor Corp. | | 68,880 | | 2,317,812 |
Titanium Metals Corp. | | 18,700 | | 109,208 |
United States Steel Corp. | | 25,570 | | 502,962 |
| | | | |
Metals & Mining Total | | | | 11,757,490 |
| | |
Paper & Forest Products – 0.1% | | | | |
International Paper Co. | | 93,895 | | 534,263 |
MeadWestvaco Corp. | | 37,495 | | 350,203 |
Weyerhaeuser Co. | | 46,355 | | 1,119,937 |
| | | | |
Paper & Forest Products Total | | | | 2,004,403 |
| | | | |
Materials Total | | | | 44,006,095 |
| | | | |
| Telecommunication Services – 3.9% |
Diversified Telecommunication Services – 3.6% |
AT&T, Inc. | | 1,293,620 | | 30,749,348 |
CenturyTel, Inc. | | 21,935 | | 577,549 |
Embarq Corp. | | 31,157 | | 1,089,560 |
Frontier Communications Corp. | | 68,295 | | 491,724 |
Qwest Communications International, Inc. | | 321,585 | | 1,090,173 |
Verizon Communications, Inc. | | 623,495 | | 17,788,312 |
Windstream Corp. | | 96,480 | | 719,741 |
| | | | |
Diversified Telecommunication Services Total | | 52,506,407 |
See Accompanying Notes to Financial Statements.
29
Columbia Large Cap Index Fund
February 28, 2009
Common Stocks (continued)
| | | | |
| | | Shares | | Value ($) |
| Telecommunication Services (continued) |
Wireless Telecommunication Services – 0.3% |
American Tower Corp., Class A (a) | | 87,100 | | 2,536,352 |
Sprint Nextel Corp. (a) | | 627,145 | | 2,063,307 |
| | | | |
Wireless Telecommunication Services Total | | 4,599,659 |
| | | | |
Telecommunication Services Total | | 57,106,066 |
| | | | |
| Utilities – 4.3% | | | | |
Electric Utilities – 2.5% | | | | |
Allegheny Energy, Inc. | | 37,090 | | 876,808 |
American Electric Power Co., Inc. | | 88,615 | | 2,485,651 |
Duke Energy Corp. | | 277,787 | | 3,741,791 |
Edison International | | 71,530 | | 1,947,046 |
Entergy Corp. | | 41,585 | | 2,802,413 |
Exelon Corp. | | 144,450 | | 6,820,929 |
FirstEnergy Corp. | | 66,905 | | 2,847,477 |
FPL Group, Inc. | | 89,730 | | 4,067,461 |
Pepco Holdings, Inc. | | 47,500 | | 712,500 |
Pinnacle West Capital Corp. | | 22,155 | | 581,790 |
PPL Corp. | | 82,290 | | 2,295,068 |
Progress Energy, Inc. | | 60,930 | | 2,158,140 |
Southern Co. | | 170,015 | | 5,153,155 |
| | | | |
Electric Utilities Total | | | | 36,490,229 |
| | |
Gas Utilities – 0.2% | | | | |
EQT Corp. | | 28,700 | | 882,525 |
Nicor, Inc. | | 9,945 | | 312,074 |
Questar Corp. | | 38,100 | | 1,098,423 |
| | | | |
Gas Utilities Total | | | | 2,293,022 |
|
Independent Power Producers & Energy Traders – 0.1% |
AES Corp. (a) | | 147,710 | | 930,573 |
Constellation Energy Group, Inc. | | 43,755 | | 864,599 |
Dynegy, Inc., Class A (a) | | 111,850 | | 145,405 |
| | | | |
Independent Power Producers & Energy Traders Total | | 1,940,577 |
| | |
Multi-Utilities – 1.5% | | | | |
Ameren Corp. | | 46,385 | | 1,103,035 |
CenterPoint Energy, Inc. | | 75,550 | | 779,676 |
CMS Energy Corp. | | 49,625 | | 548,853 |
Consolidated Edison, Inc. | | 60,080 | | 2,175,497 |
Dominion Resources, Inc. | | 127,590 | | 3,850,666 |
DTE Energy Co. | | 35,755 | | 957,161 |
Integrys Energy Group, Inc. | | 16,799 | | 404,016 |
NiSource, Inc. | | 60,220 | | 526,925 |
PG&E Corp. | | 79,275 | | 3,029,890 |
Public Service Enterprise Group, Inc. | | 111,080 | | 3,031,373 |
SCANA Corp. | | 25,800 | | 777,354 |
| | | | |
| | | Shares | | Value ($) |
Sempra Energy | | 53,440 | | 2,221,501 |
TECO Energy, Inc. | | 46,710 | | 447,949 |
Wisconsin Energy Corp. | | 25,700 | | 1,023,374 |
Xcel Energy, Inc. | | 98,605 | | 1,749,253 |
| | | | |
Multi-Utilities Total | | | | 22,626,523 |
| | | | |
Utilities Total | | | | 63,350,351 |
| | | | |
Total Common Stocks
(cost of $1,876,232,342) | | 1,404,978,639 |
| | | | |
| Short-Term Obligation – 3.5% | | |
| | | Par ($) | | |
Repurchase agreement with Fixed Income Clearing Corp., dated 02/27/09, due 03/02/09 at 0.210%, collateralized by U.S. Government Agency Obligations with various maturities to 06/15/10, market value $53,023,581 (repurchase proceeds $51,982,910) | | 51,982,000 | | 51,982,000 |
|
Total Short-Term Obligation
(cost of $51,982,000) | | 51,982,000 |
|
Total Investments – 99.5%
(cost of $1,928,214,342) (e) | | 1,456,960,639 |
|
Other Assets & Liabilities, Net – 0.5% | | 6,961,479 |
|
Net Assets – 100.0% | | | | 1,463,922,118 |
Notes to Investment Portfolio:
| (a) | Non-income producing security. |
| (b) | A portion of these securities with a market value of $13,857,800 is pledged as collateral for open futures contracts. |
| (c) | Investments in affiliates during the year ended February 28, 2009: |
| | | | |
| Security name: | | Bank of America Corp. | |
Shares as of 02/29/08: | | | 923,134 | |
Shares purchased: | | | 182,400 | |
Shares sold: | | | (26,001 | ) |
Shares from mergers: | | | 324,080 | |
Shares as of 02/28/09: | | | 1,403,613 | |
Net realized gain: | | $ | 105,918 | |
Dividend income earned: | | $ | 2,223,438 | |
Value at end of period: | | $ | 5,544,271 | |
| (d) | Represents fair value as determined in good faith under procedures approved by the Board of Trustees. At February 28, 2009, the value of this security amounted to $643, which represents less than 0.01% of net assets. |
| (e) | Cost for federal income tax purposes is $1,973,085,973. |
See Accompanying Notes to Financial Statements.
30
Columbia Large Cap Index Fund
February 28, 2009
At February 28, 2009, the Fund held investments in the following sectors:
| | |
Sector (Unaudited) | | % of
Net Assets |
Information Technology | | 16.7 |
Health Care | | 15.0 |
Energy | | 13.3 |
Consumer Staples | | 12.9 |
Financials | | 9.4 |
Industrials | | 9.4 |
Consumer Discretionary | | 8.1 |
Utilities | | 4.3 |
Telecommunication Services | | 3.9 |
Materials | | 3.0 |
| | |
| | 96.0 |
Short-Term Obligation | | 3.5 |
Other Assets & Liabilities, Net | | 0.5 |
| | |
| | 100.0 |
| | |
At February 28, 2009, the Fund held the following open long futures contracts:
| | | | | | | | | | | | | | |
Type | | Number of
Contracts | | Value | | Aggregate
Face Value | | Expiration
Date | | Unrealized
Depreciation | |
S&P 500 Index | | 312 | | $ | 57,267,600 | | $ | 67,222,827 | | Mar-2009 | | $ | (9,955,227 | ) |
| | | | | | | | | | | | | | |
See Accompanying Notes to Financial Statements.
31
Investment Portfolio – Columbia Large Cap Enhanced Core Fund
February 28, 2009
Common Stocks – 96.0%
| | | | |
| | | Shares | | Value ($) |
| Consumer Discretionary – 8.0% | | | | |
Diversified Consumer Services – 1.8% | | |
Apollo Group, Inc., Class A (a) | | 35,500 | | 2,573,750 |
H&R Block, Inc. | | 244,200 | | 4,664,220 |
| | | | |
Diversified Consumer Services Total | | 7,237,970 |
| |
Hotels, Restaurants & Leisure – 1.0% | | |
McDonald’s Corp. | | 57,900 | | 3,025,275 |
Yum! Brands, Inc. | | 30,300 | | 796,284 |
| | | | |
Hotels, Restaurants & Leisure Total | | 3,821,559 |
| | |
Household Durables – 0.2% | | | | |
D.R. Horton, Inc. | | 4,600 | | 38,870 |
Whirlpool Corp. | | 31,300 | | 695,799 |
| | | | |
Household Durables Total | | | | 734,669 |
| |
Leisure Equipment & Products – 0.1% | | |
Hasbro, Inc. | | 13,100 | | 299,859 |
| | | | |
Leisure Equipment & Products Total | | 299,859 |
| | |
Media – 1.3% | | | | |
Comcast Corp., Class A | | 46,400 | | 605,984 |
DIRECTV Group, Inc. (a) | | 31,200 | | 622,128 |
Gannett Co., Inc. | | 247,700 | | 802,548 |
McGraw-Hill Companies, Inc. | | 23,500 | | 463,655 |
Time Warner, Inc. | | 366,200 | | 2,794,106 |
| | | | |
Media Total | | | | 5,288,421 |
| | |
Multiline Retail – 0.1% | | | | |
Kohl’s Corp. (a) | | 900 | | 31,626 |
Target Corp. | | 9,500 | | 268,945 |
| | | | |
Multiline Retail Total | | | | 300,571 |
| | |
Specialty Retail – 2.5% | | | | |
Gap, Inc. | | 234,800 | | 2,533,492 |
Home Depot, Inc. | | 113,600 | | 2,373,104 |
Lowe’s Companies, Inc. | | 112,400 | | 1,780,416 |
Sherwin-Williams Co. | | 35,400 | | 1,626,630 |
TJX Companies, Inc. | | 72,100 | | 1,605,667 |
| | | | |
Specialty Retail Total | | | | 9,919,309 |
| |
Textiles, Apparel & Luxury Goods – 1.0% | | |
Coach, Inc. (a) | | 249,600 | | 3,489,408 |
Polo Ralph Lauren Corp. | | 9,700 | | 334,359 |
| | | | |
Textiles, Apparel & Luxury Goods Total | | 3,823,767 |
| | | | |
Consumer Discretionary Total | | | | 31,426,125 |
| | | | |
| Consumer Staples – 12.9% | | | | |
Beverages – 2.0% | | | | |
Coca-Cola Co. | | 70,700 | | 2,888,095 |
Coca-Cola Enterprises, Inc. | | 72,700 | | 834,596 |
PepsiCo, Inc. | | 87,800 | | 4,226,692 |
| | | | |
Beverages Total | | | | 7,949,383 |
| | | | |
| | | Shares | | Value ($) |
Food & Staples Retailing – 1.5% | | |
CVS Caremark Corp. | | 1,700 | | 43,758 |
Kroger Co. | | 69,200 | | 1,430,364 |
SUPERVALU, Inc. | | 22,400 | | 349,664 |
Sysco Corp. | | 100 | | 2,150 |
Wal-Mart Stores, Inc. | | 83,800 | | 4,126,312 |
| | | | |
Food & Staples Retailing Total | | | | 5,952,248 |
| | |
Food Products – 3.2% | | | | |
Archer-Daniels-Midland Co. | | 179,500 | | 4,785,470 |
Campbell Soup Co. | | 10,000 | | 267,700 |
Dean Foods Co. (a) | | 65,500 | | 1,339,475 |
General Mills, Inc. | | 19,900 | | 1,044,352 |
H.J. Heinz Co. | | 8,900 | | 290,763 |
Kellogg Co. | | 27,600 | | 1,074,192 |
Kraft Foods, Inc., Class A | | 96,800 | | 2,205,104 |
Sara Lee Corp. | | 164,600 | | 1,269,066 |
| | | | |
Food Products Total | | | | 12,276,122 |
| | |
Household Products – 4.4% | | | | |
Clorox Co. | | 16,200 | | 787,320 |
Colgate-Palmolive Co. | | 5,700 | | 343,026 |
Kimberly-Clark Corp. | | 116,800 | | 5,502,448 |
Procter & Gamble Co. | | 219,400 | | 10,568,498 |
| | | | |
Household Products Total | | | | 17,201,292 |
| | |
Personal Products – 0.0% | | | | |
Avon Products, Inc. | | 800 | | 14,072 |
| | | | |
Personal Products Total | | | | 14,072 |
| | |
Tobacco – 1.8% | | | | |
Altria Group, Inc. | | 164,700 | | 2,542,968 |
Lorillard, Inc. | | 500 | | 29,220 |
Philip Morris International, Inc. | | 128,600 | | 4,304,242 |
Reynolds American, Inc. | | 7,500 | | 251,850 |
| | | | |
Tobacco Total | | | | 7,128,280 |
| | | | |
Consumer Staples Total | | | | 50,521,397 |
| | | | |
| Energy – 13.4% | | | | |
Energy Equipment & Services – 0.0% |
Schlumberger Ltd. | | 100 | | 3,806 |
| | | | |
Energy Equipment & Services Total | | 3,806 |
|
Oil, Gas & Consumable Fuels – 13.4% |
Apache Corp. | | 27,300 | | 1,613,157 |
Chevron Corp. | | 145,100 | | 8,809,021 |
ConocoPhillips | | 157,000 | | 5,863,950 |
El Paso Corp. | | 166,300 | | 1,122,525 |
EOG Resources, Inc. | | 12,900 | | 645,516 |
Exxon Mobil Corp. | | 307,600 | | 20,886,040 |
Marathon Oil Corp. | | 105,100 | | 2,445,677 |
See Accompanying Notes to Financial Statements.
32
Columbia Large Cap Enhanced Core Fund
February 28, 2009
Common Stocks (continued)
| | | | |
| | | Shares | | Value ($) |
| Energy (continued) | | | | |
Oil, Gas & Consumable Fuels (continued) | | |
Murphy Oil Corp. | | 20,900 | | 873,829 |
Occidental Petroleum Corp. | | 100,600 | | 5,218,122 |
Southwestern Energy Co. (a) | | 50,300 | | 1,447,131 |
Valero Energy Corp. | | 178,200 | | 3,453,516 |
| | | | |
Oil, Gas & Consumable Fuels Total | | 52,378,484 |
| | | | |
Energy Total | | | | 52,382,290 |
| | | | |
| Financials – 9.5% | | | | |
Capital Markets – 1.6% | | | | |
Bank of New York Mellon Corp. | | 69,000 | | 1,529,730 |
Charles Schwab Corp. | | 122,400 | | 1,555,704 |
Goldman Sachs Group, Inc. | | 3,900 | | 355,212 |
Morgan Stanley | | 108,800 | | 2,125,952 |
Northern Trust Corp. | | 2,600 | | 144,430 |
State Street Corp. | | 5,500 | | 138,985 |
T. Rowe Price Group, Inc. | | 11,300 | | 256,962 |
| | | | |
Capital Markets Total | | | | 6,106,975 |
| | |
Commercial Banks – 2.7% | | | | |
BB&T Corp. | | 77,400 | | 1,248,462 |
PNC Financial Services Group, Inc. | | 63,900 | | 1,747,026 |
U.S. Bancorp | | 150,300 | | 2,150,793 |
Wells Fargo & Co. | | 463,500 | | 5,608,350 |
| | | | |
Commercial Banks Total | | | | 10,754,631 |
| | |
Consumer Finance – 0.4% | | | | |
American Express Co. | | 77,800 | | 938,268 |
Capital One Financial Corp. | | 51,900 | | 625,395 |
| | | | |
Consumer Finance Total | | | | 1,563,663 |
| |
Diversified Financial Services – 2.0% | | |
Citigroup, Inc. | | 175,200 | | 262,800 |
IntercontinentalExchange, Inc. (a) | | 1,000 | | 56,770 |
JPMorgan Chase & Co. | | 239,000 | | 5,461,150 |
Moody’s Corp. | | 116,900 | | 2,098,355 |
| | | | |
Diversified Financial Services Total | | 7,879,075 |
| | |
Insurance – 1.6% | | | | |
AFLAC, Inc. | | 39,300 | | 658,668 |
Allstate Corp. | | 31,400 | | 528,462 |
Chubb Corp. | | 12,700 | | 495,808 |
Loews Corp. | | 77,200 | | 1,532,420 |
MetLife, Inc. | | 67,400 | | 1,244,204 |
Prudential Financial, Inc. | | 80,400 | | 1,319,364 |
Travelers Companies, Inc. | | 7,600 | | 274,740 |
| | | | |
Insurance Total | | | | 6,053,666 |
|
Real Estate Investment Trusts (REITs) – 1.1% |
Apartment Investment & Management Co., Class A | | 100 | | 522 |
| | | | |
| | | Shares | | Value ($) |
AvalonBay Communities, Inc. | | 801 | | 33,967 |
Plum Creek Timber Co., Inc. | | 1,700 | | 44,591 |
Public Storage, Inc. | | 42,400 | | 2,352,352 |
Simon Property Group, Inc. | | 60,300 | | 1,995,930 |
| | | | |
Real Estate Investment Trusts (REITs) Total | | 4,427,362 |
| | |
Thrifts & Mortgage Finance – 0.1% | | | | |
Hudson City Bancorp, Inc. | | 42,700 | | 442,799 |
| | | | |
Thrifts & Mortgage Finance Total | | | | 442,799 |
| | | | |
Financials Total | | | | 37,228,171 |
| | | | |
| Health Care – 15.0% | | | | |
Biotechnology – 3.5% | | | | |
Amgen, Inc. (a) | | 137,400 | | 6,722,982 |
Biogen Idec, Inc. (a) | | 63,800 | | 2,937,352 |
Celgene Corp. (a) | | 15,900 | | 711,207 |
Cephalon, Inc. (a) | | 15,100 | | 990,409 |
Genzyme Corp. (a) | | 24,700 | | 1,504,971 |
Gilead Sciences, Inc. (a) | | 16,800 | | 752,640 |
| | | | |
Biotechnology Total | | | | 13,619,561 |
|
Health Care Equipment & Supplies – 2.1% |
Baxter International, Inc. | | 4,000 | | 203,640 |
Boston Scientific Corp. (a) | | 506,500 | | 3,555,630 |
Covidien Ltd. | | 37,800 | | 1,197,126 |
Hospira, Inc. (a) | | 40,700 | | 944,240 |
Medtronic, Inc. | | 41,900 | | 1,239,821 |
Zimmer Holdings, Inc. (a) | | 27,700 | | 970,054 |
| | | | |
Health Care Equipment & Supplies Total | | 8,110,511 |
|
Health Care Providers & Services – 0.4% |
Aetna, Inc. | | 3,700 | | 88,319 |
McKesson Corp. | | 5,500 | | 225,610 |
UnitedHealth Group, Inc. | | 71,100 | | 1,397,115 |
WellPoint, Inc. (a) | | 3,300 | | 111,936 |
| | | | |
Health Care Providers & Services Total | | 1,822,980 |
|
Life Sciences Tools & Services – 0.3% |
PerkinElmer, Inc. | | 87,900 | | 1,132,152 |
| | | | |
Life Sciences Tools & Services Total | | 1,132,152 |
|
Pharmaceuticals – 8.7% |
Abbott Laboratories | | 54,600 | | 2,584,764 |
Bristol-Myers Squibb Co. | | 107,200 | | 1,973,552 |
Eli Lilly & Co. | | 203,300 | | 5,972,954 |
Forest Laboratories, Inc. (a) | | 46,400 | | 994,816 |
Johnson & Johnson | | 157,600 | | 7,880,000 |
King Pharmaceuticals, Inc. (a) | | 161,700 | | 1,186,878 |
Merck & Co., Inc. | | 101,600 | | 2,458,720 |
Mylan, Inc. (a) | | 176,900 | | 2,198,867 |
Pfizer, Inc. | | 571,400 | | 7,033,934 |
See Accompanying Notes to Financial Statements.
33
Columbia Large Cap Enhanced Core Fund
February 28, 2009
Common Stocks (continued)
| | | | |
| | | Shares | | Value ($) |
| Health Care (continued) | | | | |
Pharmaceuticals (continued) | | | | |
Schering-Plough Corp. | | 114,400 | | 1,989,416 |
| | | | |
Pharmaceuticals Total | | | | 34,273,901 |
| | | | |
Health Care Total | | | | 58,959,105 |
| | | | |
| Industrials – 9.4% | | | | |
Aerospace & Defense – 2.8% | | | | |
Boeing Co. | | 60,700 | | 1,908,408 |
General Dynamics Corp. | | 19,900 | | 872,018 |
Goodrich Corp. | | 16,100 | | 533,554 |
Honeywell International, Inc. | | 78,400 | | 2,103,472 |
Northrop Grumman Corp. | | 60,400 | | 2,256,544 |
Precision Castparts Corp. | | 6,700 | | 371,381 |
United Technologies Corp. | | 66,500 | | 2,715,195 |
| | | | |
Aerospace & Defense Total | | | | 10,760,572 |
| | |
Air Freight & Logistics – 1.7% | | | | |
FedEx Corp. | | 86,800 | | 3,750,628 |
United Parcel Service, Inc., Class B | | 67,300 | | 2,771,414 |
| | | | |
Air Freight & Logistics Total | | | | 6,522,042 |
|
Commercial Services & Supplies – 0.6% |
R.R. Donnelley & Sons Co. | | 320,000 | | 2,492,800 |
Waste Management, Inc. | | 300 | | 8,100 |
| | | | |
Commercial Services & Supplies Total | | 2,500,900 |
| |
Construction & Engineering – 0.6% | | |
Fluor Corp. | | 70,600 | | 2,347,450 |
Jacobs Engineering Group, Inc. (a) | | 2,400 | | 80,976 |
| | | | |
Construction & Engineering Total | | 2,428,426 |
| | |
Industrial Conglomerates – 0.8% | | | | |
3M Co. | | 34,500 | | 1,568,370 |
General Electric Co. (b) | | 199,600 | | 1,698,596 |
| | | | |
Industrial Conglomerates Total | | | | 3,266,966 |
| | |
Machinery – 0.2% | | | | |
Cummins, Inc. | | 33,100 | | 688,480 |
| | | | |
Machinery Total | | | | 688,480 |
| | |
Professional Services – 0.2% | | | | |
Dun & Bradstreet Corp. | | 4,400 | | 325,468 |
Robert Half International, Inc. | | 28,000 | | 430,360 |
| | | | |
Professional Services Total | | | | 755,828 |
| | |
Road & Rail – 1.6% | | | | |
CSX Corp. | | 83,200 | | 2,053,376 |
Norfolk Southern Corp. | | 76,500 | | 2,426,580 |
Union Pacific Corp. | | 48,100 | | 1,804,712 |
| | | | |
Road & Rail Total | | | | 6,284,668 |
| | | | |
| | | Shares | | Value ($) |
Trading Companies & Distributors – 0.9% | | |
Fastenal Co. | | 17,600 | | 530,112 |
W.W. Grainger, Inc. | | 45,000 | | 2,977,200 |
| | | | |
Trading Companies & Distributors Total | | 3,507,312 |
| | | | |
Industrials Total | | | | 36,715,194 |
| | | | |
| Information Technology – 16.7% | | | | |
Communications Equipment – 2.2% | | |
Cisco Systems, Inc. (a) | | 426,300 | | 6,211,191 |
Corning, Inc. | | 400 | | 4,220 |
QUALCOMM, Inc. | | 67,300 | | 2,249,839 |
| | | | |
Communications Equipment Total | | | | 8,465,250 |
| |
Computers & Peripherals – 4.2% | | |
Apple, Inc. (a) | | 40,000 | | 3,572,400 |
Dell, Inc. (a) | | 106,300 | | 906,739 |
EMC Corp. (a) | | 83,300 | | 874,650 |
Hewlett-Packard Co. | | 163,900 | | 4,758,017 |
International Business Machines Corp. | | 65,700 | | 6,046,371 |
Lexmark International, Inc., Class A (a) | | 18,500 | | 317,090 |
Seagate Technology, Inc., Escrow Shares (c) | | 97,200 | | 972 |
| | | | |
Computers & Peripherals Total | | 16,476,239 |
| |
Internet Software & Services – 1.3% | | |
eBay, Inc. (a) | | 239,000 | | 2,597,930 |
Google, Inc., Class A (a) | | 7,600 | | 2,568,724 |
| | | | |
Internet Software & Services Total | | 5,166,654 |
| | |
| IT Services – 0.6% | | | | |
Computer Sciences Corp. (a) | | 27,900 | | 969,246 |
MasterCard, Inc., Class A | | 3,600 | | 568,908 |
Western Union Co. | | 76,300 | | 851,508 |
| | | | |
IT Services Total | | | | 2,389,662 |
|
| Semiconductors & Semiconductor Equipment – 2.8% |
Altera Corp. | | 21,300 | | 326,529 |
Intel Corp. | | 542,900 | | 6,916,546 |
LSI Corp. (a) | | 320,500 | | 929,450 |
National Semiconductor Corp. | | 6,800 | | 74,120 |
Texas Instruments, Inc. | | 196,500 | | 2,819,775 |
| | | | |
Semiconductors & Semiconductor Equipment Total | | 11,066,420 |
| | |
Software – 5.6% | | | | |
Adobe Systems, Inc. (a) | | 133,500 | | 2,229,450 |
Autodesk, Inc. (a) | | 61,500 | | 780,435 |
BMC Software, Inc. (a) | | 42,400 | | 1,256,312 |
See Accompanying Notes to Financial Statements.
34
Columbia Large Cap Enhanced Core Fund
February 28, 2009
Common Stocks (continued)
| | | | |
| | | Shares | | Value ($) |
| Information Technology (continued) | | | | |
Software (continued) | | | | |
CA, Inc. | | 800 | | 13,560 |
Compuware Corp. (a) | | 92,700 | | 547,857 |
Microsoft Corp. (b) | | 636,700 | | 10,282,705 |
Oracle Corp. (a) | | 271,100 | | 4,212,894 |
Symantec Corp. (a) | | 184,500 | | 2,551,635 |
| | | | |
Software Total | | | | 21,874,848 |
| | | | |
Information Technology Total | | 65,439,073 |
| | | | |
| Materials – 2.8% | | | | |
Chemicals – 2.7% | | | | |
Dow Chemical Co. | | 471,800 | | 3,378,088 |
E.I. Du Pont de Nemours & Co. | | 112,700 | | 2,114,252 |
Eastman Chemical Co. | | 22,800 | | 468,312 |
Ecolab, Inc. | | 16,900 | | 537,082 |
Monsanto Co. | | 36,200 | | 2,760,974 |
PPG Industries, Inc. | | 29,500 | | 916,270 |
Praxair, Inc. | | 9,500 | | 539,125 |
| | | | |
Chemicals Total | | | | 10,714,103 |
| | |
| Construction Materials – 0.0% | | | | |
Vulcan Materials Co. | | 500 | | 20,705 |
| | | | |
Construction Materials Total | | | | 20,705 |
| | |
| Containers & Packaging – 0.0% | | | | |
Owens-Illinois, Inc. (a) | | 2,000 | | 30,840 |
| | | | |
Containers & Packaging Total | | | | 30,840 |
| | |
| Metals & Mining – 0.1% | | | | |
Freeport-McMoRan Copper & Gold, Inc. | | 7,300 | | 222,066 |
Nucor Corp. | | 6,500 | | 218,725 |
| | | | |
Metals & Mining Total | | | | 440,791 |
| | | | |
Materials Total | | | | 11,206,439 |
| | | | |
| Telecommunication Services – 4.0% | | |
Diversified Telecommunication Services – 3.7% |
AT&T, Inc. | | 310,100 | | 7,371,077 |
Qwest Communications International, Inc. | | 403,000 | | 1,366,170 |
Verizon Communications, Inc. | | 195,800 | | 5,586,174 |
| | | | |
Diversified Telecommunication Services Total | | | | 14,323,421 |
|
| Wireless Telecommunication Services – 0.3% |
American Tower Corp., Class A (a) | | 30,200 | | 879,424 |
Sprint Nextel Corp. (a) | | 154,000 | | 506,660 |
| | | | |
Wireless Telecommunication Services Total | | 1,386,084 |
| | | | |
Telecommunication Services Total | | 15,709,505 |
| | | | |
| | | Shares | | Value ($) |
| Utilities – 4.3% | | | | |
Electric Utilities – 2.8% | | | | |
American Electric Power Co., Inc. | | 11,000 | | 308,550 |
Edison International | | 93,900 | | 2,555,958 |
Entergy Corp. | | 6,100 | | 411,079 |
Exelon Corp. | | 62,700 | | 2,960,694 |
FirstEnergy Corp. | | 39,900 | | 1,698,144 |
Pepco Holdings, Inc. | | 158,500 | | 2,377,500 |
Southern Co. | | 24,900 | | 754,719 |
| | | | |
Electric Utilities Total | | | | 11,066,644 |
| | |
Gas Utilities – 0.5% | | | | |
Questar Corp. | | 63,700 | | 1,836,471 |
| | | | |
Gas Utilities Total | | | | 1,836,471 |
|
Independent Power Producers & Energy Traders – 0.0% |
Dynegy, Inc., Class A (a) | | 4,110 | | 5,343 |
| | | | |
Independent Power Producers & Energy Traders Total | | 5,343 |
| | |
Multi-Utilities – 1.0% | | | | |
CenterPoint Energy, Inc. | | 300 | | 3,096 |
NiSource, Inc. | | 94,600 | | 827,750 |
Public Service Enterprise Group, Inc. | | 43,600 | | 1,189,844 |
Sempra Energy | | 44,300 | | 1,841,551 |
| | | | |
Multi-Utilities Total | | | | 3,862,241 |
| | | | |
Utilities Total | | | | 16,770,699 |
| | | | |
Total Common Stocks
(cost of $447,120,930) | | | | 376,357,998 |
| | |
Short-Term Obligation – 3.1% | | | | |
| | | Par ($) | | |
Repurchase agreement with Fixed Income Clearing Corp., dated 02/27/09, due on 03/02/09 at 0.210%, collateralized by a U.S. Government Agency Obligation maturing 06/28/10, market value $12,212,149 (repurchase proceeds $11,970,209) | | 11,970,000 | | 11,970,000 |
| | | | |
Total Short-Term Obligation (cost of $11,970,000) | | | | 11,970,000 |
| | | | |
Total Investments – 99.1% (cost of $459,090,930) (d) | | | | 388,327,998 |
| | | | |
Other Assets & Liabilities, Net – 0.9% | | 3,638,953 |
| | | | |
Net Assets – 100.0% | | | | 391,966,951 |
See Accompanying Notes to Financial Statements.
35
Columbia Large Cap Enhanced Core Fund
February 28, 2009
Notes to Investment Portfolio:
| (a) | Non-income producing security. |
| (b) | A portion of these securities with a market value of $3,401,150 are pledged as collateral for open futures contracts. |
| (c) | Represents fair value as determined in good faith under procedures approved by the Board of Trustees. At February 28, 2009, the value of this security amounted to $972, which represents less than 0.01% of net assets. |
| (d) | Cost for federal income tax purposes is $502,107,409. |
At February 28, 2009, the Fund held investments in the following sectors:
| | |
Sector (Unaudited) | | % of
Net Assets |
Information Technology | | 16.7 |
Health Care | | 15.0 |
Energy | | 13.4 |
Consumer Staples | | 12.9 |
Financials | | 9.5 |
Industrials | | 9.4 |
Consumer Discretionary | | 8.0 |
Utilities | | 4.3 |
Telecommunication Services | | 4.0 |
Materials | | 2.8 |
| | |
| | 96.0 |
Short-Term Obligation | | 3.1 |
Other Assets & Liabilities, Net | | 0.9 |
| | |
| | 100.0 |
| | |
At February 28, 2009, the Fund held the following open long futures contracts:
| | | | | | | | | | |
Type | | Number of
Contracts | | Value | | Aggregate
Face Value | | Expiration
Date | | Unrealized
Depreciation |
S&P 500 Index | | 85 | | $15,601,750 | | $18,061,054 | | Mar-2009 | | $(2,459,304) |
| | | | | | | | | | |
See Accompanying Notes to Financial Statements.
36
Investment Portfolio – Columbia Mid Cap Index Fund
February 28, 2009
Common Stocks – 96.9%
| | | | |
| | | Shares | | Value ($) |
| Consumer Discretionary – 15.3% | | | | |
Auto Components – 0.5% | | | | |
BorgWarner, Inc. | | 208,300 | | 3,593,175 |
Gentex Corp. | | 251,250 | | 2,010,000 |
|
Auto Components Total | | | | 5,603,175 |
| | |
Automobiles – 0.1% | | | | |
Thor Industries, Inc. | | 63,825 | | 683,566 |
|
Automobiles Total | | | | 683,566 |
| | |
Distributors – 0.3% | | | | |
LKQ Corp. (a) | | 251,500 | | 3,395,250 |
|
Distributors Total | | | | 3,395,250 |
| |
Diversified Consumer Services – 2.9% | | |
Brink’s Home Security Holdings, Inc. (a) | | 73,275 | | 1,536,577 |
Career Education Corp. (a) | | 132,350 | | 3,265,074 |
Corinthian Colleges, Inc. (a) | | 154,000 | | 3,033,800 |
DeVry, Inc. | | 110,825 | | 5,757,359 |
ITT Educational Services, Inc. (a) | | 56,425 | | 6,404,237 |
Matthews International Corp., Class A | | 55,000 | | 1,910,700 |
Regis Corp. | | 77,675 | | 978,705 |
Service Corp. International/US | | 459,800 | | 1,554,124 |
Sotheby’s | | 121,025 | | 812,078 |
Strayer Education, Inc. | | 25,600 | | 4,345,600 |
|
Diversified Consumer Services Total | | 29,598,254 |
| |
Hotels, Restaurants & Leisure – 1.6% | | |
Bob Evans Farms, Inc. | | 55,225 | | 1,020,006 |
Boyd Gaming Corp. | | 102,700 | | 436,475 |
Brinker International, Inc. | | 183,262 | | 2,015,882 |
Cheesecake Factory, Inc. (a) | | 107,400 | | 874,236 |
Chipotle Mexican Grill, Inc., Class A (a) | | 59,300 | | 3,239,559 |
International Speedway Corp., Class A | | 49,925 | | 965,050 |
Life Time Fitness, Inc. (a) | | 62,900 | | 538,424 |
Panera Bread Co., Class A (a) | | 55,200 | | 2,431,008 |
Scientific Games Corp., Class A (a) | | 117,000 | | 1,237,860 |
Wendy’s/Arby’s Group, Inc. | | 752,200 | | 3,407,466 |
|
Hotels, Restaurants & Leisure Total | | 16,165,966 |
| |
Household Durables – 1.4% | | |
American Greetings Corp., Class A | | 81,650 | | 304,555 |
Blyth Industries, Inc. | | 10,925 | | 222,979 |
Hovnanian Enterprises, Inc., Class A (a) | | 91,150 | | 77,478 |
M.D.C. Holdings, Inc. | | 66,200 | | 1,670,226 |
Mohawk Industries, Inc. (a) | | 100,950 | | 2,280,460 |
NVR, Inc. (a) | | 9,817 | | 3,266,803 |
| | | | |
| | | Shares | | Value ($) |
Ryland Group, Inc. | | 75,050 | | 1,060,457 |
Toll Brothers, Inc. (a) | | 234,350 | | 3,714,447 |
Tupperware Brands Corp. | | 111,575 | | 1,582,133 |
|
Household Durables Total | | | | 14,179,538 |
| |
Internet & Catalog Retail – 0.9% | | |
NetFlix, Inc. (a) | | 74,900 | | 2,706,886 |
Priceline.com, Inc. (a) | | 73,000 | | 6,194,780 |
|
Internet & Catalog Retail Total | | | | 8,901,666 |
| |
Leisure Equipment & Products – 0.1% | | |
Callaway Golf Co. | | 116,150 | | 786,336 |
|
Leisure Equipment & Products Total | | 786,336 |
| |
Media – 0.9% | | |
Belo Corp., Class A | | 158,100 | | 126,480 |
DreamWorks Animation SKG, Inc., Class A (a) | | 138,600 | | 2,673,594 |
Harte-Hanks, Inc. | | 68,325 | | 383,303 |
John Wiley & Sons, Inc., Class A | | 77,000 | | 2,417,030 |
Lamar Advertising Co., Class A (a) | | 136,600 | | 945,272 |
Marvel Entertainment, Inc. (a) | | 88,200 | | 2,280,852 |
Scholastic Corp. | | 47,600 | | 524,076 |
|
Media Total | | | | 9,350,607 |
| |
Multiline Retail – 0.7% | | |
99 Cents Only Stores (a) | | 84,351 | | 695,052 |
Dollar Tree, Inc. (a) | | 163,050 | | 6,329,601 |
Saks, Inc. (a) | | 255,575 | | 621,047 |
|
Multiline Retail Total | | | | 7,645,700 |
| |
Specialty Retail – 5.3% | | |
Advance Auto Parts, Inc. | | 170,400 | | 6,517,800 |
Aeropostale, Inc. (a) | | 120,225 | | 2,788,018 |
American Eagle Outfitters, Inc. | | 370,899 | | 3,619,974 |
AnnTaylor Stores Corp. (a) | | 102,825 | | 676,589 |
Barnes & Noble, Inc. | | 66,350 | | 1,190,319 |
CarMax, Inc. (a) | | 396,550 | | 3,739,466 |
Chico’s FAS, Inc. (a) | | 319,000 | | 1,445,070 |
Coldwater Creek, Inc. (a) | | 85,300 | | 144,157 |
Collective Brands, Inc. (a) | | 114,700 | | 1,187,145 |
Dick’s Sporting Goods, Inc. (a) | | 153,100 | | 1,890,785 |
Foot Locker, Inc. | | 278,725 | | 2,316,205 |
Guess ?, Inc. | | 108,300 | | 1,740,381 |
J Crew Group, Inc. (a) | | 93,300 | | 1,050,558 |
O’Reilly Automotive, Inc. (a) | | 242,050 | | 8,074,788 |
PETsMART, Inc. | | 228,700 | | 4,583,148 |
Rent-A-Center, Inc. (a) | | 120,125 | | 2,104,590 |
Ross Stores, Inc. | | 232,750 | | 6,870,780 |
Urban Outfitters, Inc. (a) | | 205,150 | | 3,413,696 |
Williams-Sonoma, Inc. | | 155,825 | | 1,360,352 |
| | | | |
Specialty Retail Total | | | | 54,713,821 |
See Accompanying Notes to Financial Statements.
37
Columbia Mid Cap Index Fund
February 28, 2009
Common Stocks (continued)
| | | | |
| | | Shares | | Value ($) |
| Consumer Discretionary (continued) | | |
Textiles, Apparel & Luxury Goods – 0.6% | | |
Hanesbrands, Inc. (a) | | 168,200 | | 1,177,400 |
Phillips-Van Heusen Corp. | | 92,600 | | 1,534,382 |
Timberland Co., Class A (a) | | 82,750 | | 930,938 |
Under Armour, Inc., Class A (a) | | 65,600 | | 943,984 |
Warnaco Group, Inc. (a) | | 83,900 | | 1,816,435 |
| | | | |
Textiles, Apparel & Luxury Goods Total | | 6,403,139 |
| | | | |
Consumer Discretionary Total | | | | 157,427,018 |
| | | | |
| Consumer Staples – 4.6% | | | | |
Beverages – 0.6% | | | | |
Hansen Natural Corp. (a) | | 133,000 | | 4,426,240 |
PepsiAmericas, Inc. | | 103,100 | | 1,712,491 |
| | | | |
Beverages Total | | 6,138,731 |
| | |
Food & Staples Retailing – 0.5% | | | | |
BJ’s Wholesale Club, Inc. (a) | | 105,750 | | 3,159,810 |
Ruddick Corp. | | 70,450 | | 1,527,356 |
| | | | |
Food & Staples Retailing Total | | | | 4,687,166 |
| | |
Food Products – 1.9% | | | | |
Corn Products International, Inc. | | 134,000 | | 2,702,780 |
Flowers Foods, Inc. | | 141,800 | | 3,163,558 |
Hormel Foods Corp. | | 126,125 | | 4,014,559 |
Lancaster Colony Corp. | | 35,725 | | 1,388,988 |
Ralcorp Holdings, Inc. (a) | | 101,400 | | 6,144,840 |
Smithfield Foods, Inc. (a) | | 208,625 | | 1,637,706 |
Tootsie Roll Industries, Inc. | | 46,618 | | 998,558 |
| | | | |
Food Products Total | | | | 20,050,989 |
| | |
Household Products – 1.0% | | | | |
Church & Dwight Co., Inc. | | 126,000 | | 6,163,920 |
Energizer Holdings, Inc. (a) | | 104,875 | | 4,424,676 |
|
Household Products Total | | | | 10,588,596 |
| |
Personal Products – 0.5% | | |
Alberto-Culver Co. | | 153,300 | | 3,394,062 |
NBTY, Inc. (a) | | 98,600 | | 1,466,182 |
|
Personal Products Total | | | | 4,860,244 |
| | |
Tobacco – 0.1% | | | | |
Universal Corp. | | 44,925 | | 1,291,144 |
|
Tobacco Total | | | | 1,291,144 |
| | | | |
Consumer Staples Total | | | | 47,616,870 |
| | | | |
| Energy – 6.7% | | | | |
Energy Equipment & Services – 3.0% | | |
Exterran Holdings, Inc. (a) | | 116,399 | | 2,106,822 |
FMC Technologies, Inc. (a) | | 224,950 | | 5,958,925 |
| | | | |
| | | Shares | | Value ($) |
Helix Energy Solutions Group, Inc. (a) | | 165,200 | | 513,772 |
Helmerich & Payne, Inc. | | 189,300 | | 4,478,838 |
Oceaneering International, Inc. (a) | | 98,000 | | 3,113,460 |
Patterson-UTI Energy, Inc. | | 278,125 | | 2,389,094 |
Pride International, Inc. (a) | | 311,325 | | 5,367,243 |
Superior Energy Services, Inc. (a) | | 139,500 | | 1,840,005 |
Tidewater, Inc. | | 92,675 | | 3,273,281 |
Unit Corp. (a) | | 85,000 | | 1,816,450 |
|
Energy Equipment & Services Total | | 30,857,890 |
| |
Oil, Gas & Consumable Fuels – 3.7% | | |
Arch Coal, Inc. | | 257,050 | | 3,572,995 |
Bill Barrett Corp. (a) | | 66,600 | | 1,288,044 |
Cimarex Energy Co. | | 149,800 | | 2,943,570 |
Comstock Resources, Inc. (a) | | 82,800 | | 2,519,604 |
Denbury Resources, Inc. (a) | | 444,400 | | 5,723,872 |
Encore Acquisition Co. (a) | | 94,900 | | 1,905,592 |
Forest Oil Corp. (a) | | 174,750 | | 2,477,955 |
Frontier Oil Corp. | | 186,900 | | 2,551,185 |
Mariner Energy, Inc. (a) | | 159,900 | | 1,479,075 |
Newfield Exploration Co. (a) | | 237,900 | | 4,598,607 |
Overseas Shipholding Group, Inc. | | 45,325 | | 1,165,759 |
Patriot Coal Corp. (a) | | 114,200 | | 416,830 |
Plains Exploration & Production Co. (a) | | 193,525 | | 3,704,069 |
Quicksilver Resources, Inc. (a) | | 201,100 | | 1,206,600 |
Southern Union Co. | | 223,000 | | 2,990,430 |
| | | | |
Oil, Gas & Consumable Fuels Total | | | | 38,544,187 |
| | | | |
Energy Total | | | | 69,402,077 |
| | | | |
| Financials – 16.8% | | | | |
Capital Markets – 1.6% | | | | |
Affiliated Managers Group, Inc. (a) | | 73,900 | | 2,658,922 |
Apollo Investment Corp. | | 255,900 | | 1,056,867 |
Eaton Vance Corp. | | 208,800 | | 3,612,240 |
Jefferies Group, Inc. | | 217,650 | | 2,152,558 |
Raymond James Financial, Inc. | | 173,480 | | 2,421,781 |
SEI Investments Co. | | 240,000 | | 2,841,600 |
Waddell & Reed Financial, Inc., Class A | | 152,550 | | 2,154,006 |
| | | | |
Capital Markets Total | | | | 16,897,974 |
| | |
Commercial Banks – 3.7% | | | | |
Associated Banc Corp. | | 229,762 | | 3,322,359 |
Bancorpsouth, Inc. | | 130,100 | | 2,423,763 |
Bank of Hawaii Corp. | | 85,875 | | 2,751,435 |
Cathay General Bancorp | | 89,100 | | 866,052 |
City National Corp. | | 72,750 | | 2,333,820 |
Colonial BancGroup, Inc. | | 364,200 | | 163,890 |
See Accompanying Notes to Financial Statements.
38
Columbia Mid Cap Index Fund
February 28, 2009
Common Stocks (continued)
| | | | |
| | | Shares | | Value ($) |
| Financials (continued) | | | | |
Commercial Banks (continued) | | | | |
Commerce Bancshares Inc/Kansas City MO | | 118,670 | | 4,121,409 |
Cullen/Frost Bankers, Inc. | | 106,750 | | 4,594,520 |
FirstMerit Corp. | | 145,625 | | 2,142,144 |
Fulton Financial Corp. | | 314,800 | | 1,958,056 |
International Bancshares Corp. | | 91,300 | | 913,913 |
PacWest Bancorp | | 44,100 | | 603,288 |
SVB Financial Group (a) | | 59,000 | | 964,650 |
Synovus Financial Corp. | | 505,100 | | 1,757,748 |
TCF Financial Corp. | | 207,325 | | 2,541,804 |
Valley National Bancorp | | 242,800 | | 2,775,204 |
Webster Financial Corp. | | 94,875 | | 368,115 |
Westamerica Bancorporation | | 51,950 | | 2,071,246 |
Wilmington Trust Corp. | | 122,525 | | 1,102,725 |
| | | | |
Commercial Banks Total | | | | 37,776,141 |
| | |
Consumer Finance – 0.1% | | | | |
AmeriCredit Corp. (a) | | 236,450 | | 910,332 |
| | | | |
Consumer Finance Total | | | | 910,332 |
| | |
Insurance – 5.0% | | | | |
American Financial Group, Inc. | | 135,150 | | 2,102,934 |
Arthur J. Gallagher & Co. | | 170,900 | | 2,712,183 |
Brown & Brown, Inc. | | 208,750 | | 3,521,612 |
Everest Re Group Ltd. | | 110,525 | | 7,198,493 |
Fidelity National Financial, Inc., Class A | | 381,000 | | 6,313,170 |
First American Corp. | | 167,025 | | 3,869,969 |
Hanover Insurance Group, Inc. | | 89,675 | | 3,153,870 |
HCC Insurance Holdings, Inc. | | 206,375 | | 4,529,931 |
Horace Mann Educators Corp. | | 70,250 | | 540,223 |
Mercury General Corp. | | 64,000 | | 1,725,440 |
Old Republic International Corp. | | 415,133 | | 3,769,408 |
Protective Life Corp. | | 125,800 | | 475,524 |
Reinsurance Group of America, Inc. | | 130,500 | | 3,549,600 |
Stancorp Financial Group, Inc. | | 88,050 | | 1,584,019 |
Unitrin, Inc. | | 88,575 | | 954,839 |
W.R. Berkley Corp. | | 249,470 | | 5,191,471 |
| | | | |
Insurance Total | | | | 51,192,686 |
|
Real Estate Investment Trusts (REITs) – 5.0% |
Alexandria Real Estate Equities, Inc. | | 58,000 | | 2,317,680 |
AMB Property Corp. | | 177,225 | | 2,110,750 |
BRE Properties, Inc. | | 91,900 | | 1,738,748 |
Camden Property Trust | | 95,800 | | 1,800,082 |
Cousins Properties, Inc. | | 78,600 | | 558,846 |
Duke Realty Corp. | | 265,100 | | 1,829,190 |
Equity One, Inc. | | 59,300 | | 662,974 |
| | | | |
| | | Shares | | Value ($) |
Essex Property Trust, Inc. | | 48,200 | | 2,622,080 |
Federal Realty Investment Trust | | 106,100 | | 4,363,893 |
Highwoods Properties, Inc. | | 114,400 | | 2,161,016 |
Hospitality Properties Trust | | 169,075 | | 1,927,455 |
Liberty Property Trust | | 176,625 | | 3,226,939 |
Macerich Co. | | 136,900 | | 1,563,398 |
Mack-Cali Realty Corp. | | 118,475 | | 2,023,553 |
Nationwide Health Properties, Inc. | | 178,700 | | 3,620,462 |
Omega Healthcare Investors, Inc. | | 148,100 | | 1,944,553 |
Potlatch Corp. | | 71,131 | | 1,619,653 |
Rayonier, Inc. | | 141,785 | | 3,771,481 |
Realty Income Corp. | | 187,600 | | 3,288,628 |
Regency Centers Corp. | | 125,900 | | 3,396,782 |
SL Green Realty Corp. | | 102,600 | | 1,192,212 |
UDR, Inc. | | 265,540 | | 2,100,424 |
Weingarten Realty Investors | | 139,400 | | 1,573,826 |
| | | | |
Real Estate Investment Trusts (REITs) Total | | 51,414,625 |
|
Real Estate Management & Development – 0.1% |
Jones Lang LaSalle, Inc. | | 62,100 | | 1,237,032 |
| | | | |
Real Estate Management & Development Total | | 1,237,032 |
|
Thrifts & Mortgage Finance – 1.3% |
Astoria Financial Corp. | | 144,900 | | 1,036,035 |
First Niagara Financial Group, Inc. | | 213,263 | | 2,478,116 |
New York Community Bancorp, Inc. | | 619,203 | | 6,099,150 |
NewAlliance Bancshares, Inc. | | 192,600 | | 2,199,492 |
PMI Group, Inc. | | 124,850 | | 63,673 |
Washington Federal, Inc. | | 158,227 | | 1,802,206 |
| | | | |
Thrifts & Mortgage Finance Total | | | | 13,678,672 |
| | | | |
Financials Total | | | | 173,107,462 |
| | | | |
| Health Care – 12.1% | | | | |
Biotechnology – 1.1% | | | | |
United Therapeutics Corp. (a) | | 41,800 | | 2,805,198 |
Vertex Pharmaceuticals, Inc. (a) | | 288,675 | | 8,726,645 |
| | | | |
Biotechnology Total | | | | 11,531,843 |
|
Health Care Equipment & Supplies – 4.3% |
Beckman Coulter, Inc. | | 112,700 | | 5,053,468 |
Edwards Lifesciences Corp. (a) | | 100,150 | | 5,569,341 |
Gen-Probe, Inc. (a) | | 97,800 | | 3,967,746 |
Hill-Rom Holdings, Inc. | | 112,500 | | 1,104,750 |
Hologic, Inc. (a) | | 461,000 | | 5,218,520 |
IDEXX Laboratories, Inc. (a) | | 107,100 | | 3,223,710 |
Immucor, Inc. (a) | | 126,800 | | 2,845,392 |
See Accompanying Notes to Financial Statements.
39
Columbia Mid Cap Index Fund
February 28, 2009
Common Stocks (continued)
| | | | |
| | | Shares | | Value ($) |
| Health Care (continued) | | | | |
Health Care Equipment & Supplies (continued) |
Kinetic Concepts, Inc. (a) | | 100,800 | | 2,195,424 |
Masimo Corp. (a) | | 86,200 | | 2,154,138 |
ResMed, Inc. (a) | | 136,200 | | 5,023,056 |
STERIS Corp. | | 105,925 | | 2,442,631 |
Teleflex, Inc. | | 71,450 | | 3,393,875 |
Thoratec Corp. (a) | | 100,900 | | 2,304,556 |
| | | | |
Health Care Equipment & Supplies Total | | 44,496,607 |
| |
Health Care Providers & Services – 3.1% | | |
Community Health Systems, Inc. (a) | | 167,750 | | 2,744,390 |
Health Management Associates, Inc., Class A (a) | | 439,000 | | 943,850 |
Health Net, Inc. (a) | | 186,525 | | 2,462,130 |
Henry Schein, Inc. (a) | | 160,750 | | 5,896,310 |
Kindred Healthcare, Inc. (a) | | 53,900 | | 775,621 |
LifePoint Hospitals, Inc. (a) | | 96,100 | | 2,020,022 |
Lincare Holdings, Inc. (a) | | 133,800 | | 2,819,166 |
Omnicare, Inc. | | 187,325 | | 4,857,337 |
Psychiatric Solutions, Inc. (a) | | 100,600 | | 1,704,164 |
Universal Health Services, Inc., Class B | | 91,100 | | 3,355,213 |
VCA Antech, Inc. (a) | | 152,300 | | 3,166,317 |
WellCare Health Plans, Inc. (a) | | 75,000 | | 677,250 |
| | | | |
Health Care Providers & Services Total | | 31,421,770 |
| | |
Health Care Technology – 0.4% | | | | |
Cerner Corp. (a) | | 122,400 | | 4,479,840 |
| | | | |
Health Care Technology Total | | | | 4,479,840 |
| |
Life Sciences Tools & Services – 1.9% | | |
Affymetrix, Inc. (a) | | 126,300 | | 269,019 |
Bio-Rad Laboratories, Inc., Class A (a) | | 34,400 | | 1,916,080 |
Charles River Laboratories International, Inc. (a) | | 121,750 | | 3,019,400 |
Covance, Inc. (a) | | 113,850 | | 4,324,023 |
Pharmaceutical Product Development, Inc. | | 212,100 | | 5,088,279 |
Techne Corp. | | 68,400 | | 3,341,340 |
Varian, Inc. (a) | | 52,050 | | 1,177,892 |
| | | | |
Life Sciences Tools & Services Total | | 19,136,033 |
| | |
Pharmaceuticals – 1.3% | | | | |
Endo Pharmaceuticals Holdings, Inc. (a) | | 210,600 | | 3,997,188 |
Medicis Pharmaceutical Corp., Class A | | 102,000 | | 1,150,560 |
Perrigo Co. | | 139,725 | | 2,807,075 |
Sepracor, Inc. (a) | | 195,825 | | 2,933,459 |
| | | | |
| | | Shares | | Value ($) |
Valeant Pharmaceuticals International (a) | | 146,575 | | 2,550,405 |
| | | | |
Pharmaceuticals Total | | | | 13,438,687 |
| | | | |
Health Care Total | | | | 124,504,780 |
| | | | |
| Industrials – 13.4% | | | | |
Aerospace & Defense – 0.5% | | | | |
Alliant Techsystems, Inc. (a) | | 58,875 | | 4,160,107 |
BE Aerospace, Inc. (a) | | 178,900 | | 1,334,594 |
| | | | |
Aerospace & Defense Total | | | | 5,494,701 |
| | |
Airlines – 0.3% | | | | |
AirTran Holdings, Inc. (a) | | 210,850 | | 630,442 |
Alaska Air Group, Inc. (a) | | 65,150 | | 1,427,436 |
JetBlue Airways Corp. (a) | | 329,680 | | 1,256,081 |
| | | | |
Airlines Total | | | | 3,313,959 |
| |
Commercial Services & Supplies – 1.7% | | |
Brink’s Co. | | 73,275 | | 1,749,074 |
Clean Harbors, Inc. (a) | | 36,300 | | 1,763,454 |
Copart, Inc. (a) | | 113,975 | | 3,079,605 |
Corrections Corp. of America (a) | | 226,100 | | 2,401,182 |
Deluxe Corp. | | 92,000 | | 710,240 |
Herman Miller, Inc. | | 96,525 | | 972,972 |
HNI Corp. | | 79,625 | | 781,121 |
Mine Safety Appliances Co. | | 53,400 | | 974,550 |
Rollins, Inc. | | 74,377 | | 1,175,157 |
Waste Connections, Inc. (a) | | 143,400 | | 3,418,656 |
| | | | |
Commercial Services & Supplies Total | | 17,026,011 |
| |
Construction & Engineering – 2.0% | | |
Dycom Industries, Inc. (a) | | 70,850 | | 327,327 |
Granite Construction, Inc. | | 59,175 | | 2,105,446 |
KBR, Inc. | | 290,600 | | 3,661,560 |
Quanta Services, Inc. (a) | | 354,975 | | 6,247,560 |
Shaw Group, Inc. (a) | | 150,300 | | 3,508,002 |
URS Corp. (a) | | 150,200 | | 4,644,184 |
| | | | |
Construction & Engineering Total | | | | 20,494,079 |
| |
Electrical Equipment – 1.8% | | |
AMETEK, Inc. | | 192,025 | | 5,080,981 |
Hubbell, Inc., Class B | | 100,925 | | 2,656,346 |
Roper Industries, Inc. | | 161,400 | | 6,673,890 |
Thomas & Betts Corp. (a) | | 100,600 | | 2,304,746 |
Woodward Governor Co. | | 98,100 | | 1,689,282 |
| | | | |
Electrical Equipment Total | | | | 18,405,245 |
| |
Industrial Conglomerates – 0.2% | | |
Carlisle Companies, Inc. | | 109,700 | | 2,174,254 |
| | | | |
Industrial Conglomerates Total | | | | 2,174,254 |
See Accompanying Notes to Financial Statements.
40
Columbia Mid Cap Index Fund
February 28, 2009
Common Stocks (continued)
| | | | |
| | | Shares | | Value ($) |
| Industrials (continued) | | | | |
Machinery – 4.1% | | |
AGCO Corp. (a) | | 165,075 | | 2,829,386 |
Bucyrus International, Inc. | | 134,700 | | 1,672,974 |
Crane Co. | | 87,200 | | 1,314,976 |
Donaldson Co., Inc. | �� | 138,400 | | 3,378,344 |
Federal Signal Corp. | | 85,225 | | 538,622 |
Graco, Inc. | | 107,087 | | 1,818,337 |
Harsco Corp. | | 150,200 | | 3,103,132 |
IDEX Corp. | | 148,700 | | 2,872,884 |
Joy Global, Inc. | | 183,800 | | 3,209,148 |
Kennametal, Inc. | | 131,500 | | 2,146,080 |
Lincoln Electric Holdings, Inc. | | 77,000 | | 2,366,210 |
Nordson Corp. | | 61,325 | | 1,526,993 |
Oshkosh Corp. | | 133,900 | | 838,214 |
Pentair, Inc. | | 177,475 | | 3,703,903 |
SPX Corp. | | 97,925 | | 4,336,119 |
Terex Corp. (a) | | 170,700 | | 1,522,644 |
Timken Co. | | 152,900 | | 1,862,322 |
Trinity Industries, Inc. | | 143,100 | | 1,056,078 |
Wabtec Corp. | | 87,200 | | 2,333,472 |
| | | | |
Machinery Total | | | | 42,429,838 |
| | |
Marine – 0.1% | | | | |
Alexander & Baldwin, Inc. | | 74,400 | | 1,397,976 |
| | | | |
Marine Total | | | | 1,397,976 |
| | |
Professional Services – 1.1% | | | | |
Corporate Executive Board Co. | | 61,200 | | 918,000 |
FTI Consulting, Inc. (a) | | 91,400 | | 3,339,756 |
Kelly Services, Inc., Class A | | 49,400 | | 375,440 |
Korn/Ferry International (a) | | 80,525 | | 744,051 |
Manpower, Inc. | | 140,275 | | 3,910,867 |
MPS Group, Inc. (a) | | 166,125 | | 825,641 |
Navigant Consulting, Inc. (a) | | 84,200 | | 1,092,074 |
| | | | |
Professional Services Total | | | | 11,205,829 |
| | |
Road & Rail – 1.1% | | | | |
Con-way, Inc. | | 82,450 | | 1,245,819 |
J.B. Hunt Transport Services, Inc. | | 147,350 | | 3,002,993 |
Kansas City Southern (a) | | 164,200 | | 2,904,698 |
Landstar System, Inc. | | 94,300 | | 2,984,595 |
Werner Enterprises, Inc. | | 76,643 | | 1,043,878 |
YRC Worldwide, Inc. (a) | | 106,600 | | 234,520 |
| | | | |
Road & Rail Total | | | | 11,416,503 |
| |
Trading Companies & Distributors – 0.5% | | |
GATX Corp. | | 87,575 | | 1,599,995 |
MSC Industrial Direct Co., Class A | | 80,600 | | 2,465,554 |
United Rentals, Inc. (a) | | 107,750 | | 436,388 |
| | | | |
Trading Companies & Distributors Total | | 4,501,937 |
| | | | |
Industrials Total | | | | 137,860,332 |
| | | | |
| | | Shares | | Value ($) |
| Information Technology – 13.3% | | | | |
Communications Equipment – 1.1% | | | | |
3Com Corp. (a) | | 730,800 | | 1,615,068 |
ADC Telecommunications, Inc. (a) | | 173,500 | | 492,740 |
ADTRAN, Inc. | | 98,575 | | 1,423,423 |
Avocent Corp. (a) | | 80,550 | | 964,989 |
CommScope, Inc. (a) | | 126,553 | | 1,130,118 |
F5 Networks, Inc. (a) | | 143,300 | | 2,866,000 |
Plantronics, Inc. | | 87,925 | | 755,276 |
Polycom, Inc. (a) | | 149,700 | | 1,991,010 |
| | | | |
Communications Equipment Total | | | | 11,238,624 |
| | |
Computers & Peripherals – 1.2% | | | | |
Diebold, Inc. | | 118,925 | | 2,630,621 |
Imation Corp. | | 54,275 | | 436,371 |
NCR Corp. (a) | | 283,900 | | 2,248,488 |
Palm, Inc. (a) | | 197,500 | | 1,429,900 |
Western Digital Corp. (a) | | 398,600 | | 5,444,876 |
| | | | |
Computers & Peripherals Total | | | | 12,190,256 |
|
Electronic Equipment, Instruments & Components – 2.1% |
Arrow Electronics, Inc. (a) | | 214,575 | | 3,568,382 |
Avnet, Inc. (a) | | 271,050 | | 4,681,034 |
Ingram Micro, Inc., Class A (a) | | 296,600 | | 3,229,974 |
Mettler-Toledo International, Inc. (a) | | 60,300 | | 3,214,593 |
National Instruments Corp. | | 102,562 | | 1,767,143 |
Tech Data Corp. (a) | | 89,950 | | 1,555,236 |
Trimble Navigation Ltd. (a) | | 215,100 | | 3,032,910 |
Vishay Intertechnology, Inc. (a) | | 335,575 | | 855,716 |
| | | | |
Electronic Equipment, Instruments & Components Total | | 21,904,988 |
| |
Internet Software & Services – 0.3% | | |
Digital River, Inc. (a) | | 66,700 | | 1,595,464 |
ValueClick, Inc. (a) | | 156,100 | | 978,747 |
| | | | |
Internet Software & Services Total | | | | 2,574,211 |
| | |
IT Services – 3.8% | | | | |
Acxiom Corp. | | 122,175 | | 1,011,609 |
Alliance Data Systems Corp. (a) | | 116,125 | | 3,437,300 |
Broadridge Financial Solutions, Inc. | | 254,400 | | 4,065,312 |
DST Systems, Inc. (a) | | 73,200 | | 2,153,544 |
Gartner, Inc. (a) | | 106,625 | | 1,077,979 |
Global Payments, Inc. | | 144,300 | | 4,427,124 |
Hewitt Associates, Inc., Class A (a) | | 150,900 | | 4,451,550 |
Lender Processing Services, Inc. | | 150,800 | | 3,949,452 |
Mantech International Corp., Class A (a) | | 37,600 | | 1,961,592 |
Metavante Technologies, Inc. (a) | | 161,429 | | 2,713,621 |
NeuStar, Inc., Class A (a) | | 141,900 | | 2,198,031 |
See Accompanying Notes to Financial Statements.
41
Columbia Mid Cap Index Fund
February 28, 2009
Common Stocks (continued)
| | | | |
| | | Shares | | Value ($) |
| Information Technology (continued) | | |
IT Services (continued) | | | | |
SAIC, Inc. (a) | | 364,700 | | 6,896,477 |
SRA International, Inc., Class A (a) | | 75,700 | | 1,028,006 |
| | | | |
IT Services Total | | | | 39,371,597 |
| | |
| Office Electronics – 0.2% | | | | |
Zebra Technologies Corp., Class A (a) | | 114,075 | | 2,004,298 |
| | | | |
Office Electronics Total | | | | 2,004,298 |
|
| Semiconductors & Semiconductor Equipment – 1.9% |
Atmel Corp. (a) | | 805,850 | | 2,876,884 |
Cree, Inc. (a) | | 158,875 | | 3,120,305 |
Fairchild Semiconductor International, Inc. (a) | | 223,350 | | 781,725 |
Integrated Device Technology, Inc. (a) | | 304,092 | | 1,362,332 |
International Rectifier Corp. (a) | | 131,075 | | 1,644,991 |
Intersil Corp., Class A | | 221,000 | | 2,234,310 |
Lam Research Corp. (a) | | 224,775 | | 4,396,599 |
RF Micro Devices, Inc. (a) | | 473,400 | | 430,794 |
Semtech Corp. (a) | | 108,700 | | 1,277,225 |
Silicon Laboratories, Inc. (a) | | 83,175 | | 1,821,533 |
| | | | |
Semiconductors & Semiconductor Equipment Total | | 19,946,698 |
| | |
| Software – 2.7% | | | | |
ACI Worldwide, Inc. (a) | | 62,800 | | 1,121,608 |
Advent Software, Inc. (a) | | 30,025 | | 817,881 |
ANSYS, Inc. (a) | | 161,400 | | 3,255,438 |
Cadence Design Systems, Inc. (a) | | 468,175 | | 1,966,335 |
FactSet Research Systems, Inc. | | 75,800 | | 2,921,332 |
Fair Isaac Corp. | | 87,200 | | 954,840 |
Jack Henry & Associates, Inc. | | 152,025 | | 2,421,758 |
Macrovision Solutions Corp. (a) | | 150,100 | | 2,361,073 |
Mentor Graphics Corp. (a) | | 166,175 | | 736,155 |
Parametric Technology Corp. (a) | | 209,000 | | 1,701,260 |
Sybase, Inc. (a) | | 145,775 | | 3,962,165 |
Synopsys, Inc. (a) | | 259,225 | | 4,829,362 |
Wind River Systems, Inc. (a) | | 122,125 | | 922,044 |
| | | | |
Software Total | | | | 27,971,251 |
| | | | |
Information Technology Total | | | | 137,201,923 |
| | | | |
| Materials – 6.4% | | | | |
| Chemicals – 3.5% | | | | |
Airgas, Inc. | | 145,675 | | 4,485,333 |
Albemarle Corp. | | 164,050 | | 3,174,367 |
Ashland, Inc. | | 119,000 | | 703,290 |
Cabot Corp. | | 117,725 | | 1,233,758 |
| | | | |
| | | Shares | | Value ($) |
Chemtura Corp. | | 436,200 | | 148,308 |
Cytec Industries, Inc. | | 84,775 | | 1,305,535 |
Ferro Corp. | | 78,725 | | 115,726 |
FMC Corp. | | 133,200 | | 5,385,276 |
Lubrizol Corp. | | 121,000 | | 3,326,290 |
Minerals Technologies, Inc. | | 33,700 | | 1,008,304 |
Olin Corp. | | 138,325 | | 1,444,113 |
RPM International, Inc. | | 231,600 | | 2,510,544 |
Scotts Miracle-Gro Co., Class A | | 78,750 | | 2,199,488 |
Sensient Technologies Corp. | | 87,000 | | 1,757,400 |
Terra Industries, Inc. | | 183,700 | | 4,737,623 |
Valspar Corp. | | 179,550 | | 2,998,485 |
| | | | |
Chemicals Total | | | | 36,533,840 |
| | |
Construction Materials – 0.6% | | | | |
Martin Marietta Materials, Inc. | | 74,475 | | 5,701,806 |
| | | | |
Construction Materials Total | | | | 5,701,806 |
| | |
Containers & Packaging – 1.1% | | | | |
AptarGroup, Inc. | | 121,500 | | 3,409,290 |
Greif, Inc., Class A | | 61,300 | | 1,884,975 |
Packaging Corp. of America | | 184,175 | | 1,950,413 |
Sonoco Products Co. | | 179,400 | | 3,457,038 |
Temple-Inland, Inc. | | 191,600 | | 910,100 |
| | | | |
Containers & Packaging Total | | | | 11,611,816 |
| | |
Metals & Mining – 1.2% | | | | |
Carpenter Technology Corp. | | 79,300 | | 1,086,410 |
Cliffs Natural Resources, Inc. | | 204,200 | | 3,150,806 |
Commercial Metals Co. | | 204,700 | | 2,089,987 |
Reliance Steel & Aluminum Co. | | 114,700 | | 2,728,713 |
Steel Dynamics, Inc. | | 290,900 | | 2,429,015 |
Worthington Industries, Inc. | | 107,800 | | 883,960 |
| | | | |
Metals & Mining Total | | | | 12,368,891 |
| | |
Paper & Forest Products – 0.0% | | | | |
Louisiana-Pacific Corp. | | 163,500 | | 264,870 |
| | | | |
Paper & Forest Products Total | | | | 264,870 |
| | | | |
Materials Total | | | | 66,481,223 |
| | | | |
| Telecommunication Services – 0.8% | | | | |
| Diversified Telecommunication Services – 0.1% |
Cincinnati Bell, Inc. (a) | | 414,475 | | 688,029 |
| | | | |
Diversified Telecommunication Services Total | | 688,029 |
|
Wireless Telecommunication Services – 0.7% |
Syniverse Holdings, Inc. (a) | | 93,600 | | 1,416,168 |
Telephone & Data Systems, Inc. | | 191,541 | | 5,650,459 |
| | | | |
Wireless Telecommunication Services Total | | 7,066,627 |
| | | | |
Telecommunication Services Total | | 7,754,656 |
See Accompanying Notes to Financial Statements.
42
Columbia Mid Cap Index Fund
February 28, 2009
Common Stocks (continued)
| | | | |
| | | Shares | | Value ($) |
| Utilities – 7.5% | | | | |
| Electric Utilities – 2.4% | | | | |
DPL, Inc. | | 208,625 | | 4,193,362 |
Great Plains Energy, Inc. | | 213,954 | | 2,896,937 |
Hawaiian Electric Industries, Inc. | | 162,100 | | 2,248,327 |
IDACORP, Inc. | | 82,000 | | 1,995,880 |
Northeast Utilities | | 280,075 | | 6,136,443 |
NV Energy, Inc. | | 421,200 | | 3,904,524 |
Westar Energy, Inc. | | 194,825 | | 3,292,543 |
| | | | |
Electric Utilities Total | | | | 24,668,016 |
| | |
Gas Utilities – 2.3% | | | | |
AGL Resources, Inc. | | 138,125 | | 3,831,588 |
Energen Corp. | | 129,000 | | 3,457,200 |
National Fuel Gas Co. | | 142,375 | | 4,315,386 |
ONEOK, Inc. | | 188,000 | | 4,199,920 |
UGI Corp. | | 194,100 | | 4,656,459 |
WGL Holdings, Inc. | | 89,925 | | 2,730,123 |
| | | | |
Gas Utilities Total | | | | 23,190,676 |
|
Independent Power Producers & Energy Traders – 0.1% |
Black Hills Corp. | | 69,200 | | 1,232,452 |
| | | | |
Independent Power Producers & Energy Traders Total | | 1,232,452 |
| | |
Multi-Utilities – 2.3% | | | | |
Alliant Energy Corp. | | 198,675 | | 4,595,353 |
MDU Resources Group, Inc. | | 330,405 | | 5,002,332 |
NSTAR | | 192,100 | | 6,179,857 |
OGE Energy Corp. | | 166,950 | | 3,659,544 |
PNM Resources, Inc. | | 155,550 | | 1,196,179 |
Vectren Corp. | | 145,700 | | 3,039,302 |
| | | | |
Multi-Utilities Total | | | | 23,672,567 |
| | |
Water Utilities – 0.4% | | | | |
Aqua America, Inc. | | 243,174 | | 4,474,402 |
| | | | |
Water Utilities Total | | | | 4,474,402 |
| | | | |
Utilities Total | | | | 77,238,113 |
| | | | |
Total Common Stocks
(cost of $1,531,207,726) | | | | 998,594,454 |
Short-Term Obligation – 1.4%
| | | | |
| | | Par ($) | | Value ($) |
Repurchase agreement with Fixed Income Clearing Corp., dated 02/27/09, due 03/02/09 at 0.210%, collateralized by a U.S. Government Agency Obligation maturing 06/15/10, market value $14,780,460 (repurchase proceeds $14,488,254) | | 14,488,000 | | 14,488,000 |
| | | | |
Total Short-Term Obligation
(cost of $14,488,000) | | 14,488,000 |
| | | | |
Total Investments – 98.3%
(cost of $1,545,695,726) (b) | | 1,013,082,454 |
| | | | |
Other Assets & Liabilities, Net – 1.7% | | 17,829,134 |
| | | | |
Net Assets – 100.0% | | | | 1,030,911,588 |
Notes to Investment Portfolio:
| (a) | Non-income producing security. |
| (b) | Cost for federal income tax purposes is $1,562,417,931. |
At February 28, 2009, the Fund held investments in the following sectors:
| | |
Sector (Unaudited) | | % of
Net Assets |
Financials | | 16.8 |
Consumer Discretionary | | 15.3 |
Industrials | | 13.4 |
Information Technology | | 13.3 |
Health Care | | 12.1 |
Utilities | | 7.5 |
Energy | | 6.7 |
Materials | | 6.4 |
Consumer Staples | | 4.6 |
Telecommunication Services | | 0.8 |
| | |
| | 96.9 |
Short-Term Obligation | | 1.4 |
Other Assets & Liabilities, Net | | 1.7 |
| | |
| | 100.0 |
| | |
At February 28, 2009, the Fund held the following open long futures contracts:
| | | | | | | | | | | | | | |
Type | | Number of
Contracts | | Value | | Aggregate
Face Value | | Expiration
Date | | Unrealized
Depreciation | |
S&P Mid Cap 400 Index | | 677 | | $ | 30,390,530 | | $ | 33,110,759 | | Mar-2009 | | $ | (2,720,229 | ) |
| | | | | | | | | | | | | | |
On February 28, 2009, cash of $10,700,000 was pledged as collateral for open futures contracts and was being held at the broker of the futures contracts.
See Accompanying Notes to Financial Statements.
43
Investment Portfolio – Columbia Small Cap Index Fund
February 28, 2009
Common Stocks – 97.8%
| | | | |
| | | Shares | | Value ($) |
| Consumer Discretionary – 13.0% | | | | |
Auto Components – 0.2% | | | | |
Drew Industries, Inc. (a) | | 52,500 | | 326,025 |
Spartan Motors, Inc. | | 88,800 | | 202,464 |
Standard Motor Products, Inc. | | 32,500 | | 67,925 |
Superior Industries International, Inc. | | 63,000 | | 641,970 |
| | | | |
Auto Components Total | | | | 1,238,384 |
| | |
Automobiles – 0.0% | | | | |
Winnebago Industries, Inc. | | 79,000 | | 319,950 |
| | | | |
Automobiles Total | | | | 319,950 |
| | |
Distributors – 0.0% | | | | |
Audiovox Corp., Class A (a) | | 50,300 | | 140,840 |
| | | | |
Distributors Total | | | | 140,840 |
| |
Diversified Consumer Services – 1.2% | | |
Capella Education Co. (a) | | 38,500 | | 2,135,210 |
Coinstar, Inc. (a) | | 76,700 | | 2,004,938 |
Hillenbrand, Inc. | | 167,900 | | 2,815,683 |
Pre-Paid Legal Services, Inc. (a) | | 20,500 | | 654,155 |
Universal Technical Institute, Inc. (a) | | 58,600 | | 646,358 |
| | | | |
Diversified Consumer Services Total | | 8,256,344 |
|
Hotels, Restaurants & Leisure – 3.2% |
Buffalo Wild Wings, Inc. (a) | | 48,400 | | 1,494,108 |
California Pizza Kitchen, Inc. (a) | | 65,500 | | 681,200 |
CEC Entertainment, Inc. (a) | | 61,650 | | 1,439,528 |
CKE Restaurants, Inc. | | 148,400 | | 1,034,348 |
Cracker Barrel Old Country Store, Inc. | | 60,800 | | 1,360,704 |
DineEquity, Inc. | | 41,800 | | 307,230 |
Interval Leisure Group, Inc. (a) | | 106,900 | | 427,600 |
Jack in the Box, Inc. (a) | | 154,200 | | 2,997,648 |
Landry’s Restaurants, Inc. | | 33,800 | | 179,140 |
Marcus Corp. | | 57,300 | | 474,444 |
Monarch Casino & Resort, Inc. (a) | | 31,100 | | 226,719 |
Multimedia Games, Inc. (a) | | 62,800 | | 118,064 |
O’Charleys, Inc. | | 57,900 | | 130,854 |
P.F. Chang’s China Bistro, Inc. (a) | | 64,600 | | 1,272,620 |
Papa John’s International, Inc. (a) | | 58,400 | | 1,293,560 |
Peet’s Coffee & Tea, Inc. (a) | | 32,400 | | 698,220 |
Pinnacle Entertainment, Inc. (a) | | 162,900 | | 1,223,379 |
Red Robin Gourmet Burgers, Inc. (a) | | 42,000 | | 596,820 |
Ruby Tuesday, Inc. (a) | | 143,300 | | 163,362 |
Ruth’s Hospitality Group, Inc. (a) | | 52,600 | | 52,600 |
Shuffle Master, Inc. (a) | | 150,850 | | 446,516 |
Sonic Corp. (a) | | 164,200 | | 1,477,800 |
Steak n Shake Co. (a) | | 77,900 | | 477,527 |
| | | | |
| | | Shares | | Value ($) |
Texas Roadhouse, Inc., Class A (a) | | 139,000 | | 1,139,800 |
WMS Industries, Inc. (a) | | 135,850 | | 2,462,960 |
| | | | |
Hotels, Restaurants & Leisure Total | | 22,176,751 |
| | |
Household Durables – 0.6% | | | | |
Champion Enterprises, Inc. (a) | | 211,300 | | 61,277 |
Ethan Allen Interiors, Inc. | | 78,000 | | 744,120 |
La-Z-Boy, Inc. | | 139,800 | | 125,820 |
M/I Homes, Inc. | | 38,100 | | 245,745 |
Meritage Homes Corp. (a) | | 83,400 | | 827,328 |
National Presto Industries, Inc. | | 13,000 | | 786,630 |
Russ Berrie & Co., Inc. (a) | | 45,700 | | 54,383 |
Skyline Corp. | | 18,500 | | 295,260 |
Standard Pacific Corp. (a) | | 250,800 | | 238,260 |
Universal Electronics, Inc. (a) | | 38,000 | | 591,660 |
| | | | |
Household Durables Total | | | | 3,970,483 |
| | |
Internet & Catalog Retail – 0.6% | | | | |
Blue Nile, Inc. (a) | | 39,400 | | 940,478 |
HSN, Inc. (a) | | 106,900 | | 456,463 |
NutriSystem, Inc. | | 80,400 | | 1,037,160 |
PetMed Express, Inc. (a) | | 63,900 | | 880,542 |
Stamps.com, Inc. (a) | | 38,600 | | 321,152 |
Ticketmaster (a) | | 108,800 | | 532,032 |
| | | | |
Internet & Catalog Retail Total | | | | 4,167,827 |
|
Leisure Equipment & Products – 0.8% |
Arctic Cat, Inc. | | 32,400 | | 112,104 |
Brunswick Corp. | | 238,200 | | 736,038 |
JAKKS Pacific, Inc. (a) | | 74,800 | | 947,716 |
Nautilus Group, Inc. (a) | | 60,700 | | 39,455 |
Polaris Industries, Inc. | | 88,000 | | 1,620,080 |
Pool Corp. | | 130,250 | | 1,728,417 |
RC2 Corp. (a) | | 46,800 | | 219,492 |
Sturm Ruger & Co., Inc. (a) | | 52,900 | | 498,318 |
| | | | |
Leisure Equipment & Products Total | | 5,901,620 |
| | |
Media – 0.3% | | | | |
AH Belo Corp., Class A | | 47,800 | | 51,146 |
Arbitron, Inc. | | 71,700 | | 927,798 |
EW Scripps Co., Class A | | 78,900 | | 89,946 |
Live Nation, Inc. (a) | | 212,400 | | 745,524 |
| | | | |
Media Total | | | | 1,814,414 |
| | |
Multiline Retail – 0.1% | | | | |
Fred’s, Inc., Class A | | 108,550 | | 999,746 |
Tuesday Morning Corp. (a) | | 83,300 | | 73,304 |
| | | | |
Multiline Retail Total | | | | 1,073,050 |
| | |
Specialty Retail – 3.9% | | | | |
Aaron Rents, Inc. | | 145,350 | | 3,492,760 |
Big 5 Sporting Goods Corp. | | 58,500 | | 306,540 |
Brown Shoe Co., Inc. | | 114,975 | | 410,461 |
See Accompanying Notes to Financial Statements.
44
Columbia Small Cap Index Fund
February 28, 2009
Common Stocks (continued)
| | | | |
| | | Shares | | Value ($) |
| Consumer Discretionary (continued) | | | | |
Specialty Retail (continued) | | | | |
Buckle, Inc. | | 63,850 | | 1,515,160 |
Cabela’s, Inc. (a) | | 106,800 | | 899,256 |
Cato Corp., Class A | | 79,800 | | 1,167,474 |
Charlotte Russe Holding, Inc. (a) | | 57,000 | | 299,820 |
Children’s Place Retail Stores, Inc. (a) | | 65,400 | | 1,195,512 |
Christopher & Banks Corp. | | 96,400 | | 374,996 |
Dress Barn, Inc. (a) | | 122,200 | | 1,212,224 |
Finish Line, Inc., Class A | | 149,099 | | 618,761 |
Genesco, Inc. (a) | | 52,300 | | 747,890 |
Group 1 Automotive, Inc. | | 63,300 | | 677,310 |
Gymboree Corp. (a) | | 78,900 | | 2,029,308 |
Haverty Furniture Companies, Inc. | | 50,400 | | 443,520 |
Hibbett Sports, Inc. (a) | | 77,500 | | 1,086,550 |
HOT Topic, Inc. (a) | | 119,000 | | 1,056,720 |
Jo-Ann Stores, Inc. (a) | | 68,950 | | 830,158 |
Jos. A. Bank Clothiers, Inc. (a) | | 49,575 | | 1,120,395 |
Lithia Motors, Inc., Class A | | 45,100 | | 119,064 |
MarineMax, Inc. (a) | | 50,000 | | 72,000 |
Men’s Wearhouse, Inc. | | 140,300 | | 1,498,404 |
Midas, Inc. (a) | | 38,100 | | 280,035 |
OfficeMax, Inc. | | 206,300 | | 788,066 |
Pep Boys-Manny, Moe & Jack, Inc. | | 121,000 | | 382,360 |
Sonic Automotive, Inc., Class A | | 76,200 | | 108,966 |
Stage Stores, Inc. | | 103,175 | | 740,797 |
Stein Mart, Inc. (a) | | 69,000 | | 82,800 |
Tractor Supply Co. (a) | | 86,600 | | 2,705,384 |
Tween Brands, Inc. (a) | | 67,300 | | 80,760 |
Zale Corp. (a) | | 86,600 | | 108,250 |
Zumiez, Inc. (a) | | 54,600 | | 430,794 |
| | | | |
Specialty Retail Total | | | | 26,882,495 |
| |
Textiles, Apparel & Luxury Goods – 2.1% | | |
Carter’s, Inc. (a) | | 153,000 | | 2,495,430 |
CROCS, Inc. (a) | | 225,400 | | 274,988 |
Deckers Outdoor Corp. (a) | | 35,500 | | 1,465,085 |
Fossil, Inc. (a) | | 121,250 | | 1,530,175 |
Iconix Brand Group, Inc. (a) | | 158,300 | | 1,282,230 |
K-Swiss, Inc., Class A | | 72,900 | | 726,084 |
Liz Claiborne, Inc. | | 257,200 | | 717,588 |
Maidenform Brands, Inc. (a) | | 50,900 | | 444,357 |
Movado Group, Inc. | | 49,000 | | 279,790 |
Oxford Industries, Inc. | | 37,000 | | 172,790 |
Perry Ellis International, Inc. (a) | | 32,000 | | 151,680 |
Quiksilver, Inc. (a) | | 344,900 | | 431,125 |
Skechers U.S.A., Inc., Class A (a) | | 90,200 | | 575,476 |
True Religion Apparel, Inc. (a) | | 49,800 | | 508,956 |
Unifirst Corp. | | 38,800 | | 929,648 |
| | | | |
| | | Shares | | Value ($) |
Volcom, Inc. (a) | | 43,000 | | 342,280 |
Wolverine World Wide, Inc. | | 132,900 | | 2,014,764 |
| | | | |
Textiles, Apparel & Luxury Goods Total | | 14,342,446 |
| | | | |
Consumer Discretionary Total | | | | 90,284,604 |
| | | | |
| Consumer Staples – 4.0% | | | | |
Beverages – 0.1% | | | | |
Boston Beer Co., Inc., Class A (a) | | 27,300 | | 654,381 |
| | | | |
Beverages Total | | | | 654,381 |
| | |
Food & Staples Retailing – 1.1% | | | | |
Andersons, Inc. | | 49,400 | | 610,584 |
Casey’s General Stores, Inc. | | 138,000 | | 2,747,580 |
Great Atlantic & Pacific Tea Co., Inc. (a) | | 82,100 | | 334,147 |
Nash Finch Co. | | 34,800 | | 1,212,432 |
Spartan Stores, Inc. | | 60,000 | | 918,000 |
United Natural Foods, Inc. (a) | | 116,500 | | 1,733,520 |
| | | | |
Food & Staples Retailing Total | | | | 7,556,263 |
| | |
Food Products – 1.9% | | | | |
Cal-Maine Foods, Inc. | | 34,200 | | 761,976 |
Darling International, Inc. (a) | | 222,300 | | 962,559 |
Diamond Foods, Inc. | | 44,500 | | 954,525 |
Green Mountain Coffee Roasters, Inc. (a) | | 47,400 | | 1,770,390 |
Hain Celestial Group, Inc. (a) | | 109,900 | | 1,547,392 |
J & J Snack Foods Corp. | | 37,900 | | 1,196,503 |
Lance, Inc. | | 85,600 | | 1,866,936 |
Sanderson Farms, Inc. | | 47,400 | | 1,636,722 |
TreeHouse Foods, Inc. (a) | | 85,700 | | 2,287,333 |
| | | | |
Food Products Total | | | | 12,984,336 |
| | |
Household Products – 0.3% | | | | |
Central Garden & Pet Co., Class A (a) | | 193,400 | | 1,444,698 |
WD-40 Co. | | 44,800 | | 1,102,528 |
| | | | |
Household Products Total | | | | 2,547,226 |
| | |
Personal Products – 0.5% | | | | |
Chattem, Inc. (a) | | 50,600 | | 3,209,558 |
Mannatech, Inc. | | 42,400 | | 147,976 |
| | | | |
Personal Products Total | | | | 3,357,534 |
| | |
Tobacco – 0.1% | | | | |
Alliance One International, Inc. (a) | | 241,600 | | 835,936 |
| | | | |
Tobacco Total | | | | 835,936 |
| | | | |
Consumer Staples Total | | | | 27,935,676 |
See Accompanying Notes to Financial Statements.
45
Columbia Small Cap Index Fund
February 28, 2009
Common Stocks (continued)
| | | | |
| | | Shares | | Value ($) |
| Energy – 4.2% | | | | |
Energy Equipment & Services – 2.7% | | |
Atwood Oceanics, Inc. (a) | | 151,300 | | 2,311,864 |
Basic Energy Services, Inc. (a) | | 63,100 | | 398,161 |
Bristow Group, Inc. (a) | | 79,000 | | 1,599,750 |
CARBO Ceramics, Inc. | | 55,150 | | 1,917,014 |
Dril-Quip, Inc. (a) | | 81,600 | | 1,715,232 |
Gulf Island Fabrication, Inc. | | 38,800 | | 343,768 |
Hornbeck Offshore Services, Inc. (a) | | 62,500 | | 819,375 |
ION Geophysical Corp. (a) | | 243,100 | | 260,117 |
Lufkin Industries, Inc. | | 40,300 | | 1,323,855 |
Matrix Service Co. (a) | | 70,800 | | 492,768 |
NATCO Group, Inc., Class A (a) | | 55,000 | | 978,450 |
Oil States International, Inc. (a) | | 135,200 | | 1,800,864 |
Pioneer Drilling Co. (a) | | 135,800 | | 521,472 |
SEACOR Holdings, Inc. (a) | | 54,300 | | 3,253,113 |
Superior Well Services, Inc. (a) | | 44,800 | | 257,600 |
Tetra Technologies, Inc. (a) | | 203,750 | | 582,725 |
| | | | |
Energy Equipment & Services Total | | 18,576,128 |
| |
Oil, Gas & Consumable Fuels – 1.5% | | |
Holly Corp. | | 110,700 | | 2,580,417 |
Penn Virginia Corp. | | 113,600 | | 1,573,360 |
Petroleum Development Corp. (a) | | 40,400 | | 488,840 |
Petroquest Energy, Inc. (a) | | 117,800 | | 381,672 |
Southern Union Co. | | 1 | | 13 |
St. Mary Land & Exploration Co. | | 168,900 | | 2,293,662 |
Stone Energy Corp. (a) | | 94,200 | | 373,032 |
Swift Energy Co. (a) | | 83,800 | | 602,522 |
World Fuel Services Corp. | | 79,500 | | 2,306,295 |
| | | | |
Oil, Gas & Consumable Fuels Total | | | | 10,599,813 |
| | | | |
Energy Total | | | | 29,175,941 |
| | | | |
| Financials – 18.0% | | | | |
Capital Markets – 1.7% | | | | |
Greenhill & Co., Inc. | | 49,300 | | 3,184,780 |
Investment Technology Group, Inc. (a) | | 117,400 | | 2,285,778 |
LaBranche & Co., Inc. (a) | | 142,600 | | 824,228 |
optionsXpress Holdings, Inc. | | 115,600 | | 1,140,972 |
Piper Jaffray Companies, Inc. (a) | | 40,900 | | 899,391 |
Stifel Financial Corp. (a) | | 69,700 | | 2,295,918 |
SWS Group, Inc. | | 74,550 | | 1,011,644 |
TradeStation Group, Inc. (a) | | 86,700 | | 462,978 |
| | | | |
Capital Markets Total | | | | 12,105,689 |
| | |
Commercial Banks – 6.3% | | | | |
Boston Private Financial Holdings, Inc. | | 173,100 | | 600,657 |
Cascade Bancorp | | 76,300 | | 68,670 |
| | | | |
| | | Shares | | Value ($) |
Central Pacific Financial Corp. | | 78,000 | | 309,660 |
Columbia Banking System, Inc. | | 49,300 | | 385,033 |
Community Bank System, Inc. | | 88,600 | | 1,515,946 |
East West Bancorp, Inc. | | 172,900 | | 1,229,319 |
First Bancorp Puerto Rico | | 206,000 | | 856,960 |
First Commonwealth Financial Corp. | | 199,600 | | 1,632,728 |
First Financial Bancorp | | 86,500 | | 665,185 |
First Financial Bankshares, Inc. | | 56,500 | | 2,430,630 |
First Midwest Bancorp, Inc. | | 132,000 | | 992,640 |
Frontier Financial Corp. | | 127,700 | | 197,935 |
Glacier Bancorp, Inc. | | 162,607 | | 2,502,522 |
Hancock Holding Co. | | 64,700 | | 1,834,892 |
Hanmi Financial Corp. | | 101,000 | | 119,180 |
Home Bancshares, Inc. | | 36,100 | | 660,630 |
Independent Bank Corp. MA | | 44,200 | | 647,972 |
Independent Bank Corp. MI | | 51,920 | | 64,900 |
Irwin Financial Corp. (a) | | 51,600 | | 103,716 |
Nara Bancorp, Inc. | | 60,500 | | 161,535 |
National Penn Bancshares, Inc. | | 217,500 | | 1,611,675 |
Old National Bancorp | | 180,000 | | 2,100,600 |
PrivateBancorp, Inc. | | 74,800 | | 932,008 |
Prosperity Bancshares, Inc. | | 111,400 | | 2,842,928 |
Provident Bankshares Corp. | | 91,200 | | 542,640 |
S&T Bancorp, Inc. | | 63,700 | | 1,445,353 |
Signature Bank (a) | | 95,600 | | 2,390,956 |
South Financial Group, Inc. | | 200,700 | | 252,882 |
Sterling Bancorp NY | | 49,000 | | 431,200 |
Sterling Bancshares, Inc. | | 198,850 | | 1,083,733 |
Sterling Financial Corp. | | 141,625 | | 194,026 |
Susquehanna Bancshares, Inc. | | 233,900 | | 2,051,303 |
Tompkins Financial Corp. | | 18,100 | | 724,000 |
UCBH Holdings, Inc. | | 318,600 | | 509,760 |
UMB Financial Corp. | | 80,100 | | 3,038,193 |
Umpqua Holdings Corp. | | 163,300 | | 1,388,050 |
United Bankshares, Inc. | | 102,400 | | 1,576,960 |
United Community Banks, Inc. | | 110,755 | | 383,212 |
Whitney Holding Corp. | | 173,900 | | 1,921,595 |
Wilshire Bancorp, Inc. | | 52,700 | | 250,852 |
Wintrust Financial Corp. | | 64,500 | | 803,670 |
| | | | |
Commercial Banks Total | | | | 43,456,306 |
| | |
Consumer Finance – 0.4% | | | | |
Cash America International, Inc. | | 78,800 | | 1,134,720 |
First Cash Financial Services, Inc. (a) | | 69,900 | | 954,834 |
Rewards Network, Inc. (a) | | 73,300 | | 216,235 |
World Acceptance Corp. (a) | | 44,000 | | 645,040 |
| | | | |
Consumer Finance Total | | | | 2,950,829 |
See Accompanying Notes to Financial Statements.
46
Columbia Small Cap Index Fund
February 28, 2009
Common Stocks (continued)
| | | | |
| | | Shares | | Value ($) |
| Financials (continued) | | | | |
Diversified Financial Services – 0.3% | | |
Financial Federal Corp. | | 69,800 | | 1,326,200 |
Portfolio Recovery Associates, Inc. (a) | | 41,500 | | 936,240 |
| | | | |
Diversified Financial Services Total | | 2,262,440 |
| | |
Insurance – 3.3% | | | | |
American Physicians Capital, Inc. | | 21,900 | | 927,903 |
Amerisafe, Inc. (a) | | 51,200 | | 742,400 |
Delphi Financial Group, Inc., Class A | | 112,050 | | 1,214,622 |
Infinity Property & Casualty Corp. | | 38,900 | | 1,382,117 |
National Financial Partners Corp. | | 107,800 | | 268,422 |
Navigators Group, Inc. (a) | | 36,000 | | 1,880,280 |
Presidential Life Corp. | | 58,600 | | 386,760 |
ProAssurance Corp. (a) | | 91,000 | | 4,348,890 |
RLI Corp. | | 48,300 | | 2,365,734 |
Safety Insurance Group, Inc. | | 44,300 | | 1,385,261 |
Selective Insurance Group, Inc. | | 143,300 | | 1,723,899 |
Stewart Information Services Corp. | | 48,800 | | 711,992 |
Tower Group, Inc. | | 97,600 | | 1,990,064 |
United Fire & Casualty Co. | | 61,000 | | 1,034,560 |
Zenith National Insurance Corp. | | 101,200 | | 2,225,388 |
| | | | |
Insurance Total | | | | 22,588,292 |
|
Real Estate Investment Trusts (REITs) – 5.2% |
Acadia Realty Trust | | 90,232 | | 905,929 |
BioMed Realty Trust, Inc. | | 218,200 | | 1,861,246 |
Cedar Shopping Centers, Inc. | | 120,800 | | 572,592 |
Colonial Properties Trust | | 130,400 | | 496,824 |
DiamondRock Hospitality Co. | | 244,600 | | 755,814 |
EastGroup Properties, Inc. | | 68,100 | | 1,674,579 |
Entertainment Properties Trust | | 89,300 | | 1,331,463 |
Extra Space Storage, Inc. | | 232,200 | | 1,455,894 |
Franklin Street Properties Corp. | | 160,800 | | 1,704,480 |
Home Properties, Inc. | | 87,700 | | 2,327,558 |
Inland Real Estate Corp. | | 156,700 | | 1,222,260 |
Kilroy Realty Corp. | | 89,900 | | 1,673,039 |
Kite Realty Group Trust | | 92,400 | | 317,856 |
LaSalle Hotel Properties | | 111,400 | | 592,648 |
Lexington Realty Trust | | 199,000 | | 640,780 |
LTC Properties, Inc. | | 62,800 | | 1,071,368 |
Medical Properties Trust, Inc. | | 212,800 | | 742,672 |
Mid-America Apartment Communities, Inc. | | 76,600 | | 1,980,110 |
National Retail Properties, Inc. | | 212,900 | | 3,059,373 |
Parkway Properties, Inc. | | 41,500 | | 482,645 |
Pennsylvania Real Estate Investment Trust | | 107,000 | | 326,350 |
Post Properties, Inc. | | 120,000 | | 1,156,800 |
| | | | |
| | | Shares | | Value ($) |
PS Business Parks, Inc. | | 40,600 | | 1,396,640 |
Senior Housing Properties Trust | | 311,100 | | 3,926,082 |
Sovran Self Storage, Inc. | | 59,700 | | 1,264,446 |
Tanger Factory Outlet Centers, Inc. | | 86,000 | | 2,373,600 |
Urstadt Biddle Properties, Inc., Class A | | 57,900 | | 701,169 |
|
Real Estate Investment Trusts (REITs) Total | | | | 36,014,217 |
|
Real Estate Management & Development – 0.1% |
Forestar Real Estate Group, Inc. (a) | | 97,000 | | 729,440 |
|
Real Estate Management & Development Total | | | | 729,440 |
| |
Thrifts & Mortgage Finance – 0.7% | | |
Anchor BanCorp Wisconsin, Inc. | | 49,100 | | 34,370 |
Bank Mutual Corp. | | 131,200 | | 1,108,640 |
Brookline Bancorp, Inc. | | 158,500 | | 1,391,630 |
Dime Community Bancshares | | 71,500 | | 704,990 |
Flagstar BanCorp, Inc. (a) | | 159,000 | | 124,020 |
Guaranty Financial Group, Inc. (a) | | 295,800 | | 127,194 |
TrustCo Bank Corp. NY | | 206,100 | | 1,246,905 |
|
Thrifts & Mortgage Finance Total | | | | 4,737,749 |
| | | | |
Financials Total | | | | 124,844,962 |
| | | | |
| Health Care – 13.4% | | | | |
Biotechnology – 1.0% | | | | |
ArQule, Inc. (a) | | 76,800 | | 241,152 |
Cubist Pharmaceuticals, Inc. (a) | | 154,800 | | 2,199,708 |
Martek Biosciences Corp. (a) | | 90,000 | | 1,685,700 |
Regeneron Pharmaceuticals, Inc. (a) | | 170,900 | | 2,435,325 |
Savient Pharmaceuticals, Inc. (a) | | 128,500 | | 555,120 |
|
Biotechnology Total | | | | 7,117,005 |
| |
Health Care Equipment & Supplies – 4.1% | | |
Abaxis, Inc. (a) | | 59,400 | | 929,016 |
American Medical Systems Holdings, Inc. (a) | | 199,100 | | 2,060,685 |
Analogic Corp. | | 36,000 | | 1,017,000 |
CONMED Corp. (a) | | 78,800 | | 1,070,892 |
Cooper Companies, Inc. | | 122,200 | | 2,687,178 |
CryoLife, Inc. (a) | | 76,400 | | 385,820 |
Cyberonics, Inc. (a) | | 63,000 | | 847,350 |
Greatbatch, Inc. (a) | | 62,200 | | 1,211,656 |
Haemonetics Corp. (a) | | 68,700 | | 3,667,206 |
ICU Medical, Inc. (a) | | 34,300 | | 1,081,479 |
See Accompanying Notes to Financial Statements.
47
Columbia Small Cap Index Fund
February 28, 2009
Common Stocks (continued)
| | | | |
| | | Shares | | Value ($) |
| Health Care (continued) | | | | |
Health Care Equipment & Supplies (continued) |
Integra LifeSciences Holdings Corp. (a) | | 53,300 | | 1,391,663 |
Invacare Corp. | | 87,300 | | 1,400,292 |
Kensey Nash Corp. (a) | | 31,600 | | 602,296 |
Meridian Bioscience, Inc. | | 109,500 | | 2,196,570 |
Merit Medical Systems, Inc. (a) | | 76,200 | | 848,868 |
Natus Medical, Inc. (a) | | 76,000 | | 595,080 |
Neogen Corp. (a) | | 40,000 | | 850,000 |
Osteotech, Inc. (a) | | 48,700 | | 148,048 |
Palomar Medical Technologies, Inc. (a) | | 49,300 | | 359,890 |
SurModics, Inc. (a) | | 41,200 | | 719,764 |
Symmetry Medical, Inc. (a) | | 97,300 | | 520,555 |
Theragenics Corp. (a) | | 90,300 | | 85,785 |
West Pharmaceutical Services, Inc. | | 88,900 | | 2,729,230 |
Zoll Medical Corp. (a) | | 57,200 | | 786,500 |
|
Health Care Equipment & Supplies Total | | 28,192,823 |
| |
Health Care Providers & Services – 6.5% | | |
Air Methods Corp. (a) | | 29,000 | | 484,010 |
Almost Family, Inc. (a) | | 17,300 | | 351,017 |
Amedisys, Inc. (a) | | 73,299 | | 2,397,610 |
AMERIGROUP Corp. (a) | | 143,850 | | 3,564,603 |
AMN Healthcare Services, Inc. (a) | | 88,500 | | 576,135 |
AmSurg Corp. (a) | | 85,400 | | 1,333,948 |
Bio-Reference Labs, Inc. (a) | | 31,500 | | 731,115 |
Catalyst Health Solutions, Inc. (a) | | 104,000 | | 2,192,320 |
Centene Corp. (a) | | 116,500 | | 1,978,170 |
Chemed Corp. | | 60,800 | | 2,420,448 |
Corvel Corp. (a) | | 21,500 | | 405,490 |
Cross Country Healthcare, Inc. (a) | | 83,600 | | 618,640 |
Gentiva Health Services, Inc. (a) | | 78,300 | | 1,356,939 |
Healthspring, Inc. (a) | | 135,100 | | 1,094,310 |
Healthways, Inc. (a) | | 91,300 | | 831,743 |
HMS Holdings Corp. (a) | | 68,300 | | 2,074,954 |
inVentiv Health, Inc. (a) | | 90,300 | | 917,448 |
Landauer, Inc. | | 25,300 | | 1,265,253 |
LCA-Vision, Inc. | | 50,400 | | 138,600 |
LHC Group, Inc. (a) | | 40,100 | | 799,193 |
Magellan Health Services, Inc. (a) | | 108,100 | | 3,584,596 |
Medcath Corp. (a) | | 53,200 | | 426,664 |
Mednax, Inc. (a) | | 123,900 | | 3,667,440 |
Molina Healthcare, Inc. (a) | | 38,000 | | 711,740 |
MWI Veterinary Supply, Inc. (a) | | 32,900 | | 829,738 |
Odyssey Healthcare, Inc. (a) | | 89,050 | | 922,558 |
Owens & Minor, Inc. | | 112,400 | | 3,789,004 |
PharMerica Corp. (a) | | 82,700 | | 1,387,706 |
PSS World Medical, Inc. (a) | | 164,300 | | 2,370,849 |
| | | | |
| | | Shares | | Value ($) |
RehabCare Group, Inc. (a) | | 49,100 | | 718,333 |
Res-Care, Inc. (a) | | 69,600 | | 851,208 |
|
Health Care Providers & Services Total | | 44,791,782 |
| | |
Health Care Technology – 0.5% | | | | |
Eclipsys Corp. (a) | | 148,400 | | 1,182,748 |
Omnicell, Inc. (a) | | 85,000 | | 610,300 |
Phase Forward, Inc. (a) | | 116,500 | | 1,613,525 |
|
Health Care Technology Total | | | | 3,406,573 |
| |
Life Sciences Tools & Services – 0.8% | | |
Cambrex Corp. (a) | | 79,200 | | 171,072 |
Dionex Corp. (a) | | 48,800 | | 2,283,352 |
Enzo Biochem, Inc. (a) | | 88,320 | | 324,135 |
eResearchTechnology, Inc. (a) | | 117,500 | | 569,875 |
Kendle International, Inc. (a) | | 36,300 | | 678,810 |
PAREXEL International Corp. (a) | | 150,100 | | 1,376,417 |
|
Life Sciences Tools & Services Total | | 5,403,661 |
| | |
Pharmaceuticals – 0.5% | | | | |
Noven Pharmaceuticals, Inc. (a) | | 67,600 | | 549,588 |
Par Pharmaceutical Companies, Inc. (a) | | 93,700 | | 1,248,084 |
Salix Pharmaceuticals Ltd. (a) | | 130,500 | | 972,225 |
Viropharma, Inc. (a) | | 213,700 | | 886,855 |
|
Pharmaceuticals Total | | | | 3,656,752 |
| | | | |
Health Care Total | | | | 92,568,596 |
| | | | |
| Industrials – 17.8% | | | | |
Aerospace & Defense – 3.2% | | | | |
AAR Corp. (a) | | 105,200 | | 1,390,744 |
Aerovironment, Inc. (a) | | 42,400 | | 1,323,728 |
American Science & Engineering, Inc. | | 23,900 | | 1,450,491 |
Applied Signal Technology, Inc. | | 34,600 | | 661,552 |
Axsys Technologies, Inc. (a) | | 24,900 | | 826,929 |
Ceradyne, Inc. (a) | | 71,400 | | 1,225,224 |
Cubic Corp. | | 42,100 | | 1,097,126 |
Curtiss-Wright Corp. | | 122,200 | | 3,249,298 |
Esterline Technologies Corp. (a) | | 80,500 | | 2,039,870 |
GenCorp, Inc. (a) | | 133,000 | | 336,490 |
Moog, Inc., Class A (a) | | 116,075 | | 2,698,744 |
Orbital Sciences Corp. (a) | | 159,700 | | 2,259,755 |
Teledyne Technologies, Inc. (a) | | 97,400 | | 2,231,434 |
Triumph Group, Inc. | | 45,000 | | 1,625,400 |
|
Aerospace & Defense Total | | | | 22,416,785 |
| | |
| Air Freight & Logistics – 0.4% | | | | |
Forward Air Corp. | | 78,650 | | 1,308,736 |
HUB Group, Inc., Class A (a) | | 102,300 | | 1,837,308 |
|
Air Freight & Logistics Total | | | | 3,146,044 |
See Accompanying Notes to Financial Statements.
48
Columbia Small Cap Index Fund
February 28, 2009
Common Stocks (continued)
| | | | |
| | | Shares | | Value ($) |
| Industrials (continued) | | | | |
Airlines – 0.2% | | | | |
Skywest, Inc. | | 154,900 | | 1,586,176 |
|
Airlines Total | | | | 1,586,176 |
| | |
Building Products – 1.3% | | | | |
Apogee Enterprises, Inc. | | 75,600 | | 715,932 |
Gibraltar Industries, Inc. | | 73,300 | | 480,848 |
Griffon Corp. (a) | | 131,700 | | 957,459 |
Lennox International, Inc. | | 127,800 | | 3,310,020 |
NCI Building Systems, Inc. (a) | | 53,600 | | 271,216 |
Quanex Building Products Corp. | | 102,300 | | 717,123 |
Simpson Manufacturing Co., Inc. | | 101,700 | | 1,582,452 |
Universal Forest Products, Inc. | | 45,600 | | 993,624 |
|
Building Products Total | | | | 9,028,674 |
| |
Commercial Services & Supplies – 2.2% | | |
ABM Industries, Inc. | | 120,000 | | 1,467,600 |
ATC Technology Corp. (a) | | 55,100 | | 573,591 |
Bowne & Co., Inc. | | 74,165 | | 117,181 |
Consolidated Graphics, Inc. (a) | | 29,800 | | 402,002 |
G&K Services, Inc., Class A | | 51,500 | | 919,275 |
Geo Group, Inc. (a) | | 138,800 | | 1,640,616 |
Healthcare Services Group, Inc. | | 116,800 | | 1,795,216 |
Interface, Inc., Class A | | 152,500 | | 340,075 |
Mobile Mini, Inc. (a) | | 94,700 | | 923,325 |
Standard Register Co. | | 34,400 | | 166,496 |
Sykes Enterprises, Inc. (a) | | 90,800 | | 1,449,168 |
Tetra Tech, Inc. (a) | | 162,600 | | 3,642,240 |
United Stationers, Inc. (a) | | 63,900 | | 1,388,547 |
Viad Corp. | | 55,600 | | 783,960 |
|
Commercial Services & Supplies Total | | 15,609,292 |
| | |
Construction & Engineering – 0.6% | | | | |
EMCOR Group, Inc. (a) | | 177,800 | | 2,739,898 |
Insituform Technologies, Inc., Class A (a) | | 100,300 | | 1,221,654 |
|
Construction & Engineering Total | | | | 3,961,552 |
| | |
Electrical Equipment – 2.0% | | | | |
A.O. Smith Corp. | | 61,400 | | 1,567,542 |
Acuity Brands, Inc. | | 109,600 | | 2,512,032 |
Baldor Electric Co. | | 125,600 | | 1,533,576 |
Belden CDT, Inc. | | 126,250 | | 1,347,087 |
Brady Corp., Class A | | 142,000 | | 2,432,460 |
C&D Technologies, Inc. (a) | | 71,300 | | 86,986 |
II-VI, Inc. (a) | | 66,000 | | 1,185,360 |
MagneTek, Inc. (a) | | 83,300 | | 136,612 |
Regal-Beloit Corp. | | 87,700 | | 2,515,236 |
Vicor Corp. | | 53,200 | | 244,720 |
|
Electrical Equipment Total | | | | 13,561,611 |
| | | | |
| | | Shares | | Value ($) |
Industrial Conglomerates – 0.2% | | | | |
Standex International Corp. | | 34,000 | | 368,220 |
Tredegar Corp. | | 52,500 | | 876,750 |
|
Industrial Conglomerates Total | | | | 1,244,970 |
| | |
Machinery – 4.0% | | | | |
Actuant Corp., Class A | | 152,600 | | 1,570,254 |
Albany International Corp., Class A | | 72,200 | | 620,920 |
Astec Industries, Inc. (a) | | 53,600 | | 1,190,992 |
Barnes Group, Inc. | | 116,700 | | 1,087,644 |
Briggs & Stratton Corp. | | 135,300 | | 1,647,954 |
Cascade Corp. | | 23,000 | | 377,200 |
CIRCOR International, Inc. | | 45,900 | | 1,020,357 |
CLARCOR, Inc. | | 137,900 | | 3,635,044 |
EnPro Industries, Inc. (a) | | 55,100 | | 906,395 |
Gardner Denver, Inc. (a) | | 140,500 | | 2,658,260 |
John Bean Technologies Corp. | | 74,800 | | 724,812 |
Kaydon Corp. | | 93,000 | | 2,325,000 |
Lindsay Corp. | | 33,300 | | 807,525 |
Lydall, Inc. (a) | | 45,200 | | 126,560 |
Mueller Industries, Inc. | | 100,900 | | 1,823,263 |
Robbins & Myers, Inc. | | 89,000 | | 1,435,570 |
Toro Co. | | 96,500 | | 2,110,455 |
Valmont Industries, Inc. | | 47,600 | | 2,073,456 |
Wabash National Corp. | | 83,400 | | 170,970 |
Watts Water Technologies, Inc., Class A | | 79,400 | | 1,347,418 |
|
Machinery Total | | | | 27,660,049 |
| | |
Marine – 0.5% | | | | |
Kirby Corp. (a) | | 145,200 | | 3,200,208 |
|
Marine Total | | | | 3,200,208 |
| | |
Professional Services – 1.4% | | | | |
Administaff, Inc. | | 58,900 | | 1,146,194 |
CDI Corp. | | 34,900 | | 264,891 |
Heidrick & Struggles International, Inc. | | 44,400 | | 712,176 |
On Assignment, Inc. (a) | | 97,000 | | 228,920 |
School Specialty, Inc. (a) | | 43,400 | | 610,638 |
Spherion Corp. (a) | | 139,800 | | 171,954 |
TrueBlue, Inc. (a) | | 117,800 | | 828,134 |
Volt Information Sciences, Inc. (a) | | 34,300 | | 267,540 |
Watson Wyatt Worldwide, Inc., Class A | | 115,600 | | 5,677,116 |
|
Professional Services Total | | | | 9,907,563 |
| | |
Road & Rail – 1.0% | | | | |
Arkansas Best Corp. | | 68,700 | | 1,196,754 |
Heartland Express, Inc. | | 151,468 | | 1,873,659 |
Knight Transportation, Inc. | | 155,200 | | 2,011,392 |
See Accompanying Notes to Financial Statements.
49
Columbia Small Cap Index Fund
February 28, 2009
Common Stocks (continued)
| | | | |
| | | Shares | | Value ($) |
| Industrials (continued) | | | | |
Road & Rail (continued) | | | | |
Old Dominion Freight Line, Inc. (a) | | 74,950 | | 1,633,161 |
|
Road & Rail Total | | | | 6,714,966 |
| |
Trading Companies & Distributors – 0.8% | | |
Applied Industrial Technologies, Inc. | | 98,825 | | 1,593,059 |
Kaman Corp. | | 69,200 | | 811,024 |
Lawson Products, Inc. | | 11,300 | | 200,801 |
Watsco, Inc. | | 76,900 | | 2,639,977 |
|
Trading Companies & Distributors Total | | 5,244,861 |
| | | | |
Industrials Total | | | | 123,282,751 |
| | | | |
| Information Technology – 17.5% | | | | |
Communications Equipment – 2.2% | | |
Arris Group, Inc. (a) | | 333,700 | | 2,042,244 |
Bel Fuse, Inc., Class B | | 31,400 | | 294,218 |
Black Box Corp. | | 47,600 | | 944,384 |
Blue Coat Systems, Inc. (a) | | 106,100 | | 1,164,978 |
Comtech Telecommunications Corp. (a) | | 67,200 | | 2,539,488 |
Digi International, Inc. (a) | | 68,900 | | 493,324 |
EMS Technologies, Inc. (a) | | 41,200 | | 827,296 |
Harmonic, Inc. (a) | | 258,100 | | 1,404,064 |
NETGEAR, Inc. (a) | | 95,800 | | 1,058,590 |
Network Equipment Technologies, Inc. (a) | | 79,700 | | 235,115 |
PC-Tel, Inc. | | 49,500 | | 250,965 |
Symmetricom, Inc. (a) | | 120,800 | | 408,304 |
Tekelec (a) | | 179,500 | | 2,200,670 |
Tollgrade Communications, Inc. (a) | | 35,900 | | 201,040 |
ViaSat, Inc. (a) | | 73,700 | | 1,348,710 |
| | | | |
Communications Equipment Total | | 15,413,390 |
| | |
Computers & Peripherals – 0.9% | | | | |
Adaptec, Inc. (a) | | 331,100 | | 774,774 |
Avid Technology, Inc. (a) | | 82,675 | | 823,443 |
Hutchinson Technology, Inc. (a) | | 62,300 | | 112,140 |
Intermec, Inc. (a) | | 132,500 | | 1,336,925 |
Intevac, Inc. (a) | | 59,200 | | 231,472 |
Novatel Wireless, Inc. (a) | | 82,400 | | 449,904 |
Stratasys, Inc. (a) | | 54,900 | | 499,590 |
Synaptics, Inc. (a) | | 91,700 | | 1,902,775 |
| | | | |
Computers & Peripherals Total | | | | 6,131,023 |
|
Electronic Equipment & Instruments – 3.3% |
Agilysys, Inc. | | 61,800 | | 221,862 |
Anixter International, Inc. (a) | | 81,500 | | 2,396,915 |
| | | | |
| | | Shares | | Value ($) |
Benchmark Electronics, Inc. (a) | | 176,825 | | 1,727,580 |
Brightpoint, Inc. (a) | | 139,740 | | 547,781 |
Checkpoint Systems, Inc. (a) | | 105,100 | | 817,678 |
Cognex Corp. | | 107,400 | | 1,181,400 |
CTS Corp. | | 91,600 | | 288,540 |
Daktronics, Inc. | | 92,700 | | 635,922 |
Electro Scientific Industries, Inc. (a) | | 73,300 | | 388,490 |
FARO Technologies, Inc. (a) | | 45,300 | | 538,617 |
Gerber Scientific, Inc. (a) | | 65,500 | | 152,615 |
Insight Enterprises, Inc. (a) | | 123,800 | | 325,594 |
Itron, Inc. (a) | | 93,600 | | 4,180,176 |
Keithley Instruments, Inc. | | 37,200 | | 106,020 |
Littelfuse, Inc. (a) | | 59,000 | | 673,780 |
LoJack Corp. (a) | | 47,100 | | 172,857 |
Mercury Computer Systems, Inc. (a) | | 61,600 | | 380,072 |
Methode Electronics, Inc., Class A | | 102,800 | | 364,940 |
MTS Systems Corp. | | 46,000 | | 1,087,440 |
Newport Corp. (a) | | 97,800 | | 393,156 |
Park Electrochemical Corp. | | 55,600 | | 873,476 |
Plexus Corp. (a) | | 106,800 | | 1,372,380 |
RadiSys Corp. (a) | | 62,100 | | 378,810 |
Rogers Corp. (a) | | 48,900 | | 892,425 |
ScanSource, Inc. (a) | | 71,700 | | 1,137,879 |
SYNNEX Corp. (a) | | 50,800 | | 752,856 |
Technitrol, Inc. | | 111,400 | | 143,706 |
TTM Technologies, Inc. (a) | | 116,300 | | 536,143 |
| | | | |
Electronic Equipment & Instruments Total | | 22,669,110 |
| |
Internet Software & Services – 1.4% | | |
Bankrate, Inc. (a) | | 37,800 | | 842,940 |
DealerTrack Holdings, Inc. (a) | | 108,200 | | 1,142,592 |
InfoSpace, Inc. (a) | | 93,900 | | 496,731 |
Interwoven, Inc. (a) | | 125,200 | | 2,011,964 |
j2 Global Communications, Inc. (a) | | 119,200 | | 2,232,616 |
Knot, Inc. (a) | | 78,100 | | 483,439 |
Perficient, Inc. (a) | | 88,000 | | 309,760 |
United Online, Inc. | | 222,600 | | 1,037,316 |
Websense, Inc. (a) | | 122,200 | | 1,363,752 |
| | | | |
Internet Software & Services Total | | | | 9,921,110 |
| | |
IT Services – 1.8% | | | | |
CACI International, Inc., Class A (a) | | 81,200 | | 3,472,924 |
CIBER, Inc. (a) | | 164,800 | | 426,832 |
CSG Systems International, Inc. (a) | | 95,000 | | 1,284,400 |
Cybersource Corp. (a) | | 188,899 | | 2,327,236 |
Forrester Research, Inc. (a) | | 41,500 | | 761,110 |
Gevity HR, Inc. | | 67,100 | | 142,923 |
Heartland Payment Systems, Inc. | | 66,400 | | 365,864 |
See Accompanying Notes to Financial Statements.
50
Columbia Small Cap Index Fund
February 28, 2009
Common Stocks (continued)
| | | | |
| | | Shares | | Value ($) |
| Information Technology (continued) | | | | |
IT Services (continued) | | | | |
Integral Systems, Inc. (a) | | 46,500 | | 424,545 |
MAXIMUS, Inc. | | 49,700 | | 1,831,445 |
Startek, Inc. (a) | | 31,300 | | 98,595 |
Wright Express Corp. (a) | | 105,300 | | 1,541,592 |
| | | | |
IT Services Total | | | | 12,677,466 |
|
Semiconductors & Semiconductor Equipment – 4.3% |
Actel Corp. (a) | | 70,000 | | 634,900 |
Advanced Energy Industries, Inc. (a) | | 88,600 | | 598,936 |
ATMI, Inc. (a) | | 87,300 | | 1,161,090 |
Axcelis Technologies, Inc. (a) | | 279,900 | | 89,008 |
Brooks Automation, Inc. (a) | | 172,630 | | 738,857 |
Cabot Microelectronics Corp. (a) | | 63,100 | | 1,298,598 |
Cohu, Inc. | | 63,200 | | 535,304 |
Cymer, Inc. (a) | | 80,400 | | 1,484,988 |
Cypress Semiconductor Corp. (a) | | 393,300 | | 2,186,748 |
Diodes, Inc. (a) | | 88,049 | | 685,021 |
DSP Group, Inc. (a) | | 72,900 | | 404,595 |
Exar Corp. (a) | | 116,500 | | 681,525 |
FEI Co. (a) | | 100,900 | | 1,443,879 |
Hittite Microwave Corp. (a) | | 52,100 | | 1,436,918 |
Kopin Corp. (a) | | 184,100 | | 292,719 |
Kulicke & Soffa Industries, Inc. (a) | | 165,400 | | 223,290 |
Micrel, Inc. | | 130,600 | | 868,490 |
Microsemi Corp. (a) | | 220,200 | | 2,226,222 |
MKS Instruments, Inc. (a) | | 133,500 | | 1,680,765 |
Pericom Semiconductor Corp. (a) | | 69,400 | | 372,678 |
Rudolph Technologies, Inc. (a) | | 83,300 | | 225,743 |
Skyworks Solutions, Inc. (a) | | 450,200 | | 2,926,300 |
Standard Microsystems Corp. (a) | | 60,400 | | 940,428 |
Supertex, Inc. (a) | | 34,900 | | 728,014 |
TriQuint Semiconductor, Inc. (a) | | 396,000 | | 922,680 |
Ultratech, Inc. (a) | | 63,800 | | 700,524 |
Varian Semiconductor Equipment Associates, Inc. (a) | | 197,225 | | 3,599,356 |
Veeco Instruments, Inc. (a) | | 87,400 | | 372,324 |
| | | | |
Semiconductors & Semiconductor Equipment Total | | 29,459,900 |
| | |
Software – 3.6% | | | | |
Blackbaud, Inc. | | 117,500 | | 1,203,200 |
Catapult Communications Corp. (a) | | 21,700 | | 142,569 |
Commvault Systems, Inc. (a) | | 112,800 | | 1,232,904 |
Concur Technologies, Inc. (a) | | 115,400 | | 2,422,246 |
Ebix, Inc. (a) | | 24,100 | | 503,690 |
Epicor Software Corp. (a) | | 162,700 | | 457,187 |
EPIQ Systems, Inc. (a) | | 96,500 | | 1,627,955 |
| | | | |
| | | Shares | | Value ($) |
Informatica Corp. (a) | | 238,200 | | 3,072,780 |
JDA Software Group, Inc. (a) | | 74,300 | | 720,710 |
Manhattan Associates, Inc. (a) | | 65,300 | | 967,093 |
Micros Systems, Inc. (a) | | 218,300 | | 3,510,264 |
Phoenix Technologies Ltd. (a) | | 78,200 | | 182,988 |
Progress Software Corp. (a) | | 108,200 | | 1,724,708 |
Quality Systems, Inc. | | 49,200 | | 1,904,532 |
Radiant Systems, Inc. (a) | | 74,900 | | 210,469 |
Smith Micro Software, Inc. (a) | | 75,600 | | 321,300 |
Sonic Solutions (a) | | 72,100 | | 71,379 |
SPSS, Inc. (a) | | 49,300 | | 1,237,923 |
Take-Two Interactive Software, Inc. (a) | | 210,750 | | 1,304,542 |
Taleo Corp., Class A (a) | | 83,100 | | 747,900 |
THQ, Inc. (a) | | 182,150 | | 455,375 |
Tyler Technologies, Inc. (a) | | 79,900 | | 1,087,439 |
| | | | |
Software Total | | | | 25,109,153 |
| | | | |
Information Technology Total | | | | 121,381,152 |
| | | | |
| Materials – 3.6% | | | | |
Chemicals – 1.7% | | | | |
A. Schulman, Inc. | | 71,000 | | 1,014,590 |
American Vanguard Corp. | | 54,900 | | 758,169 |
Arch Chemicals, Inc. | | 67,600 | | 1,215,448 |
Balchem Corp. | | 49,400 | | 1,025,050 |
Calgon Carbon Corp. (a) | | 146,800 | | 2,150,620 |
Georgia Gulf Corp. | | 81,500 | | 54,605 |
H.B. Fuller Co. | | 131,500 | | 1,499,100 |
NewMarket Corp. | | 33,400 | | 1,154,638 |
OM Group, Inc. (a) | | 82,800 | | 1,283,400 |
Penford Corp. | | 30,600 | | 149,328 |
PolyOne Corp. (a) | | 251,300 | | 404,593 |
Quaker Chemical Corp. | | 29,400 | | 165,522 |
Stepan Co. | | 19,600 | | 556,248 |
Zep, Inc. | | 58,850 | | 465,503 |
| | | | |
Chemicals Total | | | | 11,896,814 |
| | |
Construction Materials – 0.5% | | | | |
Eagle Materials, Inc. | | 118,300 | | 2,255,981 |
Headwaters, Inc. (a) | | 114,800 | | 227,304 |
Texas Industries, Inc. | | 74,800 | | 1,204,280 |
| | | | |
Construction Materials Total | | | | 3,687,565 |
| | |
Containers & Packaging – 0.5% | | | | |
Myers Industries, Inc. | | 76,600 | | 302,570 |
Rock-Tenn Co., Class A | | 103,900 | | 2,868,679 |
| | | | |
Containers & Packaging Total | | | | 3,171,249 |
| | |
Metals & Mining – 0.5% | | | | |
A.M. Castle & Co. | | 44,900 | | 327,321 |
AMCOL International Corp. | | 61,100 | | 737,477 |
See Accompanying Notes to Financial Statements.
51
Columbia Small Cap Index Fund
February 28, 2009
Common Stocks (continued)
| | | | |
| | | Shares | | Value ($) |
| Materials (continued) | | | | |
Metals & Mining (continued) | | | | |
Brush Engineered Materials, Inc. (a) | | 55,100 | | 683,240 |
Century Aluminum Co. (a) | | 149,800 | | 332,556 |
Olympic Steel, Inc. | | 24,500 | | 303,310 |
RTI International Metals, Inc. (a) | | 62,500 | | 677,500 |
| | | | |
Metals & Mining Total | | | | 3,061,404 |
| | |
Paper & Forest Products – 0.4% | | | | |
Buckeye Technologies, Inc. (a) | | 105,000 | | 237,300 |
Clearwater Paper Corp. (a) | | 30,700 | | 303,009 |
Deltic Timber Corp. | | 28,700 | | 898,310 |
Neenah Paper, Inc. | | 39,600 | | 207,900 |
Schweitzer-Mauduit International, Inc. | | 41,800 | | 635,360 |
Wausau Paper Corp. | | 132,500 | | 735,375 |
| | | | |
Paper & Forest Products Total | | | | 3,017,254 |
| | | | |
Materials Total | | | | 24,834,286 |
| | | | |
| Other – 0.0% | | | | |
Other – 0.0% | | | | |
CSF Holdings, Inc. Escrow (a)(b)(c) | | 2,062 | | — |
| | | | |
Other Total | | | | — |
| | | | |
| Telecommunication Services – 0.3% | | | | |
Diversified Telecommunication Services – 0.3% |
Fairpoint Communications, Inc. | | 241,700 | | 476,149 |
General Communication, Inc., Class A (a) | | 120,100 | | 647,339 |
Iowa Telecommunications Services, Inc. | | 86,900 | | 1,178,364 |
| | | | |
Diversified Telecommunication Services Total | | 2,301,852 |
| | | | |
Telecommunication Services Total | | 2,301,852 |
| | | | |
| Utilities – 6.0% | | | | |
Electric Utilities – 1.6% | | |
ALLETE, Inc. | | 72,200 | | 1,923,408 |
Central Vermont Public Service Corp. | | 31,200 | | 642,720 |
Cleco Corp. | | 163,600 | | 3,357,072 |
El Paso Electric Co. (a) | | 121,800 | | 1,721,034 |
UIL Holdings Corp. | | 68,633 | | 1,408,349 |
Unisource Energy Corp. | | 96,400 | | 2,423,496 |
| | | | |
Electric Utilities Total | | | | 11,476,079 |
| | | | |
| | | Shares | | Value ($) |
Gas Utilities – 3.6% | | | | |
Atmos Energy Corp. | | 247,500 | | 5,402,925 |
Laclede Group, Inc. | | 60,100 | | 2,378,758 |
New Jersey Resources Corp. | | 114,450 | | 4,013,762 |
Northwest Natural Gas Co. | | 71,900 | | 2,944,305 |
Piedmont Natural Gas Co. | | 199,000 | | 4,803,860 |
South Jersey Industries, Inc. | | 80,700 | | 2,910,042 |
Southwest Gas Corp. | | 119,300 | | 2,325,157 |
| | | | |
Gas Utilities Total | | | | 24,778,809 |
| | |
Multi-Utilities – 0.6% | | | | |
Avista Corp. | | 147,800 | | 2,115,018 |
CH Energy Group, Inc. | | 42,900 | | 1,787,214 |
| | | | |
Multi-Utilities Total | | | | 3,902,232 |
| | |
Water Utilities – 0.2% | | | | |
American States Water Co. | | 47,000 | | 1,576,850 |
| | | | |
Water Utilities Total | | | | 1,576,850 |
| | | | |
Utilities Total | | | | 41,733,970 |
| | | | |
Total Common Stocks
(cost of $1,049,890,733) | | | | 678,343,790 |
| | | | |
| | |
Short-Term Obligation – 0.4% | | | | |
| | | Par ($) | | |
Repurchase agreement with Fixed Income Clearing Corp., dated 02/27/09, at 0.210%, due 03/02/09, collateralized by a U.S. Government Agency Obligation maturing 06/15/10, market value $2,711,112 (repurchase proceeds $2,655,046) | | 2,655,000 | | 2,655,000 |
| | | | |
Total Short-Term Obligation (cost of $2,655,000) | | | | 2,655,000 |
| | | | |
Total Investments – 98.2% (cost of $1,052,545,733) (d) | | | | 680,998,790 |
| | | | |
Other Assets & Liabilities, Net – 1.8% | | 12,332,598 |
| | | | |
Net Assets – 100.0% | | | | 693,331,388 |
Notes to Investment Portfolio:
| (a) | Non-income producing security. |
| (b) | Security has no value. |
| (c) | Represents fair value as determined in good faith under procedures approved by the Board of Trustees. At February 28, 2009, this security has no value. |
| (d) | Cost for federal income tax purposes is $1,081,584,999. |
See Accompanying Notes to Financial Statements.
52
Columbia Small Cap Index Fund
February 28, 2009
At February 28, 2009, the Fund held investments in the following sectors:
| | | |
Sector (Unaudited) | | % of
Net Assets | |
Financials | | 18.0 | |
Industrials | | 17.8 | |
Information Technology | | 17.5 | |
Health Care | | 13.4 | |
Consumer Discretionary | | 13.0 | |
Utilities | | 6.0 | |
Energy | | 4.2 | |
Consumer Staples | | 4.0 | |
Materials | | 3.6 | |
Telecommunication Services | | 0.3 | |
Other | | 0.0 | * |
| | | |
| | 97.8 | |
Short-Term Obligation | | 0.4 | |
Other Assets & Liabilities, Net | | 1.8 | |
| | | |
| | 100.0 | |
| | | |
* Security has no value.
At February 28, 2009, the Fund held the following open long futures contracts:
| | | | | | | | | | |
Type | | Number of
Contracts | | Value | | Aggregate
Face Value | | Expiration
Date | | Unrealized
Depreciation |
Russell 2000 Mini Index | | 352 | | $13,675,200 | | $14,563,431 | | Mar-2009 | | $(888,231) |
| | | | | | | | | | |
On February 28, 2009 cash of $2,400,000 was pledged as collateral for open futures contracts and was being held at the broker of the futures contracts.
See Accompanying Notes to Financial Statements.
53
Statements of Assets and Liabilities – Index Funds
February 28, 2009
| | | | | | | | |
| | | ($) | | ($) | | ($) | | ($) |
| | | Columbia
Large Cap
Index Fund | | Columbia
Large Cap
Enhanced
Core Fund | | Columbia
Mid Cap
Index Fund | | Columbia
Small Cap
Index Fund |
Assets | | | | | | | | |
Unaffiliated investments, at identified cost | | 1,884,036,992 | | 459,090,930 | | 1,545,695,726 | | 1,052,545,733 |
Affiliated investments, at identified cost | | 44,177,350 | | — | | — | | — |
| | | | | | | | |
| | | | |
Total investments, at identified cost | | 1,928,214,342 | | 459,090,930 | | 1,545,695,726 | | 1,052,545,733 |
| | | | |
Unaffiliated investments, at value | | 1,451,416,368 | | 388,327,998 | | 1,013,082,454 | | 680,998,790 |
Affiliated investments, at value | | 5,544,271 | | — | | — | | — |
| | | | | | | | |
| | | | |
Total investments, at value | | 1,456,960,639 | | 388,327,998 | | 1,013,082,454 | | 680,998,790 |
| | | | |
Cash | | 6,482 | | 3,907 | | — | | 3,877 |
Cash at broker | | — | | — | | 10,700,000 | | 2,400,000 |
Receivable for: | | | | | | | | |
Investments sold | | 1,449,394 | | — | | 2,061,400 | | 1,892,100 |
Fund shares sold | | 5,285,584 | | 3,265,080 | | 8,289,985 | | 8,237,854 |
Dividends | | 5,883,033 | | 1,748,794 | | 1,722,703 | | 625,503 |
Interest | | 606 | | 140 | | 169 | | 31 |
Expense reimbursement due from investment advisor | | 68,684 | | 25,876 | | 90,576 | | — |
Trustees’ deferred compensation plan | | 6,748 | | — | | — | | 4,216 |
Other assets | | 1,867 | | 14,601 | | 20,992 | | — |
| | | | | | | | |
| | | | |
Total assets | | 1,469,663,037 | | 393,386,396 | | 1,035,968,279 | | 694,162,371 |
| | | | |
| | | | | | | | | |
Liabilities | | | | | | | | |
Payable to custodian bank | | — | | — | | 1,567,004 | | — |
Payable for: | | | | | | | | |
Investments purchased | | 967,955 | | — | | 1,879,803 | | — |
Fund shares repurchased | | 3,063,113 | | 790,917 | | 1,000,076 | | 524,044 |
Futures variation margin | | 1,375,864 | | 319,812 | | 265,010 | | 127,032 |
Investment advisory fee | | 123,837 | | 115,795 | | 85,752 | | 58,368 |
Administration fee | | 123,774 | | 48,138 | | 74,086 | | 58,368 |
Transfer agent fee | | — | | 21,254 | | 14,333 | | — |
Trustees’ fees | | 54,284 | | 51,133 | | 36,028 | | 51,112 |
Pricing and bookkeeping fees | | — | | 8,553 | | 12,528 | | — |
Custody fee | | — | | 12,843 | | 13,253 | | — |
Distribution and service fees | | 23,572 | | 1,991 | | 12,454 | | 7,086 |
Chief compliance officer expenses | | — | | 156 | | 201 | | — |
Trustees’ deferred compensation plan | | 6,748 | | — | | — | | 4,216 |
Other liabilities | | 1,772 | | 48,853 | | 96,163 | | 757 |
| | | | | | | | |
| | | | |
Total liabilities | | 5,740,919 | | 1,419,445 | | 5,056,691 | | 830,983 |
| | | | |
| | | | | | | | | |
Net Assets | | 1,463,922,118 | | 391,966,951 | | 1,030,911,588 | | 693,331,388 |
See Accompanying Notes to Financial Statements.
54
Statements of Assets and Liabilities (continued) – Index Funds
February 28, 2009
| | | | | | | | | | | | | | | | |
| | | ($) | | | ($) | | | ($) | | | ($) | |
| | | Columbia
Large Cap
Index Fund | | | Columbia
Large Cap
Enhanced
Core Fund | | | Columbia
Mid Cap
Index Fund | | | Columbia
Small Cap
Index Fund | |
Net Assets Consist of | | | | | | | | | | | | | | | | |
Paid-in capital | | | 2,267,213,111 | | | | 730,770,080 | | | | 1,655,765,035 | | | | 1,147,394,023 | |
Undistributed net investment income | | | 7,321,585 | | | | 1,669,247 | | | | — | | | | 87,329 | |
Accumulated net realized loss | | | (329,403,648 | ) | | | (267,250,140 | ) | | | (89,519,946 | ) | | | (81,714,790 | ) |
Net unrealized appreciation (depreciation) on: | | | | | | | | | | | | | | | | |
Investments | | | (471,253,703 | ) | | | (70,762,932 | ) | | | (532,613,272 | ) | | | (371,546,943 | ) |
Futures contracts | | | (9,955,227 | ) | | | (2,459,304 | ) | | | (2,720,229 | ) | | | (888,231 | ) |
| | | | |
| | | | | | | | | | | | | | | | | |
Net Assets | | | 1,463,922,118 | | | | 391,966,951 | | | | 1,030,911,588 | | | | 693,331,388 | |
| | | | |
| | | | | | | | | | | | | | | | | |
Class A | | | | | | | | | | | | | | | | |
Net assets | | $ | 101,119,019 | | | $ | 9,290,750 | | | $ | 59,373,684 | | | $ | 33,272,739 | |
Shares outstanding | | | 7,150,990 | | | | 1,283,227 | | | | 10,357,465 | | | | 3,878,670 | |
Net asset value and offering price per share | | $ | 14.14 | | | $ | 7.24 | | | $ | 5.73 | | | $ | 8.58 | |
| | | | |
| | | | | | | | | | | | | | | | | |
Class B | | | | | | | | | | | | | | | | |
Net assets | | $ | 3,247,782 | | | | — | | | | — | | | | — | |
Shares outstanding | | | 228,697 | | | | — | | | | — | | | | — | |
Net asset value and offering price per share(a) | | $ | 14.20 | | | | — | | | | — | | | | — | |
| | | | |
| | | | | | | | | | | | | | | | | |
Class R | | | | | | | | | | | | | | | | |
Net assets | | | — | | | $ | 39,066 | | | | — | | | | — | |
Shares outstanding | | | — | | | | 5,396 | | | | — | | | | — | |
Net asset value and offering price per share | | | — | | | $ | 7.24 | | | | — | | | | — | |
| | | | |
| | | | | | | | | | | | | | | | | |
Class Z | | | | | | | | | | | | | | | | |
Net assets | | $ | 1,359,555,317 | | | $ | 382,637,135 | | | $ | 971,537,904 | | | $ | 660,058,649 | |
Shares outstanding | | | 95,847,015 | | | | 53,006,019 | | | | 170,140,419 | | | | 76,779,702 | |
Net asset value and offering price per share | | $ | 14.18 | | | $ | 7.22 | | | $ | 5.71 | | | $ | 8.60 | |
| (a) | Redemption price per share is equal to net asset value less any applicable contingent deferred sales charge. |
See Accompanying Notes to Financial Statements.
55
Statements of Operations – Index Funds
For the Year Ended February 28, 2009
| | | | | | | | | | | | |
| | | $ | | | $ | | | $ | | | $ | |
| | | Columbia
Large Cap
Index Fund | | | Columbia
Large Cap
Enhanced
Core Fund | | | Columbia
Mid Cap
Index Fund | | | Columbia
Small Cap
Index Fund | |
Investment Income | | | | | | | | | | | | |
Dividends | | 51,254,752 | | | 15,006,318 | | | 25,411,925 | | | 15,460,684 | |
Dividends from affiliates | | 2,223,438 | | | — | | | — | | | — | |
Interest | | 955,081 | | | 125,512 | | | 619,785 | | | 121,194 | |
Securities lending | | 615,442 | | | 96,329 | | | 2,928,665 | | | 2,910,607 | |
Foreign taxes withheld | | — | | | — | | | — | | | (5,819 | ) |
| | | | |
| | | | | | | | | | | | | |
Total Investment Income | | 55,048,713 | | | 15,228,159 | | | 28,960,375 | | | 18,486,666 | |
| | | | |
Expenses | | | | | | | | | | | | |
Investment advisory fee | | 2,246,733 | | | 2,181,829 | | | 1,674,088 | | | 1,162,242 | |
Administration fee | | 2,238,144 | | | 970,695 | | | 1,534,088 | | | 1,162,133 | |
Distribution fee: | | | | | | | | | | | | |
Class B | | 45,341 | | | — | | | — | | | — | |
Class R | | — | | | 221 | | | — | | | — | |
Service fee: | | | | | | | | | | | | |
Class A | | 339,294 | | | 35,834 | | | 192,419 | | | 111,098 | |
Class B | | 15,133 | | | — | | | — | | | — | |
Transfer agent fee | | — | | | 103,499 | | | 138,552 | | | — | |
Pricing and bookkeeping fees | | — | | | 129,888 | | | 145,159 | | | — | |
Trustees’ fees | | (1,544 | ) | | (1,112 | ) | | 678 | | | (506 | ) |
Custody fee | | — | | | 77,114 | | | 77,930 | | | — | |
Reports to shareholders | | — | | | 39,193 | | | 215,645 | | | — | |
Chief compliance officer expenses | | — | | | 854 | | | 1,210 | | | — | |
Other expenses | | 13,065 | | | 161,361 | | | 251,273 | | | 6,648 | |
| | | | |
| | | | | | | | | | | | | |
Expenses Before Interest Expense | | 4,896,166 | | | 3,699,376 | | | 4,231,042 | | | 2,441,615 | |
Interest expense | | — | | | 2,918 | | | 50 | | | 416 | |
| | | | |
| | | | | | | | | | | | | |
Total Expenses | | 4,896,166 | | | 3,702,294 | | | 4,231,092 | | | 2,442,031 | |
Fees waived or expenses reimbursed by investment advisor | | (1,330,267 | ) | | (431,216 | ) | | (1,688,994 | ) | | — | |
Expense reductions | | (17,889 | ) | | (710 | ) | | (4,527 | ) | | (8,293 | ) |
| | | | |
| | | | | | | | | | | | | |
Net Expenses | | 3,548,010 | | | 3,270,368 | | | 2,537,571 | | | 2,433,738 | |
| | | | |
| | | | | | | | | | | | | |
Net Investment Income | | 51,500,703 | | | 11,957,791 | | | 26,422,804 | | | 16,052,928 | |
| | | | |
Net Realized and Unrealized Gain (Loss) on Investments, Foreign Currency and Futures Contracts | | | | | | | | | | | | |
Net realized gain (loss) on: | | | | | | | | | | | | |
Unaffiliated investments | | 10,929,588 | | | (214,922,597 | ) | | 5,823,481 | | | 62,982,473 | |
Affiliated investments | | 105,918 | | | — | | | — | | | — | |
Foreign currency transactions | | — | | | (206,228 | ) | | — | | | — | |
Futures contracts | | (19,431,993 | ) | | (5,783,488 | ) | | (9,446,773 | ) | | (6,637,107 | ) |
| | | | |
| | | | | | | | | | | | | |
Net realized gain (loss) | | (8,396,487 | ) | | (220,912,313 | ) | | (3,623,292 | ) | | 56,345,366 | |
Net change in unrealized appreciation (depreciation) on: | | | | | | | | | | | | |
Investments | | (1,173,617,225 | ) | | (95,484,132 | ) | | (812,180,020 | ) | | (611,435,708 | ) |
Foreign currency translations | | — | | | 114,569 | | | — | | | — | |
Futures contracts | | (5,605,980 | ) | | (2,020,822 | ) | | 950,840 | | | (482,560 | ) |
| | | | |
| | | | | | | | | | | | | |
Net change in unrealized appreciation (depreciation) | | (1,179,223,205 | ) | | (97,390,385 | ) | | (811,229,180 | ) | | (611,918,268 | ) |
| | | | |
| | | | | | | | | | | | | |
Net Loss | | (1,187,619,692 | ) | | (318,302,698 | ) | | (814,852,472 | ) | | (555,572,902 | ) |
| | | | |
| | | | | | | | | | | | | |
Net Decrease Resulting from Operations | | (1,136,118,989 | ) | | (306,344,907 | ) | | (788,429,668 | ) | | (539,519,974 | ) |
See Accompanying Notes to Financial Statements.
56
Statements of Changes in Net Assets – Index Funds
| | | | | | | | | | | | |
| Increase (Decrease) in Net Assets | | Columbia Large Cap Index Fund | | | Columbia Large Cap Enhanced Core Fund | |
| | | Year Ended
February 28,
2009 ($) | | | Year Ended
February 29,
2008 ($) | | | Year Ended
February 28,
2009 ($) | | | Year Ended
February 29,
2008 ($) | |
Operations | | | | | | | | | | | | |
Net investment income | | 51,500,703 | | | 50,631,245 | | | 11,957,791 | | | 12,604,560 | |
Net realized gain (loss) on investments, foreign currency transactions, swap contracts, futures contracts, and written options | | (8,396,487 | ) | | 72,090,806 | | | (220,912,313 | ) | | (11,323,582 | ) |
Net change in unrealized appreciation (depreciation) on investments, foreign currency translations, swap contracts, futures contracts and written options | | (1,179,223,205 | ) | | (214,016,231 | ) | | (97,390,385 | ) | | (55,485,792 | ) |
| | | | | | | | | | | | |
Net decrease resulting from operations | | (1,136,118,989 | ) | | (91,294,180 | ) | | (306,344,907 | ) | | (54,204,814 | ) |
| | | | |
Distributions to Shareholders | | | | | | | | | | | | |
From net investment income: | | | | | | | | | | | | |
Class A | | (2,696,198 | ) | | (1,828,626 | ) | | (200,724 | ) | | (201,651 | ) |
Class B | | (61,085 | ) | | (66,457 | ) | | — | | | — | |
Class R | | — | | | — | | | (566 | ) | | (396 | ) |
Class Z | | (49,956,060 | ) | | (48,866,173 | ) | | (11,786,371 | ) | | (12,665,314 | ) |
From net realized gains: | | | | | | | | | | | | |
Class A | | — | | | — | | | — | | | (1,084,173 | ) |
Class R | | — | | | — | | | — | | | (1,823 | ) |
Class Z | | — | | | — | | | — | | | (47,995,527 | ) |
| | | | | | | | | | | | |
Total distributions to shareholders | | (52,713,343 | ) | | (50,761,256 | ) | | (11,987,661 | ) | | (61,948,884 | ) |
| | | | |
Net Capital Stock Transactions | | 148,001,785 | | | (22,217,553 | ) | | (103,578,142 | ) | | 301,814,151 | |
Total increase (decrease) in net assets | | (1,040,830,547 | ) | | (164,272,989 | ) | | (421,910,710 | ) | | 185,660,453 | |
| | | | |
Net Assets | | | | | | | | | | | | |
Beginning of period | | 2,504,752,665 | | | 2,669,025,654 | | | 813,877,661 | | | 628,217,208 | |
End of period | | 1,463,922,118 | | | 2,504,752,665 | | | 391,966,951 | | | 813,877,661 | |
Undistributed net investment income at end of period | | 7,321,585 | | | 8,538,915 | | | 1,669,247 | | | 1,905,345 | |
See Accompanying Notes to Financial Statements.
57
Statements of Changes in Net Assets (continued) – Index Funds
| | | | | | | | | | | | |
| Increase (Decrease) in Net Assets | | Columbia Mid Cap Index Fund | | | Columbia Small Cap Index Fund | |
| | | Year Ended
February 28,
2009 ($) | | | Year Ended
February 29,
2008 ($) | | | Year Ended
February 28,
2009 ($) | | | Year Ended
February 29,
2008 ($) | |
Operations | | | | | | | | | | | | |
Net investment income | | 26,422,804 | | | 29,231,819 | | | 16,052,928 | | | 16,303,110 | |
Net realized gain (loss) on investments and futures contracts | | (3,623,292 | ) | | 183,232,266 | | | 56,345,366 | | | 169,796,259 | |
Net change in unrealized appreciation (depreciation) on investments, and futures contracts | �� | (811,229,180 | ) | | (307,375,511 | ) | | (611,918,268 | ) | | (320,989,879 | ) |
| | | | | | | | | | | | |
Net decrease resulting from operations | | (788,429,668 | ) | | (94,911,426 | ) | | (539,519,974 | ) | | (134,890,510 | ) |
| | | | |
Distributions to Shareholders | | | | | | | | | | | | |
From net investment income: | | | | | | | | | | | | |
Class A | | (1,177,180 | ) | | (508,662 | ) | | (551,033 | ) | | (398,505 | ) |
Class Z | | (27,747,729 | ) | | (28,692,287 | ) | | (16,031,195 | ) | | (15,677,095 | ) |
From net realized gains: | | | | | | | | | | | | |
Class A | | (4,762,588 | ) | | (4,727,082 | ) | | (5,617,327 | ) | | (5,874,545 | ) |
Class Z | | (93,387,726 | ) | | (187,448,824 | ) | | (130,521,900 | ) | | (166,273,006 | ) |
| | | | | | | | | | | | |
Total distributions to shareholders | | (127,075,223 | ) | | (221,376,855 | ) | | (152,721,455 | ) | | (188,223,151 | ) |
| | | | |
Net Capital Stock Transactions | | (863,169 | ) | | 180,304,168 | | | 95,112,894 | | | 40,601,298 | |
Total increase (decrease) in net assets | | (916,368,060 | ) | | (135,984,113 | ) | | (597,128,535 | ) | | (282,512,363 | ) |
| | | | |
Net Assets | | | | | | | | | | | | |
Beginning of period | | 1,947,279,648 | | | 2,083,263,761 | | | 1,290,459,923 | | | 1,572,972,286 | |
End of period | | 1,030,911,588 | | | 1,947,279,648 | | | 693,331,388 | | | 1,290,459,923 | |
Undistributed net investment income at end of period | | — | | | 2,875,522 | | | 87,329 | | | 1,295,954 | |
See Accompanying Notes to Financial Statements.
58
Statements of Changes in Net Assets – Capital Stock Activity
| | | | | | | | | | | | |
| | | Columbia Large Cap Index Fund | |
| | | Year Ended
February 28, 2009 | | | Year Ended
February 29, 2008 | |
| | | Shares | | | Dollars ($) | | | Shares | | | Dollars ($) | |
Class A | | | | | | | | | | | | |
Subscriptions | | 3,381,162 | | | 71,580,226 | | | 3,280,547 | | | 93,485,064 | |
Distributions reinvested | | 156,557 | | | 2,646,314 | | | 61,653 | | | 1,762,010 | |
Redemptions | | (1,800,951 | ) | | (36,913,986 | ) | | (1,159,935 | ) | | (32,777,024 | ) |
| | | | | | | | | | | | |
Net increase | | 1,736,768 | | | 37,312,554 | | | 2,182,265 | | | 62,470,050 | |
| | | | |
Class B | | | | | | | | | | | | |
Subscriptions | | 1,704 | | | 35,091 | | | 5,807 | | | 169,923 | |
Distributions reinvested | | 3,305 | | | 55,529 | | | 2,112 | | | 60,484 | |
Redemptions | | (81,255 | ) | | (1,715,101 | ) | | (82,644 | ) | | (2,320,603 | ) |
| | | | | | | | | | | | |
Net decrease | | (76,246 | ) | | (1,624,481 | ) | | (74,725 | ) | | (2,090,196 | ) |
| | | | |
Class Z | | | | | | | | | | | | |
Subscriptions | | 23,350,037 | | | 521,275,666 | | | 12,763,645 | | | 356,879,449 | |
Distributions reinvested | | 2,102,984 | | | 37,444,733 | | | 1,183,330 | | | 34,101,658 | |
Redemptions | | (21,026,994 | ) | | (446,406,687 | ) | | (16,736,377 | ) | | (473,578,514 | ) |
| | | | | | | | | | | | |
Net increase (decrease) | | 4,426,027 | | | 112,313,712 | | | (2,789,402 | ) | | (82,597,407 | ) |
See Accompanying Notes to Financial Statements.
59
Statements of Changes in Net Assets – Capital Stock Activity
| | | | | | | | | | | | |
| | | Columbia Large Cap Enhanced Core Fund | |
| | | Year Ended
February 28, 2009 | | | Year Ended
February 29, 2008 | |
| | | Shares | | | Dollars ($) | | | Shares | | | Dollars ($) | |
Class A | | | | | | | | | | | | |
Subscriptions | | 152,669 | | | 1,656,144 | | | 247,730 | | | 3,700,672 | |
Distributions reinvested | | 18,718 | | | 159,669 | | | 68,488 | | | 1,010,623 | |
Redemptions | | (227,018 | ) | | (2,557,738 | ) | | (170,657 | ) | | (2,490,061 | ) |
| | | | | | | | | | | | |
Net increase (decrease) | | (55,631 | ) | | (741,925 | ) | | 145,561 | | | 2,221,234 | |
| | | | |
Class R | | | | | | | | | | | | |
Subscriptions | | 1,898 | | | 18,723 | | | 2,807 | | | 42,345 | |
Distributions reinvested | | 66 | | | 566 | | | 153 | | | 2,219 | |
Redemptions | | (164 | ) | | (2,020 | ) | | (131 | ) | | (1,881 | ) |
| | | | | | | | | | | | |
Net increase | | 1,800 | | | 17,269 | | | 2,829 | | | 42,683 | |
| | | | |
Class Z | | | | | | | | | | | | |
Subscriptions | | 14,262,004 | | | 152,509,885 | | | 33,602,727 | | | 501,289,480 | |
Distributions reinvested | | 232,607 | | | 2,081,092 | | | 548,275 | | | 8,090,175 | |
Redemptions | | (23,214,920 | ) | | (257,444,463 | ) | | (14,255,167 | ) | | (209,829,421 | ) |
| | | | | | | | | | | | |
Net increase (decrease) | | (8,720,309 | ) | | (102,853,486 | ) | | 19,895,835 | | | 299,550,234 | |
See Accompanying Notes to Financial Statements.
60
Statements of Changes in Net Assets – Capital Stock Activity
| | | | | | | | | | | | |
| | | Columbia Mid Cap Index Fund | |
| | | Year Ended
February 28, 2009 | | | Year Ended
February 29, 2008 | |
| | | Shares | | | Dollars ($) | | | Shares | | | Dollars ($) | |
Class A | | | | | | | | | | | | |
Subscriptions | | 6,621,736 | | | 60,401,482 | | | 4,702,847 | | | 56,177,785 | |
Distributions reinvested | | 798,261 | | | 5,686,579 | | | 392,267 | | | 4,813,503 | |
Redemptions | | (3,703,490 | ) | | (31,836,041 | ) | | (2,383,384 | ) | | (30,512,172 | ) |
| | | | | | | | | | | | |
Net increase | | 3,716,507 | | | 34,252,020 | | | 2,711,730 | | | 30,479,116 | |
| | | | |
Class Z | | | | | | | | | | | | |
Subscriptions | | 30,926,300 | | | 260,328,278 | | | 28,123,163 | | | 352,954,524 | |
Distributions reinvested | | 8,522,036 | | | 61,801,363 | | | 7,967,508 | | | 97,509,200 | |
Redemptions | | (42,287,879 | ) | | (357,244,830 | ) | | (24,363,545 | ) | | (300,638,672 | ) |
| | | | | | | | | | | | |
Net increase (decrease) | | (2,839,543 | ) | | (35,115,189 | ) | | 11,727,126 | | | 149,825,052 | |
See Accompanying Notes to Financial Statements.
61
Statements of Changes in Net Assets – Capital Stock Activity
| | | | | | | | | | | | |
| | | Columbia Small Cap Index Fund | |
| | | Year Ended
February 28, 2009 | | | Year Ended
February 29, 2008 | |
| | | Shares | | | Dollars ($) | | | Shares | | | Dollars ($) | |
Class A | | | | | | | | | | | | |
Subscriptions | | 1,775,675 | | | 24,120,882 | | | 1,052,673 | | | 22,305,124 | |
Distributions reinvested | | 524,381 | | | 5,753,859 | | | 273,705 | | | 5,563,798 | |
Redemptions | | (1,024,121 | ) | | (14,291,888 | ) | | (1,052,496 | ) | | (22,309,115 | ) |
| | | | | | | | | | | | |
Net increase | | 1,275,935 | | | 15,582,853 | | | 273,882 | | | 5,559,807 | |
| | | | |
Class Z | | | | | | | | | | | | |
Subscriptions | | 15,987,615 | | | 235,105,416 | | | 8,457,682 | | | 180,051,660 | |
Distributions reinvested | | 7,485,215 | | | 83,446,290 | | | 4,395,213 | | | 89,801,641 | |
Redemptions | | (16,753,664 | ) | | (239,021,665 | ) | | (11,103,924 | ) | | (234,811,810 | ) |
| | | | | | | | | | | | |
Net increase | | 6,719,166 | | | 79,530,041 | | | 1,748,971 | | | 35,041,491 | |
See Accompanying Notes to Financial Statements.
62
Financial Highlights – Columbia Large Cap Index Fund
Selected data for a share outstanding throughout each period is as follows:
| | | | | | | | | | | | | | | | | | | | | | | | |
Class A Shares | | Year Ended
February 28,
2009 | | | Year Ended
February 29,
2008 | | | Period Ended
February 28,
2007 (a) | | | Year Ended March 31, | |
| | | | | 2006 (b) | | | 2005 | | | 2004 | |
Net Asset Value, Beginning of Period | | $ | 25.64 | | | $ | 27.08 | | | $ | 24.97 | | | $ | 22.67 | | | $ | 21.65 | | | $ | 16.27 | |
| | | | | | |
Income from Investment Operations: | | | | | | | | | | | | | | | | | | | | | | | | |
Net investment income (c) | | | 0.45 | | | | 0.47 | | | | 0.39 | | | | 0.36 | | | | 0.37 | (d) | | | 0.24 | |
Net realized and unrealized gain (loss) on investments and futures contracts | | | (11.54 | ) | | | (1.49 | ) | | | 2.14 | | | | 2.19 | | | | 1.01 | | | | 5.37 | |
| | | | | | | | | | | | | | | | | | | | | | | | |
Total from investment operations | | | (11.09 | ) | | | (1.02 | ) | | | 2.53 | | | | 2.55 | | | | 1.38 | | | | 5.61 | |
| | | | | | |
Less Distributions to Shareholders: | | | | | | | | | | | | | | | | | | | | | | | | |
From net investment income | | | (0.41 | ) | | | (0.42 | ) | | | (0.42 | ) | | | (0.25 | ) | | | (0.36 | ) | | | (0.23 | ) |
| | | | | | | | | | | | | | | | | | | | | | | | |
| | | | | | |
Net Asset Value, End of Period | | $ | 14.14 | | | $ | 25.64 | | | $ | 27.08 | | | $ | 24.97 | | | $ | 22.67 | | | $ | 21.65 | |
Total return (e)(f) | | | (43.51 | )% | | | (3.92 | )% | | | 10.20 | %(g) | | | 11.27 | % | | | 6.33 | % | | | 34.50 | % |
| | | | | | |
Ratios to Average Net Assets/Supplemental Data: | | | | | | | | | | | | | | | | | | | | | | | | |
Net expenses before interest expense | | | 0.39 | %(h) | | | 0.39 | % | | | 0.39 | %(i) | | | 0.39 | %(h) | | | 0.39 | %(h) | | | 0.51 | %(h)(j) |
Interest expense | | | — | | | | — | | | | — | | | | — | %(k) | | | — | | | | — | |
Net expenses | | | 0.39 | %(h) | | | 0.39 | % | | | 0.39 | %(i) | | | 0.39 | %(h) | | | 0.39 | %(h) | | | 0.51 | %(h)(j) |
Waiver/Reimbursement | | | 0.06 | % | | | 0.06 | % | | | 0.06 | %(i) | | | 0.14 | %(l) | | | 0.14 | %(l) | | | 0.24 | %(l) |
Net investment income | | | 2.09 | %(h) | | | 1.67 | % | | | 1.63 | %(i) | | | 1.53 | %(h) | | | 1.67 | %(h) | | | 1.23 | %(h) |
Portfolio turnover rate | | | 5 | % | | | 6 | % | | | 7 | %(g) | | | 12 | % | | | 4 | % | | | 1 | % |
Net assets, end of period (000’s) | | $ | 101,119 | | | $ | 138,795 | | | $ | 87,528 | | | $ | 70,808 | | | $ | 37,088 | | | $ | 33,188 | |
| (a) | The Fund changed its fiscal year end from March 31 to February 28. Per share data and total return reflect activity from April 1, 2006 through February 28, 2007. |
| (b) | On August 22, 2005, the existing Investor A shares were renamed Class A shares. |
| (c) | Per share data was calculated using the average shares outstanding during the period. |
| (d) | Net investment income per share reflects a special dividend. The effect of this dividend amounted to $0.07 per share. |
| (e) | Total return at net asset value assuming all distributions reinvested. |
| (f) | Had the investment advisor and/or any of its affiliates not waived fees or reimbursed a portion of expenses, total return would have been reduced. |
| (h) | The benefits derived from expense reductions had an impact of less than 0.01%. |
| (j) | The reimbursement from the investment advisor had an impact of less than 0.01%. |
| (k) | Rounds to less than 0.01%. |
| (l) | Bank of America Corporation assumed certain non-recurring costs. Absent these non-recurring costs, the waiver/reimbursement ratio would have been 0.08%, 0.11% and 0.21% for the years ended March 31, 2006, March 31, 2005 and March 31, 2004, respectively. |
See Accompanying Notes to Financial Statements.
63
Financial Highlights – Columbia Large Cap Index Fund
Selected data for a share outstanding throughout each period is as follows:
| | | | | | | | | | | | | | | | |
| Class B Shares | | Year Ended
February 28,
2009 | | | Year Ended
February 29,
2008 | | | Period Ended
February 28,
2007 (a) | | | Period Ended
March 31,
2006 (b) | |
Net Asset Value, Beginning of Period | | $ | 25.70 | | | $ | 27.14 | | | $ | 25.06 | | | $ | 23.49 | |
| | | | |
Income from Investment Operations: | | | | | | | | | | | | | | | | |
Net investment income (c) | | | 0.28 | | | | 0.24 | | | | 0.20 | | | | 0.10 | |
Net realized and unrealized gain (loss) on investments and futures contracts | | | (11.53 | ) | | | (1.48 | ) | | | 2.16 | | | | 1.55 | |
| | | | | | | | | | | | | | | | |
Total from investment operations | | | (11.25 | ) | | | (1.24 | ) | | | 2.36 | | | | 1.65 | |
| | | | |
Less Distributions to Shareholders: | | | | | | | | | | | | | | | | |
From net investment income | | | (0.25 | ) | | | (0.20 | ) | | | (0.28 | ) | | | (0.08 | ) |
| | | | | | | | | | | | | | | | |
| | | | |
Net Asset Value, End of Period | | $ | 14.20 | | | $ | 25.70 | | | $ | 27.14 | | | $ | 25.06 | |
Total return (d)(e) | | | (43.94 | )% | | | (4.63 | )% | | | 9.47 | %(f) | | | 7.01 | %(f) |
| | | | |
Ratios to Average Net Assets/Supplemental Data: | | | | | | | | | | | | | | | | |
Net expenses before interest expense | | | 1.14 | %(g) | | | 1.14 | % | | | 1.14 | %(h) | | | 1.14 | %(g)(h) |
Interest expense | | | — | | | | — | | | | — | | | | — | %(i) |
Net expenses | | | 1.14 | %(g) | | | 1.14 | % | | | 1.14 | %(h) | | | 1.14 | %(g)(h) |
Waiver/Reimbursement | | | 0.06 | % | | | 0.06 | % | | | 0.06 | %(h) | | | 0.12 | %(h)(j) |
Net investment income | | | 1.28 | %(g) | | | 0.86 | % | | | 0.87 | %(h) | | | 0.85 | %(g)(h) |
Portfolio turnover rate | | | 5 | % | | | 6 | % | | | 7 | %(f) | | | 12 | %(f) |
Net assets, end of period (000’s) | | $ | 3,248 | | | $ | 7,836 | | | $ | 10,302 | | | $ | 12,071 | |
| (a) | The Fund changed its fiscal year end from March 31 to February 28. Per share data and total return reflect activity from April 1, 2006 through February 28, 2007. |
| (b) | Class B shares commenced operations on September 23, 2005. Per share data and total return reflect activity from that date. |
| (c) | Per share data was calculated using the average shares outstanding during the period. |
| (d) | Total return at net asset value assuming all distributions reinvested and no contingent deferred sales charge. |
| (e) | Had the investment advisor and/or any of its affiliates not waived fees or reimbursed a portion of expenses, total return would have been reduced. |
| (g) | The benefits derived from expense reductions had an impact of less than 0.01%. |
| (i) | Rounds to less than 0.01%. |
| (j) | Bank of America Corporation assumed certain non-recurring costs. Absent these non-recurring costs, the waiver/reimbursement ratio would have been 0.06% for the period ended March 31, 2006. |
See Accompanying Notes to Financial Statements.
64
Financial Highlights – Columbia Large Cap Index Fund
Selected data for a share outstanding throughout each period is as follows:
| | | | | | | | | | | | | | | | | | | | | | | | |
Class Z Shares | | Year Ended
February 28,
2009 | | | Year Ended
February 29,
2008 | | | Period Ended
February 28,
2007 (a) | | | Year Ended March 31, | |
| | | | | 2006 (b) | | | 2005 | | | 2004 | |
Net Asset Value, Beginning of Period | | $ | 25.79 | | | $ | 27.29 | | | $ | 25.15 | | | $ | 22.82 | | | $ | 21.79 | | | $ | 16.37 | |
| | | | | | |
Income from Investment Operations: | | | | | | | | | | | | | | | | | | | | | | | | |
Net investment income (c) | | | 0.51 | | | | 0.53 | | | | 0.45 | | | | 0.42 | | | | 0.43 | (d) | | | 0.30 | |
Net realized and unrealized gain (loss) on investments and futures contracts | | | (11.59 | ) | | | (1.49 | ) | | | 2.16 | | | | 2.22 | | | | 1.01 | | | | 5.39 | |
| | | | | | | | | | | | | | | | | | | | | | | | |
Total from investment operations | | | (11.08 | ) | | | (0.96 | ) | | | 2.61 | | | | 2.64 | | | | 1.44 | | | | 5.69 | |
| | | | | | |
Less Distributions to Shareholders: | | | | | | | | | | | | | | | | | | | | | | | | |
From net investment income | | | (0.53 | ) | | | (0.54 | ) | | | (0.47 | ) | | | (0.31 | ) | | | (0.41 | ) | | | (0.27 | ) |
| | | | | | | | | | | | | | | | | | | | | | | | |
| | | | | | |
Net Asset Value, End of Period | | $ | 14.18 | | | $ | 25.79 | | | $ | 27.29 | | | $ | 25.15 | | | $ | 22.82 | | | $ | 21.79 | |
Total return (e)(f) | | | (43.37 | )% | | | (3.72 | )% | | | 10.44 | %(g) | | | 11.59 | % | | | 6.57 | % | | | 34.82 | % |
| | | | | | |
Ratios to Average Net Assets/Supplemental Data: | | | | | | | | | | | | | | | | | | | | | | | | |
Net expenses before interest expense | | | 0.14 | %(h) | | | 0.14 | % | | | 0.14 | %(i) | | | 0.14 | %(h) | | | 0.14 | %(h) | | | 0.26 | %(h)(k) |
Interest expense | | | — | | | | — | | | | — | | | | — | %(j) | | | — | | | | — | |
Net expenses | | | 0.14 | %(h) | | | 0.14 | % | | | 0.14 | %(i) | | | 0.14 | %(h) | | | 0.14 | %(h) | | | 0.26 | %(h)(k) |
Waiver/Reimbursement | | | 0.06 | % | | | 0.06 | % | | | 0.06 | %(i) | | | 0.14 | %(l) | | | 0.14 | %(l) | | | 0.24 | %(l) |
Net investment income | | | 2.31 | %(h) | | | 1.87 | % | | | 1.87 | %(i) | | | 1.78 | %(h) | | | 1.92 | %(h) | | | 1.48 | %(h) |
Portfolio turnover rate | | | 5 | % | | | 6 | % | | | 7 | %(g) | | | 12 | % | | | 4 | % | | | 1 | % |
Net assets, end of period (000’s) | | $ | 1,359,555 | | | $ | 2,358,122 | | | $ | 2,571,196 | | | $ | 2,367,063 | | | $ | 1,486,203 | | | $ | 1,245,378 | |
| (a) | The Fund changed its fiscal year end from March 31 to February 28. Per share data and total return reflect activity from April 1, 2006 through February 28, 2007. |
| (b) | On August 22, 2005, the existing Primary A shares were renamed Class Z shares. |
| (c) | Per share data was calculated using the average shares outstanding during the period. |
| (d) | Net investment income per share reflects a special dividend. The effect of this dividend amounted to $0.07 per share. |
| (e) | Total return at net asset value assuming all distributions reinvested. |
| (f) | Had the investment advisor and/or any of its affiliates not waived fees or reimbursed a portion of expenses, total return would have been reduced. |
| (h) | The benefits derived from expense reductions had an impact of less than 0.01%. |
| (j) | Rounds to less than 0.01%. |
| (k) | The reimbursement from the investment advisor had an impact of less than 0.01%. |
| (l) | Bank of America Corporation assumed certain non-recurring costs. Absent these non-recurring costs, the waiver/reimbursement ratio would have been 0.08%, 0.11% and 0.21% for the years ended March 31, 2006, March 31, 2005 and March 31, 2004, respectively. |
See Accompanying Notes to Financial Statements.
65
Financial Highlights – Columbia Large Cap Enhanced Core Fund
Selected data for a share outstanding throughout each period is as follows:
| | | | | | | | | | | | | | | | | | | | | | | | |
Class A Shares | | Year Ended
February 28,
2009 | | | Year Ended
February 29,
2008 | | | Period Ended
February 28,
2007 (a) | | | Year Ended March 31, | |
| | | | | 2006 (b) | | | 2005 | | | 2004 | |
Net Asset Value, Beginning of Period | | $ | 12.91 | | | $ | 14.58 | | | $ | 14.13 | | | $ | 13.41 | | | $ | 13.56 | | | $ | 9.98 | |
| | | | | | |
Income from Investment Operations: | | | | | | | | | | | | | | | | | | | | | | | | |
Net investment income (c) | | | 0.18 | | | | 0.19 | | | | 0.16 | | | | 0.17 | | | | 0.17 | (d) | | | 0.11 | |
Net realized and unrealized gain (loss) on investments, foreign currency, swap contracts, futures contracts and written options | | | (5.69 | ) | | | (0.85 | ) | | | 1.24 | | | | 1.42 | | | | 0.66 | | | | 3.59 | |
| | | | | | | | | | | | | | | | | | | | | | | | |
Total from investment operations | | | (5.51 | ) | | | (0.66 | ) | | | 1.40 | | | | 1.59 | | | | 0.83 | | | | 3.70 | |
| | | | | | |
Less Distributions to Shareholders: | | | | | | | | | | | | | | | | | | | | | | | | |
From net investment income | | | (0.16 | ) | | | (0.15 | ) | | | (0.14 | ) | | | (0.15 | ) | | | (0.21 | ) | | | (0.12 | ) |
From net realized gains | | | — | | | | (0.86 | ) | | | (0.81 | ) | | | (0.72 | ) | | | (0.77 | ) | | | — | |
| | | | | | | | | | | | | | | | | | | | | | | | |
Total distributions to shareholders | | | (0.16 | ) | | | (1.01 | ) | | | (0.95 | ) | | | (0.87 | ) | | | (0.98 | ) | | | (0.12 | ) |
| | | | | | |
Net Asset Value, End of Period | | $ | 7.24 | | | $ | 12.91 | | | $ | 14.58 | | | $ | 14.13 | | | $ | 13.41 | | | $ | 13.56 | |
Total return (e)(f) | | | (42.89 | )% | | | (5.29 | )% | | | 10.56 | %(g) | | | 12.35 | % | | | 6.59 | % | | | 37.08 | % |
| | | | | | |
Ratios to Average Net Assets/Supplemental Data: | | | | | | | | | | | | | | | | | | | | | | | | |
Net expenses before interest expense (h) | | | 0.75 | % | | | 0.75 | % | | | 0.75 | %(i) | | | 0.75 | % | | | 0.75 | % | | | 0.75 | %(j) |
Interest expense | | | — | %(k) | | | — | | | | — | | | | — | | | | — | | | | — | %(k) |
Net expenses (h) | | | 0.75 | % | | | 0.75 | % | | | 0.75 | %(i) | | | 0.75 | % | | | 0.75 | % | | | 0.75 | %(j) |
Waiver/Reimbursement | | | 0.07 | % | | | 0.04 | % | | | 0.08 | %(i) | | | 0.15 | %(l) | | | 0.25 | %(l) | | | 0.26 | %(l) |
Net investment income (h) | | | 1.63 | % | | | 1.28 | % | | | 1.26 | %(i) | | | 1.23 | % | | | 1.27 | % | | | 0.98 | % |
Portfolio turnover rate | | | 246 | % | | | 207 | % | | | 230 | %(g) | | | 269 | % | | | 218 | % | | | 307 | % |
Net assets, end of period (000’s) | | $ | 9,291 | | | $ | 17,281 | | | $ | 17,399 | | | $ | 18,508 | | | $ | 17,653 | | | $ | 18,734 | |
| (a) | The Fund changed its fiscal year end from March 31 to February 28. Per share data and total return reflect activity from April 1, 2006 through February 28, 2007. |
| (b) | On August 22, 2005, the existing Investor A shares were renamed Class A shares. |
| (c) | Per share data was calculated using the average shares outstanding during the period. |
| (d) | Net investment income per share reflects a special dividend. The effect of this dividend amounted to $0.04 per share. |
| (e) | Total return at net asset value assuming all distributions reinvested. |
| (f) | Had the investment advisor and/or any of its affiliates not waived fees or reimbursed a portion of expenses, total return would have been reduced. |
| (h) | The benefits derived from expense reductions had an impact of less than 0.01%. |
| (j) | The reimbursement from the investment advisor had an impact of less than 0.01%. |
| (k) | Rounds to less than 0.01%. |
| (l) | Bank of America Corporation assumed certain non-recurring costs. Absent these non-recurring costs, the waiver/reimbursement ratio would have been 0.09%, 0.22% and 0.23% for the years ended March 31, 2006, March 31, 2005 and March 31, 2004, respectively. |
See Accompanying Notes to Financial Statements.
66
Financial Highlights – Columbia Large Cap Enhanced Core Fund
Selected data for a share outstanding throughout each period is as follows:
| | | | | | | | | | | | | | | | |
| Class R Shares | | Year Ended
February 28,
2009 | | | Year Ended
February 29,
2008 | | | Period Ended
February 28,
2007 (a) | | | Period Ended
March 31,
2006 (b) | |
Net Asset Value, Beginning of Year | | $ | 12.90 | | | $ | 14.58 | | | $ | 14.13 | | | $ | 13.68 | |
| | | | |
Income from Investment Operations: | | | | | | | | | | | | | | | | |
Net investment income (c) | | | 0.16 | | | | 0.16 | | | | 0.13 | | | | 0.03 | |
Net realized and unrealized gain (loss) on investments, foreign currency, swap contracts, futures contracts and written options | | | (5.69 | ) | | | (0.86 | ) | | | 1.23 | | | | 0.42 | |
| | | | | | | | | | | | | | | | |
Total from investment operations | | | (5.53 | ) | | | (0.70 | ) | | | 1.36 | | | | 0.45 | |
| | | | |
Less Distributions to Shareholders: | | | | | | | | | | | | | | | | |
From net investment income | | | (0.13 | ) | | | (0.12 | ) | | | (0.10 | ) | | | — | |
From net realized gains | | | — | | | | (0.86 | ) | | | (0.81 | ) | | | — | |
| | | | | | | | | | | | | | | | |
Total distributions to shareholders | | | (0.13 | ) | | | (0.98 | ) | | | (0.91 | ) | | | — | |
| | | | |
Net Asset Value, End of Year | | $ | 7.24 | | | $ | 12.90 | | | $ | 14.58 | | | $ | 14.13 | |
Total return (d)(e) | | | (43.01 | )% | | | (5.57 | )% | | | 10.30 | %(f) | | | 3.29 | %(f) |
| | | | |
Ratios to Average Net Assets/Supplemental Data: | | | | | | | | | | | | | | | | |
Net expenses before interest expense (g) | | | 1.00 | % | | | 1.00 | % | | | 1.00 | %(h) | | | 1.00 | %(h) |
Interest expense | | | — | %(i) | | | — | | | | — | | | | — | |
Net expenses (g) | | | 1.00 | % | | | 1.00 | % | | | 1.00 | %(h) | | | 1.00 | %(h) |
Waiver/Reimbursement | | | 0.07 | % | | | 0.04 | % | | | 0.08 | %(h) | | | 0.09 | %(h)(j) |
Net investment income (g) | | | 1.46 | % | | | 1.09 | % | | | 1.02 | %(h) | | | 0.91 | %(h) |
Portfolio turnover rate | | | 246 | % | | | 207 | % | | | 230 | %(f) | | | 269 | %(f) |
Net assets, end of period (000’s) | | $ | 39 | | | $ | 46 | | | $ | 11 | | | $ | 10 | |
| (a) | The Fund changed its fiscal year end from March 31 to February 28. Per share data and total return reflect activity from April 1, 2006 through February 28, 2007. |
| (b) | Class R shares commenced operations on January 23, 2006. Per share data and total return reflect activity from that date. |
| (c) | Per share data was calculated using the average shares outstanding during the period. |
| (d) | Total return at net asset value assuming all distributions reinvested. |
| (e) | Had the investment advisor and/or any of its affiliates not waived fees or reimbursed a portion of expenses, total return would have been reduced. |
| (g) | The benefits derived from expense reductions had an impact of less than 0.01%. |
| (i) | Rounds to less than 0.01%. |
| (j) | Bank of America Corporation assumed certain non-recurring costs. Absent these non-recurring costs, the waiver/reimbursement ratio would have been 0.03% for the period ended March 31, 2006. |
See Accompanying Notes to Financial Statements.
67
Financial Highlights – Columbia Large Cap Enhanced Core Fund
Selected data for a share outstanding throughout each period is as follows:
| | | | | | | | | | | | | | | | | | | | | | | | |
| Class Z Shares | | Year Ended
February 28,
2009 | | | Year Ended
February 29,
2008 | | | Period Ended
February 28,
2007 (a) | | | Year Ended March 31, | |
| | | | | 2006 (b) | | | 2005 | | | 2004 | |
Net Asset Value, Beginning of Period | | $ | 12.90 | | | $ | 14.60 | | | $ | 14.18 | | | $ | 13.45 | | | $ | 13.59 | | | $ | 10.00 | |
| | | | | | |
Income from investment operations: | | | | | | | | | | | | | | | | | | | | | | | | |
Net investment income (c) | | | 0.21 | | | | 0.23 | | | | 0.20 | | | | 0.20 | | | | 0.20 | (d) | | | 0.15 | |
Net realized and unrealized gain (loss) on investments, foreign currency, swap contracts, futures contracts and written options | | | (5.68 | ) | | | (0.85 | ) | | | 1.23 | | | | 1.44 | | | | 0.67 | | | | 3.59 | |
| | | | | | | | | | | | | | | | | | | | | | | | |
Total from investment operations | | | (5.47 | ) | | | (0.62 | ) | | | 1.43 | | | | 1.64 | | | | 0.87 | | | | 3.74 | |
| | | | | | |
Less Distributions to Shareholders: | | | | | | | | | | | | | | | | | | | | | | | | |
From net investment income | | | (0.21 | ) | | | (0.22 | ) | | | (0.20 | ) | | | (0.19 | ) | | | (0.24 | ) | | | (0.15 | ) |
From net realized gains | | | — | | | | (0.86 | ) | | | (0.81 | ) | | | (0.72 | ) | | | (0.77 | ) | | | — | |
| | | | | | | | | | | | | | | | | | | | | | | | |
Total distributions to shareholders | | | (0.21 | ) | | | (1.08 | ) | | | (1.01 | ) | | | (0.91 | ) | | | (1.01 | ) | | | (0.15 | ) |
| | | | | | |
Net Asset Value, End of Period | | $ | 7.22 | | | $ | 12.90 | | | $ | 14.60 | | | $ | 14.18 | | | $ | 13.45 | | | $ | 13.59 | |
Total return (e)(f) | | | (42.69 | )% | | | (5.10 | )% | | | 10.79 | %(g) | | | 12.66 | % | | | 6.90 | % | | | 37.41 | % |
| | | | | | |
Ratios to Average Net Assets/Supplemental Data: | | | | | | | | | | | | | | | | | | | | | | | | |
Net expenses before interest expense (h) | | | 0.50 | % | | | 0.50 | % | | | 0.50 | %(i) | | | 0.50 | % | | | 0.50 | % | | | 0.50 | %(j) |
Interest expense | | | — | %(k) | | | — | | | | — | | | | — | | | | — | | | | — | %(k) |
Net expenses (h) | | | 0.50 | % | | | 0.50 | % | | | 0.50 | %(i) | | | 0.50 | % | | | 0.50 | % | | | 0.50 | %(j) |
Waiver/Reimbursement | | | 0.07 | % | | | 0.04 | % | | | 0.08 | %(i) | | | 0.15 | %(l) | | | 0.25 | %(l) | | | 0.26 | %(l) |
Net investment income (h) | | | 1.86 | % | | | 1.54 | % | | | 1.52 | %(i) | | | 1.49 | % | | | 1.52 | % | | | 1.23 | % |
Portfolio turnover rate | | | 246 | % | | | 207 | % | | | 230 | %(g) | | | 269 | % | | | 218 | % | | | 307 | % |
Net assets, end of period (000’s) | | $ | 382,637 | | | $ | 796,550 | | | $ | 610,807 | | | $ | 495,099 | | | $ | 325,008 | | | $ | 246,181 | |
| (a) | The Fund changed its fiscal year end from March 31 to February 28. Per share data and total return reflect activity from April 1, 2006 through February 28, 2007. |
| (b) | On August 22, 2005, the Fund’s Primary A shares were renamed Class Z shares. |
| (c) | Per share data was calculated using the average shares outstanding during the period. |
| (d) | Net investment income per share reflects a special dividend. The effect of this dividend amounted to $0.04 per share. |
| (e) | Total return at net asset value assuming all distributions reinvested. |
| (f) | Had the investment advisor and/or any of its affiliates not waived fees or reimbursed a portion of expenses, total return would have been reduced. |
| (h) | The benefits derived from expense reductions had an impact of less than 0.01%. |
| (j) | The reimbursement from the investment advisor had an impact of less than 0.01%. |
| (k) | Rounds to less than 0.01%. |
| (l) | Bank of America Corporation assumed certain non-recurring costs. Absent these non-recurring costs, the waiver/reimbursement ratio would have been 0.09%, 0.22% and 0.23% for the years ended March 31, 2006, March 31, 2005 and March 31, 2004, respectively. |
See Accompanying Notes to Financial Statements.
68
Financial Highlights – Columbia Mid Cap Index Fund
Selected data for a share outstanding throughout each period is as follows:
| | | | | | | | | | | | | | | | | | | | | | | | |
Class A Shares | | Year Ended
February 28,
2009 | | | Year Ended
February 29,
2008 | | | Period Ended
February 28,
2007 (a) | | | Year Ended March 31, | |
| | | | | 2006 (b) | | | 2005 | | | 2004 | |
Net Asset Value, Beginning of Period | | $ | 10.86 | | | $ | 12.61 | | | $ | 12.49 | | | $ | 10.92 | | | $ | 10.26 | | | $ | 6.96 | |
| | | | | | |
Income from Investment Operations: | | | | | | | | | | | | | | | | | | | | | | | | |
Net investment income (c) | | | 0.12 | | | | 0.14 | | | | 0.12 | | | | 0.12 | | | | 0.10 | | | | 0.06 | |
Net realized and unrealized gain (loss) on investments and futures contracts | | | (4.55 | ) | | | (0.64 | ) | | | 0.64 | | | | 2.15 | | | | 0.91 | | | | 3.30 | |
| | | | | | | | | | | | | | | | | | | | | | | | |
Total from investment operations | | | (4.43 | ) | | | (0.50 | ) | | | 0.76 | | | | 2.27 | | | | 1.01 | | | | 3.36 | |
| | | | | | |
Less Distributions to Shareholders: | | | | | | | | | | | | | | | | | | | | | | | | |
From net investment income | | | (0.14 | ) | | | (0.12 | ) | | | (0.10 | ) | | | (0.12 | ) | | | (0.08 | ) | | | (0.06 | ) |
From net realized gains | | | (0.56 | ) | | | (1.13 | ) | | | (0.54 | ) | | | (0.58 | ) | | | (0.27 | ) | | | — | (d) |
| | | | | | | | | | | | | | | | | | | | | | | | |
Total distributions to shareholders | | | (0.70 | ) | | | (1.25 | ) | | | (0.64 | ) | | | (0.70 | ) | | | (0.35 | ) | | | (0.06 | ) |
| | | | | | |
Net Asset Value, End of Period | | $ | 5.73 | | | $ | 10.86 | | | $ | 12.61 | | | $ | 12.49 | | | $ | 10.92 | | | $ | 10.26 | |
Total return (e)(f) | | | (42.11 | )% | | | (4.94 | )% | | | 6.61 | %(g)(h) | | | 21.37 | % | | | 10.03 | % | | | 48.31 | % |
| | | | | | |
Ratios to Average Net Assets/Supplemental Data: | | | | | | | | | | | | | | | | | | | | | | | | |
Net expenses before interest expense (i) | | | 0.39 | % | | | 0.39 | % | | | 0.39 | %(j) | | | 0.39 | % | | | 0.39 | % | | | 0.50 | %(k) |
Interest expense | | | — | %(l) | | | — | | | | — | | | | — | %(l) | | | — | %(l) | | | — | %(l) |
Net expenses (i) | | | 0.39 | % | | | 0.39 | % | | | 0.39 | %(j) | | | 0.39 | % | | | 0.39 | % | | | 0.50 | %(k) |
Waiver/Reimbursement | | | 0.10 | % | | | 0.08 | % | | | 0.09 | %(j) | | | 0.15 | %(m) | | | 0.14 | %(m) | | | 0.25 | %(m) |
Net investment income (i) | | | 1.36 | % | | | 1.13 | % | | | 1.08 | %(j) | | | 1.00 | % | | | 0.96 | % | | | 0.70 | % |
Portfolio turnover rate | | | 28 | % | | | 26 | % | | | 18 | %(g) | | | 24 | % | | | 18 | % | | | 9 | % |
Net assets, end of period (000’s) | | $ | 59,374 | | | $ | 72,095 | | | $ | 49,555 | | | $ | 18,115 | | | $ | 9,606 | | | $ | 7,385 | |
| (a) | The Fund changed its fiscal year end from March 31 to February 28. Per share data and total return reflect activity from April 1, 2006 through February 28, 2007. |
| (b) | On August 22, 2005, the existing Investor A shares were renamed Class A shares. |
| (c) | Per share data was calculated using the average shares outstanding during the period. |
| (d) | Amount represents less than $0.01 per share. |
| (e) | Total return at net asset value assuming all distributions reinvested. |
| (f) | Had the investment advisor and/or any of its affiliates not waived fees or reimbursed a portion of expenses, total return would have been reduced. |
| (h) | Total return includes a voluntary reimbursement by the investment advisor for realized investment losses due to a trading error. The reimbursement had an impact of less than 0.01% on the Fund’s total return. |
| (i) | The benefits derived from expense reductions had an impact of less than 0.01%. |
| (k) | The reimbursement from the investment advisor had an impact of less than 0.01%. |
| (l) | Rounds to less than 0.01%. |
| (m) | Bank of America Corporation assumed certain non-recurring costs. Absent these non-recurring costs, the waiver/reimbursement ratio would have been 0.09%, 0.11% and 0.22% for the years ended March 31, 2006, March 31, 2005 and March 31, 2004, respectively. |
See Accompanying Notes to Financial Statements.
69
Financial Highlights – Columbia Mid Cap Index Fund
Selected data for a share outstanding throughout each period is as follows:
| | | | | | | | | | | | | | | | | | | | | | | | |
| Class Z Shares | | Year Ended
February 28,
2009 | | | Year Ended
February 29,
2008 | | | Period Ended
February 28,
2007 (a) | | | Year Ended March 31, | |
| | | | | 2006 (b) | | | 2005 | | | 2004 | |
Net Asset Value, Beginning of Period | | $ | 10.84 | | | $ | 12.61 | | | $ | 12.52 | | | $ | 10.94 | | | $ | 10.27 | | | $ | 6.96 | |
| | | | | | |
Income from Investment Operations: | | | | | | | | | | | | | | | | | | | | | | | | |
Net investment income (c) | | | 0.15 | | | | 0.17 | | | | 0.14 | | | | 0.14 | | | | 0.13 | | | | 0.09 | |
Net realized and unrealized gain (loss) on investments and futures contracts | | | (4.55 | ) | | | (0.64 | ) | | | 0.64 | | | | 2.17 | | | | 0.91 | | | | 3.29 | |
| | | | | | | | | | | | | | | | | | | | | | | | |
Total from investment operations | | | (4.40 | ) | | | (0.47 | ) | | | 0.78 | | | | 2.31 | | | | 1.04 | | | | 3.38 | |
| | | | | | |
Less Distributions to Shareholders: | | | | | | | | | | | | | | | | | | | | | | | | |
From net investment income | | | (0.17 | ) | | | (0.17 | ) | | | (0.15 | ) | | | (0.15 | ) | | | (0.10 | ) | | | (0.07 | ) |
From net realized gains | | | (0.56 | ) | | | (1.13 | ) | | | (0.54 | ) | | | (0.58 | ) | | | (0.27 | ) | | | — | (d) |
| | | | | | | | | | | | | | | | | | | | | | | | |
Total distributions to shareholders | | | (0.73 | ) | | | (1.30 | ) | | | (0.69 | ) | | | (0.73 | ) | | | (0.37 | ) | | | (0.07 | ) |
| | | | | | |
Net Asset Value, End of Period | | $ | 5.71 | | | $ | 10.84 | | | $ | 12.61 | | | $ | 12.52 | | | $ | 10.94 | | | $ | 10.27 | |
Total return (e)(f) | | | (41.92 | )% | | | (4.75 | )% | | | 6.82 | %(g)(h) | | | 21.71 | % | | | 10.32 | % | | | 48.67 | % |
| | | | | | |
Ratios to Average Net Assets/Supplemental Data: | | | | | | | | | | | | | | | | | | | | | | | | |
Net expenses before interest expense (i) | | | 0.14 | % | | | 0.14 | % | | | 0.14 | %(j) | | | 0.14 | % | | | 0.14 | % | | | 0.25 | %(k) |
Interest expense | | | — | %(l) | | | — | | | | — | | | | — | %(l) | | | — | %(l) | | | — | %(l) |
Net expenses (i) | | | 0.14 | % | | | 0.14 | % | | | 0.14 | %(j) | | | 0.14 | % | | | 0.14 | % | | | 0.25 | %(k) |
Waiver/Reimbursement | | | 0.10 | % | | | 0.08 | % | | | 0.09 | %(j) | | | 0.15 | %(m) | | | 0.14 | %(m) | | | 0.25 | %(m) |
Net investment income (i) | | | 1.59 | % | | | 1.38 | % | | | 1.30 | %(j) | | | 1.25 | % | | | 1.21 | % | | | 0.95 | % |
Portfolio turnover rate | | | 28 | % | | | 26 | % | | | 18 | %(g) | | | 24 | % | | | 18 | % | | | 9 | % |
Net assets, end of period (000’s) | | $ | 971,538 | | | $ | 1,875,184 | | | $ | 2,033,709 | | | $ | 1,996,247 | | | $ | 1,601,005 | | | $ | 1,461,843 | |
| (a) | The Fund changed its fiscal year end from March 31 to February 28. Per share data and total return reflect activity from April 1, 2006 through February 28, 2007. |
| (b) | On August 22, 2005 the existing Primary A shares were renamed Class Z shares. |
| (c) | Per share data was calculated using the average shares outstanding during the period. |
| (d) | Amount represents less than $0.01 per share. |
| (e) | Total return at net asset value assuming all distributions reinvested. |
| (f) | Had the investment advisor and/or any of its affiliates not waived fees or reimbursed a portion of expenses, total return would have been reduced. |
| (h) | Total return includes a voluntary reimbursement by the investment advisor for realized investment losses due to trading errors. The reimbursement had an impact of less than 0.01% on the Fund’s total return. |
| (i) | The benefits derived from expense reductions had an impact of less than 0.01%. |
| (k) | The reimbursement from the investment advisor had an impact of less than 0.01%. |
| (l) | Rounds to less than 0.01%. |
| (m) | Bank of America Corporation assumed certain non-recurring costs. Absent these non-recurring costs, the waiver/reimbursement ratio would have been 0.09%, 0.11% and 0.22% for the years ended March 31, 2006, March 31, 2005 and March 31, 2004, respectively. |
See Accompanying Notes to Financial Statements.
70
Financial Highlights – Columbia Small Cap Index Fund
Selected data for a share outstanding throughout each period is as follows:
| | | | | | | | | | | | | | | | | | | | | | | | |
| Class A Shares | | Year Ended
February 28,
2009 | | | Year Ended
February 29,
2008 | | | Period Ended
February 28,
2007 (a) | | | Year Ended March 31, | |
| | | | | 2006 (b) | | | 2005 | | | 2004 | |
Net Asset Value, Beginning of Period | | $ | 17.70 | | | $ | 22.19 | | | $ | 23.24 | | | $ | 19.16 | | | $ | 17.88 | | | $ | 11.57 | |
| | | | | | |
Income from Investment Operations: | | | | | | | | | | | | | | | | | | | | | | | | |
Net investment income (c) | | | 0.17 | | | | 0.18 | | | | 0.10 | | | | 0.13 | | | | 0.12 | | | | 0.05 | |
Net realized and unrealized gain (loss) on investments and futures contracts | | | (7.25 | ) | | | (2.05 | ) | | | 0.48 | | | | 4.32 | | | | 2.03 | | | | 6.39 | |
| | | | | | | | | | | | | | | | | | | | | | | | |
Total from investment operations | | | (7.08 | ) | | | (1.87 | ) | | | 0.58 | | | | 4.45 | | | | 2.15 | | | | 6.44 | |
| | | | | | |
Less Distributions to Shareholders: | | | | | | | | | | | | | | | | | | | | | | | | |
From net investment income | | | (0.17 | ) | | | (0.17 | ) | | | (0.09 | ) | | | (0.09 | ) | | | (0.10 | ) | | | (0.08 | ) |
From net realized gains | | | (1.87 | ) | | | (2.45 | ) | | | (1.54 | ) | | | (0.28 | ) | | | (0.77 | ) | | | (0.05 | ) |
| | | | | | | | | | | | | | | | | | | | | | | | |
Total distributions to shareholders | | | (2.04 | ) | | | (2.62 | ) | | | (1.63 | ) | | | (0.37 | ) | | | (0.87 | ) | | | (0.13 | ) |
| | | | | | |
Net Asset Value, End of Period | | $ | 8.58 | | | $ | 17.70 | | | $ | 22.19 | | | $ | 23.24 | | | $ | 19.16 | | | $ | 17.88 | |
Total return (d) | | | (42.43 | )% | | | (9.74 | )% | | | 3.09 | %(e)(f)(g) | | | 23.46 | %(f) | | | 12.58 | %(f) | | | 55.73 | %(f) |
| | | | | | |
Ratios to Average Net Assets/Supplemental Data: | | | | | | | | | | | | | | | | | | | | | | | | |
Net expenses before interest expense (h) | | | 0.45 | % | | | 0.45 | % | | | 0.45 | %(i) | | | 0.46 | % | | | 0.46 | % | | | 0.56 | %(j) |
Interest expense | | | — | %(k) | | | — | %(k) | | | — | %(i)(k) | | | — | %(k) | | | — | | | | — | |
Net expenses (h) | | | 0.45 | % | | | 0.45 | % | | | 0.45 | %(i) | | | 0.46 | % | | | 0.46 | % | | | 0.56 | %(j) |
Waiver/Reimbursement | | | — | | | | — | | | | — | %(i)(k) | | | 0.07 | %(l) | | | 0.11 | %(l) | | | 0.22 | %(l) |
Net investment income (h) | | | 1.15 | % | | | 0.81 | % | | | 0.51 | %(i) | | | 0.62 | % | | | 0.64 | % | | | 0.32 | % |
Portfolio turnover rate | | | 35 | % | | | 24 | % | | | 15 | %(e) | | | 20 | % | | | 16 | % | | | 16 | % |
Net assets, end of period (000’s) | | $ | 33,273 | | | $ | 46,078 | | | $ | 51,681 | | | $ | 45,365 | | | $ | 14,337 | | | $ | 12,534 | |
| (a) | The Fund changed its fiscal year end from March 31 to February 28. Per share data and total return reflect activity from April 1, 2006 through February 28, 2007. |
| (b) | On August 22, 2005, the existing Investor A shares were renamed Class A shares. |
| (c) | Per share data was calculated using the average shares outstanding during the period. |
| (d) | Total return at net asset value assuming all distributions reinvested. |
| (f) | Had the investment advisor and/or any of its affiliates not waived fees or reimbursed a portion of expenses, total return would have been reduced. |
| (g) | Total return includes a voluntary reimbursement by the investment advisor for realized investment losses due to trading errors. These reimbursements had an impact of less than 0.01% on the Fund’s total return. |
| (h) | The benefits derived from expense reductions had an impact of less than 0.01%. |
| (j) | The reimbursement from the investment advisor had an impact of less than 0.01%. |
| (k) | Rounds to less than 0.01%. |
| (l) | Bank of America Corporation assumed certain non-recurring costs. Absent these non-recurring costs, the waiver/reimbursement ratio would have been 0.01%, 0.08% and 0.19% for the years ended March 31, 2006, March 31, 2005 and March 31, 2004, respectively. |
See Accompanying Notes to Financial Statements.
71
Financial Highlights – Columbia Small Cap Index Fund
Selected data for a share outstanding throughout each period is as follows:
| | | | | | | | | | | | | | | | | | | | | | | | |
| Class Z Shares | | Year Ended
February 28,
2009 | | | Year Ended
February 29,
2008 | | | Period Ended
February 28,
2007 (a) | | | Year Ended March 31, | |
| | | | | 2006 (b) | | | 2005 | | | 2004 | |
Net Asset Value, Beginning of Period | | $ | 17.76 | | | $ | 22.27 | | | $ | 23.35 | | | $ | 19.24 | | | $ | 17.95 | | | $ | 11.59 | |
| | | | | | |
Income from Investment Operations: | | | | | | | | | | | | | | | | | | | | | | | | |
Net investment income (c) | | | 0.21 | | | | 0.23 | | | | 0.15 | | | | 0.18 | | | | 0.16 | | | | 0.09 | |
Net realized and unrealized gain (loss) on investments and futures contracts | | | (7.27 | ) | | | (2.05 | ) | | | 0.48 | | | | 4.35 | | | | 2.04 | | | | 6.40 | |
| | | | | | | | | | | | | | | | | | | | | | | | |
Total from investment operations | | | (7.06 | ) | | | (1.82 | ) | | | 0.63 | | | | 4.53 | | | | 2.20 | | | | 6.49 | |
| | | | | | |
Less Distributions to Shareholders: | | | | | | | | | | | | | | | | | | | | | | | | |
From net investment income | | | (0.23 | ) | | | (0.24 | ) | | | (0.17 | ) | | | (0.14 | ) | | | (0.14 | ) | | | (0.08 | ) |
From net realized gains | | | (1.87 | ) | | | (2.45 | ) | | | (1.54 | ) | | | (0.28 | ) | | | (0.77 | ) | | | (0.05 | ) |
| | | | | | | | | | | | | | | | | | | | | | | | |
Total distributions to shareholders | | | (2.10 | ) | | | (2.69 | ) | | | (1.71 | ) | | | (0.42 | ) | | | (0.91 | ) | | | (0.13 | ) |
| | | | | | |
Net Asset Value, End of Period | | $ | 8.60 | | | $ | 17.76 | | | $ | 22.27 | | | $ | 23.35 | | | $ | 19.24 | | | $ | 17.95 | |
Total return (d) | | | (42.28 | )% | | | (9.52 | )% | | | 3.34 | %(e)(f)(g) | | | 23.80 | %(f) | | | 12.84 | %(f) | | | 56.11 | %(f) |
| | | | | | |
Ratios to Average Net Assets/Supplemental Data: | | | | | | | | | | | | | | | | | | | | | | | | |
Net expenses before interest expense (h) | | | 0.20 | % | | | 0.20 | % | | | 0.20 | %(i) | | | 0.21 | % | | | 0.21 | % | | | 0.31 | %(j) |
Interest expense | | | — | %(k) | | | — | %(k) | | | — | %(i)(k) | | | — | %(k) | | | — | | | | — | |
Net expenses (h) | | | 0.20 | % | | | 0.20 | % | | | 0.20 | %(i) | | | 0.21 | % | | | 0.21 | % | | | 0.31 | %(j) |
Waiver/Reimbursement | | | — | | | | — | | | | — | %(i)(k) | | | 0.07 | %(l) | | | 0.11 | %(l) | | | 0.22 | %(l) |
Net investment income (h) | | | 1.39 | % | | | 1.06 | % | | | 0.76 | %(i) | | | 0.87 | % | | | 0.89 | % | | | 0.57 | % |
Portfolio turnover rate | | | 35 | % | | | 24 | % | | | 15 | %(e) | | | 20 | % | | | 16 | % | | | 16 | % |
Net assets, end of period (000’s) | | $ | 660,059 | | | $ | 1,244,382 | | | $ | 1,521,291 | | | $ | 1,606,958 | | | $ | 1,072,113 | | | $ | 914,267 | |
| (a) | The Fund changed its fiscal year end from March 31 to February 28. Per share data and total return reflect activity from April 1, 2006 through February 28, 2007. |
| (b) | On August 22, 2005, the existing Primary A shares were renamed Class Z shares. |
| (c) | Per share data was calculated using the average shares outstanding during the period. |
| (d) | Total return at net asset value assuming all distributions reinvested. |
| (f) | Had the investment advisor and/or any of its affiliates not waived fees or reimbursed a portion of expenses, total return would have been reduced. |
| (g) | Total return includes a voluntary reimbursement by the investment advisor for realized investment losses due to trading errors. These reimbursements had an impact of less than 0.01% on the Fund’s total return. |
| (h) | The benefits derived from expense reductions had an impact of less than 0.01%. |
| (j) | The reimbursement from the investment advisor had an impact of less than 0.01%. |
| (k) | Rounds to less than 0.01%. |
| (l) | Bank of America Corporation assumed certain non-recurring costs. Absent these non-recurring costs, the waiver/reimbursement ratio would have been 0.01%, 0.08% and 0.19% for the years ended March 31, 2006, March 31, 2005 and March 31, 2004, respectively. |
See Accompanying Notes to Financial Statements.
72
Notes to Financial Statements – Index Funds
February 28, 2009
Note 1. Organization
Columbia Funds Series Trust (the “Trust”) is registered under the Investment Company Act of 1940, as amended (the “1940 Act”), as an open-end investment company. Information presented in these financial statements pertains to the following series of the Trust (each a “Fund” and collectively, the “Funds”):
Columbia Large Cap Index Fund
Columbia Large Cap Enhanced Core Fund
Columbia Mid Cap Index Fund
Columbia Small Cap Index Fund
Investment Objectives
Columbia Large Cap Index Fund seeks total return before fees and expenses that corresponds to the total return of the Standard and Poor’s 500 Index. Columbia Large Cap Enhanced Core Fund seeks total return before fees and expenses that exceeds the total return of the Standard and Poor’s 500 Index. Columbia Mid Cap Index Fund seeks total return before fees and expenses that corresponds to the total return of the Standard and Poor’s MidCap 400 Index. Columbia Small Cap Index Fund seeks total return before fees and expenses that corresponds to the total return of the Standard and Poor’s SmallCap 600 Index.
Fund Shares
The Trust may issue an unlimited number of shares. Columbia Mid Cap Index Fund and Columbia Small Cap Index Fund each offer two classes of shares: Class A and Class Z shares. Columbia Large Cap Index Fund offers three classes of shares: Class A, Class B and Class Z shares. Columbia Large Cap Enhanced Core Fund offers three classes of shares: Class A, Class R and Class Z shares. Each share class has its own expense structure and sales charges, as applicable. Beginning on or about June 22, 2009, the Funds will no longer accept investment in Class B shares from new or existing investors in the Funds’ Class B shares, except in connection with the reinvestment of any dividend and/or capital gain distributions in Class B shares of the Funds and exchanges by existing Class B shareholders of the other Columbia Funds.
Class A, R and Z shares are offered continuously at net asset value. Class B shares are subject to a maximum contingent deferred sales charge (“CDSC”) of 5.00% based upon the holding period after purchase. Class B shares will convert to Class A shares eight years after purchase. There are certain restrictions on the purchase of Class R and Class Z shares, as described in the Funds’ prospectuses.
Note 2. Significant Accounting Policies
The preparation of financial statements in accordance with accounting principles generally accepted in the United States of America (“GAAP”) requires management to make certain estimates and assumptions that affect the reported amounts of assets and liabilities, the disclosure of contingent assets and liabilities at the date of the financial statements and the reported amounts of revenue and expenses during the reporting period. Actual results could differ from those estimates. The following is a summary of significant accounting policies consistently followed by the Funds in the preparation of their financial statements.
Security Valuation
Equity securities, exchange-traded funds and securities of certain investment companies are valued at the last sale price on the principal exchange on which they trade, except for securities traded on the NASDAQ, which are valued at the NASDAQ official close price. Unlisted securities or listed securities for which there were no sales during the day are valued at the closing bid price on such exchanges or over-the-counter markets.
Short-term investments maturing in 60 days or less are valued at amortized cost, which approximates market value.
Futures contracts are valued at the settlement price established each day by the board of trade or exchange on which they are traded.
Forward foreign currency exchange contracts are valued at the prevailing forward exchange rate of the underlying currencies.
Investments for which market quotations are not readily available, or that have quotations which management believes are not reliable, are valued at fair value as determined in good faith under consistently applied procedures established by and under the general supervision of the Board of Trustees. If a security is valued at fair value, such value is likely to be different from the last quoted market price for the security.
73
Index Funds
February 28, 2009
On March 1, 2008, the Funds adopted Statement of Financial Accounting Standards No. 157, Fair Value Measurements (“SFAS 157”). SFAS 157 establishes a hierarchy that prioritizes the inputs to valuation techniques used to measure fair value giving the highest priority to unadjusted quoted prices in active markets for identical securities (level 1 measurements) and the lowest priority to unobservable inputs (level 3 measurements) when market prices are not readily available or reliable. The three levels of the fair value hierarchy under SFAS 157 are described below:
| n | | Level 1 — quoted prices in active markets for identical securities |
| n | | Level 2 — prices determined using other significant observable inputs (including quoted prices for similar securities, interest rates, prepayment speeds, credit risk and others) |
| n | | Level 3 — prices determined using significant unobservable inputs. In situations where quoted prices or observable inputs are unavailable or less reliable, unobservable inputs may be used. Unobservable inputs may include management’s own assumptions about the factors market participants would use in pricing an investment. |
The inputs or methodology used for valuing securities are not necessarily an indication of the risk associated with investing in those securities.
The following tables summarize the inputs used, as of February 28, 2009, in valuing each Fund’s assets:
| | | | | | | |
| | | | | | |
| Columbia Large Cap Index Fund | |
| Valuation Inputs | | Investments
in Securities | | Other Financial
Instruments* | |
Level 1 – Quoted Prices | | $ | 1,404,977,996 | | $ | (9,955,227 | ) |
Level 2 – Other Significant Observable Inputs | | | 51,982,000 | | | — | |
Level 3 – Significant Unobservable Inputs | | | 643 | | | — | |
Total | | $ | 1,456,960,639 | | $ | (9,955,227 | ) |
| * | Other financial instruments consist of futures contracts which are not included in the investment portfolio. |
The following table reconciles asset balances for the year ending February 28, 2009 in which significant unobservable inputs (Level 3) were used in determining value:
| | | | | | |
| | | | | |
| | | Investments
In Securities | | Other Financial
Instruments |
Balance as of
February 29, 2008 | | $ | 643 | | $ | — |
Accretion of Discounts/Amortization of Premiums | | | — | | | — |
Realized gain(loss) | | | — | | | — |
Change in unrealized appreciation (depreciation) | | | — | | | — |
Net purchases/sales | | | — | | | — |
Transfers into and/or out of Level 3 | | | — | | | — |
Balance as of
February 28, 2009 | | $ | 643 | | $ | — |
The information in the above reconciliation represents fiscal year to date activity for any securities identified as using Level 3 inputs at either the beginning or the end of the current fiscal period.
| | | | | | | |
| | | | | | |
| Columbia Large Cap Enhanced Core Fund | |
| Valuation Inputs | | Investments
in Securities | | Other Financial
Instruments* | |
Level 1 – Quoted Prices | | $ | 376,357,026 | | $ | (2,459,304 | ) |
Level 2 – Other Significant Observable Inputs | | | 11,970,000 | | | — | |
Level 3 – Significant Unobservable Inputs | | | 972 | | | — | |
Total | | $ | 388,327,998 | | $ | (2,459,304 | ) |
| * | Other financial instruments consist of futures contracts which are not included in the investment portfolio. |
74
Index Funds
February 28, 2009
The following table reconciles asset balances for the year ending February 28, 2009 in which significant unobservable inputs (Level 3) were used in determining value:
| | | | | | |
| | | | | |
| | | Investments
In Securities | | Other Financial
Instruments |
Balance as of February 29, 2008 | | $ | 972 | | $ | — |
Accretion of Discounts/Amortization of Premiums | | | — | | | — |
Realized gain(loss) | | | — | | | — |
Change in unrealized appreciation (depreciation) | | | — | | | — |
Net purchases/sales | | | — | | | — |
Transfers into and/or out of Level 3 | | | — | | | — |
Balance as of February 28, 2009 | | $ | 972 | | $ | — |
The information in the above reconciliation represents fiscal year to date activity for any securities identified as using Level 3 inputs at either the beginning or the end of the current fiscal period.
| | | | | | | |
| | | | | | |
| Columbia Mid Cap Index Fund | |
| Valuation Inputs | | Investments in Securities | | Other Financial
Instruments* | |
Level 1 – Quoted Prices | | $ | 998,594,454 | | $ | (2,720,229 | ) |
Level 2 – Other Significant Observable Inputs | | | 14,488,000 | | | — | |
Level 3 – Significant Unobservable Inputs | | | — | | | — | |
Total | | $ | 1,013,082,454 | | $ | (2,720,229 | ) |
| * | Other financial instruments consist of futures contracts which are not included in the investment portfolio. |
| | | | | | | |
| | | | | | |
| Columbia Small Cap Index Fund | |
| Valuation Inputs | | Investments in Securities | | Other Financial
Instruments* | |
Level 1 – Quoted Prices | | $ | 678,343,790 | | $ | (888,231 | ) |
Level 2 – Other Significant Observable Inputs | | | 2,655,000 | | | — | |
Level 3 – Significant Unobservable Inputs | | | — | | | — | |
Total | | $ | 680,998,790 | | $ | (888,231 | ) |
| * | Other financial instruments consist of futures contracts which are not included in the investment portfolio. |
The following table reconciles asset balances for the year ending February 28, 2009 in which significant unobservable inputs (Level 3) were used in determining value:
| | | | | | |
| | | | | | |
| | | Investments In Securities | | | Other Financial Instruments |
Balance as of
February 29, 2008 | | $ | 1,464 | | | — |
Accretion of Discounts/Amortization of Premiums | | | — | | | — |
Realized gain(loss) | | | — | | | — |
Change in unrealized appreciation (depreciation)* | | | (1,464 | ) | | — |
Net purchases/sales | | | — | | | — |
Transfers into and/or out of Level 3 | | | — | | | — |
Balance as of
February 28, 2009 | | $ | — | | | — |
The information in the above reconciliation represents fiscal year to date activity for any securities identified as using Level 3 inputs at either the beginning or the end of the current fiscal period.
| * | The change in unrealized losses attributable to securities owned at February 28, 2009 which were valued using significant unobservable inputs (Level 3) amounted to $(1,464). This amount is included in net change in unrealized depreciation on the Statements of Changes in Net Assets. |
Security Transactions
Security transactions are accounted for on the trade date. Cost is determined and gains (losses) are based upon the specific identification method for both financial statement and federal income tax purposes.
75
Index Funds
February 28, 2009
In March 2008, Statement of Financial Accounting Standards No. 161, Disclosures about Derivative Instruments and Hedging Activities-an amendment of FASB Statement No. 133 (“SFAS 161”), was issued. SFAS 161 is effective for fiscal years and interim periods beginning after November 15, 2008. SFAS 161 requires additional discussion about the reporting entity’s derivative instruments and hedging activities, by providing for qualitative disclosures about the objectives and strategies for using derivatives, quantitative data about the fair value of and gains and losses on derivative contracts, and details of credit-risk-related contingent features in their derivative contracts. Management is evaluating the impact the application of SFAS 161 will have on the Funds’ financial statement disclosures.
Futures Contracts
The Funds may invest in futures contracts for both hedging and non-hedging purposes, including, for example, to seek to enhance returns or as a substitute for a position in an underlying asset.
The use of futures contracts involves certain risks, which include: (1) imperfect correlation between the price movement of the instruments and the underlying securities, (2) inability to close out positions due to differing trading hours, or the temporary absence of a liquid market, for either the instruments or the underlying securities, or (3) an inaccurate prediction by Columbia Management Advisors, LLC (“Columbia”), the Funds’ investment advisor, of the future direction of interest rates. Any of these risks may involve amounts exceeding the variation margin recorded in the Funds’ Statements of Assets and Liabilities at any given time.
Upon entering into a futures contract, a Fund pledges cash or securities with the broker in an amount sufficient to meet the initial margin requirement. Subsequent payments are made or received by a Fund equal to the daily change in the contract value and are recorded as variation margin receivable or payable and offset in unrealized gains or losses. A Fund recognizes a realized gain or loss when the contract is closed or expires.
Forward Foreign Currency Exchange Contracts
Forward foreign currency exchange contracts are agreements to exchange one currency for another at a future date at a specified price. These contracts are used to minimize the exposure to foreign exchange rate fluctuations during the period between trade and settlement date of the contract. Certain Funds may utilize forward foreign currency exchange contracts in connection with the settlement of purchases and sales of securities. Certain Funds may also enter into these contracts to hedge certain other foreign currency denominated assets. Contracts to buy generally are used to acquire exposure to foreign currencies, while contracts to sell are generally used to hedge the Funds’ investments against currency fluctuations. Forward foreign currency exchange contracts are valued daily at the current exchange rate of the underlying currency, resulting in unrealized gains (losses) which become realized at the time the forward foreign currency exchange contracts are closed or mature. Realized and unrealized gains (losses) arising from such transactions are included in net realized and unrealized gains (losses) on foreign currency transactions. The use of forward foreign currency exchange contracts does not eliminate fluctuations in the prices of the Funds’ portfolio securities. While the maximum potential loss from such contracts is the aggregate face value in U.S. dollars at the time the contract was opened, exposure is typically limited to the change in value of the contract (in U.S. dollars) over the period it remains open. The Funds could also be exposed to risk that counterparties of the contracts may be unable to fulfill the terms of the contracts.
Repurchase Agreements
Each Fund may engage in repurchase agreement transactions with institutions that Columbia has determined are creditworthy. Each Fund, through its custodian, receives delivery of the underlying securities collateralizing a repurchase agreement. Columbia is responsible for determining that the collateral is at least equal, at all times, to the value of the repurchase obligation including interest. A repurchase agreement transaction involves certain risks in the event of default or insolvency of the counterparty. These risks include possible delays in or restrictions on each Fund’s ability to dispose of the underlying securities and a possible decline in the value of the underlying securities during the period while the Funds seek to assert their rights.
Foreign Currency Translations and Transactions
The values of all assets and liabilities quoted in foreign currencies are translated into U.S. dollars at that day’s
76
Index Funds
February 28, 2009
exchange rates. Net realized and unrealized gains (losses) on foreign currency transactions and translations include gains (losses) arising from the fluctuation in exchange rates between trade and settlement dates on securities transactions, gains (losses) arising from the disposition of foreign currency and currency gains (losses) between the accrual and payment dates on dividends, interest income and foreign withholding taxes.
For financial statement purposes, the Funds do not distinguish that portion of gains (losses) on investments which is due to changes in foreign exchange rates from that which is due to changes in market prices of the investments. Such fluctuations are included with the net realized and unrealized gains (losses) on investments on the Statements of Operations.
Income Recognition
Interest income is recorded on the accrual basis. Corporate actions and dividend income are recorded on the ex-date except for certain foreign securities which are recorded as soon after the ex-date as the Funds become aware of such, net of any non-reclaimable tax withholdings. Distributions received from real estate investment trusts (REITs) in excess of their income are recorded as a reduction of the cost of the related investments. If the Funds no longer own the applicable securities, any distributions received in excess of income are recorded as realized gains.
Expenses
General expenses of the Trust are allocated to the Funds and other series of the Trust based upon relative net assets or other expense allocation methodologies determined by the nature of the expense. Expenses directly attributable to a Fund are charged to such Fund.
Determination of Class Net Asset Value
All income, expenses (other than class-specific expenses, as shown on the Statements of Operations) and realized and unrealized gains (losses) are allocated to each class of the Funds on a daily basis, based on the relative net assets of each class, for purposes of determining the net asset value of each class.
Federal Income Tax Status
Each Fund intends to qualify each year as a “regulated investment company” under Subchapter M of the Internal Revenue Code, as amended, and will distribute substantially all of its tax-exempt or taxable income, if any, for its tax year, and as such will not be subject to federal income taxes. In addition, each Fund intends to distribute in each calendar year substantially all of its net investment income, capital gains and certain other amounts, if any, such that each Fund should not be subject to federal excise tax. Therefore, no federal income or excise tax provision is recorded.
Distributions to Shareholders
Distributions from net investment income, if any, for Columbia Large Cap Index Fund, Columbia Mid Cap Index Fund and Columbia Small Cap Index Fund are declared and distributed semiannually. Distributions from net investment income, if any, for Columbia Large Cap Enhanced Core Fund are declared and distributed annually. Net realized capital gains, if any, are distributed at least annually for each of the Funds. Income distributions and capital gain distributions are determined in accordance with federal income tax regulations which may differ from GAAP.
Indemnification
In the normal course of business, each Fund enters into contracts that contain a variety of representations and warranties and which provide general indemnities. A Fund’s maximum exposure under these arrangements is unknown because this would involve future claims against a Fund. Also, under the Trust’s organizational documents and by contract, the Trustees and officers of the Trust are indemnified against certain liabilities that may arise out of actions relating to their duties to the Trust. However, based on experience, the Funds expect the risk of loss due to these representations, warranties and indemnities to be minimal.
Note 3. Federal Tax Information
The timing and character of income and capital gain distributions are determined in accordance with income tax regulations, which may differ from GAAP. Reclassifications are made to each Fund’s capital accounts for permanent tax differences to reflect income and gains available for distribution (or available capital loss carryforwards) under income tax regulations.
77
Index Funds
February 28, 2009
For the year ended February 28, 2009, permanent book and tax basis differences resulting primarily from differing treatments for redemption based payments as dividends paid deduction and foreign currency transactions were identified and reclassified among the components of the Funds’ net assets as follows:
| | | | | | | | | | | |
| | | | | | | | | |
| | | Undistributed or
(Overdistributed)
or Accumulated
Net Investment
Income (Loss) | | | Accumulated
Net Realized
Gain/Loss | | | Paid-In
Capital |
Columbia Large Cap Index Fund | | $ | (4,690 | ) | | $ | 4,690 | | | $ | — |
Columbia Large Cap Enhanced Core Fund | | | (206,228 | ) | | | 206,228 | | | | — |
Columbia Mid Cap Index Fund | | | (373,417 | ) | | | (1,708,583 | ) | | | 2,082,000 |
Columbia Small Cap Index Fund | | | (391,437 | ) | | | (4,380,218 | ) | | | 4,771,655 |
Net investment income and net realized gains (losses), as disclosed on the Statements of Operations, and net assets were not affected by these reclassifications.
The tax character of distributions paid during the years ended February 28, 2009 and February 29, 2008 was as follows:
February 28, 2009
| | | | | | |
| |
| | | Ordinary
Income* | | Long-term
Capital Gains |
Columbia Large Cap Index Fund | | $ | 52,713,343 | | $ | — |
Columbia Large Cap Enhanced Core Fund | | | 11,987,661 | | | — |
Columbia Mid Cap Index Fund | | | 30,143,307 | | | 96,931,916 |
Columbia Small Cap Index Fund | | | 21,983,814 | | | 130,737,641 |
February 29, 2008
| | | | | | |
| |
| | | Ordinary
Income* | | Long-term Capital Gain |
Columbia Large Cap Index Fund | | $ | 50,761,256 | | $ | — |
Columbia Large Cap Enhanced Core Fund | | | 43,237,479 | | | 18,711,405 |
Columbia Mid Cap Index Fund | | | 36,645,929 | | | 184,730,926 |
Columbia Small Cap Index Fund | | | 23,112,252 | | | 165,110,899 |
| * | For tax purposes short-term capital gains distributions, if any, are considered ordinary income distributions. |
As of February 28, 2009, the components of distributable earnings on a tax basis were as follows:
| | | | | | | | | | |
| | | | | | | | |
| | | Undistributed
Ordinary Income | | Undistributed Long-term Capital Gains | | Net Unrealized Appreciation (Depreciation)* | |
Columbia Large Cap Index Fund | | $ | 7,211,413 | | $ | — | | $ | (516,125,334 | ) |
Columbia Large Cap Enhanced Core Fund | | | 1,669,245 | | | — | | | (113,779,411 | ) |
Columbia Mid Cap Index Fund | | | — | | | — | | | (549,335,477 | ) |
Columbia Small Cap Index Fund | | | 381,531 | | | — | | | (400,586,209 | ) |
| * | The differences between book-basis and tax-basis net unrealized appreciation/depreciation are primarily due to deferral of losses from wash sales and futures marked to market. |
78
Index Funds
February 28, 2009
Unrealized appreciation and depreciation at February 28, 2009, based on cost of investments for federal income tax purposes was:
| | | | | | | | |
| | | | | | | | | |
| | | Unrealized Appreciation | | Unrealized Depreciation | | | Net Unrealized Depreciation | |
Columbia Large Cap Index Fund | | 315,559,893 | | (831,685,227 | ) | | (516,125,334 | ) |
Columbia Large Cap Enhanced Core Fund | | 28,139,036 | | (141,918,447 | ) | | (113,779,411 | ) |
Columbia Mid Cap Index Fund | | 94,118,222 | | (643,453,699 | ) | | (549,335,477 | ) |
Columbia Small Cap Index Fund | | 85,713,097 | | (486,299,306 | ) | | (400,586,209 | ) |
The following capital loss carryforwards may be available to reduce taxable income arising from future net realized gains on investments, if any, to the extent permitted by the Internal Revenue Code:
| | | |
| | | |
| Columbia Large Cap Index Fund | | |
Expiring in 2010 | | $ | 18,794,634 |
Expiring in 2011 | | | 114,143,427 |
Expiring in 2013 | | | 19,822,029 |
Expiring in 2014 | | | 13,154,769 |
Expiring in 2015 | | | 108,188,982 |
Expiring in 2017 | | | 19,873,230 |
| | | |
| Columbia Large Cap Enhanced Core Fund | | |
Expiring in 2017 | | $ | 125,697,411 |
The availability of a portion of the capital loss carryforwards acquired by Columbia Large Cap Index Fund as a result of its merger with Columbia Large Company Index Fund may be limited in a given year.
Under current tax rules, certain currency and capital losses realized after October 31 may be deferred and treated as occurring on the first day of the following fiscal year. As of February 28, 2009, post-October capital losses attributed to security transactions were deferred to March 1, 2009 as follows:
| | | |
| | | |
Columbia Large Cap Enhanced Core Fund | | $ | 100,941,554 |
Columbia Mid Cap Index Fund | | | 75,517,969 |
Columbia Small Cap Index Fund | | | 53,554,572 |
Under Financial Accounting Standards Board (“FASB”) Interpretation No. 48, Accounting for Uncertainty in Income Taxes — an Interpretation of FASB Statement No. 109 (“FIN 48”), management determines whether a tax position of the Funds is more likely than not to be sustained upon examination by the applicable taxing authority, including resolution of any related appeals or litigation processes, based on the technical merits of the position. The tax benefit to be recognized is measured as the largest amount of benefit that is greater than fifty percent likely of being realized upon ultimate settlement. Management has evaluated the known implications of FIN 48 on the computation of net assets for each Fund. As a result of this evaluation, management has concluded that FIN 48 did not have any effect on the Funds’ financial statements. However, management’s conclusions regarding FIN 48 may be subject to review and adjustment at a later date based on factors including, but not limited to, further implementation guidance from the FASB, new tax laws, regulations, and administrative interpretations (including relevant court decisions). The Funds’ federal tax returns for the prior three fiscal years remain subject to examination by the Internal Revenue Service. The Funds are not aware of any tax positions for which it is reasonably possible that the total amounts of unrecognized tax benefits will significantly change in the next twelve months.
Note 4. Fees and Compensation Paid to Affiliates
Investment Advisory Fee
Columbia, an indirect, wholly owned subsidiary of Bank of America Corporation (“BOA”), provides investment advisory services to the Funds. In rendering investment advisory services to the Funds, Columbia may use the portfolio management and research resources of Columbia Management Pte. Ltd (“Pte”), an affiliate of Columbia. Columbia, from the investment advisory fee it receives from the Funds, pays Pte. a fee for its advisory services. Columbia
79
Index Funds
February 28, 2009
receives a monthly investment advisory fee based on each Fund’s average daily net assets at the following annual rates:
| | | | | | | | | | | | |
| | | | | | | | | | | | | |
Fees on
Average Net
Assets | | Columbia
Large Cap
Index Fund | | | Columbia
Large Cap
Enhanced
Core Fund | | | Columbia
Mid Cap
Index Fund | | | Columbia
Small Cap
Index Fund | |
First $500 Million | | 0.10 | % | | 0.35 | % | | 0.10 | % | | 0.10 | % |
$500 Million to $1 Billion | | 0.10 | % | | 0.30 | % | | 0.10 | % | | 0.10 | % |
$1 Billion to $1.5 Billion | | 0.10 | % | | 0.25 | % | | 0.10 | % | | 0.10 | % |
$1.5 Billion to $3 Billion | | 0.10 | % | | 0.20 | % | | 0.10 | % | | 0.10 | % |
$3 Billion to $6 Billion | | 0.10 | % | | 0.18 | % | | 0.10 | % | | 0.10 | % |
Over $6 Billion | | 0.10 | % | | 0.16 | % | | 0.10 | % | | 0.10 | % |
For the year ended February 28, 2009, the effective investment advisory fee rates for the Funds, as a percentage of each Fund’s average daily net assets, were as follows:
| | | |
| | |
| | | Effective Rates | |
Columbia Large Cap Index Fund | | 0.10 | % |
Columbia Large Cap Enhanced Core Fund | | 0.34 | % |
Columbia Mid Cap Index Fund | | 0.10 | % |
Columbia Small Cap Index Fund | | 0.10 | % |
Administration Fee
Columbia provides administrative and other services to the Funds. For Columbia Large Cap Index Fund and Columbia Small Cap Index Fund, Columbia, from the administration fee it receives from each Fund, pays all operating expenses of the Funds, with the exception of brokerage fees and commissions, taxes, interest, fees and expenses of Trustees who are not officers, directors or employees of Columbia or its affiliates, distribution (Rule 12b-1) and/or shareholder servicing fees and any extraordinary non-recurring expenses that may arise, including litigation.
For Columbia Large Cap Enhanced Core Fund and Columbia Mid Cap Index Fund, Columbia is entitled to receive an administration fee less the fees payable by the Funds as described under the Pricing and Bookkeeping Fees note below.
Columbia receives a monthly administration fee based on each Fund’s average daily net assets at the following annual rates:
| | | |
| | |
| | | Annual Fee Rate | |
Columbia Large Cap Index Fund | | 0.10 | % |
Columbia Large Cap Enhanced Core Fund | | 0.17 | % |
Columbia Mid Cap Index Fund | | 0.10 | % |
Columbia Small Cap Index Fund | | 0.10 | % |
Pricing and Bookkeeping Fees
The Funds have entered into a Financial Reporting Services Agreement (the “Financial Reporting Services Agreement”) with State Street Bank & Trust Company (“State Street”) and Columbia pursuant to which State Street provides financial reporting services to the Funds. The Funds have also entered into an Accounting Services Agreement (collectively with the Financial Reporting Services Agreement, the “State Street Agreements”) with State Street and Columbia pursuant to which State Street provides accounting services to the Funds. Under the State Street Agreements, each Fund pays State Street an annual fee of $38,000 paid monthly plus an additional monthly fee based on an annualized percentage rate of average daily net assets of each Fund for the month. The aggregate fee per Fund will not exceed $140,000 per year (exclusive of out-of-pocket expenses and charges). The Funds also reimburse State Street for certain out-of-pocket expenses and charges.
The Funds have entered into a Pricing and Bookkeeping Oversight and Services Agreement (the “Services Agreement”) with Columbia. Under the Services Agreement, Columbia provides services related to Fund expenses and the requirements of the Sarbanes-Oxley Act of 2002, and provides oversight of the accounting and financial reporting services provided by State Street. Under the Services Agreement, the Funds reimburse Columbia for out-of-pocket expenses.
Transfer Agent Fee
Columbia Management Services, Inc. (the “Transfer Agent”), an affiliate of Columbia and an indirect, wholly owned subsidiary of BOA, provides shareholder services to the Funds and has contracted with Boston Financial Data
80
Index Funds
February 28, 2009
Services (“BFDS”) to serve as sub-transfer agent. The Transfer Agent is entitled to receive a fee for its services, paid monthly, at the annual rate of $17.34 per open account plus reimbursement of certain sub-transfer agent fees paid by the Transfer Agent (exclusive of BFDS fees), calculated based on assets held in omnibus accounts and intended to recover the cost of payments to other parties (including affiliates of BOA) for services to those accounts. The Transfer Agent pays the fees of BFDS for services as sub-transfer agent and is not entitled to reimbursement for such fees from the Funds. The Transfer Agent may also retain, as additional compensation for its services, fees for wire, telephone and redemption orders, Individual Retirement Account (“IRA”) trustee agent fees and account transcript fees due to the Transfer Agent from shareholders of the Funds and credits (net of bank charges) earned with respect to balances in accounts the Transfer Agent maintains in connection with its services to the Funds. The Transfer Agent also receives reimbursement for certain out-of-pocket expenses.
An annual minimum account balance fee of up to $20 may apply to certain accounts with a value below each Fund’s initial minimum investment requirements. The Transfer Agent will reduce the expenses paid by a Fund by any amounts it collects from the assessment of this fee. For Funds that do not have transfer agency expenses against which to offset the amount collected through assessment of this fee, the fee will be paid directly to the Fund. These minimum account balance fees are recorded as part of expense reductions on the Statements of Operations. For the year ended February 28, 2009, these minimum account balance fees reduced total expenses as follows:
| | | |
| |
Columbia Large Cap Index Fund | | $ | 17,889 |
Columbia Large Cap Enhanced Core Fund | | | 397 |
Columbia Mid Cap Index Fund | | | 293 |
Columbia Small Cap Index Fund | | | 8,293 |
Underwriting Discounts, Distribution and Shareholder Servicing Fees
Columbia Management Distributors, Inc. (the “Distributor”), an affiliate of Columbia and an indirect, wholly owned subsidiary of BOA, is the principal underwriter of the Funds’ shares.
For the year ended February 28, 2009, the Distributor has retained net underwriting discounts on sales of Class A shares and received net CDSC fees on Class B share redemptions as follows:
| | | | | | |
| | | Front End Sales Charge | | CDSC |
| | | Class A | | Class B |
Columbia Large Cap Index Fund | | $ | 446 | | $ | 14,227 |
The Trust has adopted a shareholder servicing plan and a distribution plan for the Class B shares of Columbia Large Cap Index Fund, a distribution plan for the Class R shares of Columbia Large Cap Enhanced Core Fund, and a combined distribution and shareholder servicing plan for the Class A shares of each Fund. The shareholder servicing plans permit the Funds to compensate or reimburse servicing agents for the shareholder services they have provided. The distribution plans, adopted pursuant to Rule 12b-1 under the 1940 Act, permit the Funds to compensate or reimburse the Distributor and/or selling agents for activities or expenses primarily intended to result in the sale of the classes’ shares. Payments are made at an annual rate and paid monthly, as a percentage of average daily net assets, set from time to time by the Board of Trustees, and are charged as expenses of each Fund directly to the applicable share class. A substantial portion of the expenses incurred pursuant to these plans is paid to affiliates of BOA and the Distributor.
The annual rates in effect and plan limits, as a percentage of average daily net assets are as follows:
| | | | |
| |
| | | Current
Rate | | Plan
Limit |
Class A Combined Distribution and Shareholder Servicing Plan* | | 0.25% | | 0.25% |
Class B Shareholder Servicing Plans** | | 0.25% | | 0.25% |
Class B Distribution Plans** | | 0.75% | | 0.75% |
Class R Distribution Plan*** | | 0.50% | | 0.50% |
| ** | For Columbia Large Cap Index Fund |
| *** | For Columbia Large Cap Enhanced Core Fund |
81
Index Funds
February 28, 2009
Expense Limits and Fee Waivers
Columbia and/or some of the Funds’ other service providers have contractually agreed to waive fees and/or reimburse expenses through June 30, 2009, so that the expenses incurred by the Funds (exclusive of distribution and service fees, brokerage commissions, interest, taxes and extraordinary expenses, but inclusive of custodial charges relating to overdrafts, if any) after giving effect to any balance credits from the Funds’ custodian, will not exceed the following annual rates, based on each Fund’s average daily net assets:
| | | |
| | |
| Fund | | Annual rate | |
Columbia Large Cap Index Fund | | 0.14 | % |
Columbia Large Cap Enhanced Core Fund | | 0.50 | % |
Columbia Mid Cap Index Fund | | 0.14 | % |
Columbia Small Cap Index Fund | | 0.21 | % |
There is no guarantee that these expense limitations will continue after June 30, 2009.
Columbia is entitled to recover from Columbia Large Cap Index Fund, Columbia Large Cap Enhanced Core Fund and Columbia Small Cap Index Fund any fees waived and/or expenses reimbursed for a three year period following the date of such fee waiver and/or reimbursement if such recovery does not cause a Fund’s total operating expenses to exceed the expense limitations in effect at the time of recovery.
At February 28, 2009 the amounts potentially recoverable by Columbia pursuant to this arrangement are as follows:
| | | | | | | | | | | | |
| | | | | | | | | |
| | |
| | | Amount of Potential Recovery Expiring: | | Total
Potential
Recovery |
| Fund | | 2/29/2012 | | 2/28/2011 | | 2/28/2010 | |
Columbia Large
Cap Index
Fund | | $ | 1,330,267 | | $ | 1,647,710 | | $ | 1,379,819 | | $ | 4,357,796 |
Columbia Large
Cap Enhanced
Core Fund | | | 431,216 | | | 366,741 | | | 393,249 | | | 1,191,206 |
Fees Paid to Officers and Trustees
All officers of the Funds are employees of Columbia or its affiliates and, with the exception of the Funds’ Chief Compliance Officer, receive no compensation from the Funds. The Board of Trustees has appointed a Chief Compliance Officer to the Funds in accordance with federal securities regulations. The Funds, along with other affiliated funds, pay their pro-rata share of the expenses associated with the Chief Compliance Officer. Each Fund’s expenses for the Chief Compliance Officer will not exceed $15,000 per year.
The Trust’s eligible Trustees may participate in a non-qualified deferred compensation plan which may be terminated at any time. Any payments to plan participants are paid solely out of the Funds’ assets. Income earned on the plan participant’s deferral account is based on the rate of return of the eligible mutual funds selected by the participant or, if no funds are selected, on the rate of return of Columbia Treasury Reserves, another portfolio of the Trust. The expense for the deferred compensation plan which includes trustees’ fees deferred during the current period as well as any gains or losses on the Trustees’ deferred compensation balances as a result of market fluctuations is included in “Trustees’ fees” on the Statements of Operations. The liability for the deferred compensation plan is included in “Trustees’ fees” on the Statements of Assets and Liabilities
As a result of fund mergers, certain Funds assumed the liabilities of the deferred compensation plan of the acquired fund, which are included in “Trustees’ fee” on the Statements of Assets and Liabilities. The deferred compensation plan may be terminated at any time. Any payments to plan participants are paid solely out of the Funds’ assets.
Note 5. Custody Credits
Each Fund has an agreement with its custodian bank under which custody fees may be reduced by balance credits. These credits are recorded as part of expense reductions on the Statements of Operations. The Funds could have invested a portion of the assets utilized in connection with the expense offset arrangement in an income-producing asset if they had not entered into such an agreement.
For the year ended February 28, 2009, these custody credits reduced total expenses for the Funds as follows:
| | | |
| | | |
| | | Custody
Credits |
Columbia Large Cap Enhanced Core Fund | | $ | 313 |
Columbia Mid Cap Index Fund | | | 4,234 |
82
Index Funds
February 28, 2009
Note 6. Portfolio Information
For the year ended February 28, 2009, the cost of purchases and proceeds from sales of securities, excluding short-term obligations, for the Funds were as follows:
| | | | | | |
| | | | | |
| | | Purchases | | Sales |
Columbia Large Cap Index Fund | | $ | 279,095,256 | | $ | 115,233,118 |
Columbia Large Cap Enhanced Core Fund | | | 1,562,717,321 | | | 1,675,392,883 |
Columbia Mid Cap Index Fund | | | 455,901,269 | | | 487,474,522 |
Columbia Small Cap Index Fund | | | 403,720,809 | | | 430,730,435 |
Note 7. Line of Credit
The Funds and other affiliated funds participate in a $280,000,000 committed, unsecured revolving line of credit provided by State Street. The maximum amount that may be borrowed by any fund is limited to the lesser of $200,000,000 and the Fund’s borrowing limit set forth in the Fund’s registration statement. Borrowings are available for short-term liquidity or temporary or emergency purposes.
Interest is charged to each participating fund based on the fund’s borrowings at a rate per annum equal to the greater of the Federal Funds Rate plus 0.50% or the overnight LIBOR Rate plus 0.50%. In addition, an annual operations agency fee of $20,000, an amendment fee of 0.02% and a commitment fee of 0.12% per annum are accrued and apportioned among the participating funds pro rata based on their relative net assets. Prior to October 16, 2008, the Funds and other affiliated funds participated in a $350,000,000 committed, unsecured revolving line of credit and a $150,000,000 uncommitted, unsecured line of credit, both provided by State Street. Interest on the committed line of credit was charged to each participating fund based on the fund’s borrowings at a rate per annum equal to the Federal Funds Rate plus 0.50%. In addition, a commitment fee of 0.10% per annum was accrued and apportioned among the participating funds pro rata based on their relative net assets. Interest on the uncommitted line of credit was charged to each participating fund based on the fund’s borrowings at a rate per annum equal to the Federal Funds Rate plus 0.375%. State Street charged an annual operations agency fee of $40,000 for the committed line of credit and was able to charge an annual administration fee of $15,000 for the uncommitted line of credit. The commitment fee, the operations agency fee and the administration fee were accrued and apportioned among the participating funds pro rata based on their relative net assets.
For the year ended February 28, 2009, the average daily loan balance outstanding on days where borrowing existed, and the weighted average interest rate of each Fund that borrowed were as follows:
| | | | | | |
| | | | | | |
| | | Average
Borrowing Existed | | Weighted Average Interest Rate | |
Columbia Large Cap Enhanced Core Fund | | $ | 4,400,000 | | 2.5374 | % |
Columbia Mid Cap Index Fund | | | 2,000,000 | | 0.9000 | |
Columbia Small Cap Index Fund | | | 3,000,000 | | 1.6625 | |
Note 8. Securities Lending
Each Fund may lend its securities to certain approved brokers, dealers and other financial institutions. Each loan is collateralized by cash, in an amount at least equal to the market value of the securities loaned plus accrued income from the investment of collateral. The market value of the loaned securities is determined at the close of business of the Funds and any additional required collateral is delivered to the Funds on the next business day. The collateral received is invested and the income generated by the investment of the collateral, net of any fees remitted to State Street as the lending agent and borrower rebates, is paid to the Funds. Generally, in the event of borrower default, the Funds have the right to use the collateral to offset any losses incurred. In the event the Funds are delayed in or prevented from exercising their right to dispose of the collateral, there may be a potential loss to the Funds. The Funds bear the risk of loss with respect to the investment of collateral.
83
Index Funds
February 28, 2009
Note 9. Shares of Beneficial Interest
As of February 28, 2009, the Funds had shareholders whose shares were beneficially owned by participant accounts over which BOA and/or any of its affiliates had either sole or joint investment discretion. Subscription and redemption activity of these accounts may have a significant effect on the operations of the Funds. The percentages of shares of beneficial interest outstanding held therein are as follows:
| | |
| | | |
| | | % of Shares
Outstanding Held |
Columbia Large Cap Index Fund | | 63.2 |
Columbia Large Cap Enhanced Core Fund | | 82.6 |
Columbia Mid Cap Index Fund | | 78.7 |
Columbia Small Cap Index Fund | | 64.3 |
Subscription and redemption activity of these accounts may have a significant effect on the operations of the Funds.
Note 10. Significant Risks and Contingencies
Legal Proceedings
Columbia Management Advisors, LLC and Columbia Management Distributors, Inc. (collectively, the “Columbia Group”) are subject to a settlement agreement with the New York Attorney General (“NYAG”) (the “NYAG Settlement”) and a settlement order with the SEC (the “SEC Order”) on matters relating to mutual fund trading, each dated February 9, 2005. Under the terms of the SEC Order, the Columbia Group (or predecessor entities) agreed, among other things, to: pay disgorgement and civil money penalties collectively totaling $375 million; cease and desist from violations of the antifraud provisions and certain other provisions of the federal securities laws; maintain certain compliance and ethics oversight structures; and retain an independent consultant to review the Columbia Group’s applicable supervisory, compliance, control and other policies and procedures. The NYAG Settlement, among other things, requires Columbia Management Advisors, LLC and its affiliates to reduce management fees for certain funds in the Columbia family of mutual funds in a projected total of $160 million over five years through November 30, 2009 and to make certain disclosures to investors relating to expenses. In connection with the Columbia Group providing services to the Columbia Funds, the Columbia Funds have voluntarily undertaken to implement certain governance measures designed to maintain the independence of their boards of trustees and certain special consulting and compliance measures.
Pursuant to the SEC Order and related procedures, the $375 million in settlement amounts described above, of which approximately $90 million has been earmarked for certain Columbia Funds and their shareholders, is being distributed in accordance with a distribution plan developed by an independent distribution consultant and approved by the SEC on December 27, 2007. Distributions under the distribution plan began in mid-June 2008.
Civil Litigation
In connection with the events that resulted in the NYAG Settlement and SEC Order, various parties filed suits against Bank of America Corporation and certain of its affiliates, including Banc of America Capital Management, LLC (“BACAP,” now known as Columbia Management Advisors, LLC) and BACAP Distributors, LLC (now known as Columbia Management Distributors, Inc.) (collectively “BAC”), Nations Funds Trust (now known as Columbia Funds Series Trust) and its Board of Trustees. On February 20, 2004, the Judicial Panel on Multidistrict Litigation transferred these cases and cases against other mutual fund companies based on similar allegations to the United States District Court in Maryland for consolidated or coordinated pretrial proceedings (the “MDL”). Subsequently, additional related cases were transferred to the MDL. On September 29, 2004, the plaintiffs in the MDL filed amended and consolidated complaints. One of these amended complaints is a putative class action that includes claims under the federal securities laws and state common law, and that names Nations Funds Trust, the Trustees, BAC and others as defendants. Another of the amended complaints is a derivative action purportedly on behalf of the Nations Funds Trust against BAC and others that asserts claims under federal securities laws and state common law. Nations Funds Trust is a nominal defendant in this action.
On February 25, 2005, BAC and other defendants filed motions to dismiss the claims in the pending cases. On December 15, 2005, BAC and others entered into a Stipulation of Settlement of the direct and derivative claims brought on behalf of the Nations Funds shareholders. The settlement is subject to court approval. If the settlement is approved, BAC would pay settlement administration costs and fees to plaintiffs’ counsel as approved by the court. The stipulation has not yet been presented to the court for approval.
84
Report of Independent Registered Public Accounting Firm
To the Shareholders and Trustees of Columbia Funds Series Trust
In our opinion, the accompanying statements of assets and liabilities, including the investment portfolios, and the related statements of operations and of changes in net assets and the financial highlights present fairly, in all material respects, the financial position of Columbia Large Cap Index Fund, Columbia Large Cap Enhanced Core Fund, Columbia Mid Cap Index Fund and Columbia Small Cap Index Fund (constituting part of Columbia Funds Series Trust, hereafter referred to as the “Funds”) at February 28, 2009, the results of each of their operations for the year then ended, the changes in each of their net assets and the financial highlights for each of the periods indicated, in conformity with accounting principles generally accepted in the United States of America. These financial statements and the financial highlights (hereafter referred to as “financial statements”) are the responsibility of the Funds’ management. Our responsibility is to express an opinion on these financial statements based on our audits. We conducted our audits of these financial statements in accordance with the standards of the Public Company Accounting Oversight Board (United States). Those standards require that we plan and perform the audit to obtain reasonable assurance about whether the financial statements are free of material misstatement. An audit includes examining, on a test basis, evidence supporting the amounts and disclosures in the financial statements, assessing the accounting principles used and significant estimates made by management, and evaluating the overall financial statement presentation. We believe that our audits, which included confirmation of securities at February 28, 2009 by correspondence with the custodian and brokers, provide a reasonable basis for our opinion.
PricewaterhouseCoopers LLP
Boston, Massachusetts
April 22, 2009
85
Federal Income Tax Information (unaudited) – Index Funds
Columbia Large Cap Index Fund
96.36% of the ordinary dividend income distributed by the Fund, for the year ended February 28, 2009, qualifies for the corporate dividends received deduction.
For non-corporate shareholders 96.02% or the maximum amount allowable under the Jobs and Growth Tax Relief Reconciliation Act of 2003, of income distributed by the Fund for the period March 1, 2008 to February 28, 2009 may represent qualified dividend income. Final information will be provided in your 2009 1099-DIV Form.
Columbia Large Cap Enhanced Core Fund
89.90% of the ordinary dividend income distributed by the Fund, for the year ended February 28, 2009, qualifies for the corporate dividends received deduction.
For non-corporate shareholders 89.55% or the maximum amount allowable under the Jobs and Growth Tax Relief Reconciliation Act of 2003, of income distributed by the Fund for the period March 1, 2008 to February 28, 2009 may represent qualified dividend income. Final information will be provided in your 2009 1099-DIV Form.
Columbia Mid Cap Index Fund
The Fund hereby designates as a capital gain dividend with respect to the taxable year ended February 28, 2009, $65,550,689, or, if subsequently determined to be different, the net capital gain of such year.
55.73% of the ordinary dividend income distributed by the Fund, for the year ended February 28, 2009, qualifies for the corporate dividends received deduction.
For non-corporate shareholders 55.73% or the maximum amount allowable under the Jobs and Growth Tax Relief Reconciliation Act of 2003, of income distributed by the Fund for the period March 1, 2008 to February 28, 2009 may represent qualified dividend income. Final information will be provided in your 2009 1099-DIV Form.
Columbia Small Cap Index Fund
The Fund hereby designates as a capital gain dividend with respect to the taxable year ended February 28, 2009, $108,226,073, or, if subsequently determined to be different, the net capital gain of such year.
36.93% of the ordinary dividend income distributed by the Fund, for the year ended February 28, 2009, qualifies for the corporate dividends received deduction.
For non-corporate shareholders 38.10% or the maximum amount allowable under the Jobs and Growth Tax Relief Reconciliation Act of 2003, of income distributed by the Fund for the period March 1, 2008 to February 28, 2009 may represent qualified dividend income. Final information will be provided in your 2009 1099-DIV Form.
86
Fund Governance
The Trustees serve terms of indefinite duration. The names, addresses and ages of the Trustees and officers of the Funds in the Columbia Funds Complex, the year each was first elected or appointed to office, their principal business occupations during at least the last five years, the number of Funds overseen by each Trustee and other directorships they hold are shown below. Each officer listed below serves as an officer of each Fund in the Columbia Funds Complex.
Independent Trustees
| | |
Name, address and age, Position
with funds, Year first elected or
appointed to office | | Principal Occupation(s) During Past Five Years, Number of Funds in the Columbia
Funds Complex Overseen by Trustee, Other Directorships Held |
| |
| Edward J. Boudreau (Born 1944) | | |
c/o Columbia Management Advisors, LLC One Financial Center Boston, MA 02111 Trustee (since 2005) | | Managing Director–E.J. Boudreau & Associates (consulting), from 2000 through current; oversees 66 funds; no other directorships held. |
| |
| William P. Carmichael (Born 1943) | | |
c/o Columbia Management Advisors, LLC One Financial Center Boston, MA 02111 Trustee (since 1999) | | Retired. Oversees 66 funds; Director–Cobra Electronics Corporation (electronic equipment manufacturer); Director–Spectrum Brands, Inc. (consumer products); Director–Simmons Company (bedding); Director–The Finish Line (sportswear). |
| |
| William A. Hawkins (Born 1942) | | |
c/o Columbia Management Advisors, LLC One Financial Center Boston, MA 02111 Trustee (since 2005) | | President and Chief Executive Officer–California General Bank, N.A., from January 2008 through current; oversees 66 funds; no other directorships held. |
| |
| R. Glenn Hilliard (Born 1943) | | |
c/o Columbia Management Advisors, LLC One Financial Center Boston, MA 02111 Trustee (since 2005) | | Chairman and Chief Executive Officer–Hilliard Group LLC (investing and consulting), from April 2003 through current; Non-Executive Director & Chairman–Conseco, Inc. (insurance), September 2003 through current; Executive Chairman–Conseco, Inc. (insurance), August 2004 through September 2005; oversees 66 funds; Director–Conseco, Inc. (insurance). |
| |
| John J. Nagorniak (Born 1944) | | |
c/o Columbia Management Advisors, LLC One Financial Center Boston, MA 02111 Trustee (since 2008) | | Retired. President and Director–Foxstone Financial, Inc. (consulting), 2000 through December 2007; Director–Mellon Financial Corporation affiliates (investing), 2000 through 2007; Chairman–Franklin Portfolio Associates (investing–Mellon affiliate), 1982 through 2007; oversees 66 funds; Director–MIT Investment Company; Trustee–MIT 401k Plan; Trustee and Chairman–Research Foundation of CFA Institute. |
| |
| Anthony M. Santomero (Born 1946) | | |
c/o Columbia Management Advisors, LLC One Financial Center Boston, MA 02111 Trustee (since 2008) | | Richard K. Mellon Professor Emeritus of Finance, The Wharton School, University of Pennsylvania, from 1972 through current; Senior Advisor–McKinsey & Company (consulting), July 2006 through December 2007; President and Chief Executive Officer–Federal Reserve Bank of Philadelphia, 2000 through April 2006; oversees 66 funds; no other directorships held. |
87
Fund Governance (continued)
Independent Trustees (continued)
| | |
Name, address and age, Position
with funds, Year first elected or
appointed to office | | Principal Occupation(s) During Past Five Years, Number of Funds in the Columbia
Funds Complex Overseen by Trustee, Other Directorships Held |
| |
| Minor M. Shaw (Born 1947) | | |
c/o Columbia Management Advisors, LLC One Financial Center Boston, MA 02111 Trustee (since 2003) | | President–Micco Corporation, Chairman–The Daniel–Mickel Foundation; oversees 66 funds; Board Member–Piedmont Natural Gas. |
88
Fund Governance (continued)
Officers
| | |
Name, Address and Year of Birth,
Position with Columbia Funds, Year First
Elected or Appointed to Office | | Principal Occupation(s) During Past Five Years |
| |
| J. Kevin Connaughton (Born 1964) | | |
One Financial Center Boston, MA 02111 President (since 2009) | | Managing Director of Columbia Management Advisors, LLC since December 2004; Senior Vice President and Chief Financial Officer–Columbia Funds, from June 2008 to January 2009; Treasurer–Columbia Funds, from October 2003 to May 2008; Treasurer–the Liberty Funds, Stein Roe Funds and Liberty All-Star Funds, December 2000–December 2006; Senior Vice President–Columbia Management Advisors, LLC, from April 2003 to December 2004; President–Columbia Funds, Liberty Funds and Stein Roe Funds, February 2004 to October 2004; Treasurer–Galaxy Funds, September 2002 to December 2005; Treasurer, December 2002 to December 2004, and President, February 2004 to December 2004–Columbia Management Multi-Strategy Hedge Fund, LLC; and a senior officer of various other Bank of America-affiliated entities, including other registered and unregistered funds. |
| |
| James R. Bordewick, Jr. (Born 1959) | | |
One Financial Center Boston, MA 02111 Senior Vice President, Secretary and Chief Legal Officer
(since 2006) | | Associate General Counsel, Bank of America since April 2005; Senior Vice President and Associate General Counsel, MFS Investment Management (investment management) prior to April 2005. |
| |
| Linda J. Wondrack (Born 1964) | | |
One Financial Center Boston, MA 02111 Senior Vice President and Chief Compliance Officer
(since 2007) | | Director (Columbia Management Group LLC and Investment Product Group Compliance), Bank of America since June 2005; Director of Corporate Compliance and Conflicts Officer, MFS Investment Management (investment management), August 2004 to May 2005; Managing Director, Deutsche Asset Management (investment management) prior to August 2004. |
| |
| Michael G. Clarke (Born 1969) | | |
One Financial Center Boston, MA 02111 Senior Vice President and Chief Financial Officer
(since 2009) | | Director of Fund Administration of the Advisor since January 2006; Managing Director of the Advisor September 2004 to December 2005; Vice President Fund Administration June 2002 to September 2004. |
| |
| Jeffrey R. Coleman (Born 1969) | | |
One Financial Center Boston, MA 02111 Treasurer (since 2008) | | Director of Fund Administration of the Advisor since January 2006; Fund Controller of the Advisor from October 2004 to January 2006; Vice President of CDC IXIS Asset Management Services, Inc. (investment management) from August 2000 to September 2004. |
| |
| Joseph F. DiMaria (Born 1968) | | |
One Financial Center Boston, MA 02111 Chief Accounting Officer (since 2008) | | Director of Fund Administration of the Advisor since January 2006; Head of Tax/Compliance and Assistant Treasurer of the Advisor from November 2004 to December 2005; Director of Trustee Administration (Sarbanes-Oxley) of the Advisor from May 2003 to October 2004. |
89
Fund Governance (continued)
Officers (continued)
| | |
Name, Address and Year of Birth,
Position With Columbia Funds, Year First
Elected or Appointed to Office | | Principal Occupation(s) During Past Five Years |
| |
| Jullan Quero (Born 1967) | | |
One Financial Center Boston, MA 02111 Deputy Treasurer (since 2008) | | Senior Tax Manager of the Advisor since August 2006; Senior Compliance Manager of the Advisor from April 2002 to August 2006. |
| |
| Barry S. Vallan (Born 1969) | | |
One Financial Center Boston, MA 02111 Controller (since 2006) | | Vice President–Fund Treasury of the Advisor since October 2004; Vice President–Trustee Reporting of the Advisor from April 2002 to October 2004. |
90
Board Consideration and Re-Approval of Investment Advisory Agreements
The Board of Trustees of Columbia Funds Series Trust (the “Board”), including a majority of the Trustees who have no direct or indirect interest in the investment advisory agreement and are not “interested persons” of the Trust, as defined in the Investment Company Act of 1940 (the “1940 Act”) (the “Independent Trustees”), are required annually to review and re-approve the existing investment advisory agreement and approve any newly proposed terms therein. In this regard, the Board reviewed and re-approved, during the most recent six months covered by this report, the investment advisory agreement with Columbia Management Advisors, LLC (“CMA”) for the Columbia Large Cap Index Fund, Columbia Large Cap Enhanced Core Fund, Columbia Mid Cap Index Fund and Columbia Small Cap Index Fund. The investment advisory agreement with CMA is referred to as an “Advisory Agreement.” The funds identified above are each referred to as a “Fund” and collectively referred to as the “Funds.”
More specifically, at meetings held on November 10-11, 2008, the Board, including the Independent Trustees advised by their independent legal counsel, considered the factors and reached the conclusions described below relating to the selection of CMA and the re-approval of the Advisory Agreement. The Board also reviewed and considered a report prepared and provided by the Independent Fee Consultant (the “Consultant”) appointed by the Independent Trustees pursuant to an assurance of discontinuance entered into with the New York Attorney General (“NYAG”) to settle a civil complaint filed by the NYAG relating to trading in mutual fund shares (the “NYAG Settlement”). During the fee review process, the Consultant’s role was to manage the review process to ensure that fees are negotiated in a manner that is at arms’ length and reasonable. The Consultant found that the fee negotiation process was, to the extent practicable, at arms’ length and reasonable and consistent with the requirements of the NYAG Settlement. A summary of the Consultant’s report is available at http://www.columbiafunds.com.
In preparation for the November meetings, the Board met in August for review and discussion of the materials described below. The Investment Committee of the Board also met in June to discuss each Fund’s performance with its respective portfolio manager(s). In addition to these meetings, the Investment Committee receives and discusses performance reports at its quarterly meetings. The Contracts Review Committee also provided support in managing and coordinating the process by which the Boards reviewed the Advisory Agreements. The Board’s review and conclusions are based on comprehensive consideration of all information presented to them and not the result of any single controlling factor.
Nature, Extent and Quality of Services
The Board received and considered various data and information regarding the nature, extent and quality of services provided to the Funds by CMA under the Advisory Agreement. The most recent investment adviser registration form (“Form ADV”) for CMA was made available to the Board, as were CMA’s responses to a detailed series of requests submitted by the Independent Trustees’ independent legal counsel on behalf of such Trustees. The Board reviewed and analyzed those materials, which included, among other things, information about the background and experience of senior management and investment personnel of CMA.
In addition, the Board considered the investment and legal compliance programs of the Funds and CMA, including their compliance policies and procedures and reports of the Funds’ Chief Compliance Officer.
The Board evaluated the ability of CMA, based on its resources, reputation and other attributes, to attract and retain qualified investment professionals, including research, advisory and supervisory personnel. In this regard, the Board considered information regarding CMA’s compensation program for its personnel involved in the management of the Funds. The Board also considered CMA’s investment in further developing its research and trading departments.
Based on the above factors, together with those referenced below, the Board concluded that it was satisfied with the nature, extent and quality of the investment advisory services provided to each of the Funds by CMA.
Fund Performance and Expenses
The Board considered the performance results for each of the Funds over multiple measurement periods. It also considered these results in comparison to the performance results of the group of funds that was determined by Lipper Inc. (“Lipper”) to be the most similar to a given Fund (the “Peer Group”) and to the performance of a broader universe of relevant funds as determined by Lipper (the Universe”), as well as to each
91
Fund’s benchmark index. Lipper is an independent provider of investment company data. The Board was provided with a description of the methodology used by Lipper to select the mutual funds in each Fund’s Peer Group and Universe and considered potential imprecision resulting from the selection methodology. The Board also considered certain risk-adjusted performance data.
The Board received and considered statistical information regarding each Fund’s total expense ratio and its various components, including contractual advisory fees, actual advisory fees, actual non-management fees, Rule 12b-1 and non-Rule 12b-1 service fees, fee waivers/caps and/or expense reimbursements. The Board also considered comparisons of these fees to the expense information for the each Fund’s Peer Group and Universe, which comparative data was provided by Lipper. For certain Funds, Lipper determined that the composition of the Peer Group and/or Universe for expenses would differ from the composition for performance to provide a more accurate basis of comparison. The Board also considered Lipper data that ranked each Fund based on: (i) each Fund’s one-year performance compared to actual management fees; (ii) each Fund’s one-year performance compared to total expenses; (iii) each Fund’s three-year performance compared to actual management fees; and (iv) each Fund’s three-year performance compared to total expenses.
Investment Advisory Fee Rates
The Board reviewed and considered the proposed contractual investment advisory fee rates together with the administration fee rates payable by the Funds to CMA for investment advisory services (the “Contractual Management Rates”). In addition, the Board reviewed and considered the proposed fee waiver/cap arrangements applicable to the Contractual Management Rates and considered the Contractual Management Rates after taking the waivers/caps into account (the “Actual Management Rates”). The Board noted that, on a complex-wide basis, CMA had reduced annual management fees by at least $32 million per year pursuant to the NYAG Settlement. The Board also noted reductions in net advisory rates and/or total expenses of certain funds across the fund complex. Additionally, the Board received and afforded specific attention to information comparing the Contractual Management Rates and Actual Management Rates with those of the other funds in their respective Peer Groups.
The Board concluded that the factors noted above supported the Contractual Management Rates and the Actual Management Rates, and the approval of the Advisory Agreement for all of the Funds.
Profitability
The Board received and considered a detailed profitability analysis of CMA based on the Contractual Management Rates and the Actual Management Rates, as well as on other relationships between the Funds and other funds in the complex on the one hand and CMA affiliates on the other. The analysis included complex-wide and per-Fund information and a comparison of results using alternative allocation methodologies. The Board concluded that, in light of the costs of providing investment management and other services, the profits and other ancillary benefits that CMA and its affiliates received from providing these services were not unreasonable.
Economies of Scale
The Board received and considered information regarding whether there have been economies of scale with respect to the management of the Funds, whether the Funds have appropriately benefited from any economies of scale and whether there is potential for realization of any further economies of scale. Most particularly, CMA provided information showing that, as a percentage of fund assets, CMA’s complex-wide revenues, expenses and profits declined over a four-year period during which fund assets increased by 39% and the shareholder benefit over a two-year period increased from 33% to 41% of the Adviser’s total profits. The Board concluded that any potential economies of scale are shared fairly with Fund shareholders, most particularly through breakpoints and fee waiver arrangements.
The Board acknowledged the inherent limitations of any analysis of an investment adviser’s economies of scale, stemming largely from the Board’s understanding that economies of scale are realized, if at all, by an investment adviser across a variety of products and services, not just with respect to a single fund.
Information About Services to Other Clients
The Board also received and considered information about the nature and extent of services and fee rates offered by CMA to other clients, including separate accounts and
92
institutional investors. In this regard, the Board concluded that, where the Contractual Management Rates and Actual Management Rates were appreciably above the range of the fee rates offered to other CMA clients, based on information provided by CMA, the costs associated with managing and operating a registered investment company provided a justification for the higher fee rates charged to the Funds.
Other Benefits to CMA
The Board received and considered information regarding any “fall-out” or ancillary benefits received by CMA and its affiliates as a result of their relationships with the Funds. Such benefits could include, among others, benefits attributable to CMA’s relationship with the Funds (such as soft-dollar credits) and benefits potentially derived from an increase in CMA’s business as a result of its relationship with the Funds (such as the ability to market to shareholders other financial products offered by CMA and its affiliates).
The Board considered the effectiveness of the policies of the Funds in achieving the best execution of portfolio transactions, whether and to what extent soft dollar credits are sought and how any such credits are utilized, any benefits that may be realized by using an affiliated broker, the extent to which efforts are made to recapture transaction costs, and the controls applicable to brokerage allocation procedures. The Board also reviewed CMA’s methods for allocating portfolio investment opportunities among the Funds and other clients. The Board concluded that the benefits were not unreasonable.
Other Factors and Broader Review
As discussed above, the Board reviews materials received from CMA annually as part of the re-approval process under Section 15(c) of the 1940 Act. The Board also reviews and assesses the quality of the services the Funds receive throughout the year. In this regard, the Board and its Committees review a report of CMA at each of its quarterly meetings, which includes, among other things, Fund performance reports. In addition, the Board and its Committees confer with portfolio managers at various times throughout the year including, most particularly, in the June Investment Committee meeting.
Conclusion
After considering the above-described factors, based on their deliberations and their evaluation of the information provided, the Board concluded that the compensation payable to CMA under the Advisory Agreement is fair and equitable. Accordingly, the Board unanimously re-approved the Advisory Agreement.
93
Summary of Management Fee Evaluation by Independent Fee Consultant
REPORT OF INDEPENDENT FEE CONSULTANT TO THE FUNDS SUPERVISED BY THE COLUMBIA NATIONS BOARD
Prepared pursuant to the February 9, 2005 Assurance of Discontinuance among the Office of Attorney General of New York State, Columbia Management Advisors, LLC and Columbia Management Distributors, Inc. November 12, 2008
I. Overview
On February 9, 2005, Columbia Management Advisors, LLC (“CMA”) and Columbia Management Distributors, Inc.1 (“CMD”) agreed to the New York Attorney General’s Assurance of Discontinuance (“AOD”). Among other matters, the AOD stipulates that CMA may manage or advise a Columbia Fund (“Columbia Fund” and together with all such funds or a group of such funds as the “Columbia Funds”) only if the Independent Members of the Columbia Fund’s Board of Trustees appoint a Senior Officer or retain an Independent Fee Consultant (“IFC”) who is to manage the process by which proposed management fees are negotiated. The AOD further stipulates that the Senior Officer or IFC is to prepare a written annual evaluation of the fee negotiation process.
With effect from January 1, 2007, the Independent Members of the Board of Trustees for certain Columbia Funds known collectively as the “Nations Funds” (the “Trustees”) retained me as IFC for the Nations Funds.2 In this capacity, I have prepared the fourth annual written evaluation of the fee negotiation process. As was the case with last year’s report (the “2007 Report”) my immediate predecessor as IFC, John Rea, provided invaluable assistance in the preparation of this year’s report.
A. Role of the Independent Fee Consultant
The AOD charges the IFC with “managing the process by which proposed management fees… to be charged the Columbia Fund are negotiated so that they are negotiated in a manner which is at arms’ length and reasonable and consistent with this Assurance of Discontinuance.” The AOD also provides that CMA “may manage or advise a Columbia Fund only if the reasonableness of the proposed management fees is determined by the Board of Trustees… using… an annual independent written evaluation prepared by or under the direction of… the Independent Fee Consultant.” Therefore, the AOD makes clear that the IFC does not supplant the Trustees in negotiating management fees with CMA, nor does the IFC substitute his or her judgment for that of the Trustees with respect to the reasonableness of proposed fees or any other matter that is committed to the business judgment of the Trustees.
B. Elements Involved in Managing the Fee Negotiation Process
In preparing the report required by the AOD, the IFC must consider at least the following six factors set forth in the AOD:
| 1. | The nature and quality of CMA’s services, including the Fund’s performance; |
| 2. | Management fees (including any components thereof) charged by other mutual fund companies for like services; |
| 3. | Possible economies of scale as the Fund grows larger; |
| 4. | Management fees (including any components thereof) charged to institutional and other clients of CMA for like services; |
| 5. | Costs to CMA and its affiliates of supplying services pursuant to the management fee agreements, excluding any intra-corporate profit; and |
| 6. | Profit margins of CMA and its affiliates from supplying such services. |
C. Organization of the Annual Evaluation
This report, like last year’s, focuses on the six factors and contains a section for each factor except that CMA’s costs and profits from managing the Funds have been combined into a single section. In addition to a discussion of these factors, the report offers recommendations to improve the fee review process in future years. A review of the status of
1 | CMA and CMD are subsidiaries of Columbia Management Group, LLC (“CMG”), and are the successors to the entities named in the AOD. |
2 | I have no material relationship with Bank of America, CMG or any of its affiliates, aside from serving as IFC, and I am aware of no material relationship with any of their affiliates. I retained John Rea, an independent economic consultant, to assist me with this report. |
| | Unless otherwise stated or required by the context, this report covers only the Nations Funds, which are also referred as the “Funds.” |
94
recommendations made in the 2007 Report is being provided separately with the materials for the November meeting.
II. Summary of Findings
A. General
| 1. | Based upon my examination of the information supplied by CMG in the light of the six factors set forth in the AOD, I conclude that the Trustees have the relevant information necessary to evaluate the reasonableness of the proposed management fees for each Nations Fund. |
| 2. | In my view, the process by which the proposed management fees of the Funds have been negotiated in 2008 thus far has been, to the extent practicable, at arms’ length and reasonable and consistent with the AOD. |
B. Nature and Quality of Services, Including Performance
| 3. | The performance of the Funds has been relatively good for the most recent 1-, 3- and 5-year periods. The strongest records were posted by the Funds in the Active Equity and Quantitative Strategies Groups and by the sub-advised Funds. The 5-year performance rankings of the subadvised Funds were particularly strong, with all such Funds in the top two performance quintiles. |
| 4. | The 1- and 3-year performance records of the Funds declined slightly from 2007 to 2008, while the 5-year performance records improved year-over-year. Most Funds changed their 1-year performance quintile year-over-year, while the 5-year rankings were, as expected, much more stable, with less than half the Funds moving to a different 5-year performance quintile. |
| 5. | The performance of the actively-managed equity and sub-advised Funds against their benchmarks was strong, especially for the 1- and 3-year performance periods. However, no fixed-income Fund with a reliable benchmark exceeded it on a net basis in any performance period. Money market Funds do not have such benchmarks and therefore were excluded from this analysis. |
| 6. | The Nations equity Funds’ overall performance adjusted for risk was strong. The performance of 13 of the 19 actively-managed Funds included in the risk analysis bettered the median in 3-year performance adjusted and unadjusted for risk. No relationship between risk and return was detected for fixed-income Funds. |
| 7. | The industry-standard procedure used by third parties such as Lipper and Morningstar to construct the performance universe in which each Fund’s performance is ranked relative to comparable funds tends to bias a Fund’s ranking upward within that universe. The bias occurs because either no-12b-1-fee or A share classes of the Funds are compared to the performance universe that includes all share classes of competitive multi-class funds. Therefore, the procedure ranks shares with zero or 25 basis point 12b-1 fees against classes of competitive funds with 12b-1 fees of up to 100 basis points. Correcting this bias by limiting the performance universe to classes of competitive funds with comparable 12b-1 fees in most cases lowers the relative performance for the Funds but does not call into question the general finding that the Nations Funds’ performance has been strong. |
| 8. | A small number of Funds have consistently underperformed their peers in each of the past four years, depending on the exact criteria used to measure long-term underperformance. For example, one Fund has had below-median 1- and 3-year performance in each of the past four years; one additional Fund had below-median 3-year performance for those years. |
| 9. | The services performed by CMG professionals beyond portfolio management, such as compliance, legal, information technology, risk management, finance and fund administration, are critical to the success of the Funds and appear to be of high quality. |
C. Management Fees Charged by Other Mutual Fund Companies
| 10. | The Funds’ management fees and total expenses are generally low relative to those of their peers, with the exception of subadvised Funds. Almost two-third of the Funds ranked in the two least expensive quintiles for total expenses and just over half were in those quintiles for actual management fees. Funds with lower actual management fees tended to have lower relative total expenses. All fixed-income Funds had total expenses in the two least expensive quintiles. |
| 11. | Generally, the Nations Funds with the highest relative fees and expenses are sub-advised. All eight Nations Funds with fifth-quintile total expense rankings were sub-advised. The actual management fees of 11 of the 14 |
95
| | sub-advised Funds were in the fourth and fifth quintile. The average management fees of the sub-advised Funds were typically 20 points higher than internally-managed equity Funds. CMA presented data suggesting that such differentials were consistent with industry practice. |
| 12. | The management fees of the internally-advised Nations Funds are generally in line with those of Columbia Funds overseen by the Atlantic and Acorn/Wanger Boards of Trustees. |
D. Trustees’ Fee and Performance Evaluation Process
| 13. | The Trustees’ evaluation process identified 20 Funds in 2008 for further review based upon their relative performance or expenses or both. When compared in filtered universes, three more Funds met the criteria for review. |
E. Potential Economies of Scale
| 14. | CMG has prepared a memo for the Trustees containing its views on the sources and sharing of potential economies of scale. CMG views economies of scale as arising at the complex level and would regard estimates of scale economies for individual funds as unreliable. In its analysis, CMG did not identify specific sources of economies of scale or provide any estimates of any economies of scale that might arise from future asset growth. CMG’s analysis included measures taken by the Trustees and CMG that seek to share any potential economies of scale through breakpoints in management fee schedules, expense reimbursements, fee waivers, enhanced shareholder services, fund mergers, and operational consolidation. |
| 15. | An examination of the management fee schedules of a selected number of the Nations Funds suggests that, as a general matter, the breakpoint schedules of these Funds are not out of line with those of competitors. A similar examination of five other Nations Funds in 2007 led to the same conclusion. |
F. Management Fees Charged to Institutional Clients
| 16. | CMG has provided Trustees with comparisons of mutual fund management fees and institutional fees based upon standardized fee schedules and actual fees. The results show that, consistent with industry practice, institutional fees are generally lower than the Funds’ management fees. However, because the services provided and risks borne by the manager are more extensive for mutual funds than for institutional accounts, the differences are of limited value in assisting the Trustees in their review of the reasonableness of the Funds’ management fees. |
G. Revenues, Expenses, and Profits
| 17. | The activity-based cost allocation methodology (“ABC”) employed by CMG to allocate costs for purposes of calculating Fund profitability, both direct and indirect, for purposes of calculating Fund profitability is thoughtful and detailed. For comparison, CMG proposed a change to the method by which indirect expenses were allocated. Under this “hybrid” method, such costs are allocated to Funds 50% by assets and 50% per fund. Allocating indirect expenses equally to each Fund has an intuitive logic, as each Fund regardless of size has certain expenses, such as preparing and printing prospectuses and financial statements. |
| 18. | The materials provided on CMG’s revenues and expenses with respect to the Funds and the methodology underlying their construction generally form a sufficient basis for Trustees to evaluate CMG’s expenses and profitability for each Fund. |
| 19. | In 2007, CMG’s complex-wide pre-tax margins on the Nations Funds were close to the industry average before distribution and below average when distribution revenues and expenses were included, based on limited data available about publicly-held mutual fund managers. However, as is to be expected in a complex comprising 65 Funds, some Nations Funds have higher pre-tax profit margins, when calculated solely with respect to management revenues and expenses, while other Nations Funds operate at a loss. A pro forma analysis of the complex’s profitability taking into account expenses incurred in 2008 associated with support of the money market funds sharply reduced the profitability of the Nations Funds. There is a positive relationship between fund size and profitability, with smaller Funds generally operating at a loss. |
96
| 20. | CMG shares a fixed percentage of its management fee revenues with an affiliate, U.S. Trust, Bank of America Private Wealth Management, to compensate that affiliate for services it performs with respect to Nations Fund assets held for the benefit of its customers. Based on our analysis of the services provided by the affiliate, we believe all such payments should be regarded as a distribution expense, except for any portion attributable to payments by CMG for performance of sub-transfer agency or sub-accounting functions. |
III. Recommendations
| 1) | Criteria for review. The Trustees may wish to consider modifying the criteria for classifying a fund as a “Review Fund” to include criteria that focus exclusively on performance without regard to expense or fee levels. For example, a Fund whose one-year or three-year performance was median or below for four consecutive years could be treated as a Review Fund. Applying such criteria would add two Funds to the list of Review Funds. |
| 2) | Profitability data. CMG should present to the Trustees each year the profitability of each Fund, each investment style, and each complex (of which Nations is one) calculated as follows: |
| | Exhibit 1. Management-only profitability should be calculated without reference to any Private Bank expense. |
| | Exhibit 2. Profitability excluding distribution (which essentially covers the management and transfer agency functions) should be adjusted by removing from the expense calculation any portion of the Private Bank payment not attributable to the performance by the Private Bank of sub-transfer agency or sub-accounting functions. |
| | Exhibit 3. Total profitability, including distribution: |
| | No adjustment for Private Bank expenses should be made, because all such expenses represent legitimate fund expenses to be taken into account in calculating CMG’s profit margin including distribution. |
| | Exhibit 4. Distribution only: This should include all Private Bank expenses other than those attributable to sub-transfer agency services. |
| | Therefore, | the following data need not be provided: |
| | 1. | Adjusting total profitability data for Private Bank expenses |
| | 2. | Adjusting profitability excluding distribution by backing out all Private Bank expenses. |
| 3) | Economies of scale. CMG and the IFC should continue to work on methods for more precisely quantifying to the extent possible the sources and magnitude of any economies of scale as CMG’s mutual fund assets under management increase, to the extent that the data allows for meaningful year-over-year comparisons. The framework suggested in Section IV.D.4 may prove to be a useful model for such an analysis. |
| 4) | Competitive breakpoint analysis. As part of the annual fee evaluation process, the breakpoints of a select group of Nations Funds (which would differ each year) should continue to be compared to those of industry rivals to ensure that the Funds’ breakpoint schedules remain within industry norms. As breakpoint schedules change relatively little each year, performing such a comparison for all Funds each year would not be an efficient use of Trustee and CMG resources. |
| 5) | Cost allocation methodology. CMG’s point that the current ABC system of allocating indirect expenses creates anomalous results in several cases, including sub-advised Funds, is well-taken. We would like to work with CMG over the forthcoming year on alternatives to the current system of allocating indirect expenses that (1) resolve the anomalies, (2) limit the amount of incremental effort on CMG’s part and (3) remain faithful to the general principle that expenses should be allocated by time and effort to the extent reasonably possible. |
| 6) | Management fee disparities. CMG and the Nations Trustees, as part of any future study of management fees, should analyze any differences in management fee schedules between Funds managed in similar investment styles. As part of that analysis, CMG should provide an explanation for any significant fee differences among comparable funds across fund families managed by CMA, such as differences in the management styles of different Funds included the same Lipper category. Finally, whenever CMG proposes a management fee change or an expense cap for any mutual fund managed by CMA that is comparable to |
97
| | any Nations Fund, CMG should provide the Trustees with sufficient information about the proposal to allow the Trustees to assess the applicability of the proposed change to the relevant Nations Fund or Funds. |
| 7) | Tax-exempt Fund expense data. The expense rankings of certain tax-exempt Funds were adversely affected by including certain investment-related interest expenses that Lipper excluded in calculating the expense ratios of competitors. We recommend that CMG follow the Lipper practice and exclude such interest expenses from data submitted to Lipper to avoid unfairly disadvantaging the tax-exempt Funds. |
| 8) | Reduction of volume of paper documents submitted. The effort to rationalize and simplify the data presented to the Trustees and the process by which that data was prepared and organized was regarded as a success by all parties. We should continue to look for opportunities to reduce and simplify the presentation of 15(c) data, especially in the area of Fund and manager profitability. The Fund “Dashboard” volume presents a large volume of Fund data on a single page. If it is continued, the Trustees may wish to consider receiving the underlying Lipper data on CD, rather than the current paper volumes. |
Respectfully submitted,
Steven E. Asher
98
[THIS PAGE INTENTIONALLY LEFT BLANK]
99
[THIS PAGE INTENTIONALLY LEFT BLANK]
100
Important Information About This Report
The funds mail one shareholder report to each shareholder address. If you would like more than one report, please call shareholder services at 1-800-345-6611 and additional reports will be sent to you. This report has been prepared for shareholders of Index Funds.
A description of the policies and procedures that each fund uses to determine how to vote proxies and a copy of each fund’s voting records are available (i) at www.columbiamanagement.com; (ii) on the Securities and Exchange Commission’s website at www.sec.gov, and (iii) without charge, upon request, by calling 1-800-368-0346. Information regarding how each fund voted proxies relating to portfolio securities during the 12-month period ended June 30 is available from the SEC’s website. Information regarding how each fund voted proxies relating to portfolio securities is also available from the funds’ website, www.columbiamanagement.com.
Each fund files a complete schedule of portfolio holdings with the SEC for the first and third quarters of each fiscal year on
Form N-Q. Each fund’s Form N-Q is available on the SEC’s website at www.sec.gov and may be reviewed and copied at the SEC’s Public Reference Room in Washington, DC. Information on the operation of the Public Reference Room may be obtained by calling
1-800-SEC-0330.
Please read and consider the investment objectives, risks, charges and expenses for any fund carefully before investing. For a prospectus which contains this and other important information about the fund, contact your Columbia Management representative or financial advisor or go to www.columbiamanagement.com.
Columbia Management Group, LLC (“Columbia Management”) is the investment management division of Bank of America Corporation. Columbia Management entities furnish investment management services and products for institutional and individual investors. Columbia Funds are distributed by Columbia Management Distributors, Inc., member of FINRA, SIPC, part of Columbia Management and an affiliate of Bank of America Corporation.
Transfer Agent
Columbia Management Services, Inc.
P.O. Box 8081
Boston, MA 02266-8081
1-800-345-6611
Distributor
Columbia Management
Distributors, Inc.
One Financial Center
Boston, MA 02111
Investment Advisor
Columbia Management Advisors, LLC
100 Federal Street
Boston, MA 02110
101

One Financial Center
Boston, MA 02111-2621
Index Funds
Annual Report, February 28, 2009
©2009 Columbia Management Distributors, Inc.
One Financial Center, Boston, MA 02111-2621
800.345.6611 www.columbiafunds.com
SHC-42/8451-0209 (04/09) 09/76254
Item 2. Code of Ethics.
(a) The registrant has, as of the end of the period covered by this report, adopted a code of ethics that applies to the registrant’s principal executive officer, principal financial officer, principal accounting officer or controller, or persons performing similar functions, regardless of whether these individuals are employed by the registrant or a third party.
(b) During the period covered by this report, there were not any amendments to a provision of the code of ethics adopted in 2(a) above.
(c) During the period covered by this report, there were no waivers, including any implicit waivers, from a provision of the code of ethics described in 2(a) above that relates to one or more of the items set forth in paragraph (b) of this item’s instructions.
Item 3. Audit Committee Financial Expert.
The registrant’s Board of Trustees has determined that William P. Carmichael qualifies as an audit committee financial expert, as defined in Item 3 of Form N-CSR and is “independent” (as defined in Item 3 of Form N-CSR).
Item 4. Principal Accountant Fees and Services.
Fee information below is disclosed for the seventeen series of the registrant whose reports to stockholders are included in this annual filing. Fee information for fiscal year ended February 28, 2009 also includes fees for two series that commenced operations during the period.
(a) Audit Fees. Aggregate Audit Fees billed by the principal accountant for professional services rendered during the fiscal years ended February 28, 2009 and February 29, 2008 are approximately as follows:
2009 | | 2008 | |
$ | 644,000 | | $ | 556,700 | |
| | | | | |
Audit Fees include amounts related to the audit of the registrant’s annual financial statements or services that are normally provided by the accountant in connection with
statutory and regulatory filings or engagements for those fiscal years. Audit fees in fiscal year 2009 also include fees for the review of and provision of consent in connection with filing Form N-1A for two funds.
(b) Audit-Related Fees. Aggregate Audit-Related Fees billed to the registrant by the principal accountant for professional services rendered during the fiscal years ended February 28, 2009 and February 29, 2008 are approximately as follows:
2009 | | 2008 | |
$ | 87,400 | | $ | 74,800 | |
| | | | | |
Audit-Related Fees include amounts for assurance and related services by the principal accountant that are reasonably related to the performance of the audit of the registrant’s financial statements and are not reported in Audit Fees above. In both fiscal years 2009 and 2008, Audit-Related Fees consist of agreed-upon procedures performed for semi-annual shareholder reports.
During the fiscal years ended February 28, 2009 and February 29, 2008, there were no Audit-Related Fees billed by the registrant’s principal accountant to the registrant’s investment adviser (not including any sub-adviser whose role is primarily portfolio management and is subcontracted with or overseen by another investment adviser) and any entity controlling, controlled by, or under common control with the adviser that provides ongoing services to the registrant for an engagement that related directly to the operations and financial reporting of the registrant.
(c) Tax Fees. Aggregate Tax Fees billed by the principal accountant to the registrant for professional services rendered during the fiscal years ended February 28, 2009 and February 29, 2008 are approximately as follows:
2009 | | 2008 | |
$ | 111,100 | | $ | 126,200 | |
| | | | | |
Tax Fees include amounts for the review of annual tax returns, the review of required shareholder distribution calculations and typically include amounts for professional services by the principal accountant for tax compliance, tax advice and tax planning.
During the fiscal years ended February 28, 2009 and February 29, 2008, there were no Tax Fees billed by the registrant’s principal accountant to the registrant’s investment adviser (not including any sub-adviser whose role is primarily portfolio management and is subcontracted with or overseen by another investment adviser) and any entity controlling, controlled by, or under common control with the adviser that provides ongoing services to the registrant for an engagement that related directly to the operations and financial reporting of the registrant.
(d) All Other Fees. Aggregate All Other Fees billed by the principal accountant to the registrant for professional services rendered during the fiscal years ended February 28, 2009 and February 29, 2008 are approximately as follows:
All Other Fees include amounts for products and services provided by the principal accountant, other than the services reported in paragraphs (a) through (c) above.
Aggregate All Other Fees billed by the registrant’s principal accountant to the registrant’s investment adviser (not including any sub-adviser whose role is primarily portfolio management and is subcontracted with or overseen by another investment adviser) and any entity controlling, controlled by, or under common control with the adviser that provides ongoing services to the registrant for an engagement that related directly to the operations and financial reporting of the registrant during the fiscal years ended February 28, 2009 and February 29, 2008 are approximately as follows:
2009 | | 2008 | |
$ | 893,100 | | $ | 954,400 | |
| | | | | |
In both fiscal years 2009 and 2008, All Other Fees consist of fees billed for internal control examinations of the registrant’s transfer agent and investment advisor.
(e)(1) Audit Committee Pre-Approval Policies and Procedures
The registrant’s Audit Committee is required to pre-approve the engagement of the registrant’s independent accountants to provide audit and non-audit services to the registrant and non-audit services to its investment adviser (not including any sub-adviser whose role is primarily portfolio management and is subcontracted with or overseen by another investment adviser) or any entity controlling, controlled by or under common control with such investment adviser that provides ongoing services to the registrant (“Adviser Affiliates”), if the engagement relates directly to the operations and financial reporting of the registrant.
The Audit Committee has adop ted a Policy for Engagement of Independent Accountants for Audit and Non-Audit Services (“Policy”). The Policy sets forth the understanding of the Audit Committee regarding the engagement of the registrant’s independent accountants to provide (i) audit and permissible audit-related, tax and other services to the registrant (collectively “Fund Services”); (ii) non-audit services to the registrant’s investment adviser (not including any sub-adviser whose role is primarily portfolio management and is subcontracted with or overseen by another investment adviser) and Adviser Affiliates, if the engagement relates directly to the operations or financial reporting of a Fund (collectively “Fund-related Adviser Services”); and (iii) certain other audit and non-audit services to the registrant’s investment adviser (not including any sub-adviser whose role is primarily portfolio management and is
subcontracted with or overseen by another investment adviser) and Adviser Affiliates. Unless a type of service receives general pre-approval under the Policy, it requires specific pre-approval by the Audit Committee if it is to be provided by the independent accountants. Pre-approval of non-audit services to the registrant, the registrant’s investment adviser (not including any sub-adviser whose role is primarily portfolio management and is subcontracted with or overseen by another investment adviser) and Adviser Affiliates may be waived provided that the “de minimis” requirements set forth under paragraph (c)(7)(i)(C) of Rule 2-01 of Regulation S-X are met.
Under the Policy, the Audit Committee may delegate pre-approval authority to any pre-designated member or members who are Independent Trustees/Directors. The member(s) to whom such authority is delegated must report, for informational purposes only, any pre-approval decisions to the Audit Committee at its next regular meeting. The Audit Committee’s responsibilities with respect to the pre-approval of services performed by the independent accountants may not be delegated to management.
The Policy requires the Fund Treasurer and/or Director of Board Administration to submit to the Audit Committee, on an annual basis, a schedule of the types of services that are subject to general pre-approval. The schedule(s) provide a description of each type of service that is subject to general pre-approval and, where possible, will provide estimated fee caps for each instance of providing each service. The Audit Committees will review and approve the types of services and review the projected fees for the next fiscal year and may add to, or subtract from, the list of general pre-approved services from time to time based on subsequent determinations. That approval acknowledges that the Audit Committee is in agreement with the specific types of services that the independent accountants will be permitted to perform.
The Fund Treasurer and/or Director of Board Administration shall report to the Audit Committee at each of its regular meetings regarding all Fund Services or Fund-related Adviser Services initiated since the last such report was rendered, including a general description of the services, actual billed and projected fees, and the means by which such Fund Services or Fund-related Adviser Services were pre-approved by the Audit Committee.
*****
(e)(2) The percentage of services described in paragraphs (b) through (d) of this Item approved pursuant to the “de minimis” exception under paragraph (c)(7)(i)(C) of Rule 2-01 of Regulation S-X during both fiscal years ended February 28, 2009 and February 29, 2008 was zero.
(f) Not applicable.
(g) The aggregate non-audit fees billed by the registrant’s accountant for services rendered to the registrant, and rendered to the registrant’s investment adviser (not including any sub-adviser whose role is primarily portfolio management and is
subcontracted with or overseen by another investment adviser), and any entity controlling, controlled by, or under common control with the adviser that provides ongoing services to the registrant for the fiscal years ended February 28, 2009 and February 29, 2008 are approximately as follows:
2009 | | 2008 | |
$ | 1,091,600 | | $ | 1,155,400 | |
| | | | | |
(h) The registrant’s Audit Committee of the Board of Directors has considered whether the provision of non-audit services that were rendered to the registrant’s adviser (not including any sub-adviser whose role is primarily portfolio management and is subcontracted with or overseen by another investment adviser), and any entity controlling, controlled by, or under common control with the investment adviser that provides ongoing services to the registrant that were not pre-approved pursuant to paragraph (c)(7)(ii) of Rule 2-01 of Regulation S-X, is compatible with maintaining the principal accountant’s independence.
Item 5. Audit Committee of Listed Registrants.
Not applicable.
Item 6. Investments
(a) The registrant’s “Schedule I — Investments in securities of unaffiliated issuers” (as set forth in 17 CFR 210.12-12) is included in Item 1 of this Form N-CSR.
(b) Not applicable.
Item 7. Disclosure of Proxy Voting Policies and Procedures for Closed-End Management Investment Companies.
Not applicable.
Item 8. Portfolio Managers of Closed-End Management Investment Companies.
Not applicable.
Item 9. Purchases of Equity Securities by Closed-End Management Investment Company and Affiliated Purchasers.
Not applicable.
Item 10. Submission of Matters to a Vote of Security Holders.
There have not been any material changes to the procedures by which shareholders may recommend nominees to the registrant’s board of directors, since those procedures were last disclosed in response to requirements of Item 407(c)(2)(iv) of Regulation S-K (as required by Item 22(b)(15) of Schedule 14A) or this Item.
Item 11. Controls and Procedures.
(a) The registrant’s principal executive officer and principal financial officers, based on their evaluation of the registrant’s disclosure controls and procedures as of a date within 90 days of the filing of this report, have concluded that such controls and procedures are adequately designed to ensure that information required to be disclosed by the registrant in Form N-CSR is accumulated and communicated to the registrant’s management, including the principal executive officer and principal financial officer, or persons performing similar functions, as appropriate to allow timely decisions regarding required disclosure.
(b) There was no change in the registrant’s internal control over financial reporting that occurred during the registrant’s second fiscal quarter of the period covered by this report that has materially affected, or is reasonably likely to materially affect, the registrant’s internal control over financial reporting.
Item 12. Exhibits.
(a)(1) Code of ethics required to be disclosed under Item 2 of Form N-CSR attached hereto as Exhibit 99.CODE ETH.
(a)(2) Certifications pursuant to Rule 30a-2(a) under the Investment Company Act of 1940 (17 CFR 270.30a-2(a)) attached hereto as Exhibit 99.CERT.
(a)(3) Not applicable.
(b) Certification pursuant to Rule 30a-2(b) under the Investment Company Act of 1940 (17 CFR 270.30a-2(b)) attached hereto as Exhibit 99.906CERT.
SIGNATURES
Pursuant to the requirements of the Securities Exchange Act of 1934 and the Investment Company Act of 1940, the registrant has duly caused this report to be signed on its behalf by the undersigned, thereunto duly authorized.
(registrant) | | Columbia Funds Series Trust | |
| | |
| | |
By (Signature and Title) | | /s/ J. Kevin Connaughton | |
| J. Kevin Connaughton, President | |
| | |
| | |
Date | | April 23, 2009 | |
| | | | | |
Pursuant to the requirements of the Securities Exchange Act of 1934 and the Investment Company Act of 1940, this report has been signed below by the following persons on behalf of the registrant and in the capacities and on the dates indicated.
By (Signature and Title) | | /s/ J. Kevin Connaughton | |
| J. Kevin Connaughton, President | |
| | |
| | |
Date | | April 23, 2009 | |
| | |
| | |
By (Signature and Title) | | /s/ Michael G. Clarke | |
| Michael G. Clarke, Chief Financial Officer | |
| | |
| | |
Date | | April 23, 2009 | |
| | | | | |