UNITED STATES
SECURITIES AND EXCHANGE COMMISSION
Washington, D.C. 20549
FORM N-CSR
CERTIFIED SHAREHOLDER REPORT OF REGISTERED
MANAGEMENT INVESTMENT COMPANIES
Investment Company Act file number | 811-09645 |
|
Columbia Funds Series Trust |
(Exact name of registrant as specified in charter) |
|
One Financial Center, Boston, Massachusetts | | 02111 |
(Address of principal executive offices) | | (Zip code) |
|
James R. Bordewick, Jr., Esq.
Columbia Management Advisors, LLC
One Financial Center
Boston, MA 02111 |
(Name and address of agent for service) |
|
Registrant’s telephone number, including area code: | 1-617-426-3750 | |
|
Date of fiscal year end: | February 28 | |
|
Date of reporting period: | February 28, 2010 | |
| | | | | | | | |
Form N-CSR is to be used by management investment companies to file reports with the Commission not later than 10 days after the transmission to stockholders of any report that is required to be transmitted to stockholders under Rule 30e-1 under the Investment Company Act of 1940 (17 CFR 270.30e-1). The Commission may use the information provided on Form N-CSR in its regulatory, disclosure review, inspection, and policymaking roles.
A registrant is required to disclose the information specified by Form N-CSR, and the Commission will make this information public. A registrant is not required to respond to the collection of information contained in Form N-CSR unless the Form displays a currently valid Office of Management and Budget (“OMB”) control number. Please direct comments concerning the accuracy of the information collection burden estimate and any suggestions for reducing the burden to Secretary, Securities and Exchange Commission, 450 Fifth Street, NW, Washington, DC 20549-0609. The OMB has reviewed this collection of information under the clearance requirements of 44 U.S.C. § 3507.
Item 1. Reports to Stockholders.
Columbia Management®
Annual Report
February 28, 2010
Columbia Overseas Value Fund
| NOT FDIC INSURED | | May Lose Value | |
|
| NOT BANK ISSUED | | No Bank Guarantee | |
|
Table of Contents
| Fund Profile | | | 1 | | |
|
| Economic Update | | | 2 | | |
|
| Performance Information | | | 4 | | |
|
| Understanding Your Expenses | | | 5 | | |
|
| Portfolio Managers' Report | | | 6 | | |
|
| Financial Statements | | | | | |
|
| Investment Portfolio | | | 8 | | |
|
Statement of Assets and
Liabilities | | | 12 | | |
|
| Statement of Operations | | | 13 | | |
|
Statement of Changes in
Net Assets | | | 14 | | |
|
| Financial Highlights | | | 16 | | |
|
| Notes to Financial Statements | | | 17 | | |
|
Report of Independent Registered
Public Accounting Firm | | | 28 | | |
|
| Federal Income Tax Information | | | 29 | | |
|
| Fund Governance | | | 30 | | |
|
Board Consideration and
Re-Approval of Current Investment
Advisory Agreement | | | 33 | | |
|
Board Consideration and
Approval of Proposed Investment
Advisory Agreement | | | 37 | | |
|
Summary of Management Fee
Evaluation by Independent Fee
Consultant | | | 44 | | |
|
Important Information About
This Report | | | 53 | | |
|
The views expressed in this report reflect the current views of the respective parties. These views are not guarantees of future performance and involve certain risks, uncertainties and assumptions that are difficult to predict, so actual outcomes and results may differ significantly from the views expressed. These views are subject to change at any time based upon economic, market or other conditions and the respective parties disclaim any responsibility to update such views. These views may not be relied on as investment advice and, because investment decisions for a Columbia Fund are based on numerous factors, may not be relied on as an indication of trading intent on behalf of any particular Columbia Fund. References to specific securities should not be construed as a recommendation or investment advice.
President's Message

Dear Shareholder:
As we previously announced, Bank of America, N.A. has reached a definitive agreement to sell Columbia Management's long-term asset management business to Ameriprise Financial, Inc. This includes the management of its equity and fixed-income mutual funds.
This transaction combines two leading asset management firms and will create one entity that is expected to rank as one of the top asset managers. It is anticipated that the combined U.S. asset management business will operate under the well-regarded Columbia Management brand. The combined U.S. asset management business will be led by Ted Truscott, currently president, U.S. asset management, annuities and chief investment officer, Ameriprise Financial. Michael A. Jones, currently president of Columbia Management, will serve as president, U.S. asset management. Colin Moore, chief investment officer at Columbia Management, will continue to serve in that role for the combined organization. I will also continue in my role as head of mutual funds, responsible for the delivery of mutual fund products and services to investors.
As a valued investor in Columbia funds, please know that our goal is to ensure a smooth transition and provide you with the highest quality products and services. We will work closely with colleagues at Ameriprise Financial to seek a seamless transition for our clients and to keep you informed as the transition progresses and key decisions are made. We want to assure you that the funds' portfolio managers continue to focus on providing uninterrupted service to Columbia fund shareholders. Columbia Management and Ameriprise Financial will operate independently until all required approvals, including fund board, fund shareholder and other client approvals, have been received and the transaction closes, which is expected to occur in the spring of this year.
Meanwhile, transition teams across the company have been formed to oversee integration efforts including rebranding initiatives, vendor and system consolidations and client communications. Throughout the transition, we seek to build on best practices from both legacy organizations with enhancements to productivity, quality and the delivery of world-class customer experiences.
Clearly, we have a lot of work ahead of us in 2010. We look forward to introducing our combined business with an even wider breadth of products and capabilities. Everyone at Columbia Management and Ameriprise Financial is excited about the opportunities for this combined organization. I share this optimism and believe it will position us as a best-in-class asset management business with the ability to deliver more for clients than ever before.
Sincerely,

J. Kevin Connaughton
President, Columbia Funds
Past performance is no guarantee of future results.
Fund Profile – Columbia Overseas Value Fund
Summary
g For the 12-month period that ended February 28, 2010, the fund's Class Z shares returned 62.60% without sales charge.
g The fund outperformed its benchmark, the MSCI EAFE Value Index1, which returned 60.15%. Its return was also higher than the 57.28% average return of funds in its peer group, the Lipper International Multi-Cap Value Funds Classification.2
g Investments in China, which is not represented in the index, and an overweight in Switzerland helped the fund outperform its benchmark, as did stock selection in the financials sector.
Portfolio Management
Fred Copper has co-managed the fund since March 2008 and has been associated with the advisor or its predecessors since 2005.
Jasmine (Weili) Huang has co-managed the fund since March 2008 and has been associated with the advisor or its predecessors since 2003.
Timothy R. Anderson has co-managed the fund since March 2008 and has been associated with the advisor or its predecessors since 2006.
Paul J. DiGiacomo has co-managed the fund since March 2008 and has been associated with the advisor or its predecessors since 2006.
Daisuke Nomoto has co-managed the fund since March 2008 and has been associated with the advisor or its predecessors since 2005.
Subject to satisfying various conditions to closing, effective on or about May 1, 2010, RiverSource Investments, LLC, a subsidiary of Ameriprise Financial, Inc., is expected to become the investment advisor to the fund and change its name to Columbia Management Investment Advisers, LLC. Please see the fund's prospectus dated July 1, 2009, including the supplements thereto, for more information regarding the expected change in investment advisor and any related changes to the portfolio management of the fund.
1The Morgan Stanley Capital International Europe, Australasia, Far East (MSCI EAFE) Value Index is a subset of the MSCI EAFE Index, and constituents of the index include securities from Europe, Australasia and the Far East. The index generally represents approximately 50% of the free float-adjusted market capitalization of the underlying MSCI EAFE Index, and consists of those securities classified by Morgan Stanley Capital International, Inc. (MSCI) as most representing the value style, such as higher book value-to-price ratios, higher forward earnings-to-price ratios, higher dividend yields and lower forecasted growth rates than securities representing the growth style. Indices are not available for investment, are not professionally managed and do not reflect sales charges, fees, brokerage commissions, taxes or other expenses of investing. Securities in the fund may not match those in an index.
2Lipper Inc., a widely respected data provider in the industry, calculates an average total return (assuming reinvestment of distributions) for mutual funds with investment objectives similar to those of the fund. Lipper makes no adjustment for the effect of sales loads.
Performance data quoted represents past performance and current performance may be lower or higher. Past performance is no guarantee of future results. The investment return and principal value will fluctuate so that shares, when redeemed, may be worth more or less than the original cost. Please call 1-800-426-3750 for daily and most recent month-end performance updates.
Summary
1-year return as of 02/28/10
| | | | | +62.60% | |
|
| |  | | | Class Z shares
(without sales charge) | |
|
| | | | | +60.15% | |
|
| |  | | | MSCI EAFE Value Index | |
|
Morningstar Style BoxTM
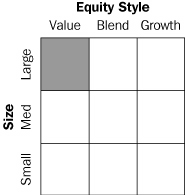
The Morningstar Style BoxTM reveals a fund's investment strategy. For equity funds, the vertical axis shows the market capitalization of the stocks owned, and the horizontal axis shows investment style (value, blend or growth). Information shown is based on the most recent data provided by Morningstar.
1
Economic Update – Columbia Overseas Value Fund
Summary
For the 12-month period that ended February 28, 2010
g After a sharp decline, stock markets rebounded around the world, as measured by the S&P 500 Index, the MSCI EAFE Index and the MSCI Emerging Markets Index.
S&P Index | | MSCI EAFE
Index | |
|
 | |  | |
|
MSCI EM
Index | |
| |
|
 | | | |
|
After a deep and difficult recession, the World Bank estimates that global gross domestic product (GDP) declined 2.2% in 2009. However, many economies began to regain their footing midway through the year. Growth turned positive in the second half of 2009 in the United States, Japan, the United Kingdom, Germany and France. In some smaller euro zone countries, such as Spain and Italy, recession continued through the year, and debt problems remain a problem for Greece, Spain, Portugal and Italy. For 2010, global economic growth is expected to rise at a rate of 2.7%.
Stimulus spending aided recovery
Growth around the world was aided by government stimulus spending, but the emerging markets of China, India and Brazil were notable for their use of stimulus to help jumpstart the global recovery. All three countries have capitalized on policies put in place over the past decade to stimulate domestic demand and succeeded through a combination of spending, tax cuts and other incentives.
Hopes for a sustained recovery around the world now depend on a rebound in consumer spending, an increase in revenues to keep business profits moving higher and a turnaround in the export markets, the latter of which appears to be underway. According to Moodys.com, surveys of manufacturers across the world show export orders up after the steepest decline in trade since the 1930s. The employment picture in developed countries is also improving, in the sense that job losses have slowed. However, it could take until 2011 for job growth to accelerate in a meaningful way, raising concerns about the sustainability of recovery where unemployment remains stubbornly high.
Manufacturing activity has picked up around the world, and the technology sector has been a significant beneficiary. Demand for both hardware and software has increased after a sharp decline in 2008 and 2009. India reports that its outsourcing pipeline is filling again. In the United States, an upturn in the manufacturing sector was one of the first signs that the economy was on the mend. In Asia and South America, stimulus spending, strong domestic demand and a rebound in trade have driven manufacturing activity sharply higher. However, manufacturing in eurozone countries continue to lag the rest of the world.
Stocks bottomed, then rebounded
Against a strengthening economic backdrop, a stock market rally that began in mid-March 2009 continued throughout the period. The U.S. stock market returned 53.62% for the 12-month period, as measured by the S&P 500 Index.1 Outside the U.S., stock market returns were even stronger. The MSCI EAFE Index,2 a broad gauge of stock market performance in foreign developed markets, gained 54.58% (net of dividends, in U.S. dollars) for the period. Emerging stock markets were caught in last year's
1The Standard & Poor's (S&P) 500 Index tracks the performance of 500 widely held, large-capitalization U.S. stocks.
2The Morgan Stanley Capital International Europe, Australia, Far East (MSCI EAFE) Index is a capitalization-weighted index that tracks the total return of common stocks in 21 developed-market countries within Europe, Australia and the Far East.
2
Economic Update (continued) – Columbia Overseas Value Fund
downdraft, but they bounced back stronger than domestic or developed world markets in 2009 as their economic growth generally outpaced the developed world. The MSCI Emerging Markets Index3 returned 91.63% (in U.S. dollars), led by strong performances from India and the regions of Eastern Europe and South America.
Past performance is no guarantee of future results.
3The Morgan Stanley Capital International Emerging Markets Index (MSCI EMI) is a free float-adjusted market capitalization index that is designed to measure equity market performance of emerging markets. As of June 2009, the MSCI Emerging Markets Index consisted of the following 22 emerging market country indices: Brazil, Chile, China, Colombia, Czech Republic, Egypt, Hungary, India, Indonesia, Israel, Korea, Malaysia, Mexico, Morocco, Peru, Philippines, Poland, Russia, South Africa, Taiwan, Thailand and Turkey.
Indices are not available for investment, are not professionally managed and do not reflect sales charges, fees, brokerage commissions, taxes or other expenses of investing. Securities in the fund may not match those in an index.
3
Performance Information – Columbia Overseas Value Fund
Performance data quoted represents past performance and current performance may be lower or higher. Past performance is no guarantee of future results. The investment return and principal value will fluctuate so that shares, when redeemed, may be worth more or less than the original cost. Please call 1-800-426-3750 for daily and most recent month-end performance updates.
Annual operating expense ratio (%)*
*The annual operating expense ratio is as stated in the fund's prospectus that is current as of the date of this report. Differences in expense ratios disclosed elsewhere in this report may result from including fee waivers and expense reimbursements as well as different time periods used in calculating the ratios.
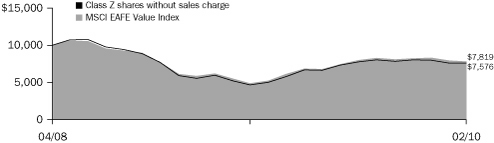
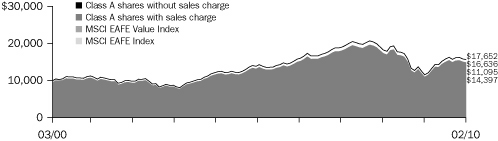
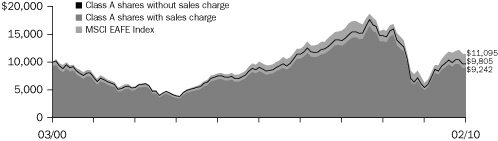
Performance of a $10,000 investment 03/31/08 – 02/28/10
The chart above shows the change in value of a hypothetical $10,000 investment in Class Z shares of Columbia Overseas Value Fund during the stated time period, and does not reflect the deduction of taxes that a shareholder may pay on fund distributions or on the redemption of fund shares.
Performance of a $10,000 investment 03/31/08 – 02/28/10 ($)
| Sales charge | | without | | with | |
| Class Z | | | 7,576 | | | | n/a | | |
Average annual total return as of 02/28/10 (%)
| Share class | | Z | |
| Inception | | 03/31/08 | |
| Sales charge | | without | |
| 1-year | | | 62.60 | | |
| Life | | | –13.49 | | |
Average annual total return as of 03/31/10 (%)
| Share class | | Z | |
| Sales charge | | without | |
| 1-year | | | 59.30 | | |
| Life | | | –10.62 | | |
The fund commenced operations on March 31, 2008. The returns shown do not reflect any sales charges and have not been adjusted to reflect differences in expenses. If difference in expenses were reflected, the return shown would have been lower.
All results shown assume reinvestment of distributions. Class Z shares are sold at net asset value with no distribution and service (Rule 12b-1) fees. Class Z shares have limited eligibility and the investment minimum requirements may vary. Please see the fund's prospectus for details. Performance for different share classes will vary based on differences in sales charges and fees associated with each class.
Performance results reflect any fee waivers or reimbursements of fund expenses by the investment advisor and/or any of its affiliates. Absent these fee waivers or expense reimbursement arrangements, performance results would have been lower.
The tables do not reflect the deduction of taxes that a shareholder may pay on fund distributions or on the redemption of fund shares.
4
Understanding Your Expenses – Columbia Overseas Value Fund
As a fund shareholder, you incur two types of costs. There are transaction costs, which generally include sales charges on purchases and may include redemption fees or exchange fees. There are also ongoing costs, which generally include investment advisory fees, distribution and service (Rule 12b-1) fees and other fund expenses. The information on this page is intended to help you understand the ongoing costs of investing in the fund and to compare these costs with the ongoing costs of investing in other mutual funds.
Analyzing your fund's expenses by share class
To illustrate these ongoing costs, we have provided an example and calculated the expenses paid by investors in each share class during the period. The information in the following table is based on an initial investment of $1,000, which is invested at the beginning of the period and held for the entire period. Expense information is calculated two ways and each method provides you with different information. The amount listed in the "Actual" column is calculated using the fund's actual operating expenses and total return for the period. The amount listed in the "Hypothetical" column for each share class assumes that the return each year is 5% before expenses and is calculated based on the fund's actual operating expenses. You should not use the hypothetical account values and expenses to estimate either your actual account balance at the end of the period or the expenses you paid during this period.
Compare with other funds
Since all mutual funds are required to include the same hypothetical calculations about expenses in shareholder reports, you can use this information to compare the ongoing costs of investing in the fund with other funds. To do so, compare the 5% hypothetical example with the 5% hypothetical examples that appear in the shareholder reports of other funds. As you compare hypothetical examples of other funds, it is important to note that hypothetical examples are meant to highlight the ongoing costs of investing in a fund and do not reflect any transaction costs, such as sales charges, redemption fees or exchange fees.
Estimating your actual expenses
To estimate the expenses that you paid over the period, first you will need your account balance at the end of the period:
g For shareholders who receive their account statements from Columbia Management Services, Inc., your account balance is available by calling Shareholder Services at 800.426.3750.
g For shareholders who receive their account statements from their financial intermediary, contact your financial intermediary to obtain your account balance.
1. Divide your ending account balance by $1,000. For example, if an account balance was $8,600 at the end of the period, the result would be 8.6.
2. In the section of the table below titled "Expenses paid during the period," locate the amount for your share class. You will find this number in the column labeled "Actual." Multiply this number by the result from step 1. Your answer is an estimate of the expenses you paid on your account during the period.
If the value of your account falls below the minimum initial investment requirement applicable to you, your account generally will be subject to a $20 annual fee. This fee is not included in the accompanying table. If you are subject to the fee, keep it in mind when you are estimating the ongoing expenses of investing in the fund and when comparing the expenses of this fund with other funds.
09/01/09 – 02/28/10
| | | Account value at the
beginning of the period ($) | | Account value at the
end of the period ($) | | Expenses paid
during the period ($) | | Fund's annualized
expense ratio (%) | |
| | | Actual | | Hypothetical | | Actual | | Hypothetical | | Actual | | Hypothetical | | Actual | |
| Class Z | | | 1,000.00 | | | | 1,000.00 | | | | 976.00 | | | | 1,019.09 | | | | 5.63 | | | | 5.76 | | | | 1.15 | | |
Expenses paid during the period are equal to the annualized expense ratio for the share class, multiplied by the average account value over the period, then multiplied by the number of days in the fund's most recent fiscal half-year and divided by 365.
Had the investment advisor and/or any of its affiliates not waived fees or reimbursed a portion of expenses, the account value at the end of the period would have been reduced.
It is important to note that the expense amounts shown in the table are meant to highlight only ongoing costs of investing in the fund and do not reflect any transaction costs, such as sales charges, redemption fees or exchange fees. Therefore, the hypothetical examples provided may not help you determine the relative total costs of owning shares of different funds. If these transaction costs were included, your costs would have been higher.
5
Portfolio Managers' Report – Columbia Overseas Value Fund
Performance data quoted represents past performance and current performance may be lower or higher. Past performance is no guarantee of future results. The investment return and principal value will fluctuate so that shares, when redeemed, may be worth more or less than the original cost. Please call 1-800-426-3750 for daily and most recent month-end performance updates.
Net asset value per share
as of 02/28/10 ($)
Distributions declared per share
03/01/09 – 02/28/10 ($)
For the 12-month period that ended February 28, 2010, the fund's Class Z shares returned 62.60% without sales charge. The fund outperformed the MSCI EAFE Value Index, which returned 60.15% over the same period. Its return was also higher than the 57.28% average return for its peer group, the Lipper International Multi-Cap Value Funds Classification. Investments in China, which is not represented in the index, and an overweight in Switzerland also contributed to the fund's outperformance. Stock selection in the financials sector contributed to positive performance.
Positioning the fund for an economic recovery
After reaching their lowest levels of the financial crisis in early March 2009, global stock markets began moving higher. With the rise in stock prices—along with evidence that a severe credit crisis was easing—we began to reposition the portfolio away from defensive companies and toward those that we believe are positioned to benefit from to an economic recovery. For example, in Switzerland, we added to a position in Tecan Group (0.5% of net assets), a manufacturer of laboratory automation equipment. Even though Tecan is a health care stock, its revenues are driven by capital spending. Its share price declined during the pullback in capital spending, but it produced substantial gains as the outlook for spending improved. In the same vein, Clariant, a Swiss specialty chemical manufacturer, did well. and we were able to take a profit from the sale of the stock. Shares of Eastern Platinum (0.4% of net assets) in Canada r ose in the face of rising global demand for raw materials. We added Turkish airline Turk Hava Yollari (0.4% of net assets) to the portfolio based on expectations that air traffic in the Middle East would improve as the economy strengthened. The stock provided a strong boost to the fund's performance.
A focus on China
As the Chinese government began unwinding its economic stimulus programs, China's stock market declined. However, we believe that the government's actions were a step in the right to direction to help prevent China's growth from overheating. We used the market downturn to add to the fund's exposure to China, especially to companies that are linked to domestic growth. For example, we added to the fund's investment in Yanzhou Coal Mining (0.7% of net assets), one of China's biggest coal producers. Coal is the main source of energy in China. The company expanded its operations by purchasing Felix Resources in Australia and was among the best performers in the fund's portfolio.
Financial stocks made a comeback
Financial stocks, which are the largest sector weight in the portfolio, rebounded after being hit hard by the recent financial crisis. We made a timely addition to the fund's position in UK-based Barclays (1.9% of net assets), which did not take bailout money and maintained a solid balance sheet throughout the crisis. Barclays shares dropped along with other big banks during the crisis. During the subsequent rebound, it was one of the strongest performers—and made a strong contribution to the fund's return.
6
Portfolio Managers' Report (continued) – Columbia Overseas Value Fund
Defensive stocks disappointed
Certain defensive consumer stocks fell short of expectations. OPAP, the Greek lottery, did not participate in the global upturn in stocks because it is not particularly sensitive to the economic cycle. OPAP also suffered because of concerns that gaming will be taxed and because its monopoly status has been the subject of anti-competitive allegations by the European Union. We sold the stock. Game Group (0.7% of net assets), a UK-based hardware and software retailer, did poorly. A trough in the hardware cycle hurt unit growth. It remains in the portfolio.
A positive outlook
Looking ahead, we believe that reasonable valuations, combined with low interest rates, could more than offset the negative impact of Europe's debt problems on investor confidence. Greece, which has been the primary focus of concern, has developed an austerity plan that we believe will be supported by the European Union. As a result, we have added to the portfolio's positions in European financials, namely the National Bank of Greece and Banco Santander in Spain (0.7% and 3.3% of net assets, respectively), which we believe may benefit as debt problems are resolved. We are also boosting investment in Japan, where valuations are compelling and where the market has lagged for the past several years.
Portfolio holdings and characteristics are subject to change periodically and may not be representative of current holdings and characteristics. The outlook for the fund may differ from those presented for other Columbia Funds.
Equity investments are affected by stock market fluctuations that occur in response to economic and business developments.
International investing may involve certain risks, including currency fluctuations, risks associated with possible differences in financial accounting standards and other monetary and political risk. Significant levels of foreign taxes, including potentially confiscatory levels of taxation and withholding taxes, may also apply to some foreign investments.
Investing in emerging markets may involve greater risks than investing in more developed countries. In addition, concentration of investments in a single region may result in greater volatility.
Value stocks are stocks of companies that may have experienced adverse business or industry developments or may be subject to special risks that have caused the stocks to be out of favor. The price of the company's stock may not approach the value the advisor has placed on it.
Top 5 sectors
as of 02/28/10 (%)
| Financials | | | 35.7 | | |
| Energy | | | 12.6 | | |
| Industrials | | | 10.9 | | |
| Utilities | | | 9.1 | | |
| Telecommunication Services | | | 7.8 | | |
Top 10 holdings
as of 02/28/10 (%)
| Banco Santander | | | 3.3 | | |
| HSBC Holdings | | | 3.3 | | |
| BP | | | 2.7 | | |
| Total | | | 2.7 | | |
| Royal Dutch Shell | | | 2.6 | | |
| Sanofi-Aventis | | | 2.4 | | |
| Barclays PLC | | | 1.9 | | |
Banco Bilbao Vizcaya
Argentaria | | | 1.8 | | |
| Zurich Financial Services AG | | | 1.8 | | |
| RWE AG | | | 1.8 | | |
The fund is actively managed and the composition of its portfolio will change over time. Information provided is calculated as a percentage of net assets.
7
Investment Portfolio – Columbia Overseas Value Fund
February 28, 2010
| Common Stocks – 100.8% | |
| | | Shares | | Value ($) | |
| Consumer Discretionary – 7.6% | |
| Auto Components – 0.6% | |
| Nippon Seiki Co., Ltd. | | | 4,000 | | | | 43,356 | | |
| Auto Components Total | | | 43,356 | | |
| Automobiles – 2.6% | |
Dongfeng Motor Group Co., Ltd.,
Class H | | | 18,000 | | | | 26,158 | | |
| Nissan Motor Co., Ltd. (a) | | | 6,300 | | | | 49,992 | | |
| Toyota Motor Corp. | | | 3,300 | | | | 123,687 | | |
| Automobiles Total | | | 199,837 | | |
| Leisure Equipment & Products – 0.5% | |
| Altek Corp. | | | 23,000 | | | | 36,932 | | |
| Leisure Equipment & Products Total | | | 36,932 | | |
| Media – 1.7% | |
| Daiichikosho Co., Ltd. | | | 5,700 | | | | 76,924 | | |
| Vivendi | | | 2,067 | | | | 52,069 | | |
| Media Total | | | 128,993 | | |
| Specialty Retail – 1.4% | |
| Game Group PLC | | | 40,928 | | | | 51,174 | | |
| USS Co., Ltd. | | | 890 | | | | 57,700 | | |
| Specialty Retail Total | | | 108,874 | | |
| Textiles, Apparel & Luxury Goods – 0.8% | |
| LG Fashion Corp. | | | 1,120 | | | | 27,906 | | |
| Polo Ralph Lauren Corp. (b) | | | 395 | | | | 31,572 | | |
| Textiles, Apparel & Luxury Goods Total | | | 59,478 | | |
| Consumer Discretionary Total | | | 577,470 | | |
| Consumer Staples – 2.7% | |
| Food & Staples Retailing – 2.2% | |
| FamilyMart Co., Ltd. | | | 2,096 | | | | 67,166 | | |
| Koninklijke Ahold NV | | | 3,979 | | | | 48,762 | | |
| Matsumotokiyoshi Holdings Co., Ltd. | | | 2,200 | | | | 48,385 | | |
| Food & Staples Retailing Total | | | 164,313 | | |
| Food Products – 0.5% | |
| Toyo Suisan Kaisha Ltd. | | | 1,400 | | | | 39,016 | | |
| Food Products Total | | | 39,016 | | |
| Consumer Staples Total | | | 203,329 | | |
| Energy – 12.6% | |
| Energy Equipment & Services – 1.3% | |
| Noble Corp. | | | 854 | | | | 36,090 | | |
| Shinko Plantech Co., Ltd. | | | 6,000 | | | | 59,294 | | |
| Energy Equipment & Services Total | | | 95,384 | | |
| Oil, Gas & Consumable Fuels – 11.3% | |
| AWE Ltd. (a) | | | 28,657 | | | | 64,720 | | |
| BP PLC | | | 23,423 | | | | 206,685 | | |
| | | Shares | | Value ($) | |
| ENI SpA | | | 4,118 | | | | 92,912 | | |
| Repsol YPF SA | | | 1,798 | | | | 40,727 | | |
| Royal Dutch Shell PLC, Class B | | | 7,447 | | | | 194,912 | | |
| Total SA | | | 3,686 | | | | 205,680 | | |
Yanzhou Coal Mining Co., Ltd.,
Class H | | | 24,000 | | | | 50,955 | | |
| Oil, Gas & Consumable Fuels Total | | | 856,591 | | |
| Energy Total | | | 951,975 | | |
| Financials – 35.7% | |
| Capital Markets – 1.6% | |
| Intermediate Capital Group PLC | | | 14,737 | | | | 54,469 | | |
| Tokai Tokyo Financial Holdings | | | 17,000 | | | | 65,440 | | |
| Capital Markets Total | | | 119,909 | | |
| Commercial Banks – 20.8% | |
Australia & New Zealand Banking
Group Ltd. | | | 5,779 | | | | 119,845 | | |
| Banco Bilbao Vizcaya Argentaria SA | | | 10,387 | | | | 135,070 | | |
| Banco Santander SA | | | 19,158 | | | | 249,100 | | |
Bangkok Bank PCL, Foreign
Registered Shares | | | 11,800 | | | | 41,576 | | |
| Bank of China Ltd., Class H | | | 89,000 | | | | 43,112 | | |
Governor & Co. of the Bank of
Ireland (a) | | | 13,779 | | | | 18,762 | | |
| Barclays PLC | | | 30,358 | | | | 144,656 | | |
| BNP Paribas | | | 1,263 | | | | 91,371 | | |
| Commonwealth Bank of Australia | | | 1,511 | | | | 73,016 | | |
| DBS Group Holdings Ltd. | | | 11,000 | | | | 109,554 | | |
| HSBC Holdings PLC | | | 22,533 | | | | 247,242 | | |
| National Australia Bank Ltd. | | | 1,760 | | | | 40,127 | | |
| National Bank of Greece SA (a) | | | 2,885 | | | | 53,818 | | |
| National Bank of Pakistan | | | 37,615 | | | | 39,120 | | |
Sumitomo Mitsui Financial
Group, Inc. | | | 1,900 | | | | 61,077 | | |
Svenska Handelsbanken AB,
Class A | | | 1,322 | | | | 36,064 | | |
| Toronto-Dominion Bank | | | 1,100 | | | | 70,295 | | |
| Commercial Banks Total | | | 1,573,805 | | |
| Consumer Finance – 0.7% | |
| Hitachi Capital Corp. | | | 3,900 | | | | 53,686 | | |
| Consumer Finance Total | | | 53,686 | | |
| Diversified Financial Services – 1.1% | |
| ING Groep NV (a) | | | 9,159 | | | | 81,874 | | |
| Diversified Financial Services Total | | | 81,874 | | |
| Insurance – 7.4% | |
| Allianz SE, Registered Shares | | | 351 | | | | 40,529 | | |
Baloise Holding AG,
Registered Shares | | | 917 | | | | 78,874 | | |
See Accompanying Notes to Financial Statements.
8
Columbia Overseas Value Fund
February 28, 2010
| Common Stocks (continued) | |
| | | Shares | | Value ($) | |
| Brit Insurance Holdings NV | | | 5,168 | | | | 60,603 | | |
| Lincoln National Corp. | | | 1,755 | | | | 44,191 | | |
Muenchener Rueckversicherungs-
Gesellschaft AG, Registered Shares | | | 616 | | | | 95,327 | | |
| Sampo Oyj, Class A | | | 2,581 | | | | 62,557 | | |
| XL Capital Ltd., Class A | | | 2,578 | | | | 47,100 | | |
Zurich Financial Services AG,
Registered Shares | | | 557 | | | | 134,292 | | |
| Insurance Total | | | 563,473 | | |
| Real Estate Investment Trusts (REITs) – 1.7% | |
| Japan Retail Fund Investment Corp. | | | 68 | | | | 80,671 | | |
| Wereldhave NV | | | 520 | | | | 46,824 | | |
| Real Estate Investment Trusts (REITs) Total | | | 127,495 | | |
| Real Estate Management & Development – 2.4% | |
| Cheung Kong Holdings Ltd. | | | 5,700 | | | | 69,688 | | |
| Hongkong Land Holdings Ltd. | | | 14,000 | | | | 64,400 | | |
| Sinolink Worldwide Holdings Ltd. | | | 304,000 | | | | 50,914 | | |
| Real Estate Management & Development Total | | | 185,002 | | |
| Financials Total | | | 2,705,244 | | |
| Health Care – 5.2% | |
| Health Care Equipment & Supplies – 0.7% | |
| Miraca Holdings, Inc. | | | 1,800 | | | | 54,499 | | |
| Health Care Equipment & Supplies Total | | | 54,499 | | |
| Life Sciences Tools & Services – 0.5% | |
| Tecan Group AG, Registered Shares | | | 576 | | | | 39,946 | | |
| Life Sciences Tools & Services Total | | | 39,946 | | |
| Pharmaceuticals – 4.0% | |
| AstraZeneca PLC | | | 1,428 | | | | 62,786 | | |
| Sanofi-Aventis SA | | | 2,496 | | | | 182,577 | | |
| Santen Pharmaceutical Co., Ltd. | | | 1,700 | | | | 54,629 | | |
| Pharmaceuticals Total | | | 299,992 | | |
| Health Care Total | | | 394,437 | | |
| Industrials – 10.9% | |
| Aerospace & Defense – 0.7% | |
| BAE Systems PLC | | | 9,847 | | | | 56,200 | | |
| Aerospace & Defense Total | | | 56,200 | | |
| Airlines – 0.4% | |
| Turk Hava Yollari A.O. | | | 10,766 | | | | 34,111 | | |
| Airlines Total | | | 34,111 | | |
| Commercial Services & Supplies – 0.8% | |
| Aeon Delight Co., Ltd. | | | 4,300 | | | | 58,853 | | |
| Commercial Services & Supplies Total | | | 58,853 | | |
| Construction & Engineering – 2.5% | |
| Macmahon Holdings Ltd. | | | 78,818 | | | | 46,973 | | |
| Maire Tecnimont SpA | | | 14,623 | | | | 45,398 | | |
| | | Shares | | Value ($) | |
| Toyo Engineering Corp. | | | 16,000 | | | | 53,667 | | |
| Vinci SA | | | 859 | | | | 44,973 | | |
| Construction & Engineering Total | | | 191,011 | | |
| Electrical Equipment – 0.9% | |
| Schneider Electric SA | | | 648 | | | | 69,203 | | |
| Electrical Equipment Total | | | 69,203 | | |
| Industrial Conglomerates – 1.9% | |
| DCC PLC | | | 1,769 | | | | 46,369 | | |
| Siemens AG, Registered Shares | | | 603 | | | | 51,720 | | |
| Tyco International Ltd. | | | 1,189 | | | | 42,875 | | |
| Industrial Conglomerates Total | | | 140,964 | | |
| Machinery – 0.6% | |
| Demag Cranes AG | | | 1,266 | | | | 41,717 | | |
| Machinery Total | | | 41,717 | | |
| Professional Services – 1.4% | |
| Atkins WS PLC | | | 6,972 | | | | 61,287 | | |
| Teleperformance | | | 1,322 | | | | 42,141 | | |
| Professional Services Total | | | 103,428 | | |
| Trading Companies & Distributors – 1.7% | |
| ITOCHU Corp. | | | 4,000 | | | | 32,236 | | |
| Mitsui & Co., Ltd. | | | 6,300 | | | | 97,785 | | |
| Trading Companies & Distributors Total | | | 130,021 | | |
| Industrials Total | | | 825,508 | | |
| Information Technology – 3.9% | |
| Electronic Equipment, Instruments & Components – 0.6% | |
| FUJIFILM Holdings Corp. | | | 1,400 | | | | 44,531 | | |
Electronic Equipment, Instruments &
Components Total | | | 44,531 | | |
| IT Services – 0.8% | |
| Groupe Steria SCA | | | 1,373 | | | | 38,588 | | |
| Redecard SA | | | 1,300 | | | | 18,919 | | |
| IT Services Total | | | 57,507 | | |
| Office Electronics – 0.7% | |
| Canon, Inc. | | | 1,300 | | | | 54,066 | | |
| Office Electronics Total | | | 54,066 | | |
| Semiconductors & Semiconductor Equipment – 1.1% | |
| Macronix International | | | 99,267 | | | | 53,236 | | |
United Microelectronics Corp.,
ADR (a) | | | 8,463 | | | | 29,028 | | |
Semiconductors & Semiconductor
Equipment Total | | | 82,264 | | |
| Software – 0.7% | |
| NSD Co., Ltd. | | | 4,800 | | | | 54,081 | | |
| Software Total | | | 54,081 | | |
| Information Technology Total | | | 292,449 | | |
See Accompanying Notes to Financial Statements.
9
Columbia Overseas Value Fund
February 28, 2010
| Common Stocks (continued) | |
| | | Shares | | Value ($) | |
| Materials – 5.3% | |
| Chemicals – 2.9% | |
| BASF SE | | | 763 | | | | 42,846 | | |
| Capro Corp. (a) | | | 6,740 | | | | 51,426 | | |
| Kansai Paint Co., Ltd. | | | 9,000 | | | | 72,936 | | |
| Makhteshim-Agan Industries Ltd. | | | 9,737 | | | | 49,860 | | |
| Chemicals Total | | | 217,068 | | |
| Metals & Mining – 1.6% | |
| BlueScope Steel Ltd. | | | 11,086 | | | | 24,043 | | |
| Eastern Platinum Ltd. (a) | | | 25,700 | | | | 31,997 | | |
| First Quantum Minerals Ltd. | | | 446 | | | | 34,758 | | |
| Yamato Kogyo Co., Ltd. | | | 1,000 | | | | 31,594 | | |
| Metals & Mining Total | | | 122,392 | | |
| Paper & Forest Products – 0.8% | |
| Svenska Cellulosa AB, Class B | | | 4,419 | | | | 65,326 | | |
| Paper & Forest Products Total | | | 65,326 | | |
| Materials Total | | | 404,786 | | |
| Telecommunication Services – 7.8% | |
| Diversified Telecommunication Services – 5.2% | |
| BCE, Inc. | | | 2,520 | | | | 69,934 | | |
| France Telecom SA | | | 1,298 | | | | 30,444 | | |
Nippon Telegraph &
Telephone Corp. | | | 2,300 | | | | 100,186 | | |
| Tele2 AB, Class B | | | 4,665 | | | | 69,355 | | |
| Telefonica O2 Czech Republic AS | | | 3,048 | | | | 71,924 | | |
| Telenor ASA (a) | | | 4,000 | | | | 50,565 | | |
| Diversified Telecommunication Services Total | | | 392,408 | | |
| Wireless Telecommunication Services – 2.6% | |
| Softbank Corp. | | | 2,400 | | | | 62,860 | | |
| Vodafone Group PLC | | | 61,432 | | | | 132,498 | | |
| Wireless Telecommunication Services Total | | | 195,358 | | |
| Telecommunication Services Total | | | 587,766 | | |
| Utilities – 9.1% | |
| Electric Utilities – 4.2% | |
| E.ON AG | | | 1,891 | | | | 67,346 | | |
| Enel SpA | | | 19,680 | | | | 106,720 | | |
| Fortum Oyj | | | 3,141 | | | | 80,022 | | |
| Okinawa Electric Power Co., Inc. | | | 1,200 | | | | 66,318 | | |
| Electric Utilities Total | | | 320,406 | | |
| Independent Power Producers & Energy Traders – 1.4% | |
| Drax Group PLC | | | 9,551 | | | | 58,239 | | |
| Energy Development Corp. | | | 445,000 | | | | 46,309 | | |
Independent Power Producers & Energy
Traders Total | | | 104,548 | | |
| | | Shares | | Value ($) | |
| Multi-Utilities – 2.7% | |
| AGL Energy Ltd. | | | 5,077 | | | | 65,383 | | |
| RWE AG | | | 1,579 | | | | 133,905 | | |
| Multi-Utilities Total | | | 199,288 | | |
| Water Utilities – 0.8% | |
Cia de Saneamento Basico do
Estado de Sao Paulo | | | 1,800 | | | | 30,230 | | |
| Guangdong Investment Ltd. | | | 62,000 | | | | 31,151 | | |
| Water Utilities Total | | | 61,381 | | |
| Utilities Total | | | 685,623 | | |
Total Common Stocks
(cost of $7,812,249) | | | 7,628,587 | | |
Total Investments – 100.8%
(cost of $7,812,249) (c) | | | 7,628,587 | | |
| Other Assets & Liabilities, Net – (0.8)% | | | (57,062 | ) | |
| Net Assets – 100.0% | | | 7,571,525 | | |
Notes to Investment Portfolio:
(a) Non-income producing security.
(b) All or a portion of this security is pledged as collateral for open written option contracts.
(c) Cost for federal income tax purposes is $7,869,255.
The following table summarizes the inputs used, as of February 28, 2010, in valuing the Fund's assets:
| Description | | Quoted Prices
(Level 1) | | Other
Significant
Observable
Inputs
(Level 2) | | Significant
Unobservable
Inputs
(Level 3) | | Total | |
| Common Stocks | |
Consumer
Discretionary | | $ | 31,572 | | | $ | 545,898 | | | $ | — | | | $ | 577,470 | | |
| Consumer Staples | | | — | | | | 203,329 | | | | — | | | | 203,329 | | |
| Energy | | | 36,090 | | | | 915,885 | | | | — | | | | 951,975 | | |
| Financials | | | 225,986 | | | | 2,479,258 | | | | — | | | | 2,705,244 | | |
| Health Care | | | — | | | | 394,437 | | | | — | | | | 394,437 | | |
| Industrials | | | 42,875 | | | | 782,633 | | | | — | | | | 825,508 | | |
| Information Technology | | | 47,947 | | | | 244,502 | | | | — | | | | 292,449 | | |
| Materials | | | 66,755 | | | | 338,031 | | | | — | | | | 404,786 | | |
Telecommunication
Services | | | 69,934 | | | | 517,832 | | | | — | | | | 587,766 | | |
| Utilities | | | 30,230 | | | | 655,393 | | | | — | | | | 685,623 | | |
| Total Common Stocks | | | 551,389 | | | | 7,077,198 | | | | — | | | | 7,628,587 | | |
| Total Investments | | | 551,389 | | | | 7,077,198 | | | | — | | | | 7,628,587 | | |
Value of Written Call
Option Contracts | | | (81 | ) | | | — | | | | — | | | | (81 | ) | |
Unrealized Appreciation
(Depreciation) on
Forward Foreign
Currency Exchange
Contracts | | | — | | | | (44,692 | ) | | | — | | | | (44,692 | ) | |
| Total | | $ | 551,308 | | | $ | 7,032,506 | | | $ | — | | | $ | 7,583,814 | | |
The Fund's assets assigned to the Level 2 input category include certain foreign securities for which a third party statistical pricing service may be employed for purposes of fair market valuation.
For more information on valuation inputs, and their aggregation into the levels used in the table above, please refer to the Security Valuation section in the accompanying Notes to Financial Statements.
See Accompanying Notes to Financial Statements.
10
Columbia Overseas Value Fund
February 28, 2010
Forward foreign currency exchange contracts outstanding on February 28, 2010, are:
Foreign Exchange Rate Risk
Forward
Foreign
Currency
Exchange
Contracts
to Buy | | Value | | Aggregate
Face
Value | | Settlement
Date | | Unrealized
Appreciation
(Depreciation) | |
| AUD | | | | $ | 240,854 | | | $ | 239,811 | | | 03/11/10 | | $ | 1,043 | | |
| EUR | | | 665,838 | | | | 705,634 | | | 03/11/10 | | | (39,796 | ) | |
| GBP | | | 240,903 | | | | 257,006 | | | 03/11/10 | | | (16,103 | ) | |
| JPY | | | 129,534 | | | | 126,899 | | | 03/11/10 | | | 2,635 | | |
| NOK | | | 31,801 | | | | 32,472 | | | 03/11/10 | | | (671 | ) | |
| NZD | | | 23,726 | | | | 25,122 | | | 03/11/10 | | | (1,396 | ) | |
| | | | | $ | (54,288 | ) | |
Forward
Foreign
Currency
Exchange
Contracts
to Sell | | Value | | Aggregate
Face
Value | | Settlement
Date | | Unrealized
Appreciation
(Depreciation) | |
| CAD | | | | $ | 194,827 | | | $ | 193,286 | | | 03/11/10 | | $ | (1,541 | ) | |
| CHF | | | 155,465 | | | | 160,762 | | | 03/11/10 | | | 5,297 | | |
| CZK | | | 76,402 | | | | 80,451 | | | 03/11/10 | | | 4,049 | | |
| EUR | | | 69,443 | | | | 71,817 | | | 03/11/10 | | | 2,374 | | |
| GBP | | | 36,593 | | | | 37,228 | | | 03/11/10 | | | 635 | | |
| ILS | | | 60,324 | | | | 60,440 | | | 03/11/10 | | | 116 | | |
| JPY | | | 49,594 | | | | 48,332 | | | 03/11/10 | | | (1,262 | ) | |
| KRW | | | 97,039 | | | | 96,399 | | | 03/11/10 | | | (640 | ) | |
| NZD | | | 31,402 | | | | 32,197 | | | 03/11/10 | | | 795 | | |
| SEK | | | 15,428 | | | | 15,089 | | | 03/11/10 | | | (339 | ) | |
| THB | | | 56,457 | | | | 56,225 | | | 03/11/10 | | | (232 | ) | |
| TWD | | | 136,378 | | | | 136,722 | | | 03/11/10 | | | 344 | | |
| | | | | $ | 9,596 | | |
For the year ended February 28, 2010, transactions in written option contracts were as follows:
| | | Number of
contracts | | Premium
received | |
| Options outstanding at February 28, 2009 | | | – | | | $ | – | | |
| Options written | | | 90 | | | | 3,817 | | |
Options terminated in closing
purchase transactions | | | (12 | ) | | | (540 | ) | |
| Options exercised | | | (29 | ) | | | (1,618 | ) | |
| Options expired | | | (46 | ) | | | (1,467 | ) | |
| Options outstanding at February 28, 2010 | | | 3 | | | $ | 192 | | |
At February 28, 2010, the Fund held the following written call option contracts:
Equity Risk
| Name of Issuer | | Strike
Price | | Number of
Contracts | | Expiration
Date | | Premium | | Value | |
Polo Ralph
Lauren Corp. | | $ | 85 | | | | 3 | | | | 03/20/10 | | | $ | 192 | | | $ | (81 | ) | |
| Total written call options (proceeds $192) | | | |
The Fund was invested in the following countries at February 28, 2010:
Summary of Securities
by Country (Unaudited) | | Value | | % of Total
Investments | |
| Japan | | $ | 1,664,635 | | | | 21.8 | | |
| United Kingdom | | | 1,330,751 | | | | 17.5 | | |
| France | | | 757,045 | | | | 9.9 | | |
| Germany | | | 473,390 | | | | 6.2 | | |
| Australia | | | 434,108 | | | | 5.7 | | |
| Spain | | | 424,897 | | | | 5.6 | | |
| Switzerland | | | 253,112 | | | | 3.3 | | |
| Italy | | | 245,031 | | | | 3.2 | | |
| Canada | | | 206,982 | | | | 2.7 | | |
| United States | | | 201,829 | | | | 2.7 | | |
| Hong Kong | | | 185,002 | | | | 2.4 | | |
| Netherlands | | | 177,460 | | | | 2.3 | | |
| Sweden | | | 170,746 | | | | 2.2 | | |
| China | | | 151,376 | | | | 2.0 | | |
| Finland | | | 142,578 | | | | 1.9 | | |
| Taiwan | | | 119,195 | | | | 1.6 | | |
| Singapore | | | 109,554 | | | | 1.4 | | |
| South Korea | | | 79,332 | | | | 1.0 | | |
| Czech Republic | | | 71,924 | | | | 1.0 | | |
| Ireland | | | 65,131 | | | | 0.9 | | |
| Greece | | | 53,819 | | | | 0.7 | | |
| Norway | | | 50,565 | | | | 0.7 | | |
| Israel | | | 49,860 | | | | 0.7 | | |
| Brazil | | | 49,149 | | | | 0.6 | | |
| Philippines | | | 46,309 | | | | 0.6 | | |
| Thailand | | | 41,576 | | | | 0.5 | | |
| Pakistan | | | 39,120 | | | | 0.5 | | |
| Turkey | | | 34,111 | | | | 0.4 | | |
| | | $ | 7,628,587 | | | | 100.0 | | |
Certain securities are listed by country of underlying exposure but may trade predominantly on another exchange.
| Acronym | | Name | |
| ADR | | American Depositary Receipt | |
|
| AUD | | Australian Dollar | |
|
| CAD | | Canadian Dollar | |
|
| CHF | | Swiss Franc | |
|
| CZK | | Czech Koruna | |
|
| EUR | | Euro | |
|
| GBP | | Pound Sterling | |
|
| ILS | | Israeli Shekel | |
|
| JPY | | Japanese Yen | |
|
| KRW | | South Korean Won | |
|
| NOK | | Norwegian Krone | |
|
| NZD | | New Zealand Dollar | |
|
| SEK | | Swedish Krona | |
|
| THB | | Thailand Baht | |
|
| TWD | | New Taiwan Dollar | |
|
See Accompanying Notes to Financial Statements.
11
Statement of Assets and Liabilities – Columbia Overseas Value Fund
February 28, 2010
| | | | | ($) | |
| Assets | | Investments, at cost | | | 7,812,249 | | |
| | | Investments, at value | | | 7,628,587 | | |
| | | Cash | | | 28,778 | | |
| | | Foreign currency (cost of $2,968) | | | 2,994 | | |
| | | Unrealized appreciation on forward foreign currency exchange contracts | | | 17,288 | | |
| | | Receivable for: | | | | | |
| | | Dividends | | | 16,854 | | |
| | | Foreign tax reclaims | | | 13,329 | | |
| | | Expense reimbursement due from investment advisor | | | 10,235 | | |
| | | Prepaid expenses | | | 90 | | |
| | | Total Assets | | | 7,718,155 | | |
| Liabilities | | Written options, at value (premium of $192) | | | 81 | | |
| | | Unrealized depreciation on forward foreign currency exchange contracts | | | 61,980 | | |
| | | Payable for: | | | | | |
| | | Foreign capital gains taxes withheld | | | 12 | | |
| | | Investment advisory fee | | | 4,961 | | |
| | | Administration fee | | | — | | |
| | | Pricing and bookkeeping fees | | | 2,274 | | |
| | | Transfer agent fee | | | 137 | | |
| | | Trustees' fees | | | 9,208 | | |
| | | Audit fee | | | 35,000 | | |
| | | Legal fee | | | 10,015 | | |
| | | Custody fee | | | 4,913 | | |
| | | Chief compliance officer expenses | | | 94 | | |
| | | Reports to shareholders | | | 13,353 | | |
| | | Other liabilities | | | 4,602 | | |
| | | Total Liabilities | | | 146,630 | | |
| | | Net Assets | | | 7,571,525 | | |
| Net Assets Consist of | | Paid-in capital | | | 10,529,305 | | |
| | | Overdistributed net investment income | | | (51,714 | ) | |
| | | Accumulated net realized loss | | | (2,677,098 | ) | |
| | | Net unrealized appreciation (depreciation) on: | | | | | |
| | | Investments | | | (183,662 | ) | |
| | | Foreign currency translations and
forward foreign currency exchange contracts | | | (45,405 | ) | |
| | | Written options | | | 111 | | |
| | | Foreign capital gains tax | | | (12 | ) | |
| | | Net Assets | | | 7,571,525 | | |
| Class Z | | Net assets | | $ | 7,571,525 | | |
| | | Shares outstanding | | | 1,085,397 | | |
| | | Net asset value, offering and redemption price per share | | $ | 6.98 | | |
See Accompanying Notes to Financial Statements.
12
Statement of Operations – Columbia Overseas Value Fund
For the Year Ended February 28, 2010
| | | | | ($) | |
| Investment Income | | Dividends | | | 278,641 | | |
| | | Interest | | | 4 | | |
| | | Foreign taxes withheld | | | (23,212 | ) | |
| | | Total Investment Income | | | 255,433 | | |
| Expenses | | Investment advisory fee | | | 58,138 | | |
| | | Administration fee | | | — | | |
| | | Transfer agent fee | | | 106 | | |
| | | Pricing and bookkeeping fees | | | 15,682 | | |
| | | Trustees' fees | | | 20,663 | | |
| | | Custody fee | | | 38,282 | | |
| | | Audit fee | | | 28,330 | | |
| | | Legal fees | | | 35,105 | | |
| | | Reports to shareholders | | | 13,478 | | |
| | | Chief compliance officer expenses | | | 585 | | |
| | | Other expenses | | | 4,190 | | |
| | | Total Expenses | | | 214,559 | | |
| | | Fees waived or expenses reimbursed by investment advisor | | | (133,414 | ) | |
| | | Expense reductions | | | (2 | ) | |
| | | Net Expenses | | | 81,143 | | |
| | | Net Investment Income | | | 174,290 | | |
| Net Realized and Unrealized Gain (Loss) on Investments, Futures Contracts, Written Options, Foreign Capital Gains Tax and Foreign Currency | | Net realized gain (loss) on: | | | | | |
| | | Investments | | | (425,753 | ) | |
| | | Foreign currency transactions and forward foreign currency
exchange contracts | | | 67,741 | | |
| | | Foreign capital gains tax | | | (6,285 | ) | |
| | | Futures contracts | | | 7,611 | | |
| | | Written options | | | 1,949 | | |
| | | Net realized loss | | | (354,737 | ) | |
| | | Net change in unrealized appreciation (depreciation) on: | | | | | |
| | | Investments | | | 3,121,847 | | |
| | | Foreign currency transactions and forward foreign currency
exchange contracts | | | (34,316 | ) | |
| | | Written options | | | 111 | | |
| | | Foreign capital gains tax | | | (12 | ) | |
| | | Net change in unrealized appreciation (depreciation) | | | 3,087,630 | | |
| | | Net Gain | | | 2,732,893 | | |
| | | Net Increase Resulting from Operations | | | 2,907,183 | | |
See Accompanying Notes to Financial Statements.
13
Statement of Changes in Net Assets – Columbia Overseas Value Fund
| Increase (Decrease) in Net Assets | | | | Year Ended
February 28,
2010 ($) | | Period Ended
February 28,
2009 ($)(a) | |
| Operations | | Net investment income | | | 174,290 | | | | 268,191 | | |
| | | Net realized loss on investments, futures contracts,
written options, foreign currency transactions and
forward foreign currency exchange contracts | | | (354,737 | ) | | | (2,287,251 | ) | |
| | | Net change in unrealized appreciation (depreciation)
on investments, written options, foreign capital
gains tax, foreign currency translations and forward
foreign currency exchange contracts | | | 3,087,630 | | | | (3,316,598 | ) | |
| | | Net increase (decrease) resulting from operations | | | 2,907,183 | | | | (5,335,658 | ) | |
| Distributions to Shareholders | | From net investment income | | | (293,672 | ) | | | (235,633 | ) | |
| | | From return of capital | | | — | | | | (14,367 | ) | |
| | | Total distributions to shareholders | | | (293,672 | ) | | | (250,000 | ) | |
| | | Net Capital Stock Transactions | | | 293,672 | | | | 10,250,000 | | |
| | | Total increase in net assets | | | 2,907,183 | | | | 4,664,342 | | |
| Net Assets | | Beginning of period | | | 4,664,342 | | | | — | | |
| | | End of period | | | 7,571,525 | | | | 4,664,342 | | |
| | | Overdistributed (Accumulated) net investment
income (loss) at end of period | | | (51,714 | ) | | | (3,584 | ) | |
(a) The Fund commenced operations on March 31, 2008.
See Accompanying Notes to Financial Statements.
14
Statement of Changes in Net Assets (continued) – Columbia Overseas Value Fund
| | | Capital Stock Activity | |
| | | Year Ended
February 28, 2010 | | Period Ended
February 28, 2009 (a) | |
| | | Shares | | Dollars ($) | | Shares | | Dollars ($) | |
| Class Z | |
| Subscriptions | | | — | | | | — | | | | 1,000,000 | | | | 10,000,000 | | |
| Distributions reinvested | | | 40,674 | | | | 293,672 | | | | 44,723 | | | | 250,000 | | |
| Net increase | | | 40,674 | | | | 293,672 | | | | 1,044,723 | | | | 10,250,000 | | |
(a) The Fund commenced operations on March 31, 2008.
See Accompanying Notes to Financial Statements.
15
Financial Highlights – Columbia Overseas Value Fund
Selected data for a share outstanding throughout each period is as follows:
| Class Z Shares | | Year
Ended
February 28,
2010 | | Period
Ended
February 28,
2009 (a) | |
| Net Asset Value, Beginning of Period | | $ | 4.46 | | | $ | 10.00 | | |
| Income from Investment Operations: | |
| Net investment income (b) | | | 0.17 | | | | 0.27 | | |
Net realized and unrealized gain (loss) on investments,
futures contracts, written options, foreign capital gains
tax and foreign currency | | | 2.63 | | | | (5.56 | ) | |
| Total from investment operations | | | 2.80 | | | | (5.29 | ) | |
| Less Distributions to Shareholders: | |
| From net investment income | | | (0.28 | ) | | | (0.23 | ) | |
| From return of capital | | | — | | | | (0.02 | ) | |
| Total distributions to shareholders | | | (0.28 | ) | | | (0.25 | ) | |
| Net Asset Value, End of Period | | $ | 6.98 | | | $ | 4.46 | | |
| Total return (c)(d) | | | 62.60 | % | | | (53.41 | )%(e) | |
| Ratios to Average Net Assets/Supplemental Data: | |
| Net expenses (f) | | | 1.14 | % | | | 1.10 | %(g) | |
| Waiver/Reimbursement | | | 1.88 | % | | | 2.89 | %(g) | |
| Net investment income (f) | | | 2.46 | % | | | 3.72 | %(g) | |
| Portfolio turnover rate | | | 62 | % | | | 66 | %(e) | |
| Net assets, end of period (000s) | | $ | 7,572 | | | $ | 4,664 | | |
(a) The Fund commenced operations on March 31, 2008. Per share data and total return reflect activity from that date.
(b) Per share data was calculated using the average shares outstanding during the period.
(c) Total return at net asset value assuming all distributions reinvested.
(d) Had the investment advisor not waived fees or reimbursed a portion of expenses, total return would have been reduced.
(e) Not annualized.
(f) The benefits derived from custody credits had an impact of less than 0.01%.
(g) Annualized.
See Accompanying Notes to Financial Statements.
16
Notes to Financial Statements – Columbia Overseas Value Fund
February 28, 2010
Note 1. Organization
Columbia Overseas Value Fund (the "Fund"), a series of Columbia Funds Series Trust (the "Trust"), is a diversified fund. The Trust is registered under the Investment Company Act of 1940, as amended (the "1940 Act"), as an open-end management investment company organized as a Delaware statutory trust.
Investment Objective
The Fund seeks long-term capital appreciation.
Fund Shares
The Trust may issue an unlimited number of shares, and may offer four classes of shares: Class A, Class C, Class R and Class Z shares. At February 28, 2010, only Class Z shares were offered. At February 28, 2010, shares of the Fund were not publicly offered.
Class A shares are subject to a maximum front-end sales charge of 5.75% based on the amount of initial investment. Class A shares purchased without an initial sales charge in accounts aggregating $1 million to $50 million at the time of purchase are subject to a 1.00% contingent deferred sales charge ("CDSC") if the shares are sold within one year after purchase. Class C shares are subject to a 1.00% CDSC on shares sold within one year after purchase. Class R and Class Z shares are offered continuously at net asset value. There are certain restrictions on the purchase of Class R and Class Z shares, as described in the Fund's prospectuses.
Note 2. Significant Accounting Policies
The preparation of financial statements in accordance with accounting principles generally accepted in the United States of America ("GAAP") requires management to make certain estimates and assumptions that affect the reported amounts of assets and liabilities, the disclosure of contingent assets and liabilities at the date of the financial statements and the reported amounts of revenue and expenses during the reporting period. Actual results could differ from those estimates.
The following is a summary of significant accounting policies consistently followed by the Fund in the preparation of its financial statements.
Security Valuation
Equity securities are valued at the last sale price on the principal exchange on which they trade, except for securities traded on the NASDAQ, which are valued at the NASDAQ official close price. Unlisted securities or listed securities for which there were no sales during the day are valued at the closing bid price on such exchanges or over-the-counter markets.
Short-term investments maturing in 60 days or less are valued at amortized cost, which approximates market value.
Futures contracts are valued at the settlement price established each day by the board of trade or exchange on which they are traded.
Purchased options are valued at the last reported sales price, or in the absence of a sale, and the last quoted bid price. Written options are valued at the last reported sale price, or in the absence of a sale, at the last quoted ask price.
Forward foreign currency exchange contracts are valued at the prevailing forward exchange rate of the underlying currencies.
Foreign securities are generally valued at the last sale price on the foreign exchange or market on which they trade. If any foreign share prices are not readily available as a result of limited share activity, the securities are valued at the last sale price of the local shares in the principal market in which such securities are normally traded.
Generally, trading in foreign securities is substantially completed each day at various times prior to the close of the New York Stock Exchange ("NYSE"). The values of such securities used in computing the net asset value of the Fund's shares are determined as of such times. Foreign currency exchange rates are generally determined at 4:00 p.m. Eastern (U.S.) time. Occasionally, events affecting the values of such foreign securities may occur between the times at which they are determined and the close of the customary trading session of the NYSE, which would not be reflected in the computation of the Fund's net asset value. If events materially affecting the values of such foreign securities occur and it is determined that market quotations are not reliable, then these foreign securities will be valued at their fair value using procedures approved by the Board of Trustees.
The Fund may use a systematic fair valuation model provided by an independent third party to value securities principally traded in foreign markets in order to adjust for possible stale
17
Columbia Overseas Value Fund, February 28, 2010
pricing that may occur between the close of the foreign exchanges and the time for valuation.
Investments for which market quotations are not readily available, or that have quotations which management believes are not reliable, are valued at fair value as determined in good faith under consistently applied procedures established by and under the general supervision of the Board of Trustees. If a security is valued at fair value, such value is likely to be different from the last quoted market price for the security. The determination of fair value often requires significant judgment. To determine fair value, management may use assumptions including but not limited to future cash flows and estimated risk premiums. Multiple inputs from various sources may be used to determine value.
GAAP establishes a hierarchy that prioritizes the inputs to valuation techniques used to measure fair value giving the highest priority to unadjusted quoted prices in active markets for identical securities (level 1 measurements) and the lowest priority to unobservable inputs (level 3 measurements) when market prices are not readily available or reliable. The three levels of the fair value hierarchy are described below:
• Level 1 – quoted prices in active markets for identical securities
• Level 2 – prices determined using other significant observable inputs (including quoted prices for similar securities, interest rates, prepayment speeds, credit risk and others)
• Level 3 – prices determined using significant unobservable inputs. In situations where quoted prices or observable inputs are unavailable or less reliable, unobservable inputs may be used. Unobservable inputs may include management's own assumptions about the factors market participants would use in pricing an investment.
The inputs or methodology used for valuing securities are not necessarily an indication of the risk associated with investing in those securities.
Security Transactions
Security transactions are accounted for on the trade date. Cost is determined and gains (losses) are based upon the specific identification method for both financial statement and federal income tax purposes.
Management is required to provide disclosures regarding the Fund's derivative instruments and hedging activities, by providing qualitative disclosures about the objectives and strategies for using derivatives, quantitative data about the fair value of and gains and losses on derivative contracts, and details of credit-risk-related contingent features in their derivative contracts. For additional information on derivative instruments, please see Note 6.
Repurchase Agreements
The Fund may engage in repurchase agreement transactions with institutions that Columbia Management Advisors, LLC ("Columbia"), the Fund's investment advisor, has determined are creditworthy. The Fund, through its custodian, receives delivery of the underlying securities collateralizing a repurchase agreement. Columbia is responsible for determining that the collateral is at least equal, at all times, to the value of the repurchase obligation including interest. A repurchase agreement transaction involves certain risks in the event of default or insolvency of the counterparty. These risks include possible delays in or restrictions on the Fund's ability to dispose of the underlying securities and a possible decline in the value of the underlying securities during the period while the Fund seeks to assert its rights.
Foreign Currency Transactions and Translations
The values of all assets and liabilities quoted in foreign currencies are translated into U.S. dollars at that day's exchange rates. Net realized and unrealized gains (losses) on foreign currency transactions and translations include gains (losses) arising from the fluctuation in exchange rates between trade and settlement dates on securities transactions, gains (losses) arising from the disposition of foreign currency and currency gains (losses) between the accrual and payment dates on dividends, interest income and foreign withholding taxes.
For financial statement purposes, the Fund does not distinguish that portion of gains (losses) on investments which is due to changes in foreign exchange rates from that which is due to changes in market prices of the investments. Such fluctuations are included with the net realized and unrealized gains (losses) on investments on the Statement of Operations.
18
Columbia Overseas Value Fund, February 28, 2010
Income Recognition
Interest income is recorded on the accrual basis.
Corporate actions and dividend income are recorded on the ex-date except for certain foreign securities which are recorded as soon after the ex-date as the Fund becomes aware of such, net of any non-reclaimable tax withholdings.
Expenses
General expenses of the Trust are allocated to the Fund and other series of the Trust based upon relative net assets or other expense allocation methodologies determined by the nature of the expense. Expenses directly attributable to the Fund are charged to the Fund.
Federal Income Tax Status
The Fund intends to qualify each year as a "regulated investment company" under Subchapter M of the Internal Revenue Code, as amended, and will distribute substantially all of its taxable income, if any, for its tax year, and as such will not be subject to federal income taxes. In addition, the Fund intends to distribute in each calendar year substantially all of its net investment income, capital gains and certain other amounts, if any, such that the Fund should not be subject to federal excise tax. Therefore, no federal income or excise tax provision is recorded.
Foreign Capital Gains Taxes
Realized gains in certain countries may be subject to foreign taxes at the fund level, at rates ranging from approximately 10% to 15%. The Fund accrues for such foreign taxes on net realized and unrealized gains at the appropriate rate for each jurisdiction.
Distributions to Shareholders
Distributions from net investment income, if any, are declared and paid annually. The Fund may, however, declare and pay distributions from net investment income more frequently. The Fund will distribute net realized capital gains (including net short-term capital gains) at least annually after the fiscal year in which the capital gains were earned, unless offset by any available capital loss carryforward. Income distributions and capital gain distributions are determined in accordance with federal income tax regulations which may differ from GAAP.
Indemnification
In the normal course of business, the Fund enters into contracts that contain a variety of representations and warranties and which provide general indemnities. The Fund's maximum exposure under these arrangements is unknown because this would involve future claims against the Fund. Also, under the Trust's organizational documents and by contract, the Trustees and officers of the Trust are indemnified against certain liabilities that may arise out of actions relating to their duties to the Trust. However, based on experience, the Fund expects the risk of loss due to these representations, warranties and indemnities to be minimal.
Note 3. Federal Tax Information
The timing and character of income and capital gain distributions are determined in accordance with income tax regulations, which may differ from GAAP. Reclassifications are made to the Fund's capital accounts for permanent tax differences to reflect income and gains available for distribution (or available capital loss carryforwards) under income tax regulations.
For the year ended February 28, 2010, permanent book and tax basis differences resulting primarily from differing treatments for foreign currency transactions were identified and reclassified among the components of the Fund's net assets as follows:
Overdistributed
Net Investment
Income | | Accumulated
Net Realized
Loss | | Paid-In Capital | |
| $ | 71,252 | | | $ | (71,252 | ) | | $ | — | | |
Net investment income and net realized gains (losses), as disclosed on the Statement of Operations, and net assets were not affected by this reclassification.
19
Columbia Overseas Value Fund, February 28, 2010
The tax character of distributions paid during the year ended February 28, 2010 and the period ended February 28, 2009 was as follows:
| Distributions paid from: | | February 28,
2010 | | February 28,
2009 | |
| Ordinary Income* | | $ | 293,672 | | | $ | 253,633 | | |
| Long-Term Capital Gains | | | — | | | | — | | |
| Tax Return of Capital | | | — | | | | 14,367 | | |
* For tax purposes short-term capital gain distributions, if any, are considered ordinary income distributions.
As of February 28, 2010, the components of distributable earnings on a tax basis were as follows:
Undistributed
Ordinary
Income | | Undistributed
Long-Term
Capital Gains | | Net Unrealized
Depreciation* | |
| $ | 11,492 | | | $ | — | | | $ | (240,668 | ) | |
* The differences between book-basis and tax-basis net unrealized depreciation are primarily due to deferral of losses from wash sales.
Unrealized appreciation and depreciation at February 28, 2010, based on cost of investments for federal income tax purposes and excluding any unrealized appreciation and depreciation from changes in the value of other assets and liabilities resulting from changes in exchange rates, were:
| Unrealized appreciation | | $ | 855,107 | | |
| Unrealized depreciation | | | (1,095,775 | ) | |
| Net unrealized depreciation | | $ | (240,668 | ) | |
The following capital loss carryforwards may be available to reduce taxable income arising from future net realized gains on investments, if any, to the extent permitted by the Internal Revenue Code:
| Year of Expiration | | Capital Loss
Carryforwards | |
| 2017 | | $ | 584,061 | | |
| 2018 | | | 2,028,503 | | |
| | | $ | 2,612,564 | | |
Under current tax rules, certain currency and capital losses realized after October 31 may be deferred and treated as occurring on the first day of the following fiscal year. As of February 28, 2010, post-October currency losses of $82,333 and capital losses of $33,204 attributed to security transactions were deferred to March 1, 2010.
Management is required to determine whether a tax position of the Fund is more likely than not to be sustained upon examination by the applicable taxing authority, including resolution of any related appeals or litigation processes, based on the technical merits of the position. The tax benefit to be recognized by the Fund is measured as the largest amount of benefit that is greater than fifty percent likely of being realized upon ultimate settlement. Management is not aware of any tax positions for which it is reasonably possible that the total amounts of unrecognized tax benefits will significantly change in the next twelve months. However, management's conclusions may be subject to review and adjustment at a later date based on factors including, but not limited to, new tax laws, regulations, and administrative interpretations (including relevant court decisions). The Fund's federal tax returns for the prior three fiscal year s remain subject to examination by the Internal Revenue Service.
Note 4. Fees and Compensation Paid to Affiliates
Investment Advisory Fee
Columbia, an indirect, wholly owned subsidiary of Bank of America Corporation ("BOA"), provides investment advisory services to the Fund. In rendering investment advisory services to the Fund, Columbia may use the portfolio management and research resources of Columbia Management Pte. Ltd, an affiliate of Columbia. Columbia receives a monthly investment advisory fee at the annual rate of 0.82% of the Fund's average daily net assets.
Bank of America, N.A., an indirect parent company of Columbia, entered into an agreement dated September 29, 2009, to sell a portion of the asset management business of Columbia Management Group, LLC to Ameriprise Financial, Inc. ("Ameriprise Financial"). The transaction ("Transaction") includes the sale of the part of the asset management business that advises long-term mutual funds, including the Fund. The Transaction is subject to certain approvals and
20
Columbia Overseas Value Fund, February 28, 2010
other conditions to closing, and is currently expected to close on or about May 1, 2010 (the "Closing"). In connection with the Closing, certain changes will occur, including a change in the entities serving as the investment advisor, administrator, distributor and transfer agent of the Fund. RiverSource Investments, LLC (the "New Advisor"), a subsidiary of Ameriprise Financial, will become the investment advisor of the Fund upon the Closing. The New Advisor will serve as investment advisor under a new investment management services agreement effective upon the closing. The New Advisor expects to change its name to Columbia Management Investment Advisers, LLC upon or shortly after the Closing. Effective upon the Closing, as the context requires, references to Columbia shall be deemed to refer to the New Advisor.
Administration Fee
Columbia provides administrative and other services to the Fund for a monthly administration fee at the annual rate of 0.05% of the Fund's average daily net assets, less the fees payable by the Fund as described under the Pricing and Bookkeeping Fees note below.
The New Advisor will become the administrator of the Fund under a new administrative services agreement effective upon the Closing.
Pricing and Bookkeeping Fees
The Fund has entered into a Financial Reporting Services Agreement (the "Financial Reporting Services Agreement") with State Street Bank and Trust Company ("State Street") and Columbia pursuant to which State Street provides financial reporting services to the Fund. The Fund has also entered into an Accounting Services Agreement (collectively with the Financial Reporting Services Agreement, the "State Street Agreements") with State Street and Columbia pursuant to which State Street provides accounting services to the Fund. Under the State Street Agreements, the Fund pays State Street an annual fee of $38,000 paid monthly plus an additional monthly fee based on an annualized percentage rate of average daily net assets of the Fund for the month. The aggregate fee will not exceed $140,000 per year (exclusive of out-of-pocket expenses and charges). The Fund also reimburses State Street for certain out-of-pocket expenses and charges.
Among other updates to the State Street Agreements, Columbia will assign and delegate its rights and obligations thereunder to the New Advisor upon the Closing.
The Fund has entered into a Pricing and Bookkeeping Oversight and Services Agreement (the "Services Agreement") with Columbia. Under the Services Agreement, Columbia provides services related to Fund expenses and the requirements of the Sarbanes-Oxley Act of 2002, and provides oversight of the accounting and financial reporting services provided by State Street. Under the Services Agreement, the Fund reimburses Columbia for out-of-pocket expenses and charges, including fees payable to third parties, such as for pricing the Fund's portfolio securities, incurred by Columbia in the performance of services under the Services Agreement.
The Services Agreement will be terminated upon the Closing, and the services provided thereunder will be covered under the administrative services agreement with the New Advisor.
Transfer Agent Fee
Columbia Management Services, Inc. (the "Transfer Agent"), an affiliate of Columbia and an indirect, wholly owned subsidiary of BOA, provides shareholder services to the Fund and has contracted with Boston Financial Data Services ("BFDS") to serve as sub-transfer agent. Effective January 1, 2010, the Transfer Agent is entitled to receive a fee for its services, paid monthly, at the annual rate of $22.36 per account plus reimbursement of certain sub-transfer agent fees paid by the Transfer Agent (exclusive of BFDS fees), calculated based on assets held in omnibus accounts and intended to recover the cost of payments to other parties (including affiliates of BOA) for services to those accounts. Prior to January 1, 2010, the annual rate was $17.34 per account. The Transfer Agent pays the fees of BFDS for services as sub-transfer agent and is not entitled to reimbursement for such fees from the Fund.
The Transfer Agent may also retain, as additional compensation for its services, fees for wire, telephone and redemption orders, Individual Retirement Account ("IRA") trustee agent fees and account transcript fees due to the Transfer Agent from shareholders of the Fund and credits (net of bank charges) earned with respect to balances in accounts the Transfer Agent maintains in connection with its services to the Fund. The Transfer Agent also receives reimbursement for certain out-of-pocket expenses.
21
Columbia Overseas Value Fund, February 28, 2010
An annual minimum account balance fee of $20 may apply to certain accounts with a value below the Fund's initial minimum investment requirements to reduce the impact of small accounts on transfer agent fees. These minimum account balance fees are recorded as part of expense reductions on the Statement of Operations. For the year ended February 28, 2010, no minimum account balance fees were charged by the Fund.
RiverSource Service Corporation (the "New Transfer Agent"), a subsidiary of Ameriprise Financial, will become the transfer agent of the Fund upon the Closing. The New Transfer Agent expects to change its name to Columbia Management Investment Services Corp. upon or shortly after the Closing.
Underwriting Discounts, Service and Distribution Fees
Columbia Management Distributors, Inc. (the "Distributor"), an affiliate of Columbia and an indirect, wholly owned subsidiary of BOA, is the principal underwriter of the Fund's shares.
RiverSource Fund Distributors, Inc. (the "New Distributor"), a subsidiary of Ameriprise Financial, will become the distributor of the Fund upon the Closing. The New Distributor expects to change its name to Columbia Management Investment Distributors, Inc. upon or shortly after the Closing.
The Trust has adopted shareholder servicing plans ("Servicing Plans") for the Class A and Class C shares of the Fund and distribution plans ("Distribution Plans") for the Class C and Class R shares of the Fund. The shareholder servicing plans permit the Fund to compensate or reimburse servicing agents for the shareholder services they have provided. The distribution plans, adopted pursuant to Rule 12b-1 under the 1940 Act, permit the Fund to compensate or reimburse the Distributor and/or selling agents for activities or expenses primarily intended to result in the sale of the classes' shares. Payments are made at an annual rate and paid monthly, as a percentage of average daily net assets, set from time to time by the Board of Trustees, and are charged as expenses of the Fund directly to the applicable share class. A substantial portion of the expenses incurred pursuant to these plans is paid to affiliates of BOA and the Distrib utor.
The annual rates in effect and plan limits, as a percentage of average daily net assets are as follows:
| | | Current
Rate | | Plan Limit | |
Class A Shareholder
Servicing Plan | | | 0.25 | % | | | 0.25 | % | |
Class C Shareholder
Servicing Plan | | | 0.25 | % | | | 0.25 | % | |
| Class C Distribution Plan | | | 0.75 | % | | | 0.75 | % | |
| Class R Distribution Plan | | | 0.50 | % | | | 0.50 | % | |
Class A, Class C and Class R shares were not offered during the period.
Expense Limits and Fee Waivers
Columbia has voluntarily agreed to reimburse a portion of the Fund's expenses so that the Fund's ordinary operating expenses (excluding any distribution and service fees, brokerage commissions, interest, taxes and extraordinary expenses, but including custodian charges relating to overdrafts, if any), after giving effect to any balance credits from the Fund's custodian, do not exceed 1.15% annually of the Fund's average daily net assets. Columbia, in its discretion, may revise or discontinue this arrangement at any time.
Prior to May 1, 2009, Columbia and/or some of the Fund's other service providers voluntarily waived fees and/or reimbursed the Fund for certain expenses so that total expenses (excluding any distribution and service fees, brokerage commissions, interest, taxes and extraordinary expenses, but including custodian charges relating to overdrafts, if any), after giving effect to any balance credits from the Fund's custodian, did not exceed 1.10% annually of the Fund's average daily net assets.
Fees Paid to Officers and Trustees
All officers of the Fund are employees of Columbia or its affiliates and, with the exception of the Fund's Chief Compliance Officer, receive no compensation from the Fund. The Board of Trustees has appointed a Chief Compliance Officer to the Fund in accordance with federal securities regulations. The Fund, along with other affiliated funds, pays its pro-rata share of the expenses associated with the Chief Compliance Officer. The Fund's expenses for the Chief Compliance Officer will not exceed $15,000 per year.
22
Columbia Overseas Value Fund, February 28, 2010
Trustees are compensated for their services to the Fund, as set forth on the Statement of Operations. The Trust's eligible Trustees may participate in a non-qualified deferred compensation plan which may be terminated at any time. Any payments to plan participants are paid solely out of the Fund's assets. Income earned on the plan participant's deferral account is based on the rate of return of the eligible mutual funds selected by the participant or, if no funds are selected, on the rate of return of Columbia Treasury Reserves, another portfolio of the Trust. The expense for the deferred compensation plan, which includes trustees' fees deferred during the current period as well as any gains or losses on the trustees' deferred compensation balances as a result of market fluctuations, is included in "Trustees' fees" on the Statement of Operations. The liability for the deferred compensation plan is included in "Trustees' fees" on the Statement of Assets and Liabilities.
Note 5. Custody Credits
The Fund has an agreement with its custodian bank under which custody fees may be reduced by balance credits. These credits are recorded as part of expense reductions on the Statement of Operations. The Fund could have invested a portion of the assets utilized in connection with the expense offset arrangement in an income-producing asset if it had not entered into such an agreement.
Note 6. Objectives and Strategies for Investing in Derivative Instruments
The Fund uses derivatives instruments including futures contracts, options and forward foreign currency exchange contracts in order to meet its investment objectives. The Fund employs strategies in differing combinations to permit it to increase, decrease or change the level of exposure to market risk factors. The achievement of any strategy relating to derivatives depends on an analysis of various risk factors, and if the strategies for the use of derivatives do not work as intended, the Fund may not achieve its investment objectives.
In pursuit of its investment objectives, the Fund is exposed to the following market risks:
Equity Risk: Equity risk relates to change in value of equity securities such as common stocks due to general market conditions such as real or perceived adverse economic conditions, changes in the general outlook for corporate earnings, or adverse investor sentiment. Equity securities generally have greater price volatility than fixed income securities.
Foreign Exchange Rate Risk: Foreign exchange rate risk relates to the change in the U.S. dollar value of a security held that is denominated in a foreign currency. The U.S. dollar value of a foreign-currency-denominated security will decrease as the dollar appreciates against the currency, while the U.S. dollar value will increase as the dollar depreciates against the currency.
The following notes provide more detailed information about each derivative type held by the Fund:
Forward Foreign Currency Exchange Contracts—The Fund entered into forward foreign currency exchange contracts to shift its investment exposure from one currency to another.
The Fund used forward foreign currency exchange contracts to shift its U.S. dollar exposure in order to achieve a representative weighted mix of major currencies in its benchmark and/or to recover an underweight country exposure in its portfolio.
Forward foreign currency exchange contracts are agreements to exchange one currency for another at a future date at a specified price. These contracts are used to minimize the exposure to foreign exchange rate fluctuations during the period between the trade and settlement dates of the contract. The Fund may utilize forward foreign currency exchange contracts in connection with the settlement of purchases and sales of securities. The Fund may also enter into these contracts to reduce the exposure to adverse price movements in certain other foreign-currency-denominated assets. Contracts to buy generally are used to acquire exposure to foreign currencies, while contracts to sell are generally used to reduce the exposure to foreign exchange rate fluctuations. Forward foreign currency exchange contracts are valued daily at the current exchange rate of the underlying currency, resulting in unrealized gains (losses) which become reali zed at the time the forward foreign currency exchange contracts are closed or mature. Realized and unrealized gains (losses) arising from such transactions are included in net realized and unrealized gains (losses) on foreign currency transactions. The use of forward foreign currency exchange contracts does not eliminate fluctuations in the prices of the Fund's portfolio securities. While the maximum potential loss from such contracts is the aggregate face value in U.S. dollars at the time the contract was opened, exposure is typically limited to the change in value of the contract (in U.S. dollars)
23
Columbia Overseas Value Fund, February 28, 2010
over the period it remains open. The Fund could also be exposed to risk that counterparties of the contracts may be unable to fulfill the terms of the contracts.
During the year ended February 28, 2010, the Fund entered into 264 forward foreign currency exchange contracts.
Futures Contracts—The Fund entered into stock index futures contracts to manage its exposure to the securities markets.
The use of futures contracts involves certain risks, which include, among these: (1) imperfect correlation between the price movement of the instruments and the underlying securities, (2) inability to close out positions due to differing trading hours, or the temporary absence of a liquid market, for either the instruments or the underlying securities, and (3) an inaccurate prediction of the future direction of interest rates by Columbia.
Upon entering into a futures contract, the Fund identifies within its portfolio of investments cash or securities in an amount sufficient to meet the initial margin requirement. Subsequent payments are made or received by the Fund equal to the daily change in the contract value and are recorded as variation margin receivable or payable and offset in unrealized gains or losses. The Fund recognizes a realized gain or loss when the contract is closed or expires.
Futures contracts involve, to varying degrees, risk of loss in excess of the variation margin disclosed on the Statement of Assets and Liabilities.
During the year ended February 28, 2010, the Fund entered into 1 futures contract. The Fund did not have any open futures contracts at the end of the year.
Options—The Fund has written covered call and purchased put options to decrease the Fund's exposure to equity risk and to increase return on instruments. Written covered call and purchased put options become more profitable as the price of the underlying instruments depreciates relative to the strike price.
Writing put options tends to increase the Fund's exposure to the underlying instrument. When the Fund writes a call or put option, an amount equal to the premium received is recorded as a liability and subsequently marked-to-market to reflect the current value of the option written. Premiums received from writing options which expire are treated as realized gains. Premiums received from writing options which are exercised or closed are added to the proceeds or offset against the amounts paid on the underlying security transaction to determine the realized gain or loss. The Fund, as a writer of an option, has no control over whether the underlying security may be sold (call) or purchased (put) and as a result bears the market risk of an unfavorable change in the price of the security underlying the written option. There is the risk that the Fund may not be able to enter into a closing transaction because of an illiquid market. Th e Fund identifies within its portfolio of investments cash or liquid portfolio securities equal to the amount of the written options contract commitment.
The Fund may also purchase put and call options. Purchasing call options tends to increase the Fund's exposure to the underlying instrument. Purchasing put options tends to decrease the Fund's exposure to the underlying instrument. The Fund may pay a premium, which is included in the Fund's Statement of Assets and Liabilities as an investment and subsequently marked-to-market to reflect the current value of the option. The risk associated with purchasing put and call options is limited to the premium paid. Premiums paid for purchasing options which expire are treated as realized losses. Premiums paid for purchasing options which are exercised are added to the amounts paid (call) or offset against the proceeds (put) on the underlying security to determine the realized gain or loss. If the Fund enters into a closing transaction, the Fund will realize a gain or loss, depending on whether the proceeds from the closing transaction ar e greater or less than the cost of the option.
During the year ended February 28, 2010, the Fund entered into 90 written option contracts.
The following table is a summary of the value of the Fund's derivative instruments as of February 28, 2010.
| Fair Value of Derivative Instruments | |
| | | Statement of Assets and Liabilities | |
| | | Asset | | Fair Value | | Liability | | Fair Value | |
| Written call options | | | — | | | $ | — | | | Written options, at value | | $ | 81 | | |
| Forward foreign currency exchange contracts | | Unrealized appreciation | | | 17,288 | | | Unrealized depreciation | | | 61,980 | | |
24
Columbia Overseas Value Fund, February 28, 2010
The effect of derivative instruments on the Fund's Statement of Operations for the year ended February 28, 2010:
| | | Amount of Realized Gain or (Loss)
and Change in Unrealized Appreciation or
(Depreciation) on Derivatives Recognized in Income | |
| | | Risk Exposure | | Net Realized
Gain (Loss) | | Change in
Unrealized
Appreciation
(Depreciation) | |
| Written call options | | Equity | | $ | 1,949 | | | $ | 111 | | |
| Forward foreign currency exchange contracts | | Foreign Exchange Rate | | | 72,662 | | | | (35,950 | ) | |
| Futures contracts | | Equity | | | 7,611 | | | | — | | |
Note 7. Portfolio Information
For the year ended February 28, 2010, the cost of purchases and proceeds from sales of securities, excluding short-term obligations, for the Fund were $4,459,420 and $4,320,382, respectively.
Note 8. Redemption Fees
The Fund may impose a 2.00% redemption fee on the proceeds of fund shares that are redeemed within 60 days of purchase. The redemption fee is designed to offset brokerage commissions and other costs associated with short term trading of fund shares. The redemption fees, which are retained by the Fund, are accounted for as an addition to paid-in capital and are allocated to each class based on the relative net assets at the time of the redemption. Effective March 1, 2010, the Fund will no longer assess the 2.00% redemption fee on the proceeds from Fund shares that are redeemed within 60 days of purchase. For the year ended February 28, 2010, the Fund received no redemption fees.
Note 9. Line of Credit
The Fund and other affiliated funds participate in a $280,000,000 committed, unsecured revolving line of credit provided by State Street. The maximum amount that may be borrowed by any fund is limited to the lesser of $200,000,000 and the Fund's borrowing limit set forth in the Fund's registration statement. Borrowings are available for short-term liquidity or temporary or emergency purposes.
Effective October 15, 2009, interest is charged to each participating fund based on the fund's borrowings at a rate per annum equal to the greater of the Federal Funds Rate plus 1.25% or the overnight LIBOR Rate plus 1.25%. In addition, a commitment fee of 0.15% per annum is accrued and apportioned among the participating funds pro rata based on their relative net assets.
Prior to October 15, 2009, interest was charged to each participating fund based on the fund's borrowings at a rate per annum equal to the greater of the Federal Funds Rate plus 0.50% or the overnight LIBOR Rate plus 0.50%. In addition, an annual operations agency fee of $20,000, an amendment fee of 0.02% and a commitment fee of 0.12% per annum were accrued and apportioned among the participating funds pro rata based on their relative net assets.
For the year ended February 28, 2010, the Fund did not borrow under these arrangements.
Note 10. Shares of Beneficial Interest
As of February 28, 2010, one shareholder (which is an affiliate of BOA) held 100% of the Fund's shares outstanding.
Subscription and redemption activity of this account may have a significant effect on the operations of the Fund.
Note 11. Significant Risks and Contingencies
Foreign Securities Risk
There are certain additional risks involved when investing in foreign securities. These risks may involve foreign currency
25
Columbia Overseas Value Fund, February 28, 2010
exchange rate fluctuations, adverse political and economic developments and the possible prevention of currency exchange or other foreign governmental laws or restrictions. In addition, the liquidity of foreign securities may be more limited than that of domestic securities.
Investments in emerging market countries are subject to additional risk. The risk of foreign investments is typically increased in less developed countries. These countries are also more likely to experience high levels of inflation, deflation or currency devaluation which could hurt their economies and securities markets.
Legal Proceedings
Columbia Management Advisors, LLC and Columbia Management Distributors, Inc. (collectively, the "Columbia Group") are subject to a settlement agreement with the New York Attorney General ("NYAG") (the "NYAG Settlement") and a settlement order with the Securities and Exchange Commission ("SEC") (the "SEC Order") on matters relating to mutual fund trading, each dated February 9, 2005. Under the terms of the SEC Order, the Columbia Group (or predecessor or affiliated entities) agreed, among other things, to: pay disgorgement and civil money penalties collectively totaling $375 million; cease and desist from violations of the antifraud provisions and certain other provisions of the federal securities laws; maintain certain compliance and ethics oversight structures; and retain an independent consultant to review the Columbia Group's applicable supervisory, compliance, control and other policies and procedures. The NYAG Settlement, a mong other things, requires Columbia Management Advisors, LLC and its affiliates to make certain disclosures to investors relating to expenses. In connection with the Columbia Group providing services to the Columbia Funds, the Columbia Funds have voluntarily undertaken to implement certain governance measures designed to maintain the independence of their boards of trustees and certain special consulting and compliance measures.
Pursuant to the SEC Order and related procedures, the $375 million in settlement amounts described above, of which approximately $90 million has been earmarked for certain Columbia Funds and their shareholders, is being distributed in accordance with a distribution plan developed by an independent distribution consultant and approved by the SEC on December 27, 2007. Distributions under the distribution plan began in mid-June 2008 and the distribution earmarked for the Columbia Funds and their shareholders has been substantially completed.
Civil Litigation
In connection with the events that resulted in the NYAG Settlement and SEC Order, various parties filed suits against Bank of America Corporation and certain of its affiliates, including Banc of America Capital Management, LLC ("BACAP," now known as Columbia Management Advisors, LLC) and BACAP Distributors, LLC (now known as Columbia Management Distributors, Inc.) (collectively "BAC"), Nations Funds Trust (now known as Columbia Funds Series Trust) and its Board of Trustees. On February 20, 2004, the Judicial Panel on Multidistrict Litigation transferred these cases and cases against other mutual fund companies based on similar allegations to the United States District Court in Maryland for consolidated or coordinated pretrial proceedings (the "MDL"). Subsequently, additional related cases were transferred to the MDL. On September 29, 2004, the plaintiffs in the MDL filed amended and consolidated complaints. One of these amended complaints is a putative class action that includes claims under the federal securities laws and state common law, and that names Nations Funds Trust, the Trustees, BAC and others as defendants. Another of the amended complaints is a derivative action purportedly on behalf of the Nations Funds Trust against BAC and others that asserts claims under federal securities laws and state common law. Nations Funds Trust is a nominal defendant in this action.
On February 25, 2005, BAC and other defendants filed motions to dismiss the claims in the pending cases. On December 15, 2005, BAC and others entered into a Stipulation of Settlement of the direct and derivative claims brought on behalf of the Nations Funds shareholders. The settlement is subject to court approval. If the settlement is approved, BAC would pay settlement administration costs and fees to plaintiffs' counsel as approved by the court. The stipulation has not yet been presented to the court for approval.
Note 12. Subsequent Events
In connection with the preparation of the financial statements of the Fund as of and for the fiscal year ended February 28, 2010, events and transactions through the date the financial statements were issued have been evaluated by the Fund's
26
Columbia Overseas Value Fund, February 28, 2010
management for possible adjustment and/or disclosure. No subsequent events or transactions had occurred that would require adjustment of the financial statements as presented. On March 3, 2010, the Fund's shareholders approved, among other matters, a proposed investment management services agreement with the New Advisor, the effectiveness of which is conditioned on the Closing.
27
Report of Independent Registered Public Accounting Firm
To the Trustees of Columbia Funds Series Trust and the Shareholders of Columbia Overseas Value Fund
In our opinion, the accompanying statement of assets and liabilities, including the investment portfolio, and the related statements of operations and of changes in net assets and the financial highlights present fairly, in all material respects, the financial position of Columbia Overseas Value Fund (the "Fund") (a series of Columbia Funds Series Trust) at February 28, 2010, the results of its operations for the year then ended, and the changes in its net assets and the financial highlights for the year ended February 28, 2010 and the period March 31, 2008 (commencement of operations) through February 28, 2009 in conformity with accounting principles generally accepted in the United States of America. These financial statements and financial highlights (hereafter referred to as "financial statements") are the responsibility of the Fund's management. Our responsibility is to express an opinion on these financial statements based on our audits. We conducted our audits of these financial statements in accordance with the standards of the Public Company Accounting Oversight Board (United States). Those standards require that we plan and perform the audit to obtain reasonable assurance about whether the financial statements are free of material misstatement. An audit includes examining, on a test basis, evidence supporting the amounts and disclosures in the financial statements, assessing the accounting principles used and significant estimates made by management, and evaluating the overall financial statement presentation. We believe that our audits, which included confirmation of securities at February 28, 2010 by correspondence with the custodian and brokers, provide a reasonable basis for our opinion.
PricewaterhouseCoopers LLP
Boston, Massachusetts
April 21, 2010
28
Federal Income Tax Information (Unaudited)
Foreign taxes paid during the fiscal year ended February 28, 2010, of $23,212 are being passed through to shareholders. This represents $0.02 per share. Eligible shareholders may claim this amount as a foreign tax credit.
Gross income derived from sources within foreign countries was $275,962 ($0.25 per share) for the fiscal year ended February 28, 2010.
For non-corporate shareholders 77.11% or the maximum amount allowable under the Jobs and Growth Tax Relief Reconciliation Act of 2003, of the ordinary income distributed by the Fund for the fiscal year February 28, 2010 may represent qualified dividend income.
The Fund will notify shareholders in January 2011 of amounts for use in preparing 2010 income tax returns.
29
Fund Governance
The Trustees serve terms of indefinite duration. The names, addresses and ages of the Trustees and officers of the Funds of Columbia Funds Series Trust, the year each was first elected or appointed to office, their principal business occupations during at least the last five years, the number of Funds overseen by each Trustee and other directorships they hold are shown below. Each officer listed below serves as an officer of each Fund in the Columbia Funds Complex.
Independent Trustees
Name, Address and Year of Birth,
Position with Funds, Year First
Elected or Appointed to Office | | Principal Occupation(s) During Past Five Years, Number of Funds in the Columbia Funds
Complex Overseen by Trustee, Other Directorships Held | |
| Edward J. Boudreau (Born 1944) | |
|
c/o Columbia Management
Advisors, LLC
One Financial Center
Boston, MA 02111
Trustee (since 2005) | | Managing Director—E.J. Boudreau & Associates (consulting), from 2000 through current; oversees 64; no other directorships held. | |
|
| William P. Carmichael (Born 1943) | |
|
c/o Columbia Management
Advisors, LLC
One Financial Center
Boston, MA 02111
Trustee (since 1999) | | Retired. Oversees 64; Director—Cobra Electronics Corporation (electronic equipment manufacturer); Director—The Finish Line (sportswear). | |
|
| William A. Hawkins (Born 1942) | |
|
c/o Columbia Management
Advisors, LLC
One Financial Center
Boston, MA 02111
Trustee (since 2005) | | President and Chief Executive Officer—California General Bank, N.A., from January 2008 through current; oversees 64; no other directorships held. | |
|
| R. Glenn Hilliard (Born 1943) | |
|
c/o Columbia Management
Advisors, LLC
One Financial Center
Boston, MA 02111
Trustee (since 2005) | | Chairman and Chief Executive Officer—Hilliard Group LLC (investing and consulting), from April 2003 through current; Non-Executive Director & Chairman—Conseco, Inc. (insurance), September 2003 through current; Executive Chairman—Conseco, Inc. (insurance), August 2004 through September 2005; oversees 64; Director—Conseco, Inc. (insurance). | |
|
| John J. Nagorniak (Born 1944) | |
|
c/o Columbia Management
Advisors, LLC
One Financial Center
Boston, MA 02111
Trustee (since 2008) | | Retired. President and Director—Foxstone Financial, Inc. (consulting), 2000 through December 2007; Director—Mellon Financial Corporation affiliates (investing), 2000 through 2007; Chairman—Franklin Portfolio Associates (investing—Mellon affiliate), 1982 through 2007; oversees 64; Director—MIT Investment Company; Trustee—MIT 401k Plan; Trustee and Chairman—Research Foundation of CFA Institute. | |
|
30
Fund Governance (continued)
Independent Trustees (continued)
Name, Address and Year of Birth,
Position with Funds, Year First
Elected or Appointed to Office | | Principal Occupation(s) During Past Five Years, Number of Funds in the Columbia Funds
Complex Overseen by Trustee, Other Directorships Held | |
| Minor M. Shaw (Born 1947) | |
|
c/o Columbia Management
Advisors, LLC
One Financial Center
Boston, MA 02111
Trustee (since 2003) | | President—Micco Corporation and Mickel Investment Group; oversees 64; Board Member—Piedmont Natural Gas. | |
|
Interested Trustee
| Anthony M. Santomero1 (Born 1946) | |
|
c/o Columbia Management
Advisors, LLC
One Financial Center
Boston, MA 02111
Trustee (since 2008) | | Richard K. Mellon Professor Emeritus of Finance, The Wharton School, University of Pennsylvania, from 1972 through current; Senior Advisor—McKinsey & Company (consulting), July 2006 through January 2008; President and Chief Executive Officer—Federal Reserve Bank of Philadelphia, July 2000 through April 2006; oversees 64; Director—Renaissance Reinsurance Ltd; Director—Penn Mutual Life Insurance Company; Director—Citigroup. | |
|
1 The Columbia Funds currently treat Mr. Santomero as an "interested person" (as defined in the 1940 Act) of the Funds because he serves as a Director of Citigroup, Inc. and Citibank, N.A. Citigroup, Inc., through its subsidiaries and affiliates, including Citibank, N.A., may engage from time-to-time in brokerage execution, principal transactions and/or lending relationships with the Columbia Funds or other funds or accounts advised/managed by the Advisor and/or any sub-advisor.
The Statement of Additional Information includes additional information about the Trustees of the Funds and is available, without charge, upon request by calling 800-426-3750.
Officers
Name, Address and Year of Birth,
Position with Columbia Funds,
Year First Elected or
Appointed to Office | | Principal Occupation(s) During Past Five Years
| |
| J. Kevin Connaughton (Born 1964) | |
|
One Financial Center
Boston, MA 02111
President (since 2009) | | Managing Director of Columbia Management Advisors, LLC since December 2004; Senior Vice President and Chief Financial Officer—Columbia Funds, from June 2008 to January 2009; Treasurer—Columbia Funds, from October 2003 to May 2008; Treasurer—the Liberty Funds, Stein Roe Funds and Liberty All-Star Funds, December 2000—December 2006; Senior Vice President—Columbia Management Advisors, LLC, from April 2003 to December 2004; President—Columbia Funds, Liberty Funds and Stein Roe Funds, February 2004 to October 2004; Treasurer—Galaxy Funds, September 2002 to December 2005; Treasurer, December 2002 to December 2004, and President, February 2004 to December 2004—Columbia Management Multi-Strategy Hedge Fund, LLC; and a senior officer of various other Bank of America-affiliated entities, including other registered and unregistered funds | |
|
31
Fund Governance (continued)
Officers (continued)
Name, Address and Year of Birth,
Position with Columbia Funds,
Year First Elected or
Appointed to Office | | Principal Occupation(s) During Past Five Years
| |
| James R. Bordewick, Jr. (Born 1959) | |
|
One Financial Center
Boston, MA 02111
Senior Vice President, Secretary and Chief Legal Officer (since 2006) | | Associate General Counsel, Bank of America since April 2005; Senior Vice President and Associate General Counsel, MFS Investment Management (investment management) prior to April 2005. | |
|
| Linda J. Wondrack (Born 1964) | |
|
One Financial Center
Boston, MA 02111
Senior Vice President and
Chief Compliance Officer (since 2007) | | Director (Columbia Management Group LLC and Investment Product Group Compliance), Bank of America since June 2005; Director of Corporate Compliance and Conflicts Officer, MFS Investment Management (investment management), August 2004 to May 2005; Managing Director, Deutsche Asset Management (investment management) prior to August 2004. | |
|
| Michael G. Clarke (Born 1969) | |
|
One Financial Center
Boston, MA 02111
Senior Vice President and
Chief Financial Officer (since 2009) | | Director of Fund Administration of the Advisor since January 2006; Managing Director of the Advisor September 2004 to December 2005; Vice President Fund Administration June 2002 to September 2004. | |
|
| Jeffrey R. Coleman (Born 1969) | |
|
One Financial Center
Boston, MA 02111
Treasurer (since 2008) | | Director of Fund Administration of the Advisor since January 2006; Fund Controller of the Advisor from October 2004 to January 2006; Vice President of CDC IXIS Asset Management Services, Inc. (investment management) from August 2000 to September 2004. | |
|
| Joseph F. DiMaria (Born 1968) | |
|
One Financial Center
Boston, MA 02111
Chief Accounting Officer (since 2008) | | Director of Fund Administration of the Advisor since January 2006; Head of Tax/Compliance and Assistant Treasurer of the Advisor from November 2004 to December 2005; Director of Trustee Administration (Sarbanes-Oxley) of the Advisor from May 2003 to October 2004. | |
|
| Julian Quero (Born 1967) | |
|
One Financial Center
Boston, MA 02111
Deputy Treasurer (since 2008) | | Senior Tax Manager of the Advisor since August 2006; Senior Compliance Manager of the Advisor from April 2002 to August 2006. | |
|
| Barry S. Vallan (Born 1969) | |
|
One Financial Center
Boston, MA 02111
Controller (since 2006) | | Vice President—Fund Treasury of the Advisor since October 2004; Vice President—Trustee Reporting of the Advisor from April 2002 to October 2004. | |
|
| Stephen T. Welsh (Born 1957) | |
|
One Financial Center
Boston, MA 02111
Vice President (since 1996) | | President, Columbia Management Services, Inc. since July 2004; Senior Vice President and Controller, Columbia Management Services, Inc. prior to July 2004. | |
|
32
Board Consideration and Re-Approval of Current Investment Advisory Agreement
Even though the following description of the Board's consideration of investment advisory and, as applicable, sub-advisory agreements covers multiple funds, for purposes of this shareholder report, the description is only relevant as to the Fund.
The Board of Trustees of Columbia Funds Series Trust (the "Board"), including a majority of the Trustees who have no direct or indirect interest in the investment advisory and sub-advisory agreements and are not "interested persons" of the Trust, as defined in the Investment Company Act of 1940 (the "1940 Act") (the "Independent Trustees"), are required annually to review and re-approve the existing investment advisory and sub-advisory agreements and approve any newly proposed terms therein. In this regard, the Board reviewed and re-approved, during the most recent six months covered by this report, (i) investment advisory agreements with Columbia Management Advisors, LLC ("CMA" or the "Adviser") for Columbia Convertible Securities Fund, Columbia Large Cap Value Fund, Columbia Mid Cap Value Fund, Columbia Small Cap Value Fund II, Columbia Marsico Growth Fund, Columbia Large Cap Core Fund, Columbia Marsico Focused Equities Fund, Columbia Marsico 21st Century Fund and Columbia Small Cap Growth Fund II; and (ii) investment sub-advisory agreements with Marsico Capital Management, LLC ("Marsico Capital" or the "Sub-Adviser") for Columbia Marsico Focused Equities Fund, Columbia Marsico 21st Century Fund and Columbia Marsico Growth Fund (the "Sub-Advised Funds"). The investment advisory agreements with CMA and the investment sub-advisory agreements with Marsico Capital are each referred to as an "Advisory Agreement" and collectively referred to as the "Advisory Agreements." The funds identified above are each referred to as a "Fund" and collectively referred to as the "Funds."
More specifically, at meetings held on November 5-6, 2009, the Board, including the Independent Trustees advised by their independent legal counsel, considered the factors and reached the conclusions described below relating to the selection of CMA and the Sub-Adviser and the re-approval of the Advisory Agreements. The Board also reviewed and considered a report prepared and provided by the Independent Fee Consultant (the "Fee Consultant") appointed by the Independent Trustees pursuant to an assurance of discontinuance entered into with the New York Attorney General ("NYAG") to settle a civil complaint filed by the NYAG relating to trading in mutual fund shares (the "NYAG Settlement"). The Fee Consultant's role was to manage the process by which management fees are negotiated so that they were negotiated in a manner that is at arms' length and reasonable. The Fee Consultant found that the fee negotiation process was, to the exte nt practicable, at arms' length and reasonable and consistent with the requirements of the NYAG Settlement. A summary of the Fee Consultant's report is available at http://www.columbiafunds.com.
In preparation for the November meetings, the Board met in August for review and discussion of the materials described below. The Investment Committee of the Board also met in June to discuss each Fund's performance with its respective portfolio manager(s). In addition to these meetings, the Investment Committee receives and discusses performance reports at its quarterly meetings. The Contracts Review Committee of the Board also provided support in managing and coordinating the process by which the Board reviewed the Advisory Agreements. The Board's review and conclusions are based on the comprehensive consideration of all information presented to it and are not the result of any single controlling factor. The Board evaluated all information available to it on a Fund-by-Fund basis, and its determinations were made separately in respect of each Fund.
Nature, Extent and Quality of Services. The Board received and considered various data and information regarding the nature, extent and quality of services provided to the Funds by CMA and the Sub-Adviser under the Advisory Agreements. The most recent investment adviser registration forms for CMA and the Sub-Adviser were made available to the Board, as were CMA's and the Sub-Adviser's responses to a detailed series of requests submitted by the Independent Trustees' independent legal counsel on behalf of such Trustees. The Board reviewed and analyzed those materials, which included, among other things, information about the background and experience of senior management and investment personnel of CMA and the Sub-Adviser.
In addition, the Board considered the investment and legal compliance programs of the Funds, CMA and the Sub-Adviser, including their compliance policies and procedures and reports of the Funds' Chief Compliance Officer.
The Board evaluated the ability of CMA and the Sub-Adviser, based on their resources, reputation and other attributes, to
33
attract and retain qualified investment professionals, including research, advisory and supervisory personnel. In this regard, the Board considered information regarding the nature of CMA's compensation structure applicable to portfolio managers and other key investment personnel.
Based on the above factors, together with those referenced below, the Board concluded that it was satisfied with the nature, extent and quality of the investment advisory services provided to each of the Funds by CMA and the Sub-Adviser.
The Board noted that Bank of America, N.A., the parent company of the Adviser, had entered into an agreement to sell a portion of the asset management business of the Adviser to Ameriprise Financial, Inc. (the "Transaction"). The Board noted that the Transaction was expected to close in the spring of 2010 and that its review of the Advisory Agreements was separate and distinct from any analysis regarding new advisory or sub-advisory arrangements that may result from the closing of the Transaction.
Investment Advisory and Sub-Advisory Fee Rates and Other Expenses. The Board reviewed and considered the proposed contractual investment advisory fee rates both separately and together with the administration fee rates payable by the Funds to CMA for investment advisory services (the "Contractual Management Rates"). The Board also reviewed and considered the proposed contractual investment sub-advisory fee rates (the "Sub-Advisory Agreement Rates") payable by CMA to the Sub-Adviser for investment sub-advisory services. In addition, the Board reviewed and considered the proposed fee waiver/cap arrangements applicable to the Contractual Management Rates and considered the Contractual Management Rates after taking the waivers/caps into account (the "Actual Management Rates"). The Board noted that, on a complex-wide basis, CMA had reduced annual managemen t fees by at least $32 million per year pursuant to the NYAG Settlement. The Board also noted reductions in net advisory rates and/or total expenses of certain funds across the fund complex. Additionally, the Board received and afforded specific attention to information comparing the Contractual Management Rates and Actual Management Rates with those of the other funds in their respective Peer Groups (as defined below).
The Board reviewed and considered statistical information regarding each Fund's total expense ratio and its various components, including contractual advisory fees, actual advisory fees, actual non-management fees, Rule 12b-1 and non-Rule 12b-1 service fees, fee waivers/caps and/or expense reimbursements. The Board also reviewed comparisons of these fees to the expense information for the group of Funds determined by Lipper Inc. ("Lipper") to be most similar to a given Fund (the "Peer Group") and to the performance of a broader universe of relevant funds as determined by Lipper (the "Universe"), which comparative data was provided by Lipper, an independent provider of investment company data. The Board was provided with a description of the methodology used by Lipper to select the mutual funds in each Fund's Peer Group and Universe and considered potential imprecision resulting from the selection methodology. For certain Funds, Lipper determined that the composition of the Peer Group and/or Universe for expenses would differ from the composition for performance to provide a more accurate basis of comparison. The Board also considered Lipper data that ranked each Fund based on: (i) each Fund's one- and three-year performance compared to actual management fees; and (ii) each Fund's one- and three-year performance compared to total expenses.
The Board concluded that the factors noted above supported the Contractual Management Rates and the Actual Management Rates, and the approval of the Advisory Agreements for all of the Funds.
With regard to the Sub-Advised Funds, the Board also reviewed the Sub-Advisory Agreement Rates, including comparative fee information provided by the Adviser and the Adviser's recommendation that the Board re-approve the Advisory Agreements with Marsico Capital. The Board also considered a breakpoint fee schedule charged by Marsico Capital for the Sub-Advised Funds, as well as a corresponding waiver of Contractual Management Rates, both of which were implemented on January 1, 2008. The Board concluded that the Sub-Advisory Agreement Rates are fair and equitable, based on its consideration of the factors described above.
The Fund-by-Fund discussion set forth below in "Fund-Specific Considerations for Certain Review Funds" provides additional information regarding those Funds highlighted as meeting agreed-upon criteria for warranting further review. Such criteria included, among other things, information relating to Actual Management Rates, total expense ratios and/or performance information, relative to a Fund's Peer Group and/or Universe.
34
Fund Performance. The Board considered the performance results for each of the Funds over multiple measurement periods. It also considered these results in comparison to the performance results of each Fund's Peer Group and Universe, as well as to each Fund's benchmark index. The Board also considered certain risk-adjusted performance data.
The Fund-by-Fund discussion set forth below in "Fund-Specific Considerations for Certain Review Funds" provides additional information regarding those Funds highlighted as meeting agreed-upon criteria for warranting further review. Such criteria included, among other things, information relating to Actual Management Rates, total expense ratios and/or performance information, relative to a Fund's Peer Group and/or Universe.
Profitability. The Board received and considered a detailed profitability analysis of CMA based on the Contractual Management Rates and the Actual Management Rates, as well as on other relationships between the Funds and other funds in the complex on the one hand and CMA affiliates on the other. The analysis included complex-wide and per-Fund information and a comparison of results using alternative allocation methodologies. The Board concluded that, in light of the costs of providing investment management and other services, the profits and other ancillary benefits that CMA and its affiliates received from providing these services were not unreasonable.
Economies of Scale. The Board received and considered information regarding whether there have been economies of scale with respect to the management of the Funds, whether the Funds have appropriately benefited from any economies of scale and whether there is potential for realization of any further economies of scale. Most particularly, CMA provided information showing that, as a percentage of fund assets, CMA's complex-wide revenues declined over a five-year period during which fund assets increased by 53% and the shareholder benefit over a four-year period has remained steady at approximately 33% of the Adviser's total profits. The Board concluded that any potential economies of scale are shared fairly with Fund shareholders, most particularly through breakpoints and fee waiver arrangements.
The Board acknowledged the inherent limitations of any analysis of an investment adviser's economies of scale, stemming largely from the Board's understanding that economies of scale are generally realized, if at all, by an investment adviser across a variety of products and services, not just with respect to a single fund.
Information About Services to Other Clients. The Board also received and considered information about the nature and extent of services and fee rates offered by CMA and the Sub-Adviser to their other clients, including separate accounts and institutional investors. In this regard, the Board concluded that, where the Contractual Management Rates, Sub-Advisory Agreement Rates and Actual Management Rates were appreciably above the range of the fee rates offered to other CMA and Sub-Adviser clients, based on information provided by CMA and the Sub-Adviser, the costs associated with managing and operating a registered investment company provided a justification for the higher fee rates charged to the Funds.
Other Benefits to CMA and the Sub-Adviser. The Board received and considered information regarding any "fall-out" or ancillary benefits received by CMA and its affiliates and the Sub-Adviser as a result of their relationship with the Funds. Such benefits could include, among others, benefits attributable to CMA's and the Sub-Adviser's relationships with the Funds (such as soft-dollar credits) and benefits potentially derived from an increase in CMA's and the Sub-Adviser's business as a result of their relationship with the Funds (such as the ability to market to shareholders other financial products offered by CMA and its affiliates or a Sub-Adviser).
The Board considered the effectiveness of the policies of the Funds in achieving the best execution of portfolio transactions, whether and to what extent soft dollar credits are sought and how any such credits are utilized, any benefits that may be realized by using an affiliated broker, the extent to which efforts are made to recapture transaction costs, and the controls applicable to brokerage allocation procedures. The Board also reviewed CMA's and the Sub-Adviser's methods for allocating portfolio investment opportunities among the Funds and other clients. The Board concluded that the benefits were not unreasonable.
Other Factors and Broader Review. As discussed above, the Board reviews materials received from CMA and the Sub-Adviser annually as part of the re-approval process under Section 15(c) of the 1940 Act. The Board also reviews and assesses the quality of the services the Funds receives
35
throughout the year. In this regard, the Board and its Committees review reports of CMA and the Sub-Adviser at each of its quarterly meetings, which include, among other things, Fund performance reports and presentations relating to such reports. In addition, the Board and its Committees confer with portfolio managers at various times throughout the year including, most particularly, at the June Investment Committee meeting.
Fund-Specific Considerations for Certain "Review" Funds. For certain Funds highlighted as meeting agreed-upon criteria for warranting further review, the Board engaged in further analysis with regard to approval of the Funds' Advisory Agreements. Such criteria included, among other things, information relating to Actual Management Rates, total expense ratios, and/or performance information relative to a Fund's Peer Group and/or Universe. Columbia Overseas Value Fund was not highlighted as a review fund.
Conclusion. After an evaluation of the above-described factors, and based on its deliberations and analysis of the information provided and alternatives considered, the Board, including all of the Independent Trustees, concluded that the compensation payable to CMA and the Sub-Adviser under the Advisory Agreements is fair and equitable. Accordingly, the Board unanimously re-approved the Advisory Agreements.
36
Board Consideration and Approval of Proposed Investment Advisory Agreement
Even though the following description of the Board's consideration of investment advisory and, as applicable, sub-advisory agreements covers multiple funds and trusts, for purposes of this shareholder report, the description is only relevant as to the Fund.
At a meeting held on December 21, 2009, the Boards of Trustees (the "Boards") of Columbia Funds Series Trust, Columbia Funds Master Investment Trust, LLC and Columbia Funds Series Trust II (each a "Trust" and collectively the "Trusts") unanimously approved a new investment management services agreement with RiverSource Investments, LLC ("RiverSource") (the "Proposed Advisory Agreement") and new subadvisory agreements with Marsico Capital Management ("Marsico Capital"), MacKay Shields LLC ("Mackay Shields") and Brandes Investment Partners, L.P. ("Brandes") (each a "Proposed Subadvisory Agreement"), as applicable, for each Fund of the Trusts (each a "Fund" and collectively the "Funds"). As detailed below, the Trustees met on multiple occasions in advance of the December 21, 2009 meeting, held numerous discussions with the management teams of Columbia Management Advisors, LLC ("Columbia") and RiverSource, a subsidiary of Ameriprise Financial, Inc. ("Ameriprise") and reviewed and considered extensive materials in connection with the approval of the Proposed Advisory and Subadvisory Agreements.
Specifically, the Trustees of each Trust, including a majority of the Trustees who have no direct or indirect interest in the Proposed Advisory and Subadvisory Agreements and are not "interested persons" of the Trusts, as defined in the Investment Company Act of 1940, as amended (the "1940 Act") (the "Independent Trustees") reviewed and approved (i) the Proposed Advisory Agreement with RiverSource for each Fund and (ii) the Proposed Subadvisory Agreement for those Funds that currently have investment subadvisory agreements with Marsico Capital, Mackay Shields, and Brandes (the "Subadvised Funds") (Marsico Capital, MacKay Shields and Brandes are collectively referred to as the "Subadvisers"). Prior to approving the Proposed Advisory Agreements, the Trustees were presented with, and requested, received and evaluated, extensive materials about RiverSource, the sale of a portion of the asset management business of Columbia Managemen t Group, LLC to Ameriprise (the "Transaction") and related matters from RiverSource, Ameriprise and Columbia. In this regard, the Trustees reviewed RiverSource's responses to a series of detailed requests submitted by the Independent Trustees' independent legal counsel and by the Independent Fee Consultant (as defined below).
The Trustees also reviewed and considered information received in connection with their most recent consideration and reapproval in November 2009 of the current advisory agreement (the "Current Advisory Agreement") and current subadvisory agreement (the "Current Subadvisory Agreement"), as applicable, for each Fund, including information about the Subadvisers (the "Current Agreement Re-Approval Process"). Moreover, the Trustees and committees of the Boards met on several occasions, and received extensive materials, throughout the course of the year relating to the Current Agreement Re-Approval Process, which the Trustees considered relevant to their consideration and approval of the Proposed Advisory and Subadvisory Agreements. The Trustees also consulted with Fund counsel and with the Independent Trustees' independent legal counsel, who advised on the legal standards for consideration by the Trustees, and otherwise assisted the Trustees in their deliberations.
In advance of the meeting on December 21, 2009, the Trustees held several meetings, including meetings held in-person with representatives from RiverSource and Ameriprise on August 26, 2009, November 5-6, 2009, December 9-10, 2009 and December 14, 2009, and additional meetings with representatives of Columbia, to discuss the Transaction, RiverSource's plans and intentions regarding the Funds and various proposals that were being presented as a result of the Transaction, including the Proposed Advisory and Subadvisory Agreements. In addition to these meetings, telephonic meetings and discussions were held on several occasions between individual Trustees, members of the committees of the Boards, their independent legal counsel and representatives from RiverSource, Ameriprise and/or Columbia.
The Trustees also reviewed and considered a report prepared and provided by the Fee Consultant (the "Fee Consultant") appointed by the Independent Trustees pursuant to an assurance of discontinuance entered into by a predecessor to Columbia with the New York Attorney General ("NYAG") to settle a civil complaint filed by the NYAG relating to trading in mutual fund shares (the "NYAG Settlement"). The Fee Consultant's role was to manage the process by which management fees are negotiated so that they were negotiated
37
in a manner that is at arms' length and reasonable. The Fee Consultant found that the fee negotiation process was, to the extent practicable, at arms' length and reasonable and consistent with the requirements of the NYAG Settlement. A summary of the Fee Consultant's report is available at www.columbiafunds.com.
The following summarizes a number of the material factors considered by the Trustees in reaching their approvals and determinations with respect to the Proposed Advisory Agreements and Proposed Subadvisory Agreements. It is followed by a more detailed discussion of the Trustees' consideration of these and other factors considered relevant by the Trustees in their evaluation of the Proposed Advisory Agreements and Proposed Subadvisory Agreements. In voting to approve the Proposed Advisory and Subadvisory Agreements for each Fund, the Trustees also considered substantially the same factors, as relevant, and reached substantially the same conclusions in their approval of interim advisory and subadvisory agreements for each Fund.
(i) the terms and conditions of the Proposed Advisory Agreements compared to the terms and conditions of the Current Advisory Agreements, as described below;
(ii) the fact that each Fund's total advisory fees would remain the same;
(iii) the qualifications of the personnel of RiverSource, Ameriprise and the Subadvisers expected to provide advisory and administrative services to each Fund, including representations by Ameriprise regarding its retention of the same process for monitoring and evaluating portfolio management personnel for each Fund as currently used by Columbia;
(iv) the terms and conditions of the Proposed Subadvisory Agreements compared to the terms and conditions of the Current Subadvisory Agreements;
(v) the reputation, financial strength, regulatory and compliance histories and resources of RiverSource and Ameriprise, and the potential benefits to the Funds of the combination of RiverSource and Columbia, including that the Funds are expected to continue to have access to existing distribution channels and have the potential for expanded distribution of Fund shares, the expected depth and breadth of investment management capabilities, that there is not expected to be any diminution in the nature, quality and extent of services to be provided to the Funds under the Proposed Advisory Agreements and the potential for the realization of additional economies of scale over time and the potential of the Funds to share in, and benefit from, these economies, if any;
(vi) that Ameriprise has committed to refrain from imposing or seeking to impose, for a period of not less than two years after the closing of the Transaction (the "Closing"), any "unfair burden" (within the meaning of Section 15(f) of the 1940 Act) on any Fund;
(vii) the terms and conditions of certain other agreements and arrangements relating to the future operations of the Funds and their distribution channels, including the administrative services agreement and the new services and distribution agreement;
(viii) that the Trustees recently had completed the Current Agreement Re-Approval Process for each Fund and had determined that they were satisfied with the nature, extent and quality of services provided thereunder and that the management fee rates and (where applicable) subadvisory fee rates for each Fund were satisfactory;
(ix) that RiverSource was willing to commit to maintain net operating expense ratios at current levels for at least the period currently covered by Columbia's existing commitments;
(x) the capabilities of RiverSource and the Subadvisers with respect to compliance, including an assessment of RiverSource's compliance program by the Funds' Chief Compliance Officer;
(xi) that certain members of RiverSource's management and certain Columbia personnel that will be integrated into RiverSource and its affiliates as a result of the Transaction have substantial experience in integrating fund families; and
38
(xii) that Ameriprise and Bank of America Corporation would bear the costs of obtaining approvals of the Proposed Advisory and Subadvisory Agreements.
In their deliberations, the Trustees did not identify any single item that was paramount or controlling and individual Trustees may have attributed different weights to various factors. The Trustees also evaluated all information available to them on a Fund-by-Fund basis, and their determinations were made separately in respect of each Fund.
Nature, Extent and Quality of Services to be Provided. The Trustees received and considered various data and information regarding the expected nature, extent and quality of services to be provided to the Funds by RiverSource and the Subadvisers under the Proposed Advisory and Subadvisory Agreements. The most recent investment adviser registration forms for RiverSource and each Subadviser were made available to the Boards, as well as extensive materials from RiverSource, Ameriprise and Columbia. The Trustees reviewed and analyzed these materials, which included, among other things, information about the background and experience of expected senior management of RiverSource and Ameriprise after the Closing. The Trustees considered RiverSource's ability to provide administrative services to the Funds, noting that while the aggregate scope of advisory an d administrative services was not expected to change following the Closing, the allocation of services was expected to shift, to a limited extent, such that administrative services will be provided under a new administrative services agreement. The Trustees considered, among other things, the capacity and quality of RiverSource's and the Subadvisers' investment management, research and trade execution capabilities and other resources that would be dedicated to performing services for the Funds. The Trustees also considered matters related to RiverSource's and the Subadvisers' compliance programs and compliance records, including RiverSource's portfolio transaction policies and procedures. The Trustees discussed with senior management personnel their ability to administer and oversee outside service providers to the Funds and their shareholders and were satisfied with management's processes for providing services and overseeing and reviewing services to be rendered by outside sources.
In evaluating the services to be provided under the Proposed Advisory and Subadvisory Agreements, the Trustees factored in their extensive discussions with representatives of Columbia, RiverSource and Ameriprise at the meetings referenced above regarding the management of each Fund. The Trustees considered representations by Ameriprise that it was expected that there will be no diminution in the nature and quality of services provided to the Funds. The Trustees noted that Columbia Management Group's current President, Columbia's current Chief Investment Officer and Columbia's current President, were expected to continue to serve the Funds in similar capacities after the Closing. With respect to portfolio management, the Trustees reviewed information regarding the deliberative process for selecting portfolio management personnel to continue servicing the Funds after the Closing, including the expected role of Columbia's Chief Inv estment Officer in evaluating and selecting portfolio management personnel for each Fund utilizing Columbia's current analytical model for evaluating portfolio managers. In this regard, the Trustees also weighed representations by Ameriprise that this investment management evaluative process was likely to result in a significant number of Columbia investment professionals and personnel currently responsible for management of the Funds to remain in place. The Trustees noted that the portfolio management evaluation and selection process was designed to optimize the portfolio management resources available to each Fund by having the ability to select investment personnel for the Funds from the combined organization. Similarly, the Trustees evaluated the ability of RiverSource and the Subadvisers, based on their respective resources, reputations and other attributes, to attract and retain qualified investment professionals. In this regard, the Trustees considered information regarding the nature of the compensat ion structure applicable to portfolio managers and other key investment personnel.
The Trustees reviewed and considered information from Ameriprise and RiverSource regarding various contemplated service provider arrangements, including information regarding both immediate and potential future plans in respect of these arrangements. In this regard, the Trustees considered information regarding potential distribution, transfer agency and custody arrangements and the evaluation of fund accounting, financial reporting and valuation service model options, noting certain differences between Columbia's and RiverSource's current approaches, including that RiverSource has historically utilized services provided "in-house" or by its affiliates for fund accounting, financial reporting and valuation. The Trustees reviewed information
39
from Ameriprise and RiverSource regarding the expectation for rationalized or harmonized fees as part of the integration after the Closing in order to develop consistent service fee schedules across the combined fund family. The Trustees noted Ameriprise's representations that, to the extent any such proposals were recommended to the Board after the Closing, they would not result in an "unfair burden" (within the meaning of Section 15(f) of the 1940 Act) on any Fund.
In addition, the Trustees reviewed and evaluated materials and information received regarding the investment and legal compliance programs of the Funds, RiverSource and the Subadvisors, including their compliance policies and procedures and reports of the Funds' Chief Compliance Officer. In this regard, the Trustees considered that Columbia's current Chief Compliance Officer was expected to serve in the same role after the Closing.
The Trustees also noted that Ameriprise and certain of its affiliates have been involved in a number of legal, arbitration and regulatory proceedings, including routine litigation, class actions, and governmental actions, concerning matters arising in connection with the ordinary conduct of their business activities, and that Ameriprise indicated that neither Ameriprise nor any of its affiliates are the subject of any pending legal, arbitration or regulatory proceedings that are likely to have a material adverse effect on the Funds or the ability of Ameriprise or its affiliates, including RiverSource to provide services to the Funds.
Based on the foregoing and other information considered relevant, the Trustees concluded that, overall, they were satisfied with assurances from Columbia, RiverSource, Ameriprise and the Subadvisers as to the expected nature, extent and quality of services to be provided to each Fund under the Proposed Advisory and Subadvisory Agreements.
Investment Advisory and Subadvisory Fee Rates and Other Expenses. The Trustees reviewed and considered the proposed contractual investment advisory fee rates to be paid by each Fund to RiverSource for investment management services both separately and together with the administration fee rates to be paid by the Funds to RiverSource (the "Contractual Management Rates"), which are the same as the separate and aggregate advisory and administrative fee rates currently paid by each Fund to Columbia. The Trustees also reviewed and considered the proposed subadvisory fee rates and the fee arrangements under the Proposed Subadvisory Agreements, respectively, which are also the same as those currently in effect under the Current Subadvisory Agreements. In addition to the materials provided by Columbia, RiverSource provided information regarding the current fee s for each of the RiverSource funds and other relevant institutional accounts. The Trustees reviewed and considered the proposed fee waiver/cap arrangements applicable to the Contractual Management Rates and considered the Contractual Management Rates after taking the waivers/caps into account (the "Actual Management Rates"). In this regard, the Trustees noted that RiverSource had committed to maintain the Funds' current expense limitation and waiver arrangements (both contractual and voluntary). The Trustees considered the potential that, after the Closing, RiverSource would propose a common fee and expense structure for the combined fund family, subject to the commitment that Ameriprise will not seek any change that would result in an "unfair burden" on any Fund. The Trustees also considered the report prepared and provided by the Fee Consultant. Additionally, the Trustees received and afforded specific attention to information provided in connection with the Current Agreement Re-Approval Process, comparin g the Contractual Management Rates and Actual Management Rates with those of other funds in each Fund's Peer Group (as defined below).
During the Current Agreement Re-Approval Process, the Trustees reviewed and considered statistical information regarding each Fund's total expense ratio and its various components, including contractual advisory fees, actual advisory fees, actual nonmanagement fees, Rule 12b-1 and non-Rule 12b-1 service fees, fee waivers/caps and/or expense reimbursements. The Trustees also reviewed comparisons of these fees to the expense information for the group of Funds that was determined by Lipper Inc. ("Lipper") to be the most similar to a given Fund (the "Peer Group") and to the performance of a broader universe of relevant funds as determined by Lipper (the "Universe"), which comparative data was provided by Lipper, an independent provider of investment company data.
The Trustees were provided with a description of the methodology used by Lipper to select the mutual funds in each Fund's Peer Group and Universe and reviewed the degree of comparability resulting from the selection methodology. For
40
certain Funds, Lipper determined that changing the composition of the Peer Group and/or Universe for expenses from that used for performance would provide a more accurate basis of comparison. The Trustees also considered Lipper data that ranked each Fund based on: (i) each Fund's one- and three-year performance compared to actual management fees; and (ii) each Fund's one- and three-year performance compared to total expenses.
For each Fund, except as otherwise described in the Fund-specific discussion below, the Trustees noted that they had concluded during the Current Agreement Re-Approval Process that the Contractual Management Rates, the Actual Management Rates and the total expense ratio were at acceptable levels in light of the quality of services provided to the Fund and in comparison to such Fund's Peer Group and Universe, as applicable; that the advisory fee rate would not be increased for any Fund; that Ameriprise and RiverSource had represented that the overall expenses for each Fund were not expected to be adversely affected by the Transaction; and that RiverSource had committed to maintain the Funds' current expense limitation or waiver arrangements (both contractual and voluntary).
Based on the foregoing, other relevant information received and the additional information described in the Fund-specific discussion below, as applicable, the Trustees concluded that the Contractual Management Rates, the Actual Management Rates and the total expense ratio were acceptable.
Fund Performance. The Trustees reviewed detailed performance information for each Fund at various Board and committee meetings during the year in addition to the additional performance information that they reviewed and evaluated in connection with the Transaction. The Trustees also reviewed and evaluated detailed performance information for each Fund in connection with the Current Agreement Re-Approval Process. The Trustees considered the performance results for each of the Funds over multiple measurement periods. They also considered these results in comparison to the performance results of each Fund's Peer Group and Universe, as well as to each Fund's benchmark index. The Boards also noted certain risk-adjusted performance data.
The Trustees also reviewed and evaluated information and data regarding the investment performance record of RiverSource in managing funds with investment strategies generally similar to those of the Funds, as applicable. Investment performance for such funds was provided for a wide range of periods.
The Trustees recognized that the investment performance record of RiverSource in managing funds with similar objectives may be less relevant to their deliberations in situations where the current portfolio managers of Columbia are expected to continue managing a particular Fund following the Closing. They also recognized that for each Fund, it is not possible to predict with certainty what effect, if any, consummation of the Transaction will have on the future performance of the Funds, noting in particular that past investment performance is no assurance of future results. The Fund-by-Fund discussion set forth below provides additional information regarding those Funds highlighted as meeting agreed-upon criteria for warranting further review. Such criteria included, among other things, information relating to Actual Management Rates, total expense ratios and/or performance information, relative to a Fund's Peer Group and/or Univ erse.
Costs of Services to be Provided and Profitability. In considering the costs of services to be provided by RiverSource and the Subadvisers under the Proposed Advisory Agreement and Proposed Subadvisory Agreement, as applicable for each Fund, and the projected range of profitability to RiverSource and the Subadvisers from their relationships with the Funds, the Trustees considered, among other things, that there would be no increase in advisory or subadvisory fee rates under the Proposed Advisory and Subadvisory Agreements. The Trustees further noted, with respect to RiverSource, that it was not possible to predict with certainty how RiverSource's profitability would be affected by becoming the investment adviser to the Funds but, as a general matter, they were satisfied, based on their review of RiverSource's projected range of profitability assuming completion of the Transaction, that this projected profitability from their relationship with the Funds would not be excessive. The Trustees based their review, in part, on information regarding RiverSource's current profitability in managing the RiverSource Funds and the information available to the Trustees with respect to RiverSource's expense budgeting process. The Trustees also noted that they would have ongoing opportunities to address RiverSource's profitability in the future based on actual results. The Trustees did not consider
41
separate profitability information with respect to the Subadvisers, as their profitability from their relationships with the Funds was not a material factor in determining whether to approve the Proposed Subadvisory Agreements. The Trustees also noted that the subadvisory fees paid to the Subadvisers, none of which is affiliated with Columbia, had previously been negotiated on an arms' length basis.
The Trustees also reviewed information about the financial condition of RiverSource and the Subadvisers and were satisfied that RiverSource and the Subadvisers have adequate resources to perform the services required under the Proposed Advisory and Proposed Subadvisory Agreements.
Subject to the limitations noted above, the Trustees concluded that they were satisfied that RiverSource's projected range of future profitability, and each Subadviser's historical profitability, from their relationship with each Fund, as relevant, were not excessive.
Economies of Scale. The Trustees received and evaluated information regarding the potential to realize economies of scale with respect to management of the Funds, whether the Funds would appropriately benefit from any economies of scale and whether there was any potential for realization of further economies of scale in connection with the Transaction. The Trustees noted that the current and proposed investment advisory fee rates for most of the Funds contain breakpoints that reduce the fee rate on assets above specified levels. The Trustees noted that RiverSource had indicated that no changes to the Funds' breakpoint arrangements were proposed to be made at this time. In light of these factors and noting that it was not possible to evaluate with certainty if and how the Transaction would produce any immediate opportunities for additional economies of scale, the Trustees concluded that each Fund's breakpoint arrangements were acceptable. The Trustees also recognized that the Funds may benefit from certain economies of scale over time from becoming a part of the larger RiverSource fund complex, based on potential future synergies of operations, potential fee harmonization/rationalization initiatives and potential future Fund mergers. The Trustees noted, in particular, RiverSource's acknowledgement of the principle that the Funds should share in certain economies of scale if realized by RiverSource. In addition, the Trustees evaluated the likelihood that there would be potential Fund mergers after the Closing. The Trustees noted that any such potential Fund mergers, if approved, could result in the achievement of additional breakpoints for Funds that have implemented breakpoint fee schedules. The Trustees also noted that they expect to consider economies of scale from time to time following the Closing and thus be in a position to evaluate any additional e conomies of scale.
The Trustees acknowledged the inherent limitations of any analysis of an investment adviser's economies of scale, stemming largely from the Trustees' understanding that economies of scale are generally realized, if at all, by an investment adviser across a variety of products and services, not just with respect to a single fund.
Information About Investment Management Services to Non-Mutual Fund Clients. The Trustees also received and reviewed information about the nature and extent of services and fee rates offered by Riversource and the Subadvisers to the Funds compared with other clients with similar accounts, including separate accounts and institutional investments. The Trustees noted that the Funds may receive services different from those offered to other clients of RiverSource and the Subadvisers and concluded that the advisory fee rates under the Proposed Advisory Agreements and the subadvisory fee rates under the Proposed Subadvisory Agreements were not excessive, given the nature and extent of services expected to be offered and other factors, including the Trustees' review of Lipper data.
Other Benefits to RiverSource and the Subadvisers. The Trustees received and reviewed information regarding any expected "fall-out" or ancillary benefits to be received by RiverSource and its affiliates and by the Subadvisers as a result of their relationships with the Funds.
Among other things, the Trustees noted that RiverSource would benefit from soft dollar arrangements using portfolio brokerage of each Fund that invests in equity securities. The Trustees also noted that the Subadvisers also had benefited from, and expected to continue to benefit from, soft dollar arrangements using portfolio brokerage of the Subadvised Funds. The Trustees acknowledged RiverSource's representation that none of its affiliated broker dealers was expected to provide brokerage services to any Fund, but noted that broker-dealer affiliates of RiverSource will receive distribution related fees from the Funds in respect of shares held in certain accounts, and that such Funds' distributor
42
(which will also become a subsidiary of RiverSource following the closing of the Transaction) retains a portion of the distribution related fees from the Funds and receives a portion of the sales charges on sales or redemptions of certain classes of shares of the Funds. The Trustees recognized that RiverSource's and the Subadvisers' profitability would be somewhat lower without these benefits. The Trustees concluded that RiverSource and the Subadvisers may derive reputational benefits from their association with the Funds. The Trustees also noted, however, that such benefits were difficult to quantify with certainty.
Fund-Specific Considerations for Certain "Review" Funds. During the Current Agreement Re-Approval Process, a limited number of Funds were highlighted as meeting agreed-upon criteria for warranting further review. Such criteria included, among other things, information relating to Actual Management Rates, total expense ratios and/or performance information, relative to a Fund's Peer Group and/or Universe. For such "review" Funds, the Trustees engaged in further analysis with regard to the approval of the Funds' Current Advisory Agreements. For each such Fund, the Trustees subsequently considered the impact of transitioning investment management responsibilities to RiverSource.
Columbia Overseas Value Fund was not highlighted as a review fund.
Conclusion. After an evaluation of the above-described factors and based on its deliberations and analysis of the information provided and alternatives considered, each Board, including all of the Independent Trustees, concluded that approval of the Proposed Advisory and Subadvisory Agreements was in the best interests of each of the Funds and its shareholders. Accordingly, the Boards unanimously approved the Proposed Advisory and Subadvisory Agreements.
43
Summary of Management Fee Evaluation by
Independent Fee Consultant
[EXPERPTS FROM:] REPORT OF INDEPENDENT FEE CONSULTANT TO THE FUNDS SUPERVISED BY THE COLUMBIA NATIONS BOARD
Prepared Pursuant to the February 9, 2005 Assurance of Discontinuance among the Office of Attorney General of New York State, Columbia Management Advisors, LLC, and Columbia Management Distributors, Inc.
November 12, 2009
I. Overview
On February 9, 2005, Columbia Management Advisors, LLC ("CMA") and Columbia Management Distributors, Inc.1 ("CMD") agreed to the New York Attorney General's Assurance of Discontinuance ("AOD"). Among other things, the AOD stipulates that CMA may manage or advise a Columbia Fund ("Columbia Fund" and, together with some or all of such funds, the "Columbia Funds") only if the Independent Members of the Columbia Fund's Board of Trustees appoint a Senior Officer or retain an Independent Fee Consultant ("IFC") who is to manage the process by which proposed management fees are negotiated. The AOD further stipulates that the Senior Officer or IFC is to prepare a written annual evaluation of the fee negotiation process.
With effect from January 1, 2007, the Independent Members of the Board of Trustees for certain Columbia Funds known collectively as the "Nations Funds" (together with the other members of that Board, the "Trustees") retained me as IFC for the Nations Funds.2 In this capacity, I have prepared the fifth annual written evaluation of the fee negotiation process. As was the case with the 2007 and 2008 reports, my immediate predecessor as IFC, John Rea, provided invaluable assistance in the preparation of this year's report.
A. Role of the Independent Fee Consultant
The AOD charges the IFC with "managing the process by which proposed management fees...to be charged the Columbia Fund are negotiated so that they are negotiated in a manner which is at arms' length and reasonable and consistent with this Assurance of Discontinuance." The AOD also provides that CMA "may manage or advise a Columbia Fund only if the reasonableness of the proposed management fees is determined by the Board of Trustees...using...an annual independent written evaluation prepared by or under the direction of...the Independent Fee Consultant." Therefore, the AOD makes clear that the IFC does not supplant the Trustees in negotiating management fees with CMA, nor does the IFC substitute his or her judgment for that of the Trustees with respect to the reasonableness of proposed fees or any other matter that is committed to the business judgment of the Trustees.
B. Elements Involved in Managing the Fee Negotiation Process
In preparing the report required by the AOD, the IFC must consider at least the following six factors set forth in the AOD:
1. The nature and quality of CMA's services, including the Fund's performance;
2. Management fees (including any components thereof) charged by other mutual fund companies for like services;
3. Possible economies of scale as the Fund grows larger;
4. Management fees (including any components thereof) charged to institutional and other clients of CMA for like services;
5. Costs to CMA and its affiliates of supplying services pursuant to the management fee agreements, excluding any intra-corporate profit; and
6. Profit margins of CMA and its affiliates from supplying such services.
C. Organization of the Annual Evaluation
This report, like last year's, focuses on the six factors and contains a section for each factor except that CMA's costs and profits from managing the Funds are treated in a single section. In addition to a discussion of these factors, the report offers recommendations to improve the fee review process in future years. A review of the status of recommendations made in the 2008 Report is being provided separately with the materials for the November meeting.
1 CMA and CMD are subsidiaries of Columbia Management Group, LLC ("CMG"), and are the successors to the entities named in the AOD.
2 I have no material relationship with Bank of America, CMG or any of its affiliates, aside from serving as IFC, and I am aware of no material relationship with any of their affiliates. I retained John Rea, an independent economic consultant, to assist me with this report.
Unless otherwise stated or required by the context, this report covers only the Nations Funds, which are also referred as the "Funds."
44
II. Summary of Findings
A. General
1. Based upon my examination of the information supplied by CMG in the light of the six factors set forth in the AOD, I conclude that the Trustees have the relevant information necessary to evaluate the reasonableness of the proposed management fees for each Nations Fund, subject to the following: on September 30, 2009, Ameriprise Financial, Inc. ("Ameriprise") announced that it had agreed to purchase the investment management business of CMG with the exception of its cash and liquidity management business which includes the Nations money market Funds. As a result, the Trustees requested information from CMG as to the plans of CMG and its parent with respect to the provision of investment management services to those Funds after the consummation of the proposed transaction. As of the date of this report, that information has not yet been provided. However, as the transaction is not expected to close until the spring o f 2010, the Trustees concluded that they would have ample opportunity to take appropriate steps with respect to the investment management agreements of the money market Funds, including invoking the 60-day termination provisions of those agreements, in response to the information to be provided by CMG and reviewed by the IFC.
2. In my view, the process by which the proposed management fees of the Funds have been negotiated in 2009 thus far has been, to the extent practicable, at arms' length and reasonable and consistent with the AOD.
B. Nature and Quality of Services, Including Performance
3. The performance of the Funds was relatively strong for the measuring periods ending March 31, 2009. Between one-third and nearly one-half of the Funds were ranked in either the first or second quintiles in the one-, three-, five-, and 10-year periods, and no more than 8% were in the fifth quintile for these periods. Overall, the performance was stronger in the two longer periods.
4. The strongest performing groups over the one-, three-, and five-year periods were active equity, quantitative strategies, and, to a lesser extent, money market Funds. Sub-advised Funds were the weakest performers, with over 60% of the Funds in the bottom two quintiles in the one- and three-year periods. For the same two periods, no more than 15% percent of the sub-advised Funds were in the top two quintiles. Almost half of fixed-income Funds ranked in the bottom two quintiles in the one- and three-year periods.
5. Overall performance of the Funds was less robust in 2009 than in 2008 and 2007 for the one- and three-year performance periods. For example, 62% of the Funds were in the top two quintiles in 2007 for the one-year period compared with 33% in 2009. The ranks of those in the bottom two quintiles rose significantly between 2007 and 2009, led by money market and fixed-income Funds in the one- and three-year periods. For the three-year period, there was a similar trend with respect to sub-advised Funds.
6. The performance of the active equity Funds against their benchmarks was strong for the one-, three-, and five-year performance periods. In contrast, more than half of the sub-advised Funds failed to beat their benchmarks on a net basis in the one- and three-year periods. The fixed-income Funds consistently produced gross returns below those of their benchmarks. Lipper quintile rankings of the actively managed equity Funds are highly correlated with their performance against their benchmarks in the sense that net returns in excess of the benchmark appear necessary to achieve a ranking in one of the top three quintiles. No such correlation was observed for fixed-income and quantitative strategies Funds.
7. The equity Funds' overall performance adjusted for risk was mixed. Based upon three-year returns, less than 40% of the equity Funds had a combination of risk-adjusted and unadjusted returns that placed them in the top half of their performance universes; 60% were in the bottom half of their universes. About 30% of the fixed income Funds posted high returns and low risk relative to comparable funds. Over 60% of the fixed-income Funds took on more risk than the typical fund in their performance universes.
8. The industry-standard procedure used by Lipper that includes all share classes in the performance universe tends to bias a Fund's ranking upward within that universe. The bias occurs because either no-12b-1 fee or low-12b-1 fee share classes of the Nations Funds are compared with funds in performance universes that
45
include all share classes of multi-class funds with 12b-1 fees of up to 100 basis points. Correcting this bias by limiting the performance universe to classes of comparable funds with low or no 12b-1 fees (a "filtered universe") lowers the relative performance for the Funds, but generally not to a material extent. The filtering process, however, did identify two Funds for further review that had not been so identified using unfiltered universes.
9. A small number of Funds have consistently underperformed over the past five years. The exact number depends on the criteria used to evaluate longer-term performance. For example, six different Funds have had below-median performance in at least four out of the five years between 2005 and 2009 for either the one- or three-year performance periods from 2005 to 2009. If the threshold were the 60th percentile, only two Funds would have satisfied the criteria.
10. The services performed by CMG professionals beyond portfolio management, such as compliance, legal, information technology, risk management, finance, and fund administration, are critical to the success of the Funds and appear to be of high quality.
C. Management Fees Charged by Other Mutual Fund Companies
11. The Funds' management fees and total expenses are generally low relative to those of their peers, with over half the Funds ranking in the most favorable two quintiles. For total expenses, slightly more than one-quarter are in the bottom two quintiles, while slightly less than two-fifths are in the bottom two quintiles for actual management fees. Fixed-income and quantitative strategies Funds have the lowest fees and expenses relative to their peers. The sub-advised Funds account for the majority of Funds in the fifth quintile for both management fees and total expenses.
12. The distribution of management fee rankings has changed little over the past three years, while the distribution of total expense rankings has moved in the direction of higher expenses. The most notable change involving total expenses has been a shift in the number of Funds from the first to the second quintile.
13. The management fees of the non-subadvised Funds are generally in line with those of Columbia Funds supervised by the Atlantic Board of Trustees (the "Atlantic Funds"). The sub-advised large cap equity, international equity, and high yield Funds, however, generally have higher management fees than those of comparable Atlantic and non-subadvised Funds.
14. The implementation of the new program of voluntary expense limits appears to have been associated, on balance, with less favorable expense rankings. This result reflects increases in expense limits for certain Funds, the removal of fee waivers, and the shift of certain expenses from CMA to the Funds. The decline in expense rankings is less significant, however, than CMA projected in December 2008.
D. Trustees' Advisory Contract Review Process
15. The Trustees' evaluation process identified 22 Funds in 2009 for further review based upon long-standing criteria relating to their relative performance or expenses or both. When compared in filtered universes, two more Funds met the criteria for further review. At the November meeting, CMG provided further information about each of those Funds to assist the Trustees in their evaluation.
E. Potential Economies of Scale
16. CMG presented to the Trustees its analysis of the sources and sharing of potential economies of scale. CMG views economies of scale as arising at the complex level and would regard estimates of scale economies for individual funds as unreliable. In its analysis, CMG did not identify specific sources of economies of scale or provide any estimates of any economies of scale that might arise from future asset growth. CMG's analysis included measures taken by the Trustees and CMG that seek to share any potential economies of scale through breakpoints in management fee schedules, the establishment of expense limits for each Fund, enhanced shareholder services, fund mergers, and operational consolidation.
17. An examination of the contractual fee schedules for five Nations Funds shows that the schedules for Small Cap II, Municipal Reserves, and Treasury Reserves compare favorably with those of their competitors, while the subadvised Marsico Growth and High Yield VS Funds have schedules generally above those of their peers, including
46
funds that do not have a sub-adviser. The group fee with breakpoints that characterizes the money market Fund schedules is not typically found among competitors, nearly all of which have flat fee schedules.
F. Management Fees Charged to Institutional Clients
18. CMG has provided Trustees with comparisons of mutual fund management fees and institutional fees based upon standardized fee schedules and upon actual fees. The results show that, consistent with industry practice, actual and scheduled institutional fees are generally, but not always, lower than the Funds' management fees. CMG provided additional data this year demonstrating that at small asset levels, the effective fee of certain Funds may be equal to or less than institutional fee levels at those asset levels, due to the effect of expense limits on small funds with high gross expenses. CMG also analyzed the differences between the services provided and risks borne on the one hand by a manager of mutual funds and on the other by institutional advisers, and suggested that these differences should be kept in mind when Trustees review the reasonableness of the Funds' management fees.
G. Revenues, Expenses, and Profits
19. The activity-based cost allocation methodology employed by CMG to allocate costs, both direct and indirect, for purposes of calculating Fund profitability is thoughtful and detailed. This year, CMG further refined the technique by allocating additional indirect expenses on an activity basis.
20. The materials provided on CMG's revenues and expenses with respect to the Funds and the methodology underlying their construction form a sufficient basis for Trustees to evaluate the expenses of and profitability to CMG arising out of its relationships with the Funds.
21. CMG provided a firm-wide pro forma 2009 income statement demonstrating the effect of market events beginning in the fourth quarter of 2008 on its revenues and profitability to provide an additional perspective on calendar 2008 profitability data.
22. In 2008, CMG's pre-tax pre- and post-distribution margins on the Nations Funds were above the industry mean and median, based on limited data available for publicly held mutual fund managers and excluding the costs of CMG's money market capital support programs. However, as is to be expected in a 63-Fund complex, some Nations Funds had relatively high pre-tax profit margins in 2008, when calculated solely with respect to management revenues and expenses, while other Nations Funds operated at a loss. There is a positive relationship between Fund size and profitability to CMG, with smaller Funds generally operating at a loss to CMG.
23. CMG pays a fixed percentage of its management fee revenues to an affiliate, U.S. Trust, Bank of America Private Wealth Management, with respect to assets of its clients invested in Nations Funds to compensate it for services it performs with respect to those client assets and for the effect of state law limitations on affiliates charging multiple fees. Based on our analysis of the services provided by this affiliate, we have concluded that all payments other than those for sub-transfer agent or sub-accounting services should be treated as a distribution expense.
III. Recommendations
1) Criteria for review. The Trustees may wish to consider modifying the criteria for identifying a Fund for further review (a "Review Fund") to include criteria that focus exclusively on performance. They may also wish to consider whether it would be useful to apply CMG's own internal monitoring standards for Fund performance to the contract review process, or whether such criteria are more relevant to their ongoing investment oversight.
2) Presentation of Review Fund discussion. CMG should consider whether it could more systematically present in one discussion all relevant information regarding each Review Fund, which is now split into several different portions of the 15(c) materials. For any Fund that has been a Review Fund in consecutive years, CMG should address under what circumstances it could reasonably be anticipated that the Fund would lose that status.
3) Refinement of tax-exempt performance data. Certain single-state tax-exempt Funds compete in extremely small universes and are compared to a multi-state benchmark of uncertain relevance. Notwithstanding the difficulties, CMG should work to improve the reliability of the calculation of relative performance of these Funds. If that is not possible,
47
CMG should provide guidance on how the Trustees should judge the quality of CMG's management of these Funds.
4) Development of risk metrics for asset-allocation, tax-exempt, and money market Funds. CMG has developed and shared with the Trustees quantitative risk metrics comparing equity and taxable fixed-income Funds against their peers. However, reliable risk metrics have not been developed for asset-allocation, tax-exempt fixed income, and money market Funds. We urge CMG to continue its efforts to provide reliable risk measures for these categories of Funds, especially in the cases of asset-allocation and money market funds, because their investors are likely to be motivated at least in part by a desire to manage risk.
5) Profitability data. For any period during which CMG is an affiliate of U.S. Trust, Bank of America Private Wealth Management, CMG should continue to present to the Trustees the profitability of each Fund, each investment style and each complex (of which Nations is one) calculated as follows:
a. Management-only profitability should be calculated without reference to any Private Bank expense.
b. Profitability excluding distribution (which essentially covers the management and transfer agency functions) should be adjusted by removing from the expense calculation any portion of the Private Bank payment not attributable to the performance by the Private Bank of sub-transfer agency or sub-accounting functions.
c. Total profitability, including distribution: No adjustment for Private Bank expenses should be made, because all such expenses represent legitimate fund expenses to be taken into account in calculating CMG's profit margin including distribution.
d. Distribution only: This should include all Private Bank expenses other than those attributable to sub-transfer agency services.
6) Contractual fee analysis. This year CMG presented a new Lipper report comparing the contractual management fees of Funds with those of competitors in similar investment styles. However, the reliability of the conclusion—that Fund management fee breakpoints compared favorably with competitive fee rates—was limited by the use of competitive funds at all asset levels. The sponsors of a $100 million mutual fund may not have given much thought to breakpoints at $5 billion; therefore, that fund's contractual fee at that level is unlikely to compare favorably with that of a $5 billion Fund. Limiting the competitors to the Lipper expense group, whose constituents are similar in size to the rele vant Fund, would make the results more meaningful. In addition, the breakpoints of a select group of Nations Funds (which would differ each year) should continue to be compared to those of industry rivals to ensure that the Funds' breakpoint schedules remain within industry norms. As breakpoint schedules change relatively little each year, performing such a comparison for each Nations Fund each year would not be an efficient use of Trustee and CMG resources.
7) Pro forma profitability data. In any year in which CMG or the Trustees believe that the prior year's profitability is unlikely to be representative of current business results due to changes in markets or for any other reason, CMG should, consistent with this year's practice, prepare a pro forma income statement based on year-to-date actual data and reasonable projections used for its own business planning purposes.
8) Additional institutional data and analysis. While CMG provided a substantial amount of information on its institutional business, we suggest some additional items for future years: (a) profitability data for the institutional business in the format, and based upon the same allocation methodologies, used to present Fund profitability, (b) an explanation of how CMA sets institutional fee breakpoints, which normally begin at asset levels far lower than those found in Fund management fee breakpoints, and (c) distinguishing in all institutional fee materials fees of accounts acquired prior to the development of current fee schedules (so-called "legacy" accounts) from the fees of accounts launched after that time.
9) Management fee disparities. In any future study of management fees, CMG and the Nations Trustees should analyze the differences in management fee schedules. As
48
part of that analysis, CMG should provide an explanation for any significant fee differences among comparable funds across fund families sponsored by CMG, such as differences in the management styles of different Funds included the same Lipper category. Finally, if CMG proposes a management fee change or an expense cap for any mutual fund managed by CMA that is comparable to any Nations Fund, CMG should provide the Trustees with sufficient information about the proposal to allow the Trustees to assess the applicability of the proposed change to the relevant Nations Fund or Funds.
10) Explanation of data supplied to Lipper. Each year, as part of the 15(c) process, CMG retains Lipper to compare the fees and expenses of each Fund to a group of competitors. In many cases, CMG, with the approval of the Trustees, adjusts the actual expense data, which is based on the most recent full fiscal year of the Fund (and each competitive fund) to reflect changes in fees or expense limits that occurred during or after the relevant fiscal year. This improves the reliability and usefulness of the comparison. However, to ensure that the Trustees know when and how CMG adjusted the data, we recommend that CMG prepare a table listing for each Fund what adjustments were made, e.g., to reflect a new expense limitation of x basis points that commenced on y date.
11) Reduction of volume of paper documents submitted. The effort to streamline and better organize the data presented to the Trustees and the process by which that data was prepared and organized continued to be well-received by all parties. Notwithstanding past success, it is always appropriate to look for opportunities to reduce and simplify the presentation of 15(c) data. One possibility would be to remove the 127 pages of biographical data, most if not all of which the Trustees have previously seen as part of their ongoing investment oversight duties, from the paper volume and post it on the Internet-based document storage and retrieval system used by the Funds to provide reference data to Trustees.
Respectfully submitted,
Steven E. Asher
49
This page intentionally left blank.
This page intentionally left blank.
This page intentionally left blank.
Important Information About This Report
The fund mails one shareholder report to each shareholder address. If you would like more than one report, please call shareholder services at 1-800-426-3750 and additional reports will be sent to you. This report has been prepared for shareholders of Columbia Overseas Value Fund.
A description of the policies and procedures that the fund uses to determine how to vote proxies and a copy of the fund's voting records are available (i) at www.columbiamanagement.com, (ii) on the Securities and Exchange Commission's website at www.sec.gov, and (iii) without charge, upon request, by calling 1-800-368-0346. Information regarding how the fund voted proxies relating to portfolio securities during the 12-month period ended June 30 is available on the SEC's website. Information regarding how the fund voted proxies relating to portfolio securities is also available from the fund's website, www.columbiamanagement.com.
The fund files a complete schedule of portfolio holdings with the SEC for the first and third quarters of each fiscal year on Form N-Q. The fund's Form N-Q is available on the SEC's website at www.sec.gov and may be reviewed and copied at the SEC's Public Reference Room in Washington, D.C. Information on the operation of the Public Reference Room may be obtained by calling 1-800-SEC-0330.
Please read and consider the investment objectives, risks, charges and expenses for any fund carefully before investing. For a prospectus which contains this and other important information about the fund, contact your Columbia Management representative or financial advisor.
Columbia Management Group, LLC ("Columbia Management") is the investment management division of Bank of America Corporation. Columbia Management entities furnish investment management services and products for institutional and individual investors. Columbia Funds are distributed by Columbia Management Distributors, Inc., member of FINRA, SIPC, part of Columbia Management and an affiliate of Bank of America Corporation.
Transfer Agent
Columbia Management Services, Inc.
P.O. Box 8081
Boston, MA 02266-8081
1-800-426-3750
Distributor
Columbia Management
Distributors, Inc.
One Financial Center
Boston, MA 02111
Investment Advisor
Columbia Management Advisors, LLC
100 Federal Street
Boston, MA 02110
53
Columbia Management®
One Financial Center
Boston, MA 02111-2621
PRSRT STD
U.S. Postage
PAID
Holliston, MA
Permit NO. 20
Columbia Management®
Columbia Overseas Value Fund
Annual Report, February 28, 2010
©2010 Columbia Management Distributors, Inc.
One Financial Center, Boston, MA 02111-2621
800-345-6611 www.columbiafunds.com
SHC-42/32194-0210 (04/10) 10/4472V0
Columbia Management®
Annual Report
February 28, 2010
Columbia Convertible Securities Fund
| NOT FDIC INSURED | | May Lose Value | |
|
| NOT BANK ISSUED | | No Bank Guarantee | |
|
Table of Contents
| Fund Profile | | | 1 | | |
|
| Economic Update | | | 2 | | |
|
| Performance Information | | | 4 | | |
|
| Understanding Your Expenses | | | 5 | | |
|
| Investment Portfolio | | | 8 | | |
|
Statement of Assets and
Liabilities | | | 14 | | |
|
| Statement of Operations | | | 15 | | |
|
Statement of Changes in Net
Assets | | | 16 | | |
|
| Financial Highlights | | | 18 | | |
|
| Notes to Financial Statements | | | 22 | | |
|
Report of Independent Registered
Public Accounting Firm | | | 30 | | |
|
| Federal Income Tax Information | | | 31 | | |
|
| Fund Governance | | | 32 | | |
|
Board Consideration and
Re-Approval of Current
Investment Advisory
Agreement | | | 36 | | |
|
Board Consideration and
Approval of Proposed Investment
Advisory Agreement | | | 40 | | |
|
Summary of Management
Fee Evaluation by Independent
Fee Consultant | | | 47 | | |
|
Important Information About
This Report | | | 53 | | |
|
The views expressed in this report reflect the current views of the respective parties. These views are not guarantees of future performance and involve certain risks, uncertainties and assumptions that are difficult to predict, so actual outcomes and results may differ significantly from the views expressed. These views are subject to change at any time based upon economic, market or other conditions and the respective parties disclaim any responsibility to update such views. These views may not be relied on as investment advice and, because investment decisions for a Columbia Fund are based on numerous factors, may not be relied on as an indication of trading intent on behalf of any particular Columbia Fund. References to specific securities should not be construed as a recommendation or investment advice.
President's Message

Dear Shareholder:
As we previously announced, Bank of America, N.A. has reached a definitive agreement to sell Columbia Management's long-term asset management business to Ameriprise Financial, Inc. This includes the management of its equity and fixed-income mutual funds.
This transaction combines two leading asset management firms and will create one entity that is expected to rank as one of the top asset managers. It is anticipated that the combined U.S. asset management business will operate under the well-regarded Columbia Management brand. The combined U.S. asset management business will be led by Ted Truscott, currently president, U.S. asset management, annuities and chief investment officer, Ameriprise Financial. Michael A. Jones, currently president of Columbia Management, will serve as president, U.S. asset management. Colin Moore, chief investment officer at Columbia Management, will continue to serve in that role for the combined organization. I will also continue in my role as head of mutual funds, responsible for the delivery of mutual fund products and services to investors.
As a valued investor in Columbia funds, please know that our goal is to ensure a smooth transition and provide you with the highest quality products and services. We will work closely with colleagues at Ameriprise Financial to seek a seamless transition for our clients and to keep you informed as the transition progresses and key decisions are made. We want to assure you that the funds' portfolio managers continue to focus on providing uninterrupted service to Columbia fund shareholders. Columbia Management and Ameriprise Financial will operate independently until all required approvals, including fund board, fund shareholder and other client approvals, have been received and the transaction closes, which is expected to occur in the spring of this year.
Meanwhile, transition teams across the company have been formed to oversee integration efforts including rebranding initiatives, vendor and system consolidations and client communications. Throughout the transition, we seek to build on best practices from both legacy organizations with enhancements to productivity, quality and the delivery of world-class customer experiences.
Clearly, we have a lot of work ahead of us in 2010. We look forward to introducing our combined business with an even wider breadth of products and capabilities. Everyone at Columbia Management and Ameriprise Financial is excited about the opportunities for this combined organization. I share this optimism and believe it will position us as a best-in-class asset management business with the ability to deliver more for clients than ever before.
Sincerely,

J. Kevin Connaughton
President, Columbia Funds
Fund Profile – Columbia Convertible Securities Fund
Summary
g For the 12-month period that ended February 28, 2010, the fund's Class A shares returned 33.91% without sales charge.
g This period's strongest returns occurred among issues and sectors that are more speculative than those the fund emphasizes. For that reason, the fund's return was well below those of its benchmark, the Merrill Lynch All Convertibles All Qualities Index1 and the average return of its peer group, the Lipper Convertible Securities Funds Classification.2
g The same measured approach that aided relative returns during the market's most tumultuous stretch held back results over this period.
Portfolio Management
Yanfang (Emma) Yan, lead manager, has co-managed the fund since July 2001 and has been associated with the advisor or its predecessors since 2001.
Richard E. Dahlberg has co-managed the fund since May 2004 and has been associated with the advisor or its predecessors since 2003.
Yan Jin has co-managed the fund since March 2006 and has been associated with the advisor or its predecessors since 2002.
Effective April 6, 2010, David L. King will be replacing Yanfang Yan as lead manager of the Fund and Richard E. Dahlberg will no longer co-manage the fund.
Subject to satisfying various conditions to closing, effective on or about May 1, 2010, RiverSource Investments, LLC, a subsidiary of Ameriprise Financial, Inc., is expected to become the investment advisor to the fund and change its name to Columbia Management Investment Advisers, LLC. Please see the fund's prospectus dated July 1, 2009, including the supplements thereto, for more information regarding the expected change in investment advisor and any related changes to the portfolio management of the fund.
1The Merrill Lynch All Convertibles All Qualities Index is a widely used index that measures convertible securities performance. It measures the performance of U.S. dollar-denominated convertible securities not currently in bankruptcy with a total market value greater than $50 million at issuance. Indices are not available for investment, are not professionally managed and do not reflect sales charges, fees, brokerage commissions, taxes or other expenses of investing. Securities in the fund may not match those in an index.
Merrill Lynch & Co., Inc. is a wholly-owned subsidiary of Bank of America Corporation and an affiliate of Columbia Management.
2Lipper Inc., a widely respected data provider in the industry, calculates an average total return (assuming reinvestment of distributions) for mutual funds with investment objectives similar to those of the fund. Lipper makes no adjustment for the effect of sales loads.
Performance data quoted represents past performance and current performance may be lower or higher. Past performance is no guarantee of future results. The investment return and principal value will fluctuate so that shares, when redeemed, may be worth more or less than the original cost. Please visit www.columbiafunds.com for daily and most recent month-end performance updates.
Summary
1-year return as of 02/28/10
| | | | | +33.91% | |
|
| |  | | | Class A shares
(without sales charge) | |
|
| | | | | +54.42% | |
|
| |  | | | Merrill Lynch All Convertibles
All Qualities Index | |
|
1
Economic Update – Columbia Convertible Securities Fund
Summary
For the 12-month period that ended February 28, 2010
g After a sharp decline, stock markets rebounded around the world, as measured by the S&P 500 Index and the MSCI EAFE Index.
| S&P Index | | MSCI Index | |
|
 | |  | |
|
g As investors grew more comfortable with risk, non-Treasury sectors of the bond market rebounded. The Barclays Capital Aggregate Bond Index delivered solid results. High-yield bonds were strong performers, as measured by the JPMorgan Developed BB High Yield Index.
Barclays
Aggregate Index | | JPMorgan Index | |
|
 | |  | |
|
After a deep and difficult recession, the U.S. economy regained its footing midway through calendar year 2009. Gross domestic product (GDP) turned positive in the third quarter of 2009, rising 2.2%, and then gained 5.6% in the fourth quarter according to the estimate released by the Bureau of Economic Analysis. Growth was primarily the result of federal government stimulus spending and a slowdown in inventory reductions. Hopes for a sustained recovery now depend on a variety of factors, including a rebound in consumer spending, an increase in revenues to keep business profits moving higher and a turnaround in the labor market.
The housing market showed some signs of improvement. Existing home sales fell late in the period, but remained above levels of one year ago. According to the National Association of Realtors, the inventory of houses for sale fell over the course of 2009. Housing prices remained unchanged during the past year, but that was progress compared to 2008. The average home price fell in 2008 and since then distressed properties, which accounted for an estimated 38% of sales in January 2010, have weighed on prices because they were heavily discounted.
In the beleaguered labor market, the good news was that there was less bad news. Businesses continued to shed jobs throughout the period, raising the unemployment rate as high as 10.2% in October 2009. However, the pace of job losses slowed markedly by the period's end. Compared to six figure losses of one year ago, 14,000 jobs were added to the labor market in January 2010 and only 14,000 were lost in February 2010.* The rate of unemployment at the end of the period was 9.7%.* Nevertheless, prospects for a quick recovery in the labor markets are dim. In fact, consumer confidence, as measured monthly by The Conference Board, an independent resear ch organization, took a sharp dive in February. Consumers surveyed cited worsening business conditions and a bleaker outlook for the labor markets and income for their pessimism.
Manufacturing activity remained slow during the first few months of the period. However, a key measure—the Institute for Supply Management's Index—rose above 50 in July and remained well above 50 for the remainder of the period. A value above 50 tends to indicate that the economy is growing. Industrial production turned positive in January 2010, and durable goods orders took a big jump forward. Manufacturing capacity utilization inched upward to 72.6%.
Consumer spending registered both ups and downs during the 12-month period, but the trend at the end of the period was upward, even though personal income decreased in January 2010. In light of uncertainty about the economy and pressure on consumers from a number of sectors, the Federal Reserve Board (the Fed) kept a key short-term interest rate—the federal funds rate—close to zero throughout the period.
Stocks bottomed, then rebounded
Against a strengthening economic backdrop, a stock market rally that began in mid-March 2009 continued throughout the period. The U.S. stock market returned 53.62%
*Source: U.S. Bureau of Labor Statistics
2
Economic Update (continued) – Columbia Convertible Securities Fund
for the 12-month period, as measured by the S&P 500 Index.1 Mid-cap stocks outperformed large and small-cap stocks and value stocks outperformed growth stocks by a solid margin, as measured by their respective Russell indices.2 Outside the U.S., stock market returns were even stronger. The MSCI EAFE Index,3 a broad gauge of stock market performance in foreign developed markets, gained 54.58% (net of dividends, in U.S. dollars) for the period. Emerging stock markets were caught in last year's downdraft, but they bounced back stronger than domestic or developed world markets in 2009 as their economic growth generally outpaced the developed world. The MSCI Emerging Markets Index4 returned 91.63% (net of dividends, in U.S. dollars).
Bond returns ranged from solid to strong
As hopes for a recovery materialized, bonds from non-Treasury sectors delivered solid returns. The Barclays Capital Aggregate Bond Index5 returned 9.32%. Municipal bonds delivered returns that were in line with taxable investment-grade bonds even without factoring in potential tax advantages to investors in higher income tax brackets. The Barclays Capital Municipal Bond Index6 returned 9.98%. High-yield bond prices rebounded strongly in 2009. For the 12-month period covered by this report, the JPMorgan Developed BB High Yield Index7 returned 32.79%.
Past performance is no guarantee of future results.
1The Standard & Poor's (S&P) 500 Index tracks the performance of 500 widely held, large-capitalization U.S. stocks.
2The Russell 1000 Index tracks the performance of 1,000 of the largest U.S. companies, based on market capitalization. The Russell Midcap Index measures the performance of the 800 smallest companies in the Russell 1000 Index, which represents approximately 25% of the total market capitalization of the Russell 1000 Index. The Russell 2000 Index measures the performance of the 2,000 smallest companies in the Russell 3000 Index, which represents approximately 8% of the total market capitalization of the Russell 3000 Index. The Russell 3000 Growth Index measures the performance of those Russell 3000 Index companies with higher price-to-book ratios and higher forecasted growth values. The stocks in this index are also members of either the Russell 1000 Growth or the Russell 2000 Growth indexes. The Russell 3000 Value Index measures the performance of those Russell 3000 Index companies with lower price-to-book ratios and lo wer forecasted growth values. The stocks in this index are also members of either the Russell 1000 Value or the Russell 2000 Value indexes.
3The Morgan Stanley Capital International Europe, Australasia, Far East (MSCI EAFE) Index is a capitalization-weighted index that tracks the total return of common stocks in 21 developed-market countries within Europe, Australasia and the Far East.
4The Morgan Stanley Capital International Emerging Markets Index (MSCI EMI) is a free float-adjusted market capitalization index that is designed to measure equity market performance of emerging markets. As of June 2009, the MSCI Emerging Markets Index consisted of the following 22 emerging market country indices: Brazil, Chile, China, Colombia, Czech Republic, Egypt, Hungary, India, Indonesia, Israel, Korea, Malaysia, Mexico, Morocco, Peru, Philippines, Poland, Russia, South Africa, Taiwan, Thailand, and Turkey.
5The Barclays Capital Aggregate Bond Index is a market value-weighted index that tracks the daily price, coupon, pay-downs and total return performance of fixed-rate, publicly placed, dollar-denominated and non-convertible investment grade debt issues with at least $250 million par amount outstanding and with at least one year to final maturity.
6The Barclays Capital Municipal Bond Index is considered representative of the broad market for investment-grade, tax-exempt bonds with a maturity of at least one year.
7The JPMorgan Developed BB High Yield Index is an unmanaged index designed to mirror the investable universe of the U.S. dollar developed, BB-rated, high yield corporate debt market.
Indices are not available for investment, are not professionally managed and do not reflect sales charges, fees, brokerage commissions, taxes or other expenses of investing. Securities in the fund may not match those in an index.
3
Performance Information – Columbia Convertible Securities Fund
Performance data quoted represents past performance and current performance may be lower or higher. Past performance is no guarantee of future results. The investment return and principal value will fluctuate so that shares, when redeemed, may be worth more or less than the original cost. Please visit www.columbiafunds.com for daily and most recent month-end performance updates.
Annual operating expense ratio (%)*
| Class A | | | 1.24 | | |
| Class B | | | 1.99 | | |
| Class C | | | 1.99 | | |
| Class Z | | | 0.99 | | |
*The annual operating expense ratio is as stated in the fund's prospectus that is current as of the date of this report. Differences in expense ratios disclosed elsewhere in this report may result from the inclusion of fee waivers and expense reimbursements as well as the use of different time periods used in calculating the ratios.
Performance of a $10,000 investment 03/01/00 – 02/28/10
The chart above shows the change in value of a hypothetical $10,000 investment in Class A shares of Columbia Convertible Securities Fund during the stated time period, and does not reflect the deduction of taxes that a shareholder may pay on fund distributions or on the redemption of fund shares.
Performance of a $10,000 investment 03/01/00 – 02/28/10 ($)
| Sales charge | | without | | with | |
| Class A | | | 12,985 | | | | 12,241 | | |
| Class B | | | 12,035 | | | | 12,035 | | |
| Class C | | | 12,035 | | | | 12,035 | | |
| Class Z | | | 13,306 | | | | n/a | | |
Average annual total return as of 02/28/10 (%)
| Share class | | A | | B | | C | | Z | |
| Inception | | 09/25/87 | | 07/15/98 | | 10/21/96 | | 05/21/99 | |
| Sales charge | | without | | with | | without | | with | | without | | with | | without | |
| 1-year | | | 33.91 | | | | 26.16 | | | | 32.86 | | | | 27.86 | | | | 32.80 | | | | 31.80 | | | | 34.20 | | |
| 5-year | | | 1.64 | | | | 0.44 | | | | 0.89 | | | | 0.60 | | | | 0.87 | | | | 0.87 | | | | 1.91 | | |
| 10-year | | | 2.65 | | | | 2.04 | | | | 1.87 | | | | 1.87 | | | | 1.87 | | | | 1.87 | | | | 2.90 | | |
Average annual total return as of 03/31/10 (%)
| Share class | | A | | B | | C | | Z | |
| Sales charge | | without | | with | | without | | with | | without | | with | | without | |
| 1-year | | | 33.74 | | | | 26.04 | | | | 32.79 | | | | 27.79 | | | | 32.70 | | | | 31.70 | | | | 34.03 | | |
| 5-year | | | 2.90 | | | | 1.69 | | | | 2.14 | | | | 1.85 | | | | 2.13 | | | | 2.13 | | | | 3.17 | | |
| 10-year | | | 2.76 | | | | 2.15 | | | | 1.99 | | | | 1.99 | | | | 1.98 | | | | 1.98 | | | | 3.02 | | |
The "with sales charge" returns include the maximum initial sales charge of 5.75% for Class A shares, the applicable contingent deferred sales charge of 5.00% in the first year, declining to 1.00% in the sixth year, and eliminated thereafter for Class B shares and 1.00% for Class C shares for the first year only. The "without sales charge" returns do not include the effect of sales charges. If they had, returns would be lower.
Performance results reflect any fee waivers or reimbursements of fund expenses by the investment advisor and/or any of its affiliates. Absent these fee waivers or expense reimbursement arrangements, performance results would have been lower.
All results shown assume the reinvestment of distributions. Class Z shares are sold at net asset value with no distribution and service (Rule 12b-1) fees. Class Z shares have limited eligibility and the investment minimum requirements may vary. Please see the fund's prospectus for details. Performance for different share classes will vary based on differences in sales charges and fees associated with each class.
The tables do not reflect the deduction of taxes that a shareholder may pay on fund distributions or on the redemption of fund shares.
4
Understanding Your Expenses – Columbia Convertible Securities Fund
As a fund shareholder, you incur two types of costs. There are transaction costs, which generally include sales charges on purchases and may include redemption fees or exchange fees. There are also ongoing costs, which generally include investment advisory fees, distribution and service (Rule 12b-1) fees and other fund expenses. The information on this page is intended to help you understand the ongoing costs of investing in the fund and to compare these costs with the ongoing costs of investing in other mutual funds.
Analyzing your fund's expenses by share class
To illustrate these ongoing costs, we have provided an example and calculated the expenses paid by investors in each share class during the period. The information in the following table is based on an initial investment of $1,000, which is invested at the beginning of the period and held for the entire period. Expense information is calculated two ways and each method provides you with different information. The amount listed in the "Actual" column is calculated using the fund's actual operating expenses and total return for the period. The amount listed in the "Hypothetical" column for each share class assumes that the return each year is 5% before expenses and is calculated based on the fund's actual operating expenses. You should not use the hypothetical account values and expenses to estimate either your actual account balance at the end of the period or the expenses you paid during this period.
Compare with other funds
Since all mutual funds are required to include the same hypothetical calculations about expenses in shareholder reports, you can use this information to compare the ongoing cost of investing in the fund with other funds. To do so, compare the 5% hypothetical example with the 5% hypothetical examples that appear in the shareholder reports of other funds. As you compare hypothetical examples of other funds, it is important to note that hypothetical examples are meant to highlight the ongoing costs of investing in a fund and do not reflect any transaction costs, such as sales charges, redemption fees or exchange fees.
Estimating your actual expenses
To estimate the expenses that you paid over the period, first you will need your account balance at the end of the period:
g For shareholders who receive their account statements from Columbia Management Services, Inc., your account balance is available online at www.columbiafunds.com or by calling Shareholder Services at 800.345.6611.
g For shareholders who receive their account statements from their financial intermediary, contact your financial intermediary to obtain your account balance.
1. Divide your ending account balance by $1,000. For example, if an account balance was $8,600 at the end of the period, the result would be 8.6.
2. In the section of the table below titled "Expenses paid during the period," locate the amount for your share class. You will find this number in the column labeled "Actual." Multiply this number by the result from step 1. Your answer is an estimate of the expenses you paid on your account during the period.
If the value of your account falls below the minimum initial investment requirement applicable to you, your account generally will be subject to a $20 annual fee. This fee is not included in the accompanying table. If you are subject to the fee, keep it in mind when you are estimating the ongoing expenses of investing in the fund and when comparing the expenses of this fund with other funds.
09/01/09 – 02/28/10
| | | Account value at the
beginning of the period ($) | | Account value at the
end of the period ($) | | Expenses paid
during the period ($) | | Fund's annualized
expense ratio (%) | |
| | | Actual | | Hypothetical | | Actual | | Hypothetical | | Actual | | Hypothetical | | Actual | |
| Class A | | | 1,000.00 | | | | 1,000.00 | | | | 1,085.00 | | | | 1,018.89 | | | | 6.15 | | | | 5.96 | | | | 1.19 | | |
| Class B | | | 1,000.00 | | | | 1,000.00 | | | | 1,080.70 | | | | 1,015.17 | | | | 10.01 | | | | 9.69 | | | | 1.94 | | |
| Class C | | | 1,000.00 | | | | 1,000.00 | | | | 1,080.40 | | | | 1,015.17 | | | | 10.01 | | | | 9.69 | | | | 1.94 | | |
| Class Z | | | 1,000.00 | | | | 1,000.00 | | | | 1,085.40 | | | | 1,020.13 | | | | 4.86 | | | | 4.71 | | | | 0.94 | | |
Expenses paid during the period are equal to the annualized expense ratio for the share class, multiplied by the average account value over the period, then multiplied by the number of days in the fund's most recent fiscal half-year and divided by 365.
Had the investment advisor and/or any of its affiliates not waived fees or reimbursed a portion of expenses, account value at the end of the period would have been reduced.
It is important to note that the expense amounts shown in the table are meant to highlight only ongoing costs of investing in the fund and do not reflect any transaction costs, such as sales charges, redemption fees or exchange fees. Therefore, the hypothetical examples provided may not help you determine the relative total costs of owning shares of different funds. If these transaction costs were included, your costs would have been higher.
5
Portfolio Managers' Report – Columbia Convertible Securities Fund
Performance data quoted represents past performance and current performance may be lower or higher. Past performance is no guarantee of future results. The investment return and principal value will fluctuate so that shares, when redeemed, may be worth more or less than the original cost. Please visit www.columbiafunds.com for daily and most recent month-end performance updates.
Net asset value per share
as of 02/28/10 ($)
| Class A | | | 12.92 | | |
| Class B | | | 12.70 | | |
| Class C | | | 12.88 | | |
| Class Z | | | 12.93 | | |
Distributions declared per share
03/01/09 – 02/28/10 ($)
| Class A | | | 0.34 | | |
| Class B | | | 0.25 | | |
| Class C | | | 0.25 | | |
| Class Z | | | 0.37 | | |
For the 12-month period that ended February 28, 2010, the fund's Class A shares returned 33.91% without sales charge. Its benchmark, the Merrill Lynch All Convertibles All Qualities Index, returned 54.42%. The average return of funds in its peer group, the Lipper Convertible Securities Funds Classification, was 47.56%. As investor confidence returned, issues of lower quality, which we underweighted, led the market.
Good results from well-timed purchases
Anticipating a business turnaround for technology and airlines, we built overweight positions in both sectors, a decision that proved beneficial to the fund's return. We realized solid gains from selling the fund's position in Continental Airlines, while EMC Corp. (2.8% of net assets) a leader in data storage and long-time fund holding, rose sharply. Credit concerns pressured bonds of Advanced Micro Devices (2.3% of net assets), presenting an attractive investment opportunity. These bonds, which featured put options that would allow us to sell at favorable prices, later rebounded significantly. We took stakes in some companies whose bonds were trading at depressed levels despite good balance sheets, solid cash flows and minimal exposure to bad assets. For example, we accumulated a large position in Wells Fargo (1.5% of net assets) when our research confirmed that it was fundamentally stronger than the deeply troubled institution s it was grouped with. This decision was rewarded when Wells Fargo's bonds rose dramatically, helping make financials the period's best-performing sector. The fear of automaker bankruptcies held down the price of a new convertible issued by parts maker Johnson Controls. Johnson is much more than an auto supply company, and the terms of the deal were attractive. We built a large position that we later sold at a sizeable gain.
Absence of speculative holdings held back returns
The period's underperformance was largely the result of two factors: 1) what we did not own and 2) our practice of avoiding speculative issues. The resulting underweight in lower-quality issues and sectors penalized performance relative to the benchmark, which holds issues of varied quality. Within the index, speculative issues nearly doubled the performance of investment-grade holdings. Our concern about the viability of major automakers helped us avoid the collapse of General Motors. However, we took a modest position in Ford (1.0% of net assets) based on its debt restructuring and well-received products. Although these bonds doubled in value, our small commitment hurt comparative results. Underexposure to the strong-performing consumer discretionary and financial sectors also limited performance. We were skeptical about the balance
Portfolio characteristics and holdings are subject to change periodically and may not be representative of current characteristics and holdings. The outlook for this fund may differ from those presented for other Columbia Funds.
Most convertible securities are not investment grade and are therefore more speculative in nature than securities with higher ratings.
6
Portfolio Managers' Report (continued) – Columbia Convertible Securities Fund
sheets of some major financial institutions and unsure of the impact of proposed government regulations. In particular, the absence from the portfolio of some strong-performing regional banks and rebounding REITs undercut returns. Continued high unemployment and weak consumer spending clouded the consumer discretionary sector in our view, and we were aware of the short-term benefit of corporate earnings increases that relied on cost cutting without increasing revenues. We exited some new issues prematurely when valuations appeared stretched. But market momentum and the shortage of new offerings carried many of these issues higher.
Looking ahead
Convertible securities surged along with equities and other bonds during the last 12 months, moving quickly from extremely cheap value levels to what now appear to be fair valuations. We think the momentum-driven, low-quality rally is largely over, and the market appears ready to focus on quality and valuation. In this environment, we plan to emphasize balanced convertibles, those whose prices may be influenced by equity moves as well as interest rates, in companies with good cash flows, healthy balance sheets, advanced technologies, dominant market shares and proven management. Increased interest in mergers and acquisitions may signal a new level of investor optimism, as some recent buyouts have occurred at substantial premiums to the market.
Top 5 sectors
as of 02/28/10 (%)
| Health Care | | | 28.1 | | |
| Information Technology | | | 21.2 | | |
| Financials | | | 13.5 | | |
| Energy | | | 7.2 | | |
| Consumer Discretionary | | | 7.2 | | |
Top 10 holdings
as of 02/28/10 (%)
| Gilead Sciences | | | 2.5 | | |
| Citigroup | | | 2.5 | | |
| Fisher Scientific | | | 2.4 | | |
| Invitrogen | | | 2.3 | | |
| Peabody Energy | | | 2.0 | | |
| Advanced Micro Devices | | | 2.3 | | |
| Interpublic Group of Companies | | | 1.8 | | |
| EMC | | | 1.8 | | |
| Dole Food Automatic | | | 1.7 | | |
| Mylan | | | 1.6 | | |
The fund is actively managed and the composition of its portfolio will change over time. Information provided is calculated as a percentage of net assets.
7
Investment Portfolio – Columbia Convertible Securities Fund
February 28, 2010
| Convertible Bonds – 75.2% | |
| | | Par ($) | | Value ($) | |
| Consumer Discretionary – 6.8% | |
| Apparel – 0.6% | |
Iconix Brand Group, Inc.
1.875% 06/30/12 | | | 2,800,000 | | | | 2,499,000 | | |
| Apparel Total | | | 2,499,000 | | |
| Auto Components – 0.9% | |
BorgWarner, Inc.
3.500% 04/15/12 | | | 2,880,000 | | | | 3,733,200 | | |
| Auto Components Total | | | 3,733,200 | | |
| Automobiles – 0.6% | |
Ford Motor Co.
4.250% 12/15/36 | | | 1,800,000 | | | | 2,540,250 | | |
| Automobile Total | | | 2,540,250 | | |
| Diversified Consumer Services – 0.5% | |
Coinstar, Inc.
4.000% 09/01/14 | | | 2,300,000 | | | | 2,328,750 | | |
| Diversified Consumer Services Total | | | 2,328,750 | | |
| Hotels, Restaurants & Leisure – 0.3% | |
International Game Technology
3.250% 05/01/14 (a) | | | 1,000,000 | | | | 1,170,000 | | |
| Hotels, Restaurants & Leisure Total | | | 1,170,000 | | |
| Household Durables – 0.5% | |
DR Horton, Inc.
2.000% 05/15/14 | | | 1,900,000 | | | | 2,225,375 | | |
| Household Durables Total | | | 2,225,375 | | |
| Leisure Equipment & Products – 0.2% | |
| Eastman Kodak Co. | |
| 7.000% 04/01/17 (a) | | | 1,000,000 | | | | 1,096,250 | | |
| Leisure Equipment & Products Total | | | 1,096,250 | | |
| Media – 2.6% | |
Interpublic Group of Companies, Inc.
4.250% 03/15/23 | | | 7,690,000 | | | | 7,814,962 | | |
Liberty Global, Inc.
4.500% 11/15/16 (a) | | | 3,000,000 | | | | 3,581,250 | | |
| Media Total | | | 11,396,212 | | |
| Specialty Retail – 0.6% | |
Best Buy Co., Inc.
2.250% 01/15/22 | | | 2,425,000 | | | | 2,546,250 | | |
| Specialty Retail Total | | | 2,546,250 | | |
| Consumer Discretionary Total | | | 29,535,287 | | |
| | | Par ($) | | Value ($) | |
| Consumer Staples – 1.2% | |
| Beverages – 0.5% | |
Molson Coors Brewing Co.
2.500% 07/30/13 | | | 1,850,000 | | | | 1,967,938 | | |
| Beverages Total | | | 1,967,938 | | |
| Tobacco – 0.7% | |
Vector Group Ltd.
(b) 06/15/26 (c) | | | 2,900,000 | | | | 2,983,375 | | |
| Tobacco Total | | | 2,983,375 | | |
| Consumer Staples Total | | | 4,951,313 | | |
| Energy – 6.2% | |
| Energy Equipment & Services – 2.4% | |
Cameron International Corp.
2.500% 06/15/26 | | | 2,840,000 | | | | 3,709,750 | | |
Exterran Holdings, Inc.
4.250% 06/15/14 | | | 1,930,000 | | | | 2,313,587 | | |
Hornbeck Offshore Services, Inc.
1.625% 11/15/26 (a)(d)
(1.375% 11/15/13) | | | 5,000,000 | | | | 4,081,500 | | |
1.625% 11/15/26 (d)
(1.375% 11/15/13) | | | 680,000 | | | | 555,084 | | |
| Energy Equipment & Services Total | | | 10,659,921 | | |
| Oil, Gas & Consumable Fuels – 3.8% | |
Alpha Natural Resources, Inc.
2.375% 04/15/15 | | | 1,910,000 | | | | 2,148,750 | | |
Bill Barrett Corp.
5.000% 03/15/28 | | | 3,895,000 | | | | 3,807,362 | | |
Chesapeake Energy Corp.
2.750% 11/15/35 | | | 1,910,000 | | | | 1,878,963 | | |
Peabody Energy Corp.
4.750% 12/15/41 | | | 8,294,000 | | | | 8,501,350 | | |
| Oil, Gas & Consumable Fuels Total | | | 16,336,425 | | |
| Energy Total | | | 26,996,346 | | |
| Financials – 6.9% | |
| Capital Markets – 0.5% | |
Janus Capital Group, Inc.
3.250% 07/15/14 | | | 1,950,000 | | | | 2,247,375 | | |
| Capital Markets Total | | | 2,247,375 | | |
| Real Estate Investment Trusts (REITs) – 6.4% | |
Alexandria Real Estate Equities, Inc.
3.700% 01/15/27 (a) | | | 6,000,000 | | | | 5,722,500 | | |
BioMed Realty LP
3.750% 01/15/30 (a) | | | 5,500,000 | | | | 5,445,000 | | |
Boston Properties LP
3.750% 05/15/36 | | | 3,893,000 | | | | 3,970,860 | | |
See Accompanying Notes to Financial Statements.
8
Columbia Convertible Securities Fund
February 28, 2010
| Convertible Bonds (continued) | |
| | | Par ($) | | Value ($) | |
Digital Realty Trust LP
5.500% 04/15/29 (a) | | | 4,000,000 | | | | 5,247,500 | | |
Hospitality Properties Trust
3.800% 03/15/27 | | | 2,480,000 | | | | 2,402,500 | | |
Prologis
2.250% 04/01/37 (a) | | | 830,000 | | | | 781,238 | | |
| 2.250% 04/01/37 | | | 2,170,000 | | | | 2,042,512 | | |
Rayonier TRS Holdings, Inc.
3.750% 10/15/12 (a) | | | 2,000,000 | | | | 2,107,500 | | |
Real Estate Investment
Trusts (REITs) Total | | | 27,719,610 | | |
| Financials Total | | | 29,966,985 | | |
| Health Care – 26.1% | |
| Biotechnology – 9.8% | |
Amgen, Inc.
0.375% 02/01/13 | | | 3,625,000 | | | | 3,625,000 | | |
Amylin Pharmaceuticals, Inc.
3.000% 06/15/14 | | | 1,800,000 | | | | 1,471,500 | | |
BioMarin Pharmaceuticals, Inc.
1.875% 04/23/17 | | | 1,925,000 | | | | 2,136,750 | | |
Cephalon, Inc.
2.500% 05/01/14 | | | 3,600,000 | | | | 4,198,500 | | |
Gilead Sciences, Inc.
0.500% 05/01/11 | | | 8,490,000 | | | | 10,708,013 | | |
Invitrogen Corp.
3.250% 06/15/25 | | | 8,536,000 | | | | 9,987,120 | | |
Isis Pharmaceuticals, Inc.
2.625% 02/15/27 | | | 4,685,000 | | | | 4,316,056 | | |
| 2.625% 02/15/27 (a) | | | 1,000,000 | | | | 921,250 | | |
OSI Pharmaceuticals, Inc.
3.000% 01/15/38 | | | 3,500,000 | | | | 3,307,500 | | |
PDL BioPharma, Inc.
2.000% 02/15/12 | | | 1,875,000 | | | | 1,788,281 | | |
| Biotechnology Total | | | 42,459,970 | | |
| Health Care Equipment & Supplies – 6.5% | |
Beckman Coulter, Inc.
2.500% 12/15/36 | | | 3,835,000 | | | | 4,319,169 | | |
| 2.500% 12/15/36 (a) | | | 220,000 | | | | 247,775 | | |
China Medical Technologies, Inc.
4.000% 08/15/13 | | | 950,000 | | | | 568,812 | | |
Fisher Scientific
International, Inc.
3.250% 03/01/24 | | | 8,127,000 | | | | 10,554,941 | | |
Medtronic, Inc.
1.500% 04/15/11 (a) | | | 5,975,000 | | | | 6,034,750 | | |
| 1.500% 04/15/11 | | | 1,860,000 | | | | 1,878,600 | | |
| 1.625% 04/15/13 | | | 4,400,000 | | | | 4,565,000 | | |
| Health Care Equipment & Supplies Total | | | 28,169,047 | | |
| | | Par ($) | | Value ($) | |
| Health Care Providers & Services – 3.1% | |
Chemed Corp.
1.875% 05/15/14 (a) | | | 2,250,000 | | | | 2,036,250 | | |
Henry Schein, Inc.
3.000% 08/15/34 (a) | | | 3,980,000 | | | | 4,989,925 | | |
HLTH Corp.
1.750% 06/15/23 | | | 1,920,000 | | | | 2,378,400 | | |
| 3.125% 09/01/25 | | | 1,925,000 | | | | 2,372,563 | | |
Omnicare, Inc.
3.250% 12/15/35 | | | 1,925,000 | | | | 1,540,000 | | |
| Health Care Providers & Services Total | | | 13,317,138 | | |
| Health Care Technology – 1.5% | |
Inverness Medical
Innovations, Inc.
3.000% 05/15/16 (a) | | | 6,000,000 | | | | 6,637,500 | | |
| Health Care Technology Total | | | 6,637,500 | | |
| Life Sciences Tool & Services – 0.9% | |
Millipore Corp.
3.750% 06/01/26 | | | 3,515,000 | | | | 4,094,975 | | |
| Life Sciences Tool & Services Total | | | 4,094,975 | | |
| Pharmaceuticals – 4.3% | |
Allergan, Inc.
1.500% 04/01/26 (a) | | | 4,180,000 | | | | 4,582,325 | | |
| 1.500% 04/01/26 | | | 2,035,000 | | | | 2,230,869 | | |
King Pharmaceuticals, Inc.
1.250% 04/01/26 | | | 2,700,000 | | | | 2,409,750 | | |
Mylan, Inc.
1.250% 03/15/12 | | | 6,664,000 | | | | 7,063,840 | | |
Teva Pharmaceutical
Finance Co., BV
1.750% 02/01/26 | | | 1,935,000 | | | | 2,442,937 | | |
| Pharmaceuticals Total | | | 18,729,721 | | |
| Health Care Total | | | 113,408,351 | | |
| Industrials – 5.1% | |
| Aerospace & Defense – 0.7% | |
L-3 Communications Corp.
3.000% 08/01/35 | | | 2,850,000 | | | | 2,974,688 | | |
| Aerospace & Defense Total | | | 2,974,688 | | |
| Airlines – 0.9% | |
UAL Corp.
4.500% 06/30/21 | | | 4,090,000 | | | | 3,803,700 | | |
| Airlines Total | | | 3,803,700 | | |
| Commercial Services & Supplies – 1.0% | |
Covanta Holding Corp.
1.000% 02/01/27 | | | 4,950,000 | | | | 4,498,313 | | |
| Commercial Services & Supplies Total | | | 4,498,313 | | |
See Accompanying Notes to Financial Statements.
9
Columbia Convertible Securities Fund
February 28, 2010
| Convertible Bonds (continued) | |
| | | Par ($) | | Value ($) | |
| Electrical Equipment – 0.8% | |
General Cable Corp.
4.500% 11/15/29 (d)
(2.250, 11/15/19) | | | 3,700,000 | | | | 3,311,500 | | |
| Electrical Equipment Total | | | 3,311,500 | | |
| Machinery – 1.7% | |
Barnes Group, Inc.
3.750% 08/01/25 | | | 1,167,000 | | | | 1,178,670 | | |
Navistar International Corp.
3.000% 10/15/14 | | | 4,335,000 | | | | 4,432,537 | | |
Trinity Industries, Inc.
3.875% 06/01/36 | | | 2,320,000 | | | | 1,711,000 | | |
| Machinery Total | | | 7,322,207 | | |
| Industrials Total | | | 21,910,408 | | |
| Information Technology – 19.0% | |
| Communications Equipment – 1.5% | |
Arris Group, Inc.
2.000% 11/15/26 | | | 2,435,000 | | | | 2,278,430 | | |
CommScope, Inc.
3.250% 07/01/15 | | | 2,950,000 | | | | 3,366,687 | | |
Lucent Technologies, Inc.
2.875% 06/15/25 | | | 800,000 | | | | 674,000 | | |
| Communications Equipment Total | | | 6,319,117 | | |
| Computers & Peripherals – 2.8% | |
EMC Corp.
1.750% 12/01/11 | | | 6,370,000 | | | | 7,636,038 | | |
| 1.750% 12/01/13 | | | 3,750,000 | | | | 4,640,625 | | |
| Computers & Peripherals Total | | | 12,276,663 | | |
| Internet Software & Services – 3.4% | |
Deutsche Bank AG,
0.250% (a)(b) | | | 5,000,000 | | | | 4,789,500 | | |
Digital River, Inc.
1.250% 01/01/24 | | | 1,900,000 | | | | 1,892,875 | | |
Equinix, Inc.
2.500% 04/15/12 | | | 3,540,000 | | | | 3,712,575 | | |
SAVVIS, Inc.
3.000% 05/15/12 | | | 4,720,000 | | | | 4,242,100 | | |
| Internet Software & Services Total | | | 14,637,050 | | |
| IT Services – 1.5% | |
DST Systems, Inc.
4.125% 08/15/23 (a) | | | 3,930,000 | | | | 3,979,125 | | |
VeriFone Holdings, Inc.
1.375% 06/15/12 (a) | | | 3,000,000 | | | | 2,673,750 | | |
| IT Services Total | | | 6,652,875 | | |
| | | Par ($) | | Value ($) | |
| Semiconductors & Semiconductor Equipment – 5.6% | |
Advanced Micro Devices, Inc.
5.750% 08/15/12 | | | 2,036,000 | | | | 2,013,095 | | |
| 6.000% 05/01/15 | | | 8,480,000 | | | | 7,833,400 | | |
Intel Corp.
3.250% 08/01/39 (a) | | | 3,500,000 | | | | 3,933,125 | | |
Micron Technology, Inc.
1.875% 06/01/14 | | | 5,560,000 | | | | 4,962,300 | | |
ON Semiconductor Corp.
2.625% 12/15/26 | | | 2,015,000 | | | | 2,050,262 | | |
Verigy Ltd.
5.250% 07/15/14 (a) | | | 1,500,000 | | | | 1,569,375 | | |
Xilinx, Inc.
3.125% 03/15/37 | | | 1,860,000 | | | | 1,734,450 | | |
Semiconductors & Semiconductor
Equipment Total | | | 24,096,007 | | |
| Software – 4.2% | |
Nuance Communications, Inc.
2.750% 08/15/27 | | | 1,925,000 | | | | 1,968,312 | | |
Salesforce.com, Inc.
0.750% 01/15/15 (a) | | | 4,600,000 | | | | 4,548,250 | | |
Sybase, Inc.
3.500% 08/15/29 (a) | | | 5,250,000 | | | | 6,142,500 | | |
Symantec Corp.
0.750% 06/15/11 | | | 800,000 | | | | 834,000 | | |
| 0.750% 06/15/11 (a) | | | 2,100,000 | | | | 2,189,250 | | |
Take-Two Interactive
Software, Inc.
4.375% 06/01/14 | | | 1,450,000 | | | | 1,651,188 | | |
TeleCommunication
Systems, Inc.
4.500% 11/01/14 (a) | | | 1,000,000 | | | | 1,057,500 | | |
| Software Total | | | 18,391,000 | | |
| Information Technology Total | | | 82,372,712 | | |
| Materials – 1.8% | |
| Metals & Mining – 1.8% | |
Kinross Gold Corp.
1.750% 03/15/28 (a) | | | 1,100,000 | | | | 1,113,750 | | |
| 1.750% 03/15/28 | | | 700,000 | | | | 708,750 | | |
Newmont Mining Corp.
3.000% 02/15/12 | | | 1,900,000 | | | | 2,348,875 | | |
Sterlite Industries India Ltd.
4.000% 10/30/14 | | | 3,770,000 | | | | 3,793,563 | | |
| Metals & Mining Total | | | 7,964,938 | | |
| Materials Total | | | 7,964,938 | | |
See Accompanying Notes to Financial Statements.
10
Columbia Convertible Securities Fund
February 28, 2010
| Convertible Bonds (continued) | |
| | | Par ($) | | Value ($) | |
| Telecommunication Services – 1.6% | |
| Diversified Telecommunication Services – 1.2% | |
Qwest Communications
International, Inc.
3.500% 11/15/25 | | | 4,800,000 | | | | 5,076,000 | | |
| Diversified Telecommunication Services Total | | | 5,076,000 | | |
| Wireless Telecommunication Services – 0.4% | |
NII Holdings, Inc.
3.125% 06/15/12 | | | 1,800,000 | | | | 1,665,000 | | |
| Wireless Telecommunication Services Total | | | 1,665,000 | | |
| Telecommunication Services Total | | | 6,741,000 | | |
| Utilities – 0.5% | |
| Multi-Utilities – 0.5% | |
CMS Energy Corp.
2.875% 12/01/24 | | | 1,940,000 | | | | 2,335,275 | | |
| Multi-Utilities Total | | | 2,335,275 | | |
| Utilities Total | | | 2,335,275 | | |
Total Convertible Bonds
(cost of $309,103,919) | | | 326,182,615 | | |
| Convertible Preferred Stocks – 18.9% | |
| | | Shares | | | |
| Consumer Discretionary – 0.4% | |
| Automobiles – 0.4% | |
Ford Motor Co. Capital
Trust II, 6.500% | | | 39,000 | | | | 1,717,560 | | |
| Automobiles Total | | | 1,717,560 | | |
| Consumer Discretionary Total | | | 1,717,560 | | |
| Consumer Staples – 3.6% | |
| Food Products – 3.6% | |
| Deutsche Bank AG, 7.200% (a)(b) | | | 229,000 | | | | 4,662,440 | | |
| Deutsche Bank AG, 7.250% (a)(b) | | | 90,000 | | | | 3,590,100 | | |
Dole Food Automatic Common
Exchange Security
Trust, 7.000% (a) | | | 640,000 | | | | 7,480,000 | | |
| Food Products Total | | | 15,732,540 | | |
| Consumer Staples Total | | | 15,732,540 | | |
| Energy – 1.0% | |
| Oil, Gas & Consumable Fuels – 1.0% | |
| El Paso Corp., 4.990% (a) | | | 4,660 | | | | 4,496,900 | | |
| Oil, Gas & Consumable Fuels Total | | | 4,496,900 | | |
| Energy Total | | | 4,496,900 | | |
| | | Shares ($) | | Value ($) | |
| Financials – 6.6% | |
| Commercial Banks – 1.4% | |
| Wells Fargo & Co., 7.500% | | | 6,650 | | | | 6,337,450 | | |
| Commercial Banks Total | | | 6,337,450 | | |
| Diversified Financial Services – 2.5% | |
| Citigroup, Inc., 7.500% | | | 99,600 | | | | 10,683,096 | | |
| Diversified Financial Services Total | | | 10,683,096 | | |
| Insurance – 2.1% | |
American International
Group, Inc., 8.500% | | | 452,500 | | | | 4,479,750 | | |
| XL Capital Ltd., 10.750% | | | 165,300 | | | | 4,575,504 | | |
| Insurance Total | | | 9,055,254 | | |
| Real Estate Investment Trusts (REITs) – 0.6% | |
Simon Property Group,
Inc., 6.000% | | | 38,000 | | | | 2,521,680 | | |
| Real Estate Investment Trusts (REITs) Total | | | 2,521,680 | | |
| Financials Total | | | 28,597,480 | | |
| Health Care – 1.2% | |
| Biotechnology – 1.2% | |
| Deutsche Bank AG, 7.200% (a)(b) | | | 102,000 | | | | 4,994,940 | | |
| Biotechnology Total | | | 4,994,940 | | |
| Health Care Total | | | 4,994,940 | | |
| Information Technology – 1.7% | |
| Communications Equipment – 0.5% | |
Lucent Technologies
Capital Trust I, 7.750% | | | 2,950 | | | | 2,212,500 | | |
| Communications Equipment Total | | | 2,212,500 | | |
| Internet Software & Services – 1.2% | |
Goldman Sachs
Group, Inc., 7.000% | | | 191,161 | | | | 5,050,473 | | |
| Internet Software & Services Total | | | 5,050,473 | | |
| Information Technology Total | | | 7,262,973 | | |
| Materials – 3.3% | |
| Metals & Mining – 3.3% | |
Credit Suisse Securities
USA LLC, 8.000% | | | 58,686 | | | | 4,440,770 | | |
Goldman Sachs
Group, Inc., 3.100% | | | 363,663 | | | | 4,845,809 | | |
| Vale Capital Ltd., 5.500% | | | 96,000 | | | | 4,992,000 | | |
| Metals & Mining Total | | | 14,278,579 | | |
| Materials Total | | | 14,278,579 | | |
See Accompanying Notes to Financial Statements.
11
Columbia Convertible Securities Fund
February 28, 2010
| Convertible Preferred Stocks (continued) | |
| | | Shares | | Value ($) | |
| Utilities – 1.1% | |
| Electric Utilities – 1.1% | |
| FPL Group, Inc., 8.375% | | | 101,600 | | | | 4,944,872 | | |
| Electric Utilities Total | | | 4,944,872 | | |
| Utilities Total | | | 4,944,872 | | |
Total Convertible Preferred Stocks
(cost of $82,289,173) | | | 82,025,844 | | |
| Common Stocks – 3.8% | |
| Financials – 0.0% | |
| Insurance – 0.0% | |
| MetLife, Inc. | | | 2 | | | | 73 | | |
| Insurance Total | | | 73 | | |
| Financials Total | | | 73 | | |
| Health Care – 0.8% | |
| Pharmaceuticals – 0.8% | |
| Merck & Co., Inc. | | | 30,000 | | | | 1,106,400 | | |
Teva Pharmaceutical
Industries Ltd., ADR | | | 40,000 | | | | 2,400,400 | | |
| Pharmaceuticals Total | | | 3,506,800 | | |
| Health Care Total | | | 3,506,800 | | |
| Industrials – 0.4% | |
| Machinery – 0.4% | |
| Ingersoll-Rand PLC | | | 50,000 | | | | 1,595,500 | | |
| Machinery Total | | | 1,595,500 | | |
| Industrials Total | | | 1,595,500 | | |
| Information Technology – 0.5% | |
| Software – 0.5% | |
| Microsoft Corp. | | | 80,000 | | | | 2,292,800 | | |
| Software Total | | | 2,292,800 | | |
| Information Technology Total | | | 2,292,800 | | |
| Materials – 0.9% | |
| Chemicals – 0.5% | |
| Monsanto Co. | | | 31,054 | | | | 2,193,965 | | |
| Chemicals Total | | | 2,193,965 | | |
| Metals & Mining – 0.4% | |
| Nucor Corp. | | | 40,000 | | | | 1,656,000 | | |
| Metals & Mining Total | | | 1,656,000 | | |
| Materials Total | | | 3,849,965 | | |
| | | Shares | | Value ($) | |
| Telecommunication Services – 1.2% | |
| Diversified Telecommunication Services – 1.2% | |
| AT&T, Inc. | | | 100,000 | | | | 2,481,000 | | |
| Verizon Communications, Inc. | | | 100,000 | | | | 2,893,000 | | |
| Diversified Telecommunication Services Total | | | 5,374,000 | | |
| Telecommunication Services Total | | | 5,374,000 | | |
Total Common Stocks
(cost of $17,139,907) | | | 16,619,138 | | |
| Short-Term Obligation – 1.8% | |
| | | Par ($) | | | |
Repurchase agreement with
Fixed Income Clearing Corp.,
dated 02/26/10, due 03/01/10
at 0.050%, collateralized by
U.S. Government Agency
obligations with various
maturities to 08/24/12,
market value $8,001,801
(repurchase proceeds
$7,841,033) | | | 7,841,000 | | | | 7,841,000 | | |
Total Short-Term Obligation
(cost of $7,841,000) | | | 7,841,000 | | |
Total Investments – 99.7%
(cost of $416,373,999) (e) | | | 432,668,597 | | |
| Other Assets & Liabilities, Net – 0.3% | | | 1,431,490 | | |
| Net Assets – 100.0% | | | 434,100,087 | | |
Notes to Investment Portfolio:
(a) Security exempt from registration pursuant to Rule 144A under the Securities Act of 1933. These securities may be resold in transactions exempt from registration, normally to qualified institutional buyers. At February 28, 2010, these securities, which are not illiquid, amounted to $111,903,018, which represents 25.8% of net assets.
(b) Zero coupon bond.
(c) The interest rate shown on floating rate or variable rate securities reflects the rate at February 28, 2010.
(d) Step bond. Shown parenthetically is the next interest rate to be paid and the date the Fund will begin accruing at this rate.
(e) Cost for federal income tax purposes is $416,552,909.
See Accompanying Notes to Financial Statements.
12
Columbia Convertible Securities Fund
February 28, 2010
The following table summarizes the inputs used, as of February 28, 2010, in valuing the Fund's assets:
| Description | | Quoted Prices
(Level 1) | | Other
Significant
Observable
Inputs
(Level 2) | | Significant
Unobservable
Inputs
(Level 3) | | Total | |
| Convertible Bonds | |
| Consumer Discretionary | | $ | — | | | $ | 29,535,287 | | | $ | — | | | $ | 29,535,287 | | |
| Consumer Staples | | | — | | | | 4,951,313 | | | | — | | | | 4,951,313 | | |
| Energy | | | — | | | | 26,996,346 | | | | — | | | | 26,996,346 | | |
| Financials | | | — | | | | 29,966,985 | | | | — | | | | 29,966,985 | | |
| Health Care | | | — | | | | 113,408,351 | | | | — | | | | 113,408,351 | | |
| Industrials | | | — | | | | 21,910,408 | | | | — | | | | 21,910,408 | | |
| Information Technology | | | — | | | | 77,583,212 | | | | 4,789,500 | | | | 82,372,712 | | |
| Materials | | | — | | | | 7,964,938 | | | | — | | | | 7,964,938 | | |
Telecommunication
Services | | | — | | | | 6,741,000 | | | | — | | | | 6,741,000 | | |
| Utilities | | | — | | | | 2,335,275 | | | | — | | | | 2,335,275 | | |
| Total Convertible Bonds | | | — | | | | 321,393,115 | | | | 4,789,500 | | | | 326,182,615 | | |
| Convertible Preferred Stocks | |
| Consumer Discretionary | | | 1,717,560 | | | | — | | | | — | | | | 1,717,560 | | |
| Consumer Staples | | | 4,662,440 | | | | 11,070,100 | | | | — | | | | 15,732,540 | | |
| Energy | | | — | | | | 4,496,900 | | | | — | | | | 4,496,900 | | |
| Financials | | | 28,597,480 | | | | — | | | | — | | | | 28,597,480 | | |
| Health Care | | | — | | | | 4,994,940 | | | | — | | | | 4,994,940 | | |
| Information Technology | | | 7,262,973 | | | | — | | | | — | | | | 7,262,973 | | |
| Materials | | | 4,992,000 | | | | 4,845,809 | | | | 4,440,770 | | | | 14,278,579 | | |
| Utilities | | | — | | | | 4,944,872 | | | | — | | | | 4,944,872 | | |
Total Convertible
Preferred Stocks | | | 47,232,453 | | | | 30,352,621 | | | | 4,440,770 | | | | 82,025,844 | | |
| Total Common Stocks | | | 16,619,138 | | | | — | | | | — | | | | 16,619,138 | | |
Total Short-Term
Obligation | | | — | | | | 7,841,000 | | | | — | | | | 7,841,000 | | |
| Total Investments | | $ | 63,851,591 | | | $ | 359,586,736 | | | $ | 9,230,270 | | | $ | 432,668,597 | | |
The following table reconciles asset balances for the year ended February 28, 2010, in which significant unobservable inputs (Level 3) were used in determining value:
| Investment in Securities | | Balance as of
February 28, 2009 | | Accrued
Discounts
(Premiums) | | Realized
Gain (Loss) | | Change in
Unrealized
Appreciation
(Depreciation) | | Net
Purchases
(Sales) | | Net Transfers
into (out of)
Level 3 | | Balance as of
February 28, 2010 | |
| Convertible Bonds | | $ | — | | | $ | — | | | $ | — | | | $ | (210,500 | ) | | $ | 5,000,000 | | | $ | — | | | $ | 4,789,500 | | |
| Convertible Preferred Stocks | | | — | | | | — | | | | — | | | | (559,277 | ) | | | 5,000,047 | | | | — | | | | 4,440,770 | | |
| Total | | $ | — | | | $ | — | | | $ | — | | | $ | (769,777 | ) | | $ | 10,000,047 | | | $ | — | | | $ | 9,230,270 | | |
The information in the above reconciliation represents fiscal year to date activity for any securities identified as using Level 3 inputs at either the beginning or the end of the current fiscal period.
The change in unrealized depreciation attributable to securities owned at February 28, 2010 which were valued using significant unobservable inputs (Level 3) amounted to $769,777. This amount is included in net changes in unrealized appreciation (depreciation) on the Statement of Changes in Net Assets.
For more information on valuation inputs, and their aggregation into the levels used in the tables above, please refer to the Security Valuation section in the accompanying Notes to Financial Statements.
At February 28, 2010, the asset allocation of the Fund was as follows:
| Asset Allocation (Unaudited) | | % of
Net Assets | |
| Convertible Bonds | | | 75.2 | | |
| Convertible Preferred Stocks | | | 18.9 | | |
| Common Stocks | | | 3.8 | | |
| | | | 97.9 | | |
| Short-Term Obligation | | | 1.8 | | |
| Other Assets & Liabilities, Net | | | 0.3 | | |
| | | | 100.0 | | |
| Acronym | | Name | |
| ADR | | American Depositary Receipt | |
|
See Accompanying Notes to Financial Statements.
13
Statement of Assets and Liabilities – Columbia Convertible Securities Fund
February 28, 2010
| Assets | | Investments, at identified cost | | $ | 416,373,999 | | |
| | | Investments, at value | | | 432,668,597 | | |
| | | Cash | | | 235 | | |
| | | Receivable for: | | | | | |
| | | Investments sold | | | 5,356,477 | | |
| | | Fund shares sold | | | 12,363 | | |
| | | Dividends | | | 270,151 | | |
| | | Interest | | | 2,333,960 | | |
| | | Expense reimbursement due from investment advisor | | | 80,650 | | |
| | | Prepaid expenses | | | 5,022 | | |
| | | Total Assets | | | 440,727,455 | | |
| Liabilities | | Payable for: | | | | | |
| | | Investments purchased | | | 5,025,030 | | |
| | | Fund shares repurchased | | | 961,864 | | |
| | | Investment advisory fee | | | 215,752 | | |
| | | Administration fee | | | 48,299 | | |
| | | Pricing and bookkeeping fees | | | 10,348 | | |
| | | Transfer agent fee | | | 34,590 | | |
| | | Trustees' fees | | | 65,359 | | |
| | | Custody fee | | | 3,108 | | |
| | | Distribution and service fees | | | 77,558 | | |
| | | Chief compliance officer expenses | | | 143 | | |
| | | Reports to shareholders | | | 137,790 | | |
| | | Other liabilities | | | 47,527 | | |
| | | Total Liabilities | | | 6,627,368 | | |
| | | Net Assets | | | 434,100,087 | | |
| Net Assets Consist of | | Paid-in capital | | | 529,402,023 | | |
| | | Undistributed net investment income | | | 2,467,274 | | |
| | | Accumulated net realized loss | | | (114,063,808 | ) | |
| | | Net unrealized appreciation on investments | | | 16,294,598 | | |
| | | Net Assets | | | 434,100,087 | | |
| Class A | | Net assets | | $ | 191,413,807 | | |
| | | Shares outstanding | | | 14,820,577 | | |
| | | Net asset value per share | | $ | 12.92 | (a) | |
| | | Maximum sales charge | | | 5.75 | % | |
| | | Maximum offering price per share | | $ | 13.71 | (b) | |
| Class B | | Net assets | | $ | 24,126,022 | | |
| | | Shares outstanding | | | 1,900,118 | | |
| | | Net asset value and offering price per share | | $ | 12.70 | (a) | |
| Class C | | Net assets | | $ | 20,103,430 | | |
| | | Shares outstanding | | | 1,560,596 | | |
| | | Net asset value and offering price per share | | $ | 12.88 | (a) | |
| Class Z | | Net assets | | $ | 198,456,828 | | |
| | | Shares outstanding | | | 15,346,840 | | |
| | | Net asset value, offering and redemption price per share | | $ | 12.93 | | |
(a) Redemption price per share is equal to net asset value less any applicable contingent deferred sales charge.
(b) On sales of $50,000 or more the offering price is reduced.
See Accompanying Notes to Financial Statements.
14
Statement of Operations – Columbia Convertible Securities Fund
For the Year Ended February 28, 2010
| | | | | ($) | |
| Investment Income | | Dividends | | | 5,059,690 | | |
| | | Interest | | | 12,894,653 | | |
| | | Foreign taxes withheld | | | (4,145 | ) | |
| | | Total Investment Income | | | 17,950,198 | | |
| Expenses | | Investment advisory fee | | | 2,864,932 | | |
| | | Administration fee | | | 645,345 | | |
| | | Distribution fee: | | | | | |
| | | Class B | | | 217,252 | | |
| | | Class C | | | 151,485 | | |
| | | Service fee: | | | | | |
| | | Class B | | | 72,417 | | |
| | | Class C | | | 50,495 | | |
| | | Distribution and service fees: | | | | | |
| | | Class A | | | 452,015 | | |
| | | Transfer agent fee | | | 421,301 | | |
| | | Pricing and bookkeeping fees | | | 117,450 | | |
| | | Trustees' fees | | | 45,294 | | |
| | | Custody fee | | | 11,512 | | |
| | | Chief compliance officer expenses | | | 759 | | |
| | | Other expenses | | | 249,874 | | |
| | | Total Expenses | | | 5,300,131 | | |
| | | Fees waived by transfer agent | | | (35,754 | ) | |
| | | Fees waived or expenses reimbursed by investment advisor | | | (143,358 | ) | |
| | | Expense reductions | | | (71 | ) | |
| | | Net Expenses | | | 5,120,948 | | |
| | | Net Investment Income | | | 12,829,250 | | |
| Net Realized and Unrealized Gain (Loss) on Investments and Foreign Currency | | Net realized gain on: | | | | | |
| | | Investments | | | 15,823,577 | | |
| | | Foreign currency transactions | | | 2,901 | | |
| | | Net realized gain | | | 15,826,478 | | |
| | | Net change in unrealized appreciation (depreciation) on investments | | | 97,282,239 | | |
| | | Net Gain | | | 113,108,717 | | |
| | | Net Increase Resulting from Operations | | | 125,937,967 | | |
See Accompanying Notes to Financial Statements.
15
Statement of Changes in Net Assets – Columbia Convertible Securities Fund
| | | | | Year Ended February 28, | |
| Increase (Decrease) in Net Assets | | | | 2010 ($) | | 2009 ($) | |
| Operations | | Net investment income | | | 12,829,250 | | | | 13,499,152 | | |
| | | Net realized gain (loss) on investments, foreign currency
transactions and written options | | | 15,826,478 | | | | (129,036,267 | ) | |
| | | Net change in unrealized appreciation (depreciation)
on investments and foreign currency translations | | | 97,282,239 | | | | (87,305,703 | ) | |
| | | Net increase (decrease) resulting from operations | | | 125,937,967 | | | | (202,842,818 | ) | |
| Distributions to Shareholders | | From net investment income: | | | | | | | | | |
| | | Class A | | | (5,127,702 | ) | | | (5,270,952 | ) | |
| | | Class B | | | (632,843 | ) | | | (854,908 | ) | |
| | | Class C | | | (430,613 | ) | | | (458,548 | ) | |
| | | Class Z | | | (6,553,878 | ) | | | (7,466,421 | ) | |
| | | From net realized gains: | | | | | | | | | |
| | | Class A | | | — | | | | (4,064,506 | ) | |
| | | Class B | | | — | | | | (1,034,439 | ) | |
| | | Class C | | | — | | | | (550,003 | ) | |
| | | Class Z | | | — | | | | (5,220,906 | ) | |
| | | Total distributions to shareholders | | | (12,745,036 | ) | | | (24,920,683 | ) | |
| | | Net Capital Stock Transactions | | | (74,409,319 | ) | | | (152,638,001 | ) | |
| | | Increase from regulatory settlements | | | 130,285 | | | | — | | |
| | | Total increase (decrease) in net assets | | | 38,913,897 | | | | (380,401,502 | ) | |
| Net Assets | | Beginning of period | | | 395,186,190 | | | | 775,587,692 | | |
| | | End of period | | | 434,100,087 | | | | 395,186,190 | | |
| | | Undistributed net investment income at end of period | | | 2,467,274 | | | | 2,244,719 | | |
See Accompanying Notes to Financial Statements.
16
Statement of Changes in Net Assets (continued) – Columbia Convertible Securities Fund
| | | Capital Stock Activity | |
| | | Year Ended
February 28, 2010 | | Year Ended
February 28, 2009 | |
| | | Shares | | Dollars ($) | | Shares | | Dollars ($) | |
| Class A | |
| Subscriptions | | | 1,675,265 | | | | 19,386,163 | | | | 1,537,088 | | | | 19,225,058 | | |
| Distributions reinvested | | | 392,420 | | | | 4,565,152 | | | | 630,014 | | | | 8,392,735 | | |
| Redemptions | | | (2,848,283 | ) | | | (33,289,324 | ) | | | (4,976,825 | ) | | | (59,899,716 | ) | |
| Net decrease | | | (780,598 | ) | | | (9,338,009 | ) | | | (2,809,723 | ) | | | (32,281,923 | ) | |
| Class B | |
| Subscriptions | | | 72,049 | | | | 795,052 | | | | 43,091 | | | | 520,935 | | |
| Distributions reinvested | | | 45,129 | | | | 511,890 | | | | 120,139 | | | | 1,598,938 | | |
| Redemptions | | | (1,470,640 | ) | | | (16,857,638 | ) | | | (1,962,040 | ) | | | (23,690,229 | ) | |
| Net decrease | | | (1,353,462 | ) | | | (15,550,696 | ) | | | (1,798,810 | ) | | | (21,570,356 | ) | |
| Class C | |
| Subscriptions | | | 94,067 | | | | 1,070,843 | | | | 181,821 | | | | 2,206,238 | | |
| Distributions reinvested | | | 21,390 | | | | 248,054 | | | | 40,032 | | | | 537,080 | | |
| Redemptions | | | (395,254 | ) | | | (4,679,053 | ) | | | (959,617 | ) | | | (11,363,854 | ) | |
| Net decrease | | | (279,797 | ) | | | (3,360,156 | ) | | | (737,764 | ) | | | (8,620,536 | ) | |
| Class Z | |
| Subscriptions | | | 3,210,315 | | | | 37,132,745 | | | | 3,541,043 | | | | 41,202,000 | | |
| Distributions reinvested | | | 157,678 | | | | 1,840,625 | | | | 251,496 | | | | 3,377,945 | | |
| Redemptions | | | (7,156,420 | ) | | | (85,133,828 | ) | | | (10,738,824 | ) | | | (134,745,131 | ) | |
| Net decrease | | | (3,788,427 | ) | | | (46,160,458 | ) | | | (6,946,285 | ) | | | (90,165,186 | ) | |
See Accompanying Notes to Financial Statements.
17
Financial Highlights – Columbia Convertible Securities Fund
Selected data for a share outstanding throughout each period is as follows:
| | | Year Ended February 28, | | Year Ended
February 29, | | Period Ended
February 28, | | Year Ended March 31, | |
| Class A Shares | | 2010 | | 2009 | | 2008 | | 2007 (a) | | 2006 (b) | | 2005 | |
| Net Asset Value, Beginning of Period | | $ | 9.93 | | | $ | 14.90 | | | $ | 16.62 | | | $ | 17.59 | | | $ | 17.35 | | | $ | 17.33 | | |
| Income from Investment Operations: | |
| Net investment income (c) | | | 0.34 | | | | 0.29 | | | | 0.32 | | | | 0.35 | | | | 0.41 | | | | 0.43 | | |
Net realized and unrealized gain
(loss) on investments, foreign
currency and written options | | | 2.99 | | | | (4.73 | ) | | | (0.27 | ) | | | 0.91 | | | | 1.32 | | | | 0.24 | | |
| Total from investment operations | | | 3.33 | | | | (4.44 | ) | | | 0.05 | | | | 1.26 | | | | 1.73 | | | | 0.67 | | |
| Less Distributions to Shareholders: | |
| From net investment income | | | (0.34 | ) | | | (0.30 | ) | | | (0.38 | ) | | | (0.43 | ) | | | (0.42 | ) | | | (0.50 | ) | |
| From net realized gains | | | — | | | | (0.23 | ) | | | (1.39 | ) | | | (1.80 | ) | | | (1.07 | ) | | | (0.15 | ) | |
| Total distributions to shareholders | | | (0.34 | ) | | | (0.53 | ) | | | (1.77 | ) | | | (2.23 | ) | | | (1.49 | ) | | | (0.65 | ) | |
| Increase from regulatory settlements | | | — | (d) | | | — | | | | — | | | | — | | | | — | | | | — | | |
| Net Asset Value, End of Period | | $ | 12.92 | | | $ | 9.93 | | | $ | 14.90 | | | $ | 16.62 | | | $ | 17.59 | | | $ | 17.35 | | |
| Total return (e)(f) | | | 33.91 | % | | | (30.64 | )% | | | (0.22 | )% | | | 7.96 | %(g) | | | 10.54 | % | | | 3.87 | % | |
Ratios to Average Net Assets/
Supplemental Data: | |
| Net expenses before interest expense (h) | | | 1.20 | % | | | 1.21 | % | | | 1.18 | % | | | 1.16 | %(i) | | | 1.09 | % | | | 1.16 | % | |
| Interest expense | | | — | | | | — | %(j) | | | — | %(j) | | | — | %(i)(j) | | | — | %(j) | | | — | %(j) | |
| Net expenses (h) | | | 1.20 | % | | | 1.21 | % | | | 1.18 | % | | | 1.16 | %(i) | | | 1.09 | % | | | 1.16 | % | |
| Waiver/Reimbursement | | | 0.04 | % | | | 0.03 | % | | | 0.01 | % | | | 0.01 | %(i) | | | 0.06 | %(k) | | | 0.03 | %(k) | |
| Net investment income (h) | | | 2.88 | % | | | 2.33 | % | | | 1.91 | % | | | 2.25 | %(i) | | | 2.39 | % | | | 2.50 | % | |
| Portfolio turnover rate | | | 117 | % | | | 92 | % | | | 77 | % | | | 44 | %(g) | | | 40 | % | | | 37 | % | |
| Net assets, end of period (000s) | | $ | 191,414 | | | $ | 154,987 | | | $ | 274,370 | | | $ | 328,023 | | | $ | 352,010 | | | $ | 373,390 | | |
(a) The Fund changed its fiscal year end from March 31 to February 28. Per share data and total return reflect activity from April 1, 2006 through February 28, 2007.
(b) On August 22, 2005, the Fund's Investor A shares were renamed Class A shares.
(c) Per share data was calculated using the average shares outstanding during the period.
(d) Rounds to less than $0.01 per share.
(e) Total return at net asset value assuming all distributions reinvested and no initial sales charge or contingent deferred sales charge.
(f) Had the investment advisor and/or any of its affiliates not waived fees or reimbursed a portion of expenses, total return would have been reduced.
(g) Not annualized.
(h) The benefits derived from expense reductions had an impact of less than 0.01%.
(i) Annualized.
(j) Rounds to less than 0.01%.
(k) Bank of America Corporation assumed certain non-recurring costs. Absent these non-recurring costs, the waiver/reimbursement ratio would have been -% and -% for the years ended March 31, 2006 and March 31, 2005, respectively.
See Accompanying Notes to Financial Statements.
18
Financial Highlights – Columbia Convertible Securities Fund
Selected data for a share outstanding throughout each period is as follows:
| | | Year Ended February 28, | | Year Ended
February 29, | | Period Ended
February 28, | | Year Ended March 31, | |
| Class B Shares | | 2010 | | 2009 | | 2008 | | 2007 (a) | | 2006 (b) | | 2005 | |
| Net Asset Value, Beginning of Period | | $ | 9.77 | | | $ | 14.66 | | | $ | 16.37 | | | $ | 17.38 | | | $ | 17.16 | | | $ | 17.15 | | |
| Income from Investment Operations: | |
| Net investment income (c) | | | 0.24 | | | | 0.19 | | | | 0.19 | | | | 0.23 | | | | 0.28 | | | | 0.30 | | |
Net realized and unrealized gain
(loss) on investments, foreign
currency and written options | | | 2.94 | | | | (4.65 | ) | | | (0.26 | ) | | | 0.90 | | | | 1.30 | | | | 0.23 | | |
| Total from investment operations | | | 3.18 | | | | (4.46 | ) | | | (0.07 | ) | | | 1.13 | | | | 1.58 | | | | 0.53 | | |
| Less Distributions to Shareholders: | |
| From net investment income | | | (0.25 | ) | | | (0.20 | ) | | | (0.25 | ) | | | (0.34 | ) | | | (0.29 | ) | | | (0.37 | ) | |
| From net realized gains | | | — | | | | (0.23 | ) | | | (1.39 | ) | | | (1.80 | ) | | | (1.07 | ) | | | (0.15 | ) | |
| Total distributions to shareholders | | | (0.25 | ) | | | (0.43 | ) | | | (1.64 | ) | | | (2.14 | ) | | | (1.36 | ) | | | (0.52 | ) | |
| Increase from regulatory settlements | | | — | (d) | | | — | | | | — | | | | — | | | | — | | | | — | | |
| Net Asset Value, End of Period | | $ | 12.70 | | | $ | 9.77 | | | $ | 14.66 | | | $ | 16.37 | | | $ | 17.38 | | | $ | 17.16 | | |
| Total return (e)(f) | | | 32.86 | % | | | (31.14 | )% | | | (0.92 | )% | | | 7.19 | %(g) | | | 9.72 | % | | | 3.08 | % | |
Ratios to Average Net Assets/
Supplemental Data: | |
| Net expenses before interest expense (h) | | | 1.95 | % | | | 1.96 | % | | | 1.93 | % | | | 1.91 | %(i) | | | 1.84 | % | | | 1.91 | % | |
| Interest expense | | | — | | | | — | %(j) | | | — | %(j) | | | — | %(i)(j) | | | — | %(j) | | | — | %(j) | |
| Net expenses (h) | | | 1.95 | % | | | 1.96 | % | | | 1.93 | % | | | 1.91 | %(i) | | | 1.84 | % | | | 1.91 | % | |
| Waiver/Reimbursement | | | 0.04 | % | | | 0.03 | % | | | 0.01 | % | | | 0.01 | %(i) | | | 0.06 | %(k) | | | 0.03 | %(k) | |
| Net investment income (h) | | | 2.10 | % | | | 1.53 | % | | | 1.16 | % | | | 1.50 | %(i) | | | 1.64 | % | | | 1.75 | % | |
| Portfolio turnover rate | | | 117 | % | | | 92 | % | | | 77 | % | | | 44 | %(g) | | | 40 | % | | | 37 | % | |
| Net assets, end of period (000s) | | $ | 24,126 | | | $ | 31,792 | | | $ | 74,074 | | | $ | 99,360 | | | $ | 116,566 | | | $ | 143,194 | | |
(a) The Fund changed its fiscal year end from March 31 to February 28. Per share data and total return reflect activity from April 1, 2006 through February 28, 2007.
(b) On August 22, 2005, the Fund's Investor B shares were renamed Class B shares.
(c) Per share data was calculated using the average shares outstanding during the period.
(d) Rounds to less than $0.01 per share.
(e) Total return at net asset value assuming all distributions reinvested and no contingent deferred sales charge.
(f) Had the investment advisor and/or any of its affiliates not waived fees or reimbursed a portion of expenses, total return would have been reduced.
(g) Not annualized.
(h) The benefits derived from expense reductions had an impact of less than 0.01%.
(i) Annualized.
(j) Rounds to less than 0.01%.
(k) Bank of America Corporation assumed certain non-recurring costs. Absent these non-recurring costs, the waiver/reimbursement ratio would have been -% and -% for the years ended March 31, 2006 and March 31, 2005, respectively.
See Accompanying Notes to Financial Statements.
19
Financial Highlights – Columbia Convertible Securities Fund
Selected data for a share outstanding throughout each period is as follows:
| | | Year Ended February 28, | | Year Ended
February 29, | | Period Ended
February 28, | | Year Ended March 31, | |
| Class C Shares | | 2010 | | 2009 | | 2008 | | 2007 (a) | | 2006 (b) | | 2005 | |
| Net Asset Value, Beginning of Period | | $ | 9.91 | | | $ | 14.86 | | | $ | 16.58 | | | $ | 17.57 | | | $ | 17.34 | | | $ | 17.31 | | |
| Income from Investment Operations: | |
| Net investment income (c) | | | 0.25 | | | | 0.20 | | | | 0.19 | | | | 0.23 | | | | 0.28 | | | | 0.30 | | |
Net realized and unrealized gain
(loss) on investments, foreign
currency and written options | | | 2.97 | | | | (4.72 | ) | | | (0.27 | ) | | | 0.92 | | | | 1.31 | | | | 0.25 | | |
| Total from investment operations | | | 3.22 | | | | (4.52 | ) | | | (0.08 | ) | | | 1.15 | | | | 1.59 | | | | 0.55 | | |
| Less Distributions to Shareholders: | |
| From net investment income | | | (0.25 | ) | | | (0.20 | ) | | | (0.25 | ) | | | (0.34 | ) | | | (0.29 | ) | | | (0.37 | ) | |
| From net realized gains | | | — | | | | (0.23 | ) | | | (1.39 | ) | | | (1.80 | ) | | | (1.07 | ) | | | (0.15 | ) | |
| Total distributions to shareholders | | | (0.25 | ) | | | (0.43 | ) | | | (1.64 | ) | | | (2.14 | ) | | | (1.36 | ) | | | (0.52 | ) | |
| Increase from regulatory settlements | | | — | (d) | | | — | | | | — | | | | — | | | | — | | | | — | | |
| Net Asset Value, End of Period | | $ | 12.88 | | | $ | 9.91 | | | $ | 14.86 | | | $ | 16.58 | | | $ | 17.57 | | | $ | 17.34 | | |
| Total return (e)(f) | | | 32.80 | % | | | (31.13 | )% | | | (0.97 | )% | | | 7.23 | %(g) | | | 9.68 | % | | | 3.16 | % | |
Ratios to Average Net Assets/
Supplemental Data: | |
| Net expenses before interest expense (h) | | | 1.95 | % | | | 1.96 | % | | | 1.93 | % | | | 1.91 | %(i) | | | 1.84 | % | | | 1.91 | % | |
| Interest expense | | | — | | | | — | %(j) | | | — | %(j) | | | — | %(i)(j) | | | — | %(j) | | | — | %(j) | |
| Net expenses (h) | | | 1.95 | % | | | 1.96 | % | | | 1.93 | % | | | 1.91 | %(i) | | | 1.84 | % | | | 1.91 | % | |
| Waiver/Reimbursement | | | 0.04 | % | | | 0.03 | % | | | 0.01 | % | | | 0.01 | %(i) | | | 0.06 | %(k) | | | 0.03 | %(k) | |
| Net investment income (h) | | | 2.12 | % | | | 1.54 | % | | | 1.16 | % | | | 1.50 | %(i) | | | 1.64 | % | | | 1.75 | % | |
| Portfolio turnover rate | | | 117 | % | | | 92 | % | | | 77 | % | | | 44 | %(g) | | | 40 | % | | | 37 | % | |
| Net assets, end of period (000s) | | $ | 20,103 | | | $ | 18,239 | | | $ | 38,320 | | | $ | 52,794 | | | $ | 57,193 | | | $ | 66,844 | | |
(a) The Fund changed its fiscal year end from March 31 to February 28. Per share data and total return reflect activity from April 1, 2006 through February 28, 2007.
(b) On August 22, 2005, the Fund's Investor C shares were renamed Class C shares.
(c) Per share data was calculated using the average shares outstanding during the period.
(d) Rounds to less than $0.01 per share.
(e) Total return at net asset value assuming all distributions reinvested and no contingent deferred sales charge.
(f) Had the investment advisor and/or any of its affiliates not waived fees or reimbursed a portion of expenses, total return would have been reduced.
(g) Not annualized.
(h) The benefits derived from expense reductions had an impact of less than 0.01%.
(i) Annualized.
(j) Rounds to less than 0.01%.
(k) Bank of America Corporation assumed certain non-recurring costs. Absent these non-recurring costs, the waiver/reimbursement ratio would have been -% and -% for the years ended March 31, 2006 and March 31, 2005, respectively.
See Accompanying Notes to Financial Statements.
20
Financial Highlights – Columbia Convertible Securities Fund
Selected data for a share outstanding throughout each period is as follows:
| | | Year Ended February 28, | | Year Ended
February 29, | | Period Ended
February 28, | | Year Ended March 31, | |
| Class Z Shares | | 2010 | | 2009 | | 2008 | | 2007 (a) | | 2006 (b) | | 2005 | |
| Net Asset Value, Beginning of Period | | $ | 9.94 | | | $ | 14.91 | | | $ | 16.62 | | | $ | 17.59 | | | $ | 17.35 | | | $ | 17.32 | | |
| Income from Investment Operations: | |
| Net investment income (c) | | | 0.37 | | | | 0.33 | | | | 0.36 | | | | 0.39 | | | | 0.46 | | | | 0.48 | | |
Net realized and unrealized gain
(loss) on investments, foreign
currency and written options | | | 2.99 | | | | (4.73 | ) | | | (0.26 | ) | | | 0.91 | | | | 1.31 | | | | 0.24 | | |
| Total from investment operations | | | 3.36 | | | | (4.40 | ) | | | 0.10 | | | | 1.30 | | | | 1.77 | | | | 0.72 | | |
| Less Distributions to Shareholders: | |
| From net investment income | | | (0.37 | ) | | | (0.34 | ) | | | (0.42 | ) | | | (0.47 | ) | | | (0.46 | ) | | | (0.54 | ) | |
| From net realized gains | | | — | | | | (0.23 | ) | | | (1.39 | ) | | | (1.80 | ) | | | (1.07 | ) | | | (0.15 | ) | |
| Total distributions to shareholders | | | (0.37 | ) | | | (0.57 | ) | | | (1.81 | ) | | | (2.27 | ) | | | (1.53 | ) | | | (0.69 | ) | |
| Increase from regulatory settlements | | | — | (d) | | | — | | | | — | | | | — | | | | — | | | | — | | |
| Net Asset Value, End of Period | | $ | 12.93 | | | $ | 9.94 | | | $ | 14.91 | | | $ | 16.62 | | | $ | 17.59 | | | $ | 17.35 | | |
| Total return (e)(f) | | | 34.20 | % | | | (30.43 | )% | | | 0.10 | % | | | 8.16 | %(g) | | | 10.81 | % | | | 4.18 | % | |
Ratios to Average Net Assets/
Supplemental Data: | |
| Net expenses before interest expense (h) | | | 0.95 | % | | | 0.96 | % | | | 0.93 | % | | | 0.91 | %(i) | | | 0.84 | % | | | 0.91 | % | |
| Interest expense | | | — | | | | — | %(j) | | | — | %(j) | | | — | %(i)(j) | | | — | %(j) | | | — | %(j) | |
| Net expenses (h) | | | 0.95 | % | | | 0.96 | % | | | 0.93 | % | | | 0.91 | %(i) | | | 0.84 | % | | | 0.91 | % | |
| Waiver/Reimbursement | | | 0.04 | % | | | 0.03 | % | | | 0.01 | % | | | 0.01 | %(i) | | | 0.06 | %(k) | | | 0.03 | %(k) | |
| Net investment income (h) | | | 3.12 | % | | | 2.56 | % | | | 2.16 | % | | | 2.50 | %(i) | | | 2.64 | % | | | 2.75 | % | |
| Portfolio turnover rate | | | 117 | % | | | 92 | % | | | 77 | % | | | 44 | %(g) | | | 40 | % | | | 37 | % | |
| Net assets, end of period (000s) | | $ | 198,457 | | | $ | 190,168 | | | $ | 388,824 | | | $ | 611,157 | | | $ | 775,758 | | | $ | 924,893 | | |
(a) The Fund changed its fiscal year end from March 31 to February 28. Per share data and total return reflect activity from April 1, 2006 through February 28, 2007.
(b) On August 22, 2005, the Fund's Investor Z shares were renamed Class Z shares.
(c) Per share data was calculated using the average shares outstanding during the period.
(d) Rounds to less than $0.01 per share.
(e) Total return at net asset value assuming all distributions reinvested.
(f) Had the investment advisor and/or any of its affiliates not waived fees or reimbursed a portion of expenses, total return would have been reduced.
(g) Not annualized.
(h) The benefits derived from expense reductions had an impact of less than 0.01%.
(i) Annualized.
(j) Rounds to less than 0.01%.
(k) Bank of America Corporation assumed certain non-recurring costs. Absent these non-recurring costs, the waiver/reimbursement ratio would have been -% and -% for the years ended March 31, 2006 and March 31, 2005, respectively.
See Accompanying Notes to Financial Statements.
21
Notes to Financial Statements – Columbia Convertible Securities Fund
February 28, 2010
Note 1. Organization
Columbia Convertible Securities Fund (the "Fund"), a series of Columbia Funds Series Trust (the "Trust"), is a diversified fund. The Trust is registered under the Investment Company Act of 1940, as amended (the "1940 Act"), as an open-end management investment company organized as a Delaware statutory trust.
Investment Objective
The Fund seeks total return, consisting of capital appreciation and current income.
Fund Shares
The Trust may issue an unlimited number of shares, and the Fund offers four classes of shares: Class A, Class B, Class C and Class Z. Each share class has its own expense structure and sales charges, as applicable. Effective June 22, 2009, the Fund no longer accepts investments from new or existing investors in the Fund's Class B shares, except in connection with the reinvestment of any dividend and/or capital gain distributions in Class B shares of the Fund and exchanges by existing Class B shareholders of the other Columbia Funds.
Class A shares are subject to a maximum front-end sales charge of 5.75% based on the amount of initial investment. Class A shares purchased without an initial sales charge in accounts aggregating $1 million to $50 million at the time of purchase are subject to a 1.00% contingent deferred sales charge ("CDSC") if the shares are sold within one year after purchase. Class B shares are subject to a maximum CDSC of 5.00% based upon the holding period after purchase. Class B shares will convert to Class A shares eight years after purchase. Class C shares are subject to a 1.00% CDSC on shares sold within one year after purchase. Class Z shares are offered continuously at net asset value. There are certain restrictions on the purchase of Class Z shares, as described in the Fund's prospectus.
Note 2. Significant Accounting Policies
The preparation of financial statements in accordance with accounting principles generally accepted in the United States of America ("GAAP") requires management to make certain estimates and assumptions that affect the reported amounts of assets and liabilities, the disclosure of contingent assets and liabilities at the date of the financial statements and the reported amounts of revenue and expenses during the reporting period. Actual results could differ from those estimates.
The following is a summary of significant accounting policies consistently followed by the Fund in the preparation of its financial statements.
Security Valuation
Debt securities generally are valued by pricing services approved by the Trust's Board of Trustees, based upon market transactions for normal, institutional-size trading units of similar securities. The services may use various pricing techniques which take into account appropriate factors such as yield, quality, coupon rate, maturity, type of issue, trading characteristics and other data, as well as broker quotes. Debt securities for which quotations are readily available are valued at an over-the-counter or exchange bid quotation.
Equity securities and exchange-traded funds are valued at the last sale price on the principal exchange on which they trade, except for securities traded on the NASDAQ, which are valued at the NASDAQ official close price. Unlisted securities or listed securities for which there were no sales during the day are valued at the closing bid price on such exchanges or over-the-counter markets.
Short-term investments maturing in 60 days or less are valued at amortized cost, which approximates market value.
Investments in other open-end investment companies are valued at net asset value.
Investments for which market quotations are not readily available, or that have quotations which management believes are not reliable, are valued at fair value as determined in good faith under consistently applied procedures established by and under the general supervision of the Board of Trustees. If a security is valued at fair value, such value is likely to be different from the last quoted market price for the security. The determination of fair value often requires significant judgment. To determine fair value, management may use assumptions including but not limited to future cash flows and estimated risk premiums. Multiple inputs from various sources may be used to determine value.
GAAP establishes a hierarchy that prioritizes the inputs to valuation techniques used to measure fair value giving the
22
Columbia Convertible Securities Fund, February 28, 2010
highest priority to unadjusted quoted prices in active markets for identical securities (level 1 measurements) and the lowest priority to unobservable inputs (level 3 measurements) when market prices are not readily available or reliable. The three levels of the fair value hierarchy are described below:
• Level 1 – quoted prices in active markets for identical securities
• Level 2 – prices determined using other significant observable inputs (including quoted prices for similar securities, interest rates, prepayment speeds, credit risk and others)
• Level 3 – prices determined using significant unobservable inputs. In situations where quoted prices or observable inputs are unavailable or less reliable, unobservable inputs may be used. Unobservable inputs may include management's own assumptions about the factors market participants would use in pricing an investment.
The inputs or methodology used for valuing securities are not necessarily an indication of the risk associated with investing in those securities.
Security Transactions
Security transactions are accounted for on the trade date. Cost is determined and gains (losses) are based upon the specific identification method for both financial statement and federal income tax purposes.
Repurchase Agreements
The Fund may engage in repurchase agreement transactions with institutions that Columbia Management Advisors, LLC ("Columbia"), the Fund's investment advisor, has determined are creditworthy. The Fund, through its custodian, receives delivery of the underlying securities collateralizing a repurchase agreement. Columbia is responsible for determining that the collateral is at least equal, at all times, to the value of the repurchase obligation including interest. A repurchase agreement transaction involves certain risks in the event of default or insolvency of the counterparty. These risks include possible delays in or restrictions on the Fund's ability to dispose of the underlying securities and a possible decline in the value of the underlying securities during the period while the Fund seeks to assert its rights.
Income Recognition
Corporate actions and dividend income are recorded on the ex-date.
Distributions received from real estate investment trusts (REITs) in excess of their income are recorded as a reduction of the cost of the related investments. If the Fund no longer owns the applicable securities, any distributions received in excess of income are recorded as realized gains.
Interest income is recorded on the accrual basis. Premium and discount are amortized and accreted, respectively, on all debt securities except for premiums attributable to the conversion feature on convertible securities.
Expenses
General expenses of the Trust are allocated to the Fund and other series of the Trust based upon relative net assets or other expense allocation methodologies determined by the nature of the expense. Expenses directly attributable to the Fund are charged to the Fund.
Determination of Class Net Asset Value
All income, expenses (other than class-specific expenses, as shown on the Statement of Operations) and realized and unrealized gains (losses) are allocated to each class of the Fund on a daily basis for purposes of determining the net asset value of each class. Income and expenses are allocated to each class based on the settled shares method, while realized and unrealized gains (losses) are allocated based on the relative net assets of each class.
Federal Income Tax Status
The Fund intends to qualify each year as a "regulated investment company" under Subchapter M of the Internal Revenue Code, as amended, and will distribute substantially all of its taxable income, if any, for its tax year, and as such will not be subject to federal income taxes. In addition, the Fund intends to distribute in each calendar year substantially all of its net investment income, capital gains and certain other amounts, if any, such that the Fund should not be subject to federal excise tax. Therefore, no provision is made for federal income or excise taxes.
23
Columbia Convertible Securities Fund, February 28, 2010
Distributions to Shareholders
Distributions from net investment income are declared and paid quarterly. Net realized capital gains, if any, are distributed at least annually. Income distributions and capital gain distributions are determined in accordance with federal income tax regulations which may differ from GAAP.
Indemnification
In the normal course of business, the Fund enters into contracts that contain a variety of representations and warranties and which provide general indemnities. The Fund's maximum exposure under these arrangements is unknown because this would involve future claims against the Fund. Also, under the Trust's organizational documents and by contract, the Trustees and officers of the Trust are indemnified against certain liabilities that may arise out of actions relating to their duties to the Trust. However, based on experience, the Fund expects the risk of loss due to these representations, warranties and indemnities to be minimal.
Note 3. Federal Tax Information
The timing and character of income and capital gain distributions are determined in accordance with income tax regulations, which may differ from GAAP. Reclassifications are made to the Fund's capital accounts for permanent tax differences to reflect income and gains available for distribution (or available capital loss carryforwards) under income tax regulations.
For the year ended February 28, 2010, permanent book and tax basis differences resulting primarily from differing treatments for foreign currency transactions, adjustments on certain convertible preferred securities and proceeds received from litigation settlements were identified and reclassified among the components of the Fund's net assets as follows:
Undistributed
Net Investment
Income | | Accumulated
Net Realized
Loss | | Paid-In Capital | |
| $ | 138,341 | | | $ | (8,055 | ) | | $ | (130,286 | ) | |
Net investment income and net realized gains (losses), as disclosed on the Statement of Operations, and net assets were not affected by this reclassification.
The tax character of distributions paid during the years ended February 28, 2010 and February 28, 2009 was as follows:
| | | February 28, | |
| Distributions paid from | | 2010 | | 2009 | |
| Ordinary Income* | | $ | 12,745,036 | | | $ | 14,240,428 | | |
| Long-Term Capital Gains | | | — | | | | 10,680,255 | | |
* For tax purposes short-term capital gain distributions, if any, are considered ordinary income distributions.
As of February 28, 2010, the components of distributable earnings on a tax basis were as follows:
Undistributed
Ordinary
Income | | Undistributed
Long-Term
Capital Gains | | Net Unrealized
Appreciation* | |
| $ | 2,455,127 | | | $ | — | | | $ | 16,115,688 | | |
* The differences between book-basis and tax-basis net unrealized appreciation are primarily due to deferral of losses from wash sales.
Unrealized appreciation and depreciation at February 28, 2010, based on cost of investments for federal income tax purposes were:
| Unrealized appreciation | | $ | 30,039,644 | | |
| Unrealized depreciation | | | (13,923,956 | ) | |
| Net unrealized appreciation | | $ | 16,115,688 | | |
The following capital loss carryforwards may be available to reduce taxable income arising from future net realized gains on investments, if any, to the extent permitted by the Internal Revenue Code:
| Year of Expiration | | Capital Loss
Carryforwards | |
| 2017 | | $ | 71,063,081 | | |
| 2018 | | | 39,523,679 | | |
| | | $ | 110,586,760 | | |
24
Columbia Convertible Securities Fund, February 28, 2010
Under current tax rules, certain currency and capital losses realized after October 31 may be deferred and treated as occurring on the first day of the following fiscal year. As of February 28, 2010, post-October capital losses of $3,417,368 attributed to security transactions were deferred to March 1, 2010.
Management is required to determine whether a tax position of the Fund is more likely than not to be sustained upon examination by the applicable taxing authority, including resolution of any related appeals or litigation processes, based on the technical merits of the position. The tax benefit to be recognized by the Fund is measured as the largest amount of benefit that is greater than fifty percent likely of being realized upon ultimate settlement. Management is not aware of any tax positions for which it is reasonably possible that the total amounts of unrecognized tax benefits will significantly change in the next twelve months. However, management's conclusions may be subject to review and adjustment at a later date based on factors including, but not limited to, new tax laws, regulations, and administrative interpretations (including relevant court decisions). The Fund's federal tax returns for the prior three fiscal year s remain subject to examination by the Internal Revenue Service.
Note 4. Fees and Compensation Paid to Affiliates
Investment Advisory Fee
Columbia, an indirect, wholly owned subsidiary of Bank of America Corporation ("BOA"), provides investment advisory services to the Fund. In rendering investment advisory services to the Fund, Columbia may use the portfolio management and research resources of Columbia Management Pte. Ltd, an affiliate of Columbia. Columbia receives a monthly investment advisory fee based on the Fund's average daily net assets at the following annual rates:
| Average Daily Net Assets | | Annual Fee Rate | |
| First $500 million | | | 0.65 | % | |
| $500 million to $1 billion | | | 0.60 | % | |
| $1 billion to $1.5 billion | | | 0.55 | % | |
| Over $1.5 billion | | | 0.50 | % | |
For the year ended February 28, 2010, the Fund's effective investment advisory fee rate was 0.65% of the Fund's average daily net assets.
Bank of America, N.A., an indirect parent company of Columbia, entered into an agreement dated September 29, 2009, to sell a portion of the asset management business of Columbia Management Group, LLC to Ameriprise Financial, Inc. ("Ameriprise Financial"). The transaction ("Transaction") includes the sale of the part of the asset management business that advises long-term mutual funds, including the Fund. The Transaction is subject to certain approvals and other conditions to closing, and is currently expected to close on or about May 1, 2010 (the "Closing"). In connection with the Closing, certain changes will occur, including a change in the entities serving as the investment advisor, administrator, distributor and transfer agent of the Fund. RiverSource Investments, LLC (the "New Advisor"), a subsidiary of Ameriprise Financial, will become the investment advisor of the Fund upon the Closing. The New Advisor will serve as inves tment advisor under a new investment management services agreement effective upon the closing. The New Advisor expects to change its name to Columbia Management Investment Advisers, LLC upon or shortly after the Closing. Effective upon the Closing, as the context requires, references to Columbia shall be deemed to refer to the New Advisor.
Administration Fee
Columbia provides administrative and other services to the Fund for a monthly administration fee at the annual rate of 0.17% of the Fund's average daily net assets, less the fees payable by the Fund as described under the Pricing and Bookkeeping Fees note below.
The New Advisor will become the administrator of the Fund under a new administrative services agreement effective upon the Closing.
Pricing and Bookkeeping Fees
The Fund has entered into a Financial Reporting Services Agreement (the "Financial Reporting Services Agreement") with State Street Bank and Trust Company ("State Street") and Columbia pursuant to which State Street provides financial reporting services to the Fund. The Fund has also entered into an Accounting Services Agreement (collectively
25
Columbia Convertible Securities Fund, February 28, 2010
with the Financial Reporting Services Agreement, the "State Street Agreements") with State Street and Columbia pursuant to which State Street provides accounting services to the Fund. Under the State Street Agreements, the Fund pays State Street an annual fee of $38,000 paid monthly plus an additional monthly fee based on an annualized percentage rate of average daily net assets of the Fund for the month. The aggregate fee will not exceed $140,000 per year (exclusive of out-of-pocket expenses and charges). The Fund also reimburses State Street for certain out-of-pocket expenses and charges.
Among other updates to the State Street Agreements, Columbia will assign and delegate its rights and obligations thereunder to the New Advisor upon the Closing.
The Fund has entered into a Pricing and Bookkeeping Oversight and Services Agreement (the "Services Agreement") with Columbia. Under the Services Agreement, Columbia provides services related to Fund expenses and the requirements of the Sarbanes-Oxley Act of 2002, and provides oversight of the accounting and financial reporting services provided by State Street. Under the Services Agreement, the Fund reimburses Columbia for out-of-pocket expenses and charges, including fees payable to third parties, such as for pricing the Fund's portfolio securities, incurred by Columbia in the performance of services under the Services Agreement.
The Services Agreement will be terminated upon the Closing, and the services provided thereunder will be covered under the administrative services agreement with the New Advisor.
Transfer Agent Fee
Columbia Management Services, Inc. (the "Transfer Agent"), an affiliate of Columbia and an indirect, wholly owned subsidiary of BOA, provides shareholder services to the Fund and has contracted with Boston Financial Data Services ("BFDS") to serve as sub-transfer agent. Effective January 1, 2010, the Transfer Agent is entitled to receive a fee for its services, paid monthly, at the annual rate of $22.36 per account plus reimbursement of certain sub-transfer agent fees paid by the Transfer Agent (exclusive of BFDS fees), calculated based on assets held in omnibus accounts and intended to recover the cost of payments to other parties (including affiliates of BOA) for services to those accounts. Prior to January 1, 2010, the annual rate was $17.34 per account. The Transfer Agent pays the fees of BFDS for services as sub-transfer agent and is not entitled to reimbursement for such fees from the Fund.
The Transfer Agent may also retain, as additional compensation for its services, fees for wire, telephone and redemption orders, Individual Retirement Account ("IRA") trustee agent fees and account transcript fees due to the Transfer Agent from shareholders of the Fund and credits (net of bank charges) earned with respect to balances in accounts the Transfer Agent maintains in connection with its services to the Fund. The Transfer Agent also receives reimbursement for certain out-of-pocket expenses.
Prior to May 1, 2009, the Transfer Agent voluntarily waived a portion of its fees for accounts other than omnibus accounts, so that transfer agent fees (exclusive of out-of-pocket expenses and sub-transfer agent fees) did not exceed 0.02% annually of the Fund's average daily net assets.
An annual minimum account balance fee of $20 may apply to certain accounts with a value below the Fund's initial minimum investment requirements to reduce the impact of small accounts on transfer agent fees. These minimum account balance fees are recorded as part of expense reductions on the Statement of Operations. For the year ended February 28, 2010, no minimum account balance fees were charged by the Fund.
RiverSource Service Corporation (the "New Transfer Agent"), a subsidiary of Ameriprise Financial, will become the transfer agent of the Fund upon the Closing. The New Transfer Agent expects to change its name to Columbia Management Investment Services Corp. upon or shortly after the Closing.
Underwriting Discounts, Service and Distribution Fees
Columbia Management Distributors, Inc. (the "Distributor"), an affiliate of Columbia and an indirect, wholly owned subsidiary of BOA, is the principal underwriter of the Fund's shares. For the year ended February 28, 2010, the Distributor has retained net underwriting discounts of $6,663 on sales of the Fund's Class A shares and received net CDSC fees of $15,863 and $141 on Class B and Class C share redemptions, respectively.
RiverSource Fund Distributors, Inc. (the "New Distributor"), a subsidiary of Ameriprise Financial, will become the distributor of the Fund upon the Closing. The New Distributor expects to
26
Columbia Convertible Securities Fund, February 28, 2010
change its name to Columbia Management Investment Distributors, Inc. upon or shortly after the Closing.
The Trust has adopted shareholder servicing plans and distribution plans for the Class B and Class C shares of the Fund and a combined distribution and shareholder servicing plan for the Class A shares of the Fund. The shareholder servicing plans permit the Fund to compensate or reimburse servicing agents for the shareholder services they have provided. The distribution plans, adopted pursuant to Rule 12b-1 under the 1940 Act, permit the Fund to compensate or reimburse the Distributor and/or selling agents for activities or expenses primarily intended to result in the sale of the classes' shares. Payments are made at an annual rate and paid monthly, as a percentage of average daily net assets, set from time to time by the Board of Trustees, and are charged as expenses of the Fund directly to the applicable share class. A substantial portion of the expenses incurred pursuant to these plans is paid to affiliates of BOA and the Dis tributor.
The annual rates in effect and plan limits, as a percentage of average daily net assets are as follows:
| | | Current
Rate | | Plan
Limit | |
Class A Combined Distribution
and Shareholder Servicing Plan | | | 0.25 | % | | | 0.25 | % | |
Class B and Class C Shareholder
Servicing Plans | | | 0.25 | % | | | 0.25 | % | |
Class B and Class C
Distribution Plans | | | 0.75 | % | | | 0.75 | % | |
Expense Limits and Fee Waivers
Effective November 9, 2009, Columbia has voluntarily agreed to reimburse a portion of the Fund's expenses so that the Fund's ordinary operating expenses (excluding any distribution and service fees, brokerage commissions, interest, taxes and extraordinary expenses, but including custodian charges relating to overdrafts, if any) after giving effect to any balance credits from the Fund's custodian, do not exceed the annual rate of 0.90% of the Fund's average daily net assets. Columbia, in its discretion, may revise or discontinue this arrangement at any time.
For the period May 1, 2009 through November 9, 2009, Columbia voluntarily agreed to reimburse a portion of the Fund's expenses so that the Fund's ordinary operating expenses (excluding any distribution and service fees, brokerage commissions, interest, taxes and extraordinary expenses, but including custodian charges relating to overdrafts, if any) after giving effect to any balance credits from the Fund's custodian, did not exceed the annual rate of 0.95% of the Fund's average daily net assets.
Fees Paid to Officers and Trustees
All officers of the Fund are employees of Columbia or its affiliates and, with the exception of the Fund's Chief Compliance Officer, receive no compensation from the Fund. The Board of Trustees has appointed a Chief Compliance Officer to the Fund in accordance with federal securities regulations. The Fund, along with other affiliated funds, pays its pro-rata share of the expenses associated with the Chief Compliance Officer. The Fund's expenses for the Chief Compliance Officer will not exceed $15,000 per year.
Trustees are compensated for their services to the Fund, as set forth on the Statement of Operations. The Trust's eligible Trustees may participate in a non-qualified deferred compensation plan which may be terminated at any time. Any payments to plan participants are paid solely out of the Fund's assets. Income earned on the plan participant's deferral account is based on the rate of return of the eligible mutual funds selected by the participant or, if no funds are selected, on the rate of return of Columbia Treasury Reserves, another portfolio of the Trust. The expense for the deferred compensation plan, which includes trustees' fees deferred during the current period as well as any gains or losses on the trustees' deferred compensation balances as a result of market fluctuations, is included in "Trustees' fees" on the Statement of Operations. The liability for the deferred compensation plan is included in "Trustees' fees" on the Statement of Assets and Liabilities.
Other Related Party Transactions
In connection with the purchase and sale of its securities during the year, the Fund used one or more brokers that are affiliates of BOA. Total brokerage commissions paid to affiliated brokers for the year ended February 28, 2010 was $2,375.
27
Columbia Convertible Securities Fund, February 28, 2010
Note 5. Custody Credits
The Fund has an agreement with its custodian bank under which custody fees may be reduced by balance credits. These credits are recorded as part of expense reductions on the Statement of Operations. The Fund could have invested a portion of the assets utilized in connection with the expense offset arrangement in an income-producing asset if it had not entered into such an agreement. For the year ended February 28, 2010, these custody credits reduced total expenses by $71 for the Fund.
Note 6. Portfolio Information
For the year ended February 28, 2010, the cost of purchases and proceeds from sales of securities, excluding short-term obligations, for the Fund were $491,588,846 and $536,109,841, respectively.
Note 7. Regulatory Settlements
During the year ended February 28, 2010, the Fund received payments totaling $130,285 relating to certain regulatory settlements with third parties that the Fund had participated in during the year. The payments have been included in "Increase from regulatory settlements" on the Statement of Changes in Net Assets.
Note 8. Line of Credit
The Fund and other affiliated funds participate in a $280,000,000 committed, unsecured revolving line of credit provided by State Street. The maximum amount that may be borrowed by any fund is limited to the lesser of $200,000,000 and the Fund's borrowing limit set forth in the Fund's registration statement. Borrowings are available for short-term liquidity or temporary or emergency purposes.
Effective October 15, 2009, interest is charged to each participating fund based on the fund's borrowings at a rate per annum equal to the greater of the Federal Funds Rate plus 1.25% or the overnight LIBOR Rate plus 1.25%. In addition, a commitment fee of 0.15% per annum is accrued and apportioned among the participating funds pro rata based on their relative net assets.
Prior to October 15, 2009, interest was charged to each participating fund based on the fund's borrowings at a rate per annum equal to the greater of the Federal Funds Rate plus 0.50% or the overnight LIBOR Rate plus 0.50%. In addition, an annual operations agency fee of $20,000, an amendment fee of 0.02% and a commitment fee of 0.12% per annum were accrued and apportioned among the participating funds pro rata based on their relative net assets.
For the year ended February 28, 2010, the Fund did not borrow under these arrangements.
Note 9. Securities Lending
The Fund may lend its securities to certain approved brokers, dealers and other financial institutions. Each loan is collateralized by cash, in an amount at least equal to the market value of the securities loaned plus accrued income from the investment of collateral. The market value of the loaned securities is determined at the close of business of the Fund and any additional required collateral is delivered to the Fund on the next business day. The collateral received is invested and the income generated by the investment of the collateral, net of any fees remitted to State Street as the lending agent and borrower rebates, is paid to the Fund. Generally, in the event of borrower default, the Fund has the right to use the collateral to offset any losses incurred. In the event the Fund is delayed or prevented from exercising its right to dispose of the collateral, there may be a potential loss to the Fund. The Fund bears the ri sk of loss with respect to the investment of collateral.
For the year ended February 28, 2010, the Fund did not participate in the securities lending program.
Note 10. Shares of Beneficial Interest
As of February 28, 2010, 32.9% of the Fund's shares outstanding were beneficially owned by two participant accounts over which BOA and/or any of its affiliates had either sole or joint investment discretion.
As of February 28, 2010, no other shareholder owned more than 5% of the outstanding shares of the Fund.
Subscription and redemption activity of this account may have a significant effect on the operations of the Fund.
28
Columbia Convertible Securities Fund, February 28, 2010
Note 11. Significant Risks and Contingencies
Legal Proceedings
Columbia Management Advisors, LLC and Columbia Management Distributors, Inc. (collectively, the "Columbia Group") are subject to a settlement agreement with the New York Attorney General ("NYAG") (the "NYAG Settlement") and a settlement order with the Securities and Exchange Commission ("SEC") (the "SEC Order") on matters relating to mutual fund trading, each dated February 9, 2005. Under the terms of the SEC Order, the Columbia Group (or predecessor or affiliated entities) agreed, among other things, to: pay disgorgement and civil money penalties collectively totaling $375 million; cease and desist from violations of the antifraud provisions and certain other provisions of the federal securities laws; maintain certain compliance and ethics oversight structures; and retain an independent consultant to review the Columbia Group's applicable supervisory, compliance, control and other policies and procedures. The NYAG Settlement, a mong other things, requires Columbia Management Advisors, LLC and its affiliates to make certain disclosures to investors relating to expenses. In connection with the Columbia Group providing services to the Columbia Funds, the Columbia Funds have voluntarily undertaken to implement certain governance measures designed to maintain the independence of their boards of trustees and certain special consulting and compliance measures.
Pursuant to the SEC Order and related procedures, the $375 million in settlement amounts described above, of which approximately $90 million has been earmarked for certain Columbia Funds and their shareholders, is being distributed in accordance with a distribution plan developed by an independent distribution consultant and approved by the SEC on December 27, 2007. Distributions under the distribution plan began in mid-June 2008 and the distribution earmarked for the Columbia Funds and their shareholders has been substantially completed.
Civil Litigation
In connection with the events that resulted in the NYAG Settlement and SEC Order, various parties filed suits against Bank of America Corporation and certain of its affiliates, including Banc of America Capital Management, LLC ("BACAP," now known as Columbia Management Advisors, LLC) and BACAP Distributors, LLC (now known as Columbia Management Distributors, Inc.) (collectively "BAC"), Nations Funds Trust (now known as Columbia Funds Series Trust) and its Board of Trustees. On February 20, 2004, the Judicial Panel on Multidistrict Litigation transferred these cases and cases against other mutual fund companies based on similar allegations to the United States District Court in Maryland for consolidated or coordinated pretrial proceedings (the "MDL"). Subsequently, additional related cases were transferred to the MDL. On September 29, 2004, the plaintiffs in the MDL filed amended and consolidated complaints. One of these amended complaints is a putative class action that includes claims under the federal securities laws and state common law, and that names Nations Funds Trust, the Trustees, BAC and others as defendants. Another of the amended complaints is a derivative action purportedly on behalf of the Nations Funds Trust against BAC and others that asserts claims under federal securities laws and state common law. Nations Funds Trust is a nominal defendant in this action.
On February 25, 2005, BAC and other defendants filed motions to dismiss the claims in the pending cases. On December 15, 2005, BAC and others entered into a Stipulation of Settlement of the direct and derivative claims brought on behalf of the Nations Funds shareholders. The settlement is subject to court approval. If the settlement is approved, BAC would pay settlement administration costs and fees to plaintiffs' counsel as approved by the court. The stipulation has not yet been presented to the court for approval.
Note 12. Subsequent Events
In connection with the preparation of the financial statements of the Fund as of and for the fiscal year ended February 28, 2010, events and transactions through the date the financial statements were issued have been evaluated by the Fund's management for possible adjustment and/or disclosure. No subsequent events or transactions had occurred that would require adjustment of the financial statements as presented. On March 3, 2010, the Fund's shareholders approved, among other matters, a proposed investment management services agreement with the New Advisor, the effectiveness of which is conditioned on the Closing.
29
Report of Independent Registered Public Accounting Firm
To the Trustees of Columbia Funds Series Trust and the Shareholders of Columbia Convertible Securities Fund
In our opinion, the accompanying statement of assets and liabilities, including the investment portfolio, and the related statement of operations and of changes in net assets and the financial highlights present fairly, in all material respects, the financial position of Columbia Convertible Securities Fund (the "Fund") (a series of Columbia Funds Series Trust) at February 28, 2010, the results of its operations, the changes in its net assets and the financial highlights for each of the periods indicated, in conformity with accounting principles generally accepted in the United States of America. These financial statements and financial highlights (hereafter referred to as "financial statements") are the responsibility of the Fund's management. Our responsibility is to express an opinion on these financial statements based on our audits. We conducted our audits of these financial statements in accordance with the standards of th e Public Company Accounting Oversight Board (United States). Those standards require that we plan and perform the audit to obtain reasonable assurance about whether the financial statements are free of material misstatement. An audit includes examining, on a test basis, evidence supporting the amounts and disclosures in the financial statements, assessing the accounting principles used and significant estimates made by management, and evaluating the overall financial statement presentation. We believe that our audits, which included confirmation of securities at February 28, 2010 by correspondence with the custodian and brokers, provide a reasonable basis for our opinion.
PricewaterhouseCoopers LLP
Boston, Massachusetts
April 21, 2010
30
Federal Income Tax Information (Unaudited)
For non-corporate shareholders, 32.57% or the maximum amount allowable under the Jobs and Growth Tax Relief Reconciliation Act of 2003, of the ordinary income distributed by the Fund for the fiscal year ended February 28, 2010 may represent qualified dividend income.
35.41% of the ordinary income distributed by the Fund for the fiscal year ended February 28, 2010, qualifies for the corporate dividends received deduction.
The Fund will notify shareholders in January 2011 of amounts for use in preparing 2010 income tax returns.
31
Fund Governance
The Trustees serve terms of indefinite duration. The names, addresses and ages of the Trustees and officers of the Funds of Columbia Funds Series Trust, the year each was first elected or appointed to office, their principal business occupations during at least the last five years, the number of Funds overseen by each Trustee and other directorships they hold are shown below. Each officer listed below serves as an officer of each Fund in the Columbia Funds Complex.
Independent Trustees
Name, Address and Age,
Position with Funds, Year First
Elected or Appointed to Office | | Principal Occupation(s) During Past Five Years, Number of Funds in the Columbia
Funds Complex Overseen by Trustee, Other Directorships Held
| |
| Edward J. Boudreau (Born 1944) | |
|
c/o Columbia Management
Advisors, LLC
One Financial Center
Boston, MA 02111
Trustee (since 2005) | | Managing Director—E.J. Boudreau & Associates (consulting), from 2000 through current; oversees 64; no other directorships held. | |
|
| William P. Carmichael (Born 1943) | |
|
c/o Columbia Management
Advisors, LLC
One Financial Center
Boston, MA 02111
Trustee (since 1999) | | Retired. Oversees 64; Director—Cobra Electronics Corporation (electronic equipment manufacturer); Director—The Finish Line (sportswear). | |
|
| William A. Hawkins (Born 1942) | |
|
c/o Columbia Management Advisors, LLC
One Financial Center
Boston, MA 02111
Trustee (since 2005) | | President and Chief Executive Officer—California General Bank, N.A., from January 2008 through current; oversees 64; no other directorships held. | |
|
| R. Glenn Hilliard (Born 1943) | |
|
c/o Columbia Management Advisors, LLC
One Financial Center
Boston, MA 02111
Trustee (since 2005) | | Chairman and Chief Executive Officer—Hilliard Group LLC (investing and consulting), from April 2003 through current; Non-Executive Director & Chairman—Conseco, Inc. (insurance), September 2003 through current; Executive Chairman—Conseco, Inc. (insurance), August 2004 through September 2005; oversees 64; Director—Conseco, Inc. (insurance). | |
|
| John J. Nagorniak (Born 1944) | |
|
c/o Columbia Management
Advisors, LLC
One Financial Center
Boston, MA 02111
Trustee (since 2008)` | | Retired. President and Director—Foxstone Financial, Inc. (consulting), 2000 through December 2007; Director—Mellon Financial Corporation affiliates (investing), 2000 through 2007; Chairman—Franklin Portfolio Associates (investing—Mellon affiliate), 1982 through 2007; oversees 64; Director—MIT Investment Company; Trustee—MIT 401k Plan; Trustee and Chairman—Research Foundation of CFA Institute. | |
|
32
Fund Governance (continued)
Independent Trustees (continued)
Name, Address and Age,
Position with Funds, Year First
Elected or Appointed to Office | | Principal Occupation(s) During Past Five Years, Number of Funds in the Columbia
Funds Complex Overseen by Trustee, Other Directorships Held
| |
| Minor M. Shaw (Born 1947) | |
|
c/o Columbia Management Advisors, LLC
One Financial Center
Boston, MA 02111
Trustee (since 2003) | | President—Micco Corporation and Mickel Investment Group; oversees 64; Board Member—Piedmont Natural Gas. | |
|
Interested Trustee
| Anthony M. Santomero1 (Born 1946) | |
|
c/o Columbia Management Advisors, LLC
One Financial Center
Boston, MA 02111
Trustee (since 2008) | | Richard K. Mellon Professor Emeritus of Finance, The Wharton School, University of Pennsylvania, from 1972 through current; Senior Advisor—McKinsey & Company (consulting), July 2006 through January 2008; President and Chief Executive Officer—Federal Reserve Bank of Philadelphia, July 2000 through April 2006; oversees 64; Director—Renaissance Reinsurance Ltd; Director—Penn Mutual Life Insurance Company; Director—Citigroup. | |
|
1 The Columbia Funds currently treat Mr. Santomero as an "interested person" (as defined in the 1940 Act) of the Funds because he serves as a Director of Citigroup, Inc. and Citibank, N.A. Citigroup, Inc., through its subsidiaries and affiliates, including Citibank, N.A., may engage from time-to-time in brokerage execution, principal transactions and/or lending relationships with the Columbia Funds or other funds or accounts advised/managed by the Advisor and/or any sub-advisor.
The Statement of Additional Information includes additional information about the Trustees of the Funds and is available, without charge, upon request by calling 800-345-6611.
33
Fund Governance (continued)
Officers
Name, Address and Year of Birth,
Position with Columbia Funds,
Year First Elected or
Appointed to Office | | Principal Occupation(s) During Past Five Years
| |
| J. Kevin Connaughton (Born 1964) | |
|
One Financial Center
Boston, MA 02111
President (since 2009) | | Managing Director of Columbia Management Advisors, LLC since December 2004; Senior Vice President and Chief Financial Officer—Columbia Funds, from June 2008 to January 2009; Treasurer—Columbia Funds, from October 2003 to May 2008; Treasurer—the Liberty Funds, Stein Roe Funds and Liberty All-Star Funds, December 2000—December 2006; Senior Vice President—Columbia Management Advisors, LLC, from April 2003 to December 2004; President—Columbia Funds, Liberty Funds and Stein Roe Funds, February 2004 to October 2004; Treasurer—Galaxy Funds, September 2002 to December 2005; Treasurer, December 2002 to December 2004, and President, February 2004 to December 2004—Columbia Management Multi-Strategy Hedge Fund, LLC; and a senior officer of various other Bank of America-affiliated entities, including other registered and unregistered funds | |
|
| James R. Bordewick, Jr. (Born 1959) | |
|
One Financial Center
Boston, MA 02111
Senior Vice President, Secretary and Chief Legal Officer (since 2006) | | Associate General Counsel, Bank of America since April 2005; Senior Vice President and Associate General Counsel, MFS Investment Management (investment management) prior to April 2005. | |
|
| Linda J. Wondrack (Born 1964) | |
|
One Financial Center
Boston, MA 02111
Senior Vice President and
Chief Compliance Officer (since 2007) | | Director (Columbia Management Group LLC and Investment Product Group Compliance), Bank of America since June 2005; Director of Corporate Compliance and Conflicts Officer, MFS Investment Management (investment management), August 2004 to May 2005; Managing Director, Deutsche Asset Management (investment management) prior to August 2004. | |
|
| Michael G. Clarke (Born 1969) | |
|
One Financial Center
Boston, MA 02111
Senior Vice President and
Chief Financial Officer (since 2009) | | Director of Fund Administration of the Advisor since January 2006; Managing Director of the Advisor September 2004 to December 2005; Vice President Fund Administration June 2002 to September 2004. | |
|
| Jeffrey R. Coleman (Born 1969) | |
|
One Financial Center
Boston, MA 02111
Treasurer (since 2008) | | Director of Fund Administration of the Advisor since January 2006; Fund Controller of the Advisor from October 2004 to January 2006; Vice President of CDC IXIS Asset Management Services, Inc. (investment management) from August 2000 to September 2004. | |
|
| Joseph F. DiMaria (Born 1968) | |
|
One Financial Center
Boston, MA 02111
Chief Accounting Officer (since 2008) | | Director of Fund Administration of the Advisor since January 2006; Head of Tax/Compliance and Assistant Treasurer of the Advisor from November 2004 to December 2005; Director of Trustee Administration (Sarbanes-Oxley) of the Advisor from May 2003 to October 2004. | |
|
34
Fund Governance (continued)
Officers (continued)
Name, Address and Year of Birth,
Position with Columbia Funds,
Year First Elected or
Appointed to Office | | Principal Occupation(s) During Past Five Years
| |
| Julian Quero (Born 1967) | |
|
One Financial Center
Boston, MA 02111
Deputy Treasurer (since 2008) | | Senior Tax Manager of the Advisor since August 2006; Senior Compliance Manager of the Advisor from April 2002 to August 2006. | |
|
| Barry S. Vallan (Born 1969) | |
|
One Financial Center
Boston, MA 02111
Controller (since 2006) | | Vice President—Fund Treasury of the Advisor since October 2004; Vice President—Trustee Reporting of the Advisor from April 2002 to October 2004. | |
|
| Stephen T. Welsh (Born 1957) | |
|
One Financial Center
Boston, MA 02111
Vice President (since 1996) | | President, Columbia Management Services, Inc. since July 2004; Senior Vice President and Controller, Columbia Management Services, Inc. prior to July 2004. | |
|
35
Board Consideration and Re-Approval of Current Investment Advisory Agreement
Even though the following description of the Board's consideration of investment advisory and, as applicable, sub-advisory agreements covers multiple funds, for purposes of this shareholder report, the description is only relevant as to the Fund.
The Board of Trustees of Columbia Funds Series Trust (the "Board"), including a majority of the Trustees who have no direct or indirect interest in the investment advisory and sub-advisory agreements and are not "interested persons" of the Trust, as defined in the Investment Company Act of 1940 (the "1940 Act") (the "Independent Trustees"), are required annually to review and re-approve the existing investment advisory and sub-advisory agreements and approve any newly proposed terms therein. In this regard, the Board reviewed and re-approved, during the most recent six months covered by this report, (i) investment advisory agreements with Columbia Management Advisors, LLC ("CMA" or the "Adviser") for Columbia Convertible Securities Fund, Columbia Large Cap Value Fund, Columbia Mid Cap Value Fund, Columbia Small Cap Value Fund II, Columbia Marsico Growth Fund, Columbia Large Cap Core Fund, Columbia Marsico Focused Equities Fund, Columbia Marsico 21st Century Fund and Columbia Small Cap Growth Fund II; and (ii) investment sub-advisory agreements with Marsico Capital Management, LLC ("Marsico Capital" or the "Sub-Adviser") for Columbia Marsico Focused Equities Fund, Columbia Marsico 21st Century Fund and Columbia Marsico Growth Fund (the "Sub-Advised Funds"). The investment advisory agreements with CMA and the investment sub-advisory agreements with Marsico Capital are each referred to as an "Advisory Agreement" and collectively referred to as the "Advisory Agreements." The funds identified above are each referred to as a "Fund" and collectively referred to as the "Funds."
More specifically, at meetings held on November 5-6, 2009, the Board, including the Independent Trustees advised by their independent legal counsel, considered the factors and reached the conclusions described below relating to the selection of CMA and the Sub-Adviser and the re-approval of the Advisory Agreements. The Board also reviewed and considered a report prepared and provided by the Independent Fee Consultant (the "Fee Consultant") appointed by the Independent Trustees pursuant to an assurance of discontinuance entered into with the New York Attorney General ("NYAG") to settle a civil complaint filed by the NYAG relating to trading in mutual fund shares (the "NYAG Settlement"). The Fee Consultant's role was to manage the process by which management fees are negotiated so that they were negotiated in a manner that is at arms' length and reasonable. Th e Fee Consultant found that the fee negotiation process was, to the extent practicable, at arms' length and reasonable and consistent with the requirements of the NYAG Settlement. A summary of the Fee Consultant's report is available at http://www.columbiafunds.com.
In preparation for the November meetings, the Board met in August for review and discussion of the materials described below. The Investment Committee of the Board also met in June to discuss each Fund's performance with its respective portfolio manager(s). In addition to these meetings, the Investment Committee receives and discusses performance reports at its quarterly meetings. The Contracts Review Committee of the Board also provided support in managing and coordinating the process by which the Board reviewed the Advisory Agreements. The Board's review and conclusions are based on the comprehensive consideration of all information presented to it and are not the result of any single controlling factor. The Board evaluated all information available to it on a Fund-by-Fund basis, and its determinations were made separately in respect of each Fund.
Nature, Extent and Quality of Services
The Board received and considered various data and information regarding the nature, extent and quality of services provided to the Funds by CMA and the Sub-Adviser under the Advisory Agreements. The most recent investment adviser registration forms for CMA and the Sub-Adviser were made available to the Board, as were CMA's and the Sub-Adviser's responses to a detailed series of requests submitted by the Independent Trustees' independent legal counsel on behalf of such Trustees. The Board reviewed and analyzed those materials, which included, among other things, information about the background and experience of senior management and investment personnel of CMA and the Sub-Adviser.
In addition, the Board considered the investment and legal compliance programs of the Funds, CMA and the Sub-Adviser, including their compliance policies and procedures and reports of the Funds' Chief Compliance Officer.
36
The Board evaluated the ability of CMA and the Sub-Adviser, based on their resources, reputation and other attributes, to attract and retain qualified investment professionals, including research, advisory and supervisory personnel. In this regard, the Board considered information regarding the nature of CMA's compensation structure applicable to portfolio managers and other key investment personnel.
Based on the above factors, together with those referenced below, the Board concluded that it was satisfied with the nature, extent and quality of the investment advisory services provided to each of the Funds by CMA and the Sub-Adviser.
The Board noted that Bank of America, N.A., the parent company of the Adviser, had entered into an agreement to sell a portion of the asset management business of the Adviser to Ameriprise Financial, Inc. (the "Transaction"). The Board noted that the Transaction was expected to close in the spring of 2010 and that its review of the Advisory Agreements was separate and distinct from any analysis regarding new advisory or sub-advisory arrangements that may result from the closing of the Transaction.
Investment Advisory and Sub-Advisory Fee Rates and Other Expenses
The Board reviewed and considered the proposed contractual investment advisory fee rates both separately and together with the administration fee rates payable by the Funds to CMA for investment advisory services (the "Contractual Management Rates"). The Board also reviewed and considered the proposed contractual investment sub-advisory fee rates (the "Sub-Advisory Agreement Rates") payable by CMA to the Sub-Adviser for investment sub-advisory services. In addition, the Board reviewed and considered the proposed fee waiver/cap arrangements applicable to the Contractual Management Rates and considered the Contractual Management Rates after taking the waivers/caps into account (the "Actual Management Rates"). The Board noted that, on a complex-wide basis, CMA had reduced annual management fees by at least $32 million per year pursuant to the NYAG Settlement. The Board also noted reductions in net advisory rates and/or total expens es of certain funds across the fund complex. Additionally, the Board received and afforded specific attention to information comparing the Contractual Management Rates and Actual Management Rates with those of the other funds in their respective Peer Groups (as defined below).
The Board reviewed and considered statistical information regarding each Fund's total expense ratio and its various components, including contractual advisory fees, actual advisory fees, actual non-management fees, Rule 12b-1 and non-Rule 12b-1 service fees, fee waivers/caps and/or expense reimbursements. The Board also reviewed comparisons of these fees to the expense information for the group of Funds determined by Lipper Inc. ("Lipper") to be most similar to a given Fund (the "Peer Group") and to the performance of a broader universe of relevant funds as determined by Lipper (the "Universe"), which comparative data was provided by Lipper, an independent provider of investment company data. The Board was provided with a description of the methodology used by Lipper to select the mutual funds in each Fund's Peer Group and Universe and considered potential imprecision resulting from the selection methodology. For certain Funds, Lipper determined that the composition of the Peer Group and/or Universe for expenses would differ from the composition for performance to provide a more accurate basis of comparison. The Board also considered Lipper data that ranked each Fund based on: (i) each Fund's one- and three-year performance compared to actual management fees; and (ii) each Fund's one- and three-year performance compared to total expenses.
The Board concluded that the factors noted above supported the Contractual Management Rates and the Actual Management Rates, and the approval of the Advisory Agreements for all of the Funds.
With regard to the Sub-Advised Funds, the Board also reviewed the Sub-Advisory Agreement Rates, including comparative fee information provided by the Adviser and the Adviser's recommendation that the Board re-approve the Advisory Agreements with Marsico Capital. The Board also considered a breakpoint fee schedule charged by Marsico Capital for the Sub-Advised Funds, as well as a corresponding waiver of Contractual Management Rates, both of which were implemented on January 1, 2008. The Board concluded that the Sub-Advisory Agreement Rates are fair and equitable, based on its consideration of the factors described above.
The Fund-by-Fund discussion set forth below in "Fund-Specific Considerations for Certain Review Funds" provides additional
37
information regarding those Funds highlighted as meeting agreed-upon criteria for warranting further review. Such criteria included, among other things, information relating to Actual Management Rates, total expense ratios and/or performance information, relative to a Fund's Peer Group and/or Universe.
Fund Performance
The Board considered the performance results for each of the Funds over multiple measurement periods. It also considered these results in comparison to the performance results of each Fund's Peer Group and Universe, as well as to each Fund's benchmark index. The Board also considered certain risk-adjusted performance data.
The Fund-by-Fund discussion set forth below in "Fund-Specific Considerations for Certain Review Funds" provides additional information regarding those Funds highlighted as meeting agreed-upon criteria for warranting further review. Such criteria included, among other things, information relating to Actual Management Rates, total expense ratios and/or performance information, relative to a Fund's Peer Group and/or Universe.
Profitability
The Board received and considered a detailed profitability analysis of CMA based on the Contractual Management Rates and the Actual Management Rates, as well as on other relationships between the Funds and other funds in the complex on the one hand and CMA affiliates on the other. The analysis included complex-wide and per-Fund information and a comparison of results using alternative allocation methodologies. The Board concluded that, in light of the costs of providing investment management and other services, the profits and other ancillary benefits that CMA and its affiliates received from providing these services were not unreasonable.
Economies of Scale
The Board received and considered information regarding whether there have been economies of scale with respect to the management of the Funds, whether the Funds have appropriately benefited from any economies of scale and whether there is potential for realization of any further economies of scale. Most particularly, CMA provided information showing that, as a percentage of fund assets, CMA's complex-wide revenues declined over a five-year period during which fund assets increased by 53% and the shareholder benefit over a four-year period has remained steady at approximately 33% of the Adviser's total profits. The Board concluded that any potential economies of scale are shared fairly with Fund shareholders, most particularly through breakpoints and fee waiver arrangements.
The Board acknowledged the inherent limitations of any analysis of an investment adviser's economies of scale, stemming largely from the Board's understanding that economies of scale are generally realized, if at all, by an investment adviser across a variety of products and services, not just with respect to a single fund.
Information About Services to Other Clients
The Board also received and considered information about the nature and extent of services and fee rates offered by CMA and the Sub-Adviser to their other clients, including separate accounts and institutional investors. In this regard, the Board concluded that, where the Contractual Management Rates, Sub-Advisory Agreement Rates and Actual Management Rates were appreciably above the range of the fee rates offered to other CMA and Sub-Adviser clients, based on information provided by CMA and the Sub-Adviser, the costs associated with managing and operating a registered investment company provided a justification for the higher fee rates charged to the Funds.
Other Benefits to CMA and the Sub-Adviser
The Board received and considered information regarding any "fall-out" or ancillary benefits received by CMA and its affiliates and the Sub-Adviser as a result of their relationship with the Funds. Such benefits could include, among others, benefits attributable to CMA's and the Sub-Adviser's relationships with the Funds (such as soft-dollar credits) and benefits potentially derived from an increase in CMA's and the Sub-Adviser's business as a result of their relationship with the Funds (such as the ability to market to shareholders other financial products offered by CMA and its affiliates or a Sub-Adviser).
The Board considered the effectiveness of the policies of the Funds in achieving the best execution of portfolio transactions, whether and to what extent soft dollar credits are sought and how any such credits are utilized, any benefits that may be realized by using an affiliated broker, the extent to
38
which efforts are made to recapture transaction costs, and the controls applicable to brokerage allocation procedures. The Board also reviewed CMA's and the Sub-Adviser's methods for allocating portfolio investment opportunities among the Funds and other clients. The Board concluded that the benefits were not unreasonable.
Other Factors and Broader Review
As discussed above, the Board reviews materials received from CMA and the Sub-Adviser annually as part of the re-approval process under Section 15(c) of the 1940 Act. The Board also reviews and assesses the quality of the services the Funds receives throughout the year. In this regard, the Board and its Committees review reports of CMA and the Sub-Adviser at each of its quarterly meetings, which include, among other things, Fund performance reports and presentations relating to such reports. In addition, the Board and its Committees confer with portfolio managers at various times throughout the year including, most particularly, at the June Investment Committee meeting.
Fund-Specific Considerations for Certain "Review" Funds
For certain Funds highlighted as meeting agreed-upon criteria for warranting further review, the Board engaged in further analysis with regard to approval of the Funds' Advisory Agreements. Such criteria included, among other things, information relating to Actual Management Rates, total expense ratios, and/or performance information relative to a Fund's Peer Group and/or Universe.
The Board engaged in further review of Columbia Convertible Securities Fund because its Actual Management Rate and total expense ratio were appreciably above the median range of its Peer Group. Although the Fund's performance over certain periods was not appreciably above the median of its Universe, the Board noted other factors such as improved performance rankings over the previous year and the impact of voluntary expense limitations on the Fund's Actual Management Rate and total expense ratio. The Board also noted the implementation of a revised voluntary reimbursement arrangement in November 2009 for the Fund. Taking into account these matters and other factors considered, the Board concluded that the Actual Management Rate and total expense ratio were acceptable.
Conclusion
After an evaluation of the above-described factors, and based on its deliberations and analysis of the information provided and alternatives considered, the Board, including all of the Independent Trustees, concluded that the compensation payable to CMA and the Sub-Adviser under the Advisory Agreements is fair and equitable. Accordingly, the Board unanimously re-approved the Advisory Agreements.
39
Board Consideration and Approval of Proposed Investment Advisory Agreement
Even though the following description of the Board's consideration of investment advisory and, as applicable, sub-advisory agreements covers multiple funds and trusts, for purposes of this shareholder report, the description is only relevant as to the Fund.
At a meeting held on December 21, 2009, the Boards of Trustees (the "Boards") of Columbia Funds Series Trust, Columbia Funds Master Investment Trust, LLC and Columbia Funds Series Trust II (each a "Trust" and collectively the "Trusts") unanimously approved a new investment management services agreement with RiverSource Investments, LLC ("RiverSource") (the "Proposed Advisory Agreement") and new subadvisory agreements with Marsico Capital Management ("Marsico Capital"), MacKay Shields LLC ("Mackay Shields") and Brandes Investment Partners, L.P. ("Brandes") (each a "Proposed Subadvisory Agreement"), as applicable, for each Fund of the Trusts (each a "Fund" and collectively the "Funds"). As detailed below, the Trustees met on multiple occasions in advance of the December 21, 2009 meeting, held numerous discussions with the management teams of Columbia Management Advisors, LLC ("Columbia") and RiverSource, a subsidiary of Ameriprise Financial, Inc. ("Ameriprise") and reviewed and considered extensive materials in connection with the approval of the Proposed Advisory and Subadvisory Agreements.
Specifically, the Trustees of each Trust, including a majority of the Trustees who have no direct or indirect interest in the Proposed Advisory and Subadvisory Agreements and are not "interested persons" of the Trusts, as defined in the Investment Company Act of 1940, as amended (the "1940 Act") (the "Independent Trustees") reviewed and approved (i) the Proposed Advisory Agreement with RiverSource for each Fund and (ii) the Proposed Subadvisory Agreement for those Funds that currently have investment subadvisory agreements with Marsico Capital, Mackay Shields, and Brandes (the "Subadvised Funds") (Marsico Capital, MacKay Shields and Brandes are collectively referred to as the "Subadvisers"). Prior to approving the Proposed Advisory Agreements, the Trustees were presented with, and requested, received and evaluated, extensive materials about RiverSource, the sale of a portion of the asset management business of Columbia Managemen t Group, LLC to Ameriprise (the "Transaction") and related matters from RiverSource, Ameriprise and Columbia. In this regard, the Trustees reviewed RiverSource's responses to a series of detailed requests submitted by the Independent Trustees' independent legal counsel and by the Independent Fee Consultant (as defined below).
The Trustees also reviewed and considered information received in connection with their most recent consideration and reapproval in November 2009 of the current advisory agreement (the "Current Advisory Agreement") and current subadvisory agreement (the "Current Subadvisory Agreement"), as applicable, for each Fund, including information about the Subadvisers (the "Current Agreement Re-Approval Process"). Moreover, the Trustees and committees of the Boards met on several occasions, and received extensive materials, throughout the course of the year relating to the Current Agreement Re-Approval Process, which the Trustees considered relevant to their consideration and approval of the Proposed Advisory and Subadvisory Agreements. The Trustees also consulted with Fund counsel and with the Independent Trustees' independent legal counsel, who advised on the legal standards for consideration by the Trustees, and otherwise assisted the Trustees in their deliberations.
In advance of the meeting on December 21, 2009, the Trustees held several meetings, including meetings held in-person with representatives from RiverSource and Ameriprise on August 26, 2009, November 5-6, 2009, December 9-10, 2009 and December 14, 2009, and additional meetings with representatives of Columbia, to discuss the Transaction, RiverSource's plans and intentions regarding the Funds and various proposals that were being presented as a result of the Transaction, including the Proposed Advisory and Subadvisory Agreements. In addition to these meetings, telephonic meetings and discussions were held on several occasions between individual Trustees, members of the committees of the Boards, their independent legal counsel and representatives from RiverSource, Ameriprise and/or Columbia.
The Trustees also reviewed and considered a report prepared and provided by the Fee Consultant (the "Fee Consultant") appointed by the Independent Trustees pursuant to an assurance of discontinuance entered into by a predecessor to Columbia with the New York Attorney General ("NYAG") to settle a civil complaint filed by the NYAG relating to trading in mutual fund shares (the "NYAG Settlement"). The Fee Consultant's role was to manage the process by which management fees are negotiated so that they were negotiated
40
in a manner that is at arms' length and reasonable. The Fee Consultant found that the fee negotiation process was, to the extent practicable, at arms' length and reasonable and consistent with the requirements of the NYAG Settlement. A summary of the Fee Consultant's report is available at www.columbiafunds.com.
The following summarizes a number of the material factors considered by the Trustees in reaching their approvals and determinations with respect to the Proposed Advisory Agreements and Proposed Subadvisory Agreements. It is followed by a more detailed discussion of the Trustees' consideration of these and other factors considered relevant by the Trustees in their evaluation of the Proposed Advisory Agreements and Proposed Subadvisory Agreements. In voting to approve the Proposed Advisory and Subadvisory Agreements for each Fund, the Trustees also considered substantially the same factors, as relevant, and reached substantially the same conclusions in their approval of interim advisory and subadvisory agreements for each Fund.
(i) the terms and conditions of the Proposed Advisory Agreements compared to the terms and conditions of the Current Advisory Agreements, as described below;
(ii) the fact that each Fund's total advisory fees would remain the same;
(iii) the qualifications of the personnel of RiverSource, Ameriprise and the Subadvisers expected to provide advisory and administrative services to each Fund, including representations by Ameriprise regarding its retention of the same process for monitoring and evaluating portfolio management personnel for each Fund as currently used by Columbia;
(iv) the terms and conditions of the Proposed Subadvisory Agreements compared to the terms and conditions of the Current Subadvisory Agreements;
(v) the reputation, financial strength, regulatory and compliance histories and resources of RiverSource and Ameriprise, and the potential benefits to the Funds of the combination of RiverSource and Columbia, including that the Funds are expected to continue to have access to existing distribution channels and have the potential for expanded distribution of Fund shares, the expected depth and breadth of investment management capabilities, that there is not expected to be any diminution in the nature, quality and extent of services to be provided to the Funds under the Proposed Advisory Agreements and the potential for the realization of additional economies of scale over time and the potential of the Funds to share in, and benefit from, these economies, if any;
(vi) that Ameriprise has committed to refrain from imposing or seeking to impose, for a period of not less than two years after the closing of the Transaction (the "Closing"), any "unfair burden" (within the meaning of Section 15(f) of the 1940 Act) on any Fund;
(vii) the terms and conditions of certain other agreements and arrangements relating to the future operations of the Funds and their distribution channels, including the administrative services agreement and the new services and distribution agreement;
(viii) that the Trustees recently had completed the Current Agreement Re-Approval Process for each Fund and had determined that they were satisfied with the nature, extent and quality of services provided thereunder and that the management fee rates and (where applicable) subadvisory fee rates for each Fund were satisfactory;
(ix) that RiverSource was willing to commit to maintain net operating expense ratios at current levels for at least the period currently covered by Columbia's existing commitments;
(x) the capabilities of RiverSource and the Subadvisers with respect to compliance, including an assessment of RiverSource's compliance program by the Funds' Chief Compliance Officer;
(xi) that certain members of RiverSource's management and certain Columbia personnel that will be integrated into RiverSource and its affiliates as a result of the Transaction have substantial experience in integrating fund families; and
(xii) that Ameriprise and Bank of America Corporation would bear the costs of obtaining approvals of the Proposed Advisory and Subadvisory Agreements.
In their deliberations, the Trustees did not identify any single item that was paramount or controlling and individual
41
Trustees may have attributed different weights to various factors. The Trustees also evaluated all information available to them on a Fund-by-Fund basis, and their determinations were made separately in respect of each Fund.
Nature, Extent and Quality of Services to be Provided
The Trustees received and considered various data and information regarding the expected nature, extent and quality of services to be provided to the Funds by RiverSource and the Subadvisers under the Proposed Advisory and Subadvisory Agreements. The most recent investment adviser registration forms for RiverSource and each Subadviser were made available to the Boards, as well as extensive materials from RiverSource, Ameriprise and Columbia. The Trustees reviewed and analyzed these materials, which included, among other things, information about the background and experience of expected senior management of RiverSource and Ameriprise after the Closing. The Trustees considered RiverSource's ability to provide administrative services to the Funds, noting that while the aggregate scope of advisory and administrative services was not expected to change following the Closing, the allocation of services was expected to shift, to a lim ited extent, such that administrative services will be provided under a new administrative services agreement. The Trustees considered, among other things, the capacity and quality of RiverSource's and the Subadvisers' investment management, research and trade execution capabilities and other resources that would be dedicated to performing services for the Funds. The Trustees also considered matters related to RiverSource's and the Subadvisers' compliance programs and compliance records, including RiverSource's portfolio transaction policies and procedures. The Trustees discussed with senior management personnel their ability to administer and oversee outside service providers to the Funds and their shareholders and were satisfied with management's processes for providing services and overseeing and reviewing services to be rendered by outside sources.
In evaluating the services to be provided under the Proposed Advisory and Subadvisory Agreements, the Trustees factored in their extensive discussions with representatives of Columbia, RiverSource and Ameriprise at the meetings referenced above regarding the management of each Fund. The Trustees considered representations by Ameriprise that it was expected that there will be no diminution in the nature and quality of services provided to the Funds. The Trustees noted that Columbia Management Group's current President, Columbia's current Chief Investment Officer and Columbia's current President, were expected to continue to serve the Funds in similar capacities after the Closing. With respect to portfolio management, the Trustees reviewed information regarding the deliberative process for selecting portfolio management personnel to continue servicing the Fund s after the Closing, including the expected role of Columbia's Chief Investment Officer in evaluating and selecting portfolio management personnel for each Fund utilizing Columbia's current analytical model for evaluating portfolio managers. In this regard, the Trustees also weighed representations by Ameriprise that this investment management evaluative process was likely to result in a significant number of Columbia investment professionals and personnel currently responsible for management of the Funds to remain in place. The Trustees noted that the portfolio management evaluation and selection process was designed to optimize the portfolio management resources available to each Fund by having the ability to select investment personnel for the Funds from the combined organization. Similarly, the Trustees evaluated the ability of RiverSource and the Subadvisers, based on their respective resources, reputations and other attributes, to attract and retain qualified investment professionals. In this regard, t he Trustees considered information regarding the nature of the compensation structure applicable to portfolio managers and other key investment personnel.
The Trustees reviewed and considered information from Ameriprise and RiverSource regarding various contemplated service provider arrangements, including information regarding both immediate and potential future plans in respect of these arrangements. In this regard, the Trustees considered information regarding potential distribution, transfer agency and custody arrangements and the evaluation of fund accounting, financial reporting and valuation service model options, noting certain differences between Columbia's and RiverSource's current approaches, including that RiverSource has historically utilized services provided "in-house" or by its affiliates for fund accounting, financial reporting and valuation. The Trustees reviewed information from Ameriprise and RiverSource regarding the expectation for rationalized or harmonized fees as part of the integration after the Closing in order to develop consistent service fee schedules across the combined fund family. The Trustees noted Ameriprise's representations that, to the extent any
42
such proposals were recommended to the Board after the Closing, they would not result in an "unfair burden" (within the meaning of Section 15(f) of the 1940 Act) on any Fund.
In addition, the Trustees reviewed and evaluated materials and information received regarding the investment and legal compliance programs of the Funds, RiverSource and the Subadvisors, including their compliance policies and procedures and reports of the Funds' Chief Compliance Officer. In this regard, the Trustees considered that Columbia's current Chief Compliance Officer was expected to serve in the same role after the Closing.
The Trustees also noted that Ameriprise and certain of its affiliates have been involved in a number of legal, arbitration and regulatory proceedings, including routine litigation, class actions, and governmental actions, concerning matters arising in connection with the ordinary conduct of their business activities, and that Ameriprise indicated that neither Ameriprise nor any of its affiliates are the subject of any pending legal, arbitration or regulatory proceedings that are likely to have a material adverse effect on the Funds or the ability of Ameriprise or its affiliates, including RiverSource to provide services to the Funds.
Based on the foregoing and other information considered relevant, the Trustees concluded that, overall, they were satisfied with assurances from Columbia, RiverSource, Ameriprise and the Subadvisers as to the expected nature, extent and quality of services to be provided to each Fund under the Proposed Advisory and Subadvisory Agreements.
Investment Advisory and Subadvisory Fee Rates and Other Expenses
The Trustees reviewed and considered the proposed contractual investment advisory fee rates to be paid by each Fund to RiverSource for investment management services both separately and together with the administration fee rates to be paid by the Funds to RiverSource (the "Contractual Management Rates"), which are the same as the separate and aggregate advisory and administrative fee rates currently paid by each Fund to Columbia. The Trustees also reviewed and considered the proposed subadvisory fee rates and the fee arrangements under the Proposed Subadvisory Agreements, respectively, which are also the same as those currently in effect under the Current Subadvisory Agreements. In addition to the materials provided by Columbia, RiverSource provided information regarding the current fees for each of the RiverSource funds and other relevant institutional acco unts. The Trustees reviewed and considered the proposed fee waiver/cap arrangements applicable to the Contractual Management Rates and considered the Contractual Management Rates after taking the waivers/caps into account (the "Actual Management Rates"). In this regard, the Trustees noted that RiverSource had committed to maintain the Funds' current expense limitation and waiver arrangements (both contractual and voluntary). The Trustees considered the potential that, after the Closing, RiverSource would propose a common fee and expense structure for the combined fund family, subject to the commitment that Ameriprise will not seek any change that would result in an "unfair burden" on any Fund. The Trustees also considered the report prepared and provided by the Fee Consultant. Additionally, the Trustees received and afforded specific attention to information provided in connection with the Current Agreement Re-Approval Process, comparing the Contractual Management Rates and Actual Management Rates with those of other funds in each Fund's Peer Group (as defined below).
During the Current Agreement Re-Approval Process, the Trustees reviewed and considered statistical information regarding each Fund's total expense ratio and its various components, including contractual advisory fees, actual advisory fees, actual nonmanagement fees, Rule 12b-1 and non-Rule 12b-1 service fees, fee waivers/caps and/or expense reimbursements. The Trustees also reviewed comparisons of these fees to the expense information for the group of Funds that was determined by Lipper Inc. ("Lipper") to be the most similar to a given Fund (the "Peer Group") and to the performance of a broader universe of relevant funds as determined by Lipper (the "Universe"), which comparative data was provided by Lipper, an independent provider of investment company data.
The Trustees were provided with a description of the methodology used by Lipper to select the mutual funds in each Fund's Peer Group and Universe and reviewed the degree of comparability resulting from the selection methodology. For certain Funds, Lipper determined that changing the composition of the Peer Group and/or Universe for expenses from that used for performance would provide a more accurate basis of comparison. The Trustees also considered Lipper data that ranked each Fund based on: (i) each Fund's one- and
43
three-year performance compared to actual management fees; and (ii) each Fund's one- and three-year performance compared to total expenses.
For each Fund, except as otherwise described in the Fund-specific discussion below, the Trustees noted that they had concluded during the Current Agreement Re-Approval Process that the Contractual Management Rates, the Actual Management Rates and the total expense ratio were at acceptable levels in light of the quality of services provided to the Fund and in comparison to such Fund's Peer Group and Universe, as applicable; that the advisory fee rate would not be increased for any Fund; that Ameriprise and RiverSource had represented that the overall expenses for each Fund were not expected to be adversely affected by the Transaction; and that RiverSource had committed to maintain the Funds' current expense limitation or waiver arrangements (both contractual and voluntary).
Based on the foregoing, other relevant information received and the additional information described in the Fund-specific discussion below, as applicable, the Trustees concluded that the Contractual Management Rates, the Actual Management Rates and the total expense ratio were acceptable.
Fund Performance
The Trustees reviewed detailed performance information for each Fund at various Board and committee meetings during the year in addition to the additional performance information that they reviewed and evaluated in connection with the Transaction. The Trustees also reviewed and evaluated detailed performance information for each Fund in connection with the Current Agreement Re-Approval Process. The Trustees considered the performance results for each of the Funds over multiple measurement periods. They also considered these results in comparison to the performance results of each Fund's Peer Group and Universe, as well as to each Fund's benchmark index. The Boards also noted certain risk-adjusted performance data.
The Trustees also reviewed and evaluated information and data regarding the investment performance record of RiverSource in managing funds with investment strategies generally similar to those of the Funds, as applicable. Investment performance for such funds was provided for a wide range of periods.
The Trustees recognized that the investment performance record of RiverSource in managing funds with similar objectives may be less relevant to their deliberations in situations where the current portfolio managers of Columbia are expected to continue managing a particular Fund following the Closing. They also recognized that for each Fund, it is not possible to predict with certainty what effect, if any, consummation of the Transaction will have on the future performance of the Funds, noting in particular that past investment performance is no assurance of future results. The Fund-by-Fund discussion set forth below provides additional information regarding those Funds highlighted as meeting agreed-upon criteria for warranting further review. Such criteria included, among other things, information relating to Actual Management Rates, total expense ratios and/or performance information, relative to a Fund's Peer Group and/or Univ erse.
Costs of Services to be Provided and Profitability
In considering the costs of services to be provided by RiverSource and the Subadvisers under the Proposed Advisory Agreement and Proposed Subadvisory Agreement, as applicable for each Fund, and the projected range of profitability to RiverSource and the Subadvisers from their relationships with the Funds, the Trustees considered, among other things, that there would be no increase in advisory or subadvisory fee rates under the Proposed Advisory and Subadvisory Agreements. The Trustees further noted, with respect to RiverSource, that it was not possible to predict with certainty how RiverSource's profitability would be affected by becoming the investment adviser to the Funds but, as a general matter, they were satisfied, based on their review of RiverSource's projected range of profitability assuming completion of the Transaction, that this projected profitability from their relationship with the Funds would not be excessive. The Trustees based their review, in part, on information regarding RiverSource's current profitability in managing the RiverSource Funds and the information available to the Trustees with respect to RiverSource's expense budgeting process. The Trustees also noted that they would have ongoing opportunities to address RiverSource's profitability in the future based on actual results. The Trustees did not consider separate profitability information with respect to the Subadvisers, as their profitability from their relationships with the Funds was not a material factor in determining whether to
44
approve the Proposed Subadvisory Agreements. The Trustees also noted that the subadvisory fees paid to the Subadvisers, none of which is affiliated with Columbia, had previously been negotiated on an arms' length basis.
The Trustees also reviewed information about the financial condition of RiverSource and the Subadvisers and were satisfied that RiverSource and the Subadvisers have adequate resources to perform the services required under the Proposed Advisory and Proposed Subadvisory Agreements.
Subject to the limitations noted above, the Trustees concluded that they were satisfied that RiverSource's projected range of future profitability, and each Subadviser's historical profitability, from their relationship with each Fund, as relevant, were not excessive.
Economies of Scale
The Trustees received and evaluated information regarding the potential to realize economies of scale with respect to management of the Funds, whether the Funds would appropriately benefit from any economies of scale and whether there was any potential for realization of further economies of scale in connection with the Transaction. The Trustees noted that the current and proposed investment advisory fee rates for most of the Funds contain breakpoints that reduce the fee rate on assets above specified levels. The Trustees noted that RiverSource had indicated that no changes to the Funds' breakpoint arrangements were proposed to be made at this time. In light of these factors and noting that it was not possible to evaluate with certainty if and how the Transaction would produce any immediate opportunities for additional economies of scale, the Trustees concluded that each Fund's breakpoint arrangements were acceptable. The Truste es also recognized that the Funds may benefit from certain economies of scale over time from becoming a part of the larger RiverSource fund complex, based on potential future synergies of operations, potential fee harmonization/rationalization initiatives and potential future Fund mergers. The Trustees noted, in particular, RiverSource's acknowledgement of the principle that the Funds should share in certain economies of scale if realized by RiverSource. In addition, the Trustees evaluated the likelihood that there would be potential Fund mergers after the Closing. The Trustees noted that any such potential Fund mergers, if approved, could result in the achievement of additional breakpoints for Funds that have implemented breakpoint fee schedules. The Trustees also noted that they expect to consider economies of scale from time to time following the Closing and thus be in a position to evaluate any additional economies of scale.
The Trustees acknowledged the inherent limitations of any analysis of an investment adviser's economies of scale, stemming largely from the Trustees' understanding that economies of scale are generally realized, if at all, by an investment adviser across a variety of products and services, not just with respect to a single fund.
Information About Investment Management Services to Non-Mutual Fund Clients
The Trustees also received and reviewed information about the nature and extent of services and fee rates offered by Riversource and the Subadvisers to the Funds compared with other clients with similar accounts, including separate accounts and institutional investments. The Trustees noted that the Funds may receive services different from those offered to other clients of RiverSource and the Subadvisers and concluded that the advisory fee rates under the Proposed Advisory Agreements and the subadvisory fee rates under the Proposed Subadvisory Agreements were not excessive, given the nature and extent of services expected to be offered and other factors, including the Trustees' review of Lipper data.
Other Benefits to RiverSource and the Subadvisers
The Trustees received and reviewed information regarding any expected "fall-out" or ancillary benefits to be received by RiverSource and its affiliates and by the Subadvisers as a result of their relationships with the Funds.
Among other things, the Trustees noted that RiverSource would benefit from soft dollar arrangements using portfolio brokerage of each Fund that invests in equity securities. The Trustees also noted that the Subadvisers also had benefited from, and expected to continue to benefit from, soft dollar arrangements using portfolio brokerage of the Subadvised Funds. The Trustees acknowledged RiverSource's representation that none of its affiliated broker dealers was expected to provide brokerage services to any Fund, but noted that broker-dealer affiliates of RiverSource will receive distribution related fees from the Funds in respect of shares held in certain accounts, and that such Funds' distributor
45
(which will also become a subsidiary of RiverSource following the closing of the Transaction) retains a portion of the distribution related fees from the Funds and receives a portion of the sales charges on sales or redemptions of certain classes of shares of the Funds. The Trustees recognized that RiverSource's and the Subadvisers' profitability would be somewhat lower without these benefits. The Trustees concluded that RiverSource and the Subadvisers may derive reputational benefits from their association with the Funds. The Trustees also noted, however, that such benefits were difficult to quantify with certainty.
Fund-Specific Considerations for Certain "Review" Funds
During the Current Agreement Re-Approval Process, a limited number of Funds were highlighted as meeting agreed-upon criteria for warranting further review. Such criteria included, among other things, information relating to Actual Management Rates, total expense ratios and/or performance information, relative to a Fund's Peer Group and/or Universe. For such "review" Funds, the Trustees engaged in further analysis with regard to the approval of the Funds' Current Advisory Agreements. For each such Fund, the Trustees subsequently considered the impact of transitioning investment management responsibilities to RiverSource.
The Trustees engaged in further review of Columbia Convertible Securities Fund because its Actual Management Rate and total expense ratio were appreciably above the median range of its Peer Group. Although the Fund's performance over certain periods was not appreciably above the median of its Universe, the Trustees noted other factors such as improved performance rankings over the previous year and the impact of voluntary expense limitations on the Fund's Actual Management Rate and total expense ratio. The Trustees also noted the implementation of a revised voluntary reimbursement arrangement in November 2009 for the Fund. Taking into account these matters and other factors considered, the Trustees concluded that the Actual Management Rate and total expense ratio were, at this time, acceptable, under the circumstances.
Conclusion
After an evaluation of the above-described factors and based on its deliberations and analysis of the information provided and alternatives considered, each Board, including all of the Independent Trustees, concluded that approval of the Proposed Advisory and Subadvisory Agreements was in the best interests of each of the Funds and its shareholders. Accordingly, the Boards unanimously approved the Proposed Advisory and Subadvisory Agreements.
46
Summary of Management Fee Evaluation by
Independent Fee Consultant
REPORT OF INDEPENDENT FEE CONSULTANT TO THE FUNDS SUPERVISED BY THE COLUMBIA NATIONS BOARD
Prepared Pursuant to the February 9, 2005
Assurance of Discontinuance among the
Office of Attorney General of New York State,
Columbia Management Advisors, LLC, and
Columbia Management Distributors, Inc.
November 12, 2009
I. Overview
On February 9, 2005, Columbia Management Advisors, LLC ("CMA") and Columbia Management Distributors, Inc.1 ("CMD") agreed to the New York Attorney General's Assurance of Discontinuance ("AOD"). Among other things, the AOD stipulates that CMA may manage or advise a Columbia Fund ("Columbia Fund" and, together with some or all of such funds, the "Columbia Funds") only if the Independent Members of the Columbia Fund's Board of Trustees appoint a Senior Officer or retain an Independent Fee Consultant ("IFC") who is to manage the process by which proposed management fees are negotiated. The AOD further stipulates that the Senior Officer or IFC is to prepare a written annual evaluation of the fee negotiation process.
With effect from January 1, 2007, the Independent Members of the Board of Trustees for certain Columbia Funds known collectively as the "Nations Funds" (together with the other members of that Board, the "Trustees") retained me as IFC for the Nations Funds.2 In this capacity, I have prepared the fifth annual written evaluation of the fee negotiation process. As was the case with the 2007 and 2008 reports, my immediate predecessor as IFC, John Rea, provided invaluable assistance in the preparation of this year's report.
A. Role of the Independent Fee Consultant
The AOD charges the IFC with "managing the process by which proposed management fees ... to be charged the Columbia Fund are negotiated so that they are negotiated in a manner which is at arms' length and reasonable and consistent with this Assurance of Discontinuance." The AOD also provides that CMA "may manage or advise a Columbia Fund only if the reasonableness of the proposed management fees is determined by the Board of Trustees ... using ... an annual independent written evaluation prepared by or under the direction of ... the Independent Fee Consultant." Therefore, the AOD makes clear that the IFC does not supplant the Trustees in negotiating management fees with CMA, nor does the IFC substitute his or her judgment for that of the Trustees with respect to the reasonableness of proposed fees or any other matter that is committed to the business judgmen t of the Trustees.
B. Elements Involved in Managing the Fee Negotiation Process
In preparing the report required by the AOD, the IFC must consider at least the following six factors set forth in the AOD:
1. The nature and quality of CMA's services, including the Fund's performance;
2. Management fees (including any components thereof) charged by other mutual fund companies for like services;
3. Possible economies of scale as the Fund grows larger;
4. Management fees (including any components thereof) charged to institutional and other clients of CMA for like services;
5. Costs to CMA and its affiliates of supplying services pursuant to the management fee agreements, excluding any intra-corporate profit; and
6. Profit margins of CMA and its affiliates from supplying such services.
C. Organization of the Annual Evaluation
This report, like last year's, focuses on the six factors and contains a section for each factor except that CMA's costs and profits from managing the Funds are treated in a single section. In addition to a discussion of these factors, the report offers recommendations to improve the fee review process in future years. A review of the status of recommendations made in the 2008 Report is being provided separately with the materials for the November meeting.
1 CMA and CMD are subsidiaries of Columbia Management Group, LLC ("CMG"), and are the successors to the entities named in the AOD.
2 I have no material relationship with Bank of America, CMG or any of its affiliates, aside from serving as IFC, and I am aware of no material relationship with any of their affiliates. I retained John Rea, an independent economic consultant, to assist me with this report.
Unless otherwise stated or required by the context, this report covers only the Nations Funds, which are also referred as the "Funds."
47
II. Summary of Findings
A. General
1. Based upon my examination of the information supplied by CMG in the light of the six factors set forth in the AOD, I conclude that the Trustees have the relevant information necessary to evaluate the reasonableness of the proposed management fees for each Nations Fund, subject to the following: on September 30, 2009, Ameriprise Financial, Inc. ("Ameriprise") announced that it had agreed to purchase the investment management business of CMG with the exception of its cash and liquidity management business which includes the Nations money market Funds. As a result, the Trustees requested information from CMG as to the plans of CMG and its parent with respect to the provision of investment management services to those Funds after the consummation of the proposed transaction. As of the date of this report, that in formation has not yet been provided. However, as the transaction is not expected to close until the spring of 2010, the Trustees concluded that they would have ample opportunity to take appropriate steps with respect to the investment management agreements of the money market Funds, including invoking the 60-day termination provisions of those agreements, in response to the information to be provided by CMG and reviewed by the IFC.
In my view, the process by which the proposed management fees of the Funds have been negotiated in 2009 thus far has been, to the extent practicable, at arms' length and reasonable and consistent with the AOD.
B. Nature and Quality of Services, Including Performance
3. The performance of the Funds was relatively strong for the measuring periods ending March 31, 2009. Between one-third and nearly one-half of the Funds were ranked in either the first or second quintiles in the one-, three-, five-, and 10-year periods, and no more than 8% were in the fifth quintile for these periods. Overall, the performance was stronger in the two longer periods.
4. The strongest performing groups over the one-, three-, and five-year periods were active equity, quantitative strategies, and, to a lesser extent, money market Funds. Sub-advised Funds were the weakest performers, with over 60% of the Funds in the bottom two quintiles in the one- and three-year periods. For the same two periods, no more than 15% percent of the sub-advised Funds were in the top two quintiles. Almost half of fixed-income Funds ranked in the bottom two quintiles in the one- and three-year periods.
5. Overall performance of the Funds was less robust in 2009 than in 2008 and 2007 for the one- and three-year performance periods. For example, 62% of the Funds were in the top two quintiles in 2007 for the one-year period compared with 33% in 2009. The ranks of those in the bottom two quintiles rose significantly between 2007 and 2009, led by money market and fixed-income Funds in the one- and three-year periods. For the three-year period, there was a similar trend with respect to sub-advised Funds.
6. The performance of the active equity Funds against their benchmarks was strong for the one-, three-, and five-year performance periods. In contrast, more than half of the sub-advised Funds failed to beat their benchmarks on a net basis in the one- and three-year periods. The fixed-income Funds consistently produced gross returns below those of their benchmarks. Lipper quintile rankings of the actively managed equity Funds are highly correlated with their performance against their benchmarks in the sense that net returns in excess of the benchmark appear necessary to achieve a ranking in one of the top three quintiles. No such correlation was observed for fixed-income and quantitative strategies Funds.
7. The equity Funds' overall performance adjusted for risk was mixed. Based upon three-year returns, less than 40% of the equity Funds had a combination of risk-adjusted and unadjusted returns that placed them in the top half of their performance universes; 60% were in the bottom half of their universes. About 30% of the fixed income Funds posted high returns and low risk relative to comparable funds. Over 60% of the fixed-income Funds took on more risk than the typical fund in their performance universes.
8. The industry-standard procedure used by Lipper that includes all share classes in the performance universe tends to bias a Fund's ranking upward within that universe. The bias occurs because either no-12b-1 fee or low-12b-1 fee share classes of the Nations Funds are compared with funds in performance universes that
48
include all share classes of multi-class funds with 12b-1 fees of up to 100 basis points. Correcting this bias by limiting the performance universe to classes of comparable funds with low or no 12b-1 fees (a "filtered universe") lowers the relative performance for the Funds, but generally not to a material extent. The filtering process, however, did identify two Funds for further review that had not been so identified using unfiltered universes.
9. A small number of Funds have consistently underperformed over the past five years. The exact number depends on the criteria used to evaluate longer-term performance. For example, six different Funds have had below-median performance in at least four out of the five years between 2005 and 2009 for either the one- or three-year performance periods from 2005 to 2009. If the threshold were the 60th percentile, only two Funds would have satisfied the criteria.
10. The services performed by CMG professionals beyond portfolio management, such as compliance, legal, information technology, risk management, finance, and fund administration, are critical to the success of the Funds and appear to be of high quality.
C. Management Fees Charged by Other Mutual Fund Companies
11. The Funds' management fees and total expenses are generally low relative to those of their peers, with over half the Funds ranking in the most favorable two quintiles. For total expenses, slightly more than one-quarter are in the bottom two quintiles, while slightly less than two-fifths are in the bottom two quintiles for actual management fees. Fixed-income and quantitative strategies Funds have the lowest fees and expenses relative to their peers. The sub-advised Funds account for the majority of Funds in the fifth quintile for both management fees and total expenses.
12. The distribution of management fee rankings has changed little over the past three years, while the distribution of total expense rankings has moved in the direction of higher expenses. The most notable change involving total expenses has been a shift in the number of Funds from the first to the second quintile.
13. The management fees of the non-subadvised Funds are generally in line with those of Columbia Funds supervised by the Atlantic Board of Trustees (the "Atlantic Funds"). The sub-advised large cap equity, international equity, and high yield Funds, however, generally have higher management fees than those of comparable Atlantic and non-subadvised Funds.
14. The implementation of the new program of voluntary expense limits appears to have been associated, on balance, with less favorable expense rankings. This result reflects increases in expense limits for certain Funds, the removal of fee waivers, and the shift of certain expenses from CMA to the Funds. The decline in expense rankings is less significant, however, than CMA projected in December 2008.
D. Trustees' Advisory Contract Review Process
15. The Trustees' evaluation process identified 22 Funds in 2009 for further review based upon long-standing criteria relating to their relative performance or expenses or both. When compared in filtered universes, two more Funds met the criteria for further review. At the November meeting, CMG provided further information about each of those Funds to assist the Trustees in their evaluation.
E. Potential Economies of Scale
16. CMG presented to the Trustees its analysis of the sources and sharing of potential economies of scale. CMG views economies of scale as arising at the complex level and would regard estimates of scale economies for individual funds as unreliable. In its analysis, CMG did not identify specific sources of economies of scale or provide any estimates of any economies of scale that might arise from future asset growth. CMG's analysis included measures taken by the Trustees and CMG that seek to share any potential economies of scale through breakpoints in management fee schedules, the establishment of expense limits for each Fund, enhanced shareholder services, fund mergers, and operational consolidation.
17. An examination of the contractual fee schedules for five Nations Funds shows that the schedules for Small Cap II, Municipal Reserves, and Treasury Reserves compare favorably with those of their competitors, while the subadvised Marsico Growth and High Yield VS Funds have schedules generally above those of their peers, including funds that do not have a sub-adviser. The group fee with
49
breakpoints that characterizes the money market Fund schedules is not typically found among competitors, nearly all of which have flat fee schedules.
F. Management Fees Charged to Institutional Clients
18. CMG has provided Trustees with comparisons of mutual fund management fees and institutional fees based upon standardized fee schedules and upon actual fees. The results show that, consistent with industry practice, actual and scheduled institutional fees are generally, but not always, lower than the Funds' management fees. CMG provided additional data this year demonstrating that at small asset levels, the effective fee of certain Funds may be equal to or less than institutional fee levels at those asset levels, due to the effect of expense limits on small funds with high gross expenses. CMG also analyzed the differences between the services provided and risks borne on the one hand by a manager of mutual funds and on the other by institutional advisers, and suggested that these differences should be kept in mind when Trustees review the reasonableness of the Funds' management fees.
G. Revenues, Expenses, and Profits
19. The activity-based cost allocation methodology employed by CMG to allocate costs, both direct and indirect, for purposes of calculating Fund profitability is thoughtful and detailed. This year, CMG further refined the technique by allocating additional indirect expenses on an activity basis.
20. The materials provided on CMG's revenues and expenses with respect to the Funds and the methodology underlying their construction form a sufficient basis for Trustees to evaluate the expenses of and profitability to CMG arising out of its relationships with the Funds.
21. CMG provided a firm-wide pro forma 2009 income statement demonstrating the effect of market events beginning in the fourth quarter of 2008 on its revenues and profitability to provide an additional perspective on calendar 2008 profitability data.
22. In 2008, CMG's pre-tax pre- and post-distribution margins on the Nations Funds were above the industry mean and median, based on limited data available for publicly held mutual fund managers and excluding the costs of CMG's money market capital support programs. However, as is to be expected in a 63-Fund complex, some Nations Funds had relatively high pre-tax profit margins in 2008, when calculated solely with respect to management revenues and expenses, while other Nations Funds operated at a loss. There is a positive relationship between Fund size and profitability to CMG, with smaller Funds generally operating at a loss to CMG.
23. CMG pays a fixed percentage of its management fee revenues to an affiliate, U.S. Trust, Bank of America Private Wealth Management, with respect to assets of its clients invested in Nations Funds to compensate it for services it performs with respect to those client assets and for the effect of state law limitations on affiliates charging multiple fees. Based on our analysis of the services provided by this affiliate, we have concluded that all payments other than those for sub-transfer agent or sub-accounting services should be treated as a distribution expense.
III. Recommendations
1) Criteria for review. The Trustees may wish to consider modifying the criteria for identifying a Fund for further review (a "Review Fund") to include criteria that focus exclusively on performance. They may also wish to consider whether it would be useful to apply CMG's own internal monitoring standards for Fund performance to the contract review process, or whether such criteria are more relevant to their ongoing investment oversight.
2) Presentation of Review Fund discussion. CMG should consider whether it could more systematically present in one discussion all relevant information regarding each Review Fund, which is now split into several different portions of the 15(c) materials. For any Fund that has been a Review Fund in consecutive years, CMG should address under what circumstances it could reasonably be anticipated that the Fund would lose that status.
3) Refinement of tax-exempt performance data. Certain single-state tax-exempt Funds compete in extremely small universes and are compared to a multi-state benchmark of uncertain relevance. Notwithstanding the difficulties, CMG should work to improve the reliability of the calculation of relative performance of these Funds. If that is not possible, CMG should provide guidance on how the Trustees should judge the quality of CMG's management of these Funds.
50
4) Development of risk metrics for asset-allocation, tax-exempt, and money market Funds. CMG has developed and shared with the Trustees quantitative risk metrics comparing equity and taxable fixed-income Funds against their peers. However, reliable risk metrics have not been developed for asset-allocation, tax-exempt fixed income, and money market Funds. We urge CMG to continue its efforts to provide reliable risk measures for these categories of Funds, especially in the cases of asset-allocation and money market funds, because their investors are likely to be motivated at least in part by a desire to manage risk.
5) Profitability data. For any period during which CMG is an affiliate of U.S. Trust, Bank of America Private Wealth Management, CMG should continue to present to the Trustees the profitability of each Fund, each investment style and each complex (of which Nations is one) calculated as follows:
a. Management-only profitability should be calculated without reference to any Private Bank expense.
b. Profitability excluding distribution (which essentially covers the management and transfer agency functions) should be adjusted by removing from the expense calculation any portion of the Private Bank payment not attributable to the performance by the Private Bank of sub-transfer agency or sub-accounting functions.
c. Total profitability, including distribution: No adjustment for Private Bank expenses should be made, because all such expenses represent legitimate fund expenses to be taken into account in calculating CMG's profit margin including distribution.
d. Distribution only: This should include all Private Bank expenses other than those attributable to sub-transfer agency services.
6) Contractual fee analysis. This year CMG presented a new Lipper report comparing the contractual management fees of Funds with those of competitors in similar investment styles. However, the reliability of the conclusion—that Fund management fee breakpoints compared favorably with competitive fee rates—was limited by the use of competitive funds at all asset levels. The sponsors of a $100 million mutual fund may not have given much thought to breakpoints at $5 billion; therefore, that fund's contractual fee at that level is unlikely to compare favorably with that of a $5 billion Fund. Limiting the competitors to the Lipper expense group, whose constituents are similar in size to the rele vant Fund, would make the results more meaningful. In addition, the breakpoints of a select group of Nations Funds (which would differ each year) should continue to be compared to those of industry rivals to ensure that the Funds' breakpoint schedules remain within industry norms. As breakpoint schedules change relatively little each year, performing such a comparison for each Nations Fund each year would not be an efficient use of Trustee and CMG resources.
7) Pro forma profitability data. In any year in which CMG or the Trustees believe that the prior year's profitability is unlikely to be representative of current business results due to changes in markets or for any other reason, CMG should, consistent with this year's practice, prepare a pro forma income statement based on year-to-date actual data and reasonable projections used for its own business planning purposes.
8) Additional institutional data and analysis. While CMG provided a substantial amount of information on its institutional business, we suggest some additional items for future years: (a) profitability data for the institutional business in the format, and based upon the same allocation methodologies, used to present Fund profitability, (b) an explanation of how CMA sets institutional fee breakpoints, which normally begin at asset levels far lower than those found in Fund management fee breakpoints, and (c) distinguishing in all institutional fee materials fees of accounts acquired prior to the development of current fee schedules (so-called "legacy" accounts) from the fees of accounts launched after that time.
9) Management fee disparities. In any future study of management fees, CMG and the Nations Trustees should analyze the differences in management fee schedules. As part of that analysis, CMG should provide an explanation for any significant fee differences among comparable funds across fund families sponsored by CMG, such as differences in the management styles of different Funds included the same Lipper category. Finally, if CMG proposes a management fee change or an expense cap for
51
any mutual fund managed by CMA that is comparable to any Nations Fund, CMG should provide the Trustees with sufficient information about the proposal to allow the Trustees to assess the applicability of the proposed change to the relevant Nations Fund or Funds.
10) Explanation of data supplied to Lipper. Each year, as part of the 15(c) process, CMG retains Lipper to compare the fees and expenses of each Fund to a group of competitors. In many cases, CMG, with the approval of the Trustees, adjusts the actual expense data, which is based on the most recent full fiscal year of the Fund (and each competitive fund) to reflect changes in fees or expense limits that occurred during or after the relevant fiscal year. This improves the reliability and usefulness of the comparison. However, to ensure that the Trustees know when and how CMG adjusted the data, we recommend that CMG prepare a table listing for each Fund what adjustments were made, e.g., to reflect a new expense limitation of x basis points that commenced on y date.
11) Reduction of volume of paper documents submitted. The effort to streamline and better organize the data presented to the Trustees and the process by which that data was prepared and organized continued to be well-received by all parties. Notwithstanding past success, it is always appropriate to look for opportunities to reduce and simplify the presentation of 15(c) data. One possibility would be to remove the 127 pages of biographical data, most if not all of which the Trustees have previously seen as part of their ongoing investment oversight duties, from the paper volume and post it on the Internet-based document storage and retrieval system used by the Funds to provide reference data to Trustees.
Respectfully submitted,
Steven E. Asher
52
Important Information About This Report
The fund mails one shareholder report to each shareholder address. If you would like more than one report, please call shareholder services at 1-800-345-6611 and additional reports will be sent to you. This report has been prepared for shareholders of Columbia Convertible Securities Fund.
A description of the policies and procedures that the fund uses to determine how to vote proxies and a copy of the fund's voting records are available (i) at www.columbiamanagement.com, (ii) on the Securities and Exchange Commission's website at www.sec.gov, and (iii) without charge, upon request, by calling 1-800-368-0346. Information regarding how the fund voted proxies relating to portfolio securities during the 12-month period ended June 30 is available from the SEC's website. Information regarding how the fund voted proxies relating to portfolio securities is also available from the fund's website, www.columbiamanagement.com.
The fund files a complete schedule of portfolio holdings with the SEC for the first and third quarters of each fiscal year on Form N-Q. The fund's Form N-Q is available on the SEC's website at www.sec.gov and may be reviewed and copied at the SEC's Public Reference Room in Washington, DC. Information on the operation of the Public Reference Room may be obtained by calling 1-800-SEC-0330.
Please read and consider the investment objectives, risks, charges and expenses for any fund carefully before investing. For a prospectus which contains this and other important information about the fund, contact your Columbia Management representative or financial advisor or go to www.columbiamanagement.com.
Columbia Management Group, LLC ("Columbia Management") is the investment management division of Bank of America Corporation. Columbia Management entities furnish investment management services and products for institutional and individual investors. Columbia Funds are distributed by Columbia Management Distributors, Inc., member of FINRA, SIPC, part of Columbia Management and an affiliate of Bank of America Corporation.
Transfer Agent
Columbia Management Services, Inc.
P.O. Box 8081
Boston, MA 02266-8081
1-800-345-6611
Distributor
Columbia Management
Distributors, Inc.
One Financial Center
Boston, MA 02111
Investment Advisor
Columbia Management Advisors, LLC
100 Federal Street
Boston, MA 02110
53
Columbia Management®
One Financial Center
Boston, MA 02111-2621
PRSRT STD
U.S. Postage
PAID
Holliston, MA
Permit NO. 20
Columbia Management®
Columbia Convertible Securities Fund
Annual Report, February 28, 2010
©2010 Columbia Management Distributors, Inc.
One Financial Center, Boston, MA 02111-2621
800-345-6611 www.columbiafunds.com
SHC-42/32310-0210 (04/10) 10-J346V6
Columbia Management®
Annual Report
February 28, 2010
Columbia Large Cap Value Fund
| NOT FDIC INSURED | | May Lose Value | |
|
| NOT BANK ISSUED | | No Bank Guarantee | |
|
Table of Contents
| Fund Profile | | | 1 | | |
|
| Economic Update | | | 2 | | |
|
| Performance Information | | | 4 | | |
|
| Understanding Your Expenses | | | 5 | | |
|
| Investment Portfolio | | | 8 | | |
|
Statement of Assets and
Liabilities | | | 12 | | |
|
| Statement of Operations | | | 14 | | |
|
Statement of Changes in Net
Assets | | | 15 | | |
|
| Financial Highlights | | | 17 | | |
|
| Notes to Financial Statements | | | 23 | | |
|
Report of Independent Registered
Public Accounting Firm | | | 32 | | |
|
| Federal Income Tax Information | | | 33 | | |
|
| Fund Governance | | | 34 | | |
|
Board Consideration and
Re-Approval of Current
Investment Advisory Agreement | | | 38 | | |
|
Board Consideration and
Approval of Proposed
Investment Advisory Agreement | | | 42 | | |
|
Summary of Management Fee
Evaluation by Independent Fee
Consultant | | | 49 | | |
|
Important Information About
This Report | | | 57 | | |
|
The views expressed in this report reflect the current views of the respective parties. These views are not guarantees of future performance and involve certain risks, uncertainties and assumptions that are difficult to predict, so actual outcomes and results may differ significantly from the views expressed. These views are subject to change at any time based upon economic, market or other conditions and the respective parties disclaim any responsibility to update such views. These views may not be relied on as investment advice and, because investment decisions for a Columbia Fund are based on numerous factors, may not be relied on as an indication of trading intent on behalf of any particular Columbia Fund. References to specific securities should not be construed as a recommendation or investment advice.
President's Message

Dear Shareholder:
As we previously announced, Bank of America, N.A. has reached a definitive agreement to sell Columbia Management's long-term asset management business to Ameriprise Financial, Inc. This includes the management of its equity and fixed-income mutual funds.
This transaction combines two leading asset management firms and will create one entity that is expected to rank as one of the top asset managers. It is anticipated that the combined U.S. asset management business will operate under the well-regarded Columbia Management brand. The combined U.S. asset management business will be led by Ted Truscott, currently president, U.S. asset management, annuities and chief investment officer, Ameriprise Financial. Michael A. Jones, currently president of Columbia Management, will serve as president, U.S. asset management. Colin Moore, chief investment officer at Columbia Management, will continue to serve in that role for the combined organization. I will also continue in my role as head of mutual funds, responsible for the delivery of mutual fund products and services to investors.
As a valued investor in Columbia funds, please know that our goal is to ensure a smooth transition and provide you with the highest quality products and services. We will work closely with colleagues at Ameriprise Financial to seek a seamless transition for our clients and to keep you informed as the transition progresses and key decisions are made. We want to assure you that the funds' portfolio managers continue to focus on providing uninterrupted service to Columbia fund shareholders. Columbia Management and Ameriprise Financial will operate independently until all required approvals, including fund board, fund shareholder and other client approvals, have been received and the transaction closes, which is expected to occur in the spring of this year.
Meanwhile, transition teams across the company have been formed to oversee integration efforts including rebranding initiatives, vendor and system consolidations and client communications. Throughout the transition, we seek to build on best practices from both legacy organizations with enhancements to productivity, quality and the delivery of world-class customer experiences.
Clearly, we have a lot of work ahead of us in 2010. We look forward to introducing our combined business with an even wider breadth of products and capabilities. Everyone at Columbia Management and Ameriprise Financial is excited about the opportunities for this combined organization. I share this optimism and believe it will position us as a best-in-class asset management business with the ability to deliver more for clients than ever before.
Sincerely,

J. Kevin Connaughton
President, Columbia Funds
Fund Profile – Columbia Large Cap Value Fund
Summary
g For the 12-month period that ended February 28, 2010, the fund's Class A shares returned 45.49% without sales charge.
g The fund trailed its benchmark, the Russell 1000 Value Index1, and the average return of its peer group, the Lipper Large-Cap Value Funds Classification.2
g A focus on higher-quality companies with strong balance sheets hampered relative performance as lower-quality stocks led the market recovery.
Portfolio Management
Lori J. Ensinger has co-managed the fund since August 2001 and has been associated with the advisor or its predecessors since 2001.
Diane L. Sobin has co-managed the fund since August 2001 and has been associated with the advisor or its predecessors since 2001.
David I. Hoffman has co-managed the fund since April 2004 and has been associated with the advisor or its predecessors since 2001.
Noah J. Petrucci has co-managed the fund since February 2002 and has been associated with the advisor or its predecessors since 2002.
Subject to satisfying various conditions to closing, effective on or about May 1, 2010, RiverSource Investments, LLC, a subsidiary of Ameriprise Financial, Inc., is expected to become the investment advisor to the fund and change its name to Columbia Management Investment Advisers, LLC. Please see the fund's prospectus dated July 1, 2009, including the supplements thereto, for more information regarding the expected change in investment advisor and any related changes to the portfolio management of the fund.
1The Russell 1000 Value Index measures the performance of those Russell 1000 Index companies with lower price-to-book ratios and lower forecasted growth values. Indices are not available for investment, are not professionally managed and do not reflect sales charges, fees, brokerage commissions, taxes or other expenses of investing. Securities in the fund may not match those in an index.
2Lipper Inc., a widely respected data provider in the industry, calculates an average total return (assuming reinvestment of distributions) for mutual funds with investment objectives similar to those of the fund. Lipper makes no adjustment for the effect of sales loads.
Performance data quoted represents past performance and current performance may be lower or higher. Past performance is no guarantee of future results. The investment return and principal value will fluctuate so that shares, when redeemed, may be worth more or less than the original cost. Please visit www.columbiafunds.com for daily and most recent month-end performance updates.
Summary
1-year return as of 02/28/10
| | 45.49% | |
|
 | | Class A shares
(without sales charge) | |
|
| | 56.50% | |
|
 | | Russell 1000 Value Index | |
|
Morningstar Style BoxTM

The Morningstar Style BoxTM reveals a fund's investment strategy. For equity funds, the vertical axis shows the market capitalization of the stocks owned and the horizontal axis shows investment style (value, blend or growth). Information shown is based on the most recent data provided by Morningstar.
1
Economic Update – Columbia Large Cap Value Fund
Summary
For the 12-month period that ended February 28, 2010
g After a sharp decline, stock markets rebounded around the world, as measured by the S&P 500 Index and the MSCI EAFE Index.
| S&P Index | | MSCI Index | |
|
 | |  | |
|
g As investors grew more comfortable with risk, non-Treasury sectors of the bond market rebounded. The Barclays Capital Aggregate Bond Index delivered solid results. High-yield bonds were strong performers, as measured by the JPMorgan Developed BB High Yield Index.
Barclays
Aggregate Index | | JPMorgan
Index | |
|
 | |  | |
|
After a deep and difficult recession, the U.S. economy regained its footing midway through calendar year 2009. Gross domestic product (GDP) turned positive in the third quarter of 2009, rising 2.2%, and then gained 5.6% in the fourth quarter according to the estimate released by the Bureau of Economic Analysis. Growth was primarily the result of federal government stimulus spending and a slowdown in inventory reductions. Hopes for a sustained recovery now depend on a variety of factors, including a rebound in consumer spending, an increase in revenues to keep business profits moving higher and a turnaround in the labor market.
The housing market showed some signs of improvement. Existing home sales fell late in the period, but remained above levels of one year ago. According to the National Association of Realtors, the inventory of houses for sale fell over the course of 2009. Housing prices remained unchanged during the past year, but that was progress compared to 2008. The average home price fell in 2008 and since then distressed properties, which accounted for an estimated 38% of sales in January 2010, have weighed on prices because they were heavily discounted.
In the beleaguered labor market, the good news was that there was less bad news. Businesses continued to shed jobs throughout the period, raising the unemployment rate as high as 10.2% in October 2009. However, the pace of job losses slowed markedly by the period's end. Compared to six figure losses of one year ago, 14,000 jobs were added to the labor market in January 2010 and only 14,000 were lost in February 2010.* The rate of unemployment at the end of the period was 9.7%.* Nevertheless, prospects for a quick recovery in the labor markets are dim. In fact, consumer confidence, as measured monthly by The Conference Board, an independent research organization, took a sharp dive in February. Consumers surveyed cited worsening business conditions and a bleaker outlook for the labor markets and income for their pessimism.
Manufacturing activity remained slow during the first few months of the period. However, a key measure—the Institute for Supply Management's Index—rose above 50 in July and remained well above 50 for the remainder of the period. A value above 50 tends to indicate that the economy is growing. Industrial production turned positive in January 2010, and durable goods orders took a big jump forward. Manufacturing capacity utilization inched upward to 72.6%.
Consumer spending registered both ups and downs during the 12-month period, but the trend at the end of the period was upward, even though personal income decreased in January 2010. In light of uncertainty about the economy and pressure on consumers from a number of sectors, the Federal Reserve Board (the Fed) kept a key short-term interest rate—the federal funds rate—close to zero throughout the period.
*Source: U.S. Bureau of Labor Statistic
2
Economic Update (continued) – Columbia Large Cap Value Fund
Stocks bottomed, then rebounded
Against a strengthening economic backdrop, a stock market rally that began in mid-March 2009 continued throughout the period. The U.S. stock market returned 53.62% for the 12-month period, as measured by the S&P 500 Index.1 Mid-cap stocks outperformed large and small-cap stocks and value stocks outperformed growth stocks by a solid margin, as measured by their respective Russell indices.2 Outside the U.S., stock market returns were even stronger. The MSCI EAFE Index,3 a broad gauge of stock market performance in foreign developed markets, gained 54.58% (net of dividends, in U.S. dollars) for the period. Emerging stock markets were caught in last year's downdraft, but they bounced back stronger than domestic or developed world markets in 2009 as their economic growth generally outpaced the developed world. The MSCI Emerging Markets Index4 returned 91.63% (net of dividends, in U.S. d ollars).
Bond returns ranged from solid to strong
As hopes for a recovery materialized, bonds from non-Treasury sectors delivered solid returns. The Barclays Capital Aggregate Bond Index5 returned 9.32%. Municipal bonds delivered returns that were in line with taxable investment-grade bonds even without factoring in potential tax advantages to investors in higher income tax brackets. The Barclays Capital Municipal Bond Index6 returned 9.98%. High-yield bond prices rebounded strongly in 2009. For the 12-month period covered by this report, the JPMorgan Developed BB High Yield Index7 returned 32.79%.
Past performance is no guarantee of future results.
1The Standard & Poors (S&P) 500 Index tracks the performance of 500 widely held, large-capitalization U.S. stocks.
2The Russell 1000 Index tracks the performance of 1,000 of the largest U.S. companies, based on market capitalization. The Russell Midcap Index measures the performance of the 800 smallest companies in the Russell 1000 Index, which represents approximately 25% of the total market capitalization of the Russell 1000 Index. The Russell 2000 Index measures the performance of the 2,000 smallest companies in the Russell 3000 Index, which represents approximately 8% of the total market capitalization of the Russell 3000 Index. The Russell 3000 Growth Index measures the performance of those Russell 3000 Index companies with higher price-to-book ratios and higher forecasted growth values. The stocks in this index are also members of either the Russell 1000 Growth or the Russell 2000 Growth indexes. The Russell 3000 Value Index measures the performance of those Russell 3000 Index companies with lower price-to-book ratios and lo wer forecasted growth values. The stocks in this index are also members of either the Russell 1000 Value or the Russell 2000 Value indexes.
3The Morgan Stanley Capital International Europe, Australasia, Far East (MSCI EAFE) Index is a capitalization-weighted index that tracks the total return of common stocks in 21 developed-market countries within Europe, Australasia and the Far East.
4The Morgan Stanley Capital International Emerging Markets Index (MSCI EMI) is a free float-adjusted market capitalization index that is designed to measure equity market performance of emerging markets. As of June 2009, the MSCI Emerging Markets Index consisted of the following 22 emerging market country indices: Brazil, Chile, China, Colombia, Czech Republic, Egypt, Hungary, India, Indonesia, Israel, Korea, Malaysia, Mexico, Morocco, Peru, Philippines, Poland, Russia, South Africa, Taiwan, Thailand, and Turkey.
5The Barclays Capital Aggregate Bond Index is a market value-weighted index that tracks the daily price, coupon, pay-downs and total return performance of fixed-rate, publicly placed, dollar-denominated and non-convertible investment grade debt issues with at least $250 million par amount outstanding and with at least one year to final maturity.
6The Barclays Capital Municipal Bond Index is considered representative of the broad market for investment-grade, tax-exempt bonds with maturity of at least one year.
7The JPMorgan Developed BB High Yield Index is an unmanaged index designed to mirror the investable universe of the U.S. dollar developed, BB-rated, high yield corporate debt market.
Indices are not available for investment, are not professionally managed and do not reflect sales charges, fees, brokerage commissions, taxes or other expenses of investing. Securities in the fund may not match those in an index.
3
Performance Information – Columbia Large Cap Value Fund
Performance data quoted represents past performance and current performance may be lower or higher. Past performance is no guarantee of future results. The investment return and principal value will fluctuate so that shares, when redeemed, may be worth more or less than the original cost. Please visit www.columbiafunds.com for daily and most recent month-end performance updates.
Annual operating expense ratio (%)*
| Class A | | | 1.10 | | |
| Class B | | | 1.85 | | |
| Class C | | | 1.85 | | |
| Class R | | | 1.35 | | |
| Class Y | | | 0.69 | | |
| Class Z | | | 0.85 | | |
*The annual operating expense ratio is as stated in the fund's prospectus that is current as of the date of this report. Differences in expense ratios disclosed elsewhere in this report may result from the inclusion of fee waivers and expense reimbursements as well as the use of different time periods used in calculating the ratios.
Performance of a $10,000 investment 03/01/00 – 02/28/10
The chart above shows the change in value of a hypothetical $10,000 investment in Class A shares of Columbia Large Cap Value Fund during the stated time period, and does not reflect the deduction of taxes that a shareholder may pay on fund distributions or on the redemption of fund shares.
Performance of a $10,000 investment 03/01/00 – 02/28/10 ($)
| Sales charge | | without | | with | |
| Class A | | | 12,579 | | | | 11,857 | | |
| Class B | | | 11,661 | | | | 11,661 | | |
| Class C | | | 11,661 | | | | 11,661 | | |
| Class R | | | 12,457 | | | | n/a | | |
| Class Y | | | 12,916 | | | | n/a | | |
| Class Z | | | 12,891 | | | | n/a | | |
Average annual total return as of 02/28/10 (%)
| Share class | | A | | B | | C | | R | | Y | | Z | |
| Inception | | 12/06/89 | | 06/07/93 | | 06/17/92 | | 01/23/06 | | 07/15/09 | | 09/19/89 | |
| Sales charge | | without | | with | | without | | with | | without | | with | | without | | without | | without | |
| 1-year | | | 45.49 | | | | 37.07 | | | | 44.59 | | | | 39.59 | | | | 44.59 | | | | 43.59 | | | | 45.34 | | | | 46.20 | | | | 45.93 | | |
| 5-year | | | –0.53 | | | | –1.70 | | | | –1.28 | | | | –1.60 | | | | –1.27 | | | | –1.27 | | | | –0.72 | | | | –0.26 | | | | –0.29 | | |
| 10-year | | | 2.32 | | | | 1.72 | | | | 1.55 | | | | 1.55 | | | | 1.55 | | | | 1.55 | | | | 2.22 | | | | 2.59 | | | | 2.57 | | |
Average annual total return as of 03/31/10 (%)
| Share class | | A | | B | | C | | R | | Y | | Z | |
| Sales charge | | without | | with | | without | | with | | without | | with | | without | | without | | without | |
| 1- year | | | 44.55 | | | | 36.18 | | | | 43.54 | | | | 38.54 | | | | 43.68 | | | | 42.68 | | | | 44.39 | | | | 45.16 | | | | 44.98 | | |
| 5-year | | | 0.92 | | | | –0.27 | | | | 0.15 | | | | –0.18 | | | | 0.16 | | | | 0.16 | | | | 0.71 | | | | 1.19 | | | | 1.16 | | |
| 10-year | | | 2.22 | | | | 1.61 | | | | 1.44 | | | | 1.44 | | | | 1.45 | | | | 1.45 | | | | 2.11 | | | | 2.49 | | | | 2.48 | | |
The "with sales charge" returns include the maximum initial sales charge of 5.75% for Class A shares and the applicable contingent deferred sales charge of 5.00% in the first year, declining to 1.00% in the sixth year and eliminated thereafter for Class B shares and 1.00% for Class C shares in the first year only. The "without sales charge" returns do not include the effect of sales charges. If they had, returns would be lower.
Performance results reflect any fee waivers or reimbursements of fund expenses by the investment advisor and/or any of its affiliates. Absent these fee waivers or expense reimbursement arrangements, performance results would have been lower.
All results shown assume reinvestment of distributions. Class Y and Class Z shares are sold at net asset value with no distribution and service (Rule 12b-1) fees. Class R shares are sold at net asset value with distribution and service (Rule 12b-1) fees. Class R, Class Y and Class Z shares have limited eligibility and the investment minimum requirements may vary. Please see the fund's prospectus for details. Performance for different share classes will vary based on differences in sales charges and fees associated with each class.
The tables do not reflect the deduction of taxes that a shareholder may pay on fund distributions or on the redemption of fund shares.
The returns for Class R shares include the returns for Class A shares prior to January 23, 2006, the date on which Class R shares were initially offered by the fund. If differences in expenses had been reflected, the returns would have been lower, since Class R shares are subject to a higher Rule 12b-1 fee.
The returns for Class Y shares include the returns for Class Z shares prior to July 15, 2009, the date on which Class Y shares were initially offered by the fund. The returns shown have not been adjusted to reflect any differences in expenses between Class Y shares and Class Z shares.
4
Understanding Your Expenses – Columbia Large Cap Value Fund
As a fund shareholder, you incur two types of costs. There are transaction costs, which generally include sales charges on purchases and may include redemption fees or exchange fees. There are also ongoing costs, which generally include investment advisory fees, distribution and service (Rule 12b-1) fees and other fund expenses. The information on this page is intended to help you understand the ongoing costs of investing in the fund and to compare these costs with the ongoing costs of investing in other mutual funds.
Analyzing your fund's expenses by share class
To illustrate these ongoing costs, we have provided an example and calculated the expenses paid by investors in each share class during the period. The information in the following table is based on an initial investment of $1,000, which is invested at the beginning of the period and held for the entire period. Expense information is calculated two ways and each method provides you with different information. The amount listed in the "Actual" column is calculated using the fund's actual operating expenses and total return for the period. The amount listed in the "Hypothetical" column for each share class assumes that the return each year is 5% before expenses and is calculated based on the fund's actual operating expenses. You should not use the hypothetical account values and expenses to estimate either your actual account balance at the end of the period or the expenses you paid during this period.
Compare with other funds
Since all mutual funds are required to include the same hypothetical calculations about expenses in shareholder reports, you can use this information to compare the ongoing cost of investing in the fund with other funds. To do so, compare the 5% hypothetical example with the 5% hypothetical examples that appear in the shareholder reports of other funds. As you compare hypothetical examples of other funds, it is important to note that hypothetical examples are meant to highlight the ongoing costs of investing in a fund and do not reflect any transaction costs, such as sales charges, redemption fees or exchange fees.
Estimating your actual expenses
To estimate the expenses that you paid over the period, first you will need your account balance at the end of the period:
g For shareholders who receive their account statements from Columbia Management Services, Inc., your account balance is available online at www.columbiafunds.com or by calling Shareholder Services at 800.345.6611.
g For shareholders who receive their account statements from their financial intermediary, contact your financial intermediary to obtain your account balance.
1. Divide your ending account balance by $1,000. For example, if an account balance was $8,600 at the end of the period, the result would be 8.6.
2. In the section of the table below titled "Expenses paid during the period," locate the amount for your share class. You will find this number in the column labeled "Actual." Multiply this number by the result from step 1. Your answer is an estimate of the expenses you paid on your account during the period.
If the value of your account falls below the minimum initial investment requirement applicable to you, your account generally will be subject to a $20 annual fee. This fee is not included in the accompanying table. If you are subject to the fee, keep it in mind when you are estimating the ongoing expenses of investing in the fund and when comparing the expenses of this fund with other funds.
09/01/09 – 02/28/10
| | | Account value at the
beginning of the period ($) | | Account value at the
end of the period ($) | | Expenses paid
during the period ($) | | Fund's annualized
expense ratio (%) | |
| | | Actual | | Hypothetical | | Actual | | Hypothetical | | Actual | | Hypothetical | | Actual | |
| Class A | | | 1,000.00 | | | | 1,000.00 | | | | 1,062.50 | | | | 1,019.25 | | | | 5.71 | | | | 5.59 | | | | 1.12 | | |
| Class B | | | 1,000.00 | | | | 1,000.00 | | | | 1,058.70 | | | | 1,015.53 | | | | 9.54 | | | | 9.34 | | | | 1.87 | | |
| Class C | | | 1,000.00 | | | | 1,000.00 | | | | 1,057.50 | | | | 1,015.53 | | | | 9.53 | | | | 9.34 | | | | 1.87 | | |
| Class R | | | 1,000.00 | | | | 1,000.00 | | | | 1,060.20 | | | | 1,018.02 | | | | 6.98 | | | | 6.84 | | | | 1.37 | | |
| Class Y | | | 1,000.00 | | | | 1,000.00 | | | | 1,063.50 | | | | 1,021.21 | | | | 3.70 | | | | 3.62 | | | | 0.72 | | |
| Class Z | | | 1,000.00 | | | | 1,000.00 | | | | 1,062.70 | | | | 1,020.49 | | | | 4.43 | | | | 4.34 | | | | 0.87 | | |
Expenses paid during the period are equal to the annualized expense ratio for the share class, multiplied by the average account value over the period, then multiplied by the number of days in the fund's most recent fiscal half-year and divided by 365.
Had the investment advisor and/or any of its affiliates not waived fees or reimbursed a portion of expenses, account value at the end of the period would have been reduced.
It is important to note that the expense amounts shown in the table are meant to highlight only ongoing costs of investing in the fund and do not reflect any transaction costs, such as sales charges, redemption fees or exchange fees. Therefore, the hypothetical examples provided may not help you determine the relative total costs of owning shares of different funds. If these transaction costs were included, your costs would have been higher.
5
Portfolio Managers' Report – Columbia Large Cap Value Fund
Performance data quoted represents past performance and current performance may be lower or higher. Past performance is no guarantee of future results. The investment return and principal value will fluctuate so that shares, when redeemed, may be worth more or less than the original cost. Please visit www.columbiafunds.com for daily and most recent month-end performance updates.
Net asset value per share
as of 02/28/10 ($)
| Class A | | | 10.07 | | |
| Class B | | | 9.72 | | |
| Class C | | | 9.72 | | |
| Class R | | | 10.07 | | |
| Class Y | | | 10.10 | | |
| Class Z | | | 10.09 | | |
Distributions declared per share
03/01/09 – 02/28/10 ($)
| Class A | | | 0.10 | | |
| Class B | | | 0.04 | | |
| Class C | | | 0.04 | | |
| Class R | | | 0.08 | | |
| Class Y | | | 0.08 | | |
| Class Z | | | 0.12 | | |
For the 12-month period that ended February 28, 2010, the fund's Class A shares returned 45.49% without sales charge. The fund's benchmark, the Russell 1000 Value Index, returned 56.50%. The average return of the fund's peer group, the Lipper Large-Cap Value Funds Classification, was 53.99%. We believe that the fund's focus on higher-quality stocks accounted for its shortfall relative to the index as low-quality, higher-risk names—those with above-average levels of debt on their balance sheets that had fallen sharply in the market downturn—posted the steepest gains in the past year's market recovery. Although the rally was broad-based, value stocks ended the year ahead of growth stocks, and smaller-cap stocks outpaced larger-cap names.
Positive stock selection in energy and consumer staples
We sought out attractively-priced stocks issued by fundamentally sound companies that showed the potential to expand profit margins through revenue growth. Stock selection yielded strong returns in the energy and consumer staples sectors, which outpaced those in the Russell index. In energy, standouts included Williams Companies, a natural gas producer, and EOG Resources, an oil and gas exploration company (1.5% and 0.9% of net assets, respectively). Williams rallied after the company announced a restructuring of its pipeline and domestic distribution affiliates, while EOG climbed in anticipation of strong production growth. In the consumer staples sector, both J.M. Smucker Company, a food company whose brands include Smucker, Crisco and Pillsbury, and cosmetics company Avon Products (1.3% and 0.5% of net assets, respectively) aided performance. Smucker benefited from expectations that moderating input costs and the recent acqui sition of the Folgers coffee brand would boost profit margins. Avon experienced growing demand for its products in emerging markets, which helped drive strong revenue and earnings growth. Underweights in the telecommunications and utilities sectors, which delivered solid but relatively modest returns, further aided results.
Lost ground from financials and materials
Investments in the financials sector yielded strong absolute returns, but lagged results in the index, largely because the fund did not own the sector's lower-quality issuers. In addition, some holdings did not perform as expected. Detractors included AON Corp., an insurance brokerage company, and ACE Ltd. (0.7% of net assets), a property and casualty insurer that is not in the index. AON's shares fell sharply in the spring of 2009. In a persistently weak pricing environment, the company missed analysts' earnings estimates, leading us to sell the position. ACE posted solid gains, but underperformed the broader financials sector after reporting weaker-than-expected third quarter 2009 earnings. Disappointments within the materials sector included Nucor, a steel company, and Monsanto (1.0% and 1.2% of net assets, respectively), a fertilizer-and-chemicals company. Nucor struggled early in the year as lower steel prices and higher co sts crimped profit margins. Monsanto declined as competition pressured pricing and volumes in the chemicals business. The fund lost further ground from weak stock selection in the consumer discretionary and industrials sectors.
6
Portfolio Managers' Report (continued) – Columbia Large Cap Value Fund
Outlook and positioning ahead
Going forward, we believe that sustainable gains in the equity market will depend on permanent cost reductions by corporations accompanied by reaccelerating revenue growth. Regardless of what happens, we believe that the fund has the potential to benefit from focusing on individual stocks that meet our investment criteria. Currently, we are finding the best opportunities clustered by industry, particularly in economically-sensitive businesses, such as financials, materials and industrials. In financials, we have focused on banks that have strengthened their earnings power, balance sheets and long-term franchise values, particularly more consumer-oriented institutions. We also favor capital markets companies, which we believe can benefit from increased merger-and-acquisition activity. Elsewhere, we expect materials stocks to benefit from long-term emerging market demand growth as well as constrained supply. Within industrials, ou r emphasis is on attractively valued, early-cycle companies. We remain more cautious about the prospects for media and pharmaceuticals stocks, as we believe both industries face challenges that could lead to declining long-term earnings power.
Portfolio characteristics and holdings are subject to change periodically and may not be representative of current characteristics and holdings. The outlook for this fund may differ from those presented for other Columbia Funds.
Equity securities are subject to stock market fluctuations that occur in response to economic and business developments.
Value stocks are securities of companies that may have experienced adverse business or industry developments or may be subject to special risks that have caused the stocks to be out of favor. If the managers' assessment of a company's prospects is wrong, the price of the company's stock may not approach the value the manager has placed on it.
Top 5 sectors
as of 02/28/10 (%)
| Financials | | | 25.7 | | |
| Energy | | | 15.5 | | |
| Industrials | | | 11.6 | | |
| Consumer Discretionary | | | 9.5 | | |
| Health Care | | | 7.3 | | |
Top 10 holdings
as of 02/28/10 (%)
| JPMorgan Chase | | | 3.8 | | |
| Chevron | | | 3.4 | | |
| Occidental Petroleum | | | 3.1 | | |
| Goldman Sachs Group | | | 3.1 | | |
| U.S. Bancorp | | | 2.4 | | |
| Wells Fargo | | | 2.2 | | |
| EMC | | | 2.1 | | |
| Apache | | | 2.1 | | |
| American Electric Power | | | 2.1 | | |
| American Express | | | 2.0 | | |
The fund is actively managed and the composition of its portfolio will change over time. Information provided is calculated as a percentage of net assets.
7
Investment Portfolio – Columbia Large Cap Value Fund
February 28, 2010
| Common Stocks – 95.7% | |
| | | Shares | | Value ($) | |
| Consumer Discretionary – 9.5% | |
| Hotels, Restaurants & Leisure – 3.5% | |
| Carnival Corp. | | | 928,900 | | | | 33,403,244 | | |
| McDonald's Corp. | | | 344,519 | | | | 21,997,538 | | |
Starwood Hotels &
Resorts Worldwide, Inc. | | | 659,138 | | | | 25,508,641 | | |
| Hotels, Restaurants & Leisure Total | | | 80,909,423 | | |
| Household Durables – 0.5% | |
| D.R. Horton, Inc. | | | 831,300 | | | | 10,274,868 | | |
| Household Durables Total | | | 10,274,868 | | |
| Multiline Retail – 2.1% | |
| J.C. Penney Co., Inc. | | | 925,200 | | | | 25,517,016 | | |
| Nordstrom, Inc. | | | 652,300 | | | | 24,095,962 | | |
| Multiline Retail Total | | | 49,612,978 | | |
| Specialty Retail – 2.9% | |
| Lowe's Companies, Inc. | | | 1,807,400 | | | | 42,853,454 | | |
| O'Reilly Automotive, Inc. (a) | | | 641,800 | | | | 25,222,740 | | |
| Specialty Retail Total | | | 68,076,194 | | |
| Textiles, Apparel & Luxury Goods – 0.5% | |
| NIKE, Inc., Class B | | | 182,700 | | | | 12,350,520 | | |
| Textiles, Apparel & Luxury Goods Total | | | 12,350,520 | | |
| Consumer Discretionary Total | | | 221,223,983 | | |
| Consumer Staples – 6.2% | |
| Beverages – 1.4% | |
| Diageo PLC, ADR | | | 491,398 | | | | 32,078,461 | | |
| Beverages Total | | | 32,078,461 | | |
| Food & Staples Retailing – 0.5% | |
| Wal-Mart Stores, Inc. | | | 223,200 | | | | 12,068,424 | | |
| Food & Staples Retailing Total | | | 12,068,424 | | |
| Food Products – 1.3% | |
| J.M. Smucker Co. | | | 493,800 | | | | 29,469,984 | | |
| Food Products Total | | | 29,469,984 | | |
| Household Products – 1.1% | |
| Procter & Gamble Co. | | | 403,000 | | | | 25,501,840 | | |
| Household Products Total | | | 25,501,840 | | |
| Personal Products – 0.5% | |
| Avon Products, Inc. | | | 390,597 | | | | 11,889,773 | | |
| Personal Products Total | | | 11,889,773 | | |
| | | Shares | | Value ($) | |
| Tobacco – 1.4% | |
| Philip Morris International, Inc. | | | 662,077 | | | | 32,428,532 | | |
| Tobacco Total | | | 32,428,532 | | |
| Consumer Staples Total | | | 143,437,014 | | |
| Energy – 15.5% | |
| Energy Equipment & Services – 2.9% | |
| Halliburton Co. | | | 1,212,398 | | | | 36,553,800 | | |
| Nabors Industries Ltd. (a) | | | 1,440,200 | | | | 31,742,008 | | |
| Energy Equipment & Services Total | | | 68,295,808 | | |
| Oil, Gas & Consumable Fuels – 12.6% | |
Alpha Natural
Resources, Inc. (a) | | | 558,500 | | | | 25,696,585 | | |
| Apache Corp. | | | 473,600 | | | | 49,083,904 | | |
| Chevron Corp. | | | 1,081,200 | | | | 78,170,760 | | |
| EOG Resources, Inc. | | | 220,400 | | | | 20,728,620 | | |
| Occidental Petroleum Corp. | | | 917,600 | | | | 73,270,360 | | |
| Petroleo Brasileiro SA, ADR | | | 290,200 | | | | 12,377,030 | | |
| Williams Companies, Inc. | | | 1,577,400 | | | | 33,977,196 | | |
| Oil, Gas & Consumable Fuels Total | | | 293,304,455 | | |
| Energy Total | | | 361,600,263 | | |
| Financials – 24.7% | |
| Capital Markets – 4.7% | |
| Goldman Sachs Group, Inc. | | | 457,400 | | | | 71,514,490 | | |
| Morgan Stanley | | | 1,346,600 | | | | 37,947,188 | | |
| Capital Markets Total | | | 109,461,678 | | |
| Commercial Banks – 7.8% | |
| BB&T Corp. | | | 946,400 | | | | 27,000,792 | | |
| Fifth Third Bancorp. | | | 1,182,200 | | | | 14,434,662 | | |
PNC Financial Services
Group, Inc. | | | 468,079 | | | | 25,163,927 | | |
| U.S. Bancorp | | | 2,243,282 | | | | 55,207,170 | | |
| Wells Fargo & Co. | | | 1,911,614 | | | | 52,263,527 | | |
| Zions Bancorporation | | | 467,600 | | | | 8,669,304 | | |
| Commercial Banks Total | | | 182,739,382 | | |
| Consumer Finance – 2.0% | |
| American Express Co. | | | 1,242,100 | | | | 47,435,799 | | |
| Consumer Finance Total | | | 47,435,799 | | |
| Diversified Financial Services – 3.8% | |
| JPMorgan Chase & Co. | | | 2,105,510 | | | | 88,368,255 | | |
| Diversified Financial Services Total | | | 88,368,255 | | |
See Accompanying Notes to Financial Statements.
8
Columbia Large Cap Value Fund
February 28, 2010
| Common Stocks (continued) | |
| | | Shares | | Value ($) | |
| Insurance – 3.7% | |
| ACE Ltd. (a) | | | 334,276 | | | | 16,710,457 | | |
| Axis Capital Holdings Ltd. | | | 820,400 | | | | 25,801,580 | | |
| Prudential Financial, Inc. | | | 820,115 | | | | 42,982,227 | | |
| Insurance Total | | | 85,494,264 | | |
| Real Estate Investment Trusts (REITs) – 2.7% | |
Equity Residential
Property Trust | | | 400,400 | | | | 14,446,432 | | |
| Plum Creek Timber Co., Inc. | | | 271,166 | | | | 9,688,761 | | |
| Rayonier, Inc. | | | 438,800 | | | | 18,240,916 | | |
| Simon Property Group, Inc. | | | 257,473 | | | | 20,157,561 | | |
| Real Estate Investment Trusts (REITs) Total | | | 62,533,670 | | |
| Financials Total | | | 576,033,048 | | |
| Health Care – 7.3% | |
| Health Care Providers & Services – 1.2% | |
| Medco Health Solutions, Inc. (a) | | | 444,400 | | | | 28,103,856 | | |
| Health Care Providers & Services Total | | | 28,103,856 | | |
| Life Sciences Tools & Services – 3.4% | |
| Life Technologies Corp. (a) | | | 716,600 | | | | 36,374,616 | | |
| Millipore Corp. (a) | | | 66,600 | | | | 6,287,706 | | |
Thermo Fisher
Scientific, Inc. (a) | | | 771,800 | | | | 37,640,686 | | |
| Life Sciences Tools & Services Total | | | 80,303,008 | | |
| Pharmaceuticals – 2.7% | |
| Merck & Co., Inc. | | | 704,635 | | | | 25,986,939 | | |
| Pfizer, Inc. | | | 2,100,900 | | | | 36,870,795 | | |
| Pharmaceuticals Total | | | 62,857,734 | | |
| Health Care Total | | | 171,264,598 | | |
| Industrials – 11.6% | |
| Aerospace & Defense – 4.4% | |
| Goodrich Corp. | | | 293,300 | | | | 19,249,279 | | |
| Honeywell International, Inc. | | | 658,100 | | | | 26,429,296 | | |
L-3 Communications
Holdings, Inc. | | | 180,500 | | | | 16,501,310 | | |
| United Technologies Corp. | | | 585,380 | | | | 40,186,337 | | |
| Aerospace & Defense Total | | | 102,366,222 | | |
| Air Freight & Logistics – 0.5% | |
| FedEx Corp. | | | 142,700 | | | | 12,095,252 | | |
| Air Freight & Logistics Total | | | 12,095,252 | | |
| | | Shares | | Value ($) | |
| Building Products – 0.5% | |
| Masco Corp. | | | 840,800 | | | | 11,241,496 | | |
| Building Products Total | | | 11,241,496 | | |
| Construction & Engineering – 0.9% | |
| Fluor Corp. | | | 263,900 | | | | 11,294,920 | | |
| Foster Wheeler AG (a) | | | 387,900 | | | | 9,546,219 | | |
| Construction & Engineering Total | | | 20,841,139 | | |
| Industrial Conglomerates – 1.4% | |
| General Electric Co. | | | 1,978,816 | | | | 31,779,785 | | |
| Industrial Conglomerates Total | | | 31,779,785 | | |
| Machinery – 3.1% | |
| Eaton Corp. | | | 228,000 | | | | 15,531,360 | | |
| Illinois Tool Works, Inc. | | | 382,800 | | | | 17,425,056 | | |
| Ingersoll-Rand PLC | | | 483,900 | | | | 15,441,249 | | |
| Kennametal, Inc. | | | 224,900 | | | | 5,858,645 | | |
| Navistar International Corp. (a) | | | 340,902 | | | | 13,349,722 | | |
| PACCAR, Inc. | | | 154,100 | | | | 5,447,435 | | |
| Machinery Total | | | 73,053,467 | | |
| Professional Services – 0.8% | |
| Manpower, Inc. | | | 348,100 | | | | 17,934,112 | | |
| Professional Services Total | | | 17,934,112 | | |
| Industrials Total | | | 269,311,473 | | |
| Information Technology – 6.6% | |
| Computers & Peripherals – 4.1% | |
| EMC Corp. (a) | | | 2,827,600 | | | | 49,454,724 | | |
| Hewlett-Packard Co. | | | 352,600 | | | | 17,908,554 | | |
International Business
Machines Corp. | | | 222,100 | | | | 28,242,236 | | |
| Computers & Peripherals Total | | | 95,605,514 | | |
| IT Services – 0.4% | |
| Western Union Co. | | | 637,000 | | | | 10,051,860 | | |
| IT Services Total | | | 10,051,860 | | |
| Semiconductors & Semiconductor Equipment – 1.5% | |
| Lam Research Corp. (a) | | | 565,783 | | | | 19,185,701 | | |
| Texas Instruments, Inc. | | | 586,800 | | | | 14,306,184 | | |
Semiconductors & Semiconductor
Equipment Total | | | 33,491,885 | | |
| Software – 0.6% | |
| Nuance Communications, Inc. (a) | | | 951,200 | | | | 13,687,768 | | |
| Software Total | | | 13,687,768 | | |
| Information Technology Total | | | 152,837,027 | | |
See Accompanying Notes to Financial Statements.
9
Columbia Large Cap Value Fund
February 28, 2010
| Common Stocks (continued) | |
| | | Shares | | Value ($) | |
| Materials – 6.2% | |
| Chemicals – 2.2% | |
| Monsanto Co. | | | 405,200 | | | | 28,627,380 | | |
Potash Corp. of
Saskatchewan, Inc. | | | 208,100 | | | | 22,986,726 | | |
| Chemicals Total | | | 51,614,106 | | |
| Metals & Mining – 3.1% | |
| Allegheny Technologies, Inc. | | | 545,300 | | | | 23,807,798 | | |
| Nucor Corp. | | | 546,000 | | | | 22,604,400 | | |
| United States Steel Corp. | | | 500,200 | | | | 26,480,588 | | |
| Metals & Mining Total | | | 72,892,786 | | |
| Paper & Forest Products – 0.9% | |
| Weyerhaeuser Co. | | | 482,700 | | | | 19,501,080 | | |
| Paper & Forest Products Total | | | 19,501,080 | | |
| Materials Total | | | 144,007,972 | | |
| Telecommunication Services – 2.4% | |
| Diversified Telecommunication Services – 2.4% | |
| AT&T, Inc. | | | 1,659,051 | | | | 41,161,055 | | |
| Verizon Communications, Inc. | | | 503,802 | | | | 14,574,992 | | |
Diversified Telecommunication
Services Total | | | 55,736,047 | | |
| Telecommunication Services Total | | | 55,736,047 | | |
| Utilities – 5.7% | |
| Electric Utilities – 2.5% | |
American Electric
Power Co., Inc. | | | 1,442,900 | | | | 48,510,298 | | |
| Northeast Utilities | | | 355,561 | | | | 9,102,362 | | |
| Electric Utilities Total | | | 57,612,660 | | |
| Multi-Utilities – 3.2% | |
| PG&E Corp. | | | 876,143 | | | | 36,727,914 | | |
| Sempra Energy | | | 446,000 | | | | 21,929,820 | | |
| Wisconsin Energy Corp. | | | 331,900 | | | | 16,073,917 | | |
| Multi-Utilities Total | | | 74,731,651 | | |
| Utilities Total | | | 132,344,311 | | |
Total Common Stocks
(cost of $1,881,296,854) | | | 2,227,795,736 | | |
| Convertible Preferred Stocks – 1.9% | |
| | | Shares | | Value ($) | |
| Financials – 1.0% | |
| Diversified Financial Services – 1.0% | |
| Citigroup, Inc., 7.500% | | | 225,288 | | | | 24,164,391 | | |
| Diversified Financial Services Total | | | 24,164,391 | | |
| Financials Total | | | 24,164,391 | | |
| Materials – 0.9% | |
| Metals & Mining – 0.9% | |
Freeport-McMoRan
Copper & Gold, Inc., 6.750% | | | 201,000 | | | | 21,639,660 | | |
| Metals & Mining Total | | | 21,639,660 | | |
| Materials Total | | | 21,639,660 | | |
Total Convertible Preferred Stocks
(cost of $31,852,224) | | | 45,804,051 | | |
| Short-Term Obligation – 2.3% | |
| | | Par ($) | | | |
Repurchase agreement with
Fixed Income Clearing Corp.,
dated 02/26/10, due 03/01/10
at 0.050%, collateralized by
U.S. Government Agency
obligations with various
maturities to 12/30/13,
market value $54,214,413
(repurchase proceeds
$53,151,221) | | | 53,151,000 | | | | 53,151,000 | | |
Total Short-Term Obligation
(cost of $53,151,000) | | | 53,151,000 | | |
Total Investments – 99.9%
(cost of $1,966,300,078) (b) | | | 2,326,750,787 | | |
| Other Assets & Liabilities, Net – 0.1% | | | 1,207,951 | | |
| Net Assets – 100.0% | | | 2,327,958,738 | | |
Notes to Investment Portfolio:
(a) Non-income producing security.
(b) Cost for federal income tax purposes is $1,978,100,516.
See Accompanying Notes to Financial Statements.
10
Columbia Large Cap Value Fund
February 28, 2010
The following table summarizes the inputs used, as of February 28, 2010, in valuing the Fund's assets:
| Description | | Quoted Prices
(Level 1) | | Other
Significant
Observable
Inputs
(Level 2) | | Significant
Unobservable
Inputs
(Level 3) | | Total | |
Total Common
Stocks | | $ | 2,227,795,736 | | | $ | — | | | $ | — | | | $ | 2,227,795,736 | | |
Total Convertible
Preferred Stocks | | | 45,804,051 | | | | — | | | | — | | | | 45,804,051 | | |
Total Short-Term
Obligation | | | — | | | | 53,151,000 | | | | — | | | | 53,151,000 | | |
| Total Investments | | $ | 2,273,599,787 | | | $ | 53,151,000 | | | $ | — | | | $ | 2,326,750,787 | | |
For more information on valuation inputs, and their aggregation into the levels used in the table above, please refer to the Security Valuation section in the accompanying Notes to Financial Statements.
At February 28, 2010, the Fund held investments in the following sectors:
| Sector (Unaudited) | | % of
Net Assets | |
| Financials | | | 25.7 | | |
| Energy | | | 15.5 | | |
| Industrials | | | 11.6 | | |
| Consumer Discretionary | | | 9.5 | | |
| Health Care | | | 7.3 | | |
| Materials | | | 7.1 | | |
| Information Technology | | | 6.6 | | |
| Consumer Staples | | | 6.2 | | |
| Utilities | | | 5.7 | | |
| Telecommunication Services | | | 2.4 | | |
| | | | 97.6 | | |
| Short-Term Obligation | | | 2.3 | | |
| Other Assets & Liabilities, Net | | | 0.1 | | |
| | | | 100.0 | | |
| Acronym | | Name | |
| ADR | | American Depositary Receipt | |
|
See Accompanying Notes to Financial Statements.
11
Statement of Assets and Liabilities – Columbia Large Cap Value Fund
February 28, 2010
| | | | | ($) | |
| Assets | | Investments, at cost | | | 1,966,300,078 | | |
| | | Investments, at value | | | 2,326,750,787 | | |
| | | Cash | | | 3 | | |
| | | Receivable for: | | | | | |
| | | Investments sold | | | 1,514,583 | | |
| | | Fund shares sold | | | 1,936,289 | | |
| | | Dividends | | | 4,203,863 | | |
| | | Interest | | | 221 | | |
| | | Trustees' deferred compensation plan | | | 64,230 | | |
| | | Prepaid expenses | | | 26,358 | | |
| | | Total Assets | | | 2,334,496,334 | | |
| Liabilities | | Payable for: | | | | | |
| | | Fund shares repurchased | | | 4,037,692 | | |
| | | Investment advisory fee | | | 896,572 | | |
| | | Administration fee | | | 298,768 | | |
| | | Pricing and bookkeeping fees | | | 11,856 | | |
| | | Transfer agent fee | | | 505,895 | | |
| | | Trustees' fees | | | 89,157 | | |
| | | Custody fee | | | 9,142 | | |
| | | Distribution and service fees | | | 288,324 | | |
| | | Chief compliance officer expenses | | | 279 | | |
| | | Reports to shareholders | | | 280,373 | | |
| | | Trustees' deferred compensation plan | | | 64,230 | | |
| | | Other liabilities | | | 55,308 | | |
| | | Total Liabilities | | | 6,537,596 | | |
| | | Net Assets | | | 2,327,958,738 | | |
| Net Assets Consist of | | Paid-in capital | | | 2,838,831,474 | | |
| | | Undistributed net investment income | | | 1,287,424 | | |
| | | Accumulated net realized loss | | | (872,610,869 | ) | |
| | | Net unrealized appreciation on investments | | | 360,450,709 | | |
| | | Net Assets | | | 2,327,958,738 | | |
See Accompanying Notes to Financial Statements.
12
Statement of Assets and Liabilities – Columbia Large Cap Value Fund
February 28, 2010 (continued)
| Class A | | Net assets | | $ | 891,893,695 | | |
| | | Shares outstanding | | | 88,530,299 | | |
| | | Net asset value per share | | $ | 10.07 | (a) | |
| | | Maximum sales charge | | | 5.75 | % | |
| | | Maximum offering price per share | | $ | 10.68 | (b) | |
| Class B | | Net assets | | $ | 96,523,638 | | |
| | | Shares outstanding | | | 9,934,543 | | |
| | | Net asset value and offering price per share | | $ | 9.72 | (a) | |
| Class C | | Net assets | | $ | 37,229,369 | | |
| | | Shares outstanding | | | 3,831,275 | | |
| | | Net asset value and offering price per share | | $ | 9.72 | (a) | |
| Class R | | Net assets | | $ | 252,290 | | |
| | | Shares outstanding | | | 25,061 | | |
| | | Net asset value, offering and redemption price per share | | $ | 10.07 | | |
| Class Y (c) | | Net assets | | $ | 11,497,038 | | |
| | | Shares outstanding | | | 1,138,501 | | |
| | | Net asset value, offering and redemption price per share | | $ | 10.10 | | |
| Class Z | | Net assets | | $ | 1,290,562,708 | | |
| | | Shares outstanding | | | 127,856,817 | | |
| | | Net asset value, offering and redemption price per share | | $ | 10.09 | | |
(a) Redemption price per share is equal to net asset value less any applicable contingent deferred sales charge.
(b) On sales of $50,000 or more the offering price is reduced.
(c) Class Y shares commenced operations on July 15, 2009.
See Accompanying Notes to Financial Statements.
13
Statement of Operations – Columbia Large Cap Value Fund
For the Year Ended February 28, 2010
| | | | | ($) | |
| Investment Income | | Dividends | | | 45,847,123 | | |
| | | Interest | | | 426,365 | | |
| | | Foreign taxes withheld | | | (120,592 | ) | |
| | | Total Investment Income | | | 46,152,896 | | |
| Expenses | | Investment advisory fee | | | 11,014,155 | | |
| | | Administration fee | | | 3,641,178 | | |
| | | Distribution fee: | | | | | |
| | | Class B | | | 931,465 | | |
| | | Class C | | | 278,193 | | |
| | | Class R | | | 1,043 | | |
| | | Service fee: | | | | | |
| | | Class B | | | 310,488 | | |
| | | Class C | | | 92,731 | | |
| | | Distribution and service fees: | | | | | |
| | | Class A | | | 2,116,593 | | |
| | | Transfer agent fee: | | | | | |
| | | Class A, Class B, Class C, Class R and Class Z | | | 3,823,229 | | |
| | | Class Y (a) | | | 24 | | |
| | | Pricing and bookkeeping fees | | | 141,357 | | |
| | | Trustee's fees | | | 50,365 | | |
| | | Custody fee | | | 50,440 | | |
| | | Chief compliance officer expenses | | | 1,424 | | |
| | | Other expenses | | | 912,897 | | |
| | | Total Expenses | | | 23,365,582 | | |
| | | Fees waived by transfer agent | | | (278,265 | ) | |
| | | Fees waived or expenses reimbursed by investment advisor
and/or administrator | | | (66,850 | ) | |
| | | Expense reductions | | | (8 | ) | |
| | | Net Expenses | | | 23,020,459 | | |
| | | Net Investment Income | | | 23,132,437 | | |
Net Realized and Unrealized
Gain (Loss) on Investments | | Net realized loss on investments | | | (154,849,867 | ) | |
| | | Net change in unrealized appreciation (depreciation) on investments | | | 918,811,164 | | |
| | | Net Gain | | | 763,961,297 | | |
| | | Net Increase Resulting from Operations | | | 787,093,734 | | |
(a) Class Y shares commenced operations on July 15, 2009.
See Accompanying Notes to Financial Statements.
14
Statement of Changes in Net Assets – Columbia Large Cap Value Fund
| | | | | Year Ended February 28, | |
| Increase (Decrease) in Net Assets | | | | 2010 ($)(a) | | 2009 ($) | |
| Operations | | Net investment income | | | 23,132,437 | | | | 49,270,249 | | |
| | | Net realized loss on investments and written options | | | (154,849,867 | ) | | | (612,666,044 | ) | |
| | | Net change in unrealized appreciation (depreciation)
on investments | | | 918,811,164 | | | | (812,203,175 | ) | |
| | | Net increase (decrease) resulting from operations | | | 787,093,734 | | | | (1,375,598,970 | ) | |
| Distributions to Shareholders | | From net investment income: | | | | | | | | | |
| | | Class A | | | (9,326,644 | ) | | | (19,145,155 | ) | |
| | | Class B | | | (503,460 | ) | | | (2,456,302 | ) | |
| | | Class C | | | (148,010 | ) | | | (544,756 | ) | |
| | | Class R | | | (1,783 | ) | | | (3,471 | ) | |
| | | Class Y | | | (88,057 | ) | | | — | | |
| | | Class Z | | | (16,140,284 | ) | | | (31,407,396 | ) | |
| | | Total distributions to shareholders | | | (26,208,238 | ) | | | (53,557,080 | ) | |
| | | Net Capital Stock Transactions | | | (171,434,011 | ) | | | (417,626,088 | ) | |
| | | Increase from regulatory settlements | | | 1,763 | | | | — | | |
| | | Total increase (decrease) in net assets | | | 589,453,248 | | | | (1,846,782,138 | ) | |
| Net Assets | | Beginning of period | | | 1,738,505,490 | | | | 3,585,287,628 | | |
| | | End of period | | | 2,327,958,738 | | | | 1,738,505,490 | | |
| | | Undistributed net investment income at end of period | | | 1,287,424 | | | | 4,361,462 | | |
(a) Class Y shares commenced operations on July 15, 2009.
See Accompanying Notes to Financial Statements.
15
Statement of Changes in Net Assets (continued) – Columbia Large Cap Value Fund
| | | Capital Stock Activity | |
| | | Year Ended February 28, | |
| | | 2010 | | 2009 | |
| | | Shares | | Dollars ($) | | Shares | | Dollars ($) | |
| Class A | |
| Subscriptions | | | 14,418,748 | | | | 127,246,912 | | | | 21,665,197 | | | | 223,674,367 | | |
| Distributions reinvested | | | 994,912 | | | | 8,893,118 | | | | 1,758,660 | | | | 18,227,584 | | |
| Redemptions | | | (22,943,831 | ) | | | (205,288,668 | ) | | | (29,409,824 | ) | | | (296,101,412 | ) | |
| Net decrease | | | (7,530,171 | ) | | | (69,148,638 | ) | | | (5,985,967 | ) | | | (54,199,461 | ) | |
| Class B | |
| Subscriptions | | | 173,524 | | | | 1,441,614 | | | | 326,080 | | | | 3,333,007 | | |
| Distributions reinvested | | | 54,092 | | | | 462,394 | | | | 231,092 | | | | 2,247,279 | | |
| Redemptions | | | (9,174,195 | ) | | | (80,479,829 | ) | | | (10,677,747 | ) | | | (108,032,276 | ) | |
| Net decrease | | | (8,946,579 | ) | | | (78,575,821 | ) | | | (10,120,575 | ) | | | (102,451,990 | ) | |
| Class C | |
| Subscriptions | | | 248,296 | | | | 2,150,151 | | | | 364,182 | | | | 3,317,906 | | |
| Distributions reinvested | | | 14,624 | | | | 126,386 | | | | 48,057 | | | | 465,605 | | |
| Redemptions | | | (1,035,282 | ) | | | (9,064,816 | ) | | | (1,703,376 | ) | | | (16,777,002 | ) | |
| Net decrease | | | (772,362 | ) | | | (6,788,279 | ) | | | (1,291,137 | ) | | | (12,993,491 | ) | |
| Class R | |
| Subscriptions | | | 8,096 | | | | 73,330 | | | | 6,275 | | | | 66,917 | | |
| Distributions reinvested | | | 199 | | | | 1,783 | | | | 342 | | | | 3,472 | | |
| Redemptions | | | (4,316 | ) | | | (39,322 | ) | | | (4,602 | ) | | | (42,622 | ) | |
| Net increase | | | 3,979 | | | | 35,791 | | | | 2,015 | | | | 27,767 | | |
| Class Y (a) | |
| Subscriptions | | | 2,538,079 | | | | 22,992,093 | | | | — | | | | — | | |
| Distributions reinvested | | | 9 | | | | 89 | | | | — | | | | — | | |
| Redemptions | | | (1,399,587 | ) | | | (13,030,304 | ) | | | — | | | | — | | |
| Net increase | | | 1,138,501 | | | | 9,961,878 | | | | — | | | | — | | |
| Class Z | |
| Subscriptions | | | 23,268,121 | | | | 200,560,704 | | | | 19,753,607 | | | | 193,882,402 | | |
| Distributions reinvested | | | 1,061,174 | | | | 9,540,775 | | | | 1,620,276 | | | | 17,041,733 | | |
| Redemptions | | | (25,864,203 | ) | | | (237,020,421 | ) | | | (45,713,915 | ) | | | (458,933,048 | ) | |
| Net decrease | | | (1,534,908 | ) | | | (26,918,942 | ) | | | (24,340,032 | ) | | | (248,008,913 | ) | |
(a) Class Y shares commenced operations on July 15, 2009.
See Accompanying Notes to Financial Statements.
16
Financial Highlights – Columbia Large Cap Value Fund
Selected data for a share outstanding throughout each period is as follows:
| | | Year Ended
February 28, | | Year Ended
February 29, | | Period Ended
February 28, | | Year Ended March 31, | |
| Class A Shares | | 2010 | | 2009 | | 2008 | | 2007 (a) | | 2006 (b) | | 2005 | |
| Net Asset Value, Beginning of Period | | $ | 7.00 | | | $ | 12.37 | | | $ | 15.16 | | | $ | 14.60 | | | $ | 13.10 | | | $ | 11.84 | | |
| Income from Investment Operations: | |
| Net investment income (c) | | | 0.09 | | | | 0.18 | | | | 0.20 | | | �� | 0.17 | | | | 0.19 | | | | 0.17 | | |
Net realized and unrealized gain (loss)
on investments, foreign currency and
written options | | | 3.08 | | | | (5.36 | ) | | | (1.14 | ) | | | 1.37 | | | | 1.64 | | | | 1.26 | | |
| Total from investment operations | | | 3.17 | | | | (5.18 | ) | | | (0.94 | ) | | | 1.54 | | | | 1.83 | | | | 1.43 | | |
| Less Distributions to Shareholders: | |
| From net investment income | | | (0.10 | ) | | | (0.19 | ) | | | (0.22 | ) | | | (0.12 | ) | | | (0.16 | ) | | | (0.17 | ) | |
| From net realized gains | | | — | | | | — | | | | (1.63 | ) | | | (0.86 | ) | | | (0.17 | ) | | | — | | |
| Total distributions to shareholders | | | (0.10 | ) | | | (0.19 | ) | | | (1.85 | ) | | | (0.98 | ) | | | (0.33 | ) | | | (0.17 | ) | |
| Increase from regulatory settlements | | | — | (d) | | | — | | | | — | | | | — | | | | — | | | | — | | |
| Net Asset Value, End of Period | | $ | 10.07 | | | $ | 7.00 | | | $ | 12.37 | | | $ | 15.16 | | | $ | 14.60 | | | $ | 13.10 | | |
| Total return (e)(f) | | | 45.49 | % | | | (42.36 | )% | | | (7.55 | )% | | | 11.09 | %(g) | | | 14.15 | % | | | 12.16 | % | |
Ratios to Average Net Assets/
Supplemental Data: | |
| Net expenses before interest expense (h) | | | 1.12 | % | | | 1.04 | % | | | 0.99 | % | | | 1.01 | %(i) | | | 0.96 | % | | | 1.02 | % | |
| Interest expense | | | — | | | | — | %(j) | | | — | | | | — | | | | — | | | | — | | |
| Net expenses (h) | | | 1.12 | % | | | 1.04 | % | | | 0.99 | % | | | 1.01 | %(i) | | | 0.96 | % | | | 1.02 | % | |
| Waiver/Reimbursement | | | 0.01 | % | | | 0.06 | % | | | 0.06 | % | | | 0.05 | %(i) | | | 0.09 | %(k) | | | 0.13 | %(k) | |
| Net investment income (h) | | | 0.95 | % | | | 1.68 | % | | | 1.37 | % | | | 1.27 | %(i) | | | 1.36 | % | | | 1.41 | % | |
| Portfolio turnover rate | | | 61 | % | | | 61 | % | | | 62 | % | | | 66 | %(g) | | | 59 | % | | | 52 | % | |
| Net assets, end of period (000s) | | $ | 891,894 | | | $ | 672,426 | | | $ | 1,262,700 | | | $ | 1,332,311 | | | $ | 1,066,456 | | | $ | 292,037 | | |
(a) The Fund changed its fiscal year end from March 31 to February 28. Per share data and total return reflect activity from April 1, 2006 through February 28, 2007.
(b) On August 22, 2005, the Fund's Investor A shares were renamed Class A shares.
(c) Per share data was calculated using the average shares outstanding during the period.
(d) Rounds to less than $0.01 per share.
(e) Total return at net asset value assuming all distributions reinvested and no initial sales charge or contingent deferred sales charge.
(f) Had the investment advisor and/or any of its affiliates not waived fees or reimbursed a portion of expenses, total return would have been reduced.
(g) Not annualized.
(h) The benefits derived from expense reductions had an impact of less than 0.01%.
(i) Annualized.
(j) Rounds to less than 0.01%.
(k) Bank of America Corporation assumed certain non-recurring costs. Absent these non-recurring costs, the waiver/reimbursement ratio would have been 0.03% and 0.10% for the years ended March 31, 2006 and March 31, 2005, respectively.
See Accompanying Notes to Financial Statements.
17
Financial Highlights – Columbia Large Cap Value Fund
Selected data for a share outstanding throughout each period is as follows:
| | | Year Ended
February 28, | | Year Ended
February 29, | | Period Ended
February 28, | | Year Ended March 31, | |
| Class B Shares | | 2010 | | 2009 | | 2008 | | 2007 (a) | | 2006 (b) | | 2005 | |
| Net Asset Value, Beginning of Period | | $ | 6.75 | | | $ | 11.94 | | | $ | 14.69 | | | $ | 14.19 | | | $ | 12.75 | | | $ | 11.53 | | |
| Income from Investment Operations: | |
| Net investment income (c) | | | 0.02 | | | | 0.09 | | | | 0.09 | | | | 0.07 | | | | 0.08 | | | | 0.08 | | |
Net realized and unrealized gain (loss)
on investments, foreign currency and
written options | | | 2.99 | | | | (5.17 | ) | | | (1.10 | ) | | | 1.34 | | | | 1.59 | | | | 1.22 | | |
| Total from investment operations | | | 3.01 | | | | (5.08 | ) | | | (1.01 | ) | | | 1.41 | | | | 1.67 | | | | 1.30 | | |
| Less Distributions to Shareholders: | |
| From net investment income | | | (0.04 | ) | | | (0.11 | ) | | | (0.11 | ) | | | (0.05 | ) | | | (0.06 | ) | | | (0.08 | ) | |
| From net realized gains | | | — | | | | — | | | | (1.63 | ) | | | (0.86 | ) | | | (0.17 | ) | | | — | | |
| Total distributions to shareholders | | | (0.04 | ) | | | (0.11 | ) | | | (1.74 | ) | | | (0.91 | ) | | | (0.23 | ) | | | (0.08 | ) | |
| Increase from regulatory settlements | | | — | (d) | | | — | | | | — | | | | — | | | | — | | | | — | | |
| Net Asset Value, End of Period | | $ | 9.72 | | | $ | 6.75 | | | $ | 11.94 | | | $ | 14.69 | | | $ | 14.19 | | | $ | 12.75 | | |
| Total return (e)(f) | | | 44.59 | % | | | (42.84 | )% | | | (8.24 | )% | | | 10.38 | %(g) | | | 13.22 | % | | | 11.31 | % | |
Ratios to Average Net Assets/
Supplemental Data: | |
| Net expenses before interest expense (h) | | | 1.87 | % | | | 1.79 | % | | | 1.74 | % | | | 1.76 | %(i) | | | 1.71 | % | | | 1.77 | % | |
| Interest expense | | | — | | | | — | %(j) | | | — | | | | — | | | | — | | | | — | | |
| Net expenses (h) | | | 1.87 | % | | | 1.79 | % | | | 1.74 | % | | | 1.76 | %(i) | | | 1.71 | % | | | 1.77 | % | |
| Waiver/Reimbursement | | | 0.01 | % | | | 0.06 | % | | | 0.06 | % | | | 0.05 | %(i) | | | 0.09 | %(k) | | | 0.13 | %(k) | |
| Net investment income (h) | | | 0.23 | % | | | 0.89 | % | | | 0.60 | % | | | 0.52 | %(i) | | | 0.60 | % | | | 0.66 | % | |
| Portfolio turnover rate | | | 61 | % | | | 61 | % | | | 62 | % | | | 66 | %(g) | | | 59 | % | | | 52 | % | |
| Net assets, end of period (000s) | | $ | 96,524 | | | $ | 127,489 | | | $ | 346,218 | | | $ | 557,033 | | | $ | 693,558 | | | $ | 84,756 | | |
(a) The Fund changed its fiscal year end from March 31 to February 28. Per share data and total return reflect activity from April 1, 2006 through February 28, 2007.
(b) On August 22, 2005, the Fund's Investor B shares were renamed Class B shares.
(c) Per share data was calculated using the average shares outstanding during the period.
(d) Rounds to less than $0.01 per share.
(e) Total return at net asset value assuming all distributions reinvested and no contingent deferred sales charge.
(f) Had the investment advisor and/or any of its affiliates not waived fees or reimbursed a portion of expenses, total return would have been reduced.
(g) Not annualized.
(h) The benefits derived from expense reductions had an impact of less than 0.01%.
(i) Annualized.
(j) Rounds to less than 0.01%.
(k) Bank of America Corporation assumed certain non-recurring costs. Absent these non-recurring costs, the waiver/reimbursement ratio would have been 0.03% and 0.10% for the years ended March 31, 2006 and March 31, 2005, respectively.
See Accompanying Notes to Financial Statements.
18
Financial Highlights – Columbia Large Cap Value Fund
Selected data for a share outstanding throughout each period is as follows:
| | | Year Ended
February 28, | | Year Ended
February 29, | | Period Ended
February 28, | | Year Ended March 31, | |
| Class C Shares | | 2010 | | 2009 | | 2008 | | 2007 (a) | | 2006 (b) | | 2005 | |
| Net Asset Value, Beginning of Period | | $ | 6.75 | | | $ | 11.94 | | | $ | 14.69 | | | $ | 14.19 | | | $ | 12.75 | | | $ | 11.52 | | |
| Income from Investment Operations: | |
| Net investment income (c) | | | 0.02 | | | | 0.09 | | | | 0.09 | | | | 0.07 | | | | 0.08 | | | | 0.08 | | |
Net realized and unrealized gain (loss)
on investments, foreign currency and
written options | | | 2.99 | | | | (5.17 | ) | | | (1.10 | ) | | | 1.34 | | | | 1.59 | | | | 1.22 | | |
| Total from investment operations | | | 3.01 | | | | (5.08 | ) | | | (1.01 | ) | | | 1.41 | | | | 1.67 | | | | 1.30 | | |
| Less Distributions to Shareholders: | |
| From net investment income | | | (0.04 | ) | | | (0.11 | ) | | | (0.11 | ) | | | (0.05 | ) | | | (0.06 | ) | | | (0.07 | ) | |
| From net realized gains | | | — | | | | — | | | | (1.63 | ) | | | (0.86 | ) | | | (0.17 | ) | | | — | | |
| Total distributions to shareholders | | | (0.04 | ) | | | (0.11 | ) | | | (1.74 | ) | | | (0.91 | ) | | | (0.23 | ) | | | (0.07 | ) | |
| Increase from regulatory settlements | | | — | (d) | | | — | | | | — | | | | — | | | | — | | | | — | | |
| Net Asset Value, End of Period | | $ | 9.72 | | | $ | 6.75 | | | $ | 11.94 | | | $ | 14.69 | | | $ | 14.19 | | | $ | 12.75 | | |
| Total return (e)(f) | | | 44.59 | % | | | (42.84 | )% | | | (8.24 | )% | | | 10.38 | %(g) | | | 13.22 | % | | | 11.36 | % | |
Ratios to Average Net Assets/
Supplemental Data: | |
| Net expenses before interest expense (h) | | | 1.87 | % | | | 1.79 | % | | | 1.74 | % | | | 1.76 | %(i) | | | 1.71 | % | | | 1.77 | % | |
| Interest expense | | | — | | | | — | %(j) | | | — | | | | — | | | | — | | | | — | | |
| Net expenses (h) | | | 1.87 | % | | | 1.79 | % | | | 1.74 | % | | | 1.76 | %(i) | | | 1.71 | % | | | 1.77 | % | |
| Waiver/Reimbursement | | | 0.01 | % | | | 0.06 | % | | | 0.06 | % | | | 0.05 | %(i) | | | 0.09 | %(k) | | | 0.13 | %(k) | |
| Net investment income (h) | | | 0.21 | % | | | 0.90 | % | | | 0.60 | % | | | 0.52 | %(i) | | | 0.60 | % | | | 0.66 | % | |
| Portfolio turnover rate | | | 61 | % | | | 61 | % | | | 62 | % | | | 66 | %(g) | | | 59 | % | | | 52 | % | |
| Net assets, end of period (000s) | | $ | 37,229 | | | $ | 31,091 | | | $ | 70,383 | | | $ | 94,600 | | | $ | 98,884 | | | $ | 17,210 | | |
(a) The Fund changed its fiscal year end from March 31 to February 28. Per share data and total return reflect activity from April 1, 2006 through February 28, 2007.
(b) On August 22, 2005, the Fund's Investor C shares were renamed Class C shares.
(c) Per share data was calculated using the average shares outstanding during the period.
(d) Rounds to less than $0.01 per share.
(e) Total return at net asset value assuming all distributions reinvested and no contingent deferred sales charge.
(f) Had the investment advisor and/or any of its affiliates not waived fees or reimbursed a portion of expenses, total return would have been reduced.
(g) Not annualized.
(h) The benefits derived from expense reductions had an impact of less than 0.01%.
(i) Annualized.
(j) Rounds to less than 0.01%.
(k) Bank of America Corporation assumed certain non-recurring costs. Absent these non-recurring costs, the waiver/reimbursement ratio would have been 0.03% and 0.10% for the years ended March 31, 2006 and March 31, 2005, respectively.
See Accompanying Notes to Financial Statements.
19
Financial Highlights – Columbia Large Cap Value Fund
Selected data for a share outstanding throughout each period is as follows:
| | | Year Ended February 28, | | Year Ended
February 29 | | Period Ended
February 28, | | Period Ended
March 31, | |
| Class R Shares | | 2010 | | 2009 | | 2008 | | 2007 (a) | | 2006 (b) | |
| Net Asset Value, Beginning of Period | | $ | 6.99 | | | $ | 12.36 | | | $ | 15.15 | | | $ | 14.59 | | | $ | 14.05 | | |
| Income from Investment Operations: | |
| Net investment income (c) | | | 0.07 | | | | 0.15 | | | | 0.22 | | | | 0.14 | | | | 0.04 | | |
Net realized and unrealized gain (loss)
on investments, foreign currency and
written options | | | 3.09 | | | | (5.36 | ) | | | (1.19 | ) | | | 1.38 | | | | 0.53 | | |
| Total from investment operations | | | 3.16 | | | | (5.21 | ) | | | (0.97 | ) | | | 1.52 | | | | 0.57 | | |
| Less Distributions to Shareholders: | |
| From net investment income | | | (0.08 | ) | | | (0.16 | ) | | | (0.19 | ) | | | (0.10 | ) | | | (0.03 | ) | |
| From net realized gains | | | — | | | | — | | | | (1.63 | ) | | | (0.86 | ) | | | — | | |
| Total distributions to shareholders | | | (0.08 | ) | | | (0.16 | ) | | | (1.82 | ) | | | (0.96 | ) | | | (0.03 | ) | |
| Increase from regulatory settlements | | | — | (d) | | | — | | | | — | | | | — | | | | — | | |
| Net Asset Value, End of Period | | $ | 10.07 | | | $ | 6.99 | | | $ | 12.36 | | | $ | 15.15 | | | $ | 14.59 | | |
| Total return (e)(f) | | | 45.34 | % | | | (42.54 | )% | | | (7.79 | )% | | | 10.90 | %(g) | | | 4.05 | %(g) | |
Ratios to Average Net Assets/
Supplemental Data: | |
| Net expenses before interest expense (h) | | | 1.37 | % | | | 1.29 | % | | | 1.24 | % | | | 1.26 | %(i) | | | 1.25 | %(i) | |
| Interest expense | | | — | | | | — | %(j) | | | — | | | | — | | | | — | | |
| Net expenses (h) | | | 1.37 | % | | | 1.29 | % | | | 1.24 | % | | | 1.26 | %(i) | | | 1.25 | %(i) | |
| Waiver/Reimbursement | | | 0.01 | % | | | 0.06 | % | | | 0.06 | % | | | 0.05 | %(i) | | | 0.16 | %(i)(k) | |
| Net investment income (h) | | | 0.71 | % | | | 1.45 | % | | | 1.63 | % | | | 1.02 | %(i) | | | 1.33 | %(i) | |
| Portfolio turnover rate | | | 61 | % | | | 61 | % | | | 62 | % | | | 66 | %(g) | | | 59 | %(g) | |
| Net assets, end of period (000s) | | $ | 252 | | | $ | 147 | | | $ | 236 | | | $ | 11 | | | $ | 10 | | |
(a) The Fund changed its fiscal year end from March 31 to February 28. Per share data and total return reflect activity from April 1, 2006 through February 28, 2007.
(b) Class R shares commenced operations on January 23, 2006. Per share data and total return reflect activity from that date.
(c) Per share data was calculated using the average shares outstanding during the period.
(d) Rounds to less than $0.01 per share.
(e) Total return at net asset value assuming all distributions reinvested.
(f) Had the investment advisor and/or any of its affiliates not waived fees or reimbursed a portion of expenses, total return would have been reduced.
(g) Not annualized.
(h) The benefits derived from expense reductions had an impact of less than 0.01%.
(i) Annualized.
(j) Rounds to less than 0.01%.
(k) Bank of America Corporation assumed certain non-recurring costs. Absent these non-recurring costs, the waiver/reimbursement ratio would have been 0.10% for the period ended March 31, 2006.
See Accompanying Notes to Financial Statements.
20
Financial Highlights – Columbia Large Cap Value Fund
Selected data for a share outstanding throughout the period is as follows:
| Class Y Shares | | Period Ended
February 28,
2010 (a) | |
| Net Asset Value, Beginning of Period | | $ | 8.65 | | |
| Income from Investment Operations: | |
| Net investment income (b) | | | 0.08 | | |
| Net realized and unrealized gain on investments | | | 1.45 | | |
| Total from investment operations | | | 1.53 | | |
| Less Distributions to Shareholders: | |
| From net investment income | | | (0.08 | ) | |
| Net Asset Value, End of Period | | $ | 10.10 | | |
| Total return (c)(d) | | | 17.67 | % | |
| Ratios to Average Net Assets/Supplemental Data: | |
| Net expenses (e)(f) | | | 0.72 | % | |
| Net investment income (e)(f) | | | 1.36 | % | |
| Portfolio turnover rate (d) | | | 61 | % | |
| Net assets, end of period (000s) | | $ | 11,497 | | |
(a) Class Y shares commenced operations on July 15, 2009. Per share data and total return reflect activity from that date.
(b) Per share data was calculated using the average shares outstanding during the period.
(c) Total return at net asset value assuming all distributions reinvested.
(d) Not annualized.
(e) Annualized.
(f) The benefits derived from expense reductions had an impact of less than 0.01%.
See Accompanying Notes to Financial Statements.
21
Financial Highlights – Columbia Large Cap Value Fund
Selected data for a share outstanding throughout each period is as follows:
| | | Year Ended
February 28, | | Year Ended
February 29, | | Period Ended
February 28, | | Year Ended March 31, | |
| Class Z Shares | | 2010 | | 2009 | | 2008 | | 2007 (a) | | 2006 (b) | | 2005 | |
| Net Asset Value, Beginning of Period | | $ | 7.01 | | | $ | 12.40 | | | $ | 15.19 | | | $ | 14.61 | | | $ | 13.12 | | | $ | 11.85 | | |
| Income from Investment Operations: | |
| Net investment income (c) | | | 0.11 | | | | 0.20 | | | | 0.24 | | | | 0.21 | | | | 0.22 | | | | 0.20 | | |
Net realized and unrealized gain (loss)
on investments, foreign currency and
written options | | | 3.09 | | | | (5.39 | ) | | | (1.14 | ) | | | 1.38 | | | | 1.63 | | | | 1.27 | | |
| Total from investment operations | | | 3.20 | | | | (5.19 | ) | | | (0.90 | ) | | | 1.59 | | | | 1.85 | | | | 1.47 | | |
| Less Distributions to Shareholders: | |
| From net investment income | | | (0.12 | ) | | | (0.22 | ) | | | (0.26 | ) | | | (0.15 | ) | | | (0.19 | ) | | | (0.20 | ) | |
| From net realized gains | | | — | | | | — | | | | (1.63 | ) | | | (0.86 | ) | | | (0.17 | ) | | | — | | |
| Total distributions to shareholders | | | (0.12 | ) | | | (0.22 | ) | | | (1.89 | ) | | | (1.01 | ) | | | (0.36 | ) | | | (0.20 | ) | |
| Increase from regulatory settlements | | | — | (d) | | | 0.02 | | | | — | | | | — | | | | — | | | | — | | |
| Net Asset Value, End of Period | | $ | 10.09 | | | $ | 7.01 | | | $ | 12.40 | | | $ | 15.19 | | | $ | 14.61 | | | $ | 13.12 | | |
| Total return (e)(f) | | | 45.93 | %(g) | | | (42.27 | )% | | | (7.29 | )% | | | 11.42 | %(g) | | | 14.33 | % | | | 12.51 | % | |
Ratios to Average Net Assets/
Supplemental Data: | |
| Net expenses before interest expense (h) | | | 0.87 | % | | | 0.79 | % | | | 0.74 | % | | | 0.76 | %(i) | | | 0.71 | % | | | 0.77 | % | |
| Interest expense | | | — | | | | — | %(j) | | | — | | | | — | | | | — | | | | — | | |
| Net expenses (h) | | | 0.87 | % | | | 0.79 | % | | | 0.74 | % | | | 0.76 | %(i) | | | 0.71 | % | | | 0.77 | % | |
| Waiver/Reimbursement | | | 0.01 | % | | | 0.06 | % | | | 0.06 | % | | | 0.05 | %(i) | | | 0.09 | %(k) | | | 0.13 | %(k) | |
| Net investment income (h) | | | 1.21 | % | | | 1.91 | % | | | 1.61 | % | | | 1.52 | %(i) | | | 1.60 | % | | | 1.66 | % | |
| Portfolio turnover rate | | | 61 | % | | | 61 | % | | | 62 | % | | | 66 | %(g) | | | 59 | % | | | 52 | % | |
| Net assets, end of period (000s) | | $ | 1,290,563 | | | $ | 907,353 | | | $ | 1,905,752 | | | $ | 2,277,652 | | | $ | 2,009,115 | | | $ | 1,376,691 | | |
(a) The Fund changed its fiscal year end from March 31 to February 28. Per share data and total return reflect activity from April 1, 2006 through February 28, 2007.
(b) On August 22, 2005, the Fund's Primary A shares were renamed Class Z shares.
(c) Per share data was calculated using the average shares outstanding during the period.
(d) Rounds to less than $0.01 per share.
(e) Total return at net asset value assuming all distributions reinvested.
(f) Had the investment advisor and/or any of its affiliates not waived fees or reimbursed a portion of expenses, total return would have been reduced.
(g) Not annualized.
(h) The benefits derived from expense reductions had an impact of less than 0.01%.
(i) Annualized.
(j) Rounds to less than 0.01%.
(k) Bank of America Corporation assumed certain non-recurring costs. Absent these non-recurring costs, the waiver/reimbursement ratio would have been 0.03% and 0.10% for the years ended March 31, 2006 and March 31, 2005, respectively.
See Accompanying Notes to Financial Statements.
22
Notes to Financial Statements – Columbia Large Cap Value Fund
February 28, 2010
Note 1. Organization
Columbia Large Cap Value Fund (the "Fund"), a series of Columbia Funds Series Trust (the "Trust"), is a diversified fund. The Trust is registered under the Investment Company Act of 1940, as amended (the "1940 Act"), as an open-end management investment company organized as a Delaware statutory trust.
Investment Objective
The Fund seeks long-term capital appreciation.
Fund Shares
The Trust may issue an unlimited number of shares, and the Fund offers six classes of shares: Class A, Class B, Class C, Class R, Class Y and Class Z shares. Each share class has its own expense structure and sales charges, as applicable. Class Y shares commenced operations effective July 15, 2009. Effective June 22, 2009, the Fund no longer accepts investments from new or existing investors in the Fund's Class B shares, except in connection with the reinvestment of any dividend and/or capital gain distributions in Class B shares of the Fund and exchanges by existing Class B shareholders of the other Columbia Funds.
Class A shares are subject to a maximum front-end sales charge of 5.75% based on the amount of initial investment. Class A shares purchased without an initial sales charge in accounts aggregating $1 million to $50 million at the time of purchase are subject to a 1.00% contingent deferred sales charge ("CDSC") if the shares are sold within one year after purchase. Class B shares are subject to a maximum CDSC of 5.00% based upon the holding period after purchase. Class B shares will convert to Class A shares eight years after purchase. Class C shares are subject to a 1.00% CDSC on shares sold within one year after purchase. Class R, Class Y and Class Z shares are offered continuously at net asset value. There are certain restrictions on the purchase of Class R, Class Y and Class Z shares, as described in the Fund's prospectuses.
Note 2. Significant Accounting Policies
The preparation of financial statements in accordance with accounting principles generally accepted in the United States of America ("GAAP") requires management to make certain estimates and assumptions that affect the reported amounts of assets and liabilities, the disclosure of contingent assets and liabilities at the date of the financial statements and the reported amounts of revenue and expenses during the reporting period. Actual results could differ from those estimates.
The following is a summary of significant accounting policies consistently followed by the Fund in the preparation of its financial statements.
Security Valuation
Equity securities are valued at the last sale price on the principal exchange on which they trade, except for securities traded on the NASDAQ, which are valued at the NASDAQ official close price. Unlisted securities or listed securities for which there were no sales during the day are valued at the closing bid price on such exchanges or over-the-counter markets.
Short-term investments maturing in 60 days or less are valued at amortized cost, which approximates market value.
Investments for which market quotations are not readily available, or that have quotations which management believes are not reliable, are valued at fair value as determined in good faith under consistently applied procedures established by and under the general supervision of the Board of Trustees. If a security is valued at fair value, such value is likely to be different from the last quoted market price for the security. The determination of fair value often requires significant judgment. To determine fair value, management may use assumptions including but not limited to future cash flows and estimated risk premiums. Multiple inputs from various sources may be used to determine value.
GAAP establishes a hierarchy that prioritizes the inputs to valuation techniques used to measure fair value giving the highest priority to unadjusted quoted prices in active markets for identical securities (level 1 measurements) and the lowest priority to unobservable inputs (level 3 measurements) when market prices are not readily available or reliable. The three levels of the fair value hierarchy are described below:
• Level 1 – quoted prices in active markets for identical securities
• Level 2 – prices determined using other significant observable inputs (including quoted prices for similar
23
Columbia Large Cap Value Fund, February 28, 2010
securities, interest rates, prepayment speeds, credit risk and others)
• Level 3 – prices determined using significant unobservable inputs. In situations where quoted prices or observable inputs are unavailable or less reliable, unobservable inputs may be used. Unobservable inputs may include management's own assumptions about the factors market participants would use in pricing an investment.
The inputs or methodology used for valuing securities are not necessarily an indication of the risk associated with investing in those securities.
Security Transactions
Security transactions are accounted for on the trade date. Cost is determined and gains (losses) are based upon the specific identification method for both financial statement and federal income tax purposes.
Repurchase Agreements
The Fund may engage in repurchase agreement transactions with institutions that Columbia Management Advisors, LLC ("Columbia"), the Fund's investment advisor, has determined are creditworthy. The Fund, through its custodian, receives delivery of the underlying securities collateralizing a repurchase agreement. Columbia is responsible for determining that the collateral is at least equal, at all times, to the value of the repurchase obligation including interest. A repurchase agreement transaction involves certain risks in the event of default or insolvency of the counterparty. These risks include possible delays in or restrictions on the Fund's ability to dispose of the underlying securities and a possible decline in the value of the underlying securities during the period while the Fund seeks to assert their rights.
Income Recognition
Interest income is recorded on the accrual basis.
Corporate actions and dividend income are recorded on the ex-date.
Distributions received from real estate investment trusts (REITs) in excess of their income are recorded as a reduction of the cost of the related investments. If the Fund no longer owns the applicable securities, any distributions received in excess of income are recorded as realized gains.
Expenses
General expenses of the Trust are allocated to the Funds and other series of the Trust based upon relative net assets or other expense allocation methodologies determined by the nature of the expense. Expenses directly attributable to a specific class of shares are charged to that share class. Expenses directly attributable to a Fund are charged to such Fund.
Determination of Class Net Asset Value
All income, expenses (other than class-specific expenses, as shown on the Statement of Operations) and realized and unrealized gains (losses) are allocated to each class of the Fund on a daily basis for purposes of determining the net asset value of each class. Income and expenses are allocated to each class based on the settled shares method, while realized and unrealized gains (losses) are allocated based on the relative net assets of each class.
Federal Income Tax Status
The Fund intends to qualify each year as a "regulated investment company" under Subchapter M of the Internal Revenue Code, as amended, and will distribute substantially all of its taxable income, if any, for its tax year, and as such will not be subject to federal income taxes. In addition, the Fund intends to distribute in each calendar year substantially all of its net investment income, capital gains and certain other amounts, if any, such that the Fund should not be subject to federal excise tax. Therefore, no provision is made for federal income or excise taxes.
Distributions to Shareholders
Distributions from net investment income are declared and paid quarterly. Net realized capital gains, if any, are distributed at least annually. Income distributions and capital gain distributions are determined in accordance with federal income tax regulations which may differ from GAAP.
Indemnification
In the normal course of business, the Fund enters into contracts that contain a variety of representations and warranties and which provide general indemnities. The Fund's maximum exposure under these arrangements is unknown because this would involve future claims against the Fund. Also, under the Trust's organizational documents and by
24
Columbia Large Cap Value Fund, February 28, 2010
contract, the Trustees and officers of the Trust are indemnified against certain liabilities that may arise out of actions relating to their duties to the Trust. However, based on experience, the Fund expects the risk of loss due to these representations, warranties and indemnities to be minimal.
Note 3. Federal Tax Information
The timing and character of income and capital gain distributions are determined in accordance with income tax regulations, which may differ from GAAP. Reclassifications are made to the Fund's capital accounts for permanent tax differences to reflect income and gains available for distribution (or available capital loss carryforwards) under income tax regulations.
For the year ended February 28, 2010, permanent book and tax basis differences resulting primarily from differing treatments for proceeds received from litigation settlements were identified and reclassified among the components of the Fund's net assets as follows:
Undistributed
Net Investment
Income | | Accumulated
Net Realized
Loss | | Paid-In Capital | |
| $ | 1,763 | | | $ | 1 | | | $ | (1,764 | ) | |
Net investment income and net realized gains (losses), as disclosed on the Statement of Operations, and net assets were not affected by this reclassification.
The tax character of distributions paid during the years ended February 28, 2010 and February 28, 2009 was as follows:
| | | February 28, | |
| Distributions paid from: | | 2010 | | 2009 | |
| Ordinary Income* | | $ | 26,208,238 | | | $ | 53,557,080 | | |
| Long-Term Capital Gains | | | — | | | | — | | |
* For tax purposes short-term capital gain distributions, if any, are considered ordinary income distributions.
As of February 28, 2010, the components of distributable earnings on a tax basis were as follows:
Undistributed
Ordinary
Income | | Undistributed
Long-Term
Capital Gains | | Net Unrealized
Appreciation* | |
| $ | 1,360,279 | | | $ | — | | | $ | 348,650,271 | | |
* The differences between book-basis and tax-basis net unrealized appreciation are primarily due to deferral of losses from wash sales.
Unrealized appreciation and depreciation at February 28, 2010, based on cost of investments for federal income tax purposes were:
| Unrealized appreciation | | $ | 411,085,405 | | |
| Unrealized depreciation | | | (62,435,134 | ) | |
| Net unrealized appreciation | | $ | 348,650,271 | | |
The following capital loss carryforwards, determined as of February 28, 2010, may be available to reduce taxable income arising from future net realized gains on investments, if any, to the extent permitted by the Internal Revenue Code:
| Year of Expiration | | Capital Loss
Carryforwards | |
| 2011 | | $ | 4,189,476 | | |
| 2017 | | | 383,028,117 | | |
| 2018 | | | 473,592,838 | | |
| | | $ | 860,810,431 | | |
Management is required to determine whether a tax position of the Fund is more likely than not to be sustained upon examination by the applicable taxing authority, including resolution of any related appeals or litigation processes, based on the technical merits of the position. The tax benefit to be recognized by the Fund is measured as the largest amount of benefit that is greater than fifty percent likely of being realized upon ultimate settlement. Management is not aware of any tax positions for which it is reasonably possible that the total amounts of unrecognized tax benefits will significantly change in the next twelve months. However, management's
25
Columbia Large Cap Value Fund, February 28, 2010
conclusions may be subject to review and adjustment at a later date based on factors including, but not limited to, new tax laws, regulations, and administrative interpretations (including relevant court decisions). The Fund's federal tax returns for the prior three fiscal years remain subject to examination by the Internal Revenue Service.
Note 4. Fees and Compensation Paid to Affiliates
Investment Advisory Fee
Columbia, an indirect, wholly owned subsidiary of Bank of America Corporation ("BOA"), provides investment advisory services to the Fund. In rendering investment advisory services to the Fund, Columbia may use the portfolio management and research resources of Columbia Management Pte. Ltd, an affiliate of Columbia. Columbia receives a monthly investment advisory fee based on the Fund's average daily net assets at the following annual rates:
| Average Daily Net Assets | | Annual Fee Rate | |
| First $500 million | | | 0.60 | % | |
| $500 million to $1 billion | | | 0.55 | % | |
| $1 billion to $6 billion | | | 0.43 | % | |
| Over $6 billion | | | 0.41 | % | |
For the year ended February 28, 2010, the Fund's effective investment advisory fee rate was 0.49% of the Fund's average daily net assets.
Bank of America, N.A., an indirect parent company of Columbia, entered into an agreement dated September 29, 2009, to sell a portion of the asset management business of Columbia Management Group, LLC to Ameriprise Financial, Inc. ("Ameriprise Financial"). The transaction ("Transaction") includes the sale of the part of the asset management business that advises long-term mutual funds, including the Fund. The Transaction is subject to certain approvals and other conditions to closing, and is currently expected to close on or about May 1, 2010 (the "Closing"). In connection with the Closing, certain changes will occur, including a change in the entities serving as the investment advisor, administrator, distributor and transfer agent of the Fund. RiverSource Investments, LLC (the "New Advisor"), a subsidiary of Ameriprise Financial, will become the investment advisor of the Fund upon the Closing. The New Advisor will serve as inves tment advisor under a new investment management services agreement effective upon the closing. The New Advisor expects to change its name to Columbia Management Investment Advisers, LLC upon or shortly after the Closing. Effective upon the Closing, as the context requires, references to Columbia shall be deemed to refer to the New Advisor.
Administration Fee
Columbia provides administrative and other services to the Fund for a monthly administration fee at the annual rate of 0.17% of the Fund's average daily net assets, less the fees payable by the Fund as described under the Pricing and Bookkeeping Fees note below.
Prior to June 30, 2009, Columbia contractually agreed to waive a portion of its administration fee for the Fund, at an annual rate of 0.04% of the Fund's average daily net assets up to $500 million.
The New Advisor will become the administrator of the Fund under a new administrative services agreement effective upon the Closing.
Pricing and Bookkeeping Fees
The Fund has entered into a Financial Reporting Services Agreement (the "Financial Reporting Services Agreement") with State Street Bank and Trust Company ("State Street") and Columbia pursuant to which State Street provides financial reporting services to the Fund. The Fund has also entered into an Accounting Services Agreement (collectively with the Financial Reporting Services Agreement, the "State Street Agreements") with State Street and Columbia pursuant to which State Street provides accounting services to the Fund. Under the State Street Agreements, the Fund pays State Street an annual fee of $38,000 paid monthly plus an additional monthly fee based on an annualized percentage rate of average daily net assets of the Fund for the month. The aggregate fee will not exceed $140,000 per year (exclusive of out-of-pocket expenses and charges). The Fund also reimburses State Street for certain out-of-pocket expenses and charges.
26
Columbia Large Cap Value Fund, February 28, 2010
Among other updates to the State Street Agreements, Columbia will assign and delegate its rights and obligations thereunder to the New Advisor upon the Closing.
The Fund has entered into a Pricing and Bookkeeping Oversight and Services Agreement (the "Services Agreement") with Columbia. Under the Services Agreement, Columbia provides services related to Fund expenses and the requirements of the Sarbanes-Oxley Act of 2002, and provides oversight of the accounting and financial reporting services provided by State Street. Under the Services Agreement, the Fund reimburses Columbia for out-of-pocket expenses and charges, including fees payable to third parties, such as for pricing the Fund's portfolio securities, incurred by Columbia in the performance of services under the Services Agreement.
The Services Agreement will be terminated upon the Closing, and the services provided thereunder will be covered under the administrative services agreement with the New Advisor.
Transfer Agent Fee
Columbia Management Services, Inc. (the "Transfer Agent"), an affiliate of Columbia and an indirect, wholly owned subsidiary of BOA, provides shareholder services to the Fund and has contracted with Boston Financial Data Services ("BFDS") to serve as sub-transfer agent.
The Fund pays a monthly fee to the Transfer Agent for its services. All share classes, with the exception of Class Y shares (the "Other Share Classes") pay a monthly service fee (the "aggregate fee") based on the following:
(i) Effective January 1, 2010, an annual rate of $22.36 is applied to the aggregate number of accounts for the Other Share Classes. Prior to January 1, 2010, the annual rate was $17.34 per account.
(ii) An allocated portion of fees for wire, telephone and redemption orders, Individual Retirement Account ("IRA") trustee agent fees and account transcript fees due to the Transfer Agent from shareholders of the Fund and credits (net of bank charges) earned with respect to balances in accounts the Transfer Agent maintains in connection with its services to the Fund. The Transfer Agent also receives reimbursement for certain out-of-pocket expenses.
The aggregate fee is allocated to the Other Share Classes based on the relative average daily net assets of each share class.
Class Y shares of the Fund pay a monthly service fee based on the following:
(i) Effective January 1, 2010, an annual rate of $22.36 is applied to the aggregate number of accounts for Class Y shares. Prior to January 1, 2010, the annual rate was $17.34 per account.
(ii) An allocated portion of fees for wire, telephone and redemption orders, IRA trustee agent fees and account transcript fees due to the Transfer Agent from shareholders of the Fund and credits (net of bank charges) earned with respect to balances in accounts the Transfer Agent maintains in connection with its services to the Fund. The Transfer Agent also receives reimbursement for certain out-of-pocket expenses.
The Transfer Agent is also entitled to receive reimbursement of certain sub-transfer agent fees paid by the Transfer Agent (exclusive of BFDS fees), calculated based on the combined assets held in the Other Share Classes in omnibus accounts and intended to recover the cost of payments to other parties (including affiliates of BOA) for services to those accounts. Such fees are allocated to the Other Share Classes based on the relative average daily net assets of each share class. The Transfer Agent pays the fees of BFDS for services as sub-transfer agent and is not entitled to reimbursement for such fees from the Fund.
Prior to May 1, 2009, the Transfer Agent voluntarily waived a portion of its fees for accounts other than omnibus accounts, so that transfer agent fees (exclusive of out-of-pocket expenses and sub-transfer agent fees) did not exceed 0.02% annually of the Fund's average daily net assets.
An annual minimum account balance fee of $20 may apply to certain accounts with a value below the Fund's initial minimum investment requirements to reduce the impact of small accounts on transfer agent fees. These minimum account balance fees are recorded as part of expense reductions on the Statement of Operations. For the year ended February 28, 2010, no minimum account balance fees were charged by the Fund.
27
Columbia Large Cap Value Fund, February 28, 2010
RiverSource Service Corporation (the "New Transfer Agent"), a subsidiary of Ameriprise Financial, will become the transfer agent of the Fund upon the Closing. The New Transfer Agent expects to change its name to Columbia Management Investment Services Corp. upon or shortly after the Closing.
Underwriting Discounts, Service and Distribution Fees
Columbia Management Distributors, Inc. (the "Distributor"), an affiliate of Columbia and an indirect, wholly owned subsidiary of BOA, is the principal underwriter of the Fund's shares. For the year ended February 28, 2010, the Distributor has retained net underwriting discounts of $24,126 on sales of the Fund's Class A shares and received net CDSC fees of $955, $57,696 and $1,728 on Class A, Class B and Class C share redemptions, respectively.
RiverSource Fund Distributors, Inc. (the "New Distributor"), a subsidiary of Ameriprise Financial, will become the distributor of the Fund upon the Closing. The New Distributor expects to change its name to Columbia Management Investment Distributors, Inc. upon or shortly after the Closing.
The Trust has adopted shareholder servicing plans and distribution plans for the Class B and Class C shares of the Fund and a combined distribution and shareholder servicing plan for the Class A shares of the Fund. The Trust has also adopted a distribution plan for the Class R shares of the Fund. The shareholder servicing plans permit the Fund to compensate or reimburse servicing agents for the shareholder services they have provided. The distribution plans, adopted pursuant to Rule 12b-1 under the 1940 Act, permit the Fund to compensate or reimburse the Distributor and/or selling agents for activities or expenses primarily intended to result in the sale of the classes' shares. Payments are made at an annual rate and paid monthly, as a percentage of average daily net assets, set from time to time by the Board of Trustees, and are charged as expenses of the Fund directly to the applicable share class. A substantial portion of the expenses incurred pursuant to these plans is paid to affiliates of BOA and the Distributor.
The annual rates in effect and plan limits, as a percentage of average daily net assets are as follows:
| | | Current
Rate | | Plan Limit | |
Class A Combined Distribution
and Shareholder Servicing Plan | | | 0.25 | % | | | 0.25 | % | |
Class B and Class C
Shareholder Servicing Plans | | | 0.25 | % | | | 0.25 | % | |
Class B and Class C
Distribution Plans | | | 0.75 | % | | | 0.75 | % | |
| Class R Distribution Plan | | | 0.50 | % | | | 0.50 | % | |
Expense Limits and Fee Waivers
Effective May 1, 2009, Columbia has voluntarily agreed to reimburse a portion of the Fund's expenses so that the Fund's ordinary operating expenses (excluding any distribution and service fees, brokerage commissions, interest, taxes and extraordinary expenses, but including custodian charges relating to overdrafts, if any) after giving effect to any balance credits from the Fund's custodian, do not exceed the annual rate of 1.00% of the Fund's average daily net assets. Columbia, in its discretion, may revise or discontinue this arrangement at any time.
Fees Paid to Officers and Trustees
All officers of the Fund are employees of Columbia or its affiliates and, with the exception of the Fund's Chief Compliance Officer, receive no compensation from the Fund. The Board of Trustees has appointed a Chief Compliance Officer to the Fund in accordance with federal securities regulations. The Fund, along with other affiliated funds, pays its pro-rata share of the expenses associated with the Chief Compliance Officer. The Fund's expenses for the Chief Compliance Officer will not exceed $15,000 per year.
Trustees are compensated for their services to the Fund, as set forth on the Statement of Operations. The Trust's eligible Trustees may participate in a non-qualified deferred compensation plan which may be terminated at any time. Any payments to plan participants are paid solely out of the Fund's assets. Income earned on the plan participant's deferral account is based on the rate of return of the eligible mutual funds selected by the participant or, if no funds are selected,
28
Columbia Large Cap Value Fund, February 28, 2010
on the rate of return of Columbia Treasury Reserves, another portfolio of the Trust. The expense for the deferred compensation plan, which includes trustees' fees deferred during the current period as well as any gains or losses on the trustees' deferred compensation balances as a result of market fluctuations, is included in "Trustees' fees" on the Statement of Operations. The liability for the deferred compensation plan is included in "Trustees' fees" on the Statement of Assets and Liabilities.
Other Related Party Transactions
In connection with the purchase and sale of its securities during the year, the Fund used one or more brokers that are affiliates of BOA. Total brokerage commissions paid to affiliated brokers for the year ended February 28, 2010 was $6,291.
Note 5. Custody Credits
The Fund has an agreement with its custodian bank under which custody fees may be reduced by balance credits. These credits are recorded as part of expense reductions on the Statement of Operations. The Fund could have invested a portion of the assets utilized in connection with the expense offset arrangement in an income-producing asset if it had not entered into such an agreement. For the year ended February 28, 2010, these custody credits reduced total expenses by $8 for the Fund.
Note 6. Portfolio Information
For the year ended February 28, 2010, the cost of purchases and proceeds from sales of securities, excluding short-term obligations, for the Fund were $1,324,882,565 and $1,527,366,150, respectively.
Note 7. Regulatory Settlements
During the year ended February 28, 2010, the Fund received payments totaling $1,763 relating to certain regulatory settlements with third parties that the Fund had participated in during the year. The payments have been included in "Increase from regulatory settlements" on the Statement of Changes in Net Assets.
Note 8. Line of Credit
The Fund and other affiliated funds participate in a $280,000,000 committed, unsecured revolving line of credit provided by State Street. The maximum amount that may be borrowed by any fund is limited to the lesser of $200,000,000 and the Fund's borrowing limit set forth in the Fund's registration statement. Borrowings are available for short-term liquidity or temporary or emergency purposes.
Effective October 15, 2009, interest is charged to each participating fund based on the fund's borrowings at a rate per annum equal to the greater of the Federal Funds Rate plus 1.25% or the overnight LIBOR Rate plus 1.25%. In addition, a commitment fee of 0.15% per annum is accrued and apportioned among the participating funds pro rata based on their relative net assets.
Prior to October 15, 2009, interest was charged to each participating fund based on the fund's borrowings at a rate per annum equal to the greater of the Federal Funds Rate plus 0.50% or the overnight LIBOR Rate plus 0.50%. In addition, an annual operations agency fee of $20,000, an amendment fee of 0.02% and a commitment fee of 0.12% per annum were accrued and apportioned among the participating funds pro rata based on their relative net assets.
For the year ended February 28, 2010, the Fund did not borrow under these arrangements.
Note 9. Securities Lending
The Fund may lend its securities to certain approved brokers, dealers and other financial institutions. Each loan is collateralized by cash, in an amount at least equal to the market value of the securities loaned plus accrued income from the investment of collateral. The market value of the loaned securities is determined at the close of business of the Fund and any additional required collateral is delivered to the Fund on the next business day. The collateral received is invested and the income generated by the investment of the collateral, net of any fees remitted to State Street as the lending agent and borrower rebates, is paid to the Fund. Generally, in the event of borrower default, the Fund has the right to use the collateral to offset any losses incurred. In the event the Fund is delayed or prevented from exercising its right to dispose of the collateral, there may be a potential loss
29
Columbia Large Cap Value Fund, February 28, 2010
to the Fund. The Fund bears the risk of loss with respect to the investment of collateral.
For the year ended February 28, 2010, the Fund did not participate in the securities lending program.
Note 10. Shares of Beneficial Interest
As of February 28, 2010, 35.2% of the Fund's shares outstanding were beneficially owned by three participant accounts over which BOA and/or any of its affiliates had either sole or joint investment discretion.
As of February 28, 2010, no other shareholders owned more than 5% of the outstanding shares of the Fund.
Subscription and redemption activity of these accounts may have a significant effect on the operations of the Fund.
Note 11. Significant Risks and Contingencies
Legal Proceedings
Columbia Management Advisors, LLC and Columbia Management Distributors, Inc. (collectively, the "Columbia Group") are subject to a settlement agreement with the New York Attorney General ("NYAG") (the "NYAG Settlement") and a settlement order with the Securities and Exchange Commission ("SEC") (the "SEC Order") on matters relating to mutual fund trading, each dated February 9, 2005. Under the terms of the SEC Order, the Columbia Group (or predecessor or affiliated entities) agreed, among other things, to: pay disgorgement and civil money penalties collectively totaling $375 million; cease and desist from violations of the antifraud provisions and certain other provisions of the federal securities laws; maintain certain compliance and ethics oversight structures; and retain an independent consultant to review the Columbia Group's applicable supervisory, compliance, control and other policies and procedures. The NYAG Settlement, a mong other things, requires Columbia Management Advisors, LLC and its affiliates to make certain disclosures to investors relating to expenses. In connection with the Columbia Group providing services to the Columbia Funds, the Columbia Funds have voluntarily undertaken to implement certain governance measures designed to maintain the independence of their boards of trustees and certain special consulting and compliance measures.
Pursuant to the SEC Order and related procedures, the $375 million in settlement amounts described above, of which approximately $90 million has been earmarked for certain Columbia Funds and their shareholders, is being distributed in accordance with a distribution plan developed by an independent distribution consultant and approved by the SEC on December 27, 2007. Distributions under the distribution plan began in mid-June 2008 and the distribution earmarked for the Columbia Funds and their shareholders has been substantially completed.
Civil Litigation
In connection with the events that resulted in the NYAG Settlement and SEC Order, various parties filed suits against Bank of America Corporation and certain of its affiliates, including Banc of America Capital Management, LLC ("BACAP," now known as Columbia Management Advisors, LLC) and BACAP Distributors, LLC (now known as Columbia Management Distributors, Inc.) (collectively "BAC"), Nations Funds Trust (now known as Columbia Funds Series Trust) and its Board of Trustees. On February 20, 2004, the Judicial Panel on Multidistrict Litigation transferred these cases and cases against other mutual fund companies based on similar allegations to the United States District Court in Maryland for consolidated or coordinated pretrial proceedings (the "MDL"). Subsequently, additional related cases were transferred to the MDL. On September 29, 2004, the plaintiffs in the MDL filed amended and consolidated complaints. One of these amended complaints is a putative class action that includes claims under the federal securities laws and state common law, and that names Nations Funds Trust, the Trustees, BAC and others as defendants. Another of the amended complaints is a derivative action purportedly on behalf of the Nations Funds Trust against BAC and others that asserts claims under federal securities laws and state common law. Nations Funds Trust is a nominal defendant in this action.
On February 25, 2005, BAC and other defendants filed motions to dismiss the claims in the pending cases. On December 15, 2005, BAC and others entered into a Stipulation of Settlement of the direct and derivative claims brought on behalf of the Nations Funds shareholders. The settlement is subject to court approval. If the settlement is approved, BAC would pay settlement administration costs and fees to plaintiffs' counsel as approved by the court. The stipulation has not yet been presented to the court for approval.
30
Columbia Large Cap Value Fund, February 28, 2010
Note 12. Subsequent Events
In connection with the preparation of the financial statements of the Fund as of and for the fiscal year ended February 28, 2010, events and transactions through the date the financial statements were issued have been evaluated by the Fund's management for possible adjustment and/or disclosure. No subsequent events or transactions had occurred that would require adjustment of the financial statements as presented. On March 3, 2010, the Fund's shareholders approved, among other matters, a proposed investment management services agreement with the New Advisor, the effectiveness of which is conditioned on the Closing.
31
Report of Independent Registered Public Accounting Firm
To the Trustees of Columbia Funds Series Trust and the Shareholders of Columbia Large Cap Value Fund
In our opinion, the accompanying statement of assets and liabilities, including the investment portfolio, and the related statements of operations and of changes in net assets and the financial highlights present fairly, in all material respects, the financial position of Columbia Large Cap Value Fund (the "Fund") (a series of Columbia Funds Series Trust) at February 28, 2010, the results of its operations, the changes in its net assets and the financial highlights for each of the periods indicated, in conformity with accounting principles generally accepted in the United States of America. These financial statements and financial highlights (hereafter referred to as "financial statements") are the responsibility of the Fund's management. Our responsibility is to express an opinion on these financial statements based on our audits. We conducted our audits of these financial statements in accordance with the standards of the Publ ic Company Accounting Oversight Board (United States). Those standards require that we plan and perform the audit to obtain reasonable assurance about whether the financial statements are free of material misstatement. An audit includes examining, on a test basis, evidence supporting the amounts and disclosures in the financial statements, assessing the accounting principles used and significant estimates made by management, and evaluating the overall financial statement presentation. We believe that our audits, which included confirmation of securities at February 28, 2010 by correspondence with the custodian and brokers, provide a reasonable basis for our opinion.
PricewaterhouseCoopers LLP
Boston, Massachusetts
April 21, 2010
32
Federal Income Tax Information (Unaudited)
For non-corporate shareholders, 100.00% or the maximum amount allowable under the Jobs and Growth Tax Relief Reconciliation Act of 2003, of the ordinary income distributed by the Fund for the fiscal year ended February 28, 2010 may represent qualified dividend income.
100.00% of the ordinary income distributed by the Fund for the fiscal year ended February 28, 2010, qualifies for the corporate dividends received deduction.
The Fund will notify shareholders in January 2011 of amounts for use in preparing 2010 income tax returns.
33
Fund Governance
The Trustees serve terms of indefinite duration. The names, addresses and ages of the Trustees and officers of the Funds of Columbia Funds Series Trust, the year each was first elected or appointed to office, their principal business occupations during at least the last five years, the number of Funds overseen by each Trustee and other directorships they hold are shown below. Each officer listed below serves as an officer of each Fund in the Columbia Funds Complex.
Independent Trustees
Name, Address and Age,
Position with Funds, Year First
Elected or Appointed to Office | | Principal Occupation(s) During Past Five Years, Number of Funds in the Columbia
Funds Complex Overseen by Trustee, Other Directorships Held
| |
| Edward J. Boudreau (Born 1944) | |
|
c/o Columbia Management
Advisors, LLC
One Financial Center
Boston, MA 02111
Trustee (since 2005) | | Managing Director—E.J. Boudreau & Associates (consulting), from 2000 through current; oversees 64; no other directorships held. | |
|
| William P. Carmichael (Born 1943) | |
|
c/o Columbia Management
Advisors, LLC
One Financial Center
Boston, MA 02111
Trustee (since 1999) | | Retired. Oversees 64; Director—Cobra Electronics Corporation (electronic equipment manufacturer); Director—The Finish Line (sportswear). | |
|
| William A. Hawkins (Born 1942) | |
|
c/o Columbia Management Advisors, LLC
One Financial Center
Boston, MA 02111
Trustee (since 2005) | | President and Chief Executive Officer—California General Bank, N.A., from January 2008 through current; oversees 64; no other directorships held. | |
|
| R. Glenn Hilliard (Born 1943) | |
|
c/o Columbia Management Advisors, LLC
One Financial Center
Boston, MA 02111
Trustee (since 2005) | | Chairman and Chief Executive Officer—Hilliard Group LLC (investing and consulting), from April 2003 through current; Non-Executive Director & Chairman—Conseco, Inc. (insurance), September 2003 through current; Executive Chairman—Conseco, Inc. (insurance), August 2004 through September 2005; oversees 64; Director—Conseco, Inc. (insurance). | |
|
| John J. Nagorniak (Born 1944) | |
|
c/o Columbia Management
Advisors, LLC One
Financial Center
Boston, MA 02111
Trustee (since 2008)` | | Retired. President and Director—Foxstone Financial, Inc. (consulting), 2000 through December 2007; Director—Mellon Financial Corporation affiliates (investing), 2000 through 2007; Chairman—Franklin Portfolio Associates (investing—Mellon affiliate), 1982 through 2007; oversees 64; Director—MIT Investment Company; Trustee—MIT 401k Plan; Trustee and Chairman—Research Foundation of CFA Institute. | |
|
34
Fund Governance (continued)
Independent Trustees (continued)
Name, Address and Age,
Position with Funds, Year First
Elected or Appointed to Office | | Principal Occupation(s) During Past Five Years, Number of Funds in the Columbia
Funds Complex Overseen by Trustee, Other Directorships Held
| |
| Minor M. Shaw (Born 1947) | |
|
c/o Columbia Management Advisors, LLC
One Financial Center
Boston, MA 02111
Trustee (since 2003) | | President—Micco Corporation and Mickel Investment Group; oversees 64; Board Member—Piedmont Natural Gas. | |
|
Interested Trustee
Name, Address and Age,
Position with Funds, Year First
Elected or Appointed to Office | | Principal Occupation(s) During Past Five Years, Number of Funds in the Columbia
Funds Complex Overseen by Trustee, Other Directorships Held
| |
| Anthony M. Santomero1 (Born 1946) | |
|
c/o Columbia Management Advisors, LLC
One Financial Center
Boston, MA 02111
Trustee (since 2008) | | Richard K. Mellon Professor Emeritus of Finance, The Wharton School, University of Pennsylvania, from 1972 through current; Senior Advisor—McKinsey & Company (consulting), July 2006 through January 2008; President and Chief Executive Officer—Federal Reserve Bank of Philadelphia, July 2000 through April 2006; oversees 64; Director—Renaissance Reinsurance Ltd; Director—Penn Mutual Life Insurance Company; Director—Citigroup. | |
|
1 The Columbia Funds currently treat Mr. Santomero as an "interested person" (as defined in the 1940 Act) of the Funds because he serves as a Director of Citigroup, Inc. and Citibank, N.A. Citigroup, Inc., through its subsidiaries and affiliates, including Citibank, N.A., may engage from time-to-time in brokerage execution, principal transactions and/or lending relationships with the Columbia Funds or other funds or accounts advised/managed by the Advisor and/or any sub-advisor.
The Statement of Additional Information includes additional information about the Trustees of the Funds and is available, without charge, upon request by calling 800-345-6611.
35
Fund Governance (continued)
Officers
Name, Address and Year of Birth,
Position with Columbia Funds,
Year First Elected or
Appointed to Office | | Principal Occupation(s) During Past Five Years
| |
| J. Kevin Connaughton (Born 1964) | |
|
One Financial Center
Boston, MA 02111
President (since 2009) | | Managing Director of Columbia Management Advisors, LLC since December 2004; Senior Vice President and Chief Financial Officer—Columbia Funds, from June 2008 to January 2009; Treasurer—Columbia Funds, from October 2003 to May 2008; Treasurer—the Liberty Funds, Stein Roe Funds and Liberty All-Star Funds, December 2000—December 2006; Senior Vice President—Columbia Management Advisors, LLC, from April 2003 to December 2004; President—Columbia Funds, Liberty Funds and Stein Roe Funds, February 2004 to October 2004; Treasurer—Galaxy Funds, September 2002 to December 2005; Treasurer, December 2002 to December 2004, and President, February 2004 to December 2004—Columbia Management Multi-Strategy Hedge Fund, LLC; and a senior officer of various other Bank of America-affiliated entities, including other registered and unregistered funds | |
|
| James R. Bordewick, Jr. (Born 1959) | |
|
One Financial Center
Boston, MA 02111
Senior Vice President, Secretary and Chief Legal Officer (since 2006) | | Associate General Counsel, Bank of America since April 2005; Senior Vice President and Associate General Counsel, MFS Investment Management (investment management) prior to April 2005. | |
|
| Linda J. Wondrack (Born 1964) | |
|
One Financial Center
Boston, MA 02111
Senior Vice President and
Chief Compliance Officer (since 2007) | | Director (Columbia Management Group LLC and Investment Product Group Compliance), Bank of America since June 2005; Director of Corporate Compliance and Conflicts Officer, MFS Investment Management (investment management), August 2004 to May 2005; Managing Director, Deutsche Asset Management (investment management) prior to August 2004. | |
|
| Michael G. Clarke (Born 1969) | |
|
One Financial Center
Boston, MA 02111
Senior Vice President and
Chief Financial Officer (since 2009) | | Director of Fund Administration of the Advisor since January 2006; Managing Director of the Advisor September 2004 to December 2005; Vice President Fund Administration June 2002 to September 2004. | |
|
| Jeffrey R. Coleman (Born 1969) | |
|
One Financial Center
Boston, MA 02111
Treasurer (since 2008) | | Director of Fund Administration of the Advisor since January 2006; Fund Controller of the Advisor from October 2004 to January 2006; Vice President of CDC IXIS Asset Management Services, Inc. (investment management) from August 2000 to September 2004. | |
|
| Joseph F. DiMaria (Born 1968) | |
|
One Financial Center
Boston, MA 02111
Chief Accounting Officer (since 2008) | | Director of Fund Administration of the Advisor since January 2006; Head of Tax/Compliance and Assistant Treasurer of the Advisor from November 2004 to December 2005; Director of Trustee Administration (Sarbanes-Oxley) of the Advisor from May 2003 to October 2004. | |
|
36
Fund Governance (continued)
Officers (continued)
Name, Address and Year of Birth,
Position with Columbia Funds,
Year First Elected or
Appointed to Office | | Principal Occupation(s) During Past Five Years
| |
| Julian Quero (Born 1967) | |
|
One Financial Center
Boston, MA 02111
Deputy Treasurer (since 2008) | | Senior Tax Manager of the Advisor since August 2006; Senior Compliance Manager of the Advisor from April 2002 to August 2006. | |
|
| Barry S. Vallan (Born 1969) | |
|
One Financial Center
Boston, MA 02111
Controller (since 2006) | | Vice President—Fund Treasury of the Advisor since October 2004; Vice President—Trustee Reporting of the Advisor from April 2002 to October 2004. | |
|
| Stephen T. Welsh (Born 1957) | |
|
One Financial Center
Boston, MA 02111
Vice President (since 1996) | | President, Columbia Management Services, Inc. since July 2004; Senior Vice President and Controller, Columbia Management Services, Inc. prior to July 2004. | |
|
37
Board Consideration and Re-Approval of Current
Investment Advisory Agreement
Even though the following description of the Board's consideration of investment advisory and, as applicable, sub-advisory agreements covers multiple funds, for purposes of this shareholder report, the description is only relevant as to the Fund.
The Board of Trustees of Columbia Funds Series Trust (the "Board"), including a majority of the Trustees who have no direct or indirect interest in the investment advisory and sub-advisory agreements and are not "interested persons" of the Trust, as defined in the Investment Company Act of 1940 (the "1940 Act") (the "Independent Trustees"), are required annually to review and re-approve the existing investment advisory and sub-advisory agreements and approve any newly proposed terms therein. In this regard, the Board reviewed and re-approved, during the most recent six months covered by this report, (i) investment advisory agreements with Columbia Management Advisors, LLC ("CMA" or the "Adviser") for Columbia Convertible Securities Fund, Columbia Large Cap Value Fund, Columbia Mid Cap Value Fund, Columbia Small Cap Value Fund II, Columbia Marsico Growth Fund, Columbia Large Cap Core Fund, Columbia Marsico Focused Equities Fund, Columbia Marsico 21st Century Fund and Columbia Small Cap Growth Fund II; and (ii) investment sub-advisory agreements with Marsico Capital Management, LLC ("Marsico Capital" or the "Sub-Adviser") for Columbia Marsico Focused Equities Fund, Columbia Marsico 21st Century Fund and Columbia Marsico Growth Fund (the "Sub-Advised Funds"). The investment advisory agreements with CMA and the investment sub-advisory agreements with Marsico Capital are each referred to as an "Advisory Agreement" and collectively referred to as the "Advisory Agreements." The funds identified above are each referred to as a "Fund" and collectively referred to as the "Funds."
More specifically, at meetings held on November 5-6, 2009, the Board, including the Independent Trustees advised by their independent legal counsel, considered the factors and reached the conclusions described below relating to the selection of CMA and the Sub-Adviser and the re-approval of the Advisory Agreements. The Board also reviewed and considered a report prepared and provided by the Independent Fee Consultant (the "Fee Consultant") appointed by the Independent Trustees pursuant to an assurance of discontinuance entered into with the New York Attorney General ("NYAG") to settle a civil complaint filed by the NYAG relating to trading in mutual fund shares (the "NYAG Settlement"). The Fee Consultant's role was to manage the process by which management fees are negotiated so that they were negotiated in a manner that is at arms' length and reasonable. Th e Fee Consultant found that the fee negotiation process was, to the extent practicable, at arms' length and reasonable and consistent with the requirements of the NYAG Settlement. A summary of the Fee Consultant's report is available at http://www.columbiafunds.com.
In preparation for the November meetings, the Board met in August for review and discussion of the materials described below. The Investment Committee of the Board also met in June to discuss each Fund's performance with its respective portfolio manager(s). In addition to these meetings, the Investment Committee receives and discusses performance reports at its quarterly meetings. The Contracts Review Committee of the Board also provided support in managing and coordinating the process by which the Board reviewed the Advisory Agreements. The Board's review and conclusions are based on the comprehensive consideration of all information presented to it and are not the result of any single controlling factor. The Board evaluated all information available to it on a Fund-by-Fund basis, and its determinations were made separately in respect of each Fund.
Nature, Extent and Quality of Services. The Board received and considered various data and information regarding the nature, extent and quality of services provided to the Funds by CMA and the Sub-Adviser under the Advisory Agreements. The most recent investment adviser registration forms for CMA and the Sub-Adviser were made available to the Board, as were CMA's and the Sub-Adviser's responses to a detailed series of requests submitted by the Independent Trustees' independent legal counsel on behalf of such Trustees. The Board reviewed and analyzed those materials, which included, among other things, information about the background and experience of senior management and investment personnel of CMA and the Sub-Adviser.
In addition, the Board considered the investment and legal compliance programs of the Funds, CMA and the Sub-Adviser, including their compliance policies and procedures and reports of the Funds' Chief Compliance Officer.
The Board evaluated the ability of CMA and the Sub-Adviser, based on their resources, reputation and other attributes, to attract and retain qualified investment professionals, including research, advisory and supervisory personnel. In
38
this regard, the Board considered information regarding the nature of CMA's compensation structure applicable to portfolio managers and other key investment personnel.
Based on the above factors, together with those referenced below, the Board concluded that it was satisfied with the nature, extent and quality of the investment advisory services provided to each of the Funds by CMA and the Sub-Adviser.
The Board noted that Bank of America, N.A., the parent company of the Adviser, had entered into an agreement to sell a portion of the asset management business of the Adviser to Ameriprise Financial, Inc. (the "Transaction"). The Board noted that the Transaction was expected to close in the spring of 2010 and that its review of the Advisory Agreements was separate and distinct from any analysis regarding new advisory or sub-advisory arrangements that may result from the closing of the Transaction.
Investment Advisory and Sub-Advisory Fee Rates and Other Expenses. The Board reviewed and considered the proposed contractual investment advisory fee rates both separately and together with the administration fee rates payable by the Funds to CMA for investment advisory services (the "Contractual Management Rates"). The Board also reviewed and considered the proposed contractual investment sub-advisory fee rates (the "Sub-Advisory Agreement Rates") payable by CMA to the Sub-Adviser for investment sub-advisory services. In addition, the Board reviewed and considered the proposed fee waiver/cap arrangements applicable to the Contractual Management Rates and considered the Contractual Management Rates after taking the waivers/caps into account (the "Actual Management Rates"). The Board noted that, on a complex-wide basis, CMA had reduced annual managemen t fees by at least $32 million per year pursuant to the NYAG Settlement. The Board also noted reductions in net advisory rates and/or total expenses of certain funds across the fund complex. Additionally, the Board received and afforded specific attention to information comparing the Contractual Management Rates and Actual Management Rates with those of the other funds in their respective Peer Groups (as defined below).
The Board reviewed and considered statistical information regarding each Fund's total expense ratio and its various components, including contractual advisory fees, actual advisory fees, actual non-management fees, Rule 12b-1 and non-Rule 12b-1 service fees, fee waivers/caps and/or expense reimbursements. The Board also reviewed comparisons of these fees to the expense information for the group of Funds determined by Lipper Inc. ("Lipper") to be most similar to a given Fund (the "Peer Group") and to the performance of a broader universe of relevant funds as determined by Lipper (the "Universe"), which comparative data was provided by Lipper, an independent provider of investment company data. The Board was provided with a description of the methodology used by Lipper to select the mutual funds in each Fund's Peer Group and Universe and considered potential i mprecision resulting from the selection methodology. For certain Funds, Lipper determined that the composition of the Peer Group and/or Universe for expenses would differ from the composition for performance to provide a more accurate basis of comparison. The Board also considered Lipper data that ranked each Fund based on: (i) each Fund's one- and three-year performance compared to actual management fees; and (ii) each Fund's one- and three-year performance compared to total expenses.
The Board concluded that the factors noted above supported the Contractual Management Rates and the Actual Management Rates, and the approval of the Advisory Agreements for all of the Funds.
With regard to the Sub-Advised Funds, the Board also reviewed the Sub-Advisory Agreement Rates, including comparative fee information provided by the Adviser and the Adviser's recommendation that the Board re-approve the Advisory Agreements with Marsico Capital. The Board also considered a breakpoint fee schedule charged by Marsico Capital for the Sub-Advised Funds, as well as a corresponding waiver of Contractual Management Rates, both of which were implemented on January 1, 2008. The Board concluded that the Sub-Advisory Agreement Rates are fair and equitable, based on its consideration of the factors described above.
The Fund-by-Fund discussion set forth below in "Fund-Specific Considerations for Certain Review Funds" provides additional information regarding those Funds highlighted as meeting agreed-upon criteria for warranting further review. Such criteria included, among other things, information relating to Actual Management Rates, total expense ratios and/or performance information, relative to a Fund's Peer Group and/or Universe.
Fund Performance. The Board considered the performance results for each of the Funds over multiple measurement periods. It also considered these results in comparison to the
39
performance results of each Fund's Peer Group and Universe, as well as to each Fund's benchmark index. The Board also considered certain risk-adjusted performance data.
The Fund-by-Fund discussion set forth below in "Fund-Specific Considerations for Certain Review Funds" provides additional information regarding those Funds highlighted as meeting agreed-upon criteria for warranting further review. Such criteria included, among other things, information relating to Actual Management Rates, total expense ratios and/or performance information, relative to a Fund's Peer Group and/or Universe.
Profitability. The Board received and considered a detailed profitability analysis of CMA based on the Contractual Management Rates and the Actual Management Rates, as well as on other relationships between the Funds and other funds in the complex on the one hand and CMA affiliates on the other. The analysis included complex-wide and per-Fund information and a comparison of results using alternative allocation methodologies. The Board concluded that, in light of the costs of providing investment management and other services, the profits and other ancillary benefits that CMA and its affiliates received from providing these services were not unreasonable.
Economies of Scale. The Board received and considered information regarding whether there have been economies of scale with respect to the management of the Funds, whether the Funds have appropriately benefited from any economies of scale and whether there is potential for realization of any further economies of scale. Most particularly, CMA provided information showing that, as a percentage of fund assets, CMA's complex-wide revenues declined over a five-year period during which fund assets increased by 53% and the shareholder benefit over a four-year period has remained steady at approximately 33% of the Adviser's total profits. The Board concluded that any potential economies of scale are shared fairly with Fund shareholders, most particularly through breakpoints and fee waiver arrangements.
The Board acknowledged the inherent limitations of any analysis of an investment adviser's economies of scale, stemming largely from the Board's understanding that economies of scale are generally realized, if at all, by an investment adviser across a variety of products and services, not just with respect to a single fund.
Information About Services to Other Clients. The Board also received and considered information about the nature and extent of services and fee rates offered by CMA and the Sub-Adviser to their other clients, including separate accounts and institutional investors. In this regard, the Board concluded that, where the Contractual Management Rates, Sub-Advisory Agreement Rates and Actual Management Rates were appreciably above the range of the fee rates offered to other CMA and Sub-Adviser clients, based on information provided by CMA and the Sub-Adviser, the costs associated with managing and operating a registered investment company provided a justification for the higher fee rates charged to the Funds.
Other Benefits to CMA and the Sub-Adviser. The Board received and considered information regarding any "fall-out" or ancillary benefits received by CMA and its affiliates and the Sub-Adviser as a result of their relationship with the Funds. Such benefits could include, among others, benefits attributable to CMA's and the Sub-Adviser's relationships with the Funds (such as soft-dollar credits) and benefits potentially derived from an increase in CMA's and the Sub-Adviser's business as a result of their relationship with the Funds (such as the ability to market to shareholders other financial products offered by CMA and its affiliates or a Sub-Adviser).
The Board considered the effectiveness of the policies of the Funds in achieving the best execution of portfolio transactions, whether and to what extent soft dollar credits are sought and how any such credits are utilized, any benefits that may be realized by using an affiliated broker, the extent to which efforts are made to recapture transaction costs, and the controls applicable to brokerage allocation procedures. The Board also reviewed CMA's and the Sub-Adviser's methods for allocating portfolio investment opportunities among the Funds and other clients. The Board concluded that the benefits were not unreasonable.
Other Factors and Broader Review. As discussed above, the Board reviews materials received from CMA and the Sub-Adviser annually as part of the re-approval process under Section 15(c) of the 1940 Act. The Board also reviews and assesses the quality of the services the Funds receives throughout the year. In this regard, the Board and its Committees review reports of CMA and the Sub-Adviser at each of its quarterly meetings, which include, among other things, Fund performance reports and presentations relating to such reports. In addition, the Board and its Committees
40
confer with portfolio managers at various times throughout the year including, most particularly, at the June Investment Committee meeting.
Fund-Specific Considerations for Certain "Review" Funds. For certain Funds highlighted as meeting agreed-upon criteria for warranting further review, the Board engaged in further analysis with regard to approval of the Funds' Advisory Agreements. Such criteria included, among other things, information relating to Actual Management Rates, total expense ratios, and/or performance information relative to a Fund's Peer Group and/or Universe. Columbia Large Cap Value Fund was not highlighted as a review fund.
Conclusion. After an evaluation of the above-described factors, and based on its deliberations and analysis of the information provided and alternatives considered, the Board, including all of the Independent Trustees, concluded that the compensation payable to CMA and the Sub-Adviser under the Advisory Agreements is fair and equitable. Accordingly, the Board unanimously re-approved the Advisory Agreements.
41
Board Consideration and Approval of Proposed
Investment Advisory Agreement
Even though the following description of the Board's consideration of investment advisory and, as applicable, sub-advisory agreements covers multiple funds and trusts, for purposes of this shareholder report, the description is only relevant as to the Fund.
At a meeting held on December 21, 2009, the Boards of Trustees (the "Boards") of Columbia Funds Series Trust, Columbia Funds Master Investment Trust, LLC and Columbia Funds Series Trust II (each a "Trust" and collectively the "Trusts") unanimously approved a new investment management services agreement with RiverSource Investments, LLC ("RiverSource") (the "Proposed Advisory Agreement") and new subadvisory agreements with Marsico Capital Management ("Marsico Capital"), MacKay Shields LLC ("Mackay Shields") and Brandes Investment Partners, L.P. ("Brandes") (each a "Proposed Subadvisory Agreement"), as applicable, for each Fund of the Trusts (each a "Fund" and collectively the "Funds"). As detailed below, the Trustees met on multiple occasions in advance of the December 21, 2009 meeting, held numerous discussions with the management teams of Columbia Management Advisors, LLC ("Columbia") and RiverSource, a subsidiary of Ameriprise Financial, Inc. ("Ameriprise") and reviewed and considered extensive materials in connection with the approval of the Proposed Advisory and Subadvisory Agreements.
Specifically, the Trustees of each Trust, including a majority of the Trustees who have no direct or indirect interest in the Proposed Advisory and Subadvisory Agreements and are not "interested persons" of the Trusts, as defined in the Investment Company Act of 1940, as amended (the "1940 Act") (the "Independent Trustees") reviewed and approved (i) the Proposed Advisory Agreement with RiverSource for each Fund and (ii) the Proposed Subadvisory Agreement for those Funds that currently have investment subadvisory agreements with Marsico Capital, Mackay Shields, and Brandes (the "Subadvised Funds") (Marsico Capital, MacKay Shields and Brandes are collectively referred to as the "Subadvisers"). Prior to approving the Proposed Advisory Agreements, the Trustees were presented with, and requested, received and evaluated, extensive materials about RiverSource, the sale of a portion of the asset management business of Columbia Managemen t Group, LLC to Ameriprise (the "Transaction") and related matters from RiverSource, Ameriprise and Columbia. In this regard, the Trustees reviewed RiverSource's responses to a series of detailed requests submitted by the Independent Trustees' independent legal counsel and by the Independent Fee Consultant (as defined below).
The Trustees also reviewed and considered information received in connection with their most recent consideration and reapproval in November 2009 of the current advisory agreement (the "Current Advisory Agreement") and current subadvisory agreement (the "Current Subadvisory Agreement"), as applicable, for each Fund, including information about the Subadvisers (the "Current Agreement Re-Approval Process"). Moreover, the Trustees and committees of the Boards met on several occasions, and received extensive materials, throughout the course of the year relating to the Current Agreement Re-Approval Process, which the Trustees considered relevant to their consideration and approval of the Proposed Advisory and Subadvisory Agreements. The Trustees also consulted with Fund counsel and with the Independent Trustees' independent legal counsel, who advised on the legal standards for consideration by the Trustees, and otherwise assisted the Trustees in their deliberations.
In advance of the meeting on December 21, 2009, the Trustees held several meetings, including meetings held in-person with representatives from RiverSource and Ameriprise on August 26, 2009, November 5-6, 2009, December 9-10, 2009 and December 14, 2009, and additional meetings with representatives of Columbia, to discuss the Transaction, RiverSource's plans and intentions regarding the Funds and various proposals that were being presented as a result of the Transaction, including the Proposed Advisory and Subadvisory Agreements. In addition to these meetings, telephonic meetings and discussions were held on several occasions between individual Trustees, members of the committees of the Boards, their independent legal counsel and representatives from RiverSource, Ameriprise and/or Columbia.
The Trustees also reviewed and considered a report prepared and provided by the Fee Consultant (the "Fee Consultant") appointed by the Independent Trustees pursuant to an assurance of discontinuance entered into by a predecessor to Columbia with the New York Attorney General ("NYAG") to settle a civil complaint filed by the NYAG relating to trading in mutual fund shares (the "NYAG Settlement"). The Fee Consultant's role was to manage the process by which management fees are negotiated so that they were negotiated in a manner that is at arms' length and reasonable. The Fee
42
Consultant found that the fee negotiation process was, to the extent practicable, at arms' length and reasonable and consistent with the requirements of the NYAG Settlement. A summary of the Fee Consultant's report is available at www.columbiafunds.com.
The following summarizes a number of the material factors considered by the Trustees in reaching their approvals and determinations with respect to the Proposed Advisory Agreements and Proposed Subadvisory Agreements. It is followed by a more detailed discussion of the Trustees' consideration of these and other factors considered relevant by the Trustees in their evaluation of the Proposed Advisory Agreements and Proposed Subadvisory Agreements. In voting to approve the Proposed Advisory and Subadvisory Agreements for each Fund, the Trustees also considered substantially the same factors, as relevant, and reached substantially the same conclusions in their approval of interim advisory and subadvisory agreements for each Fund.
(i) the terms and conditions of the Proposed Advisory Agreements compared to the terms and conditions of the Current Advisory Agreements, as described below;
(ii) the fact that each Fund's total advisory fees would remain the same;
(iii) the qualifications of the personnel of RiverSource, Ameriprise and the Subadvisers expected to provide advisory and administrative services to each Fund, including representations by Ameriprise regarding its retention of the same process for monitoring and evaluating portfolio management personnel for each Fund as currently used by Columbia;
(iv) the terms and conditions of the Proposed Subadvisory Agreements compared to the terms and conditions of the Current Subadvisory Agreements;
(v) the reputation, financial strength, regulatory and compliance histories and resources of RiverSource and Ameriprise, and the potential benefits to the Funds of the combination of RiverSource and Columbia, including that the Funds are expected to continue to have access to existing distribution channels and have the potential for expanded distribution of Fund shares, the expected depth and breadth of investment management capabilities, that there is not expected to be any diminution in the nature, quality and extent of services to be provided to the Funds under the Proposed Advisory Agreements and the potential for the realization of additional economies of scale over time and the potential of the Funds to share in, and benefit from, these economies, if any;
(vi) that Ameriprise has committed to refrain from imposing or seeking to impose, for a period of not less than two years after the closing of the Transaction (the "Closing"), any "unfair burden" (within the meaning of Section 15(f) of the 1940 Act) on any Fund;
(vii) the terms and conditions of certain other agreements and arrangements relating to the future operations of the Funds and their distribution channels, including the administrative services agreement and the new services and distribution agreement;
(viii) that the Trustees recently had completed the Current Agreement Re-Approval Process for each Fund and had determined that they were satisfied with the nature, extent and quality of services provided thereunder and that the management fee rates and (where applicable) subadvisory fee rates for each Fund were satisfactory;
(ix) that RiverSource was willing to commit to maintain net operating expense ratios at current levels for at least the period currently covered by Columbia's existing commitments;
(x) the capabilities of RiverSource and the Subadvisers with respect to compliance, including an assessment of RiverSource's compliance program by the Funds' Chief Compliance Officer;
(xi) that certain members of RiverSource's management and certain Columbia personnel that will be integrated into RiverSource and its affiliates as a result of the Transaction have substantial experience in integrating fund families; and
(xii) that Ameriprise and Bank of America Corporation would bear the costs of obtaining approvals of the Proposed Advisory and Subadvisory Agreements.
In their deliberations, the Trustees did not identify any single item that was paramount or controlling and individual Trustees may have attributed different weights to various
43
factors. The Trustees also evaluated all information available to them on a Fund-by-Fund basis, and their determinations were made separately in respect of each Fund.
Nature, Extent and Quality of Services to be Provided. The Trustees received and considered various data and information regarding the expected nature, extent and quality of services to be provided to the Funds by RiverSource and the Subadvisers under the Proposed Advisory and Subadvisory Agreements. The most recent investment adviser registration forms for RiverSource and each Subadviser were made available to the Boards, as well as extensive materials from RiverSource, Ameriprise and Columbia. The Trustees reviewed and analyzed these materials, which included, among other things, information about the background and experience of expected senior management of RiverSource and Ameriprise after the Closing. The Trustees considered RiverSource's ability to provide administrative services to the Funds, noting that while the aggregate scope of advisory an d administrative services was not expected to change following the Closing, the allocation of services was expected to shift, to a limited extent, such that administrative services will be provided under a new administrative services agreement. The Trustees considered, among other things, the capacity and quality of RiverSource's and the Subadvisers' investment management, research and trade execution capabilities and other resources that would be dedicated to performing services for the Funds. The Trustees also considered matters related to RiverSource's and the Subadvisers' compliance programs and compliance records, including RiverSource's portfolio transaction policies and procedures. The Trustees discussed with senior management personnel their ability to administer and oversee outside service providers to the Funds and their shareholders and were satisfied with management's processes for providing services and overseeing and reviewing services to be rendered by outside sources.
In evaluating the services to be provided under the Proposed Advisory and Subadvisory Agreements, the Trustees factored in their extensive discussions with representatives of Columbia, RiverSource and Ameriprise at the meetings referenced above regarding the management of each Fund. The Trustees considered representations by Ameriprise that it was expected that there will be no diminution in the nature and quality of services provided to the Funds. The Trustees noted that Columbia Management Group's current President, Columbia's current Chief Investment Officer and Columbia's current President, were expected to continue to serve the Funds in similar capacities after the Closing. With respect to portfolio management, the Trustees reviewed information regarding the deliberative process for selecting portfolio management personnel to continue servicing the Fund s after the Closing, including the expected role of Columbia's Chief Investment Officer in evaluating and selecting portfolio management personnel for each Fund utilizing Columbia's current analytical model for evaluating portfolio managers. In this regard, the Trustees also weighed representations by Ameriprise that this investment management evaluative process was likely to result in a significant number of Columbia investment professionals and personnel currently responsible for management of the Funds to remain in place. The Trustees noted that the portfolio management evaluation and selection process was designed to optimize the portfolio management resources available to each Fund by having the ability to select investment personnel for the Funds from the combined organization. Similarly, the Trustees evaluated the ability of RiverSource and the Subadvisers, based on their respective resources, reputations and other attributes, to attract and retain qualified investment professionals. In this regard, t he Trustees considered information regarding the nature of the compensation structure applicable to portfolio managers and other key investment personnel.
The Trustees reviewed and considered information from Ameriprise and RiverSource regarding various contemplated service provider arrangements, including information regarding both immediate and potential future plans in respect of these arrangements. In this regard, the Trustees considered information regarding potential distribution, transfer agency and custody arrangements and the evaluation of fund accounting, financial reporting and valuation service model options, noting certain differences between Columbia's and RiverSource's current approaches, including that RiverSource has historically utilized services provided "in-house" or by its affiliates for fund accounting, financial reporting and valuation. The Trustees reviewed information from Ameriprise and RiverSource regarding the expectation for rationalized or harmonized fees as part of the integration after the Closing in order to develop consistent service fee schedules across the combined fund family. The Trustees noted Ameriprise's representations that, to the extent any such proposals were recommended to the Board after the
44
Closing, they would not result in an "unfair burden" (within the meaning of Section 15(f) of the 1940 Act) on any Fund.
In addition, the Trustees reviewed and evaluated materials and information received regarding the investment and legal compliance programs of the Funds, RiverSource and the Subadvisors, including their compliance policies and procedures and reports of the Funds' Chief Compliance Officer. In this regard, the Trustees considered that Columbia's current Chief Compliance Officer was expected to serve in the same role after the Closing.
The Trustees also noted that Ameriprise and certain of its affiliates have been involved in a number of legal, arbitration and regulatory proceedings, including routine litigation, class actions, and governmental actions, concerning matters arising in connection with the ordinary conduct of their business activities, and that Ameriprise indicated that neither Ameriprise nor any of its affiliates are the subject of any pending legal, arbitration or regulatory proceedings that are likely to have a material adverse effect on the Funds or the ability of Ameriprise or its affiliates, including RiverSource to provide services to the Funds.
Based on the foregoing and other information considered relevant, the Trustees concluded that, overall, they were satisfied with assurances from Columbia, RiverSource, Ameriprise and the Subadvisers as to the expected nature, extent and quality of services to be provided to each Fund under the Proposed Advisory and Subadvisory Agreements.
Investment Advisory and Subadvisory Fee Rates and Other Expenses. The Trustees reviewed and considered the proposed contractual investment advisory fee rates to be paid by each Fund to RiverSource for investment management services both separately and together with the administration fee rates to be paid by the Funds to RiverSource (the "Contractual Management Rates"), which are the same as the separate and aggregate advisory and administrative fee rates currently paid by each Fund to Columbia. The Trustees also reviewed and considered the proposed subadvisory fee rates and the fee arrangements under the Proposed Subadvisory Agreements, respectively, which are also the same as those currently in effect under the Current Subadvisory Agreements. In addition to the materials provided by Columbia, RiverSource provided information regarding the current fee s for each of the RiverSource funds and other relevant institutional accounts. The Trustees reviewed and considered the proposed fee waiver/cap arrangements applicable to the Contractual Management Rates and considered the Contractual Management Rates after taking the waivers/caps into account (the "Actual Management Rates"). In this regard, the Trustees noted that RiverSource had committed to maintain the Funds' current expense limitation and waiver arrangements (both contractual and voluntary). The Trustees considered the potential that, after the Closing, RiverSource would propose a common fee and expense structure for the combined fund family, subject to the commitment that Ameriprise will not seek any change that would result in an "unfair burden" on any Fund. The Trustees also considered the report prepared and provided by the Fee Consultant. Additionally, the Trustees received and afforded specific attention to information provide d in connection with the Current Agreement Re-Approval Process, comparing the Contractual Management Rates and Actual Management Rates with those of other funds in each Fund's Peer Group (as defined below).
During the Current Agreement Re-Approval Process, the Trustees reviewed and considered statistical information regarding each Fund's total expense ratio and its various components, including contractual advisory fees, actual advisory fees, actual nonmanagement fees, Rule 12b-1 and non-Rule 12b-1 service fees, fee waivers/caps and/or expense reimbursements. The Trustees also reviewed comparisons of these fees to the expense information for the group of Funds that was determined by Lipper Inc. ("Lipper") to be the most similar to a given Fund (the "Peer Group") and to the performance of a broader universe of relevant funds as determined by Lipper (the "Universe"), which comparative data was provided by Lipper, an independent provider of investment company data.
The Trustees were provided with a description of the methodology used by Lipper to select the mutual funds in each Fund's Peer Group and Universe and reviewed the degree of comparability resulting from the selection methodology. For certain Funds, Lipper determined that changing the composition of the Peer Group and/or Universe for expenses from that used for performance would provide a more accurate basis of comparison. The Trustees also considered Lipper data that ranked each Fund based on: (i) each Fund's one- and three-year performance compared to actual management fees; and (ii) each Fund's one- and three-year performance compared to total expenses.
45
For each Fund, except as otherwise described in the Fund-specific discussion below, the Trustees noted that they had concluded during the Current Agreement Re-Approval Process that the Contractual Management Rates, the Actual Management Rates and the total expense ratio were at acceptable levels in light of the quality of services provided to the Fund and in comparison to such Fund's Peer Group and Universe, as applicable; that the advisory fee rate would not be increased for any Fund; that Ameriprise and RiverSource had represented that the overall expenses for each Fund were not expected to be adversely affected by the Transaction; and that RiverSource had committed to maintain the Funds' current expense limitation or waiver arrangements (both contractual and voluntary).
Based on the foregoing, other relevant information received and the additional information described in the Fund-specific discussion below, as applicable, the Trustees concluded that the Contractual Management Rates, the Actual Management Rates and the total expense ratio were acceptable.
Fund Performance. The Trustees reviewed detailed performance information for each Fund at various Board and committee meetings during the year in addition to the additional performance information that they reviewed and evaluated in connection with the Transaction. The Trustees also reviewed and evaluated detailed performance information for each Fund in connection with the Current Agreement Re-Approval Process. The Trustees considered the performance results for each of the Funds over multiple measurement periods. They also considered these results in comparison to the performance results of each Fund's Peer Group and Universe, as well as to each Fund's benchmark index. The Boards also noted certain risk-adjusted performance data.
The Trustees also reviewed and evaluated information and data regarding the investment performance record of RiverSource in managing funds with investment strategies generally similar to those of the Funds, as applicable. Investment performance for such funds was provided for a wide range of periods.
The Trustees recognized that the investment performance record of RiverSource in managing funds with similar objectives may be less relevant to their deliberations in situations where the current portfolio managers of Columbia are expected to continue managing a particular Fund following the Closing. They also recognized that for each Fund, it is not possible to predict with certainty what effect, if any, consummation of the Transaction will have on the future performance of the Funds, noting in particular that past investment performance is no assurance of future results. The Fund-by-Fund discussion set forth below provides additional information regarding those Funds highlighted as meeting agreed-upon criteria for warranting further review. Such criteria included, among other things, information relating to Actual Management Rates, total expense ratios and /or performance information, relative to a Fund's Peer Group and/or Universe.
Costs of Services to be Provided and Profitability. In considering the costs of services to be provided by RiverSource and the Subadvisers under the Proposed Advisory Agreement and Proposed Subadvisory Agreement, as applicable for each Fund, and the projected range of profitability to RiverSource and the Subadvisers from their relationships with the Funds, the Trustees considered, among other things, that there would be no increase in advisory or subadvisory fee rates under the Proposed Advisory and Subadvisory Agreements. The Trustees further noted, with respect to RiverSource, that it was not possible to predict with certainty how RiverSource's profitability would be affected by becoming the investment adviser to the Funds but, as a general matter, they were satisfied, based on their review of RiverSource's projected range of profitability assuming completion of the Transaction, that this projected profitability from their relationship with the Funds would not be excessive. The Trustees based their review, in part, on information regarding RiverSource's current profitability in managing the RiverSource Funds and the information available to the Trustees with respect to RiverSource's expense budgeting process. The Trustees also noted that they would have ongoing opportunities to address RiverSource's profitability in the future based on actual results. The Trustees did not consider separate profitability information with respect to the Subadvisers, as their profitability from their relationships with the Funds was not a material factor in determining whether to approve the Proposed Subadvisory Agreements. The Trustees also noted that the subadvisory fees paid to the Subadvisers, none of which is affiliated with Columbia, had previously been negotiated on an arms' length basis.
The Trustees also reviewed information about the financial condition of RiverSource and the Subadvisers and were satisfied that RiverSource and the Subadvisers have adequate resources to perform the services required under the Proposed Advisory and Proposed Subadvisory Agreements.
46
Subject to the limitations noted above, the Trustees concluded that they were satisfied that RiverSource's projected range of future profitability, and each Subadviser's historical profitability, from their relationship with each Fund, as relevant, were not excessive.
Economies of Scale. The Trustees received and evaluated information regarding the potential to realize economies of scale with respect to management of the Funds, whether the Funds would appropriately benefit from any economies of scale and whether there was any potential for realization of further economies of scale in connection with the Transaction. The Trustees noted that the current and proposed investment advisory fee rates for most of the Funds contain breakpoints that reduce the fee rate on assets above specified levels. The Trustees noted that RiverSource had indicated that no changes to the Funds' breakpoint arrangements were proposed to be made at this time. In light of these factors and noting that it was not possible to evaluate with certainty if and how the Transaction would produce any immediate opportunities for additional economies of scale, the Trustees concluded that each Fund's breakpoint arrangements were acceptable. The Trustees also recognized that the Funds may benefit from certain economies of scale over time from becoming a part of the larger RiverSource fund complex, based on potential future synergies of operations, potential fee harmonization/rationalization initiatives and potential future Fund mergers. The Trustees noted, in particular, RiverSource's acknowledgement of the principle that the Funds should share in certain economies of scale if realized by RiverSource. In addition, the Trustees evaluated the likelihood that there would be potential Fund mergers after the Closing. The Trustees noted that any such potential Fund mergers, if approved, could result in the achievement of additional breakpoints for Funds that have implemented breakpoint fee schedules. The Trustees also noted that they expect to consider economies of scale from time to time following the Closing and thus be in a position to evaluate any additional e conomies of scale.
The Trustees acknowledged the inherent limitations of any analysis of an investment adviser's economies of scale, stemming largely from the Trustees' understanding that economies of scale are generally realized, if at all, by an investment adviser across a variety of products and services, not just with respect to a single fund.
Information About Investment Management Services to Non-Mutual Fund Clients. The Trustees also received and reviewed information about the nature and extent of services and fee rates offered by Riversource and the Subadvisers to the Funds compared with other clients with similar accounts, including separate accounts and institutional investments. The Trustees noted that the Funds may receive services different from those offered to other clients of RiverSource and the Subadvisers and concluded that the advisory fee rates under the Proposed Advisory Agreements and the subadvisory fee rates under the Proposed Subadvisory Agreements were not excessive, given the nature and extent of services expected to be offered and other factors, including the Trustees' review of Lipper data.
Other Benefits to RiverSource and the Subadvisers. The Trustees received and reviewed information regarding any expected "fall-out" or ancillary benefits to be received by RiverSource and its affiliates and by the Subadvisers as a result of their relationships with the Funds.
Among other things, the Trustees noted that RiverSource would benefit from soft dollar arrangements using portfolio brokerage of each Fund that invests in equity securities. The Trustees also noted that the Subadvisers also had benefited from, and expected to continue to benefit from, soft dollar arrangements using portfolio brokerage of the Subadvised Funds. The Trustees acknowledged RiverSource's representation that none of its affiliated broker dealers was expected to provide brokerage services to any Fund, but noted that broker-dealer affiliates of RiverSource will receive distribution related fees from the Funds in respect of shares held in certain accounts, and that such Funds' distributor (which will also become a subsidiary of RiverSource following the closing of the Transaction) retains a portion of the distribution related fees from the Funds and receives a portion of the sales charges on sales or redemptions of certai n classes of shares of the Funds. The Trustees recognized that RiverSource's and the Subadvisers' profitability would be somewhat lower without these benefits. The Trustees concluded that RiverSource and the Subadvisers may derive reputational benefits from their association with the Funds. The Trustees also noted, however, that such benefits were difficult to quantify with certainty.
47
Fund-Specific Considerations for Certain "Review" Funds. During the Current Agreement Re-Approval Process, a limited number of Funds were highlighted as meeting agreed-upon criteria for warranting further review. Such criteria included, among other things, information relating to Actual Management Rates, total expense ratios and/or performance information, relative to a Fund's Peer Group and/or Universe. For such "review" Funds, the Trustees engaged in further analysis with regard to the approval of the Funds' Current Advisory Agreements. For each such Fund, the Trustees subsequently considered the impact of transitioning investment management responsibilities to RiverSource.
Columbia Large Cap Value Fund was not highlighted as a review fund.
Conclusion. After an evaluation of the above-described factors and based on its deliberations and analysis of the information provided and alternatives considered, each Board, including all of the Independent Trustees, concluded that approval of the Proposed Advisory and Subadvisory Agreements was in the best interests of each of the Funds and its shareholders. Accordingly, the Boards unanimously approved the Proposed Advisory and Subadvisory Agreements.
48
Summary of Management Fee Evaluation by
Independent Fee Consultant
REPORT OF INDEPENDENT FEE CONSULTANT TO THE FUNDS SUPERVISED BY THE COLUMBIA NATIONS BOARD
Prepared Pursuant to the February 9, 2005
Assurance of Discontinuance among the
Office of Attorney General of New York State,
Columbia Management Advisors, LLC, and
Columbia Management Distributors, Inc.
November 12, 2009
I. Overview
On February 9, 2005, Columbia Management Advisors, LLC ("CMA") and Columbia Management Distributors, Inc.1 ("CMD") agreed to the New York Attorney General's Assurance of Discontinuance ("AOD"). Among other things, the AOD stipulates that CMA may manage or advise a Columbia Fund ("Columbia Fund" and, together with some or all of such funds, the "Columbia Funds") only if the Independent Members of the Columbia Fund's Board of Trustees appoint a Senior Officer or retain an Independent Fee Consultant ("IFC") who is to manage the process by which proposed management fees are negotiated. The AOD further stipulates that the Senior Officer or IFC is to prepare a written annual evaluation of the fee negotiation process.
With effect from January 1, 2007, the Independent Members of the Board of Trustees for certain Columbia Funds known collectively as the "Nations Funds" (together with the other members of that Board, the "Trustees") retained me as IFC for the Nations Funds.2 In this capacity, I have prepared the fifth annual written evaluation of the fee negotiation process. As was the case with the 2007 and 2008 reports, my immediate predecessor as IFC, John Rea, provided invaluable assistance in the preparation of this year's report.
A. Role of the Independent Fee Consultant
The AOD charges the IFC with "managing the process by which proposed management fees ... to be charged the Columbia Fund are negotiated so that they are negotiated in a manner which is at arms' length and reasonable and consistent with this Assurance of Discontinuance." The AOD also provides that CMA "may manage or advise a Columbia Fund only if the reasonableness of the proposed management fees is determined by the Board of Trustees ... using ... an annual independent written evaluation prepared by or under the direction of ... the Independent Fee Consultant." Therefore, the AOD makes clear that the IFC does not supplant the Trustees in negotiating management fees with CMA, nor does the IFC substitute his or her judgment for that of the Trustees with respect to the reasonableness of proposed fees or any other matter that is committed to the business judgmen t of the Trustees.
B. Elements Involved in Managing the Fee Negotiation Process
In preparing the report required by the AOD, the IFC must consider at least the following six factors set forth in the AOD:
1. The nature and quality of CMA's services, including the Fund's performance;
2. Management fees (including any components thereof) charged by other mutual fund companies for like services;
3. Possible economies of scale as the Fund grows larger;
4. Management fees (including any components thereof) charged to institutional and other clients of CMA for like services;
5. Costs to CMA and its affiliates of supplying services pursuant to the management fee agreements, excluding any intra-corporate profit; and
6. Profit margins of CMA and its affiliates from supplying such services.
C. Organization of the Annual Evaluation
This report, like last year's, focuses on the six factors and contains a section for each factor except that CMA's costs and profits from managing the Funds are treated in a single section. In addition to a discussion of these factors, the report offers recommendations to improve the fee review process in future years. A review of the status of recommendations made in the 2008 Report is being provided separately with the materials for the November meeting.
1 CMA and CMD are subsidiaries of Columbia Management Group, LLC ("CMG"), and are the successors to the entities named in the AOD.
2 I have no material relationship with Bank of America, CMG or any of its affiliates, aside from serving as IFC, and I am aware of no material relationship with any of their affiliates. I retained John Rea, an independent economic consultant, to assist me with this report.
Unless otherwise stated or required by the context, this report covers only the Nations Funds, which are also referred as the "Funds."
49
II. Summary of Findings
A. General
1. Based upon my examination of the information supplied by CMG in the light of the six factors set forth in the AOD, I conclude that the Trustees have the relevant information necessary to evaluate the reasonableness of the proposed management fees for each Nations Fund, subject to the following: on September 30, 2009, Ameriprise Financial, Inc. ("Ameriprise") announced that it had agreed to purchase the investment management business of CMG with the exception of its cash and liquidity management business which includes the Nations money market Funds. As a result, the Trustees requested information from CMG as to the plans of CMG and its parent with respect to the provision of investment management services to those Funds after the consummation of the proposed transaction. As of the date of this report, that in formation has not yet been provided. However, as the transaction is not expected to close until the spring of 2010, the Trustees concluded that they would have ample opportunity to take appropriate steps with respect to the investment management agreements of the money market Funds, including invoking the 60-day termination provisions of those agreements, in response to the information to be provided by CMG and reviewed by the IFC.
In my view, the process by which the proposed management fees of the Funds have been negotiated in 2009 thus far has been, to the extent practicable, at arms' length and reasonable and consistent with the AOD.
B. Nature and Quality of Services, Including Performance
3. The performance of the Funds was relatively strong for the measuring periods ending March 31, 2009. Between one-third and nearly one-half of the Funds were ranked in either the first or second quintiles in the one-, three-, five-, and 10-year periods, and no more than 8% were in the fifth quintile for these periods. Overall, the performance was stronger in the two longer periods.
4. The strongest performing groups over the one-, three-, and five-year periods were active equity, quantitative strategies, and, to a lesser extent, money market Funds. Sub-advised Funds were the weakest performers, with over 60% of the Funds in the bottom two quintiles in the one- and three-year periods. For the same two periods, no more than 15% percent of the sub-advised Funds were in the top two quintiles. Almost half of fixed-income Funds ranked in the bottom two quintiles in the one- and three-year periods.
5. Overall performance of the Funds was less robust in 2009 than in 2008 and 2007 for the one- and three-year performance periods. For example, 62% of the Funds were in the top two quintiles in 2007 for the one-year period compared with 33% in 2009. The ranks of those in the bottom two quintiles rose significantly between 2007 and 2009, led by money market and fixed-income Funds in the one- and three-year periods. For the three-year period, there was a similar trend with respect to sub-advised Funds.
6. The performance of the active equity Funds against their benchmarks was strong for the one-, three-, and five-year performance periods. In contrast, more than half of the sub-advised Funds failed to beat their benchmarks on a net basis in the one- and three-year periods. The fixed-income Funds consistently produced gross returns below those of their benchmarks. Lipper quintile rankings of the actively managed equity Funds are highly correlated with their performance against their benchmarks in the sense that net returns in excess of the benchmark appear necessary to achieve a ranking in one of the top three quintiles. No such correlation was observed for fixed-income and quantitative strategies Funds.
7. The equity Funds' overall performance adjusted for risk was mixed. Based upon three-year returns, less than 40% of the equity Funds had a combination of risk-adjusted and unadjusted returns that placed them in the top half of their performance universes; 60% were in the bottom half of their universes. About 30% of the fixed income Funds posted high returns and low risk relative to comparable funds. Over 60% of the fixed-income Funds took on more risk than the typical fund in their performance universes.
8. The industry-standard procedure used by Lipper that includes all share classes in the performance universe tends to bias a Fund's ranking upward within that universe. The bias occurs because either no-12b-1 fee or low-12b-1 fee share classes of the Nations Funds are compared with funds in performance universes that
50
include all share classes of multi-class funds with 12b-1 fees of up to 100 basis points. Correcting this bias by limiting the performance universe to classes of comparable funds with low or no 12b-1 fees (a "filtered universe") lowers the relative performance for the Funds, but generally not to a material extent. The filtering process, however, did identify two Funds for further review that had not been so identified using unfiltered universes.
9. A small number of Funds have consistently underperformed over the past five years. The exact number depends on the criteria used to evaluate longer-term performance. For example, six different Funds have had below-median performance in at least four out of the five years between 2005 and 2009 for either the one- or three-year performance periods from 2005 to 2009. If the threshold were the 60th percentile, only two Funds would have satisfied the criteria.
10. The services performed by CMG professionals beyond portfolio management, such as compliance, legal, information technology, risk management, finance, and fund administration, are critical to the success of the Funds and appear to be of high quality.
C. Management Fees Charged by Other Mutual Fund Companies
11. The Funds' management fees and total expenses are generally low relative to those of their peers, with over half the Funds ranking in the most favorable two quintiles. For total expenses, slightly more than one-quarter are in the bottom two quintiles, while slightly less than two-fifths are in the bottom two quintiles for actual management fees. Fixed-income and quantitative strategies Funds have the lowest fees and expenses relative to their peers. The sub-advised Funds account for the majority of Funds in the fifth quintile for both management fees and total expenses.
12. The distribution of management fee rankings has changed little over the past three years, while the distribution of total expense rankings has moved in the direction of higher expenses. The most notable change involving total expenses has been a shift in the number of Funds from the first to the second quintile.
13. The management fees of the non-subadvised Funds are generally in line with those of Columbia Funds supervised by the Atlantic Board of Trustees (the "Atlantic Funds"). The sub-advised large cap equity, international equity, and high yield Funds, however, generally have higher management fees than those of comparable Atlantic and non-subadvised Funds.
14. The implementation of the new program of voluntary expense limits appears to have been associated, on balance, with less favorable expense rankings. This result reflects increases in expense limits for certain Funds, the removal of fee waivers, and the shift of certain expenses from CMA to the Funds. The decline in expense rankings is less significant, however, than CMA projected in December 2008.
D. Trustees' Advisory Contract Review Process
15. The Trustees' evaluation process identified 22 Funds in 2009 for further review based upon long-standing criteria relating to their relative performance or expenses or both. When compared in filtered universes, two more Funds met the criteria for further review. At the November meeting, CMG provided further information about each of those Funds to assist the Trustees in their evaluation.
E. Potential Economies of Scale
16. CMG presented to the Trustees its analysis of the sources and sharing of potential economies of scale. CMG views economies of scale as arising at the complex level and would regard estimates of scale economies for individual funds as unreliable. In its analysis, CMG did not identify specific sources of economies of scale or provide any estimates of any economies of scale that might arise from future asset growth. CMG's analysis included measures taken by the Trustees and CMG that seek to share any potential economies of scale through breakpoints in management fee schedules, the establishment of expense limits for each Fund, enhanced shareholder services, fund mergers, and operational consolidation.
17. An examination of the contractual fee schedules for five Nations Funds shows that the schedules for Small Cap II, Municipal Reserves, and Treasury Reserves compare favorably with those of their competitors, while the subadvised Marsico Growth and High Yield VS Funds have schedules generally above those of their peers, including funds that do not have a sub-adviser. The group fee with
51
breakpoints that characterizes the money market Fund schedules is not typically found among competitors, nearly all of which have flat fee schedules.
F. Management Fees Charged to Institutional Clients
18. CMG has provided Trustees with comparisons of mutual fund management fees and institutional fees based upon standardized fee schedules and upon actual fees. The results show that, consistent with industry practice, actual and scheduled institutional fees are generally, but not always, lower than the Funds' management fees. CMG provided additional data this year demonstrating that at small asset levels, the effective fee of certain Funds may be equal to or less than institutional fee levels at those asset levels, due to the effect of expense limits on small funds with high gross expenses. CMG also analyzed the differences between the services provided and risks borne on the one hand by a manager of mutual funds and on the other by institutional advisers, and suggested that these differences should be kept in mind when Trustees review the reasonableness of the Funds' management fees.
G. Revenues, Expenses, and Profits
19. The activity-based cost allocation methodology employed by CMG to allocate costs, both direct and indirect, for purposes of calculating Fund profitability is thoughtful and detailed. This year, CMG further refined the technique by allocating additional indirect expenses on an activity basis.
20. The materials provided on CMG's revenues and expenses with respect to the Funds and the methodology underlying their construction form a sufficient basis for Trustees to evaluate the expenses of and profitability to CMG arising out of its relationships with the Funds.
21. CMG provided a firm-wide pro forma 2009 income statement demonstrating the effect of market events beginning in the fourth quarter of 2008 on its revenues and profitability to provide an additional perspective on calendar 2008 profitability data.
22. In 2008, CMG's pre-tax pre- and post-distribution margins on the Nations Funds were above the industry mean and median, based on limited data available for publicly held mutual fund managers and excluding the costs of CMG's money market capital support programs. However, as is to be expected in a 63-Fund complex, some Nations Funds had relatively high pre-tax profit margins in 2008, when calculated solely with respect to management revenues and expenses, while other Nations Funds operated at a loss. There is a positive relationship between Fund size and profitability to CMG, with smaller Funds generally operating at a loss to CMG.
23. CMG pays a fixed percentage of its management fee revenues to an affiliate, U.S. Trust, Bank of America Private Wealth Management, with respect to assets of its clients invested in Nations Funds to compensate it for services it performs with respect to those client assets and for the effect of state law limitations on affiliates charging multiple fees. Based on our analysis of the services provided by this affiliate, we have concluded that all payments other than those for sub-transfer agent or sub-accounting services should be treated as a distribution expense.
III. Recommendations
1) Criteria for review. The Trustees may wish to consider modifying the criteria for identifying a Fund for further review (a "Review Fund") to include criteria that focus exclusively on performance. They may also wish to consider whether it would be useful to apply CMG's own internal monitoring standards for Fund performance to the contract review process, or whether such criteria are more relevant to their ongoing investment oversight.
2) Presentation of Review Fund discussion. CMG should consider whether it could more systematically present in one discussion all relevant information regarding each Review Fund, which is now split into several different portions of the 15(c) materials. For any Fund that has been a Review Fund in consecutive years, CMG should address under what circumstances it could reasonably be anticipated that the Fund would lose that status.
3) Refinement of tax-exempt performance data. Certain single-state tax-exempt Funds compete in extremely small universes and are compared to a multi-state benchmark of uncertain relevance. Notwithstanding the difficulties, CMG should work to improve the reliability of the calculation of relative performance of these Funds. If that is not possible, CMG should provide guidance on how the Trustees should judge the quality of CMG's management of these Funds.
52
4) Development of risk metrics for asset-allocation, tax-exempt, and money market Funds. CMG has developed and shared with the Trustees quantitative risk metrics comparing equity and taxable fixed-income Funds against their peers. However, reliable risk metrics have not been developed for asset-allocation, tax-exempt fixed income, and money market Funds. We urge CMG to continue its efforts to provide reliable risk measures for these categories of Funds, especially in the cases of asset-allocation and money market funds, because their investors are likely to be motivated at least in part by a desire to manage risk.
5) Profitability data. For any period during which CMG is an affiliate of U.S. Trust, Bank of America Private Wealth Management, CMG should continue to present to the Trustees the profitability of each Fund, each investment style and each complex (of which Nations is one) calculated as follows:
a. Management-only profitability should be calculated without reference to any Private Bank expense.
b. Profitability excluding distribution (which essentially covers the management and transfer agency functions) should be adjusted by removing from the expense calculation any portion of the Private Bank payment not attributable to the performance by the Private Bank of sub-transfer agency or sub-accounting functions.
c. Total profitability, including distribution: No adjustment for Private Bank expenses should be made, because all such expenses represent legitimate fund expenses to be taken into account in calculating CMG's profit margin including distribution.
d. Distribution only: This should include all Private Bank expenses other than those attributable to sub-transfer agency services.
6) Contractual fee analysis. This year CMG presented a new Lipper report comparing the contractual management fees of Funds with those of competitors in similar investment styles. However, the reliability of the conclusion—that Fund management fee breakpoints compared favorably with competitive fee rates—was limited by the use of competitive funds at all asset levels. The sponsors of a $100 million mutual fund may not have given much thought to breakpoints at $5 billion; therefore, that fund's contractual fee at that level is unlikely to compare favorably with that of a $5 billion Fund. Limiting the competitors to the Lipper expense group, whose constituents are similar in size to the rele vant Fund, would make the results more meaningful. In addition, the breakpoints of a select group of Nations Funds (which would differ each year) should continue to be compared to those of industry rivals to ensure that the Funds' breakpoint schedules remain within industry norms. As breakpoint schedules change relatively little each year, performing such a comparison for each Nations Fund each year would not be an efficient use of Trustee and CMG resources.
7) Pro forma profitability data. In any year in which CMG or the Trustees believe that the prior year's profitability is unlikely to be representative of current business results due to changes in markets or for any other reason, CMG should, consistent with this year's practice, prepare a pro forma income statement based on year-to-date actual data and reasonable projections used for its own business planning purposes.
8) Additional institutional data and analysis. While CMG provided a substantial amount of information on its institutional business, we suggest some additional items for future years: (a) profitability data for the institutional business in the format, and based upon the same allocation methodologies, used to present Fund profitability, (b) an explanation of how CMA sets institutional fee breakpoints, which normally begin at asset levels far lower than those found in Fund management fee breakpoints, and (c) distinguishing in all institutional fee materials fees of accounts acquired prior to the development of current fee schedules (so-called "legacy" accounts) from the fees of accounts launched after that time.
9) Management fee disparities. In any future study of management fees, CMG and the Nations Trustees should analyze the differences in management fee schedules. As part of that analysis, CMG should provide an explanation for any significant fee differences among comparable funds across fund families sponsored by CMG, such as differences in the management styles of different Funds included the same Lipper category. Finally, if CMG proposes a management fee change or an expense cap for
53
any mutual fund managed by CMA that is comparable to any Nations Fund, CMG should provide the Trustees with sufficient information about the proposal to allow the Trustees to assess the applicability of the proposed change to the relevant Nations Fund or Funds.
10) Explanation of data supplied to Lipper. Each year, as part of the 15(c) process, CMG retains Lipper to compare the fees and expenses of each Fund to a group of competitors. In many cases, CMG, with the approval of the Trustees, adjusts the actual expense data, which is based on the most recent full fiscal year of the Fund (and each competitive fund) to reflect changes in fees or expense limits that occurred during or after the relevant fiscal year. This improves the reliability and usefulness of the comparison. However, to ensure that the Trustees know when and how CMG adjusted the data, we recommend that CMG prepare a table listing for each Fund what adjustments were made, e.g., to reflect a new expense limitation of x basis points that commenced on y date.
11) Reduction of volume of paper documents submitted. The effort to streamline and better organize the data presented to the Trustees and the process by which that data was prepared and organized continued to be well-received by all parties. Notwithstanding past success, it is always appropriate to look for opportunities to reduce and simplify the presentation of 15(c) data. One possibility would be to remove the 127 pages of biographical data, most if not all of which the Trustees have previously seen as part of their ongoing investment oversight duties, from the paper volume and post it on the Internet-based document storage and retrieval system used by the Funds to provide reference data to Trustees.
Respectfully submitted,
Steven E. Asher
54
This page intentionally left blank.
This page intentionally left blank.
Important Information About This Report
The fund mails one shareholder report to each shareholder address. If you would like more than one report, please call shareholder services at 1-800-345-6611 and additional reports will be sent to you. This report has been prepared for shareholders of Columbia Large Cap Value Fund.
A description of the policies and procedures that the fund uses to determine how to vote proxies and a copy of the fund's voting records are available (i) at www.columbiamanagement.com, (ii) on the Securities and Exchange Commission's website at www.sec.gov, and (iii) without charge, upon request, by calling 1-800-368-0346. Information regarding how the fund voted proxies relating to portfolio securities during the 12-month period ended June 30 is available from the SEC's website. Information regarding how the fund voted proxies relating to portfolio securities is also available from the fund's website, www.columbiamanagement.com.
The fund files a complete schedule of portfolio holdings with the SEC for the first and third quarters of each fiscal year on Form N-Q. The fund's Form N-Q is available on the SEC's website at www.sec.gov and may be reviewed and copied at the SEC's Public Reference Room in Washington, DC. Information on the operation of the Public Reference Room may be obtained by calling 1-800-SEC-0330.
Please read and consider the investment objectives, risks, charges and expenses for any fund carefully before investing. For a prospectus which contains this and other important information about the fund, contact your Columbia Management representative or financial advisor or go to www.columbiamanagement.com.
Columbia Management Group, LLC ("Columbia Management") is the investment management division of Bank of America Corporation. Columbia Management entities furnish investment management services and products for institutional and individual investors. Columbia Funds are distributed by Columbia Management Distributors, Inc., member of FINRA, SIPC, part of Columbia Management and an affiliate of Bank of America Corporation.
Transfer Agent
Columbia Management Services, Inc.
P.O. Box 8081
Boston, MA 02266-8081
1-800-345-6611
Distributor
Columbia Management
Distributors, Inc.
One Financial Center
Boston, MA 02111
Investment Advisor
Columbia Management Advisors, LLC
100 Federal Street
Boston, MA 02110
57
Columbia Management®
One Financial Center
Boston, MA 02111-2621
PRSRT STD
U.S. Postage
PAID
Holliston, MA
Permit NO. 20
Columbia Management®
Columbia Large Cap Value Fund
Annual Report, February 28, 2010
©2010 Columbia Management Distributors, Inc.
One Financial Center, Boston, MA 02111-2621
800-345-6611 www.columbiafunds.com
SHC-42/32224-0210 (04/10) 10-Y38516
Columbia Management®
Annual Report
February 28, 2010
Columbia Mid Cap Value Fund
| NOT FDIC INSURED | | May Lose Value | |
|
| NOT BANK ISSUED | | No Bank Guarantee | |
|
Table of Contents
| Fund Profile | | | 1 | | |
|
| Economic Update | | | 2 | | |
|
| Performance Information | | | 4 | | |
|
| Understanding Your Expenses | | | 5 | | |
|
| Financial Statements | | | | | |
|
| Investment Portfolio | | | 8 | | |
|
Statement of Assets and
Liabilities | | | 12 | | |
|
| Statement of Operations | | | 14 | | |
|
Statement of Changes in
Net Assets | | | 15 | | |
|
| Financial Highlights | | | 17 | | |
|
| Notes to Financial Statements | | | 23 | | |
|
Report of Independent Registered
Public Accounting Firm | | | 32 | | |
|
| Federal Income Tax Information | | | 33 | | |
|
| Fund Governance | | | 34 | | |
|
Board Consideration and
Re-Approval of Current
Investment Advisory Agreement | | | 38 | | |
|
Board Consideration and
Approval of Proposed
Investment Advisory Agreement | | | 42 | | |
|
Summary of Management
Fee Evaluation by Independent
Fee Consultant | | | 49 | | |
|
Important Information About
This Report | | | 57 | | |
|
The views expressed in this report reflect the current views of the respective parties. These views are not guarantees of future performance and involve certain risks, uncertainties and assumptions that are difficult to predict, so actual outcomes and results may differ significantly from the views expressed. These views are subject to change at any time based upon economic, market or other conditions and the respective parties disclaim any responsibility to update such views. These views may not be relied on as investment advice and, because investment decisions for a Columbia Fund are based on numerous factors, may not be relied on as an indication of trading intent on behalf of any particular Columbia Fund. References to specific securities should not be construed as a recommendation or investment advice.
President's Message

Dear Shareholder:
As we previously announced, Bank of America, N.A. has reached a definitive agreement to sell Columbia Management's long-term asset management business to Ameriprise Financial, Inc. This includes the management of its equity and fixed-income mutual funds.
This transaction combines two leading asset management firms and will create one entity that is expected to rank as one of the top asset managers. It is anticipated that the combined U.S. asset management business will operate under the well-regarded Columbia Management brand. The combined U.S. asset management business will be led by Ted Truscott, currently president, U.S. asset management, annuities and chief investment officer, Ameriprise Financial. Michael A. Jones, currently president of Columbia Management, will serve as president, U.S. asset management. Colin Moore, chief investment officer at Columbia Management, will continue to serve in that role for the combined organization. I will also continue in my role as head of mutual funds, responsible for the delivery of mutual fund products and services to investors.
As a valued investor in Columbia funds, please know that our goal is to ensure a smooth transition and provide you with the highest quality products and services. We will work closely with colleagues at Ameriprise Financial to seek a seamless transition for our clients and to keep you informed as the transition progresses and key decisions are made. We want to assure you that the funds' portfolio managers continue to focus on providing uninterrupted service to Columbia fund shareholders. Columbia Management and Ameriprise Financial will operate independently until all required approvals, including fund board, fund shareholder and other client approvals, have been received and the transaction closes, which is expected to occur in the spring of this year.
Meanwhile, transition teams across the company have been formed to oversee integration efforts including rebranding initiatives, vendor and system consolidations and client communications. Throughout the transition, we seek to build on best practices from both legacy organizations with enhancements to productivity, quality and the delivery of world-class customer experiences.
Clearly, we have a lot of work ahead of us in 2010. We look forward to introducing our combined business with an even wider breadth of products and capabilities. Everyone at Columbia Management and Ameriprise Financial is excited about the opportunities for this combined organization. I share this optimism and believe it will position us as a best-in-class asset management business with the ability to deliver more for clients than ever before.
Sincerely,

J. Kevin Connaughton
President, Columbia Funds
Fund Profile – Columbia Mid Cap Value Fund
Summary
g For the 12-month period that ended February 28, 2010, the fund's Class A shares returned 64.09% without sales charge.
g The fund trailed its benchmark, the Russell Midcap Value Index,1 and the average return of its peer group, the Lipper Mid-Cap Value Funds Classification.2
g The fund delivered outstanding returns as the stock market rebounded. However, lower-quality stocks led the market recovery and the fund's higher-quality focus accounted for its shortfall relative to the benchmark.
Portfolio Management
Lori Ensinger has co-managed the fund since August 2001 and has been associated with the advisor or its predecessors since 2001.
Diane Sobin has co-managed the fund since August 2001 and has been associated with the advisor or its predecessors since 2001.
David Hoffman has co-managed the fund since April 2004 and has been associated with the advisor or its predecessors since 2001.
Noah Petrucci has co-managed the fund since February 2002 and has been associated with the advisor or its predecessors since 2002.
Subject to satisfying various conditions to closing, effective on or about May 1, 2010, RiverSource Investments, LLC, a subsidiary of Ameriprise Financial, Inc., is expected to become the investment advisor to the fund and change its name to Columbia Management Investment Advisers, LLC. Please see the fund's prospectus dated July 1, 2009, including the supplements thereto, for more information regarding the expected change in investment advisor and any related changes to the portfolio management of the fund.
1The Russell Midcap Value Index measures the performance of those Russell Midcap companies with lower price-to-book ratios and lower forecasted growth values. The stocks are also members of the Russell 1000 Value Index. Indices are not available for investment, are not professionally managed and do not reflect sales charges, fees, brokerage commissions, taxes or other expenses of investing. Securities in the fund may not match those in an index.
2Lipper Inc., a widely respected data provider in the industry, calculates an average total return (assuming reinvestment of distributions) for mutual funds with investment objectives similar to those of the fund. Lipper makes no adjustment for the effect of sales loads.
Performance data quoted represents past performance and current performance may be lower or higher. Past performance is no guarantee of future results. The investment return and principal value will fluctuate so that shares, when redeemed, may be worth more or less than the original cost. Please visit www.columbiafunds.com for daily and most recent month-end performance updates.
Summary
1-year return as of 02/28/10
| | +64.09% | |
|
| |  | | | Class A shares
(without sales charge) | |
|
| | +74.74% | |
|
| |  | | | Russell Midcap Value Index | |
|
Morningstar Style BoxTM

The Morningstar Style BoxTM reveals a fund's investment strategy. For equity funds, the vertical axis shows the market capitalization of the stocks owned and the horizontal axis shows investment style (value, blend or growth). Information shown is based on the most recent data provided by Morningstar.
1
Economic Update – Columbia Mid Cap Value Fund
Summary
For the 12-month period that ended February 28, 2010
g After a sharp decline, stock markets rebounded around the world, as measured by the S&P 500 Index and the MSCI EAFE Index.
| S&P Index | | MSCI Index | |
|
 | |  | |
|
g As investors grew more comfortable with risk, non-Treasury sectors of the bond market rebounded. The Barclays Capital Aggregate Bond Index delivered solid results. High-yield bonds were strong performers, as measured by the JPMorgan Developed BB High Yield Index.
Barclays
Aggregate Index | | JPMorgan Index | |
|
 | |  | |
|
After a deep and difficult recession, the U.S. economy regained its footing midway through calendar year 2009. Gross domestic product (GDP) turned positive in the third quarter of 2009, rising 2.2%, and then gained 5.6% in the fourth quarter according to the estimate released by the Bureau of Economic Analysis. Growth was primarily the result of federal government stimulus spending and a slowdown in inventory reductions. Hopes for a sustained recovery now depend on a variety of factors, including a rebound in consumer spending, an increase in revenues to keep business profits moving higher and a turnaround in the labor market.
The housing market showed some signs of improvement. Existing home sales fell late in the period, but remained above levels of one year ago. According to the National Association of Realtors, the inventory of houses for sale fell over the course of 2009. Housing prices remained unchanged during the past year, but that was progress compared to 2008. The average home price fell in 2008 and since then distressed properties, which accounted for an estimated 38% of sales in January 2010, have weighed on prices because they were heavily discounted.
In the beleaguered labor market, the good news was that there was less bad news. Businesses continued to shed jobs throughout the period, raising the unemployment rate as high as 10.2% in October 2009. However, the pace of job losses slowed markedly by the period's end. Compared to six figure losses of one year ago, 14,000 jobs were added to the labor market in January 2010 and only 14,000 were lost in February 2010.* The rate of unemployment at the end of the period was 9.7%.* Nevertheless, prospects for a quick recovery in the labor markets are dim. In fact, consumer confidence, as measured monthly by The Conference Board, an independent resear ch organization, took a sharp dive in February. Consumers surveyed cited worsening business conditions and a bleaker outlook for the labor markets and income for their pessimism.
Manufacturing activity remained slow during the first few months of the period. However, a key measure—the Institute for Supply Management's Index—rose above 50 in July and remained well above 50 for the remainder of the period. A value above 50 tends to indicate that the economy is growing. Industrial production turned positive in January 2010, and durable goods orders took a big jump forward. Manufacturing capacity utilization inched upward to 72.6%.
Consumer spending registered both ups and downs during the 12-month period, but the trend at the end of the period was upward, even though personal income decreased in January 2010. In light of uncertainty about the economy and pressure on consumers from a number of sectors, the Federal Reserve Board (the Fed) kept a key short-term interest rate—the federal funds rate—close to zero throughout the period.
Stocks bottomed, then rebounded
Against a strengthening economic backdrop, a stock market rally that began in mid-March 2009 continued throughout the period. The U.S. stock market returned 53.62%
*Source: U.S. Bureau of Labor Statistics
2
Economic Update (continued) – Columbia Mid Cap Value Fund
for the 12-month period, as measured by the S&P 500 Index.1 Mid-cap stocks outperformed large and small-cap stocks and value stocks outperformed growth stocks by a solid margin, as measured by their respective Russell indices.2 Outside the U.S., stock market returns were even stronger. The MSCI EAFE Index,3 a broad gauge of stock market performance in foreign developed markets, gained 54.58% (net of dividends, in U.S. dollars) for the period. Emerging stock markets were caught in last year's downdraft, but they bounced back stronger than domestic or developed world markets in 2009 as their economic growth generally outpaced the developed world. The MSCI Emerging Markets Index4 returned 91.63% (net of dividends, in U.S. dollars).
Bond returns ranged from solid to strong
As hopes for a recovery materialized, bonds from non-Treasury sectors delivered solid returns. The Barclays Capital Aggregate Bond Index5 returned 9.32%. Municipal bonds delivered returns that were in line with taxable investment-grade bonds even without factoring in potential tax advantages to investors in higher income tax brackets. The Barclays Capital Municipal Bond Index6 returned 9.98%. High-yield bond prices rebounded strongly in 2009. For the 12-month period covered by this report, the JPMorgan Developed BB High Yield Index7 returned 32.79%.
Past performance is no guarantee of future results.
1The Standard & Poor's (S&P) 500 Index tracks the performance of 500 widely held, large-capitalization U.S. stocks.
2The Russell 1000 Index tracks the performance of 1,000 of the largest U.S. companies, based on market capitalization. The Russell Midcap Index measures the performance of the 800 smallest companies in the Russell 1000 Index, which represents approximately 25% of the total market capitalization of the Russell 1000 Index. The Russell 2000 Index measures the performance of the 2,000 smallest companies in the Russell 3000 Index, which represents approximately 8% of the total market capitalization of the Russell 3000 Index. The Russell 3000 Growth Index measures the performance of those Russell 3000 Index companies with higher price-to-book ratios and higher forecasted growth values. The stocks in this index are also members of either the Russell 1000 Growth or the Russell 2000 Growth indexes. The Russell 3000 Value Index measures the performance of those Russell 3000 Index companies with lower price-to-book ratios and lo wer forecasted growth values. The stocks in this index are also members of either the Russell 1000 Value or the Russell 2000 Value indexes.
3The Morgan Stanley Capital International Europe, Australasia, Far East (MSCI EAFE) Index is a capitalization-weighted index that tracks the total return of common stocks in 21 developed-market countries within Europe, Australasia and the Far East.
4The Morgan Stanley Capital International Emerging Markets Index (MSCI EMI) is a free float-adjusted market capitalization index that is designed to measure equity market performance of emerging markets. As of June 2009, the MSCI Emerging Markets Index consisted of the following 22 emerging market country indices: Brazil, Chile, China, Colombia, Czech Republic, Egypt, Hungary, India, Indonesia, Israel, Korea, Malaysia, Mexico, Morocco, Peru, Philippines, Poland, Russia, South Africa, Taiwan, Thailand, and Turkey.
5The Barclays Capital Aggregate Bond Index is a market value-weighted index that tracks the daily price, coupon, pay-downs and total return performance of fixed-rate, publicly placed, dollar-denominated and non-convertible investment grade debt issues with at least $250 million par amount outstanding and with at least one year to final maturity.
6The Barclays Capital Municipal Bond Index is considered representative of the broad market for investment-grade, tax-exempt bonds with a maturity of at least one year.
7The JPMorgan Developed BB High Yield Index is an unmanaged index designed to mirror the investable universe of the U.S. dollar developed, BB-rated, high yield corporate debt market.
Indices are not available for investment, are not professionally managed and do not reflect sales charges, fees, brokerage commissions, taxes or other expenses of investing. Securities in the fund may not match those in an index.
3
Performance Information – Columbia Mid Cap Value Fund
Performance data quoted represents past performance and current performance may be lower or higher. Past performance is no guarantee of future results. The investment return and principal value will fluctuate so that shares, when redeemed, may be worth more or less than the original cost. Please visit www.columbiafunds.com for daily and most recent month-end performance updates.
Annual operating expense ratio (%)*
| Class A | | | 1.17 | | |
| Class B | | | 1.92 | | |
| Class C | | | 1.92 | | |
| Class R | | | 1.42 | | |
| Class Y | | | 0.74 | | |
| Class Z | | | 0.92 | | |
*The annual operating expense ratio is as stated in the fund's prospectus that is current as of the date of this report. Differences in expense ratios disclosed elsewhere in this report may result from the inclusion of fee waivers and expense reimbursements as well as the use of different time periods used in calculating the ratios.
Performance of a $10,000 investment 11/20/01 – 02/28/10
The chart above shows the change in value of a hypothetical $10,000 investment in Class A shares of Columbia Mid Cap Value Fund during the stated time period, and does not reflect the deduction of taxes that a shareholder may pay on fund distributions or on the redemption of fund shares.
Performance of a $10,000 investment 11/20/01 – 02/28/10 ($)
| Sales charge | | without | | with | |
| Class A | | | 16,980 | | | | 16,003 | | |
| Class B | | | 15,959 | | | | 15,959 | | |
| Class C | | | 15,966 | | | | 15,966 | | |
| Class R | | | 16,811 | | | | n/a | | |
| Class Y | | | 17,322 | | | | n/a | | |
| Class Z | | | 17,334 | | | | n/a | | |
Average annual total return as of 02/28/10 (%)
| Share class | | A | | B | | C | | R | | Y | | Z | |
| Inception | | 11/20/01 | | 11/20/01 | | 11/20/01 | | 01/23/06 | | 07/15/09 | | 11/20/01 | |
| Sales charge | | without | | with | | without | | with | | without | | with | | without | | without | | without | |
| 1-year | | | 64.09 | | | | 54.64 | | | | 62.86 | | | | 57.86 | | | | 62.97 | | | | 61.97 | | | | 63.69 | | | | 64.44 | | | | 64.55 | | |
| 5-year | | | 1.70 | | | | 0.49 | | | | 0.94 | | | | 0.64 | | | | 0.94 | | | | 0.94 | | | | 1.49 | | | | 1.94 | | | | 1.95 | | |
| Life | | | 6.61 | | | | 5.85 | | | | 5.81 | | | | 5.81 | | | | 5.82 | | | | 5.82 | | | | 6.48 | | | | 6.87 | | | | 6.87 | | |
Average annual total return as of 03/31/10 (%)
| Share class | | A | | B | | C | | R | | Y | | Z | |
| Sales charge | | without | | with | | without | | with | | without | | with | | without | | without | | without | |
| 1-year | | | 62.38 | | | | 53.09 | | | | 61.23 | | | | 56.23 | | | | 61.12 | | | | 60.12 | | | | 62.05 | | | | 62.66 | | | | 62.69 | | |
| 5-year | | | 3.10 | | | | 1.88 | | | | 2.33 | | | | 2.03 | | | | 2.33 | | | | 2.33 | | | | 2.89 | | | | 3.34 | | | | 3.35 | | |
| Life | | | 7.40 | | | | 6.65 | | | | 6.60 | | | | 6.60 | | | | 6.61 | | | | 6.61 | | | | 7.27 | | | | 7.66 | | | | 7.66 | | |
The "with sales charge" returns include the maximum initial sales charge of 5.75% for Class A, the applicable contingent deferred sales charge of 5.00% in the first year, declining to 1.00% in the sixth year and eliminated thereafter for Class B shares and 1.00% for Class C shares for the first year only. The "without sales charge" returns do not include the effect of sales charges. If they had, returns would be lower.
Performance results reflect any fee waivers or reimbursements of fund expenses by the investment advisor and/or any of its affiliates. Absent these fee waivers or expense reimbursement arrangements, performance results would have been lower.
All results shown assume reinvestment of distributions. Class Y and Class Z shares are sold at net asset value with no distribution and service (Rule 12b-1) fees. Class R shares are sold at net asset value with distribution and service (Rule 12b-1) fees. Class R, Class Y, and Class Z shares have limited eligibility and the investment minimum requirements may vary. Please see the fund's prospectus for details. Performance for different share classes will vary based on differences in sales charges and fees associated with each class.
The tables do not reflect the deduction of taxes that a shareholder may pay on fund distributions or on the redemption of fund shares.
The returns for Class R shares include the returns of Class A shares prior to January 23, 2006, the date on which Class R shares were initially offered by the fund. If differences in expenses had been reflected, the returns shown would have been lower, since Class R shares are subject to higher distribution and service (Rule 12b-1) fees. The returns for Class Y shares include the returns for Class Z shares prior to July 15, 2009, the date on which Class Y shares were initially offered by the fund. The returns shown have not been adjusted to reflect any differences in expenses between Class Y shares and Class Z shares.
4
Understanding Your Expenses – Columbia Mid Cap Value Fund
As a fund shareholder, you incur two types of costs. There are transaction costs, which generally include sales charges on purchases and may include redemption fees or exchange fees. There are also ongoing costs, which generally include investment advisory fees, distribution and service (Rule 12b-1) fees and other fund expenses. The information on this page is intended to help you understand the ongoing costs of investing in the fund and to compare these costs with the ongoing costs of investing in other mutual funds.
Analyzing your fund's expenses by share class
To illustrate these ongoing costs, we have provided an example and calculated the expenses paid by investors in each share class during the period. The information in the following table is based on an initial investment of $1,000, which is invested at the beginning of the period and held for the entire period. Expense information is calculated two ways and each method provides you with different information. The amount listed in the "Actual" column is calculated using the fund's actual operating expenses and total return for the period. The amount listed in the "Hypothetical" column for each share class assumes that the return each year is 5% before expenses and is calculated based on the fund's actual operating expenses. You should not use the hypothetical account values and expenses to estimate either your actual account balance at the end of the period or the expenses you paid during this period.
Compare with other funds
Since all mutual funds are required to include the same hypothetical calculations about expenses in shareholder reports, you can use this information to compare the ongoing cost of investing in the fund with other funds. To do so, compare the 5% hypothetical example with the 5% hypothetical examples that appear in the shareholder reports of other funds. As you compare hypothetical examples of other funds, it is important to note that hypothetical examples are meant to highlight the ongoing costs of investing in a fund and do not reflect any transaction costs, such as sales charges, redemption fees or exchange fees.
Estimating your actual expenses
To estimate the expenses that you paid over the period, first you will need your account balance at the end of the period:
g For shareholders who receive their account statements from Columbia Management Services, Inc., your account balance is available online at www.columbiafunds.com or by calling Shareholder Services at 800.345.6611.
g For shareholders who receive their account statements from their financial intermediary, contact your financial intermediary to obtain your account balance.
1. Divide your ending account balance by $1,000. For example, if an account balance was $8,600 at the end of the period, the result would be 8.6.
2. In the section of the table below titled "Expenses paid during the period," locate the amount for your share class. You will find this number in the column labeled "Actual." Multiply this number by the result from step 1. Your answer is an estimate of the expenses you paid on your account during the period.
If the value of your account falls below the minimum initial investment requirement applicable to you, your account generally will be subject to a $20 annual fee. This fee is not included in the accompanying table. If you are subject to the fee, keep it in mind when you are estimating the ongoing expenses of investing in the fund and when comparing the expenses of this fund with other funds.
09/01/09 – 02/28/10
| | | Account value at the
beginning of the period ($) | | Account value at the
end of the period ($) | | Expenses paid
during the period ($) | | Fund's annualized
expense ratio (%) | |
| | | Actual | | Hypothetical | | Actual | | Hypothetical | | Actual | | Hypothetical | | Actual | |
| Class A | | | 1,000.00 | | | | 1,000.00 | | | | 1,124.90 | | | | 1,019.09 | | | | 6.06 | | | | 5.76 | | | | 1.15 | | |
| Class B | | | 1,000.00 | | | | 1,000.00 | | | | 1,120.50 | | | | 1,015.37 | | | | 9.99 | | | | 9.49 | | | | 1.90 | | |
| Class C | | | 1,000.00 | | | | 1,000.00 | | | | 1,121.20 | | | | 1,015.37 | | | | 9.99 | | | | 9.49 | | | | 1.90 | | |
| Class R | | | 1,000.00 | | | | 1,000.00 | | | | 1,123.60 | | | | 1,017.85 | | | | 7.37 | | | | 7.00 | | | | 1.40 | | |
| Class Z | | | 1,000.00 | | | | 1,000.00 | | | | 1,127.10 | | | | 1,020.33 | | | | 4.75 | | | | 4.51 | | | | 0.90 | | |
| Class Y | | | 1,000.00 | | | | 1,000.00 | | | | 1,125.30 | | | | 1,020.98 | | | | 4.06 | | | | 3.86 | | | | 0.77 | | |
Expenses paid during the period are equal to the annualized expense ratio for the share class, multiplied by the average account value over the period, then multiplied by the number of days in the fund's most recent fiscal half-year and divided by 365.
It is important to note that the expense amounts shown in the table are meant to highlight only ongoing costs of investing in the fund and do not reflect any transaction costs, such as sales charges, redemption fees or exchange fees. Therefore, the hypothetical examples provided may not help you determine the relative total costs of owning shares of different funds. If these transaction costs were included, your costs would have been higher.
5
Portfolio Managers' Report – Columbia Mid Cap Value Fund
Performance data quoted represents past performance and current performance may be lower or higher. Past performance is no guarantee of future results. The investment return and principal value will fluctuate so that shares, when redeemed, may be worth more or less than the original cost. Please visit www.columbiafunds.com for daily and most recent month-end performance updates.
Net asset value per share
as of 02/28/10 ($)
| Class A | | | 11.18 | | |
| Class B | | | 10.94 | | |
| Class C | | | 10.98 | | |
| Class R | | | 11.18 | | |
| Class Y | | | 11.18 | | |
| Class Z | | | 11.20 | | |
Distributions declared per share
03/01/09 – 02/28/10 ($)
| Class A | | | 0.08 | | |
| Class B | | | 0.02 | | |
| Class C | | | 0.02 | | |
| Class R | | | 0.06 | | |
| Class Y | | | 0.07 | | |
| Class Z | | | 0.10 | | |
For the 12-month period that ended February 28, 2010, the fund's Class A shares returned 64.09% without sales charge. Over the same period, the fund's benchmark, the Russell Midcap Value Index, returned 74.74%, while the fund's peer group, the Lipper Mid-Cap Value Funds Classification, gained 69.29%. Absolute results were strong as mid-cap value stocks outpaced mid-cap growth stocks, and mid-cap stocks outpaced both large and small-cap stocks. However, the fund's focus on higher-quality stocks hampered performance versus the benchmark as low-quality, higher-risk names fueled the market rally. Industry allocations benefited returns, led by underweights in the utilities and telecommunications sectors. Stock selection delivered mixed results.
Gains from stock selection in consumer staples
All sectors in the index and the fund posted very strong returns for the year. Relative to the benchmark, stock selection in consumer staples gave the fund an edge. Pepsi Bottling Group and Fomento Economico Mexicano SAB, or FEMSA (0.8% of net assets) were among the fund's top contributors in the sector. Pepsi Bottling rose after it was announced that the company would be acquired by Pepsi Co. We subsequently sold the position, locking in the market's positive reaction to the sale. Shares of FEMSA, a Mexican beverage company, climbed as the company considered selling its beer unit. Elsewhere in the portfolio, standouts included Newfield Exploration and Peabody Energy (0.9% and 1.3% of net assets, respectively). Newfield Exploration, an oil exploration and production company, posted solid earnings driven by sound cost containment and improving volume growth, while coal miner Peabody Energy benefited from increasing demand for met allurgical coal from China.
Underperformance from consumer discretionary, tech and materials
Despite very strong returns in the consumer discretionary, information technology and materials sectors, the fund's results lagged those of the benchmark. In consumer discretionary, the fund had little or no exposure to many of the benchmark's strongest-performing media stocks, which hampered relative performance. We avoided these names because we believe that they have limited potential to expand profit margins over the long term. As a result of advertising dollars trending away from traditional media outlets, such as television, radio and newspapers, and shifting to online sites. In technology, detractors included NCR and Diebold (0.9% of net assets), manufacturers of automated teller machines (ATMs), the stocks of each of which declined in value as a result of declining demand from financial services companies who were reluctant to invest in upgraded or new ATMs. NCR also suffered when it announced it was entering the DVD kio sk business, which many analysts believe has limited long-term growth potential. NCR was no longer in the portfolio at period end. In materials, an underweight in paper companies, which were strong performers in the rally, hindered results.
Opportunity ahead
While corporate cost cutting helped fuel a stock market rally in 2009, we believe that permanent cost reductions and reaccelerating revenue growth will be necessary to fuel a sustained rally going forward. Regardless of the environment, we continue to find numerous opportunities that meet the fund's investment criteria. Many of these
6
Portfolio Managers' Report (continued) – Columbia Mid Cap Value Fund
opportunities are clustered by industry, particularly more economically-sensitive ones. In financials, which represented over one-quarter of the fund's assets at period end, we expect financial service companies that have strengthened their earnings power, balance sheets and long-term franchise values to do well. We're particularly interested in opportunities presented by consumer-oriented lenders as well as in capital markets companies that could benefit from an increase in merger-and-acquisition activity. We also believe that growth in long-term demand of emerging markets bodes well for both the energy and materials sectors. Finally, we believe that early-cycle industrials, as well as certain consumer discretionary stocks—including selected department stores, home centers and travel/leisure companies—offer opportunity. We are more cautious about prospects for telecommunications and health care stocks, both of which w e believe face long-term challenges.
Portfolio characteristics and holdings are subject to change periodically and may not be representative of current characteristics and holdings. The outlook for the fund may differ from those presented for other Columbia Funds.
Equity securities are subject to stock market fluctuations that occur in response to economic and business developments.
Stocks of mid-cap companies pose special risks, including possible illiquidity and greater price volatility than stocks of larger, more established companies.
Top 5 sectors
as of 02/28/10 (%)
| Financials | | | 27.8 | | |
| Consumer Discretionary | | | 15.1 | | |
| Industrials | | | 10.8 | | |
| Energy | | | 9.4 | | |
| Information Technology | | | 9.0 | | |
Top 10 holdings
as of 02/28/10 (%)
| Reinsurance Group of America | | | 2.0 | | |
| Royal Caribbean Cruises | | | 1.8 | | |
Starwood Hotels & Resorts
Worldwide | | | 1.6 | | |
| Cullen/Frost Bankers | | | 1.6 | | |
| J.C. Penney | | | 1.5 | | |
| Discover Financial Services | | | 1.5 | | |
| Comerica | | | 1.5 | | |
| TCF Financial | | | 1.5 | | |
| Sempra Energy | | | 1.4 | | |
Packaging Corporation of
America | | | 1.4 | | |
The fund is actively managed and the composition of its portfolio will change over time. Information provided is calculated as a percentage of net assets
7
Investment Portfolio – Columbia Mid Cap Value Fund
February 28, 2010
| Common Stocks – 98.9% | |
| | | Shares | | Value ($) | |
| Consumer Discretionary – 15.1% | |
| Auto Components – 1.7% | |
| BorgWarner, Inc. (a) | | | 1,440,300 | | | | 53,953,638 | | |
Goodyear Tire &
Rubber Co. (a) | | | 1,709,100 | | | | 22,201,209 | | |
| Auto Components Total | | | 76,154,847 | | |
| Hotels, Restaurants & Leisure – 4.0% | |
International Game
Technology | | | 1,607,902 | | | | 28,218,680 | | |
Royal Caribbean
Cruises Ltd. (a) | | | 2,712,300 | | | | 76,676,721 | | |
Starwood Hotels & Resorts
Worldwide, Inc. | | | 1,778,600 | | | | 68,831,820 | | |
| Hotels, Restaurants & Leisure Total | | | 173,727,221 | | |
| Household Durables – 1.0% | |
| D.R. Horton, Inc. | | | 3,500,800 | | | | 43,269,888 | | |
| Household Durables Total | | | 43,269,888 | | |
| Leisure Equipment & Products – 1.2% | |
| Hasbro, Inc. | | | 1,412,800 | | | | 50,549,984 | | |
| Leisure Equipment & Products Total | | | 50,549,984 | | |
| Media – 1.1% | |
DISH Network Corp.,
Class A (a) | | | 1,528,200 | | | | 30,518,154 | | |
| Gannett Co., Inc. | | | 1,192,615 | | | | 18,068,117 | | |
| Media Total | | | 48,586,271 | | |
| Multiline Retail – 2.0% | |
| J.C. Penney Co., Inc. | | | 2,414,300 | | | | 66,586,394 | | |
| Nordstrom, Inc. | | | 622,800 | | | | 23,006,232 | | |
| Multiline Retail Total | | | 89,592,626 | | |
| Specialty Retail – 2.6% | |
| American Eagle Outfitters, Inc. | | | 2,010,400 | | | | 33,915,448 | | |
| Foot Locker, Inc. | | | 3,812,300 | | | | 49,445,531 | | |
| O'Reilly Automotive, Inc. (a) | | | 832,500 | | | | 32,717,250 | | |
| Specialty Retail Total | | | 116,078,229 | | |
| Textiles, Apparel & Luxury Goods – 1.5% | |
| Hanesbrands, Inc. (a) | | | 1,224,600 | | | | 31,753,878 | | |
| Jones Apparel Group, Inc. | | | 2,084,500 | | | | 35,144,670 | | |
| Textiles, Apparel & Luxury Goods Total | | | 66,898,548 | | |
| Consumer Discretionary Total | | | 664,857,614 | | |
| Consumer Staples – 4.9% | |
| Beverages – 0.8% | |
Fomento Economico Mexicano
SAB de CV, ADR | | | 786,700 | | | | 33,670,760 | | |
| Beverages Total | | | 33,670,760 | | |
| | | Shares | | Value ($) | |
| Food Products – 1.5% | |
| Dean Foods Co. (a) | | | 860,332 | | | | 12,552,244 | | |
| J.M. Smucker Co. | | | 898,600 | | | | 53,628,448 | | |
| Food Products Total | | | 66,180,692 | | |
| Household Products – 0.7% | |
| Clorox Co. | | | 536,500 | | | | 32,892,815 | | |
| Household Products Total | | | 32,892,815 | | |
| Personal Products – 1.9% | |
| Avon Products, Inc. | | | 1,084,000 | | | | 32,996,960 | | |
Estee Lauder Companies,
Inc., Class A | | | 813,000 | | | | 48,885,690 | | |
| Personal Products Total | | | 81,882,650 | | |
| Consumer Staples Total | | | 214,626,917 | | |
| Energy – 9.4% | |
| Energy Equipment & Services – 3.3% | |
| Nabors Industries Ltd. (a) | | | 1,925,600 | | | | 42,440,224 | | |
| Noble Corp. (a) | | | 1,278,800 | | | | 54,042,088 | | |
| Pride International, Inc. (a) | | | 1,735,300 | | | | 48,553,694 | | |
| Energy Equipment & Services Total | | | 145,036,006 | | |
| Oil, Gas & Consumable Fuels – 6.1% | |
| Cabot Oil & Gas Corp. | | | 1,414,100 | | | | 56,761,974 | | |
| Newfield Exploration Co. (a) | | | 750,600 | | | | 38,333,142 | | |
| Peabody Energy Corp. | | | 1,243,178 | | | | 57,148,893 | | |
| Spectra Energy Corp. | | | 2,491,000 | | | | 54,303,800 | | |
| Williams Companies, Inc. | | | 2,918,400 | | | | 62,862,336 | | |
| Oil, Gas & Consumable Fuels Total | | | 269,410,145 | | |
| Energy Total | | | 414,446,151 | | |
| Financials – 27.8% | |
| Capital Markets – 3.0% | |
| Ameriprise Financial, Inc. | | | 1,086,000 | | | | 43,472,580 | | |
Raymond James
Financial, Inc. | | | 1,252,300 | | | | 32,384,478 | | |
TD Ameritrade Holding
Corp. (a) | | | 3,130,300 | | | | 54,748,947 | | |
| Capital Markets Total | | | 130,606,005 | | |
| Commercial Banks – 9.4% | |
| BB&T Corp. | | | 1,590,200 | | | | 45,368,406 | | |
| City National Corp. | | | 945,400 | | | | 47,194,368 | | |
| Comerica, Inc. | | | 1,836,000 | | | | 66,242,880 | | |
| Cullen/Frost Bankers, Inc. | | | 1,260,050 | | | | 68,231,708 | | |
| Fifth Third Bancorp. | | | 3,382,600 | | | | 41,301,546 | | |
| SVB Financial Group (a) | | | 1,133,311 | | | | 50,500,338 | | |
| TCF Financial Corp. | | | 4,483,300 | | | | 64,738,852 | | |
See Accompanying Notes to Financial Statements.
8
Columbia Mid Cap Value Fund
February 28, 2010
| Common Stocks (continued) | |
| | | Shares | | Value ($) | |
| Zions Bancorporation | | | 1,423,250 | | | | 26,387,055 | | |
| Commercial Banks Total | | | 409,965,153 | | |
| Consumer Finance – 1.5% | |
| Discover Financial Services | | | 4,860,299 | | | | 66,343,081 | | |
| Consumer Finance Total | | | 66,343,081 | | |
| Insurance – 5.4% | |
| ACE Ltd. (a) | | | 1,093,266 | | | | 54,652,367 | | |
| Assured Guaranty Ltd. | | | 975,100 | | | | 20,574,610 | | |
| Axis Capital Holdings Ltd. | | | 1,284,200 | | | | 40,388,090 | | |
Genworth Financial, Inc.,
Class A (a) | | | 2,260,400 | | | | 36,030,776 | | |
Reinsurance Group of
America, Inc. | | | 1,822,000 | | | | 86,599,660 | | |
| Insurance Total | | | 238,245,503 | | |
| Real Estate Investment Trusts (REITs) – 8.5% | |
Alexandria Real Estate
Equities, Inc. | | | 719,400 | | | | 44,329,428 | | |
| Boston Properties, Inc. | | | 661,300 | | | | 44,922,109 | | |
Equity Residential Property
Trust | | | 1,427,600 | | | | 51,507,808 | | |
Host Hotels & Resorts,
Inc. (a) | | | 2,898,297 | | | | 33,939,058 | | |
| Plum Creek Timber Co., Inc. | | | 977,245 | | | | 34,916,964 | | |
| ProLogis | | | 2,428,200 | | | | 31,299,498 | | |
| Rayonier, Inc. | | | 1,444,500 | | | | 60,047,865 | | |
| Simon Property Group, Inc. | | | 137,465 | | | | 10,762,135 | | |
| Taubman Centers, Inc. | | | 640,492 | | | | 24,806,255 | | |
| Vornado Realty Trust | | | 563,172 | | | | 37,011,664 | | |
| Real Estate Investment Trusts (REITs) Total | | | 373,542,784 | | |
| Financials Total | | | 1,218,702,526 | | |
| Health Care – 5.9% | |
| Health Care Equipment & Supplies – 3.4% | |
| Beckman Coulter, Inc. | | | 606,900 | | | | 39,788,364 | | |
| Cooper Companies, Inc. | | | 640,200 | | | | 25,646,412 | | |
| Hospira, Inc. (a) | | | 668,000 | | | | 34,956,440 | | |
| Teleflex, Inc. | | | 803,100 | | | | 48,940,914 | | |
| Health Care Equipment & Supplies Total | | | 149,332,130 | | |
| Health Care Providers & Services – 1.8% | |
| AmerisourceBergen Corp. | | | 1,496,700 | | | | 41,967,468 | | |
Community Health Systems,
Inc. (a) | | | 1,083,800 | | | | 37,141,826 | | |
| Health Care Providers & Services Total | | | 79,109,294 | | |
| | | Shares | | Value ($) | |
| Life Sciences Tools & Services – 0.7% | |
Mettler-Toledo International,
Inc. (a) | | | 291,500 | | | | 28,978,015 | | |
| Life Sciences Tools & Services Total | | | 28,978,015 | | |
| Health Care Total | | | 257,419,439 | | |
| Industrials – 10.8% | |
| Aerospace & Defense – 2.6% | |
| AerCap Holdings NV (a) | | | 3,314,007 | | | | 31,516,206 | | |
| Alliant Techsystems, Inc. (a) | | | 248,400 | | | | 19,735,380 | | |
L-3 Communications
Holdings, Inc. | | | 678,500 | | | | 62,028,470 | | |
| Aerospace & Defense Total | | | 113,280,056 | | |
| Airlines – 0.5% | |
| Delta Air Lines, Inc. (a) | | | 1,811,100 | | | | 23,399,412 | | |
| Airlines Total | | | 23,399,412 | | |
| Construction & Engineering – 0.6% | |
| Foster Wheeler AG (a) | | | 1,029,600 | | | | 25,338,456 | | |
| Construction & Engineering Total | | | 25,338,456 | | |
| Electrical Equipment – 0.9% | |
| Cooper Industries PLC, Class A | | | 892,100 | | | | 40,465,656 | | |
| Electrical Equipment Total | | | 40,465,656 | | |
| Machinery – 5.0% | |
| Ingersoll-Rand PLC | | | 677,200 | | | | 21,609,452 | | |
| Kennametal, Inc. | | | 1,726,900 | | | | 44,985,745 | | |
| Navistar International Corp. (a) | | | 871,300 | | | | 34,120,108 | | |
| Parker Hannifin Corp. | | | 892,700 | | | | 53,838,737 | | |
| Stanley Works | | | 837,700 | | | | 47,958,325 | | |
| Terex Corp. (a) | | | 963,200 | | | | 18,753,504 | | |
| Machinery Total | | | 221,265,871 | | |
| Marine – 0.2% | |
| Alexander & Baldwin, Inc. | | | 234,998 | | | | 7,562,236 | | |
| Marine Total | | | 7,562,236 | | |
| Professional Services – 1.0% | |
| Manpower, Inc. | | | 814,800 | | | | 41,978,496 | | |
| Professional Services Total | | | 41,978,496 | | |
| Industrials Total | | | 473,290,183 | | |
| Information Technology – 9.0% | |
| Communications Equipment – 1.0% | |
Brocade Communications
Systems, Inc. (a) | | | 4,337,600 | | | | 25,244,832 | | |
| CommScope, Inc. (a) | | | 706,000 | | | | 17,995,940 | | |
| Communications Equipment Total | | | 43,240,772 | | |
See Accompanying Notes to Financial Statements.
9
Columbia Mid Cap Value Fund
February 28, 2010
| Common Stocks (continued) | |
| | | Shares | | Value ($) | |
| Computers & Peripherals – 0.9% | |
| Diebold, Inc. | | | 1,385,700 | | | | 40,129,872 | | |
| Computers & Peripherals Total | | | 40,129,872 | | |
| Electronic Equipment, Instruments & Components – 2.6% | |
| Agilent Technologies, Inc. (a) | | | 894,200 | | | | 28,131,532 | | |
| Arrow Electronics, Inc. (a) | | | 1,475,600 | | | | 41,626,676 | | |
| Molex, Inc. | | | 2,085,700 | | | | 42,652,565 | | |
Electronic Equipment, Instruments &
Components Total | | | 112,410,773 | | |
| Internet Software & Services – 0.3% | |
| VeriSign, Inc. (a) | | | 635,500 | | | | 15,836,660 | | |
| Internet Software & Services Total | | | 15,836,660 | | |
| IT Services – 0.7% | |
| Western Union Co. | | | 1,919,600 | | | | 30,291,288 | | |
| IT Services Total | | | 30,291,288 | | |
| Semiconductors & Semiconductor Equipment – 1.4% | |
Advanced Micro Devices,
Inc. (a) | | | 1,777,400 | | | | 14,059,234 | | |
| Atmel Corp. (a) | | | 4,224,800 | | | | 19,053,848 | | |
| Lam Research Corp. (a) | | | 564,712 | | | | 19,149,384 | | |
Varian Semiconductor
Equipment Associates, Inc. (a) | | | 325,800 | | | | 9,800,064 | | |
Semiconductors & Semiconductor
Equipment Total | | | 62,062,530 | | |
| Software – 2.1% | |
| Citrix Systems, Inc. (a) | | | 1,052,700 | | | | 45,276,627 | | |
Nuance Communications,
Inc. (a) | | | 1,682,600 | | | | 24,212,614 | | |
| Synopsys, Inc. (a) | | | 987,900 | | | | 21,635,010 | | |
| Software Total | | | 91,124,251 | | |
| Information Technology Total | | | 395,096,146 | | |
| Materials – 7.3% | |
| Chemicals – 2.3% | |
| Albemarle Corp. | | | 1,210,600 | | | | 45,385,394 | | |
| PPG Industries, Inc. | | | 901,800 | | | | 55,496,772 | | |
| Chemicals Total | | | 100,882,166 | | |
| Containers & Packaging – 2.5% | |
| Crown Holdings, Inc. (a) | | | 1,639,700 | | | | 44,796,604 | | |
| Packaging Corp. of America | | | 2,647,000 | | | | 62,998,600 | | |
| Containers & Packaging Total | | | 107,795,204 | | |
| | | Shares | | Value ($) | |
| Metals & Mining – 1.3% | |
| Allegheny Technologies, Inc. | | | 509,200 | | | | 22,231,672 | | |
| United States Steel Corp. | | | 702,200 | | | | 37,174,468 | | |
| Metals & Mining Total | | | 59,406,140 | | |
| Paper & Forest Products – 1.2% | |
| Weyerhaeuser Co. | | | 1,261,200 | | | | 50,952,480 | | |
| Paper & Forest Products Total | | | 50,952,480 | | |
| Materials Total | | | 319,035,990 | | |
| Telecommunication Services – 0.6% | |
| Diversified Telecommunication Services – 0.6% | |
Qwest Communications
International, Inc. | | | 5,622,100 | | | | 25,636,776 | | |
Diversified Telecommunication
Services Total | | | 25,636,776 | | |
| Telecommunication Services Total | | | 25,636,776 | | |
| Utilities – 8.1% | |
| Electric Utilities – 2.0% | |
American Electric Power
Co., Inc. | | | 1,275,700 | | | | 42,889,034 | | |
| Northeast Utilities | | | 856,600 | | | | 21,928,960 | | |
| PPL Corp. | | | 729,800 | | | | 20,784,704 | | |
| Electric Utilities Total | | | 85,602,698 | | |
| Independent Power Producers & Energy Traders – 0.2% | |
| AES Corp. (a) | | | 784,155 | | | | 9,166,772 | | |
Independent Power Producers & Energy
Traders Total | | | 9,166,772 | | |
| Multi-Utilities – 5.9% | |
| PG&E Corp. | | | 1,286,200 | | | | 53,917,504 | | |
Public Service Enterprise
Group, Inc. | | | 1,255,200 | | | | 37,304,544 | | |
| Sempra Energy | | | 1,284,100 | | | | 63,139,197 | | |
| Wisconsin Energy Corp. | | | 1,121,600 | | | | 54,319,088 | | |
| Xcel Energy, Inc. | | | 2,503,800 | | | | 52,104,078 | | |
| Multi-Utilities Total | | | 260,784,411 | | |
| Utilities Total | | | 355,553,881 | | |
Total Common Stocks
(cost of $3,929,510,905) | | | 4,338,665,623 | | |
See Accompanying Notes to Financial Statements.
10
Columbia Mid Cap Value Fund
February 28, 2010
| Convertible Preferred Stock – 0.3% | |
| | | Shares | | Value ($) | |
| Materials – 0.3% | |
| Metals & Mining – 0.3% | |
Freeport-McMoRan Copper &
Gold, Inc., 6.750% | | | 140,900 | | | | 15,169,294 | | |
| Metals & Mining Total | | | 15,169,294 | | |
| Materials Total | | | 15,169,294 | | |
Total Convertible Preferred Stock
(cost of $5,558,266) | | | 15,169,294 | | |
| Short-Term Obligation – 0.6% | |
| | | Par ($) | | | |
Repurchase agreement with
Fixed Income Clearing Corp.,
dated 02/26/10, due 03/01/10
at 0.050%, collateralized by a
U.S. Government Agency
obligation maturing 02/25/13,
market value $26,783,438
(repurchase proceeds
$26,257,109) | | | 26,257,000 | | | | 26,257,000 | | |
Total Short-Term Obligation
(cost of $26,257,000) | | | 26,257,000 | | |
Total Investments – 99.8%
(cost of $3,961,326,171) (b) | | | 4,380,091,917 | | |
| Other Assets & Liabilities, Net – 0.2% | | | 6,711,474 | | |
| Net Assets – 100.0% | | | 4,386,803,391 | | |
Notes to Investment Portfolio:
(a) Non-income producing security.
(b) Cost for federal income tax purposes is $3,968,175,907.
The following table summarizes the inputs used, as of February 28, 2010 in valuing the Fund's assets:
| Description | | Quoted Prices
(Level 1) | | Other
Significant
Observable
Inputs
(Level 2) | | Significant
Unobservable
Inputs
(Level 3) | | Total | |
| Total Common Stocks | | $ | 4,338,665,623 | | | $ | – | | | $ | – | | | $ | 4,338,665,623 | | |
Total Convertible
Preferred Stock | | | 15,169,294 | | | | – | | | | – | | | | 15,169,294 | | |
Total Short-Term
Obligation | | | – | | | | 26,257,000 | | | | – | | | | 26,257,000 | | |
| Total Investments | | $ | 4,353,834,917 | | | $ | 26,257,000 | | | $ | – | | | $ | 4,380,091,917 | | |
At February 28, 2010, the Fund held investments in the following sectors:
| Sector (Unaudited) | | % of
Net Assets | |
| Financials | | | 27.8 | | |
| Consumer Discretionary | | | 15.1 | | |
| Industrials | | | 10.8 | | |
| Energy | | | 9.4 | | |
| Information Technology | | | 9.0 | | |
| Utilities | | | 8.1 | | |
| Materials | | | 7.6 | | |
| Health Care | | | 5.9 | | |
| Consumer Staples | | | 4.9 | | |
| Telecommunication Services | | | 0.6 | | |
| | | | 99.2 | | |
| Short-Term Obligation | | | 0.6 | | |
| Other Assets & Liabilities, Net | | | 0.2 | | |
| | | | 100.0 | | |
| Acronym | | Name | |
| ADR | | American Depositary Receipt | |
|
The following table reconciles asset balances for the year ended February 28, 2010, in which significant unobservable inputs (Level 3) were used in determining value:
| Investments in Securities | | Balance as of
February 28, 2009 | | Accrued
Discounts/
(Premiums) | | Realized
Gain (Loss) | | Change in
Unrealized
Appreciation
(Depreciation) | | Net
Purchases
(Sales) | | Net Transfers
into (out of)
Level 3 | | Balance as of
February 28, 2010 | |
| Common Stocks | | $ | 1,058 | | | $ | – | | | $ | 10,796 | | | $ | (1,058 | ) | | $ | (10,796 | ) | | $ | – | | | $ | — | | |
The information in the above reconciliation represents fiscal year to date activity for any securities identified as using Level 3 inputs at either the beginning or the end of the current fiscal period.
For more information on valuation inputs, and their aggregation into the levels used in the tables above, please refer to the Security Valuation section in the accompanying Notes to Financial Statements.
See Accompanying Notes to Financial Statements.
11
Statement of Assets and Liabilities – Columbia Mid Cap Value Fund
February 28, 2010
| | | | | ($) | |
| Assets | | Investments, at identified cost | | | 3,961,326,171 | | |
| | | Investments, at value | | | 4,380,091,917 | | |
| | | Cash | | | 10,607,864 | | |
| | | Receivable for: | | | | | |
| | | Investments sold | | | 105,542,030 | | |
| | | Fund shares sold | | | 4,763,757 | | |
| | | Dividends | | | 6,389,314 | | |
| | | Interest | | | 109 | | |
| | | Trustees' deferred compensation plan | | | 43,824 | | |
| | | Prepaid expenses | | | 46,488 | | |
| | | Other assets | | | 982 | | |
| | | Total Assets | | | 4,507,486,285 | | |
| Liabilities | | Payable for: | | | | | |
| | | Investments purchased | | | 108,343,711 | | |
| | | Fund shares repurchased | | | 6,763,647 | | |
| | | Investment advisory fee | | | 1,764,372 | | |
| | | Administration fee | | | 549,096 | | |
| | | Pricing and bookkeeping fees | | | 12,198 | | |
| | | Transfer agent fee | | | 1,817,044 | | |
| | | Trustees' fees | | | 36,201 | | |
| | | Custody fee | | | 15,220 | | |
| | | Distribution and service fees | | | 563,976 | | |
| | | Chief compliance officer expenses | | | 418 | | |
| | | Reports to shareholders | | | 715,379 | | |
| | | Trustees' deferred compensation plan | | | 43,824 | | |
| | | Other liabilities | | | 57,808 | | |
| | | Total Liabilities | | | 120,682,894 | | |
| | | Net Assets | | | 4,386,803,391 | | |
| Net Assets Consist of | | Paid-in capital | | | 4,955,889,917 | | |
| | | Overdistributed net investment income | | | (48,094 | ) | |
| | | Accumulated net realized loss | | | (987,804,178 | ) | |
| | | Net unrealized appreciation on investments | | | 418,765,746 | | |
| | | Net Assets | | | 4,386,803,391 | | |
See Accompanying Notes to Financial Statements.
12
Statement of Assets and Liabilities – Columbia Mid Cap Value Fund
February 28, 2010 (continued)
| Class A | | Net assets | | $ | 1,441,388,094 | | |
| | | Shares outstanding | | | 128,891,677 | | |
| | | Net asset value per share | | $ | 11.18 | (a) | |
| | | Maximum sales charge | | | 5.75 | % | |
| | | Maximum offering price per share | | $ | 11.86 | (b) | |
| Class B | | Net assets | | $ | 68,110,149 | | |
| | | Shares outstanding | | | 6,226,852 | | |
| | | Net asset value and offering price per share | | $ | 10.94 | (a) | |
| Class C | | Net assets | | $ | 181,941,259 | | |
| | | Shares outstanding | | | 16,572,694 | | |
| | | Net asset value and offering price per share | | $ | 10.98 | (a) | |
| Class R | | Net assets | | $ | 276,045,748 | | |
| | | Shares outstanding | | | 24,694,504 | | |
| | | Net asset value, offering and redemption price per share | | $ | 11.18 | | |
| Class Y (c) | | Net assets | | $ | 12,705 | | |
| | | Shares outstanding | | | 1,136 | | |
| | | Net asset value, offering and redemption price per share | | $ | 11.18 | | |
| Class Z | | Net assets | | $ | 2,419,305,436 | | |
| | | Shares outstanding | | | 216,054,038 | | |
| | | Net asset value, offering and redemption price per share | | $ | 11.20 | | |
(a) Redemption price per share is equal to net asset value less any applicable contingent deferred sales charge.
(b) On sales of $50,000 or more the offering price is reduced.
(c) Class Y shares commenced operations on July 15, 2009.
See Accompanying Notes to Financial Statements.
13
Statement of Operations – Columbia Mid Cap Value Fund
For the Year Ended February 28, 2010
| | | | | ($) | |
| Investment Income | | Dividends | | | 72,354,507 | | |
| | | Interest | | | 405,125 | | |
| | | Foreign taxes withheld | | | (34,214 | ) | |
| | | Total Investment Income | | | 72,725,418 | | |
| Expenses | | Investment advisory fee | | | 20,846,297 | | |
| | | Administration fee | | | 6,437,740 | | |
| | | Distribution fee: | | | | | |
| | | Class B | | | 555,246 | | |
| | | Class C | | | 1,337,147 | | |
| | | Class R | | | 1,054,475 | | |
| | | Service fee: | | | | | |
| | | Class B | | | 183,887 | | |
| | | Class C | | | 443,036 | | |
| | | Distribution and service fees: | | | | | |
| | | Class A | | | 3,275,124 | | |
| | | Pricing and bookkeeping fees | | | 141,991 | | |
| | | Transfer agent fee: | | | | | |
| | | Class A, Class B, Class C, Class R and Class Z | | | 6,514,832 | | |
| | | Class Y (a) | | | 24 | | |
| | | Trustees' fees | | | 41,065 | | |
| | | Custody fee | | | 91,112 | | |
| | | Chief compliance officer expenses | | | 2,217 | | |
| | | Other expenses | | | 1,662,053 | | |
| | | Total Expenses | | | 42,586,246 | | |
| | | Expense reductions | | | (130 | ) | |
| | | Net Expenses | | | 42,586,116 | | |
| | | Net Investment Income | | | 30,139,302 | | |
| Net Realized and Unrealized Gain (Loss) on Investments and Foreign Currency | | Net realized gain (loss) on: | | | | | |
| | | Investments | | | (299,154,368 | ) | |
| | | Foreign currency transactions | | | 6,760 | | |
| | | Net realized loss | | | (299,147,608 | ) | |
| | | Net change in unrealized appreciation (depreciation) on investments | | | 2,039,005,188 | | |
| | | Net Gain | | | 1,739,857,580 | | |
| | | Net Increase Resulting from Operations | | | 1,769,996,882 | | |
(a) Class Y commenced operations on July 15, 2009.
See Accompanying Notes to Financial Statements.
14
Statement of Changes in Net Assets – Columbia Mid Cap Value Fund
| Increase (Decrease) in Net Assets | | | | Year Ended
February 28,
2010 ($) | | Year Ended
February 28,
2009 ($) | |
| Operations | | Net investment income | | | 30,139,302 | | | | 41,960,085 | | |
| | | Net realized loss on investments and foreign
currency transactions | | | (299,147,608 | ) | | | (603,360,021 | ) | |
| | | Net change in unrealized appreciation (depreciation)
on investments | | | 2,039,005,188 | | | | (1,841,821,869 | ) | |
| | | Net increase (decrease) resulting from operations | | | 1,769,996,882 | | | | (2,403,221,805 | ) | |
| Distributions to Shareholders | | From net investment income: | | | | | | | | | |
| | | Class A | | | (9,486,273 | ) | | | (14,592,923 | ) | |
| | | Class B | | | (118,551 | ) | | | (342,482 | ) | |
| | | Class C | | | (283,569 | ) | | | (716,943 | ) | |
| | | Class R | | | (1,055,772 | ) | | | (1,302,697 | ) | |
| | | Class Y (a) | | | (1,968 | ) | | | — | | |
| | | Class Z | | | (19,244,353 | ) | | | (24,983,415 | ) | |
| | | From return of capital: | | | | | | | | | |
| | | Class A | | | (1,179,530 | ) | | | (1,449,913 | ) | |
| | | Class B | | | (14,741 | ) | | | (124,768 | ) | |
| | | Class C | | | (35,259 | ) | | | (246,286 | ) | |
| | | Class R | | | (131,276 | ) | | | (118,045 | ) | |
| | | Class Y (a) | | | (245 | ) | | | — | | |
| | | Class Z | | | (2,392,858 | ) | | | (1,910,378 | ) | |
| | | Total distributions to shareholders | | | (33,944,395 | ) | | | (45,787,850 | ) | |
| | | Net Capital Stock Transactions | | | (131,106,499 | ) | | | 900,396,673 | | |
| | | Increase from regulatory settlements | | | 44,425 | | | | — | | |
| | | Total increase (decrease) in net assets | | | 1,604,990,413 | | | | (1,548,612,982 | ) | |
| Net Assets | | Beginning of period | | | 2,781,812,978 | | | | 4,330,425,960 | | |
| | | End of period | | | 4,386,803,391 | | | | 2,781,812,978 | | |
| | | Overdistributed net investment income
at end of period | | | (48,094 | ) | | | (48,094 | ) | |
(a) Class Y commenced operations on July 15, 2009.
See Accompanying Notes to Financial Statements.
15
Statement of Changes in Net Assets (continued) – Columbia Mid Cap Value Fund
| | | Capital Stock Activity | |
| | | Year Ended
February 28, 2010 | | Year Ended
February 28, 2009 | |
| | | Shares | | Dollars ($) | | Shares | | Dollars ($) | |
| Class A | |
| Subscriptions | | | 34,476,480 | | | | 320,190,001 | | | | 63,025,926 | | | | 710,570,981 | | |
| Distributions reinvested | | | 1,021,407 | | | | 9,544,277 | | | | 1,381,260 | | | | 13,959,126 | | |
| Redemptions | | | (47,315,899 | ) | | | (451,182,983 | ) | | | (51,586,325 | ) | | | (543,348,700 | ) | |
| Net increase (decrease) | | | (11,818,012 | ) | | | (121,448,705 | ) | | | 12,820,861 | | | | 181,181,407 | | |
| Class B | |
| Subscriptions | | | 149,471 | | | | 1,317,009 | | | | 486,582 | | | | 5,324,226 | | |
| Distributions reinvested | | | 13,472 | | | | 120,734 | | | | 49,269 | | | | 424,638 | | |
| Redemptions | | | (3,787,390 | ) | | | (35,177,085 | ) | | | (4,612,237 | ) | | | (49,295,036 | ) | |
| Net decrease | | | (3,624,447 | ) | | | (33,739,342 | ) | | | (4,076,386 | ) | | | (43,546,172 | ) | |
| Class C | |
| Subscriptions | | | 1,973,707 | | | | 18,398,360 | | | | 4,675,275 | | | | 53,297,733 | | |
| Distributions reinvested | | | 26,638 | | | | 240,612 | | | | 80,247 | | | | 692,328 | | |
| Redemptions | | | (6,816,392 | ) | | | (63,647,129 | ) | | | (8,023,598 | ) | | | (84,629,721 | ) | |
| Net decrease | | | (4,816,047 | ) | | | (45,008,157 | ) | | | (3,268,076 | ) | | | (30,639,660 | ) | |
| Class R | |
| Subscriptions | | | 13,682,875 | | | | 137,019,802 | | | | 23,356,150 | | | | 276,733,469 | | |
| Distributions reinvested | | | 123,314 | | | | 1,166,143 | | | | 149,023 | | | | 1,389,675 | | |
| Redemptions | | | (10,264,977 | ) | | | (99,055,533 | ) | | | (5,880,050 | ) | | | (57,901,376 | ) | |
| Net increase | | | 3,541,212 | | | | 39,130,412 | | | | 17,625,123 | | | | 220,221,768 | | |
| Class Y (a) | |
| Subscriptions | | | 207,937 | | | | 1,954,982 | | | | — | | | | — | | |
| Distributions reinvested | | | 7 | | | | 77 | | | | — | | | | — | | |
| Redemptions | | | (206,808 | ) | | | (2,047,085 | ) | | | — | | | | — | | |
| Net increase (decrease) | | | 1,136 | | | | (92,026 | ) | | | — | | | | — | | |
| Class Z | |
| Subscriptions | | | 73,875,293 | | | | 704,601,659 | | | | 103,345,236 | | | | 1,106,675,936 | | |
| Distributions reinvested | | | 1,549,920 | | | | 14,489,725 | | | | 1,705,562 | | | | 17,485,955 | | |
| Redemptions | | | (71,601,663 | ) | | | (689,040,065 | ) | | | (53,426,936 | ) | | | (550,982,561 | ) | |
| Net increase | | | 3,823,550 | | | | 30,051,319 | | | | 51,623,862 | | | | 573,179,330 | | |
(a) Class Y commenced operations on July 15, 2009.
See Accompanying Notes to Financial Statements.
16
Financial Highlights – Columbia Mid Cap Value Fund
Selected data for a share outstanding throughout each period is as follows:
| | | Year Ended February 28, | | Year Ended
February 29, | | Period Ended
February 28, | | Year Ended March 31, | |
| Class A Shares | | 2010 | | 2009 | | 2008 | | 2007 (a) | | 2006 (b) | | 2005 | |
| Net Asset Value, Beginning of Period | | $ | 6.87 | | | $ | 13.12 | | | $ | 15.21 | | | $ | 15.01 | | | $ | 14.02 | | | $ | 12.77 | | |
| Income from Investment Operations: | |
| Net investment income (c) | | | 0.07 | | | | 0.11 | | | | 0.13 | | | | 0.10 | | | | 0.11 | | | | 0.13 | | |
Net realized and unrealized gain (loss)
on investments, foreign currency and
written options | | | 4.32 | | | | (6.25 | ) | | | (1.19 | ) | | | 1.67 | | | | 2.47 | | | | 2.23 | (d) | |
| Total from investment operations | | | 4.39 | | | | (6.14 | ) | | | (1.06 | ) | | | 1.77 | | | | 2.58 | | | | 2.36 | | |
| Less Distributions to Shareholders: | |
| From net investment income | | | (0.07 | ) | | | (0.10 | ) | | | (0.16 | ) | | | (0.06 | ) | | | (0.07 | ) | | | (0.12 | ) | |
| From net realized gains | | | — | | | | — | | | | (0.87 | ) | | | (1.51 | ) | | | (1.52 | ) | | | (1.00 | ) | |
| From return of capital | | | (0.01 | ) | | | (0.01 | ) | | | — | | | | — | | | | — | | | | — | | |
| Total distributions to shareholders | | | (0.08 | ) | | | (0.11 | ) | | | (1.03 | ) | | | (1.57 | ) | | | (1.59 | ) | | | (1.12 | ) | |
| Increase due to capital contributions | | | — | | | | — | | | | — | | | | — | | | | — | | | | 0.01 | | |
| Increase from regulatory settlements | | | — | (e) | | | — | | | | — | | | | — | | | | — | | | | — | | |
| Net Asset Value, End of Period | | $ | 11.18 | | | $ | 6.87 | | | $ | 13.12 | | | $ | 15.21 | | | $ | 15.01 | | | $ | 14.02 | | |
| Total return (f) | | | 64.09 | % | | | (47.05 | )% | | | (7.88 | )% | | | 13.09 | %(g) | | | 20.24 | % | | | 19.90 | %(h) | |
Ratios to Average Net Assets/
Supplemental Data: | |
| Net expenses before interest expense (i) | | | 1.17 | % | | | 1.17 | % | | | 1.10 | % | | | 1.12 | %(j) | | | 1.08 | % | | | 1.20 | % | |
| Interest expense | | | — | | | | — | | | | — | | | | — | | | | — | | | | — | %(k) | |
| Net expenses (i) | | | 1.17 | % | | | 1.17 | % | | | 1.10 | % | | | 1.12 | %(j) | | | 1.08 | % | | | 1.20 | % | |
| Net investment income (i) | | | 0.71 | % | | | 0.97 | % | | | 0.83 | % | | | 0.76 | %(j) | | | 0.80 | % | | | 0.99 | % | |
| Portfolio turnover rate | | | 56 | % | | | 46 | % | | | 24 | % | | | 53 | %(g) | | | 41 | % | | | 61 | % | |
| Net assets, end of period (000s) | | $ | 1,441,388 | | | $ | 966,440 | | | $ | 1,677,414 | | | $ | 1,296,803 | | | $ | 874,429 | | | $ | 10,258 | | |
(a) The Fund changed its fiscal year end from March 31 to February 28. Per share data and total return reflect activity from April 1, 2006 through February 28, 2007.
(b) On August 22, 2005, the Fund's Investor A shares were renamed Class A shares.
(c) Per share data was calculated using the average shares outstanding during the period.
(d) The effect of the investment advisor's reimbursement for the Fund exceeding certain investment restrictions is included in the net realized and unrealized gain (loss) on investments (per share). The effect of this reimbursement was to increase net realized and unrealized gain (loss) on investments by $0.01.
(e) Rounds to less than $0.01 per share.
(f) Total return at net asset value assuming all distributions reinvested and no initial sales charge or contingent deferred sales charge.
(g) Not annualized.
(h) Without the effect of the investment advisor's reimbursement for the Fund exceeding certain investment restrictions, total return would have been 19.81%.
(i) The benefits derived from expense reductions had an impact of less than 0.01%.
(j) Annualized.
(k) Rounds to less than 0.01%.
See Accompanying Notes to Financial Statements.
17
Financial Highlights – Columbia Mid Cap Value Fund
Selected data for a share outstanding throughout each period is as follows:
| | | Year Ended February 28, | | Year Ended
February 29, | | Period Ended
February 28, | | Year Ended March 31, | |
| Class B Shares | | 2010 | | 2009 | | 2008 | | 2007 (a) | | 2006 (b) | | 2005 | |
| Net Asset Value, Beginning of Period | | $ | 6.73 | | | $ | 12.86 | | | $ | 14.94 | | | $ | 14.80 | | | $ | 13.89 | | | $ | 12.70 | | |
| Income from Investment Operations: | |
| Net investment income (c) | | | — | (d) | | | 0.02 | | | | 0.03 | | | | — | (d) | | | 0.01 | | | | 0.03 | | |
Net realized and unrealized gain (loss)
on investments, foreign currency and
written options | | | 4.23 | | | | (6.11 | ) | | | (1.19 | ) | | | 1.65 | | | | 2.43 | | | | 2.20 | (e) | |
| Total from investment operations | | | 4.23 | | | | (6.09 | ) | | | (1.16 | ) | | | 1.65 | | | | 2.44 | | | | 2.23 | | |
| Less Distributions to Shareholders: | |
| From net investment income | | | (0.02 | ) | | | (0.03 | ) | | | (0.05 | ) | | | — | (d) | | | (0.01 | ) | | | (0.05 | ) | |
| From net realized gains | | | — | | | | — | | | | (0.87 | ) | | | (1.51 | ) | | | (1.52 | ) | | | (1.00 | ) | |
| From return of capital | | | — | (d) | | | (0.01 | ) | | | — | | | | — | | | | — | | | | — | | |
| Total distributions to shareholders | | | (0.02 | ) | | | (0.04 | ) | | | (0.92 | ) | | | (1.51 | ) | | | (1.53 | ) | | | (1.05 | ) | |
| Increase due to capital contribution | | | — | | | | — | | | | — | | | | — | | | | — | | | | 0.01 | | |
| Increase from regulatory settlements | | | — | (d) | | | — | | | | — | | | | — | | | | — | | | | — | | |
| Net Asset Value, End of Period | | $ | 10.94 | | | $ | 6.73 | | | $ | 12.86 | | | $ | 14.94 | | | $ | 14.80 | | | $ | 13.89 | | |
| Total return (f) | | | 62.86 | % | | | (47.41 | )% | | | (8.61 | )% | | | 12.36 | %(g) | | | 19.32 | % | | | 18.91 | %(h) | |
Ratios to Average Net Assets/
Supplemental Data: | |
| Net expenses before interest expense (i) | | | 1.92 | % | | | 1.92 | % | | | 1.85 | % | | | 1.87 | %(j) | | | 1.84 | % | | | 1.95 | % | |
| Interest expense | | | — | | | | — | | | | — | | | | — | | | | — | | | | — | %(k) | |
| Net expenses (i) | | | 1.92 | % | | | 1.92 | % | | | 1.85 | % | | | 1.87 | %(j) | | | 1.84 | % | | | 1.95 | % | |
| Net investment income (loss) (i) | | | (0.01 | )% | | | 0.18 | % | | | 0.18 | % | | | (0.02 | )%(j) | | | 0.05 | % | | | 0.24 | % | |
| Portfolio turnover rate | | | 56 | % | | | 46 | % | | | 24 | % | | | 53 | %(g) | | | 41 | % | | | 61 | % | |
| Net assets, end of period (000s) | | $ | 68,110 | | | $ | 66,254 | | | $ | 179,087 | | | $ | 255,123 | | | $ | 312,587 | | | $ | 4,447 | | |
(a) The Fund changed its fiscal year end from March 31 to February 28. Per share data and total return reflect activity from April 1, 2006 through February 28, 2007.
(b) On August 22, 2005, the Fund's Investor B shares were renamed Class B shares.
(c) Per share data was calculated using the average shares outstanding during the period.
(d) Rounds to less than $0.01 per share.
(e) The effect of the investment advisor's reimbursement for the Fund exceeding certain investment restrictions is included in the net realized and unrealized gain (loss) on investments (per share). The effect of this reimbursement was to increase net realized and unrealized gain (loss) on investments by $0.01.
(f) Total return at net asset value assuming all distributions reinvested and no contingent deferred sales charge.
(g) Not annualized.
(h) Without the effect of the investment advisor's reimbursement for the Fund exceeding certain investment restrictions, total return would have been 18.82%.
(i) The benefits derived from expense reductions had an impact of less than 0.01%.
(j) Annualized.
(k) Rounds to less than 0.01%.
See Accompanying Notes to Financial Statements.
18
Financial Highlights – Columbia Mid Cap Value Fund
Selected data for a share outstanding throughout each period is as follows:
| | | Year Ended February 28, | | Year Ended
February 29, | | Period Ended
February 28, | | Year Ended March 31, | |
| Class C Shares | | 2010 | | 2009 | | 2008 | | 2007 (a) | | 2006 (b) | | 2005 | |
| Net Asset Value, Beginning of Period | | $ | 6.75 | | | $ | 12.90 | | | $ | 14.99 | | | $ | 14.84 | | | $ | 13.93 | | | $ | 12.73 | | |
| Income from Investment Operations: | |
| Net investment income (c) | | | — | (d) | | | 0.02 | | | | 0.01 | | | | — | (d) | | | 0.01 | | | | 0.05 | | |
Net realized and unrealized gain (loss)
on investments, foreign currency and
written options | | | 4.25 | | | | (6.13 | ) | | | (1.18 | ) | | | 1.66 | | | | 2.43 | | | | 2.19 | (e) | |
| Total from investment operations | | | 4.25 | | | | (6.11 | ) | | | (1.17 | ) | | | 1.66 | | | | 2.44 | | | | 2.24 | | |
| Less Distributions to Shareholders: | |
| From net investment income | | | (0.02 | ) | | | (0.03 | ) | | | (0.05 | ) | | | — | (d) | | | (0.01 | ) | | | (0.05 | ) | |
| From net realized gains | | | — | | | | — | | | | (0.87 | ) | | | (1.51 | ) | | | (1.52 | ) | | | (1.00 | ) | |
| From return of capital | | | — | (d) | | | (0.01 | ) | | | — | | | | — | | | | — | | | | — | | |
| Total distributions to shareholders | | | (0.02 | ) | | | (0.04 | ) | | | (0.92 | ) | | | (1.51 | ) | | | (1.53 | ) | | | (1.05 | ) | |
| Increase due to capital contributions | | | — | | | | — | | | | — | | | | — | | | | — | | | | 0.01 | | |
| Increase from regulatory settlements | | | — | (d) | | | — | | | | — | | | | — | | | | — | | | | — | | |
| Net Asset Value, End of Period | | $ | 10.98 | | | $ | 6.75 | | | $ | 12.90 | | | $ | 14.99 | | | $ | 14.84 | | | $ | 13.93 | | |
| Total return (f) | | | 62.97 | % | | | (47.42 | )% | | | (8.65 | )% | | | 12.40 | %(g) | | | 19.25 | % | | | 18.97 | %(h) | |
Ratios to Average Net Assets/
Supplemental Data: | |
| Net expenses before interest expense (i) | | | 1.92 | % | | | 1.92 | % | | | 1.85 | % | | | 1.87 | %(j) | | | 1.84 | % | | | 1.95 | % | |
| Interest expense | | | — | | | | — | | | | — | | | | — | | | | — | | | | — | %(k) | |
| Net expenses (i) | | | 1.92 | % | | | 1.92 | % | | | 1.85 | % | | | 1.87 | %(j) | | | 1.84 | % | | | 1.95 | % | |
| Net investment income (loss) (i) | | | (0.03 | )% | | | 0.19 | % | | | 0.07 | % | | | 0.03 | %(j) | | | 0.05 | % | | | 0.36 | % | |
| Portfolio turnover rate | | | 56 | % | | | 46 | % | | | 24 | % | | | 53 | %(g) | | | 41 | % | | | 61 | % | |
| Net assets, end of period (000s) | | $ | 181,941 | | | $ | 144,370 | | | $ | 318,190 | | | $ | 249,067 | | | $ | 123,789 | | | $ | 944 | | |
(a) The Fund changed its fiscal year end from March 31 to February 28. Per share data and total return reflect activity from April 1, 2006 through February 28, 2007.
(b) On August 22, 2005, the Fund's Investor C shares were renamed Class C shares.
(c) Per share data was calculated using the average shares outstanding during the period.
(d) Rounds to less than $0.01 per share.
(e) The effect of the investment advisor's reimbursement for the Fund exceeding certain investment restrictions is included in the net realized and unrealized gain (loss) on investments (per share). The effect of this reimbursement was to increase net realized and unrealized gain (loss) on investments by $0.01.
(f) Total return at net asset value assuming all distributions reinvested and no contingent deferred sales charge.
(g) Not annualized.
(h) Without the effect of the investment advisor's reimbursement for the Fund exceeding certain investment restrictions, total return would have been 18.88%.
(i) The benefits derived from expense reductions had an impact of less than 0.01%.
(j) Annualized.
(k) Rounds to less than 0.01%.
See Accompanying Notes to Financial Statements.
19
Financial Highlights – Columbia Mid Cap Value Fund
Selected data for a share outstanding throughout each period is as follows:
| | | Year Ended
February 28, | | Year Ended
February 29, | | Period Ended
February 28, | | Period Ended
March 31, | |
| Class R Shares | | 2010 | | 2009 | | 2008 | | 2007 (a) | | 2006 (b) | |
| Net Asset Value, Beginning of Period | | $ | 6.87 | | | $ | 13.11 | | | $ | 15.21 | | | $ | 15.01 | | | $ | 14.25 | | |
| Income from Investment Operations: | |
| Net investment income (c) | | | 0.04 | | | | 0.09 | | | | 0.05 | | | | 0.08 | | | | 0.01 | | |
Net realized and unrealized gain (loss)
on investments, foreign currency and
written options | | | 4.33 | | | | (6.24 | ) | | | (1.16 | ) | | | 1.66 | | | | 0.75 | | |
| Total from investment operations | | | 4.37 | | | | (6.15 | ) | | | (1.11 | ) | | | 1.74 | | | | 0.76 | | |
| Less Distributions to Shareholders: | |
| From net investment income | | | (0.05 | ) | | | (0.08 | ) | | | (0.12 | ) | | | (0.03 | ) | | | — | (d) | |
| From net realized gains | | | — | | | | — | | | | (0.87 | ) | | | (1.51 | ) | | | — | | |
| From return of capital | | | (0.01 | ) | | | (0.01 | ) | | | — | | | | — | | | | — | | |
| Total distributions to shareholders | | | (0.06 | ) | | | (0.09 | ) | | | (0.99 | ) | | | (1.54 | ) | | | — | (d) | |
| Increase from regulatory settlements | | | — | (d) | | | — | | | | — | | | | — | | | | — | | |
| Net Asset Value, End of Period | | $ | 11.18 | | | $ | 6.87 | | | $ | 13.11 | | | $ | 15.21 | | | $ | 15.01 | | |
| Total return (e) | | | 63.69 | % | | | (47.13 | )% | | | (8.17 | )% | | | 12.86 | %(f) | | | 5.36 | %(f) | |
Ratios to Average Net Assets/
Supplemental Data: | |
| Net expenses (g) | | | 1.42 | % | | | 1.42 | % | | | 1.35 | % | | | 1.37 | %(h) | | | 1.44 | %(h) | |
| Net investment income (g) | | | 0.44 | % | | | 0.94 | % | | | 0.35 | % | | | 0.61 | %(h) | | | 0.44 | %(h) | |
| Portfolio turnover rate | | | 56 | % | | | 46 | % | | | 24 | % | | | 53 | %(f) | | | 41 | %(f) | |
| Net assets, end of period (000s) | | $ | 276,046 | | | $ | 145,227 | | | $ | 46,252 | | | $ | 7,337 | | | $ | 10 | | |
(a) The Fund changed its fiscal year end from March 31 to February 28. Per share data and total return reflect activity from April 1, 2006 through February 28, 2007.
(b) The Fund's Class R shares commenced operations on January 23, 2006. Per share data and total return reflect activity from that date.
(c) Per share data was calculated using the average shares outstanding during the period.
(d) Rounds to less than $0.01 per share.
(e) Total return at net asset value assuming all distributions reinvested.
(f) Not annualized.
(g) The benefits derived from expense reductions had an impact of less than 0.01%.
(h) Annualized.
See Accompanying Notes to Financial Statements.
20
Financial Highlights – Columbia Mid Cap Value Fund
Selected data for a share outstanding throughout each period is as follows:
| Class Y Shares | | Period Ended
February 28,
2010 (a) | |
| Net Asset Value, Beginning of Period | | $ | 8.86 | | |
| Income from Investment Operations: | |
| Net investment income (b) | | | 0.08 | | |
| Net realized and unrealized gain on investments and foreign currency | | | 2.31 | | |
| Total from investment operations | | | 2.39 | | |
| Less Distributions to Shareholders: | |
| From net investment income | | | (0.06 | ) | |
| From return of capital | | | (0.01 | ) | |
| Total distributions to shareholders | | | (0.07 | ) | |
| Increase from regulatory settlements | | | — | (c) | |
| Net Asset Value, End of Period | | $ | 11.18 | | |
| Total return (d) | | | 27.00 | %(e) | |
| Ratios to Average Net Assets/Supplemental Data: | |
| Net expenses (f) | | | 0.76 | %(g) | |
| Net investment income (f) | | | 1.28 | %(g) | |
| Portfolio turnover rate | | | 56 | %(e) | |
| Net assets, end of period (000s) | | $ | 13 | | |
(a) Class Y shares commenced operations on July 15, 2009. Per share data and total return reflect activity from that date.
(b) Per share data was calculated using the average shares outstanding during the period.
(c) Rounds to less than $0.01 per share.
(d) Total return at net asset value assuming all distributions reinvested.
(e) Not annualized.
(f) The benefits derived from expense reductions had an impact of less than 0.01%.
(g) Annualized.
See Accompanying Notes to Financial Statements.
21
Financial Highlights – Columbia Mid Cap Value Fund
Selected data for a share outstanding throughout each period is as follows:
| | | Year Ended
February 28, | | Year Ended
February 29, | | Period Ended
February 28, | | Year Ended
March 31, | |
| Class Z Shares | | 2010 | | 2009 | | 2008 | | 2007 (a) | | 2006 (b) | | 2005 | |
| Net Asset Value, Beginning of Period | | $ | 6.88 | | | $ | 13.13 | | | $ | 15.23 | | | $ | 15.03 | | | $ | 14.04 | | | $ | 12.79 | | |
| Income from Investment Operations: | |
| Net investment income (c) | | | 0.09 | | | | 0.14 | | | | 0.17 | | | | 0.13 | | | | 0.13 | | | | 0.16 | | |
Net realized and unrealized gain (loss)
on investments, foreign currency and
written options | | | 4.33 | | | | (6.25 | ) | | | (1.21 | ) | | | 1.68 | | | | 2.49 | | | | 2.23 | (d) | |
| Total from investment operations | | | 4.42 | | | | (6.11 | ) | | | (1.04 | ) | | | 1.81 | | | | 2.62 | | | | 2.39 | | |
| Less Distributions to Shareholders: | |
| From net investment income | | | (0.09 | ) | | | (0.13 | ) | | | (0.19 | ) | | | (0.10 | ) | | | (0.11 | ) | | | (0.15 | ) | |
| From net realized gains | | | — | | | | — | | | | (0.87 | ) | | | (1.51 | ) | | | (1.52 | ) | | | (1.00 | ) | |
| From return of capital | | | (0.01 | ) | | | (0.01 | ) | | | — | | | | — | | | | — | | | | — | | |
| Total distributions to shareholders | | | (0.10 | ) | | | (0.14 | ) | | | (1.06 | ) | | | (1.61 | ) | | | (1.63 | ) | | | (1.15 | ) | |
| Increase due to capital contributions | | | — | | | | — | | | | — | | | | — | | | | — | | | | 0.01 | | |
| Increase from regulatory settlements | | | — | (e) | | | — | | | | — | | | | — | | | | — | | | | — | | |
| Net Asset Value, End of Period | | $ | 11.20 | | | $ | 6.88 | | | $ | 13.13 | | | $ | 15.23 | | | $ | 15.03 | | | $ | 14.04 | | |
| Total return (f) | | | 64.55 | % | | | (46.87 | )% | | | (7.70 | )% | | | 13.36 | %(g) | | | 20.49 | % | | | 20.16 | %(h) | |
Ratios to Average Net Assets/
Supplemental Data: | |
Net expenses before
interest expense (i) | | | 0.92 | % | | | 0.92 | % | | | 0.85 | % | | | 0.87 | %(j) | | | 0.84 | % | | | 0.95 | % | |
| Interest expense | | | — | | | | — | | | | — | | | | — | | | | — | | | | — | %(k) | |
| Net expenses (i) | | | 0.92 | % | | | 0.92 | % | | | 0.85 | % | | | 0.87 | %(j) | | | 0.84 | % | | | 0.95 | % | |
| Net investment income (i) | | | 0.95 | % | | | 1.23 | % | | | 1.10 | % | | | 1.00 | %(j) | | | 0.94 | % | | | 1.24 | % | |
| Portfolio turnover rate | | | 56 | % | | | 46 | % | | | 24 | % | | | 53 | %(g) | | | 41 | % | | | 61 | % | |
| Net assets, end of period (000s) | | $ | 2,419,305 | | | $ | 1,459,522 | | | $ | 2,109,483 | | | $ | 1,758,133 | | | $ | 1,415,664 | | | $ | 591,318 | | |
(a) The Fund changed its fiscal year end from March 31 to February 28. Per share data and total return reflect activity from April 1, 2006 through February 28, 2007.
(b) On August 22, 2005, the Fund's Primary A shares were renamed Class Z shares.
(c) Per share data was calculated using the average shares outstanding during the period.
(d) The effect of the investment advisor's reimbursement for the Fund exceeding certain investment restrictions is included in the net realized and unrealized gain (loss) on investments (per share). The effect of this reimbursement was to increase net realized and unrealized gain (loss) on investments by $0.01.
(e) Rounds to less than $0.01 per share.
(f) Total return at net asset value assuming all distributions reinvested.
(g) Not annualized.
(h) Without the effect of the investment advisor's reimbursement for the Fund exceeding certain investment restrictions, total return would have been 20.07%.
(i) The benefits derived from expense reductions had an impact of less than 0.01%.
(j) Annualized.
(k) Rounds to less than 0.01%.
See Accompanying Notes to Financial Statements.
22
Notes to Financial Statements – Columbia Mid Cap Value Fund
February 28, 2010
Note 1. Organization
Columbia Mid Cap Value Fund (the "Fund"), a series of Columbia Funds Series Trust (the "Trust"), is a diversified fund. The Trust is registered under the Investment Company Act of 1940, as amended (the "1940 Act"), as an open-end management investment company organized as a Delaware statutory trust.
Investment Objective
The Fund seeks long-term capital appreciation.
Fund Shares
The Trust may issue an unlimited number of shares, and the Fund offers six classes of shares: Class A, Class B, Class C, Class R, Class Y and Class Z shares. Each share class has its own expense structure and sales charges, as applicable. Class Y shares commenced operations effective July 15, 2009. Effective June 22, 2009, the Fund no longer accepts investments from new or existing investors in the Fund's Class B shares, except in connection with the reinvestment of any dividend and/or capital gain distributions in Class B shares of the Fund and exchanges by existing Class B shareholders of the other Columbia Funds.
Class A shares are subject to a maximum front-end sales charge of 5.75% based on the amount of initial investment. Class A shares purchased without an initial sales charge in accounts aggregating $1 million to $50 million at the time of purchase are subject to a 1.00% contingent deferred sales charge ("CDSC") if the shares are sold within one year after purchase. Class B shares are subject to a maximum CDSC of 5.00% based upon the holding period after purchase. Class B shares will convert to Class A shares eight years after purchase. Class C shares are subject to a 1.00% CDSC on shares sold within one year after purchase. Class R, Class Y and Class Z shares are offered continuously at net asset value. There are certain restrictions on the purchase of Class R, Class Y and Class Z shares, as described in the Fund's prospectuses.
Note 2. Significant Accounting Policies
The preparation of financial statements in accordance with accounting principles generally accepted in the United States of America ("GAAP") requires management to make certain estimates and assumptions that affect the reported amounts of assets and liabilities, the disclosure of contingent assets and liabilities at the date of the financial statements and the reported amounts of revenue and expenses during the reporting period. Actual results could differ from those estimates.
The following is a summary of significant accounting policies consistently followed by the Fund in the preparation of its financial statements.
Security Valuation
Equity securities are valued at the last sale price on the principal exchange on which they trade, except for securities traded on the NASDAQ, which are valued at the NASDAQ official close price. Unlisted securities or listed securities for which there were no sales during the day are valued at the closing bid price on such exchanges or over-the-counter markets.
Short-term investments maturing in 60 days or less are valued at amortized cost, which approximates market value.
Investments for which market quotations are not readily available, or that have quotations which management believes are not reliable, are valued at fair value as determined in good faith under consistently applied procedures established by and under the general supervision of the Board of Trustees. If a security is valued at fair value, such value is likely to be different from the last quoted market price for the security. The determination of fair value often requires significant judgment. To determine fair value, management may use assumptions including but not limited to future cash flows and estimated risk premiums. Multiple inputs from various sources may be used to determine value.
GAAP establishes a hierarchy that prioritizes the inputs to valuation techniques used to measure fair value giving the highest priority to unadjusted quoted prices in active markets for identical securities (level 1 measurements) and the lowest priority to unobservable inputs (level 3 measurements) when market prices are not readily available or reliable. The three levels of the fair value hierarchy are described below:
• Level 1 – quoted prices in active markets for identical securities
• Level 2 – prices determined using other significant observable inputs (including quoted prices for similar securities, interest rates, prepayment speeds, credit risk and others)
23
Columbia Mid Cap Value Fund, February 28, 2010
• Level 3 – prices determined using significant unobservable inputs. In situations where quoted prices or observable inputs are unavailable or less reliable, unobservable inputs may be used. Unobservable inputs may include management's own assumptions about the factors market participants would use in pricing an investment.
The inputs or methodology used for valuing securities are not necessarily an indication of the risk associated with investing in those securities.
Security Transactions
Security transactions are accounted for on the trade date. Cost is determined and gains (losses) are based upon the specific identification method for both financial statement and federal income tax purposes.
Repurchase Agreements
The Fund may engage in repurchase agreement transactions with institutions that Columbia Management Advisors, LLC ("Columbia"), the Fund's investment advisor, has determined are creditworthy. The Fund, through its custodian, receives delivery of the underlying securities collateralizing a repurchase agreement. Columbia is responsible for determining that the collateral is at least equal, at all times, to the value of the repurchase obligation including interest. A repurchase agreement transaction involves certain risks in the event of default or insolvency of the counterparty. These risks include possible delays in or restrictions on the Fund's ability to dispose of the underlying securities and a possible decline in the value of the underlying securities during the period while the Fund seeks to assert its rights.
Income Recognition
Interest income is recorded on the accrual basis. Premium and discount are amortized and accreted, respectively, on all debt securities, unless otherwise noted.
Corporate actions and dividend income are recorded on the ex-date.
Distributions received from real estate investment trusts (REITs) in excess of their income are recorded as a reduction of the cost of the related investments. If the Fund no longer owns the applicable securities, any distributions received in excess of income are recorded as realized gains.
Expenses
General expenses of the Trust are allocated to the Funds and other series of the Trust based upon relative net assets or other expense allocation methodologies determined by the nature of the expense. Expenses directly attributable to a specific class of shares are charged to that share class. Expenses directly attributable to a Fund are charged to such Fund.
Determination of Class Net Asset Value
All income, expenses (other than class-specific expenses, as shown on the Statement of Operations) and realized and unrealized gains (losses) are allocated to each class of the Fund on a daily basis for purposes of determining the net asset value of each class. Income and expenses are allocated to each class based on the settled shares method, while realized and unrealized gains (losses) are allocated based on the relative net assets of each class.
Federal Income Tax Status
The Fund intends to qualify each year as a "regulated investment company" under Subchapter M of the Internal Revenue Code, as amended, and will distribute substantially all of its taxable income, if any, for its tax year, and as such will not be subject to federal income taxes. In addition, the Fund intends to distribute in each calendar year substantially all of its net investment income, capital gains and certain other amounts, if any, such that the Fund should not be subject to federal excise tax. Therefore, no provision is made for federal income or excise taxes.
Distributions to Shareholders
Distributions from net investment income are declared and paid quarterly. Net realized capital gains, if any, are distributed at least annually. Income distributions and capital gain distributions are determined in accordance with federal income tax regulations which may differ from GAAP.
24
Columbia Mid Cap Value Fund, February 28, 2010
Indemnification
In the normal course of business, the Fund enters into contracts that contain a variety of representations and warranties and which provide general indemnities. The Fund's maximum exposure under these arrangements is unknown because this would involve future claims against the Fund. Also, under the Trust's organizational documents and by contract, the Trustees and officers of the Trust are indemnified against certain liabilities that may arise out of actions relating to their duties to the Trust. However, based on experience, the Fund expects the risk of loss due to these representations, warranties and indemnities to be minimal.
Note 3. Federal Tax Information
The timing and character of income and capital gain distributions are determined in accordance with income tax regulations, which may differ from GAAP. Reclassifications are made to the Fund's capital accounts for permanent tax differences to reflect income and gains available for distribution (or available capital loss carryforwards) under income tax regulations.
For the year ended February 28, 2010, permanent book and tax basis differences resulting primarily from differing treatments for foreign currency transactions and proceeds received from litigation settlements were identified and reclassified among the components of the Fund's net assets as follows:
Undistributed
Net Investment
Income | | Accumulated
Net Realized
Loss | | Paid-In Capital | |
| $ | 51,184 | | | $ | (6,761 | ) | | $ | (44,423 | ) | |
Net investment income and net realized gains (losses), as disclosed on the Statement of Operations, and net assets were not affected by this reclassification.
The tax character of distributions paid during the years ended February 28, 2010 and February 28, 2009 was as follows:
| | | February 28,
2010 | | February 28,
2009 | |
| Distributions paid from: | | | | | |
| Ordinary Income* | | $ | 30,190,486 | | | $ | 41,938,460 | | |
| Tax Return of Capital | | | 3,753,909 | | | | 3,849,390 | | |
* For tax purposes short-term capital gain distributions, if any, are considered ordinary income distributions.
As of February 28, 2010, the components of distributable earnings on a tax basis were as follows:
Undistributed
Ordinary Income | | Undistributed
Long-Term
Capital Gains | | Net Unrealized
Appreciation* | |
| $ | — | | | $ | — | | | $ | 411,916,010 | | |
* The differences between book-basis and tax-basis net unrealized appreciation are primarily due to deferral of losses from wash sales.
Unrealized appreciation and depreciation at February 28, 2010, based on cost of investments for federal income tax purposes were:
| Unrealized appreciation | | $ | 710,430,792 | | |
| Unrealized depreciation | | | (298,514,782 | ) | |
| Net unrealized appreciation | | $ | 411,916,010 | | |
The following capital loss carryforwards may be available to reduce taxable income arising from future net realized gains on investments, if any, to the extent permitted by the Internal Revenue Code:
| Year of Expiration | | Capital Loss
Carryforwards | |
| 2017 | | $ | 311,073,387 | | |
| 2018 | | | 602,735,614 | | |
| | | $ | 913,809,001 | | |
25
Columbia Mid Cap Value Fund, February 28, 2010
Under current tax rules, certain currency and capital losses realized after October 31 may be deferred and treated as occurring on the first day of the following fiscal year. As of February 28, 2010, post-October capital losses of $67,145,441 attributed to security transactions were deferred to March 1, 2010.
Management is required to determine whether a tax position of the Fund is more likely than not to be sustained upon examination by the applicable taxing authority, including resolution of any related appeals or litigation processes, based on the technical merits of the position. The tax benefit to be recognized by the Fund is measured as the largest amount of benefit that is greater than fifty percent likely of being realized upon ultimate settlement. Management is not aware of any tax positions for which it is reasonably possible that the total amounts of unrecognized tax benefits will significantly change in the next twelve months. However, management's conclusions may be subject to review and adjustment at a later date based on factors including, but not limited to, new tax laws, regulations, and administrative interpretations (including relevant court decisions). The Fund's federal tax returns for the prior three fiscal year s remain subject to examination by the Internal Revenue Service.
Note 4. Fees and Compensation Paid to Affiliates
Investment Advisory Fee
Columbia, an indirect, wholly owned subsidiary of Bank of America Corporation ("BOA"), provides investment advisory services to the Fund. Columbia receives a monthly investment advisory fee based on the Fund's average daily net assets at the following annual rates:
| Average Daily Net Assets | | Annual Fee Rate | |
| First $500 million | | | 0.65 | % | |
| $500 million to $1 billion | | | 0.60 | % | |
| $1 billion to $1.5 billion | | | 0.55 | % | |
| Over $1.5 billion | | | 0.50 | % | |
For the year ended February 28, 2010, the Fund's effective investment advisory fee rate was 0.54% of the Fund's average daily net assets.
Bank of America, N.A., an indirect parent company of Columbia, entered into an agreement dated September 29, 2009, to sell a portion of the asset management business of Columbia Management Group, LLC to Ameriprise Financial, Inc. ("Ameriprise Financial"). The transaction ("Transaction") includes the sale of the part of the asset management business that advises long-term mutual funds, including the Fund. The Transaction is subject to certain approvals and other conditions to closing, and is currently expected to close on or about May 1, 2010 (the "Closing"). In connection with the Closing, certain changes will occur, including a change in the entities serving as the investment advisor, administrator, distributor and transfer agent of the Fund. RiverSource Investments, LLC (the "New Advisor"), a subsidiary of Ameriprise Financial, will become the investment advisor of the Fund upon the Closing. The New Advisor will serve as inves tment advisor under a new investment management services agreement effective upon the closing. The New Advisor expects to change its name to Columbia Management Investment Advisers, LLC upon or shortly after the Closing. Effective upon the Closing, as the context requires, references to Columbia shall be deemed to refer to the New Advisor.
Administration Fee
Columbia provides administrative and other services to the Fund for a monthly administration fee at the annual rate of 0.17% of the Fund's average daily net assets, less the fees payable by the Fund as described under the Pricing and Bookkeeping Fees note below.
The New Advisor will become the administrator of the Fund under a new administrative services agreement effective upon the Closing.
Pricing and Bookkeeping Fees
The Fund has entered into a Financial Reporting Services Agreement (the "Financial Reporting Services Agreement") with State Street Bank and Trust Company ("State Street") and Columbia pursuant to which State Street provides financial reporting services to the Fund. The Fund has also entered into an Accounting Services Agreement (collectively with the Financial Reporting Services Agreement, the "State Street Agreements") with State Street and Columbia pursuant to which State Street provides accounting services to the Fund. Under the State Street Agreements, the Fund pays State
26
Columbia Mid Cap Value Fund, February 28, 2010
Street an annual fee of $38,000 paid monthly plus an additional monthly fee based on an annualized percentage rate of average daily net assets of the Fund for the month. The aggregate fee will not exceed $140,000 per year (exclusive of out-of-pocket expenses and charges). The Fund also reimburses State Street for certain out-of-pocket expenses and charges.
Among other updates to the State Street Agreements, Columbia will assign and delegate its rights and obligations thereunder to the New Advisor upon the Closing.
The Fund has entered into a Pricing and Bookkeeping Oversight and Services Agreement (the "Services Agreement") with Columbia. Under the Services Agreement, Columbia provides services related to Fund expenses and the requirements of the Sarbanes-Oxley Act of 2002, and provides oversight of the accounting and financial reporting services provided by State Street. Under the Services Agreement, the Fund reimburses Columbia for out-of-pocket expenses and charges, including fees payable to third parties, such as for pricing the Fund's portfolio securities, incurred by Columbia in the performance of services under the Services Agreement.
The Services Agreement will be terminated upon the Closing, and the services provided thereunder will be covered under the administrative services agreement with the New Advisor.
Transfer Agent Fee
Columbia Management Services, Inc. (the "Transfer Agent"), an affiliate of Columbia and an indirect, wholly owned subsidiary of BOA, provides shareholder services to the Fund and has contracted with Boston Financial Data Services ("BFDS") to serve as sub-transfer agent.
The Fund pays a monthly fee to the Transfer Agent for its services. All share classes, with the exception of Class Y shares (the "Other Share Classes") pay a monthly service fee (the "aggregate fee") based on the following:
(i) Effective January 1, 2010, an annual rate of $22.36 is applied to the aggregate number of accounts for the Other Share Classes. Prior to January 1, 2010, the annual rate was $17.34 per account.
(ii) An allocated portion of fees for wire, telephone and redemption orders, Individual Retirement Account ("IRA") trustee agent fees and account transcript fees due to the Transfer Agent from shareholders of the Fund and credits (net of bank charges) earned with respect to balances in accounts the Transfer Agent maintains in connection with its services to the Fund. The Transfer Agent also receives reimbursement for certain out-of-pocket expenses.
The aggregate fee is allocated to the Other Share Classes based on the relative average daily net assets of each share class.
Class Y shares of the Fund pay a monthly service fee based on the following:
(i) Effective January 1, 2010, an annual rate of $22.36 is applied to the aggregate number of accounts for Class Y shares. Prior to January 1, 2010, the annual rate was $17.34 per account.
(ii) An allocated portion of fees for wire, telephone and redemption orders, IRA trustee agent fees and account transcript fees due to the Transfer Agent from shareholders of the Fund and credits (net of bank charges) earned with respect to balances in accounts the Transfer Agent maintains in connection with its services to the Fund. The Transfer Agent also receives reimbursement for certain out-of-pocket expenses.
The Transfer Agent is also entitled to receive reimbursement of certain sub-transfer agent fees paid by the Transfer Agent (exclusive of BFDS fees), calculated based on the combined assets held in the Other Share Classes in omnibus accounts and intended to recover the cost of payments to other parties (including affiliates of BOA) for services to those accounts. Such fees are allocated to the Other Share Classes based on the relative average daily net assets of each share class. The Transfer Agent pays the fees of BFDS for services as sub-transfer agent and is not entitled to reimbursement for such fees from the Fund.
An annual minimum account balance fee of $20 may apply to certain accounts with a value below the Fund's initial minimum investment requirements to reduce the impact of small accounts on transfer agent fees. These minimum account balance fees are recorded as part of expense reductions on the Statement of Operations. For the year ended February 28, 2010, no minimum account balance fees were charged by the Fund.
27
Columbia Mid Cap Value Fund, February 28, 2010
RiverSource Service Corporation (the "New Transfer Agent"), a subsidiary of Ameriprise Financial, will become the transfer agent of the Fund upon the Closing. The New Transfer Agent expects to change its name to Columbia Management Investment Services Corp. upon or shortly after the Closing.
Underwriting Discounts, Service and Distribution Fees
Columbia Management Distributors, Inc. (the "Distributor"), an affiliate of Columbia and an indirect, wholly owned subsidiary of BOA, is the principal underwriter of the Fund's shares. For the year ended February 28, 2010, the Distributor has retained net underwriting discounts of $41,302 on sales of the Fund's Class A shares and received net CDSC fees of $4,326, $88,854 and $20,739 on Class A, Class B and Class C share redemptions, respectively.
RiverSource Fund Distributors, Inc. (the "New Distributor"), a subsidiary of Ameriprise Financial, will become the distributor of the Fund upon the Closing. The New Distributor expects to change its name to Columbia Management Investment Distributors, Inc. upon or shortly after the Closing.
The Trust has adopted shareholder servicing plans and distribution plans for the Class B and Class C shares of the Fund and a combined distribution and shareholder servicing plan for the Class A shares of the Fund. The Trust has also adopted a distribution plan for the Class R shares of the Fund. The shareholder servicing plans permit the Fund to compensate or reimburse servicing agents for the shareholder services they have provided. The distribution plans, adopted pursuant to Rule 12b-1 under the 1940 Act, permit the Fund to compensate or reimburse the Distributor and/or selling agents for activities or expenses primarily intended to result in the sale of the classes' shares. Payments are made at an annual rate and paid monthly, as a percentage of average daily net assets, set from time to time by the Board of Trustees, and are charged as expenses of the Fund directly to the applicable share class. A substantial portion of the expenses incurred pursuant to these plans is paid to affiliates of BOA and the Distributor.
The annual rates in effect and plan limits, as a percentage of average daily net assets are as follows:
| | | Current
Rate | | Plan
Limit | |
Class A Combined Distribution
and Shareholder Servicing Plan | | | 0.25 | % | | | 0.25 | % | |
Class B and Class C Shareholder
Servicing Plans | | | 0.25 | % | | | 0.25 | % | |
Class B and Class C
Distribution Plans | | | 0.75 | % | | | 0.75 | % | |
| Class R Distribution Plan | | | 0.50 | % | | | 0.50 | % | |
Expense Limits and Fee Waivers
Effective May 1, 2009, Columbia has voluntarily agreed to reimburse a portion of the Fund's expenses so that the Fund's ordinary operating expenses (excluding any distribution and service fees, brokerage commissions, interest, taxes and extraordinary expenses, but including custodian charges relating to overdrafts, if any) after giving effect to any balance credits from the Fund's custodian, do not exceed the annual rate of 1.05% of the Fund's average daily net assets. Columbia, in its discretion, may revise or discontinue this arrangement at any time.
Fees Paid to Officers and Trustees
All officers of the Fund are employees of Columbia or its affiliates and, with the exception of the Fund's Chief Compliance Officer, receive no compensation from the Fund. The Board of Trustees has appointed a Chief Compliance Officer to the Fund in accordance with federal securities regulations. The Fund, along with other affiliated funds, pays its pro-rata share of the expenses associated with the Chief Compliance Officer. The Fund's expenses for the Chief Compliance Officer will not exceed $15,000 per year.
Trustees are compensated for their services to the Fund, as set forth on the Statement of Operations. The Trust's eligible Trustees may participate in a non-qualified deferred compensation plan which may be terminated at any time. Any payments to plan participants are paid solely out of the Fund's assets. Income earned on the plan participant's deferral
28
Columbia Mid Cap Value Fund, February 28, 2010
account is based on the rate of return of the eligible mutual funds selected by the participant or, if no funds are selected, on the rate of return of Columbia Treasury Reserves, another portfolio of the Trust. The expense for the deferred compensation plan, which includes trustees' fees deferred during the current period as well as any gains or losses on the trustees' deferred compensation balances as a result of market fluctuations, is included in "Trustees' fees" on the Statement of Operations. The liability for the deferred compensation plan is included in "Trustees' fees" on the Statement of Assets and Liabilities.
Other Related Party Transactions
In connection with the purchase and sale of its securities during the period, the Fund used one or more brokers that are affiliates of BOA. Total brokerage commissions paid to affiliated brokers for the year ended February 28, 2010 was $31,459.
Note 5. Custody Credits
The Fund has an agreement with its custodian bank under which custody fees may be reduced by balance credits. These credits are recorded as part of expense reductions on the Statement of Operations. The Fund could have invested a portion of the assets utilized in connection with the expense offset arrangement in an income-producing asset if it had not entered into such an agreement.
For the year ended February 28, 2010, these custody credits reduced total expenses by $130 for the Fund.
Note 6. Portfolio Information
For the year ended February 28, 2010, the cost of purchases and proceeds from sales of securities, excluding short-term obligations, for the Fund were $2,091,800,617 and $2,192,413,446, respectively.
Note 7. Regulatory Settlements
During the year ended February 28, 2010, the Fund received payments totaling $44,425 relating to certain regulatory settlements with third parties that the Fund had participated in during the year. The payments have been included in "Increase from regulatory settlements" on the Statement of Changes in Net Assets.
Note 8. Line of Credit
The Fund and other affiliated funds participate in a $280,000,000 committed, unsecured revolving line of credit provided by State Street. The maximum amount that may be borrowed by any fund is limited to the lesser of $200,000,000 and the Fund's borrowing limit set forth in the Fund's registration statement. Borrowings are available for short-term liquidity or temporary or emergency purposes.
Effective October 15, 2009, interest is charged to each participating fund based on the fund's borrowings at a rate per annum equal to the greater of the Federal Funds Rate plus 1.25% or the overnight LIBOR Rate plus 1.25%. In addition, a commitment fee of 0.15% per annum is accrued and apportioned among the participating funds pro rata based on their relative net assets.
Prior to October 15, 2009, interest was charged to each participating fund based on the fund's borrowings at a rate per annum equal to the greater of the Federal Funds Rate plus 0.50% or the overnight LIBOR Rate plus 0.50%. In addition, an annual operations agency fee of $20,000, an amendment fee of 0.02% and a commitment fee of 0.12% per annum were accrued and apportioned among the participating funds pro rata based on their relative net assets.
For the year ended February 28, 2010, the Fund did not borrow under these arrangements.
Note 9. Securities Lending
The Fund may lend its securities to certain approved brokers, dealers and other financial institutions. Each loan is collateralized by cash, in an amount at least equal to the market value of the securities loaned plus accrued income from the investment of collateral. The market value of the loaned securities is determined at the close of business of the Fund and any additional required collateral is delivered to the Fund on the next business day. The collateral received is invested and the income generated by the investment of the collateral, net of any fees remitted to State Street as the lending agent and borrower rebates, is paid to the Fund. Generally, in the event of borrower default, the Fund has the right to use the collateral to offset any losses incurred. In the event the Fund is delayed or prevented from exercising its right to dispose of the collateral, there may be a potential loss to the Fund. The Fund bears the ri sk of loss with respect to the investment of collateral.
29
Columbia Mid Cap Value Fund, February 28, 2010
For the year ended February 28, 2010, the Fund did not participate in the securities lending program.
Note 10. Shares of Beneficial Interest
As of February 28, 2010, 18.2% of the Fund's shares outstanding were beneficially owned by two participant accounts over which BOA and/or any of its affiliates had either sole or joint investment discretion.
As of February 28, 2010, the Fund had two shareholders that held 11.4% of the shares outstanding, over which BOA and/or any of its affiliates did not have investment discretion.
As of February 28, 2010, no other shareholders owned more than 5% of the outstanding shares of the Fund.
Subscription and redemption activity of these accounts may have a significant effect on the operations of the Fund.
Note 11. Significant Risks and Contingencies
Legal Proceedings
Columbia Management Advisors, LLC and Columbia Management Distributors, Inc. (collectively, the "Columbia Group") are subject to a settlement agreement with the New York Attorney General ("NYAG") (the "NYAG Settlement") and a settlement order with the Securities and Exchange Commission ("SEC") (the "SEC Order") on matters relating to mutual fund trading, each dated February 9, 2005. Under the terms of the SEC Order, the Columbia Group (or predecessor or affiliated entities) agreed, among other things, to: pay disgorgement and civil money penalties collectively totaling $375 million; cease and desist from violations of the antifraud provisions and certain other provisions of the federal securities laws; maintain certain compliance and ethics oversight structures; and retain an independent consultant to review the Columbia Group's applicable supervisory, compliance, control and other policies and procedures. The NYAG Settlement, a mong other things, requires Columbia Management Advisors, LLC and its affiliates to make certain disclosures to investors relating to expenses. In connection with the Columbia Group providing services to the Columbia Funds, the Columbia Funds have voluntarily undertaken to implement certain governance measures designed to maintain the independence of their boards of trustees and certain special consulting and compliance measures.
Pursuant to the SEC Order and related procedures, the $375 million in settlement amounts described above, of which approximately $90 million has been earmarked for certain Columbia Funds and their shareholders, is being distributed in accordance with a distribution plan developed by an independent distribution consultant and approved by the SEC on December 27, 2007. Distributions under the distribution plan began in mid-June 2008 and the distribution earmarked for the Columbia Funds and their shareholders has been substantially completed.
Civil Litigation
In connection with the events that resulted in the NYAG Settlement and SEC Order, various parties filed suits against Bank of America Corporation and certain of its affiliates, including Banc of America Capital Management, LLC ("BACAP," now known as Columbia Management Advisors, LLC) and BACAP Distributors, LLC (now known as Columbia Management Distributors, Inc.) (collectively "BAC"), Nations Funds Trust (now known as Columbia Funds Series Trust) and its Board of Trustees. On February 20, 2004, the Judicial Panel on Multidistrict Litigation transferred these cases and cases against other mutual fund companies based on similar allegations to the United States District Court in Maryland for consolidated or coordinated pretrial proceedings (the "MDL"). Subsequently, additional related cases were transferred to the MDL. On September 29, 2004, the plaintiffs in the MDL filed amended and consolidated complaints. One of these amended complaints is a putative class action that includes claims under the federal securities laws and state common law, and that names Nations Funds Trust, the Trustees, BAC and others as defendants. Another of the amended complaints is a derivative action purportedly on behalf of the Nations Funds Trust against BAC and others that asserts claims under federal securities laws and state common law. Nations Funds Trust is a nominal defendant in this action.
On February 25, 2005, BAC and other defendants filed motions to dismiss the claims in the pending cases. On December 15, 2005, BAC and others entered into a Stipulation of Settlement of the direct and derivative claims brought on behalf of the Nations Funds shareholders. The settlement is subject to court approval. If the settlement is approved, BAC would pay settlement administration costs and fees to plaintiffs' counsel as approved by the court. The stipulation has not yet been presented to the court for approval.
30
Columbia Mid Cap Value Fund, February 28, 2010
Note 12. Subsequent Events
In connection with the preparation of the financial statements of the Fund as of and for the fiscal year ended February 28, 2010, events and transactions through the date the financial statements were issued have been evaluated by the Fund's management for possible adjustment and/or disclosure. No subsequent events or transactions had occurred that would require adjustment of the financial statements as presented. On March 3, 2010, the Fund's shareholders approved, among other matters, a proposed investment management services agreement with the New Advisor, the effectiveness of which is conditioned on the Closing.
31
Report of Independent Registered Public Accounting Firm
To the Trustees of Columbia Funds Series Trust and the Shareholders of Columbia Mid Cap Value Fund
In our opinion, the accompanying statement of assets and liabilities, including the investment portfolio, and the related statements of operations and of changes in net assets and the financial highlights present fairly, in all material respects, the financial position of Columbia Mid Cap Value Fund (the "Fund") (a series of Columbia Funds Series Trust) at February 28, 2010, the results of its operations, the changes in its net assets and the financial highlights for each of the periods indicated, in conformity with accounting principles generally accepted in the United States of America. These financial statements and financial highlights (hereafter referred to as "financial statements") are the responsibility of the Fund's management. Our responsibility is to express an opinion on these financial statements based on our audits. We conducted our audits of these financial statements in accordance with the standards of the Public Company Accounting Oversight Board (United States). Those standards require that we plan and perform the audit to obtain reasonable assurance about whether the financial statements are free of material misstatement. An audit includes examining, on a test basis, evidence supporting the amounts and disclosures in the financial statements, assessing the accounting principles used and significant estimates made by management, and evaluating the overall financial statement presentation. We believe that our audits, which included confirmation of securities at February 28, 2010 by correspondence with the custodian and brokers, provide a reasonable basis for our opinion.
PricewaterhouseCoopers LLP
Boston, Massachusetts
April 21, 2010
32
Federal Income Tax Information (Unaudited) – Columbia Mid Cap Value Fund
For non-corporate shareholders, 100.00% or the maximum amount allowable under the Jobs and Growth Tax Relief Reconciliation Act of 2003, of the ordinary income distributed by the Fund for the fiscal year ended February 28, 2010 may represent qualified dividend income.
100.00% of the ordinary income distributed by the Fund for the fiscal year ended February 28, 2010, qualifies for the corporate dividends received deduction.
The Fund will notify shareholders in January 2011 of amounts for use in preparing 2010 income tax returns.
33
Fund Governance
The Trustees serve terms of indefinite duration. The names, addresses and ages of the Trustees and officers of the Funds of Columbia Funds Series Trust, the year each was first elected or appointed to office, their principal business occupations during at least the last five years, the number of Funds overseen by each Trustee and other directorships they hold are shown below. Each officer listed below serves as an officer of each Fund in the Columbia Funds Complex.
Independent Trustees
Name, Address and Age,
Position with Funds, Year First
Elected or Appointed to Office | | Principal Occupation(s) During Past Five Years, Number of Funds in the Columbia
Funds Complex Overseen by Trustee, Other Directorships Held
| |
| Edward J. Boudreau (Born 1944) | |
|
c/o Columbia Management
Advisors, LLC
One Financial Center
Boston, MA 02111
Trustee (since 2005) | | Managing Director—E.J. Boudreau & Associates (consulting), from 2000 through current; oversees 64; no other directorships held. | |
|
| William P. Carmichael (Born 1943) | |
|
c/o Columbia Management
Advisors, LLC
One Financial Center
Boston, MA 02111
Trustee (since 1999) | | Retired. Oversees 64; Director—Cobra Electronics Corporation (electronic equipment manufacturer); Director—Simmons Company (bedding); Director—The Finish Line (sportswear). | |
|
| William A. Hawkins (Born 1942) | |
|
c/o Columbia Management Advisors, LLC
One Financial Center
Boston, MA 02111
Trustee (since 2005) | | President and Chief Executive Officer—California General Bank, N.A., from January 2008 through current; oversees 64; no other directorships held. | |
|
| R. Glenn Hilliard (Born 1943) | |
|
c/o Columbia Management Advisors, LLC
One Financial Center
Boston, MA 02111
Trustee (since 2005) | | Chairman and Chief Executive Officer—Hilliard Group LLC (investing and consulting), from April 2003 through current; Non-Executive Director & Chairman—Conseco, Inc. (insurance), September 2003 through current; Executive Chairman—Conseco, Inc. (insurance), August 2004 through September 2005; oversees 64; Director—Conseco, Inc. (insurance). | |
|
| John J. Nagorniak (Born 1944) | |
|
c/o Columbia Management
Advisors, LLC
One Financial Center
Boston, MA 02111
Trustee (since 2008)` | | Retired. President and Director—Foxstone Financial, Inc. (consulting), 2000 through December 2007; Director—Mellon Financial Corporation affiliates (investing), 2000 through 2007; Chairman—Franklin Portfolio Associates (investing—Mellon affiliate), 1982 through 2007; oversees 64; Director—MIT Investment Company; Trustee—MIT 401k Plan; Trustee and Chairman—Research Foundation of CFA Institute. | |
|
34
Fund Governance (continued)
Independent Trustees (continued)
Name, Address and Age,
Position with Funds, Year First
Elected or Appointed to Office | | Principal Occupation(s) During Past Five Years, Number of Funds in the Columbia
Funds Complex Overseen by Trustee, Other Directorships Held
| |
| Minor M. Shaw (Born 1947) | |
|
c/o Columbia Management Advisors, LLC
One Financial Center
Boston, MA 02111
Trustee (since 2003) | | President—Micco Corporation and Mickel Investment Group; oversees 64; Board Member—Piedmont Natural Gas. | |
|
Interested Trustee
| Anthony M. Santomero1 (Born 1946) | |
|
c/o Columbia Management Advisors, LLC
One Financial Center
Boston, MA 02111
Trustee (since 2008) | | Richard K. Mellon Professor Emeritus of Finance, The Wharton School, University of Pennsylvania, from 1972 through current; Senior Advisor—McKinsey & Company (consulting), July 2006 through January 2008; President and Chief Executive Officer—Federal Reserve Bank of Philadelphia, July 2000 through April 2006; oversees 64; Director—Renaissance Reinsurance Ltd; Trustee—Penn Mutual Life Insurance Company; Director—Citigroup | |
|
1The Columbia Funds currently treat Mr. Santomero as an "interested person" (as defined in the 1940 Act) of the Funds because he serves as a Director of Citigroup, Inc. and Citibank, N.A. Citigroup, Inc., through its subsidiaries and affiliates, including Citibank, N.A., may engage from time-to-time in brokerage execution, principal transactions and/or lending relationships with the Columbia Funds or other funds or accounts advised/managed by the Advisor and/or any sub-advisor.
The Statement of Additional Information includes additional information about the Trustees of the Funds and is available, without charge, upon request by calling 800-345-6611.
35
Fund Governance (continued)
Officers
Name, Address and Year of Birth,
Position with Columbia Funds,
Year First Elected or
Appointed to Office | | Principal Occupation(s) During Past Five Years
| |
| J. Kevin Connaughton (Born 1964) | |
|
One Financial Center
Boston, MA 02111
President (since 2009) | | Managing Director of Columbia Management Advisors, LLC since December 2004; Senior Vice President and Chief Financial Officer—Columbia Funds, from June 2008 to January 2009; Treasurer—Columbia Funds, from October 2003 to May 2008; Treasurer—the Liberty Funds, Stein Roe Funds and Liberty All-Star Funds, December 2000—December 2006; Senior Vice President—Columbia Management Advisors, LLC, from April 2003 to December 2004; President—Columbia Funds, Liberty Funds and Stein Roe Funds, February 2004 to October 2004; Treasurer—Galaxy Funds, September 2002 to December 2005; Treasurer, December 2002 to December 2004, and President, February 2004 to December 2004—Columbia Management Multi-Strategy Hedge Fund, LLC; and a senior officer of various other Bank of America-affiliated entities, including other registered and unregistered funds | |
|
| James R. Bordewick, Jr. (Born 1959) | |
|
One Financial Center
Boston, MA 02111
Senior Vice President, Secretary and Chief Legal Officer (since 2006) | | Associate General Counsel, Bank of America since April 2005; Senior Vice President and Associate General Counsel, MFS Investment Management (investment management) prior to April 2005. | |
|
| Linda J. Wondrack (Born 1964) | |
|
One Financial Center
Boston, MA 02111
Senior Vice President and
Chief Compliance Officer (since 2007) | | Director (Columbia Management Group LLC and Investment Product Group Compliance), Bank of America since June 2005; Director of Corporate Compliance and Conflicts Officer, MFS Investment Management (investment management), August 2004 to May 2005; Managing Director, Deutsche Asset Management (investment management) prior to August 2004. | |
|
| Michael G. Clarke (Born 1969) | |
|
One Financial Center
Boston, MA 02111
Senior Vice President and
Chief Financial Officer (since 2009) | | Director of Fund Administration of the Advisor since January 2006; Managing Director of the Advisor September 2004 to December 2005; Vice President Fund Administration June 2002 to September 2004. | |
|
| Jeffrey R. Coleman (Born 1969) | |
|
One Financial Center
Boston, MA 02111
Treasurer (since 2008) | | Director of Fund Administration of the Advisor since January 2006; Fund Controller of the Advisor from October 2004 to January 2006; Vice President of CDC IXIS Asset Management Services, Inc. (investment management) from August 2000 to September 2004. | |
|
| Joseph F. DiMaria (Born 1968) | |
|
One Financial Center
Boston, MA 02111
Chief Accounting Officer (since 2008) | | Director of Fund Administration of the Advisor since January 2006; Head of Tax/Compliance and Assistant Treasurer of the Advisor from November 2004 to December 2005; Director of Trustee Administration (Sarbanes-Oxley) of the Advisor from May 2003 to October 2004. | |
|
36
Fund Governance (continued)
Officers (continued)
Name, Address and Year of Birth,
Position with Columbia Funds,
Year First Elected or
Appointed to Office | | Principal Occupation(s) During Past Five Years
| |
| Julian Quero (Born 1967) | |
|
One Financial Center
Boston, MA 02111
Deputy Treasurer (since 2008) | | Senior Tax Manager of the Advisor since August 2006; Senior Compliance Manager of the Advisor from April 2002 to August 2006. | |
|
| Barry S. Vallan (Born 1969) | |
|
One Financial Center
Boston, MA 02111
Controller (since 2006) | | Vice President—Fund Treasury of the Advisor since October 2004; Vice President—Trustee Reporting of the Advisor from April 2002 to October 2004. | |
|
| Stephen T. Welsh (Born 1957) | |
|
One Financial Center
Boston, MA 02111
Vice President (since 1996) | | President, Columbia Management Services, Inc. since July 2004; Senior Vice President and Controller, Columbia Management Services, Inc. prior to July 2004. | |
|
37
Board Consideration and Re-Approval of Current Investment Advisory Agreement
Even though the following description of the Board's consideration of investment advisory and, as applicable, sub-advisory agreements covers multiple funds, for purposes of this shareholder report, the description is only relevant as to the Fund.
The Board of Trustees of Columbia Funds Series Trust (the "Board"), including a majority of the Trustees who have no direct or indirect interest in the investment advisory and sub-advisory agreements and are not "interested persons" of the Trust, as defined in the Investment Company Act of 1940 (the "1940 Act") (the "Independent Trustees"), are required annually to review and re-approve the existing investment advisory and sub-advisory agreements and approve any newly proposed terms therein. In this regard, the Board reviewed and re-approved, during the most recent six months covered by this report, (i) investment advisory agreements with Columbia Management Advisors, LLC ("CMA" or the "Adviser") for Columbia Convertible Securities Fund, Columbia Large Cap Value Fund, Columbia Mid Cap Value Fund, Columbia Small Cap Value Fund II, Columbia Marsico Growth Fund, Columbia Large Cap Core Fund, Columbia Marsico Focused Equities Fund, Columbia Marsico 21st Century Fund and Columbia Small Cap Growth Fund II; and (ii) investment sub-advisory agreements with Marsico Capital Management, LLC ("Marsico Capital" or the "Sub-Adviser") for Columbia Marsico Focused Equities Fund, Columbia Marsico 21st Century Fund and Columbia Marsico Growth Fund (the "Sub-Advised Funds"). The investment advisory agreements with CMA and the investment sub-advisory agreements with Marsico Capital are each referred to as an "Advisory Agreement" and collectively referred to as the "Advisory Agreements." The funds identified above are each referred to as a "Fund" and collectively referred to as the "Funds."
More specifically, at meetings held on November 5-6, 2009, the Board, including the Independent Trustees advised by their independent legal counsel, considered the factors and reached the conclusions described below relating to the selection of CMA and the Sub-Adviser and the re-approval of the Advisory Agreements. The Board also reviewed and considered a report prepared and provided by the Independent Fee Consultant (the "Fee Consultant") appointed by the Independent Trustees pursuant to an assurance of discontinuance entered into with the New York Attorney General ("NYAG") to settle a civil complaint filed by the NYAG relating to trading in mutual fund shares (the "NYAG Settlement"). The Fee Consultant's role was to manage the process by which management fees are negotiated so that they were negotiated in a manner that is at arms' length and reasonable. Th e Fee Consultant found that the fee negotiation process was, to the extent practicable, at arms' length and reasonable and consistent with the requirements of the NYAG Settlement. A summary of the Fee Consultant's report is available at http://www.columbiafunds.com.
In preparation for the November meetings, the Board met in August for review and discussion of the materials described below. The Investment Committee of the Board also met in June to discuss each Fund's performance with its respective portfolio manager(s). In addition to these meetings, the Investment Committee receives and discusses performance reports at its quarterly meetings. The Contracts Review Committee of the Board also provided support in managing and coordinating the process by which the Board reviewed the Advisory Agreements. The Board's review and conclusions are based on the comprehensive consideration of all information presented to it and are not the result of any single controlling factor. The Board evaluated all information available to it on a Fund-by-Fund basis, and its determinations were made separately in respect of each Fund.
Nature, Extent and Quality of Services. The Board received and considered various data and information regarding the nature, extent and quality of services provided to the Funds by CMA and the Sub-Adviser under the Advisory Agreements. The most recent investment adviser registration forms for CMA and the Sub-Adviser were made available to the Board, as were CMA's and the Sub-Adviser's responses to a detailed series of requests submitted by the Independent Trustees' independent legal counsel on behalf of such Trustees. The Board reviewed and analyzed those materials, which included, among other things, information about the background and experience of senior management and investment personnel of CMA and the Sub-Adviser.
In addition, the Board considered the investment and legal compliance programs of the Funds, CMA and the Sub-Adviser, including their compliance policies and procedures and reports of the Funds' Chief Compliance Officer.
The Board evaluated the ability of CMA and the Sub-Adviser, based on their resources, reputation and other attributes, to attract and retain qualified investment professionals, including research, advisory and supervisory personnel.
38
In this regard, the Board considered information regarding the nature of CMA's compensation structure applicable to portfolio managers and other key investment personnel.
Based on the above factors, together with those referenced below, the Board concluded that it was satisfied with the nature, extent and quality of the investment advisory services provided to each of the Funds by CMA and the Sub-Adviser.
The Board noted that Bank of America, N.A., the parent company of the Adviser, had entered into an agreement to sell a portion of the asset management business of the Adviser to Ameriprise Financial, Inc. (the "Transaction"). The Board noted that the Transaction was expected to close in the spring of 2010 and that its review of the Advisory Agreements was separate and distinct from any analysis regarding new advisory or sub-advisory arrangements that may result from the closing of the Transaction.
Investment Advisory and Sub-Advisory Fee Rates and Other Expenses. The Board reviewed and considered the proposed contractual investment advisory fee rates both separately and together with the administration fee rates payable by the Funds to CMA for investment advisory services (the "Contractual Management Rates"). The Board also reviewed and considered the proposed contractual investment sub-advisory fee rates (the "Sub-Advisory Agreement Rates") payable by CMA to the Sub-Adviser for investment sub-advisory services. In addition, the Board reviewed and considered the proposed fee waiver/cap arrangements applicable to the Contractual Management Rates and considered the Contractual Management Rates after taking the waivers/caps into account (the "Actual Management Rates"). The Board noted that, on a complex-wide basis, CMA had reduced annual managemen t fees by at least $32 million per year pursuant to the NYAG Settlement. The Board also noted reductions in net advisory rates and/or total expenses of certain funds across the fund complex. Additionally, the Board received and afforded specific attention to information comparing the Contractual Management Rates and Actual Management Rates with those of the other funds in their respective Peer Groups (as defined below).
The Board reviewed and considered statistical information regarding each Fund's total expense ratio and its various components, including contractual advisory fees, actual advisory fees, actual non-management fees, Rule 12b-1 and non-Rule 12b-1 service fees, fee waivers/caps and/or expense reimbursements. The Board also reviewed comparisons of these fees to the expense information for the group of Funds determined by Lipper Inc. ("Lipper") to be most similar to a given Fund (the "Peer Group") and to the performance of a broader universe of relevant funds as determined by Lipper (the "Universe"), which comparative data was provided by Lipper, an independent provider of investment company data. The Board was provided with a description of the methodology used by Lipper to select the mutual funds in each Fund's Peer Group and Universe and considered potential i mprecision resulting from the selection methodology. For certain Funds, Lipper determined that the composition of the Peer Group and/or Universe for expenses would differ from the composition for performance to provide a more accurate basis of comparison. The Board also considered Lipper data that ranked each Fund based on: (i) each Fund's one- and three-year performance compared to actual management fees; and (ii) each Fund's one- and three-year performance compared to total expenses.
The Board concluded that the factors noted above supported the Contractual Management Rates and the Actual Management Rates, and the approval of the Advisory Agreements for all of the Funds.
With regard to the Sub-Advised Funds, the Board also reviewed the Sub-Advisory Agreement Rates, including comparative fee information provided by the Adviser and the Adviser's recommendation that the Board re-approve the Advisory Agreements with Marsico Capital. The Board also considered a breakpoint fee schedule charged by Marsico Capital for the Sub-Advised Funds, as well as a corresponding waiver of Contractual Management Rates, both of which were implemented on January 1, 2008. The Board concluded that the Sub-Advisory Agreement Rates are fair and equitable, based on its consideration of the factors described above.
The Fund-by-Fund discussion set forth below in "Fund-Specific Considerations for Certain Review Funds" provides additional information regarding those Funds highlighted as meeting agreed-upon criteria for warranting further review. Such criteria included, among other things, information relating to Actual Management Rates, total expense ratios and/or performance information, relative to a Fund's Peer Group and/or Universe.
39
Fund Performance. The Board considered the performance results for each of the Funds over multiple measurement periods. It also considered these results in comparison to the performance results of each Fund's Peer Group and Universe, as well as to each Fund's benchmark index. The Board also considered certain risk-adjusted performance data.
The Fund-by-Fund discussion set forth below in "Fund-Specific Considerations for Certain Review Funds" provides additional information regarding those Funds highlighted as meeting agreed-upon criteria for warranting further review. Such criteria included, among other things, information relating to Actual Management Rates, total expense ratios and/or performance information, relative to a Fund's Peer Group and/or Universe.
Profitability. The Board received and considered a detailed profitability analysis of CMA based on the Contractual Management Rates and the Actual Management Rates, as well as on other relationships between the Funds and other funds in the complex on the one hand and CMA affiliates on the other. The analysis included complex-wide and per-Fund information and a comparison of results using alternative allocation methodologies. The Board concluded that, in light of the costs of providing investment management and other services, the profits and other ancillary benefits that CMA and its affiliates received from providing these services were not unreasonable.
Economies of Scale. The Board received and considered information regarding whether there have been economies of scale with respect to the management of the Funds, whether the Funds have appropriately benefited from any economies of scale and whether there is potential for realization of any further economies of scale. Most particularly, CMA provided information showing that, as a percentage of fund assets, CMA's complex-wide revenues declined over a five-year period during which fund assets increased by 53% and the shareholder benefit over a four-year period has remained steady at approximately 33% of the Adviser's total profits. The Board concluded that any potential economies of scale are shared fairly with Fund shareholders, most particularly through breakpoints and fee waiver arrangements.
The Board acknowledged the inherent limitations of any analysis of an investment adviser's economies of scale, stemming largely from the Board's understanding that economies of scale are generally realized, if at all, by an investment adviser across a variety of products and services, not just with respect to a single fund.
Information About Services to Other Clients. The Board also received and considered information about the nature and extent of services and fee rates offered by CMA and the Sub-Adviser to their other clients, including separate accounts and institutional investors. In this regard, the Board concluded that, where the Contractual Management Rates, Sub-Advisory Agreement Rates and Actual Management Rates were appreciably above the range of the fee rates offered to other CMA and Sub-Adviser clients, based on information provided by CMA and the Sub-Adviser, the costs associated with managing and operating a registered investment company provided a justification for the higher fee rates charged to the Funds.
Other Benefits to CMA and the Sub-Adviser. The Board received and considered information regarding any "fall-out" or ancillary benefits received by CMA and its affiliates and the Sub-Adviser as a result of their relationship with the Funds. Such benefits could include, among others, benefits attributable to CMA's and the Sub-Adviser's relationships with the Funds (such as soft-dollar credits) and benefits potentially derived from an increase in CMA's and the Sub-Adviser's business as a result of their relationship with the Funds (such as the ability to market to shareholders other financial products offered by CMA and its affiliates or a Sub-Adviser).
The Board considered the effectiveness of the policies of the Funds in achieving the best execution of portfolio transactions, whether and to what extent soft dollar credits are sought and how any such credits are utilized, any benefits that may be realized by using an affiliated broker, the extent to which efforts are made to recapture transaction costs, and the controls applicable to brokerage allocation procedures. The Board also reviewed CMA's and the Sub-Adviser's methods for allocating portfolio investment opportunities among the Funds and other clients. The Board concluded that the benefits were not unreasonable.
Other Factors and Broader Review. As discussed above, the Board reviews materials received from CMA and the Sub-Adviser annually as part of the re-approval process under Section 15(c) of the 1940 Act. The Board also reviews and assesses the quality of the services the Funds receives throughout the year. In this regard, the Board and its
40
Committees review reports of CMA and the Sub-Adviser at each of its quarterly meetings, which include, among other things, Fund performance reports and presentations relating to such reports. In addition, the Board and its Committees confer with portfolio managers at various times throughout the year including, most particularly, at the June Investment Committee meeting.
Fund-Specific Considerations for Certain "Review" Funds. For certain Funds highlighted as meeting agreed-upon criteria for warranting further review, the Board engaged in further analysis with regard to approval of the Funds' Advisory Agreements. Such criteria included, among other things, information relating to Actual Management Rates, total expense ratios, and/or performance information relative to a Fund's Peer Group and/or Universe.
The Board engaged in further review of Columbia Mid Cap Value Fund because its Actual Management Rate was above the median range of its Peer Group and its one-year performance ranking was below the median range of its Universe. However, the Board noted other factors such as a total expense ratio that was appreciably below the Fund's Peer Group and Universe and strong performance over other periods. Taking into account these matters and other factors considered, the Board concluded that the Fund's performance and Actual Management Rate were acceptable.
Conclusion. After an evaluation of the above-described factors, and based on its deliberations and analysis of the information provided and alternatives considered, the Board, including all of the Independent Trustees, concluded that the compensation payable to CMA and the Sub-Adviser under the Advisory Agreements is fair and equitable. Accordingly, the Board unanimously re-approved the Advisory Agreements.
41
Board Consideration and Approval of Proposed Investment Advisory Agreement
Even though the following description of the Board's consideration of investment advisory and, as applicable, sub-advisory agreements covers multiple funds and trusts, for purposes of this shareholder report, the description is only relevant as to the Fund.
At a meeting held on December 21, 2009, the Boards of Trustees (the "Boards") of Columbia Funds Series Trust, Columbia Funds Master Investment Trust, LLC and Columbia Funds Series Trust II (each a "Trust" and collectively the "Trusts") unanimously approved a new investment management services agreement with RiverSource Investments, LLC ("RiverSource") (the "Proposed Advisory Agreement") and new subadvisory agreements with Marsico Capital Management ("Marsico Capital"), MacKay Shields LLC ("Mackay Shields") and Brandes Investment Partners, L.P. ("Brandes") (each a "Proposed Subadvisory Agreement"), as applicable, for each Fund of the Trusts (each a "Fund" and collectively the "Funds"). As detailed below, the Trustees met on multiple occasions in advance of the December 21, 2009 meeting, held numerous discussions with the management teams of Columbia Management Advisors, LLC ("Columbia") and RiverSource, a subsidiary of Ameriprise Financial, Inc. ("Ameriprise") and reviewed and considered extensive materials in connection with the approval of the Proposed Advisory and Subadvisory Agreements.
Specifically, the Trustees of each Trust, including a majority of the Trustees who have no direct or indirect interest in the Proposed Advisory and Subadvisory Agreements and are not "interested persons" of the Trusts, as defined in the Investment Company Act of 1940, as amended (the "1940 Act") (the "Independent Trustees") reviewed and approved (i) the Proposed Advisory Agreement with RiverSource for each Fund and (ii) the Proposed Subadvisory Agreement for those Funds that currently have investment subadvisory agreements with Marsico Capital, Mackay Shields, and Brandes (the "Subadvised Funds") (Marsico Capital, MacKay Shields and Brandes are collectively referred to as the "Subadvisers"). Prior to approving the Proposed Advisory Agreements, the Trustees were presented with, and requested, received and evaluated, extensive materials about RiverSource, the sale of a portion of the asset management business of Columbia Managemen t Group, LLC to Ameriprise (the "Transaction") and related matters from RiverSource, Ameriprise and Columbia. In this regard, the Trustees reviewed RiverSource's responses to a series of detailed requests submitted by the Independent Trustees' independent legal counsel and by the Independent Fee Consultant (as defined below).
The Trustees also reviewed and considered information received in connection with their most recent consideration and reapproval in November 2009 of the current advisory agreement (the "Current Advisory Agreement") and current subadvisory agreement (the "Current Subadvisory Agreement"), as applicable, for each Fund, including information about the Subadvisers (the "Current Agreement Re-Approval Process"). Moreover, the Trustees and committees of the Boards met on several occasions, and received extensive materials, throughout the course of the year relating to the Current Agreement Re-Approval Process, which the Trustees considered relevant to their consideration and approval of the Proposed Advisory and Subadvisory Agreements. The Trustees also consulted with Fund counsel and with the Independent Trustees' independent legal counsel, who advised on the legal standards for consideration by the Trustees, and otherwise assisted the Trustees in their deliberations.
In advance of the meeting on December 21, 2009, the Trustees held several meetings, including meetings held in-person with representatives from RiverSource and Ameriprise on August 26, 2009, November 5-6, 2009, December 9-10, 2009 and December 14, 2009, and additional meetings with representatives of Columbia, to discuss the Transaction, RiverSource's plans and intentions regarding the Funds and various proposals that were being presented as a result of the Transaction, including the Proposed Advisory and Subadvisory Agreements. In addition to these meetings, telephonic meetings and discussions were held on several occasions between individual Trustees, members of the committees of the Boards, their independent legal counsel and representatives from RiverSource, Ameriprise and/or Columbia.
The Trustees also reviewed and considered a report prepared and provided by the Fee Consultant (the "Fee Consultant") appointed by the Independent Trustees pursuant to an assurance of discontinuance entered into by a predecessor to Columbia with the New York Attorney General ("NYAG") to settle a civil complaint filed by the NYAG relating to trading in mutual fund shares (the "NYAG Settlement"). The Fee Consultant's role was to manage the process by which management fees are negotiated so that they were negotiated in a manner that is at arms' length and reasonable. The Fee
42
Consultant found that the fee negotiation process was, to the extent practicable, at arms' length and reasonable and consistent with the requirements of the NYAG Settlement. A summary of the Fee Consultant's report is available at www.columbiafunds.com.
The following summarizes a number of the material factors considered by the Trustees in reaching their approvals and determinations with respect to the Proposed Advisory Agreements and Proposed Subadvisory Agreements. It is followed by a more detailed discussion of the Trustees' consideration of these and other factors considered relevant by the Trustees in their evaluation of the Proposed Advisory Agreements and Proposed Subadvisory Agreements. In voting to approve the Proposed Advisory and Subadvisory Agreements for each Fund, the Trustees also considered substantially the same factors, as relevant, and reached substantially the same conclusions in their approval of interim advisory and subadvisory agreements for each Fund.
(i) the terms and conditions of the Proposed Advisory Agreements compared to the terms and conditions of the Current Advisory Agreements, as described below;
(ii) the fact that each Fund's total advisory fees would remain the same;
(iii) the qualifications of the personnel of RiverSource, Ameriprise and the Subadvisers expected to provide advisory and administrative services to each Fund, including representations by Ameriprise regarding its retention of the same process for monitoring and evaluating portfolio management personnel for each Fund as currently used by Columbia;
(iv) the terms and conditions of the Proposed Subadvisory Agreements compared to the terms and conditions of the Current Subadvisory Agreements;
(v) the reputation, financial strength, regulatory and compliance histories and resources of RiverSource and Ameriprise, and the potential benefits to the Funds of the combination of RiverSource and Columbia, including that the Funds are expected to continue to have access to existing distribution channels and have the potential for expanded distribution of Fund shares, the expected depth and breadth of investment management capabilities, that there is not expected to be any diminution in the nature, quality and extent of services to be provided to the Funds under the Proposed Advisory Agreements and the potential for the realization of additional economies of scale over time and the potential of the Funds to share in, and benefit from, these economies, if any;
(vi) that Ameriprise has committed to refrain from imposing or seeking to impose, for a period of not less than two years after the closing of the Transaction (the "Closing"), any "unfair burden" (within the meaning of Section 15(f) of the 1940 Act) on any Fund;
(vii) the terms and conditions of certain other agreements and arrangements relating to the future operations of the Funds and their distribution channels, including the administrative services agreement and the new services and distribution agreement;
(viii) that the Trustees recently had completed the Current Agreement Re-Approval Process for each Fund and had determined that they were satisfied with the nature, extent and quality of services provided thereunder and that the management fee rates and (where applicable) subadvisory fee rates for each Fund were satisfactory;
(ix) that RiverSource was willing to commit to maintain net operating expense ratios at current levels for at least the period currently covered by Columbia's existing commitments;
(x) the capabilities of RiverSource and the Subadvisers with respect to compliance, including an assessment of RiverSource's compliance program by the Funds' Chief Compliance Officer;
(xi) that certain members of RiverSource's management and certain Columbia personnel that will be integrated into RiverSource and its affiliates as a result of the Transaction have substantial experience in integrating fund families; and
(xii) that Ameriprise and Bank of America Corporation would bear the costs of obtaining approvals of the Proposed Advisory and Subadvisory Agreements.
In their deliberations, the Trustees did not identify any single item that was paramount or controlling and individual Trustees may have attributed different weights to various factors. The Trustees also evaluated all information available to them on a Fund-by-Fund basis, and their determinations were made separately in respect of each Fund.
43
Nature, Extent and Quality of Services to be Provided. The Trustees received and considered various data and information regarding the expected nature, extent and quality of services to be provided to the Funds by RiverSource and the Subadvisers under the Proposed Advisory and Subadvisory Agreements. The most recent investment adviser registration forms for RiverSource and each Subadviser were made available to the Boards, as well as extensive materials from RiverSource, Ameriprise and Columbia. The Trustees reviewed and analyzed these materials, which included, among other things, information about the background and experience of expected senior management of RiverSource and Ameriprise after the Closing. The Trustees considered RiverSource's ability to provide administrative services to the Funds, noting that while the aggregate scope of advisory an d administrative services was not expected to change following the Closing, the allocation of services was expected to shift, to a limited extent, such that administrative services will be provided under a new administrative services agreement. The Trustees considered, among other things, the capacity and quality of RiverSource's and the Subadvisers' investment management, research and trade execution capabilities and other resources that would be dedicated to performing services for the Funds. The Trustees also considered matters related to RiverSource's and the Subadvisers' compliance programs and compliance records, including RiverSource's portfolio transaction policies and procedures. The Trustees discussed with senior management personnel their ability to administer and oversee outside service providers to the Funds and their shareholders and were satisfied with management's processes for providing services and overseeing and reviewing services to be rendered by outside sources.
In evaluating the services to be provided under the Proposed Advisory and Subadvisory Agreements, the Trustees factored in their extensive discussions with representatives of Columbia, RiverSource and Ameriprise at the meetings referenced above regarding the management of each Fund. The Trustees considered representations by Ameriprise that it was expected that there will be no diminution in the nature and quality of services provided to the Funds. The Trustees noted that Columbia Management Group's current President, Columbia's current Chief Investment Officer and Columbia's current President, were expected to continue to serve the Funds in similar capacities after the Closing. With respect to portfolio management, the Trustees reviewed information regarding the deliberative process for selecting portfolio management personnel to continue servicing the Fund s after the Closing, including the expected role of Columbia's Chief Investment Officer in evaluating and selecting portfolio management personnel for each Fund utilizing Columbia's current analytical model for evaluating portfolio managers. In this regard, the Trustees also weighed representations by Ameriprise that this investment management evaluative process was likely to result in a significant number of Columbia investment professionals and personnel currently responsible for management of the Funds to remain in place. The Trustees noted that the portfolio management evaluation and selection process was designed to optimize the portfolio management resources available to each Fund by having the ability to select investment personnel for the Funds from the combined organization. Similarly, the Trustees evaluated the ability of RiverSource and the Subadvisers, based on their respective resources, reputations and other attributes, to attract and retain qualified investment professionals. In this regard, t he Trustees considered information regarding the nature of the compensation structure applicable to portfolio managers and other key investment personnel.
The Trustees reviewed and considered information from Ameriprise and RiverSource regarding various contemplated service provider arrangements, including information regarding both immediate and potential future plans in respect of these arrangements. In this regard, the Trustees considered information regarding potential distribution, transfer agency and custody arrangements and the evaluation of fund accounting, financial reporting and valuation service model options, noting certain differences between Columbia's and RiverSource's current approaches, including that RiverSource has historically utilized services provided "in-house" or by its affiliates for fund accounting, financial reporting and valuation. The Trustees reviewed information from Ameriprise and RiverSource regarding the expectation for rationalized or harmonized fees as part of the integration after the Closing in order to develop consistent service fee schedules across the combined fund family. The Trustees noted Ameriprise's representations that, to the extent any such proposals were recommended to the Board after the Closing, they would not result in an "unfair burden" (within the meaning of Section 15(f) of the 1940 Act) on any Fund.
44
In addition, the Trustees reviewed and evaluated materials and information received regarding the investment and legal compliance programs of the Funds, RiverSource and the Subadvisors, including their compliance policies and procedures and reports of the Funds' Chief Compliance Officer. In this regard, the Trustees considered that Columbia's current Chief Compliance Officer was expected to serve in the same role after the Closing.
The Trustees also noted that Ameriprise and certain of its affiliates have been involved in a number of legal, arbitration and regulatory proceedings, including routine litigation, class actions, and governmental actions, concerning matters arising in connection with the ordinary conduct of their business activities, and that Ameriprise indicated that neither Ameriprise nor any of its affiliates are the subject of any pending legal, arbitration or regulatory proceedings that are likely to have a material adverse effect on the Funds or the ability of Ameriprise or its affiliates, including RiverSource to provide services to the Funds.
Based on the foregoing and other information considered relevant, the Trustees concluded that, overall, they were satisfied with assurances from Columbia, RiverSource, Ameriprise and the Subadvisers as to the expected nature, extent and quality of services to be provided to each Fund under the Proposed Advisory and Subadvisory Agreements.
Investment Advisory and Subadvisory Fee Rates and Other Expenses. The Trustees reviewed and considered the proposed contractual investment advisory fee rates to be paid by each Fund to RiverSource for investment management services both separately and together with the administration fee rates to be paid by the Funds to RiverSource (the "Contractual Management Rates"), which are the same as the separate and aggregate advisory and administrative fee rates currently paid by each Fund to Columbia. The Trustees also reviewed and considered the proposed subadvisory fee rates and the fee arrangements under the Proposed Subadvisory Agreements, respectively, which are also the same as those currently in effect under the Current Subadvisory Agreements. In addition to the materials provided by Columbia, RiverSource provided information regarding the current fee s for each of the RiverSource funds and other relevant institutional accounts. The Trustees reviewed and considered the proposed fee waiver/cap arrangements applicable to the Contractual Management Rates and considered the Contractual Management Rates after taking the waivers/caps into account (the "Actual Management Rates"). In this regard, the Trustees noted that RiverSource had committed to maintain the Funds' current expense limitation and waiver arrangements (both contractual and voluntary). The Trustees considered the potential that, after the Closing, RiverSource would propose a common fee and expense structure for the combined fund family, subject to the commitment that Ameriprise will not seek any change that would result in an "unfair burden" on any Fund. The Trustees also considered the report prepared and provided by the Fee Consultant. Additionally, the Trustees received and afforded specific attention to information provide d in connection with the Current Agreement Re-Approval Process, comparing the Contractual Management Rates and Actual Management Rates with those of other funds in each Fund's Peer Group (as defined below).
During the Current Agreement Re-Approval Process, the Trustees reviewed and considered statistical information regarding each Fund's total expense ratio and its various components, including contractual advisory fees, actual advisory fees, actual nonmanagement fees, Rule 12b-1 and non-Rule 12b-1 service fees, fee waivers/caps and/or expense reimbursements. The Trustees also reviewed comparisons of these fees to the expense information for the group of Funds that was determined by Lipper Inc. ("Lipper") to be the most similar to a given Fund (the "Peer Group") and to the performance of a broader universe of relevant funds as determined by Lipper (the "Universe"), which comparative data was provided by Lipper, an independent provider of investment company data.
The Trustees were provided with a description of the methodology used by Lipper to select the mutual funds in each Fund's Peer Group and Universe and reviewed the degree of comparability resulting from the selection methodology. For certain Funds, Lipper determined that changing the composition of the Peer Group and/or Universe for expenses from that used for performance would provide a more accurate basis of comparison. The Trustees also considered Lipper data that ranked each Fund based on: (i) each Fund's one- and three-year performance compared to actual management fees; and (ii) each Fund's one- and three-year performance compared to total expenses.
For each Fund, except as otherwise described in the Fund-specific discussion below, the Trustees noted that they had
45
concluded during the Current Agreement Re-Approval Process that the Contractual Management Rates, the Actual Management Rates and the total expense ratio were at acceptable levels in light of the quality of services provided to the Fund and in comparison to such Fund's Peer Group and Universe, as applicable; that the advisory fee rate would not be increased for any Fund; that Ameriprise and RiverSource had represented that the overall expenses for each Fund were not expected to be adversely affected by the Transaction; and that RiverSource had committed to maintain the Funds' current expense limitation or waiver arrangements (both contractual and voluntary).
Based on the foregoing, other relevant information received and the additional information described in the Fund-specific discussion below, as applicable, the Trustees concluded that the Contractual Management Rates, the Actual Management Rates and the total expense ratio were acceptable.
Fund Performance. The Trustees reviewed detailed performance information for each Fund at various Board and committee meetings during the year in addition to the additional performance information that they reviewed and evaluated in connection with the Transaction. The Trustees also reviewed and evaluated detailed performance information for each Fund in connection with the Current Agreement Re-Approval Process. The Trustees considered the performance results for each of the Funds over multiple measurement periods. They also considered these results in comparison to the performance results of each Fund's Peer Group and Universe, as well as to each Fund's benchmark index. The Boards also noted certain risk-adjusted performance data.
The Trustees also reviewed and evaluated information and data regarding the investment performance record of RiverSource in managing funds with investment strategies generally similar to those of the Funds, as applicable. Investment performance for such funds was provided for a wide range of periods.
The Trustees recognized that the investment performance record of RiverSource in managing funds with similar objectives may be less relevant to their deliberations in situations where the current portfolio managers of Columbia are expected to continue managing a particular Fund following the Closing. They also recognized that for each Fund, it is not possible to predict with certainty what effect, if any, consummation of the Transaction will have on the future performance of the Funds, noting in particular that past investment performance is no assurance of future results. The Fund-by-Fund discussion set forth below provides additional information regarding those Funds highlighted as meeting agreed-upon criteria for warranting further review. Such criteria included, among other things, information relating to Actual Management Rates, total expense ratios and /or performance information, relative to a Fund's Peer Group and/or Universe.
Costs of Services to be Provided and Profitability. In considering the costs of services to be provided by RiverSource and the Subadvisers under the Proposed Advisory Agreement and Proposed Subadvisory Agreement, as applicable for each Fund, and the projected range of profitability to RiverSource and the Subadvisers from their relationships with the Funds, the Trustees considered, among other things, that there would be no increase in advisory or subadvisory fee rates under the Proposed Advisory and Subadvisory Agreements. The Trustees further noted, with respect to RiverSource, that it was not possible to predict with certainty how RiverSource's profitability would be affected by becoming the investment adviser to the Funds but, as a general matter, they were satisfied, based on their review of RiverSource's projected range of profitability assuming completion of the Transaction, that this projected profitability from their relationship with the Funds would not be excessive. The Trustees based their review, in part, on information regarding RiverSource's current profitability in managing the RiverSource Funds and the information available to the Trustees with respect to RiverSource's expense budgeting process. The Trustees also noted that they would have ongoing opportunities to address RiverSource's profitability in the future based on actual results. The Trustees did not consider separate profitability information with respect to the Subadvisers, as their profitability from their relationships with the Funds was not a material factor in determining whether to approve the Proposed Subadvisory Agreements. The Trustees also noted that the subadvisory fees paid to the Subadvisers, none of which is affiliated with Columbia, had previously been negotiated on an arms' length basis.
The Trustees also reviewed information about the financial condition of RiverSource and the Subadvisers and were satisfied that RiverSource and the Subadvisers have adequate
46
resources to perform the services required under the Proposed Advisory and Proposed Subadvisory Agreements.
Subject to the limitations noted above, the Trustees concluded that they were satisfied that RiverSource's projected range of future profitability, and each Subadviser's historical profitability, from their relationship with each Fund, as relevant, were not excessive.
Economies of Scale. The Trustees received and evaluated information regarding the potential to realize economies of scale with respect to management of the Funds, whether the Funds would appropriately benefit from any economies of scale and whether there was any potential for realization of further economies of scale in connection with the Transaction. The Trustees noted that the current and proposed investment advisory fee rates for most of the Funds contain breakpoints that reduce the fee rate on assets above specified levels. The Trustees noted that RiverSource had indicated that no changes to the Funds' breakpoint arrangements were proposed to be made at this time. In light of these factors and noting that it was not possible to evaluate with certainty if and how the Transaction would produce any immediate opportunities for additional economies of scale, the Trustees concluded that each Fund's breakpoint arrangements were acceptable. The Trustees also recognized that the Funds may benefit from certain economies of scale over time from becoming a part of the larger RiverSource fund complex, based on potential future synergies of operations, potential fee harmonization/rationalization initiatives and potential future Fund mergers. The Trustees noted, in particular, RiverSource's acknowledgement of the principle that the Funds should share in certain economies of scale if realized by RiverSource. In addition, the Trustees evaluated the likelihood that there would be potential Fund mergers after the Closing. The Trustees noted that any such potential Fund mergers, if approved, could result in the achievement of additional breakpoints for Funds that have implemented breakpoint fee schedules. The Trustees also noted that they expect to consider economies of scale from time to time following the Closing and thus be in a position to evaluate any additional e conomies of scale.
The Trustees acknowledged the inherent limitations of any analysis of an investment adviser's economies of scale, stemming largely from the Trustees' understanding that economies of scale are generally realized, if at all, by an investment adviser across a variety of products and services, not just with respect to a single fund.
Information About Investment Management Services to Non-Mutual Fund Clients. The Trustees also received and reviewed information about the nature and extent of services and fee rates offered by Riversource and the Subadvisers to the Funds compared with other clients with similar accounts, including separate accounts and institutional investments. The Trustees noted that the Funds may receive services different from those offered to other clients of RiverSource and the Subadvisers and concluded that the advisory fee rates under the Proposed Advisory Agreements and the subadvisory fee rates under the Proposed Subadvisory Agreements were not excessive, given the nature and extent of services expected to be offered and other factors, including the Trustees' review of Lipper data.
Other Benefits to RiverSource and the Subadvisers. The Trustees received and reviewed information regarding any expected "fall-out" or ancillary benefits to be received by RiverSource and its affiliates and by the Subadvisers as a result of their relationships with the Funds.
Among other things, the Trustees noted that RiverSource would benefit from soft dollar arrangements using portfolio brokerage of each Fund that invests in equity securities. The Trustees also noted that the Subadvisers also had benefited from, and expected to continue to benefit from, soft dollar arrangements using portfolio brokerage of the Subadvised Funds. The Trustees acknowledged RiverSource's representation that none of its affiliated broker dealers was expected to provide brokerage services to any Fund, but noted that broker-dealer affiliates of RiverSource will receive distribution related fees from the Funds in respect of shares held in certain accounts, and that such Funds' distributor (which will also become a subsidiary of RiverSource following the closing of the Transaction) retains a portion of the distribution related fees from the Funds and receives a portion of the sales charges on sales or redemptions of certai n classes of shares of the Funds. The Trustees recognized that RiverSource's and the Subadvisers' profitability would be somewhat lower without these benefits. The Trustees concluded that RiverSource and the Subadvisers may derive reputational benefits from their association with the Funds. The Trustees also noted, however, that such benefits were difficult to quantify with certainty.
47
Fund-Specific Considerations for Certain "Review" Funds. During the Current Agreement Re-Approval Process, a limited number of Funds were highlighted as meeting agreed-upon criteria for warranting further review. Such criteria included, among other things, information relating to Actual Management Rates, total expense ratios and/or performance information, relative to a Fund's Peer Group and/or Universe. For such "review" Funds, the Trustees engaged in further analysis with regard to the approval of the Funds' Current Advisory Agreements. For each such Fund, the Trustees subsequently considered the impact of transitioning investment management responsibilities to RiverSource.
The Trustees engaged in further review of Columbia Mid Cap Value Fund because its Actual Management Rate was above the median range of its Peer Group and its one-year performance ranking was below the median range of its Universe. However, the Trustees noted other factors such as a total expense ratio that was appreciably below the Fund's Peer Group and Universe and strong performance over other periods. Taking into account these matters and other factors considered, the Trustees concluded that the Fund's performance and Actual Management Rate were, at this time, acceptable, under the circumstances.
Conclusion. After an evaluation of the above-described factors and based on its deliberations and analysis of the information provided and alternatives considered, each Board, including all of the Independent Trustees, concluded that approval of the Proposed Advisory and Subadvisory Agreements was in the best interests of each of the Funds and its shareholders. Accordingly, the Boards unanimously approved the Proposed Advisory and Subadvisory Agreements.
48
Summary of Management Fee Evaluation by
Independent Fee Consultant
EXCERPTS FROM REPORT OF INDEPENDENT FEE CONSULTANT TO THE FUNDS SUPERVISED BY THE COLUMBIA NATIONS BOARD
Prepared Pursuant to the February 9, 2005
Assurance of Discontinuance among the
Office of Attorney General of New York State,
Columbia Management Advisors, LLC, and
Columbia Management Distributors, Inc.
November 12, 2009
I. Overview
On February 9, 2005, Columbia Management Advisors, LLC ("CMA") and Columbia Management Distributors, Inc.1 ("CMD") agreed to the New York Attorney General's Assurance of Discontinuance ("AOD"). Among other things, the AOD stipulates that CMA may manage or advise a Columbia Fund ("Columbia Fund" and, together with some or all of such funds, the "Columbia Funds") only if the Independent Members of the Columbia Fund's Board of Trustees appoint a Senior Officer or retain an Independent Fee Consultant ("IFC") who is to manage the process by which proposed management fees are negotiated. The AOD further stipulates that the Senior Officer or IFC is to prepare a written annual evaluation of the fee negotiation process.
With effect from January 1, 2007, the Independent Members of the Board of Trustees for certain Columbia Funds known collectively as the "Nations Funds" (together with the other members of that Board, the "Trustees") retained me as IFC for the Nations Funds.2 In this capacity, I have prepared the fifth annual written evaluation of the fee negotiation process. As was the case with the 2007 and 2008 reports, my immediate predecessor as IFC, John Rea, provided invaluable assistance in the preparation of this year's report.
A. Role of the Independent Fee Consultant
The AOD charges the IFC with "managing the process by which proposed management fees ... to be charged the Columbia Fund are negotiated so that they are negotiated in a manner which is at arms' length and reasonable and consistent with this Assurance of Discontinuance." The AOD also provides that CMA "may manage or advise a Columbia Fund only if the reasonableness of the proposed management fees is determined by the Board of Trustees ... using ... an annual independent written evaluation prepared by or under the direction of ... the Independent Fee Consultant." Therefore, the AOD makes clear that the IFC does not supplant the Trustees in negotiating management fees with CMA, nor does the IFC substitute his or her judgment for that of the Trustees with respect to the reasonableness of proposed fees or any other matter that is committed to the business judgmen t of the Trustees.
B. Elements Involved in Managing the Fee Negotiation Process
In preparing the report required by the AOD, the IFC must consider at least the following six factors set forth in the AOD:
1. The nature and quality of CMA's services, including the Fund's performance;
2. Management fees (including any components thereof) charged by other mutual fund companies for like services;
3. Possible economies of scale as the Fund grows larger;
4. Management fees (including any components thereof) charged to institutional and other clients of CMA for like services;
5. Costs to CMA and its affiliates of supplying services pursuant to the management fee agreements, excluding any intra-corporate profit; and
6. Profit margins of CMA and its affiliates from supplying such services.
C. Organization of the Annual Evaluation
This report, like last year's, focuses on the six factors and contains a section for each factor except that CMA's costs and profits from managing the Funds are treated in a single section. In addition to a discussion of these factors, the report offers recommendations to improve the fee review process in future years. A review of the status of recommendations made in the 2008 Report is being provided separately with the materials for the November meeting.
1 CMA and CMD are subsidiaries of Columbia Management Group, LLC ("CMG"), and are the successors to the entities named in the AOD.
2 I have no material relationship with Bank of America, CMG or any of its affiliates, aside from serving as IFC, and I am aware of no material relationship with any of their affiliates. I retained John Rea, an independent economic consultant, to assist me with this report.
Unless otherwise stated or required by the context, this report covers only the Nations Funds, which are also referred as the "Funds."
49
II. Summary of Findings
A. General
1. Based upon my examination of the information supplied by CMG in the light of the six factors set forth in the AOD, I conclude that the Trustees have the relevant information necessary to evaluate the reasonableness of the proposed management fees for each Nations Fund, subject to the following: on September 30, 2009, Ameriprise Financial, Inc. ("Ameriprise") announced that it had agreed to purchase the investment management business of CMG with the exception of its cash and liquidity management business which includes the Nations money market Funds. As a result, the Trustees requested information from CMG as to the plans of CMG and its parent with respect to the provision of investment management services to those Funds after the consummation of the proposed transaction. As of the date of this report, that information has not yet been provided. However, as the transaction is not expected to close until the spring o f 2010, the Trustees concluded that they would have ample opportunity to take appropriate steps with respect to the investment management agreements of the money market Funds, including invoking the 60-day termination provisions of those agreements, in response to the information to be provided by CMG and reviewed by the IFC.
In my view, the process by which the proposed management fees of the Funds have been negotiated in 2009 thus far has been, to the extent practicable, at arms' length and reasonable and consistent with the AOD.
B. Nature and Quality of Services, Including Performance
3. The performance of the Funds was relatively strong for the measuring periods ending March 31, 2009. Between one-third and nearly one-half of the Funds were ranked in either the first or second quintiles in the one-, three-, five-, and 10-year periods, and no more than 8% were in the fifth quintile for these periods. Overall, the performance was stronger in the two longer periods.
4. The strongest performing groups over the one-, three-, and five-year periods were active equity, quantitative strategies, and, to a lesser extent, money market Funds. Sub-advised Funds were the weakest performers, with over 60% of the Funds in the bottom two quintiles in the one- and three-year periods. For the same two periods, no more than 15% percent of the sub-advised Funds were in the top two quintiles. Almost half of fixed-income Funds ranked in the bottom two quintiles in the one- and three-year periods.
5. Overall performance of the Funds was less robust in 2009 than in 2008 and 2007 for the one- and three-year performance periods. For example, 62% of the Funds were in the top two quintiles in 2007 for the one-year period compared with 33% in 2009. The ranks of those in the bottom two quintiles rose significantly between 2007 and 2009, led by money market and fixed-income Funds in the one- and three-year periods. For the three-year period, there was a similar trend with respect to sub-advised Funds.
6. The performance of the active equity Funds against their benchmarks was strong for the one-, three-, and five-year performance periods. In contrast, more than half of the sub-advised Funds failed to beat their benchmarks on a net basis in the one- and three-year periods. The fixed-income Funds consistently produced gross returns below those of their benchmarks. Lipper quintile rankings of the actively managed equity Funds are highly correlated with their performance against their benchmarks in the sense that net returns in excess of the benchmark appear necessary to achieve a ranking in one of the top three quintiles. No such correlation was observed for fixed-income and quantitative strategies Funds.
7. The equity Funds' overall performance adjusted for risk was mixed. Based upon three-year returns, less than 40% of the equity Funds had a combination of risk-adjusted and unadjusted returns that placed them in the top half of their performance universes; 60% were in the bottom half of their universes. About 30% of the fixed income Funds posted high returns and low risk relative to comparable funds. Over 60% of the fixed-income Funds took on more risk than the typical fund in their performance universes.
8. The industry-standard procedure used by Lipper that includes all share classes in the performance universe tends to bias a Fund's ranking upward within that universe. The bias occurs because either no-12b-1 fee or low-12b-1 fee share classes of the Nations Funds are compared with funds in performance universes that
50
include all share classes of multi-class funds with 12b-1 fees of up to 100 basis points. Correcting this bias by limiting the performance universe to classes of comparable funds with low or no 12b-1 fees (a "filtered universe") lowers the relative performance for the Funds, but generally not to a material extent. The filtering process, however, did identify two Funds for further review that had not been so identified using unfiltered universes.
9. A small number of Funds have consistently underperformed over the past five years. The exact number depends on the criteria used to evaluate longer-term performance. For example, six different Funds have had below-median performance in at least four out of the five years between 2005 and 2009 for either the one- or three-year performance periods from 2005 to 2009. If the threshold were the 60th percentile, only two Funds would have satisfied the criteria.
10. The services performed by CMG professionals beyond portfolio management, such as compliance, legal, information technology, risk management, finance, and fund administration, are critical to the success of the Funds and appear to be of high quality.
C. Management Fees Charged by Other Mutual Fund Companies
11. The Funds' management fees and total expenses are generally low relative to those of their peers, with over half the Funds ranking in the most favorable two quintiles. For total expenses, slightly more than one-quarter are in the bottom two quintiles, while slightly less than two-fifths are in the bottom two quintiles for actual management fees. Fixed-income and quantitative strategies Funds have the lowest fees and expenses relative to their peers. The sub-advised Funds account for the majority of Funds in the fifth quintile for both management fees and total expenses.
12. The distribution of management fee rankings has changed little over the past three years, while the distribution of total expense rankings has moved in the direction of higher expenses. The most notable change involving total expenses has been a shift in the number of Funds from the first to the second quintile.
13. The management fees of the non-subadvised Funds are generally in line with those of Columbia Funds supervised by the Atlantic Board of Trustees (the "Atlantic Funds"). The sub-advised large cap equity, international equity, and high yield Funds, however, generally have higher management fees than those of comparable Atlantic and non-subadvised Funds.
14. The implementation of the new program of voluntary expense limits appears to have been associated, on balance, with less favorable expense rankings. This result reflects increases in expense limits for certain Funds, the removal of fee waivers, and the shift of certain expenses from CMA to the Funds. The decline in expense rankings is less significant, however, than CMA projected in December 2008.
D. Trustees' Advisory Contract Review Process
15. The Trustees' evaluation process identified 22 Funds in 2009 for further review based upon long-standing criteria relating to their relative performance or expenses or both. When compared in filtered universes, two more Funds met the criteria for further review. At the November meeting, CMG provided further information about each of those Funds to assist the Trustees in their evaluation.
E. Potential Economies of Scale
16. CMG presented to the Trustees its analysis of the sources and sharing of potential economies of scale. CMG views economies of scale as arising at the complex level and would regard estimates of scale economies for individual funds as unreliable. In its analysis, CMG did not identify specific sources of economies of scale or provide any estimates of any economies of scale that might arise from future asset growth. CMG's analysis included measures taken by the Trustees and CMG that seek to share any potential economies of scale through breakpoints in management fee schedules, the establishment of expense limits for each Fund, enhanced shareholder services, fund mergers, and operational consolidation.
17. An examination of the contractual fee schedules for five Nations Funds shows that the schedules for Small Cap II, Municipal Reserves, and Treasury Reserves compare favorably with those of their competitors, while the subadvised Marsico Growth and High Yield VS Funds have schedules generally above those of their peers, including funds that do not have a sub-adviser. The group fee with
51
breakpoints that characterizes the money market Fund schedules is not typically found among competitors, nearly all of which have flat fee schedules.
F. Management Fees Charged to Institutional Clients
18. CMG has provided Trustees with comparisons of mutual fund management fees and institutional fees based upon standardized fee schedules and upon actual fees. The results show that, consistent with industry practice, actual and scheduled institutional fees are generally, but not always, lower than the Funds' management fees. CMG provided additional data this year demonstrating that at small asset levels, the effective fee of certain Funds may be equal to or less than institutional fee levels at those asset levels, due to the effect of expense limits on small funds with high gross expenses. CMG also analyzed the differences between the services provided and risks borne on the one hand by a manager of mutual funds and on the other by institutional advisers, and suggested that these differences should be kept in mind when Trustees review the reasonableness of the Funds' management fees.
G. Revenues, Expenses, and Profits
19. The activity-based cost allocation methodology employed by CMG to allocate costs, both direct and indirect, for purposes of calculating Fund profitability is thoughtful and detailed. This year, CMG further refined the technique by allocating additional indirect expenses on an activity basis.
20. The materials provided on CMG's revenues and expenses with respect to the Funds and the methodology underlying their construction form a sufficient basis for Trustees to evaluate the expenses of and profitability to CMG arising out of its relationships with the Funds.
21. CMG provided a firm-wide pro forma 2009 income statement demonstrating the effect of market events beginning in the fourth quarter of 2008 on its revenues and profitability to provide an additional perspective on calendar 2008 profitability data.
22. In 2008, CMG's pre-tax pre- and post-distribution margins on the Nations Funds were above the industry mean and median, based on limited data available for publicly held mutual fund managers and excluding the costs of CMG's money market capital support programs. However, as is to be expected in a 63-Fund complex, some Nations Funds had relatively high pre-tax profit margins in 2008, when calculated solely with respect to management revenues and expenses, while other Nations Funds operated at a loss. There is a positive relationship between Fund size and profitability to CMG, with smaller Funds generally operating at a loss to CMG.
23. CMG pays a fixed percentage of its management fee revenues to an affiliate, U.S. Trust, Bank of America Private Wealth Management, with respect to assets of its clients invested in Nations Funds to compensate it for services it performs with respect to those client assets and for the effect of state law limitations on affiliates charging multiple fees. Based on our analysis of the services provided by this affiliate, we have concluded that all payments other than those for sub-transfer agent or sub-accounting services should be treated as a distribution expense.
III. Recommendations
1) Criteria for review. The Trustees may wish to consider modifying the criteria for identifying a Fund for further review (a "Review Fund") to include criteria that focus exclusively on performance. They may also wish to consider whether it would be useful to apply CMG's own internal monitoring standards for Fund performance to the contract review process, or whether such criteria are more relevant to their ongoing investment oversight.
2) Presentation of Review Fund discussion. CMG should consider whether it could more systematically present in one discussion all relevant information regarding each Review Fund, which is now split into several different portions of the 15(c) materials. For any Fund that has been a Review Fund in consecutive years, CMG should address under what circumstances it could reasonably be anticipated that the Fund would lose that status.
3) Refinement of tax-exempt performance data. Certain single-state tax-exempt Funds compete in extremely small universes and are compared to a multi-state benchmark of uncertain relevance. Notwithstanding the difficulties, CMG should work to improve the reliability of the calculation of relative performance of these Funds. If that is not possible, CMG should provide guidance on how the Trustees should judge the quality of CMG's management of these Funds.
52
4) Development of risk metrics for asset-allocation, tax-exempt, and money market Funds. CMG has developed and shared with the Trustees quantitative risk metrics comparing equity and taxable fixed-income Funds against their peers. However, reliable risk metrics have not been developed for asset-allocation, tax-exempt fixed income, and money market Funds. We urge CMG to continue its efforts to provide reliable risk measures for these categories of Funds, especially in the cases of asset-allocation and money market funds, because their investors are likely to be motivated at least in part by a desire to manage risk.
5) Profitability data. For any period during which CMG is an affiliate of U.S. Trust, Bank of America Private Wealth Management, CMG should continue to present to the Trustees the profitability of each Fund, each investment style and each complex (of which Nations is one) calculated as follows:
a. Management-only profitability should be calculated without reference to any Private Bank expense.
b. Profitability excluding distribution (which essentially covers the management and transfer agency functions) should be adjusted by removing from the expense calculation any portion of the Private Bank payment not attributable to the performance by the Private Bank of sub-transfer agency or sub-accounting functions.
c. Total profitability, including distribution: No adjustment for Private Bank expenses should be made, because all such expenses represent legitimate fund expenses to be taken into account in calculating CMG's profit margin including distribution.
d. Distribution only: This should include all Private Bank expenses other than those attributable to sub-transfer agency services.
6) Contractual fee analysis. This year CMG presented a new Lipper report comparing the contractual management fees of Funds with those of competitors in similar investment styles. However, the reliability of the conclusion—that Fund management fee breakpoints compared favorably with competitive fee rates—was limited by the use of competitive funds at all asset levels. The sponsors of a $100 million mutual fund may not have given much thought to breakpoints at $5 billion; therefore, that fund's contractual fee at that level is unlikely to compare favorably with that of a $5 billion Fund. Limiting the competitors to the Lipper expense group, whose constituents are similar in size to the rele vant Fund, would make the results more meaningful. In addition, the breakpoints of a select group of Nations Funds (which would differ each year) should continue to be compared to those of industry rivals to ensure that the Funds' breakpoint schedules remain within industry norms. As breakpoint schedules change relatively little each year, performing such a comparison for each Nations Fund each year would not be an efficient use of Trustee and CMG resources.
7) Pro forma profitability data. In any year in which CMG or the Trustees believe that the prior year's profitability is unlikely to be representative of current business results due to changes in markets or for any other reason, CMG should, consistent with this year's practice, prepare a pro forma income statement based on year-to-date actual data and reasonable projections used for its own business planning purposes.
8) Additional institutional data and analysis. While CMG provided a substantial amount of information on its institutional business, we suggest some additional items for future years: (a) profitability data for the institutional business in the format, and based upon the same allocation methodologies, used to present Fund profitability, (b) an explanation of how CMA sets institutional fee breakpoints, which normally begin at asset levels far lower than those found in Fund management fee breakpoints, and (c) distinguishing in all institutional fee materials fees of accounts acquired prior to the development of current fee schedules (so-called "legacy" accounts) from the fees of accounts launched after that time.
9) Management fee disparities. In any future study of management fees, CMG and the Nations Trustees should analyze the differences in management fee schedules. As part of that analysis, CMG should provide an explanation for any significant fee differences among comparable funds across fund families sponsored by CMG, such as differences in the management styles of different Funds included the same Lipper category. Finally, if CMG proposes a management fee change or an expense cap for
53
any mutual fund managed by CMA that is comparable to any Nations Fund, CMG should provide the Trustees with sufficient information about the proposal to allow the Trustees to assess the applicability of the proposed change to the relevant Nations Fund or Funds.
10) Explanation of data supplied to Lipper. Each year, as part of the 15(c) process, CMG retains Lipper to compare the fees and expenses of each Fund to a group of competitors. In many cases, CMG, with the approval of the Trustees, adjusts the actual expense data, which is based on the most recent full fiscal year of the Fund (and each competitive fund) to reflect changes in fees or expense limits that occurred during or after the relevant fiscal year. This improves the reliability and usefulness of the comparison. However, to ensure that the Trustees know when and how CMG adjusted the data, we recommend that CMG prepare a table listing for each Fund what adjustments were made, e.g., to reflect a new expense limitation of x basis points that commenced on y date.
11) Reduction of volume of paper documents submitted. The effort to streamline and better organize the data presented to the Trustees and the process by which that data was prepared and organized continued to be well-received by all parties. Notwithstanding past success, it is always appropriate to look for opportunities to reduce and simplify the presentation of 15(c) data. One possibility would be to remove the 127 pages of biographical data, most if not all of which the Trustees have previously seen as part of their ongoing investment oversight duties, from the paper volume and post it on the Internet-based document storage and retrieval system used by the Funds to provide reference data to Trustees.
Respectfully submitted,
Steven E. Asher
54
This page intentionally left blank.
This page intentionally left blank.
Important Information About This Report
The fund mails one shareholder report to each shareholder address. If you would like more than one report, please call shareholder services at 1-800-345-6611 and additional reports will be sent to you. This report has been prepared for shareholders of Columbia Mid Cap Value Fund.
A description of the policies and procedures that the fund uses to determine how to vote proxies and a copy of the fund's voting records are available (i) at www.columbiamanagement.com, (ii) on the Securities and Exchange Commission's website at www.sec.gov, and (iii) without charge, upon request, by calling 1-800-368-0346. Information regarding how the fund voted proxies relating to portfolio securities during the 12-month period ended June 30 is available from the SEC's website. Information regarding how the fund voted proxies relating to portfolio securities is also available from the fund's website, www.columbiamanagement.com.
The fund files a complete schedule of portfolio holdings with the SEC for the first and third quarters of each fiscal year on Form N-Q. The fund's Form N-Q is available on the SEC's website at www.sec.gov and may be reviewed and copied at the SEC's Public Reference Room in Washington, D.C. Information on the operation of the Public Reference Room may be obtained by calling 1-800-SEC-0330.
Please read and consider the investment objectives, risks, charges and expenses for any fund carefully before investing. For a prospectus which contains this and other important information about the fund, contact your Columbia Management representative or financial advisor or go to www.columbiamanagement.com.
Columbia Management Group, LLC ("Columbia Management") is the investment management division of Bank of America Corporation. Columbia Management entities furnish investment management services and products for institutional and individual investors. Columbia Funds are distributed by Columbia Management Distributors, Inc., member of FINRA, SIPC, part of Columbia Management and an affiliate of Bank of America Corporation.
Transfer Agent
Columbia Management Services, Inc.
P.O. Box 8081
Boston, MA 02266-8081
1-800-345-6611
Distributor
Columbia Management
Distributors, Inc.
One Financial Center
Boston, MA 02111
Investment Advisor
Columbia Management Advisors, LLC
100 Federal Street
Boston, MA 02110
57
Columbia Management®
One Financial Center
Boston, MA 02111-2621
PRSRT STD
U.S. Postage
PAID
Holliston, MA
Permit NO. 20
Columbia Management®
Columbia Mid Cap Value Fund
Annual Report, February 28, 2010
©2010 Columbia Management Distributors, Inc.
One Financial Center, Boston, MA 02111-2621
800-345-6611 www.columbiafunds.com
SHC-42/34606-0210 (04/10) 10/B2I4D4
Columbia Management®
Annual Report
February 28, 2010
Columbia Small Cap Value Fund II
| NOT FDIC INSURED | | May Lose Value | |
|
| NOT BANK ISSUED | | No Bank Guarantee | |
|
Table of Contents
| Fund Profile | | | 1 | | |
|
| Economic Update | | | 2 | | |
|
| Performance Information | | | 4 | | |
|
| Understanding Your Expenses | | | 5 | | |
|
| Financial Statements | | | | | |
|
| Investment Portfolio | | | 8 | | |
|
Statement of Assets and
Liabilities | | | 12 | | |
|
| Statement of Operations | | | 13 | | |
|
Statement of Changes in
Net Assets | | | 14 | | |
|
| Financial Highlights | | | 16 | | |
|
| Notes to Financial Statements | | | 21 | | |
|
Report of Independent Registered
Public Accounting Firm | | | 29 | | |
|
Federal Income Tax
Information | | | 30 | | |
|
| Fund Governance | | | 31 | | |
|
Board Consideration and
Re-Approval of Current
Investment Advisory Agreement | | | 35 | | |
|
Board Consideration and
Approval of Proposed
Investment Advisory Agreement | | | 39 | | |
|
Summary of Management
Fee Evaluation by Independent
Fee Consultant | | | 46 | | |
|
Important Information About
This Report | | | 53 | | |
|
The views expressed in this report reflect the current views of the respective parties. These views are not guarantees of future performance and involve certain risks, uncertainties and assumptions that are difficult to predict, so actual outcomes and results may differ significantly from the views expressed. These views are subject to change at any time based upon economic, market or other conditions and the respective parties disclaim any responsibility to update such views. These views may not be relied on as investment advice and, because investment decisions for a Columbia Fund are based on numerous factors, may not be relied on as an indication of trading intent on behalf of any particular Columbia Fund. References to specific securities should not be construed as a recommendation or investment advice.
President's Message

Dear Shareholder:
As we previously announced, Bank of America, N.A. has reached a definitive agreement to sell Columbia Management's long-term asset management business to Ameriprise Financial, Inc. This includes the management of its equity and fixed-income mutual funds.
This transaction combines two leading asset management firms and will create one entity that is expected to rank as one of the top asset managers. It is anticipated that the combined U.S. asset management business will operate under the well-regarded Columbia Management brand. The combined U.S. asset management business will be led by Ted Truscott, currently president, U.S. asset management, annuities and chief investment officer, Ameriprise Financial. Michael A. Jones, currently president of Columbia Management, will serve as president, U.S. asset management. Colin Moore, chief investment officer at Columbia Management, will continue to serve in that role for the combined organization. I will also continue in my role as head of mutual funds, responsible for the delivery of mutual fund products and services to investors.
As a valued investor in Columbia funds, please know that our goal is to ensure a smooth transition and provide you with the highest quality products and services. We will work closely with colleagues at Ameriprise Financial to seek a seamless transition for our clients and to keep you informed as the transition progresses and key decisions are made. We want to assure you that the funds' portfolio managers continue to focus on providing uninterrupted service to Columbia fund shareholders. Columbia Management and Ameriprise Financial will operate independently until all required approvals, including fund board, fund shareholder and other client approvals, have been received and the transaction closes, which is expected to occur in the spring of this year.
Meanwhile, transition teams across the company have been formed to oversee integration efforts including rebranding initiatives, vendor and system consolidations and client communications. Throughout the transition, we seek to build on best practices from both legacy organizations with enhancements to productivity, quality and the delivery of world-class customer experiences.
Clearly, we have a lot of work ahead of us in 2010. We look forward to introducing our combined business with an even wider breadth of products and capabilities. Everyone at Columbia Management and Ameriprise Financial is excited about the opportunities for this combined organization. I share this optimism and believe it will position us as a best-in-class asset management business with the ability to deliver more for clients than ever before.
Sincerely,

J. Kevin Connaughton
President, Columbia Funds
Fund Profile – Columbia Small Cap Value Fund II
Summary
g For the 12-month period that ended February 28, 2010, the fund's Class A shares returned 64.73% without sales charge.
g The fund performed in line with its benchmark, the Russell 2000 Value Index1, but lagged the average return of its peer group, the Lipper Small-Cap Value Funds Classification.2
g Strong stock selection and an underweight in the financials sector helped the fund keep pace with the benchmark, while a lack of exposure to the more speculative stocks that led the market recovery hampered performance versus the peer group.
Portfolio Management
Christian Stadlinger has co-managed the fund since April 2002 and has been associated with the advisor or its predecessors since 2002.
Jarl Ginsberg has co-managed the fund since February 2003 and has been associated with the advisor or its predecessors since 2003.
Subject to satisfying various conditions to closing, effective on or about May 1, 2010, RiverSource Investments, LLC, a subsidiary of Ameriprise Financial, Inc., is expected to become the investment advisor to the fund and change its name to Columbia Management Investment Advisers, LLC. Please see the fund's prospectus dated July 1, 2009, including the supplements thereto, for more information regarding the expected change in investment advisor and any related changes to the portfolio management of the fund.
1The Russell 2000 Value Index measures the performance of those Russell 2000 Index companies with lower price-to-book ratios and lower forecasted growth values. Indices are not available for investment, are not professionally managed and do not reflect sales charges, fees, brokerage commissions, taxes or other expenses of investing. Securities in the fund may not match those in an index.
2Lipper Inc., a widely respected data provider in the industry, calculates an average total return (assuming reinvestment of distributions) for mutual funds with investment objectives similar to those of the fund. Lipper makes no adjustment for the effect of sales loads.
Performance data quoted represents past performance and current performance may be lower or higher. Past performance is no guarantee of future results. The investment return and principal value will fluctuate so that shares, when redeemed, may be worth more or less than the original cost. Please visit www.columbiafunds.com for daily and most recent month-end performance updates.
Summary
1-year return as of 02/28/10
| | | +64.73% | |
|
| |  | | | Class A shares
(without sales charge) | |
|
| | | | | +65.93% | |
|
| |  | | | Russell 2000 Value Index | |
|
Morningstar Style BoxTM

The Morningstar Style BoxTM reveals a fund's investment strategy. For equity funds, the vertical axis shows the market capitalization of the stocks owned and the horizontal axis shows investment style (value, blend or growth). Information shown is based on the most recent data provided by Morningstar.
1
Economic Update – Columbia Small Cap Value Fund II
Summary
For the 12-month period that ended February 28, 2010
g After a sharp decline, stock markets rebounded around the world, as measured by the S&P 500 Index and the MSCI EAFE Index.
| S&P Index | | MSCI Index | |
|
 | |  | |
|
g As investors grew more comfortable with risk, non-Treasury sectors of the bond market rebounded. The Barclays Capital Aggregate Bond Index delivered solid results. High-yield bonds were strong performers, as measured by the JPMorgan Developed BB High Yield Index.
Barclays
Aggregate
Index | |
JPMorgan
Index | |
|
 | |  | |
|
After a deep and difficult recession, the U.S. economy regained its footing midway through calendar year 2009. Gross domestic product (GDP) turned positive in the third quarter of 2009, rising 2.2%, and then gained 5.6% in the fourth quarter according to the estimate released by the Bureau of Economic Analysis. Growth was primarily the result of federal government stimulus spending and a slowdown in inventory reductions. Hopes for a sustained recovery now depend on a variety of factors, including a rebound in consumer spending, an increase in revenues to keep business profits moving higher and a turnaround in the labor market.
The housing market showed some signs of improvement. Existing home sales fell late in the period, but remained above levels of one year ago. According to the National Association of Realtors, the inventory of houses for sale fell over the course of 2009. Housing prices remained unchanged during the past year, but that was progress compared to 2008. The average home price fell in 2008 and since then distressed properties, which accounted for an estimated 38% of sales in January 2010, have weighed on prices because they were heavily discounted.
In the beleaguered labor market, the good news was that there was less bad news. Businesses continued to shed jobs throughout the period, raising the unemployment rate as high as 10.2% in October 2009. However, the pace of job losses slowed markedly by the period's end. Compared to six figure losses of one year ago, 14,000 jobs were added to the labor market in January 2010 and only 14,000 were lost in February 2010.* The rate of unemployment at the end of the period was 9.7%.* Nevertheless, prospects for a quick recovery in the labor markets are dim. In fact, consumer confidence, as measured monthly by The Conference Board, an independent research organization, took a sharp dive in February. Consumers surveyed cited worsening business conditions and a bleaker outlook for the labor markets and income for their pessimism.
Manufacturing activity remained slow during the first few months of the period. However, a key measure—the Institute for Supply Management's Index—rose above 50 in July and remained well above 50 for the remainder of the period. A value above 50 tends to indicate that the economy is growing. Industrial production turned positive in January 2010, and durable goods orders took a big jump forward. Manufacturing capacity utilization inched upward to 72.6%.
Consumer spending registered both ups and downs during the 12-month period, but the trend at the end of the period was upward, even though personal income decreased in January 2010. In light of uncertainty about the economy and pressure on consumers from a number of sectors, the Federal Reserve Board (the Fed) kept a key short-term interest rate—the federal funds rate—close to zero throughout the period.
Stocks bottomed, then rebounded
Against a strengthening economic backdrop, a stock market rally that began in mid-March 2009 continued throughout the period. The U.S. stock market returned 53.62% for the 12-month period, as measured by the S&P 500 Index.1 Mid-cap stocks
*Source: U.S. Bureau of Labor Statistics
1The Standard & Poor's (S&P) 500 Index tracks the performance of 500 widely held, large-capitalization U.S. stocks.
2
Economic Update (continued) – Columbia Small Cap Value Fund II
outperformed large and small-cap stocks and value stocks outperformed growth stocks by a solid margin, as measured by their respective Russell indices.2 Outside the U.S., stock market returns were even stronger. The MSCI EAFE Index,3 a broad gauge of stock market performance in foreign developed markets, gained 54.58% (net of dividends, in U.S. dollars) for the period. Emerging stock markets were caught in last year's downdraft, but they bounced back stronger than domestic or developed world markets in 2009 as their economic growth generally outpaced the developed world. The MSCI Emerging Markets Index4 returned 91.63% (net of dividends, in U.S. dollars).
Bond returns ranged from solid to strong
As hopes for a recovery materialized, bonds from non-Treasury sectors delivered solid returns. The Barclays Capital Aggregate Bond Index5 returned 9.32%. Municipal bonds delivered returns that were in line with taxable investment-grade bonds even without factoring in potential tax advantages to investors in higher income tax brackets. The Barclays Capital Municipal Bond Index6 returned 9.98%. High-yield bond prices rebounded strongly in 2009. For the 12-month period covered by this report, the JPMorgan Developed BB High Yield Index7 returned 32.79%.
Past performance is no guarantee of future results.
2The Russell 1000 Index tracks the performance of 1,000 of the largest U.S. companies, based on market capitalization. The Russell Midcap Index measures the performance of the 800 smallest companies in the Russell 1000 Index, which represents approximately 25% of the total market capitalization of the Russell 1000 Index. The Russell 2000 Index measures the performance of the 2,000 smallest companies in the Russell 3000 Index, which represents approximately 8% of the total market capitalization of the Russell 3000 Index. The Russell 3000 Growth Index measures the performance of those Russell 3000 Index companies with higher price-to-book ratios and higher forecasted growth values. The stocks in this index are also members of either the Russell 1000 Growth or the Russell 2000 Growth indexes. The Russell 3000 Value Index measures the performance of those Russell 3000 Index companies with lower price-to-book ratios and lo wer forecasted growth values. The stocks in this index are also members of either the Russell 1000 Value or the Russell 2000 Value indexes.
3The Morgan Stanley Capital International Europe, Australasia, Far East (MSCI EAFE) Index is a capitalization-weighted index that tracks the total return of common stocks in 21 developed-market countries within Europe, Australasia and the Far East.
4The Morgan Stanley Capital International Emerging Markets Index (MSCI EMI) is a free float-adjusted market capitalization index that is designed to measure equity market performance of emerging markets. As of June 2009, the MSCI Emerging Markets Index consisted of the following 22 emerging market country indices: Brazil, Chile, China, Colombia, Czech Republic, Egypt, Hungary, India, Indonesia, Israel, Korea, Malaysia, Mexico, Morocco, Peru, Philippines, Poland, Russia, South Africa, Taiwan, Thailand, and Turkey.
5The Barclays Capital Aggregate Bond Index is a market value-weighted index that tracks the daily price, coupon, pay-downs and total return performance of fixed-rate, publicly placed, dollar-denominated and non-convertible investment grade debt issues with at least $250 million par amount outstanding and with at least one year to final maturity.
6The Barclays Capital Municipal Bond Index is considered representative of the broad market for investment-grade, tax-exempt bonds with a maturity of at least one year.
7The JPMorgan Developed BB High Yield Index is an unmanaged index designed to mirror the investable universe of the U.S. dollar developed, BB-rated, high yield corporate debt market.
Indices are not available for investment, are not professionally managed and do not reflect sales charges, fees, brokerage commissions, taxes or other expenses of investing. Securities in the fund may not match those in an index.
3
Performance Information – Columbia Small Cap Value Fund II
Performance data quoted represents past performance and current performance may be lower or higher. Past performance is no guarantee of future results. The investment return and principal value will fluctuate so that shares, when redeemed, may be worth more or less than the original cost. Please visit www.columbiafunds.com for daily and most recent month-end performance updates.
Annual operating expense ratio (%)*
| Class A | | | 1.32 | | |
| Class B | | | 2.07 | | |
| Class C | | | 2.07 | | |
| Class R | | | 1.57 | | |
| Class Z | | | 1.07 | | |
*The annual operating expense ratio is as stated in the fund's prospectus that is current as of the date of this report and includes the expenses incurred by the investment companies in which the fund invests. Differences in expense ratios disclosed elsewhere in this report may result from expenses incurred by the investment companies, inclusion of fee waivers and expense reimbursements as well as the use of different time periods used in calculating the ratios.
Performance of a $10,000 investment 05/01/02 – 02/28/10
The chart above shows the change in value of a hypothetical $10,000 investment in Class A shares of Columbia Small Cap Value Fund II during the stated time period, and does not reflect the deduction of taxes that a shareholder may pay on fund distributions or on the redemption of fund shares.
Performance of a $10,000 investment 05/01/02 – 02/28/10 ($)
| Sales charge | | without | | with | |
| Class A | | | 15,759 | | | | 14,852 | | |
| Class B | | | 14,852 | | | | 14,852 | | |
| Class C | | | 14,845 | | | | 14,845 | | |
| Class R | | | 15,574 | | | | n/a | | |
| Class Z | | | 16,059 | | | | n/a | | |
Average annual total return as of 02/28/10 (%)
| Share class | | A | | B | | C | | R | | Z | |
| Inception | | 05/01/02 | | 05/01/02 | | 05/01/02 | | 01/23/06 | | 05/01/02 | |
| Sales charge | | without | | with | | without | | with | | without | | with | | without | | without | |
| 1-year | | | 64.73 | | | | 55.28 | | | | 63.48 | | | | 58.48 | | | | 63.33 | | | | 62.33 | | | | 64.32 | | | | 64.94 | | |
| 5-year | | | 1.88 | | | | 0.68 | | | | 1.11 | | | | 0.78 | | | | 1.11 | | | | 1.11 | | | | 1.64 | | | | 2.13 | | |
| Life | | | 5.98 | | | | 5.18 | | | | 5.18 | | | | 5.18 | | | | 5.17 | | | | 5.17 | | | | 5.82 | | | | 6.23 | | |
Average annual total return as of 03/31/10 (%)
| Share class | | A | | B | | C | | R | | Z | |
| Sales charge | | without | | with | | without | | with | | without | | with | | without | | without | |
| 1-year | | | 61.25 | | | | 51.94 | | | | 60.20 | | | | 55.20 | | | | 60.28 | | | | 59.28 | | | | 60.85 | | | | 61.76 | | |
| 5-year | | | 3.60 | | | | 2.39 | | | | 2.82 | | | | 2.49 | | | | 2.82 | | | | 2.82 | | | | 3.36 | | | | 3.86 | | |
| Life | | | 6.77 | | | | 5.98 | | | | 5.97 | | | | 5.97 | | | | 5.97 | | | | 5.97 | | | | 6.62 | | | | 7.04 | | |
The "with sales charge" returns include the maximum initial sales charge of 5.75% for Class A shares, the applicable contingent deferred sales charge of 5.00% in the first year, declining to 1.00% in the sixth year and eliminated thereafter for Class B shares and 1.00% for Class C shares for the first year only. The "without sales charge" returns do not include the effect of sales charges. If they had, returns would be lower.
Performance results reflect any fee waivers or reimbursements of fund expenses by the investment advisor and/or any of its affiliates. Absent these fee waivers or expense reimbursement arrangements, performance results would have been lower.
All results shown assume reinvestment of distributions. Class Z shares are sold at net asset value with no distribution and service (Rule 12b-1) fees. Class R shares are sold at net asset value with distribution and service (Rule 12b-1) fees. Class R and Class Z shares have limited eligibility and the investment minimum requirements may vary. Please see the fund's prospectus for details. Performance for different share classes will vary based on differences in sales charges and fees associated with each class.
The tables do not reflect the deduction of taxes that a shareholder may pay on fund distributions or on the redemption of fund shares.
The returns for Class R shares include the returns of Class A shares prior to January 23, 2006, the date on which Class R shares were initially offered by the fund. If differences in expenses had been reflected, the returns shown would have been lower, since Class R shares are subject to higher distribution and service (Rule 12b-1) fees.
4
Understanding Your Expenses – Columbia Small Cap Value Fund II
As a fund shareholder, you incur two types of costs. There are transaction costs, which generally include sales charges on purchases and may include redemption fees or exchange fees. There are also ongoing costs, which generally include investment advisory fees, distribution and service (Rule 12b-1) fees and other fund expenses. The information on this page is intended to help you understand the ongoing costs of investing in the fund and to compare these costs with the ongoing costs of investing in other mutual funds.
Analyzing your fund's expenses by share class
To illustrate these ongoing costs, we have provided an example and calculated the expenses paid by investors in each share class during the period. The information in the following table is based on an initial investment of $1,000, which is invested at the beginning of the period and held for the entire period. Expense information is calculated two ways and each method provides you with different information. The amount listed in the "Actual" column is calculated using the fund's actual operating expenses and total return for the period. The amount listed in the "Hypothetical" column for each share class assumes that the return each year is 5% before expenses and is calculated based on the fund's actual operating expenses. You should not use the hypothetical account values and expenses to estimate either your actual account balance at the end of the period or the expenses you paid during this period.
Compare with other funds
Since all mutual funds are required to include the same hypothetical calculations about expenses in shareholder reports, you can use this information to compare the ongoing cost of investing in the fund with other funds. To do so, compare the 5% hypothetical example with the 5% hypothetical examples that appear in the shareholder reports of other funds. As you compare hypothetical examples of other funds, it is important to note that hypothetical examples are meant to highlight the ongoing costs of investing in a fund and do not reflect any transaction costs, such as sales charges, redemption fees or exchange fees.
Estimating your actual expenses
To estimate the expenses that you paid over the period, first you will need your account balance at the end of the period:
g For shareholders who receive their account statements from Columbia Management Services, Inc., your account balance is available online at www.columbiafunds.com or by calling Shareholder Services at 800.345.6611.
g For shareholders who receive their account statements from their financial intermediary, contact your financial intermediary to obtain your account balance.
1. Divide your ending account balance by $1,000. For example, if an account balance was $8,600 at the end of the period, the result would be 8.6.
2. In the section of the table below titled "Expenses paid during the period," locate the amount for your share class. You will find this number in the column labeled "Actual." Multiply this number by the result from step 1. Your answer is an estimate of the expenses you paid on your account during the period.
If the value of your account falls below the minimum initial investment requirement applicable to you, your account generally will be subject to a $20 annual fee. This fee is not included in the accompanying table. If you are subject to the fee, keep it in mind when you are estimating the ongoing expenses of investing in the fund and when comparing the expenses of this fund with other funds.
09/01/09 – 02/28/10
| | | Account value at the
beginning of the period ($) | | Account value at the
end of the period ($) | | Expenses paid
during the period ($) | | Fund's annualized
expense ratio (%) | |
| | | Actual | | Hypothetical | | Actual | | Hypothetical | | Actual | | Hypothetical | | Actual | |
| Class A | | | 1,000.00 | | | | 1,000.00 | | | | 1,100.40 | | | | 1,018.20 | | | | 6.93 | | | | 6.66 | | | | 1.33 | | |
| Class B | | | 1,000.00 | | | | 1,000.00 | | | | 1,096.10 | | | | 1,014.48 | | | | 10.81 | | | | 10.39 | | | | 2.08 | | |
| Class C | | | 1,000.00 | | | | 1,000.00 | | | | 1,096.20 | | | | 1,014.48 | | | | 10.81 | | | | 10.39 | | | | 2.08 | | |
| Class R | | | 1,000.00 | | | | 1,000.00 | | | | 1,098.70 | | | | 1,016.96 | | | | 8.22 | | | | 7.90 | | | | 1.58 | | |
| Class Z | | | 1,000.00 | | | | 1,000.00 | | | | 1,101.80 | | | | 1,019.44 | | | | 5.63 | | | | 5.41 | | | | 1.08 | | |
Expenses paid during the period are equal to the annualized expense ratio for the share class, multiplied by the average account value over the period, then multiplied by the number of days in the fund's most recent fiscal half-year and divided by 365.
It is important to note that the expense amounts shown in the table are meant to highlight only ongoing costs of investing in the fund and do not reflect any transaction costs, such as sales charges, redemption fees or exchange fees. Therefore, the hypothetical examples provided may not help you determine the relative total costs of owning shares of different funds. If these transaction costs were included, your costs would have been higher.
5
Portfolio Managers' Report – Columbia Small Cap Value Fund II
Performance data quoted represents past performance and current performance may be lower or higher. Past performance is no guarantee of future results. The investment return and principal value will fluctuate so that shares, when redeemed, may be worth more or less than the original cost. Please visit www.columbiafunds.com for daily and most recent month-end performance updates.
Net asset value per share
as of 02/28/10 ($)
| Class A | | | 11.05 | | |
| Class B | | | 10.61 | | |
| Class C | | | 10.60 | | |
| Class R | | | 11.01 | | |
| Class Z | | | 11.11 | | |
Distributions declared per share
03/01/09 – 02/28/10 ($)
| Class A | | | 0.05 | | |
| Class R | | | 0.03 | | |
| Class Z | | | 0.07 | | |
For the 12-month period that ended February 28, 2010, the fund's Class A shares returned 64.73% without sales charge. By comparison, the fund's benchmark, the Russell 2000 Value Index, returned 65.93%, and the Lipper Small-Cap Value Funds Classification average, a peer comparison, returned 73.99%. Strong stock selection, particularly in the financials and consumer staples sectors, and an underweight in utilities helped the fund keep pace with its benchmark, while a lack of exposure to more speculative stocks caused the fund to fall behind its peer group.
Sharp market recovery led by higher-risk stocks
Stocks that had been beaten down the most, particularly lower-quality, higher-risk small companies with high levels of debt on their balance sheets, posted the strongest gains in the market rebound that began last spring. Stocks across most sectors rallied amid signs that the economy was improving and the credit markets were beginning to stabilize. Among the best performers were stocks in economically-sensitive sectors, such as consumer discretionary and materials. Small banks were a notable exception in the rally, due to concerns over credit deterioration and their capital levels. More defensive sectors, such as utilities and consumer staples, posted strong, but more modest, returns.
Emphasis on value companies with improving earnings prospects
Throughout the period, we remained focused on attractively priced stocks issued by companies that showed improving operating performance. In keeping with the fund's long-standing investment strategy, it did not own the most distressed names that led the recent market rally. Yet, it kept pace with the index, largely by avoiding financials with deteriorating credit outlooks. Within the financials sector, we focused instead on financially strong insurance and specialty finance companies. The fund benefited as its financials holdings posted gains that far surpassed the sector average. Top performers included National Financial Partners, which sells financial planning and insurance to wealthy individuals and small businesses, and LaSalle Hotel Properties, a hotel real estate investment trust (0.7% and 1.1% of net assets, respectively). In addition, our strategy of buying mid-cap stocks that had fallen into the small-cap universe duri ng the market downturn further aided results. In this regard, purchases included XL Capital, a property and casualty insurer, and Lincoln National, a life insurer, both of which rebounded sharply. We took profits and sold both stocks. The fund also benefited by avoiding deep losses in the banking sector, which were commonplace last year. Underweights in the financials and utilities sectors, along with positive stock selection in consumer staples, also contributed positively to results.
Strong returns, but relative underperformance in technology and health care
The fund's technology and health care investments generated strong returns but not as strong as those in the index. In technology, the fund had less exposure than the index to commodity-like semiconductor stocks, which were leading performers as the market recovered. Instead, we favored electronic equipment and communications equipment companies, which we believed had more stable, long-term earnings outlooks. An overweight in health care, coupled with a lack of exposure to biotechnology stocks,
6
Portfolio Managers' Report (continued) – Columbia Small Cap Value Fund II
further hindered results. Owning more stable names, such as PharMerica, a pharmaceutical company that serves a range of health-care institutions, also hampered performance as investors shifted into higher-risk stocks. Finally, returns in the consumer discretionary sector were positive on an absolute basis, but trailed those in the index. The fund lost ground from its lack of exposure to highly speculative auto parts suppliers, homebuilders and leisure companies, all of which rose sharply during the period.
Looking ahead
Despite the market's strong run this past year, we believe that small-cap value companies with strong underlying earnings prospects and whose shares are attractively priced have the potential to continue to reward investors. The opportunities that are most attractive to us include "out-of-the-limelight" companies that have been overlooked by Wall Street analysts; cyclically-driven companies in out-of-favor industries and companies with compressed operating profit margins that seem poised to expand within a reasonable timeframe. The fund tends to have modest overweights in areas where we are finding attractive opportunities, which at period end included technology, the personal products segment of consumer staples and commercial services and supplies within industrials.
Portfolio characteristics and holdings are subject to change periodically and may not be representative of current characteristics and holdings. The outlook for this fund may differ from those presented for other Columbia Funds.
Equity securities are subject to stock market fluctuations that occur in response to economic and business developments.
Value stocks are stocks of companies that may have experienced adverse business or industry developments or may be subject to special risks that have caused the stocks to be out of favor. If the manager's assessment of a company's prospects is wrong, the price of its stock may not approach the value the manager has placed on it.
Stocks of small-cap companies pose special risks, including possible illiquidity and greater price volatility than stocks of larger, more established companies.
Top 5 sectors
as of 02/28/10 (%)
| Financials | | | 29.1 | | |
| Industrials | | | 18.2 | | |
| Information Technology | | | 12.3 | | |
| Consumer Discretionary | | | 11.7 | | |
| Materials | | | 6.9 | | |
Top 10 holdings
as of 02/28/10 (%)
| East West Bancorp | | | 1.2 | | |
| Bowne & Co | | | 1.2 | | |
Mid-America Apartment
Communities | | | 1.2 | | |
| Invacare | | | 1.2 | | |
| Pier 1 Imports | | | 1.2 | | |
| American Italian Pasta | | | 1.2 | | |
| New Jersey Resources | | | 1.1 | | |
| Atmos Energy | | | 1.1 | | |
| Swift Energy | | | 1.1 | | |
| IBERIABANK | | | 1.1 | | |
The fund is actively managed and the composition of its portfolio will change over time. Information provided is calculated as a percentage of net assets.
7
Investment Portfolio – Columbia Small Cap Value Fund II
February 28, 2010
| Common Stocks – 97.4% | |
| | | Shares | | Value ($) | |
| Consumer Discretionary – 11.7% | |
| Auto Components – 2.5% | |
| ArvinMeritor, Inc. (a) | | | 1,130,000 | | | | 13,175,800 | | |
| Dana Holding Corp. (a) | | | 938,000 | | | | 10,665,060 | | |
| Tenneco Automotive, Inc. (a) | | | 580,000 | | | | 11,692,800 | | |
| Auto Components Total | | | 35,533,660 | | |
| Automobiles – 1.0% | |
| Thor Industries, Inc. | | | 430,000 | | | | 14,589,900 | | |
| Automobiles Total | | | 14,589,900 | | |
| Diversified Consumer Services – 1.7% | |
| Regis Corp. | | | 740,000 | | | | 12,232,200 | | |
Stewart Enterprises, Inc.,
Class A | | | 2,480,000 | | | | 12,152,000 | | |
| Diversified Consumer Services Total | | | 24,384,200 | | |
| Hotels, Restaurants & Leisure – 0.7% | |
| Bally Technologies, Inc. (a) | | | 252,000 | | | | 10,435,320 | | |
| Hotels, Restaurants & Leisure Total | | | 10,435,320 | | |
| Household Durables – 1.8% | |
| Helen of Troy Ltd. (a) | | | 615,000 | | | | 14,864,550 | | |
| Tupperware Brands Corp. | | | 215,000 | | | | 10,046,950 | | |
| Household Durables Total | | | 24,911,500 | | |
| Media – 0.5% | |
World Wrestling
Entertainment, Inc. | | | 425,000 | | | | 7,246,250 | | |
| Media Total | | | 7,246,250 | | |
| Specialty Retail – 2.6% | |
| Chico's FAS, Inc. (a) | | | 572,200 | | | | 7,753,310 | | |
| New York & Co., Inc. (a) | | | 1,557,519 | | | | 5,778,395 | | |
| Pier 1 Imports, Inc. (a) | | | 2,710,000 | | | | 16,558,100 | | |
| Talbots, Inc. (a) | | | 567,800 | | | | 6,154,952 | | |
| Specialty Retail Total | | | 36,244,757 | | |
| Textiles, Apparel & Luxury Goods – 0.9% | |
| Warnaco Group, Inc. (a) | | | 295,000 | | | | 12,313,300 | | |
| Textiles, Apparel & Luxury Goods Total | | | 12,313,300 | | |
| Consumer Discretionary Total | | | 165,658,887 | | |
| Consumer Staples – 4.1% | |
| Food Products – 1.6% | |
American Italian Pasta Co.,
Class A (a) | | | 425,000 | | | | 16,490,000 | | |
Corn Products
International, Inc. | | | 190,000 | | | | 6,190,200 | | |
| Food Products Total | | | 22,680,200 | | |
| | | Shares | | Value ($) | |
| Personal Products – 1.5% | |
| Inter Parfums, Inc. | | | 770,000 | | | | 10,456,600 | | |
Nu Skin Enterprises, Inc.,
Class A | | | 380,000 | | | | 10,153,600 | | |
| Personal Products Total | | | 20,610,200 | | |
| Tobacco – 1.0% | |
| Universal Corp. | | | 275,000 | | | | 14,588,750 | | |
| Tobacco Total | | | 14,588,750 | | |
| Consumer Staples Total | | | 57,879,150 | | |
| Energy – 5.6% | |
| Energy Equipment & Services – 2.2% | |
Hornbeck Offshore
Services, Inc. (a) | | | 325,000 | | | | 6,136,000 | | |
| ION Geophysical Corp. (a) | | | 2,125,000 | | | | 9,732,500 | | |
| Oil States International, Inc. (a) | | | 350,000 | | | | 15,057,000 | | |
| Energy Equipment & Services Total | | | 30,925,500 | | |
| Oil, Gas & Consumable Fuels – 3.4% | |
| Bill Barrett Corp. (a) | | | 305,000 | | | | 10,342,550 | | |
| Patriot Coal Corp. (a) | | | 570,000 | | | | 9,496,200 | | |
| Stone Energy Corp. (a) | | | 740,000 | | | | 12,617,000 | | |
| Swift Energy Co. (a) | | | 515,000 | | | | 15,341,850 | | |
| Oil, Gas & Consumable Fuels Total | | | 47,797,600 | | |
| Energy Total | | | 78,723,100 | | |
| Financials – 29.1% | |
| Capital Markets – 1.6% | |
| Apollo Investment Corp. | | | 720,000 | | | | 8,395,200 | | |
| KBW, Inc. (a) | | | 322,781 | | | | 7,669,277 | | |
| Stifel Financial Corp. (a) | | | 130,000 | | | | 7,111,000 | | |
| Capital Markets Total | | | 23,175,477 | | |
| Commercial Banks – 9.1% | |
| Bancorpsouth, Inc. | | | 500,000 | | | | 9,735,000 | | |
| Community Bank System, Inc. | | | 660,000 | | | | 14,790,600 | | |
| East West Bancorp, Inc. | | | 1,000,000 | | | | 17,520,000 | | |
First Horizon
National Corp. (a) | | | 510,000 | | | | 6,528,000 | | |
| IBERIABANK Corp. | | | 265,000 | | | | 15,134,150 | | |
| Independent Bank Corp. MA | | | 600,000 | | | | 14,748,000 | | |
| Prosperity Bancshares, Inc. | | | 335,000 | | | | 14,013,050 | | |
Texas Capital
Bancshares, Inc. (a) | | | 770,000 | | | | 12,974,500 | | |
| Umpqua Holdings Corp. | | | 1,210,000 | | | | 15,100,800 | | |
| Wilmington Trust Corp. | | | 585,400 | | | | 8,441,468 | | |
| Commercial Banks Total | | | 128,985,568 | | |
See Accompanying Notes to Financial Statements.
8
Columbia Small Cap Value Fund II
February 28, 2010
| Common Stocks (continued) | |
| | | Shares | | Value ($) | |
| Insurance – 6.4% | |
Argo Group International
Holdings Ltd. | | | 360,365 | | | | 10,028,958 | | |
| Arthur J. Gallagher & Co. | | | 303,500 | | | | 7,202,055 | | |
| Aspen Insurance Holdings Ltd. | | | 430,000 | | | | 12,151,800 | | |
| Assured Guaranty Ltd. | | | 240,000 | | | | 5,064,000 | | |
Delphi Financial Group, Inc.,
Class A | | | 542,758 | | | | 11,577,028 | | |
| First American Corp. | | | 185,000 | | | | 5,962,550 | | |
| Max Capital Group Ltd. | | | 515,000 | | | | 12,432,100 | | |
National Financial
Partners Corp. (a) | | | 907,870 | | | | 10,431,426 | | |
Platinum Underwriters
Holdings Ltd. | | | 400,000 | | | | 14,956,000 | | |
| Insurance Total | | | 89,805,917 | | |
| Real Estate Investment Trusts (REITs) – 8.3% | |
| Brandywine Realty Trust | | | 1,350,000 | | | | 15,133,500 | | |
| Capstead Mortgage Corp. | | | 625,000 | | | | 7,775,000 | | |
| Highwoods Properties, Inc. | | | 420,000 | | | | 12,201,000 | | |
| LaSalle Hotel Properties | | | 770,000 | | | | 14,945,700 | | |
| LTC Properties, Inc. | | | 450,000 | | | | 11,736,000 | | |
Mid-America Apartment
Communities, Inc. | | | 325,000 | | | | 16,880,500 | | |
OMEGA Healthcare
Investors, Inc. | | | 690,000 | | | | 13,089,300 | | |
| Tanger Factory Outlet Centers | | | 330,000 | | | | 13,751,100 | | |
| U-Store-It Trust | | | 1,850,000 | | | | 12,043,500 | | |
Real Estate Investment Trusts
(REITs) Total | | | 117,555,600 | | |
| Thrifts & Mortgage Finance – 3.7% | |
First Niagara Financial
Group, Inc. | | | 975,000 | | | | 13,689,000 | | |
| MGIC Investment Corp. (a) | | | 1,150,000 | | | | 8,809,000 | | |
| Northwest Bancshares, Inc. | | | 1,075,000 | | | | 12,695,750 | | |
| Ocwen Financial Corp. (a) | | | 920,000 | | | | 9,945,200 | | |
| Radian Group, Inc. | | | 775,000 | | | | 7,610,500 | | |
| Thrifts & Mortgage Finance Total | | | 52,749,450 | | |
| Financials Total | | | 412,272,012 | | |
| Health Care – 5.7% | |
| Health Care Equipment & Supplies – 2.9% | |
| CONMED Corp. (a) | | | 510,000 | | | | 11,158,800 | | |
| Cooper Companies, Inc. | | | 332,900 | | | | 13,335,974 | | |
| Invacare Corp. | | | 610,000 | | | | 16,640,800 | | |
| Health Care Equipment & Supplies Total | | | 41,135,574 | | |
| | | Shares | | Value ($) | |
| Health Care Providers & Services – 2.8% | |
| Amedisys, Inc. (a) | | | 234,100 | | | | 13,495,865 | | |
| Healthspring, Inc. (a) | | | 650,000 | | | | 11,966,500 | | |
| Kindred Healthcare, Inc. (a) | | | 810,000 | | | | 14,110,200 | | |
| Health Care Providers & Services Total | | | 39,572,565 | | |
| Health Care Total | | | 80,708,139 | | |
| Industrials – 18.2% | |
| Aerospace & Defense – 1.9% | |
| BE Aerospace, Inc. (a) | | | 486,000 | | | | 12,587,400 | | |
Esterline Technologies
Corp. (a) | | | 325,000 | | | | 13,373,750 | | |
| Aerospace & Defense Total | | | 25,961,150 | | |
| Airlines – 1.6% | |
| AirTran Holdings, Inc. (a) | | | 1,725,000 | | | | 8,314,500 | | |
| UAL Corp. (a) | | | 850,000 | | | | 14,577,500 | | |
| Airlines Total | | | 22,892,000 | | |
| Building Products – 0.6% | |
| Insteel Industries, Inc. | | | 815,344 | | | | 8,275,741 | | |
| Building Products Total | | | 8,275,741 | | |
| Commercial Services & Supplies – 4.6% | |
| Bowne & Co., Inc. | | | 1,550,000 | | | | 17,251,500 | | |
| Brink's Co. | | | 250,000 | | | | 6,370,000 | | |
| Cenveo, Inc. (a) | | | 1,425,000 | | | | 10,630,500 | | |
| Cornell Companies, Inc. (a) | | | 429,747 | | | | 8,010,484 | | |
| Deluxe Corp. | | | 616,088 | | | | 11,058,780 | | |
| Waste Services, Inc. (a) | | | 1,078,100 | | | | 10,867,248 | | |
| Commercial Services & Supplies Total | | | 64,188,512 | | |
| Construction & Engineering – 1.5% | |
| EMCOR Group, Inc. (a) | | | 410,000 | | | | 9,438,200 | | |
Sterling Construction Co.,
Inc. (a) | | | 605,000 | | | | 11,876,150 | | |
| Construction & Engineering Total | | | 21,314,350 | | |
| Electrical Equipment – 1.0% | |
| Brady Corp., Class A (b) | | | 425,000 | | | | 11,908,500 | | |
| C&D Technologies, Inc. (a)(b) | | | 1,400,000 | | | | 2,310,000 | | |
| Electrical Equipment Total | | | 14,218,500 | | |
| Machinery – 1.8% | |
| Barnes Group, Inc. | | | 375,000 | | | | 6,022,500 | | |
| Gardner Denver, Inc. | | | 316,000 | | | | 13,780,760 | | |
| Terex Corp. (a) | | | 311,900 | | | | 6,072,693 | | |
| Machinery Total | | | 25,875,953 | | |
See Accompanying Notes to Financial Statements.
9
Columbia Small Cap Value Fund II
February 28, 2010
| Common Stocks (continued) | |
| | | Shares | | Value ($) | |
| Marine – 0.4% | |
| Diana Shipping, Inc. (a) | | | 425,000 | | | | 5,911,750 | | |
| Marine Total | | | 5,911,750 | | |
| Professional Services – 1.1% | |
| Advisory Board Co. (a) | | | 160,000 | | | | 5,081,600 | | |
| CBIZ, Inc. (a) | | | 750,000 | | | | 4,672,500 | | |
| SFN Group, Inc. (a) | | | 743,926 | | | | 5,854,698 | | |
| Professional Services Total | | | 15,608,798 | | |
| Road & Rail – 1.2% | |
| RailAmerica, Inc. (a) | | | 850,000 | | | | 10,064,000 | | |
| Werner Enterprises, Inc. | | | 320,000 | | | | 7,139,200 | | |
| Road & Rail Total | | | 17,203,200 | | |
| Trading Companies & Distributors – 2.5% | |
| Houston Wire & Cable Co. | | | 860,000 | | | | 10,552,200 | | |
| Textainer Group Holdings Ltd. | | | 685,149 | | | | 14,148,327 | | |
| United Rentals, Inc. (a) | | | 1,475,000 | | | | 11,136,250 | | |
| Trading Companies & Distributors Total | | | 35,836,777 | | |
| Industrials Total | | | 257,286,731 | | |
| Information Technology – 12.3% | |
| Communications Equipment – 1.8% | |
Brocade Communications
Systems, Inc. (a) | | | 1,050,000 | | | | 6,111,000 | | |
| Ciena Corp. (a) | | | 835,000 | | | | 11,973,900 | | |
| CommScope, Inc. (a) | | | 290,000 | | | | 7,392,100 | | |
| Communications Equipment Total | | | 25,477,000 | | |
| Electronic Equipment, Instruments & Components – 3.2% | |
| Anixter International, Inc. (a) | | | 170,000 | | | | 7,095,800 | | |
| Brightpoint, Inc. (a) | | | 1,175,000 | | | | 8,377,750 | | |
Rofin-Sinar
Technologies, Inc. (a) | | | 500,000 | | | | 10,245,000 | | |
| Rogers Corp. (a) | | | 480,000 | | | | 13,176,000 | | |
| Technitrol, Inc. | | | 1,500,000 | | | | 6,600,000 | | |
Electronic Equipment, Instruments &
Components Total | | | 45,494,550 | | |
| IT Services – 0.8% | |
| iGate Corp. | | | 530,000 | | | | 4,844,200 | | |
| infoGROUP, Inc. (a) | | | 766,500 | | | | 6,154,995 | | |
| IT Services Total | | | 10,999,195 | | |
| Semiconductors & Semiconductor Equipment – 4.6% | |
| Atmel Corp. (a) | | | 2,125,000 | | | | 9,583,750 | | |
| Cirrus Logic, Inc. (a) | | | 1,300,000 | | | | 9,282,000 | | |
Fairchild Semiconductor
International, Inc. (a) | | | 1,065,000 | | | | 10,990,800 | | |
| | | Shares | | Value ($) | |
| FEI Co. (a) | | | 405,000 | | | | 8,618,400 | | |
| IXYS Corp. (a) | | | 850,000 | | | | 7,233,500 | | |
| Skyworks Solutions, Inc. (a) | | | 910,000 | | | | 13,895,700 | | |
| Ultra Clean Holdings (a) | | | 560,841 | | | | 4,974,660 | | |
Semiconductors & Semiconductor
Equipment Total | | | 64,578,810 | | |
| Software – 1.9% | |
| Ariba, Inc. (a) | | | 631,600 | | | | 7,585,516 | | |
| Lawson Software, Inc. (a) | | | 1,650,000 | | | | 9,933,000 | | |
| Mentor Graphics Corp. (a) | | | 1,154,900 | | | | 9,608,768 | | |
| Software Total | | | 27,127,284 | | |
| Information Technology Total | | | 173,676,839 | | |
| Materials – 6.9% | |
| Chemicals – 2.3% | |
| Olin Corp. | | | 495,000 | | | | 8,667,450 | | |
| Rockwood Holdings, Inc. (a) | | | 500,000 | | | | 11,995,000 | | |
| Solutia, Inc. (a) | | | 875,000 | | | | 12,311,250 | | |
| Chemicals Total | | | 32,973,700 | | |
| Containers & Packaging – 2.0% | |
| Boise, Inc. (a) | | | 2,400,000 | | | | 11,400,000 | | |
| Graham Packaging Co., Inc. (a) | | | 431,155 | | | | 4,509,881 | | |
| Rock-Tenn Co., Class A | | | 300,000 | | | | 12,552,000 | | |
| Containers & Packaging Total | | | 28,461,881 | | |
| Metals & Mining – 2.1% | |
| AK Steel Holding Corp. | | | 460,000 | | | | 9,903,800 | | |
RTI International
Metals, Inc. (a) | | | 430,000 | | | | 10,332,900 | | |
Schnitzer Steel Industries, Inc.,
Class A | | | 190,000 | | | | 8,675,400 | | |
| Metals & Mining Total | | | 28,912,100 | | |
| Paper & Forest Products – 0.5% | |
Schweitzer-Mauduit
International, Inc. | | | 165,000 | | | | 7,573,500 | | |
| Paper & Forest Products Total | | | 7,573,500 | | |
| Materials Total | | | 97,921,181 | | |
| Telecommunication Services – 0.6% | |
| Diversified Telecommunication Services – 0.6% | |
| Cincinnati Bell, Inc. (a) | | | 2,900,000 | | | | 8,584,000 | | |
| Diversified Telecommunication Services Total | | | 8,584,000 | | |
| Telecommunication Services Total | | | 8,584,000 | | |
See Accompanying Notes to Financial Statements.
10
Columbia Small Cap Value Fund II
February 28, 2010
| Common Stocks (continued) | |
| | | Shares | | Value ($) | |
| Utilities – 3.2% | |
| Electric Utilities – 1.0% | |
| Westar Energy, Inc. | | | 682,400 | | | | 14,603,360 | | |
| Electric Utilities Total | | | 14,603,360 | | |
| Gas Utilities – 2.2% | |
| Atmos Energy Corp. | | | 561,800 | | | | 15,427,028 | | |
| New Jersey Resources Corp. | | | 440,600 | | | | 16,046,652 | | |
| Gas Utilities Total | | | 31,473,680 | | |
| Utilities Total | | | 46,077,040 | | |
Total Common Stocks
(cost of $1,219,660,008) | | | 1,378,787,079 | | |
| Short-Term Obligation – 3.1% | |
| | | Par ($) | | | |
Repurchase agreement
with Fixed Income Clearing
Corp., dated 02/26/10,
due 03/01/10 at 0.050%,
collateralized by a
U.S. Government Agency
obligation maturing
01/18/11, market value
$44,940,225 (repurchase
proceeds $44,055,184) | | | 44,055,000 | | | | 44,055,000 | | |
Total Short-Term Obligation
(cost of $44,055,000) | | | 44,055,000 | | |
Total Investments – 100.5%
(cost of $1,263,715,008)(c) | | | 1,422,842,079 | | |
| Other Assets & Liabilities, Net – (0.5)% | | | (6,615,956 | ) | |
| Net Assets – 100.0% | | | 1,416,226,123 | | |
Notes to Investment Portfolio:
(a) Non-income producing security.
(b) An affiliate may include any company in which the Fund owns five percent or more of its outstanding voting shares. Transactions in these affiliated companies during the year ended February 28, 2010, are as follows:
| Affiliate | | Value,
beginning
of period | | Purchases | | Sales
Proceeds | | Dividend
Income | | Value,
end of
period | |
Brady Corp.,
Class A. | | $ | — | | | $ | 12,265,066 | | | $ | — | | | $ | 148,750 | | | $ | 11,908,500 | | |
C&D
Technologies, Inc. | | | 1,518,900 | | | | 376,787 | | | | — | | | | — | | | | 2,310,000 | | |
| Total | | $ | 1,518,900 | | | $ | 12,641,853 | | | $ | — | | | $ | 148,750 | | | $ | 14,218,500 | | |
(c) Cost for federal income tax purposes is $1,267,875,526.
The following table summarizes the inputs used, as of February 28, 2010 in valuing the Fund's assets:
| Description | | Quoted
Prices
(Level 1) | | Other
Significant
Observable
Inputs
(Level 2) | | Significant
Unobservable
Inputs
(Level 3) | | Total | |
| Total Common Stocks | | $ | 1,378,787,079 | | | $ | — | | | $ | — | | | $ | 1,378,787,079 | | |
Total Short-Term
Obligations | | | — | | | | 44,055,000 | | | | — | | | | 44,055,000 | | |
| Total Investments | | $ | 1,378,787,079 | | | $ | 44,055,000 | | | $ | — | | | $ | 1,422,842,079 | | |
For more information on valuation inputs, and their aggregation into the levels used in the table above, please refer to the Security Valuation section in the accompanying Notes to Financial Statements.
At February 28, 2010, the Fund held investments in the following sectors:
Sector (Unaudited) | | % of
Net Assets | |
| Financials | | | 29.1 | | |
| Industrials | | | 18.2 | | |
| Information Technology | | | 12.3 | | |
| Consumer Discretionary | | | 11.7 | | |
| Materials | | | 6.9 | | |
| Health Care | | | 5.7 | | |
| Energy | | | 5.6 | | |
| Consumer Staples | | | 4.1 | | |
| Utilities | | | 3.2 | | |
| Telecommunication Services | | | 0.6 | | |
| | | | 97.4 | | |
| Short-Term Obligation | | | 3.1 | | |
| Other Assets & Liabilities, Net | | | (0.5 | ) | |
| | | 100.0 | | |
See Accompanying Notes to Financial Statements.
11
Statement of Assets and Liabilities – Columbia Small Cap Value Fund II
February 28, 2010
| | | | | ($) | |
| Assets | | Unaffiliated investments, at identified cost | | | 1,243,256,170 | | |
| | | Affiliated investments, at identified cost | | | 20,458,838 | | |
| | | Total investments, at identified cost | | | 1,263,715,008 | | |
| | | Unaffiliated investments, at value | | | 1,408,623,579 | | |
| | | Affiliated investments, at value | | | 14,218,500 | | |
| | | Total investments, at value | | | 1,422,842,079 | | |
| | | Cash | | | 123 | | |
| | | Receivable for: | | | | | |
| | | Investments sold | | | 12,541,955 | | |
| | | Fund shares sold | | | 2,745,624 | | |
| | | Dividends | | | 1,266,487 | | |
| | | Interest | | | 184 | | |
| | | Prepaid expenses | | | 14,612 | | |
| | | Total Assets | | | 1,439,411,064 | | |
| Liabilities | | Payable for: | | | | | |
| | | Investments purchased | | | 19,324,204 | | |
| | | Fund shares repurchased | | | 2,057,838 | | |
| | | Investment advisory fee | | | 689,697 | | |
| | | Administration fee | | | 167,446 | | |
| | | Pricing and bookkeeping fees | | | 11,983 | | |
| | | Transfer agent fee | | | 665,675 | | |
| | | Trustees' fees | | | 36,965 | | |
| | | Custody fee | | | 8,427 | | |
| | | Distribution and service fees | | | 105,877 | | |
| | | Chief compliance officer expenses | | | 196 | | |
| | | Other liabilities | | | 116,633 | | |
| | | Total Liabilities | | | 23,184,941 | | |
| | | Net Assets | | | 1,416,226,123 | | |
| Net Assets Consist of | | Paid-in capital | | | 1,599,341,398 | | |
| | | Accumulated net realized loss | | | (342,242,346 | ) | |
| | | Net unrealized appreciation on investments | | | 159,127,071 | | |
| | | Net Assets | | | 1,416,226,123 | | |
| Class A | | Net assets | | $ | 414,900,914 | | |
| | | Shares outstanding | | | 37,557,280 | | |
| | | Net asset value per share (a) | | $ | 11.05 | | |
| | | Maximum sales charge | | | 5.75 | % | |
| | | Maximum offering price per share (b) | | $ | 11.72 | | |
| Class B | | Net assets | | $ | 3,030,569 | | |
| | | Shares outstanding | | | 285,687 | | |
| | | Net asset value and offering price per share (a) | | $ | 10.61 | | |
| Class C | | Net assets | | $ | 23,588,036 | | |
| | | Shares outstanding | | | 2,225,440 | | |
| | | Net asset value and offering price per share (a) | | $ | 10.60 | | |
| Class R | | Net assets | | $ | 22,755,227 | | |
| | | Shares outstanding | | | 2,066,788 | | |
| | | Net asset value, offering and redemption price per share | | $ | 11.01 | | |
| Class Z | | Net assets | | $ | 951,951,377 | | |
| | | Shares outstanding | | | 85,649,948 | | |
| | | Net asset value, offering and redemption price per share | | $ | 11.11 | | |
(a) Redemption price per share is equal to net asset value less any applicable contingent deferred sales charge.
(b) On sales of $50,000 or more the offering price is reduced.
See Accompanying Notes to Financial Statements.
12
Statement of Operations – Columbia Small Cap Value Fund II
For the Year Ended February 28, 2010
| | | | | ($) | |
| Investment Income | | Dividends | | | 21,021,859 | | |
| | | Dividends from affiliates | | | 148,750 | | |
| | | Interest | | | 29,084 | | |
| | | Total Investment Income | | | 21,199,693 | | |
| Expenses | | Investment advisory fee | | | 8,000,936 | | |
| | | Administration fee | | | 1,916,545 | | |
| | | Distribution fee: | | | | | |
| | | Class B | | | 22,185 | | |
| | | Class C | | | 188,396 | | |
| | | Class R | | | 103,273 | | |
| | | Service fee: | | | | | |
| | | Class B | | | 7,388 | | |
| | | Class C | | | 62,797 | | |
| | | Distribution and service fees: | | | | | |
| | | Class A | | | 869,827 | | |
| | | Pricing and bookkeeping fees | | | 141,971 | | |
| | | Transfer agent fee | | | 2,310,710 | | |
| | | Trustees' fees | | | 39,868 | | |
| | | Custody fee | | | 66,796 | | |
| | | Chief compliance officer expenses | | | 1,069 | | |
| | | Other expenses | | | 415,691 | | |
| | | Total Expenses | | | 14,147,452 | | |
| | | Expense reductions | | | (31 | ) | |
| | | Net Expenses | | | 14,147,421 | | |
| | | Net Investment Income | | | 7,052,272 | | |
| Net Realized and Unrealized Gain (Loss) on Investments | | | |
| | | Net realized loss on investments | | | (118,900,672 | ) | |
| | | Net change in unrealized appreciation on investments | | | 657,053,898 | | |
| | | Net Gain | | | 538,153,226 | | |
| | | Net Increase Resulting from Operations | | | 545,205,498 | | |
See Accompanying Notes to Financial Statements.
13
Statement of Changes in Net Assets – Columbia Small Cap Value Fund II
| Increase (Decrease) in Net Assets | | | | Year Ended
February 28,
2010 ($) | | Year Ended
February 28,
2009 ($) | |
| Operations | | Net investment income | | | 7,052,272 | | | | 14,244,706 | | |
| | | Net realized loss on investments | | | (118,900,672 | ) | | | (209,071,640 | ) | |
| | | Net change in unrealized appreciation (depreciation)
on investments | | | 657,053,898 | | | | (448,879,414 | ) | |
| | | Net increase (decrease) resulting from operations | | | 545,205,498 | | | | (643,706,348 | ) | |
| Distributions to Shareholders | | From net investment income: | | | | | | | | | |
| | | Class A | | | (1,714,316 | ) | | | (3,853,806 | ) | |
| | | Class B | | | — | | | | (14,111 | ) | |
| | | Class C | | | — | | | | (137,499 | ) | |
| | | Class R | | | (57,675 | ) | | | (176,638 | ) | |
| | | Class Z | | | (5,280,281 | ) | | | (10,573,772 | ) | |
| | | From return of capital: | | | | | | | | | |
| | | Class A | | | (175,829 | ) | | | — | | |
| | | Class B | | | — | | | | — | | |
| | | Class C | | | — | | | | — | | |
| | | Class R | | | (5,915 | ) | | | — | | |
| | | Class Z | | | (541,574 | ) | | | — | | |
| | | Total distributions to shareholders | | | (7,775,590 | ) | | | (14,755,826 | ) | |
| | | Net Capital Stock Transactions | | | 62,677,087 | | | | 386,461,833 | | |
| | | Total increase (decrease) in net assets | | | 600,106,995 | | | | (272,000,341 | ) | |
| Net Assets | | Beginning of period | | | 816,119,128 | | | | 1,088,119,469 | | |
| | | End of period | | | 1,416,226,123 | | | | 816,119,128 | | |
| | | Undistributed net investment income at end of period | | | — | | | | — | | |
See Accompanying Notes to Financial Statements.
14
Statement of Changes in Net Assets (continued) – Columbia Small Cap Value Fund II
| | | Capital Stock Activity | |
| | | Year Ended | | Year Ended | |
| | | February 28, 2010 | | February 28, 2009 | |
| | | Shares | | Dollars ($) | | Shares | | Dollars ($) | |
| Class A | |
| Subscriptions | | | 16,882,535 | | | | 160,610,818 | | | | 20,089,474 | | | | 226,503,868 | | |
| Distributions reinvested | | | 161,026 | | | | 1,682,721 | | | | 418,878 | | | | 3,313,340 | | |
| Redemptions | | | (14,467,480 | ) | | | (137,280,953 | ) | | | (15,667,900 | ) | | | (165,929,455 | ) | |
| Net increase | | | 2,576,081 | | | | 25,012,586 | | | | 4,840,452 | | | | 63,887,753 | | |
| Class B | |
| Subscriptions | | | 1,997 | | | | 18,579 | | | | 21,059 | | | | 244,977 | | |
| Distributions reinvested | | | — | | | | — | | | | 1,639 | | | | 12,509 | | |
| Redemptions | | | (81,783 | ) | | | (731,165 | ) | | | (104,159 | ) | | | (1,042,426 | ) | |
| Net decrease | | | (79,786 | ) | | | (712,586 | ) | | | (81,461 | ) | | | (784,940 | ) | |
| Class C | |
| Subscriptions | | | 113,786 | | | | 1,015,570 | | | | 779,636 | | | | 9,057,660 | | |
| Distributions reinvested | | | — | | | | — | | | | 10,819 | | | | 82,444 | | |
| Redemptions | | | (1,303,758 | ) | | | (11,623,525 | ) | | | (1,321,666 | ) | | | (12,766,148 | ) | |
| Net decrease | | | (1,189,972 | ) | | | (10,607,955 | ) | | | (531,211 | ) | | | (3,626,044 | ) | |
| Class R | |
| Subscriptions | | | 686,240 | | | | 6,326,881 | | | | 1,601,357 | | | | 18,451,317 | | |
| Distributions reinvested | | | 5,492 | | | | 57,226 | | | | 20,180 | | | | 159,220 | | |
| Redemptions | | | (820,740 | ) | | | (7,835,346 | ) | | | (563,596 | ) | | | (5,924,133 | ) | |
| Net increase (decrease) | | | (129,008 | ) | | | (1,451,239 | ) | | | 1,057,941 | | | | 12,686,404 | | |
| Class Z | |
| Subscriptions | | | 29,773,189 | | | | 280,330,566 | | | | 44,863,675 | | | | 507,257,666 | | |
| Distributions reinvested | | | 391,889 | | | | 4,118,759 | | | | 902,574 | | | | 7,263,771 | | |
| Redemptions | | | (24,297,675 | ) | | | (234,013,044 | ) | | | (19,250,966 | ) | | | (200,222,777 | ) | |
| Net increase | | | 5,867,403 | | | | 50,436,281 | | | | 26,515,283 | | | | 314,298,660 | | |
See Accompanying Notes to Financial Statements.
15
Financial Highlights – Columbia Small Cap Value Fund II
Selected data for a share outstanding throughout each period is as follows:
| | | Year Ended February 28, | | Year Ended
February 29, | | Period Ended
February 28, | | Year Ended March 31, | |
| Class A Shares | | 2010 | | 2009 | | 2008 | | 2007 (a) | | 2006 (b) | | 2005 | |
| Net Asset Value, Beginning of Period | | $ | 6.74 | | | $ | 12.21 | | | $ | 13.86 | | | $ | 14.12 | | | $ | 12.52 | | | $ | 12.26 | | |
| Income from Investment Operations: | |
| Net investment income (loss) (c) | | | 0.04 | | | | 0.11 | | | | 0.06 | | | | 0.03 | | | | 0.04 | | | | (0.04 | ) | |
Net realized and unrealized gain (loss)
on investments and foreign currency | | | 4.32 | | | | (5.47 | ) | | | (1.21 | ) | | | 0.65 | | | | 2.98 | | | | 1.47 | | |
| Total from investment operations | | | 4.36 | | | | (5.36 | ) | | | (1.15 | ) | | | 0.68 | | | | 3.02 | | | | 1.43 | | |
| Less Distributions to Shareholders: | |
| From net investment income | | | (0.04 | ) | | | (0.11 | ) | | | (0.05 | ) | | | (0.01 | ) | | | (0.03 | ) | | | — | | |
| From net realized gains | | | — | | | | — | | | | (0.45 | ) | | | (0.93 | ) | | | (1.39 | ) | | | (1.17 | ) | |
| From return of capital | | | (0.01 | ) | | | — | | | | — | | | | — | | | | — | | | | — | | |
| Total distributions to shareholders | | | (0.05 | ) | | | (0.11 | ) | | | (0.50 | ) | | | (0.94 | ) | | | (1.42 | ) | | | (1.17 | ) | |
| Net Asset Value, End of Period | | $ | 11.05 | | | $ | 6.74 | | | $ | 12.21 | | | $ | 13.86 | | | $ | 14.12 | | | $ | 12.52 | | |
| Total return (d) | | | 64.73 | % | | | (44.03 | )% | | | (8.74 | )% | | | 5.49 | %(e) | | | 26.14 | % | | | 13.42 | %(f) | |
Ratios to Average Net Assets/
Supplemental Data: | |
| Net expenses before interest expense (g) | | | 1.32 | % | | | 1.28 | % | | | 1.26 | % | | | 1.27 | %(h) | | | 1.23 | % | | | 1.47 | % | |
| Interest expense | | | — | | | | — | | | | — | | | | — | | | | — | | | | — | %(i) | |
| Net expenses (g) | | | 1.32 | % | | | 1.28 | % | | | 1.26 | % | | | 1.27 | %(h) | | | 1.23 | % | | | 1.47 | % | |
| Waiver/Reimbursement | | | — | | | | — | | | | — | | | | — | | | | — | | | | 0.02 | % | |
| Net investment income (loss) (g) | | | 0.44 | % | | | 1.05 | % | | | 0.46 | % | | | 0.25 | %(h) | | | 0.33 | % | | | (0.30 | )% | |
| Portfolio turnover rate | | | 70 | % | | | 56 | % | | | 41 | % | | | 61 | %(e) | | | 80 | % | | | 61 | % | |
| Net assets, end of period (000s) | | $ | 414,901 | | | $ | 235,871 | | | $ | 368,060 | | | $ | 118,549 | | | $ | 8,646 | | | $ | 4,868 | | |
(a) The Fund changed its fiscal year end from March 31 to February 28. Per share data and total return reflect activity from April 1, 2006 through February 28, 2007.
(b) On August 22, 2005, the Fund's Investor A shares were renamed Class A shares.
(c) Per share data was calculated using the average shares outstanding during the period.
(d) Total return at net asset value assuming all distributions reinvested and no initial sales charge or contingent deferred sales charge.
(e) Not annualized.
(f) Had the investment advisor and/or any of its affiliates not waived fees or reimbursed a portion of expenses, total return would have been reduced.
(g) The benefits derived from expense reductions had an impact of less than 0.01%.
(h) Annualized.
(i) Rounds to less than 0.01%.
See Accompanying Notes to Financial Statements.
16
Financial Highlights – Columbia Small Cap Value Fund II
Selected data for a share outstanding throughout each period is as follows:
| | | Year Ended February 28, | | Year Ended
February 29, | | Period Ended
February 28, | | Year Ended March 31, | |
| Class B Shares | | 2010 | | 2009 | | 2008 | | 2007 (a) | | 2006 (b) | | 2005 | |
| Net Asset Value, Beginning of Period | | $ | 6.49 | | | $ | 11.74 | | | $ | 13.41 | | | $ | 13.76 | | | $ | 12.28 | | | $ | 12.13 | | |
| Income from Investment Operations: | |
| Net investment income (loss) (c) | | | (0.03 | ) | | | 0.03 | | | | (0.04 | ) | | | (0.06 | ) | | | (0.05 | ) | | | (0.12 | ) | |
Net realized and unrealized gain (loss)
on investments and foreign currency | | | 4.15 | | | | (5.24 | ) | | | (1.18 | ) | | | 0.64 | | | | 2.90 | | | | 1.44 | | |
| Total from investment operations | | | 4.12 | | | | (5.21 | ) | | | (1.22 | ) | | | 0.58 | | | | 2.85 | | | | 1.32 | | |
| Less Distributions to Shareholders: | |
| From net investment income | | | — | | | | (0.04 | ) | | | — | | | | — | | | | — | | | | — | | |
| From net realized gains | | | — | | | | — | | | | (0.45 | ) | | | (0.93 | ) | | | (1.37 | ) | | | (1.17 | ) | |
| Total distributions to shareholders | | | — | | | | (0.04 | ) | | | (0.45 | ) | | | (0.93 | ) | | | (1.37 | ) | | | (1.17 | ) | |
| Net Asset Value, End of Period | | $ | 10.61 | | | $ | 6.49 | | | $ | 11.74 | | | $ | 13.41 | | | $ | 13.76 | | | $ | 12.28 | | |
| Total return (d) | | | 63.48 | % | | | (44.46 | )% | | | (9.49 | )% | | | 4.82 | %(e) | | | 25.12 | % | | | 12.59 | %(f) | |
Ratios to Average Net Assets/
Supplemental Data: | |
| Net expenses before interest expense (g) | | | 2.07 | % | | | 2.03 | % | | | 2.01 | % | | | 2.02 | %(h) | | | 1.98 | % | | | 2.22 | % | |
| Interest expense | | | — | | | | — | | | | — | | | | — | | | | — | | | | — | %(i) | |
| Net expenses (g) | | | 2.07 | % | | | 2.03 | % | | | 2.01 | % | | | 2.02 | %(h) | | | 1.98 | % | | | 2.22 | % | |
| Waiver/Reimbursement | | | — | | | | — | | | | — | | | | — | | | | — | | | | 0.02 | % | |
| Net investment income (loss) (g) | | | (0.29 | )% | | | 0.29 | % | | | (0.28 | )% | | | (0.53 | )%(h) | | | (0.43 | )% | | | (1.05 | )% | |
| Portfolio turnover rate | | | 70 | % | | | 56 | % | | | 41 | % | | | 61 | %(e) | | | 80 | % | | | 61 | % | |
| Net assets, end of period (000s) | | $ | 3,031 | | | $ | 2,373 | | | $ | 5,248 | | | $ | 3,746 | | | $ | 2,158 | | | $ | 1,569 | | |
(a) The Fund changed its fiscal year end from March 31 to February 28. Per share data and total return reflect activity from April 1, 2006 through February 28, 2007.
(b) On August 22, 2005, the Fund's Investor B shares were renamed Class B shares.
(c) Per share data was calculated using the average shares outstanding during the period.
(d) Total return at net asset value assuming all distributions reinvested and no contingent deferred sales charge.
(e) Not annualized.
(f) Had the investment advisor and/or any of its affiliates not waived fees or reimbursed a portion of expenses, total return would have been reduced.
(g) The benefits derived from expense reductions had an impact of less than 0.01%.
(h) Annualized.
(i) Rounds to less than 0.01%.
See Accompanying Notes to Financial Statements.
17
Financial Highlights – Columbia Small Cap Value Fund II
Selected data for a share outstanding throughout each period is as follows:
| | | Year Ended February 28, | | Year Ended
February 29, | | Period Ended
February 28, | | Year Ended March 31, | |
| Class C Shares | | 2010 | | 2009 | | 2008 | | 2007 (a) | | 2006 (b) | | 2005 | |
| Net Asset Value, Beginning of Period | | $ | 6.49 | | | $ | 11.73 | | | $ | 13.40 | | | $ | 13.75 | | | $ | 12.27 | | | $ | 12.13 | | |
| Income from Investment Operations: | |
| Net investment income (loss) (c) | | | (0.02 | ) | | | 0.03 | | | | (0.04 | ) | | | (0.06 | ) | | | (0.04 | ) | | | (0.12 | ) | |
Net realized and unrealized gain (loss)
on investments and foreign currency | | | 4.13 | | | | (5.23 | ) | | | (1.18 | ) | | | 0.64 | | | | 2.89 | | | | 1.43 | | |
| Total from investment operations | | | 4.11 | | | | (5.20 | ) | | | (1.22 | ) | | | 0.58 | | | | 2.85 | | | | 1.31 | | |
| Less Distributions to Shareholders: | |
| From net investment income | | | — | | | | (0.04 | ) | | | — | | | | — | | | | — | | | | — | | |
| From net realized gains | | | — | | | | — | | | | (0.45 | ) | | | (0.93 | ) | | | (1.37 | ) | | | (1.17 | ) | |
| Total distributions to shareholders | | | — | | | | (0.04 | ) | | | (0.45 | ) | | | (0.93 | ) | | | (1.37 | ) | | | (1.17 | ) | |
| Net Asset Value, End of Period | | $ | 10.60 | | | $ | 6.49 | | | $ | 11.73 | | | $ | 13.40 | | | $ | 13.75 | | | $ | 12.27 | | |
| Total return (d) | | | 63.33 | % | | | (44.41 | )% | | | (9.49 | )% | | | 4.83 | %(e) | | | 25.14 | % | | | 12.51 | %(f) | |
Ratios to Average Net Assets/
Supplemental Data: | |
| Net expenses before interest expense (g) | | | 2.07 | % | | | 2.03 | % | | | 2.01 | % | | | 2.02 | %(h) | | | 1.98 | % | | | 2.22 | % | |
| Interest expense | | | — | | | | — | | | | — | | | | — | | | | — | | | | — | %(i) | |
| Net expenses (g) | | | 2.07 | % | | | 2.03 | % | | | 2.01 | % | | | 2.02 | %(h) | | | 1.98 | % | | | 2.22 | % | |
| Waiver/Reimbursement | | | — | | | | — | | | | — | | | | — | | | | — | | | | 0.02 | % | |
| Net investment income (loss) (g) | | | (0.27 | )% | | | 0.29 | % | | | (0.29 | )% | | | (0.49 | )%(h) | | | (0.32 | )% | | | (1.05 | )% | |
| Portfolio turnover rate | | | 70 | % | | | 56 | % | | | 41 | % | | | 61 | %(e) | | | 80 | % | | | 61 | % | |
| Net assets, end of period (000s) | | $ | 23,588 | | | $ | 22,159 | | | $ | 46,303 | | | $ | 17,032 | | | $ | 1,671 | | | $ | 370 | | |
(a) The Fund changed its fiscal year end from March 31 to February 28. Per share data and total return reflect activity from April 1, 2006 through February 28, 2007.
(b) On August 22, 2005, the Fund's Investor C shares were renamed Class C shares.
(c) Per share data was calculated using the average shares outstanding during the period.
(d) Total return at net asset value assuming all distributions reinvested and no contingent deferred sales charge.
(e) Not annualized.
(f) Had the investment advisor and/or any of its affiliates not waived fees or reimbursed a portion of expenses, total return would have been reduced.
(g) The benefits derived from expense reductions had an impact of less than 0.01%.
(h) Annualized.
(i) Rounds to less than 0.01%.
See Accompanying Notes to Financial Statements.
18
Financial Highlights – Columbia Small Cap Value Fund II
Selected data for a share outstanding throughout each period is as follows:
| | | Year Ended February 28, | | Year Ended
February 29, | | Period Ended
February 28, | | Period Ended
March 31, | |
| Class R Shares | | 2010 | | 2009 | | 2008 | | 2007 (a) | | 2006 (b) | |
| Net Asset Value, Beginning of Period | | $ | 6.72 | | | $ | 12.17 | | | $ | 13.83 | | | $ | 14.11 | | | $ | 12.93 | | |
| Income from Investment Operations: | |
| Net investment income (c) | | | 0.02 | | | | 0.09 | | | | 0.03 | | | | — | (d) | | | — | | |
Net realized and unrealized gain (loss)
on investments and foreign currency | | | 4.30 | | | | (5.45 | ) | | | (1.22 | ) | | | 0.65 | | | | 1.18 | | |
| Total from investment operations | | | 4.32 | | | | (5.36 | ) | | | (1.19 | ) | | | 0.65 | | | | 1.18 | | |
| Less Distributions to Shareholders: | |
| From net investment income | | | (0.03 | ) | | | (0.09 | ) | | | (0.02 | ) | | | — | | | | — | | |
| From net realized gains | | | — | | | | — | | | | (0.45 | ) | | | (0.93 | ) | | | — | | |
| From return of capital | | | — | (d) | | | — | | | | — | | | | — | | | | — | | |
| Total distributions to shareholders | | | (0.03 | ) | | | (0.09 | ) | | | (0.47 | ) | | | (0.93 | ) | | | — | | |
| Net Asset Value, End of Period | | $ | 11.01 | | | $ | 6.72 | | | $ | 12.17 | | | $ | 13.83 | | | $ | 14.11 | | |
| Total return (e) | | | 64.32 | % | | | (44.18 | )% | | | (9.03 | )% | | | 5.22 | %(f) | | | 9.13 | %(f) | |
Ratios to Average Net Assets/
Supplemental Data: | |
| Net expenses (g) | | | 1.57 | % | | | 1.53 | % | | | 1.51 | % | | | 1.52 | %(h) | | | 1.36 | %(h) | |
| Net investment income (loss) (g) | | | 0.20 | % | | | 0.82 | % | | | 0.20 | % | | | (0.02 | )%(h) | | | 0.03 | %(h) | |
| Portfolio turnover rate | | | 70 | % | | | 56 | % | | | 41 | % | | | 61 | %(f) | | | 80 | %(f) | |
| Net assets, end of period (000s) | | $ | 22,755 | | | $ | 14,765 | | | $ | 13,851 | | | $ | 1,727 | | | $ | 11 | | |
(a) The Fund changed its fiscal year end from March 31 to February 28. Per share data and total return reflect activity from April 1, 2006 through February 28, 2007.
(b) Class R shares commenced operations on January 23, 2006. Per share data and total return reflect activity from that date.
(c) Per share data was calculated using the average shares outstanding during the period.
(d) Rounds to less than $0.01 per share.
(e) Total return at net asset value assuming all distributions reinvested.
(f) Not annualized.
(g) The benefits derived from expense reductions had an impact of less than 0.01%.
(h) Annualized.
See Accompanying Notes to Financial Statements.
19
Financial Highlights – Columbia Small Cap Value Fund II
Selected data for a share outstanding throughout each period is as follows:
| | | Year Ended February 28, | | Year Ended
February 29, | | Period Ended
February 28, | | Year Ended March 31, | |
| Class Z Shares | | 2010 | | 2009 | | 2008 | | 2007 (a) | | 2006 (b) | | 2005 | |
| Net Asset Value, Beginning of Period | | $ | 6.78 | | | $ | 12.29 | | | $ | 13.95 | | | $ | 14.21 | | | $ | 12.60 | | | $ | 12.30 | | |
| Income from Investment Operations: | |
| Net investment income (loss) (c) | | | 0.07 | | | | 0.14 | | | | 0.10 | | | | 0.06 | | | | 0.07 | | | | (0.01 | ) | |
Net realized and unrealized gain (loss)
on investments and foreign currency | | | 4.33 | | | | (5.51 | ) | | | (1.23 | ) | | | 0.67 | | | | 3.00 | | | | 1.48 | | |
| Total from investment operations | | | 4.40 | | | | (5.37 | ) | | | (1.13 | ) | | | 0.73 | | | | 3.07 | | | | 1.47 | | |
| Less Distributions to Shareholders: | |
| From net investment income | | | (0.06 | ) | | | (0.14 | ) | | | (0.08 | ) | | | (0.06 | ) | | | (0.06 | ) | | | — | (d) | |
| From net realized gains | | | — | | | | — | | | | (0.45 | ) | | | (0.93 | ) | | | (1.40 | ) | | | (1.17 | ) | |
| From return of capital | | | (0.01 | ) | | | — | | | | — | | | | — | | | | — | | | | — | | |
| Total distributions to shareholders | | | (0.07 | ) | | | (0.14 | ) | | | (0.53 | ) | | | (0.99 | ) | | | (1.46 | ) | | | (1.17 | ) | |
| Net Asset Value, End of Period | | $ | 11.11 | | | $ | 6.78 | | | $ | 12.29 | | | $ | 13.95 | | | $ | 14.21 | | | $ | 12.60 | | |
| Total return (e) | | | 64.94 | % | | | (43.87 | )% | | | (8.55 | )% | | | 5.77 | %(f) | | | 26.43 | % | | | 13.72 | %(g) | |
Ratios to Average Net Assets/
Supplemental Data: | |
| Net expenses before interest expense (h) | | | 1.07 | % | | | 1.03 | % | | | 1.01 | % | | | 1.02 | %(i) | | | 0.98 | % | | | 1.22 | % | |
| Interest expense | | | — | | | | — | | | | — | | | | — | | | | — | | | | — | %(j) | |
| Net expenses (h) | | | 1.07 | % | | | 1.03 | % | | | 1.01 | % | | | 1.02 | %(i) | | | 0.98 | % | | | 1.22 | % | |
| Waiver/Reimbursement | | | — | | | | — | | | | — | | | | — | | | | — | | | | 0.02 | % | |
| Net investment income (loss) (h) | | | 0.68 | % | | | 1.33 | % | | | 0.71 | % | | | 0.47 | %(i) | | | 0.56 | % | | | (0.05 | )% | |
| Portfolio turnover rate | | | 70 | % | | | 56 | % | | | 41 | % | | | 61 | %(f) | | | 80 | % | | | 61 | % | |
| Net assets, end of period (000s) | | $ | 951,951 | | | $ | 540,951 | | | $ | 654,658 | | | $ | 393,160 | | | $ | 238,856 | | | $ | 197,829 | | |
(a) The Fund changed its fiscal year end from March 31 to February 28. Per share data and total return reflect activity from April 1, 2006 through February 28, 2007.
(b) On August 22, 2005, the Fund's Primary A shares were renamed Class Z shares.
(c) Per share data was calculated using the average shares outstanding during the period.
(d) Rounds to less than $0.01 per share.
(e) Total return at net asset value assuming all distributions reinvested.
(f) Not annualized.
(g) Had the investment advisor and/or any of its affiliates not waived fees or reimbursed a portion of expenses, total return would have been reduced.
(h) The benefits derived from expense reductions had an impact of less than 0.01%.
(i) Annualized.
(j) Rounds to less than 0.01%.
See Accompanying Notes to Financial Statements.
20
Notes to Financial Statements – Columbia Small Cap Value Fund II
February 28, 2010
Note 1. Organization
Columbia Small Cap Value Fund II (the "Fund"), a series of Columbia Funds Series Trust (the "Trust"), is a diversified fund. The Trust is registered under the Investment Company Act of 1940, as amended (the "1940 Act"), as an open-end management investment company organized as a Delaware statutory trust.
Investment Objective
The Fund seeks long-term capital appreciation.
Fund Shares
The Trust may issue an unlimited number of shares, and the Fund offers five classes of shares: Class A, Class B, Class C, Class R and Class Z shares. Each share class has its own expense structure and sales charges, as applicable. Effective June 22, 2009, the Fund no longer accepts investments from new or existing investors in the Fund's Class B shares, except in connection with the reinvestment of any dividend and/or capital gain distributions in Class B shares of the Fund and exchanges by existing Class B shareholders of the other Columbia Funds.
Class A shares are subject to a maximum front-end sales charge of 5.75% based on the amount of initial investment. Class A shares purchased without an initial sales charge in accounts aggregating $1 million to $50 million at the time of purchase are subject to a 1.00% contingent deferred sales charge ("CDSC") if the shares are sold within one year after purchase. Class B shares are subject to a maximum CDSC of 5.00% based upon the holding period after purchase. Class B shares will convert to Class A shares eight years after purchase. Class C shares are subject to a 1.00% CDSC on shares sold within one year after purchase. Class R and Class Z shares are offered continuously at net asset value. There are certain restrictions on the purchase of Class R and Class Z shares, as described in the Fund's prospectuses.
Note 2. Significant Accounting Policies
The preparation of financial statements in accordance with accounting principles generally accepted in the United States of America ("GAAP") requires management to make certain estimates and assumptions that affect the reported amounts of assets and liabilities, the disclosure of contingent assets and liabilities at the date of the financial statements and the reported amounts of revenue and expenses during the reporting period. Actual results could differ from those estimates.
The following is a summary of significant accounting policies consistently followed by the Fund in the preparation of its financial statements.
Security Valuation
Equity securities are valued at the last sale price on the principal exchange on which they trade, except for securities traded on the NASDAQ, which are valued at the NASDAQ official close price. Unlisted securities or listed securities for which there were no sales during the day are valued at the closing bid price on such exchanges or over-the-counter markets.
Short-term investments maturing in 60 days or less are valued at amortized cost, which approximates market value.
Investments for which market quotations are not readily available, or that have quotations which management believes are not reliable, are valued at fair value as determined in good faith under consistently applied procedures established by and under the general supervision of the Board of Trustees. If a security is valued at fair value, such value is likely to be different from the last quoted market price for the security. The determination of fair value often requires significant judgment. To determine fair value, management may use assumptions including but not limited to future cash flows and estimated risk premiums. Multiple inputs from various sources may be used to determine value.
GAAP establishes a hierarchy that prioritizes the inputs to valuation techniques used to measure fair value giving the highest priority to unadjusted quoted prices in active markets for identical securities (level 1 measurements) and the lowest priority to unobservable inputs (level 3 measurements) when market prices are not readily available or reliable. The three levels of the fair value hierarchy are described below:
• Level 1 – quoted prices in active markets for identical securities
• Level 2 – prices determined using other significant observable inputs (including quoted prices for similar securities, interest rates, prepayment speeds, credit risk and others)
• Level 3 – prices determined using significant unobservable inputs. In situations where quoted prices or observable inputs are unavailable or less reliable, unobservable inputs may be used. Unobservable inputs may include management's own assumptions about the factors market participants would use in pricing an investment.
21
Columbia Small Cap Value Fund II, February 28, 2010
The inputs or methodology used for valuing securities are not necessarily an indication of the risk associated with investing in those securities.
Security Transactions
Security transactions are accounted for on the trade date. Cost is determined and gains (losses) are based upon the specific identification method for both financial statement and federal income tax purposes.
Repurchase Agreements
The Fund may engage in repurchase agreement transactions with institutions that Columbia Management Advisors, LLC ("Columbia"), the Fund's investment advisor, has determined are creditworthy. The Fund, through its custodian, receives delivery of the underlying securities collateralizing a repurchase agreement. Columbia is responsible for determining that the collateral is at least equal, at all times, to the value of the repurchase obligation including interest. A repurchase agreement transaction involves certain risks in the event of default or insolvency of the counterparty. These risks include possible delays in or restrictions on the Fund's ability to dispose of the underlying securities and a possible decline in the value of the underlying securities during the period while the Fund seeks to assert its rights.
Income Recognition
Interest income is recorded on the accrual basis.
Corporate actions and dividend income are recorded on the ex-date.
Distributions received from real estate investment trusts (REITs) in excess of their income are recorded as a reduction of the cost of the related investments. If the Fund no longer owns the applicable securities, any distributions received in excess of income are recorded as realized gains.
Expenses
General expenses of the Trust are allocated to the Fund and other series of the Trust based upon relative net assets or other expense allocation methodologies determined by the nature of the expense. Expenses directly attributable to the Fund are charged to the Fund.
Determination of Class Net Asset Value
All income, expenses (other than class-specific expenses, as shown on the Statement of Operations) and realized and unrealized gains (losses) are allocated to each class of the Fund on a daily basis for purposes of determining the net asset value of each class. Income and expenses are allocated to each class based on the settled shares method, while realized and unrealized gains (losses) are allocated based on the relative net assets of each class.
Federal Income Tax Status
The Fund intends to qualify each year as a "regulated investment company" under Subchapter M of the Internal Revenue Code, as amended, and will distribute substantially all of its taxable income, if any, for its tax year, and as such will not be subject to federal income taxes. In addition, the Fund intends to distribute in each calendar year substantially all of its net investment income, capital gains and certain other amounts, if any, such that the Fund should not be subject to federal excise tax. Therefore, no provision is made for federal income or excise taxes.
Distributions to Shareholders
Distributions from net investment income, if any, are declared and paid annually. The Fund may, however, declare and pay distributions from net investment income more frequently. The Fund will distribute net realized capital gains (including net short-term capital gains) at least annually after the fiscal year in which the capital gains were earned, unless offset by any available capital loss carryforward. Income distributions and capital gain distributions are determined in accordance with federal income tax regulations which may differ from GAAP.
Indemnification
In the normal course of business, the Fund enters into contracts that contain a variety of representations and warranties and which provide general indemnities. The Fund's maximum exposure under these arrangements is unknown because this would involve future claims against the Fund. Also, under the Trust's organizational documents and by contract, the Trustees and officers of the Trust are indemnified against certain liabilities that may arise out of
22
Columbia Small Cap Value Fund II, February 28, 2010
actions relating to their duties to the Trust. However, based on experience, the Fund expects the risk of loss due to these representations, warranties and indemnities to be minimal.
Note 3. Federal Tax Information
The timing and character of income and capital gain distributions are determined in accordance with income tax regulations, which may differ from GAAP. Reclassifications are made to the Fund's capital accounts for permanent tax differences to reflect income and gains available for distribution (or available capital loss carryforwards) under income tax regulations.
The tax character of distributions paid during the years ended February 28, 2010 and February 28, 2009 was as follows:
| | | February 28, | |
| Distributions paid from: | | 2010 | | 2009 | |
| Ordinary Income* | | $ | 7,052,272 | | | $ | 14,755,826 | | |
| Long-Term Capital Gains | | | — | | | | — | | |
| Return of Capital | | | 723,318 | | | | — | | |
* For tax purposes short-term capital gain distributions, if any, are considered ordinary income distributions.
As of February 28, 2010, the components of distributable earnings on a tax basis were as follows:
Undistributed
Ordinary
Income | | Undistributed
Long-Term
Capital Gains | | Net Unrealized
Appreciation* | |
| $ | — | | | $ | — | | | $ | 154,966,553 | | |
* The differences between book-basis and tax-basis net unrealized appreciation are primarily due to deferral of losses from wash sales.
Unrealized appreciation and depreciation at February 28, 2010, based on cost of investments for federal income tax purposes were:
| Unrealized appreciation | | $ | 246,964,881 | | |
| Unrealized depreciation | | | (91,998,328 | ) | |
| Net unrealized appreciation | | $ | 154,966,553 | | |
The following capital loss carryforwards may be available to reduce taxable income arising from future net realized gains on investments, if any, to the extent permitted by the Internal Revenue Code:
| Year of Expiration | | Capital Loss
Carryforwards | |
| 2017 | | $ | 70,573,610 | | |
| 2018 | | | 265,955,033 | | |
| | | $ | 336,528,643 | | |
Under current tax rules, certain currency and capital losses realized after October 31 may be deferred and treated as occurring on the first day of the following fiscal year. As of February 28, 2010, post-October capital losses of $1,553,185 attributed to security transactions were deferred to March 1, 2010.
Management is required to determine whether a tax position of the Fund is more likely than not to be sustained upon examination by the applicable taxing authority, including resolution of any related appeals or litigation processes, based on the technical merits of the position. The tax benefit to be recognized by the Fund is measured as the largest amount of benefit that is greater than fifty percent likely of being realized upon ultimate settlement. Management is not aware of any tax positions for which it is reasonably possible that the total amounts of unrecognized tax benefits will significantly change in the next twelve months. However, management's conclusions may be subject to review and adjustment at a later date based on factors including, but not limited to, new tax laws, regulations, and administrative interpretations (including relevant court decisions). The Fund's federal tax returns for the prior three fiscal year s remain subject to examination by the Internal Revenue Service.
Note 4. Fees and Compensation Paid to Affiliates
Investment Advisory Fee
Columbia, an indirect, wholly owned subsidiary of Bank of America Corporation ("BOA"), provides investment advisory services to the Fund. Columbia receives a monthly investment
23
Columbia Small Cap Value Fund II, February 28, 2010
advisory fee based on the Fund's average daily net assets at the following annual rates:
| Average Daily Net Assets | | Annual Fee Rate | |
| First $500 million | | | 0.70 | % | |
| $500 million to $1 billion | | | 0.65 | % | |
| Over $1 billion | | | 0.60 | % | |
For the year ended February 28, 2010, the Fund's effective investment advisory fee rate was 0.66% of the Fund's average daily net assets.
Bank of America, N.A., an indirect parent company of Columbia, entered into an agreement dated September 29, 2009, to sell a portion of the asset management business of Columbia Management Group, LLC to Ameriprise Financial, Inc. ("Ameriprise Financial"). The transaction ("Transaction") includes the sale of the part of the asset management business that advises long-term mutual funds, including the Fund. The Transaction is subject to certain approvals and other conditions to closing, and is currently expected to close on or about May 1, 2010 (the "Closing"). In connection with the Closing, certain changes will occur, including a change in the entities serving as the investment advisor, administrator, distributor and transfer agent of the Fund. RiverSource Investments, LLC (the "New Advisor"), a subsidiary of Ameriprise Financial, will become the investment advisor of the Fund upon the Closing. The New Advisor will serve as inves tment advisor under a new investment management services agreement effective upon the closing. The New Advisor expects to change its name to Columbia Management Investment Advisers, LLC upon or shortly after the Closing. Effective upon the Closing, as the context requires, references to Columbia shall be deemed to refer to the New Advisor.
Administration Fee
Columbia provides administrative and other services to the Fund for a monthly administration fee at the annual rate of 0.17% of the Fund's average daily net assets, less the fees payable by the Fund as described under the Pricing and Bookkeeping Fees note below.
The New Advisor will become the administrator of the Fund under a new administrative services agreement effective upon the Closing.
Pricing and Bookkeeping Fees
The Fund has entered into a Financial Reporting Services Agreement (the "Financial Reporting Services Agreement") with State Street Bank and Trust Company ("State Street") and Columbia pursuant to which State Street provides financial reporting services to the Fund. The Fund has also entered into an Accounting Services Agreement (collectively with the Financial Reporting Services Agreement, the "State Street Agreements") with State Street and Columbia pursuant to which State Street provides accounting services to the Fund. Under the State Street Agreements, the Fund pays State Street an annual fee of $38,000 paid monthly plus an additional monthly fee based on an annualized percentage rate of average daily net assets of the Fund for the month. The aggregate fee will not exceed $140,000 per year (exclusive of out-of-pocket expenses and charges). The Fund also reimburses State Street for certain out-of-pocket expenses and charges.
Among other updates to the State Street Agreements, Columbia will assign and delegate its rights and obligations thereunder to the New Advisor upon the Closing.
The Fund has entered into a Pricing and Bookkeeping Oversight and Services Agreement (the "Services Agreement") with Columbia. Under the Services Agreement, Columbia provides services related to Fund expenses and the requirements of the Sarbanes-Oxley Act of 2002, and provides oversight of the accounting and financial reporting services provided by State Street. Under the Services Agreement, the Fund reimburses Columbia for out-of-pocket expenses and charges, including fees payable to third parties, such as for pricing the Fund's portfolio securities, incurred by Columbia in the performance of services under the Services Agreement.
The Services Agreement will be terminated upon the Closing, and the services provided thereunder will be covered under the administrative services agreement with the New Advisor.
Transfer Agent Fee
Columbia Management Services, Inc. (the "Transfer Agent"), an affiliate of Columbia and an indirect, wholly owned subsidiary of BOA, provides shareholder services to the Fund and has contracted with Boston Financial Data Services ("BFDS") to serve as sub-transfer agent. Effective January 1, 2010, the Transfer Agent is entitled to receive a fee for its
24
Columbia Small Cap Value Fund II, February 28, 2010
services, paid monthly, at the annual rate of $22.36 per account plus reimbursement of certain sub-transfer agent fees paid by the Transfer Agent (exclusive of BFDS fees), calculated based on assets held in omnibus accounts and intended to recover the cost of payments to other parties (including affiliates of BOA) for services to those accounts. Prior to January 1, 2010, the annual rate was $17.34 per account. The Transfer Agent pays the fees of BFDS for services as sub-transfer agent and is not entitled to reimbursement for such fees from the Fund.
The Transfer Agent may also retain, as additional compensation for its services, fees for wire, telephone and redemption orders, Individual Retirement Account ("IRA") trustee agent fees and account transcript fees due to the Transfer Agent from shareholders of the Fund and credits (net of bank charges) earned with respect to balances in accounts the Transfer Agent maintains in connection with its services to the Fund. The Transfer Agent also receives reimbursement for certain out-of-pocket expenses.
An annual minimum account balance fee of $20 may apply to certain accounts with a value below the Fund's initial minimum investment requirements to reduce the impact of small accounts on transfer agent fees. These minimum account balance fees are recorded as part of expense reductions on the Statement of Operations. For the year ended February 28, 2010, no minimum account balance fees were charged by the Fund.
RiverSource Service Corporation (the "New Transfer Agent"), a subsidiary of Ameriprise Financial, will become the transfer agent of the Fund upon the Closing. The New Transfer Agent expects to change its name to Columbia Management Investment Services Corp. upon or shortly after the Closing.
Underwriting Discounts, Service and Distribution Fees
Columbia Management Distributors, Inc. (the "Distributor"), an affiliate of Columbia and an indirect, wholly owned subsidiary of BOA, is the principal underwriter of the Fund's shares. For the year ended February 28, 2010, the Distributor has retained net underwriting discounts of $1,118 on sales of the Fund's Class A shares and received net CDSC fees of $8,191 and $1,745 on Class B and Class C share redemptions, respectively.
RiverSource Fund Distributors, Inc. (the "New Distributor"), a subsidiary of Ameriprise Financial, will become the distributor of the Fund upon the Closing. The New Distributor expects to change its name to Columbia Management Investment Distributors, Inc. upon or shortly after the Closing.
The Trust has adopted shareholder servicing plans and distribution plans for the Class B and Class C shares of the Fund and a combined distribution and shareholder servicing plan for the Class A shares of the Fund. The Trust has also adopted a distribution plan for the Class R shares of the Fund. The shareholder servicing plans permit the Fund to compensate or reimburse servicing agents for the shareholder services they have provided. The distribution plans, adopted pursuant to Rule 12b-1 under the 1940 Act, permit the Fund to compensate or reimburse the Distributor and/or selling agents for activities or expenses primarily intended to result in the sale of the classes' shares. Payments are made at an annual rate and paid monthly, as a percentage of average daily net assets, set from time to time by the Board of Trustees, and are charged as expenses of the Fund directly to the applicable share class. A substantial portion of the expenses incurred pursuant to these plans is paid to affiliates of BOA and the Distributor.
The annual rates in effect and plan limits, as a percentage of average daily net assets are as follows:
| | | Current
Rate | | Plan Limit | |
Class A Combined Distribution
and Shareholder Servicing Plan | | | 0.25 | % | | | 0.25 | % | |
Class B and Class C
Shareholder Servicing Plans | | | 0.25 | % | | | 0.25 | % | |
Class B and Class C
Distribution Plans | | | 0.75 | % | | | 0.75 | % | |
| Class R Distribution Plan | | | 0.50 | % | | | 0.50 | % | |
Expense Limits and Fee Waivers
Effective July 1, 2009, Columbia has voluntarily agreed to reimburse a portion of the Fund's expenses so that the Fund's ordinary operating expenses (excluding any distribution and service fees, brokerage commissions, interest, taxes and extraordinary expenses, but including custodian charges relating
25
Columbia Small Cap Value Fund II, February 28, 2010
to overdrafts, if any) after giving effect to any balance credits from the Fund's custodian, do not exceed the annual rate of 1.10% of the Fund's average daily net assets. Columbia, in its discretion, may revise or discontinue this arrangement at any time.
Prior to July 1, 2009, Columbia contractually agreed to bear a portion of the Fund's expenses so that the Fund's ordinary operating expenses (excluding any distribution and service fees, brokerage commissions, interest, taxes and extraordinary expenses, but including custodian charges relating to overdrafts, if any) after giving effect to any balance credits from the Fund's custodian, did not exceed the annual rate of 1.30% of the Fund's average daily net assets.
Columbia is entitled to recover from the Fund any fees waived and/or expenses reimbursed for a three year period following the date of such fee waiver and/or reimbursement if such recovery does not cause the Fund's expenses to exceed the expense limitations in effect at the time of recovery. At February 28, 2010, no amounts were potentially recoverable from the Fund pursuant to this arrangement.
Fees Paid to Officers and Trustees
All officers of the Fund are employees of Columbia or its affiliates and, with the exception of the Fund's Chief Compliance Officer, receive no compensation from the Fund. The Board of Trustees has appointed a Chief Compliance Officer to the Fund in accordance with federal securities regulations. The Fund, along with other affiliated funds, pays its pro-rata share of the expenses associated with the Chief Compliance Officer. The Fund's expenses for the Chief Compliance Officer will not exceed $15,000 per year.
Trustees are compensated for their services to the Fund, as set forth on the Statement of Operations. The Trust's eligible Trustees may participate in a non-qualified deferred compensation plan which may be terminated at any time. Any payments to plan participants are paid solely out of the Fund's assets. Income earned on the plan participant's deferral account is based on the rate of return of the eligible mutual funds selected by the participant or, if no funds are selected, on the rate of return of Columbia Treasury Reserves, another portfolio of the Trust. The expense for the deferred compensation plan, which includes trustees' fees deferred during the current period as well as any gains or losses on the trustees' deferred compensation balances as a result of market fluctuations, is included in "Trustees' fees" on the Statement of Operations. The liability for the deferred compensation plan is included in "Trustees' fees" on the Statement of Assets and Liabilities.
Other Related Party Transactions
In connection with the purchase and sale of its securities during the period, the Fund used one or more brokers that are affiliates of BOA. Total brokerage commissions paid to affiliated brokers for the year ended February 28, 2010 was $152,684.
Note 5. Custody Credits
The Fund has an agreement with its custodian bank under which custody fees may be reduced by balance credits. These credits are recorded as part of expense reductions on the Statement of Operations. The Fund could have invested a portion of the assets utilized in connection with the expense offset arrangement in an income-producing asset if it had not entered into such an agreement.
For the year ended February 28, 2010, these custody credits reduced total expenses by $31 for the Fund.
Note 6. Portfolio Information
For the year ended February 28, 2010, the cost of purchases and proceeds from sales of securities, excluding short-term obligations, for the Fund were $867,007,844 and $808,815,753, respectively.
Note 7. Line of Credit
The Fund and other affiliated funds participate in a $280,000,000 committed, unsecured revolving line of credit provided by State Street. The maximum amount that may be borrowed by any fund is limited to the lesser of $200,000,000 and the Fund's borrowing limit set forth in the Fund's registration statement. Borrowings are available for short-term liquidity or temporary or emergency purposes.
Effective October 15, 2009, interest is charged to each participating fund based on the fund's borrowings at a rate per annum equal to the greater of the Federal Funds Rate plus 1.25% or the overnight LIBOR Rate plus 1.25%. In addition, a commitment fee of 0.15% per annum is accrued and apportioned among the participating funds pro rata based on their relative net assets.
26
Columbia Small Cap Value Fund II, February 28, 2010
Prior to October 15, 2009, interest was charged to each participating fund based on the fund's borrowings at a rate per annum equal to the greater of the Federal Funds Rate plus 0.50% or the overnight LIBOR Rate plus 0.50%. In addition, an annual operations agency fee of $20,000, an amendment fee of 0.02% and a commitment fee of 0.12% per annum were accrued and apportioned among the participating funds pro rata based on their relative net assets.
For the year ended February 28, 2010, the Fund did not borrow under these arrangements.
Note 8. Securities Lending
The Fund may lend its securities to certain approved brokers, dealers and other financial institutions. Each loan is collateralized by cash, in an amount at least equal to the market value of the securities loaned plus accrued income from the investment of collateral. The market value of the loaned securities is determined at the close of business of the Fund and any additional required collateral is delivered to the Fund on the next business day. The collateral received is invested and the income generated by the investment of the collateral, net of any fees remitted to State Street as the lending agent and borrower rebates, is paid to the Fund. Generally, in the event of borrower default, the Fund has the right to use the collateral to offset any losses incurred. In the event the Fund is delayed or prevented from exercising its right to dispose of the collateral, there may be a potential loss to the Fund. The Fund bears the ri sk of loss with respect to the investment of collateral.
For the year ended February 28, 2010, the Fund did not participate in the securities lending program.
Note 9. Shares of Beneficial Interest
As of February 28, 2010, 21.8% of the Fund's shares outstanding were beneficially owned by two participant accounts over which BOA and/or any of its affiliates had either sole or joint investment discretion.
As of February 28, 2010, the Fund had two shareholders that collectively held 14.9% of the shares outstanding, over which BOA and/or any of its affiliates did not have investment discretion.
As of February 28, 2010, no other shareholders owned more than 5% of the outstanding shares of the Fund.
Subscription and redemption activity of these accounts may have a significant effect on the operations of the Fund.
Note 10. Significant Risks and Contingencies
Legal Proceedings
Columbia Management Advisors, LLC and Columbia Management Distributors, Inc. (collectively, the "Columbia Group") are subject to a settlement agreement with the New York Attorney General ("NYAG") (the "NYAG Settlement") and a settlement order with the Securities and Exchange Commission ("SEC") (the "SEC Order") on matters relating to mutual fund trading, each dated February 9, 2005. Under the terms of the SEC Order, the Columbia Group (or predecessor or affiliated entities) agreed, among other things, to: pay disgorgement and civil money penalties collectively totaling $375 million; cease and desist from violations of the antifraud provisions and certain other provisions of the federal securities laws; maintain certain compliance and ethics oversight structures; and retain an independent consultant to review the Columbia Group's applicable supervisory, compliance, control and other policies and procedures. The NYAG Settlement, a mong other things, requires Columbia Management Advisors, LLC and its affiliates to make certain disclosures to investors relating to expenses. In connection with the Columbia Group providing services to the Columbia Funds, the Columbia Funds have voluntarily undertaken to implement certain governance measures designed to maintain the independence of their boards of trustees and certain special consulting and compliance measures.
Pursuant to the SEC Order and related procedures, the $375 million in settlement amounts described above, of which approximately $90 million has been earmarked for certain Columbia Funds and their shareholders, is being distributed in accordance with a distribution plan developed by an independent distribution consultant and approved by the SEC on December 27, 2007. Distributions under the distribution plan began in mid-June 2008 and the distribution earmarked for the Columbia Funds and their shareholders has been substantially completed.
Civil Litigation
In connection with the events that resulted in the NYAG Settlement and SEC Order, various parties filed suits against Bank of America Corporation and certain of its affiliates,
27
Columbia Small Cap Value Fund II, February 28, 2010
including Banc of America Capital Management, LLC ("BACAP," now known as Columbia Management Advisors, LLC) and BACAP Distributors, LLC (now known as Columbia Management Distributors, Inc.) (collectively "BAC"), Nations Funds Trust (now known as Columbia Funds Series Trust) and its Board of Trustees. On February 20, 2004, the Judicial Panel on Multidistrict Litigation transferred these cases and cases against other mutual fund companies based on similar allegations to the United States District Court in Maryland for consolidated or coordinated pretrial proceedings (the "MDL"). Subsequently, additional related cases were transferred to the MDL. On September 29, 2004, the plaintiffs in the MDL filed amended and consolidated complaints. One of these amended complaints is a putative class action that includes claims under the federal securities laws and state common law, and that names Nations Funds Trust, the Trustees, BAC and othe rs as defendants. Another of the amended complaints is a derivative action purportedly on behalf of the Nations Funds Trust against BAC and others that asserts claims under federal securities laws and state common law. Nations Funds Trust is a nominal defendant in this action.
On February 25, 2005, BAC and other defendants filed motions to dismiss the claims in the pending cases. On December 15, 2005, BAC and others entered into a Stipulation of Settlement of the direct and derivative claims brought on behalf of the Nations Funds shareholders. The settlement is subject to court approval. If the settlement is approved, BAC would pay settlement administration costs and fees to plaintiffs' counsel as approved by the court. The stipulation has not yet been presented to the court for approval.
Note 11. Subsequent Events
In connection with the preparation of the financial statements of the Fund as of and for the fiscal year ended February 28, 2010, events and transactions through the date the financial statements were issued have been evaluated by the Fund's management for possible adjustment and/or disclosure. No subsequent events or transactions had occurred that would require adjustment of the financial statements as presented. On March 31, 2010, the Fund's shareholders approved, among other matters, a proposed investment management services agreement with the New Advisor, the effectiveness of which is conditioned on the Closing.
28
Report of Independent Registered Public Accounting Firm
To the Trustees of Columbia Funds Series Trust and the Shareholders of Columbia Small Cap Value Fund II
In our opinion, the accompanying statement of assets and liabilities, including the investment portfolio, and the related statements of operations and of changes in net assets and the financial highlights present fairly, in all material respects, the financial position of Columbia Small Cap Value Fund II (the "Fund") (a series of Columbia Funds Series Trust), at February 28, 2010, the results of its operations, the changes in its net assets and the financial highlights for each of the periods indicated, in conformity with accounting principles generally accepted in the United States of America. These financial statements and financial highlights (hereafter referred to as "financial statements") are the responsibility of the Fund's management. Our responsibility is to express an opinion on these financial statements based on our audits. We conducted our audits of these financial statements in accordance with the standards of the Public Company Accounting Oversight Board (United States). Those standards require that we plan and perform the audit to obtain reasonable assurance about whether the financial statements are free of material misstatement. An audit includes examining, on a test basis, evidence supporting the amounts and disclosures in the financial statements, assessing the accounting principles used and significant estimates made by management, and evaluating the overall financial statement presentation. We believe that our audits, which included confirmation of securities at February 28, 2010 by correspondence with the custodian and brokers, provide a reasonable basis for our opinion.
PricewaterhouseCoopers LLP
Boston, Massachusetts
April 21, 2010
29
Federal Income Tax Information (Unaudited) – Columbia Small Cap Value Fund II
For non-corporate shareholders, 100.00% or the maximum amount allowable under the Jobs and Growth Tax Relief Reconciliation Act of 2003, of the ordinary income distributed by the Fund for the fiscal year ended February 28, 2010 may represent qualified dividend income.
100.00% of the ordinary income distributed by the Fund for the fiscal year ended February 28, 2010, qualifies for the corporate dividends received deduction.
The Fund will notify shareholders in January 2011 of amounts for use in preparing 2010 income tax returns.
30
Fund Governance
The Trustees serve terms of indefinite duration. The names, addresses and ages of the Trustees and officers of the Funds of Columbia Funds Series Trust, the year each was first elected or appointed to office, their principal business occupations during at least the last five years, the number of Funds overseen by each Trustee and other directorships they hold are shown below. Each officer listed below serves as an officer of each Fund in the Columbia Funds Complex.
Independent Trustees
Name, Address and Age,
Position with Funds, Year First
Elected or Appointed to Office | | Principal Occupation(s) During Past Five Years, Number of Funds in the Columbia
Funds Complex Overseen by Trustee, Other Directorships Held
| |
| Edward J. Boudreau (Born 1944) | |
|
c/o Columbia Management
Advisors, LLC
One Financial Center
Boston, MA 02111
Trustee (since 2005) | | Managing Director—E.J. Boudreau & Associates (consulting), from 2000 through current; oversees 64; no other directorships held. | |
|
| William P. Carmichael (Born 1943) | |
|
c/o Columbia Management
Advisors, LLC
One Financial Center
Boston, MA 02111
Trustee (since 1999) | | Retired. Oversees 64; Director—Cobra Electronics Corporation (electronic equipment manufacturer); Director—Simmons Company (bedding); Director—The Finish Line (sportswear). | |
|
| William A. Hawkins (Born 1942) | |
|
c/o Columbia Management Advisors, LLC
One Financial Center
Boston, MA 02111
Trustee (since 2005) | | President and Chief Executive Officer—California General Bank, N.A., from January 2008 through current; oversees 64; no other directorships held. | |
|
| R. Glenn Hilliard (Born 1943) | |
|
c/o Columbia Management Advisors, LLC
One Financial Center
Boston, MA 02111
Trustee (since 2005) | | Chairman and Chief Executive Officer—Hilliard Group LLC (investing and consulting), from April 2003 through current; Non-Executive Director & Chairman—Conseco, Inc. (insurance), September 2003 through current; Executive Chairman—Conseco, Inc. (insurance), August 2004 through September 2005; oversees 64; Director—Conseco, Inc. (insurance). | |
|
| John J. Nagorniak (Born 1944) | |
|
c/o Columbia Management
Advisors, LLC
One Financial Center
Boston, MA 02111
Trustee (since 2008)` | | Retired. President and Director—Foxstone Financial, Inc. (consulting), 2000 through December 2007; Director—Mellon Financial Corporation affiliates (investing), 2000 through 2007; Chairman—Franklin Portfolio Associates (investing—Mellon affiliate), 1982 through 2007; oversees 64; Director—MIT Investment Company; Trustee—MIT 401k Plan; Trustee and Chairman—Research Foundation of CFA Institute. | |
|
31
Fund Governance (continued)
Independent Trustees (continued)
Name, Address and Age,
Position with Funds, Year First
Elected or Appointed to Office | | Principal Occupation(s) During Past Five Years, Number of Funds in the Columbia
Funds Complex Overseen by Trustee, Other Directorships Held
| |
| Minor M. Shaw (Born 1947) | |
|
c/o Columbia Management Advisors, LLC
One Financial Center
Boston, MA 02111
Trustee (since 2003) | | President—Micco Corporation and Mickel Investment Group; oversees 64; Board Member—Piedmont Natural Gas. | |
|
Interested Trustee
| Anthony M. Santomero1 (Born 1946) | |
|
c/o Columbia Management Advisors, LLC
One Financial Center
Boston, MA 02111
Trustee (since 2008) | | Richard K. Mellon Professor Emeritus of Finance, The Wharton School, University of Pennsylvania, from 1972 through current; Senior Advisor—McKinsey & Company (consulting), July 2006 through January 2008; President and Chief Executive Officer—Federal Reserve Bank of Philadelphia, July 2000 through April 2006; oversees 64; Director—Renaissance Reinsurance Ltd; Trustee—Penn Mutual Life Insurance Company; Director—Citigroup | |
|
1 The Columbia Funds currently treat Mr. Santomero as an "interested person" (as defined in the 1940 Act) of the Funds because he serves as a Director of Citigroup, Inc. and Citibank, N.A. Citigroup, Inc., through its subsidiaries and affiliates, including Citibank, N.A., may engage from time-to-time in brokerage execution, principal transactions and/or lending relationships with the Columbia Funds or other funds or accounts advised/managed by the Advisor and/or any sub-advisor.
The Statement of Additional Information includes additional information about the Trustees of the Funds and is available, without charge, upon request by calling 800-345-6611.
32
Fund Governance (continued)
Officers
Name, Address and Year of Birth,
Position with Columbia Funds,
Year First Elected or
Appointed to Office | | Principal Occupation(s) During Past Five Years
| |
| J. Kevin Connaughton (Born 1964) | |
|
One Financial Center
Boston, MA 02111
President (since 2009) | | Managing Director of Columbia Management Advisors, LLC since December 2004; Senior Vice President and Chief Financial Officer—Columbia Funds, from June 2008 to January 2009; Treasurer—Columbia Funds, from October 2003 to May 2008; Treasurer—the Liberty Funds, Stein Roe Funds and Liberty All-Star Funds, December 2000—December 2006; Senior Vice President—Columbia Management Advisors, LLC, from April 2003 to December 2004; President—Columbia Funds, Liberty Funds and Stein Roe Funds, February 2004 to October 2004; Treasurer—Galaxy Funds, September 2002 to December 2005; Treasurer, December 2002 to December 2004, and President, February 2004 to December 2004—Columbia Management Multi-Strategy Hedge Fund, LLC; and a senior officer of various other Bank of America-affiliated entities, including other registered and unregistered funds | |
|
| James R. Bordewick, Jr. (Born 1959) | |
|
One Financial Center
Boston, MA 02111
Senior Vice President, Secretary and Chief Legal Officer (since 2006) | | Associate General Counsel, Bank of America since April 2005; Senior Vice President and Associate General Counsel, MFS Investment Management (investment management) prior to April 2005. | |
|
| Linda J. Wondrack (Born 1964) | |
|
One Financial Center
Boston, MA 02111
Senior Vice President and
Chief Compliance Officer (since 2007) | | Director (Columbia Management Group LLC and Investment Product Group Compliance), Bank of America since June 2005; Director of Corporate Compliance and Conflicts Officer, MFS Investment Management (investment management), August 2004 to May 2005; Managing Director, Deutsche Asset Management (investment management) prior to August 2004. | |
|
| Michael G. Clarke (Born 1969) | |
|
One Financial Center
Boston, MA 02111
Senior Vice President and
Chief Financial Officer (since 2009) | | Director of Fund Administration of the Advisor since January 2006; Managing Director of the Advisor September 2004 to December 2005; Vice President Fund Administration June 2002 to September 2004. | |
|
| Jeffrey R. Coleman (Born 1969) | |
|
One Financial Center
Boston, MA 02111
Treasurer (since 2008) | | Director of Fund Administration of the Advisor since January 2006; Fund Controller of the Advisor from October 2004 to January 2006; Vice President of CDC IXIS Asset Management Services, Inc. (investment management) from August 2000 to September 2004. | |
|
| Joseph F. DiMaria (Born 1968) | |
|
One Financial Center
Boston, MA 02111
Chief Accounting Officer (since 2008) | | Director of Fund Administration of the Advisor since January 2006; Head of Tax/Compliance and Assistant Treasurer of the Advisor from November 2004 to December 2005; Director of Trustee Administration (Sarbanes-Oxley) of the Advisor from May 2003 to October 2004. | |
|
33
Fund Governance (continued)
Officers (continued)
Name, Address and Year of Birth,
Position with Columbia Funds,
Year First Elected or
Appointed to Office | | Principal Occupation(s) During Past Five Years
| |
| Julian Quero (Born 1967) | |
|
One Financial Center
Boston, MA 02111
Deputy Treasurer (since 2008) | | Senior Tax Manager of the Advisor since August 2006; Senior Compliance Manager of the Advisor from April 2002 to August 2006. | |
|
| Barry S. Vallan (Born 1969) | |
|
One Financial Center
Boston, MA 02111
Controller (since 2006) | | Vice President—Fund Treasury of the Advisor since October 2004; Vice President—Trustee Reporting of the Advisor from April 2002 to October 2004. | |
|
| Stephen T. Welsh (Born 1957) | |
|
One Financial Center
Boston, MA 02111
Vice President (since 1996) | | President, Columbia Management Services, Inc. since July 2004; Senior Vice President and Controller, Columbia Management Services, Inc. prior to July 2004. | |
|
34
Board Consideration and Re-Approval of Current
Investment Advisory Agreement
Even though the following description of the Board's consideration of investment advisory and, as applicable, sub-advisory agreements covers multiple funds, for purposes of this shareholder report, the description is only relevant as to the Fund.
The Board of Trustees of Columbia Funds Series Trust (the "Board"), including a majority of the Trustees who have no direct or indirect interest in the investment advisory and sub-advisory agreements and are not "interested persons" of the Trust, as defined in the Investment Company Act of 1940 (the "1940 Act") (the "Independent Trustees"), are required annually to review and re-approve the existing investment advisory and sub-advisory agreements and approve any newly proposed terms therein. In this regard, the Board reviewed and re-approved, during the most recent six months covered by this report, (i) investment advisory agreements with Columbia Management Advisors, LLC ("CMA" or the "Adviser") for Columbia Convertible Securities Fund, Columbia Large Cap Value Fund, Columbia Mid Cap Value Fund, Columbia Small Cap Value Fund II, Columbia Marsico Growth Fund, Columbia Large Cap Core Fund, Columbia Marsico Focused Equities Fund, Columbia Marsico 21st Century Fund and Columbia Small Cap Growth Fund II; and (ii) investment sub-advisory agreements with Marsico Capital Management, LLC ("Marsico Capital" or the "Sub-Adviser") for Columbia Marsico Focused Equities Fund, Columbia Marsico 21st Century Fund and Columbia Marsico Growth Fund (the "Sub-Advised Funds"). The investment advisory agreements with CMA and the investment sub-advisory agreements with Marsico Capital are each referred to as an "Advisory Agreement" and collectively referred to as the "Advisory Agreements." The funds identified above are each referred to as a "Fund" and collectively referred to as the "Funds."
More specifically, at meetings held on November 5-6, 2009, the Board, including the Independent Trustees advised by their independent legal counsel, considered the factors and reached the conclusions described below relating to the selection of CMA and the Sub-Adviser and the re-approval of the Advisory Agreements. The Board also reviewed and considered a report prepared and provided by the Independent Fee Consultant (the "Fee Consultant") appointed by the Independent Trustees pursuant to an assurance of discontinuance entered into with the New York Attorney General ("NYAG") to settle a civil complaint filed by the NYAG relating to trading in mutual fund shares (the "NYAG Settlement"). The Fee Consultant's role was to manage the process by which management fees are negotiated so that they were negotiated in a manner that is at arms' length and reasonable. Th e Fee Consultant found that the fee negotiation process was, to the extent practicable, at arms' length and reasonable and consistent with the requirements of the NYAG Settlement. A summary of the Fee Consultant's report is available at http://www.columbiafunds.com.
In preparation for the November meetings, the Board met in August for review and discussion of the materials described below. The Investment Committee of the Board also met in June to discuss each Fund's performance with its respective portfolio manager(s). In addition to these meetings, the Investment Committee receives and discusses performance reports at its quarterly meetings. The Contracts Review Committee of the Board also provided support in managing and coordinating the process by which the Board reviewed the Advisory Agreements. The Board's review and conclusions are based on the comprehensive consideration of all information presented to it and are not the result of any single controlling factor. The Board evaluated all information available to it on a Fund-by-Fund basis, and its determinations were made separately in respect of each Fund.
Nature, Extent and Quality of Services. The Board received and considered various data and information regarding the nature, extent and quality of services provided to the Funds by CMA and the Sub-Adviser under the Advisory Agreements. The most recent investment adviser registration forms for CMA and the Sub-Adviser were made available to the Board, as were CMA's and the Sub-Adviser's responses to a detailed series of requests submitted by the Independent Trustees' independent legal counsel on behalf of such Trustees. The Board reviewed and analyzed those materials, which included, among other things, information about the background and experience of senior management and investment personnel of CMA and the Sub-Adviser.
In addition, the Board considered the investment and legal compliance programs of the Funds, CMA and the Sub-Adviser, including their compliance policies and procedures and reports of the Funds' Chief Compliance Officer.
The Board evaluated the ability of CMA and the Sub-Adviser, based on their resources, reputation and other attributes, to attract and retain qualified investment professionals, including research, advisory and supervisory personnel. In
35
this regard, the Board considered information regarding the nature of CMA's compensation structure applicable to portfolio managers and other key investment personnel.
Based on the above factors, together with those referenced below, the Board concluded that it was satisfied with the nature, extent and quality of the investment advisory services provided to each of the Funds by CMA and the Sub-Adviser.
The Board noted that Bank of America, N.A., the parent company of the Adviser, had entered into an agreement to sell a portion of the asset management business of the Adviser to Ameriprise Financial, Inc. (the "Transaction"). The Board noted that the Transaction was expected to close in the spring of 2010 and that its review of the Advisory Agreements was separate and distinct from any analysis regarding new advisory or sub-advisory arrangements that may result from the closing of the Transaction.
Investment Advisory and Sub-Advisory Fee Rates and Other Expenses. The Board reviewed and considered the proposed contractual investment advisory fee rates both separately and together with the administration fee rates payable by the Funds to CMA for investment advisory services (the "Contractual Management Rates"). The Board also reviewed and considered the proposed contractual investment sub-advisory fee rates (the "Sub-Advisory Agreement Rates") payable by CMA to the Sub-Adviser for investment sub-advisory services. In addition, the Board reviewed and considered the proposed fee waiver/cap arrangements applicable to the Contractual Management Rates and considered the Contractual Management Rates after taking the waivers/caps into account (the "Actual Management Rates"). The Board noted that, on a complex-wide basis, CMA had reduced annual managemen t fees by at least $32 million per year pursuant to the NYAG Settlement. The Board also noted reductions in net advisory rates and/or total expenses of certain funds across the fund complex. Additionally, the Board received and afforded specific attention to information comparing the Contractual Management Rates and Actual Management Rates with those of the other funds in their respective Peer Groups (as defined below).
The Board reviewed and considered statistical information regarding each Fund's total expense ratio and its various components, including contractual advisory fees, actual advisory fees, actual non-management fees, Rule 12b-1 and non-Rule 12b-1 service fees, fee waivers/caps and/or expense reimbursements. The Board also reviewed comparisons of these fees to the expense information for the group of Funds determined by Lipper Inc. ("Lipper") to be most similar to a given Fund (the "Peer Group") and to the performance of a broader universe of relevant funds as determined by Lipper (the "Universe"), which comparative data was provided by Lipper, an independent provider of investment company data. The Board was provided with a description of the methodology used by Lipper to select the mutual funds in each Fund's Peer Group and Universe and considered potential i mprecision resulting from the selection methodology. For certain Funds, Lipper determined that the composition of the Peer Group and/or Universe for expenses would differ from the composition for performance to provide a more accurate basis of comparison. The Board also considered Lipper data that ranked each Fund based on: (i) each Fund's one- and three-year performance compared to actual management fees; and (ii) each Fund's one- and three-year performance compared to total expenses.
The Board concluded that the factors noted above supported the Contractual Management Rates and the Actual Management Rates, and the approval of the Advisory Agreements for all of the Funds.
With regard to the Sub-Advised Funds, the Board also reviewed the Sub-Advisory Agreement Rates, including comparative fee information provided by the Adviser and the Adviser's recommendation that the Board re-approve the Advisory Agreements with Marsico Capital. The Board also considered a breakpoint fee schedule charged by Marsico Capital for the Sub-Advised Funds, as well as a corresponding waiver of Contractual Management Rates, both of which were implemented on January 1, 2008. The Board concluded that the Sub-Advisory Agreement Rates are fair and equitable, based on its consideration of the factors described above.
The Fund-by-Fund discussion set forth below in "Fund-Specific Considerations for Certain Review Funds" provides additional information regarding those Funds highlighted as meeting agreed-upon criteria for warranting further review. Such criteria included, among other things, information relating to Actual Management Rates, total expense ratios and/or performance information, relative to a Fund's Peer Group and/or Universe.
36
Fund Performance. The Board considered the performance results for each of the Funds over multiple measurement periods. It also considered these results in comparison to the performance results of each Fund's Peer Group and Universe, as well as to each Fund's benchmark index. The Board also considered certain risk-adjusted performance data.
The Fund-by-Fund discussion set forth below in "Fund-Specific Considerations for Certain Review Funds" provides additional information regarding those Funds highlighted as meeting agreed-upon criteria for warranting further review. Such criteria included, among other things, information relating to Actual Management Rates, total expense ratios and/or performance information, relative to a Fund's Peer Group and/or Universe.
Profitability. The Board received and considered a detailed profitability analysis of CMA based on the Contractual Management Rates and the Actual Management Rates, as well as on other relationships between the Funds and other funds in the complex on the one hand and CMA affiliates on the other. The analysis included complex-wide and per-Fund information and a comparison of results using alternative allocation methodologies. The Board concluded that, in light of the costs of providing investment management and other services, the profits and other ancillary benefits that CMA and its affiliates received from providing these services were not unreasonable.
Economies of Scale. The Board received and considered information regarding whether there have been economies of scale with respect to the management of the Funds, whether the Funds have appropriately benefited from any economies of scale and whether there is potential for realization of any further economies of scale. Most particularly, CMA provided information showing that, as a percentage of fund assets, CMA's complex-wide revenues declined over a five-year period during which fund assets increased by 53% and the shareholder benefit over a four-year period has remained steady at approximately 33% of the Adviser's total profits. The Board concluded that any potential economies of scale are shared fairly with Fund shareholders, most particularly through breakpoints and fee waiver arrangements.
The Board acknowledged the inherent limitations of any analysis of an investment adviser's economies of scale, stemming largely from the Board's understanding that economies of scale are generally realized, if at all, by an investment adviser across a variety of products and services, not just with respect to a single fund.
Information About Services to Other Clients. The Board also received and considered information about the nature and extent of services and fee rates offered by CMA and the Sub-Adviser to their other clients, including separate accounts and institutional investors. In this regard, the Board concluded that, where the Contractual Management Rates, Sub-Advisory Agreement Rates and Actual Management Rates were appreciably above the range of the fee rates offered to other CMA and Sub-Adviser clients, based on information provided by CMA and the Sub-Adviser, the costs associated with managing and operating a registered investment company provided a justification for the higher fee rates charged to the Funds.
Other Benefits to CMA and the Sub-Adviser. The Board received and considered information regarding any "fall-out" or ancillary benefits received by CMA and its affiliates and the Sub-Adviser as a result of their relationship with the Funds. Such benefits could include, among others, benefits attributable to CMA's and the Sub-Adviser's relationships with the Funds (such as soft-dollar credits) and benefits potentially derived from an increase in CMA's and the Sub-Adviser's business as a result of their relationship with the Funds (such as the ability to market to shareholders other financial products offered by CMA and its affiliates or a Sub-Adviser).
The Board considered the effectiveness of the policies of the Funds in achieving the best execution of portfolio transactions, whether and to what extent soft dollar credits are sought and how any such credits are utilized, any benefits that may be realized by using an affiliated broker, the extent to which efforts are made to recapture transaction costs, and the controls applicable to brokerage allocation procedures. The Board also reviewed CMA's and the Sub-Adviser's methods for allocating portfolio investment opportunities among the Funds and other clients. The Board concluded that the benefits were not unreasonable.
Other Factors and Broader Review. As discussed above, the Board reviews materials received from CMA and the Sub-Adviser annually as part of the re-approval process under Section 15(c) of the 1940 Act. The Board also reviews and assesses the quality of the services the Funds receives throughout the year. In this regard, the Board and its
37
Committees review reports of CMA and the Sub-Adviser at each of its quarterly meetings, which include, among other things, Fund performance reports and presentations relating to such reports. In addition, the Board and its Committees confer with portfolio managers at various times throughout the year including, most particularly, at the June Investment Committee meeting.
Fund-Specific Considerations for Certain "Review" Funds. For certain Funds highlighted as meeting agreed-upon criteria for warranting further review, the Board engaged in further analysis with regard to approval of the Funds' Advisory Agreements. Such criteria included, among other things, information relating to Actual Management Rates, total expense ratios, and/or performance information relative to a Fund's Peer Group and/or Universe. Columbia Small Cap Value Fund II was not highlighted as a review fund.
Conclusion. After an evaluation of the above-described factors, and based on its deliberations and analysis of the information provided and alternatives considered, the Board, including all of the Independent Trustees, concluded that the compensation payable to CMA and the Sub-Adviser under the Advisory Agreements is fair and equitable. Accordingly, the Board unanimously re-approved the Advisory Agreements.
38
Board Consideration and Approval of Proposed
Investment Advisory Agreement
Even though the following description of the Board's consideration of investment advisory and, as applicable, sub-advisory agreements covers multiple funds and trusts, for purposes of this shareholder report, the description is only relevant as to the Fund.
At a meeting held on December 21, 2009, the Boards of Trustees (the "Boards") of Columbia Funds Series Trust, Columbia Funds Master Investment Trust, LLC and Columbia Funds Series Trust II (each a "Trust" and collectively the "Trusts") unanimously approved a new investment management services agreement with RiverSource Investments, LLC ("RiverSource") (the "Proposed Advisory Agreement") and new subadvisory agreements with Marsico Capital Management ("Marsico Capital"), MacKay Shields LLC ("Mackay Shields") and Brandes Investment Partners, L.P. ("Brandes") (each a "Proposed Subadvisory Agreement"), as applicable, for each Fund of the Trusts (each a "Fund" and collectively the "Funds"). As detailed below, the Trustees met on multiple occasions in advance of the December 21, 2009 meeting, held numerous discussions with the management teams of Columbia Management Advisors, LLC ("Columbia") and RiverSource, a subsidiary of Ameriprise Financial, Inc. ("Ameriprise") and reviewed and considered extensive materials in connection with the approval of the Proposed Advisory and Subadvisory Agreements.
Specifically, the Trustees of each Trust, including a majority of the Trustees who have no direct or indirect interest in the Proposed Advisory and Subadvisory Agreements and are not "interested persons" of the Trusts, as defined in the Investment Company Act of 1940, as amended (the "1940 Act") (the "Independent Trustees") reviewed and approved (i) the Proposed Advisory Agreement with RiverSource for each Fund and (ii) the Proposed Subadvisory Agreement for those Funds that currently have investment subadvisory agreements with Marsico Capital, Mackay Shields, and Brandes (the "Subadvised Funds") (Marsico Capital, MacKay Shields and Brandes are collectively referred to as the "Subadvisers"). Prior to approving the Proposed Advisory Agreements, the Trustees were presented with, and requested, received and evaluated, extensive materials about RiverSource, the sale of a portion of the asset management business of Columbia Managemen t Group, LLC to Ameriprise (the "Transaction") and related matters from RiverSource, Ameriprise and Columbia. In this regard, the Trustees reviewed RiverSource's responses to a series of detailed requests submitted by the Independent Trustees' independent legal counsel and by the Independent Fee Consultant (as defined below).
The Trustees also reviewed and considered information received in connection with their most recent consideration and reapproval in November 2009 of the current advisory agreement (the "Current Advisory Agreement") and current subadvisory agreement (the "Current Subadvisory Agreement"), as applicable, for each Fund, including information about the Subadvisers (the "Current Agreement Re-Approval Process"). Moreover, the Trustees and committees of the Boards met on several occasions, and received extensive materials, throughout the course of the year relating to the Current Agreement Re-Approval Process, which the Trustees considered relevant to their consideration and approval of the Proposed Advisory and Subadvisory Agreements. The Trustees also consulted with Fund counsel and with the Independent Trustees' independent legal counsel, who advised on the legal standards for consideration by the Trustees, and otherwise assisted the Trustees in their deliberations.
In advance of the meeting on December 21, 2009, the Trustees held several meetings, including meetings held in-person with representatives from RiverSource and Ameriprise on August 26, 2009, November 5-6, 2009, December 9-10, 2009 and December 14, 2009, and additional meetings with representatives of Columbia, to discuss the Transaction, RiverSource's plans and intentions regarding the Funds and various proposals that were being presented as a result of the Transaction, including the Proposed Advisory and Subadvisory Agreements. In addition to these meetings, telephonic meetings and discussions were held on several occasions between individual Trustees, members of the committees of the Boards, their independent legal counsel and representatives from RiverSource, Ameriprise and/or Columbia.
The Trustees also reviewed and considered a report prepared and provided by the Fee Consultant (the "Fee Consultant") appointed by the Independent Trustees pursuant to an assurance of discontinuance entered into by a predecessor to Columbia with the New York Attorney General ("NYAG") to settle a civil complaint filed by the NYAG relating to trading in mutual fund shares (the "NYAG Settlement"). The Fee Consultant's role was to manage the process by which management fees are negotiated so that they were negotiated
39
in a manner that is at arms' length and reasonable. The Fee Consultant found that the fee negotiation process was, to the extent practicable, at arms' length and reasonable and consistent with the requirements of the NYAG Settlement. A summary of the Fee Consultant's report is available at www.columbiafunds.com.
The following summarizes a number of the material factors considered by the Trustees in reaching their approvals and determinations with respect to the Proposed Advisory Agreements and Proposed Subadvisory Agreements. It is followed by a more detailed discussion of the Trustees' consideration of these and other factors considered relevant by the Trustees in their evaluation of the Proposed Advisory Agreements and Proposed Subadvisory Agreements. In voting to approve the Proposed Advisory and Subadvisory Agreements for each Fund, the Trustees also considered substantially the same factors, as relevant, and reached substantially the same conclusions in their approval of interim advisory and subadvisory agreements for each Fund.
(i) the terms and conditions of the Proposed Advisory Agreements compared to the terms and conditions of the Current Advisory Agreements, as described below;
(ii) the fact that each Fund's total advisory fees would remain the same;
(iii) the qualifications of the personnel of RiverSource, Ameriprise and the Subadvisers expected to provide advisory and administrative services to each Fund, including representations by Ameriprise regarding its retention of the same process for monitoring and evaluating portfolio management personnel for each Fund as currently used by Columbia;
(iv) the terms and conditions of the Proposed Subadvisory Agreements compared to the terms and conditions of the Current Subadvisory Agreements;
(v) the reputation, financial strength, regulatory and compliance histories and resources of RiverSource and Ameriprise, and the potential benefits to the Funds of the combination of RiverSource and Columbia, including that the Funds are expected to continue to have access to existing distribution channels and have the potential for expanded distribution of Fund shares, the expected depth and breadth of investment management capabilities, that there is not expected to be any diminution in the nature, quality and extent of services to be provided to the Funds under the Proposed Advisory Agreements and the potential for the realization of additional economies of scale over time and the potential of the Funds to share in, and benefit from, these economies, if any;
(vi) that Ameriprise has committed to refrain from imposing or seeking to impose, for a period of not less than two years after the closing of the Transaction (the "Closing"), any "unfair burden" (within the meaning of Section 15(f) of the 1940 Act) on any Fund;
(vii) the terms and conditions of certain other agreements and arrangements relating to the future operations of the Funds and their distribution channels, including the administrative services agreement and the new services and distribution agreement;
(viii) that the Trustees recently had completed the Current Agreement Re-Approval Process for each Fund and had determined that they were satisfied with the nature, extent and quality of services provided thereunder and that the management fee rates and (where applicable) subadvisory fee rates for each Fund were satisfactory;
(ix) that RiverSource was willing to commit to maintain net operating expense ratios at current levels for at least the period currently covered by Columbia's existing commitments;
(x) the capabilities of RiverSource and the Subadvisers with respect to compliance, including an assessment of RiverSource's compliance program by the Funds' Chief Compliance Officer;
(xi) that certain members of RiverSource's management and certain Columbia personnel that will be integrated into RiverSource and its affiliates as a result of the Transaction have substantial experience in integrating fund families; and
(xii) that Ameriprise and Bank of America Corporation would bear the costs of obtaining approvals of the Proposed Advisory and Subadvisory Agreements.
In their deliberations, the Trustees did not identify any single item that was paramount or controlling and individual Trustees may have attributed different weights to various
40
factors. The Trustees also evaluated all information available to them on a Fund-by-Fund basis, and their determinations were made separately in respect of each Fund.
Nature, Extent and Quality of Services to be Provided. The Trustees received and considered various data and information regarding the expected nature, extent and quality of services to be provided to the Funds by RiverSource and the Subadvisers under the Proposed Advisory and Subadvisory Agreements. The most recent investment adviser registration forms for RiverSource and each Subadviser were made available to the Boards, as well as extensive materials from RiverSource, Ameriprise and Columbia. The Trustees reviewed and analyzed these materials, which included, among other things, information about the background and experience of expected senior management of RiverSource and Ameriprise after the Closing. The Trustees considered RiverSource's ability to provide administrative services to the Funds, noting that while the aggregate scope of advisory an d administrative services was not expected to change following the Closing, the allocation of services was expected to shift, to a limited extent, such that administrative services will be provided under a new administrative services agreement. The Trustees considered, among other things, the capacity and quality of RiverSource's and the Subadvisers' investment management, research and trade execution capabilities and other resources that would be dedicated to performing services for the Funds. The Trustees also considered matters related to RiverSource's and the Subadvisers' compliance programs and compliance records, including RiverSource's portfolio transaction policies and procedures. The Trustees discussed with senior management personnel their ability to administer and oversee outside service providers to the Funds and their shareholders and were satisfied with management's processes for providing services and overseeing and reviewing services to be rendered by outside sources.
In evaluating the services to be provided under the Proposed Advisory and Subadvisory Agreements, the Trustees factored in their extensive discussions with representatives of Columbia, RiverSource and Ameriprise at the meetings referenced above regarding the management of each Fund. The Trustees considered representations by Ameriprise that it was expected that there will be no diminution in the nature and quality of services provided to the Funds. The Trustees noted that Columbia Management Group's current President, Columbia's current Chief Investment Officer and Columbia's current President, were expected to continue to serve the Funds in similar capacities after the Closing. With respect to portfolio management, the Trustees reviewed information regarding the deliberative process for selecting portfolio management personnel to continue servicing the Fund s after the Closing, including the expected role of Columbia's Chief Investment Officer in evaluating and selecting portfolio management personnel for each Fund utilizing Columbia's current analytical model for evaluating portfolio managers. In this regard, the Trustees also weighed representations by Ameriprise that this investment management evaluative process was likely to result in a significant number of Columbia investment professionals and personnel currently responsible for management of the Funds to remain in place. The Trustees noted that the portfolio management evaluation and selection process was designed to optimize the portfolio management resources available to each Fund by having the ability to select investment personnel for the Funds from the combined organization. Similarly, the Trustees evaluated the ability of RiverSource and the Subadvisers, based on their respective resources, reputations and other attributes, to attract and retain qualified investment professionals. In this regard, t he Trustees considered information regarding the nature of the compensation structure applicable to portfolio managers and other key investment personnel.
The Trustees reviewed and considered information from Ameriprise and RiverSource regarding various contemplated service provider arrangements, including information regarding both immediate and potential future plans in respect of these arrangements. In this regard, the Trustees considered information regarding potential distribution, transfer agency and custody arrangements and the evaluation of fund accounting, financial reporting and valuation service model options, noting certain differences between Columbia's and RiverSource's current approaches, including that RiverSource has historically utilized services provided "in-house" or by its affiliates for fund accounting, financial reporting and valuation. The Trustees reviewed information from Ameriprise and RiverSource regarding the expectation for rationalized or harmonized fees as part of the integration after the Closing in order to develop consistent service fee schedules across the combined fund family. The Trustees noted Ameriprise's representations that, to the extent any
41
such proposals were recommended to the Board after the Closing, they would not result in an "unfair burden" (within the meaning of Section 15(f) of the 1940 Act) on any Fund.
In addition, the Trustees reviewed and evaluated materials and information received regarding the investment and legal compliance programs of the Funds, RiverSource and the Subadvisors, including their compliance policies and procedures and reports of the Funds' Chief Compliance Officer. In this regard, the Trustees considered that Columbia's current Chief Compliance Officer was expected to serve in the same role after the Closing.
The Trustees also noted that Ameriprise and certain of its affiliates have been involved in a number of legal, arbitration and regulatory proceedings, including routine litigation, class actions, and governmental actions, concerning matters arising in connection with the ordinary conduct of their business activities, and that Ameriprise indicated that neither Ameriprise nor any of its affiliates are the subject of any pending legal, arbitration or regulatory proceedings that are likely to have a material adverse effect on the Funds or the ability of Ameriprise or its affiliates, including RiverSource to provide services to the Funds.
Based on the foregoing and other information considered relevant, the Trustees concluded that, overall, they were satisfied with assurances from Columbia, RiverSource, Ameriprise and the Subadvisers as to the expected nature, extent and quality of services to be provided to each Fund under the Proposed Advisory and Subadvisory Agreements.
Investment Advisory and Subadvisory Fee Rates and Other Expenses. The Trustees reviewed and considered the proposed contractual investment advisory fee rates to be paid by each Fund to RiverSource for investment management services both separately and together with the administration fee rates to be paid by the Funds to RiverSource (the "Contractual Management Rates"), which are the same as the separate and aggregate advisory and administrative fee rates currently paid by each Fund to Columbia. The Trustees also reviewed and considered the proposed subadvisory fee rates and the fee arrangements under the Proposed Subadvisory Agreements, respectively, which are also the same as those currently in effect under the Current Subadvisory Agreements. In addition to the materials provided by Columbia, RiverSource provided information regarding the current fee s for each of the RiverSource funds and other relevant institutional accounts. The Trustees reviewed and considered the proposed fee waiver/cap arrangements applicable to the Contractual Management Rates and considered the Contractual Management Rates after taking the waivers/caps into account (the "Actual Management Rates"). In this regard, the Trustees noted that RiverSource had committed to maintain the Funds' current expense limitation and waiver arrangements (both contractual and voluntary). The Trustees considered the potential that, after the Closing, RiverSource would propose a common fee and expense structure for the combined fund family, subject to the commitment that Ameriprise will not seek any change that would result in an "unfair burden" on any Fund. The Trustees also considered the report prepared and provided by the Fee Consultant. Additionally, the Trustees received and afforded specific attention to information provide d in connection with the Current Agreement Re-Approval Process, comparing the Contractual Management Rates and Actual Management Rates with those of other funds in each Fund's Peer Group (as defined below).
During the Current Agreement Re-Approval Process, the Trustees reviewed and considered statistical information regarding each Fund's total expense ratio and its various components, including contractual advisory fees, actual advisory fees, actual nonmanagement fees, Rule 12b-1 and non-Rule 12b-1 service fees, fee waivers/caps and/or expense reimbursements. The Trustees also reviewed comparisons of these fees to the expense information for the group of Funds that was determined by Lipper Inc. ("Lipper") to be the most similar to a given Fund (the "Peer Group") and to the performance of a broader universe of relevant funds as determined by Lipper (the "Universe"), which comparative data was provided by Lipper, an independent provider of investment company data.
The Trustees were provided with a description of the methodology used by Lipper to select the mutual funds in each Fund's Peer Group and Universe and reviewed the degree of comparability resulting from the selection methodology. For certain Funds, Lipper determined that changing the composition of the Peer Group and/or Universe for expenses from that used for performance would provide a more accurate basis of comparison. The Trustees also considered Lipper data that ranked each Fund based on: (i) each Fund's one- and
42
three-year performance compared to actual management fees; and (ii) each Fund's one- and three-year performance compared to total expenses.
For each Fund, except as otherwise described in the Fund-specific discussion below, the Trustees noted that they had concluded during the Current Agreement Re-Approval Process that the Contractual Management Rates, the Actual Management Rates and the total expense ratio were at acceptable levels in light of the quality of services provided to the Fund and in comparison to such Fund's Peer Group and Universe, as applicable; that the advisory fee rate would not be increased for any Fund; that Ameriprise and RiverSource had represented that the overall expenses for each Fund were not expected to be adversely affected by the Transaction; and that RiverSource had committed to maintain the Funds' current expense limitation or waiver arrangements (both contractual and voluntary).
Based on the foregoing, other relevant information received and the additional information described in the Fund-specific discussion below, as applicable, the Trustees concluded that the Contractual Management Rates, the Actual Management Rates and the total expense ratio were acceptable.
Fund Performance. The Trustees reviewed detailed performance information for each Fund at various Board and committee meetings during the year in addition to the additional performance information that they reviewed and evaluated in connection with the Transaction. The Trustees also reviewed and evaluated detailed performance information for each Fund in connection with the Current Agreement Re-Approval Process. The Trustees considered the performance results for each of the Funds over multiple measurement periods. They also considered these results in comparison to the performance results of each Fund's Peer Group and Universe, as well as to each Fund's benchmark index. The Boards also noted certain risk-adjusted performance data.
The Trustees also reviewed and evaluated information and data regarding the investment performance record of RiverSource in managing funds with investment strategies generally similar to those of the Funds, as applicable. Investment performance for such funds was provided for a wide range of periods.
The Trustees recognized that the investment performance record of RiverSource in managing funds with similar objectives may be less relevant to their deliberations in situations where the current portfolio managers of Columbia are expected to continue managing a particular Fund following the Closing. They also recognized that for each Fund, it is not possible to predict with certainty what effect, if any, consummation of the Transaction will have on the future performance of the Funds, noting in particular that past investment performance is no assurance of future results. The Fund-by-Fund discussion set forth below provides additional information regarding those Funds highlighted as meeting agreed-upon criteria for warranting further review. Such criteria included, among other things, information relating to Actual Management Rates, total expense ratios and /or performance information, relative to a Fund's Peer Group and/or Universe.
Costs of Services to be Provided and Profitability. In considering the costs of services to be provided by RiverSource and the Subadvisers under the Proposed Advisory Agreement and Proposed Subadvisory Agreement, as applicable for each Fund, and the projected range of profitability to RiverSource and the Subadvisers from their relationships with the Funds, the Trustees considered, among other things, that there would be no increase in advisory or subadvisory fee rates under the Proposed Advisory and Subadvisory Agreements. The Trustees further noted, with respect to RiverSource, that it was not possible to predict with certainty how RiverSource's profitability would be affected by becoming the investment adviser to the Funds but, as a general matter, they were satisfied, based on their review of RiverSource's projected range of profitability assuming completion of the Transaction, that this projected profitability from their relationship with the Funds would not be excessive. The Trustees based their review, in part, on information regarding RiverSource's current profitability in managing the RiverSource Funds and the information available to the Trustees with respect to RiverSource's expense budgeting process. The Trustees also noted that they would have ongoing opportunities to address RiverSource's profitability in the future based on actual results. The Trustees did not consider separate profitability information with respect to the Subadvisers, as their profitability from their relationships with the Funds was not a material factor in determining whether to approve the Proposed Subadvisory Agreements. The Trustees also noted that the subadvisory fees paid to the Subadvisers, none of which is affiliated with Columbia, had previously been negotiated on an arms' length basis.
43
The Trustees also reviewed information about the financial condition of RiverSource and the Subadvisers and were satisfied that RiverSource and the Subadvisers have adequate resources to perform the services required under the Proposed Advisory and Proposed Subadvisory Agreements.
Subject to the limitations noted above, the Trustees concluded that they were satisfied that RiverSource's projected range of future profitability, and each Subadviser's historical profitability, from their relationship with each Fund, as relevant, were not excessive.
Economies of Scale. The Trustees received and evaluated information regarding the potential to realize economies of scale with respect to management of the Funds, whether the Funds would appropriately benefit from any economies of scale and whether there was any potential for realization of further economies of scale in connection with the Transaction. The Trustees noted that the current and proposed investment advisory fee rates for most of the Funds contain breakpoints that reduce the fee rate on assets above specified levels. The Trustees noted that RiverSource had indicated that no changes to the Funds' breakpoint arrangements were proposed to be made at this time. In light of these factors and noting that it was not possible to evaluate with certainty if and how the Transaction would produce any immediate opportunities for additional economies of scale, the Trustees concluded that each Fund's breakpoint arrangements were acceptable. The Trustees also recognized that the Funds may benefit from certain economies of scale over time from becoming a part of the larger RiverSource fund complex, based on potential future synergies of operations, potential fee harmonization/rationalization initiatives and potential future Fund mergers. The Trustees noted, in particular, RiverSource's acknowledgement of the principle that the Funds should share in certain economies of scale if realized by RiverSource. In addition, the Trustees evaluated the likelihood that there would be potential Fund mergers after the Closing. The Trustees noted that any such potential Fund mergers, if approved, could result in the achievement of additional breakpoints for Funds that have implemented breakpoint fee schedules. The Trustees also noted that they expect to consider economies of scale from time to time following the Closing and thus be in a position to evaluate any additional e conomies of scale.
The Trustees acknowledged the inherent limitations of any analysis of an investment adviser's economies of scale, stemming largely from the Trustees' understanding that economies of scale are generally realized, if at all, by an investment adviser across a variety of products and services, not just with respect to a single fund.
Information About Investment Management Services to Non-Mutual Fund Clients. The Trustees also received and reviewed information about the nature and extent of services and fee rates offered by Riversource and the Subadvisers to the Funds compared with other clients with similar accounts, including separate accounts and institutional investments. The Trustees noted that the Funds may receive services different from those offered to other clients of RiverSource and the Subadvisers and concluded that the advisory fee rates under the Proposed Advisory Agreements and the subadvisory fee rates under the Proposed Subadvisory Agreements were not excessive, given the nature and extent of services expected to be offered and other factors, including the Trustees' review of Lipper data.
Other Benefits to RiverSource and the Subadvisers. The Trustees received and reviewed information regarding any expected "fall-out" or ancillary benefits to be received by RiverSource and its affiliates and by the Subadvisers as a result of their relationships with the Funds.
Among other things, the Trustees noted that RiverSource would benefit from soft dollar arrangements using portfolio brokerage of each Fund that invests in equity securities. The Trustees also noted that the Subadvisers also had benefited from, and expected to continue to benefit from, soft dollar arrangements using portfolio brokerage of the Subadvised Funds. The Trustees acknowledged RiverSource's representation that none of its affiliated broker dealers was expected to provide brokerage services to any Fund, but noted that broker-dealer affiliates of RiverSource will receive distribution related fees from the Funds in respect of shares held in certain accounts, and that such Funds' distributor (which will also become a subsidiary of RiverSource following the closing of the Transaction) retains a portion of the distribution related fees from the Funds and receives a portion of the sales charges on sales or redemptions of certai n classes of shares of the Funds. The Trustees recognized that RiverSource's and the Subadvisers' profitability would be
44
somewhat lower without these benefits. The Trustees concluded that RiverSource and the Subadvisers may derive reputational benefits from their association with the Funds. The Trustees also noted, however, that such benefits were difficult to quantify with certainty.
Fund-Specific Considerations for Certain "Review" Funds. During the Current Agreement Re-Approval Process, a limited number of Funds were highlighted as meeting agreed-upon criteria for warranting further review. Such criteria included, among other things, information relating to Actual Management Rates, total expense ratios and/or performance information, relative to a Fund's Peer Group and/or Universe. For such "review" Funds, the Trustees engaged in further analysis with regard to the approval of the Funds' Current Advisory Agreements. For each such Fund, the Trustees subsequently considered the impact of transitioning investment management responsibilities to RiverSource.
Columbia Small Cap Value Fund II was not highlighted as a review fund.
Conclusion. After an evaluation of the above-described factors and based on its deliberations and analysis of the information provided and alternatives considered, each Board, including all of the Independent Trustees, concluded that approval of the Proposed Advisory and Subadvisory Agreements was in the best interests of each of the Funds and its shareholders. Accordingly, the Boards unanimously approved the Proposed Advisory and Subadvisory Agreements.
45
Summary of Management Fee Evaluation by
Independent Fee Consultant
EXCERPTS FROM REPORT OF INDEPENDENT FEE CONSULTANT TO THE FUNDS SUPERVISED BY THE COLUMBIA NATIONS BOARD
Prepared Pursuant to the February 9, 2005
Assurance of Discontinuance among the
Office of Attorney General of New York State,
Columbia Management Advisors, LLC, and
Columbia Management Distributors, Inc.
November 12, 2009
I. Overview
On February 9, 2005, Columbia Management Advisors, LLC ("CMA") and Columbia Management Distributors, Inc.1 ("CMD") agreed to the New York Attorney General's Assurance of Discontinuance ("AOD"). Among other things, the AOD stipulates that CMA may manage or advise a Columbia Fund ("Columbia Fund" and, together with some or all of such funds, the "Columbia Funds") only if the Independent Members of the Columbia Fund's Board of Trustees appoint a Senior Officer or retain an Independent Fee Consultant ("IFC") who is to manage the process by which proposed management fees are negotiated. The AOD further stipulates that the Senior Officer or IFC is to prepare a written annual evaluation of the fee negotiation process.
With effect from January 1, 2007, the Independent Members of the Board of Trustees for certain Columbia Funds known collectively as the "Nations Funds" (together with the other members of that Board, the "Trustees") retained me as IFC for the Nations Funds.2 In this capacity, I have prepared the fifth annual written evaluation of the fee negotiation process. As was the case with the 2007 and 2008 reports, my immediate predecessor as IFC, John Rea, provided invaluable assistance in the preparation of this year's report.
A. Role of the Independent Fee Consultant
The AOD charges the IFC with "managing the process by which proposed management fees ... to be charged the Columbia Fund are negotiated so that they are negotiated in a manner which is at arms' length and reasonable and consistent with this Assurance of Discontinuance." The AOD also provides that CMA "may manage or advise a Columbia Fund only if the reasonableness of the proposed management fees is determined by the Board of Trustees ... using ... an annual independent written evaluation prepared by or under the direction of ... the Independent Fee Consultant." Therefore, the AOD makes clear that the IFC does not supplant the Trustees in negotiating management fees with CMA, nor does the IFC substitute his or her judgment for that of the Trustees with respect to the reasonableness of proposed fees or any other matter that is committed to the business judgmen t of the Trustees.
B. Elements Involved in Managing the Fee Negotiation Process
In preparing the report required by the AOD, the IFC must consider at least the following six factors set forth in the AOD:
1. The nature and quality of CMA's services, including the Fund's performance;
2. Management fees (including any components thereof) charged by other mutual fund companies for like services;
3. Possible economies of scale as the Fund grows larger;
4. Management fees (including any components thereof) charged to institutional and other clients of CMA for like services;
5. Costs to CMA and its affiliates of supplying services pursuant to the management fee agreements, excluding any intra-corporate profit; and
6. Profit margins of CMA and its affiliates from supplying such services.
C. Organization of the Annual Evaluation
This report, like last year's, focuses on the six factors and contains a section for each factor except that CMA's costs and profits from managing the Funds are treated in a single section. In addition to a discussion of these factors, the report offers recommendations to improve the fee review process in future years. A review of the status of recommendations made in the 2008 Report is being provided separately with the materials for the November meeting.
1 CMA and CMD are subsidiaries of Columbia Management Group, LLC ("CMG"), and are the successors to the entities named in the AOD.
2 I have no material relationship with Bank of America, CMG or any of its affiliates, aside from serving as IFC, and I am aware of no material relationship with any of their affiliates. I retained John Rea, an independent economic consultant, to assist me with this report.
Unless otherwise stated or required by the context, this report covers only the Nations Funds, which are also referred as the "Funds."
46
II. Summary of Findings
A. General
1. Based upon my examination of the information supplied by CMG in the light of the six factors set forth in the AOD, I conclude that the Trustees have the relevant information necessary to evaluate the reasonableness of the proposed management fees for each Nations Fund, subject to the following: on September 30, 2009, Ameriprise Financial, Inc. ("Ameriprise") announced that it had agreed to purchase the investment management business of CMG with the exception of its cash and liquidity management business which includes the Nations money market Funds. As a result, the Trustees requested information from CMG as to the plans of CMG and its parent with respect to the provision of investment management services to those Funds after the consummation of the proposed transaction. As of the date of this report, that in formation has not yet been provided. However, as the transaction is not expected to close until the spring of 2010, the Trustees concluded that they would have ample opportunity to take appropriate steps with respect to the investment management agreements of the money market Funds, including invoking the 60-day termination provisions of those agreements, in response to the information to be provided by CMG and reviewed by the IFC.
In my view, the process by which the proposed management fees of the Funds have been negotiated in 2009 thus far has been, to the extent practicable, at arms' length and reasonable and consistent with the AOD.
B. Nature and Quality of Services, Including Performance
3. The performance of the Funds was relatively strong for the measuring periods ending March 31, 2009. Between one-third and nearly one-half of the Funds were ranked in either the first or second quintiles in the one-, three-, five-, and 10-year periods, and no more than 8% were in the fifth quintile for these periods. Overall, the performance was stronger in the two longer periods.
4. The strongest performing groups over the one-, three-, and five-year periods were active equity, quantitative strategies, and, to a lesser extent, money market Funds. Sub-advised Funds were the weakest performers, with over 60% of the Funds in the bottom two quintiles in the one- and three-year periods. For the same two periods, no more than 15% percent of the sub-advised Funds were in the top two quintiles. Almost half of fixed-income Funds ranked in the bottom two quintiles in the one- and three-year periods.
5. Overall performance of the Funds was less robust in 2009 than in 2008 and 2007 for the one- and three-year performance periods. For example, 62% of the Funds were in the top two quintiles in 2007 for the one-year period compared with 33% in 2009. The ranks of those in the bottom two quintiles rose significantly between 2007 and 2009, led by money market and fixed-income Funds in the one- and three-year periods. For the three-year period, there was a similar trend with respect to sub-advised Funds.
6. The performance of the active equity Funds against their benchmarks was strong for the one-, three-, and five-year performance periods. In contrast, more than half of the sub-advised Funds failed to beat their benchmarks on a net basis in the one- and three-year periods. The fixed-income Funds consistently produced gross returns below those of their benchmarks. Lipper quintile rankings of the actively managed equity Funds are highly correlated with their performance against their benchmarks in the sense that net returns in excess of the benchmark appear necessary to achieve a ranking in one of the top three quintiles. No such correlation was observed for fixed-income and quantitative strategies Funds.
7. The equity Funds' overall performance adjusted for risk was mixed. Based upon three-year returns, less than 40% of the equity Funds had a combination of risk-adjusted and unadjusted returns that placed them in the top half of their performance universes; 60% were in the bottom half of their universes. About 30% of the fixed income Funds posted high returns and low risk relative to comparable funds. Over 60% of the fixed-income Funds took on more risk than the typical fund in their performance universes.
8. The industry-standard procedure used by Lipper that includes all share classes in the performance universe tends to bias a Fund's ranking upward within that universe. The bias occurs because either no-12b-1 fee or low-12b-1 fee share classes of the Nations Funds are compared with funds in performance universes that
47
include all share classes of multi-class funds with 12b-1 fees of up to 100 basis points. Correcting this bias by limiting the performance universe to classes of comparable funds with low or no 12b-1 fees (a "filtered universe") lowers the relative performance for the Funds, but generally not to a material extent. The filtering process, however, did identify two Funds for further review that had not been so identified using unfiltered universes.
9. A small number of Funds have consistently underperformed over the past five years. The exact number depends on the criteria used to evaluate longer-term performance. For example, six different Funds have had below-median performance in at least four out of the five years between 2005 and 2009 for either the one- or three-year performance periods from 2005 to 2009. If the threshold were the 60th percentile, only two Funds would have satisfied the criteria.
10. The services performed by CMG professionals beyond portfolio management, such as compliance, legal, information technology, risk management, finance, and fund administration, are critical to the success of the Funds and appear to be of high quality.
C. Management Fees Charged by Other Mutual Fund Companies
11. The Funds' management fees and total expenses are generally low relative to those of their peers, with over half the Funds ranking in the most favorable two quintiles. For total expenses, slightly more than one-quarter are in the bottom two quintiles, while slightly less than two-fifths are in the bottom two quintiles for actual management fees. Fixed-income and quantitative strategies Funds have the lowest fees and expenses relative to their peers. The sub-advised Funds account for the majority of Funds in the fifth quintile for both management fees and total expenses.
12. The distribution of management fee rankings has changed little over the past three years, while the distribution of total expense rankings has moved in the direction of higher expenses. The most notable change involving total expenses has been a shift in the number of Funds from the first to the second quintile.
13. The management fees of the non-subadvised Funds are generally in line with those of Columbia Funds supervised by the Atlantic Board of Trustees (the "Atlantic Funds"). The sub-advised large cap equity, international equity, and high yield Funds, however, generally have higher management fees than those of comparable Atlantic and non-subadvised Funds.
14. The implementation of the new program of voluntary expense limits appears to have been associated, on balance, with less favorable expense rankings. This result reflects increases in expense limits for certain Funds, the removal of fee waivers, and the shift of certain expenses from CMA to the Funds. The decline in expense rankings is less significant, however, than CMA projected in December 2008.
D. Trustees' Advisory Contract Review Process
15. The Trustees' evaluation process identified 22 Funds in 2009 for further review based upon long-standing criteria relating to their relative performance or expenses or both. When compared in filtered universes, two more Funds met the criteria for further review. At the November meeting, CMG provided further information about each of those Funds to assist the Trustees in their evaluation.
E. Potential Economies of Scale
16. CMG presented to the Trustees its analysis of the sources and sharing of potential economies of scale. CMG views economies of scale as arising at the complex level and would regard estimates of scale economies for individual funds as unreliable. In its analysis, CMG did not identify specific sources of economies of scale or provide any estimates of any economies of scale that might arise from future asset growth. CMG's analysis included measures taken by the Trustees and CMG that seek to share any potential economies of scale through breakpoints in management fee schedules, the establishment of expense limits for each Fund, enhanced shareholder services, fund mergers, and operational consolidation.
17. An examination of the contractual fee schedules for five Nations Funds shows that the schedules for Small Cap II, Municipal Reserves, and Treasury Reserves compare favorably with those of their competitors, while the subadvised Marsico Growth and High Yield VS Funds have schedules generally above those of their peers, including funds that do not have a sub-adviser. The group fee with
48
breakpoints that characterizes the money market Fund schedules is not typically found among competitors, nearly all of which have flat fee schedules.
F. Management Fees Charged to Institutional Clients
18. CMG has provided Trustees with comparisons of mutual fund management fees and institutional fees based upon standardized fee schedules and upon actual fees. The results show that, consistent with industry practice, actual and scheduled institutional fees are generally, but not always, lower than the Funds' management fees. CMG provided additional data this year demonstrating that at small asset levels, the effective fee of certain Funds may be equal to or less than institutional fee levels at those asset levels, due to the effect of expense limits on small funds with high gross expenses. CMG also analyzed the differences between the services provided and risks borne on the one hand by a manager of mutual funds and on the other by institutional advisers, and suggested that these differences should be kept in mind when Trustees review the reasonableness of the Funds' management fees.
G. Revenues, Expenses, and Profits
19. The activity-based cost allocation methodology employed by CMG to allocate costs, both direct and indirect, for purposes of calculating Fund profitability is thoughtful and detailed. This year, CMG further refined the technique by allocating additional indirect expenses on an activity basis.
20. The materials provided on CMG's revenues and expenses with respect to the Funds and the methodology underlying their construction form a sufficient basis for Trustees to evaluate the expenses of and profitability to CMG arising out of its relationships with the Funds.
21. CMG provided a firm-wide pro forma 2009 income statement demonstrating the effect of market events beginning in the fourth quarter of 2008 on its revenues and profitability to provide an additional perspective on calendar 2008 profitability data.
22. In 2008, CMG's pre-tax pre- and post-distribution margins on the Nations Funds were above the industry mean and median, based on limited data available for publicly held mutual fund managers and excluding the costs of CMG's money market capital support programs. However, as is to be expected in a 63-Fund complex, some Nations Funds had relatively high pre-tax profit margins in 2008, when calculated solely with respect to management revenues and expenses, while other Nations Funds operated at a loss. There is a positive relationship between Fund size and profitability to CMG, with smaller Funds generally operating at a loss to CMG.
23. CMG pays a fixed percentage of its management fee revenues to an affiliate, U.S. Trust, Bank of America Private Wealth Management, with respect to assets of its clients invested in Nations Funds to compensate it for services it performs with respect to those client assets and for the effect of state law limitations on affiliates charging multiple fees. Based on our analysis of the services provided by this affiliate, we have concluded that all payments other than those for sub-transfer agent or sub-accounting services should be treated as a distribution expense.
III. Recommendations
1) Criteria for review. The Trustees may wish to consider modifying the criteria for identifying a Fund for further review (a "Review Fund") to include criteria that focus exclusively on performance. They may also wish to consider whether it would be useful to apply CMG's own internal monitoring standards for Fund performance to the contract review process, or whether such criteria are more relevant to their ongoing investment oversight.
2) Presentation of Review Fund discussion. CMG should consider whether it could more systematically present in one discussion all relevant information regarding each Review Fund, which is now split into several different portions of the 15(c) materials. For any Fund that has been a Review Fund in consecutive years, CMG should address under what circumstances it could reasonably be anticipated that the Fund would lose that status.
3) Refinement of tax-exempt performance data. Certain single-state tax-exempt Funds compete in extremely small universes and are compared to a multi-state benchmark of uncertain relevance. Notwithstanding the difficulties, CMG should work to improve the reliability of the calculation of relative performance of these Funds. If that is not possible, CMG should provide guidance on how the Trustees should judge the quality of CMG's management of these Funds.
49
4) Development of risk metrics for asset-allocation, tax-exempt, and money market Funds. CMG has developed and shared with the Trustees quantitative risk metrics comparing equity and taxable fixed-income Funds against their peers. However, reliable risk metrics have not been developed for asset-allocation, tax-exempt fixed income, and money market Funds. We urge CMG to continue its efforts to provide reliable risk measures for these categories of Funds, especially in the cases of asset-allocation and money market funds, because their investors are likely to be motivated at least in part by a desire to manage risk.
5) Profitability data. For any period during which CMG is an affiliate of U.S. Trust, Bank of America Private Wealth Management, CMG should continue to present to the Trustees the profitability of each Fund, each investment style and each complex (of which Nations is one) calculated as follows:
a. Management-only profitability should be calculated without reference to any Private Bank expense.
b. Profitability excluding distribution (which essentially covers the management and transfer agency functions) should be adjusted by removing from the expense calculation any portion of the Private Bank payment not attributable to the performance by the Private Bank of sub-transfer agency or sub-accounting functions.
c. Total profitability, including distribution: No adjustment for Private Bank expenses should be made, because all such expenses represent legitimate fund expenses to be taken into account in calculating CMG's profit margin including distribution.
d. Distribution only: This should include all Private Bank expenses other than those attributable to sub-transfer agency services.
6) Contractual fee analysis. This year CMG presented a new Lipper report comparing the contractual management fees of Funds with those of competitors in similar investment styles. However, the reliability of the conclusion—that Fund management fee breakpoints compared favorably with competitive fee rates—was limited by the use of competitive funds at all asset levels. The sponsors of a $100 million mutual fund may not have given much thought to breakpoints at $5 billion; therefore, that fund's
contractual fee at that level is unlikely to compare favorably with that of a $5 billion Fund. Limiting the competitors to the Lipper expense group, whose constituents are similar in size to the relevant Fund, would make the results more meaningful. In addition, the breakpoints of a select group of Nations Funds (which would differ each year) should continue to be compared to those of industry rivals to ensure that the Funds' breakpoint schedules remain within industry norms. As breakpoint schedules change relatively little each year, performing such a comparison for each Nations Fund each year would not be an efficient use of Trustee and CMG resources.
7) Pro forma profitability data. In any year in which CMG or the Trustees believe that the prior year's profitability is unlikely to be representative of current business results due to changes in markets or for any other reason, CMG should, consistent with this year's practice, prepare a pro forma income statement based on year-to-date actual data and reasonable projections used for its own business planning purposes.
8) Additional institutional data and analysis. While CMG provided a substantial amount of information on its institutional business, we suggest some additional items for future years: (a) profitability data for the institutional business in the format, and based upon the same allocation methodologies, used to present Fund profitability, (b) an explanation of how CMA sets institutional fee breakpoints, which normally begin at asset levels far lower than those found in Fund management fee breakpoints, and (c) distinguishing in all institutional fee materials fees of accounts acquired prior to the development of current fee schedules (so-called "legacy" accounts) from the fees of accounts launched after that time.
9) Management fee disparities. In any future study of management fees, CMG and the Nations Trustees should analyze the differences in management fee schedules. As part of that analysis, CMG should provide an explanation for any significant fee differences among comparable funds across fund families sponsored by CMG, such as differences in the management styles of different Funds included the same Lipper category. Finally, if CMG proposes a management fee change or an expense cap for
50
any mutual fund managed by CMA that is comparable to any Nations Fund, CMG should provide the Trustees with sufficient information about the proposal to allow the Trustees to assess the applicability of the proposed change to the relevant Nations Fund or Funds.
10) Explanation of data supplied to Lipper. Each year, as part of the 15(c) process, CMG retains Lipper to compare the fees and expenses of each Fund to a group of competitors. In many cases, CMG, with the approval of the Trustees, adjusts the actual expense data, which is based on the most recent full fiscal year of the Fund (and each competitive fund) to reflect changes in fees or expense limits that occurred during or after the relevant fiscal year. This improves the reliability and usefulness of the comparison. However, to ensure that the Trustees know when and how CMG adjusted the data, we recommend that CMG prepare a table listing for each Fund what adjustments were made, e.g., to reflect a new expense limitation of x basis points that commenced on y date.
11) Reduction of volume of paper documents submitted. The effort to streamline and better organize the data presented to the Trustees and the process by which that data was prepared and organized continued to be well-received by all parties. Notwithstanding past success, it is always appropriate to look for opportunities to reduce and simplify the presentation of 15(c) data. One possibility would be to remove the 127 pages of biographical data, most if not all of which the Trustees have previously seen as part of their ongoing investment oversight duties, from the paper volume and post it on the Internet-based document storage and retrieval system used by the Funds to provide reference data to Trustees.
Respectfully submitted,
Steven E. Asher
51
This page intentionally left blank.
Important Information About This Report
The fund mails one shareholder report to each shareholder address. If you would like more than one report, please call shareholder services at 1-800-345-6611 and additional reports will be sent to you. This report has been prepared for shareholders of Columbia Small Cap Value Fund II.
A description of the policies and procedures that the fund uses to determine how to vote proxies and a copy of the fund's voting records are available (i) at www.columbiamanagement.com, (ii) on the Securities and Exchange Commission's website at www.sec.gov, and (iii) without charge, upon request, by calling 1-800-368-0346. Information regarding how the fund voted proxies relating to portfolio securities during the 12-month period ended June 30 is available from the SEC's website. Information regarding how the fund voted proxies relating to portfolio securities is also available from the fund's website, www.columbiamanagement.com.
The fund files a complete schedule of portfolio holdings with the SEC for the first and third quarters of each fiscal year on Form N-Q. The fund's Form N-Q is available on the SEC's website at www.sec.gov and may be reviewed and copied at the SEC's Public Reference Room in Washington, D.C. Information on the operation of the Public Reference Room may be obtained by calling 1-800-SEC-0330.
Please read and consider the investment objectives, risks, charges and expenses for any fund carefully before investing. For a prospectus which contains this and other important information about the fund, contact your Columbia Management representative or financial advisor or go to www.columbiamanagement.com.
Columbia Management Group, LLC ("Columbia Management") is the investment management division of Bank of America Corporation. Columbia Management entities furnish investment management services and products for institutional and individual investors. Columbia Funds are distributed by Columbia Management Distributors, Inc., member of FINRA, SIPC, part of Columbia Management and an affiliate of Bank of America Corporation.
Transfer Agent
Columbia Management Services, Inc.
P.O. Box 8081
Boston, MA 02266-8081
1-800-345-6611
Distributor
Columbia Management
Distributors, Inc.
One Financial Center
Boston, MA 02111
Investment Advisor
Columbia Management Advisors, LLC
100 Federal Street
Boston, MA 02110
53
Columbia Management®
One Financial Center
Boston, MA 02111-2621
PRSRT STD
U.S. Postage
PAID
Holliston, MA
Permit NO. 20
Columbia Management®
Columbia Small Cap Value Fund II
Annual Report, February 28, 2010
©2010 Columbia Management Distributors, Inc.
One Financial Center, Boston, MA 02111-2621
800-345-6611 www.columbiafunds.com
SHC-42/34608-0210 (04/10) 10-85V1I3
Columbia Management®
Annual Report
February 28, 2010
Columbia Marsico 21st Century Fund
| NOT FDIC INSURED | | May Lose Value | |
|
| NOT BANK ISSUED | | No Bank Guarantee | |
|
Table of Contents
| Fund Profile | | | 1 | | |
|
| Economic Update | | | 2 | | |
|
| Performance Information | | | 4 | | |
|
| Understanding Your Expenses | | | 5 | | |
|
| Financial Statements | | | | | |
|
| Investment Portfolio | | | 8 | | |
|
Statement of Assets and
Liabilities | | | 11 | | |
|
| Statement of Operations | | | 13 | | |
|
Statement of Changes in Net
Assets | | | 14 | | |
|
| Financial Highlights | | | 16 | | |
|
| Notes to Financial Statements | | | 21 | | |
|
Report of Independent Registered
Public Accounting Firm | | | 30 | | |
|
| Fund Governance | | | 31 | | |
|
Board Consideration and
Re-Approval of Current
Investment Advisory and
Sub-Advisory Agreements | | | 35 | | |
|
Board Consideration and
Approval of Proposed
Investment Advisory and
Sub-Advisory Agreements | | | 39 | | |
|
Summary of Management
Fee Evaluation by Independent
Fee Consultant | | | 46 | | |
|
Important Information About
This Report | | | 53 | | |
|
The views expressed in this report reflect the current views of the respective parties. These views are not guarantees of future performance and involve certain risks, uncertainties and assumptions that are difficult to predict, so actual outcomes and results may differ significantly from the views expressed. These views are subject to change at any time based upon economic, market or other conditions and the respective parties disclaim any responsibility to update such views. These views may not be relied on as investment advice and, because investment decisions for a Columbia Fund are based on numerous factors, may not be relied on as an indication of trading intent on behalf of any particular Columbia Fund. References to specific securities should not be construed as a recommendation or investment advice.
President's Message

Dear Shareholder:
As we previously announced, Bank of America, N.A. has reached a definitive agreement to sell Columbia Management's long-term asset management business to Ameriprise Financial, Inc. This includes the management of its equity and fixed-income mutual funds.
This transaction combines two leading asset management firms and will create one entity that is expected to rank as one of the top asset managers. It is anticipated that the combined U.S. asset management business will operate under the well-regarded Columbia Management brand. The combined U.S. asset management business will be led by Ted Truscott, currently president, U.S. asset management, annuities and chief investment officer, Ameriprise Financial. Michael A. Jones, currently president of Columbia Management, will serve as president, U.S. asset management. Colin Moore, chief investment officer at Columbia Management, will continue to serve in that role for the combined organization. I will also continue in my role as head of mutual funds, responsible for the delivery of mutual fund products and services to investors.
As a valued investor in Columbia funds, please know that our goal is to ensure a smooth transition and provide you with the highest quality products and services. We will work closely with colleagues at Ameriprise Financial to seek a seamless transition for our clients and to keep you informed as the transition progresses and key decisions are made. We want to assure you that the funds' portfolio managers continue to focus on providing uninterrupted service to Columbia fund shareholders. Columbia Management and Ameriprise Financial will operate independently until all required approvals, including fund board, fund shareholder and other client approvals, have been received and the transaction closes, which is expected to occur in the spring of this year.
Meanwhile, transition teams across the company have been formed to oversee integration efforts including rebranding initiatives, vendor and system consolidations and client communications. Throughout the transition, we seek to build on best practices from both legacy organizations with enhancements to productivity, quality and the delivery of world-class customer experiences.
Clearly, we have a lot of work ahead of us in 2010. We look forward to introducing our combined business with an even wider breadth of products and capabilities. Everyone at Columbia Management and Ameriprise Financial is excited about the opportunities for this combined organization. I share this optimism and believe it will position us as a best-in-class asset management business with the ability to deliver more for clients than ever before.
Sincerely,

J. Kevin Connaughton
President, Columbia Funds
Fund Profile – Columbia Marsico 21st Century Fund
Summary
g For the 12-month period that ended February 28, 2010, the fund's Class A shares returned 59.10% without sales charge.
g In a period of robust gains by U.S. equities, the fund outperformed both its benchmark, the Russell 3000 Index1 and the average return of its peer group, the Lipper Multi-Cap Growth Funds Classification2, for the period.
g Strong stock selection in the financials, energy and consumer staples sectors aided the fund's relative performance. In addition, sector positioning in these areas was a positive factor for performance.
Portfolio Management
Corydon J. Gilchrist has managed the fund since February 2003. He is with Marsico Capital Management, LLC ("MCM"), investment sub-advisor to the fund.
Columbia Management Advisors, LLC ("Columbia") and Marsico Capital Management, LLC (MCM) are SEC-registered investment advisors. Columbia is an indirect, wholly owned subsidiary of Bank of America Corporation. Columbia has retained MCM to serve as investment sub-advisor. As the investment sub-advisor, MCM makes the investment decisions and manages all or a portion of the fund. MCM is not affiliated with Bank of America.
Subject to satisfying various conditions to closing, effective on or about May 1, 2010, RiverSource Investments, LLC, a subsidiary of Ameriprise Financial, Inc., is expected to become the investment advisor to the fund and change its name to Columbia Management Investment Advisers, LLC. Please see the fund's prospectus dated July 1, 2009, including the supplements thereto, for more information regarding the expected change in investment advisor and any related changes to the portfolio management of the fund.
1The Russell 3000 Index measures the performance of the 3,000 largest U.S. companies based on total market capitalization, which represents approximately 98% of the investable U.S. equity market. Indices are not available for investment, are not professionally managed and do not reflect sales charges, fees, brokerage commissions, taxes or other expenses of investing. Securities in the fund may not match those in an index.
2Lipper Inc., a widely respected data provider in the industry, calculates an average total return (assuming reinvestment of distributions) for mutual funds with investment objectives similar to those of the fund. Lipper makes no adjustment for the effect of sales loads.
Performance data quoted represents past performance and current performance may be lower or higher. Past performance is no guarantee of future results. The investment return and principal value will fluctuate so that shares, when redeemed, may be worth more or less than the original cost. Please visit www.columbiafunds.com for daily and most recent month-end performance updates.
Summary
1-year return as of 02/28/10
| | | | | +59.10% | |
|
| |  | | | Class A shares
(without sales charge) | |
|
| | | | | +55.96% | |
|
| |  | | | Russell 3000 Index | |
|
Morningstar Style BoxTM
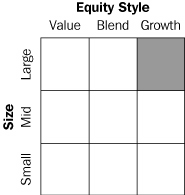
The Morningstar Style BoxTM reveals a fund's investment strategy. For equity funds, the vertical axis shows the market capitalization of the stocks owned, and the horizontal axis shows investment style (value, blend or growth). Information shown is based on the most recent data provided by Morningstar.
1
Economic Update – Columbia Marsico 21st Century Fund
Summary
For the 12-month period that ended February 28, 2010
g After a sharp decline, stock markets rebounded around the world, as measured by the S&P 500 Index and the MSCI EAFE Index.
| S&P Index | | MSCI Index | |
|
 | |  | |
|
g As investors grew more comfortable with risk, non-Treasury sectors of the bond market rebounded. The Barclays Capital Aggregate Bond Index delivered solid results. High-yield bonds were strong performers, as measured by the JPMorgan Developed BB High Yield Index.
Barclays
Aggregate Index | | JPMorgan
Index | |
|
 | |  | |
|
After a deep and difficult recession, the U.S. economy regained its footing midway through calendar year 2009. Gross domestic product (GDP) turned positive in the third quarter of 2009, rising 2.2%, and then gained 5.6% in the fourth quarter according to the estimate released by the Bureau of Economic Analysis. Growth was primarily the result of federal government stimulus spending and a slowdown in inventory reductions. Hopes for a sustained recovery now depend on a variety of factors, including a rebound in consumer spending, an increase in revenues to keep business profits moving higher and a turnaround in the labor market.
The housing market showed some signs of improvement. Existing home sales fell late in the period, but remained above levels of one year ago. According to the National Association of Realtors, the inventory of houses for sale fell over the course of 2009. Housing prices remained unchanged during the past year, but that was progress compared to 2008. The average home price fell in 2008 and since then distressed properties, which accounted for an estimated 38% of sales in January 2010, have weighed on prices because they were heavily discounted.
In the beleaguered labor market, the good news was that there was less bad news. Businesses continued to shed jobs throughout the period, raising the unemployment rate as high as 10.2% in October 2009. However, the pace of job losses slowed markedly by the period's end. Compared to six figure losses of one year ago, 14,000 jobs were added to the labor market in January 2010 and only 14,000 were lost in February 2010.* The rate of unemployment at the end of the period was 9.7%.* Nevertheless, prospects for a quick recovery in the labor markets are dim. In fact, consumer confidence, as measured monthly by The Conference Board, an independent resear ch organization, took a sharp dive in February. Consumers surveyed cited worsening business conditions and a bleaker outlook for the labor markets and income for their pessimism.
Manufacturing activity remained slow during the first few months of the period. However, a key measure—the Institute for Supply Management's Index—rose above 50 in July and remained well above 50 for the remainder of the period. A value above 50 tends to indicate that the economy is growing. Industrial production turned positive in January 2010, and durable goods orders took a big jump forward. Manufacturing capacity utilization inched upward to 72.6%.
Consumer spending registered both ups and downs during the 12-month period, but the trend at the end of the period was upward, even though personal income decreased in January 2010. In light of uncertainty about the economy and pressure on consumers from a number of sectors, the Federal Reserve Board (the Fed) kept a key short-term interest rate—the federal funds rate—close to zero throughout the period.
Stocks bottomed, then rebounded
Against a strengthening economic backdrop, a stock market rally that began in mid-March 2009 continued throughout the period. The U.S. stock market returned 53.62% for the 12-month period, as measured by the S&P 500 Index.1 Mid-cap stocks
*Source: U.S. Bureau of Labor Statistics
1The Standard & Poor's (S&P) 500 Index tracks the performance of 500 widely held, large-capitalization U.S. stocks.
2
Economic Update (continued) – Columbia Marsico 21st Century Fund
outperformed large and small-cap stocks and value stocks outperformed growth stocks by a solid margin, as measured by their respective Russell indices.2 Outside the U.S., stock market returns were even stronger. The MSCI EAFE Index,3 a broad gauge of stock market performance in foreign developed markets, gained 54.58% (net of dividends, in U.S. dollars) for the period. Emerging stock markets were caught in last year's downdraft, but they bounced back stronger than domestic or developed world markets in 2009 as their economic growth generally outpaced the developed world. The MSCI Emerging Markets Index4 returned 91.63% (net of dividends, in U.S. dollars).
Bond returns ranged from solid to strong
As hopes for a recovery materialized, bonds from non-Treasury sectors delivered solid returns. The Barclays Capital Aggregate Bond Index5 returned 9.32%. Municipal bonds delivered returns that were in line with taxable investment-grade bonds even without factoring in potential tax advantages to investors in higher income tax brackets. The Barclays Capital Municipal Bond Index6 returned 9.98%. High-yield bond prices rebounded strongly in 2009. For the 12-month period covered by this report, the JPMorgan Developed BB High Yield Index7 returned 32.79%.
Past performance is no guarantee of future results.
2The Russell 1000 Index tracks the performance of 1,000 of the largest U.S. companies, based on market capitalization. The Russell Midcap Index measures the performance of the 800 smallest companies in the Russell 1000 Index, which represents approximately 25% of the total market capitalization of the Russell 1000 Index. The Russell 2000 Index measures the performance of the 2,000 smallest companies in the Russell 3000 Index, which represents approximately 8% of the total market capitalization of the Russell 3000 Index. The Russell 3000 Growth Index measures the performance of those Russell 3000 Index companies with higher price-to-book ratios and higher forecasted growth values. The stocks in this index are also members of either the Russell 1000 Growth or the Russell 2000 Growth indexes. The Russell 3000 Value Index measures the performance of those Russell 3000 Index companies with lower price-to-book ratios and lo wer forecasted growth values. The stocks in this index are also members of either the Russell 1000 Value or the Russell 2000 Value indexes.
3The Morgan Stanley Capital International Europe, Australasia, Far East (MSCI EAFE) Index is a capitalization-weighted index that tracks the total return of common stocks in 21 developed-market countries within Europe, Australasia and the Far East.
4The Morgan Stanley Capital International Emerging Markets Index (MSCI EMI) is a free float-adjusted market capitalization index that is designed to measure equity market performance of emerging markets. As of June 2009, the MSCI Emerging Markets Index consisted of the following 22 emerging market country indices: Brazil, Chile, China, Colombia, Czech Republic, Egypt, Hungary, India, Indonesia, Israel, Korea, Malaysia, Mexico, Morocco, Peru, Philippines, Poland, Russia, South Africa, Taiwan, Thailand, and Turkey.
5The Barclays Capital Aggregate Bond Index is a market value-weighted index that tracks the daily price, coupon, pay-downs and total return performance of fixed-rate, publicly placed, dollar-denominated and non-convertible investment grade debt issues with at least $250 million par amount outstanding and with at least one year to final maturity.
6The Barclays Capital Municipal Bond Index is considered representative of the broad market for investment-grade, tax-exempt bonds with a maturity of at least one year.
7The JPMorgan Developed BB High Yield Index is an unmanaged index designed to mirror the investable universe of the U.S. dollar developed, BB-rated, high yield corporate debt market.
Indices are not available for investment, are not professionally managed and do not reflect sales charges, fees, brokerage commissions, taxes or other expenses of investing. Securities in the fund may not match those in an index.
3
Performance Information – Columbia Marsico 21st Century Fund
Performance data quoted represents past performance and current performance may be lower or higher. Past performance is no guarantee of future results. The investment return and principal value will fluctuate so that shares, when redeemed, may be worth more or less than the original cost. Please visit www.columbiafunds.com for daily and most recent month-end performance updates.
Annual operating expense ratio (%)*
| Class A | | | 1.29 | | |
| Class B | | | 2.04 | | |
| Class C | | | 2.04 | | |
| Class R | | | 1.54 | | |
| Class Z | | | 1.04 | | |
*The annual operating expense ratio is as stated in the fund's prospectus that is current as of the date of this report. Differences in expense ratios disclosed elsewhere in this report may result from the inclusion of fee waivers and expense reimbursements as well as the use of different time periods used in calculating the ratios.
Performance of a $10,000 investment 04/10/00 – 02/28/10
The chart above shows the change in value of a hypothetical $10,000 investment in Class A shares of Columbia Marsico 21st Century Fund during the stated time period, and does not reflect the deduction of taxes that a shareholder may pay on fund distributions or on the redemption of fund shares.
Performance of a $10,000 investment 04/10/00 – 02/28/10 ($)
| Sales charge | | without | | with | |
| Class A | | | 12,286 | | | | 11,580 | | |
| Class B | | | 11,403 | | | | 11,403 | | |
| Class C | | | 11,403 | | | | 11,403 | | |
| Class R | | | 12,155 | | | | n/a | | |
| Class Z | | | 12,598 | | | | n/a | | |
Average annual total return as of 02/28/10 (%)
| Share class | | A | | B | | C | | R | | Z | |
| Inception | | 04/10/00 | | 04/10/00 | | 04/10/00 | | 01/23/06 | | 04/10/00 | |
| Sales charge | | without | | with | | without | | with | | without | | with | | without | | without | |
| 1-year | | | 59.10 | | | | 49.87 | | | | 57.66 | | | | 52.66 | | | | 57.89 | | | | 56.89 | | | | 58.71 | | | | 59.42 | | |
| 5-year | | | 2.27 | | | | 1.07 | | | | 1.49 | | | | 1.11 | | | | 1.51 | | | | 1.51 | | | | 2.05 | | | | 2.53 | | |
| Life | | | 2.10 | | | | 1.49 | | | | 1.34 | | | | 1.34 | | | | 1.34 | | | | 1.34 | | | | 1.99 | | | | 2.36 | | |
Average annual total return as of 03/31/10 (%)
| Share class | | A | | B | | C | | R | | Z | |
| Sales charge | | without | | with | | without | | with | | without | | with | | without | | without | |
| 1-year | | | 60.31 | | | | 51.05 | | | | 58.98 | | | | 53.98 | | | | 59.20 | | | | 58.20 | | | | 59.82 | | | | 60.73 | | |
| 5-year | | | 4.10 | | | | 2.87 | | | | 3.32 | | | | 2.96 | | | | 3.32 | | | | 3.32 | | | | 3.87 | | | | 4.35 | | |
| Life | | | 2.64 | | | | 2.04 | | | | 1.87 | | | | 1.87 | | | | 1.87 | | | | 1.87 | | | | 2.53 | | | | 2.90 | | |
The "with sales charge" returns include the maximum initial sales charge of 5.75% for Class A shares and the applicable contingent deferred sales charge of 5.00% in the first year, declining to 1.00% in the sixth year and eliminated thereafter for Class B shares and 1.00% for Class C shares for the first year only. The "without sales charge" returns do not include the effect of sales charges. If they had, returns would be lower.
Performance results reflect any fee waivers or reimbursements of fund expenses by the investment advisor and/or any of its affiliates. Absent these fee waivers or expense reimbursement arrangements, performance results would have been lower.
All results shown assume reinvestment of distributions. Class R shares are sold at net asset value with distribution and service (Rule 12b-1) fees. Class Z shares are sold at net asset value with no distribution and service (Rule 12b-1) fees. Class R and Class Z shares have limited eligibility and the investment minimum requirements may vary. Please see the fund's prospectus for details. Performance for different share classes will vary based on differences in sales charges and fees associated with each class.
The tables do not reflect the deduction of taxes that a shareholder may pay on fund distributions or on the redemption of fund shares.
The returns for Class R shares include the returns of Class A shares prior to January 23, 2006, the date on which Class R shares were initially offered by the fund. If differences in expenses had been reflected, the returns would have been lower, since Class R shares are subject to higher distribution and service (Rule 12b-1) fees.
4
Understanding Your Expenses – Columbia Marsico 21st Century Fund
As a fund shareholder, you incur two types of costs. There are transaction costs, which generally include sales charges on purchases and may include redemption fees or exchange fees. There are also ongoing costs, which generally include investment advisory fees, distribution and service (Rule 12b-1) fees and other fund expenses. The information on this page is intended to help you understand the ongoing costs of investing in the fund and to compare these costs with the ongoing costs of investing in other mutual funds.
Analyzing your fund's expenses by share class
To illustrate these ongoing costs, we have provided an example and calculated the expenses paid by investors in each share class during the period. The information in the following table is based on an initial investment of $1,000, which is invested at the beginning of the period and held for the entire period. Expense information is calculated two ways and each method provides you with different information. The amount listed in the "Actual" column is calculated using the fund's actual operating expenses and total return for the period. The amount listed in the "Hypothetical" column for each share class assumes that the return each year is 5% before expenses and is calculated based on the fund's actual operating expenses. You should not use the hypothetical account values and expenses to estimate either your actual account balance at the end of the period or the expenses you paid during this period.
Compare with other funds
Since all mutual funds are required to include the same hypothetical calculations about expenses in shareholder reports, you can use this information to compare the ongoing cost of investing in the fund with other funds. To do so, compare the 5% hypothetical example with the 5% hypothetical examples that appear in the shareholder reports of other funds. As you compare hypothetical examples of other funds, it is important to note that hypothetical examples are meant to highlight the ongoing costs of investing in a fund and do not reflect any transaction costs, such as sales charges, redemption fees or exchange fees.
Estimating your actual expenses
To estimate the expenses that you paid over the period, first you will need your account balance at the end of the period:
g For shareholders who receive their account statements from Columbia Management Services, Inc., your account balance is available online at www.columbiafunds.com or by calling Shareholder Services at 800.345.6611.
g For shareholders who receive their account statements from their financial intermediary, contact your financial intermediary to obtain your account balance.
1. Divide your ending account balance by $1,000. For example, if an account balance was $8,600 at the end of the period, the result would be 8.6.
2. In the section of the table below titled "Expenses paid during the period," locate the amount for your share class. You will find this number in the column labeled "Actual." Multiply this number by the result from step 1. Your answer is an estimate of the expenses you paid on your account during the period.
If the value of your account falls below the minimum initial investment requirement applicable to you, your account generally will be subject to a $20 annual fee. This fee is not included in the accompanying table. If you are subject to the fee, keep it in mind when you are estimating the ongoing expenses of investing in the fund and when comparing the expenses of this fund with other funds.
09/01/09 – 02/28/10
| | | Account value at the
beginning of the period ($) | | Account value at the
end of the period ($) | | Expenses paid
during the period ($) | | Fund's annualized
expense ratio (%) | |
| | | Actual | | Hypothetical | | Actual | | Hypothetical | | Actual | | Hypothetical | | Actual | |
| Class A | | | 1,000.00 | | | | 1,000.00 | | | | 1,139.10 | | | | 1,018.60 | | | | 6.63 | | | | 6.26 | | | | 1.25 | | |
| Class B | | | 1,000.00 | | | | 1,000.00 | | | | 1,134.10 | | | | 1,014.88 | | | | 10.58 | | | | 9.99 | | | | 2.00 | | |
| Class C | | | 1,000.00 | | | | 1,000.00 | | | | 1,134.10 | | | | 1,014.88 | | | | 10.58 | | | | 9.99 | | | | 2.00 | | |
| Class R | | | 1,000.00 | | | | 1,000.00 | | | | 1,137.70 | | | | 1,017.36 | | | | 7.95 | | | | 7.50 | | | | 1.50 | | |
| Class Z | | | 1,000.00 | | | | 1,000.00 | | | | 1,140.40 | | | | 1,019.84 | | | | 5.31 | | | | 5.01 | | | | 1.00 | | |
Expenses paid during the period are equal to the annualized expense ratio for the share class, multiplied by the average account value over the period, then multiplied by the number of days in the fund's most recent fiscal half-year and divided by 365.
Had the investment advisor and/or any of its affiliates not waived fees or reimbursed a portion of expenses, account value at the end of the period would have been reduced.
It is important to note that the expense amounts shown in the table are meant to highlight only ongoing costs of investing in the fund and do not reflect any transaction costs, such as sales charges, redemption fees or exchange fees. Therefore, the hypothetical examples provided may not help you determine the relative total costs of owning shares of different funds. If these transaction costs were included, your costs would have been higher.
5
Portfolio Manager's Report – Columbia Marsico 21st Century Fund
Performance data quoted represents past performance and current performance may be lower or higher. Past performance is no guarantee of future results. The investment return and principal value will fluctuate so that shares, when redeemed, may be worth more or less than the original cost. Please visit www.columbiafunds.com for daily and most recent month-end performance updates.
Net asset value per share
as of 02/28/10 ($)
| Class A | | | 11.63 | | |
| Class B | | | 10.91 | | |
| Class C | | | 10.91 | | |
| Class R | | | 11.57 | | |
| Class Z | | | 11.86 | | |
For the 12-month period that ended February 28, 2010, the fund's Class A shares returned 59.10% without sales charge. The fund outperformed its benchmark, the Russell 3000 Index, which returned 55.96%. The fund's return was also above the average return of its peer group, the Lipper Multi-Cap Growth Funds Classification, which was 54.54%. Sector positioning and stock selection within the financials, energy and consumer staples sectors generally accounted for the strong results.
Sources of positive relative performance
As economic data pointed to the end of recession and the potential for a sustainable recovery, U.S. equities generated strong gains in most sectors. Financial stocks, in particular, rallied after a period of significant weakness, and the fund benefited from its significant exposure to financials. Two of the fund's bank holdings, India-based ICICI Bank and Brazil-headquartered Itau Unibanco, posted strong gains before they were sold from the portfolio.
An underweight position in energy and consumer staples stocks, which trailed the benchmark return, aided relative performance, and favorable stock selection within both sectors further benefited results. Pride International, an offshore drilling contractor, and Petroleo Brasileiro, an oil and natural gas producer, appreciated strongly during the period and were sold. Within consumer staples, Anheuser-Busch InBev (2.7% of net assets) posted solid results. Elsewhere in the portfolio, Apple and Crown Castle International (3.2% and 6.2% of net assets, respectively), were strong performers. Crown Castle, which leases and operates wireless telecommunications towers, was the fund's largest holding at the end of the period.
Disappointments from stock selection, cash position
Individual security selection in materials, information technology, industrials and health care detracted from relative returns. Agricultural materials manufacturer Monsanto was a disappointing performer and was sold from the portfolio. In technology, financial transactions processors MasterCard (3.7% of net assets) and Visa posted poor results. The fund maintained its position in MasterCard, but Visa was sold. Genzyme, which has been plagued by manufacturing difficulties in key products, was also sold from the fund based on its poor performance. While the fund's industrials positions generally posted strong returns, they lagged the sector's performance within the benchmark, primarily due to an investment in Energy Conversion Devices, a solar electric products manufacturer. The stock had negative returns prior to being sold from the portfolio.
6
Portfolio Manager's Report (continued) – Columbia Marsico 21st Century Fund
The fund maintained a modest cash position during the period, which detracted from returns relative to the benchmark as the market posted strong overall gains. The benchmark is fully invested in stocks.
Summary
During the period, we increased the fund's allocation to the financials and consumer discretionary sectors, and at the end of the period, these two were among the fund's most significant sector allocations, along with information technology. We also decreased the fund's weight in the industrials, information technology, consumer staples and materials sectors. At the end of the period, the fund had no exposure to materials or utilities. We also reduced the fund's cash position over the 12-month period.
Source for all statistical data—Columbia Management Advisors, LLC.
Source of all stock-specific commentary—Marsico Capital Management, LLC.
Portfolio characteristics and holdings are subject to change periodically and may not be representative of current characteristics and holdings. The outlook for this fund may differ from those presented for other Columbia Funds.
Equity securities are subject to stock market fluctuations that occur in response to economic and business developments.
Columbia Marsico 21st Century Fund normally invests in a core portfolio of 35-50 stocks. By maintaining a relatively concentrated portfolio, the fund may be subject to greater risk than a fund that is more fully diversified.
International investing involves special risks, including foreign taxation, currency fluctuations, risks associated with possible differences in financial standards and other risks associated with future political and economic developments.
Top 5 sectors
as of 02/28/10 (%)
| Financials | | | 30.8 | | |
| Consumer Discretionary | | | 20.5 | | |
| Information Technology | | | 13.7 | | |
| Health Care | | | 9.8 | | |
| Industrials | | | 6.9 | | |
Top 10 holdings
as of 02/28/10 (%)
| Crown Castle International | | | 6.2 | | |
| Wells Fargo | | | 5.6 | | |
| JPMorgan | | | 4.9 | | |
| Intuitive Surgical | | | 4.2 | | |
| US Bancorp | | | 4.0 | | |
| CSX | | | 3.8 | | |
| Walt Disney | | | 3.8 | | |
| MasterCard | | | 3.7 | | |
| PNC Financial Services Group | | | 3.7 | | |
| Polo Ralph Lauren | | | 3.6 | | |
The fund is actively managed and the composition of its portfolio will change over time. Information provided is calculated as a percentage of net assets.
7
Investment Portfolio – Columbia Marsico 21st Century Fund
February 28, 2010
| Common Stocks – 95.3% | |
| | | Shares | | Value ($) | |
| Consumer Discretionary – 20.5% | |
| Automobiles – 1.3% | |
| Ford Motor Co. (a) | | | 4,307,394 | | | | 50,568,806 | | |
| Automobiles Total | | | 50,568,806 | | |
| Hotels, Restaurants & Leisure – 3.5% | |
Chipotle Mexican Grill, Inc.,
Class A (a) | | | 174,032 | | | | 18,222,891 | | |
| Vail Resorts, Inc. (a)(b) | | | 2,328,202 | | | | 83,838,554 | | |
| Wynn Resorts Ltd. (a) | | | 516,988 | | | | 32,864,927 | | |
| Hotels, Restaurants & Leisure Total | | | 134,926,372 | | |
| Household Durables – 1.8% | |
| Cyrela Brazil Realty SA | | | 2,449,567 | | | | 30,566,215 | | |
| Gafisa SA, ADR | | | 535,934 | | | | 16,458,533 | | |
PDG Realty SA
Empreendimentos e
Participacoes | | | 2,540,103 | | | | 22,728,310 | | |
| Household Durables Total | | | 69,753,058 | | |
| Internet & Catalog Retail – 1.8% | |
| Amazon.com, Inc. (a) | | | 411,278 | | | | 48,695,315 | | |
| Priceline.com, Inc. (a) | | | 81,538 | | | | 18,489,557 | | |
| Internet & Catalog Retail Total | | | 67,184,872 | | |
| Media – 6.8% | |
| CBS Corp., Class B | | | 8,672,602 | | | | 112,657,100 | | |
| Walt Disney Co. | | | 4,662,244 | | | | 145,648,502 | | |
| Media Total | | | 258,305,602 | | |
| Specialty Retail – 1.7% | |
| J Crew Group, Inc. (a) | | | 1,223,852 | | | | 51,499,692 | | |
| Rue21, Inc. (a) | | | 486,540 | | | | 13,983,160 | | |
| Specialty Retail Total | | | 65,482,852 | | |
| Textiles, Apparel & Luxury Goods – 3.6% | |
| Polo Ralph Lauren Corp. | | | 1,710,018 | | | | 136,681,739 | | |
| Textiles, Apparel & Luxury Goods Total | | | 136,681,739 | | |
| Consumer Discretionary Total | | | 782,903,301 | | |
| Consumer Staples – 2.7% | |
| Beverages – 2.7% | |
| Anheuser-Busch InBev NV | | | 2,095,303 | | | | 104,878,845 | | |
| Beverages Total | | | 104,878,845 | | |
| Consumer Staples Total | | | 104,878,845 | | |
| | | Shares | | Value ($) | |
| Energy – 5.3% | |
| Energy Equipment & Services – 2.4% | |
| National-Oilwell Varco, Inc. | | | 2,129,347 | | | | 92,562,714 | | |
| Energy Equipment & Services Total | | | 92,562,714 | | |
| Oil, Gas & Consumable Fuels – 2.9% | |
| Range Resources Corp. | | | 2,151,422 | | | | 108,883,468 | | |
| Oil, Gas & Consumable Fuels Total | | | 108,883,468 | | |
| Energy Total | | | 201,446,182 | | |
| Financials – 30.2% | |
| Capital Markets – 4.7% | |
| Jefferies Group, Inc. | | | 4,125,156 | | | | 102,963,894 | | |
| State Street Corp. | | | 1,696,008 | | | | 76,167,719 | | |
| Capital Markets Total | | | 179,131,613 | | |
| Commercial Banks – 17.9% | |
| City National Corp. | | | 1,751,060 | | | | 87,412,915 | | |
| CVB Financial Corp. | | | 3,273,210 | | | | 30,440,853 | | |
First Horizon
National Corp. (a) | | | 3,016,666 | | | | 38,613,325 | | |
| First Midwest Bancorp, Inc. | | | 1,268,150 | | | | 17,234,159 | | |
PNC Financial Services
Group, Inc. | | | 2,604,159 | | | | 139,999,588 | | |
| U.S. Bancorp | | | 6,272,307 | | | | 154,361,475 | | |
| Wells Fargo & Co. | | | 7,874,560 | | | | 215,290,470 | | |
| Commercial Banks Total | | | 683,352,785 | | |
| Diversified Financial Services – 4.9% | |
| JPMorgan Chase & Co. | | | 4,489,593 | | | | 188,428,218 | | |
| Diversified Financial Services Total | | | 188,428,218 | | |
| Real Estate Investment Trusts (REITs) – 0.9% | |
| Colony Financial, Inc. | | | 721,673 | | | | 14,390,160 | | |
| Taubman Centers, Inc. | | | 517,577 | | | | 20,045,757 | | |
Real Estate Investment
Trusts (REITs) Total | | | 34,435,917 | | |
| Thrifts & Mortgage Finance – 1.8% | |
First Niagara Financial
Group, Inc. | | | 4,911,049 | | | | 68,951,128 | | |
| Thrifts & Mortgage Finance Total | | | 68,951,128 | | |
| Financials Total | | | 1,154,299,661 | | |
| Health Care – 9.8% | |
| Biotechnology – 5.3% | |
| Celgene Corp. (a) | | | 1,635,436 | | | | 97,341,151 | | |
| Gilead Sciences, Inc. (a) | | | 2,221,717 | | | | 105,775,946 | | |
| Biotechnology Total | | | 203,117,097 | | |
See Accompanying Notes to Financial Statements.
8
Columbia Marsico 21st Century Fund
February 28, 2010
| Common Stocks (continued) | |
| | | Shares | | Value ($) | |
| Health Care Equipment & Supplies – 4.2% | |
| Intuitive Surgical, Inc. (a) | | | 463,343 | | | | 160,844,889 | | |
Health Care Equipment &
Supplies Total | | | 160,844,889 | | |
| Health Care Providers & Services – 0.3% | |
Emergency Medical
Services Corp., Class A (a) | | | 223,389 | | | | 11,629,631 | | |
Health Care Providers &
Services Total | | | 11,629,631 | | |
| Health Care Total | | | 375,591,617 | | |
| Industrials – 6.9% | |
| Aerospace & Defense – 2.0% | |
| Precision Castparts Corp. | | | 683,558 | | | | 77,071,165 | | |
| Aerospace & Defense Total | | | 77,071,165 | | |
| Commercial Services & Supplies – 0.5% | |
| Ritchie Bros Auctioneers, Inc. | | | 826,530 | | | | 17,332,334 | | |
Commercial Services &
Supplies Total | | | 17,332,334 | | |
| Construction & Engineering – 0.5% | |
| AECOM Technology Corp. (a) | | | 762,641 | | | | 20,667,571 | | |
| Construction & Engineering Total | | | 20,667,571 | | |
| Road & Rail – 3.9% | |
| CSX Corp. | | | 3,095,029 | | | | 146,890,076 | | |
| Road & Rail Total | | | 146,890,076 | | |
| Industrials Total | | | 261,961,146 | | |
| Information Technology – 13.7% | |
| Computers & Peripherals – 3.2% | |
| Apple, Inc. (a) | | | 595,917 | | | | 121,936,536 | | |
| Computers & Peripherals Total | | | 121,936,536 | | |
| Internet Software & Services – 1.5% | |
| Google, Inc., Class A (a) | | | 89,544 | | | | 47,171,779 | | |
| OpenTable, Inc. (a) | | | 299,652 | | | | 10,212,140 | | |
| Internet Software & Services Total | | | 57,383,919 | | |
| IT Services – 3.7% | |
| MasterCard, Inc., Class A | | | 634,005 | | | | 142,251,702 | | |
| IT Services Total | | | 142,251,702 | | |
| Semiconductors & Semiconductor Equipment – 1.8% | |
| Cree, Inc. (a) | | | 993,019 | | | | 67,356,479 | | |
Semiconductors & Semiconductor
Equipment Total | | | 67,356,479 | | |
| | | Shares | | Value ($) | |
| Software – 3.5% | |
| Adobe Systems, Inc. (a) | | | 1,009,356 | | | | 34,974,185 | | |
| ANSYS, Inc. (a) | | | 926,387 | | | | 40,631,334 | | |
| Citrix Systems, Inc. (a) | | | 1,352,357 | | | | 58,164,875 | | |
| Software Total | | | 133,770,394 | | |
| Information Technology Total | | | 522,699,030 | | |
| Telecommunication Services – 6.2% | |
| Wireless Telecommunication Services – 6.2% | |
Crown Castle
International Corp. (a) | | | 6,246,045 | | | | 236,100,501 | | |
Wireless Telecommunication
Services Total | | | 236,100,501 | | |
| Telecommunication Services Total | | | 236,100,501 | | |
Total Common Stocks
(cost of $2,866,133,875) | | | 3,639,880,283 | | |
| | | Par ($) | | | |
| Convertible Bond – 0.7% | |
| Consumer Cyclical – 0.7% | |
| Auto Manufacturers – 0.7% | |
Ford Motor Co.
4.250% 11/15/16 | | | 19,525,000 | | | | 27,725,500 | | |
| Auto Manufacturers Total | | | 27,725,500 | | |
| Consumer Cyclical Total | | | 27,725,500 | | |
Total Convertible Bond
(cost of $19,525,000) | | | 27,725,500 | | |
| | | Units | | | |
| Warrants – 0.6% | |
| Financials – 0.6% | |
| Diversified Financial Services – 0.6% | |
JPMorgan Chase & Co.,
Expires 10/28/18 (a) | | | 1,562,546 | | | | 21,063,120 | | |
| Diversified Financial Services Total | | | 21,063,120 | | |
| Financials Total | | | 21,063,120 | | |
Total Warrants
(cost of $19,575,774) | | | 21,063,120 | | |
See Accompanying Notes to Financial Statements.
9
Columbia Marsico 21st Century Fund
February 28, 2010
| Short-Term Obligation – 2.8% | |
| | | Par ($) | | Value ($) | |
Repurchase agreement with
Fixed Income Clearing Corp.,
dated 02/26/10, due 03/01/10
at 0.050%, collateralized by
a U.S. Government Agency
obligation maturing 01/15/14,
market value $111,114,063
(repurchase proceeds
$108,931,454) | | | 108,931,000 | | | | 108,931,000 | | |
Total Short-Term Obligation
(cost of $108,931,000) | | | 108,931,000 | | |
Total Investments – 99.4%
(cost of $3,014,165,649) (c) | | | 3,797,599,903 | | |
| Other Assets & Liabilities, Net – 0.6% | | | 23,727,707 | | |
| Net Assets – 100.0% | | | 3,821,327,610 | | |
Notes to Investment Portfolio:
(a) Non-income producing security.
(b) An affiliate may include any company in which the Fund owns five percent or more of its outstanding voting shares. Transactions in these affiliated companies during the year ended February 28, 2010, are as follows:
| Affiliate | | Value,
beginning of
period | | Purchases | | Sales
Proceeds | | Dividend
Income | | Value, end of
period | |
Vail
Resorts, Inc. | | $ | 58,359,968 | | | $ | 8,426,663 | | | $ | 32,450,610 | | | $ | – | | | $ | 83,838,554 | | |
| Saks, Inc. | | | 25,374,310 | | | | – | | | | 16,075,555 | | | | – | | | | – | | |
| Total | | $ | 83,734,278 | | | $ | 8,426,663 | | | $ | 48,526,165 | | | $ | – | | | $ | 83,838,554 | | |
(c) Cost for federal income tax purposes is $3,202,974,041.
The following table summarizes the inputs used, as of February 28, 2010, in valuing the Fund's assets:
| Description | | Quoted
Prices
(Level 1) | | Other
Significant
Observable
Inputs
(Level 2) | | Significant
Unobservable
Inputs
(Level 3) | | Total | |
| Common Stocks | |
Consumer
Discretionary | | $ | 782,903,301 | | | $ | — | | | $ | — | | | $ | 782,903,301 | | |
| Consumer Staples | | | — | | | | 104,878,845 | | | | — | | | | 104,878,845 | | |
| Energy | | | 201,446,182 | | | | — | | | | — | | | | 201,446,182 | | |
| Financials | | | 1,154,299,661 | | | | — | | | | — | | | | 1,154,299,661 | | |
| Health Care | | | 375,591,617 | | | | — | | | | — | | | | 375,591,617 | | |
| Industrials | | | 261,961,146 | | | | — | | | | — | | | | 261,961,146 | | |
Information
Technology | | | 522,699,030 | | | | — | | | | — | | | | 522,699,030 | | |
Telecommunication
Services | | | 236,100,501 | | | | — | | | | — | | | | 236,100,501 | | |
| Total Common Stocks | | | 3,535,001,438 | | | | 104,878,845 | | | | — | | | | 3,639,880,283 | | |
| Total Convertible Bond | | | — | | | | 27,725,500 | | | | — | | | | 27,725,500 | | |
| Total Warrants | | | 21,063,120 | | | | — | | | | — | | | | 21,063,120 | | |
Total Short-Term
Obligation | | | — | | | | 108,931,000 | | | | — | | | | 108,931,000 | | |
| Total Investments | | $ | 3,556,064,558 | | | $ | 241,535,345 | | | $ | — | | | $ | 3,797,599,903 | | |
The Fund's assets assigned to the Level 2 input category include certain foreign securities for which a third party statistical pricing service may be employed for purposes of fair market valuation.
For more information on valuation inputs, and their aggregation into the levels used in the table above, please refer to the Security Valuation section in the accompanying Notes to Financial Statements.
At February 28, 2010, the Fund held investments in the following sectors:
| Sector (Unaudited) | | % of
Net Assets | |
| Financials | | | 30.8 | | |
| Consumer Discretionary | | | 20.5 | | |
| Information Technology | | | 13.7 | | |
| Health Care | | | 9.8 | | |
| Industrials | | | 6.9 | | |
| Telecommunication Services | | | 6.2 | | |
| Energy | | | 5.3 | | |
| Consumer Staples | | | 2.7 | | |
| Consumer Cyclical | | | 0.7 | | |
| | | | 96.6 | | |
| Short-Term Obligation | | | 2.8 | | |
| Other Assets & Liabilities, Net | | | 0.6 | | |
| | | | 100.0 | | |
| Acronym | | Name | |
| ADR | | American Depositary Receipt | |
|
See Accompanying Notes to Financial Statements.
10
Statement of Assets and Liabilities – Columbia Marsico 21st Century Fund
February 28, 2010
| Assets | | Unaffiliated investments, at identified cost | | $ | 2,901,739,214 | | |
| | | Affiliated investments, at identified cost | | | 112,426,435 | | |
| | | Total investments, at identified cost | | $ | 3,014,165,649 | | |
| | | Unaffiliated investments, at value | | | 3,713,761,349 | | |
| | | Affiliated investments, at value | | | 83,838,554 | | |
| | | Total investments, at value | | | 3,797,599,903 | | |
| | | Cash | | | 338 | | |
| | | Receivable for: | | | | | |
| | | Investments sold | | | 53,093,221 | | |
| | | Fund shares sold | | | 2,829,445 | | |
| | | Dividends | | | 1,762,684 | | |
| | | Interest | | | 258,618 | | |
| | | Foreign tax reclaims | | | 538,794 | | |
| | | Prepaid expenses | | | 45,855 | | |
| | | Total Assets | | | 3,856,128,858 | | |
| Liabilities | | Payable for: | | | | | |
| | | Investments purchased | | | 17,180,185 | | |
| | | Fund shares repurchased | | | 11,550,281 | | |
| | | Investment advisory fee | | | 1,851,852 | | |
| | | Administration fee | | | 629,655 | | |
| | | Pricing and bookkeeping fees | | | 13,363 | | |
| | | Transfer agent fee | | | 1,711,941 | | |
| | | Trustees' fees | | | 43,727 | | |
| | | Custody fee | | | 82,064 | | |
| | | Distribution and service fees | | | 992,283 | | |
| | | Chief compliance officer expenses | | | 399 | | |
| | | Reports to shareholders | | | 698,983 | | |
| | | Other liabilities | | | 46,515 | | |
| | | Total Liabilities | | | 34,801,248 | | |
| | | Net Assets | | | 3,821,327,610 | | |
| Net Assets Consist of | | Paid-in capital | | | 5,970,119,980 | | |
| | | Overdistributed net investment income | | | (6,938 | ) | |
| | | Accumulated net realized loss | | | (2,932,263,945 | ) | |
| | | Net unrealized appreciation on: | | | | | |
| | | Investments | | | 783,434,254 | | |
| | | Foreign currency translations | | | 44,259 | | |
| | | Net Assets | | | 3,821,327,610 | | |
See Accompanying Notes to Financial Statements.
11
Statement of Assets and Liabilities – Columbia Marsico 21st Century Fund
February 28, 2010 (continued)
| Class A | | Net assets | | $ | 1,993,000,066 | | |
| | | Shares outstanding | | | 171,386,453 | | |
| | | Net asset value per share | | $ | 11.63 | (a) | |
| | | Maximum sales charge | | | 5.75 | % | |
| | | Maximum offering price per share | | $ | 12.34 | (b) | |
| Class B | | Net assets | | $ | 117,306,762 | | |
| | | Shares outstanding | | | 10,750,513 | | |
| | | Net asset value and offering price per share | | $ | 10.91 | (a) | |
| Class C | | Net assets | | $ | 660,456,550 | | |
| | | Shares outstanding | | | 60,536,536 | | |
| | | Net asset value and offering price per share | | $ | 10.91 | (a) | |
| Class R | | Net assets | | $ | 41,627,355 | | |
| | | Shares outstanding | | | 3,598,578 | | |
| | | Net asset value, offering and redemption price per share | | $ | 11.57 | | |
| Class Z | | Net assets | | $ | 1,008,936,877 | | |
| | | Shares outstanding | | | 85,088,865 | | |
| | | Net asset value, offering and redemption price per share | | $ | 11.86 | | |
(a) Redemption price per share is equal to net asset value less any applicable contingent deferred sales charge.
(b) On sales of $50,000 or more the offering price is reduced.
See Accompanying Notes to Financial Statements.
12
Statement of Operations – Columbia Marsico 21st Century Fund
For the Year Ended February 28, 2010
| | | | | ($) | |
| Investment Income | | Dividends | | | 38,844,055 | | |
| | | Interest | | | 416,204 | | |
| | | Foreign taxes withheld | | | (1,428,457 | ) | |
| | | Total Investment Income | | | 37,831,802 | | |
| Expenses | | Investment advisory fee | | | 25,152,257 | | |
| | | Administration fee | | | 8,603,983 | | |
| | | Distribution fee: | | | | | |
| | | Class B | | | 865,694 | | |
| | | Class C | | | 5,219,447 | | |
| | | Class R | | | 229,926 | | |
| | | Service fee: | | | | | |
| | | Class B | | | 288,564 | | |
| | | Class C | | | 1,739,815 | | |
| | | Distribution and service fees: | | | | | |
| | | Class A | | | 5,312,864 | | |
| | | Transfer agent fee | | | 6,606,939 | | |
| | | Pricing and bookkeeping fees | | | 147,990 | | |
| | | Trustees' fees | | | 41,308 | | |
| | | Custody fee | | | 339,304 | | |
| | | Chief compliance officer expenses | | | 2,041 | | |
| | | Other expenses | | | 1,274,686 | | |
| | | Total Expenses | | | 55,824,818 | | |
| | | Fees waived by transfer agent | | | (420,985 | ) | |
| | | Expense reductions | | | (20 | ) | |
| | | Net Expenses | | | 55,403,813 | | |
| | | Net Investment Loss | | | (17,572,011 | ) | |
| Net Realized and Unrealized Gain (Loss) on Investments and Foreign Currency | | Net realized gain (loss) on: | | | | | |
| | | Unaffiliated investments | | | 128,982,301 | | |
| | | Affiliated investments | | | (158,052,065 | ) | |
| | | Foreign currency transactions | | | (805,689 | ) | |
| | | Net realized loss | | | (29,875,453 | ) | |
| | | Net change in unrealized appreciation (depreciation) on: | | | | | |
| | | Investments | | | 1,852,008,906 | | |
| | | Foreign currency translations | | | 54,769 | | |
| | | Net change in unrealized appreciation (depreciation) | | | 1,852,063,675 | | |
| | | Net Gain | | | 1,822,188,222 | | |
| | | Net Increase Resulting from Operations | | | 1,804,616,211 | | |
See Accompanying Notes to Financial Statements.
13
Statement of Changes in Net Assets – Columbia Marsico 21st Century Fund
| Increase (Decrease) in Net Assets | | | | Year Ended
February 28,
2010 ($) | | Year Ended
February 28,
2009 ($) | |
| Operations | | Net investment income (loss) | | | (17,572,011 | ) | | | 1,161,973 | | |
| | | Net realized loss on investments
and foreign currency transactions | | | (29,875,453 | ) | | | (2,838,594,363 | ) | |
| | | Net change in unrealized appreciation (depreciation)
on investments and foreign currency translations | | | 1,852,063,675 | | | | (1,264,907,676 | ) | |
| | | Net increase (decrease) resulting from operations | | | 1,804,616,211 | | | | (4,102,340,066 | ) | |
| Distributions to Shareholders | | From net investment income: | | | | | | | | | |
| | | Class Z | | | (51,807 | ) | | | — | | |
| | | Total distributions to shareholders | | | (51,807 | ) | | | — | | |
| | | Net Capital Stock Transactions | | | (1,581,913,765 | ) | | | (671,895,304 | ) | |
| | | Redemption fees | | | — | | | | 4,836 | | |
| | | Total increase (decrease) in net assets | | | 222,650,639 | | | | (4,774,230,534 | ) | |
| Net Assets | | Beginning of period | | | 3,598,676,971 | | | | 8,372,907,505 | | |
| | | End of period | | | 3,821,327,610 | | | | 3,598,676,971 | | |
| | | Undistributed (overdistributed) net investment income
at end of period | | | (6,938 | ) | | | 69,338 | | |
See Accompanying Notes to Financial Statements.
14
Statement of Changes in Net Assets (continued) – Columbia Marsico 21st Century Fund
| | | Capital Stock Activity | |
| | | Year Ended
February 28, 2010 | | Year Ended
February 28, 2009 | |
| | | Shares | | Dollars ($) | | Shares | | Dollars ($) | |
| Class A | |
| Subscriptions | | | 28,125,647 | | | | 271,443,196 | | | | 105,611,474 | | | | 1,310,056,381 | | |
| Redemptions | | | (125,712,406 | ) | | | (1,218,405,442 | ) | | | (184,568,865 | ) | | | (1,956,959,802 | ) | |
| Net decrease | | | (97,586,759 | ) | | | (946,962,246 | ) | | | (78,957,391 | ) | | | (646,903,421 | ) | |
| Class B | |
| Subscriptions | | | 389,920 | | | | 3,272,819 | | | | 2,612,075 | | | | 31,983,995 | | |
| Redemptions | | | (3,505,840 | ) | | | (32,363,151 | ) | | | (5,376,566 | ) | | | (61,678,675 | ) | |
| Net decrease | | | (3,115,920 | ) | | | (29,090,332 | ) | | | (2,764,491 | ) | | | (29,694,680 | ) | |
| Class C | |
| Subscriptions | | | 4,696,952 | | | | 42,097,591 | | | | 21,938,434 | | | | 266,205,652 | | |
| Redemptions | | | (34,135,126 | ) | | | (316,088,945 | ) | | | (34,296,625 | ) | | | (353,567,760 | ) | |
| Net decrease | | | (29,438,174 | ) | | | (273,991,354 | ) | | | (12,358,191 | ) | | | (87,362,108 | ) | |
| Class R | |
| Subscriptions | | | 1,653,756 | | | | 15,191,943 | | | | 4,058,699 | | | | 47,957,625 | | |
| Redemptions | | | (3,871,749 | ) | | | (36,817,796 | ) | | | (1,526,441 | ) | | | (17,254,066 | ) | |
| Net increase (decrease) | | | (2,217,993 | ) | | | (21,625,853 | ) | | | 2,532,258 | | | | 30,703,559 | | |
| Class Z | |
| Subscriptions | | | 27,604,452 | | | | 276,459,305 | | | | 68,444,092 | | | | 766,777,581 | | |
| Distributions reinvested | | | 3,866 | | | | 35,489 | | | | — | | | | — | | |
| Redemptions | | | (59,572,261 | ) | | | (586,738,774 | ) | | | (60,742,453 | ) | | | (705,416,235 | ) | |
| Net increase (decrease) | | | (31,963,943 | ) | | | (310,243,980 | ) | | | 7,701,639 | | | | 61,361,346 | | |
See Accompanying Notes to Financial Statements.
15
Financial Highlights – Columbia Marsico 21st Century Fund
Selected data for a fund share outstanding throughout each period is as follows:
| | | Year Ended February 28, | | Year Ended
February 29, | | Period Ended
February 28, | | Year Ended March 31, | |
| Class A Shares | | 2010 | | 2009 | | 2008 | | 2007 (a) | | 2006 (b) | | 2005 | |
| Net Asset Value, Beginning of Period | | $ | 7.31 | | | $ | 14.55 | | | $ | 14.28 | | | $ | 13.58 | | | $ | 10.61 | | | $ | 9.70 | | |
| Income from Investment Operations: | |
| Net investment income (loss) (c) | | | (0.03 | ) | | | 0.01 | | | | 0.02 | | | | 0.11 | (d) | | | (0.03 | ) | | | (0.05 | ) | |
Net realized and unrealized gain (loss)
on investments and foreign currency | | | 4.35 | | | | (7.25 | ) | | | 0.77 | (e) | | | 0.89 | | | | 3.00 | | | | 0.96 | | |
| Total from investment operations | | | 4.32 | | | | (7.24 | ) | | | 0.79 | | | | 1.00 | | | | 2.97 | | | | 0.91 | | |
| Less Distributions to Shareholders: | |
| From net investment income | | | — | | | | — | | | | — | | | | (0.10 | ) | | | — | (f) | | | — | | |
| From net realized gains | | | — | | | | — | | | | (0.49 | ) | | | (0.20 | ) | | | — | | | | — | | |
| From return of capital | | | — | | | | — | | | | (0.03 | ) | | | — | | | | — | | | | — | | |
| Total distributions to shareholders | | | — | | | | — | | | | (0.52 | ) | | | (0.30 | ) | | | — | (f) | | | — | | |
| Redemption Fees: | |
Redemption fees added to
paid-in-capital | | | — | | | | — | (c)(f) | | | — | | | | — | | | | — | | | | — | | |
| Net Asset Value, End of Period | | $ | 11.63 | | | $ | 7.31 | | | $ | 14.55 | | | $ | 14.28 | | | $ | 13.58 | | | $ | 10.61 | | |
| Total return (g) | | | 59.10 | %(h) | | | (49.76 | )%(h) | | | 5.16 | %(h) | | | 7.59 | %(h)(i) | | | 28.04 | %(h) | | | 9.38 | % | |
Ratios to Average Net Assets/
Supplemental Data: | |
| Net expenses before interest expense (j) | | | 1.30 | % | | | 1.25 | % | | | 1.20 | % | | | 1.26 | %(k) | | | 1.31 | % | | | 1.40 | % | |
| Interest expense | | | — | | | | — | | | | — | | | | — | | | | — | | | | — | %(l) | |
| Net expenses (j) | | | 1.30 | % | | | 1.25 | % | | | 1.20 | % | | | 1.26 | %(k) | | | 1.31 | % | | | 1.40 | % | |
| Waiver/Reimbursement | | | 0.01 | % | | | 0.04 | % | | | 0.02 | % | | | 0.02 | %(k) | | | 0.01 | % | | | — | | |
| Net investment income (loss) (j) | | | (0.35 | )% | | | 0.12 | % | | | 0.15 | % | | | 0.84 | %(k) | | | (0.22 | )% | | | (0.50 | )% | |
| Portfolio turnover rate | | | 119 | % | | | 152 | % | | | 113 | % | | | 86 | %(i) | | | 141 | % | | | 130 | % | |
| Net assets, end of period (000s) | | $ | 1,993,000 | | | $ | 1,967,386 | | | $ | 5,062,299 | | | $ | 2,474,268 | | | $ | 675,287 | | | $ | 187,094 | | |
(a) The Fund changed its fiscal year end from March 31 to February 28. Per share data and total return reflect activity from April 1, 2006 through February 28, 2007.
(b) On August 22, 2005, the Fund's Investor A shares were renamed Class A shares.
(c) Per share data was calculated using the average shares outstanding during the period.
(d) Net investment income per share reflects special dividends. The effect of these dividends amounted to $0.08 per share.
(e) The amount shown for a share outstanding does not correspond with the aggregate net loss on investments for the period due to timing of repurchases of Fund shares in relation to fluctuating market values of the investments of the Fund.
(f) Rounds to less than $0.01 per share.
(g) Total return at net asset value assuming all distributions reinvested and no initial sales charge or contingent deferred sales charge.
(h) Had the investment advisor and/or any of its affiliates not waived fees or reimbursed a portion of expenses, total return would have been reduced.
(i) Not annualized.
(j) The benefits derived from expense reductions had an impact of less than 0.01%, except for the period ended February 28, 2007 and the year ended March 31, 2006, which had an impact of 0.07% and 0.08%, respectively.
(k) Annualized.
(l) Rounds to less than 0.01%.
See Accompanying Notes to Financial Statements.
16
Financial Highlights – Columbia Marsico 21st Century Fund
Selected data for a fund share outstanding throughout each period is as follows:
| | | Year Ended February 28, | | Year Ended
February 29, | | Period Ended
February 28, | | Year Ended March 31, | |
| Class B Shares | | 2010 | | 2009 | | 2008 | | 2007 (a) | | 2006 (b) | | 2005 | |
| Net Asset Value, Beginning of Period | | $ | 6.92 | | | $ | 13.86 | | | $ | 13.73 | | | $ | 12.99 | | | $ | 10.22 | | | $ | 9.42 | | |
| Income from Investment Operations: | |
| Net investment loss (c) | | | (0.10 | ) | | | (0.07 | ) | | | (0.08 | ) | | | — | (d)(e) | | | (0.11 | ) | | | (0.12 | ) | |
Net realized and unrealized gain (loss)
on investments and foreign currency | | | 4.09 | | | | (6.87 | ) | | | 0.73 | (f) | | | 0.88 | | | | 2.88 | | | | 0.92 | | |
| Total from investment operations | | | 3.99 | | | | (6.94 | ) | | | 0.65 | | | | 0.88 | | | | 2.77 | | | | 0.80 | | |
| Less Distributions to Shareholders: | |
| From net investment income | | | — | | | | — | | | | — | | | | (0.02 | ) | | | — | | | | — | | |
| From net realized gains | | | — | | | | — | | | | (0.49 | ) | | | (0.12 | ) | | | — | | | | — | | |
| From return of capital | | | — | | | | — | | | | (0.03 | ) | | | — | | | | — | | | | — | | |
| Total distributions to shareholders | | | — | | | | — | | | | (0.52 | ) | | | (0.14 | ) | | | — | | | | — | | |
| Redemption Fees: | |
Redemption fees added to
paid-in-capital | | | — | | | | — | (c)(e) | | | — | | | | — | | | | — | | | | — | | |
| Net Asset Value, End of Period | | $ | 10.91 | | | $ | 6.92 | | | $ | 13.86 | | | $ | 13.73 | | | $ | 12.99 | | | $ | 10.22 | | |
| Total return (g) | | | 57.66 | %(h) | | | (50.07 | )%(h) | | | 4.34 | %(h) | | | 6.88 | %(h)(i) | | | 27.10 | %(h) | | | 8.49 | % | |
Ratios to Average Net Assets/
Supplemental Data: | |
| Net expenses before interest expense (j) | | | 2.05 | % | | | 2.00 | % | | | 1.95 | % | | | 2.01 | %(k) | | | 2.06 | % | | | 2.15 | % | |
| Interest expense | | | — | | | | — | | | | — | | | | — | | | | — | | | | — | %(l) | |
| Net expenses (j) | | | 2.05 | % | | | 2.00 | % | | | 1.95 | % | | | 2.01 | %(k) | | | 2.06 | % | | | 2.15 | % | |
| Waiver/Reimbursement | | | 0.01 | % | | | 0.04 | % | | | 0.02 | % | | | 0.02 | %(k) | | | 0.01 | % | | | — | | |
| Net investment loss (j) | | | (1.10 | )% | | | (0.63 | )% | | | (0.56 | )% | | | (0.02 | )%(k) | | | (0.96 | )% | | | (1.25 | )% | |
| Portfolio turnover rate | | | 119 | % | | | 152 | % | | | 113 | % | | | 86 | %(i) | | | 141 | % | | | 130 | % | |
| Net assets, end of period (000s) | | $ | 117,307 | | | $ | 95,889 | | | $ | 230,505 | | | $ | 167,144 | | | $ | 97,006 | | | $ | 60,495 | | |
(a) The Fund changed its fiscal year end from March 31 to February 28. Per share data and total return reflect activity from April 1, 2006 through February 28, 2007.
(b) On August 22, 2005, the Fund's Investor B shares were renamed Class B shares.
(c) Per share data was calculated using the average shares outstanding during the period.
(d) Net investment income per share reflects special dividends. The effect of these dividends amounted to $0.08 per share.
(e) Rounds to less than $0.01 per share.
(f) The amount shown for a share outstanding does not correspond with the aggregate net loss on investments for the period due to timing of repurchases of Fund shares in relation to fluctuating market values of the investments of the Fund.
(g) Total return at net asset value assuming all distributions reinvested and no contingent deferred sales charge.
(h) Had the investment advisor and/or any of its affiliates not waived fees or reimbursed a portion of expenses, total return would have been reduced.
(i) Not annualized.
(j) The benefits derived from expense reductions had an impact of less than 0.01%, except for the period ended February 28, 2007 and the year ended March 31, 2006, which had an impact of 0.07% and 0.08%, respectively.
(k) Annualized.
(l) Rounds to less than 0.01%.
See Accompanying Notes to Financial Statements.
17
Financial Highlights – Columbia Marsico 21st Century Fund
Selected data for a fund share outstanding throughout each period is as follows:
| | | Year Ended February 28, | | Year Ended
February 29, | | Period Ended
February 28, | | Year Ended March 31, | |
| Class C Shares | | 2010 | | 2009 | | 2008 | | 2007 (a) | | 2006 (b) | | 2005 | |
| Net Asset Value, Beginning of Period | | $ | 6.91 | | | $ | 13.86 | | | $ | 13.73 | | | $ | 12.99 | | | $ | 10.22 | | | $ | 9.42 | | |
| Income from Investment Operations: | |
| Net investment income (loss) (c) | | | (0.10 | ) | | | (0.07 | ) | | | (0.09 | ) | | | 0.01 | (d) | | | (0.11 | ) | | | (0.12 | ) | |
Net realized and unrealized gain (loss)
on investments and foreign currency | | | 4.10 | | | | (6.88 | ) | | | 0.74 | (e) | | | 0.87 | | | | 2.88 | | | | 0.92 | | |
| Total from investment operations | | | 4.00 | | | | (6.95 | ) | | | 0.65 | | | | 0.88 | | | | 2.77 | | | | 0.80 | | |
| Less Distributions to Shareholders: | |
| From net investment income | | | — | | | | — | | | | — | | | | (0.02 | ) | | | — | | | | — | | |
| From net realized gains | | | — | | | | — | | | | (0.49 | ) | | | (0.12 | ) | | | — | | | | — | | |
| From return of capital | | | — | | | | — | | | | (0.03 | ) | | | — | | | | — | | | | — | | |
| Total distributions to shareholders | | | — | | | | — | | | | (0.52 | ) | | | (0.14 | ) | | | — | | | | — | | |
| Redemption Fees: | |
| Redemption fees added to paid-in-capital | | | — | | | | — | (c)(f) | | | — | | | | — | | | | — | | | | — | | |
| Net Asset Value, End of Period | | $ | 10.91 | | | $ | 6.91 | | | $ | 13.86 | | | $ | 13.73 | | | $ | 12.99 | | | $ | 10.22 | | |
| Total return (g) | | | 57.89 | %(h) | | | (50.14 | )%(h) | | | 4.34 | %(h) | | | 6.88 | %(h)(i) | | | 27.10 | %(h) | | | 8.49 | % | |
Ratios to Average Net Assets/
Supplemental Data: | |
| Net expenses before interest expense (j) | | | 2.05 | % | | | 2.00 | % | | | 1.95 | % | | | 2.01 | %(k) | | | 2.06 | % | | | 2.15 | % | |
| Interest expense | | | — | | | | — | | | | — | | | | — | | | | — | | | | — | %(l) | |
| Net expenses (j) | | | 2.05 | % | | | 2.00 | % | | | 1.95 | % | | | 2.01 | %(k) | | | 2.06 | % | | | 2.15 | % | |
| Waiver/Reimbursement | | | 0.01 | % | | | 0.04 | % | | | 0.02 | % | | | 0.02 | %(k) | | | 0.01 | % | | | — | | |
| Net investment income (loss) (j) | | | (1.10 | )% | | | (0.63 | )% | | | (0.60 | )% | | | 0.11 | %(k) | | | (0.96 | )% | | | (1.25 | )% | |
| Portfolio turnover rate | | | 119 | % | | | 152 | % | | | 113 | % | | | 86 | %(i) | | | 141 | % | | | 130 | % | |
| Net assets, end of period (000s) | | $ | 660,457 | | | $ | 622,098 | | | $ | 1,418,014 | | | $ | 651,596 | | | $ | 157,286 | | | $ | 38,460 | | |
(a) The Fund changed its fiscal year end from March 31 to February 28. Per share data and total return reflect activity from April 1, 2006 through February 28, 2007.
(b) On August 22, 2005, the Fund's Investor C shares were renamed Class C shares.
(c) Per share data was calculated using the average shares outstanding during the period.
(d) Net investment income per share reflects special dividends. The effect of these dividends amounted to $0.08 per share.
(e) The amount shown for a share outstanding does not correspond with the aggregate net loss on investments for the period due to timing of repurchases of Fund shares in relation to fluctuating market values of the investments of the Fund.
(f) Rounds to less than $0.01 per share.
(g) Total return at net asset value assuming all distributions reinvested and no contingent deferred sales charge.
(h) Had the investment advisor and/or any of its affiliates not waived fees or reimbursed a portion of expenses, total return would have been reduced.
(i) Not annualized.
(j) The benefits derived from expense reductions had an impact of less than 0.01%, except for the period ended February 28, 2007 and the year ended March 31, 2006, which had an impact of 0.07% and 0.08%, respectively.
(k) Annualized.
(l) Rounds to less than 0.01%.
See Accompanying Notes to Financial Statements.
18
Financial Highlights – Columbia Marsico 21st Century Fund
Selected data for a fund share outstanding throughout each period is as follows:
| | | Year Ended February 28, | | Year
Ended
February 29, | | Period
Ended
February 28, | | Period
Ended
March 31, | |
| Class R Shares | | 2010 | | 2009 | | 2008 | | 2007 (a) | | 2006 (b) | |
| Net Asset Value, Beginning of Period | | $ | 7.29 | | | $ | 14.55 | | | $ | 14.32 | | | $ | 13.58 | | | $ | 12.53 | | |
| Income from Investment Operations: | |
| Net investment income (loss) (c) | | | (0.06 | ) | | | (0.02 | ) | | | (0.02 | ) | | | 0.16 | (d) | | | (0.02 | ) | |
Net realized and unrealized gain (loss)
on investments and foreign currency | | | 4.34 | | | | (7.24 | ) | | | 0.77 | (e) | | | 0.81 | | | | 1.07 | | |
| Total from investment operations | | | 4.28 | | | | (7.26 | ) | | | 0.75 | | | | 0.97 | | | | 1.05 | | |
| Less Distributions to Shareholders: | |
| From net investment income | | | — | | | | — | | | | — | | | | (0.06 | ) | | | — | | |
| From net realized gains | | | — | | | | — | | | | (0.49 | ) | | | — | | | | — | (f) | |
| From return of capital | | | — | | | | — | | | | (0.03 | ) | | | (0.17 | ) | | | — | | |
| Total distributions to shareholders | | | — | | | | — | | | | (0.52 | ) | | | (0.23 | ) | | | — | (f) | |
| Redemption Fees: | |
| Redemption fees added to paid-in-capital | | | — | | | | — | (c)(f) | | | — | | | | — | | | | — | | |
| Net Asset Value, End of Period | | $ | 11.57 | | | $ | 7.29 | | | $ | 14.55 | | | $ | 14.32 | | | $ | 13.58 | | |
| Total return (g)(h) | | | 58.71 | % | | | (49.90 | )% | | | 4.87 | % | | | 7.38 | %(i) | | | 8.38 | %(i) | |
Ratios to Average Net Assets/
Supplemental Data: | |
| Net expenses (j) | | | 1.55 | % | | | 1.50 | % | | | 1.45 | % | | | 1.51 | %(k) | | | 1.63 | %(k) | |
| Waiver/Reimbursement | | | 0.01 | % | | | 0.04 | % | | | 0.02 | % | | | 0.02 | %(k) | | | 0.03 | %(k) | |
| Net investment income (loss) (j) | | | (0.59 | )% | | | (0.13 | )% | | | (0.15 | )% | | | 1.25 | %(k) | | | (0.91 | )%(k) | |
| Portfolio turnover rate | | | 119 | % | | | 152 | % | | | 113 | % | | | 86 | %(i) | | | 141 | %(i) | |
| Net assets, end of period (000s) | | $ | 41,627 | | | $ | 42,429 | | | $ | 47,777 | | | $ | 4,394 | | | $ | 11 | | |
(a) The Fund changed its fiscal year end from March 31 to February 28. Per share data and total return reflect activity from April 1, 2006 through February 28, 2007.
(b) Class R shares commenced operations on January 23, 2006.
(c) Per share data was calculated using the average shares outstanding during the period.
(d) Net investment income per share reflects special dividends. The effect of these dividends amounted to $0.08 per share.
(e) The amount shown for a share outstanding does not correspond with the aggregate net loss on investments for the period due to timing of repurchases of Fund shares in relation to fluctuating market values of the investment of the Fund.
(f) Rounds to less than $0.01 per share.
(g) Total return at net asset value assuming all distributions reinvested.
(h) Had the investment advisor and/or any of its affiliates not waived fees or reimbursed a portion of expenses, total return would have been reduced.
(i) Not annualized.
(j) The benefits derived from expense reductions had an impact of less than 0.01%, except for the period ended February 28, 2007 and the period ended March 31, 2006, which had an impact of 0.07% and 0.08, respectively.
(k) Annualized.
See Accompanying Notes to Financial Statements.
19
Financial Highlights – Columbia Marsico 21st Century Fund
Selected data for a fund share outstanding throughout each period is as follows:
| | | Year Ended February 28, | | Year Ended
February 29, | | Period Ended
February 28, | | Year Ended March 31, | |
| Class Z Shares | | 2010 | | 2009 | | 2008 | | 2007 (a) | | 2006 (b) | | 2005 | |
| Net Asset Value, Beginning of Period | | $ | 7.44 | | | $ | 14.76 | | | $ | 14.45 | | | $ | 13.76 | | | $ | 10.75 | | | $ | 9.80 | | |
| Income from Investment Operations: | |
| Net investment income (loss) (c) | | | (0.01 | ) | | | 0.05 | | | | 0.07 | | | | 0.13 | (d) | | | — | (e) | | | (0.03 | ) | |
Net realized and unrealized gain (loss)
on investments and foreign currency | | | 4.43 | | | | (7.37 | ) | | | 0.76 | (f) | | | 0.91 | | | | 3.04 | | | | 0.98 | | |
| Total from investment operations | | | 4.42 | | | | (7.32 | ) | | | 0.83 | | | | 1.04 | | | | 3.04 | | | | 0.95 | | |
| Less Distributions to Shareholders: | |
| From net investment income | | | — | (e) | | | — | | | | — | | | | (0.12 | ) | | | (0.03 | ) | | | — | | |
| From net realized gains | | | — | | | | — | | | | (0.49 | ) | | | (0.23 | ) | | | — | | | | — | | |
| From return of capital | | | — | | | | — | | | | (0.03 | ) | | | — | | | | — | | | | — | | |
| Total distributions to shareholders | | | — | (e) | | | — | | | | (0.52 | ) | | | (0.35 | ) | | | (0.03 | ) | | | — | | |
| Redemption Fees: | |
Redemption fees added to
paid-in-capital | | | — | | | | — | (c)(e) | | | — | | | | — | | | | — | | | | — | | |
| Net Asset Value, End of Period | | $ | 11.86 | | | $ | 7.44 | | | $ | 14.76 | | | $ | 14.45 | | | $ | 13.76 | | | $ | 10.75 | | |
| Total return (g) | | | 59.42 | %(h) | | | (49.59 | )%(h) | | | 5.38 | %(h) | | | 7.84 | %(h)(i) | | | 28.33 | %(h) | | | 9.69 | % | |
Ratios to Average Net Assets/
Supplemental Data: | |
| Net expenses before interest expense (j) | | | 1.05 | % | | | 1.00 | % | | | 0.95 | % | | | 1.01 | %(k) | | | 1.06 | % | | | 1.15 | % | |
| Interest expense | | | — | | | | — | | | | — | | | | — | | | | — | | | | — | %(l) | |
| Net expenses (j) | | | 1.05 | % | | | 1.00 | % | | | 0.95 | % | | | 1.01 | %(k) | | | 1.06 | % | | | 1.15 | % | |
| Waiver/Reimbursement | | | 0.01 | % | | | 0.04 | % | | | 0.02 | % | | | 0.02 | %(k) | | | 0.01 | % | | | — | | |
| Net investment income (loss) (j) | | | (0.10 | )% | | | 0.37 | % | | | 0.41 | % | | | 1.03 | %(k) | | | 0.04 | % | | | (0.25 | )% | |
| Portfolio turnover rate | | | 119 | % | | | 152 | % | | | 113 | % | | | 86 | %(i) | | | 141 | % | | | 130 | % | |
| Net assets, end of period (000s) | | $ | 1,008,937 | | | $ | 870,875 | | | $ | 1,614,313 | | | $ | 732,508 | | | $ | 274,594 | | | $ | 114,896 | | |
(a) The Fund changed its fiscal year end from March 31 to February 28. Per share data and total return reflect activity from April 1, 2006 through February 28, 2007.
(b) On August 22, 2005, the Fund's Primary A shares were renamed Class Z shares.
(c) Per share data was calculated using the average shares outstanding during the period.
(d) Net investment income per share reflects special dividends. The effect of these dividends amounted to $0.08 per share.
(e) Rounds to less than $0.01 per share.
(f) The amount shown for a share outstanding does not correspond with the aggregate net loss on investments for the period due to timing of repurchases of Fund shares in relation to fluctuating market values of the investment of the Fund.
(g) Total return at net asset value assuming all distributions reinvested.
(h) Had the investment advisor and/or any of its affiliates not waived fees or reimbursed a portion of expenses, total return would have been reduced.
(i) Not annualized.
(j) The benefits derived from expense reductions had an impact of less than 0.01%, except for the period ended February 28, 2007 and the year ended March 31, 2006, which had an impact of 0.07% and 0.08, respectively.
(k) Annualized.
(l) Rounds to less than 0.01%.
See Accompanying Notes to Financial Statements.
20
Notes to Financial Statements – Columbia Marsico 21st Century Fund
February 28, 2010
Note 1. Organization
Columbia Marsico 21st Century Fund (the "Fund"), a series of Columbia Funds Series Trust (the "Trust"), is a diversified fund. The Trust is registered under the Investment Company Act of 1940, as amended (the "1940 Act"), as an open-end management investment company organized as a Delaware statutory trust.
Investment Objective
The Fund seeks long-term growth of capital.
Fund Shares
The Trust may issue an unlimited number of shares, and the Fund offers five classes of shares: Class A, Class B, Class C, Class R and Class Z shares. Each share class has its own expense structure and sales charges, as applicable. Effective June 22, 2009, the Fund no longer accepts investments from new or existing investors in the Fund's Class B shares, except in connection with the reinvestment of any dividend and/or capital gain distributions in Class B shares of the Fund and exchanges by existing Class B shareholders of the other Columbia Funds.
Class A shares are subject to a maximum front-end sales charge of 5.75% based on the amount of initial investment. Class A shares purchased without an initial sales charge in accounts aggregating $1 million to $50 million at the time of purchase are subject to a 1.00% contingent deferred sales charge ("CDSC") if the shares are sold within one year after purchase. Class B shares are subject to a maximum CDSC of 5.00% based upon the holding period after purchase. Class B shares will convert to Class A shares eight years after purchase. Class C shares are subject to a 1.00% CDSC on shares sold within one year after purchase. Class R and Class Z shares are offered continuously at net asset value. There are certain restrictions on the purchase of Class R and Class Z shares, as described in the Fund's prospectuses.
Note 2. Significant Accounting Policies
The preparation of financial statements in accordance with accounting principles generally accepted in the United States of America ("GAAP") requires management to make certain estimates and assumptions that affect the reported amounts of assets and liabilities, the disclosure of contingent assets and liabilities at the date of the financial statements and the reported amounts of revenue and expenses during the reporting period. Actual results could differ from those estimates.
The following is a summary of significant accounting policies consistently followed by the Fund in the preparation of its financial statements.
Security Valuation
Equity securities are valued at the last sale price on the principal exchange on which they trade, except for securities traded on the NASDAQ, which are valued at the NASDAQ official close price. Unlisted securities or listed securities for which there were no sales during the day are valued at the closing bid price on such exchanges or over-the-counter markets.
Short-term investments maturing in 60 days or less are valued at amortized cost, which approximates market value.
Foreign securities are generally valued at the last sale price on the foreign exchange or market on which they trade. If any foreign share prices are not readily available as a result of limited share activity, the securities are valued at the last sale price of the local shares in the principal market in which such securities are normally traded.
Generally, trading in foreign securities is substantially completed each day at various times prior to the close of the New York Stock Exchange ("NYSE"). The values of such securities used in computing the net asset value of the Fund's shares are determined as of such times. Foreign currency exchange rates are generally determined at 4:00 p.m. Eastern (U.S.) time. Occasionally, events affecting the values of such foreign securities may occur between the times at which they are determined and the close of the customary trading session of the NYSE, which would not be reflected in the computation of the Fund's net asset value. If events materially affecting the values of such foreign securities occur and it is determined that market quotations are not reliable, then these foreign securities will be valued at their fair value using procedures approved by the Board of Trustees.
Investments for which market quotations are not readily available, or that have quotations which management believes are not reliable, are valued at fair value as determined in good faith under consistently applied procedures established by and under the general supervision of the Board of Trustees. If a
21
Columbia Marsico 21st Century Fund, February 28, 2010
security is valued at fair value, such value is likely to be different from the last quoted market price for the security. The determination of fair value often requires significant judgment. To determine fair value, management may use assumptions including but not limited to future cash flows and estimated risk premiums. Multiple inputs from various sources may be used to determine value.
GAAP establishes a hierarchy that prioritizes the inputs to valuation techniques used to measure fair value giving the highest priority to unadjusted quoted prices in active markets for identical securities (level 1 measurements) and the lowest priority to unobservable inputs (level 3 measurements) when market prices are not readily available or reliable. The three levels of the fair value hierarchy are described below:
• Level 1 – quoted prices in active markets for identical securities
• Level 2 – prices determined using other significant observable inputs (including quoted prices for similar securities, interest rates, prepayment speeds, credit risk and others)
• Level 3 – prices determined using significant unobservable inputs. In situations where quoted prices or observable inputs are unavailable or less reliable, unobservable inputs may be used. Unobservable inputs may include management's own assumptions about the factors market participants would use in pricing an investment.
The inputs or methodology used for valuing securities are not necessarily an indication of the risk associated with investing in those securities.
Security Transactions
Security transactions are accounted for on the trade date. Cost is determined and gains (losses) are based upon the specific identification method for both financial statement and federal income tax purposes.
Repurchase Agreements
The Fund may engage in repurchase agreement transactions with institutions that Columbia Management Advisors, LLC ("Columbia"), the Fund's investment advisor, has determined are creditworthy. The Fund, through its custodian, receives delivery of the underlying securities collateralizing a repurchase agreement. Columbia is responsible for determining that the collateral is at least equal, at all times, to the value of the repurchase obligation including interest. A repurchase agreement transaction involves certain risks in the event of default or insolvency of the counterparty. These risks include possible delays in or restrictions on the Fund's ability to dispose of the underlying securities and a possible decline in the value of the underlying securities during the period while the Fund seeks to assert its rights.
Foreign Currency Transactions and Translations
The values of all assets and liabilities quoted in foreign currencies are translated into U.S. dollars at that day's exchange rates. Net realized and unrealized gains (losses) on foreign currency transactions and translations include gains (losses) arising from the fluctuation in exchange rates between trade and settlement dates on securities transactions, gains (losses) arising from the disposition of foreign currency and currency gains (losses) between the accrual and payment dates on dividends, interest income and foreign withholding taxes.
For financial statement purposes, the Fund does not distinguish that portion of gains (losses) on investments which is due to changes in foreign exchange rates from that which is due to changes in market prices of the investments. Such fluctuations are included with the net realized and unrealized gains (losses) on investments on the Statement of Operations.
Income Recognition
Interest income is recorded on the accrual basis. Premium and discount are amortized and accreted, respectively, on all debt securities except for premiums attributable to the conversion feature on convertible securities.
Corporate actions and dividend income are recorded on the ex-date except for certain foreign securities which are recorded as soon after the ex-date as the Fund becomes aware of such, net of any non-reclaimable tax withholdings.
Distributions received from real estate investment trusts (REITs) in excess of their income are recorded as a reduction of the cost of the related investments. If the Fund no longer owns the applicable securities, any distributions received in excess of income are recorded as realized gains.
22
Columbia Marsico 21st Century Fund, February 28, 2010
Expenses
General expenses of the Trust are allocated to the Fund and other series of the Trust based upon relative net assets or other expense allocation methodologies determined by the nature of the expense. Expenses directly attributable to the Fund are charged to the Fund.
Determination of Class Net Asset Value
All income, expenses (other than class-specific expenses, as shown on the Statement of Operations) and realized and unrealized gains (losses) are allocated to each class of the Fund on a daily basis for purposes of determining the net asset value of each class. Income and expenses are allocated to each class based on the settled shares method, while realized and unrealized gains (losses) are allocated based on the relative net assets of each class.
Federal Income Tax Status
The Fund intends to qualify each year as a "regulated investment company" under Subchapter M of the Internal Revenue Code, as amended, and will distribute substantially all of its taxable income, if any, for its tax year, and as such will not be subject to federal income taxes. In addition, the Fund intends to distribute in each calendar year substantially all of its net investment income, capital gains and certain other amounts, if any, such that the Fund should not be subject to federal excise tax. Therefore, no provision is made for federal income or excise taxes.
Distributions to Shareholders
Distributions from net investment income, if any, are declared and paid semi-annually. The Fund may, however, declare and pay distributions from net investment income more frequently The Fund will distribute net realized capital gains (including net short-term capital gains) at least annually after the fiscal year in which the capital gains were earned, unless offset by any available capital loss carryforward. Income distributions and capital gain distributions are determined in accordance with federal income tax regulations which may differ from GAAP.
Indemnification
In the normal course of business, the Fund enters into contracts that contain a variety of representations and warranties and which provide general indemnities. The Fund's maximum exposure under these arrangements is unknown because this would involve future claims against the Fund. Also, under the Trust's organizational documents and by contract, the Trustees and officers of the Trust are indemnified against certain liabilities that may arise out of actions relating to their duties to the Trust. However, based on experience, the Fund expects the risk of loss due to these representations, warranties and indemnities to be minimal.
Note 3. Federal Tax Information
The timing and character of income and capital gain distributions are determined in accordance with income tax regulations, which may differ from GAAP. Reclassifications are made to the Fund's capital accounts for permanent tax differences to reflect income and gains available for distribution (or available capital loss carryforwards) under income tax regulations.
For the year ended February 28, 2010, permanent book and tax basis differences resulting primarily from differing treatments for net operating losses and foreign currency transactions were identified and reclassified among the components of the Fund's net assets as follows:
Accumulated
Net Investment
Loss | | Accumulated
Net Realized
Loss | | Paid-In Capital | |
| $ | 17,547,542 | | | $ | 805,688 | | | $ | (18,353,230 | ) | |
Net investment income and net realized gains (losses), as disclosed on the Statement of Operations, and net assets were not affected by this reclassification.
The tax character of distributions paid during the years ended February 28, 2010 and February 28, 2009 was as follows:
| | | February 28, | |
| Distributions paid from: | | 2010 | | 2009 | |
| Ordinary Income* | | $ | 51,807 | | | $ | — | | |
| Long-Term Capital Gains | | | — | | | | — | | |
* For tax purposes short-term capital gain distributions, if any, are considered ordinary income distributions.
23
Columbia Marsico 21st Century Fund, February 28, 2010
As of February 28, 2010, the components of distributable earnings on a tax basis were as follows:
Undistributed
Ordinary
Income | | Undistributed
Long-Term
Capital Gains | | Net Unrealized
Appreciation* | |
| $ | — | | | $ | — | | | $ | 594,625,862 | | |
* The differences between book-basis and tax-basis net unrealized appreciation are primarily due to deferral of losses from wash sales.
Unrealized appreciation and depreciation at February 28, 2010, based on cost of investments for federal income tax purposes were:
| Unrealized appreciation | | $ | 647,925,148 | | |
| Unrealized depreciation | | | (53,299,286 | ) | |
| Net unrealized appreciation | | $ | 594,625,862 | | |
The following capital loss carryforwards may be available to reduce taxable income arising from future net realized gains on investments, if any, to the extent permitted by the Internal Revenue Code:
| Year of Expiration | | Capital Loss
Carryforwards | |
| 2017 | | $ | 1,181,576,157 | | |
| 2018 | | | 1,526,982,692 | | |
| | | $ | 2,708,558,849 | | |
Under current tax rules, certain currency and capital losses realized after October 31 may be deferred and treated as occurring on the first day of the following fiscal year. As of February 28, 2010, post-October capital losses of $34,896,704 attributed to security transactions were deferred to March 1, 2010.
Management is required to determine whether a tax position of the Fund is more likely than not to be sustained upon examination by the applicable taxing authority, including resolution of any related appeals or litigation processes, based on the technical merits of the position. The tax benefit to be recognized by the Fund is measured as the largest amount of benefit that is greater than fifty percent likely of being realized upon ultimate settlement. Management is not aware of any tax positions for which it is reasonably possible that the total amounts of unrecognized tax benefits will significantly change in the next twelve months. However, management's conclusions may be subject to review and adjustment at a later date based on factors including, but not limited to, new tax laws, regulations, and administrative interpretations (including relevant court decisions). The Fund's federal tax returns for the prior three fiscal year s remain subject to examination by the Internal Revenue Service.
Note 4. Fees and Compensation Paid to Affiliates
Investment Advisory Fee
Columbia, an indirect, wholly owned subsidiary of Bank of America Corporation ("BOA"), provides investment advisory services to the Fund. Columbia receives a monthly investment advisory fee based on the Fund's average daily net assets at the following annual rates:
| Average Daily Net Assets | | Annual Fee Rate | |
| First $500 million | | | 0.75 | % | |
| $500 million to $1 billion | | | 0.70 | % | |
| $1 billion to $1.5 billion | | | 0.65 | % | |
| $1.5 billion to $3 billion | | | 0.60 | % | |
| $3 billion to $6 billion | | | 0.58 | % | |
| Over $6 billion | | | 0.56 | % | |
For the year ended February 28, 2010, the Fund's effective investment advisory fee rate was 0.63% of the Fund's average daily net assets.
Bank of America N.A., an indirect parent company of Columbia, entered into an agreement dated September 29, 2009, to sell a portion of the asset management business of Columbia Management Group, LLC to Ameriprise Financial, Inc. ("Ameriprise Financial"). The transaction ("Transaction") includes the sale of the part of the asset management business that advises long-term mutual funds, including the Fund. The Transaction is subject to certain approvals and other conditions to closing, and is currently expected to close on or about May 1, 2010 (the "Closing"). In connection with the Closing, certain changes will occur, including a change in the entities serving as the investment advisor, administrator, distributor and transfer agent of the Fund. RiverSource
24
Columbia Marsico 21st Century Fund, February 28, 2010
Investments, LLC (the "New Advisor"), a subsidiary of Ameriprise Financial, will become the investment advisor of the Fund upon the Closing. The New Advisor will serve as investment advisor under a new investment management services agreement effective upon the closing. The New Advisor expects to change its name to Columbia Management Investment Advisers, LLC upon or shortly after the Closing. Effective upon the Closing, as the context requires, references to Columbia shall be deemed to refer to the New Advisor.
To the extent that the Fund is not benefitting from a separate contractual expense limitation arrangement, Columbia has contractually agreed to waive a portion of its advisory fees through June 30, 2010.
The waiver amount is calculated based on the difference between the dollar amount of sub-advisory fees that would have been payable to Marsico Capital Management, LLC ("Marsico") based on the annualized rate of 0.45% of the Fund's average daily net assets, and the dollar amount of sub-advisory fees calculated on a monthly basis based on the annualized sub-advisory fee rate effective January 1, 2008 in which Marsico is entitled from the Fund which is described under the Sub-Advisory Fee note below. The annualized fee rate of 0.45% represents the sub-advisory fee rate which Marsico was entitled to receive prior to January 1, 2008.
In the absence of a separate contractual expense limitation arrangement, the advisory fee waiver for the Fund would be calculated as follows:
| Fund Average Daily Net Assets* | | | Advisory Fee Waiver | | |
| Assets up to $18 billion | | | 0.00 | % | |
Assets in excess of $18 billion
and up to $21 billion | | | 0.05 | % | |
| Assets in excess of $21 billion | | | 0.10 | % | |
* For purposes of the calculation, "Assets" are aggregate assets sub-advised by Marsico in the following Columbia Funds: (i) Columbia Marsico Growth Fund; (ii) Columbia Marsico Focused Equities Fund; (iii) Columbia Marsico 21st Century Fund; (iv) Columbia Marsico Growth Fund, Variable Series; (v) Columbia Marsico Focused Equities Fund, Variable Series; (vi) Columbia Marsico 21st Century Fund, Variable Series; and (vii) any future Columbia U.S. equity fund sub-advised by Marsico which Columbia and Marsico mutually agree in writing.
For the year ended February 28, 2010, Columbia did not waive investment advisory fees for the Fund.
Sub-Advisory Fee
Marsico has been retained by Columbia to serve as the investment sub-advisor to the Fund. As the sub-advisor, and subject to the oversight of Columbia and the Fund's Board of Trustees, Marsico is responsible for the daily investment operations, including placing all orders for the purchase and sale of the portfolio securities for the Fund. Columbia, from the investment advisory fee it receives, pays Marsico a monthly sub-advisory fee.
Marsico is entitled to receive a monthly sub-advisory fee for its services provided to the Fund at the following annual rates:
| Fund Average Daily Net Assets* | | | Fee Rate | | |
| Assets up to $18 billion | | | 0.45 | % | |
Assets in excess of $18 billion
and up to $21 billion | | | 0.40 | % | |
| Assets in excess of $21 billion | | | 0.35 | % | |
* For purposes of the calculation, "Assets" are aggregate assets sub-advised by Marsico in the following Columbia Funds: (i) Columbia Marsico Growth Fund; (ii) Columbia Marsico Focused Equities Fund; (iii) Columbia Marsico 21st Century Fund; (iv) Columbia Marsico Growth Fund, Variable Series; (v) Columbia Marsico Focused Equities Fund, Variable Series; (vi) Columbia Marsico 21st Century Fund, Variable Series; and (vii) any future Columbia U.S. equity fund sub-advised by Marsico which the Advisor and Marsico mutually agree in writing.
Administration Fee
Columbia provides administrative and other services to the Fund for a monthly administration fee at the annual rate of 0.22% of the Fund's average daily net assets, less the fees payable by the Fund as described under the Pricing and Bookkeeping Fees note below.
The New Advisor will become the administrator of the Fund under a new administrative services agreement effective upon the Closing.
Pricing and Bookkeeping Fees
The Fund has entered into a Financial Reporting Services Agreement (the "Financial Reporting Services Agreement") with State Street Bank and Trust Company ("State Street") and Columbia pursuant to which State Street provides financial reporting services to the Fund. The Fund has also entered into an Accounting Services Agreement (collectively with the Financial Reporting Services Agreement, the "State Street Agreements") with State Street and Columbia pursuant
25
Columbia Marsico 21st Century Fund, February 28, 2010
to which State Street provides accounting services to the Fund. Under the State Street Agreements, the Fund pays State Street an annual fee of $38,000 paid monthly plus an additional monthly fee based on an annualized percentage rate of average daily net assets of the Fund for the month. The aggregate fee will not exceed $140,000 per year (exclusive of out-of-pocket expenses and charges). The Fund also reimburses State Street for certain out-of-pocket expenses and charges.
Among other updates to the State Street Agreements, Columbia will assign and delegate its rights and obligations thereunder to the New Advisor upon the Closing.
The Fund has entered into a Pricing and Bookkeeping Oversight and Services Agreement (the "Services Agreement") with Columbia. Under the Services Agreement, Columbia provides services related to Fund expenses and the requirements of the Sarbanes-Oxley Act of 2002, and provides oversight of the accounting and financial reporting services provided by State Street. Under the Services Agreement, the Fund reimburses Columbia for out-of-pocket expenses and charges, including fees payable to third parties, such as for pricing the Fund's portfolio securities, incurred by Columbia in the performance of services under the Services Agreement.
The Services Agreement will be terminated upon the Closing, and the services provided thereunder will be covered under the administrative services agreement with the New Advisor.
Transfer Agent Fee
Columbia Management Services, Inc. (the "Transfer Agent"), an affiliate of Columbia and an indirect, wholly owned subsidiary of BOA, provides shareholder services to the Fund and has contracted with Boston Financial Data Services ("BFDS") to serve as sub-transfer agent. Effective January 1, 2010, the Transfer Agent is entitled to receive a fee for its services, paid monthly, at the annual rate of $22.36 per account plus reimbursement of certain sub-transfer agent fees paid by the Transfer Agent (exclusive of BFDS fees), calculated based on assets held in omnibus accounts and intended to recover the cost of payments to other parties (including affiliates of BOA) for services to those accounts. Prior to January 1, 2010, the annual rate was $17.34 per account. The Transfer Agent pays the fees of BFDS for services as sub-transfer agent and is not entitled to reimbursement for such fees from the Fund.
The Transfer Agent may also retain, as additional compensation for its services, fees for wire, telephone and redemption orders, Individual Retirement Account ("IRA") trustee agent fees and account transcript fees due to the Transfer Agent from shareholders of the Fund and credits (net of bank charges) earned with respect to balances in accounts the Transfer Agent maintains in connection with its services to the Fund. The Transfer Agent also receives reimbursement for certain out-of-pocket expenses.
Prior to May 1, 2009, the Transfer Agent voluntarily waived a portion of its fees for accounts other than omnibus accounts, so that transfer agent fees (exclusive of out-of-pocket expenses and sub-transfer agent fees) did not exceed 0.02% annually of the Fund's average daily net assets.
An annual minimum account balance fee of $20 may apply to certain accounts with a value below the Fund's initial minimum investment requirements to reduce the impact of small accounts on transfer agent fees. These minimum account balance fees are recorded as part of expense reductions on the Statement of Operations. For the year ended February 28, 2010, no minimum account balance fees were charged by the Fund.
RiverSource Service Corporation (the "New Transfer Agent"), a subsidiary of Ameriprise Financial, will become the transfer agent of the Fund upon the Closing. The New Transfer Agent expects to change its name to Columbia Management Investment Services Corp. upon or shortly after the Closing.
Underwriting Discounts, Service and Distribution Fees
Columbia Management Distributors, Inc. (the "Distributor"), an affiliate of Columbia and an indirect, wholly owned subsidiary of BOA, is the principal underwriter of the Fund's shares. For the year ended February 28, 2010, the Distributor has retained net underwriting discounts of $118,273 on sales of the Fund's Class A shares and received net CDSC fees of $2,245, $402,871 and $144,216 on Class A, Class B and Class C share redemptions, respectively.
RiverSource Fund Distributors, Inc. (the "New Distributor"), a subsidiary of Ameriprise Financial, will become the distributor of the Fund upon the Closing. The New Distributor expects to change its name to Columbia Management Investment Distributors, Inc. upon or shortly after the Closing.
26
Columbia Marsico 21st Century Fund, February 28, 2010
The Trust has adopted shareholder servicing plans and distribution plans for the Class B and Class C shares of the Fund and a combined distribution and shareholder servicing plan for the Class A shares of the Fund. The Trust has also adopted a distribution plan for the Class R shares of the Fund. The shareholder servicing plans permit the Fund to compensate or reimburse servicing agents for the shareholder services they have provided. The distribution plans, adopted pursuant to Rule 12b-1 under the 1940 Act, permit the Fund to compensate or reimburse the Distributor and/or selling agents for activities or expenses primarily intended to result in the sale of the classes' shares. Payments are made at an annual rate and paid monthly, as a percentage of average daily net assets, set from time to time by the Board of Trustees, and are charged as expenses of the Fund directly to the applicable share class. A substantial portion of the expenses incurred pursuant to these plans is paid to affiliates of BOA and the Distributor.
The annual rates in effect and plan limits, as a percentage of average daily net assets are as follows:
| | | Current
Rate | | Plan Limit | |
Class A Combined Distribution
and Shareholder Servicing Plan | | | 0.25 | % | | | 0.25 | % | |
Class B and Class C
Shareholder Servicing Plans | | | 0.25 | % | | | 0.25 | % | |
Class B and Class C
Distribution Plans | | | 0.75 | % | | | 0.75 | % | |
| Class R Distribution Plan | | | 0.50 | % | | | 0.50 | % | |
Expense Limits and Fee Waivers
Effective May 1, 2009, Columbia has voluntarily agreed to reimburse a portion of the Fund's expenses so that the Fund's ordinary operating expenses (excluding any distribution and service fees, brokerage commissions, interest, taxes and extraordinary expenses, but including custodian charges relating to overdrafts, if any) after giving effect to any balance credits from the Fund's custodian, do not exceed the annual rate of 1.20% of the Fund's average daily net assets. Columbia, in its discretion, may revise or discontinue this arrangement at any time.
Fees Paid to Officers and Trustees
All officers of the Fund are employees of Columbia or its affiliates and, with the exception of the Fund's Chief Compliance Officer, receive no compensation from the Fund. The Board of Trustees has appointed a Chief Compliance Officer to the Fund in accordance with federal securities regulations. The Fund, along with other affiliated funds, pays its pro-rata share of the expenses associated with the Chief Compliance Officer. The Fund's expenses for the Chief Compliance Officer will not exceed $15,000 per year.
Trustees are compensated for their services to the Fund, as set forth on the Statement of Operations. The Trust's eligible Trustees may participate in a non-qualified deferred compensation plan which may be terminated at any time. Any payments to plan participants are paid solely out of the Fund's assets. Income earned on the plan participant's deferral account is based on the rate of return of the eligible mutual funds selected by the participant or, if no funds are selected, on the rate of return of Columbia Treasury Reserves, another portfolio of the Trust. The expense for the deferred compensation plan, which includes trustees' fees deferred during the current period as well as any gains or losses on the trustees' deferred compensation balances as a result of market fluctuations, is included in "Trustees' fees" on the Statement of Operations. The liability for the deferred compensation plan is included in "Trustees' fees" on the Statement of Assets and Liabilities.
Other Related Party Transactions
In connection with the purchase and sale of its securities during the period, the Fund used one or more brokers that are affiliates of BOA. Total brokerage commissions paid to affiliated brokers for the year ended February 28, 2010 was $431,786.
Note 5. Custody Credits
The Fund has an agreement with its custodian bank under which custody fees may be reduced by balance credits. These credits are recorded as part of expense reductions on the Statement of Operations. The Fund could have invested a portion of the assets utilized in connection with the expense offset arrangement in an income-producing asset if it had not entered into such an agreement. For the year ended
27
Columbia Marsico 21st Century Fund, February 28, 2010
February 28, 2010, these custody credits reduced total expenses by $20 for the Fund.
Note 6. Portfolio Information
For the year ended February 28, 2010, the cost of purchases and proceeds from sales of securities, excluding short-term obligations, for the Fund were $4,501,235,460 and $5,964,652,933, respectively.
Note 7. Line of Credit
The Fund and other affiliated funds participate in a $280,000,000 committed, unsecured revolving line of credit provided by State Street. The maximum amount that may be borrowed by any fund is limited to the lesser of $200,000,000 and the Fund's borrowing limit set forth in the Fund's registration statement. Borrowings are available for short-term liquidity or temporary or emergency purposes.
Effective October 15, 2009, interest is charged to each participating fund based on the fund's borrowings at a rate per annum equal to the greater of the Federal Funds Rate plus 1.25% or the overnight LIBOR Rate plus 1.25%. In addition, a commitment fee of 0.15% per annum is accrued and apportioned among the participating funds pro rata based on their relative net assets.
Prior to October 15, 2009, interest was charged to each participating fund based on the fund's borrowings at a rate per annum equal to the greater of the Federal Funds Rate plus 0.50% or the overnight LIBOR Rate plus 0.50%. In addition, an annual operations agency fee of $20,000, an amendment fee of 0.02% and a commitment fee of 0.12% per annum were accrued and apportioned among the participating funds pro rata based on their relative net assets.
For the year ended February 28, 2010, the Fund did not borrow under these arrangements.
Note 8. Securities Lending
The Fund may lend its securities to certain approved brokers, dealers and other financial institutions. Each loan is collateralized by cash, in an amount at least equal to the market value of the securities loaned plus accrued income from the investment of collateral. The market value of the loaned securities is determined at the close of business of the Fund and any additional required collateral is delivered to the Fund on the next business day. The collateral received is invested and the income generated by the investment of the collateral, net of any fees remitted to State Street as the lending agent and borrower rebates, is paid to the Fund. Generally, in the event of borrower default, the Fund has the right to use the collateral to offset any losses incurred. In the event the Fund is delayed or prevented from exercising its right to dispose of the collateral, there may be a potential loss to the Fund. The Fund bears the ri sk of loss with respect to the investment of collateral.
For the year ended February 28, 2010, the Fund did not participate in the securities lending program.
Note 9. Shares of Beneficial Interest
As of February 28, 2010, 13.7% of the Fund's shares outstanding were beneficially owned by two participant accounts over which BOA and/or any of its affiliates had either sole or joint investment discretion.
As of February 28, 2010, the Fund had one shareholder that held 17.8% of the shares outstanding, over which BOA and/or any of its affiliates did not have investment discretion.
As of February 28, 2010, no other shareholders owned more than 5% of the outstanding shares of the Fund.
Subscription and redemption activity of these accounts may have a significant effect on the operations of the Fund.
Note 10. Significant Risks and Contingencies
Foreign Securities Risk
There are certain additional risks involved when investing in foreign securities. These risks may involve foreign currency exchange rate fluctuations, adverse political and economic developments and the possible prevention of currency exchange or other foreign governmental laws or restrictions. In addition, the liquidity of foreign securities may be more limited than that of domestic securities.
Investments in emerging market countries are subject to additional risk. The risk of foreign investments is typically increased in less developed countries. These countries are also more likely to experience high levels of inflation, deflation or currency devaluation which could hurt their economies and securities markets.
28
Columbia Marsico 21st Century Fund, February 28, 2010
Legal Proceedings
Columbia Management Advisors, LLC and Columbia Management Distributors, Inc. (collectively, the "Columbia Group") are subject to a settlement agreement with the New York Attorney General ("NYAG") (the "NYAG Settlement") and a settlement order with the Securities and Exchange Commission ("SEC") (the "SEC Order") on matters relating to mutual fund trading, each dated February 9, 2005. Under the terms of the SEC Order, the Columbia Group (or predecessor or affiliated entities) agreed, among other things, to: pay disgorgement and civil money penalties collectively totaling $375 million; cease and desist from violations of the antifraud provisions and certain other provisions of the federal securities laws; maintain certain compliance and ethics oversight structures; and retain an independent consultant to review the Columbia Group's applicable supervisory, compliance, control and other policies and procedures. The NYAG Settlement, a mong other things, requires Columbia Management Advisors, LLC and its affiliates to make certain disclosures to investors relating to expenses. In connection with the Columbia Group providing services to the Columbia Funds, the Columbia Funds have voluntarily undertaken to implement certain governance measures designed to maintain the independence of their boards of trustees and certain special consulting and compliance measures.
Pursuant to the SEC Order and related procedures, the $375 million in settlement amounts described above, of which approximately $90 million has been earmarked for certain Columbia Funds and their shareholders, is being distributed in accordance with a distribution plan developed by an independent distribution consultant and approved by the SEC on December 27, 2007. Distributions under the distribution plan began in mid-June 2008 and the distribution earmarked for the Columbia Funds and their shareholders has been substantially completed.
Civil Litigation
In connection with the events that resulted in the NYAG Settlement and SEC Order, various parties filed suits against Bank of America Corporation and certain of its affiliates, including Banc of America Capital Management, LLC ("BACAP," now known as Columbia Management Advisors, LLC) and BACAP Distributors, LLC (now known as Columbia Management Distributors, Inc.) (collectively "BAC"), Nations Funds Trust (now known as Columbia Funds Series Trust) and its Board of Trustees. On February 20, 2004, the Judicial Panel on Multidistrict Litigation transferred these cases and cases against other mutual fund companies based on similar allegations to the United States District Court in Maryland for consolidated or coordinated pretrial proceedings (the "MDL"). Subsequently, additional related cases were transferred to the MDL. On September 29, 2004, the plaintiffs in the MDL filed amended and consolidated complaints. One of these amended complaints is a putative class action that includes claims under the federal securities laws and state common law, and that names Nations Funds Trust, the Trustees, BAC and others as defendants. Another of the amended complaints is a derivative action purportedly on behalf of the Nations Funds Trust against BAC and others that asserts claims under federal securities laws and state common law. Nations Funds Trust is a nominal defendant in this action.
On February 25, 2005, BAC and other defendants filed motions to dismiss the claims in the pending cases. On December 15, 2005, BAC and others entered into a Stipulation of Settlement of the direct and derivative claims brought on behalf of the Nations Funds shareholders. The settlement is subject to court approval. If the settlement is approved, BAC would pay settlement administration costs and fees to plaintiffs' counsel as approved by the court. The stipulation has not yet been presented to the court for approval.
Note 11. Subsequent Events
In connection with the preparation of the financial statements of the Fund as of and for the fiscal year ended February 28, 2010, events and transactions through the date the financial statements were issued have been evaluated by the Fund's management for possible adjustment and/or disclosure. No subsequent events or transactions had occurred that would require adjustment of the financial statements as presented. On March 31, 2010, the Fund's shareholders approved, among other matters, a proposed investment management services agreement with the New Advisor and a proposed investment subadvisory agreement with Marsico, the effectiveness of each of which is conditioned on the Closing.
29
Report of Independent Registered Public Accounting Firm
To the Trustees of Columbia Funds Series Trust and the Shareholders of Columbia Marsico 21st Century Fund
In our opinion, the accompanying statement of assets and liabilities, including the investment portfolio, and the related statements of operations and of changes in net assets and the financial highlights present fairly, in all material respects, the financial position of Columbia Marsico 21st Century Fund (the "Fund") (a series of Columbia Funds Series Trust) at February 28, 2010, the results of its operations, the changes in its net assets and the financial highlights for each of the periods indicated, in conformity with accounting principles generally accepted in the United States of America. These financial statements and financial highlights (hereafter referred to as "financial statements") are the responsibility of the Fund's management. Our responsibility is to express an opinion on these financial statements based on our audits. We conducted our audits of these financial statements in accordance with the stand ards of the Public Company Accounting Oversight Board (United States). Those standards require that we plan and perform the audit to obtain reasonable assurance about whether the financial statements are free of material misstatement. An audit includes examining, on a test basis, evidence supporting the amounts and disclosures in the financial statements, assessing the accounting principles used and significant estimates made by management, and evaluating the overall financial statement presentation. We believe that our audits, which included confirmation of securities at February 28, 2010 by correspondence with the custodian and brokers, provide a reasonable basis for our opinion.
PricewaterhouseCoopers LLP
Boston, Massachusetts
April 21, 2010
30
Fund Governance
The Trustees serve terms of indefinite duration. The names, addresses and ages of the Trustees and officers of the Funds of Columbia Funds Series Trust, the year each was first elected or appointed to office, their principal business occupations during at least the last five years, the number of Funds overseen by each Trustee and other directorships they hold are shown below. Each officer listed below serves as an officer of each Fund in the Columbia Funds Complex.
Independent Trustees
Name, Address and Age,
Position with Funds, Year First
Elected or Appointed to Office | | Principal Occupation(s) During Past Five Years, Number of Funds in the Columbia
Funds Complex Overseen by Trustee, Other Directorships Held
| |
| Edward J. Boudreau (Born 1944) | |
|
c/o Columbia Management
Advisors, LLC
One Financial Center
Boston, MA 02111
Trustee (since 2005) | | Managing Director—E.J. Boudreau & Associates (consulting), from 2000 through current; oversees 64; no other directorships held. | |
|
| William P. Carmichael (Born 1943) | |
|
c/o Columbia Management
Advisors, LLC
One Financial Center
Boston, MA 02111
Trustee (since 1999) | | Retired. Oversees 64; Director—Cobra Electronics Corporation (electronic equipment manufacturer); Director—Simmons Company (bedding); Director—The Finish Line (sportswear). | |
|
| William A. Hawkins (Born 1942) | |
|
c/o Columbia Management Advisors, LLC
One Financial Center
Boston, MA 02111
Trustee (since 2005) | | President and Chief Executive Officer—California General Bank, N.A., from January 2008 through current; oversees 64; no other directorships held. | |
|
| R. Glenn Hilliard (Born 1943) | |
|
c/o Columbia Management Advisors, LLC
One Financial Center
Boston, MA 02111
Trustee (since 2005) | | Chairman and Chief Executive Officer—Hilliard Group LLC (investing and consulting), from April 2003 through current; Non-Executive Director & Chairman—Conseco, Inc. (insurance), September 2003 through current; Executive Chairman—Conseco, Inc. (insurance), August 2004 through September 2005; oversees 64; Director—Conseco, Inc. (insurance). | |
|
| John J. Nagorniak (Born 1944) | |
|
c/o Columbia Management
Advisors, LLC
One Financial Center
Boston, MA 02111
Trustee (since 2008)` | | Retired. President and Director—Foxstone Financial, Inc. (consulting), 2000 through December 2007; Director—Mellon Financial Corporation affiliates (investing), 2000 through 2007; Chairman—Franklin Portfolio Associates (investing—Mellon affiliate), 1982 through 2007; oversees 64; Director—MIT Investment Company; Trustee—MIT 401k Plan; Trustee and Chairman—Research Foundation of CFA Institute. | |
|
31
Fund Governance (continued)
Independent Trustees (continued)
Name, Address and Age,
Position with Funds, Year First
Elected or Appointed to Office | | Principal Occupation(s) During Past Five Years, Number of Funds in the Columbia
Funds Complex Overseen by Trustee, Other Directorships Held
| |
| Minor M. Shaw (Born 1947) | |
|
c/o Columbia Management Advisors, LLC
One Financial Center
Boston, MA 02111
Trustee (since 2003) | | President—Micco Corporation and Mickel Investment Group; oversees 64; Board Member—Piedmont Natural Gas. | |
|
Interested Trustee
| Anthony M. Santomero1 (Born 1946) | |
|
c/o Columbia Management Advisors, LLC
One Financial Center
Boston, MA 02111
Trustee (since 2008) | | Richard K. Mellon Professor Emeritus of Finance, The Wharton School, University of Pennsylvania, from 1972 through current; Senior Advisor—McKinsey & Company (consulting), July 2006 through January 2008; President and Chief Executive Officer—Federal Reserve Bank of Philadelphia, July 2000 through April 2006; oversees 64; Director—Renaissance Reinsurance Ltd; Trustee—Penn Mutual Life Insurance Company; Director—Citigroup | |
|
1 The Columbia Funds currently treat Mr. Santomero as an "interested person" (as defined in the 1940 Act) of the Funds because he serves as a Director of Citigroup, Inc. and Citibank, N.A. Citigroup, Inc., through its subsidiaries and affiliates, including Citibank, N.A., may engage from time-to-time in brokerage execution, principal transactions and/or lending relationships with the Columbia Funds or other funds or accounts advised/managed by the Advisor and/or any sub-advisor.
The Statement of Additional Information includes additional information about the Trustees of the Funds and is available, without charge, upon request by calling 800-345-6611.
32
Fund Governance (continued)
Officers
Name, Address and Year of Birth,
Position with Columbia Funds,
Year First Elected or
Appointed to Office | | Principal Occupation(s) During Past Five Years
| |
| J. Kevin Connaughton (Born 1964) | |
|
One Financial Center
Boston, MA 02111
President (since 2009) | | Managing Director of Columbia Management Advisors, LLC since December 2004; Senior Vice President and Chief Financial Officer—Columbia Funds, from June 2008 to January 2009; Treasurer—Columbia Funds, from October 2003 to May 2008; Treasurer—the Liberty Funds, Stein Roe Funds and Liberty All-Star Funds, December 2000—December 2006; Senior Vice President—Columbia Management Advisors, LLC, from April 2003 to December 2004; President—Columbia Funds, Liberty Funds and Stein Roe Funds, February 2004 to October 2004; Treasurer—Galaxy Funds, September 2002 to December 2005; Treasurer, December 2002 to December 2004, and President, February 2004 to December 2004—Columbia Management Multi-Strategy Hedge Fund, LLC; and a senior officer of various other Bank of America-affiliated entities, including other registered and unregistered funds | |
|
| James R. Bordewick, Jr. (Born 1959) | |
|
One Financial Center
Boston, MA 02111
Senior Vice President, Secretary and Chief Legal Officer (since 2006) | | Associate General Counsel, Bank of America since April 2005; Senior Vice President and Associate General Counsel, MFS Investment Management (investment management) prior to April 2005. | |
|
| Linda J. Wondrack (Born 1964) | |
|
One Financial Center
Boston, MA 02111
Senior Vice President and
Chief Compliance Officer (since 2007) | | Director (Columbia Management Group LLC and Investment Product Group Compliance), Bank of America since June 2005; Director of Corporate Compliance and Conflicts Officer, MFS Investment Management (investment management), August 2004 to May 2005; Managing Director, Deutsche Asset Management (investment management) prior to August 2004. | |
|
| Michael G. Clarke (Born 1969) | |
|
One Financial Center
Boston, MA 02111
Senior Vice President and
Chief Financial Officer (since 2009) | | Director of Fund Administration of the Advisor since January 2006; Managing Director of the Advisor September 2004 to December 2005; Vice President Fund Administration June 2002 to September 2004. | |
|
| Jeffrey R. Coleman (Born 1969) | |
|
One Financial Center
Boston, MA 02111
Treasurer (since 2008) | | Director of Fund Administration of the Advisor since January 2006; Fund Controller of the Advisor from October 2004 to January 2006; Vice President of CDC IXIS Asset Management Services, Inc. (investment management) from August 2000 to September 2004. | |
|
| Joseph F. DiMaria (Born 1968) | |
|
One Financial Center
Boston, MA 02111
Chief Accounting Officer (since 2008) | | Director of Fund Administration of the Advisor since January 2006; Head of Tax/Compliance and Assistant Treasurer of the Advisor from November 2004 to December 2005; Director of Trustee Administration (Sarbanes-Oxley) of the Advisor from May 2003 to October 2004. | |
|
33
Fund Governance (continued)
Officers (continued)
Name, Address and Year of Birth,
Position with Columbia Funds,
Year First Elected or
Appointed to Office | | Principal Occupation(s) During Past Five Years
| |
| Julian Quero (Born 1967) | |
|
One Financial Center
Boston, MA 02111
Deputy Treasurer (since 2008) | | Senior Tax Manager of the Advisor since August 2006; Senior Compliance Manager of the Advisor from April 2002 to August 2006. | |
|
| Barry S. Vallan (Born 1969) | |
|
One Financial Center
Boston, MA 02111
Controller (since 2006) | | Vice President—Fund Treasury of the Advisor since October 2004; Vice President—Trustee Reporting of the Advisor from April 2002 to October 2004. | |
|
| Stephen T. Welsh (Born 1957) | |
|
One Financial Center
Boston, MA 02111
Vice President (since 1996) | | President, Columbia Management Services, Inc. since July 2004; Senior Vice President and Controller, Columbia Management Services, Inc. prior to July 2004. | |
|
34
Board Consideration and Re-Approval of Current Investment Advisory and Sub-Advisory Agreements
Even though the following description of the Board's consideration of investment advisory and, as applicable, sub-advisory agreements covers multiple funds, for purposes of this shareholder report, the description is only relevant as to the Fund.
The Board of Trustees of Columbia Funds Series Trust (the "Board"), including a majority of the Trustees who have no direct or indirect interest in the investment advisory and sub-advisory agreements and are not "interested persons" of the Trust, as defined in the Investment Company Act of 1940 (the "1940 Act") (the "Independent Trustees"), are required annually to review and re-approve the existing investment advisory and sub-advisory agreements and approve any newly proposed terms therein. In this regard, the Board reviewed and re-approved, during the most recent six months covered by this report, (i) investment advisory agreements with Columbia Management Advisors, LLC ("CMA" or the "Adviser") for Columbia Convertible Securities Fund, Columbia Large Cap Value Fund, Columbia Mid Cap Value Fund, Columbia Small Cap Value Fund II, Columbia Marsico Growth Fund, Columbia Large Cap Core Fund, Columbia Marsico Focused Equities Fund, Columbia Marsico 21st Century Fund and Columbia Small Cap Growth Fund II; and (ii) investment sub-advisory agreements with Marsico Capital Management, LLC ("Marsico Capital" or the "Sub-Adviser") for Columbia Marsico Focused Equities Fund, Columbia Marsico 21st Century Fund and Columbia Marsico Growth Fund (the "Sub-Advised Funds"). The investment advisory agreements with CMA and the investment sub-advisory agreements with Marsico Capital are each referred to as an "Advisory Agreement" and collectively referred to as the "Advisory Agreements." The funds identified above are each referred to as a "Fund" and collectively referred to as the "Funds."
More specifically, at meetings held on November 5-6, 2009, the Board, including the Independent Trustees advised by their independent legal counsel, considered the factors and reached the conclusions described below relating to the selection of CMA and the Sub-Adviser and the re-approval of the Advisory Agreements. The Board also reviewed and considered a report prepared and provided by the Independent Fee Consultant (the "Fee Consultant") appointed by the Independent Trustees pursuant to an assurance of discontinuance entered into with the New York Attorney General ("NYAG") to settle a civil complaint filed by the NYAG relating to trading in mutual fund shares (the "NYAG Settlement"). The Fee Consultant's role was to manage the process by which management fees are negotiated so that they were negotiated in a manner that is at arms' length and reasonable. Th e Fee Consultant found that the fee negotiation process was, to the extent practicable, at arms' length and reasonable and consistent with the requirements of the NYAG Settlement. A summary of the Fee Consultant's report is available at http://www.columbiafunds.com.
In preparation for the November meetings, the Board met in August for review and discussion of the materials described below. The Investment Committee of the Board also met in June to discuss each Fund's performance with its respective portfolio manager(s). In addition to these meetings, the Investment Committee receives and discusses performance reports at its quarterly meetings. The Contracts Review Committee of the Board also provided support in managing and coordinating the process by which the Board reviewed the Advisory Agreements. The Board's review and conclusions are based on the comprehensive consideration of all information presented to it and are not the result of any single controlling factor. The Board evaluated all information available to it on a Fund-by-Fund basis, and its determinations were made separately in respect of each Fund.
Nature, Extent and Quality of Services. The Board received and considered various data and information regarding the nature, extent and quality of services provided to the Funds by CMA and the Sub-Adviser under the Advisory Agreements. The most recent investment adviser registration forms for CMA and the Sub-Adviser were made available to the Board, as were CMA's and the Sub-Adviser's responses to a detailed series of requests submitted by the Independent Trustees' independent legal counsel on behalf of such Trustees. The Board reviewed and analyzed those materials, which included, among other things, information about the background and experience of senior management and investment personnel of CMA and the Sub-Adviser.
In addition, the Board considered the investment and legal compliance programs of the Funds, CMA and the Sub-Adviser, including their compliance policies and procedures and reports of the Funds' Chief Compliance Officer.
The Board evaluated the ability of CMA and the Sub-Adviser, based on their resources, reputation and other attributes, to
35
attract and retain qualified investment professionals, including research, advisory and supervisory personnel. In this regard, the Board considered information regarding the nature of CMA's compensation structure applicable to portfolio managers and other key investment personnel.
Based on the above factors, together with those referenced below, the Board concluded that it was satisfied with the nature, extent and quality of the investment advisory services provided to each of the Funds by CMA and the Sub-Adviser.
The Board noted that Bank of America, N.A., the parent company of the Adviser, had entered into an agreement to sell a portion of the asset management business of the Adviser to Ameriprise Financial, Inc. (the "Transaction"). The Board noted that the Transaction was expected to close in the spring of 2010 and that its review of the Advisory Agreements was separate and distinct from any analysis regarding new advisory or sub-advisory arrangements that may result from the closing of the Transaction.
Investment Advisory and Sub-Advisory Fee Rates and Other Expenses. The Board reviewed and considered the proposed contractual investment advisory fee rates both separately and together with the administration fee rates payable by the Funds to CMA for investment advisory services (the "Contractual Management Rates"). The Board also reviewed and considered the proposed contractual investment sub-advisory fee rates (the "Sub-Advisory Agreement Rates") payable by CMA to the Sub-Adviser for investment sub-advisory services. In addition, the Board reviewed and considered the proposed fee waiver/cap arrangements applicable to the Contractual Management Rates and considered the Contractual Management Rates after taking the waivers/caps into account (the "Actual Management Rates"). The Board noted that, on a complex-wide basis, CMA had reduced annual managemen t fees by at least $32 million per year pursuant to the NYAG Settlement. The Board also noted reductions in net advisory rates and/or total expenses of certain funds across the fund complex. Additionally, the Board received and afforded specific attention to information comparing the Contractual Management Rates and Actual Management Rates with those of the other funds in their respective Peer Groups (as defined below).
The Board reviewed and considered statistical information regarding each Fund's total expense ratio and its various components, including contractual advisory fees, actual advisory fees, actual non-management fees, Rule 12b-1 and non-Rule 12b-1 service fees, fee waivers/caps and/or expense reimbursements. The Board also reviewed comparisons of these fees to the expense information for the group of Funds determined by Lipper Inc. ("Lipper") to be most similar to a given Fund (the "Peer Group") and to the performance of a broader universe of relevant funds as determined by Lipper (the "Universe"), which comparative data was provided by Lipper, an independent provider of investment company data. The Board was provided with a description of the methodology used by Lipper to select the mutual funds in each Fund's Peer Group and Universe and considered potential i mprecision resulting from the selection methodology. For certain Funds, Lipper determined that the composition of the Peer Group and/or Universe for expenses would differ from the composition for performance to provide a more accurate basis of comparison. The Board also considered Lipper data that ranked each Fund based on: (i) each Fund's one- and three-year performance compared to actual management fees; and (ii) each Fund's one- and three-year performance compared to total expenses.
The Board concluded that the factors noted above supported the Contractual Management Rates and the Actual Management Rates, and the approval of the Advisory Agreements for all of the Funds.
With regard to the Sub-Advised Funds, the Board also reviewed the Sub-Advisory Agreement Rates, including comparative fee information provided by the Adviser and the Adviser's recommendation that the Board re-approve the Advisory Agreements with Marsico Capital. The Board also considered a breakpoint fee schedule charged by Marsico Capital for the Sub-Advised Funds, as well as a corresponding waiver of Contractual Management Rates, both of which were implemented on January 1, 2008. The Board concluded that the Sub-Advisory Agreement Rates are fair and equitable, based on its consideration of the factors described above.
The Fund-by-Fund discussion set forth below in "Fund-Specific Considerations for Certain Review Funds" provides additional information regarding those Funds highlighted as meeting agreed-upon criteria for warranting further review. Such criteria included, among other things, information relating to Actual Management Rates, total expense ratios and/or performance information, relative to a Fund's Peer Group and/or Universe.
36
Fund Performance. The Board considered the performance results for each of the Funds over multiple measurement periods. It also considered these results in comparison to the performance results of each Fund's Peer Group and Universe, as well as to each Fund's benchmark index. The Board also considered certain risk-adjusted performance data.
The Fund-by-Fund discussion set forth below in "Fund-Specific Considerations for Certain Review Funds" provides additional information regarding those Funds highlighted as meeting agreed-upon criteria for warranting further review. Such criteria included, among other things, information relating to Actual Management Rates, total expense ratios and/or performance information, relative to a Fund's Peer Group and/or Universe.
Profitability. The Board received and considered a detailed profitability analysis of CMA based on the Contractual Management Rates and the Actual Management Rates, as well as on other relationships between the Funds and other funds in the complex on the one hand and CMA affiliates on the other. The analysis included complex-wide and per-Fund information and a comparison of results using alternative allocation methodologies. The Board concluded that, in light of the costs of providing investment management and other services, the profits and other ancillary benefits that CMA and its affiliates received from providing these services were not unreasonable.
Economies of Scale. The Board received and considered information regarding whether there have been economies of scale with respect to the management of the Funds, whether the Funds have appropriately benefited from any economies of scale and whether there is potential for realization of any further economies of scale. Most particularly, CMA provided information showing that, as a percentage of fund assets, CMA's complex-wide revenues declined over a five-year period during which fund assets increased by 53% and the shareholder benefit over a four-year period has remained steady at approximately 33% of the Adviser's total profits. The Board concluded that any potential economies of scale are shared fairly with Fund shareholders, most particularly through breakpoints and fee waiver arrangements.
The Board acknowledged the inherent limitations of any analysis of an investment adviser's economies of scale, stemming largely from the Board's understanding that economies of scale are generally realized, if at all, by an investment adviser across a variety of products and services, not just with respect to a single fund.
Information About Services to Other Clients. The Board also received and considered information about the nature and extent of services and fee rates offered by CMA and the Sub-Adviser to their other clients, including separate accounts and institutional investors. In this regard, the Board concluded that, where the Contractual Management Rates, Sub-Advisory Agreement Rates and Actual Management Rates were appreciably above the range of the fee rates offered to other CMA and Sub-Adviser clients, based on information provided by CMA and the Sub-Adviser, the costs associated with managing and operating a registered investment company provided a justification for the higher fee rates charged to the Funds.
Other Benefits to CMA and the Sub-Adviser. The Board received and considered information regarding any "fall-out" or ancillary benefits received by CMA and its affiliates and the Sub-Adviser as a result of their relationship with the Funds. Such benefits could include, among others, benefits attributable to CMA's and the Sub-Adviser's relationships with the Funds (such as soft-dollar credits) and benefits potentially derived from an increase in CMA's and the Sub-Adviser's business as a result of their relationship with the Funds (such as the ability to market to shareholders other financial products offered by CMA and its affiliates or a Sub-Adviser).
The Board considered the effectiveness of the policies of the Funds in achieving the best execution of portfolio transactions, whether and to what extent soft dollar credits are sought and how any such credits are utilized, any benefits that may be realized by using an affiliated broker, the extent to which efforts are made to recapture transaction costs, and the controls applicable to brokerage allocation procedures. The Board also reviewed CMA's and the Sub-Adviser's methods for allocating portfolio investment opportunities among the Funds and other clients. The Board concluded that the benefits were not unreasonable.
Other Factors and Broader Review. As discussed above, the Board reviews materials received from CMA and the Sub-Adviser annually as part of the re-approval process under Section 15(c) of the 1940 Act. The Board also reviews and assesses the quality of the services the Funds receives
37
throughout the year. In this regard, the Board and its Committees review reports of CMA and the Sub-Adviser at each of its quarterly meetings, which include, among other things, Fund performance reports and presentations relating to such reports. In addition, the Board and its Committees confer with portfolio managers at various times throughout the year including, most particularly, at the June Investment Committee meeting.
Fund-Specific Considerations for Certain "Review" Funds. For certain Funds highlighted as meeting agreed-upon criteria for warranting further review, the Board engaged in further analysis with regard to approval of the Funds' Advisory Agreements. Such criteria included, among other things, information relating to Actual Management Rates, total expense ratios, and/or performance information relative to a Fund's Peer Group and/or Universe.
The Board engaged in further review of Columbia Marsico 21st Century Fund because its Actual Management Rate and total expense ratio were appreciably above the median range of its Peer Group and its performance over certain periods was appreciably below the median range of its Universe. However, the Board noted other factors such as the inherently higher cost structure of subadvised funds, the implementation of a group breakpoint structure and contractual advisory fee waivers in January 2008 for the Funds subadvised by Marsico Capital, the recent implementation of additional voluntary expense limitations and recent enhancements to Columbia's subadviser oversight process. Taking into account these matters and other factors considered, the Board concluded that the Fund's performance, Actual Management Rate and total expense ratio were acceptable.
Conclusion. After an evaluation of the above-described factors, and based on its deliberations and analysis of the information provided and alternatives considered, the Board, including all of the Independent Trustees, concluded that the compensation payable to CMA and the Sub-Adviser under the Advisory Agreements is fair and equitable. Accordingly, the Board unanimously re-approved the Advisory Agreements.
38
Board Consideration and Approval of Proposed Investment Advisory and Sub-Advisory Agreements
Even though the following description of the Board's consideration of investment advisory and, as applicable, sub-advisory agreements covers multiple funds and trusts, for purposes of this shareholder report, the description is only relevant as to the Fund.
At a meeting held on December 21, 2009, the Boards of Trustees (the "Boards") of Columbia Funds Series Trust, Columbia Funds Master Investment Trust, LLC and Columbia Funds Series Trust II (each a "Trust" and collectively the "Trusts") unanimously approved a new investment management services agreement with RiverSource Investments, LLC ("RiverSource") (the "Proposed Advisory Agreement") and new subadvisory agreements with Marsico Capital Management ("Marsico Capital"), MacKay Shields LLC ("Mackay Shields") and Brandes Investment Partners, L.P. ("Brandes") (each a "Proposed Subadvisory Agreement"), as applicable, for each Fund of the Trusts (each a "Fund" and collectively the "Funds"). As detailed below, the Trustees met on multiple occasions in advance of the December 21, 2009 meeting, held numerous discussions with the management teams of Columbia Management Advisors, LLC ("Columbia") and RiverSource, a subsidiary of Ameriprise Financial, Inc. ("Ameriprise") and reviewed and considered extensive materials in connection with the approval of the Proposed Advisory and Subadvisory Agreements.
Specifically, the Trustees of each Trust, including a majority of the Trustees who have no direct or indirect interest in the Proposed Advisory and Subadvisory Agreements and are not "interested persons" of the Trusts, as defined in the Investment Company Act of 1940, as amended (the "1940 Act") (the "Independent Trustees") reviewed and approved (i) the Proposed Advisory Agreement with RiverSource for each Fund and (ii) the Proposed Subadvisory Agreement for those Funds that currently have investment subadvisory agreements with Marsico Capital, Mackay Shields, and Brandes (the "Subadvised Funds") (Marsico Capital, MacKay Shields and Brandes are collectively referred to as the "Subadvisers"). Prior to approving the Proposed Advisory Agreements, the Trustees were presented with, and requested, received and evaluated, extensive materials about RiverSource, the sale of a portion of the asset management business of Columbia Managemen t Group, LLC to Ameriprise (the "Transaction") and related matters from RiverSource, Ameriprise and Columbia. In this regard, the Trustees reviewed RiverSource's responses to a series of detailed requests submitted by the Independent Trustees' independent legal counsel and by the Independent Fee Consultant (as defined below).
The Trustees also reviewed and considered information received in connection with their most recent consideration and reapproval in November 2009 of the current advisory agreement (the "Current Advisory Agreement") and current subadvisory agreement (the "Current Subadvisory Agreement"), as applicable, for each Fund, including information about the Subadvisers (the "Current Agreement Re-Approval Process"). Moreover, the Trustees and committees of the Boards met on several occasions, and received extensive materials, throughout the course of the year relating to the Current Agreement Re-Approval Process, which the Trustees considered relevant to their consideration and approval of the Proposed Advisory and Subadvisory Agreements. The Trustees also consulted with Fund counsel and with the Independent Trustees' independent legal counsel, who advised on the legal standards for consideration by the Trustees, and otherwise assisted the Trustees in their deliberations.
In advance of the meeting on December 21, 2009, the Trustees held several meetings, including meetings held in-person with representatives from RiverSource and Ameriprise on August 26, 2009, November 5-6, 2009, December 9-10, 2009 and December 14, 2009, and additional meetings with representatives of Columbia, to discuss the Transaction, RiverSource's plans and intentions regarding the Funds and various proposals that were being presented as a result of the Transaction, including the Proposed Advisory and Subadvisory Agreements. In addition to these meetings, telephonic meetings and discussions were held on several occasions between individual Trustees, members of the committees of the Boards, their independent legal counsel and representatives from RiverSource, Ameriprise and/or Columbia.
The Trustees also reviewed and considered a report prepared and provided by the Fee Consultant (the "Fee Consultant") appointed by the Independent Trustees pursuant to an assurance of discontinuance entered into by a predecessor to Columbia with the New York Attorney General ("NYAG") to settle a civil complaint filed by the NYAG relating to trading in mutual fund shares (the "NYAG Settlement"). The Fee Consultant's role was to manage the process by which management fees are negotiated so that they were negotiated in a manner that is at arms' length and reasonable. The Fee
39
Consultant found that the fee negotiation process was, to the extent practicable, at arms' length and reasonable and consistent with the requirements of the NYAG Settlement. A summary of the Fee Consultant's report is available at www.columbiafunds.com.
The following summarizes a number of the material factors considered by the Trustees in reaching their approvals and determinations with respect to the Proposed Advisory Agreements and Proposed Subadvisory Agreements. It is followed by a more detailed discussion of the Trustees' consideration of these and other factors considered relevant by the Trustees in their evaluation of the Proposed Advisory Agreements and Proposed Subadvisory Agreements. In voting to approve the Proposed Advisory and Subadvisory Agreements for each Fund, the Trustees also considered substantially the same factors, as relevant, and reached substantially the same conclusions in their approval of interim advisory and subadvisory agreements for each Fund.
(i) the terms and conditions of the Proposed Advisory Agreements compared to the terms and conditions of the Current Advisory Agreements, as described below;
(ii) the fact that each Fund's total advisory fees would remain the same;
(iii) the qualifications of the personnel of RiverSource, Ameriprise and the Subadvisers expected to provide advisory and administrative services to each Fund, including representations by Ameriprise regarding its retention of the same process for monitoring and evaluating portfolio management personnel for each Fund as currently used by Columbia;
(iv) the terms and conditions of the Proposed Subadvisory Agreements compared to the terms and conditions of the Current Subadvisory Agreements;
(v) the reputation, financial strength, regulatory and compliance histories and resources of RiverSource and Ameriprise, and the potential benefits to the Funds of the combination of RiverSource and Columbia, including that the Funds are expected to continue to have access to existing distribution channels and have the potential for expanded distribution of Fund shares, the expected depth and breadth of investment management capabilities, that there is not expected to be any diminution in the nature, quality and extent of services to be provided to the Funds under the Proposed Advisory Agreements and the potential for the realization of additional economies of scale over time and the potential of the Funds to share in, and benefit from, these economies, if any;
(vi) that Ameriprise has committed to refrain from imposing or seeking to impose, for a period of not less than two years after the closing of the Transaction (the "Closing"), any "unfair burden" (within the meaning of Section 15(f) of the 1940 Act) on any Fund;
(vii) the terms and conditions of certain other agreements and arrangements relating to the future operations of the Funds and their distribution channels, including the administrative services agreement and the new services and distribution agreement;
(viii) that the Trustees recently had completed the Current Agreement Re-Approval Process for each Fund and had determined that they were satisfied with the nature, extent and quality of services provided thereunder and that the management fee rates and (where applicable) subadvisory fee rates for each Fund were satisfactory;
(ix) that RiverSource was willing to commit to maintain net operating expense ratios at current levels for at least the period currently covered by Columbia's existing commitments;
(x) the capabilities of RiverSource and the Subadvisers with respect to compliance, including an assessment of RiverSource's compliance program by the Funds' Chief Compliance Officer;
(xi) that certain members of RiverSource's management and certain Columbia personnel that will be integrated into RiverSource and its affiliates as a result of the Transaction have substantial experience in integrating fund families; and
(xii) that Ameriprise and Bank of America Corporation would bear the costs of obtaining approvals of the Proposed Advisory and Subadvisory Agreements.
In their deliberations, the Trustees did not identify any single item that was paramount or controlling and individual Trustees may have attributed different weights to various
40
factors. The Trustees also evaluated all information available to them on a Fund-by-Fund basis, and their determinations were made separately in respect of each Fund.
Nature, Extent and Quality of Services to be Provided. The Trustees received and considered various data and information regarding the expected nature, extent and quality of services to be provided to the Funds by RiverSource and the Subadvisers under the Proposed Advisory and Subadvisory Agreements. The most recent investment adviser registration forms for RiverSource and each Subadviser were made available to the Boards, as well as extensive materials from RiverSource, Ameriprise and Columbia. The Trustees reviewed and analyzed these materials, which included, among other things, information about the background and experience of expected senior management of RiverSource and Ameriprise after the Closing. The Trustees considered RiverSource's ability to provide administrative services to the Funds, noting that while the aggregate scope of advisory an d administrative services was not expected to change following the Closing, the allocation of services was expected to shift, to a limited extent, such that administrative services will be provided under a new administrative services agreement. The Trustees considered, among other things, the capacity and quality of RiverSource's and the Subadvisers' investment management, research and trade execution capabilities and other resources that would be dedicated to performing services for the Funds. The Trustees also considered matters related to RiverSource's and the Subadvisers' compliance programs and compliance records, including RiverSource's portfolio transaction policies and procedures. The Trustees discussed with senior management personnel their ability to administer and oversee outside service providers to the Funds and their shareholders and were satisfied with management's processes for providing services and overseeing and reviewing services to be rendered by outside sources.
In evaluating the services to be provided under the Proposed Advisory and Subadvisory Agreements, the Trustees factored in their extensive discussions with representatives of Columbia, RiverSource and Ameriprise at the meetings referenced above regarding the management of each Fund. The Trustees considered representations by Ameriprise that it was expected that there will be no diminution in the nature and quality of services provided to the Funds. The Trustees noted that Columbia Management Group's current President, Columbia's current Chief Investment Officer and Columbia's current President, were expected to continue to serve the Funds in similar capacities after the Closing. With respect to portfolio management, the Trustees reviewed information regarding the deliberative process for selecting portfolio management personnel to continue servicing the Fund s after the Closing, including the expected role of Columbia's Chief Investment Officer in evaluating and selecting portfolio management personnel for each Fund utilizing Columbia's current analytical model for evaluating portfolio managers. In this regard, the Trustees also weighed representations by Ameriprise that this investment management evaluative process was likely to result in a significant number of Columbia investment professionals and personnel currently responsible for management of the Funds to remain in place. The Trustees noted that the portfolio management evaluation and selection process was designed to optimize the portfolio management resources available to each Fund by having the ability to select investment personnel for the Funds from the combined organization. Similarly, the Trustees evaluated the ability of RiverSource and the Subadvisers, based on their respective resources, reputations and other attributes, to attract and retain qualified investment professionals. In this regard, t he Trustees considered information regarding the nature of the compensation structure applicable to portfolio managers and other key investment personnel.
The Trustees reviewed and considered information from Ameriprise and RiverSource regarding various contemplated service provider arrangements, including information regarding both immediate and potential future plans in respect of these arrangements. In this regard, the Trustees considered information regarding potential distribution, transfer agency and custody arrangements and the evaluation of fund accounting, financial reporting and valuation service model options, noting certain differences between Columbia's and RiverSource's current approaches, including that RiverSource has historically utilized services provided "in-house" or by its affiliates for fund accounting, financial reporting and valuation. The Trustees reviewed information from Ameriprise and RiverSource regarding the expectation for rationalized or harmonized fees as part of the integration after the Closing in order to develop consistent service fee schedules across the combined fund family. The Trustees noted Ameriprise's representations that, to the extent any such proposals were recommended to the Board after the
41
Closing, they would not result in an "unfair burden" (within the meaning of Section 15(f) of the 1940 Act) on any Fund.
In addition, the Trustees reviewed and evaluated materials and information received regarding the investment and legal compliance programs of the Funds, RiverSource and the Subadvisors, including their compliance policies and procedures and reports of the Funds' Chief Compliance Officer. In this regard, the Trustees considered that Columbia's current Chief Compliance Officer was expected to serve in the same role after the Closing.
The Trustees also noted that Ameriprise and certain of its affiliates have been involved in a number of legal, arbitration and regulatory proceedings, including routine litigation, class actions, and governmental actions, concerning matters arising in connection with the ordinary conduct of their business activities, and that Ameriprise indicated that neither Ameriprise nor any of its affiliates are the subject of any pending legal, arbitration or regulatory proceedings that are likely to have a material adverse effect on the Funds or the ability of Ameriprise or its affiliates, including RiverSource to provide services to the Funds.
Based on the foregoing and other information considered relevant, the Trustees concluded that, overall, they were satisfied with assurances from Columbia, RiverSource, Ameriprise and the Subadvisers as to the expected nature, extent and quality of services to be provided to each Fund under the Proposed Advisory and Subadvisory Agreements.
Investment Advisory and Subadvisory Fee Rates and Other Expenses. The Trustees reviewed and considered the proposed contractual investment advisory fee rates to be paid by each Fund to RiverSource for investment management services both separately and together with the administration fee rates to be paid by the Funds to RiverSource (the "Contractual Management Rates"), which are the same as the separate and aggregate advisory and administrative fee rates currently paid by each Fund to Columbia. The Trustees also reviewed and considered the proposed subadvisory fee rates and the fee arrangements under the Proposed Subadvisory Agreements, respectively, which are also the same as those currently in effect under the Current Subadvisory Agreements. In addition to the materials provided by Columbia, RiverSource provided information regarding the current fee s for each of the RiverSource funds and other relevant institutional accounts. The Trustees reviewed and considered the proposed fee waiver/cap arrangements applicable to the Contractual Management Rates and considered the Contractual Management Rates after taking the waivers/caps into account (the "Actual Management Rates"). In this regard, the Trustees noted that RiverSource had committed to maintain the Funds' current expense limitation and waiver arrangements (both contractual and voluntary). The Trustees considered the potential that, after the Closing, RiverSource would propose a common fee and expense structure for the combined fund family, subject to the commitment that Ameriprise will not seek any change that would result in an "unfair burden" on any Fund. The Trustees also considered the report prepared and provided by the Fee Consultant. Additionally, the Trustees received and afforded specific attention to information provide d in connection with the Current Agreement Re-Approval Process, comparing the Contractual Management Rates and Actual Management Rates with those of other funds in each Fund's Peer Group (as defined below).
During the Current Agreement Re-Approval Process, the Trustees reviewed and considered statistical information regarding each Fund's total expense ratio and its various components, including contractual advisory fees, actual advisory fees, actual nonmanagement fees, Rule 12b-1 and non-Rule 12b-1 service fees, fee waivers/caps and/or expense reimbursements. The Trustees also reviewed comparisons of these fees to the expense information for the group of Funds that was determined by Lipper Inc. ("Lipper") to be the most similar to a given Fund (the "Peer Group") and to the performance of a broader universe of relevant funds as determined by Lipper (the "Universe"), which comparative data was provided by Lipper, an independent provider of investment company data.
The Trustees were provided with a description of the methodology used by Lipper to select the mutual funds in each Fund's Peer Group and Universe and reviewed the degree of comparability resulting from the selection methodology. For certain Funds, Lipper determined that changing the composition of the Peer Group and/or Universe for expenses from that used for performance would provide a more accurate basis of comparison. The Trustees also considered Lipper data that ranked each Fund based on: (i) each Fund's one- and three-year performance compared to actual management fees;
42
and (ii) each Fund's one- and three-year performance compared to total expenses.
For each Fund, except as otherwise described in the Fund-specific discussion below, the Trustees noted that they had concluded during the Current Agreement Re-Approval Process that the Contractual Management Rates, the Actual Management Rates and the total expense ratio were at acceptable levels in light of the quality of services provided to the Fund and in comparison to such Fund's Peer Group and Universe, as applicable; that the advisory fee rate would not be increased for any Fund; that Ameriprise and RiverSource had represented that the overall expenses for each Fund were not expected to be adversely affected by the Transaction; and that RiverSource had committed to maintain the Funds' current expense limitation or waiver arrangements (both contractual and voluntary).
Based on the foregoing, other relevant information received and the additional information described in the Fund-specific discussion below, as applicable, the Trustees concluded that the Contractual Management Rates, the Actual Management Rates and the total expense ratio were acceptable.
Fund Performance. The Trustees reviewed detailed performance information for each Fund at various Board and committee meetings during the year in addition to the additional performance information that they reviewed and evaluated in connection with the Transaction. The Trustees also reviewed and evaluated detailed performance information for each Fund in connection with the Current Agreement Re-Approval Process. The Trustees considered the performance results for each of the Funds over multiple measurement periods. They also considered these results in comparison to the performance results of each Fund's Peer Group and Universe, as well as to each Fund's benchmark index. The Boards also noted certain risk-adjusted performance data.
The Trustees also reviewed and evaluated information and data regarding the investment performance record of RiverSource in managing funds with investment strategies generally similar to those of the Funds, as applicable. Investment performance for such funds was provided for a wide range of periods.
The Trustees recognized that the investment performance record of RiverSource in managing funds with similar objectives may be less relevant to their deliberations in situations where the current portfolio managers of Columbia are expected to continue managing a particular Fund following the Closing. They also recognized that for each Fund, it is not possible to predict with certainty what effect, if any, consummation of the Transaction will have on the future performance of the Funds, noting in particular that past investment performance is no assurance of future results. The Fund-by-Fund discussion set forth below provides additional information regarding those Funds highlighted as meeting agreed-upon criteria for warranting further review. Such criteria included, among other things, information relating to Actual Management Rates, total expense ratios and /or performance information, relative to a Fund's Peer Group and/or Universe.
Costs of Services to be Provided and Profitability. In considering the costs of services to be provided by RiverSource and the Subadvisers under the Proposed Advisory Agreement and Proposed Subadvisory Agreement, as applicable for each Fund, and the projected range of profitability to RiverSource and the Subadvisers from their relationships with the Funds, the Trustees considered, among other things, that there would be no increase in advisory or subadvisory fee rates under the Proposed Advisory and Subadvisory Agreements. The Trustees further noted, with respect to RiverSource, that it was not possible to predict with certainty how RiverSource's profitability would be affected by becoming the investment adviser to the Funds but, as a general matter, they were satisfied, based on their review of RiverSource's projected range of profitability assuming completion of the Transaction, that this projected profitability from their relationship with the Funds would not be excessive. The Trustees based their review, in part, on information regarding RiverSource's current profitability in managing the RiverSource Funds and the information available to the Trustees with respect to RiverSource's expense budgeting process. The Trustees also noted that they would have ongoing opportunities to address RiverSource's profitability in the future based on actual results. The Trustees did not consider separate profitability information with respect to the Subadvisers, as their profitability from their relationships with the Funds was not a material factor in determining whether to approve the Proposed Subadvisory Agreements. The Trustees also noted that the subadvisory fees paid to the Subadvisers, none of which is affiliated with Columbia, had previously been negotiated on an arms' length basis.
43
The Trustees also reviewed information about the financial condition of RiverSource and the Subadvisers and were satisfied that RiverSource and the Subadvisers have adequate resources to perform the services required under the Proposed Advisory and Proposed Subadvisory Agreements.
Subject to the limitations noted above, the Trustees concluded that they were satisfied that RiverSource's projected range of future profitability, and each Subadviser's historical profitability, from their relationship with each Fund, as relevant, were not excessive.
Economies of Scale. The Trustees received and evaluated information regarding the potential to realize economies of scale with respect to management of the Funds, whether the Funds would appropriately benefit from any economies of scale and whether there was any potential for realization of further economies of scale in connection with the Transaction. The Trustees noted that the current and proposed investment advisory fee rates for most of the Funds contain breakpoints that reduce the fee rate on assets above specified levels. The Trustees noted that RiverSource had indicated that no changes to the Funds' breakpoint arrangements were proposed to be made at this time. In light of these factors and noting that it was not possible to evaluate with certainty if and how the Transaction would produce any immediate opportunities for additional economies of scale, the Trustees concluded that each Fund's breakpoint arrangements were acceptable. The Trustees also recognized that the Funds may benefit from certain economies of scale over time from becoming a part of the larger RiverSource fund complex, based on potential future synergies of operations, potential fee harmonization/rationalization initiatives and potential future Fund mergers. The Trustees noted, in particular, RiverSource's acknowledgement of the principle that the Funds should share in certain economies of scale if realized by RiverSource. In addition, the Trustees evaluated the likelihood that there would be potential Fund mergers after the Closing. The Trustees noted that any such potential Fund mergers, if approved, could result in the achievement of additional breakpoints for Funds that have implemented breakpoint fee schedules. The Trustees also noted that they expect to consider economies of scale from time to time following the Closing and thus be in a position to evaluate any additional e conomies of scale.
The Trustees acknowledged the inherent limitations of any analysis of an investment adviser's economies of scale, stemming largely from the Trustees' understanding that economies of scale are generally realized, if at all, by an investment adviser across a variety of products and services, not just with respect to a single fund.
Information About Investment Management Services to Non-Mutual Fund Clients. The Trustees also received and reviewed information about the nature and extent of services and fee rates offered by Riversource and the Subadvisers to the Funds compared with other clients with similar accounts, including separate accounts and institutional investments. The Trustees noted that the Funds may receive services different from those offered to other clients of RiverSource and the Subadvisers and concluded that the advisory fee rates under the Proposed Advisory Agreements and the subadvisory fee rates under the Proposed Subadvisory Agreements were not excessive, given the nature and extent of services expected to be offered and other factors, including the Trustees' review of Lipper data.
Other Benefits to RiverSource and the Subadvisers. The Trustees received and reviewed information regarding any expected "fall-out" or ancillary benefits to be received by RiverSource and its affiliates and by the Subadvisers as a result of their relationships with the Funds.
Among other things, the Trustees noted that RiverSource would benefit from soft dollar arrangements using portfolio brokerage of each Fund that invests in equity securities. The Trustees also noted that the Subadvisers also had benefited from, and expected to continue to benefit from, soft dollar arrangements using portfolio brokerage of the Subadvised Funds. The Trustees acknowledged RiverSource's representation that none of its affiliated broker dealers was expected to provide brokerage services to any Fund, but noted that broker-dealer affiliates of RiverSource will receive distribution related fees from the Funds in respect of shares held in certain accounts, and that such Funds' distributor (which will also become a subsidiary of RiverSource following the closing of the Transaction) retains a portion of the distribution related fees from the Funds and receives a portion of the sales charges on sales or redemptions of certai n classes of shares of the Funds. The Trustees recognized that RiverSource's and the Subadvisers' profitability would be somewhat lower without these benefits. The Trustees
44
concluded that RiverSource and the Subadvisers may derive reputational benefits from their association with the Funds. The Trustees also noted, however, that such benefits were difficult to quantify with certainty.
Fund-Specific Considerations for Certain "Review" Funds. During the Current Agreement Re-Approval Process, a limited number of Funds were highlighted as meeting agreed-upon criteria for warranting further review. Such criteria included, among other things, information relating to Actual Management Rates, total expense ratios and/or performance information, relative to a Fund's Peer Group and/or Universe. For such "review" Funds, the Trustees engaged in further analysis with regard to the approval of the Funds' Current Advisory Agreements. For each such Fund, the Trustees subsequently considered the impact of transitioning investment management responsibilities to RiverSource.
The Trustees engaged in further review of Columbia Marsico 21st Century Fund because its Actual Management Rate and total expense ratio were appreciably above the median range of its Peer Group and its performance over certain periods was appreciably below the median range of its Universe. However, the Trustees noted other factors such as the inherently higher cost structure of subadvised funds, the implementation of a group breakpoint structure and contractual advisory fee waivers in January 2008 for the Funds subadvised by Marsico Capital, the recent implementation of additional voluntary expense limitations and recent enhancements to Columbia's subadviser oversight process. Taking into account these matters and other factors considered, the Trustees concluded that the Fund's performance, Actual Management Rate and total expense ratio were, at this time, acceptable, under the circumstances.
Conclusion. After an evaluation of the above-described factors and based on its deliberations and analysis of the information provided and alternatives considered, each Board, including all of the Independent Trustees, concluded that approval of the Proposed Advisory and Subadvisory Agreements was in the best interests of each of the Funds and its shareholders. Accordingly, the Boards unanimously approved the Proposed Advisory and Subadvisory Agreements.
45
Summary of Management Fee Evaluation by
Independent Fee Consultant
EXCERPTS FROM REPORT OF INDEPENDENT FEE CONSULTANT TO THE FUNDS SUPERVISED BY THE COLUMBIA NATIONS BOARD
Prepared Pursuant to the February 9, 2005
Assurance of Discontinuance among the
Office of Attorney General of New York State,
Columbia Management Advisors, LLC, and
Columbia Management Distributors, Inc.
November 12, 2009
I. Overview
On February 9, 2005, Columbia Management Advisors, LLC ("CMA") and Columbia Management Distributors, Inc.1 ("CMD") agreed to the New York Attorney General's Assurance of Discontinuance ("AOD"). Among other things, the AOD stipulates that CMA may manage or advise a Columbia Fund ("Columbia Fund" and, together with some or all of such funds, the "Columbia Funds") only if the Independent Members of the Columbia Fund's Board of Trustees appoint a Senior Officer or retain an Independent Fee Consultant ("IFC") who is to manage the process by which proposed management fees are negotiated. The AOD further stipulates that the Senior Officer or IFC is to prepare a written annual evaluation of the fee negotiation process.
With effect from January 1, 2007, the Independent Members of the Board of Trustees for certain Columbia Funds known collectively as the "Nations Funds" (together with the other members of that Board, the "Trustees") retained me as IFC for the Nations Funds.2 In this capacity, I have prepared the fifth annual written evaluation of the fee negotiation process. As was the case with the 2007 and 2008 reports, my immediate predecessor as IFC, John Rea, provided invaluable assistance in the preparation of this year's report.
A. Role of the Independent Fee Consultant
The AOD charges the IFC with "managing the process by which proposed management fees ... to be charged the Columbia Fund are negotiated so that they are negotiated in a manner which is at arms' length and reasonable and consistent with this Assurance of Discontinuance." The AOD also provides that CMA "may manage or advise a Columbia Fund only if the reasonableness of the proposed management fees is determined by the Board of Trustees ... using ... an annual independent written evaluation prepared by or under the direction of ... the Independent Fee Consultant." Therefore, the AOD makes clear that the IFC does not supplant the Trustees in negotiating management fees with CMA, nor does the IFC substitute his or her judgment for that of the Trustees with respect to the reasonableness of proposed fees or any other matter that is committed to the business judgmen t of the Trustees.
B. Elements Involved in Managing the Fee Negotiation Process
In preparing the report required by the AOD, the IFC must consider at least the following six factors set forth in the AOD:
1. The nature and quality of CMA's services, including the Fund's performance;
2. Management fees (including any components thereof) charged by other mutual fund companies for like services;
3. Possible economies of scale as the Fund grows larger;
4. Management fees (including any components thereof) charged to institutional and other clients of CMA for like services;
5. Costs to CMA and its affiliates of supplying services pursuant to the management fee agreements, excluding any intra-corporate profit; and
6. Profit margins of CMA and its affiliates from supplying such services.
C. Organization of the Annual Evaluation
This report, like last year's, focuses on the six factors and contains a section for each factor except that CMA's costs and profits from managing the Funds are treated in a single section. In addition to a discussion of these factors, the report offers recommendations to improve the fee review process in future years. A review of the status of recommendations made in the 2008 Report is being provided separately with the materials for the November meeting.
1 CMA and CMD are subsidiaries of Columbia Management Group, LLC ("CMG"), and are the successors to the entities named in the AOD.
2 I have no material relationship with Bank of America, CMG or any of its affiliates, aside from serving as IFC, and I am aware of no material relationship with any of their affiliates. I retained John Rea, an independent economic consultant, to assist me with this report.
Unless otherwise stated or required by the context, this report covers only the Nations Funds, which are also referred as the "Funds."
46
II. Summary of Findings
A. General
1. Based upon my examination of the information supplied by CMG in the light of the six factors set forth in the AOD, I conclude that the Trustees have the relevant information necessary to evaluate the reasonableness of the proposed management fees for each Nations Fund, subject to the following: on September 30, 2009, Ameriprise Financial, Inc. ("Ameriprise") announced that it had agreed to purchase the investment management business of CMG with the exception of its cash and liquidity management business which includes the Nations money market Funds. As a result, the Trustees requested information from CMG as to the plans of CMG and its parent with respect to the provision of investment management services to those Funds after the consummation of the proposed transaction. As of the date of this report, that in formation has not yet been provided. However, as the transaction is not expected to close until the spring of 2010, the Trustees concluded that they would have ample opportunity to take appropriate steps with respect to the investment management agreements of the money market Funds, including invoking the 60-day termination provisions of those agreements, in response to the information to be provided by CMG and reviewed by the IFC.
In my view, the process by which the proposed management fees of the Funds have been negotiated in 2009 thus far has been, to the extent practicable, at arms' length and reasonable and consistent with the AOD.
B. Nature and Quality of Services, Including Performance
3. The performance of the Funds was relatively strong for the measuring periods ending March 31, 2009. Between one-third and nearly one-half of the Funds were ranked in either the first or second quintiles in the one-, three-, five-, and 10-year periods, and no more than 8% were in the fifth quintile for these periods. Overall, the performance was stronger in the two longer periods.
4. The strongest performing groups over the one-, three-, and five-year periods were active equity, quantitative strategies, and, to a lesser extent, money market Funds. Sub-advised Funds were the weakest performers, with over 60% of the Funds in the bottom two quintiles in the one- and three-year periods. For the same two periods, no more than 15% percent of the sub-advised Funds were in the top two quintiles. Almost half of fixed-income Funds ranked in the bottom two quintiles in the one- and three-year periods.
5. Overall performance of the Funds was less robust in 2009 than in 2008 and 2007 for the one- and three-year performance periods. For example, 62% of the Funds were in the top two quintiles in 2007 for the one-year period compared with 33% in 2009. The ranks of those in the bottom two quintiles rose significantly between 2007 and 2009, led by money market and fixed-income Funds in the one- and three-year periods. For the three-year period, there was a similar trend with respect to sub-advised Funds.
6. The performance of the active equity Funds against their benchmarks was strong for the one-, three-, and five-year performance periods. In contrast, more than half of the sub-advised Funds failed to beat their benchmarks on a net basis in the one- and three-year periods. The fixed-income Funds consistently produced gross returns below those of their benchmarks. Lipper quintile rankings of the actively managed equity Funds are highly correlated with their performance against their benchmarks in the sense that net returns in excess of the benchmark appear necessary to achieve a ranking in one of the top three quintiles. No such correlation was observed for fixed-income and quantitative strategies Funds.
7. The equity Funds' overall performance adjusted for risk was mixed. Based upon three-year returns, less than 40% of the equity Funds had a combination of risk-adjusted and unadjusted returns that placed them in the top half of their performance universes; 60% were in the bottom half of their universes. About 30% of the fixed income Funds posted high returns and low risk relative to comparable funds. Over 60% of the fixed-income Funds took on more risk than the typical fund in their performance universes.
8. The industry-standard procedure used by Lipper that includes all share classes in the performance universe tends to bias a Fund's ranking upward within that universe. The bias occurs because either no-12b-1 fee or low-12b-1 fee share classes of the Nations Funds are compared with funds in performance universes that
47
include all share classes of multi-class funds with 12b-1 fees of up to 100 basis points. Correcting this bias by limiting the performance universe to classes of comparable funds with low or no 12b-1 fees (a "filtered universe") lowers the relative performance for the Funds, but generally not to a material extent. The filtering process, however, did identify two Funds for further review that had not been so identified using unfiltered universes.
9. A small number of Funds have consistently underperformed over the past five years. The exact number depends on the criteria used to evaluate longer-term performance. For example, six different Funds have had below-median performance in at least four out of the five years between 2005 and 2009 for either the one- or three-year performance periods from 2005 to 2009. If the threshold were the 60th percentile, only two Funds would have satisfied the criteria.
10. The services performed by CMG professionals beyond portfolio management, such as compliance, legal, information technology, risk management, finance, and fund administration, are critical to the success of the Funds and appear to be of high quality.
C. Management Fees Charged by Other Mutual Fund Companies
11. The Funds' management fees and total expenses are generally low relative to those of their peers, with over half the Funds ranking in the most favorable two quintiles. For total expenses, slightly more than one-quarter are in the bottom two quintiles, while slightly less than two-fifths are in the bottom two quintiles for actual management fees. Fixed-income and quantitative strategies Funds have the lowest fees and expenses relative to their peers. The sub-advised Funds account for the majority of Funds in the fifth quintile for both management fees and total expenses.
12. The distribution of management fee rankings has changed little over the past three years, while the distribution of total expense rankings has moved in the direction of higher expenses. The most notable change involving total expenses has been a shift in the number of Funds from the first to the second quintile.
13. The management fees of the non-subadvised Funds are generally in line with those of Columbia Funds supervised by the Atlantic Board of Trustees (the "Atlantic Funds"). The sub-advised large cap equity, international equity, and high yield Funds, however, generally have higher management fees than those of comparable Atlantic and non-subadvised Funds.
14. The implementation of the new program of voluntary expense limits appears to have been associated, on balance, with less favorable expense rankings. This result reflects increases in expense limits for certain Funds, the removal of fee waivers, and the shift of certain expenses from CMA to the Funds. The decline in expense rankings is less significant, however, than CMA projected in December 2008.
D. Trustees' Advisory Contract Review Process
15. The Trustees' evaluation process identified 22 Funds in 2009 for further review based upon long-standing criteria relating to their relative performance or expenses or both. When compared in filtered universes, two more Funds met the criteria for further review. At the November meeting, CMG provided further information about each of those Funds to assist the Trustees in their evaluation.
E. Potential Economies of Scale
16. CMG presented to the Trustees its analysis of the sources and sharing of potential economies of scale. CMG views economies of scale as arising at the complex level and would regard estimates of scale economies for individual funds as unreliable. In its analysis, CMG did not identify specific sources of economies of scale or provide any estimates of any economies of scale that might arise from future asset growth. CMG's analysis included measures taken by the Trustees and CMG that seek to share any potential economies of scale through breakpoints in management fee schedules, the establishment of expense limits for each Fund, enhanced shareholder services, fund mergers, and operational consolidation.
17. An examination of the contractual fee schedules for five Nations Funds shows that the schedules for Small Cap II, Municipal Reserves, and Treasury Reserves compare favorably with those of their competitors, while the subadvised Marsico Growth and High Yield VS Funds have schedules generally above those of their peers, including funds that do not have a sub-adviser. The group fee with
48
breakpoints that characterizes the money market Fund schedules is not typically found among competitors, nearly all of which have flat fee schedules.
F. Management Fees Charged to Institutional Clients
18. CMG has provided Trustees with comparisons of mutual fund management fees and institutional fees based upon standardized fee schedules and upon actual fees. The results show that, consistent with industry practice, actual and scheduled institutional fees are generally, but not always, lower than the Funds' management fees. CMG provided additional data this year demonstrating that at small asset levels, the effective fee of certain Funds may be equal to or less than institutional fee levels at those asset levels, due to the effect of expense limits on small funds with high gross expenses. CMG also analyzed the differences between the services provided and risks borne on the one hand by a manager of mutual funds and on the other by institutional advisers, and suggested that these differences should be kept in mind when Trustees review the reasonableness of the Funds' management fees.
G. Revenues, Expenses, and Profits
19. The activity-based cost allocation methodology employed by CMG to allocate costs, both direct and indirect, for purposes of calculating Fund profitability is thoughtful and detailed. This year, CMG further refined the technique by allocating additional indirect expenses on an activity basis.
20. The materials provided on CMG's revenues and expenses with respect to the Funds and the methodology underlying their construction form a sufficient basis for Trustees to evaluate the expenses of and profitability to CMG arising out of its relationships with the Funds.
21. CMG provided a firm-wide pro forma 2009 income statement demonstrating the effect of market events beginning in the fourth quarter of 2008 on its revenues and profitability to provide an additional perspective on calendar 2008 profitability data.
22. In 2008, CMG's pre-tax pre- and post-distribution margins on the Nations Funds were above the industry mean and median, based on limited data available for publicly held mutual fund managers and excluding the costs of CMG's money market capital support programs. However, as is to be expected in a 63-Fund complex, some Nations Funds had relatively high pre-tax profit margins in 2008, when calculated solely with respect to management revenues and expenses, while other Nations Funds operated at a loss. There is a positive relationship between Fund size and profitability to CMG, with smaller Funds generally operating at a loss to CMG.
23. CMG pays a fixed percentage of its management fee revenues to an affiliate, U.S. Trust, Bank of America Private Wealth Management, with respect to assets of its clients invested in Nations Funds to compensate it for services it performs with respect to those client assets and for the effect of state law limitations on affiliates charging multiple fees. Based on our analysis of the services provided by this affiliate, we have concluded that all payments other than those for sub-transfer agent or sub-accounting services should be treated as a distribution expense.
III. Recommendations
1) Criteria for review. The Trustees may wish to consider modifying the criteria for identifying a Fund for further review (a "Review Fund") to include criteria that focus exclusively on performance. They may also wish to consider whether it would be useful to apply CMG's own internal monitoring standards for Fund performance to the contract review process, or whether such criteria are more relevant to their ongoing investment oversight.
2) Presentation of Review Fund discussion. CMG should consider whether it could more systematically present in one discussion all relevant information regarding each Review Fund, which is now split into several different portions of the 15(c) materials. For any Fund that has been a Review Fund in consecutive years, CMG should address under what circumstances it could reasonably be anticipated that the Fund would lose that status.
3) Refinement of tax-exempt performance data. Certain single-state tax-exempt Funds compete in extremely small universes and are compared to a multi-state benchmark of uncertain relevance. Notwithstanding the difficulties, CMG should work to improve the reliability of the calculation of relative performance of these Funds. If that is not possible, CMG should provide guidance on how the Trustees should judge the quality of CMG's management of these Funds.
49
4) Development of risk metrics for asset-allocation, tax-exempt, and money market Funds. CMG has developed and shared with the Trustees quantitative risk metrics comparing equity and taxable fixed-income Funds against their peers. However, reliable risk metrics have not been developed for asset-allocation, tax-exempt fixed income, and money market Funds. We urge CMG to continue its efforts to provide reliable risk measures for these categories of Funds, especially in the cases of asset-allocation and money market funds, because their investors are likely to be motivated at least in part by a desire to manage risk.
5) Profitability data. For any period during which CMG is an affiliate of U.S. Trust, Bank of America Private Wealth Management, CMG should continue to present to the Trustees the profitability of each Fund, each investment style and each complex (of which Nations is one) calculated as follows:
a. Management-only profitability should be calculated without reference to any Private Bank expense.
b. Profitability excluding distribution (which essentially covers the management and transfer agency functions) should be adjusted by removing from the expense calculation any portion of the Private Bank payment not attributable to the performance by the Private Bank of sub-transfer agency or sub-accounting functions.
c. Total profitability, including distribution: No adjustment for Private Bank expenses should be made, because all such expenses represent legitimate fund expenses to be taken into account in calculating CMG's profit margin including distribution.
d. Distribution only: This should include all Private Bank expenses other than those attributable to sub-transfer agency services.
6) Contractual fee analysis. This year CMG presented a new Lipper report comparing the contractual management fees of Funds with those of competitors in similar investment styles. However, the reliability of the conclusion—that Fund management fee breakpoints compared favorably with competitive fee rates—was limited by the use of competitive funds at all asset levels. The sponsors of a $100 million mutual fund may not have given much thought to breakpoints at $5 billion; therefore, that fund's contractual fee at that level is unlikely to compare favorably with that of a $5 billion Fund. Limiting the competitors to the Lipper expense group, whose constituents are similar in size to the rele vant Fund, would make the results more meaningful. In addition, the breakpoints of a select group of Nations Funds (which would differ each year) should continue to be compared to those of industry rivals to ensure that the Funds' breakpoint schedules remain within industry norms. As breakpoint schedules change relatively little each year, performing such a comparison for each Nations Fund each year would not be an efficient use of Trustee and CMG resources.
7) Pro forma profitability data. In any year in which CMG or the Trustees believe that the prior year's profitability is unlikely to be representative of current business results due to changes in markets or for any other reason, CMG should, consistent with this year's practice, prepare a pro forma income statement based on year-to-date actual data and reasonable projections used for its own business planning purposes.
8) Additional institutional data and analysis. While CMG provided a substantial amount of information on its institutional business, we suggest some additional items for future years: (a) profitability data for the institutional business in the format, and based upon the same allocation methodologies, used to present Fund profitability, (b) an explanation of how CMA sets institutional fee breakpoints, which normally begin at asset levels far lower than those found in Fund management fee breakpoints, and (c) distinguishing in all institutional fee materials fees of accounts acquired prior to the development of current fee schedules (so-called "legacy" accounts) from the fees of accounts launched after that time.
9) Management fee disparities. In any future study of management fees, CMG and the Nations Trustees should analyze the differences in management fee schedules. As part of that analysis, CMG should provide an explanation for any significant fee differences among comparable funds across fund families sponsored by CMG, such as differences in the management styles of different Funds included the same Lipper category. Finally, if CMG proposes a management fee change or an expense cap for
50
any mutual fund managed by CMA that is comparable to any Nations Fund, CMG should provide the Trustees with sufficient information about the proposal to allow the Trustees to assess the applicability of the proposed change to the relevant Nations Fund or Funds.
10) Explanation of data supplied to Lipper. Each year, as part of the 15(c) process, CMG retains Lipper to compare the fees and expenses of each Fund to a group of competitors. In many cases, CMG, with the approval of the Trustees, adjusts the actual expense data, which is based on the most recent full fiscal year of the Fund (and each competitive fund) to reflect changes in fees or expense limits that occurred during or after the relevant fiscal year. This improves the reliability and usefulness of the comparison. However, to ensure that the Trustees know when and how CMG adjusted the data, we recommend that CMG prepare a table listing for each Fund what adjustments were made, e.g., to reflect a new expense limitation of x basis points that commenced on y date.
11) Reduction of volume of paper documents submitted. The effort to streamline and better organize the data presented to the Trustees and the process by which that data was prepared and organized continued to be well-received by all parties. Notwithstanding past success, it is always appropriate to look for opportunities to reduce and simplify the presentation of 15(c) data. One possibility would be to remove the 127 pages of biographical data, most if not all of which the Trustees have previously seen as part of their ongoing investment oversight duties, from the paper volume and post it on the Internet-based document storage and retrieval system used by the Funds to provide reference data to Trustees.
Respectfully submitted,
Steven E. Asher
51
This page intentionally left blank.
Important Information About This Report
The fund mails one shareholder report to each shareholder address. If you would like more than one report, please call shareholder services at 1-800-345-6611 and additional reports will be sent to you. This report has been prepared for shareholders of Columbia Marsico 21st Century Fund.
A description of the policies and procedures that the fund uses to determine how to vote proxies and a copy of the fund's voting records are available (i) at www.columbiamanagement.com, (ii) on the Securities and Exchange Commission's website at www.sec.gov, and (iii) without charge, upon request, by calling 1-800-368-0346. Information regarding how the fund voted proxies relating to portfolio securities during the 12-month period ended June 30 is available from the SEC's website. Information regarding how the fund voted proxies relating to portfolio securities is also available from the fund's website, www.columbiamanagement.com.
The fund files a complete schedule of portfolio holdings with the SEC for the first and third quarters of each fiscal year on Form N-Q. The fund's Form N-Q is available on the SEC's website at www.sec.gov and may be reviewed and copied at the SEC's Public Reference Room in Washington, D.C. Information on the operation of the Public Reference Room may be obtained by calling 1-800-SEC-0330.
Please read and consider the investment objectives, risks, charges and expenses for any fund carefully before investing. For a prospectus which contains this and other important information about the fund, contact your Columbia Management representative or financial advisor or go to www.columbiamanagement.com.
Columbia Management Group, LLC ("Columbia Management") is the investment management division of Bank of America Corporation. Columbia Management entities furnish investment management services and products for institutional and individual investors. Columbia Funds are distributed by Columbia Management Distributors, Inc., member of FINRA, SIPC, part of Columbia Management and an affiliate of Bank of America Corporation.
Transfer Agent
Columbia Management Services, Inc.
P.O. Box 8081
Boston, MA 02266-8081
1-800-345-6611
Distributor
Columbia Management
Distributors, Inc.
One Financial Center
Boston, MA 02111
Investment Advisor
Columbia Management Advisors, LLC
100 Federal Street
Boston, MA 02110
53
Columbia Management®
One Financial Center
Boston, MA 02111-2621
PRSRT STD
U.S. Postage
PAID
Holliston, MA
Permit NO. 20
Columbia Management®
Columbia Marsico 21st Century Fund
Annual Report, February 28, 2010
©2010 Columbia Management Distributors, Inc.
One Financial Center, Boston, MA 02111-2621
800-345-6611 www.columbiafunds.com
SHC-42/34610-0210 (04/10) 10-M6D5U5
Columbia Management®
Annual Report
February 28, 2010
Columbia Small Cap Growth Fund II
| NOT FDIC INSURED | | May Lose Value | |
|
| NOT BANK ISSUED | | No Bank Guarantee | |
|
Table of Contents
| Fund Profile | | | 1 | | |
|
| Economic Update | | | 2 | | |
|
| Performance Information | | | 4 | | |
|
| Understanding Your Expenses | | | 5 | | |
|
| Financial Statements | | | | | |
|
| Investment Portfolio | | | 8 | | |
|
Statement of Assets and
Liabilities | | | 12 | | |
|
| Statement of Operations | | | 13 | | |
|
Statement of Changes in
Net Assets | | | 14 | | |
|
| Financial Highlights | | | 16 | | |
|
| Notes to Financial Statements | | | 20 | | |
|
Report of Independent Registered
Public Accounting Firm | | | 28 | | |
|
| Fund Governance | | | 29 | | |
|
Board Consideration and
Re-Approval of Current
Investment Advisory
Agreement | | | 33 | | |
|
Board Consideration and
Approval of Proposed
Investment Advisory
Agreement | | | 37 | | |
|
Summary of Management
Fee Evaluation by Independent
Fee Consultant | | | 44 | | |
|
Important Information About
This Report | | | 53 | | |
|
The views expressed in this report reflect the current views of the respective parties. These views are not guarantees of future performance and involve certain risks, uncertainties and assumptions that are difficult to predict, so actual outcomes and results may differ significantly from the views expressed. These views are subject to change at any time based upon economic, market or other conditions and the respective parties disclaim any responsibility to update such views. These views may not be relied on as investment advice and, because investment decisions for a Columbia Fund are based on numerous factors, may not be relied on as an indication of trading intent on behalf of any particular Columbia Fund. References to specific securities should not be construed as a recommendation or investment advice.
President's Message

Dear Shareholder:
As we previously announced, Bank of America, N.A. has reached a definitive agreement to sell Columbia Management's long-term asset management business to Ameriprise Financial, Inc. This includes the management of its equity and fixed-income mutual funds.
This transaction combines two leading asset management firms and will create one entity that is expected to rank as one of the top asset managers. It is anticipated that the combined U.S. asset management business will operate under the well-regarded Columbia Management brand. The combined U.S. asset management business will be led by Ted Truscott, currently president, U.S. asset management, annuities and chief investment officer, Ameriprise Financial. Michael A. Jones, currently president of Columbia Management, will serve as president, U.S. asset management. Colin Moore, chief investment officer at Columbia Management, will continue to serve in that role for the combined organization. I will also continue in my role as head of mutual funds, responsible for the delivery of mutual fund products and services to investors.
As a valued investor in Columbia funds, please know that our goal is to ensure a smooth transition and provide you with the highest quality products and services. We will work closely with colleagues at Ameriprise Financial to seek a seamless transition for our clients and to keep you informed as the transition progresses and key decisions are made. We want to assure you that the funds' portfolio managers continue to focus on providing uninterrupted service to Columbia fund shareholders. Columbia Management and Ameriprise Financial will operate independently until all required approvals, including fund board, fund shareholder and other client approvals, have been received and the transaction closes, which is expected to occur in the spring of this year.
Meanwhile, transition teams across the company have been formed to oversee integration efforts including rebranding initiatives, vendor and system consolidations and client communications. Throughout the transition, we seek to build on best practices from both legacy organizations with enhancements to productivity, quality and the delivery of world-class customer experiences.
Clearly, we have a lot of work ahead of us in 2010. We look forward to introducing our combined business with an even wider breadth of products and capabilities. Everyone at Columbia Management and Ameriprise Financial is excited about the opportunities for this combined organization. I share this optimism and believe it will position us as a best-in-class asset management business with the ability to deliver more for clients than ever before.
Sincerely,

J. Kevin Connaughton
President, Columbia Funds
Fund Profile – Columbia Small Cap Growth Fund II
Summary
g For the 12-month period that ended February 28, 2010, the fund's Class A shares returned 48.91% without sales charge.
g The fund underperformed both the Russell 2000 Growth Index1 and its peer group, the Lipper Small-Cap Growth Funds Classification.2
g While the fund participated in the recent market rally and achieved a strong double-digit return, an emphasis on higher-quality stocks caused the fund to fall behind its benchmark and its peer group average in an investment environment that favored lower-quality issues. Stock selection in the health care and consumer discretionary sectors also detracted from relative returns.
Portfolio Management
Daniele Donahoe has co-managed the fund since December 2005 and has been associated with the advisor or its predecessors since 2002.
Jon Michael Morgan has co-managed the fund since December 2005 and has been associated with the advisor or its predecessors since 2000.
Christian Pineno has co-managed the fund since October 2006 and previously from January 1997 to December 2005 and has been associated with the advisor or its predecessors since 1995.
Subject to satisfying various conditions to closing, effective on or about May 1, 2010, RiverSource Investments, LLC, a subsidiary of Ameriprise Financial, Inc., is expected to become the investment advisor to the fund and change its name to Columbia Management Investment Advisers, LLC. Please see the fund's prospectus dated July 1, 2009, including the supplements thereto, for more information regarding the expected change in investment advisor and any related changes to the portfolio management of the fund.
1The Russell 2000 Growth Index measures the performance of those Russell 2000 Index companies with higher price-to-book ratios and higher forecasted growth values. Indices are not available for investment, are not professionally managed and do not reflect sales charges, fees, brokerage commissions, taxes or other expenses of investing. Securities in the fund may not match those in an index.
2Lipper Inc., a widely respected data provider in the industry, calculates an average total return (assuming reinvestment of distributions) for mutual funds with investment objectives similar to those of the fund. Lipper makes no adjustment for the effect of sales loads.
Performance data quoted represents past performance and current performance may be lower or higher. Past performance is no guarantee of future results. The investment return and principal value will fluctuate so that shares, when redeemed, may be worth more or less than the original cost. Please visit www.columbiafunds.com for daily and most recent month-end performance updates.
Summary
1-year return as of 02/28/10
| | | | | +48.91% | |
|
 | | Class A shares
(without sales charge) | |
|
| | | +61.85% | |
|
 | | Russell 2000 Growth Index | |
|
Morningstar Style BoxTM
The Morningstar Style BoxTM reveals a fund's investment strategy. For equity funds, the vertical axis shows the market capitalization of the stocks owned, and the horizontal axis shows investment style (value, blend or growth). Information shown is based on the most recent data provided by Morningstar.
1
Economic Update – Columbia Small Cap Growth Fund II
Summary
For the 12-month period that ended February 28, 2010
g After a sharp decline, stock markets rebounded around the world, as measured by the S&P 500 Index and the MSCI EAFE Index.
| S&P Index | | MSCI Index | |
|
 | |  | |
|
g As investors grew more comfortable with risk, non-Treasury sectors of the bond market rebounded. The Barclays Capital Aggregate Bond Index delivered solid results. High-yield bonds were strong performers, as measured by the JPMorgan Developed BB High Yield Index.
Barclays
Aggregate
Index | | JPMorgan
Index | |
|
 | |  | |
|
After a deep and difficult recession, the U.S. economy regained its footing midway through calendar year 2009. Gross domestic product (GDP) turned positive in the third quarter of 2009, rising 2.2%, and then gained 5.6% in the fourth quarter according to the estimate released by the Bureau of Economic Analysis. Growth was primarily the result of federal government stimulus spending and a slowdown in inventory reductions. Hopes for a sustained recovery now depend on a variety of factors, including a rebound in consumer spending, an increase in revenues to keep business profits moving higher and a turnaround in the labor market.
The housing market showed some signs of improvement. Existing home sales fell late in the period, but remained above levels of one year ago. According to the National Association of Realtors, the inventory of houses for sale fell over the course of 2009. Housing prices remained unchanged during the past year, but that was progress compared to 2008. The average home price fell in 2008 and since then distressed properties, which accounted for an estimated 38% of sales in January 2010, have weighed on prices because they were heavily discounted.
In the beleaguered labor market, the good news was that there was less bad news. Businesses continued to shed jobs throughout the period, raising the unemployment rate as high as 10.2% in October 2009. However, the pace of job losses slowed markedly by the period's end. Compared to six figure losses of one year ago, 14,000 jobs were added to the labor market in January 2010 and only 14,000 were lost in February 2010.* The rate of unemployment at the end of the period was 9.7%.* Nevertheless, prospects for a quick recovery in the labor markets are dim. In fact, consumer confidence, as measured monthly by The Conference Board, an independent research organization, took a sharp dive in February. Consumers surveyed cited worsening business conditions and a bleaker outlook for the labor markets and income for their pessimism.
Manufacturing activity remained slow during the first few months of the period. However, a key measure—the Institute for Supply Management's Index—rose above 50 in July and remained well above 50 for the remainder of the period. A value above 50 tends to indicate that the economy is growing. Industrial production turned positive in January 2010, and durable goods orders took a big jump forward. Manufacturing capacity utilization inched upward to 72.6%.
Consumer spending registered both ups and downs during the 12-month period, but the trend at the end of the period was upward, even though personal income decreased in January 2010. In light of uncertainty about the economy and pressure on consumers from a number of sectors, the Federal Reserve Board (the Fed) kept a key short-term interest rate—the federal funds rate—close to zero throughout the period.
*Source: U.S. Bureau of Labor Statistics
2
Economic Update (continued) – Columbia Small Cap Growth Fund II
Stocks bottomed, then rebounded
Against a strengthening economic backdrop, a stock market rally that began in mid-March 2009 continued throughout the period. The U.S. stock market returned 53.62% for the 12-month period, as measured by the S&P 500 Index.1 Mid-cap stocks outperformed large and small-cap stocks and value stocks outperformed growth stocks by a solid margin, as measured by their respective Russell indices.2 Outside the U.S., stock market returns were even stronger. The MSCI EAFE Index,3 a broad gauge of stock market performance in foreign developed markets, gained 54.58% (net of dividends, in U.S. dollars) for the period. Emerging stock markets were caught in last year's downdraft, but they bounced back stronger than domestic or developed world markets in 2009 as their economic growth generally outpaced the developed world. The MSCI Emerging Markets Index4 returned 91.63% (net of dividends, in U.S. d ollars).
Bond returns ranged from solid to strong
As hopes for a recovery materialized, bonds from non-Treasury sectors delivered solid returns. The Barclays Capital Aggregate Bond Index5 returned 9.32%. Municipal bonds delivered returns that were in line with taxable investment-grade bonds even without factoring in potential tax advantages to investors in higher income tax brackets. The Barclays Capital Municipal Bond Index6 returned 9.98%. High-yield bond prices rebounded strongly in 2009. For the 12-month period covered by this report, the JPMorgan Developed BB High Yield Index7 returned 32.79%.
Past performance is no guarantee of future results.
1The Standard & Poor's (S&P) 500 Index tracks the performance of 500 widely held, large-capitalization U.S. stocks.
2The Russell 1000 Index tracks the performance of 1,000 of the largest U.S. companies, based on market capitalization. The Russell Midcap Index measures the performance of the 800 smallest companies in the Russell 1000 Index, which represents approximately 25% of the total market capitalization of the Russell 1000 Index. The Russell 2000 Index measures the performance of the 2,000 smallest companies in the Russell 3000 Index, which represents approximately 8% of the total market capitalization of the Russell 3000 Index. The Russell 3000 Growth Index measures the performance of those Russell 3000 Index companies with higher price-to-book ratios and higher forecasted growth values. The stocks in this index are also members of either the Russell 1000 Growth or the Russell 2000 Growth indexes. The Russell 3000 Value Index measures the performance of those Russell 3000 Index companies with lower price-to-book ratios and lower forecasted growth values. The stocks in this index are also members of either the Russell 1000 Value or the Russell 2000 Value indexes.
3The Morgan Stanley Capital International Europe, Australasia, Far East (MSCI EAFE) Index is a capitalization-weighted index that tracks the total return of common stocks in 21 developed-market countries within Europe, Australasia and the Far East.
4The Morgan Stanley Capital International Emerging Markets Index (MSCI EMI) is a free float-adjusted market capitalization index that is designed to measure equity market performance of emerging markets. As of June 2009, the MSCI Emerging Markets Index consisted of the following 22 emerging market country indices: Brazil, Chile, China, Colombia, Czech Republic, Egypt, Hungary, India, Indonesia, Israel, Korea, Malaysia, Mexico, Morocco, Peru, Philippines, Poland, Russia, South Africa, Taiwan, Thailand, and Turkey.
5The Barclays Capital Aggregate Bond Index is a market value-weighted index that tracks the daily price, coupon, pay-downs and total return performance of fixed-rate, publicly placed, dollar-denominated and non-convertible investment grade debt issues with at least $250 million par amount outstanding and with at least one year to final maturity.
6The Barclays Capital Municipal Bond Index is considered representative of the broad market for investment-grade, tax-exempt bonds with a maturity of at least one year.
7The JPMorgan Developed BB High Yield Index is an unmanaged index designed to mirror the investable universe of the U.S. dollar developed, BB-rated, high yield corporate debt market.
Indices are not available for investment, are not professionally managed and do not reflect sales charges, fees, brokerage commissions, taxes or other expenses of investing. Securities in the fund may not match those in an index.
3
Performance Information – Columbia Small Cap Growth Fund II
Performance data quoted represents past performance and current performance may be lower or higher. Past performance is no guarantee of future results. The investment return and principal value will fluctuate so that shares, when redeemed, may be worth more or less than the original cost. Please visit www.columbiafunds.com for daily and most recent month-end performance updates.
Annual operating expense ratio (%)*
| Class A | | | 1.32 | | |
| Class B | | | 2.07 | | |
| Class C | | | 2.07 | | |
| Class Z | | | 1.07 | | |
*TThe annual operating expense ratio is as stated in the fund's prospectus that is current as of the date of this report and includes the expenses incurred by the investment companies in which the fund invests. Differences in expense ratios disclosed elsewhere in this report may result from expenses incurred by the investment companies, inclusion of fee waivers and expense reimbursements as well as the use of different time periods used in calculating the ratios.
Performance of a $10,000 investment 03/01/00 – 02/28/10
The chart above shows the change in value of a hypothetical $10,000 investment in Class A shares of Columbia Small Cap Growth Fund II during the stated time period, and does not reflect the deduction of taxes that a shareholder may pay on fund distributions or on the redemption of fund shares.
Performance of a $10,000 investment 03/01/00 – 02/28/10 ($)
| Sales charge | | without | | with | |
| Class A | | | 7,868 | | | | 7,417 | | |
| Class B | | | 7,295 | | | | 7,295 | | |
| Class C | | | 7,295 | | | | 7,295 | | |
| Class Z | | | 8,062 | | | | n/a | | |
Average annual total return as of 02/28/10 (%)
| Share class | | A | | B | | C | | Z | |
| Inception | | 12/12/95 | | 12/12/95 | | 09/22/97 | | 12/12/95 | |
| Sales charge | | without | | with | | without | | with | | without | | with | | without | |
| 1-year | | | 48.91 | | | | 40.25 | | | | 47.83 | | | | 42.83 | | | | 47.79 | | | | 46.79 | | | | 49.44 | | |
| 5-year | | | –0.23 | | | | –1.41 | | | | –0.97 | | | | –1.19 | | | | –0.99 | | | | –0.99 | | | | 0.02 | | |
| 10-year | | | –2.37 | | | | –2.94 | | | | –3.10 | | | | –3.10 | | | | –3.10 | | | | –3.10 | | | | –2.13 | | |
Average annual total return as of 03/31/10 (%)
| Share class | | A | | B | | C | | Z | |
| Sales charge | | without | | with | | without | | with | | without | | with | | without | |
| 1-year | | | 50.47 | | | | 41.85 | | | | 49.21 | | | | 44.21 | | | | 49.23 | | | | 48.23 | | | | 50.82 | | |
| 5-year | | | 2.27 | | | | 1.06 | | | | 1.50 | | | | 1.28 | | | | 1.50 | | | | 1.50 | | | | 2.55 | | |
| 10-year | | | –1.64 | | | | –2.22 | | | | –2.38 | | | | –2.38 | | | | –2.38 | | | | –2.38 | | | | –1.39 | | |
The "with sales charge" returns include the maximum initial sales charge of 5.75% for Class A, the applicable contingent deferred sales charge of 5.00% in the first year, declining to 1.00% in the sixth year and eliminated thereafter for Class B shares and 1.00% for Class C shares for the first year only. The "without sales charge" returns do not include the effect of sales charges. If they had, returns would be lower.
Performance results reflect any fee waivers or reimbursements of fund expenses by the investment advisor and/or any of its affiliates. Absent these fee waivers or expense reimbursement arrangements, performance results would have been lower.
All results shown assume reinvestment of distributions. Class Z shares are sold at net asset value with no distribution and service (Rule 12b-1) fees. Class Z shares have limited eligibility and the investment minimum requirements may vary. Please see the fund's prospectus for details. Performance for different share classes will vary based on differences in sales charges and fees associated with each class.
The tables do not reflect the deduction of taxes that a shareholder may pay on fund distributions or on the redemption of fund shares.
4
Understanding Your Expenses – Columbia Small Cap Growth Fund II
As a fund shareholder, you incur two types of costs. There are transaction costs, which generally include sales charges on purchases and may include redemption fees or exchange fees. There are also ongoing costs, which generally include investment advisory fees, distribution and service (Rule 12b-1) fees and other fund expenses. The information on this page is intended to help you understand the ongoing costs of investing in the fund and to compare these costs with the ongoing costs of investing in other mutual funds.
Analyzing your fund's expenses by share class
To illustrate these ongoing costs, we have provided an example and calculated the expenses paid by investors in each share class during the period. The information in the following table is based on an initial investment of $1,000, which is invested at the beginning of the period and held for the entire period. Expense information is calculated two ways and each method provides you with different information. The amount listed in the "Actual" column is calculated using the fund's actual operating expenses and total return for the period. The amount listed in the "Hypothetical" column for each share class assumes that the return each year is 5% before expenses and is calculated based on the fund's actual operating expenses. You should not use the hypothetical account values and expenses to estimate either your actual account balance at the end of the period or the expenses you paid during this period.
Compare with other funds
Since all mutual funds are required to include the same hypothetical calculations about expenses in shareholder reports, you can use this information to compare the ongoing cost of investing in the fund with other funds. To do so, compare the 5% hypothetical example with the 5% hypothetical examples that appear in the shareholder reports of other funds. As you compare hypothetical examples of other funds, it is important to note that hypothetical examples are meant to highlight the ongoing costs of investing in a fund and do not reflect any transaction costs, such as sales charges, redemption fees or exchange fees.
Estimating your actual expenses
To estimate the expenses that you paid over the period, first you will need your account balance at the end of the period:
g For shareholders who receive their account statements from Columbia Management Services, Inc., your account balance is available online at www.columbiafunds.com or by calling Shareholder Services at 800.345.6611.
g For shareholders who receive their account statements from their financial intermediary, contact your financial intermediary to obtain your account balance.
1. Divide your ending account balance by $1,000. For example, if an account balance was $8,600 at the end of the period, the result would be 8.6.
2. In the section of the table below titled "Expenses paid during the period," locate the amount for your share class. You will find this number in the column labeled "Actual." Multiply this number by the result from step 1. Your answer is an estimate of the expenses you paid on your account during the period.
If the value of your account falls below the minimum initial investment requirement applicable to you, your account generally will be subject to a $20 annual fee. This fee is not included in the accompanying table. If you are subject to the fee, keep it in mind when you are estimating the ongoing expenses of investing in the fund and when comparing the expenses of this fund with other funds.
09/01/09 – 02/28/10
| | | Account value at the
beginning of the period ($) | | Account value at the
end of the period ($) | | Expenses paid
during the period ($) | | Fund's annualized
expense ratio (%) | |
| | | Actual | | Hypothetical | | Actual | | Hypothetical | | Actual | | Hypothetical | | Actual | |
| Class A | | | 1,000.00 | | | | 1,000.00 | | | | 1,069.50 | | | | 1,018.10 | | | | 6.93 | | | | 6.76 | | | | 1.35 | | |
| Class B | | | 1,000.00 | | | | 1,000.00 | | | | 1,065.10 | | | | 1,014.38 | | | | 10.75 | | | | 10.49 | | | | 2.10 | | |
| Class C | | | 1,000.00 | | | | 1,000.00 | | | | 1,064.90 | | | | 1,014.38 | | | | 10.75 | | | | 10.49 | | | | 2.10 | | |
| Class Z | | | 1,000.00 | | | | 1,000.00 | | | | 1,069.90 | | | | 1,019.34 | | | | 5.65 | | | | 5.51 | | | | 1.10 | | |
Expenses paid during the period are equal to the annualized expense ratio for the share class, multiplied by the average account value over the period, then multiplied by the number of days in the fund's most recent fiscal half-year and divided by 365.
Had the investment advisor and/or any of its affiliates not waived fees or reimbursed a portion of expenses, account value at the end of the period would have been reduced.
It is important to note that the expense amounts shown in the table are meant to highlight only ongoing costs of investing in the fund and do not reflect any transaction costs, such as sales charges, redemption fees or exchange fees. Therefore, the hypothetical examples provided may not help you determine the relative total costs of owning shares of different funds. If these transaction costs were included, your costs would have been higher.
5
Portfolio Managers' Report – Columbia Small Cap Growth Fund II
Performance data quoted represents past performance and current performance may be lower or higher. Past performance is no guarantee of future results. The investment return and principal value will fluctuate so that shares, when redeemed, may be worth more or less than the original cost. Please visit www.columbiafunds.com for daily and most recent month-end performance updates.
Net asset value per share
as of 02/28/10 ($)
| Class A | | | 8.92 | | |
| Class B | | | 7.85 | | |
| Class C | | | 8.04 | | |
| Class Z | | | 9.34 | | |
For the 12-month period that ended February 28, 2010, the fund's Class A shares returned 48.91% without sales charge. The Russell 2000 Growth Index returned 61.85%. The average return of the fund's peer group, the Lipper Small Cap Growth Funds Classification, was 59.81%. The fund achieved a strong double-digit return during the period, but an emphasis on higher-quality stocks held it back in an environment where improved availability of capital spurred investors to favor lower-priced, more speculative stocks. Positive stock selection among information technology, financials and materials companies helped returns, while holdings in the health care and consumer discretionary sectors hurt relative performance.
Information technology, financials and materials names helped returns
The fund's strong absolute performance was driven by positive stock selection in the information technology, materials and financials sectors. In the information technology sector, Switch & Data and 3 Com benefited from announced acquisitions by larger rivals. We subsequently sold both positions, locking in the market's positive reaction to the news. In the materials sector, key contributors included chemical manufacturers Solutia (0.7% of net assets) and NewMarket. Solutia posted strong earnings driven by improving sales volumes and aggressive cost-cutting measures. As the economy recovered, NewMarket saw demand improve for its petroleum and lubricant additives. We sold the position prior to year-end. Top performers among financials were asset manager Waddell & Reed Financial and brokerage firm Stifel Financial (0.8% and 1.1% of net assets, respectively). Revenues for both companies increased revenues as the stock marke t rallied.
Health care and consumer discretionary stocks disappointed
Among underperformers during the period were health care holdings, including drug manufacturer Isis Pharmaceuticals (0.4% of net assets) and scanner rental company Alliance Imaging. Results of a late-stage study suggested one of Isis's cholesterol-lowering drugs may lead to higher liver toxicity, alarming investors. A decline in short-term rentals of MRI and CT scanners hurt Alliance Imaging, and we sold the stock. In the consumer discretionary sector, tax preparer Jackson Hewitt and apparel brand licensor Iconix Brand Group (1.2% of net assets) had poor results. In a weak economy, many individuals prepared their own 2008 tax returns, hampering Jackson Hewitt's results. We sold the stock. Iconix overestimated the ability of one of its brands, Ocean Pacific, to generate year-round profits. The company also issued more stock mid-year, diluting the value of existing positions.
6
Portfolio Managers' Report (continued) – Columbia Small Cap Growth Fund II
Positioned for the return of a rational market
The stock market rally of 2009 was driven largely by the appreciation of lower-quality and lower-priced stocks, which stood to benefit most in the short term from improved liquidity. While the fund's bias toward higher-quality companies acted as a headwind in this environment, we expect the market may behave more rationally as the credit crisis begins to subside. Against this backdrop, we believe investors may once again reward quality growth companies with strong balance sheets and higher expected returns on capital. We have positioned the portfolio to benefit from such an environment by investing in stocks that we believe can capitalize on a cyclical economic recovery and that are available at valuations representing attractive risk-reward scenarios.
Portfolio characteristics and holdings are subject to change periodically and may not be representative of current characteristics and holdings. The outlook for the fund may differ from those presented for other Columbia Funds.
Equity securities are subject to stock market fluctuations that occur in response to economic and business developments.
Stocks of small-cap companies pose special risks, including possible illiquidity and greater price volatility than stocks of larger, more established companies.
Top 5 sectors
as of 02/28/10 (%)
| Information Technology | | | 26.3 | | |
| Health Care | | | 23.7 | | |
| Consumer Discretionary | | | 17.1 | | |
| Industrials | | | 14.1 | | |
| Financials | | | 6.0 | | |
Top 10 holdings
as of 02/28/10 (%)
| Knology | | | 1.8 | | |
| Polycom | | | 1.8 | | |
| Portfolio Recovery Assocs | | | 1.4 | | |
| Korn/Ferry International | | | 1.4 | | |
| TeleTech Holdings | | | 1.3 | | |
| American Medical Systems | | | 1.2 | | |
| Iconix Brand Group | | | 1.2 | | |
| STERIS | | | 1.2 | | |
| American Italian Pasta | | | 1.2 | | |
| Skyworks Solutions | | | 1.1 | | |
The fund is actively managed and the composition of its portfolio will change over time. Information provided is calculated as a percentage of net assets
7
Investment Portfolio – Columbia Small Cap Growth Fund II
February 28, 2010
| Common Stocks – 99.1% | |
| | | Shares | | Value ($) | |
| Consumer Discretionary – 17.1% | |
| Diversified Consumer Services – 0.8% | |
Brink's Home Security
Holdings, Inc. (a) | | | 62,260 | | | | 2,605,581 | | |
| Diversified Consumer Services Total | | | 2,605,581 | | |
| Hotels, Restaurants & Leisure – 3.2% | |
| Bally Technologies, Inc. (a) | | | 71,070 | | | | 2,943,009 | | |
| DineEquity, Inc. (a) | | | 119,150 | | | | 3,495,861 | | |
Scientific Games Corp.,
Class A (a) | | | 164,340 | | | | 2,775,702 | | |
| Vail Resorts, Inc. (a) | | | 49,770 | | | | 1,792,218 | | |
| Hotels, Restaurants & Leisure Total | | | 11,006,790 | | |
| Household Durables – 1.7% | |
Tempur-Pedic
International, Inc. (a) | | | 126,400 | | | | 3,589,760 | | |
| Tupperware Brands Corp. | | | 48,960 | | | | 2,287,901 | | |
| Household Durables Total | | | 5,877,661 | | |
| Internet & Catalog Retail – 0.7% | |
| HSN, Inc. (a) | | | 118,570 | | | | 2,568,226 | | |
| Internet & Catalog Retail Total | | | 2,568,226 | | |
| Media – 2.9% | |
| Imax Corp. (a) | | | 105,310 | | | | 1,412,207 | | |
| Knology, Inc. (a) | | | 530,254 | | | | 6,071,408 | | |
| LodgeNet Interactive Corp. (a) | | | 389,690 | | | | 2,431,666 | | |
| Media Total | | | 9,915,281 | | |
| Specialty Retail – 4.4% | |
| Group 1 Automotive, Inc. (a) | | | 78,632 | | | | 2,183,611 | | |
| hhgregg, Inc. (a) | | | 60,650 | | | | 1,265,765 | | |
| J Crew Group, Inc. (a) | | | 57,670 | | | | 2,426,754 | | |
| OfficeMax, Inc. (a) | | | 213,850 | | | | 3,415,184 | | |
| Pier 1 Imports, Inc. (a) | | | 464,910 | | | | 2,840,600 | | |
Ulta Salon Cosmetics &
Fragrance, Inc. (a) | | | 101,700 | | | | 1,864,161 | | |
| Vitamin Shoppe, Inc. (a) | | | 43,072 | | | | 855,841 | | |
| Specialty Retail Total | | | 14,851,916 | | |
| Textiles, Apparel & Luxury Goods – 3.4% | |
| Fossil, Inc. (a) | | | 96,260 | | | | 3,489,425 | | |
| Iconix Brand Group, Inc. (a) | | | 313,050 | | | | 4,079,042 | | |
| True Religion Apparel, Inc. (a) | | | 50,770 | | | | 1,246,911 | | |
| Warnaco Group, Inc. (a) | | | 64,200 | | | | 2,679,708 | | |
| Textiles, Apparel & Luxury Goods Total | | | 11,495,086 | | |
| Consumer Discretionary Total | | | 58,320,541 | | |
| | | Shares | | Value ($) | |
| Consumer Staples – 3.9% | |
| Food Products – 2.1% | |
American Italian Pasta Co.,
Class A (a) | | | 101,547 | | | | 3,940,024 | | |
| Darling International, Inc. (a) | | | 347,498 | | | | 2,800,834 | | |
| Lance, Inc. | | | 29,150 | | | | 632,263 | | |
| Food Products Total | | | 7,373,121 | | |
| Household Products – 0.8% | |
Central Garden & Pet Co.,
Class A (a) | | | 278,420 | | | | 2,658,911 | | |
| Household Products Total | | | 2,658,911 | | |
| Personal Products – 1.0% | |
Nu Skin Enterprises, Inc.,
Class A | | | 126,078 | | | | 3,368,804 | | |
| Personal Products Total | | | 3,368,804 | | |
| Consumer Staples Total | | | 13,400,836 | | |
| Energy – 4.2% | |
| Energy Equipment & Services – 0.9% | |
| Key Energy Services, Inc. (a) | | | 179,740 | | | | 1,822,563 | | |
| Pioneer Drilling Co. (a) | | | 197,383 | | | | 1,409,315 | | |
| Energy Equipment & Services Total | | | 3,231,878 | | |
| Oil, Gas & Consumable Fuels – 3.3% | |
| Arena Resources, Inc. (a) | | | 68,070 | | | | 2,820,140 | | |
| Atlas Energy, Inc. (a) | | | 76,480 | | | | 2,496,307 | | |
| Comstock Resources, Inc. (a) | | | 67,370 | | | | 2,325,612 | | |
| GMX Resources, Inc. (a) | | | 97,914 | | | | 900,809 | | |
| Resolute Energy Corp. (a) | | | 108,460 | | | | 1,155,099 | | |
| Stone Energy Corp. (a) | | | 83,030 | | | | 1,415,662 | | |
| Oil, Gas & Consumable Fuels Total | | | 11,113,629 | | |
| Energy Total | | | 14,345,507 | | |
| Financials – 6.0% | |
| Capital Markets – 2.6% | |
| Evercore Partners, Inc., Class A | | | 57,378 | | | | 1,727,651 | | |
| FBR Capital Markets Corp. (a) | | | 156,160 | | | | 844,826 | | |
| Stifel Financial Corp. (a) | | | 67,484 | | | | 3,691,375 | | |
Waddell & Reed Financial,
Inc., Class A | | | 80,900 | | | | 2,659,992 | | |
| Capital Markets Total | | | 8,923,844 | | |
| Commercial Banks – 0.7% | |
Pinnacle Financial
Partners, Inc. (a) | | | 160,779 | | | | 2,429,371 | | |
| Commercial Banks Total | | | 2,429,371 | | |
See Accompanying Notes to Financial Statements.
8
Columbia Small Cap Growth Fund II
February 28, 2010
| Common Stocks (continued) | |
| | | Shares | | Value ($) | |
| Diversified Financial Services – 1.4% | |
Portfolio Recovery
Associates, Inc. (a) | | | 89,191 | | | | 4,756,556 | | |
| Diversified Financial Services Total | | | 4,756,556 | | |
| Insurance – 0.3% | |
Platinum Underwriters
Holdings Ltd. | | | 26,450 | | | | 988,965 | | |
| Insurance Total | | | 988,965 | | |
| Real Estate Investment Trusts (REITs) – 1.0% | |
| DuPont Fabros Technology, Inc. | | | 72,220 | | | | 1,415,512 | | |
| Home Properties, Inc. | | | 38,392 | | | | 1,758,354 | | |
| Real Estate Investment Trusts (REITs) Total | | | 3,173,866 | | |
| Financials Total | | | 20,272,602 | | |
| Health Care – 23.7% | |
| Biotechnology – 9.3% | |
Alexion
Pharmaceuticals, Inc. (a) | | | 52,060 | | | | 2,578,011 | | |
| Alkermes, Inc. (a) | | | 248,270 | | | | 2,845,174 | | |
BioMarin
Pharmaceuticals, Inc. (a) | | | 140,921 | | | | 2,818,420 | | |
Human Genome
Sciences, Inc. (a) | | | 133,577 | | | | 3,760,193 | | |
| Immunogen, Inc. (a) | | | 167,597 | | | | 1,107,816 | | |
| Incyte Corp. Ltd. (a) | | | 105,270 | | | | 1,122,178 | | |
| Isis Pharmaceuticals, Inc. (a) | | | 156,760 | | | | 1,385,758 | | |
| Martek Biosciences Corp. (a) | | | 82,250 | | | | 1,631,018 | | |
| Onyx Pharmaceuticals, Inc. (a) | | | 105,323 | | | | 2,923,766 | | |
Regeneron
Pharmaceuticals, Inc. (a) | | | 133,484 | | | | 3,265,019 | | |
| Rigel Pharmaceuticals, Inc. (a) | | | 167,582 | | | | 1,265,244 | | |
Savient
Pharmaceuticals, Inc. (a) | | | 162,792 | | | | 2,194,436 | | |
| Seattle Genetics, Inc. (a) | | | 234,243 | | | | 2,389,279 | | |
| United Therapeutics Corp. (a) | | | 44,204 | | | | 2,537,752 | | |
| Biotechnology Total | | | 31,824,064 | | |
| Health Care Equipment & Supplies – 5.7% | |
American Medical Systems
Holdings, Inc. (a) | | | 226,140 | | | | 4,097,657 | | |
| Cyberonics, Inc. (a) | | | 67,530 | | | | 1,205,411 | | |
| Masimo Corp. (a) | | | 82,306 | | | | 2,279,053 | | |
| NuVasive, Inc. (a) | | | 74,610 | | | | 2,980,669 | | |
| Sirona Dental Systems, Inc. (a) | | | 88,000 | | | | 3,158,320 | | |
| STERIS Corp. | | | 126,560 | | | | 4,000,562 | | |
| Thoratec Corp. (a) | | | 61,090 | | | | 1,762,446 | | |
| Health Care Equipment & Supplies Total | | | 19,484,118 | | |
| | | Shares | | Value ($) | |
| Health Care Providers & Services – 4.0% | |
| AMERIGROUP Corp. (a) | | | 69,680 | | | | 1,831,191 | | |
Catalyst Health
Solutions, Inc. (a) | | | 20,379 | | | | 768,085 | | |
| Healthsouth Corp. (a) | | | 36,400 | | | | 629,720 | | |
| HMS Holdings Corp. (a) | | | 21,780 | | | | 1,002,751 | | |
| inVentiv Health, Inc. (a) | | | 111,190 | | | | 1,632,269 | | |
Magellan Health
Services, Inc. (a) | | | 17,150 | | | | 718,928 | | |
| Owens & Minor, Inc. | | | 84,880 | | | | 3,789,892 | | |
| Psychiatric Solutions, Inc. (a) | | | 147,283 | | | | 3,159,220 | | |
| Health Care Providers & Services Total | | | 13,532,056 | | |
| Health Care Technology – 0.7% | |
Computer Programs &
Systems, Inc. | | | 70,460 | | | | 2,532,333 | | |
| Health Care Technology Total | | | 2,532,333 | | |
| Life Sciences Tools & Services – 2.5% | |
Albany Molecular
Research, Inc. (a) | | | 162,210 | | | | 1,456,646 | | |
Bio-Rad Laboratories,
Inc., Class A (a) | | | 17,013 | | | | 1,588,844 | | |
| Dionex Corp. (a) | | | 54,660 | | | | 3,733,278 | | |
| ICON PLC, ADR (a) | | | 69,630 | | | | 1,639,786 | | |
| Life Sciences Tools & Services Total | | | 8,418,554 | | |
| Pharmaceuticals – 1.5% | |
| Eurand NV (a) | | | 143,561 | | | | 1,274,821 | | |
| Impax Laboratories, Inc. (a) | | | 130,470 | | | | 2,010,543 | | |
| Vivus, Inc. (a) | | | 208,620 | | | | 1,752,408 | | |
| Pharmaceuticals Total | | | 5,037,772 | | |
| Health Care Total | | | 80,828,897 | | |
| Industrials – 14.1% | |
| Aerospace & Defense – 2.1% | |
| HEICO Corp. | | | 34,504 | | | | 1,644,116 | | |
| Hexcel Corp. (a) | | | 229,580 | | | | 2,529,971 | | |
| Teledyne Technologies, Inc. (a) | | | 76,033 | | | | 2,864,163 | | |
| Aerospace & Defense Total | | | 7,038,250 | | |
| Air Freight & Logistics – 1.0% | |
| HUB Group, Inc., Class A (a) | | | 125,351 | | | | 3,380,717 | | |
| Air Freight & Logistics Total | | | 3,380,717 | | |
| Commercial Services & Supplies – 0.7% | |
| Geo Group, Inc. (a) | | | 124,420 | | | | 2,459,783 | | |
| Commercial Services & Supplies Total | | | 2,459,783 | | |
See Accompanying Notes to Financial Statements.
9
Columbia Small Cap Growth Fund II
February 28, 2010
| Common Stocks (continued) | |
| | | Shares | | Value ($) | |
| Construction & Engineering – 0.7% | |
Great Lakes Dredge &
Dock Corp. | | | 522,604 | | | | 2,367,396 | | |
| Construction & Engineering Total | | | 2,367,396 | | |
| Electrical Equipment – 2.7% | |
American Superconductor
Corp. (a) | | | 27,370 | | | | 766,360 | | |
| General Cable Corp. (a) | | | 58,170 | | | | 1,421,093 | | |
| II-VI, Inc. (a) | | | 126,249 | | | | 3,540,022 | | |
| Thomas & Betts Corp. (a) | | | 99,500 | | | | 3,591,950 | | |
| Electrical Equipment Total | | | 9,319,425 | | |
| Machinery – 3.3% | |
| Actuant Corp., Class A | | | 74,380 | | | | 1,347,022 | | |
| Chart Industries, Inc. (a) | | | 77,820 | | | | 1,584,415 | | |
Columbus McKinnon
Corp./NY (a) | | | 123,840 | | | | 1,782,058 | | |
| Dynamic Materials Corp. | | | 78,370 | | | | 1,420,064 | | |
| Trinity Industries, Inc. | | | 135,470 | | | | 2,279,960 | | |
| Wabtec Corp. | | | 77,018 | | | | 2,937,467 | | |
| Machinery Total | | | 11,350,986 | | |
| Marine – 1.0% | |
Genco Shipping &
Trading Ltd. (a) | | | 72,887 | | | | 1,530,627 | | |
| Kirby Corp. (a) | | | 55,440 | | | | 1,830,075 | | |
| Marine Total | | | 3,360,702 | | |
| Professional Services – 1.4% | |
| Korn/Ferry International (a) | | | 273,976 | | | | 4,679,510 | | |
| Professional Services Total | | | 4,679,510 | | |
| Road & Rail – 0.7% | |
Dollar Thrifty Automotive
Group, Inc. (a) | | | 52,920 | | | | 1,589,717 | | |
Old Dominion Freight
Line, Inc. (a) | | | 23,860 | | | | 733,456 | | |
| Road & Rail Total | | | 2,323,173 | | |
| Trading Companies & Distributors – 0.5% | |
| Beacon Roofing Supply, Inc. (a) | | | 108,290 | | | | 1,884,246 | | |
| Trading Companies & Distributors Total | | | 1,884,246 | | |
| Industrials Total | | | 48,164,188 | | |
| Information Technology – 26.3% | |
| Communications Equipment – 3.7% | |
| Arris Group, Inc. (a) | | | 194,823 | | | | 2,010,573 | | |
Brocade Communications
Systems, Inc. (a) | | | 218,340 | | | | 1,270,739 | | |
Comtech Telecommunications
Corp. (a) | | | 55,900 | | | | 1,767,558 | | |
| | | Shares | | Value ($) | |
| Digi International, Inc. (a) | | | 145,937 | | | | 1,481,261 | | |
| Polycom, Inc. (a) | | | 229,020 | | | | 5,979,712 | | |
| Communications Equipment Total | | | 12,509,843 | | |
| Computers & Peripherals – 0.6% | |
| Synaptics, Inc. (a) | | | 81,030 | | | | 2,163,501 | | |
| Computers & Peripherals Total | | | 2,163,501 | | |
| Electronic Equipment, Instruments & Components – 3.0% | |
| Anixter International, Inc. (a) | | | 45,120 | | | | 1,883,309 | | |
| Brightpoint, Inc. (a) | | | 545,680 | | | | 3,890,698 | | |
| Plexus Corp. (a) | | | 83,350 | | | | 2,874,742 | | |
| TTM Technologies, Inc. (a) | | | 185,398 | | | | 1,583,299 | | |
Electronic Equipment, Instruments &
Components Total | | | 10,232,048 | | |
| Internet Software & Services – 1.9% | |
| MercadoLibre, Inc. (a) | | | 26,550 | | | | 1,092,267 | | |
| Perficient, Inc. (a) | | | 266,290 | | | | 2,955,819 | | |
| Rackspace Hosting, Inc. (a) | | | 123,720 | | | | 2,453,368 | | |
| Internet Software & Services Total | | | 6,501,454 | | |
| IT Services – 4.0% | |
CACI International, Inc.,
Class A (a) | | | 62,230 | | | | 3,084,118 | | |
| Cybersource Corp. (a) | | | 101,100 | | | | 1,731,843 | | |
| Syntel, Inc. | | | 61,010 | | | | 2,068,239 | | |
| TeleTech Holdings, Inc. (a) | | | 249,867 | | | | 4,370,174 | | |
| Wright Express Corp. (a) | | | 81,440 | | | | 2,306,381 | | |
| IT Services Total | | | 13,560,755 | | |
| Semiconductors & Semiconductor Equipment – 6.8% | |
| Amkor Technology, Inc. (a) | | | 368,550 | | | | 2,218,671 | | |
Atheros Communications,
Inc. (a) | | | 100,690 | | | | 3,613,764 | | |
Cabot Microelectronics
Corp. (a) | | | 56,640 | | | | 2,005,056 | | |
| Cavium Networks, Inc. (a) | | | 103,070 | | | | 2,463,373 | | |
| Cirrus Logic, Inc. (a) | | | 196,570 | | | | 1,403,510 | | |
| Diodes, Inc. (a) | | | 86,190 | | | | 1,690,186 | | |
Monolithic Power
Systems, Inc. (a) | | | 129,820 | | | | 2,636,644 | | |
| Semtech Corp. (a) | | | 201,660 | | | | 3,200,344 | | |
| Skyworks Solutions, Inc. (a) | | | 255,540 | | | | 3,902,096 | | |
Semiconductors & Semiconductor
Equipment Total | | | 23,133,644 | | |
| Software – 6.3% | |
| ANSYS, Inc. (a) | | | 78,670 | | | | 3,450,466 | | |
Cadence Design
Systems, Inc. (a) | | | 280,930 | | | | 1,601,301 | | |
| Concur Technologies, Inc. (a) | | | 34,810 | | | | 1,369,425 | | |
See Accompanying Notes to Financial Statements.
10
Columbia Small Cap Growth Fund II
February 28, 2010
| Common Stocks (continued) | |
| | | Shares | | Value ($) | |
Monotype Imaging
Holdings, Inc. (a) | | | 62,950 | | | | 598,655 | | |
Net 1 UEPS
Technologies, Inc. (a) | | | 166,655 | | | | 2,941,461 | | |
| Progress Software Corp. (a) | | | 131,670 | | | | 3,689,394 | | |
| Solera Holdings, Inc. | | | 91,790 | | | | 3,135,546 | | |
TeleCommunication Systems,
Inc., Class A (a) | | | 221,400 | | | | 1,687,068 | | |
| THQ, Inc. (a) | | | 462,590 | | | | 2,803,295 | | |
| Software Total | | | 21,276,611 | | |
| Information Technology Total | | | 89,377,856 | | |
| Materials – 2.6% | |
| Chemicals – 1.3% | |
| Koppers Holdings, Inc. | | | 72,016 | | | | 2,002,045 | | |
| Solutia, Inc. (a) | | | 167,095 | | | | 2,351,026 | | |
| Chemicals Total | | | 4,353,071 | | |
| Containers & Packaging – 0.9% | |
| Greif, Inc., Class A | | | 56,560 | | | | 2,898,134 | | |
| Containers & Packaging Total | | | 2,898,134 | | |
| Metals & Mining – 0.4% | |
Compass Minerals
International, Inc. | | | 19,020 | | | | 1,436,581 | | |
| Metals & Mining Total | | | 1,436,581 | | |
| Materials Total | | | 8,687,786 | | |
| Telecommunication Services – 1.2% | |
| Diversified Telecommunication Services – 0.5% | |
| Neutral Tandem, Inc. (a) | | | 110,210 | | | | 1,776,585 | | |
| Diversified Telecommunication Services Total | | | 1,776,585 | | |
| Wireless Telecommunication Services – 0.7% | |
| NTELOS Holdings Corp. | | | 131,830 | | | | 2,251,656 | | |
| Wireless Telecommunication Services Total | | | 2,251,656 | | |
| Telecommunication Services Total | | | 4,028,241 | | |
Total Common Stocks
(cost of $305,833,535) | | | 337,426,454 | | |
| Short-Term Obligation – 1.1% | |
| | | Par ($) | | Value ($) | |
Repurchase agreement with
Fixed Income Clearing Corp.,
dated 02/26/10, due 03/01/10
at 0.040%, collateralized by a
U.S. Treasury obligation
maturing 05/15/19, market
value $3,919,344 (repurchase
proceeds $3,838,013) | | | 3,838,000 | | | | 3,838,000 | | |
Total Short-Term Obligation
(cost of $3,838,000) | | | 3,838,000 | | |
Total Investments – 100.2%
(cost of $309,671,535) (b) | | | 341,264,454 | | |
| Other Assets & Liabilities, Net – (0.2)% | | | (827,545 | ) | |
| Net Assets – 100.0% | | | 340,436,909 | | |
Notes to Investment Portfolio:
(a) Non-income producing security.
(b) Cost for federal income tax purposes is $311,358,186.
The following table summarizes the inputs used, as of February 28, 2010, in valuing the Fund's assets:
| Description | | Quoted
Prices
(Level 1) | | Other
Significant
Observable
Inputs
(Level 2) | | Significant
Unobservable
Inputs
(Level 3) | | Total | |
| Total Common Stocks | | $ | 337,426,454 | | | $ | — | | | $ | — | | | $ | 337,426,454 | | |
Total Short-Term
Obligation | | | — | | | | 3,838,000 | | | | — | | | | 3,838,000 | | |
| Total Investments | | $ | 337,426,454 | | | $ | 3,838,000 | | | $ | — | | | $ | 341,264,454 | | |
For more information on valuation inputs, and their aggregation into the levels used in the table above, please refer to the Security Valuation section in the accompanying Notes to Financial Statements.
At February 28, 2010, the Fund held investments in the following sectors:
| Sector (Unaudited) | | % of
Net Assets | |
| Information Technology | | | 26.3 | | |
| Health Care | | | 23.7 | | |
| Consumer Discretionary | | | 17.1 | | |
| Industrials | | | 14.1 | | |
| Financials | | | 6.0 | | |
| Energy | | | 4.2 | | |
| Consumer Staples | | | 3.9 | | |
| Materials | | | 2.6 | | |
| Telecommunication Services | | | 1.2 | | |
| | | | 99.1 | | |
| Short- Term Obligation | | | 1.1 | | |
| Other Assets & Liabilities, Net | | | (0.2 | ) | |
| | | | 100.0 | | |
| Acronym | | Name | |
| ADR | | American Depositary Receipt | |
|
See Accompanying Notes to Financial Statements.
11
Statement of Assets and Liabilities – Columbia Small Cap Growth Fund II
February 28, 2010
| | | | | ($) | |
| Assets | | Investments, at identified cost | | | 309,671,535 | | |
| | | Investments, at value | | | 341,264,454 | | |
| | | Cash | | | 821 | | |
| | | Receivable for: | | | | | |
| | | Fund shares sold | | | 165,729 | | |
| | | Dividends | | | 97,855 | | |
| | | Interest | | | 13 | | |
| | | Trustees' deferred compensation plan | | | 22,670 | | |
| | | Prepaid expenses | | | 3,919 | | |
| | | Total Assets | | | 341,555,461 | | |
| Liabilities | | Payable for: | | | | | |
| | | Fund shares repurchased | | | 641,810 | | |
| | | Investment advisory fee | | | 181,104 | | |
| | | Administration fee | | | 23,303 | | |
| | | Pricing and bookkeeping fees | | | 7,393 | | |
| | | Transfer agent fee | | | 81,394 | | |
| | | Trustees' fees | | | 52,209 | | |
| | | Custody fee | | | 3,386 | | |
| | | Distribution and service fees | | | 27,337 | | |
| | | Chief compliance officer expenses | | | 98 | | |
| | | Trustees' deferred compensation plan | | | 22,670 | | |
| | | Other liabilities | | | 77,848 | | |
| | | Total Liabilities | | | 1,118,552 | | |
| | | Net Assets | | | 340,436,909 | | |
| Net Assets Consist of | | Paid-in capital | | | 444,240,865 | | |
| | | Accumulated net investment loss | | | (12,156 | ) | |
| | | Accumulated net realized loss | | | (135,384,719 | ) | |
| | | Net unrealized appreciation on investments | | | 31,592,919 | | |
| | | Net Assets | | | 340,436,909 | | |
| Class A | | Net assets | | $ | 119,894,135 | | |
| | | Shares outstanding | | | 13,443,982 | | |
| | | Net asset value per share | | $ | 8.92 | (a) | |
| | | Maximum sales charge | | | 5.75 | % | |
| | | Maximum offering price per share | | $ | 9.46 | (b) | |
| Class B | | Net assets | | $ | 3,339,802 | | |
| | | Shares outstanding | | | 425,574 | | |
| | | Net asset value and offering price per share | | $ | 7.85 | (a) | |
| Class C | | Net assets | | $ | 2,628,749 | | |
| | | Shares outstanding | | | 326,886 | | |
| | | Net asset value and offering price per share | | $ | 8.04 | (a) | |
| Class Z | | Net assets | | $ | 214,574,223 | | |
| | | Shares outstanding | | | 22,969,907 | | |
| | | Net asset value, offering and redemption price per share | | $ | 9.34 | | |
(a) Redemption price per share is equal to net asset value less any applicable contingent deferred sales charge.
(b) On sales of $50,000 or more the offering price is reduced.
See Accompanying Notes to Financial Statements.
12
Statement of Operations – Columbia Small Cap Growth Fund II
For the Year Ended February 28, 2010
| | | | | ($) | |
| Investment Income | | Dividends | | | 1,473,954 | | |
| | | Interest | | | 4,013 | | |
| | | Total Investment Income | | | 1,477,967 | | |
| Expenses | | Investment advisory fee | | | 2,294,866 | | |
| | | Administration fee | | | 296,532 | | |
| | | Distribution fee: | | | | | |
| | | Class B | | | 27,741 | | |
| | | Class C | | | 19,673 | | |
| | | Service fee: | | | | | |
| | | Class B | | | 9,242 | | |
| | | Class C | | | 6,551 | | |
| | | Distribution and service fees: | | | | | |
| | | Class A | | | 295,265 | | |
| | | Transfer agent fee | | | 647,518 | | |
| | | Pricing and bookkeeping fees | | | 89,209 | | |
| | | Trustees' fees | | | 43,490 | | |
| | | Custody fee | | | 18,298 | | |
| | | Chief compliance officer expenses | | | 702 | | |
| | | Other expenses | | | 275,322 | | |
| | | Expenses before interest expense | | | 4,024,409 | | |
| | | Interest expense | | | 280 | | |
| | | Total Expenses | | | 4,024,689 | | |
| | | Fees waived by transfer agent | | | (43,672 | ) | |
| | | Expense reductions | | | (7 | ) | |
| | | Net Expenses | | | 3,981,010 | | |
| | | Net Investment Loss | | | (2,503,043 | ) | |
| Net Realized and Unrealized Gain (Loss) on Investments | | | |
| | | Net realized loss on investments | | | (13,937,128 | ) | |
| | | Net change in unrealized appreciation on investments | | | 135,495,875 | | |
| | | Net Gain | | | 121,558,747 | | |
| | | Net Increase Resulting from Operations | | | 119,055,704 | | |
See Accompanying Notes to Financial Statements.
13
Statement of Changes in Net Assets – Columbia Small Cap Growth Fund II
| Increase (Decrease) in Net Assets | | | | Year Ended
February 28,
2010 ($) | | Year Ended
February 28,
2009 ($) | |
| Operations | | Net investment loss | | | (2,503,043 | ) | | | (2,675,422 | ) | |
| | | Net realized loss on investments | | | (13,937,128 | ) | | | (96,422,480 | ) | |
| | | Net change in unrealized appreciation (depreciation)
on investments | | | 135,495,875 | | | | (92,844,643 | ) | |
| | | Net increase (decrease) resulting from operations | | | 119,055,704 | | | | (191,942,545 | ) | |
| | | Net Capital Stock Transactions | | | (18,764,168 | ) | | | (34,904,286 | ) | |
| | | Increase from regulatory settlements | | | 543,481 | | | | — | | |
| | | Total increase (decrease) in net assets | | | 100,835,017 | | | | (226,846,831 | ) | |
| Net Assets | | Beginning of period | | | 239,601,892 | | | | 466,448,723 | | |
| | | End of period | | | 340,436,909 | | | | 239,601,892 | | |
| | | Accumulated net investment loss at end of period | | | (12,156 | ) | | | (21,025 | ) | |
See Accompanying Notes to Financial Statements.
14
Statement of Changes in Net Assets (continued) – Columbia Small Cap Growth Fund II
| | | Capital Stock Activity | |
| | | Year Ended
February 28, 2010 | | Year Ended
February 28, 2009 | |
| | | Shares | | Dollars ($) | | Shares | | Dollars ($) | |
| Class A | |
| Subscriptions | | | 1,205,033 | | | | 9,556,394 | | | | 1,585,697 | | | | 16,089,431 | | |
| Redemptions | | | (2,904,474 | ) | | | (24,025,684 | ) | | | (2,875,860 | ) | | | (25,149,538 | ) | |
| Net decrease | | | (1,699,441 | ) | | | (14,469,290 | ) | | | (1,290,163 | ) | | | (9,060,107 | ) | |
| Class B | |
| Subscriptions | | | 9,581 | | | | 65,844 | | | | 38,276 | | | | 341,230 | | |
| Redemptions | | | (217,514 | ) | | | (1,528,227 | ) | | | (377,670 | ) | | | (3,162,007 | ) | |
| Net decrease | | | (207,933 | ) | | | (1,462,383 | ) | | | (339,394 | ) | | | (2,820,777 | ) | |
| Class C | |
| Subscriptions | | | 51,092 | | | | 361,405 | | | | 165,308 | | | | 1,457,640 | | |
| Redemptions | | | (106,951 | ) | | | (762,336 | ) | | | (163,956 | ) | | | (1,411,760 | ) | |
| Net increase (decrease) | | | (55,859 | ) | | | (400,931 | ) | | | 1,352 | | | | 45,880 | | |
| Class Z | |
| Subscriptions | | | 6,693,775 | | | | 54,630,116 | | | | 5,454,785 | | | | 48,504,604 | | |
| Redemptions | | | (6,668,451 | ) | | | (57,061,680 | ) | | | (7,927,067 | ) | | | (71,573,886 | ) | |
| Net increase (decrease) | | | 25,324 | | | | (2,431,564 | ) | | | (2,472,282 | ) | | | (23,069,282 | ) | |
See Accompanying Notes to Financial Statements.
15
Financial Highlights – Columbia Small Cap Growth Fund II
Selected data for a share outstanding throughout each period is as follows:
| | | Year Ended February 28, | | Period Ended
February 29, | | Year Ended March 31, | |
| Class A Shares | | 2010 | | 2009 | | 2008 (a)(b)(c) | | 2007 (a) | | 2006 (a)(d) | | 2005 (a) | |
| Net Asset Value, Beginning of Period | | $ | 5.99 | | | $ | 10.57 | | | $ | 13.79 | | | $ | 17.56 | | | $ | 15.06 | | | $ | 15.04 | | |
| Income from Investment Operations: | |
| Net investment loss (e) | | | (0.07 | ) | | | (0.07 | ) | | | (0.10 | ) | | | (0.12 | ) | | | (0.13 | ) | | | (0.14 | ) | |
Net realized and unrealized gain (loss)
on investments and written options | | | 2.99 | | | | (4.51 | ) | | | (0.41 | ) | | | (0.24 | )(f) | | | 4.51 | | | | 0.16 | | |
| Total from investment operations | | | 2.92 | | | | (4.58 | ) | | | (0.51 | ) | | | (0.36 | ) | | | 4.38 | | | | 0.02 | | |
| Less Distributions to Shareholders: | |
| From net realized gains | | | — | | | | — | | | | (2.69 | ) | | | (3.41 | ) | | | (1.88 | ) | | | — | | |
| From return of capital | | | — | | | | — | | | | (0.02 | ) | | | — | | | | — | | | | — | | |
| Total distributions to shareholders | | | — | | | | — | | | | (2.71 | ) | | | (3.41 | ) | | | (1.88 | ) | | | — | | |
| Increase from regulatory settlements | | | 0.01 | | | | — | | | | — | | | | — | | | | — | | | | — | | |
| Net Asset Value, End of Period | | $ | 8.92 | | | $ | 5.99 | | | $ | 10.57 | | | $ | 13.79 | | | $ | 17.56 | | | $ | 15.06 | | |
| Total return (g)(h) | | | 48.91 | % | | | (43.33 | )% | | | (6.45 | )%(i) | | | (0.03 | )% | | | 30.90 | % | | | 0.13 | % | |
Ratios to Average Net Assets/
Supplemental Data: | |
| Net expenses before interest expense | | | 1.36 | %(j) | | | 1.27 | %(j) | | | 1.20 | %(j)(k) | | | 1.23 | %(j) | | | 1.24 | % | | | 1.32 | % | |
| Interest expense | | | — | %(l) | | | — | %(l) | | | — | %(k)(l) | | | — | | | | — | | | | — | | |
| Net expenses | | | 1.36 | %(j) | | | 1.27 | %(j) | | | 1.20 | %(j)(k) | | | 1.23 | %(j) | | | 1.24 | % | | | 1.32 | % | |
| Waiver/Reimbursement | | | 0.01 | % | | | 0.05 | % | | | 0.04 | %(k) | | | 0.03 | % | | | 0.07 | %(m) | | | 0.08 | %(m) | |
| Net investment loss | | | (0.90 | )%(j) | | | (0.80 | )%(j) | | | (0.85 | )%(j)(k) | | | (0.81 | )%(j) | | | (0.84 | )% | | | (0.96 | )% | |
| Portfolio turnover rate | | | 105 | % | | | 130 | % | | | 3 | %(i)(n) | | | — | | | | — | | | | — | | |
Turnover of Columbia Small Cap
Growth Master Portfolio | | | — | | | | — | | | | 199 | %(i) | | | 188 | % | | | 117 | % | | | 59 | % | |
| Net assets, end of period (000s) | | $ | 119,894 | | | $ | 90,647 | | | $ | 173,675 | | | $ | 207,258 | | | $ | 150,761 | | | $ | 132,400 | | |
(a) The per share amounts and percentages reflect income and expenses assuming inclusion of the Fund's proportionate share of the income and expenses of Columbia Small Cap Growth Master Portfolio.
(b) The Fund changed its fiscal year end from March 31 to February 29. Per share data and total return reflect activity from April 1, 2007 through February 29, 2008.
(c) Effective February 28, 2008, the Fund converted to a stand-alone fund. Prior to February 28, 2008, the Fund operated in a master-feeder structure.
(d) On August 22, 2005, the Fund's Investor A shares were renamed Class A shares.
(e) Per share data was calculated using the average shares outstanding during the period.
(f) The amount shown for a share outstanding does not correspond with the aggregate net gain on investments for the year due to the timing of sales and repurchases of Fund shares in relation to fluctuating market values of the investments of the Columbia Small Cap Growth Master Portfolio.
(g) Total return at net asset value assuming all distributions reinvested and no initial sales charge or contingent deferred sales charge.
(h) Had the investment advisor and/or any of its affiliates not waived fees or reimbursed a portion of expenses, total return would have been reduced.
(i) Not annualized.
(j) The benefits derived from expense reductions had an impact of less than 0.01%.
(k) Annualized.
(l) Rounds to less than 0.01%.
(m) Bank of America Corporation assumed certain non-recurring costs. Absent these non-recurring costs, the waiver/reimbursement ratio would have been 0.01% and 0.05% for the years ended March 31, 2006 and March 31, 2005, respectively.
(n) Amount represents results after the Fund's conversion to a stand-alone structure on February 28, 2008.
See Accompanying Notes to Financial Statements.
16
Financial Highlights – Columbia Small Cap Growth Fund II
Selected data for a share outstanding throughout each period is as follows:
| | | Year Ended February 28, | | Period Ended
February 29, | | Year Ended March 31, | |
| Class B Shares | | 2010 | | 2009 | | 2008 (a)(b)(c) | | 2007 (a) | | 2006 (a)(d) | | 2005 (a) | |
| Net Asset Value, Beginning of Period | | $ | 5.31 | | | $ | 9.44 | | | $ | 12.49 | | | $ | 16.21 | | | $ | 14.13 | | | $ | 14.22 | | |
| Income from Investment Operations: | |
| Net investment loss (e) | | | (0.12 | ) | | | (0.13 | ) | | | (0.13 | ) | | | (0.21 | ) | | | (0.24 | ) | | | (0.24 | ) | |
Net realized and unrealized gain (loss)
on investments and written options | | | 2.65 | | | | (4.00 | ) | | | (0.40 | ) | | | (0.22 | )(f) | | | 4.20 | | | | 0.15 | | |
| Total from investment operations | | | 2.53 | | | | (4.13 | ) | | | (0.53 | ) | | | (0.43 | ) | | | 3.96 | | | | (0.09 | ) | |
| Less Distributions to Shareholders: | |
| From net realized gains | | | — | | | | — | | | | (2.50 | ) | | | (3.29 | ) | | | (1.88 | ) | | | — | | |
| From return of capital | | | — | | | | — | | | | (0.02 | ) | | | — | | | | — | | | | — | | |
| Total distributions to shareholders | | | — | | | | — | | | | (2.52 | ) | | | (3.29 | ) | | | (1.88 | ) | | | — | | |
| Increase from regulatory settlements | | | 0.01 | | | | — | | | | — | | | | — | | | | — | | | | — | | |
| Net Asset Value, End of Period | | $ | 7.85 | | | $ | 5.31 | | | $ | 9.44 | | | $ | 12.49 | | | $ | 16.21 | | | $ | 14.13 | | |
| Total return (g)(h) | | | 47.83 | % | | | (43.75 | )% | | | (7.15 | )%(i) | | | (0.69 | )% | | | 29.92 | % | | | (0.63 | )% | |
Ratios to Average Net Assets/
Supplemental Data: | |
| Net expenses before interest expense | | | 2.11 | %(j) | | | 2.02 | %(j) | | | 1.95 | %(j)(k) | | | 1.98 | %(j) | | | 1.99 | % | | | 2.07 | % | |
| Interest expense | | | — | %(l) | | | — | %(l) | | | — | %(k)(l) | | | — | | | | — | | | | — | | |
| Net expenses | | | 2.11 | %(j) | | | 2.02 | %(j) | | | 1.95 | %(j)(k) | | | 1.98 | %(j) | | | 1.99 | % | | | 2.07 | % | |
| Waiver/Reimbursement | | | 0.01 | % | | | 0.05 | % | | | 0.04 | %(k) | | | 0.03 | % | | | 0.07 | %(m) | | | 0.08 | %(m) | |
| Net investment loss | | | (1.66 | )%(j) | | | (1.54 | )%(j) | | | (1.60 | )%(j)(k) | | | (1.58 | )%(j) | | | (1.59 | )% | | | (1.73 | )% | |
| Portfolio turnover rate | | | 105 | % | | | 130 | % | | | 3 | %(i)(n) | | | — | | | | — | | | | — | | |
Turnover of Columbia Small Cap
Growth Master Portfolio | | | — | | | | — | | | | 199 | %(i) | | | 188 | % | | | 117 | % | | | 59 | % | |
| Net assets, end of period (000s) | | $ | 3,340 | | | $ | 3,362 | | | $ | 9,184 | | | $ | 13,018 | | | $ | 16,229 | | | $ | 16,131 | | |
(a) The per share amounts and percentages reflect income and expenses assuming inclusion of the Fund's proportionate share of the income and expenses of Columbia Small Cap Growth Master Portfolio.
(b) The Fund changed its fiscal year end from March 31 to February 29. Per share data and total return reflect activity from April 1, 2007 through February 29, 2008.
(c) Effective February 28, 2008, the Fund converted to a stand-alone fund. Prior to February 28, 2008, the Fund operated in a master-feeder structure.
(d) On August 22, 2005, the Fund's Investor B shares were renamed Class B shares.
(e) Per share data was calculated using the average shares outstanding during the period.
(f) The amount shown for a share outstanding does not correspond with the aggregate net gain on investments for the year due to the timing of sales and repurchases of Fund shares in relation to fluctuating market values of the investments of the Columbia Small Cap Growth Master Portfolio.
(g) Total return at net asset value assuming all distributions reinvested and no contingent deferred sales charge.
(h) Had the investment advisor and/or any of its affiliates not waived fees or reimbursed a portion of expenses, total return would have been reduced.
(i) Not annualized.
(j) The benefits derived from expense reductions had an impact of less than 0.01%.
(k) Annualized.
(l) Rounds to less than 0.01%.
(m) Bank of America Corporation assumed certain non-recurring costs. Absent these non-recurring costs, the waiver/reimbursement ratio would have been 0.01% and 0.05% for the years ended March 31, 2006 and March 31, 2005, respectively.
(n) Amount represents results after the Fund's conversion to a stand-alone structure on February 28, 2008.
See Accompanying Notes to Financial Statements.
17
Financial Highlights – Columbia Small Cap Growth Fund II
Selected data for a share outstanding throughout each period is as follows:
| | | Year Ended February 28, | | Period Ended
February 29, | | Year Ended March 31, | |
| Class C Shares | | 2010 | | 2009 | | 2008 (a)(b)(c) | | 2007 (a) | | 2006 (a)(d) | | 2005 (a) | |
| Net Asset Value, Beginning of Period | | $ | 5.44 | | | $ | 9.67 | | | $ | 12.74 | | | $ | 16.47 | | | $ | 14.33 | | | $ | 14.42 | | |
| Income from Investment Operations: | |
| Net investment loss (e) | | | (0.12 | ) | | | (0.13 | ) | | | (0.17 | ) | | | (0.21 | ) | | | (0.24 | ) | | | (0.24 | ) | |
Net realized and unrealized gain (loss)
on investments and written options | | | 2.71 | | | | (4.10 | ) | | | (0.38 | ) | | | (0.23 | )(f) | | | 4.26 | | | | 0.15 | | |
| Total from investment operations | | | 2.59 | | | | (4.23 | ) | | | (0.55 | ) | | | (0.44 | ) | | | 4.02 | | | | (0.09 | ) | |
| Less Distributions to Shareholders: | |
| From net realized gains | | | — | | | | — | | | | (2.50 | ) | | | (3.29 | ) | | | (1.88 | ) | | | — | | |
| From return of capital | | | — | | | | — | | | | (0.02 | ) | | | — | | | | — | | | | — | | |
| Total distributions to shareholders | | | — | | | | — | | | | (2.52 | ) | | | (3.29 | ) | | | (1.88 | ) | | | — | | |
| Increase from regulatory settlements | | | 0.01 | | | | — | | | | — | | | | — | | | | — | | | | — | | |
| Net Asset Value, End of Period | | $ | 8.04 | | | $ | 5.44 | | | $ | 9.67 | | | $ | 12.74 | | | $ | 16.47 | | | $ | 14.33 | | |
| Total return (g)(h) | | | 47.79 | % | | | (43.74 | )% | | | (7.17 | )%(i) | | | (0.74 | )% | | | 29.93 | % | | | (0.62 | )% | |
Ratios to Average Net Assets/
Supplemental Data: | |
| Net expenses before interest expense | | | 2.11 | %(j) | | | 2.02 | %(j) | | | 1.95 | %(j)(k) | | | 1.98 | %(j) | | | 1.99 | % | | | 2.07 | % | |
| Interest expense | | | — | %(l) | | | — | %(l) | | | — | %(k)(l) | | | — | | | | — | | | | — | | |
| Net expenses | | | 2.11 | %(j) | | | 2.02 | %(j) | | | 1.95 | %(j)(k) | | | 1.98 | %(j) | | | 1.99 | % | | | 2.07 | % | |
| Waiver/Reimbursement | | | 0.01 | % | | | 0.05 | % | | | 0.04 | %(k) | | | 0.03 | % | | | 0.07 | %(m) | | | 0.08 | %(m) | |
| Net investment loss | | | (1.66 | )%(j) | | | (1.55 | )%(j) | | | (1.60 | )%(j)(k) | | | (1.57 | )%(j) | | | (1.59 | )% | | | (1.73 | )% | |
| Portfolio turnover rate | | | 105 | % | | | 130 | % | | | 3 | %(i)(n) | | | — | | | | — | | | | — | | |
Turnover of Columbia Small Cap
Growth Master Portfolio | | | — | | | | — | | | | 199 | %(i) | | | 188 | % | | | 117 | % | | | 59 | % | |
| Net assets, end of period (000s) | | $ | 2,629 | | | $ | 2,081 | | | $ | 3,689 | | | $ | 4,998 | | | $ | 4,452 | | | $ | 3,651 | | |
(a) The per share amounts and percentages reflect income and expenses assuming inclusion of the Fund's proportionate share of the income and expenses of Columbia Small Cap Growth Master Portfolio.
(b) The Fund changed its fiscal year end from March 31 to February 29. Per share data and total return reflect activity from April 1, 2007 through February 29, 2008.
(c) Effective February 28, 2008, the Fund converted to a stand-alone fund. Prior to February 28, 2008, the Fund operated in a master-feeder structure.
(d) On August 22, 2005, the Fund's Investor C shares were renamed Class C shares.
(e) Per share data was calculated using the average shares outstanding during the period.
(f) The amount shown for a share outstanding does not correspond with the aggregate net gain on investments for the year due to the timing of sales and repurchases of Fund shares in relation to fluctuating market values of the investments of the Columbia Small Cap Growth Master Portfolio.
(g) Total return at net asset value assuming all distributions reinvested and no contingent deferred sales charge.
(h) Had the investment advisor and/or any of its affiliates not waived fees or reimbursed a portion of expenses, total return would have been reduced.
(i) Not annualized.
(j) The benefits derived from expense reductions had an impact of less than 0.01%.
(k) Annualized.
(l) Rounds to less than 0.01%.
(m) Bank of America Corporation assumed certain non-recurring costs. Absent these non-recurring costs, the waiver/reimbursement ratio would have been 0.01% and 0.05% for the years ended March 31, 2006 and March 31, 2005, respectively.
(n) Amount represents results after the Fund's conversion to a stand-alone structure on February 28, 2008.
See Accompanying Notes to Financial Statements.
18
Financial Highlights – Columbia Small Cap Growth Fund II
Selected data for a share outstanding throughout each period is as follows:
| | | Year Ended February 28, | | Period Ended
February 29, | | Year Ended March 31, | |
| Class Z Shares | | 2010 | | 2009 | | 2008 (a)(b)(c) | | 2007 (a) | | 2006 (a)(d) | | 2005 (a) | |
| Net Asset Value, Beginning of Period | | $ | 6.25 | | | $ | 11.01 | | | $ | 14.30 | | | $ | 18.06 | | | $ | 15.40 | | | $ | 15.35 | | |
| Income from Investment Operations: | |
| Net investment loss (e) | | | (0.06 | ) | | | (0.05 | ) | | | (0.07 | ) | | | (0.08 | ) | | | (0.10 | ) | | | (0.11 | ) | |
Net realized and unrealized gain (loss)
on investments and written options | | | 3.14 | | | | (4.71 | ) | | | (0.44 | ) | | | (0.23 | )(f) | | | 4.64 | | | | 0.16 | | |
| Total from investment operations | | | 3.08 | | | | (4.76 | ) | | | (0.51 | ) | | | (0.31 | ) | | | 4.54 | | | | 0.05 | | |
| Less Distributions to Shareholders: | |
| From net realized gains | | | — | | | | — | | | | (2.76 | ) | | | (3.45 | ) | | | (1.88 | ) | | | — | | |
| From return of capital | | | — | | | | — | | | | (0.02 | ) | | | — | | | | — | | | | — | | |
| Total distributions to shareholders | | | — | | | | — | | | | (2.78 | ) | | | (3.45 | ) | | | (1.88 | ) | | | — | | |
| Increase from regulatory settlements | | | 0.01 | | | | — | | | | — | | | | — | | | | — | | | | — | | |
| Net Asset Value, End of Period | | $ | 9.34 | | | $ | 6.25 | | | $ | 11.01 | | | $ | 14.30 | | | $ | 18.06 | | | $ | 15.40 | | |
| Total return (g)(h) | | | 49.44 | % | | | (43.23 | )% | | | (6.31 | )%(i) | | | 0.33 | % | | | 31.26 | % | | | 0.33 | % | |
Ratios to Average Net Assets/
Supplemental Data: | |
| Net expenses before interest expense | | | 1.11 | %(j) | | | 1.02 | %(j) | | | 0.95 | %(j)(k) | | | 0.98 | %(j) | | | 0.99 | % | | | 1.07 | % | |
| Interest expense | | | — | %(l) | | | — | %(l) | | | — | %(k)(l) | | | — | | | | — | | | | — | | |
| Net expenses | | | 1.11 | %(j) | | | 1.02 | %(j) | | | 0.95 | %(j)(k) | | | 0.98 | %(j) | | | 0.99 | % | | | 1.07 | % | |
| Waiver/Reimbursement | | | 0.01 | % | | | 0.05 | % | | | 0.04 | %(k) | | | 0.03 | % | | | 0.07 | %(m) | | | 0.08 | %(m) | |
| Net investment loss | | | (0.65 | )%(j) | | | (0.54 | )%(j) | | | (0.59 | )%(j)(k) | | | (0.56 | )%(j) | | | (0.59 | )% | | | (0.73 | )% | |
| Portfolio turnover rate | | | 105 | % | | | 130 | % | | | 3 | %(i)(n) | | | — | | | | — | | | | — | | |
Turnover of Columbia Small Cap
Growth Master Portfolio | | | — | | | | — | | | | 199 | %(i) | | | 188 | % | | | 117 | % | | | 59 | % | |
| Net assets, end of period (000s) | | $ | 214,574 | | | $ | 143,511 | | | $ | 279,900 | | | $ | 378,164 | | | $ | 308,930 | | | $ | 360,975 | | |
(a) The per share amounts and percentages reflect income and expenses assuming inclusion of the Fund's proportionate share of the income and expenses of Columbia Small Cap Growth Master Portfolio.
(b) The Fund changed its fiscal year end from March 31 to February 29. Per share data and total return reflect activity from April 1, 2007 through February 29, 2008.
(c) Effective February 28, 2008, the Fund converted to a stand-alone fund. Prior to February 28, 2008, the Fund operated in a master-feeder structure.
(d) On August 22, 2005, the Fund's Investor Z shares were renamed Class Z shares.
(e) Per share data was calculated using the average shares outstanding during the period.
(f) The amount shown for a share outstanding does not correspond with the aggregate net gain on investments for the year due to the timing of sales and repurchases of Fund shares in relation to fluctuating market values of the investments of the Columbia Small Cap Growth Master Portfolio.
(g) Total return at net asset value assuming all distributions reinvested.
(h) Had the investment advisor and/or any of its affiliates not waived fees or reimbursed a portion of expenses, total return would have been reduced.
(i) Not annualized.
(j) The benefits derived from expense reductions had an impact of less than 0.01%.
(k) Annualized.
(l) Rounds to less than 0.01%.
(m) Bank of America Corporation assumed certain non-recurring costs. Absent these non-recurring costs, the waiver/reimbursement ratio would have been 0.01% and 0.05% for the years ended March 31, 2006 and March 31, 2005, respectively.
(n) Amount represents results after the Fund's conversion to a stand-alone structure on February 28, 2008.
See Accompanying Notes to Financial Statements.
19
Notes to Financial Statements – Columbia Small Cap Growth Fund II
February 28, 2010
Note 1. Organization
Columbia Small Cap Growth Fund II (the "Fund"), a series of Columbia Funds Series Trust (the "Trust"), is a diversified fund. The Trust is registered under the Investment Company Act of 1940, as amended (the "1940 Act"), as an open-end management investment company organized as a Delaware statutory trust.
Investment Objective
The Fund seeks long-term growth of capital.
Fund Shares
The Trust may issue an unlimited number of shares, and the Fund offers four classes of shares: Class A, Class B, Class C and Class Z. Each share class has its own expense structure and sales charges, as applicable. Effective June 22, 2009, the Fund no longer accepts investments from new or existing investors in the Fund's Class B shares, except in connection with the reinvestment of any dividend and/or capital gain distributions in Class B shares of the Fund and exchanges by existing Class B shareholders of the other Columbia Funds.
Class A shares are subject to a maximum front-end sales charge of 5.75% based on the amount of initial investment. Class A shares purchased without an initial sales charge in accounts aggregating $1 million to $50 million at the time of purchase are subject to a 1.00% contingent deferred sales charge ("CDSC") if the shares are sold within one year after purchase. Class B shares are subject to a maximum CDSC of 5.00% based upon the holding period after purchase. Class B shares will convert to Class A shares eight years after purchase. Class C shares are subject to a 1.00% CDSC on shares sold within one year after purchase. Class Z shares are offered continuously at net asset value. There are certain restrictions on the purchase of Class Z shares, as described in the Fund's prospectus.
Note 2. Significant Accounting Policies
The preparation of financial statements in accordance with accounting principles generally accepted in the United States of America ("GAAP") requires management to make certain estimates and assumptions that affect the reported amounts of assets and liabilities, the disclosure of contingent assets and liabilities at the date of the financial statements and the reported amounts of revenue and expenses during the reporting period. Actual results could differ from those estimates.
The following is a summary of significant accounting policies consistently followed by the Fund in the preparation of its financial statements.
Security Valuation
Equity securities are valued at the last sale price on the principal exchange on which they trade, except for securities traded on the NASDAQ, which are valued at the NASDAQ official close price. Unlisted securities or listed securities for which there were no sales during the day are valued at the closing bid price on such exchanges or over-the-counter markets.
Short-term investments maturing in 60 days or less are valued at amortized cost, which approximates market value.
Investments for which market quotations are not readily available, or that have quotations which management believes are not reliable, are valued at fair value as determined in good faith under consistently applied procedures established by and under the general supervision of the Board of Trustees. If a security is valued at fair value, such value is likely to be different from the last quoted market price for the security. The determination of fair value often requires significant judgment. To determine fair value, management may use assumptions including but not limited to future cash flows and estimated risk premiums. Multiple inputs from various sources may be used to determine value.
GAAP establishes a hierarchy that prioritizes the inputs to valuation techniques used to measure fair value giving the highest priority to unadjusted quoted prices in active markets for identical securities (level 1 measurements) and the lowest priority to unobservable inputs (level 3 measurements) when market prices are not readily available or reliable. The three levels of the fair value hierarchy are described below:
• Level 1 – quoted prices in active markets for identical securities
• Level 2 – prices determined using other significant observable inputs (including quoted prices for similar securities, interest rates, prepayment speeds, credit risk and others)
• Level 3 – prices determined using significant unobservable inputs. In situations where quoted
20
Columbia Small Cap Growth Fund II, February 28, 2010
prices or observable inputs are unavailable or less reliable, unobservable inputs may be used. Unobservable inputs may include management's own assumptions about the factors market participants would use in pricing an investment.
The inputs or methodology used for valuing securities are not necessarily an indication of the risk associated with investing in those securities.
Security Transactions
Security transactions are accounted for on the trade date. Cost is determined and gains (losses) are based upon the specific identification method for both financial statement and federal income tax purposes.
Repurchase Agreements
The Fund may engage in repurchase agreement transactions with institutions that Columbia Management Advisors, LLC ("Columbia"), the Fund's investment advisor, has determined are creditworthy. The Fund, through its custodian, receives delivery of the underlying securities collateralizing a repurchase agreement. Columbia is responsible for determining that the collateral is at least equal, at all times, to the value of the repurchase obligation including interest. A repurchase agreement transaction involves certain risks in the event of default or insolvency of the counterparty. These risks include possible delays in or restrictions on the Fund's ability to dispose of the underlying securities and a possible decline in the value of the underlying securities during the period while the Fund seeks to assert its rights.
Income Recognition
Interest income is recorded on the accrual basis.
Corporate actions and dividend income are recorded on the ex-date.
Distributions received from real estate investment trusts (REITs) in excess of their income are recorded as a reduction of the cost of the related investments. If the Fund no longer owns the applicable securities, any distributions received in excess of income are recorded as realized gains.
Expenses
General expenses of the Trust are allocated to the Fund and other series of the Trust based upon relative net assets or other expense allocation methodologies determined by the nature of the expense. Expenses directly attributable to the Fund are charged to the Fund.
Determination of Class Net Asset Value
All income, expenses (other than class-specific expenses, as shown on the Statement of Operations) and realized and unrealized gains (losses) are allocated to each class of the Fund on a daily basis for purposes of determining the net asset value of each class. Income and expenses are allocated to each class based on the settled shares method, while realized and unrealized gains (losses) are allocated based on the relative net assets of each class.
Federal Income Tax Status
The Fund intends to qualify each year as a "regulated investment company" under Subchapter M of the Internal Revenue Code, as amended, and will distribute substantially all of its taxable income, if any, for its tax year, and as such will not be subject to federal income taxes. In addition, the Fund intends to distribute in each calendar year substantially all of its net investment income, capital gains and certain other amounts, if any, such that the Fund should not be subject to federal excise tax. Therefore, no provision is made for federal income or excise taxes.
Distributions to Shareholders
Distributions from net investment income, if any, are declared and paid annually. The Fund may, however, declare and pay distributions from net investment income more frequently. The Fund will distribute net realized capital gains (including net short-term capital gains) at least annually after the fiscal year in which the capital gains were earned, unless offset by any available capital loss carryforward. Income distributions and capital gain distributions are determined in accordance with federal income tax regulations which may differ from GAAP.
Indemnification
In the normal course of business, the Fund enters into contracts that contain a variety of representations and
21
Columbia Small Cap Growth Fund II, February 28, 2010
warranties and which provide general indemnities. The Fund's maximum exposure under these arrangements is unknown because this would involve future claims against the Fund. Also, under the Trust's organizational documents and by contract, the Trustees and officers of the Trust are indemnified against certain liabilities that may arise out of actions relating to their duties to the Trust. However, based on experience, the Fund expects the risk of loss due to these representations, warranties and indemnities to be minimal.
Note 3. Federal Tax Information
The timing and character of income and capital gain distributions are determined in accordance with income tax regulations, which may differ from GAAP. Reclassifications are made to the Fund's capital accounts for permanent tax differences to reflect income and gains available for distribution (or available capital loss carryforwards) under income tax regulations.
For the year ended February 28, 2010, permanent book and tax basis differences resulting primarily from differing treatments for net operating losses and proceeds received from litigation settlements were identified and reclassified among the components of the Fund's net assets as follows:
Accumulated
Net Investment
Loss | | Accumulated
Net Realized
Loss | | Paid-In Capital | |
| $ | 2,511,912 | | | $ | (331,302 | ) | | $ | (2,180,610 | ) | |
Net investment income and net realized gains (losses), as disclosed on the Statement of Operations, and net assets were not affected by this reclassification.
The tax character of distributions paid during the years ended February 28, 2010 and February 28, 2009 was as follows:
| | | February 28, | |
| Distributions paid from: | | 2010 | | 2009 | |
| Ordinary Income* | | | — | | | | — | | |
| Long-Term Capital Gains | | | — | | | | — | | |
| Tax Return of Capital | | | — | | | | — | | |
* For tax purposes short-term capital gain distributions, if any, are considered ordinary income distributions.
As of February 28, 2010, the components of distributable earnings on a tax basis were as follows:
Undistributed
Ordinary
Income | | Undistributed
Long-Term
Capital Gains | | Net Unrealized
Appreciation* | |
| $ | — | | | $ | — | | | $ | 29,906,268 | | |
* The differences between book-basis and tax-basis net unrealized appreciation are primarily due to deferral of losses from wash sales.
Unrealized appreciation and depreciation at February 28, 2010, based on cost of investments for federal income tax purposes were:
| Unrealized appreciation | | $ | 52,370,388 | | |
| Unrealized depreciation | | | (22,464,120 | ) | |
| Net unrealized appreciation | | $ | 29,906,268 | | |
The following capital loss carryforwards may be available to reduce taxable income arising from future net realized gains on investments, if any, to the extent permitted by the Internal Revenue Code:
| Year of Expiration | | Capital Loss
Carryforwards | |
| 2017 | | $ | 60,634,568 | | |
| 2018 | | | 69,882,820 | | |
| | | $ | 130,517,388 | | |
Under current tax rules, certain currency and capital losses realized after October 31 may be deferred and treated as occurring on the first day of the following fiscal year. As of February 28, 2010, post-October capital losses of $3,180,680 attributed to security transactions were deferred to March 1, 2010.
Management is required to determine whether a tax position of the Fund is more likely than not to be sustained upon examination by the applicable taxing authority, including resolution of any related appeals or litigation processes, based on the technical merits of the position. The tax benefit to be recognized by the Fund is measured as the largest amount of benefit that is greater than fifty percent likely of being realized upon ultimate settlement. Management is not aware of any tax
22
Columbia Small Cap Growth Fund II, February 28, 2010
positions for which it is reasonably possible that the total amounts of unrecognized tax benefits will significantly change in the next twelve months. However, management's conclusions may be subject to review and adjustment at a later date based on factors including, but not limited to, new tax laws, regulations, and administrative interpretations (including relevant court decisions). The Fund's federal tax returns for the prior three fiscal years remain subject to examination by the Internal Revenue Service.
Note 4. Fees and Compensation Paid to Affiliates
Investment Advisory Fee
Columbia, an indirect, wholly owned subsidiary of Bank of America Corporation ("BOA"), provides investment advisory services to the Fund. In rendering investment advisory services to the Fund, Columbia may use the portfolio management and research resources of Columbia Management Pte. Ltd, an affiliate of Columbia. Columbia receives a monthly investment advisory fee based on the Fund's average daily net assets at the following annual rates:
| Average Daily Net Assets | | Annual Fee Rate | |
| First $500 million | | | 0.70 | % | |
| $500 million to $1 billion | | | 0.65 | % | |
| Over $1 billion | | | 0.60 | % | |
For the year ended February 28, 2010, the Fund's effective investment advisory fee rate was 0.70% of the Fund's average daily net assets.
Bank of America, N.A., an indirect parent company of Columbia, entered into an agreement dated September 29, 2009, to sell a portion of the asset management business of Columbia Management Group, LLC to Ameriprise Financial, Inc. ("Ameriprise Financial"). The transaction ("Transaction") includes the sale of the part of the asset management business that advises long-term mutual funds, including the Fund. The Transaction is subject to certain approvals and other conditions to closing, and is currently expected to close on or about May 1, 2010 (the "Closing"). In connection with the Closing, certain changes will occur, including a change in the entities serving as the investment advisor, administrator, distributor and transfer agent of the Fund. RiverSource Investments, LLC (the "New Advisor"), a subsidiary of Ameriprise Financial, will become the investment advisor of the Fund upon the Closing. The New Advisor will serve as inves tment advisor under a new investment management services agreement effective upon the closing. The New Advisor expects to change its name to Columbia Management Investment Advisers, LLC upon or shortly after the Closing. Effective upon the Closing, as the context requires, references to Columbia shall be deemed to refer to the New Advisor.
Administration Fee
Columbia provides administrative and other services to the Fund for a monthly administration fee at the annual rate of 0.117% of the Fund's average daily net assets, less the fees payable by the Fund as described under the Pricing and Bookkeeping Fees note below.
The New Advisor will become the administrator of the Fund under a new administrative services agreement effective upon the Closing.
Pricing and Bookkeeping Fees
The Fund has entered into a Financial Reporting Services Agreement (the "Financial Reporting Services Agreement") with State Street Bank and Trust Company ("State Street") and Columbia pursuant to which State Street provides financial reporting services to the Fund. The Fund has also entered into an Accounting Services Agreement (collectively with the Financial Reporting Services Agreement, the "State Street Agreements") with State Street and Columbia pursuant to which State Street provides accounting services to the Fund. Under the State Street Agreements, the Fund pays State Street an annual fee of $38,000 paid monthly plus an additional monthly fee based on an annualized percentage rate of average daily net assets of the Fund for the month. The aggregate fee will not exceed $140,000 per year (exclusive of out-of-pocket expenses and charges). The Fund also reimburses State Street for certain out-of-pocket expenses and charges.
Among other updates to the State Street Agreements, Columbia will assign and delegate its rights and obligations thereunder to the New Advisor upon the Closing.
The Fund has entered into a Pricing and Bookkeeping Oversight and Services Agreement (the "Services
23
Columbia Small Cap Growth Fund II, February 28, 2010
Agreement") with Columbia. Under the Services Agreement, Columbia provides services related to Fund expenses and the requirements of the Sarbanes-Oxley Act of 2002, and provides oversight of the accounting and financial reporting services provided by State Street. Under the Services Agreement, the Fund reimburses Columbia for out-of-pocket expenses and charges, including fees payable to third parties, such as for pricing the Fund's portfolio securities, incurred by Columbia in the performance of services under the Services Agreement.
The Services Agreement will be terminated upon the Closing, and the services provided thereunder will be covered under the administrative services agreement with the New Advisor.
Transfer Agent Fee
Columbia Management Services, Inc. (the "Transfer Agent"), an affiliate of Columbia and an indirect, wholly owned subsidiary of BOA, provides shareholder services to the Fund and has contracted with Boston Financial Data Services ("BFDS") to serve as sub-transfer agent. Effective January 1, 2010, the Transfer Agent is entitled to receive a fee for its services, paid monthly, at the annual rate of $22.36 per account plus reimbursement of certain sub-transfer agent fees paid by the Transfer Agent (exclusive of BFDS fees), calculated based on assets held in omnibus accounts and intended to recover the cost of payments to other parties (including affiliates of BOA) for services to those accounts. Prior to January 1, 2010, the annual rate was $17.34 per account. The Transfer Agent pays the fees of BFDS for services as sub-transfer agent and is not entitled to reimbursement for such fees from the Fund.
The Transfer Agent may also retain, as additional compensation for its services, fees for wire, telephone and redemption orders, Individual Retirement Account ("IRA") trustee agent fees and account transcript fees due to the Transfer Agent from shareholders of the Fund and credits (net of bank charges) earned with respect to balances in accounts the Transfer Agent maintains in connection with its services to the Fund. The Transfer Agent also receives reimbursement for certain out-of-pocket expenses.
Prior to May 1, 2009, the Transfer Agent voluntarily waived a portion of its fees for accounts other than omnibus accounts, so that transfer agent fees (exclusive of out-of-pocket expenses and sub-transfer agent fees) did not exceed 0.02% annually of the Fund's average daily net assets.
An annual minimum account balance fee of $20 may apply to certain accounts with a value below the Fund's initial minimum investment requirements to reduce the impact of small accounts on transfer agent fees. These minimum account balance fees are recorded as part of expense reductions on the Statement of Operations. For the year ended February 28, 2010, no minimum account balance fees were charged by the Fund.
RiverSource Service Corporation (the "New Transfer Agent"), a subsidiary of Ameriprise Financial, will become the transfer agent of the Fund upon the Closing. The New Transfer Agent expects to change its name to Columbia Management Investment Services Corp. upon or shortly after the Closing.
Underwriting Discounts, Service and Distribution Fees
Columbia Management Distributors, Inc. (the "Distributor"), an affiliate of Columbia and an indirect, wholly owned subsidiary of BOA, is the principal underwriter of the Fund's shares. For the year ended February 28, 2010, the Distributor has retained net underwriting discounts of $3,046 on sales of the Fund's Class A shares and received net CDSC fees of $1,948 and $551 on Class B and Class C share redemptions, respectively.
RiverSource Fund Distributors, Inc. (the "New Distributor"), a subsidiary of Ameriprise Financial, will become the distributor of the Fund upon the Closing. The New Distributor expects to change its name to Columbia Management Investment Distributors, Inc. upon or shortly after the Closing.
The Trust has adopted shareholder servicing plans and distribution plans for the Class B and Class C shares of the Fund and a combined distribution and shareholder servicing plan for the Class A shares of the Fund. The shareholder servicing plans permit the Fund to compensate or reimburse servicing agents for the shareholder services they have provided. The distribution plans, adopted pursuant to Rule 12b-1 under the 1940 Act, permit the Fund to compensate or reimburse the Distributor and/or selling agents for activities or expenses primarily intended to result in the sale of the classes' shares. Payments are made at an annual rate and paid monthly, as a percentage of average daily net assets, set from time to time by the Board of Trustees, and are charged as expenses of the Fund directly to the applicable share class. A substantial portion of the expenses incurred
24
Columbia Small Cap Growth Fund II, February 28, 2010
pursuant to these plans is paid to affiliates of BOA and the Distributor.
The annual rates in effect and plan limits, as a percentage of average daily net assets are as follows:
| | | Current
Rate | |
Plan Limit | |
Class A Combined Distribution
and Shareholder Servicing Plan | | | 0.25 | % | | | 0.25 | % | |
Class B and Class C
Shareholder Servicing Plans | | | 0.25 | % | | | 0.25 | % | |
Class B and Class C
Distribution Plans | | | 0.75 | % | | | 0.75 | % | |
Expense Limits and Fee Waivers
Effective July 1, 2009, Columbia has voluntarily agreed to reimburse a portion of the Fund's expenses so that the Fund's ordinary operating expenses (excluding any distribution and service fees, brokerage commissions, interest, taxes and extraordinary expenses, but including custodian charges relating to overdrafts, if any) after giving effect to any balance credits from the Fund's custodian, do not exceed the annual rate of 1.10% of the Fund's average daily net assets. Columbia, in its discretion, may revise or discontinue this arrangement at any time.
Prior to July 1, 2009, Columbia contractually agreed to bear a portion of the Fund's expenses so that the Fund's ordinary operating expenses (excluding any distribution and service fees, brokerage commissions, interest, taxes and extraordinary expenses, but including custodian charges relating to overdrafts, if any) after giving effect to any balance credits from the Fund's custodian, did not exceed the annual rate of 1.15% of the Fund's average daily net assets.
Columbia is entitled to recover from the Fund any fees waived and/or expenses reimbursed for a three year period following the date of such fee waiver and/or reimbursement if such recovery does not cause the Fund's expenses to exceed the expense limitations in effect at the time of recovery. At February 28, 2010, no amounts were potentially recoverable from the Fund pursuant to this arrangement.
Fees Paid to Officers and Trustees
All officers of the Fund are employees of Columbia or its affiliates and, with the exception of the Fund's Chief Compliance Officer, receive no compensation from the Fund. The Board of Trustees has appointed a Chief Compliance Officer to the Fund in accordance with federal securities regulations. The Fund, along with other affiliated funds, pays its pro-rata share of the expenses associated with the Chief Compliance Officer. The Fund's expenses for the Chief Compliance Officer will not exceed $15,000 per year.
Trustees are compensated for their services to the Fund, as set forth on the Statement of Operations. The Trust's eligible Trustees may participate in a non-qualified deferred compensation plan which may be terminated at any time. Any payments to plan participants are paid solely out of the Fund's assets. Income earned on the plan participant's deferral account is based on the rate of return of the eligible mutual funds selected by the participant or, if no funds are selected, on the rate of return of Columbia Treasury Reserves, another portfolio of the Trust. The expense for the deferred compensation plan, which includes trustees' fees deferred during the current period as well as any gains or losses on the trustees' deferred compensation balances as a result of market fluctuations, is included in "Trustees' fees" on the Statement of Operations. The liability for the deferred compensation plan is included in "Trustees' fees" on the Statement of Assets and Liabilities.
As a result of a fund merger, the Fund assumed the liabilities of the deferred compensation plan of the acquired fund, which are included in "Trustees' fee" on the Statement of Assets and Liabilities. The deferred compensation plan may be terminated at any time. Any payments to plan participants are paid solely out of the Fund's assets.
Other Related Party Transactions
In connection with the purchase and sale of its securities during the period, the Fund used one or more brokers that are affiliates of BOA. Total brokerage commissions paid to affiliated brokers for the year ended February 28, 2010 was $7,223.
25
Columbia Small Cap Growth Fund II, February 28, 2010
Note 5. Custody Credits
The Fund has an agreement with its custodian bank under which custody fees may be reduced by balance credits. These credits are recorded as part of expense reductions on the Statement of Operations. The Fund could have invested a portion of the assets utilized in connection with the expense offset arrangement in an income-producing asset if it had not entered into such an agreement. For the year ended February 28, 2010, these custody credits reduced total expenses by $7 for the Fund.
Note 6. Portfolio Information
For the year ended February 28, 2010, the cost of purchases and proceeds from sales of securities, excluding short-term obligations, for the Fund were $332,716,001 and $350,791,665, respectively.
Note 7. Regulatory Settlements
During the year ended February 28, 2010, the Fund received payments totaling $543,481 relating to certain regulatory settlements with third parties that the Fund had participated in during the year. The payments have been included in "Increase from regulatory settlements" on the Statement of Changes in Net Assets.
Note 8. Line of Credit
The Fund and other affiliated funds participate in a $280,000,000 committed, unsecured revolving line of credit provided by State Street. The maximum amount that may be borrowed by any fund is limited to the lesser of $200,000,000 and the Fund's borrowing limit set forth in the Fund's registration statement. Borrowings are available for short-term liquidity or temporary or emergency purposes.
Effective October 15, 2009, interest is charged to each participating fund based on the fund's borrowings at a rate per annum equal to the greater of the Federal Funds Rate plus 1.25% or the overnight LIBOR Rate plus 1.25%. In addition, a commitment fee of 0.15% per annum is accrued and apportioned among the participating funds pro rata based on their relative net assets.
Prior to October 15, 2009, interest was charged to each participating fund based on the fund's borrowings at a rate per annum equal to the greater of the Federal Funds Rate plus 0.50% or the overnight LIBOR Rate plus 0.50%. In addition, an annual operations agency fee of $20,000, an amendment fee of 0.02% and a commitment fee of 0.12% per annum were accrued and apportioned among the participating funds pro rata based on their relative net assets.
For the year ended February 28, 2010, the average daily loan balance outstanding on days where borrowing existed was $7,100,000 at a weighted average interest rate of 1.00%.
Note 9. Securities Lending
The Fund may lend its securities to certain approved brokers, dealers and other financial institutions. Each loan is collateralized by cash, in an amount at least equal to the market value of the securities loaned plus accrued income from the investment of collateral. The market value of the loaned securities is determined at the close of business of the Fund and any additional required collateral is delivered to the Fund on the next business day. The collateral received is invested and the income generated by the investment of the collateral, net of any fees remitted to State Street as the lending agent and borrower rebates, is paid to the Fund. Generally, in the event of borrower default, the Fund has the right to use the collateral to offset any losses incurred. In the event the Fund is delayed or prevented from exercising its right to dispose of the collateral, there may be a potential loss to the Fund. The Fund bears the ri sk of loss with respect to the investment of collateral.
For the year ended February 28, 2010, the Fund did not participate in the securities lending program.
Note 10. Shares of Beneficial Interest
As of February 28, 2010, 37.9% of the Fund's shares outstanding were beneficially owned by one participant account over which BOA and/or any of its affiliates had either sole or joint investment discretion.
As of February 28, 2010, no other shareholder owned more than 5% of the outstanding shares of the Fund.
Subscription and redemption activity of this account may have a significant effect on the operations of the Fund.
26
Columbia Small Cap Growth Fund II, February 28, 2010
Note 11. Significant Risks and Contingencies
Legal Proceedings
Columbia Management Advisors, LLC and Columbia Management Distributors, Inc. (collectively, the "Columbia Group") are subject to a settlement agreement with the New York Attorney General ("NYAG") (the "NYAG Settlement") and a settlement order with the Securities and Exchange Commission ("SEC") (the "SEC Order") on matters relating to mutual fund trading, each dated February 9, 2005. Under the terms of the SEC Order, the Columbia Group (or predecessor or affiliated entities) agreed, among other things, to: pay disgorgement and civil money penalties collectively totaling $375 million; cease and desist from violations of the antifraud provisions and certain other provisions of the federal securities laws; maintain certain compliance and ethics oversight structures; and retain an independent consultant to review the Columbia Group's applicable supervisory, compliance, control and other policies and procedures. The NYAG Settlement, a mong other things, requires Columbia Management Advisors, LLC and its affiliates to make certain disclosures to investors relating to expenses. In connection with the Columbia Group providing services to the Columbia Funds, the Columbia Funds have voluntarily undertaken to implement certain governance measures designed to maintain the independence of their boards of trustees and certain special consulting and compliance measures.
Pursuant to the SEC Order and related procedures, the $375 million in settlement amounts described above, of which approximately $90 million has been earmarked for certain Columbia Funds and their shareholders, is being distributed in accordance with a distribution plan developed by an independent distribution consultant and approved by the SEC on December 27, 2007. Distributions under the distribution plan began in mid-June 2008 and the distribution earmarked for the Columbia Funds and their shareholders has been substantially completed.
Civil Litigation
In connection with the events that resulted in the NYAG Settlement and SEC Order, various parties filed suits against Bank of America Corporation and certain of its affiliates, including Banc of America Capital Management, LLC ("BACAP," now known as Columbia Management Advisors, LLC) and BACAP Distributors, LLC (now known as Columbia Management Distributors, Inc.) (collectively "BAC"), Nations Funds Trust (now known as Columbia Funds Series Trust) and its Board of Trustees. On February 20, 2004, the Judicial Panel on Multidistrict Litigation transferred these cases and cases against other mutual fund companies based on similar allegations to the United States District Court in Maryland for consolidated or coordinated pretrial proceedings (the "MDL"). Subsequently, additional related cases were transferred to the MDL. On September 29, 2004, the plaintiffs in the MDL filed amended and consolidated complaints. One of these amended complaints is a putative class action that includes claims under the federal securities laws and state common law, and that names Nations Funds Trust, the Trustees, BAC and others as defendants. Another of the amended complaints is a derivative action purportedly on behalf of the Nations Funds Trust against BAC and others that asserts claims under federal securities laws and state common law. Nations Funds Trust is a nominal defendant in this action.
On February 25, 2005, BAC and other defendants filed motions to dismiss the claims in the pending cases. On December 15, 2005, BAC and others entered into a Stipulation of Settlement of the direct and derivative claims brought on behalf of the Nations Funds shareholders. The settlement is subject to court approval. If the settlement is approved, BAC would pay settlement administration costs and fees to plaintiffs' counsel as approved by the court. The stipulation has not yet been presented to the court for approval.
Note 12. Subsequent Events
In connection with the preparation of the financial statements of the Fund as of and for the fiscal year ended February 28, 2010, events and transactions through the date the financial statements were issued have been evaluated by the Fund's management for possible adjustment and/or disclosure. No subsequent events or transactions had occurred that would require adjustment of the financial statements as presented. On March 3, 2010, the Fund's shareholders approved, among other matters, a proposed investment management services agreement with the New Advisor, the effectiveness of which is conditioned on the Closing.
27
Report of Independent Registered Public Accounting Firm
To the Trustees of Columbia Funds Series Trust and the Shareholders of Columbia Small Cap Growth Fund II
In our opinion, the accompanying statement of assets and liabilities, including the investment portfolio, and the related statements of operations and of changes in net assets and the financial highlights present fairly, in all material respects, the financial position of Columbia Small Cap Growth Fund II (the "Fund") (a series of Columbia Funds Series Trust) at February 28, 2010, the results of its operations, the changes in its net assets and the financial highlights for each of the periods indicated, in conformity with accounting principles generally accepted in the United States of America. These financial statements and financial highlights (hereafter referred to as "financial statements") are the responsibility of the Fund's management. Our responsibility is to express an opinion on these financial statements based on our audits. We conducted our audits of these financial statements in accordance with the standards of the Public Company Accounting Oversight Board (United States). Those standards require that we plan and perform the audit to obtain reasonable assurance about whether the financial statements are free of material misstatement. An audit includes examining, on a test basis, evidence supporting the amounts and disclosures in the financial statements, assessing the accounting principles used and significant estimates made by management, and evaluating the overall financial statement presentation. We believe that our audits, which included confirmation of securities at February 28, 2010 by correspondence with the custodian and brokers, provide a reasonable basis for our opinion.
PricewaterhouseCoopers LLP
Boston, Massachusetts
April 21, 2010
28
Fund Governance
The Trustees serve terms of indefinite duration. The names, addresses and ages of the Trustees and officers of the Funds of Columbia Funds Series Trust, the year each was first elected or appointed to office, their principal business occupations during at least the last five years, the number of Funds overseen by each Trustee and other directorships they hold are shown below. Each officer listed below serves as an officer of each Fund in the Columbia Funds Complex.
Independent Trustees
Name, Address and Age,
Position with Funds, Year First
Elected or Appointed to Office | | Principal Occupation(s) During Past Five Years, Number of Funds in the Columbia
Funds Complex Overseen by Trustee, Other Directorships Held
| |
| Edward J. Boudreau (Born 1944) | |
|
c/o Columbia Management
Advisors, LLC
One Financial Center
Boston, MA 02111
Trustee (since 2005) | | Managing Director—E.J. Boudreau & Associates (consulting), from 2000 through current; oversees 64; no other directorships held. | |
|
| William P. Carmichael (Born 1943) | |
|
c/o Columbia Management
Advisors, LLC
One Financial Center
Boston, MA 02111
Trustee (since 1999) | | Retired. Oversees 64; Director—Cobra Electronics Corporation (electronic equipment manufacturer); Director—Simmons Company (bedding); Director—The Finish Line (sportswear). | |
|
| William A. Hawkins (Born 1942) | |
|
c/o Columbia Management Advisors, LLC
One Financial Center
Boston, MA 02111
Trustee (since 2005) | | President and Chief Executive Officer—California General Bank, N.A., from January 2008 through current; oversees 64; no other directorships held. | |
|
| R. Glenn Hilliard (Born 1943) | |
|
c/o Columbia Management Advisors, LLC
One Financial Center
Boston, MA 02111
Trustee (since 2005) | | Chairman and Chief Executive Officer—Hilliard Group LLC (investing and consulting), from April 2003 through current; Non-Executive Director & Chairman—Conseco, Inc. (insurance), September 2003 through current; Executive Chairman—Conseco, Inc. (insurance), August 2004 through September 2005; oversees 64; Director—Conseco, Inc. (insurance). | |
|
| John J. Nagorniak (Born 1944) | |
|
c/o Columbia Management
Advisors, LLC
One Financial Center
Boston, MA 02111
Trustee (since 2008)` | | Retired. President and Director—Foxstone Financial, Inc. (consulting), 2000 through December 2007; Director—Mellon Financial Corporation affiliates (investing), 2000 through 2007; Chairman—Franklin Portfolio Associates (investing—Mellon affiliate), 1982 through 2007; oversees 64; Director—MIT Investment Company; Trustee—MIT 401k Plan; Trustee and Chairman—Research Foundation of CFA Institute. | |
|
29
Fund Governance (continued)
Independent Trustees (continued)
Name, Address and Age,
Position with Funds, Year First
Elected or Appointed to Office | | Principal Occupation(s) During Past Five Years, Number of Funds in the Columbia
Funds Complex Overseen by Trustee, Other Directorships Held
| |
| Minor M. Shaw (Born 1947) | |
|
c/o Columbia Management Advisors, LLC
One Financial Center
Boston, MA 02111
Trustee (since 2003) | | President—Micco Corporation and Mickel Investment Group; oversees 64; Board Member—Piedmont Natural Gas. | |
|
Interested Trustee
| Anthony M. Santomero1 (Born 1946) | |
|
c/o Columbia Management Advisors, LLC
One Financial Center
Boston, MA 02111
Trustee (since 2008) | | Richard K. Mellon Professor Emeritus of Finance, The Wharton School, University of Pennsylvania, from 1972 through current; Senior Advisor—McKinsey & Company (consulting), July 2006 through January 2008; President and Chief Executive Officer—Federal Reserve Bank of Philadelphia, July 2000 through April 2006; oversees 64; Director—Renaissance Reinsurance Ltd; Trustee—Penn Mutual Life Insurance Company; Director—Citigroup | |
|
1 The Columbia Funds currently treat Mr. Santomero as an "interested person" (as defined in the 1940 Act) of the Funds because he serves as a Director of Citigroup, Inc. and Citibank, N.A. Citigroup, Inc., through its subsidiaries and affiliates, including Citibank, N.A., may engage from time-to-time in brokerage execution, principal transactions and/or lending relationships with the Columbia Funds or other funds or accounts advised/managed by the Advisor and/or any sub-advisor.
The Statement of Additional Information includes additional information about the Trustees of the Funds and is available, without charge, upon request by calling 800-345-6611.
30
Fund Governance (continued)
Officers
Name, Address and Year of Birth,
Position with Columbia Funds,
Year First Elected or
Appointed to Office | | Principal Occupation(s) During Past Five Years
| |
| J. Kevin Connaughton (Born 1964) | |
|
One Financial Center
Boston, MA 02111
President (since 2009) | | Managing Director of Columbia Management Advisors, LLC since December 2004; Senior Vice President and Chief Financial Officer—Columbia Funds, from June 2008 to January 2009; Treasurer—Columbia Funds, from October 2003 to May 2008; Treasurer—the Liberty Funds, Stein Roe Funds and Liberty All-Star Funds, December 2000—December 2006; Senior Vice President—Columbia Management Advisors, LLC, from April 2003 to December 2004; President—Columbia Funds, Liberty Funds and Stein Roe Funds, February 2004 to October 2004; Treasurer—Galaxy Funds, September 2002 to December 2005; Treasurer, December 2002 to December 2004, and President, February 2004 to December 2004—Columbia Management Multi-Strategy Hedge Fund, LLC; and a senior officer of various other Bank of America-affiliated entities, including other registered and unregistered funds | |
|
| James R. Bordewick, Jr. (Born 1959) | |
|
One Financial Center
Boston, MA 02111
Senior Vice President, Secretary and Chief Legal Officer (since 2006) | | Associate General Counsel, Bank of America since April 2005; Senior Vice President and Associate General Counsel, MFS Investment Management (investment management) prior to April 2005. | |
|
| Linda J. Wondrack (Born 1964) | |
|
One Financial Center
Boston, MA 02111
Senior Vice President and
Chief Compliance Officer (since 2007) | | Director (Columbia Management Group LLC and Investment Product Group Compliance), Bank of America since June 2005; Director of Corporate Compliance and Conflicts Officer, MFS Investment Management (investment management), August 2004 to May 2005; Managing Director, Deutsche Asset Management (investment management) prior to August 2004. | |
|
| Michael G. Clarke (Born 1969) | |
|
One Financial Center
Boston, MA 02111
Senior Vice President and
Chief Financial Officer (since 2009) | | Director of Fund Administration of the Advisor since January 2006; Managing Director of the Advisor September 2004 to December 2005; Vice President Fund Administration June 2002 to September 2004. | |
|
| Jeffrey R. Coleman (Born 1969) | |
|
One Financial Center
Boston, MA 02111
Treasurer (since 2008) | | Director of Fund Administration of the Advisor since January 2006; Fund Controller of the Advisor from October 2004 to January 2006; Vice President of CDC IXIS Asset Management Services, Inc. (investment management) from August 2000 to September 2004. | |
|
| Joseph F. DiMaria (Born 1968) | |
|
One Financial Center
Boston, MA 02111
Chief Accounting Officer (since 2008) | | Director of Fund Administration of the Advisor since January 2006; Head of Tax/Compliance and Assistant Treasurer of the Advisor from November 2004 to December 2005; Director of Trustee Administration (Sarbanes-Oxley) of the Advisor from May 2003 to October 2004. | |
|
31
Fund Governance (continued)
Officers (continued)
Name, Address and Year of Birth,
Position with Columbia Funds,
Year First Elected or
Appointed to Office | | Principal Occupation(s) During Past Five Years
| |
| Julian Quero (Born 1967) | |
|
One Financial Center
Boston, MA 02111
Deputy Treasurer (since 2008) | | Senior Tax Manager of the Advisor since August 2006; Senior Compliance Manager of the Advisor from April 2002 to August 2006. | |
|
| Barry S. Vallan (Born 1969) | |
|
One Financial Center
Boston, MA 02111
Controller (since 2006) | | Vice President—Fund Treasury of the Advisor since October 2004; Vice President—Trustee Reporting of the Advisor from April 2002 to October 2004. | |
|
| Stephen T. Welsh (Born 1957) | |
|
One Financial Center
Boston, MA 02111
Vice President (since 1996) | | President, Columbia Management Services, Inc. since July 2004; Senior Vice President and Controller, Columbia Management Services, Inc. prior to July 2004. | |
|
32
Board Consideration and Re-Approval of Current Investment Advisory Agreement
Even though the following description of the Board's consideration of investment advisory and, as applicable, sub-advisory agreements covers multiple funds, for purposes of this shareholder report, the description is only relevant as to the Fund.
The Board of Trustees of Columbia Funds Series Trust (the "Board"), including a majority of the Trustees who have no direct or indirect interest in the investment advisory and sub-advisory agreements and are not "interested persons" of the Trust, as defined in the Investment Company Act of 1940 (the "1940 Act") (the "Independent Trustees"), are required annually to review and re-approve the existing investment advisory and sub-advisory agreements and approve any newly proposed terms therein. In this regard, the Board reviewed and re-approved, during the most recent six months covered by this report, (i) investment advisory agreements with Columbia Management Advisors, LLC ("CMA" or the "Adviser") for Columbia Convertible Securities Fund, Columbia Large Cap Value Fund, Columbia Mid Cap Value Fund, Columbia Small Cap Value Fund II, Columbia Marsico Growth Fund, Columbia Large Cap Core Fund, Columbia Marsico Focused Equities Fund, Columbia Marsico 21st Century Fund and Columbia Small Cap Growth Fund II; and (ii) investment sub-advisory agreements with Marsico Capital Management, LLC ("Marsico Capital" or the "Sub-Adviser") for Columbia Marsico Focused Equities Fund, Columbia Marsico 21st Century Fund and Columbia Marsico Growth Fund (the "Sub-Advised Funds"). The investment advisory agreements with CMA and the investment sub-advisory agreements with Marsico Capital are each referred to as an "Advisory Agreement" and collectively referred to as the "Advisory Agreements." The funds identified above are each referred to as a "Fund" and collectively referred to as the "Funds."
More specifically, at meetings held on November 5-6, 2009, the Board, including the Independent Trustees advised by their independent legal counsel, considered the factors and reached the conclusions described below relating to the selection of CMA and the Sub-Adviser and the re-approval of the Advisory Agreements. The Board also reviewed and considered a report prepared and provided by the Independent Fee Consultant (the "Fee Consultant") appointed by the Independent Trustees pursuant to an assurance of discontinuance entered into with the New York Attorney General ("NYAG") to settle a civil complaint filed by the NYAG relating to trading in mutual fund shares (the "NYAG Settlement"). The Fee Consultant's role was to manage the process by which management fees are negotiated so that they were negotiated in a manner that is at arms' length and reasonable. The Fee Consultant found that the fee negotiation process was, to the exte nt practicable, at arms' length and reasonable and consistent with the requirements of the NYAG Settlement. A summary of the Fee Consultant's report is available at http://www.columbiafunds.com.
In preparation for the November meetings, the Board met in August for review and discussion of the materials described below. The Investment Committee of the Board also met in June to discuss each Fund's performance with its respective portfolio manager(s). In addition to these meetings, the Investment Committee receives and discusses performance reports at its quarterly meetings. The Contracts Review Committee of the Board also provided support in managing and coordinating the process by which the Board reviewed the Advisory Agreements. The Board's review and conclusions are based on the comprehensive consideration of all information presented to it and are not the result of any single controlling factor. The Board evaluated all information available to it on a Fund-by-Fund basis, and its determinations were made separately in respect of each Fund.
Nature, Extent and Quality of Services. The Board received and considered various data and information regarding the nature, extent and quality of services provided to the Funds by CMA and the Sub-Adviser under the Advisory Agreements. The most recent investment adviser registration forms for CMA and the Sub-Adviser were made available to the Board, as were CMA's and the Sub-Adviser's responses to a detailed series of requests submitted by the Independent Trustees' independent legal counsel on behalf of such Trustees. The Board reviewed and analyzed those materials, which included, among other things, information about the background and experience of senior management and investment personnel of CMA and the Sub-Adviser.
In addition, the Board considered the investment and legal compliance programs of the Funds, CMA and the Sub-Adviser, including their compliance policies and procedures and reports of the Funds' Chief Compliance Officer.
The Board evaluated the ability of CMA and the Sub-Adviser, based on their resources, reputation and other attributes, to
33
attract and retain qualified investment professionals, including research, advisory and supervisory personnel. In this regard, the Board considered information regarding the nature of CMA's compensation structure applicable to portfolio managers and other key investment personnel.
Based on the above factors, together with those referenced below, the Board concluded that it was satisfied with the nature, extent and quality of the investment advisory services provided to each of the Funds by CMA and the Sub-Adviser.
The Board noted that Bank of America, N.A., the parent company of the Adviser, had entered into an agreement to sell a portion of the asset management business of the Adviser to Ameriprise Financial, Inc. (the "Transaction"). The Board noted that the Transaction was expected to close in the spring of 2010 and that its review of the Advisory Agreements was separate and distinct from any analysis regarding new advisory or sub-advisory arrangements that may result from the closing of the Transaction.
Investment Advisory and Sub-Advisory Fee Rates and Other Expenses. The Board reviewed and considered the proposed contractual investment advisory fee rates both separately and together with the administration fee rates payable by the Funds to CMA for investment advisory services (the "Contractual Management Rates"). The Board also reviewed and considered the proposed contractual investment sub-advisory fee rates (the "Sub-Advisory Agreement Rates") payable by CMA to the Sub-Adviser for investment sub-advisory services. In addition, the Board reviewed and considered the proposed fee waiver/cap arrangements applicable to the Contractual Management Rates and considered the Contractual Management Rates after taking the waivers/caps into account (the "Actual Management Rates"). The Board noted that, on a complex-wide basis, CMA had reduced annual managemen t fees by at least $32 million per year pursuant to the NYAG Settlement. The Board also noted reductions in net advisory rates and/or total expenses of certain funds across the fund complex. Additionally, the Board received and afforded specific attention to information comparing the Contractual Management Rates and Actual Management Rates with those of the other funds in their respective Peer Groups (as defined below).
The Board reviewed and considered statistical information regarding each Fund's total expense ratio and its various components, including contractual advisory fees, actual advisory fees, actual non-management fees, Rule 12b-1 and non-Rule 12b-1 service fees, fee waivers/caps and/or expense reimbursements. The Board also reviewed comparisons of these fees to the expense information for the group of Funds determined by Lipper Inc. ("Lipper") to be most similar to a given Fund (the "Peer Group") and to the performance of a broader universe of relevant funds as determined by Lipper (the "Universe"), which comparative data was provided by Lipper, an independent provider of investment company data. The Board was provided with a description of the methodology used by Lipper to select the mutual funds in each Fund's Peer Group and Universe and considered potential imprecision resulting from the selection methodology. For certain Funds, Lipper determined that the composition of the Peer Group and/or Universe for expenses would differ from the composition for performance to provide a more accurate basis of comparison. The Board also considered Lipper data that ranked each Fund based on: (i) each Fund's one- and three-year performance compared to actual management fees; and (ii) each Fund's one- and three-year performance compared to total expenses.
The Board concluded that the factors noted above supported the Contractual Management Rates and the Actual Management Rates, and the approval of the Advisory Agreements for all of the Funds.
With regard to the Sub-Advised Funds, the Board also reviewed the Sub-Advisory Agreement Rates, including comparative fee information provided by the Adviser and the Adviser's recommendation that the Board re-approve the Advisory Agreements with Marsico Capital. The Board also considered a breakpoint fee schedule charged by Marsico Capital for the Sub-Advised Funds, as well as a corresponding waiver of Contractual Management Rates, both of which were implemented on January 1, 2008. The Board concluded that the Sub-Advisory Agreement Rates are fair and equitable, based on its consideration of the factors described above.
The Fund-by-Fund discussion set forth below in "Fund-Specific Considerations for Certain Review Funds" provides additional information regarding those Funds highlighted as meeting agreed-upon criteria for warranting further review. Such criteria included, among other things, information relating to Actual Management Rates, total expense ratios and/or
34
performance information, relative to a Fund's Peer Group and/or Universe.
Fund Performance. The Board considered the performance results for each of the Funds over multiple measurement periods. It also considered these results in comparison to the performance results of each Fund's Peer Group and Universe, as well as to each Fund's benchmark index. The Board also considered certain risk-adjusted performance data.
The Fund-by-Fund discussion set forth below in "Fund-Specific Considerations for Certain Review Funds" provides additional information regarding those Funds highlighted as meeting agreed-upon criteria for warranting further review. Such criteria included, among other things, information relating to Actual Management Rates, total expense ratios and/or performance information, relative to a Fund's Peer Group and/or Universe.
Profitability. The Board received and considered a detailed profitability analysis of CMA based on the Contractual Management Rates and the Actual Management Rates, as well as on other relationships between the Funds and other funds in the complex on the one hand and CMA affiliates on the other. The analysis included complex-wide and per-Fund information and a comparison of results using alternative allocation methodologies. The Board concluded that, in light of the costs of providing investment management and other services, the profits and other ancillary benefits that CMA and its affiliates received from providing these services were not unreasonable.
Economies of Scale. The Board received and considered information regarding whether there have been economies of scale with respect to the management of the Funds, whether the Funds have appropriately benefited from any economies of scale and whether there is potential for realization of any further economies of scale. Most particularly, CMA provided information showing that, as a percentage of fund assets, CMA's complex-wide revenues declined over a five-year period during which fund assets increased by 53% and the shareholder benefit over a four-year period has remained steady at approximately 33% of the Adviser's total profits. The Board concluded that any potential economies of scale are shared fairly with Fund shareholders, most particularly through breakpoints and fee waiver arrangements.
The Board acknowledged the inherent limitations of any analysis of an investment adviser's economies of scale, stemming largely from the Board's understanding that economies of scale are generally realized, if at all, by an investment adviser across a variety of products and services, not just with respect to a single fund.
Information About Services to Other Clients. The Board also received and considered information about the nature and extent of services and fee rates offered by CMA and the Sub-Adviser to their other clients, including separate accounts and institutional investors. In this regard, the Board concluded that, where the Contractual Management Rates, Sub-Advisory Agreement Rates and Actual Management Rates were appreciably above the range of the fee rates offered to other CMA and Sub-Adviser clients, based on information provided by CMA and the Sub-Adviser, the costs associated with managing and operating a registered investment company provided a justification for the higher fee rates charged to the Funds.
Other Benefits to CMA and the Sub-Adviser. The Board received and considered information regarding any "fall-out" or ancillary benefits received by CMA and its affiliates and the Sub-Adviser as a result of their relationship with the Funds. Such benefits could include, among others, benefits attributable to CMA's and the Sub-Adviser's relationships with the Funds (such as soft-dollar credits) and benefits potentially derived from an increase in CMA's and the Sub-Adviser's business as a result of their relationship with the Funds (such as the ability to market to shareholders other financial products offered by CMA and its affiliates or a Sub-Adviser).
The Board considered the effectiveness of the policies of the Funds in achieving the best execution of portfolio transactions, whether and to what extent soft dollar credits are sought and how any such credits are utilized, any benefits that may be realized by using an affiliated broker, the extent to which efforts are made to recapture transaction costs, and the controls applicable to brokerage allocation procedures. The Board also reviewed CMA's and the Sub-Adviser's methods for allocating portfolio investment opportunities among the Funds and other clients. The Board concluded that the benefits were not unreasonable.
35
Other Factors and Broader Review. As discussed above, the Board reviews materials received from CMA and the Sub-Adviser annually as part of the re-approval process under Section 15(c) of the 1940 Act. The Board also reviews and assesses the quality of the services the Funds receives throughout the year. In this regard, the Board and its Committees review reports of CMA and the Sub-Adviser at each of its quarterly meetings, which include, among other things, Fund performance reports and presentations relating to such reports. In addition, the Board and its Committees confer with portfolio managers at various times throughout the year including, most particularly, at the June Investment Committee meeting.
Fund-Specific Considerations for Certain "Review" Funds. For certain Funds highlighted as meeting agreed-upon criteria for warranting further review, the Board engaged in further analysis with regard to approval of the Funds' Advisory Agreements. Such criteria included, among other things, information relating to Actual Management Rates, total expense ratios, and/or performance information relative to a Fund's Peer Group and/or Universe. Columbia Small Cap Growth Fund II was not highlighted as a review fund.
Conclusion. After an evaluation of the above-described factors, and based on its deliberations and analysis of the information provided and alternatives considered, the Board, including all of the Independent Trustees, concluded that the compensation payable to CMA and the Sub-Adviser under the Advisory Agreements is fair and equitable. Accordingly, the Board unanimously re-approved the Advisory Agreements.
36
Board Consideration and Approval of Proposed Investment Advisory Agreement
Even though the following description of the Board's consideration of investment advisory and, as applicable, sub-advisory agreements covers multiple funds and trusts, for purposes of this shareholder report, the description is only relevant as to the Fund.
At a meeting held on December 21, 2009, the Boards of Trustees (the "Boards") of Columbia Funds Series Trust, Columbia Funds Master Investment Trust, LLC and Columbia Funds Series Trust II (each a "Trust" and collectively the "Trusts") unanimously approved a new investment management services agreement with RiverSource Investments, LLC ("RiverSource") (the "Proposed Advisory Agreement") and new subadvisory agreements with Marsico Capital Management ("Marsico Capital"), MacKay Shields LLC ("Mackay Shields") and Brandes Investment Partners, L.P. ("Brandes") (each a "Proposed Subadvisory Agreement"), as applicable, for each Fund of the Trusts (each a "Fund" and collectively the "Funds"). As detailed below, the Trustees met on multiple occasions in advance of the December 21, 2009 meeting, held numerous discussions with the management teams of Columbia Management Advisors, LLC ("Columbia") and RiverSource, a subsidiary of Ameriprise Financial, Inc. ("Ameriprise") and reviewed and considered extensive materials in connection with the approval of the Proposed Advisory and Subadvisory Agreements.
Specifically, the Trustees of each Trust, including a majority of the Trustees who have no direct or indirect interest in the Proposed Advisory and Subadvisory Agreements and are not "interested persons" of the Trusts, as defined in the Investment Company Act of 1940, as amended (the "1940 Act") (the "Independent Trustees") reviewed and approved (i) the Proposed Advisory Agreement with RiverSource for each Fund and (ii) the Proposed Subadvisory Agreement for those Funds that currently have investment subadvisory agreements with Marsico Capital, Mackay Shields, and Brandes (the "Subadvised Funds") (Marsico Capital, MacKay Shields and Brandes are collectively referred to as the "Subadvisers"). Prior to approving the Proposed Advisory Agreements, the Trustees were presented with, and requested, received and evaluated, extensive materials about RiverSource, the sale of a portion of the asset management business of Columbia Managemen t Group, LLC to Ameriprise (the "Transaction") and related matters from RiverSource, Ameriprise and Columbia. In this regard, the Trustees reviewed RiverSource's responses to a series of detailed requests submitted by the Independent Trustees' independent legal counsel and by the Independent Fee Consultant (as defined below).
The Trustees also reviewed and considered information received in connection with their most recent consideration and reapproval in November 2009 of the current advisory agreement (the "Current Advisory Agreement") and current subadvisory agreement (the "Current Subadvisory Agreement"), as applicable, for each Fund, including information about the Subadvisers (the "Current Agreement Re-Approval Process"). Moreover, the Trustees and committees of the Boards met on several occasions, and received extensive materials, throughout the course of the year relating to the Current Agreement Re-Approval Process, which the Trustees considered relevant to their consideration and approval of the Proposed Advisory and Subadvisory Agreements. The Trustees also consulted with Fund counsel and with the Independent Trustees' independent legal counsel, who advised on the legal standards for consideration by the Trustees, and otherwise assisted the Trustees in their deliberations.
In advance of the meeting on December 21, 2009, the Trustees held several meetings, including meetings held in-person with representatives from RiverSource and Ameriprise on August 26, 2009, November 5-6, 2009, December 9-10, 2009 and December 14, 2009, and additional meetings with representatives of Columbia, to discuss the Transaction, RiverSource's plans and intentions regarding the Funds and various proposals that were being presented as a result of the Transaction, including the Proposed Advisory and Subadvisory Agreements. In addition to these meetings, telephonic meetings and discussions were held on several occasions between individual Trustees, members of the committees of the Boards, their independent legal counsel and representatives from RiverSource, Ameriprise and/or Columbia.
The Trustees also reviewed and considered a report prepared and provided by the Fee Consultant (the "Fee Consultant") appointed by the Independent Trustees pursuant to an assurance of discontinuance entered into by a predecessor to Columbia with the New York Attorney General ("NYAG") to settle a civil complaint filed by the NYAG relating to trading in mutual fund shares (the "NYAG Settlement"). The Fee Consultant's role was to manage the process by which management fees are negotiated so that they were negotiated
37
in a manner that is at arms' length and reasonable. The Fee Consultant found that the fee negotiation process was, to the extent practicable, at arms' length and reasonable and consistent with the requirements of the NYAG Settlement. A summary of the Fee Consultant's report is available at www.columbiafunds.com.
The following summarizes a number of the material factors considered by the Trustees in reaching their approvals and determinations with respect to the Proposed Advisory Agreements and Proposed Subadvisory Agreements. It is followed by a more detailed discussion of the Trustees' consideration of these and other factors considered relevant by the Trustees in their evaluation of the Proposed Advisory Agreements and Proposed Subadvisory Agreements. In voting to approve the Proposed Advisory and Subadvisory Agreements for each Fund, the Trustees also considered substantially the same factors, as relevant, and reached substantially the same conclusions in their approval of interim advisory and subadvisory agreements for each Fund.
(i) the terms and conditions of the Proposed Advisory Agreements compared to the terms and conditions of the Current Advisory Agreements, as described below;
(ii) the fact that each Fund's total advisory fees would remain the same;
(iii) the qualifications of the personnel of RiverSource, Ameriprise and the Subadvisers expected to provide advisory and administrative services to each Fund, including representations by Ameriprise regarding its retention of the same process for monitoring and evaluating portfolio management personnel for each Fund as currently used by Columbia;
(iv) the terms and conditions of the Proposed Subadvisory Agreements compared to the terms and conditions of the Current Subadvisory Agreements;
(v) the reputation, financial strength, regulatory and compliance histories and resources of RiverSource and Ameriprise, and the potential benefits to the Funds of the combination of RiverSource and Columbia, including that the Funds are expected to continue to have access to existing distribution channels and have the potential for expanded distribution of Fund shares, the expected depth and breadth of investment management capabilities, that there is not expected to be any diminution in the nature, quality and extent of services to be provided to the Funds under the Proposed Advisory Agreements and the potential for the realization of additional economies of scale over time and the potential of the Funds to share in, and benefit from, these economies, if any;
(vi) that Ameriprise has committed to refrain from imposing or seeking to impose, for a period of not less than two years after the closing of the Transaction (the "Closing"), any "unfair burden" (within the meaning of Section 15(f) of the 1940 Act) on any Fund;
(vii) the terms and conditions of certain other agreements and arrangements relating to the future operations of the Funds and their distribution channels, including the administrative services agreement and the new services and distribution agreement;
(viii) that the Trustees recently had completed the Current Agreement Re-Approval Process for each Fund and had determined that they were satisfied with the nature, extent and quality of services provided thereunder and that the management fee rates and (where applicable) subadvisory fee rates for each Fund were satisfactory;
(ix) that RiverSource was willing to commit to maintain net operating expense ratios at current levels for at least the period currently covered by Columbia's existing commitments;
(x) the capabilities of RiverSource and the Subadvisers with respect to compliance, including an assessment of RiverSource's compliance program by the Funds' Chief Compliance Officer;
(xi) that certain members of RiverSource's management and certain Columbia personnel that will be integrated into RiverSource and its affiliates as a result of the Transaction have substantial experience in integrating fund families; and
38
(xii) that Ameriprise and Bank of America Corporation would bear the costs of obtaining approvals of the Proposed Advisory and Subadvisory Agreements.
In their deliberations, the Trustees did not identify any single item that was paramount or controlling and individual Trustees may have attributed different weights to various factors. The Trustees also evaluated all information available to them on a Fund-by-Fund basis, and their determinations were made separately in respect of each Fund.
Nature, Extent and Quality of Services to be Provided. The Trustees received and considered various data and information regarding the expected nature, extent and quality of services to be provided to the Funds by RiverSource and the Subadvisers under the Proposed Advisory and Subadvisory Agreements. The most recent investment adviser registration forms for RiverSource and each Subadviser were made available to the Boards, as well as extensive materials from RiverSource, Ameriprise and Columbia. The Trustees reviewed and analyzed these materials, which included, among other things, information about the background and experience of expected senior management of RiverSource and Ameriprise after the Closing. The Trustees considered RiverSource's ability to provide administrative services to the Funds, noting that while the aggregate scope of advisory an d administrative services was not expected to change following the Closing, the allocation of services was expected to shift, to a limited extent, such that administrative services will be provided under a new administrative services agreement. The Trustees considered, among other things, the capacity and quality of RiverSource's and the Subadvisers' investment management, research and trade execution capabilities and other resources that would be dedicated to performing services for the Funds. The Trustees also considered matters related to RiverSource's and the Subadvisers' compliance programs and compliance records, including RiverSource's portfolio transaction policies and procedures. The Trustees discussed with senior management personnel their ability to administer and oversee outside service providers to the Funds and their shareholders and were satisfied with management's processes for providing services and overseeing and reviewing services to be rendered by outside sources.
In evaluating the services to be provided under the Proposed Advisory and Subadvisory Agreements, the Trustees factored in their extensive discussions with representatives of Columbia, RiverSource and Ameriprise at the meetings referenced above regarding the management of each Fund. The Trustees considered representations by Ameriprise that it was expected that there will be no diminution in the nature and quality of services provided to the Funds. The Trustees noted that Columbia Management Group's current President, Columbia's current Chief Investment Officer and Columbia's current President, were expected to continue to serve the Funds in similar capacities after the Closing. With respect to portfolio management, the Trustees reviewed information regarding the deliberative process for selecting portfolio management personnel to continue servicing the Funds after the Closing, including the expected role of Columbia's Chief Inv estment Officer in evaluating and selecting portfolio management personnel for each Fund utilizing Columbia's current analytical model for evaluating portfolio managers. In this regard, the Trustees also weighed representations by Ameriprise that this investment management evaluative process was likely to result in a significant number of Columbia investment professionals and personnel currently responsible for management of the Funds to remain in place. The Trustees noted that the portfolio management evaluation and selection process was designed to optimize the portfolio management resources available to each Fund by having the ability to select investment personnel for the Funds from the combined organization. Similarly, the Trustees evaluated the ability of RiverSource and the Subadvisers, based on their respective resources, reputations and other attributes, to attract and retain qualified investment professionals. In this regard, the Trustees considered information regarding the nature of the compensat ion structure applicable to portfolio managers and other key investment personnel.
The Trustees reviewed and considered information from Ameriprise and RiverSource regarding various contemplated service provider arrangements, including information regarding both immediate and potential future plans in respect of these arrangements. In this regard, the Trustees considered information regarding potential distribution, transfer agency and custody arrangements and the evaluation of fund accounting, financial reporting and valuation service model options, noting certain differences between Columbia's and RiverSource's current approaches, including that RiverSource has historically utilized services provided "in-house" or by its affiliates for fund accounting, financial reporting and valuation. The Trustees reviewed information
39
from Ameriprise and RiverSource regarding the expectation for rationalized or harmonized fees as part of the integration after the Closing in order to develop consistent service fee schedules across the combined fund family. The Trustees noted Ameriprise's representations that, to the extent any such proposals were recommended to the Board after the Closing, they would not result in an "unfair burden" (within the meaning of Section 15(f) of the 1940 Act) on any Fund.
In addition, the Trustees reviewed and evaluated materials and information received regarding the investment and legal compliance programs of the Funds, RiverSource and the Subadvisors, including their compliance policies and procedures and reports of the Funds' Chief Compliance Officer. In this regard, the Trustees considered that Columbia's current Chief Compliance Officer was expected to serve in the same role after the Closing.
The Trustees also noted that Ameriprise and certain of its affiliates have been involved in a number of legal, arbitration and regulatory proceedings, including routine litigation, class actions, and governmental actions, concerning matters arising in connection with the ordinary conduct of their business activities, and that Ameriprise indicated that neither Ameriprise nor any of its affiliates are the subject of any pending legal, arbitration or regulatory proceedings that are likely to have a material adverse effect on the Funds or the ability of Ameriprise or its affiliates, including RiverSource to provide services to the Funds.
Based on the foregoing and other information considered relevant, the Trustees concluded that, overall, they were satisfied with assurances from Columbia, RiverSource, Ameriprise and the Subadvisers as to the expected nature, extent and quality of services to be provided to each Fund under the Proposed Advisory and Subadvisory Agreements.
Investment Advisory and Subadvisory Fee Rates and Other Expenses. The Trustees reviewed and considered the proposed contractual investment advisory fee rates to be paid by each Fund to RiverSource for investment management services both separately and together with the administration fee rates to be paid by the Funds to RiverSource (the "Contractual Management Rates"), which are the same as the separate and aggregate advisory and administrative fee rates currently paid by each Fund to Columbia. The Trustees also reviewed and considered the proposed subadvisory fee rates and the fee arrangements under the Proposed Subadvisory Agreements, respectively, which are also the same as those currently in effect under the Current Subadvisory Agreements. In addition to the materials provided by Columbia, RiverSource provided information regarding the current fee s for each of the RiverSource funds and other relevant institutional accounts. The Trustees reviewed and considered the proposed fee waiver/cap arrangements applicable to the Contractual Management Rates and considered the Contractual Management Rates after taking the waivers/caps into account (the "Actual Management Rates"). In this regard, the Trustees noted that RiverSource had committed to maintain the Funds' current expense limitation and waiver arrangements (both contractual and voluntary). The Trustees considered the potential that, after the Closing, RiverSource would propose a common fee and expense structure for the combined fund family, subject to the commitment that Ameriprise will not seek any change that would result in an "unfair burden" on any Fund. The Trustees also considered the report prepared and provided by the Fee Consultant. Additionally, the Trustees received and afforded specific attention to information provided in connection with the Current Agreement Re-Approval Process, comparin g the Contractual Management Rates and Actual Management Rates with those of other funds in each Fund's Peer Group (as defined below).
During the Current Agreement Re-Approval Process, the Trustees reviewed and considered statistical information regarding each Fund's total expense ratio and its various components, including contractual advisory fees, actual advisory fees, actual nonmanagement fees, Rule 12b-1 and non-Rule 12b-1 service fees, fee waivers/caps and/or expense reimbursements. The Trustees also reviewed comparisons of these fees to the expense information for the group of Funds that was determined by Lipper Inc. ("Lipper") to be the most similar to a given Fund (the "Peer Group") and to the performance of a broader universe of relevant funds as determined by Lipper (the "Universe"), which comparative data was provided by Lipper, an independent provider of investment company data.
The Trustees were provided with a description of the methodology used by Lipper to select the mutual funds in each Fund's Peer Group and Universe and reviewed the degree of comparability resulting from the selection methodology. For
40
certain Funds, Lipper determined that changing the composition of the Peer Group and/or Universe for expenses from that used for performance would provide a more accurate basis of comparison. The Trustees also considered Lipper data that ranked each Fund based on: (i) each Fund's one- and three-year performance compared to actual management fees; and (ii) each Fund's one- and three-year performance compared to total expenses.
For each Fund, except as otherwise described in the Fund-specific discussion below, the Trustees noted that they had concluded during the Current Agreement Re-Approval Process that the Contractual Management Rates, the Actual Management Rates and the total expense ratio were at acceptable levels in light of the quality of services provided to the Fund and in comparison to such Fund's Peer Group and Universe, as applicable; that the advisory fee rate would not be increased for any Fund; that Ameriprise and RiverSource had represented that the overall expenses for each Fund were not expected to be adversely affected by the Transaction; and that RiverSource had committed to maintain the Funds' current expense limitation or waiver arrangements (both contractual and voluntary).
Based on the foregoing, other relevant information received and the additional information described in the Fund-specific discussion below, as applicable, the Trustees concluded that the Contractual Management Rates, the Actual Management Rates and the total expense ratio were acceptable.
Fund Performance. The Trustees reviewed detailed performance information for each Fund at various Board and committee meetings during the year in addition to the additional performance information that they reviewed and evaluated in connection with the Transaction. The Trustees also reviewed and evaluated detailed performance information for each Fund in connection with the Current Agreement Re-Approval Process. The Trustees considered the performance results for each of the Funds over multiple measurement periods. They also considered these results in comparison to the performance results of each Fund's Peer Group and Universe, as well as to each Fund's benchmark index. The Boards also noted certain risk-adjusted performance data.
The Trustees also reviewed and evaluated information and data regarding the investment performance record of RiverSource in managing funds with investment strategies generally similar to those of the Funds, as applicable. Investment performance for such funds was provided for a wide range of periods.
The Trustees recognized that the investment performance record of RiverSource in managing funds with similar objectives may be less relevant to their deliberations in situations where the current portfolio managers of Columbia are expected to continue managing a particular Fund following the Closing. They also recognized that for each Fund, it is not possible to predict with certainty what effect, if any, consummation of the Transaction will have on the future performance of the Funds, noting in particular that past investment performance is no assurance of future results. The Fund-by-Fund discussion set forth below provides additional information regarding those Funds highlighted as meeting agreed-upon criteria for warranting further review. Such criteria included, among other things, information relating to Actual Management Rates, total expense ratios and/or performance information, relative to a Fund's Peer Group and/or Univ erse.
Costs of Services to be Provided and Profitability. In considering the costs of services to be provided by RiverSource and the Subadvisers under the Proposed Advisory Agreement and Proposed Subadvisory Agreement, as applicable for each Fund, and the projected range of profitability to RiverSource and the Subadvisers from their relationships with the Funds, the Trustees considered, among other things, that there would be no increase in advisory or subadvisory fee rates under the Proposed Advisory and Subadvisory Agreements. The Trustees further noted, with respect to RiverSource, that it was not possible to predict with certainty how RiverSource's profitability would be affected by becoming the investment adviser to the Funds but, as a general matter, they were satisfied, based on their review of RiverSource's projected range of profitability assuming completion of the Transaction, that this projected profitability from their relationship with the Funds would not be excessive. The Trustees based their review, in part, on information regarding RiverSource's current profitability in managing the RiverSource Funds and the information available to the Trustees with respect to RiverSource's expense budgeting process. The Trustees also noted that they would have ongoing opportunities to address RiverSource's profitability in the future based on actual results. The Trustees did not consider
41
separate profitability information with respect to the Subadvisers, as their profitability from their relationships with the Funds was not a material factor in determining whether to approve the Proposed Subadvisory Agreements. The Trustees also noted that the subadvisory fees paid to the Subadvisers, none of which is affiliated with Columbia, had previously been negotiated on an arms' length basis.
The Trustees also reviewed information about the financial condition of RiverSource and the Subadvisers and were satisfied that RiverSource and the Subadvisers have adequate resources to perform the services required under the Proposed Advisory and Proposed Subadvisory Agreements.
Subject to the limitations noted above, the Trustees concluded that they were satisfied that RiverSource's projected range of future profitability, and each Subadviser's historical profitability, from their relationship with each Fund, as relevant, were not excessive.
Economies of Scale. The Trustees received and evaluated information regarding the potential to realize economies of scale with respect to management of the Funds, whether the Funds would appropriately benefit from any economies of scale and whether there was any potential for realization of further economies of scale in connection with the Transaction. The Trustees noted that the current and proposed investment advisory fee rates for most of the Funds contain breakpoints that reduce the fee rate on assets above specified levels. The Trustees noted that RiverSource had indicated that no changes to the Funds' breakpoint arrangements were proposed to be made at this time. In light of these factors and noting that it was not possible to evaluate with certainty if and how the Transaction would produce any immediate opportunities for additional economies of scale, the Trustees concluded that each Fund's breakpoint arrangements were acceptable. The Trustees also recognized that the Funds may benefit from certain economies of scale over time from becoming a part of the larger RiverSource fund complex, based on potential future synergies of operations, potential fee harmonization/rationalization initiatives and potential future Fund mergers. The Trustees noted, in particular, RiverSource's acknowledgement of the principle that the Funds should share in certain economies of scale if realized by RiverSource. In addition, the Trustees evaluated the likelihood that there would be potential Fund mergers after the Closing. The Trustees noted that any such potential Fund mergers, if approved, could result in the achievement of additional breakpoints for Funds that have implemented breakpoint fee schedules. The Trustees also noted that they expect to consider economies of scale from time to time following the Closing and thus be in a position to evaluate any additional e conomies of scale.
The Trustees acknowledged the inherent limitations of any analysis of an investment adviser's economies of scale, stemming largely from the Trustees' understanding that economies of scale are generally realized, if at all, by an investment adviser across a variety of products and services, not just with respect to a single fund.
Information About Investment Management Services to Non-Mutual Fund Clients. The Trustees also received and reviewed information about the nature and extent of services and fee rates offered by Riversource and the Subadvisers to the Funds compared with other clients with similar accounts, including separate accounts and institutional investments. The Trustees noted that the Funds may receive services different from those offered to other clients of RiverSource and the Subadvisers and concluded that the advisory fee rates under the Proposed Advisory Agreements and the subadvisory fee rates under the Proposed Subadvisory Agreements were not excessive, given the nature and extent of services expected to be offered and other factors, including the Trustees' review of Lipper data.
Other Benefits to RiverSource and the Subadvisers. The Trustees received and reviewed information regarding any expected "fall-out" or ancillary benefits to be received by RiverSource and its affiliates and by the Subadvisers as a result of their relationships with the Funds.
Among other things, the Trustees noted that RiverSource would benefit from soft dollar arrangements using portfolio brokerage of each Fund that invests in equity securities. The Trustees also noted that the Subadvisers also had benefited from, and expected to continue to benefit from, soft dollar arrangements using portfolio brokerage of the Subadvised Funds. The Trustees acknowledged RiverSource's representation that none of its affiliated broker dealers was expected to provide brokerage services to any Fund, but noted that broker-dealer affiliates of RiverSource will receive distribution related fees from the Funds in respect of shares held in certain accounts, and that such Funds' distributor
42
(which will also become a subsidiary of RiverSource following the closing of the Transaction) retains a portion of the distribution related fees from the Funds and receives a portion of the sales charges on sales or redemptions of certain classes of shares of the Funds. The Trustees recognized that RiverSource's and the Subadvisers' profitability would be somewhat lower without these benefits. The Trustees concluded that RiverSource and the Subadvisers may derive reputational benefits from their association with the Funds. The Trustees also noted, however, that such benefits were difficult to quantify with certainty.
Fund-Specific Considerations for Certain "Review" Funds. During the Current Agreement Re-Approval Process, a limited number of Funds were highlighted as meeting agreed-upon criteria for warranting further review. Such criteria included, among other things, information relating to Actual Management Rates, total expense ratios and/or performance information, relative to a Fund's Peer Group and/or Universe. For such "review" Funds, the Trustees engaged in further analysis with regard to the approval of the Funds' Current Advisory Agreements. For each such Fund, the Trustees subsequently considered the impact of transitioning investment management responsibilities to RiverSource.
Columbia Small Cap Growth Fund II was not highlighted as a review fund.
Conclusion. After an evaluation of the above-described factors and based on its deliberations and analysis of the information provided and alternatives considered, each Board, including all of the Independent Trustees, concluded that approval of the Proposed Advisory and Subadvisory Agreements was in the best interests of each of the Funds and its shareholders. Accordingly, the Boards unanimously approved the Proposed Advisory and Subadvisory Agreements.
43
Summary of Management Fee Evaluation by
Independent Fee Consultant
EXCERPTS FROM REPORT OF INDEPENDENT FEE CONSULTANT TO THE FUNDS SUPERVISED BY THE COLUMBIA NATIONS BOARD
Prepared Pursuant to the February 9, 2005
Assurance of Discontinuance among the
Office of Attorney General of New York State,
Columbia Management Advisors, LLC, and
Columbia Management Distributors, Inc.
November 12, 2009
I. Overview
On February 9, 2005, Columbia Management Advisors, LLC ("CMA") and Columbia Management Distributors, Inc.1 ("CMD") agreed to the New York Attorney General's Assurance of Discontinuance ("AOD"). Among other things, the AOD stipulates that CMA may manage or advise a Columbia Fund ("Columbia Fund" and, together with some or all of such funds, the "Columbia Funds") only if the Independent Members of the Columbia Fund's Board of Trustees appoint a Senior Officer or retain an Independent Fee Consultant ("IFC") who is to manage the process by which proposed management fees are negotiated. The AOD further stipulates that the Senior Officer or IFC is to prepare a written annual evaluation of the fee negotiation process.
With effect from January 1, 2007, the Independent Members of the Board of Trustees for certain Columbia Funds known collectively as the "Nations Funds" (together with the other members of that Board, the "Trustees") retained me as IFC for the Nations Funds.2 In this capacity, I have prepared the fifth annual written evaluation of the fee negotiation process. As was the case with the 2007 and 2008 reports, my immediate predecessor as IFC, John Rea, provided invaluable assistance in the preparation of this year's report.
A. Role of the Independent Fee Consultant
The AOD charges the IFC with "managing the process by which proposed management fees ... to be charged the Columbia Fund are negotiated so that they are negotiated in a manner which is at arms' length and reasonable and consistent with this Assurance of Discontinuance." The AOD also provides that CMA "may manage or advise a Columbia Fund only if the reasonableness of the proposed management fees is determined by the Board of Trustees ... using ... an annual independent written evaluation prepared by or under the direction of ... the Independent Fee Consultant." Therefore, the AOD makes clear that the IFC does not supplant the Trustees in negotiating management fees with CMA, nor does the IFC substitute his or her judgment for that of the Trustees with respect to the reasonableness of proposed fees or any other matter that is committed to the business judgment of the Trustees.
B. Elements Involved in Managing the Fee Negotiation Process
In preparing the report required by the AOD, the IFC must consider at least the following six factors set forth in the AOD:
1. The nature and quality of CMA's services, including the Fund's performance;
2. Management fees (including any components thereof) charged by other mutual fund companies for like services;
3. Possible economies of scale as the Fund grows larger;
4. Management fees (including any components thereof) charged to institutional and other clients of CMA for like services;
5. Costs to CMA and its affiliates of supplying services pursuant to the management fee agreements, excluding any intra-corporate profit; and
6. Profit margins of CMA and its affiliates from supplying such services.
C. Organization of the Annual Evaluation
This report, like last year's, focuses on the six factors and contains a section for each factor except that CMA's costs and profits from managing the Funds are treated in a single section. In addition to a discussion of these factors, the report offers recommendations to improve the fee review process in future years. A review of the status of recommendations made in the 2008 Report is being provided separately with the materials for the November meeting.
1 CMA and CMD are subsidiaries of Columbia Management Group, LLC ("CMG"), and are the successors to the entities named in the AOD.
2 I have no material relationship with Bank of America, CMG or any of its affiliates, aside from serving as IFC, and I am aware of no material relationship with any of their affiliates. I retained John Rea, an independent economic consultant, to assist me with this report.
Unless otherwise stated or required by the context, this report covers only the Nations Funds, which are also referred as the "Funds."
44
II. Summary of Findings
A. General
1. Based upon my examination of the information supplied by CMG in the light of the six factors set forth in the AOD, I conclude that the Trustees have the relevant information necessary to evaluate the reasonableness of the proposed management fees for each Nations Fund, subject to the following: on September 30, 2009, Ameriprise Financial, Inc. ("Ameriprise") announced that it had agreed to purchase the investment management business of CMG with the exception of its cash and liquidity management business which includes the Nations money market Funds. As a result, the Trustees requested information from CMG as to the plans of CMG and its parent with respect to the provision of investment management services to those Funds after the consummation of the proposed transaction. As of the date of this report, that in formation has not yet been provided. However, as the transaction is not expected to close until the spring of 2010, the Trustees concluded that they would have ample opportunity to take appropriate steps with respect to the investment management agreements of the money market Funds, including invoking the 60-day termination provisions of those agreements, in response to the information to be provided by CMG and reviewed by the IFC.
In my view, the process by which the proposed management fees of the Funds have been negotiated in 2009 thus far has been, to the extent practicable, at arms' length and reasonable and consistent with the AOD.
B. Nature and Quality of Services, Including Performance
3. The performance of the Funds was relatively strong for the measuring periods ending March 31, 2009. Between one-third and nearly one-half of the Funds were ranked in either the first or second quintiles in the one-, three-, five-, and 10-year periods, and no more than 8% were in the fifth quintile for these periods. Overall, the performance was stronger in the two longer periods.
4. The strongest performing groups over the one-, three-, and five-year periods were active equity, quantitative strategies, and, to a lesser extent, money market Funds. Sub-advised Funds were the weakest performers, with over 60% of the Funds in the bottom two quintiles in the one- and three-year periods. For the same two periods, no more than 15% percent of the sub-advised Funds were in the top two quintiles. Almost half of fixed-income Funds ranked in the bottom two quintiles in the one- and three-year periods.
5. Overall performance of the Funds was less robust in 2009 than in 2008 and 2007 for the one- and three-year performance periods. For example, 62% of the Funds were in the top two quintiles in 2007 for the one-year period compared with 33% in 2009. The ranks of those in the bottom two quintiles rose significantly between 2007 and 2009, led by money market and fixed-income Funds in the one- and three-year periods. For the three-year period, there was a similar trend with respect to sub-advised Funds.
6. The performance of the active equity Funds against their benchmarks was strong for the one-, three-, and five-year performance periods. In contrast, more than half of the sub-advised Funds failed to beat their benchmarks on a net basis in the one- and three-year periods. The fixed-income Funds consistently produced gross returns below those of their benchmarks. Lipper quintile rankings of the actively managed equity Funds are highly correlated with their performance against their benchmarks in the sense that net returns in excess of the benchmark appear necessary to achieve a ranking in one of the top three quintiles. No such correlation was observed for fixed-income and quantitative strategies Funds.
7. The equity Funds' overall performance adjusted for risk was mixed. Based upon three-year returns, less than 40% of the equity Funds had a combination of risk-adjusted and unadjusted returns that placed them in the top half of their performance universes; 60% were in the bottom half of their universes. About 30% of the fixed income Funds posted high returns and low risk relative to comparable funds. Over 60% of the fixed-income Funds took on more risk than the typical fund in their performance universes.
8. The industry-standard procedure used by Lipper that includes all share classes in the performance universe tends to bias a Fund's ranking upward within that universe. The bias occurs because either no-12b-1 fee or low-12b-1 fee share classes of the Nations Funds are compared with funds in performance universes that
45
include all share classes of multi-class funds with 12b-1 fees of up to 100 basis points. Correcting this bias by limiting the performance universe to classes of comparable funds with low or no 12b-1 fees (a "filtered universe") lowers the relative performance for the Funds, but generally not to a material extent. The filtering process, however, did identify two Funds for further review that had not been so identified using unfiltered universes.
9. A small number of Funds have consistently underperformed over the past five years. The exact number depends on the criteria used to evaluate longer-term performance. For example, six different Funds have had below-median performance in at least four out of the five years between 2005 and 2009 for either the one- or three-year performance periods from 2005 to 2009. If the threshold were the 60th percentile, only two Funds would have satisfied the criteria.
10. The services performed by CMG professionals beyond portfolio management, such as compliance, legal, information technology, risk management, finance, and fund administration, are critical to the success of the Funds and appear to be of high quality.
C. Management Fees Charged by Other Mutual Fund Companies
11. The Funds' management fees and total expenses are generally low relative to those of their peers, with over half the Funds ranking in the most favorable two quintiles. For total expenses, slightly more than one-quarter are in the bottom two quintiles, while slightly less than two-fifths are in the bottom two quintiles for actual management fees. Fixed-income and quantitative strategies Funds have the lowest fees and expenses relative to their peers. The sub-advised Funds account for the majority of Funds in the fifth quintile for both management fees and total expenses.
12. The distribution of management fee rankings has changed little over the past three years, while the distribution of total expense rankings has moved in the direction of higher expenses. The most notable change involving total expenses has been a shift in the number of Funds from the first to the second quintile.
13. The management fees of the non-subadvised Funds are generally in line with those of Columbia Funds supervised by the Atlantic Board of Trustees (the "Atlantic Funds"). The sub-advised large cap equity, international equity, and high yield Funds, however, generally have higher management fees than those of comparable Atlantic and non-subadvised Funds.
14. The implementation of the new program of voluntary expense limits appears to have been associated, on balance, with less favorable expense rankings. This result reflects increases in expense limits for certain Funds, the removal of fee waivers, and the shift of certain expenses from CMA to the Funds. The decline in expense rankings is less significant, however, than CMA projected in December 2008.
D. Trustees' Advisory Contract Review Process
15. The Trustees' evaluation process identified 22 Funds in 2009 for further review based upon long-standing criteria relating to their relative performance or expenses or both. When compared in filtered universes, two more Funds met the criteria for further review. At the November meeting, CMG provided further information about each of those Funds to assist the Trustees in their evaluation.
E. Potential Economies of Scale
16. CMG presented to the Trustees its analysis of the sources and sharing of potential economies of scale. CMG views economies of scale as arising at the complex level and would regard estimates of scale economies for individual funds as unreliable. In its analysis, CMG did not identify specific sources of economies of scale or provide any estimates of any economies of scale that might arise from future asset growth. CMG's analysis included measures taken by the Trustees and CMG that seek to share any potential economies of scale through breakpoints in management fee schedules, the establishment of expense limits for each Fund, enhanced shareholder services, fund mergers, and operational consolidation.
17. An examination of the contractual fee schedules for five Nations Funds shows that the schedules for Small Cap II, Municipal Reserves, and Treasury Reserves compare favorably with those of their competitors, while the subadvised Marsico Growth and High Yield VS Funds have schedules generally above those of their peers, including funds that do not have a sub-adviser. The group fee with
46
breakpoints that characterizes the money market Fund schedules is not typically found among competitors, nearly all of which have flat fee schedules.
F. Management Fees Charged to Institutional Clients
18. CMG has provided Trustees with comparisons of mutual fund management fees and institutional fees based upon standardized fee schedules and upon actual fees. The results show that, consistent with industry practice, actual and scheduled institutional fees are generally, but not always, lower than the Funds' management fees. CMG provided additional data this year demonstrating that at small asset levels, the effective fee of certain Funds may be equal to or less than institutional fee levels at those asset levels, due to the effect of expense limits on small funds with high gross expenses. CMG also analyzed the differences between the services provided and risks borne on the one hand by a manager of mutual funds and on the other by institutional advisers, and suggested that these differences should be kept in mind when Trustees review the reasonableness of the Funds' management fees.
G. Revenues, Expenses, and Profits
19. The activity-based cost allocation methodology employed by CMG to allocate costs, both direct and indirect, for purposes of calculating Fund profitability is thoughtful and detailed. This year, CMG further refined the technique by allocating additional indirect expenses on an activity basis.
20. The materials provided on CMG's revenues and expenses with respect to the Funds and the methodology underlying their construction form a sufficient basis for Trustees to evaluate the expenses of and profitability to CMG arising out of its relationships with the Funds.
21. CMG provided a firm-wide pro forma 2009 income statement demonstrating the effect of market events beginning in the fourth quarter of 2008 on its revenues and profitability to provide an additional perspective on calendar 2008 profitability data.
22. In 2008, CMG's pre-tax pre- and post-distribution margins on the Nations Funds were above the industry mean and median, based on limited data available for publicly held mutual fund managers and excluding the costs of CMG's money market capital support programs. However, as is to be expected in a 63-Fund complex, some Nations Funds had relatively high pre-tax profit margins in 2008, when calculated solely with respect to management revenues and expenses, while other Nations Funds operated at a loss. There is a positive relationship between Fund size and profitability to CMG, with smaller Funds generally operating at a loss to CMG.
23. CMG pays a fixed percentage of its management fee revenues to an affiliate, U.S. Trust, Bank of America Private Wealth Management, with respect to assets of its clients invested in Nations Funds to compensate it for services it performs with respect to those client assets and for the effect of state law limitations on affiliates charging multiple fees. Based on our analysis of the services provided by this affiliate, we have concluded that all payments other than those for sub-transfer agent or sub-accounting services should be treated as a distribution expense.
III. Recommendations
1) Criteria for review. The Trustees may wish to consider modifying the criteria for identifying a Fund for further review (a "Review Fund") to include criteria that focus exclusively on performance. They may also wish to consider whether it would be useful to apply CMG's own internal monitoring standards for Fund performance to the contract review process, or whether such criteria are more relevant to their ongoing investment oversight.
2) Presentation of Review Fund discussion. CMG should consider whether it could more systematically present in one discussion all relevant information regarding each Review Fund, which is now split into several different portions of the 15(c) materials. For any Fund that has been a Review Fund in consecutive years, CMG should address under what circumstances it could reasonably be anticipated that the Fund would lose that status.
3) Refinement of tax-exempt performance data. Certain single-state tax-exempt Funds compete in extremely small universes and are compared to a multi-state benchmark of uncertain relevance. Notwithstanding the difficulties, CMG should work to improve the reliability of the calculation of relative performance of these Funds. If that is not possible, CMG should provide guidance on how the Trustees should judge the quality of CMG's management of these Funds.
47
4) Development of risk metrics for asset-allocation, tax-exempt, and money market Funds. CMG has developed and shared with the Trustees quantitative risk metrics comparing equity and taxable fixed-income Funds against their peers. However, reliable risk metrics have not been developed for asset-allocation, tax-exempt fixed income, and money market Funds. We urge CMG to continue its efforts to provide reliable risk measures for these categories of Funds, especially in the cases of asset-allocation and money market funds, because their investors are likely to be motivated at least in part by a desire to manage risk.
5) Profitability data. For any period during which CMG is an affiliate of U.S. Trust, Bank of America Private Wealth Management, CMG should continue to present to the Trustees the profitability of each Fund, each investment style and each complex (of which Nations is one) calculated as follows:
a. Management-only profitability should be calculated without reference to any Private Bank expense.
b. Profitability excluding distribution (which essentially covers the management and transfer agency functions) should be adjusted by removing from the expense calculation any portion of the Private Bank payment not attributable to the performance by the Private Bank of sub-transfer agency or sub-accounting functions.
c. Total profitability, including distribution: No adjustment for Private Bank expenses should be made, because all such expenses represent legitimate fund expenses to be taken into account in calculating CMG's profit margin including distribution.
d. Distribution only: This should include all Private Bank expenses other than those attributable to sub-transfer agency services.
6) Contractual fee analysis. This year CMG presented a new Lipper report comparing the contractual management fees of Funds with those of competitors in similar investment styles. However, the reliability of the conclusion—that Fund management fee breakpoints compared favorably with competitive fee rates—was limited by the use of competitive funds at all asset levels. The sponsors of a $100 million mutual fund may not have given much thought to breakpoints at $5 billion; therefore, that fund's contractual fee at that level is unlikely to compare favorably with that of a $5 billion Fund. Limiting the competitors to the Lipper expense group, whose constituents are similar in size to the relevant Fund, would make the results more meaningful. In addition, the brea kpoints of a select group of Nations Funds (which would differ each year) should continue to be compared to those of industry rivals to ensure that the Funds' breakpoint schedules remain within industry norms. As breakpoint schedules change relatively little each year, performing such a comparison for each Nations Fund each year would not be an efficient use of Trustee and CMG resources.
7) Pro forma profitability data. In any year in which CMG or the Trustees believe that the prior year's profitability is unlikely to be representative of current business results due to changes in markets or for any other reason, CMG should, consistent with this year's practice, prepare a pro forma income statement based on year-to-date actual data and reasonable projections used for its own business planning purposes.
8) Additional institutional data and analysis. While CMG provided a substantial amount of information on its institutional business, we suggest some additional items for future years: (a) profitability data for the institutional business in the format, and based upon the same allocation methodologies, used to present Fund profitability, (b) an explanation of how CMA sets institutional fee breakpoints, which normally begin at asset levels far lower than those found in Fund management fee breakpoints, and (c) distinguishing in all institutional fee materials fees of accounts acquired prior to the development of current fee schedules (so-called "legacy" accounts) from the fees of accounts launched after that time.
9) Management fee disparities. In any future study of management fees, CMG and the Nations Trustees should analyze the differences in management fee schedules. As part of that analysis, CMG should provide an explanation for any significant fee differences among comparable funds across fund families sponsored by CMG, such as differences in the management styles of different Funds included the same Lipper category. Finally, if CMG proposes a management fee change or an expense cap for
48
any mutual fund managed by CMA that is comparable to any Nations Fund, CMG should provide the Trustees with sufficient information about the proposal to allow the Trustees to assess the applicability of the proposed change to the relevant Nations Fund or Funds.
10) Explanation of data supplied to Lipper. Each year, as part of the 15(c) process, CMG retains Lipper to compare the fees and expenses of each Fund to a group of competitors. In many cases, CMG, with the approval of the Trustees, adjusts the actual expense data, which is based on the most recent full fiscal year of the Fund (and each competitive fund) to reflect changes in fees or expense limits that occurred during or after the relevant fiscal year. This improves the reliability and usefulness of the comparison. However, to ensure that the Trustees know when and how CMG adjusted the data, we recommend that CMG prepare a table listing for each Fund what adjustments were made, e.g., to reflect a new expense limitation of x basis points that commenced on y date.
11) Reduction of volume of paper documents submitted. The effort to streamline and better organize the data presented to the Trustees and the process by which that data was prepared and organized continued to be well-received by all parties. Notwithstanding past success, it is always appropriate to look for opportunities to reduce and simplify the presentation of 15(c) data. One possibility would be to remove the 127 pages of biographical data, most if not all of which the Trustees have previously seen as part of their ongoing investment oversight duties, from the paper volume and post it on the Internet-based document storage and retrieval system used by the Funds to provide reference data to Trustees.
Respectfully submitted,
Steven E. Asher
49
This page intentionally left blank.
This page intentionally left blank.
This page intentionally left blank.
Important Information About This Report
The fund mails one shareholder report to each shareholder address. If you would like more than one report, please call shareholder services at 1-800-345-6611 and additional reports will be sent to you. This report has been prepared for shareholders of Columbia Small Cap Growth Fund II.
A description of the policies and procedures that the fund uses to determine how to vote proxies and a copy of the fund's voting records are available (i) at www.columbiamanagement.com, (ii) on the Securities and Exchange Commission's website at www.sec.gov, and (iii) without charge, upon request, by calling 1-800-368-0346. Information regarding how the fund voted proxies relating to portfolio securities during the 12-month period ended June 30 is available from the SEC's website. Information regarding how the fund voted proxies relating to portfolio securities is also available from the fund's website, www.columbiamanagement.com.
The fund files a complete schedule of portfolio holdings with the SEC for the first and third quarters of each fiscal year on Form N-Q. The fund's Form N-Q is available on the SEC's website at www.sec.gov and may be reviewed and copied at the SEC's Public Reference Room in Washington, D.C. Information on the operation of the Public Reference Room may be obtained by calling 1-800-SEC-0330.
Please read and consider the investment objectives, risks, charges and expenses for any fund carefully before investing. For a prospectus which contains this and other important information about the fund, contact your Columbia Management representative or financial advisor or go to www.columbiamanagement.com.
Columbia Management Group, LLC ("Columbia Management") is the investment management division of Bank of America Corporation. Columbia Management entities furnish investment management services and products for institutional and individual investors. Columbia Funds are distributed by Columbia Management Distributors, Inc., member of FINRA, SIPC, part of Columbia Management and an affiliate of Bank of America Corporation.
Transfer Agent
Columbia Management Services, Inc.
P.O. Box 8081
Boston, MA 02266-8081
1-800-345-6611
Distributor
Columbia Management
Distributors, Inc.
One Financial Center
Boston, MA 02111
Investment Advisor
Columbia Management Advisors, LLC
100 Federal Street
Boston, MA 02110
53
Columbia Management®
One Financial Center
Boston, MA 02111-2621
PRSRT STD
U.S. Postage
PAID
Holliston, MA
Permit NO. 20
Columbia Management®
Columbia Small Cap Growth Fund II
Annual Report, February 28, 2010
©2010 Columbia Management Distributors, Inc.
One Financial Center, Boston, MA 02111-2621
800-345-6611 www.columbiafunds.com
SHC-42/35025-0210 (04/10) 10-B2Z0S0
Columbia Management®
Annual Report
February 28, 2010
Columbia Large Cap Core Fund
| NOT FDIC INSURED | | May Lose Value | |
|
| NOT BANK ISSUED | | No Bank Guarantee | |
|
Table of Contents
| Fund Profile | | | 1 | | |
|
| Economic Update | | | 2 | | |
|
| Performance Information | | | 4 | | |
|
| Understanding Your Expenses | | | 5 | | |
|
| Portfolio Managers' Report | | | 6 | | |
|
| Financial Statements | | | | | |
|
| Investment Portfolio | | | 8 | | |
|
Statement of Assets and
Liabilities | | | 12 | | |
|
| Statement of Operations | | | 13 | | |
|
Statement of Changes in Net
Assets | | | 14 | | |
|
| Financial Highlights | | | 16 | | |
|
| Notes to Financial Statements | | | 20 | | |
|
Report of Independent
Registered Public Accounting
Firm | | | 29 | | |
|
| Federal Income Tax Information | | | 30 | | |
|
| Fund Governance | | | 31 | | |
|
Board Consideration and
Re-Approval of Current
Investment Advisory Agreement | | | 35 | | |
|
Board Consideration and
Approval of Proposed
Investment Advisory
Agreement | | | 39 | | |
|
Summary of Management
Fee Evaluation by Independent
Fee Consultant | | | 46 | | |
|
Important Information About
This Report | | | 53 | | |
|
The views expressed in this report reflect the current views of the respective parties. These views are not guarantees of future performance and involve certain risks, uncertainties and assumptions that are difficult to predict, so actual outcomes and results may differ significantly from the views expressed. These views are subject to change at any time based upon economic, market or other conditions and the respective parties disclaim any responsibility to update such views. These views may not be relied on as investment advice and, because investment decisions for a Columbia Fund are based on numerous factors, may not be relied on as an indication of trading intent on behalf of any particular Columbia Fund. References to specific securities should not be construed as a recommendation or investment advice.
President's Message

Dear Shareholder:
As we previously announced, Bank of America, N.A. has reached a definitive agreement to sell Columbia Management's long-term asset management business to Ameriprise Financial, Inc. This includes the management of its equity and fixed-income mutual funds.
This transaction combines two leading asset management firms and will create one entity that is expected to rank as one of the top asset managers. It is anticipated that the combined U.S. asset management business will operate under the well-regarded Columbia Management brand. The combined U.S. asset management business will be led by Ted Truscott, currently president, U.S. asset management, annuities and chief investment officer, Ameriprise Financial. Michael A. Jones, currently president of Columbia Management, will serve as president, U.S. asset management. Colin Moore, chief investment officer at Columbia Management, will continue to serve in that role for the combined organization. I will also continue in my role as head of mutual funds, responsible for the delivery of mutual fund products and services to investors.
As a valued investor in Columbia funds, please know that our goal is to ensure a smooth transition and provide you with the highest quality products and services. We will work closely with colleagues at Ameriprise Financial to seek a seamless transition for our clients and to keep you informed as the transition progresses and key decisions are made. We want to assure you that the funds' portfolio managers continue to focus on providing uninterrupted service to Columbia fund shareholders. Columbia Management and Ameriprise Financial will operate independently until all required approvals, including fund board, fund shareholder and other client approvals, have been received and the transaction closes, which is expected to occur in the spring of this year.
Meanwhile, transition teams across the company have been formed to oversee integration efforts including rebranding initiatives, vendor and system consolidations and client communications. Throughout the transition, we seek to build on best practices from both legacy organizations with enhancements to productivity, quality and the delivery of world-class customer experiences.
Clearly, we have a lot of work ahead of us in 2010. We look forward to introducing our combined business with an even wider breadth of products and capabilities. Everyone at Columbia Management and Ameriprise Financial is excited about the opportunities for this combined organization. I share this optimism and believe it will position us as a best-in-class asset management business with the ability to deliver more for clients than ever before.
Sincerely,

J. Kevin Connaughton
President, Columbia Funds
Past performance is no guarantee of future results.
Fund Profile – Columbia Large Cap Core Fund
Summary
g For the 12-month period that ended February 28, 2010, the fund's Class A shares returned 45.99% without sales charge.
g The fund underperformed both the S&P 500 Index1 and the average fund in its peer group, the Lipper Large-Cap Core Funds Classification.2
g While the fund achieved strong double-digit results for the period, its conservative positioning and emphasis on quality held it back relative to the index and peers in an environment in which speculative names responded more favorably.
Portfolio Management
Peter Santoro, lead manager since March 2008, has co-managed the fund since July 2004 and has been associated with the advisor or its predecessors since 2003.
Craig Leopold has co-managed the fund since July 2004 and has been associated with the advisor or its predecessors since 2003.
Subject to satisfying various conditions to closing, effective on or about May 1, 2010, RiverSource Investments, LLC, a subsidiary of Ameriprise Financial, Inc., is expected to become the investment advisor to the fund and change its name to Columbia Management Investment Advisers, LLC. Please see the fund's prospectus dated July 1, 2009, including the supplements thereto, for more information regarding the expected change in investment advisor and any related changes to the portfolio management of the fund.
1The Standard & Poor's (S&P) 500 Index tracks the performance of 500 widely held, large-capitalization U.S. stocks. Indices are not available for investment, are not professionally managed and do not reflect sales charges, fees, brokerage commissions, taxes or other expenses of investing. Securities in the fund may not match those in an index.
2Lipper Inc., a widely respected data provider in the industry, calculates an average total return (assuming reinvestment of distributions) for mutual funds with investment objectives similar to those of the fund. Lipper makes no adjustment for the effect of sales loads.
Performance data quoted represents past performance and current performance may be lower or higher. Past performance is no guarantee of future results. The investment return and principal value will fluctuate so that shares, when redeemed, may be worth more or less than the original cost. Please visit www.columbiafunds.com for daily and most recent month-end performance updates.
Summary
1-year return as of 02/28/10
| | +45.99% | |
|
| |  | | | Class A shares
(without sales charge) | |
|
| | | | | +53.62% | |
|
| |  | | | S&P 500 Index | |
|
Morningstar Style BoxTM
The Morningstar Style BoxTM reveals a fund's investment strategy. For equity funds, the vertical axis shows the market capitalization of the stocks owned, and the horizontal axis shows investment style (value, blend or growth). Information shown is based on the most recent data provided by Morningstar.
1
Economic Update – Columbia Large Cap Core Fund
Summary
For the 12-month period that ended February 28, 2010
g After a sharp decline, stock markets rebounded around the world, as measured by the S&P 500 Index and the MSCI EAFE Index.
| S&P Index | | MSCI Index | |
|
 | |  | |
|
g As investors grew more comfortable with risk, non-Treasury sectors of the bond market rebounded. The Barclays Capital Aggregate Bond Index delivered solid results. High-yield bonds were strong performers, as measured by the JPMorgan Developed BB High Yield Index.
Barclays
Aggregate Index | | JPMorgan
Index | |
|
 | |  | |
|
After a deep and difficult recession, the U.S. economy regained its footing midway through calendar year 2009. Gross domestic product (GDP) turned positive in the third quarter of 2009, rising 2.2%, and then gained 5.6% in the fourth quarter according to the estimate released by the Bureau of Economic Analysis. Growth was primarily the result of federal government stimulus spending and a slowdown in inventory reductions. Hopes for a sustained recovery now depend on a variety of factors, including a rebound in consumer spending, an increase in revenues to keep business profits moving higher and a turnaround in the labor market.
The housing market showed some signs of improvement. Existing home sales fell late in the period, but remained above levels of one year ago. According to the National Association of Realtors, the inventory of houses for sale fell over the course of 2009. Housing prices remained unchanged during the past year, but that was progress compared to 2008. The average home price fell in 2008 and since then distressed properties, which accounted for an estimated 38% of sales in January 2010, have weighed on prices because they were heavily discounted.
In the beleaguered labor market, the good news was that there was less bad news. Businesses continued to shed jobs throughout the period, raising the unemployment rate as high as 10.2% in October 2009. However, the pace of job losses slowed markedly by the period's end. Compared to monthly six figure losses of one year ago, 14,000 jobs were added to the labor market in January 2010 and only 14,000 were lost in February 2010.* The rate of unemployment at the end of the period was 9.7%.* Nevertheless, prospects for a quick recovery in the labor markets are dim. In fact, consumer confidence, as measured monthly by The Conference Board, an independent research organization, took a sharp dive in February. Consumers surveyed cited worsening business conditions, a bleaker outlook for the labor markets and income for their pessimism.
Manufacturing activity remained slow during the first few months of the period. However, a key measure—the Institute for Supply Management's Index—rose above 50 in July and remained well above 50 for the remainder of the period. A value above 50 tends to indicate that the economy is growing. Industrial production turned positive in January 2010, and durable goods orders took a big jump forward. Manufacturing capacity utilization inched upward to 72.6%.
Consumer spending registered both ups and downs during the 12-month period, but the trend at the end of the period was upward, even though personal income decreased in January 2010. In light of uncertainty about the economy and pressure on consumers from a number of sectors, the Federal Reserve Board (the Fed) kept a key short-term interest rate—the federal funds rate—close to zero throughout the period.
Stocks bottomed, then rebounded
Against a strengthening economic backdrop, a stock market rally that began in mid-March 2009 continued throughout the period. The U.S. stock market returned 53.62% for the 12-month period, as measured by the S&P 500 Index.1 Mid-cap stocks
*Source: U.S. Bureau of Labor Statistics
1The Standard & Poor's (S&P) 500 Index tracks the performance of 500 widely held, large-capitalization U.S. stocks.
2
Economic Update (continued) – Columbia Large Cap Core Fund
outperformed large and small-cap stocks and value stocks outperformed growth stocks by a solid margin, as measured by their respective Russell indices.2 Outside the U.S., stock market returns were even stronger. The MSCI EAFE Index,3 a broad gauge of stock market performance in foreign developed markets, gained 54.58% (net of dividends, in U.S. dollars) for the period. Emerging stock markets were caught in last year's downdraft, but they bounced back stronger than domestic or developed world markets in 2009 as their economic growth generally outpaced the developed world. The MSCI Emerging Markets Index4 returned 91.63% (net of dividends, in U.S. dollars).
Bond returns ranged from solid to strong
As hopes for a recovery materialized, bonds from non-Treasury sectors delivered solid returns. The Barclays Capital Aggregate Bond Index5 returned 9.32%. Municipal bonds delivered returns that were in line with taxable investment-grade bonds even without factoring in potential tax advantages to investors in higher income tax brackets. The Barclays Capital Municipal Bond Index6 returned 9.98%. High-yield bond prices rebounded strongly in 2009. For the 12-month period covered by this report, the JPMorgan Developed BB High Yield Index7 returned 32.79%.
Past performance is no guarantee of future results.
2The Russell 1000 Index tracks the performance of 1,000 of the largest U.S. companies, based on market capitalization. The Russell MidCap Index measures the performance of the 800 smallest companies in the Russell 1000 Index, which represents approximately 25% of the total market capitalization of the Russell 1000 Index. The Russell 2000 Index measures the performance of the 2,000 smallest companies in the Russell 3000 Index, which represents approximately 8% of the total market capitalization of the Russell 3000 Index. The Russell 3000 Growth Index measures the performance of those Russell 3000 Index companies with higher price-to-book ratios and higher forecasted growth values. The stocks in this index are also members of either the Russell 1000 Growth or the Russell 2000 Growth indexes. The Russell 3000 Value Index measures the performance of those Russell 3000 Index companies with lower price-to-book ratios and lo wer forecasted growth values. The stocks in this index are also members of either the Russell 1000 Value or the Russell 2000 Value indexes.
3The Morgan Stanley Capital International Europe, Australasia, Far East (MSCI EAFE) Index is a capitalization-weighted index that tracks the total return of common stocks in 21 developed-market countries within Europe, Australasia and the Far East.
4The Morgan Stanley Capital International Emerging Markets Index (MSCI EMI) is a free float-adjusted market capitalization index that is designed to measure equity market performance of emerging markets. As of June 2009, the MSCI Emerging Markets Index consisted of the following 22 emerging market country indices: Brazil, Chile, China, Colombia, Czech Republic, Egypt, Hungary, India, Indonesia, Israel, Korea, Malaysia, Mexico, Morocco, Peru, Philippines, Poland, Russia, South Africa, Taiwan, Thailand, and Turkey.
5The Barclays Capital Aggregate Bond Index is a market value-weighted index that tracks the daily price, coupon, pay-downs and total return performance of fixed-rate, publicly placed, dollar-denominated and non-convertible investment grade debt issues with at least $250 million par amount outstanding and with at least one year to final maturity.
6The Barclays Capital Municipal Bond Index is considered representative of the broad market for investment-grade, tax-exempt bonds with a maturity of at least one year.
7The JPMorgan Developed BB High Yield Index is an unmanaged index designed to mirror the investable universe of the U.S. dollar developed, BB-rated, high yield corporate debt market.
Indices are not available for investment, are not professionally managed and do not reflect sales charges, fees, brokerage commissions, taxes or other expenses of investing. Securities in the fund may not match those in an index.
3
Performance Information – Columbia Large Cap Core Fund
Performance data quoted represents past performance and current performance may be lower or higher. Past performance is no guarantee of future results. The investment return and principal value will fluctuate so that shares, when redeemed, may be worth more or less than the original cost. Please visit www.columbiafunds.com for daily and most recent month-end performance updates.
Annual operating expense ratio (%)*
| Class A | | | 1.15 | | |
| Class B | | | 1.90 | | |
| Class C | | | 1.90 | | |
| Class Z | | | 0.90 | | |
*The annual operating expense ratio is as stated in the fund's prospectus that is current as of the date of this report and includes the expenses incurred by the investment companies in which the fund invests. Differences in expense ratios disclosed elsewhere in this report may result from expenses incurred by the investment companies, including fee waivers and expense reimbursements as well as different time periods used in calculating the ratios.
Performance of a $10,000 investment 03/01/00 – 02/28/10
The chart above shows the change in value of a hypothetical $10,000 investment in Class A shares of Columbia Large Cap Core Fund during the stated time period, and does not reflect the deduction of taxes that a shareholder may pay on fund distributions or on the redemption of fund shares.
Performance of a $10,000 investment 03/01/00 – 02/28/10 ($)
| Sales charge | | without | | with | |
| Class A | | | 8,257 | | | | 7,784 | | |
| Class B | | | 7,641 | | | | 7,641 | | |
| Class C | | | 7,641 | | | | 7,641 | | |
| Class Z | | | 8,429 | | | | n/a | | |
Average annual total return as of 02/28/10 (%)
| Share class | | A | | B | | C | | Z | |
| Inception | | 08/02/99 | | 08/02/99 | | 08/02/99 | | 10/02/98 | |
| Sales charge | | without | | with | | without | | with | | without | | with | | without | |
| 1-year | | | 45.99 | | | | 37.51 | | | | 44.74 | | | | 39.74 | | | | 44.93 | | | | 43.93 | | | | 46.30 | | |
| 5-year | | | 1.01 | | | | –0.18 | | | | 0.25 | | | | –0.13 | | | | 0.25 | | | | 0.25 | | | | 1.27 | | |
| 10-year | | | –1.90 | | | | –2.47 | | | | –2.65 | | | | –2.65 | | | | –2.65 | | | | –2.65 | | | | –1.69 | | |
Average annual total return as of 03/31/10 (%)
| Share class | | A | | B | | C | | Z | |
| Sales charge | | without | | with | | without | | with | | without | | with | | without | |
| 1-year | | | 43.68 | | | | 35.46 | | | | 42.73 | | | | 37.73 | | | | 42.73 | | | | 41.73 | | | | 44.04 | | |
| 5-year | | | 2.55 | | | | 1.34 | | | | 1.77 | | | | 1.40 | | | | 1.79 | | | | 1.79 | | | | 2.80 | | |
| 10-year | | | –2.03 | | | | –2.61 | | | | –2.78 | | | | –2.78 | | | | –2.78 | | | | –2.78 | | | | –1.84 | | |
The "with sales charge" returns include the maximum initial sales charge of 5.75% for Class A shares, the applicable contingent deferred sales charge of 5.00% in the first year, declining to 1.00% in the sixth year and eliminated thereafter for Class B shares and 1.00% for Class C shares for the first year only. The "without sales charge" returns do not include the effect of sales charges. If they had, returns would be lower.
Performance results reflect any fee waivers or reimbursements of fund expenses by the investment advisor and/or any of its affiliates. Absent these fee waivers or expense reimbursement arrangements, performance results would have been lower.
All results shown assume reinvestment of distributions. Class Z shares are sold at net asset value with no distribution and service (Rule 12b-1) fees. Class Z shares have limited eligibility and the investment minimum requirements may vary. Please see the fund's prospectus for details. Performance for different share classes will vary based on differences in sales charges and fees associated with each class.
The tables do not reflect the deduction of taxes that a shareholder may pay on fund distributions or on the redemption of fund shares.
4
Understanding Your Expenses – Columbia Large Cap Core Fund
As a fund shareholder, you incur two types of costs. There are transaction costs, which generally include sales charges on purchases and may include redemption fees or exchange fees. There are also ongoing costs, which generally include investment advisory fees, distribution and service (Rule 12b-1) fees and other fund expenses. The information on this page is intended to help you understand the ongoing costs of investing in the fund and to compare these costs with the ongoing costs of investing in other mutual funds.
Analyzing your fund's expenses by share class
To illustrate these ongoing costs, we have provided an example and calculated the expenses paid by investors in each share class during the period. The information in the following table is based on an initial investment of $1,000, which is invested at the beginning of the period and held for the entire period. Expense information is calculated two ways and each method provides you with different information. The amount listed in the "Actual" column is calculated using the fund's actual operating expenses and total return for the period. The amount listed in the "Hypothetical" column for each share class assumes that the return each year is 5% before expenses and is calculated based on the fund's actual operating expenses. You should not use the hypothetical account values and expenses to estimate either your actual account balance at the end of the period or the expenses you paid during this period.
Compare with other funds
Since all mutual funds are required to include the same hypothetical calculations about expenses in shareholder reports, you can use this information to compare the ongoing cost of investing in the fund with other funds. To do so, compare the 5% hypothetical example with the 5% hypothetical examples that appear in the shareholder reports of other funds. As you compare hypothetical examples of other funds, it is important to note that hypothetical examples are meant to highlight the ongoing costs of investing in a fund and do not reflect any transaction costs, such as sales charges, redemption fees or exchange fees.
Estimating your actual expenses
To estimate the expenses that you paid over the period, first you will need your account balance at the end of the period:
g For shareholders who receive their account statements from Columbia Management Services, Inc., your account balance is available online at www.columbiafunds.com or by calling Shareholder Services at 800.345.6611.
g For shareholders who receive their account statements from their financial intermediary, contact your financial intermediary to obtain your account balance.
1. Divide your ending account balance by $1,000. For example, if an account balance was $8,600 at the end of the period, the result would be 8.6.
2. In the section of the table below titled "Expenses paid during the period," locate the amount for your share class. You will find this number in the column labeled "Actual." Multiply this number by the result from step 1. Your answer is an estimate of the expenses you paid on your account during the period.
If the value of your account falls below the minimum initial investment requirement applicable to you, your account generally will be subject to a $20 annual fee. This fee is not included in the accompanying table. If you are subject to the fee, keep it in mind when you are estimating the ongoing expenses of investing in the fund and when comparing the expenses of this fund with other funds.
09/01/09 – 02/28/10
| | | Account value at the
beginning of the period ($) | | Account value at the
end of the period ($) | | Expenses paid
during the period ($) | | Fund's annualized
expense ratio (%) | |
| | | Actual | | Hypothetical | | Actual | | Hypothetical | | Actual | | Hypothetical | | Actual | |
| Class A | | | 1,000.00 | | | | 1,000.00 | | | | 1,069.50 | | | | 1,019.04 | | | | 5.95 | | | | 5.81 | | | | 1.16 | | |
| Class B | | | 1,000.00 | | | | 1,000.00 | | | | 1,064.80 | | | | 1,015.32 | | | | 9.78 | | | | 9.54 | | | | 1.91 | | |
| Class C | | | 1,000.00 | | | | 1,000.00 | | | | 1,065.80 | | | | 1,015.32 | | | | 9.78 | | | | 9.54 | | | | 1.91 | | |
| Class Z | | | 1,000.00 | | | | 1,000.00 | | | | 1,071.60 | | | | 1,020.28 | | | | 4.67 | | | | 4.56 | | | | 0.91 | | |
Expenses paid during the period are equal to the annualized expense ratio for the share class, multiplied by the average account value over the period, then multiplied by the number of days in the fund's most recent fiscal half-year and divided by 365.
It is important to note that the expense amounts shown in the table are meant to highlight only ongoing costs of investing in the fund and do not reflect any transaction costs, such as sales charges, redemption fees or exchange fees. Therefore, the hypothetical examples provided may not help you determine the relative total costs of owning shares of different funds. If these transaction costs were included, your costs would have been higher.
5
Portfolio Managers' Report – Columbia Large Cap Core Fund
Performance data quoted represents past performance and current performance may be lower or higher. Past performance is no guarantee of future results. The investment return and principal value will fluctuate so that shares, when redeemed, may be worth more or less than the original cost. Please visit www.columbiafunds.com for daily and most recent month-end performance updates.
Net asset value per share
as of 02/28/10 ($)
| Class A | | | 11.48 | | |
| Class B | | | 11.11 | | |
| Class C | | | 11.11 | | |
| Class Z | | | 11.45 | | |
Distributions declared per share
03/01/09 – 02/28/10 ($)
| Class A | | | 0.12 | | |
| Class B | | | 0.04 | | |
| Class C | | | 0.04 | | |
| Class Z | | | 0.14 | | |
For the 12-month period that ended February 28, 2010, the fund's Class A shares returned 45.99% without sales charge. The fund underperformed its benchmark, the S&P 500 Index, which returned 53.62%, and the average return of its peer group, the Lipper Large-Cap Core Funds Classification, which was 51.96%. The stock market rally that characterized most of the period drove strong results for the fund and its benchmark. However, the fund's emphasis on companies with solid balance sheets and good prospects for free cash flow generation hurt performance relative to the benchmark in an environment that favored companies with weaker balance sheets, which rallied strongly as the likelihood of bankruptcies decreased. The fund's focus on companies in sectors that historically have done well early in the economic cycle and on companies that could benefit from the recovery of emerging economies worked in its favor, as did a contrarian p osition in managed health care companies.
Economic recovery, emerging markets and energy themes helped drive results
Several of the fund's technology holdings were among early beneficiaries of positive economic news, including Hewlett-Packard, Microsoft, Apple and Google (2.1%, 1.8%, 1.8% and 2.0% of net assets, respectively). In light of a potentially muted domestic economic recovery, we sought out companies with exposure to emerging markets, which may have greater growth prospects. Among holdings that benefited from an uptick in demand from emerging economies were iron ore distributor Rio Tinto, cosmetics purveyor Avon Products (0.8% and 0.7% of net assets, respectively) and AES, an international generator and distributor of electricity. All three turned in strong results on fast-growing demand from overseas, and we subsequently sold the AES position.
An emphasis on oil and natural gas exploration and production companies also aided returns. Apache and Occidental Petroleum (1.2% and 2.1% of net assets, respectively) were among the names that benefited from rising energy prices. Both continued to develop their pipelines with discoveries of new oil and gas reserves. Although the debate on national health care put pressure on insurance companies, we built a position in managed care companies, including CIGNA, Humana and UnitedHealth Group (0.6%, 0.5% and 0.4%, respectively). Their share prices did not, in our opinion, reflect substantial future cash flow prospects, and we were rewarded when prices edged upwards.
Disappointments in financials, industrials and consumer discretionary sectors
In a market that seemed to assume that the worst was over for the economy and rewarded hope for the future, many of the companies that had performed well in 2008 did not retain that momentum throughout 2009. Thus, our cautious approach to the cyclical rally detracted from performance during the period, as we continued to emphasize companies with financial strength and defensive characteristics. As a result, the fund's holdings in the financials, industrials, and consumer discretionary sectors failed to keep up with the benchmark, which included more speculative names in these sectors. We focused on bank stocks, such as Fifth Third, U.S. Bancorp, JPMorgan Chase and PNC Financial Services Group (0.4%, 0.8%, 3.1% and 1.1% of net assets, respectively), as the segment within financials that was most likely to succeed as the
6
Portfolio Managers' Report (continued) – Columbia Large Cap Core Fund
risk of insolvency declined. They did well during the period, but more speculative issuers did even better. While holdings with absolute negative results were few, department store J.C. Penney reported disappointing same store sales, and shares of education firm Apollo Group (0.4% of net assets) declined amidst concerns regarding an SEC inquiry into the company's revenue recognition practices. We sold J.C. Penney.
Positioned for improving economy
We remain focused on high-quality companies with strong balance sheets that we believe are well positioned relative to their respective industries. By drawing on three independent research sources—fundamental research, quantitative models and the input of our portfolio management team—and by employing a disciplined valuation process, we are seeking companies that are positioned to capitalize as the economic recovery continues.
Portfolio holdings and characteristics are subject to change periodically and may not be representative of current holdings and characteristics. The outlook for the fund may differ from those presented for other Columbia Funds.
Equity investments are affected by stock market fluctuations that occur in response to economic and business developments.
International investing may involve certain risks, including currency fluctuations, risks associated with possible differences in financial accounting standards and other monetary and political risks. Significant levels of foreign taxes, including potentially confiscatory levels of taxation and withholding taxes, may also apply to some foreign investments.
Top 5 sectors
as of 02/28/10 (%)
| Information Technology | | | 19.1 | | |
| Financials | | | 16.0 | | |
| Health Care | | | 12.0 | | |
| Energy | | | 11.5 | | |
| Industrials | | | 11.2 | | |
Top 10 holdings
as of 02/28/10 (%)
| JPMorgan Chase | | | 3.1 | | |
| Procter & Gamble | | | 2.6 | | |
| Goldman Sachs Group | | | 2.5 | | |
International Business
Machines | | | 2.4 | | |
| General Electric | | | 2.1 | | |
| Occidental Petroleum | | | 2.1 | | |
| Hewlett-Packard | | | 2.0 | | |
| Philip Morris International | | | 2.0 | | |
| Exxon Mobil | | | 2.0 | | |
| Google | | | 1.9 | | |
| Apple | | | 1.8 | | |
The fund is actively managed and the composition of its portfolio will change over time. Information provided is calculated as a percentage of net assets.
7
Investment Portfolio – Columbia Large Cap Core Fund
February 28, 2010
| Common Stocks – 99.4% | |
| | | Shares | | Value ($) | |
| Consumer Discretionary – 10.8% | |
| Auto Components – 0.3% | |
| BorgWarner, Inc. (a) | | | 87,930 | | | | 3,293,858 | | |
| Auto Components Total | | | 3,293,858 | | |
| Automobiles – 0.4% | |
| Ford Motor Co. (a) | | | 398,520 | | | | 4,678,625 | | |
| Automobiles Total | | | 4,678,625 | | |
| Diversified Consumer Services – 0.4% | |
| Apollo Group, Inc., Class A (a) | | | 68,120 | | | | 4,079,025 | | |
| Diversified Consumer Services Total | | | 4,079,025 | | |
| Hotels, Restaurants & Leisure – 1.1% | |
| Carnival Corp. | | | 159,020 | | | | 5,718,359 | | |
| Starbucks Corp. (a) | | | 294,750 | | | | 6,752,723 | | |
| Hotels, Restaurants & Leisure Total | | | 12,471,082 | | |
| Internet & Catalog Retail – 0.8% | |
| Amazon.com, Inc. (a) | | | 73,020 | | | | 8,645,568 | | |
| Internet & Catalog Retail Total | | | 8,645,568 | | |
| Media – 3.4% | |
| DIRECTV, Class A (a) | | | 149,210 | | | | 5,050,758 | | |
| DISH Network Corp., Class A (a) | | | 250,970 | | | | 5,011,871 | | |
| Gannett Co., Inc. | | | 362,420 | | | | 5,490,663 | | |
| News Corp., Class A | | | 841,810 | | | | 11,255,000 | | |
| Viacom, Inc., Class B (a) | | | 383,012 | | | | 11,356,306 | | |
| Media Total | | | 38,164,598 | | |
| Multiline Retail – 1.5% | |
| Nordstrom, Inc. | | | 108,200 | | | | 3,996,908 | | |
| Target Corp. | | | 260,550 | | | | 13,423,536 | | |
| Multiline Retail Total | | | 17,420,444 | | |
| Specialty Retail – 2.4% | |
| Lowe's Companies, Inc. | | | 705,060 | | | | 16,716,972 | | |
| Ross Stores, Inc. | | | 146,990 | | | | 7,189,281 | | |
| TJX Companies, Inc. | | | 69,100 | | | | 2,876,633 | | |
| Specialty Retail Total | | | 26,782,886 | | |
| Textiles, Apparel & Luxury Goods – 0.5% | |
| Hanesbrands, Inc. (a) | | | 219,570 | | | | 5,693,450 | | |
| Textiles, Apparel & Luxury Goods Total | | | 5,693,450 | | |
| Consumer Discretionary Total | | | 121,229,536 | | |
| Consumer Staples – 10.2% | |
| Beverages – 1.0% | |
| PepsiCo, Inc. | | | 187,700 | | | | 11,725,619 | | |
| Beverages Total | | | 11,725,619 | | |
| | | Shares | | Value ($) | |
| Food & Staples Retailing – 1.1% | |
| CVS Caremark Corp. | | | 162,790 | | | | 5,494,163 | | |
| Wal-Mart Stores, Inc. | | | 128,210 | | | | 6,932,315 | | |
| Food & Staples Retailing Total | | | 12,426,478 | | |
| Food Products – 1.3% | |
| General Mills, Inc. | | | 113,690 | | | | 8,186,817 | | |
Mead Johnson Nutrition Co.,
Class A | | | 123,180 | | | | 5,826,414 | | |
| Food Products Total | | | 14,013,231 | | |
| Household Products – 3.7% | |
| Clorox Co. | | | 191,630 | | | | 11,748,836 | | |
| Procter & Gamble Co. | | | 467,461 | | | | 29,580,932 | | |
| Household Products Total | | | 41,329,768 | | |
| Personal Products – 0.7% | |
| Avon Products, Inc. | | | 273,948 | | | | 8,338,977 | | |
| Personal Products Total | | | 8,338,977 | | |
| Tobacco – 2.4% | |
| Lorillard, Inc. | | | 58,560 | | | | 4,277,222 | | |
| Philip Morris International, Inc. | | | 456,752 | | | | 22,371,713 | | |
| Tobacco Total | | | 26,648,935 | | |
| Consumer Staples Total | | | 114,483,008 | | |
| Energy – 11.5% | |
| Energy Equipment & Services – 2.1% | |
| Baker Hughes, Inc. | | | 172,520 | | | | 8,267,158 | | |
| Noble Corp. (a) | | | 215,240 | | | | 9,096,042 | | |
| Transocean Ltd. (a) | | | 85,364 | | | | 6,813,755 | | |
| Energy Equipment & Services Total | | | 24,176,955 | | |
| Oil, Gas & Consumable Fuels – 9.4% | |
| Alpha Natural Resources, Inc. (a) | | | 61,580 | | | | 2,833,296 | | |
| Apache Corp. | | | 129,952 | | | | 13,468,225 | | |
| Cabot Oil & Gas Corp. | | | 111,670 | | | | 4,482,434 | | |
| Chevron Corp. | | | 267,887 | | | | 19,368,230 | | |
| Continental Resources, Inc. (a) | | | 112,850 | | | | 4,455,318 | | |
| EOG Resources, Inc. | | | 92,100 | | | | 8,662,005 | | |
| Exxon Mobil Corp. | | | 340,070 | | | | 22,104,550 | | |
| Occidental Petroleum Corp. | | | 290,660 | | | | 23,209,201 | | |
| Peabody Energy Corp. | | | 75,730 | | | | 3,481,308 | | |
| Southwestern Energy Co. (a) | | | 86,680 | | | | 3,688,234 | | |
| Oil, Gas & Consumable Fuels Total | | | 105,752,801 | | |
| Energy Total | | | 129,929,756 | | |
| Financials – 16.0% | |
| Capital Markets – 5.4% | |
| Franklin Resources, Inc. | | | 95,370 | | | | 9,701,036 | | |
| Goldman Sachs Group, Inc. | | | 178,800 | | | | 27,955,380 | | |
See Accompanying Notes to Financial Statements.
8
Columbia Large Cap Core Fund
February 28, 2010
| Common Stocks (continued) | |
| | | Shares | | Value ($) | |
| Morgan Stanley | | | 160,520 | | | | 4,523,454 | | |
| Raymond James Financial, Inc. | | | 170,270 | | | | 4,403,182 | | |
| State Street Corp. | | | 62,170 | | | | 2,792,055 | | |
| T. Rowe Price Group, Inc. | | | 224,600 | | | | 11,384,974 | | |
| Capital Markets Total | | | 60,760,081 | | |
| Commercial Banks – 3.3% | |
| Fifth Third Bancorp. | | | 366,780 | | | | 4,478,384 | | |
PNC Financial Services
Group, Inc. | | | 234,359 | | | | 12,599,140 | | |
| U.S. Bancorp | | | 353,510 | | | | 8,699,881 | | |
| Wells Fargo & Co. | | | 406,406 | | | | 11,111,140 | | |
| Commercial Banks Total | | | 36,888,545 | | |
| Consumer Finance – 1.9% | |
| American Express Co. | | | 370,390 | | | | 14,145,194 | | |
| Discover Financial Services | | | 541,303 | | | | 7,388,786 | | |
| Consumer Finance Total | | | 21,533,980 | | |
| Diversified Financial Services – 3.1% | |
| JPMorgan Chase & Co. | | | 840,450 | | | | 35,273,686 | | |
| Diversified Financial Services Total | | | 35,273,686 | | |
| Insurance – 2.3% | |
| Axis Capital Holdings Ltd. | | | 102,246 | | | | 3,215,637 | | |
| Prudential Financial, Inc. | | | 152,720 | | | | 8,004,055 | | |
| Unum Group | | | 367,930 | | | | 7,656,623 | | |
| XL Capital Ltd., Class A | | | 387,410 | | | | 7,077,981 | | |
| Insurance Total | | | 25,954,296 | | |
| Financials Total | | | 180,410,588 | | |
| Health Care – 12.0% | |
| Biotechnology – 1.7% | |
| Gilead Sciences, Inc. (a) | | | 313,474 | | | | 14,924,497 | | |
| Vertex Pharmaceuticals, Inc. (a) | | | 98,790 | | | | 4,011,862 | | |
| Biotechnology Total | | | 18,936,359 | | |
| Health Care Equipment & Supplies – 1.9% | |
| Baxter International, Inc. | | | 145,620 | | | | 8,290,146 | | |
| CareFusion Corp. (a) | | | 238,270 | | | | 6,013,935 | | |
| St. Jude Medical, Inc. (a) | | | 190,800 | | | | 7,292,376 | | |
| Health Care Equipment & Supplies Total | | | 21,596,457 | | |
| Health Care Providers & Services – 3.2% | |
| AmerisourceBergen Corp. | | | 368,760 | | | | 10,340,031 | | |
| Cardinal Health, Inc. | | | 83,490 | | | | 2,836,155 | | |
| CIGNA Corp. | | | 190,690 | | | | 6,533,039 | | |
| Humana, Inc. (a) | | | 109,960 | | | | 5,204,407 | | |
| Medco Health Solutions, Inc. (a) | | | 110,560 | | | | 6,991,815 | | |
| UnitedHealth Group, Inc. | | | 139,120 | | | | 4,710,603 | | |
| Health Care Providers & Services Total | | | 36,616,050 | | |
| | | Shares | | Value ($) | |
| Life Sciences Tools & Services – 0.7% | |
| Millipore Corp. (a) | | | 25,660 | | | | 2,422,561 | | |
| Thermo Fisher Scientific, Inc. (a) | | | 118,590 | | | | 5,783,634 | | |
| Life Sciences Tools & Services Total | | | 8,206,195 | | |
| Pharmaceuticals – 4.5% | |
| Abbott Laboratories | | | 364,060 | | | | 19,761,177 | | |
| Merck & Co., Inc. | | | 403,620 | | | | 14,885,505 | | |
| Mylan, Inc. (a) | | | 219,420 | | | | 4,682,423 | | |
| Pfizer, Inc. | | | 622,580 | | | | 10,926,279 | | |
| Pharmaceuticals Total | | | 50,255,384 | | |
| Health Care Total | | | 135,610,445 | | |
| Industrials – 11.2% | |
| Aerospace & Defense – 2.6% | |
| General Dynamics Corp. | | | 103,180 | | | | 7,485,709 | | |
| Honeywell International, Inc. | | | 141,000 | | | | 5,662,560 | | |
| United Technologies Corp. | | | 233,473 | | | | 16,027,921 | | |
| Aerospace & Defense Total | | | 29,176,190 | | |
| Air Freight & Logistics – 1.2% | |
United Parcel Service, Inc.,
Class B | | | 243,580 | | | | 14,307,889 | | |
| Air Freight & Logistics Total | | | 14,307,889 | | |
| Building Products – 0.4% | |
| Masco Corp. | | | 313,740 | | | | 4,194,704 | | |
| Building Products Total | | | 4,194,704 | | |
| Electrical Equipment – 0.6% | |
| Cooper Industries PLC, Class A | | | 144,380 | | | | 6,549,077 | | |
| Electrical Equipment Total | | | 6,549,077 | | |
| Industrial Conglomerates – 2.9% | |
| General Electric Co. | | | 1,496,827 | | | | 24,039,042 | | |
| Tyco International Ltd. | | | 232,910 | | | | 8,398,734 | | |
| Industrial Conglomerates Total | | | 32,437,776 | | |
| Machinery – 3.5% | |
| Dover Corp. | | | 173,790 | | | | 7,865,735 | | |
| Flowserve Corp. | | | 52,730 | | | | 5,277,746 | | |
| Illinois Tool Works, Inc. | | | 240,640 | | | | 10,953,933 | | |
| Joy Global, Inc. | | | 85,020 | | | | 4,319,016 | | |
| Parker Hannifin Corp. | | | 178,518 | | | | 10,766,421 | | |
| Machinery Total | | | 39,182,851 | | |
| Industrials Total | | | 125,848,487 | | |
| Information Technology – 19.1% | |
| Communications Equipment – 2.5% | |
Brocade Communications
Systems, Inc. (a) | | | 595,660 | | | | 3,466,741 | | |
| Cisco Systems, Inc. (a) | | | 479,930 | | | | 11,676,697 | | |
See Accompanying Notes to Financial Statements.
9
Columbia Large Cap Core Fund
February 28, 2010
| Common Stocks (continued) | |
| | | Shares | | Value ($) | |
| CommScope, Inc. (a) | | | 121,050 | | | | 3,085,564 | | |
| QUALCOMM, Inc. | | | 261,030 | | | | 9,577,191 | | |
| Communications Equipment Total | | | 27,806,193 | | |
| Computers & Peripherals – 7.8% | |
| Apple, Inc. (a) | | | 100,446 | | | | 20,553,261 | | |
| EMC Corp. (a) | | | 597,111 | | | | 10,443,471 | | |
| Hewlett-Packard Co. | | | 453,897 | | | | 23,053,429 | | |
International Business
Machines Corp. | | | 215,412 | | | | 27,391,790 | | |
| Teradata Corp. (a) | | | 214,390 | | | | 6,536,751 | | |
| Computers & Peripherals Total | | | 87,978,702 | | |
| Internet Software & Services – 3.3% | |
| Akamai Technologies, Inc. (a) | | | 179,510 | | | | 4,721,113 | | |
| eBay, Inc. (a) | | | 456,490 | | | | 10,508,400 | | |
| Google, Inc., Class A (a) | | | 41,571 | | | | 21,899,603 | | |
| Internet Software & Services Total | | | 37,129,116 | | |
| IT Services – 1.3% | |
| MasterCard, Inc., Class A | | | 40,400 | | | | 9,064,548 | | |
| Western Union Co. | | | 358,130 | | | | 5,651,291 | | |
| IT Services Total | | | 14,715,839 | | |
| Semiconductors & Semiconductor Equipment – 2.1% | |
| Lam Research Corp. (a) | | | 121,280 | | | | 4,112,605 | | |
| Novellus Systems, Inc. (a) | | | 375,090 | | | | 8,296,991 | | |
| Texas Instruments, Inc. | | | 460,120 | | | | 11,217,725 | | |
Semiconductors & Semiconductor
Equipment Total | | | 23,627,321 | | |
| Software – 2.1% | |
| Microsoft Corp. | | | 706,789 | | | | 20,256,573 | | |
| Nuance Communications, Inc. (a) | | | 224,300 | | | | 3,227,677 | | |
| Software Total | | | 23,484,250 | | |
| Information Technology Total | | | 214,741,421 | | |
| Materials – 3.6% | |
| Chemicals – 1.0% | |
| Celanese Corp., Series A | | | 243,270 | | | | 7,587,591 | | |
| PPG Industries, Inc. | | | 64,700 | | | | 3,981,638 | | |
| Chemicals Total | | | 11,569,229 | | |
| Containers & Packaging – 1.0% | |
| Owens-Illinois, Inc. (a) | | | 218,910 | | | | 6,488,492 | | |
| Packaging Corp. of America | | | 202,430 | | | | 4,817,834 | | |
| Containers & Packaging Total | | | 11,306,326 | | |
| Metals & Mining – 1.2% | |
| Rio Tinto PLC, ADR | | | 41,000 | | | | 8,519,800 | | |
| Steel Dynamics, Inc. | | | 272,820 | | | | 4,455,151 | | |
| Metals & Mining Total | | | 12,974,951 | | |
| | | Shares | | Value ($) | |
| Paper & Forest Products – 0.4% | |
| International Paper Co. | | | 183,830 | | | | 4,259,341 | | |
| Paper & Forest Products Total | | | 4,259,341 | | |
| Materials Total | | | 40,109,847 | | |
| Telecommunication Services – 3.1% | |
| Diversified Telecommunication Services – 2.0% | |
| AT&T, Inc. | | | 325,392 | | | | 8,072,976 | | |
| Verizon Communications, Inc. | | | 492,628 | | | | 14,251,728 | | |
| Diversified Telecommunication Services Total | | | 22,324,704 | | |
| Wireless Telecommunication Services – 1.1% | |
Millicom International
Cellular SA | | | 59,490 | | | | 5,041,183 | | |
| NII Holdings, Inc. (a) | | | 134,520 | | | | 5,033,738 | | |
| Sprint Nextel Corp. (a) | | | 829,600 | | | | 2,762,568 | | |
| Wireless Telecommunication Services Total | | | 12,837,489 | | |
| Telecommunication Services Total | | | 35,162,193 | | |
| Utilities – 1.9% | |
| Electric Utilities – 0.2% | |
| American Electric Power Co., Inc. | | | 77,214 | | | | 2,595,935 | | |
| Electric Utilities Total | | | 2,595,935 | | |
| Gas Utilities – 0.4% | |
| Questar Corp. | | | 104,740 | | | | 4,398,033 | | |
| Gas Utilities Total | | | 4,398,033 | | |
| Multi-Utilities – 1.3% | |
| PG&E Corp. | | | 160,650 | | | | 6,734,448 | | |
Public Service Enterprise
Group, Inc. | | | 273,380 | | | | 8,124,853 | | |
| Multi-Utilities Total | | | 14,859,301 | | |
| Utilities Total | | | 21,853,269 | | |
Total Common Stocks
(cost of $1,001,094,954) | | | 1,119,378,550 | | |
See Accompanying Notes to Financial Statements.
10
Columbia Large Cap Core Fund
February 28, 2010
| Short-Term Obligation – 0.1% | |
| | | Par ($) | | Value ($) | |
Repurchase agreement
with Fixed Income
Clearing Corp., dated
02/26/10, due 03/01/10
at 0.050%, collateralized
by a U.S. Government
Agency obligation maturing
03/30/10, market value
$691,850 (repurchase
proceeds $674,003) | | | 674,000 | | | | 674,000 | | |
Total Short-Term Obligation
(cost of $674,000) | | | 674,000 | | |
Total Investments – 99.5%
(cost of $1,001,768,954) (b) | | | 1,120,052,550 | | |
| Other Assets & Liabilities, Net – 0.5% | | | 5,384,850 | | |
| Net Assets – 100.0% | | | 1,125,437,400 | | |
Notes to Investment Portfolio:
(a) Non-income producing security.
(b) Cost for federal income tax purposes is $1,005,944,507.
The following table summarizes the inputs used, as of February 28, 2010, in valuing the Fund's assets:
| Description | | Quoted Prices
(Level 1) | | Other
Significant
Observable
Inputs
(Level 2) | | Significant
Unobservable
Inputs
(Level 3) | | Total | |
| Total Common Stocks | | $ | 1,119,378,550 | | | $ | — | | | $ | — | | | $ | 1,119,378,550 | | |
Total Short-Term
Obligation | | | — | | | | 674,000 | | | | — | | | | 674,000 | | |
| Total Investments | | $ | 1,119,378,550 | | | $ | 674,000 | | | $ | — | | | $ | 1,120,052,550 | | |
For more information on valuation inputs, and their aggregation into the levels used in the table above, please refer to the Security Valuation section in the accompanying Notes to Financial Statements.
For the year ended February 28, 2010, transactions in written call option contracts were as follows:
| | | Number of
contracts | | Premium
received | |
| Options outstanding at February 28, 2009 | | | 1,620 | | | $ | 94,079 | | |
| Options written | | | 5,635 | | | | 369,038 | | |
Options terminated in closing purchase
transactions | | | — | | | | — | | |
| Options exercised | | | (2,240 | ) | | | (238,575 | ) | |
| Options expired | | | (5,015 | ) | | | (224,542 | ) | |
| Options outstanding at February 28, 2010 | | | — | | | $ | — | | |
At February 28, 2010, the Fund held investments in the following sectors:
| Sector (Unaudited) | | % of
Net Assets | |
| Information Technology | | | 19.1 | | |
| Financials | | | 16.0 | | |
| Health Care | | | 12.0 | | |
| Energy | | | 11.5 | | |
| Industrials | | | 11.2 | | |
| Consumer Discretionary | | | 10.8 | | |
| Consumer Staples | | | 10.2 | | |
| Materials | | | 3.6 | | |
| Telecommunication Services | | | 3.1 | | |
| Utilities | | | 1.9 | | |
| | | | 99.4 | | |
| Short-Term Obligation | | | 0.1 | | |
| Other Assets & Liabilities, Net | | | 0.5 | | |
| | | | 100.0 | | |
| Acronym | | Name | |
| ADR | | American Depositary Receipt | |
|
See Accompanying Notes to Financial Statements.
11
Statement of Assets and Liabilities – Columbia Large Cap Core Fund
February 28, 2010
| | | | | ($) | |
| Assets | | Investments, at identified cost | | | 1,001,768,954 | | |
| | | Investments, at value | | | 1,120,052,550 | | |
| | | Cash | | | 233 | | |
| | Receivable for: | | | | | |
| | | Investments sold | | | 13,501,493 | | |
| | | Fund shares sold | | | 3,360,959 | | |
| | | Dividends | | | 1,923,727 | | |
| | | Interest | | | 3 | | |
| | | Foreign tax reclaims | | | 8,735 | | |
| | | Prepaid expenses | | | 12,724 | | |
| | | Other assets | | | 7,232 | | |
| | | Total Assets | | | 1,138,867,656 | | |
| Liabilities | | Payable for: | | | | | |
| | | Investments purchased | | | 10,066,874 | | |
| | | Fund shares repurchased | | | 2,381,664 | | |
| | | Investment advisory fee | | | 483,625 | | |
| | | Administration fee | | | 133,429 | | |
| | | Pricing and bookkeeping fees | | | 12,485 | | |
| | | Transfer agent fee | | | 159,282 | | |
| | | Trustees' fees | | | 72,202 | | |
| | | Custody fee | | | 5,133 | | |
| | | Distribution and service fees | | | 28,970 | | |
| | | Chief compliance officer expenses | | | 125 | | |
| | | Other liabilities | | | 86,467 | | |
| | | Total Liabilities | | | 13,430,256 | | |
| | | Net Assets | | | 1,125,437,400 | | |
| Net Assets Consist of | | Paid-in capital | | | 1,243,176,009 | | |
| | | Undistributed net investment income | | | 1,541,914 | | |
| | | Accumulated net realized loss | | | (237,563,554 | ) | |
| | | Net unrealized appreciation (depreciation) on: | | | | | |
| | | Investments | | | 118,283,596 | | |
| | | Foreign currency translations | | | (565 | ) | |
| | | Net Assets | | | 1,125,437,400 | | |
| Class A | | Net assets | | $ | 131,651,692 | | |
| | | Shares outstanding | | | 11,465,618 | | |
| | | Net asset value per share | | $ | 11.48 | (a) | |
| | | Maximum sales charge | | | 5.75 | % | |
| | | Maximum offering price per share | | $ | 12.18 | (b) | |
| Class B | | Net assets | | $ | 2,696,448 | | |
| | | Shares outstanding | | | 242,636 | | |
| | | Net asset value and offering price per share | | $ | 11.11 | (a) | |
| Class C | | Net assets | | $ | 2,448,888 | | |
| | | Shares outstanding | | | 220,401 | | |
| | | Net asset value and offering price per share | | $ | 11.11 | (a) | |
| Class Z | | Net assets | | $ | 988,640,372 | | |
| | | Shares outstanding | | | 86,372,094 | | |
| | | Net asset value, offering and redemption price per share | | $ | 11.45 | | |
(a) Redemption price per share is equal to net asset value less any applicable contingent deferred sales charge.
(b) On sales of $50,000 or more the offering price is reduced.
See Accompanying Notes to Financial Statements.
12
Statement of Operations – Columbia Large Cap Core Fund
For the Year Ended February 28, 2010
| | | | | ($) | |
| Investment Income | | Dividends | | | 20,581,257 | | |
| | | Interest | | | 5,173 | | |
| | | Foreign taxes withheld | | | (25,349 | ) | |
| | | Total Investment Income | | | 20,561,081 | | |
| Expenses | | Investment advisory fee | | | 5,991,679 | | |
| | | Administration fee | | | 1,646,222 | | |
| | | Distribution fee: | | | | | |
| | | Class B | | | 25,822 | | |
| | | Class C | | | 16,769 | | |
| | | Service fee: | | | | | |
| | | Class B | | | 8,610 | | |
| | | Class C | | | 5,586 | | |
| | | Distribution and service fees: | | | | | |
| | | Class A | | | 308,472 | | |
| | | Transfer agent fee | | | 1,586,435 | | |
| | | Pricing and bookkeeping fees | | | 144,815 | | |
| | | Trustees' fees | | | 47,384 | | |
| | | Custody fee | | | 30,378 | | |
| | | Chief compliance officer expenses | | | 906 | | |
| | | Other expenses | | | 288,049 | | |
| | | Expenses before interest expense | | | 10,101,127 | | |
| | | Interest expense | | | 784 | | |
| | | Total Expenses | | | 10,101,911 | | |
| | | Fees waived by transfer agent | | | (8,824 | ) | |
| | | Expense reductions | | | (3 | ) | |
| | | Net Expenses | | | 10,093,084 | | |
| | | Net Investment Income | | | 10,467,997 | | |
| Net Realized and Unrealized Gain (Loss) on Investments, Foreign Currency and Written Options | | Net realized gain on: | | | | | |
| | | Investments | | | 80,687,171 | | |
| | | Foreign currency transactions | | | 19,828 | | |
| | | Written options | | | 224,542 | | |
| | | Net realized gain | | | 80,931,541 | | |
| | | Net change in unrealized appreciation (depreciation) on: | | | | | |
| | | Investments | | | 280,953,320 | | |
| | | Foreign currency translations | | | 273 | | |
| | | Written options | | | (36,879 | ) | |
| | | Net change in unrealized appreciation (depreciation) | | | 280,916,714 | | |
| | | Net Gain | | | 361,848,255 | | |
| | | Net Increase Resulting from Operations | | | 372,316,252 | | |
See Accompanying Notes to Financial Statements.
13
Statement of Changes in Net Assets – Columbia Large Cap Core Fund
| Increase (Decrease) in Net Assets | | | | Year Ended
February 28,
2010 ($) | | Year Ended
February 28,
2009 ($) | |
| Operations | | Net investment income | | | 10,467,997 | | | | 16,249,352 | | |
| | | Net realized gain (loss) on investments, foreign currency
transactions and written options | | | 80,931,541 | | | | (322,388,321 | ) | |
| | | Net change in unrealized appreciation (depreciation)
on investments, foreign currency translations and
written options | | | 280,916,714 | | | | (264,474,588 | ) | |
| | | Net increase (decrease) resulting from operations | | | 372,316,252 | | | | (570,613,557 | ) | |
| Distributions to Shareholders | | From net investment income: | | | | | | | | | |
| | | Class A | | | (1,371,241 | ) | | | (1,116,833 | ) | |
| | | Class B | | | (15,727 | ) | | | (6,962 | ) | |
| | | Class C | | | (9,344 | ) | | | (2,486 | ) | |
| | | Class Z | | | (12,467,626 | ) | | | (13,375,007 | ) | |
| | | From net realized gains: | | | | | | | | | |
| | | Class A | | | — | | | | (3,135,999 | ) | |
| | | Class B | | | — | | | | (178,970 | ) | |
| | | Class C | | | — | | | | (38,993 | ) | |
| | | Class Z | | | — | | | | (23,631,658 | ) | |
| | | Total Distributions to Shareholders | | | (13,863,938 | ) | | | (41,486,908 | ) | |
| | | Net Capital Stock Transactions | | | (46,012,562 | ) | | | (48,603,594 | ) | |
| | | Increase from regulatory settlements | | | 120,276 | | | | — | | |
| | | Total increase (decrease) in net assets | | | 312,560,028 | | | | (660,704,059 | ) | |
| Net Assets | | Beginning of period | | | 812,877,372 | | | | 1,473,581,431 | | |
| | | End of period | | | 1,125,437,400 | | | | 812,877,372 | | |
| | | Undistributed net investment income at end of period | | | 1,541,914 | | | | 4,797,751 | | |
See Accompanying Notes to Financial Statements.
14
Statement of Changes in Net Assets (continued) – Columbia Large Cap
Core Fund
| | | Capital Stock Activity | |
| | | Year Ended
February 28, 2010 | | Year Ended
February 28, 2009 | |
| | | Shares | | Dollars ($) | | Shares | | Dollars ($) | |
| Class A | |
| Subscriptions | | | 1,222,912 | | | | 12,608,001 | | | | 1,289,189 | | | | 14,602,665 | | |
| Distributions reinvested | | | 122,487 | | | | 1,308,058 | | | | 336,825 | | | | 4,066,822 | | |
| Redemptions | | | (1,914,941 | ) | | | (19,942,435 | ) | | | (2,220,014 | ) | | | (25,294,199 | ) | |
| Net decrease | | | (569,542 | ) | | | (6,026,376 | ) | | | (594,000 | ) | | | (6,624,712 | ) | |
| Class B | |
| Subscriptions | | | 69,296 | | | | 609,730 | | | | 50,979 | | | | 507,280 | | |
| Distributions reinvested | | | 1,543 | | | | 14,711 | | | | 13,297 | | | | 171,564 | | |
| Redemptions | | | (256,473 | ) | | | (2,550,851 | ) | | | (637,074 | ) | | | (7,542,554 | ) | |
| Net decrease | | | (185,634 | ) | | | (1,926,410 | ) | | | (572,798 | ) | | | (6,863,710 | ) | |
| Class C | |
| Subscriptions | | | 57,843 | | | | 551,312 | | | | 87,290 | | | | 813,728 | | |
| Distributions reinvested | | | 895 | | | | 8,580 | | | | 2,756 | | | | 35,150 | | |
| Redemptions | | | (40,782 | ) | | | (409,555 | ) | | | (51,475 | ) | | | (566,462 | ) | |
| Net increase | | | 17,956 | | | | 150,337 | | | | 38,571 | | | | 282,416 | | |
| Class Z | |
| Subscriptions | | | 14,909,900 | | | | 151,975,066 | | | | 16,804,269 | | | | 180,656,299 | | |
| Distributions reinvested | | | 370,569 | | | | 3,986,667 | | | | 1,345,926 | | | | 16,804,649 | | |
| Redemptions | | | (18,769,876 | ) | | | (194,171,846 | ) | | | (22,430,533 | ) | | | (232,858,536 | ) | |
| Net decrease | | | (3,489,407 | ) | | | (38,210,113 | ) | | | (4,280,338 | ) | | | (35,397,588 | ) | |
See Accompanying Notes to Financial Statements.
15
Financial Highlights – Columbia Large Cap Core Fund
Selected data for a share outstanding throughout each period is as follows:
| | | Year Ended February 28, | | Period Ended
February 29, | | Year Ended March 31, | |
| Class A Shares | | 2010 | | 2009 | | 2008 (a)(b)(c) | | 2007 (a) | | 2006 (a)(d) | | 2005 (a) | |
| Net Asset Value, Beginning of Period | | $ | 7.95 | | | $ | 13.66 | | | $ | 14.86 | | | $ | 13.35 | | | $ | 12.00 | | | $ | 11.55 | | |
| Income from Investment Operations: | |
| Net investment income (e) | | | 0.08 | | | | 0.13 | | | | 0.11 | | | | 0.14 | | | | 0.11 | | | | 0.10 | | |
Net realized and unrealized gain (loss)
on investments, foreign currency and
written options | | | 3.57 | | | | (5.49 | ) | | | (0.41 | ) | | | 1.46 | | | | 1.35 | | | | 0.45 | (f) | |
| Total from investment operations | | | 3.65 | | | | (5.36 | ) | | | (0.30 | ) | | | 1.60 | | | | 1.46 | | | | 0.55 | | |
| Less Distributions to Shareholders: | |
| From net investment income | | | (0.12 | ) | | | (0.10 | ) | | | (0.14 | ) | | | (0.09 | ) | | | (0.11 | ) | | | (0.10 | ) | |
| From net realized gains | | | — | | | | (0.25 | ) | | | (0.76 | ) | | | — | | | | — | | | | — | | |
| Total distributions to shareholders | | | (0.12 | ) | | | (0.35 | ) | | | (0.90 | ) | | | (0.09 | ) | | | (0.11 | ) | | | (0.10 | ) | |
| Increase from regulatory settlements | | | — | (g) | | | — | | | | — | | | | — | | | | — | | | | — | | |
| Net Asset Value, End of Period | | $ | 11.48 | | | $ | 7.95 | | | $ | 13.66 | | | $ | 14.86 | | | $ | 13.35 | | | $ | 12.00 | | |
| Total return (h) | | | 45.99 | %(i) | | | (40.12 | )%(i) | | | (2.69 | )%(j) | | | 12.00 | % | | | 12.19 | %(i) | | | 4.71 | %(i)(k) | |
Ratios to Average Net Assets/
Supplemental Data: | |
| Net expenses before interest expense | | | 1.18 | %(l) | | | 1.15 | %(l) | | | 1.07 | %(l)(m) | | | 1.05 | %(l) | | | 1.03 | % | | | 1.12 | %(n) | |
| Interest expense | | | — | %(o) | | | — | %(o) | | | — | %(m)(o) | | | — | %(o) | | | — | | | | — | %(o) | |
| Net expenses | | | 1.18 | %(l) | | | 1.15 | %(l) | | | 1.07 | %(l)(m) | | | 1.05 | %(l) | | | 1.03 | % | | | 1.12 | %(n) | |
| Waiver/Reimbursement | | | — | %(o) | | | — | %(o) | | | — | | | | — | | | | 0.06 | %(p) | | | 0.03 | %(p) | |
| Net investment income | | | 0.78 | %(l) | | | 1.10 | %(l) | | | 0.81 | %(l)(m) | | | 0.98 | %(l) | | | 0.86 | % | | | 0.89 | % | |
| Portfolio turnover rate | | | 165 | % | | | 156 | % | | | — | %(j)(o)(q) | | | — | | | | — | | | | — | | |
Turnover of Columbia Large Cap Core
Master Portfolio | | | — | | | | — | | | | 98 | %(j) | | | 148 | % | | | 106 | % | | | 122 | % | |
| Net assets, end of period (000s) | | $ | 131,652 | | | $ | 95,714 | | | $ | 172,569 | | | $ | 194,203 | | | $ | 201,359 | | | $ | 213,513 | | |
(a) The per share amounts and percentages reflect income and expenses assuming inclusion of the Fund's proportionate share of the income and expenses of Columbia Large Cap Core Master Portfolio.
(b) The Fund changed its fiscal year end from March 31 to February 29. Per share data and total return reflect activity from April 1, 2007 through February 29, 2008.
(c) Effective February 28, 2008, the Fund converted to a stand-alone fund. Prior to February 28, 2008, the Fund operated in a master-feeder structure.
(d) On August 22, 2005, the Fund's Investor A shares were renamed Class A shares.
(e) Per share data was calculated using the average shares outstanding during the period.
(f) The effect of the investment advisor's reimbursement for the Fund exceeding certain investment restrictions is included in the net realized and unrealized gain (loss) on investments (per share). The effect of this reimbursement was less than $0.01.
(g) Rounds to less than $0.01 per share.
(h) Total return at net asset value assuming all distributions reinvested and no initial sales charge or contingent deferred sales charge.
(i) Had the investment advisor and/or any of its affiliates not waived fees or reimbursed a portion of expenses, total return would have been reduced.
(j) Not annualized.
(k) Without the effect of the investment advisor's reimbursement for the Fund exceeding certain investment restrictions, total return would have been 4.70%.
(l) The benefits derived from expense reductions had an impact of less than 0.01%.
(m) Annualized.
(n) The reimbursement from the investment advisor had an impact of less than 0.01%.
(o) Rounds to less than 0.01%.
(p) Bank of America Corporation assumed certain non-recurring costs. Absent these non-recurring costs, the waiver/reimbursement ratio would have been -% and 0.01% for the years ended March 31, 2006 and March 31, 2005, respectively.
(q) Amount represents results after the Fund's conversion to a stand-alone structure on February 28, 2008.
See Accompanying Notes to Financial Statements.
16
Financial Highlights – Columbia Large Cap Core Fund
Selected data for a share outstanding throughout each period is as follows:
| | | Year Ended February 28, | | Period Ended
February 29, | | Year Ended March 31, | |
| Class B Shares | | 2010 | | 2009 | | 2008 (a)(b)(c) | | 2007 (a) | | 2006 (a)(d) | | 2005 (a) | |
| Net Asset Value, Beginning of Period | | $ | 7.71 | | | $ | 13.23 | | | $ | 14.39 | | | $ | 12.95 | | | $ | 11.65 | | | $ | 11.21 | | |
| Income from Investment Operations: | |
| Net investment income (e) | | | — | (f) | | | 0.03 | | | | — | (f) | | | 0.03 | | | | 0.01 | | | | 0.02 | | |
Net realized and unrealized gain (loss)
on investments, foreign currency and
written options | | | 3.44 | | | | (5.28 | ) | | | (0.40 | ) | | | 1.41 | | | | 1.31 | | | | 0.42 | (g) | |
| Total from investment operations | | | 3.44 | | | | (5.25 | ) | | | (0.40 | ) | | | 1.44 | | | | 1.32 | | | | 0.44 | | |
| Less Distributions to Shareholders: | |
| From net investment income | | | (0.04 | ) | | | (0.02 | ) | | | — | (f) | | | — | | | | (0.02 | ) | | | — | (f) | |
| From net realized gains | | | — | | | | (0.25 | ) | | | (0.76 | ) | | | — | | | | — | | | | — | | |
| Total distributions to shareholders | | | (0.04 | ) | | | (0.27 | ) | | | (0.76 | ) | | | — | | | | (0.02 | ) | | | — | (f) | |
| Increase from regulatory settlements | | | — | (f) | | | — | | | | — | | | | — | | | | — | | | | — | | |
| Net Asset Value, End of Period | | $ | 11.11 | | | $ | 7.71 | | | $ | 13.23 | | | $ | 14.39 | | | $ | 12.95 | | | $ | 11.65 | | |
| Total return (h) | | | 44.74 | %(i) | | | (40.51 | )%(i) | | | (3.34 | )%(j) | | | 11.12 | % | | | 11.33 | %(i) | | | 3.93 | %(i)(k) | |
Ratios to Average Net Assets/
Supplemental Data: | |
| Net expenses before interest expense | | | 1.93 | %(l) | | | 1.90 | %(l) | | | 1.82 | %(l)(m) | | | 1.80 | %(l) | | | 1.78 | % | | | 1.87 | %(n) | |
| Interest expense | | | — | %(o) | | | — | %(o) | | | — | %(m)(o) | | | — | %(o) | | | — | | | | — | %(o) | |
| Net expenses | | | 1.93 | %(l) | | | 1.90 | %(l) | | | 1.82 | %(l)(m) | | | 1.80 | %(l) | | | 1.78 | % | | | 1.87 | %(n) | |
| Waiver/Reimbursement | | | — | %(o) | | | — | %(o) | | | — | | | | — | | | | 0.06 | %(p) | | | 0.03 | %(p) | |
| Net investment income | | | 0.04 | %(l) | | | 0.28 | %(l) | | | 0.03 | %(l)(m) | | | 0.21 | %(l) | | | 0.11 | % | | | 0.14 | % | |
| Portfolio turnover rate | | | 165 | % | | | 156 | % | | | — | %(j)(o)(q) | | | — | | | | — | | | | — | | |
Turnover of Columbia Large Cap Core
Master Portfolio | | | — | | | | — | | | | 98 | %(j) | | | 148 | % | | | 106 | % | | | 122 | % | |
| Net assets, end of period (000s) | | $ | 2,696 | | | $ | 3,300 | | | $ | 13,247 | | | $ | 25,523 | | | $ | 31,542 | | | $ | 37,140 | | |
(a) The per share amounts and percentages reflect income and expenses assuming inclusion of the Fund's proportionate share of the income and expenses of Columbia Large Cap Core Master Portfolio.
(b) The Fund changed its fiscal year end from March 31 to February 29. Per share data and total return reflect activity from April 1, 2007 through February 29, 2008.
(c) Effective February 28, 2008, the Fund converted to a stand-alone fund. Prior to February 28, 2008, the Fund operated in a master-feeder structure.
(d) On August 22, 2005, the Fund's Investor B shares were renamed Class B shares.
(e) Per share data was calculated using the average shares outstanding during the period.
(f) Rounds to less than $0.01 per share.
(g) The effect of the investment advisor's reimbursement for the Fund exceeding certain investment restrictions is included in the net realized and unrealized gain (loss) on investments (per share). The effect of this reimbursement was less than $0.01.
(h) Total return at net asset value assuming all distributions reinvested and no contingent deferred sales charge.
(i) Had the investment advisor and/or any of its affiliates not waived fees or reimbursed a portion of expenses, total return would have been reduced.
(j) Not annualized.
(k) Without the effect of the investment advisor's reimbursement for the Fund exceeding certain investment restrictions, total return would have been 3.92%.
(l) The benefits derived from expense reductions had an impact of less than 0.01%.
(m) Annualized.
(n) The reimbursement from the investment advisor had an impact of less than 0.01%.
(o) Rounds to less than 0.01%.
(p) Bank of America Corporation assumed certain non-recurring costs. Absent these non-recurring costs, the waiver/reimbursement ratio would have been -% and 0.01% for the years ended March 31, 2006 and March 31, 2005, respectively.
(q) Amount represents results after the Fund's conversion to a stand-alone structure on February 28, 2008.
See Accompanying Notes to Financial Statements.
17
Financial Highlights – Columbia Large Cap Core Fund
Selected data for a share outstanding throughout each period is as follows:
| | | Year Ended February 28, | | Period Ended
February 29, | | Year Ended March 31, | |
| Class C Shares | | 2010 | | 2009 | | 2008 (a)(b)(c) | | 2007 (a) | | 2006 (a)(d) | | 2005 (a) | |
| Net Asset Value, Beginning of Period | | $ | 7.70 | | | $ | 13.23 | | | $ | 14.39 | | | $ | 12.94 | | | $ | 11.64 | | | $ | 11.21 | | |
| Income from Investment Operations: | |
| Net investment income (e) | | | — | (f) | | | 0.04 | | | | 0.01 | | | | 0.03 | | | | 0.01 | | | | 0.02 | | |
Net realized and unrealized gain (loss)
on investments, foreign currency and
written options | | | 3.45 | | | | (5.30 | ) | | | (0.41 | ) | | | 1.42 | | | | 1.31 | | | | 0.42 | (g) | |
| Total from investment operations | | | 3.45 | | | | (5.26 | ) | | | (0.40 | ) | | | 1.45 | | | | 1.32 | | | | 0.44 | | |
| Less Distributions to Shareholders: | |
| From net investment income | | | (0.04 | ) | | | (0.02 | ) | | | — | (f) | | | — | | | | (0.02 | ) | | | (0.01 | ) | |
| From net realized gains | | | — | | | | (0.25 | ) | | | (0.76 | ) | | | — | | | | — | | | | — | | |
| Total distributions to shareholders | | | (0.04 | ) | | | (0.27 | ) | | | (0.76 | ) | | | — | | | | (0.02 | ) | | | (0.01 | ) | |
| Increase from regulatory settlements | | | — | (f) | | | — | | | | — | | | | — | | | | — | | | | — | | |
| Net Asset Value, End of Period | | $ | 11.11 | | | $ | 7.70 | | | $ | 13.23 | | | $ | 14.39 | | | $ | 12.94 | | | $ | 11.64 | | |
| Total return (h) | | | 44.93 | %(i) | | | (40.58 | )%(i) | | | (3.34 | )%(j) | | | 11.21 | % | | | 11.34 | %(i) | | | 3.91 | %(i)(k) | |
Ratios to Average Net Assets/
Supplemental Data: | |
| Net expenses before interest expense | | | 1.93 | %(l) | | | 1.90 | %(l) | | | 1.82 | %(l)(m) | | | 1.80 | %(l) | | | 1.78 | % | | | 1.87 | %(n) | |
| Interest expense | | | — | %(o) | | | — | %(o) | | | — | %(m)(o) | | | — | %(o) | | | — | | | | — | %(o) | |
| Net expenses | | | 1.93 | %(l) | | | 1.90 | %(l) | | | 1.82 | %(l)(m) | | | 1.80 | %(l) | | | 1.78 | % | | | 1.87 | %(n) | |
| Waiver/Reimbursement | | | — | %(o) | | | — | %(o) | | | — | | | | — | | | | 0.06 | %(p) | | | 0.03 | %(p) | |
| Net investment income | | | 0.03 | %(l) | | | 0.39 | %(l) | | | 0.04 | %(l)(m) | | | 0.21 | %(l) | | | 0.11 | % | | | 0.14 | % | |
| Portfolio turnover rate | | | 165 | % | | | 156 | % | | | — | %(j)(o)(q) | | | — | | | | — | | | | — | | |
Turnover of Columbia Large Cap Core
Master Portfolio | | | — | | | | — | | | | 98 | %(j) | | | 148 | % | | | 106 | % | | | 122 | % | |
| Net assets, end of period (000s) | | $ | 2,449 | | | $ | 1,559 | | | $ | 2,168 | | | $ | 11,413 | | | $ | 14,026 | | | $ | 14,899 | | |
(a) The per share amounts and percentages reflect income and expenses assuming inclusion of the Fund's proportionate share of the income and expenses of Columbia Large Cap Core Master Portfolio.
(b) The Fund changed its fiscal year end from March 31 to February 29. Per share data and total return reflect activity from April 1, 2007 through February 29, 2008.
(c) Effective February 28, 2008, the Fund converted to a stand-alone fund. Prior to February 28, 2008, the Fund operated in a master-feeder structure.
(d) On August 22, 2005, the Fund's Investor C shares were renamed Class C shares.
(e) Per share data was calculated using the average shares outstanding during the period.
(f) Rounds to less than $0.01 per share.
(g) The effect of the investment advisor's reimbursement for the Fund exceeding certain investment restrictions is included in the net realized and unrealized gain (loss) on investments (per share). The effect of this reimbursement was less than $0.01.
(h) Total return at net asset value assuming all distributions reinvested and no contingent deferred sales charge.
(i) Had the investment advisor and/or any of its affiliates not waived fees or reimbursed a portion of expenses, total return would have been reduced.
(j) Not annualized.
(k) Without the effect of the investment advisor's reimbursement for the Fund exceeding certain investment restrictions, total return would have been 3.92%.
(l) The benefits derived from expense reductions had an impact of less than 0.01%.
(m) Annualized.
(n) The reimbursement from the investment advisor had an impact of less than 0.01%.
(o) Rounds to less than 0.01%.
(p) Bank of America Corporation assumed certain non-recurring costs. Absent these non-recurring costs, the waiver/reimbursement ratio would have been -% and 0.01% for the years ended March 31, 2006 and March 31, 2005, respectively.
(q) Amount represents results after the Fund's conversion to a stand-alone structure on February 28, 2008.
See Accompanying Notes to Financial Statements.
18
Financial Highlights – Columbia Large Cap Core Fund
Selected data for a share outstanding throughout each period is as follows:
| | | Year Ended February 28, | | Period Ended
February 29, | | Year Ended March 31, | |
| Class Z Shares | | 2010 | | 2009 | | 2008 (a)(b)(c) | | 2007 (a) | | 2006 (a)(d) | | 2005 (a) | |
| Net Asset Value, Beginning of Period | | $ | 7.93 | | | $ | 13.66 | | | $ | 14.88 | | | $ | 13.39 | | | $ | 12.03 | | | $ | 11.58 | | |
| Income from Investment Operations: | |
| Net investment income (e) | | | 0.11 | | | | 0.16 | | | | 0.15 | | | | 0.17 | | | | 0.14 | | | | 0.13 | | |
Net realized and unrealized gain (loss)
on investments, foreign currency and
written options | | | 3.55 | | | | (5.48 | ) | | | (0.41 | ) | | | 1.47 | | | | 1.36 | | | | 0.45 | (f) | |
| Total from investment operations | | | 3.66 | | | | (5.32 | ) | | | (0.26 | ) | | | 1.64 | | | | 1.50 | | | | 0.58 | | |
| Less Distributions to Shareholders: | |
| From net investment income | | | (0.14 | ) | | | (0.16 | ) | | | (0.20 | ) | | | (0.15 | ) | | | (0.14 | ) | | | (0.13 | ) | |
| From net realized gains | | | — | | | | (0.25 | ) | | | (0.76 | ) | | | — | | | | — | | | | — | | |
| Total distributions to shareholders | | | (0.14 | ) | | | (0.41 | ) | | | (0.96 | ) | | | (0.15 | ) | | | (0.14 | ) | | | (0.13 | ) | |
| Increase from regulatory settlements | | | — | (g) | | | — | | | | — | | | | — | | | | — | | | | — | | |
| Net Asset Value, End of Period | | $ | 11.45 | | | $ | 7.93 | | | $ | 13.66 | | | $ | 14.88 | | | $ | 13.39 | | | $ | 12.03 | | |
| Total return (h) | | | 46.30 | %(i) | | | (39.95 | )%(i) | | | (2.43 | )%(j) | | | 12.28 | % | | | 12.50 | %(i) | | | 4.98 | %(i)(k) | |
Ratios to Average Net Assets/
Supplemental Data: | |
| Net expenses before interest expense | | | 0.93 | %(l) | | | 0.90 | %(l) | | | 0.82 | %(l)(m) | | | 0.80 | %(l) | | | 0.78 | % | | | 0.87 | %(n) | |
| Interest expense | | | — | %(o) | | | — | %(o) | | | — | %(m)(o) | | | — | %(o) | | | — | | | | — | | |
| Net expenses | | | 0.93 | %(l) | | | 0.90 | %(l) | | | 0.82 | %(l)(m) | | | 0.80 | %(l) | | | 0.78 | % | | | 0.87 | %(n) | |
| Waiver/Reimbursement | | | — | %(o) | | | — | %(o) | | | — | | | | — | | | | 0.06 | %(p) | | | 0.03 | %(p) | |
| Net investment income | | | 1.03 | %(l) | | | 1.35 | %(l) | | | 1.06 | %(l)(m) | | | 1.23 | %(l) | | | 1.11 | % | | | 1.14 | % | |
| Portfolio turnover rate | | | 165 | % | | | 156 | % | | | — | %(j)(o)(q) | | | — | | | | — | | | | — | | |
Turnover of Columbia Large Cap Core
Master Portfolio | | | — | | | | — | | | | 98 | %(j) | | | 148 | % | | | 106 | % | | | 122 | % | |
| Net assets, end of period (000s) | | $ | 988,640 | | | $ | 712,304 | | | $ | 1,285,598 | | | $ | 1,466,653 | | | $ | 1,347,623 | | | $ | 1,187,622 | | |
(a) The per share amounts and percentages reflect income and expenses assuming inclusion of the Fund's proportionate share of the income and expenses of Columbia Large Cap Core Master Portfolio.
(b) The Fund changed its fiscal year end from March 31 to February 29. Per share data and total return reflect activity from April 1, 2007 through February 29, 2008.
(c) Effective February 28, 2008, the Fund converted to a stand-alone fund. Prior to February 28, 2008, the Fund operated in a master-feeder structure.
(d) On August 22, 2005, the Fund's Primary A shares were renamed Class Z shares.
(e) Per share data was calculated using the average shares outstanding during the period.
(f) The effect of the investment advisor's reimbursement for the Fund exceeding certain investment restrictions is included in the net realized and unrealized gain (loss) on investments (per share). The effect of this reimbursement was less than $0.01.
(g) Rounds to less than $0.01 per share.
(h) Total return at net asset value assuming all distributions reinvested.
(i) Had the investment advisor and/or any of its affiliates not waived fees or reimbursed a portion of expenses, total return would have been reduced.
(j) Not annualized.
(k) Without the effect of the investment advisor's reimbursement for the Fund exceeding certain investment restrictions, total return would have been 4.70%.
(l) The benefits derived from expense reductions had an impact of less than 0.01%.
(m) Annualized.
(n) The reimbursement from the investment advisor had an impact of less than 0.01%.
(o) Rounds to less than 0.01%.
(p) Bank of America Corporation assumed certain non-recurring costs. Absent these non-recurring costs, the waiver/reimbursement ratio would have been -% and 0.01% for the years ended March 31, 2006 and March 31, 2005, respectively.
(q) Amount represents results after the Fund's conversion to a stand-alone structure on February 28, 2008.
See Accompanying Notes to Financial Statements.
19
Notes to Financial Statements – Columbia Large Cap Core Fund
February 28, 2010
Note 1. Organization
Columbia Large Cap Core Fund (the "Fund"), a series of Columbia Funds Series Trust (the "Trust"), is a diversified fund. The Trust is registered under the Investment Company Act of 1940, as amended (the "1940 Act"), as an open-end management investment company organized as a Delaware statutory trust.
Investment Objective
The Fund seeks long-term capital appreciation.
Fund Shares
The Trust may issue an unlimited number of shares, and the Fund offers four classes of shares: Class A, Class B, Class C and Class Z. Each share class has its own expense structure and sales charges, as applicable. Effective June 22, 2009, the Fund no longer accepts investments from new or existing investors in the Fund's Class B shares, except in connection with the reinvestment of any dividend and/or capital gain distributions in Class B shares of the Fund and exchanges by existing Class B shareholders of the other Columbia Funds.
Class A shares are subject to a maximum front-end sales charge of 5.75% based on the amount of initial investment. Class A shares purchased without an initial sales charge in accounts aggregating $1 million to $50 million at the time of purchase are subject to a 1.00% contingent deferred sales charge ("CDSC") if the shares are sold within one year after purchase. Class B shares are subject to a maximum CDSC of 5.00% based upon the holding period after purchase. Class B shares will convert to Class A shares eight years after purchase. Class C shares are subject to a 1.00% CDSC on shares sold within one year after purchase. Class Z shares are offered continuously at net asset value. There are certain restrictions on the purchase of Class Z shares, as described in the Fund's prospectus.
Note 2. Significant Accounting Policies
The preparation of financial statements in accordance with accounting principles generally accepted in the United States of America ("GAAP") requires management to make certain estimates and assumptions that affect the reported amounts of assets and liabilities, the disclosure of contingent assets and liabilities at the date of the financial statements and the reported amounts of revenue and expenses during the reporting period. Actual results could differ from those estimates.
The following is a summary of significant accounting policies consistently followed by the Fund in the preparation of its financial statements.
Security Valuation
Equity securities are valued at the last sale price on the principal exchange on which they trade, except for securities traded on the NASDAQ, which are valued at the NASDAQ official close price. Unlisted securities or listed securities for which there were no sales during the day are valued at the closing bid price on such exchanges or over-the-counter markets.
Short-term investments maturing in 60 days or less are valued at amortized cost, which approximates market value.
Written options are valued at the last reported sale price, or in the absence of a sale, at the last quoted ask price.
Foreign securities are generally valued at the last sale price on the foreign exchange or market on which they trade. If any foreign share prices are not readily available as a result of limited share activity, the securities are valued at the last sale price of the local shares in the principal market in which such securities are normally traded.
Generally, trading in foreign securities is substantially completed each day at various times prior to the close of the New York Stock Exchange ("NYSE"). The values of such securities used in computing the net asset value of the Fund's shares are determined as of such times. Foreign currency exchange rates are generally determined at 4:00 p.m. Eastern (U.S.) time. Occasionally, events affecting the values of such foreign securities and such exchange rates may occur between the times at which they are determined and the close of the customary trading session of the NYSE, which would not be reflected in the computation of the Fund's net asset value. If events materially affecting the values of such foreign securities occur and it is determined that market quotations are not reliable, then these foreign securities will be valued at their fair value using procedures approved by the Board of Trustees.
Investments for which market quotations are not readily available, or that have quotations which management believes
20
Columbia Large Cap Core Fund, February 28, 2010
are not reliable, are valued at fair value as determined in good faith under consistently applied procedures established by and under the general supervision of the Board of Trustees. If a security is valued at fair value, such value is likely to be different from the last quoted market price for the security. The determination of fair value often requires significant judgment. To determine fair value, management may use assumptions including but not limited to future cash flows and estimated risk premiums. Multiple inputs from various sources may be used to determine value.
GAAP establishes a hierarchy that prioritizes the inputs to valuation techniques used to measure fair value giving the highest priority to unadjusted quoted prices in active markets for identical securities (level 1 measurements) and the lowest priority to unobservable inputs (level 3 measurements) when market prices are not readily available or reliable. The three levels of the fair value hierarchy are described below:
• Level 1 – quoted prices in active markets for identical securities
• Level 2 – prices determined using other significant observable inputs (including quoted prices for similar securities, interest rates, prepayment speeds, credit risk and others)
• Level 3 – prices determined using significant unobservable inputs. In situations where quoted prices or observable inputs are unavailable or less reliable, unobservable inputs may be used. Unobservable inputs may include management's own assumptions about the factors market participants would use in pricing an investment.
The inputs or methodology used for valuing securities are not necessarily an indication of the risk associated with investing in those securities.
Security Transactions
Security transactions are accounted for on the trade date. Cost is determined and gains (losses) are based upon the specific identification method for both financial statement and federal income tax purposes.
Management is required to provide disclosures regarding the Fund's derivative instruments and hedging activities, by providing qualitative disclosures about the objectives and strategies for using derivatives, quantitative data about the fair value of and gains and losses on derivative contracts, and details of credit-risk-related contingent features in their derivative contracts. For additional information on derivative instruments, please see Note 6.
Repurchase Agreements
The Fund may engage in repurchase agreement transactions with institutions that Columbia Management Advisors, LLC ("Columbia"), the Fund's investment advisor, has determined are creditworthy. The Fund, through its custodian, receives delivery of the underlying securities collateralizing a repurchase agreement. Columbia is responsible for determining that the collateral is at least equal, at all times, to the value of the repurchase obligation including interest. A repurchase agreement transaction involves certain risks in the event of default or insolvency of the counterparty. These risks include possible delays in or restrictions on the Fund's ability to dispose of the underlying securities and a possible decline in the value of the underlying securities during the period while the Fund seeks to assert its rights.
Foreign Currency Transactions and Translations
The values of all assets and liabilities quoted in foreign currencies are translated into U.S. dollars at that day's exchange rates. Net realized and unrealized gains (losses) on foreign currency transactions and translations include gains (losses) arising from the fluctuation in exchange rates between trade and settlement dates on securities transactions, gains (losses) arising from the disposition of foreign currency and currency gains (losses) between the accrual and payment dates on dividends, interest income and foreign withholding taxes.
For financial statement purposes, the Fund does not distinguish that portion of gains (losses) on investments which is due to changes in foreign exchange rates from that which is due to changes in market prices of the investments. Such fluctuations are included with the net realized and unrealized gains (losses) on investments on the Statement of Operations.
Income Recognition
Interest income is recorded on the accrual basis.
21
Columbia Large Cap Core Fund, February 28, 2010
Corporate actions and dividend income are recorded on the ex-date except for certain foreign securities which are recorded as soon after the ex-date as the Fund becomes aware of such, net of any non-reclaimable tax withholdings.
Distributions received from real estate investment trusts (REITs) in excess of their income are recorded as a reduction of the cost of the related investments. If the Fund no longer owns the applicable securities, any distributions received in excess of income are recorded as realized gains.
Expenses
General expenses of the Trust are allocated to the Fund and other series of the Trust based upon relative net assets or other expense allocation methodologies determined by the nature of the expense. Expenses directly attributable to the Fund are charged to the Fund.
Determination of Class Net Asset Value
All income, expenses (other than class-specific expenses, as shown on the Statement of Operations) and realized and unrealized gains (losses) are allocated to each class of the Fund on a daily basis for purposes of determining the net asset value of each class. Income and expenses are allocated to each class based on the settled shares method, while realized and unrealized gains (losses) are allocated based on the relative net assets of each class.
Federal Income Tax Status
The Fund intends to qualify each year as a "regulated investment company" under Subchapter M of the Internal Revenue Code, as amended, and will distribute substantially all of its taxable income, if any, for its tax year, and as such will not be subject to federal income taxes. In addition, the Fund intends to distribute in each calendar year substantially all of its net investment income, capital gains and certain other amounts, if any, such that the Fund should not be subject to federal excise tax. Therefore, no provision is made for federal income or excise taxes.
Distributions to Shareholders
Distributions from net investment income, if any, are declared and paid semi-annually. The Fund may, however, declare and pay distributions from net investment income more frequently. The Fund will distribute net realized capital gains (including net short-term capital gains) at least annually after the fiscal year in which the capital gains were earned, unless offset by any available capital loss carryforward. Income distributions and capital gain distributions are determined in accordance with federal income tax regulations which may differ from GAAP.
Indemnification
In the normal course of business, the Fund enters into contracts that contain a variety of representations and warranties and which provide general indemnities. The Fund's maximum exposure under these arrangements is unknown because this would involve future claims against the Fund. Also, under the Trust's organizational documents and by contract, the Trustees and officers of the Trust are indemnified against certain liabilities that may arise out of actions relating to their duties to the Trust. However, based on experience, the Fund expects the risk of loss due to these representations, warranties and indemnities to be minimal.
Note 3. Federal Tax Information
The timing and character of income and capital gain distributions are determined in accordance with income tax regulations, which may differ from GAAP. Reclassifications are made to the Fund's capital accounts for permanent tax differences to reflect income and gains available for distribution (or available capital loss carryforwards) under income tax regulations.
For the year ended February 28, 2010, permanent book and tax basis differences resulting primarily from differing treatments for foreign currency transactions and proceeds received from litigation settlements were identified and reclassified among the components of the Fund's net assets as follows:
Undistributed
Net Investment
Income | | Accumulated
Net Realized
Loss | | Paid-In Capital | |
| $ | 140,104 | | | $ | (19,828 | ) | | $ | (120,276 | ) | |
Net investment income and net realized gains (losses), as disclosed on the Statement of Operations, and net assets were not affected by this reclassification.
22
Columbia Large Cap Core Fund, February 28, 2010
The tax character of distributions paid during the years ended February 28, 2010 and February 28, 2009 was as follows:
| | | February 28, | |
| Distributions paid from: | | 2010 | | 2009 | |
| Ordinary Income* | | $ | 13,863,938 | | | $ | 14,545,809 | | |
| Long-Term Capital Gains | | | — | | | | 26,941,099 | | |
* For tax purposes short-term capital gain distributions, if any, are considered ordinary income distributions.
As of February 28, 2010, the components of distributable earnings on a tax basis were as follows:
Undistributed
Ordinary
Income | | Undistributed
Long-Term
Capital Gains | | Net Unrealized
Appreciation* | |
| $ | 1,541,914 | | | $ | — | | | $ | 114,108,043 | | |
* The differences between book-basis and tax-basis net unrealized appreciation are primarily due to deferral of losses from wash sales.
Unrealized appreciation and depreciation at February 28, 2010, based on cost of investments for federal income tax purposes were:
| Unrealized appreciation | | $ | 134,960,227 | | |
| Unrealized depreciation | | | (20,852,184 | ) | |
| Net unrealized appreciation | | $ | 114,108,043 | | |
The following capital loss carryforwards may be available to reduce taxable income arising from future net realized gains on investments, if any, to the extent permitted by the Internal Revenue Code:
| Year of Expiration | | Capital Loss
Carryforwards | |
| | 2017 | | | $ | 112,956,820 | | |
| | 2018 | | | | 120,431,181 | | |
| | | $ | 233,388,001 | | |
Management is required to determine whether a tax position of the Fund is more likely than not to be sustained upon examination by the applicable taxing authority, including resolution of any related appeals or litigation processes, based on the technical merits of the position. The tax benefit to be recognized by the Fund is measured as the largest amount of benefit that is greater than fifty percent likely of being realized upon ultimate settlement. Management is not aware of any tax positions for which it is reasonably possible that the total amounts of unrecognized tax benefits will significantly change in the next twelve months. However, management's conclusions may be subject to review and adjustment at a later date based on factors including, but not limited to, new tax laws, regulations, and administrative interpretations (including relevant court decisions). The Fund's federal tax returns for the prior three fiscal year s remain subject to examination by the Internal Revenue Service.
Note 4. Fees and Compensation Paid to Affiliates
Investment Advisory Fee
Columbia, an indirect, wholly owned subsidiary of Bank of America Corporation ("BOA"), provides investment advisory services to the Fund. In rendering investment advisory services to the Fund, Columbia may use the portfolio management and research resources of Columbia Management Pte. Ltd, an affiliate of Columbia. Columbia receives a monthly investment advisory fee based on the Fund's average daily net assets at the following annual rates:
| Average Daily Net Assets | | Annual Fee Rate | |
| First $500 million | | | 0.60 | % | |
| $500 million to $1 billion | | | 0.55 | % | |
| $1 billion to $1.5 billion | | | 0.50 | % | |
| $1.5 billion to $3 billion | | | 0.45 | % | |
| $3 billion to $6 billion | | | 0.43 | % | |
| Over $6 billion | | | 0.41 | % | |
For the year ended February 28, 2010, the Fund's effective investment advisory fee rate was 0.57% of the Fund's average daily net assets.
Bank of America, N.A., an indirect parent company of Columbia, entered into an agreement dated September 29, 2009, to sell a portion of the asset management business of Columbia Management Group, LLC to Ameriprise Financial, Inc. ("Ameriprise Financial"). The transaction ("Transaction") includes the sale of the part of the asset management business that advises long-term mutual funds, including the
23
Columbia Large Cap Core Fund, February 28, 2010
Fund. The Transaction is subject to certain approvals and other conditions to closing, and is currently expected to close on or about May 1, 2010 (the "Closing"). In connection with the Closing, certain changes will occur, including a change in the entities serving as the investment advisor, administrator, distributor and transfer agent of the Fund. RiverSource Investments, LLC (the "New Advisor"), a subsidiary of Ameriprise Financial, will become the investment advisor of the Fund upon the Closing. The New Advisor will serve as investment advisor under a new investment management services agreement effective upon the closing. The New Advisor expects to change its name to Columbia Management Investment Advisers, LLC upon or shortly after the Closing. Effective upon the Closing, as the context requires, references to Columbia shall be deemed to refer to the New Advisor.
Administration Fee
Columbia provides administrative and other services to the Fund for a monthly administration fee at the annual rate of 0.17% of the Fund's average daily net assets, less the fees payable by the Fund as described under the Pricing and Bookkeeping Fees note below.
The New Advisor will become the administrator of the Fund under a new administrative services agreement effective upon the Closing.
Pricing and Bookkeeping Fees
The Fund has entered into a Financial Reporting Services Agreement (the "Financial Reporting Services Agreement") with State Street Bank and Trust Company ("State Street") and Columbia pursuant to which State Street provides financial reporting services to the Fund. The Fund has also entered into an Accounting Services Agreement (collectively with the Financial Reporting Services Agreement, the "State Street Agreements") with State Street and Columbia pursuant to which State Street provides accounting services to the Fund. Under the State Street Agreements, the Fund pays State Street an annual fee of $38,000 paid monthly plus an additional monthly fee based on an annualized percentage rate of average daily net assets of the Fund for the month. The aggregate fee will not exceed $140,000 per year (exclusive of out-of-pocket expenses and charges). The Fund also reimburses State Street for certain out-of-pocket expenses and charges.
Among other updates to the State Street Agreements, Columbia will assign and delegate its rights and obligations thereunder to the New Advisor upon the Closing.
The Fund has entered into a Pricing and Bookkeeping Oversight and Services Agreement (the "Services Agreement") with Columbia. Under the Services Agreement, Columbia provides services related to Fund expenses and the requirements of the Sarbanes-Oxley Act of 2002, and provides oversight of the accounting and financial reporting services provided by State Street. Under the Services Agreement, the Fund reimburses Columbia for out-of-pocket expenses and charges, including fees payable to third parties, such as for pricing the Fund's portfolio securities, incurred by Columbia in the performance of services under the Services Agreement.
The Services Agreement will be terminated upon the Closing, and the services provided thereunder will be covered under the administrative services agreement with the New Advisor.
Transfer Agent Fee
Columbia Management Services, Inc. (the "Transfer Agent"), an affiliate of Columbia and an indirect, wholly owned subsidiary of BOA, provides shareholder services to the Fund and has contracted with Boston Financial Data Services ("BFDS") to serve as sub-transfer agent. Effective January 1, 2010, the Transfer Agent is entitled to receive a fee for its services, paid monthly, at the annual rate of $22.36 per account plus reimbursement of certain sub-transfer agent fees paid by the Transfer Agent (exclusive of BFDS fees), calculated based on assets held in omnibus accounts and intended to recover the cost of payments to other parties (including affiliates of BOA) for services to those accounts. Prior to January 1, 2010, the annual rate was $17.34 per account. The Transfer Agent pays the fees of BFDS for services as sub-transfer agent and is not entitled to reimbursement for such fees from the Fund.
The Transfer Agent may also retain, as additional compensation for its services, fees for wire, telephone and redemption orders, Individual Retirement Account ("IRA") trustee agent fees and account transcript fees due to the Transfer Agent from shareholders of the Fund and credits (net of bank charges) earned with respect to balances in accounts the Transfer Agent maintains in connection with its services to the Fund. The Transfer Agent also receives reimbursement for certain out-of-pocket expenses.
24
Columbia Large Cap Core Fund, February 28, 2010
Prior to May 1, 2009, the Transfer Agent voluntarily waived a portion of its fees for accounts other than omnibus accounts, so that transfer agent fees (exclusive of out-of-pocket expenses and sub-transfer agent fees) did not exceed 0.02% annually of the Fund's average daily net assets.
An annual minimum account balance fee of $20 may apply to certain accounts with a value below the Fund's initial minimum investment requirements to reduce the impact of small accounts on transfer agent fees. These minimum account balance fees are recorded as part of expense reductions on the Statement of Operations. For the year ended February 28, 2010, no minimum account balance fees were charged by the Fund.
RiverSource Service Corporation (the "New Transfer Agent"), a subsidiary of Ameriprise Financial, will become the transfer agent of the Fund upon the Closing. The New Transfer Agent expects to change its name to Columbia Management Investment Services Corp. upon or shortly after the Closing.
Underwriting Discounts, Service and Distribution Fees
Columbia Management Distributors, Inc. (the "Distributor"), an affiliate of Columbia and an indirect, wholly owned subsidiary of BOA, is the principal underwriter of the Fund's shares. For the year ended February 28, 2010, the Distributor has retained net underwriting discounts of $6,503 on sales of the Fund's Class A shares and received net CDSC fees of $3,239 and $203 on Class B and Class C share redemptions, respectively.
RiverSource Fund Distributors, Inc. (the "New Distributor"), a subsidiary of Ameriprise Financial, will become the distributor of the Fund upon the Closing. The New Distributor expects to change its name to Columbia Management Investment Distributors, Inc. upon or shortly after the Closing.
The Trust has adopted shareholder servicing plans and distribution plans for the Class B and Class C shares of the Fund and a combined distribution and shareholder servicing plan for the Class A shares of the Fund. The shareholder servicing plans permit the Fund to compensate or reimburse servicing agents for the shareholder services they have provided. The distribution plans, adopted pursuant to Rule 12b-1 under the 1940 Act, permit the Fund to compensate or reimburse the Distributor and/or selling agents for activities or expenses primarily intended to result in the sale of the classes' shares. Payments are made at an annual rate and paid monthly, as a percentage of average daily net assets, set from time to time by the Board of Trustees, and are charged as expenses of the Fund directly to the applicable share class. A substantial portion of the expenses incurred pursuant to these plans is paid to affiliates of BOA and the Dis tributor.
The annual rates in effect and plan limits, as a percentage of average daily net assets are as follows:
| | | Current
Rate | | Plan Limit | |
Class A Combined Distribution
and Shareholder Servicing Plan | | | 0.25 | % | | | 0.25 | % | |
Class B and Class C
Shareholder Servicing Plans | | | 0.25 | % | | | 0.25 | % | |
Class B and Class C
Distribution Plans | | | 0.75 | % | | | 0.75 | % | |
Expense Limits and Fee Waivers
Effective May 1, 2009, Columbia has voluntarily agreed to reimburse a portion of the Fund's expenses so that the Fund's ordinary operating expenses (excluding any distribution and service fees, brokerage commissions, interest, taxes and extraordinary expenses, but including custodian charges relating to overdrafts, if any) after giving effect to any balance credits from the Fund's custodian, do not exceed the annual rate of 1.00% of the Fund's average daily net assets. Columbia, in its discretion, may revise or discontinue this arrangement at any time.
Fees Paid to Officers and Trustees
All officers of the Fund are employees of Columbia or its affiliates and, with the exception of the Fund's Chief Compliance Officer, receive no compensation from the Fund. The Board of Trustees has appointed a Chief Compliance Officer to the Fund in accordance with federal securities regulations. The Fund, along with other affiliated funds, pays its pro-rata share of the expenses associated with the Chief Compliance Officer. The Fund's expenses for the Chief Compliance Officer will not exceed $15,000 per year.
Trustees are compensated for their services to the Fund, as set forth on the Statement of Operations. The Trust's eligible Trustees may participate in a non-qualified deferred compensation plan which may be terminated at any time. Any
25
Columbia Large Cap Core Fund, February 28, 2010
payments to plan participants are paid solely out of the Fund's assets. Income earned on the plan participant's deferral account is based on the rate of return of the eligible mutual funds selected by the participant or, if no funds are selected, on the rate of return of Columbia Treasury Reserves, another portfolio of the Trust. The expense for the deferred compensation plan, which includes trustees' fees deferred during the current period as well as any gains or losses on the trustees' deferred compensation balances as a result of market fluctuations, is included in "Trustees' fees" on the Statement of Operations. The liability for the deferred compensation plan is included in "Trustees' fees" on the Statement of Assets and Liabilities.
Other Related Party Transactions
In connection with the purchase and sale of its securities during the period, the Fund used one or more brokers that are affiliates of BOA. Total brokerage commissions paid to affiliated brokers for the year ended February 28, 2010 was $57,020.
Note 5. Custody Credits
The Fund has an agreement with its custodian bank under which custody fees may be reduced by balance credits. These credits are recorded as part of expense reductions on the Statement of Operations. The Fund could have invested a portion of the assets utilized in connection with the expense offset arrangement in an income-producing asset if it had not entered into such an agreement. For the year ended February 28, 2010, these custody credits reduced total expenses by $3 for the Fund.
Note 6. Objectives and Strategies for Investing in Derivative Instruments
The Fund uses derivatives instruments including options in order to meet its investment objectives. The Fund employs strategies in differing combinations to permit it to increase, decrease or change the level of exposure to market risk factors. The achievement of any strategy relating to derivatives depends on an analysis of various risk factors, and if the strategies for the use of derivatives do not work as intended, the Fund may not achieve its investment objectives.
In pursuit of its investment objectives, the Fund is exposed to the following market risks:
Equity Risk: Equity risk relates to change in value of equity securities such as common stocks due to general market conditions such as real or perceived adverse economic conditions, changes in the general outlook for corporate earnings, or adverse investor sentiment. Equity securities generally have greater price volatility than fixed income securities.
The following notes provide more detailed information about the derivative type held by the Fund:
Options—The Fund had written covered call options to decrease the Fund's exposure to equity risk. A written covered call option becomes more valuable as the price of the underlying instruments depreciates relative to the strike price.
Writing put options tends to increase the Fund's exposure to the underlying instrument. When the Fund writes a call or put option, an amount equal to the premium received is recorded as a liability and subsequently marked-to-market to reflect the current value of the option written. Premiums received from writing options which expire are treated as realized gains. Premiums received from writing options which are exercised or closed are added to the proceeds or offset against the amounts paid on the underlying security transaction to determine the realized gain or loss. The Fund, as a writer of an option, has no control over whether the underlying security may be sold (call) or purchased (put) and as a result bears the market risk of an unfavorable change in the price of the security underlying the written option. There is the risk that the Fund may not be able to enter into a closing transaction because of an illiquid market. Th e Fund identifies within its portfolio of investments cash or liquid portfolio securities equal to the amount of the written options contract commitment.
The Fund may also purchase put and call options. Purchasing call options tends to increase the Fund's exposure to the underlying instrument. Purchasing put options tends to decrease the Fund's exposure to the underlying instrument. The Fund may pay a premium, which is included in the Fund's Statement of Assets and Liabilities as an investment and subsequently marked-to-market to reflect the current value of the option. The risk associated with purchasing put and call options is limited to the premium paid. Premiums paid for purchasing options which expire are treated as realized losses. Premiums paid for purchasing options which are exercised are added to the amounts paid (call) or offset against the proceeds (put) on the underlying security to determine the realized gain or loss. If the Fund enters into a closing transaction, the Fund will realize a gain or loss, depending on whether the proceeds from the closing transaction ar e greater or less than the cost of the option.
During the year ended February 28, 2010, the Fund entered into 5,635 written option contracts. The Fund did not have any open written option contracts at the end of the year.
26
Columbia Large Cap Core Fund, February 28, 2010
The effect of derivative instruments on the Fund's Statement of Operations for the year ended February 28, 2010:
| | | Amount of Realized Gain or (Loss) and Change in Unrealized
Appreciation or (Depreciation) on Derivatives Recognized in Income | |
| |
Risk Exposure | |
Net Realized Gain | | Change in
Unrealized
Appreciation
(Depreciation) | |
| Written Call Options | | Equity Risk | | $ | 224,542 | | | $ | (36,879 | ) | |
Note 7. Portfolio Information
For the year ended February 28, 2010, the cost of purchases and proceeds from sales of securities, excluding short-term obligations, for the Fund were $1,698,702,274 and $1,747,729,492, respectively.
Note 8. Regulatory Settlements
During the year ended February 28, 2010, the Fund received payments totaling $120,276 relating to certain regulatory settlements with third parties that the Fund had participated in during the year. The payments have been included in "Increase from regulatory settlements" on the Statement of Changes in Net Assets.
Note 9. Line of Credit
The Fund and other affiliated funds participate in a $280,000,000 committed, unsecured revolving line of credit provided by State Street. The maximum amount that may be borrowed by any fund is limited to the lesser of $200,000,000 and the Fund's borrowing limit set forth in the Fund's registration statement. Borrowings are available for short-term liquidity or temporary or emergency purposes.
Effective October 15, 2009, interest is charged to each participating fund based on the fund's borrowings at a rate per annum equal to the greater of the Federal Funds Rate plus 1.25% or the overnight LIBOR Rate plus 1.25%. In addition, a commitment fee of 0.15% per annum is accrued and apportioned among the participating funds pro rata based on their relative net assets.
Prior to October 15, 2009, interest was charged to each participating fund based on the fund's borrowings at a rate per annum equal to the greater of the Federal Funds Rate plus 0.50% or the overnight LIBOR Rate plus 0.50%. In addition, an annual operations agency fee of $20,000, an amendment fee of 0.02% and a commitment fee of 0.12% per annum were accrued and apportioned among the participating funds pro rata based on their relative net assets.
For the year ended February 28, 2010, the average daily loan balance outstanding on days where borrowing existed was $1,666,667 at a weighted average interest rate of 1.03%.
Note 10. Shares of Beneficial Interest
As of February 28, 2010, 62.6% of the Fund's shares outstanding were beneficially owned by three participant accounts over which BOA and/or any of its affiliates had either sole or joint investment discretion.
As of February 28, 2010, no other shareholder owned more than 5% of the outstanding shares of the Fund.
Subscription and redemption activity of this account may have a significant effect on the operations of the Fund.
Note 11. Significant Risks and Contingencies
Foreign Securities Risk
There are certain additional risks involved when investing in foreign securities. These risks may involve foreign currency exchange rate fluctuations, adverse political and economic developments and the possible prevention of currency exchange or other foreign governmental laws or restrictions. In addition, the liquidity of foreign securities may be more limited than that of domestic securities.
Legal Proceedings
Columbia Management Advisors, LLC and Columbia Management Distributors, Inc. (collectively, the "Columbia Group") are subject to a settlement agreement with the New
27
Columbia Large Cap Core Fund, February 28, 2010
York Attorney General ("NYAG") (the "NYAG Settlement") and a settlement order with the Securities and Exchange Commission ("SEC") (the "SEC Order") on matters relating to mutual fund trading, each dated February 9, 2005. Under the terms of the SEC Order, the Columbia Group (or predecessor or affiliated entities) agreed, among other things, to: pay disgorgement and civil money penalties collectively totaling $375 million; cease and desist from violations of the antifraud provisions and certain other provisions of the federal securities laws; maintain certain compliance and ethics oversight structures; and retain an independent consultant to review the Columbia Group's applicable supervisory, compliance, control and other policies and procedures. The NYAG Settlement, among other things, requires Columbia Management Advisors, LLC and its affiliates to make certain disclosures to investors relating to expenses. In connection with th e Columbia Group providing services to the Columbia Funds, the Columbia Funds have voluntarily undertaken to implement certain governance measures designed to maintain the independence of their boards of trustees and certain special consulting and compliance measures.
Pursuant to the SEC Order and related procedures, the $375 million in settlement amounts described above, of which approximately $90 million has been earmarked for certain Columbia Funds and their shareholders, is being distributed in accordance with a distribution plan developed by an independent distribution consultant and approved by the SEC on December 27, 2007. Distributions under the distribution plan began in mid-June 2008 and the distribution earmarked for the Columbia Funds and their shareholders has been substantially completed.
Civil Litigation
In connection with the events that resulted in the NYAG Settlement and SEC Order, various parties filed suits against Bank of America Corporation and certain of its affiliates, including Banc of America Capital Management, LLC ("BACAP," now known as Columbia Management Advisors, LLC) and BACAP Distributors, LLC (now known as Columbia Management Distributors, Inc.) (collectively "BAC"), Nations Funds Trust (now known as Columbia Funds Series Trust) and its Board of Trustees. On February 20, 2004, the Judicial Panel on Multidistrict Litigation transferred these cases and cases against other mutual fund companies based on similar allegations to the United States District Court in Maryland for consolidated or coordinated pretrial proceedings (the "MDL"). Subsequently, additional related cases were transferred to the MDL. On September 29, 2004, the plaintiffs in the MDL filed amended and consolidated complaints. One of these amended complaints is a putative class action that includes claims under the federal securities laws and state common law, and that names Nations Funds Trust, the Trustees, BAC and others as defendants. Another of the amended complaints is a derivative action purportedly on behalf of the Nations Funds Trust against BAC and others that asserts claims under federal securities laws and state common law. Nations Funds Trust is a nominal defendant in this action.
On February 25, 2005, BAC and other defendants filed motions to dismiss the claims in the pending cases. On December 15, 2005, BAC and others entered into a Stipulation of Settlement of the direct and derivative claims brought on behalf of the Nations Funds shareholders. The settlement is subject to court approval. If the settlement is approved, BAC would pay settlement administration costs and fees to plaintiffs' counsel as approved by the court. The stipulation has not yet been presented to the court for approval.
Note 12. Subsequent Events
In connection with the preparation of the financial statements of the Fund as of and for the fiscal year ended February 28, 2010, events and transactions through the date the financial statements were issued have been evaluated by the Fund's management for possible adjustment and/or disclosure. No subsequent events or transactions had occurred that would require adjustment of the financial statements as presented. On March 3, 2010, the Fund's shareholders approved, among other matters, a proposed investment management services agreement with the New Advisor, the effectiveness of which is conditioned on the Closing.
28
Report of Independent Registered Public Accounting Firm
To the Trustees of Columbia Funds Series Trust and the Shareholders of Columbia Large Cap Core Fund
In our opinion, the accompanying statement of assets and liabilities, including the investment portfolio, and the related statements of operations and of changes in net assets and the financial highlights present fairly, in all material respects, the financial position of Columbia Large Cap Core Fund (the "Fund") (a series of Columbia Funds Series Trust) at February 28, 2010, the results of its operations, the changes in its net assets and the financial highlights for each of the periods indicated, in conformity with accounting principles generally accepted in the United States of America. These financial statements and financial highlights (hereafter referred to as "financial statements") are the responsibility of the Fund's management. Our responsibility is to express an opinion on these financial statements based on our audits. We conducted our audits of these financial statements in accordance with the standards of the Publi c Company Accounting Oversight Board (United States). Those standards require that we plan and perform the audit to obtain reasonable assurance about whether the financial statements are free of material misstatement. An audit includes examining, on a test basis, evidence supporting the amounts and disclosures in the financial statements, assessing the accounting principles used and significant estimates made by management, and evaluating the overall financial statement presentation. We believe that our audits, which included confirmation of securities at February 28, 2010 by correspondence with the custodian and brokers, provide a reasonable basis for our opinion.
PricewaterhouseCoopers LLP
Boston, Massachusetts
April 21, 2010
29
Federal Income Tax Information (Unaudited)
For non-corporate shareholders, 100.00% or the maximum amount allowable under the Jobs and Growth Tax Relief Reconciliation Act of 2003, of the ordinary income distributed by the Fund for the fiscal year ended February 28, 2010 may represent qualified dividend income.
100.00% of the ordinary income distributed by the Fund for the fiscal year ended February 28, 2010, qualifies for the corporate dividends received deduction.
The Fund will notify shareholders in January 2011 of amounts for use in preparing 2010 income tax returns.
30
Fund Governance
The Trustees serve terms of indefinite duration. The names, addresses and ages of the Trustees and officers of the Funds of Columbia Funds Series Trust, the year each was first elected or appointed to office, their principal business occupations during at least the last five years, the number of Funds overseen by each Trustee and other directorships they hold are shown below. Each officer listed below serves as an officer of each Fund in the Columbia Funds Complex.
Independent Trustees
Name, Address and Year of Birth,
Position with Funds, Year First
Elected or Appointed to Office | | Principal Occupation(s) During Past Five Years, Number of Funds in the Columbia
Funds Complex Overseen by Trustee, Other Directorships Held
| |
| Edward J. Boudreau (Born 1944) | |
|
c/o Columbia Management
Advisors, LLC
One Financial Center
Boston, MA 02111
Trustee (since 2005) | | Managing Director—E.J. Boudreau & Associates (consulting), from 2000 through current; oversees 64; no other directorships held. | |
|
| William P. Carmichael (Born 1943) | |
|
c/o Columbia Management
Advisors, LLC
One Financial Center
Boston, MA 02111
Trustee (since 1999) | | Retired. Oversees 64; Director—Cobra Electronics Corporation (electronic equipment manufacturer); Director—The Finish Line (sportswear). | |
|
| William A. Hawkins (Born 1942) | |
|
c/o Columbia Management Advisors, LLC
One Financial Center
Boston, MA 02111
Trustee (since 2005) | | President and Chief Executive Officer—California General Bank, N.A., from January 2008 through current; oversees 64; no other directorships held. | |
|
| R. Glenn Hilliard (Born 1943) | |
|
c/o Columbia Management Advisors, LLC
One Financial Center
Boston, MA 02111
Trustee (since 2005) | | Chairman and Chief Executive Officer—Hilliard Group LLC (investing and consulting), from April 2003 through current; Non-Executive Director & Chairman—Conseco, Inc. (insurance), September 2003 through current; Executive Chairman—Conseco, Inc. (insurance), August 2004 through September 2005; oversees 64; Director—Conseco, Inc. (insurance). | |
|
| John J. Nagorniak (Born 1944) | |
|
c/o Columbia Management
Advisors, LLC
One Financial Center
Boston, MA 02111
Trustee (since 2008)` | | Retired. President and Director—Foxstone Financial, Inc. (consulting), 2000 through December 2007; Director—Mellon Financial Corporation affiliates (investing), 2000 through 2007; Chairman—Franklin Portfolio Associates (investing—Mellon affiliate), 1982 through 2007; oversees 64; Director—MIT Investment Company; Trustee—MIT 401k Plan; Trustee and Chairman—Research Foundation of CFA Institute. | |
|
31
Fund Governance (continued)
Independent Trustees (continued)
Name, Address and Year of Birth,
Position with Funds, Year First
Elected or Appointed to Office | | Principal Occupation(s) During Past Five Years, Number of Funds in the Columbia
Funds Complex Overseen by Trustee, Other Directorships Held
| |
| Minor M. Shaw (Born 1947) | |
|
c/o Columbia Management Advisors, LLC
One Financial Center
Boston, MA 02111
Trustee (since 2003) | | President—Micco Corporation and Mickel Investment Group; oversees 64; Board Member—Piedmont Natural Gas. | |
|
Interested Trustee
| Anthony M. Santomero1 (Born 1946) | |
|
c/o Columbia Management Advisors, LLC
One Financial Center
Boston, MA 02111
Trustee (since 2008) | | Richard K. Mellon Professor Emeritus of Finance, The Wharton School, University of Pennsylvania, from 1972 through current; Senior Advisor—McKinsey & Company (consulting), July 2006 through January 2008; President and Chief Executive Officer—Federal Reserve Bank of Philadelphia, July 2000 through April 2006; oversees 64; Director—Renaissance Reinsurance Ltd; Director—Penn Mutual Life Insurance Company; Director—Citigroup. | |
|
1 The Columbia Funds currently treat Mr. Santomero as an "interested person" (as defined in the 1940 Act) of the Funds because he serves as a Director of Citigroup, Inc. and Citibank, N.A. Citigroup, Inc., through its subsidiaries and affiliates, including Citibank, N.A., may engage from time-to-time in brokerage execution, principal transactions and/or lending relationships with the Columbia Funds or other funds or accounts advised/managed by the Advisor and/or any sub-advisor.
The Statement of Additional Information includes additional information about the Trustees of the Funds and is available, without charge, upon request by calling 800-345-6611.
32
Fund Governance (continued)
Officers
Name, Address and Year of Birth,
Position with Columbia Funds,
Year First Elected or
Appointed to Office | | Principal Occupation(s) During Past Five Years
| |
| J. Kevin Connaughton (Born 1964) | |
|
One Financial Center
Boston, MA 02111
President (since 2009) | | Managing Director of Columbia Management Advisors, LLC since December 2004; Senior Vice President and Chief Financial Officer—Columbia Funds, from June 2008 to January 2009; Treasurer—Columbia Funds, from October 2003 to May 2008; Treasurer—the Liberty Funds, Stein Roe Funds and Liberty All-Star Funds, December 2000—December 2006; Senior Vice President—Columbia Management Advisors, LLC, from April 2003 to December 2004; President—Columbia Funds, Liberty Funds and Stein Roe Funds, February 2004 to October 2004; Treasurer—Galaxy Funds, September 2002 to December 2005; Treasurer, December 2002 to December 2004, and President, February 2004 to December 2004—Columbia Management Multi-Strategy Hedge Fund, LLC; and a senior officer of various other Bank of America-affiliated entities, including other registered and unregistered funds | |
|
| James R. Bordewick, Jr. (Born 1959) | |
|
One Financial Center
Boston, MA 02111
Senior Vice President, Secretary and Chief Legal Officer (since 2006) | | Associate General Counsel, Bank of America since April 2005; Senior Vice President and Associate General Counsel, MFS Investment Management (investment management) prior to April 2005. | |
|
| Linda J. Wondrack (Born 1964) | |
|
One Financial Center
Boston, MA 02111
Senior Vice President and
Chief Compliance Officer (since 2007) | | Director (Columbia Management Group LLC and Investment Product Group Compliance), Bank of America since June 2005; Director of Corporate Compliance and Conflicts Officer, MFS Investment Management (investment management), August 2004 to May 2005; Managing Director, Deutsche Asset Management (investment management) prior to August 2004. | |
|
| Michael G. Clarke (Born 1969) | |
|
One Financial Center
Boston, MA 02111
Senior Vice President and
Chief Financial Officer (since 2009) | | Director of Fund Administration of the Advisor since January 2006; Managing Director of the Advisor September 2004 to December 2005; Vice President Fund Administration June 2002 to September 2004. | |
|
| Jeffrey R. Coleman (Born 1969) | |
|
One Financial Center
Boston, MA 02111
Treasurer (since 2008) | | Director of Fund Administration of the Advisor since January 2006; Fund Controller of the Advisor from October 2004 to January 2006; Vice President of CDC IXIS Asset Management Services, Inc. (investment management) from August 2000 to September 2004. | |
|
| Joseph F. DiMaria (Born 1968) | |
|
One Financial Center
Boston, MA 02111
Chief Accounting Officer (since 2008) | | Director of Fund Administration of the Advisor since January 2006; Head of Tax/Compliance and Assistant Treasurer of the Advisor from November 2004 to December 2005; Director of Trustee Administration (Sarbanes-Oxley) of the Advisor from May 2003 to October 2004. | |
|
33
Fund Governance (continued)
Officers (continued)
Name, Address and Year of Birth,
Position with Columbia Funds,
Year First Elected or
Appointed to Office | | Principal Occupation(s) During Past Five Years
| |
| Julian Quero (Born 1967) | |
|
One Financial Center
Boston, MA 02111
Deputy Treasurer (since 2008) | | Senior Tax Manager of the Advisor since August 2006; Senior Compliance Manager of the Advisor from April 2002 to August 2006. | |
|
| Barry S. Vallan (Born 1969) | |
|
One Financial Center
Boston, MA 02111
Controller (since 2006) | | Vice President—Fund Treasury of the Advisor since October 2004; Vice President—Trustee Reporting of the Advisor from April 2002 to October 2004. | |
|
| Stephen T. Welsh (Born 1957) | |
|
One Financial Center
Boston, MA 02111
Vice President (since 1996) | | President, Columbia Management Services, Inc. since July 2004; Senior Vice President and Controller, Columbia Management Services, Inc. prior to July 2004. | |
|
34
Board Consideration and Re-Approval of Current Investment Advisory and Sub-Advisory Agreements
Even though the following description of the Board's consideration of investment advisory and, as applicable, sub-advisory agreements covers multiple funds, for purposes of this shareholder report, the description is only relevant as to the Fund.
The Board of Trustees of Columbia Funds Series Trust (the "Board"), including a majority of the Trustees who have no direct or indirect interest in the investment advisory and sub-advisory agreements and are not "interested persons" of the Trust, as defined in the Investment Company Act of 1940 (the "1940 Act") (the "Independent Trustees"), are required annually to review and re-approve the existing investment advisory and sub-advisory agreements and approve any newly proposed terms therein. In this regard, the Board reviewed and re-approved, during the most recent six months covered by this report, (i) investment advisory agreements with Columbia Management Advisors, LLC ("CMA" or the "Adviser") for Columbia Convertible Securities Fund, Columbia Large Cap Value Fund, Columbia Mid Cap Value Fund, Columbia Small Cap Value Fund II, Columbia Marsico Growth Fund, Columbia Large Cap Core Fund, Columbia Marsico Focused Equities Fund, Columbia Marsico 21st Century Fund and Columbia Small Cap Growth Fund II; and (ii) investment sub-advisory agreements with Marsico Capital Management, LLC ("Marsico Capital" or the "Sub-Adviser") for Columbia Marsico Focused Equities Fund, Columbia Marsico 21st Century Fund and Columbia Marsico Growth Fund (the "Sub-Advised Funds"). The investment advisory agreements with CMA and the investment sub-advisory agreements with Marsico Capital are each referred to as an "Advisory Agreement" and collectively referred to as the "Advisory Agreements." The funds identified above are each referred to as a "Fund" and collectively referred to as the "Funds."
More specifically, at meetings held on November 5-6, 2009, the Board, including the Independent Trustees advised by their independent legal counsel, considered the factors and reached the conclusions described below relating to the selection of CMA and the Sub-Adviser and the re-approval of the Advisory Agreements. The Board also reviewed and considered a report prepared and provided by the Independent Fee Consultant (the "Fee Consultant") appointed by the Independent Trustees pursuant to an assurance of discontinuance entered into with the New York Attorney General ("NYAG") to settle a civil complaint filed by the NYAG relating to trading in mutual fund shares (the "NYAG Settlement"). The Fee Consultant's role was to manage the process by which management fees are negotiated so that they were negotiated in a manner that is at arms' length and reasonable. Th e Fee Consultant found that the fee negotiation process was, to the extent practicable, at arms' length and reasonable and consistent with the requirements of the NYAG Settlement. A summary of the Fee Consultant's report is available at http://www.columbiafunds.com.
In preparation for the November meetings, the Board met in August for review and discussion of the materials described below. The Investment Committee of the Board also met in June to discuss each Fund's performance with its respective portfolio manager(s). In addition to these meetings, the Investment Committee receives and discusses performance reports at its quarterly meetings. The Contracts Review Committee of the Board also provided support in managing and coordinating the process by which the Board reviewed the Advisory Agreements. The Board's review and conclusions are based on the comprehensive consideration of all information presented to it and are not the result of any single controlling factor. The Board evaluated all information available to it on a Fund-by-Fund basis, and its determinations were made separately in respect of each Fund.
Nature, Extent and Quality of Services
The Board received and considered various data and information regarding the nature, extent and quality of services provided to the Funds by CMA and the Sub-Adviser under the Advisory Agreements. The most recent investment adviser registration forms for CMA and the Sub-Adviser were made available to the Board, as were CMA's and the Sub-Adviser's responses to a detailed series of requests submitted by the Independent Trustees' independent legal counsel on behalf of such Trustees. The Board reviewed and analyzed those materials, which included, among other things, information about the background and experience of senior
35
management and investment personnel of CMA and the Sub-Adviser.
In addition, the Board considered the investment and legal compliance programs of the Funds, CMA and the Sub-Adviser, including their compliance policies and procedures and reports of the Funds' Chief Compliance Officer.
The Board evaluated the ability of CMA and the Sub-Adviser, based on their resources, reputation and other attributes, to attract and retain qualified investment professionals, including research, advisory and supervisory personnel. In this regard, the Board considered information regarding the nature of CMA's compensation structure applicable to portfolio managers and other key investment personnel.
Based on the above factors, together with those referenced below, the Board concluded that it was satisfied with the nature, extent and quality of the investment advisory services provided to each of the Funds by CMA and the Sub-Adviser.
The Board noted that Bank of America, N.A., the parent company of the Adviser, had entered into an agreement to sell a portion of the asset management business of the Adviser to Ameriprise Financial, Inc. (the "Transaction"). The Board noted that the Transaction was expected to close in the spring of 2010 and that its review of the Advisory Agreements was separate and distinct from any analysis regarding new advisory or sub-advisory arrangements that may result from the closing of the Transaction.
Investment Advisory and Sub-Advisory Fee Rates and Other Expenses
The Board reviewed and considered the proposed contractual investment advisory fee rates both separately and together with the administration fee rates payable by the Funds to CMA for investment advisory services (the "Contractual Management Rates"). The Board also reviewed and considered the proposed contractual investment sub-advisory fee rates (the "Sub-Advisory Agreement Rates") payable by CMA to the Sub-Adviser for investment sub-advisory services. In addition, the Board reviewed and considered the proposed fee waiver/cap arrangements applicable to the Contractual Management Rates and considered the Contractual Management Rates after taking the waivers/caps into account (the "Actual Management Rates"). The Board noted that, on a complex-wide basis, CMA had reduced annual management fees by at least $32 million per year pursuant to the NYAG Settlement. T he Board also noted reductions in net advisory rates and/or total expenses of certain funds across the fund complex. Additionally, the Board received and afforded specific attention to information comparing the Contractual Management Rates and Actual Management Rates with those of the other funds in their respective Peer Groups (as defined below).
The Board reviewed and considered statistical information regarding each Fund's total expense ratio and its various components, including contractual advisory fees, actual advisory fees, actual non-management fees, Rule 12b-1 and non-Rule 12b-1 service fees, fee waivers/caps and/or expense reimbursements. The Board also reviewed comparisons of these fees to the expense information for the group of Funds determined by Lipper Inc. ("Lipper") to be most similar to a given Fund (the "Peer Group") and to the performance of a broader universe of relevant funds as determined by Lipper (the "Universe"), which comparative data was provided by Lipper, an independent provider of investment company data. The Board was provided with a description of the methodology used by Lipper to select the mutual funds in each Fund's Peer Group and Universe and considered potential imprecision resulting from the selection methodology. For certain Funds, Lipper determined that the composition of the Peer Group and/or Universe for expenses would differ from the composition for performance to provide a more accurate basis of comparison. The Board also considered Lipper data that ranked each Fund based on: (i) each Fund's one- and three-year performance compared to actual management fees; and (ii) each Fund's one- and three-year performance compared to total expenses.
The Board concluded that the factors noted above supported the Contractual Management Rates and the Actual Management Rates, and the approval of the Advisory Agreements for all of the Funds.
With regard to the Sub-Advised Funds, the Board also reviewed the Sub-Advisory Agreement Rates, including comparative fee information provided by the Adviser and the Adviser's recommendation that the Board re-approve the Advisory Agreements with Marsico Capital. The Board also considered a breakpoint fee schedule charged by Marsico Capital for the Sub-Advised Funds, as well as a corresponding waiver of Contractual Management Rates, both of which were
36
implemented on January 1, 2008. The Board concluded that the Sub-Advisory Agreement Rates are fair and equitable, based on its consideration of the factors described above.
The Fund-by-Fund discussion set forth below in "Fund-Specific Considerations for Certain Review Funds" provides additional information regarding those Funds highlighted as meeting agreed-upon criteria for warranting further review. Such criteria included, among other things, information relating to Actual Management Rates, total expense ratios and/or performance information, relative to a Fund's Peer Group and/or Universe.
Fund Performance
The Board considered the performance results for each of the Funds over multiple measurement periods. It also considered these results in comparison to the performance results of each Fund's Peer Group and Universe, as well as to each Fund's benchmark index. The Board also considered certain risk-adjusted performance data.
The Fund-by-Fund discussion set forth below in "Fund-Specific Considerations for Certain Review Funds" provides additional information regarding those Funds highlighted as meeting agreed-upon criteria for warranting further review. Such criteria included, among other things, information relating to Actual Management Rates, total expense ratios and/or performance information, relative to a Fund's Peer Group and/or Universe.
Profitability
The Board received and considered a detailed profitability analysis of CMA based on the Contractual Management Rates and the Actual Management Rates, as well as on other relationships between the Funds and other funds in the complex on the one hand and CMA affiliates on the other. The analysis included complex-wide and per-Fund information and a comparison of results using alternative allocation methodologies. The Board concluded that, in light of the costs of providing investment management and other services, the profits and other ancillary benefits that CMA and its affiliates received from providing these services were not unreasonable.
Economies of Scale
The Board received and considered information regarding whether there have been economies of scale with respect to the management of the Funds, whether the Funds have appropriately benefited from any economies of scale and whether there is potential for realization of any further economies of scale. Most particularly, CMA provided information showing that, as a percentage of fund assets, CMA's complex-wide revenues declined over a five-year period during which fund assets increased by 53% and the shareholder benefit over a four-year period has remained steady at approximately 33% of the Adviser's total profits. The Board concluded that any potential economies of scale are shared fairly with Fund shareholders, most particularly through breakpoints and fee waiver arrangements.
The Board acknowledged the inherent limitations of any analysis of an investment adviser's economies of scale, stemming largely from the Board's understanding that economies of scale are generally realized, if at all, by an investment adviser across a variety of products and services, not just with respect to a single fund.
Information About Services to Other Clients
The Board also received and considered information about the nature and extent of services and fee rates offered by CMA and the Sub-Adviser to their other clients, including separate accounts and institutional investors. In this regard, the Board concluded that, where the Contractual Management Rates, Sub-Advisory Agreement Rates and Actual Management Rates were appreciably above the range of the fee rates offered to other CMA and Sub-Adviser clients, based on information provided by CMA and the Sub-Adviser, the costs associated with managing and operating a registered investment company provided a justification for the higher fee rates charged to the Funds.
Other Benefits to CMA and the Sub-Adviser
The Board received and considered information regarding any "fall-out" or ancillary benefits received by CMA and its affiliates and the Sub-Adviser as a result of their relationship with the Funds. Such benefits could include, among others, benefits attributable to CMA's and the Sub-Adviser's relationships with the Funds (such as soft-dollar credits) and benefits potentially derived from an increase in CMA's and the Sub-Adviser's business as a result of their relationship with the Funds (such as the ability to market to shareholders other financial products offered by CMA and its affiliates or a Sub-Adviser).
37
The Board considered the effectiveness of the policies of the Funds in achieving the best execution of portfolio transactions, whether and to what extent soft dollar credits are sought and how any such credits are utilized, any benefits that may be realized by using an affiliated broker, the extent to which efforts are made to recapture transaction costs, and the controls applicable to brokerage allocation procedures. The Board also reviewed CMA's and the Sub-Adviser's methods for allocating portfolio investment opportunities among the Funds and other clients. The Board concluded that the benefits were not unreasonable.
Other Factors and Broader Review
As discussed above, the Board reviews materials received from CMA and the Sub-Adviser annually as part of the re-approval process under Section 15(c) of the 1940 Act. The Board also reviews and assesses the quality of the services the Funds receives throughout the year. In this regard, the Board and its Committees review reports of CMA and the Sub-Adviser at each of its quarterly meetings, which include, among other things, Fund performance reports and presentations relating to such reports. In addition, the Board and its Committees confer with portfolio managers at various times throughout the year including, most particularly, at the June Investment Committee meeting.
Fund-Specific Considerations for Certain "Review" Funds
For certain Funds highlighted as meeting agreed-upon criteria for warranting further review, the Board engaged in further analysis with regard to approval of the Funds' Advisory Agreements. Such criteria included, among other things, information relating to Actual Management Rates, total expense ratios, and/or performance information relative to a Fund's Peer Group and/or Universe. Columbia Large Cap Core Fund was not highlighted as a review fund.
Conclusion
After an evaluation of the above-described factors, and based on its deliberations and analysis of the information provided and alternatives considered, the Board, including all of the Independent Trustees, concluded that the compensation payable to CMA and the Sub-Adviser under the Advisory Agreements is fair and equitable. Accordingly, the Board unanimously re-approved the Advisory Agreements.
38
Board Consideration and Approval of Proposed Investment Advisory Agreement
Even though the following description of the Board's consideration of investment advisory and, as applicable, sub-advisory agreements covers multiple funds and trusts, for purposes of this shareholder report, the description is only relevant as to the Fund.
At a meeting held on December 21, 2009, the Boards of Trustees (the "Boards") of Columbia Funds Series Trust, Columbia Funds Master Investment Trust, LLC and Columbia Funds Series Trust II (each a "Trust" and collectively the "Trusts") unanimously approved a new investment management services agreement with RiverSource Investments, LLC ("RiverSource") (the "Proposed Advisory Agreement") and new subadvisory agreements with Marsico Capital Management ("Marsico Capital"), MacKay Shields LLC ("Mackay Shields") and Brandes Investment Partners, L.P. ("Brandes") (each a "Proposed Subadvisory Agreement"), as applicable, for each Fund of the Trusts (each a "Fund" and collectively the "Funds"). As detailed below, the Trustees met on multiple occasions in advance of the December 21, 2009 meeting, held numerous discussions with the management teams of Columbia Management Advisors, LLC ("Columbia") and RiverSource, a subsidiary of Ameriprise Financial, Inc. ("Ameriprise") and reviewed and considered extensive materials in connection with the approval of the Proposed Advisory and Subadvisory Agreements.
Specifically, the Trustees of each Trust, including a majority of the Trustees who have no direct or indirect interest in the Proposed Advisory and Subadvisory Agreements and are not "interested persons" of the Trusts, as defined in the Investment Company Act of 1940, as amended (the "1940 Act") (the "Independent Trustees") reviewed and approved (i) the Proposed Advisory Agreement with RiverSource for each Fund and (ii) the Proposed Subadvisory Agreement for those Funds that currently have investment subadvisory agreements with Marsico Capital, Mackay Shields, and Brandes (the "Subadvised Funds") (Marsico Capital, MacKay Shields and Brandes are collectively referred to as the "Subadvisers"). Prior to approving the Proposed Advisory Agreements, the Trustees were presented with, and requested, received and evaluated, extensive materials about RiverSource, the sale of a portion of the asset management business of Columbia Managemen t Group, LLC to Ameriprise (the "Transaction") and related matters from RiverSource, Ameriprise and Columbia. In this regard, the Trustees reviewed RiverSource's responses to a series of detailed requests submitted by the Independent Trustees' independent legal counsel and by the Independent Fee Consultant (as defined below).
The Trustees also reviewed and considered information received in connection with their most recent consideration and reapproval in November 2009 of the current advisory agreement (the "Current Advisory Agreement") and current subadvisory agreement (the "Current Subadvisory Agreement"), as applicable, for each Fund, including information about the Subadvisers (the "Current Agreement Re-Approval Process"). Moreover, the Trustees and committees of the Boards met on several occasions, and received extensive materials, throughout the course of the year relating to the Current Agreement Re-Approval Process, which the Trustees considered relevant to their consideration and approval of the Proposed Advisory and Subadvisory Agreements. The Trustees also consulted with Fund counsel and with the Independent Trustees' independent legal counsel, who advised on the legal standards for consideration by the Trustees, and otherwise assisted the Trustees in their deliberations.
In advance of the meeting on December 21, 2009, the Trustees held several meetings, including meetings held in-person with representatives from RiverSource and Ameriprise on August 26, 2009, November 5-6, 2009, December 9-10, 2009 and December 14, 2009, and additional meetings with representatives of Columbia, to discuss the Transaction, RiverSource's plans and intentions regarding the Funds and various proposals that were being presented as a result of the Transaction, including the Proposed Advisory and Subadvisory Agreements. In addition to these meetings, telephonic meetings and discussions were held on several occasions between individual Trustees, members of the committees of the Boards, their independent legal counsel and representatives from RiverSource, Ameriprise and/or Columbia.
The Trustees also reviewed and considered a report prepared and provided by the Fee Consultant (the "Fee Consultant") appointed by the Independent Trustees pursuant to an assurance of discontinuance entered into by a predecessor to Columbia with the New York Attorney General ("NYAG") to settle a civil complaint filed by the NYAG relating to trading in mutual fund shares (the "NYAG Settlement"). The Fee Consultant's role was to manage the process by which management fees are negotiated so that they were negotiated
39
in a manner that is at arms' length and reasonable. The Fee Consultant found that the fee negotiation process was, to the extent practicable, at arms' length and reasonable and consistent with the requirements of the NYAG Settlement. A summary of the Fee Consultant's report is available at www.columbiafunds.com.
The following summarizes a number of the material factors considered by the Trustees in reaching their approvals and determinations with respect to the Proposed Advisory Agreements and Proposed Subadvisory Agreements. It is followed by a more detailed discussion of the Trustees' consideration of these and other factors considered relevant by the Trustees in their evaluation of the Proposed Advisory Agreements and Proposed Subadvisory Agreements. In voting to approve the Proposed Advisory and Subadvisory Agreements for each Fund, the Trustees also considered substantially the same factors, as relevant, and reached substantially the same conclusions in their approval of interim advisory and subadvisory agreements for each Fund.
(i) the terms and conditions of the Proposed Advisory Agreements compared to the terms and conditions of the Current Advisory Agreements, as described below;
(ii) the fact that each Fund's total advisory fees would remain the same;
(iii) the qualifications of the personnel of RiverSource, Ameriprise and the Subadvisers expected to provide advisory and administrative services to each Fund, including representations by Ameriprise regarding its retention of the same process for monitoring and evaluating portfolio management personnel for each Fund as currently used by Columbia;
(iv) the terms and conditions of the Proposed Subadvisory Agreements compared to the terms and conditions of the Current Subadvisory Agreements;
(v) the reputation, financial strength, regulatory and compliance histories and resources of RiverSource and Ameriprise, and the potential benefits to the Funds of the combination of RiverSource and Columbia, including that the Funds are expected to continue to have access to existing distribution channels and have the potential for expanded distribution of Fund shares, the expected depth and breadth of investment management capabilities, that there is not expected to be any diminution in the nature, quality and extent of services to be provided to the Funds under the Proposed Advisory Agreements and the potential for the realization of additional economies of scale over time and the potential of the Funds to share in, and benefit from, these economies, if any;
(vi) that Ameriprise has committed to refrain from imposing or seeking to impose, for a period of not less than two years after the closing of the Transaction (the "Closing"), any "unfair burden" (within the meaning of Section 15(f) of the 1940 Act) on any Fund;
(vii) the terms and conditions of certain other agreements and arrangements relating to the future operations of the Funds and their distribution channels, including the administrative services agreement and the new services and distribution agreement;
(viii) that the Trustees recently had completed the Current Agreement Re-Approval Process for each Fund and had determined that they were satisfied with the nature, extent and quality of services provided thereunder and that the management fee rates and (where applicable) subadvisory fee rates for each Fund were satisfactory;
(ix) that RiverSource was willing to commit to maintain net operating expense ratios at current levels for at least the period currently covered by Columbia's existing commitments;
(x) the capabilities of RiverSource and the Subadvisers with respect to compliance, including an assessment of RiverSource's compliance program by the Funds' Chief Compliance Officer;
(xi) that certain members of RiverSource's management and certain Columbia personnel that will be integrated into RiverSource and its affiliates as a result of the Transaction have substantial experience in integrating fund families; and
(xii) that Ameriprise and Bank of America Corporation would bear the costs of obtaining approvals of the Proposed Advisory and Subadvisory Agreements.
In their deliberations, the Trustees did not identify any single item that was paramount or controlling and individual
40
Trustees may have attributed different weights to various factors. The Trustees also evaluated all information available to them on a Fund-by-Fund basis, and their determinations were made separately in respect of each Fund.
Nature, Extent and Quality of Services to be Provided
The Trustees received and considered various data and information regarding the expected nature, extent and quality of services to be provided to the Funds by RiverSource and the Subadvisers under the Proposed Advisory and Subadvisory Agreements. The most recent investment adviser registration forms for RiverSource and each Subadviser were made available to the Boards, as well as extensive materials from RiverSource, Ameriprise and Columbia. The Trustees reviewed and analyzed these materials, which included, among other things, information about the background and experience of expected senior management of RiverSource and Ameriprise after the Closing. The Trustees considered RiverSource's ability to provide administrative services to the Funds, noting that while the aggregate scope of advisory and administrative services was not expected to change following the Closing, the allocation of services was expected to shift, to a lim ited extent, such that administrative services will be provided under a new administrative services agreement. The Trustees considered, among other things, the capacity and quality of RiverSource's and the Subadvisers' investment management, research and trade execution capabilities and other resources that would be dedicated to performing services for the Funds. The Trustees also considered matters related to RiverSource's and the Subadvisers' compliance programs and compliance records, including RiverSource's portfolio transaction policies and procedures. The Trustees discussed with senior management personnel their ability to administer and oversee outside service providers to the Funds and their shareholders and were satisfied with management's processes for providing services and overseeing and reviewing services to be rendered by outside sources.
In evaluating the services to be provided under the Proposed Advisory and Subadvisory Agreements, the Trustees factored in their extensive discussions with representatives of Columbia, RiverSource and Ameriprise at the meetings referenced above regarding the management of each Fund. The Trustees considered representations by Ameriprise that it was expected that there will be no diminution in the nature and quality of services provided to the Funds. The Trustees noted that Columbia Management Group's current President, Columbia's current Chief Investment Officer and Columbia's current President, were expected to continue to serve the Funds in similar capacities after the Closing. With respect to portfolio management, the Trustees reviewed information regarding the deliberative process for selecting portfolio management personnel to continue servicing the Fund s after the Closing, including the expected role of Columbia's Chief Investment Officer in evaluating and selecting portfolio management personnel for each Fund utilizing Columbia's current analytical model for evaluating portfolio managers. In this regard, the Trustees also weighed representations by Ameriprise that this investment management evaluative process was likely to result in a significant number of Columbia investment professionals and personnel currently responsible for management of the Funds to remain in place. The Trustees noted that the portfolio management evaluation and selection process was designed to optimize the portfolio management resources available to each Fund by having the ability to select investment personnel for the Funds from the combined organization. Similarly, the Trustees evaluated the ability of RiverSource and the Subadvisers, based on their respective resources, reputations and other attributes, to attract and retain qualified investment professionals. In this regard, t he Trustees considered information regarding the nature of the compensation structure applicable to portfolio managers and other key investment personnel.
The Trustees reviewed and considered information from Ameriprise and RiverSource regarding various contemplated service provider arrangements, including information regarding both immediate and potential future plans in respect of these arrangements. In this regard, the Trustees considered information regarding potential distribution, transfer agency and custody arrangements and the evaluation of fund accounting, financial reporting and valuation service model options, noting certain differences between Columbia's and RiverSource's current approaches, including that RiverSource has historically utilized services provided "in-house" or by its affiliates for fund accounting, financial reporting and valuation. The Trustees reviewed information from Ameriprise and RiverSource regarding the expectation for rationalized or harmonized fees as part of the integration after the Closing in order to develop consistent service fee schedules across the combined fund family. The Trustees noted Ameriprise's representations that, to the extent any
41
such proposals were recommended to the Board after the Closing, they would not result in an "unfair burden" (within the meaning of Section 15(f) of the 1940 Act) on any Fund.
In addition, the Trustees reviewed and evaluated materials and information received regarding the investment and legal compliance programs of the Funds, RiverSource and the Subadvisors, including their compliance policies and procedures and reports of the Funds' Chief Compliance Officer. In this regard, the Trustees considered that Columbia's current Chief Compliance Officer was expected to serve in the same role after the Closing.
The Trustees also noted that Ameriprise and certain of its affiliates have been involved in a number of legal, arbitration and regulatory proceedings, including routine litigation, class actions, and governmental actions, concerning matters arising in connection with the ordinary conduct of their business activities, and that Ameriprise indicated that neither Ameriprise nor any of its affiliates are the subject of any pending legal, arbitration or regulatory proceedings that are likely to have a material adverse effect on the Funds or the ability of Ameriprise or its affiliates, including RiverSource to provide services to the Funds.
Based on the foregoing and other information considered relevant, the Trustees concluded that, overall, they were satisfied with assurances from Columbia, RiverSource, Ameriprise and the Subadvisers as to the expected nature, extent and quality of services to be provided to each Fund under the Proposed Advisory and Subadvisory Agreements.
Investment Advisory and Subadvisory Fee Rates and Other Expenses
The Trustees reviewed and considered the proposed contractual investment advisory fee rates to be paid by each Fund to RiverSource for investment management services both separately and together with the administration fee rates to be paid by the Funds to RiverSource (the "Contractual Management Rates"), which are the same as the separate and aggregate advisory and administrative fee rates currently paid by each Fund to Columbia. The Trustees also reviewed and considered the proposed subadvisory fee rates and the fee arrangements under the Proposed Subadvisory Agreements, respectively, which are also the same as those currently in effect under the Current Subadvisory Agreements. In addition to the materials provided by Columbia, RiverSource provided information regarding the current fees for each of the RiverSource funds and other relevant institutional acco unts. The Trustees reviewed and considered the proposed fee waiver/cap arrangements applicable to the Contractual Management Rates and considered the Contractual Management Rates after taking the waivers/caps into account (the "Actual Management Rates"). In this regard, the Trustees noted that RiverSource had committed to maintain the Funds' current expense limitation and waiver arrangements (both contractual and voluntary). The Trustees considered the potential that, after the Closing, RiverSource would propose a common fee and expense structure for the combined fund family, subject to the commitment that Ameriprise will not seek any change that would result in an "unfair burden" on any Fund. The Trustees also considered the report prepared and provided by the Fee Consultant. Additionally, the Trustees received and afforded specific attention to information provided in connection with the Current Agreement Re-Approval Process, comparing the Contractual Management Rates and Actual Management Rates with those of other funds in each Fund's Peer Group (as defined below).
During the Current Agreement Re-Approval Process, the Trustees reviewed and considered statistical information regarding each Fund's total expense ratio and its various components, including contractual advisory fees, actual advisory fees, actual nonmanagement fees, Rule 12b-1 and non-Rule 12b-1 service fees, fee waivers/caps and/or expense reimbursements. The Trustees also reviewed comparisons of these fees to the expense information for the group of Funds that was determined by Lipper Inc. ("Lipper") to be the most similar to a given Fund (the "Peer Group") and to the performance of a broader universe of relevant funds as determined by Lipper (the "Universe"), which comparative data was provided by Lipper, an independent provider of investment company data.
The Trustees were provided with a description of the methodology used by Lipper to select the mutual funds in each Fund's Peer Group and Universe and reviewed the degree of comparability resulting from the selection methodology. For certain Funds, Lipper determined that changing the composition of the Peer Group and/or Universe for expenses from that used for performance would provide a more accurate basis of comparison. The Trustees also considered Lipper data that ranked each Fund based on: (i) each Fund's one- and
42
three-year performance compared to actual management fees; and (ii) each Fund's one- and three-year performance compared to total expenses.
For each Fund, except as otherwise described in the Fund-specific discussion below, the Trustees noted that they had concluded during the Current Agreement Re-Approval Process that the Contractual Management Rates, the Actual Management Rates and the total expense ratio were at acceptable levels in light of the quality of services provided to the Fund and in comparison to such Fund's Peer Group and Universe, as applicable; that the advisory fee rate would not be increased for any Fund; that Ameriprise and RiverSource had represented that the overall expenses for each Fund were not expected to be adversely affected by the Transaction; and that RiverSource had committed to maintain the Funds' current expense limitation or waiver arrangements (both contractual and voluntary).
Based on the foregoing, other relevant information received and the additional information described in the Fund-specific discussion below, as applicable, the Trustees concluded that the Contractual Management Rates, the Actual Management Rates and the total expense ratio were acceptable.
Fund Performance
The Trustees reviewed detailed performance information for each Fund at various Board and committee meetings during the year in addition to the additional performance information that they reviewed and evaluated in connection with the Transaction. The Trustees also reviewed and evaluated detailed performance information for each Fund in connection with the Current Agreement Re-Approval Process. The Trustees considered the performance results for each of the Funds over multiple measurement periods. They also considered these results in comparison to the performance results of each Fund's Peer Group and Universe, as well as to each Fund's benchmark index. The Boards also noted certain risk-adjusted performance data.
The Trustees also reviewed and evaluated information and data regarding the investment performance record of RiverSource in managing funds with investment strategies generally similar to those of the Funds, as applicable. Investment performance for such funds was provided for a wide range of periods.
The Trustees recognized that the investment performance record of RiverSource in managing funds with similar objectives may be less relevant to their deliberations in situations where the current portfolio managers of Columbia are expected to continue managing a particular Fund following the Closing. They also recognized that for each Fund, it is not possible to predict with certainty what effect, if any, consummation of the Transaction will have on the future performance of the Funds, noting in particular that past investment performance is no assurance of future results. The Fund-by-Fund discussion set forth below provides additional information regarding those Funds highlighted as meeting agreed-upon criteria for warranting further review. Such criteria included, among other things, information relating to Actual Management Rates, total expense ratios and/or performance information, relative to a Fund's Peer Group and/or Univ erse.
Costs of Services to be Provided and Profitability
In considering the costs of services to be provided by RiverSource and the Subadvisers under the Proposed Advisory Agreement and Proposed Subadvisory Agreement, as applicable for each Fund, and the projected range of profitability to RiverSource and the Subadvisers from their relationships with the Funds, the Trustees considered, among other things, that there would be no increase in advisory or subadvisory fee rates under the Proposed Advisory and Subadvisory Agreements. The Trustees further noted, with respect to RiverSource, that it was not possible to predict with certainty how RiverSource's profitability would be affected by becoming the investment adviser to the Funds but, as a general matter, they were satisfied, based on their review of RiverSource's projected range of profitability assuming completion of the Transaction, that this projected profitability from their relationship with the Funds would not be excessive. The Trustees based their review, in part, on information regarding RiverSource's current profitability in managing the RiverSource Funds and the information available to the Trustees with respect to RiverSource's expense budgeting process. The Trustees also noted that they would have ongoing opportunities to address RiverSource's profitability in the future based on actual results. The Trustees did not consider separate profitability information with respect to the Subadvisers, as their profitability from their relationships with the Funds was not a material factor in determining whether to
43
approve the Proposed Subadvisory Agreements. The Trustees also noted that the subadvisory fees paid to the Subadvisers, none of which is affiliated with Columbia, had previously been negotiated on an arms' length basis.
The Trustees also reviewed information about the financial condition of RiverSource and the Subadvisers and were satisfied that RiverSource and the Subadvisers have adequate resources to perform the services required under the Proposed Advisory and Proposed Subadvisory Agreements.
Subject to the limitations noted above, the Trustees concluded that they were satisfied that RiverSource's projected range of future profitability, and each Subadviser's historical profitability, from their relationship with each Fund, as relevant, were not excessive.
Economies of Scale
The Trustees received and evaluated information regarding the potential to realize economies of scale with respect to management of the Funds, whether the Funds would appropriately benefit from any economies of scale and whether there was any potential for realization of further economies of scale in connection with the Transaction. The Trustees noted that the current and proposed investment advisory fee rates for most of the Funds contain breakpoints that reduce the fee rate on assets above specified levels. The Trustees noted that RiverSource had indicated that no changes to the Funds' breakpoint arrangements were proposed to be made at this time. In light of these factors and noting that it was not possible to evaluate with certainty if and how the Transaction would produce any immediate opportunities for additional economies of scale, the Trustees concluded that each Fund's breakpoint arrangements were acceptable. The Truste es also recognized that the Funds may benefit from certain economies of scale over time from becoming a part of the larger RiverSource fund complex, based on potential future synergies of operations, potential fee harmonization/ rationalization initiatives and potential future Fund mergers. The Trustees noted, in particular, RiverSource's acknowledgement of the principle that the Funds should share in certain economies of scale if realized by RiverSource. In addition, the Trustees evaluated the likelihood that there would be potential Fund mergers after the Closing. The Trustees noted that any such potential Fund mergers, if approved, could result in the achievement of additional breakpoints for Funds that have implemented breakpoint fee schedules. The Trustees also noted that they expect to consider economies of scale from time to time following the Closing and thus be in a position to evaluate any additional economies of scale.
The Trustees acknowledged the inherent limitations of any analysis of an investment adviser's economies of scale, stemming largely from the Trustees' understanding that economies of scale are generally realized, if at all, by an investment adviser across a variety of products and services, not just with respect to a single fund.
Information About Investment Management Services to Non-Mutual Fund Clients
The Trustees also received and reviewed information about the nature and extent of services and fee rates offered by Riversource and the Subadvisers to the Funds compared with other clients with similar accounts, including separate accounts and institutional investments. The Trustees noted that the Funds may receive services different from those offered to other clients of RiverSource and the Subadvisers and concluded that the advisory fee rates under the Proposed Advisory Agreements and the subadvisory fee rates under the Proposed Subadvisory Agreements were not excessive, given the nature and extent of services expected to be offered and other factors, including the Trustees' review of Lipper data.
Other Benefits to RiverSource and the Subadvisers
The Trustees received and reviewed information regarding any expected "fall-out" or ancillary benefits to be received by RiverSource and its affiliates and by the Subadvisers as a result of their relationships with the Funds.
Among other things, the Trustees noted that RiverSource would benefit from soft dollar arrangements using portfolio brokerage of each Fund that invests in equity securities. The Trustees also noted that the Subadvisers also had benefited from, and expected to continue to benefit from, soft dollar arrangements using portfolio brokerage of the Subadvised Funds. The Trustees acknowledged RiverSource's representation that none of its affiliated broker dealers was expected to provide brokerage services to any Fund, but noted that broker-dealer affiliates of RiverSource will receive distribution related fees from the Funds in respect of shares held in certain accounts, and that such Funds' distributor
44
(which will also become a subsidiary of RiverSource following the closing of the Transaction) retains a portion of the distribution related fees from the Funds and receives a portion of the sales charges on sales or redemptions of certain classes of shares of the Funds. The Trustees recognized that RiverSource's and the Subadvisers' profitability would be somewhat lower without these benefits. The Trustees concluded that RiverSource and the Subadvisers may derive reputational benefits from their association with the Funds. The Trustees also noted, however, that such benefits were difficult to quantify with certainty.
Fund-Specific Considerations for Certain "Review" Funds
During the Current Agreement Re-Approval Process, a limited number of Funds were highlighted as meeting agreed-upon criteria for warranting further review. Such criteria included, among other things, information relating to Actual Management Rates, total expense ratios and/or performance information, relative to a Fund's Peer Group and/or Universe. For such "review" Funds, the Trustees engaged in further analysis with regard to the approval of the Funds' Current Advisory Agreements. For each such Fund, the Trustees subsequently considered the impact of transitioning investment management responsibilities to RiverSource.
Columbia Large Cap Core Fund was not highlighted as a review fund.
Conclusion
After an evaluation of the above-described factors and based on its deliberations and analysis of the information provided and alternatives considered, each Board, including all of the Independent Trustees, concluded that approval of the Proposed Advisory and Subadvisory Agreements was in the best interests of each of the Funds and its shareholders. Accordingly, the Boards unanimously approved the Proposed Advisory and Subadvisory Agreements.
45
Summary of Management Fee Evaluation by
Independent Fee Consultant
EXCERPTS FROM REPORT OF INDEPENDENT FEE CONSULTANT TO THE FUNDS SUPERVISED BY THE COLUMBIA NATIONS BOARD
Prepared Pursuant to the February 9, 2005
Assurance of Discontinuance among the
Office of Attorney General of New York State,
Columbia Management Advisors, LLC, and
Columbia Management Distributors, Inc.
November 12, 2009
I. Overview
On February 9, 2005, Columbia Management Advisors, LLC ("CMA") and Columbia Management Distributors, Inc.1 ("CMD") agreed to the New York Attorney General's Assurance of Discontinuance ("AOD"). Among other things, the AOD stipulates that CMA may manage or advise a Columbia Fund ("Columbia Fund" and, together with some or all of such funds, the "Columbia Funds") only if the Independent Members of the Columbia Fund's Board of Trustees appoint a Senior Officer or retain an Independent Fee Consultant ("IFC") who is to manage the process by which proposed management fees are negotiated. The AOD further stipulates that the Senior Officer or IFC is to prepare a written annual evaluation of the fee negotiation process.
With effect from January 1, 2007, the Independent Members of the Board of Trustees for certain Columbia Funds known collectively as the "Nations Funds" (together with the other members of that Board, the "Trustees") retained me as IFC for the Nations Funds.2 In this capacity, I have prepared the fifth annual written evaluation of the fee negotiation process. As was the case with the 2007 and 2008 reports, my immediate predecessor as IFC, John Rea, provided invaluable assistance in the preparation of this year's report.
A. Role of the Independent Fee Consultant
The AOD charges the IFC with "managing the process by which proposed management fees ... to be charged the Columbia Fund are negotiated so that they are negotiated in a manner which is at arms' length and reasonable and consistent with this Assurance of Discontinuance." The AOD also provides that CMA "may manage or advise a Columbia Fund only if the reasonableness of the proposed management fees is determined by the Board of Trustees ... using ... an annual independent written evaluation prepared by or under the direction of ... the Independent Fee Consultant." Therefore, the AOD makes clear that the IFC does not supplant the Trustees in negotiating management fees with CMA, nor does the IFC substitute his or her judgment for that of the Trustees with respect to the reasonableness of proposed fees or any other matter that is committed to the business judgmen t of the Trustees.
B. Elements Involved in Managing the Fee Negotiation Process
In preparing the report required by the AOD, the IFC must consider at least the following six factors set forth in the AOD:
1. The nature and quality of CMA's services, including the Fund's performance;
2. Management fees (including any components thereof) charged by other mutual fund companies for like services;
3. Possible economies of scale as the Fund grows larger;
4. Management fees (including any components thereof) charged to institutional and other clients of CMA for like services;
5. Costs to CMA and its affiliates of supplying services pursuant to the management fee agreements, excluding any intra-corporate profit; and
6. Profit margins of CMA and its affiliates from supplying such services.
C. Organization of the Annual Evaluation
This report, like last year's, focuses on the six factors and contains a section for each factor except that CMA's costs and profits from managing the Funds are treated in a single section. In addition to a discussion of these factors, the report offers recommendations to improve the fee review process in future years. A review of the status of recommendations made
1 CMA and CMD are subsidiaries of Columbia Management Group, LLC ("CMG"), and are the successors to the entities named in the AOD.
2 I have no material relationship with Bank of America, CMG or any of its affiliates, aside from serving as IFC, and I am aware of no material relationship with any of their affiliates. I retained John Rea, an independent economic consultant, to assist me with this report.
Unless otherwise stated or required by the context, this report covers only the Nations Funds, which are also referred as the "Funds."
46
in the 2008 Report is being provided separately with the materials for the November meeting.
II. Summary of Findings
A. General
1. Based upon my examination of the information supplied by CMG in the light of the six factors set forth in the AOD, I conclude that the Trustees have the relevant information necessary to evaluate the reasonableness of the proposed management fees for each Nations Fund, subject to the following: on September 30, 2009, Ameriprise Financial, Inc. ("Ameriprise") announced that it had agreed to purchase the investment management business of CMG with the exception of its cash and liquidity management business which includes the Nations money market Funds. As a result, the Trustees requested information from CMG as to the plans of CMG and its parent with respect to the provision of investment management services to those Funds after the consummation of the proposed transaction. As of the date of this report, that in formation has not yet been provided. However, as the transaction is not expected to close until the spring of 2010, the Trustees concluded that they would have ample opportunity to take appropriate steps with respect to the investment management agreements of the money market Funds, including invoking the 60-day termination provisions of those agreements, in response to the information to be provided by CMG and reviewed by the IFC.
In my view, the process by which the proposed management fees of the Funds have been negotiated in 2009 thus far has been, to the extent practicable, at arms' length and reasonable and consistent with the AOD.
B. Nature and Quality of Services, Including Performance
3. The performance of the Funds was relatively strong for the measuring periods ending March 31, 2009. Between one-third and nearly one-half of the Funds were ranked in either the first or second quintiles in the one-, three-, five-, and 10-year periods, and no more than 8% were in the fifth quintile for these periods. Overall, the performance was stronger in the two longer periods.
4. The strongest performing groups over the one-, three-, and five-year periods were active equity, quantitative strategies, and, to a lesser extent, money market Funds. Sub-advised Funds were the weakest performers, with over 60% of the Funds in the bottom two quintiles in the one- and three-year periods. For the same two periods, no more than 15% percent of the sub-advised Funds were in the top two quintiles. Almost half of fixed-income Funds ranked in the bottom two quintiles in the one- and three-year periods.
5. Overall performance of the Funds was less robust in 2009 than in 2008 and 2007 for the one- and three-year performance periods. For example, 62% of the Funds were in the top two quintiles in 2007 for the one-year period compared with 33% in 2009. The ranks of those in the bottom two quintiles rose significantly between 2007 and 2009, led by money market and fixed-income Funds in the one- and three-year periods. For the three-year period, there was a similar trend with respect to sub-advised Funds.
6. The performance of the active equity Funds against their benchmarks was strong for the one-, three-, and five-year performance periods. In contrast, more than half of the sub-advised Funds failed to beat their benchmarks on a net basis in the one- and three-year periods. The fixed-income Funds consistently produced gross returns below those of their benchmarks. Lipper quintile rankings of the actively managed equity Funds are highly correlated with their performance against their benchmarks in the sense that net returns in excess of the benchmark appear necessary to achieve a ranking in one of the top three quintiles. No such correlation was observed for fixed-income and quantitative strategies Funds.
7. The equity Funds' overall performance adjusted for risk was mixed. Based upon three-year returns, less than 40% of the equity Funds had a combination of risk-adjusted and unadjusted returns that placed them in the top half of their performance universes; 60% were in the bottom half of their universes. About 30% of the fixed income Funds posted high returns and low risk relative to comparable funds. Over 60% of the fixed-income Funds took on more risk than the typical fund in their performance universes.
8. The industry-standard procedure used by Lipper that includes all share classes in the performance universe tends to bias a Fund's ranking upward within that universe. The bias occurs because either no-12b-1 fee or
47
low-12b-1 fee share classes of the Nations Funds are compared with funds in performance universes that include all share classes of multi-class funds with 12b-1 fees of up to 100 basis points. Correcting this bias by limiting the performance universe to classes of comparable funds with low or no 12b-1 fees (a "filtered universe") lowers the relative performance for the Funds, but generally not to a material extent. The filtering process, however, did identify two Funds for further review that had not been so identified using unfiltered universes.
9. A small number of Funds have consistently underperformed over the past five years. The exact number depends on the criteria used to evaluate longer-term performance. For example, six different Funds have had below-median performance in at least four out of the five years between 2005 and 2009 for either the one- or three-year performance periods from 2005 to 2009. If the threshold were the 60th percentile, only two Funds would have satisfied the criteria.
10. The services performed by CMG professionals beyond portfolio management, such as compliance, legal, information technology, risk management, finance, and fund administration, are critical to the success of the Funds and appear to be of high quality.
C. Management Fees Charged by Other Mutual Fund Companies
11. The Funds' management fees and total expenses are generally low relative to those of their peers, with over half the Funds ranking in the most favorable two quintiles. For total expenses, slightly more than one-quarter are in the bottom two quintiles, while slightly less than two-fifths are in the bottom two quintiles for actual management fees. Fixed-income and quantitative strategies Funds have the lowest fees and expenses relative to their peers. The sub-advised Funds account for the majority of Funds in the fifth quintile for both management fees and total expenses.
12. The distribution of management fee rankings has changed little over the past three years, while the distribution of total expense rankings has moved in the direction of higher expenses. The most notable change involving total expenses has been a shift in the number of Funds from the first to the second quintile.
13. The management fees of the non-subadvised Funds are generally in line with those of Columbia Funds supervised by the Atlantic Board of Trustees (the "Atlantic Funds"). The sub-advised large cap equity, international equity, and high yield Funds, however, generally have higher management fees than those of comparable Atlantic and non-subadvised Funds.
14. The implementation of the new program of voluntary expense limits appears to have been associated, on balance, with less favorable expense rankings. This result reflects increases in expense limits for certain Funds, the removal of fee waivers, and the shift of certain expenses from CMA to the Funds. The decline in expense rankings is less significant, however, than CMA projected in December 2008.
D. Trustees' Advisory Contract Review Process
15. The Trustees' evaluation process identified 22 Funds in 2009 for further review based upon long-standing criteria relating to their relative performance or expenses or both. When compared in filtered universes, two more Funds met the criteria for further review. At the November meeting, CMG provided further information about each of those Funds to assist the Trustees in their evaluation.
E. Potential Economies of Scale
16. CMG presented to the Trustees its analysis of the sources and sharing of potential economies of scale. CMG views economies of scale as arising at the complex level and would regard estimates of scale economies for individual funds as unreliable. In its analysis, CMG did not identify specific sources of economies of scale or provide any estimates of any economies of scale that might arise from future asset growth. CMG's analysis included measures taken by the Trustees and CMG that seek to share any potential economies of scale through breakpoints in management fee schedules, the establishment of expense limits for each Fund, enhanced shareholder services, fund mergers, and operational consolidation.
17. An examination of the contractual fee schedules for five Nations Funds shows that the schedules for Small Cap II, Municipal Reserves, and Treasury Reserves compare favorably with those of their competitors, while the
48
subadvised Marsico Growth and High Yield VS Funds have schedules generally above those of their peers, including funds that do not have a sub-adviser. The group fee with breakpoints that characterizes the money market Fund schedules is not typically found among competitors, nearly all of which have flat fee schedules.
F. Management Fees Charged to Institutional Clients
18. CMG has provided Trustees with comparisons of mutual fund management fees and institutional fees based upon standardized fee schedules and upon actual fees. The results show that, consistent with industry practice, actual and scheduled institutional fees are generally, but not always, lower than the Funds' management fees. CMG provided additional data this year demonstrating that at small asset levels, the effective fee of certain Funds may be equal to or less than institutional fee levels at those asset levels, due to the effect of expense limits on small funds with high gross expenses. CMG also analyzed the differences between the services provided and risks borne on the one hand by a manager of mutual funds and on the other by institutional advisers, and suggested that these differences should be kept in mind when Trustees review the reasonableness of the Funds' management fees.
G. Revenues, Expenses, and Profits
19. The activity-based cost allocation methodology employed by CMG to allocate costs, both direct and indirect, for purposes of calculating Fund profitability is thoughtful and detailed. This year, CMG further refined the technique by allocating additional indirect expenses on an activity basis.
20. The materials provided on CMG's revenues and expenses with respect to the Funds and the methodology underlying their construction form a sufficient basis for Trustees to evaluate the expenses of and profitability to CMG arising out of its relationships with the Funds.
21. CMG provided a firm-wide pro forma 2009 income statement demonstrating the effect of market events beginning in the fourth quarter of 2008 on its revenues and profitability to provide an additional perspective on calendar 2008 profitability data.
22. In 2008, CMG's pre-tax pre- and post-distribution margins on the Nations Funds were above the industry mean and median, based on limited data available for publicly held mutual fund managers and excluding the costs of CMG's money market capital support programs. However, as is to be expected in a 63-Fund complex, some Nations Funds had relatively high pre-tax profit margins in 2008, when calculated solely with respect to management revenues and expenses, while other Nations Funds operated at a loss. There is a positive relationship between Fund size and profitability to CMG, with smaller Funds generally operating at a loss to CMG.
23. CMG pays a fixed percentage of its management fee revenues to an affiliate, U.S. Trust, Bank of America Private Wealth Management, with respect to assets of its clients invested in Nations Funds to compensate it for services it performs with respect to those client assets and for the effect of state law limitations on affiliates charging multiple fees. Based on our analysis of the services provided by this affiliate, we have concluded that all payments other than those for sub-transfer agent or sub-accounting services should be treated as a distribution expense.
III. Recommendations
1) Criteria for review. The Trustees may wish to consider modifying the criteria for identifying a Fund for further review (a "Review Fund") to include criteria that focus exclusively on performance. They may also wish to consider whether it would be useful to apply CMG's own internal monitoring standards for Fund performance to the contract review process, or whether such criteria are more relevant to their ongoing investment oversight.
2) Presentation of Review Fund discussion. CMG should consider whether it could more systematically present in one discussion all relevant information regarding each Review Fund, which is now split into several different portions of the 15(c) materials. For any Fund that has been a Review Fund in consecutive years, CMG should address under what circumstances it could reasonably be anticipated that the Fund would lose that status.
3) Refinement of tax-exempt performance data. Certain single-state tax-exempt Funds compete in extremely small universes and are compared to a multi-state benchmark of uncertain relevance. Notwithstanding the difficulties, CMG should work to improve the reliability of the calculation of relative performance of these Funds. If that is not possible,
49
CMG should provide guidance on how the Trustees should judge the quality of CMG's management of these Funds.
4) Development of risk metrics for asset-allocation, tax-exempt, and money market Funds. CMG has developed and shared with the Trustees quantitative risk metrics comparing equity and taxable fixed-income Funds against their peers. However, reliable risk metrics have not been developed for asset-allocation, tax-exempt fixed income, and money market Funds. We urge CMG to continue its efforts to provide reliable risk measures for these categories of Funds, especially in the cases of asset-allocation and money market funds, because their investors are likely to be motivated at least in part by a desire to manage risk.
5) Profitability data. For any period during which CMG is an affiliate of U.S. Trust, Bank of America Private Wealth Management, CMG should continue to present to the Trustees the profitability of each Fund, each investment style and each complex (of which Nations is one) calculated as follows:
a. Management-only profitability should be calculated without reference to any Private Bank expense.
b. Profitability excluding distribution (which essentially covers the management and transfer agency functions) should be adjusted by removing from the expense calculation any portion of the Private Bank payment not attributable to the performance by the Private Bank of sub-transfer agency or sub-accounting functions.
c. Total profitability, including distribution: No adjustment for Private Bank expenses should be made, because all such expenses represent legitimate fund expenses to be taken into account in calculating CMG's profit margin including distribution.
d. Distribution only: This should include all Private Bank expenses other than those attributable to sub-transfer agency services.
6) Contractual fee analysis. This year CMG presented a new Lipper report comparing the contractual management fees of Funds with those of competitors in similar investment styles. However, the reliability of the conclusion—that Fund management fee breakpoints compared favorably with competitive fee rates—was limited by the use of competitive funds at all asset levels. The sponsors of a $100 million mutual fund may not have given much thought to breakpoints at $5 billion; therefore, that fund's contractual fee at that level is unlikely to compare favorably with that of a $5 billion Fund. Limiting the competitors to the Lipper expense group, whose constituents are similar in size to the rele vant Fund, would make the results more meaningful. In addition, the breakpoints of a select group of Nations Funds (which would differ each year) should continue to be compared to those of industry rivals to ensure that the Funds' breakpoint schedules remain within industry norms. As breakpoint schedules change relatively little each year, performing such a comparison for each Nations Fund each year would not be an efficient use of Trustee and CMG resources.
7) Pro forma profitability data. In any year in which CMG or the Trustees believe that the prior year's profitability is unlikely to be representative of current business results due to changes in markets or for any other reason, CMG should, consistent with this year's practice, prepare a pro forma income statement based on year-to-date actual data and reasonable projections used for its own business planning purposes.
8) Additional institutional data and analysis. While CMG provided a substantial amount of information on its institutional business, we suggest some additional items for future years: (a) profitability data for the institutional business in the format, and based upon the same allocation methodologies, used to present Fund profitability, (b) an explanation of how CMA sets institutional fee breakpoints, which normally begin at asset levels far lower than those found in Fund management fee breakpoints, and (c) distinguishing in all institutional fee materials fees of accounts acquired prior to the development of current fee schedules (so-called "legacy" accounts) from the fees of accounts launched after that time.
9) Management fee disparities. In any future study of management fees, CMG and the Nations Trustees should analyze the differences in management fee schedules. As part of that analysis, CMG should provide an explanation for any significant fee differences among comparable funds across fund families sponsored by CMG, such as differences in the management styles of different Funds
50
included the same Lipper category. Finally, if CMG proposes a management fee change or an expense cap for any mutual fund managed by CMA that is comparable to any Nations Fund, CMG should provide the Trustees with sufficient information about the proposal to allow the Trustees to assess the applicability of the proposed change to the relevant Nations Fund or Funds.
10) Explanation of data supplied to Lipper. Each year, as part of the 15(c) process, CMG retains Lipper to compare the fees and expenses of each Fund to a group of competitors. In many cases, CMG, with the approval of the Trustees, adjusts the actual expense data, which is based on the most recent full fiscal year of the Fund (and each competitive fund) to reflect changes in fees or expense limits that occurred during or after the relevant fiscal year. This improves the reliability and usefulness of the comparison. However, to ensure that the Trustees know when and how CMG adjusted the data, we recommend that CMG prepare a table listing for each Fund what adjustments were made, e.g., to reflect a new expense limitation of x basis points that commenced on y date.
11) Reduction of volume of paper documents submitted. The effort to streamline and better organize the data presented to the Trustees and the process by which that data was prepared and organized continued to be well-received by all parties. Notwithstanding past success, it is always appropriate to look for opportunities to reduce and simplify the presentation of 15(c) data. One possibility would be to remove the 127 pages of biographical data, most if not all of which the Trustees have previously seen as part of their ongoing investment oversight duties, from the paper volume and post it on the Internet-based document storage and retrieval system used by the Funds to provide reference data to Trustees.
Respectfully submitted,
Steven E. Asher
51
This page intentionally left blank.
Important Information About This Report
The fund mails one shareholder report to each shareholder address. If you would like more than one report, please call shareholder services at 1-800-345-6611 and additional reports will be sent to you. This report has been prepared for shareholders of Columbia Large Cap Core Fund.
A description of the policies and procedures that the fund uses to determine how to vote proxies and a copy of the fund's voting records are available (i) at www.columbiamanagement.com, (ii) on the Securities and Exchange Commission's website at www.sec.gov, and (iii) without charge, upon request, by calling 1-800-368-0346. Information regarding how the fund voted proxies relating to portfolio securities during the 12-month period ended June 30 is available from the SEC's website. Information regarding how the fund voted proxies relating to portfolio securities is also available from the fund's website, www.columbiamanagement.com.
The fund files a complete schedule of portfolio holdings with the SEC for the first and third quarters of each fiscal year on Form N-Q. The fund's Form N-Q is available on the SEC's website at www.sec.gov and may be reviewed and copied at the SEC's Public Reference Room in Washington, D.C. Information on the operation of the Public Reference Room may be obtained by calling 1-800-SEC-0330.
Please read and consider the investment objectives, risks, charges and expenses for any fund carefully before investing. For a prospectus which contains this and other important information about the fund, contact your Columbia Management representative or financial advisor or go to www.columbiamanagement.com.
Columbia Management Group, LLC ("Columbia Management") is the investment management division of Bank of America Corporation. Columbia Management entities furnish investment management services and products for institutional and individual investors. Columbia Funds are distributed by Columbia Management Distributors, Inc., member of FINRA, SIPC, part of Columbia Management and an affiliate of Bank of America Corporation.
Transfer Agent
Columbia Management Services, Inc.
P.O. Box 8081
Boston, MA 02266-8081
1-800-345-6611
Distributor
Columbia Management
Distributors, Inc.
One Financial Center
Boston, MA 02111
Investment Advisor
Columbia Management Advisors, LLC
100 Federal Street
Boston, MA 02110
53
Columbia Management®
One Financial Center
Boston, MA 02111-2621
PRSRT STD
U.S. Postage
PAID
Holliston, MA
Permit NO. 20
Columbia Management®
Columbia Large Cap Core Fund
Annual Report, February 28, 2010
©2010 Columbia Management Distributors, Inc.
One Financial Center, Boston, MA 02111-2621
800-345-6611 www.columbiafunds.com
SHC-42/35202-0210 (04/10) 10-K0E4K0
Columbia Management®
Annual Report
February 28, 2010
Columbia Marsico Growth Fund
| NOT FDIC INSURED | | May Lose Value | |
|
| NOT BANK ISSUED | | No Bank Guarantee | |
|
Table of Contents
| Fund Profile | | | 1 | | |
|
| Economic Update | | | 2 | | |
|
| Performance Information | | | 4 | | |
|
| Understanding Your Expenses | | | 5 | | |
|
| Portfolio Managers' Report | | | 6 | | |
|
| Financial Statements | | | | | |
|
| Investment Portfolio | | | 8 | | |
|
Statement of Assets and
Liabilities | | | 10 | | |
|
| Statement of Operations | | | 11 | | |
|
Statement of Changes in
Net Assets | | | 12 | | |
|
| Financial Highlights | | | 14 | | |
|
| Notes to Financial Statements | | | 19 | | |
|
Report of Independent Registered
Public Accounting Firm | | | 28 | | |
|
| Federal Income Tax Information | | | 29 | | |
|
| Fund Governance | | | 30 | | |
|
Board Consideration and
Re-Approval of Current Investment
Advisory and Sub-Advisory
Agreements | | | 34 | | |
|
Board Consideration and
Approval of Proposed Investment
Advisory and Sub-Advisory
Agreements | | | 38 | | |
|
Summary of Management Fee
Evaluation by Independent Fee
Consultant | | | 45 | | |
|
Important Information About
This Report | | | 53 | | |
|
The views expressed in this report reflect the current views of the respective parties. These views are not guarantees of future performance and involve certain risks, uncertainties and assumptions that are difficult to predict, so actual outcomes and results may differ significantly from the views expressed. These views are subject to change at any time based upon economic, market or other conditions and the respective parties disclaim any responsibility to update such views. These views may not be relied on as investment advice and, because investment decisions for a Columbia Fund are based on numerous factors, may not be relied on as an indication of trading intent on behalf of any particular Columbia Fund. References to specific securities should not be construed as a recommendation or investment advice.
President's Message

Dear Shareholder:
As we previously announced, Bank of America, N.A. has reached a definitive agreement to sell Columbia Management's long-term asset management business to Ameriprise Financial, Inc. This includes the management of its equity and fixed-income mutual funds.
This transaction combines two leading asset management firms and will create one entity that is expected to rank as one of the top asset managers. It is anticipated that the combined U.S. asset management business will operate under the well-regarded Columbia Management brand. The combined U.S. asset management business will be led by Ted Truscott, currently president, U.S. asset management, annuities and chief investment officer, Ameriprise Financial. Michael A. Jones, currently president of Columbia Management, will serve as president, U.S. asset management. Colin Moore, chief investment officer at Columbia Management, will continue to serve in that role for the combined organization. I will also continue in my role as head of mutual funds, responsible for the delivery of mutual fund products and services to investors.
As a valued investor in Columbia funds, please know that our goal is to ensure a smooth transition and provide you with the highest quality products and services. We will work closely with colleagues at Ameriprise Financial to seek a seamless transition for our clients and to keep you informed as the transition progresses and key decisions are made. We want to assure you that the funds' portfolio managers continue to focus on providing uninterrupted service to Columbia fund shareholders. Columbia Management and Ameriprise Financial will operate independently until all required approvals, including fund board, fund shareholder and other client approvals, have been received and the transaction closes, which is expected to occur in the spring of this year.
Meanwhile, transition teams across the company have been formed to oversee integration efforts including rebranding initiatives, vendor and system consolidations and client communications. Throughout the transition, we seek to build on best practices from both legacy organizations with enhancements to productivity, quality and the delivery of world-class customer experiences.
Clearly, we have a lot of work ahead of us in 2010. We look forward to introducing our combined business with an even wider breadth of products and capabilities. Everyone at Columbia Management and Ameriprise Financial is excited about the opportunities for this combined organization. I share this optimism and believe it will position us as a best-in-class asset management business with the ability to deliver more for clients than ever before.
Sincerely,

J. Kevin Connaughton
President, Columbia Funds
Past performance is no guarantee of future results.
Fund Profile – Columbia Marsico Growth Fund
Summary
g For the 12-month period that ended February 28, 2010, the fund's Class A shares returned 49.09% without sales charge.
g The fund underperformed its benchmark, the S&P 500 Index1, but performed generally in line with its peer group, the Lipper Large-Cap Growth Funds Classification.2
g Stock selection in the consumer discretionary and information technology sectors detracted from relative performance, while sector positioning was positive for relative returns.
Portfolio Management
Thomas F. Marsico has managed the fund since December 1997 and is Chief Investment Officer of Marsico Capital Management, LLC ("MCM"), investment sub-advisor to the fund. On February 1, 2010, A. Douglas Rao joined Tom F. Marsico as co-manager of the fund.
Columbia Management Advisors, LLC ("CMA") and MCM are SEC-registered investment advisors. CMA is an indirect, wholly owned subsidiary of Bank of America Corporation. CMA has retained MCM to serve as investment sub-advisor. As the investment sub-advisor, MCM makes the investment decisions and manages all or a portion of the fund. MCM is not affiliated with Bank of America.
Subject to satisfying various conditions to closing, effective on or about May 1, 2010, RiverSource Investments, LLC, a subsidiary of Ameriprise Financial, Inc., is expected to become the investment advisor to the fund and change its name to Columbia Management Investment Advisers, LLC. Please see the fund's prospectus dated July 1, 2009, including the supplements thereto, for more information regarding the expected change in investment advisor and any related changes to the portfolio management of the fund.
1The Standard and Poor's (S&P) 500 Index tracks the performance of 500 widely held, large-capitalization U.S. stocks. Indices are not available for investment, are not professionally managed and do not reflect sales charges, fees, brokerage commissions, taxes or other expenses of investing. Securities in the fund may not match those in an index.
2Lipper Inc., a widely respected data provider in the industry, calculates an average total return (assuming reinvestment of distributions) for mutual funds with investment objectives similar to those of the fund. Lipper makes no adjustment for the effect of sales loads.
Performance data quoted represents past performance and current performance may be lower or higher. Past performance is no guarantee of future results. The investment return and principal value will fluctuate so that shares, when redeemed, may be worth more or less than the original cost. Please visit www.columbiafunds.com for daily and most recent month-end performance updates.
Summary
1-year return as of 02/28/10
| | +49.09% | |
|
 | | Class A shares
(without sales charges) | |
|
| | +53.62% | |
|
 | | S&P 500 Index | |
|
Morningstar Style BoxTM

The Morningstar Style BoxTM reveals a fund's investment strategy. For equity funds, the vertical axis shows the market capitalization of the stocks owned, and the horizontal axis shows investment style (value, blend or growth). Information shown is based on the most recent data provided by Morningstar.
1
Economic Update – Columbia Marsico Growth Fund
Summary
For the 12-month period that ended February 28, 2010
g After a sharp decline, stock markets rebounded around the world, as measured by the S&P 500 Index and the MSCI EAFE Index.
| S&P Index | | MSCI Index | |
|
 | |  | |
|
g As investors grew more comfortable with risk, non-Treasury sectors of the bond market rebounded. The Barclays Capital Aggregate Bond Index delivered solid results. High-yield bonds were strong performers, as measured by the JPMorgan Developed BB High Yield Index.
Barclays
Aggregate Index | | JPMorgan
Index | |
|
 | |  | |
|
After a deep and difficult recession, the U.S. economy regained its footing midway through calendar year 2009. Gross domestic product (GDP) turned positive in the third quarter of 2009, rising 2.2%, and then gained 5.6% in the fourth quarter according to the estimate released by the Bureau of Economic Analysis. Growth was primarily the result of federal government stimulus spending and a slowdown in inventory reductions. Hopes for a sustained recovery now depend on a variety of factors, including a rebound in consumer spending, an increase in revenues to keep business profits moving higher and a turnaround in the labor market.
The housing market showed some signs of improvement. Existing home sales fell late in the period, but remained above levels of one year ago. According to the National Association of Realtors, the inventory of houses for sale fell over the course of 2009. Housing prices remained unchanged during the past year, but that was progress compared to 2008. The average home price fell in 2008 and since then distressed properties, which accounted for an estimated 38% of sales in January 2010, have weighed on prices because they were heavily discounted.
In the beleaguered labor market, the good news was that there was less bad news. Businesses continued to shed jobs throughout the period, raising the unemployment rate as high as 10.2% in October 2009. However, the pace of job losses slowed markedly by the period's end. Compared to monthly six figure losses of one year ago, 14,000 jobs were added to the labor market in January 2010 and only 14,000 were lost in February 2010.* The rate of unemployment at the end of the period was 9.7%.* Nevertheless, prospects for a quick recovery in the labor markets are dim. In fact, consumer confidence, as measured monthly by The Conference Board, an independent research organization, took a sharp dive in February. Consumers surveyed cited worsening business conditions, a bleaker outlook for the labor markets and income for their pessimism.
Manufacturing activity remained slow during the first few months of the period. However, a key measure—the Institute for Supply Management's Index—rose above 50 in July and remained well above 50 for the remainder of the period. A value above 50 tends to indicate that the economy is growing. Industrial production turned positive in January 2010, and durable goods orders took a big jump forward. Manufacturing capacity utilization inched upward to 72.6%.
Consumer spending registered both ups and downs during the 12-month period, but the trend at the end of the period was upward, even though personal income decreased in January 2010. In light of uncertainty about the economy and pressure on consumers from a number of sectors, the Federal Reserve Board (the Fed) kept a key short-term interest rate—the federal funds rate—close to zero throughout the period.
*Source: U.S. Bureau of Labor Statistics
2
Economic Update (continued) – Columbia Marsico Growth Fund
Stocks bottomed, then rebounded
Against a strengthening economic backdrop, a stock market rally that began in mid-March 2009 continued throughout the period. The U.S. stock market returned 53.62% for the 12-month period, as measured by the S&P 500 Index.1 Mid-cap stocks outperformed large and small-cap stocks and value stocks outperformed growth stocks by a solid margin, as measured by their respective Russell indices.2 Outside the U.S., stock market returns were even stronger. The MSCI EAFE Index,3 a broad gauge of stock market performance in foreign developed markets, gained 54.58% (net of dividends, in U.S. dollars) for the period. Emerging stock markets were caught in last year's downdraft, but they bounced back stronger than domestic or developed world markets in 2009 as their economic growth generally outpaced the developed world. The MSCI Emerging Markets Index4 returned 91.63% (net of dividends, in U.S. d ollars).
Bond returns ranged from solid to strong
As hopes for a recovery materialized, bonds from non-Treasury sectors delivered solid returns. The Barclays Capital Aggregate Bond Index5 returned 9.32%. Municipal bonds delivered returns that were in line with taxable investment-grade bonds even without factoring in potential tax advantages to investors in higher income tax brackets. The Barclays Capital Municipal Bond Index6 returned 9.98%. High-yield bond prices rebounded strongly in 2009. For the 12-month period covered by this report, the JPMorgan Developed BB High Yield Index7 returned 32.79%.
Past performance is no guarantee of future results.
1The Standard & Poor's (S&P) 500 Index tracks the performance of 500 widely held, large-capitalization U.S. stocks.
2The Russell 1000 Index tracks the performance of 1,000 of the largest U.S. companies, based on market capitalization. The Russell MidCap Index measures the performance of the 800 smallest companies in the Russell 1000 Index, which represents approximately 25% of the total market capitalization of the Russell 1000 Index. The Russell 2000 Index measures the performance of the 2,000 smallest companies in the Russell 3000 Index, which represents approximately 8% of the total market capitalization of the Russell 3000 Index. The Russell 3000 Growth Index measures the performance of those Russell 3000 Index companies with higher price-to-book ratios and higher forecasted growth values. The stocks in this index are also members of either the Russell 1000 Growth or the Russell 2000 Growth indexes. The Russell 3000 Value Index measures the performance of those Russell 3000 Index companies with lower price-to-book ratios and lo wer forecasted growth values. The stocks in this index are also members of either the Russell 1000 Value or the Russell 2000 Value indexes.
3The Morgan Stanley Capital International Europe, Australasia, Far East (MSCI EAFE) Index is a capitalization-weighted index that tracks the total return of common stocks in 21 developed-market countries within Europe, Australasia and the Far East.
4The Morgan Stanley Capital International Emerging Markets Index (MSCI EMI) is a free float-adjusted market capitalization index that is designed to measure equity market performance of emerging markets. As of June 2009, the MSCI Emerging Markets Index consisted of the following 22 emerging market country indices: Brazil, Chile, China, Colombia, Czech Republic, Egypt, Hungary, India, Indonesia, Israel, Korea, Malaysia, Mexico, Morocco, Peru, Philippines, Poland, Russia, South Africa, Taiwan, Thailand, and Turkey.
5The Barclays Capital Aggregate Bond Index is a market value-weighted index that tracks the daily price, coupon, pay-downs and total return performance of fixed-rate, publicly placed, dollar-denominated and non-convertible investment grade debt issues with at least $250 million par amount outstanding and with at least one year to final maturity.
6The Barclays Capital Municipal Bond Index is considered representative of the broad market for investment grade, tax-exempt bonds with maturity of at least one year.
7The JPMorgan Developed BB High Yield Index is an unmanaged index designed to mirror the investable universe of the U.S. dollar developed, BB-rated, high yield corporate debt market.
Indices are not available for investment, are not professionally managed and do not reflect sales charges, fees, brokerage commissions, taxes or other expenses of investing. Securities in the fund may not match those in an index.
3
Performance Information – Columbia Marsico Growth Fund
Performance data quoted represents past performance and current performance may be lower or higher. Past performance is no guarantee of future results. The investment return and principal value will fluctuate so that shares, when redeemed, may be worth more or less than the original cost. Please visit www.columbiafunds.com for daily and most recent month-end performance updates.
Annual operating expense ratio (%)*
| Class A | | | 1.27 | | |
| Class B | | | 2.02 | | |
| Class C | | | 2.02 | | |
| Class R | | | 1.52 | | |
| Class Z | | | 1.02 | | |
Annual operating expense ratio
after contractual waivers (%)*
| Class A | | | 1.26 | | |
| Class B | | | 2.01 | | |
| Class C | | | 2.01 | | |
| Class R | | | 1.51 | | |
| Class Z | | | 1.01 | | |
*The annual operating expense ratio and annual operating expense ratio after contractual waivers are as stated in the fund's prospectus that is current as of the date of this report. The contractual waiver expires 06/30/10. Differences in expense ratios disclosed elsewhere in this report may result from including fee waivers and expense reimbursements as well as different time periods used in calculating the ratios.
Performance of a $10,000 investment 03/01/00 – 02/28/10
The chart above shows the change in value of a hypothetical $10,000 investment in Class A shares of Columbia Marsico Growth Fund during the stated time period, and does not reflect the deduction of taxes that a shareholder may pay on fund distributions or on the redemption of fund shares.
Performance of a $10,000 investment 03/01/00 – 02/28/10 ($)
| Sales charge | | without | | with | |
| Class A | | | 7,729 | | | | 7,286 | | |
| Class B | | | 7,172 | | | | 7,172 | | |
| Class C | | | 7,172 | | | | 7,172 | | |
| Class R | | | 7,639 | | | | n/a | | |
| Class Z | | | 7,928 | | | | n/a | | |
Average annual total return as of 02/28/10 (%)
| Share class | | A | | B | | C | | R | | Z | |
| Inception | | 12/31/97 | | 12/31/97 | | 12/31/97 | | 01/23/06 | | 12/31/97 | |
| Sales charge | | without | | with | | without | | with | | without | | with | | without | | without | |
| 1-year | | | 49.09 | | | | 40.51 | | | | 48.10 | | | | 43.10 | | | | 48.00 | | | | 47.00 | | | | 48.79 | | | | 49.55 | | |
| 5-year | | | –0.57 | | | | –1.74 | | | | –1.31 | | | | –1.70 | | | | –1.32 | | | | –1.32 | | | | –0.80 | | | | –0.32 | | |
| 10-year | | | –2.54 | | | | –3.12 | | | | –3.27 | | | | –3.27 | | | | –3.27 | | | | –3.27 | | | | –2.66 | | | | –2.29 | | |
Average annual total return as of 03/31/10 (%)
| Share class | | A | | B | | C | | R | | Z | |
| Sales charge | | without | | with | | without | | with | | without | | with | | without | | without | |
| 1-year | | | 50.07 | | | | 41.39 | | | | 49.01 | | | | 44.01 | | | | 48.93 | | | | 47.93 | | | | 49.74 | | | | 50.43 | | |
| 5-year | | | 1.21 | | | | 0.02 | | | | 0.46 | | | | 0.06 | | | | 0.46 | | | | 0.46 | | | | 0.97 | | | | 1.47 | | |
| 10-year | | | –1.68 | | | | –2.26 | | | | –2.41 | | | | –2.41 | | | | –2.41 | | | | –2.41 | | | | –1.80 | | | | –1.43 | | |
The "with sales charge" returns include the maximum initial sales charge of 5.75% for Class A shares, the applicable contingent deferred sales charge of 5.00% in the first year, declining to 1.00% in the sixth year, and eliminated thereafter for Class B shares and 1.00% for Class C shares for the first year only. The "without sales charge" returns do not include the effect of sales charges. If they had, returns would be lower.
Performance results reflect any fee waivers or reimbursements of fund expenses by the investment advisor and/or any of its affiliates. Absent these fee waivers or expense reimbursement arrangements, performance results would have been lower.
All results shown assume reinvestment of distributions. Class Z shares are sold at net asset value with no distribution and service (Rule 12b-1) fees. Class R shares are sold at net asset value with distribution and service (Rule 12b-1) fees. Class R and Class Z shares have limited eligibility and the investment minimum requirements may vary. Please see the fund's prospectus for details. Performance for different share classes will vary based on differences in sales charges and fees associated with each class.
The tables do not reflect the deduction of taxes that a shareholder may pay on fund distributions or on the redemption of fund shares.
The returns for Class R shares include the returns of Class A shares prior to January 23, 2006, the date on which Class R shares were initially offered by the fund. These returns have not been restated to reflect any differences in expenses between Class A shares and Class R shares. If differences in expenses had been reflected, the returns shown would have been lower, since Class R shares are subject to higher distribution and service (Rule 12b-1) fees.
4
Understanding Your Expenses – Columbia Marsico Growth Fund
As a fund shareholder, you incur two types of costs. There are transaction costs, which generally include sales charges on purchases and may include redemption fees or exchange fees. There are also ongoing costs, which generally include investment advisory fees, distribution and service (Rule 12b-1) fees and other fund expenses. The information on this page is intended to help you understand the ongoing costs of investing in the fund and to compare these costs with the ongoing costs of investing in other mutual funds.
Analyzing your fund's expenses by share class
To illustrate these ongoing costs, we have provided an example and calculated the expenses paid by investors in each share class during the period. The information in the following table is based on an initial investment of $1,000, which is invested at the beginning of the period and held for the entire period. Expense information is calculated two ways and each method provides you with different information. The amount listed in the "Actual" column is calculated using the fund's actual operating expenses and total return for the period. The amount listed in the "Hypothetical" column for each share class assumes that the return each year is 5% before expenses and is calculated based on the fund's actual operating expenses. You should not use the hypothetical account values and expenses to estimate either your actual account balance at the end of the period or the expenses you paid during this period.
Compare with other funds
Since all mutual funds are required to include the same hypothetical calculations about expenses in shareholder reports, you can use this information to compare the ongoing cost of investing in the fund with other funds. To do so, compare the 5% hypothetical example with the 5% hypothetical examples that appear in the shareholder reports of other funds. As you compare hypothetical examples of other funds, it is important to note that hypothetical examples are meant to highlight the ongoing costs of investing in a fund and do not reflect any transaction costs, such as sales charges, redemption fees or exchange fees.
Estimating your actual expenses
To estimate the expenses that you paid over the period, first you will need your account balance at the end of the period:
g For shareholders who receive their account statements from Columbia Management Services, Inc., your account balance is available online at www.columbiafunds.com or by calling Shareholder Services at 800.345.6611.
g For shareholders who receive their account statements from their financial intermediary, contact your financial intermediary to obtain your account balance.
1. Divide your ending account balance by $1,000. For example, if an account balance was $8,600 at the end of the period, the result would be 8.6.
2. In the section of the table below titled "Expenses paid during the period," locate the amount for your share class. You will find this number in the column labeled "Actual." Multiply this number by the result from step 1. Your answer is an estimate of the expenses you paid on your account during the period.
If the value of your account falls below the minimum initial investment requirement applicable to you, your account generally will be subject to a $20 annual fee. This fee is not included in the accompanying table. If you are subject to the fee, keep it in mind when you are estimating the ongoing expenses of investing in the fund and when comparing the expenses of this fund with other funds.
09/01/09 – 02/28/10
| | | Account value at the
beginning of the period ($) | | Account value at the
end of the period ($) | | Expenses paid
during the period ($) | | Fund's annualized
expense ratio (%) | |
| | | Actual | | Hypothetical | | Actual | | Hypothetical | | Actual | | Hypothetical | | Actual | |
| Class A | | | 1,000.00 | | | | 1,000.00 | | | | 1,100.80 | | | | 1,018.55 | | | | 6.56 | | | | 6.31 | | | | 1.26 | | |
| Class B | | | 1,000.00 | | | | 1,000.00 | | | | 1,097.00 | | | | 1,014.83 | | | | 10.45 | | | | 10.04 | | | | 2.01 | | |
| Class C | | | 1,000.00 | | | | 1,000.00 | | | | 1,096.90 | | | | 1,014.83 | | | | 10.45 | | | | 10.04 | | | | 2.01 | | |
| Class R | | | 1,000.00 | | | | 1,000.00 | | | | 1,100.10 | | | | 1,017.31 | | | | 7.86 | | | | 7.55 | | | | 1.51 | | |
| Class Z | | | 1,000.00 | | | | 1,000.00 | | | | 1,102.40 | | | | 1,019.79 | | | | 5.26 | | | | 5.06 | | | | 1.01 | | |
Expenses paid during the period are equal to the annualized expense ratio for the share class, multiplied by the average account value over the period, then multiplied by the number of days in the fund's most recent fiscal half-year and divided by 365.
It is important to note that the expense amounts shown in the table are meant to highlight only ongoing costs of investing in the fund and do not reflect any transaction costs, such as sales charges, redemption fees or exchange fees. Therefore, the hypothetical examples provided may not help you determine the relative total costs of owning shares of different funds. If these transaction costs were included, your costs would have been higher.
5
Portfolio Managers' Report – Columbia Marsico Growth Fund
Performance data quoted represents past performance and current performance may be lower or higher. Past performance is no guarantee of future results. The investment return and principal value will fluctuate so that shares, when redeemed, may be worth more or less than the original cost. Please visit www.columbiafunds.com for daily and most recent month-end performance updates.
Net asset value per share
| as of 02/28/10 ($) | |
| Class A | | | 16.75 | | |
| Class B | | | 15.38 | | |
| Class C | | | 15.40 | | |
| Class R | | | 16.60 | | |
| Class Z | | | 17.02 | | |
Distributions declared per share
| 03/01/09 – 02/28/10 ($) | |
| Class A | | | 0.08 | | |
| Class B | | | 0.04 | | |
| Class C | | | 0.04 | | |
| Class R | | | 0.05 | | |
| Class Z | | | 0.12 | | |
For the 12-month period that ended February 28, 2010, the fund's Class A shares returned 49.09% without sales charge. The fund's benchmark, the S&P 500 Index, returned 53.62%. The average return of the fund's peer group, the Lipper Large-Cap Growth Funds Classification, was 49.40%. Stock selection in the consumer discretionary and information technology sectors detracted from the fund's return relative to its benchmark, while sector positioning made a positive contribution to the fund's relative return.
Underweights benefited returns
The fund eliminated its exposure to utilities and consumer staples and ended the period with very little exposure to telecommunication services, three weak performing sectors in the index. The fund was also underweight relative to the benchmark in energy and health care, which underperformed the index. This sector positioning benefited relative performance.
Mixed results from stock selection
The fund's best performing individual holdings were Apple and Wynn Resorts (5.0% and 1.4% of net assets, respectively). Apple was the fund's largest holding at the end of the period. Both stocks appreciated sharply during the period and had a significant positive impact on returns. Brazil-based oil and natural gas firm Petroleo Brasileiro was a strong performer within the energy sector. We took profits and sold the stock from the portfolio.
Weak consumer spending hurt several fund holdings in the consumer discretionary and information technology sectors. Restaurant operator McDonald's (3.8% of net assets) was a weak performer, and we reduced the fund's stake in the company during the period. Financial transaction processors Visa and MasterCard (each 2.8% of net assets) generated double-digit returns, but lagged the return of the benchmark index. We sold QUALCOMM from the fund during the period as the wireless communications technology firm had disappointing performance. Wells Fargo & Co. (3.4% of net assets), the fourth largest bank in the U.S., also detracted from returns, but we continue to hold the stock. Agricultural materials company Monsanto and aerospace/defense contractor Lockheed Martin also disappointed and were sold from the portfolio.
6
Portfolio Managers' Report (continued) – Columbia Marsico Growth Fund
Summary
We increased the fund's exposure to the financials, information technology and materials sectors during the period and decreased consumer staples, industrials and consumer discretionary holdings. At the end of the period, the fund had no exposure to consumer staples or utilities. At the end of the period, the fund's largest sector allocations were to information technology, financials, consumer discretionary and materials.
Source for all statistical data—Columbia Management Advisors, LLC.
Source for all stock-specific commentary—Marsico Capital Management, LLC.
Portfolio holdings and characteristics are subject to change periodically and may not be representative of current holdings and characteristics. The outlook for the fund may differ from those presented for other Columbia Funds.
The fund normally invests in a core portfolio of 35-50 stocks. By maintaining a relatively concentrated portfolio, the fund may be subject to a greater risk than a fund that is more diversified.
International investing may involve certain risks, including currency fluctuations, risks associated with possible differences in financial accounting standards and other monetary and political risks. Significant levels of foreign taxes, including potentially confiscatory levels of taxation and withholding taxes, may also apply to some foreign investments.
Top 5 sectors
as of 02/28/10 (%)
| Information Technology | | | 24.0 | | |
| Financials | | | 16.0 | | |
| Consumer Discretionary | | | 15.4 | | |
| Materials | | | 12.9 | | |
| Health Care | | | 10.5 | | |
Top 10 holdings
as of 02/28/10 (%)
| Apple | | | 5.0 | | |
| Union Pacific | | | 4.0 | | |
| Dow Chemical | | | 4.0 | | |
| McDonald's | | | 3.8 | | |
| Transocean | | | 3.7 | | |
| Goldman Sachs | | | 3.7 | | |
| Abbott Laboratories | | | 3.7 | | |
| Wells Fargo & Co | | | 3.4 | | |
| Google | | | 3.3 | | |
| General Dynamics | | | 3.3 | | |
The fund is actively managed and the composition of its portfolio will change over time. Information provided is calculated as a percentage of net assets.
7
Investment Portfolio – Columbia Marsico Growth Fund
February 28, 2010
| Common Stocks – 95.7% | |
| | | Shares | | Value ($) | |
| Consumer Discretionary – 15.4% | |
| Automobiles – 0.5% | |
| Ford Motor Co. (a) | | | 1,720,824 | | | | 20,202,474 | | |
| Automobiles Total | | | 20,202,474 | | |
| Hotels, Restaurants & Leisure – 5.3% | |
| McDonald's Corp. | | | 2,222,634 | | | | 141,915,181 | | |
| Wynn Resorts Ltd. | | | 834,000 | | | | 53,017,380 | | |
| Hotels, Restaurants & Leisure Total | | | 194,932,561 | | |
| Internet & Catalog Retail – 3.6% | |
| Amazon.com, Inc. (a) | | | 781,363 | | | | 92,513,379 | | |
| Priceline.com, Inc. (a) | | | 177,122 | | | | 40,164,185 | | |
| Internet & Catalog Retail Total | | | 132,677,564 | | |
| Media – 0.9% | |
| DIRECTV, Class A (a) | | | 968,493 | | | | 32,783,488 | | |
| Media Total | | | 32,783,488 | | |
| Multiline Retail – 0.7% | |
| Nordstrom, Inc. | | | 741,814 | | | | 27,402,609 | | |
| Multiline Retail Total | | | 27,402,609 | | |
| Specialty Retail – 0.7% | |
| Tiffany & Co. | | | 629,027 | | | | 27,922,509 | | |
| Specialty Retail Total | | | 27,922,509 | | |
| Textiles, Apparel & Luxury Goods – 3.7% | |
| NIKE, Inc., Class B | | | 1,741,257 | | | | 117,708,973 | | |
| Polo Ralph Lauren Corp. | | | 237,271 | | | | 18,965,071 | | |
| Textiles, Apparel & Luxury Goods Total | | | 136,674,044 | | |
| Consumer Discretionary Total | | | 572,595,249 | | |
| Energy – 6.1% | |
| Energy Equipment & Services – 3.7% | |
| Transocean Ltd. (a) | | | 1,723,100 | | | | 137,537,842 | | |
| Energy Equipment & Services Total | | | 137,537,842 | | |
| Oil, Gas & Consumable Fuels – 2.4% | |
| EOG Resources, Inc. | | | 921,074 | | | | 86,627,010 | | |
| Oil, Gas & Consumable Fuels Total | | | 86,627,010 | | |
| Energy Total | | | 224,164,852 | | |
| Financials – 15.5% | |
| Capital Markets – 3.7% | |
| Goldman Sachs Group, Inc. | | | 872,193 | | | | 136,367,376 | | |
| Capital Markets Total | | | 136,367,376 | | |
| Commercial Banks – 6.8% | |
PNC Financial Services
Group, Inc. | | | 1,037,709 | | | | 55,787,236 | | |
| U.S. Bancorp | | | 2,862,917 | | | | 70,456,387 | | |
| | | Shares | | Value ($) | |
| Wells Fargo & Co. | | | 4,618,577 | | | | 126,271,895 | | |
| Commercial Banks Total | | | 252,515,518 | | |
| Consumer Finance – 1.8% | |
| American Express Co. | | | 1,700,142 | | | | 64,928,423 | | |
| Consumer Finance Total | | | 64,928,423 | | |
| Diversified Financial Services – 3.2% | |
| JPMorgan Chase & Co. | | | 2,848,488 | | | | 119,551,041 | | |
| Diversified Financial Services Total | | | 119,551,041 | | |
| Financials Total | | | 573,362,358 | | |
| Health Care – 10.5% | |
| Biotechnology – 2.1% | |
| Gilead Sciences, Inc. (a) | | | 1,628,987 | | | | 77,556,071 | | |
| Biotechnology Total | | | 77,556,071 | | |
| Pharmaceuticals – 8.4% | |
| Abbott Laboratories | | | 2,495,610 | | | | 135,461,711 | | |
| Johnson & Johnson | | | 1,343,241 | | | | 84,624,183 | | |
| Merck & Co., Inc. | | | 2,470,996 | | | | 91,130,332 | | |
| Pharmaceuticals Total | | | 311,216,226 | | |
| Health Care Total | | | 388,772,297 | | |
| Industrials – 8.9% | |
| Aerospace & Defense – 3.3% | |
| General Dynamics Corp. | | | 1,692,444 | | | | 122,786,812 | | |
| Aerospace & Defense Total | | | 122,786,812 | | |
| Road & Rail – 5.6% | |
| Norfolk Southern Corp. | | | 1,149,426 | | | | 59,114,979 | | |
| Union Pacific Corp. | | | 2,213,246 | | | | 149,106,383 | | |
| Road & Rail Total | | | 208,221,362 | | |
| Industrials Total | | | 331,008,174 | | |
| Information Technology – 24.0% | |
| Communications Equipment – 1.8% | |
| Cisco Systems, Inc. (a) | | | 1,634,255 | | | | 39,761,424 | | |
| Research In Motion Ltd. (a) | | | 386,339 | | | | 27,383,709 | | |
| Communications Equipment Total | | | 67,145,133 | | |
| Computers & Peripherals – 9.1% | |
| Apple, Inc. (a) | | | 903,071 | | | | 184,786,388 | | |
| EMC Corp. (a) | | | 3,094,195 | | | | 54,117,470 | | |
International Business
Machines Corp. | | | 768,192 | | | | 97,683,295 | | |
| Computers & Peripherals Total | | | 336,587,153 | | |
| Internet Software & Services – 6.6% | |
| Baidu, Inc., ADR (a) | | | 219,782 | | | | 113,996,527 | | |
| Google, Inc., Class A (a) | | | 234,806 | | | | 123,695,801 | | |
See Accompanying Notes to Financial Statements.
8
Columbia Marsico Growth Fund
February 28, 2010
| Common Stocks (continued) | |
| | | Shares | | Value ($) | |
| Yahoo!, Inc. (a) | | | 543,422 | | | | 8,319,791 | | |
| Internet Software & Services Total | | | 246,012,119 | | |
| IT Services – 5.6% | |
| MasterCard, Inc., Class A | | | 458,176 | | | | 102,800,949 | | |
| Visa, Inc., Class A | | | 1,217,019 | | | | 103,787,381 | | |
| IT Services Total | | | 206,588,330 | | |
| Software – 0.9% | |
| Adobe Systems, Inc. (a) | | | 981,863 | | | | 34,021,553 | | |
| Software Total | | | 34,021,553 | | |
| Information Technology Total | | | 890,354,288 | | |
| Materials – 12.9% | |
| Chemicals – 10.1% | |
| Dow Chemical Co. | | | 5,175,849 | | | | 146,528,285 | | |
Potash Corp. of
Saskatchewan, Inc. | | | 489,320 | | | | 54,050,287 | | |
| PPG Industries, Inc. | | | 1,028,091 | | | | 63,268,720 | | |
| Praxair, Inc. | | | 1,474,861 | | | | 110,821,056 | | |
| Chemicals Total | | | 374,668,348 | | |
| Metals & Mining – 2.8% | |
| BHP Billiton PLC, ADR | | | 1,705,193 | | | | 105,312,720 | | |
| Metals & Mining Total | | | 105,312,720 | | |
| Materials Total | | | 479,981,068 | | |
| Telecommunication Services – 2.4% | |
| Wireless Telecommunication Services – 2.4% | |
American Tower Corp.,
Class A (a) | | | 1,551,432 | | | | 66,184,089 | | |
Crown Castle International
Corp. (a) | | | 618,024 | | | | 23,361,307 | | |
| Wireless Telecommunication Services Total | | | 89,545,396 | | |
| Telecommunication Services Total | | | 89,545,396 | | |
Total Common Stocks
(cost of $2,777,551,462) | | | 3,549,783,682 | | |
| Preferred Stock – 0.5% | |
| Financials – 0.5% | |
| Commercial Banks – 0.5% | |
Wells Fargo & Co.,
Series J, 8.000% | | | 687,425 | | | | 17,983,038 | | |
| Commercial Banks Total | | | 17,983,038 | | |
| Financials Total | | | 17,983,038 | | |
Total Preferred Stock
(cost of $13,207,874) | | | 17,983,038 | | |
| | | Par ($) | | Value ($) | |
| Short-Term Obligation – 3.9% | |
Repurchase agreement
with Fixed Income
Clearing Corp., dated
02/26/10, due 03/01/10
at 0.050%, collateralized
by U.S. Government
Agency obligations with
various maturities to
06/18/12, market value
$147 ,758,422 (repurchase
proceeds $144,855,604) | | | 144,855,000 | | | | 144,855,000 | | |
Total Short-Term Obligation
(cost of $144,855,000) | | | 144,855,000 | | |
Total Investments – 100.1%
(cost of $2,935,614,336) (b) | | | 3,712,621,720 | | |
| Other Assets & Liabilities, Net – (0.1)% | | | (4,970,775 | ) | |
| Net Assets – 100.0% | | | 3,707,650,945 | | |
Notes to Investment Portfolio:
(a) Non-income producing security.
(b) Cost for federal income tax purposes is $2,975,083,504.
The following table summarizes the inputs used, as of February 28, 2010, in valuing the Fund's assets:
| Description | | Quoted Prices
(Level 1) | | Other
Significant
Observable
Inputs
(Level 2) | | Significant
Unobservable
Inputs
(Level 3) | | Total | |
| Total Common Stocks | | $ | 3,549,783,682 | | | $ | — | | | $ | — | | | $ | 3,549,783,682 | | |
| Total Preferred Stock | | | 17,983,038 | | | | — | | | | — | | | | 17,983,038 | | |
Total Short-Term
Obligation | | | — | | | | 144,855,000 | | | | — | | | | 144,855,000 | | |
| Total Investments | | $ | 3,567,766,720 | | | $ | 144,855,000 | | | $ | — | | | $ | 3,712,621,720 | | |
For more information on valuation inputs, and their aggregation into the levels used in the table above, please refer to the Security Valuation section in the accompanying Notes to Financial Statements.
At February 28, 2010, the Fund held investments in the following sectors:
| Sector (Unaudited) | | % of
Net Assets | |
| Information Technology | | | 24.0 | | |
| Financials | | | 16.0 | | |
| Consumer Discretionary | | | 15.4 | | |
| Materials | | | 12.9 | | |
| Health Care | | | 10.5 | | |
| Industrials | | | 8.9 | | |
| Energy | | | 6.1 | | |
| Telecommunication Services | | | 2.4 | | |
| | | | 96.2 | | |
| Short-Term Obligation | | | 3.9 | | |
| Other Assets & Liabilities, Net | | | (0.1 | ) | |
| | | | 100.0 | | |
| Acronym | | Name | |
| ADR | | American Depositary Receipt | |
See Accompanying Notes to Financial Statements.
9
Statement of Assets and Liabilities – Columbia Marsico Growth Fund
February 28, 2010
| | | | | ($) | |
| Assets | | Investments, at identified cost | | | 2,935,614,336 | | |
| | | Investments, at value | | | 3,712,621,720 | | |
| | | Cash | | | 539 | | |
| | | Receivable for: | | | | | |
| | | Fund shares sold | | | 3,244,947 | | |
| | | Dividends | | | 5,205,775 | | |
| | | Interest | | | 603 | | |
| | | Prepaid expenses | | | 43,966 | | |
| | | Total Assets | | | 3,721,117,550 | | |
| Liabilities | | Payable for: | | | | | |
| | | Fund shares repurchased | | | 8,664,350 | | |
| | | Investment advisory fee | | | 1,799,522 | | |
| | | Administration fee | | | 609,805 | | |
| | | Pricing and bookkeeping fees | | | 12,282 | | |
| | | Transfer agent fee | | | 1,168,658 | | |
| | | Trustees' fees | | | 110,246 | | |
| | | Custody fee | | | 10,661 | | |
| | | Distribution and service fees | | | 648,381 | | |
| | | Chief compliance officer expenses | | | 365 | | |
| | | Other liabilities | | | 442,335 | | |
| | | Total Liabilities | | | 13,466,605 | | |
| | | Net Assets | | | 3,707,650,945 | | |
| Net Assets Consist of | | Paid-in capital | | | 4,208,915,533 | | |
| | | Undistributed net investment income | | | 42,623 | | |
| | | Accumulated net realized loss | | | (1,278,314,595 | ) | |
| | | Net unrealized appreciation on investments | | | 777,007,384 | | |
| | | Net Assets | | | 3,707,650,945 | | |
| Class A | | Net assets | | $ | 1,569,859,921 | | |
| | | Shares outstanding | | | 93,701,182 | | |
| | | Net asset value per share | | $ | 16.75 | (a) | |
| | | Maximum sales charge | | | 5.75 | % | |
| | | Maximum offering price per share | | $ | 17.77 | (b) | |
| Class B | | Net assets | | $ | 47,847,422 | | |
| | | Shares outstanding | | | 3,110,538 | | |
| | | Net asset value and offering price per share | | $ | 15.38 | (a) | |
| Class C | | Net assets | | $ | 399,082,362 | | |
| | | Shares outstanding | | | 25,910,390 | | |
| | | Net asset value and offering price per share | | $ | 15.40 | (a) | |
| Class R | | Net assets | | $ | 14,847,943 | | |
| | | Shares outstanding | | | 894,493 | | |
| | | Net asset value, offering and redemption price per share | | $ | 16.60 | | |
| Class Z | | Net assets | | $ | 1,676,013,297 | | |
| | | Shares outstanding | | | 98,468,938 | | |
| | | Net asset value, offering and redemption price per share | | $ | 17.02 | | |
(a) Redemption price per share is equal to net asset value less any applicable contingent deferred sales charge.
(b) On sales of $50,000 or more the offering price is reduced.
See Accompanying Notes to Financial Statements.
10
Statement of Operations – Columbia Marsico Growth Fund
For the Year Ended February 28, 2010
| | | | | ($) | |
| Investment Income | | Dividends | | | 56,775,871 | | |
| | | Interest | | | 188,083 | | |
| | | Foreign taxes withheld | | | (910,312 | ) | |
| | | Total Investment Income | | | 56,053,642 | | |
| Expenses | | Investment advisory fee | | | 23,646,080 | | |
| | | Administration fee | | | 8,032,650 | | |
| | | Distribution fee: | | | | | |
| | | Class B | | | 377,764 | | |
| | | Class C | | | 3,184,187 | | |
| | | Class R | | | 65,356 | | |
| | | Service fee: | | | | | |
| | | Class B | | | 125,921 | | |
| | | Class C | | | 1,061,396 | | |
| | | Distribution and service fees: | | | | | |
| | | Class A | | | 4,043,631 | | |
| | | Transfer agent fee | | | 5,403,494 | | |
| | | Pricing and bookkeeping fees | | | 143,813 | | |
| | | Trustees' fees | | | 59,707 | | |
| | | Custody fee | | | 37,242 | | |
| | | Chief compliance officer expenses | | | 2,065 | | |
| | | Other expenses | | | 1,092,087 | | |
| | | Expenses before interest expense | | | 47,275,393 | | |
| | | Interest expense | | | 4,454 | | |
| | | Total Expenses | | | 47,279,847 | | |
| | | Fees waived by transfer agent | | | (195,569 | ) | |
| | | Expense reductions | | | (56 | ) | |
| | | Net Expenses | | | 47,084,222 | | |
| | | Net Investment Income | | | 8,969,420 | | |
Net Realized and Unrealized
Gain (Loss) on Investments and
Foreign Currency | | Net realized gain (loss) on: | | | | | |
| | Investments | | | 178,901,538 | | |
| | Foreign currency transactions | | | (1,836 | ) | |
| | | Net realized gain | | | 178,899,702 | | |
| | | Net change in unrealized appreciation (depreciation) on: | | | | | |
| | | Investments | | | 1,246,696,486 | | |
| | | Foreign currency translations | | | 165 | | |
| | | Net change in unrealized appreciation (depreciation) | | | 1,246,696,651 | | |
| | | Net Gain | | | 1,425,596,353 | | |
| | | Net Increase Resulting from Operations | | | 1,434,565,773 | | |
See Accompanying Notes to Financial Statements.
11
Statement of Changes in Net Assets – Columbia Marsico Growth Fund
| Increase (Decrease) in Net Assets | | | | Year Ended
February 28,
2010 ($) | | Year Ended
February 28,
2009 ($) | |
| Operations | | Net investment income | | | 8,969,420 | | | | 18,308,135 | | |
| | | Net realized gain (loss) on investments and
foreign currency transactions | | | 178,899,702 | | | | (512,194,494 | ) | |
| | | Allocated from Master Portfolio on investments
and foreign currency transactions | | | — | | | | (757,509,096 | )(a) | |
| | | Net change in unrealized appreciation (depreciation)
on investments and foreign currency translations | | | 1,246,696,651 | | | | (228,610,768 | ) | |
| | | Allocated from Master Portfolio on investments | | | — | | | | (1,204,052,673 | )(a) | |
| | | Net increase (decrease) resulting from operations | | | 1,434,565,773 | | | | (2,684,058,896 | ) | |
| Distributions to Shareholders | | From net investment income: | | | | | | | | | |
| | | Class A | | | (9,183,116 | ) | | | (1,121,074 | ) | |
| | | Class B | | | (165,504 | ) | | | — | | |
| | | Class C | | | (1,414,974 | ) | | | — | | |
| | | Class R | | | (45,116 | ) | | | — | | |
| | | Class Z | | | (12,584,369 | ) | | | (10,691,108 | ) | |
| | | Total distributions to shareholders | | | (23,393,079 | ) | | | (11,812,182 | ) | |
| | | Net Capital Stock Transactions | | | (855,162,658 | ) | | | (533,595,368 | ) | |
| | | Increase from regulatory settlements | | | 47,849 | | | | — | | |
| | | Total increase (decrease) in net assets | | | 556,057,885 | | | | (3,229,466,446 | ) | |
| Net Assets | | Beginning of period | | | 3,151,593,060 | | | | 6,381,059,506 | | |
| | | End of period | | | 3,707,650,945 | | | | 3,151,593,060 | | |
| | | Undistributed net investment income at end of period | | | 42,623 | | | | 14,420,279 | | |
(a) Allocated from Master Portfolio for the period March 1, 2008 through November 9, 2008.
See Accompanying Notes to Financial Statements.
12
Statement of Changes in Net Assets (continued) – Columbia Marsico Growth Fund
| | | Capital Stock Activity | |
| | | Year Ended
February 28, 2010 | | Year Ended
February 28, 2009 | |
| | | Shares | | Dollars ($) | | Shares | | Dollars ($) | |
| Class A | |
| Subscriptions | | | 19,904,226 | | | | 284,838,934 | | | | 44,433,644 | | | | 737,416,581 | | |
| Distributions reinvested | | | 555,844 | | | | 8,087,394 | | | | 41,341 | | | | 850,804 | | |
| Redemptions | | | (49,221,870 | ) | | | (727,565,635 | ) | | | (71,244,738 | ) | | | (1,085,177,038 | ) | |
| Net decrease | | | (28,761,800 | ) | | | (434,639,307 | ) | | | (26,769,753 | ) | | | (346,909,653 | ) | |
| Class B | |
| Subscriptions | | | 110,169 | | | | 1,410,963 | | | | 346,662 | | | | 5,152,434 | | |
| Distributions reinvested | | | 7,721 | | | | 98,133 | | | | — | | | | — | | |
| Redemptions | | | (1,267,043 | ) | | | (17,214,886 | ) | | | (2,368,905 | ) | | | (37,708,743 | ) | |
| Net decrease | | | (1,149,153 | ) | | | (15,705,790 | ) | | | (2,022,243 | ) | | | (32,556,309 | ) | |
| Class C | |
| Subscriptions | | | 1,673,393 | | | | 22,559,211 | | | | 5,250,529 | | | | 81,358,143 | | |
| Distributions reinvested | | | 46,697 | | | | 594,444 | | | | — | | | | — | | |
| Redemptions | | | (12,599,011 | ) | | | (170,768,424 | ) | | | (15,710,796 | ) | | | (234,848,981 | ) | |
| Net decrease | | | (10,878,921 | ) | | | (147,614,769 | ) | | | (10,460,267 | ) | | | (153,490,838 | ) | |
| Class R | |
| Subscriptions | | | 340,705 | | | | 5,053,932 | | | | 477,406 | | | | 8,309,058 | | |
| Distributions reinvested | | | 2,928 | | | | 40,021 | | | | — | | | | — | | |
| Redemptions | | | (336,780 | ) | | | (4,977,250 | ) | | | (178,853 | ) | | | (2,803,300 | ) | |
| Net increase | | | 6,853 | | | | 116,703 | | | | 298,553 | | | | 5,505,758 | | |
| Class Z | |
| Subscriptions | | | 27,111,329 | | | | 411,640,488 | | | | 44,726,222 | | | | 685,650,148 | | |
| Distributions reinvested | | | 481,886 | | | | 7,396,682 | | | | 314,478 | | | | 5,402,432 | | |
| Redemptions | | | (45,044,453 | ) | | | (676,356,665 | ) | | | (42,322,825 | ) | | | (697,196,906 | ) | |
| Net increase (decrease) | | | (17,451,238 | ) | | | (257,319,495 | ) | | | 2,717,875 | | | | (6,144,326 | ) | |
See Accompanying Notes to Financial Statements.
13
Financial Highlights – Columbia Marsico Growth Fund
Selected data for a share outstanding throughout each period is as follows:
| | | Year Ended February 28, | | Period Ended
February 29, | | Year Ended March 31, | |
| Class A Shares | | 2010 | | 2009 (a)(b) | | 2008 (a)(c) | | 2007 (a) | | 2006 (a)(d) | | 2005 (a) | |
| Net Asset Value, Beginning of Period | | $ | 11.30 | | | $ | 20.26 | | | $ | 20.22 | | | $ | 19.53 | | | $ | 17.04 | | | $ | 15.80 | | |
| Income from Investment Operations: | |
| Net investment income (loss) (e) | | | 0.03 | | | | 0.06 | | | | 0.06 | | | | — | (f) | | | (0.03 | ) | | | (0.03 | ) | |
Net realized and unrealized gain (loss)
on investments and foreign currency | | | 5.50 | | | | (9.01 | ) | | | (0.01 | ) | | | 0.69 | | | | 2.52 | | | | 1.27 | | |
| Total from investment operations | | | 5.53 | | | | (8.95 | ) | | | 0.05 | | | | 0.69 | | | | 2.49 | | | | 1.24 | | |
| Less Distributions to Shareholders: | |
| From net investment income | | | (0.08 | ) | | | (0.01 | ) | | | (0.01 | ) | | | — | | | | — | | | | — | | |
| Increase from regulatory settlements | | | — | (f) | | | — | | | | — | | | | — | | | | — | | | | — | | |
| Net Asset Value, End of Period | | $ | 16.75 | | | $ | 11.30 | | | $ | 20.26 | | | $ | 20.22 | | | $ | 19.53 | | | $ | 17.04 | | |
| Total return (g)(h) | | | 49.09 | % | | | (44.21 | )% | | | 0.24 | %(i) | | | 3.53 | % | | | 14.61 | % | | | 7.85 | % | |
Ratios to Average Net Assets/
Supplemental Data: | |
| Net expenses before interest expense | | | 1.28 | %(j) | | | 1.24 | %(j) | | | 1.20 | %(j)(k) | | | 1.22 | %(j) | | | 1.21 | % | | | 1.30 | % | |
| Interest expense | | | — | %(l) | | | — | | | | — | | | | — | | | | — | | | | — | | |
| Net expenses | | | 1.28 | %(j) | | | 1.24 | %(j) | | | 1.20 | %(j)(k) | | | 1.22 | %(j) | | | 1.21 | % | | | 1.30 | % | |
| Waiver/Reimbursement | | | — | %(l) | | | 0.02 | % | | | 0.01 | %(k) | | | 0.01 | % | | | 0.06 | %(m) | | | 0.03 | %(m) | |
| Net investment income (loss) | | | 0.23 | %(j) | | | 0.36 | %(j) | | | 0.29 | %(j)(k) | | | 0.01 | %(j) | | | (0.15 | )% | | | (0.21 | )% | |
| Portfolio turnover rate | | | 69 | % | | | 21 | %(i)(n) | | | — | | | | — | | | | — | | | | — | | |
Turnover of Columbia Marsico
Growth Master Portfolio | | | — | | | | 54 | %(i) | | | 58 | %(i) | | | 42 | % | | | 62 | % | | | 62 | % | |
| Net assets, end of period (000s) | | $ | 1,569,860 | | | $ | 1,383,438 | | | $ | 3,024,016 | | | $ | 2,864,153 | | | $ | 1,956,822 | | | $ | 988,948 | | |
(a) The per share amounts and percentages reflect income and expenses assuming inclusion of the Fund's proportionate share of the income and expenses of Columbia Marsico Growth Master Portfolio.
(b) Effective November 10, 2008, the Fund converted to a stand-alone fund. Prior to November 10, 2008, the Fund operated in a master-feeder structure.
(c) The Fund changed its fiscal year end from March 31 to February 29. Per share data and total return reflect activity from April 1, 2007 through February 29, 2008.
(d) On August 22, 2005, the Fund's Investor A shares were renamed Class A shares.
(e) Per share data was calculated using the average shares outstanding during the period.
(f) Rounds to less than $0.01 per share.
(g) Total return at net asset value assuming all distributions reinvested and no initial sales charge or contingent deferred sales charge.
(h) Had the investment advisor and/or any of its affiliates not waived fees or reimbursed a portion of expenses, total return would have been reduced.
(i) Not annualized.
(j) The benefits derived from expense reductions had an impact of less than 0.01%.
(k) Annualized.
(l) Rounds to less than 0.01%.
(m) Bank of America Corporation assumed certain non-recurring costs. Absent these non-recurring costs, the waiver/reimbursement ratio would have been -% and -% for the years ended March 31, 2006 and March 31, 2005, respectively.
(n) Amount represents results after the Fund's conversion to a stand-alone structure on November 10, 2008.
See Accompanying Notes to Financial Statements.
14
Financial Highlights – Columbia Marsico Growth Fund
Selected data for a share outstanding throughout each period is as follows:
| | | Year Ended February 28, | | Period Ended
February 29, | | Year Ended March 31, | |
| Class B Shares | | 2010 | | 2009 (a)(b) | | 2008 (a)(c) | | 2007 (a) | | 2006 (a)(d) | | 2005 (a) | |
| Net Asset Value, Beginning of Period | | $ | 10.42 | | | $ | 18.83 | | | $ | 18.92 | | | $ | 18.40 | | | $ | 16.18 | | | $ | 15.12 | | |
| Income from Investment Operations: | |
| Net investment loss (e) | | | (0.07 | ) | | | (0.06 | ) | | | (0.09 | ) | | | (0.13 | ) | | | (0.15 | ) | | | (0.15 | ) | |
Net realized and unrealized gain (loss)
on investments and foreign currency | | | 5.07 | | | | (8.35 | ) | | | — | (f) | | | 0.65 | | | | 2.37 | | | | 1.21 | | |
| Total from investment operations | | | 5.00 | | | | (8.41 | ) | | | (0.09 | ) | | | 0.52 | | | | 2.22 | | | | 1.06 | | |
| Less Distributions to Shareholders: | |
| From net investment income | | | (0.04 | ) | | | — | | | | — | | | | — | | | | — | | | | — | | |
| Increase from regulatory settlements | | | — | (f) | | | — | | | | — | | | | — | | | | — | | | | — | | |
| Net Asset Value, End of Period | | $ | 15.38 | | | $ | 10.42 | | | $ | 18.83 | | | $ | 18.92 | | | $ | 18.40 | | | $ | 16.18 | | |
| Total return (g)(h) | | | 48.10 | % | | | (44.66 | )% | | | (0.48 | )%(i) | | | 2.83 | % | | | 13.72 | % | | | 7.01 | % | |
Ratios to Average Net Assets/
Supplemental Data: | |
| Net expenses before interest expense | | | 2.03 | %(j) | | | 1.99 | %(j) | | | 1.95 | %(j)(k) | | | 1.97 | %(j) | | | 1.96 | % | | | 2.05 | % | |
| Interest expense | | | — | %(l) | | | — | | | | — | | | | — | | | | — | | | | — | | |
| Net expenses | | | 2.03 | %(j) | | | 1.99 | %(j) | | | 1.95 | %(j)(k) | | | 1.97 | %(j) | | | 1.96 | % | | | 2.05 | % | |
| Waiver/Reimbursement | | | — | %(l) | | | 0.02 | % | | | 0.01 | %(k) | | | 0.01 | % | | | 0.06 | %(m) | | | 0.03 | %(m) | |
| Net investment loss | | | (0.52 | )%(j) | | | (0.39 | )%(j) | | | (0.46 | )%(j)(k) | | | (0.71 | )%(j) | | | (0.85 | )% | | | (0.96 | )% | |
| Portfolio turnover rate | | | 69 | % | | | 21 | %(i)(n) | | | — | | | | — | | | | — | | | | — | | |
Turnover of Columbia Marsico
Growth Master Portfolio | | | — | | | | 54 | %(i) | | | 58 | %(i) | | | 42 | % | | | 62 | % | | | 62 | % | |
| Net assets, end of period (000s) | | $ | 47,847 | | | $ | 44,407 | | | $ | 118,307 | | | $ | 156,923 | | | $ | 198,749 | | | $ | 194,668 | | |
(a) The per share amounts and percentages reflect income and expenses assuming inclusion of the Fund's proportionate share of the income and expenses of Columbia Marsico Growth Master Portfolio.
(b) Effective November 10, 2008, the Fund converted to a stand-alone fund. Prior to November 10, 2008, the Fund operated in a master-feeder structure.
(c) The Fund changed its fiscal year end from March 31 to February 29. Per share data and total return reflect activity from April 1, 2007 through February 29, 2008.
(d) On August 22, 2005, the Fund's Investor B shares were renamed Class B shares.
(e) Per share data was calculated using the average shares outstanding during the period.
(f) Rounds to less than $0.01 per share.
(g) Total return at net asset value assuming all distributions reinvested and no contingent deferred sales charge.
(h) Had the investment advisor and/or any of its affiliates not waived fees or reimbursed a portion of expenses, total return would have been reduced.
(i) Not annualized.
(j) The benefits derived from expense reductions had an impact of less than 0.01%.
(k) Annualized.
(l) Rounds to less than 0.01%.
(m) Bank of America Corporation assumed certain non-recurring costs. Absent these non-recurring costs, the waiver/reimbursement ratio would have been -% and -% for the years ended March 31, 2006 and March 31, 2005, respectively.
(n) Amount represents results after the Fund's conversion to a stand-alone structure on November 10, 2008.
See Accompanying Notes to Financial Statements.
15
Financial Highlights – Columbia Marsico Growth Fund
Selected data for a share outstanding throughout each period is as follows:
| | | Year Ended February 28, | | Period Ended
February 29, | | Year Ended March 31, | |
| Class C Shares | | 2010 | | 2009 (a)(b) | | 2008 (a)(c) | | 2007 (a) | | 2006 (a)(d) | | 2005 (a) | |
| Net Asset Value, Beginning of Period | | $ | 10.44 | | | $ | 18.86 | | | $ | 18.94 | | | $ | 18.43 | | | $ | 16.20 | | | $ | 15.14 | | |
| Income from Investment Operations: | |
| Net investment loss (e) | | | (0.07 | ) | | | (0.06 | ) | | | (0.08 | ) | | | (0.13 | ) | | | (0.15 | ) | | | (0.15 | ) | |
Net realized and unrealized gain (loss)
on investments and foreign currency | | | 5.07 | | | | (8.36 | ) | | | — | (f) | | | 0.64 | | | | 2.38 | | | | 1.21 | | |
| Total from investment operations | | | 5.00 | | | | (8.42 | ) | | | (0.08 | ) | | | 0.51 | | | | 2.23 | | | | 1.06 | | |
| Less Distributions to Shareholders: | |
| From net investment income | | | (0.04 | ) | | | — | | | | — | | | | — | | | | — | | | | — | | |
| Increase from regulatory settlements | | | — | (f) | | | — | | | | — | | | | — | | | | — | | | | — | | |
| Net Asset Value, End of Period | | $ | 15.40 | | | $ | 10.44 | | | $ | 18.86 | | | $ | 18.94 | | | $ | 18.43 | | | $ | 16.20 | | |
| Total return (g)(h) | | | 48.00 | % | | | (44.64 | )% | | | (0.42 | )%(i) | | | 2.77 | % | | | 13.77 | % | | | 7.00 | % | |
Ratios to Average Net Assets/
Supplemental Data: | |
| Net expenses before interest expense | | | 2.03 | %(j) | | | 1.99 | %(j) | | | 1.95 | %(j)(k) | | | 1.97 | %(j) | | | 1.96 | % | | | 2.05 | % | |
| Interest expense | | | — | %(l) | | | — | | | | — | | | | — | | | | — | | | | — | | |
| Net expenses | | | 2.03 | %(j) | | | 1.99 | %(j) | | | 1.95 | %(j)(k) | | | 1.97 | %(j) | | | 1.96 | % | | | 2.05 | % | |
| Waiver/Reimbursement | | | — | %(l) | | | 0.02 | % | | | 0.01 | %(k) | | | 0.01 | % | | | 0.06 | %(m) | | | 0.03 | %(m) | |
| Net investment loss | | | (0.52 | )%(j) | | | (0.39 | )%(j) | | | (0.46 | )%(j)(k) | | | (0.74 | )%(j) | | | (0.89 | )% | | | (0.96 | )% | |
| Portfolio turnover rate | | | 69 | % | | | 21 | %(i)(n) | | | — | | | | — | | | | — | | | | — | | |
Turnover of Columbia Marsico
Growth Master Portfolio | | | — | | | | 54 | %(i) | | | 58 | %(i) | | | 42 | % | | | 62 | % | | | 62 | % | |
| Net assets, end of period (000s) | | $ | 399,082 | | | $ | 384,025 | | | $ | 891,076 | | | $ | 832,852 | | | $ | 679,735 | | | $ | 352,016 | | |
(a) The per share amounts and percentages reflect income and expenses assuming inclusion of the Fund's proportionate share of the income and expenses of Columbia Marsico Growth Master Portfolio.
(b) Effective November 10, 2008, the Fund converted to a stand-alone fund. Prior to November 10, 2008, the Fund operated in a master-feeder structure.
(c) The Fund changed its fiscal year end from March 31 to February 29. Per share data and total return reflect activity from April 1, 2007 through February 29, 2008.
(d) On August 22, 2005, the Fund's Investor C shares were renamed Class C shares.
(e) Per share data was calculated using the average shares outstanding during the period.
(f) Rounds to less than $0.01 per share.
(g) Total return at net asset value assuming all distributions reinvested and no contingent deferred sales charge.
(h) Had the investment advisor and/or any of its affiliates not waived fees or reimbursed a portion of expenses, total return would have been reduced.
(i) Not annualized.
(j) The benefits derived from expense reductions had an impact of less than 0.01%.
(k) Annualized.
(l) Rounds to less than 0.01%.
(m) Bank of America Corporation assumed certain non-recurring costs. Absent these non-recurring costs, the waiver/reimbursement ratio would have been -% and -% for the years ended March 31, 2006 and March 31, 2005, respectively.
(n) Amount represents results after the Fund's conversion to a stand-alone structure on November 10, 2008.
See Accompanying Notes to Financial Statements.
16
Financial Highlights – Columbia Marsico Growth Fund
Selected data for a share outstanding throughout each period is as follows:
| | | Year Ended February 28, | | Period Ended
February 29, | | Year Ended
March 31, | | Period Ended
March 31, | |
| Class R Shares | | 2010 | | 2009 (a)(b) | | 2008 (a)(c) | | 2007 (a) | | 2006 (a)(d) | |
| Net Asset Value, Beginning of Period | | $ | 11.20 | | | $ | 20.13 | | | $ | 20.14 | | | $ | 19.49 | | | $ | 18.89 | | |
| Income from Investment Operations: | |
| Net investment income (loss) (e) | | | — | (f) | | | 0.02 | | | | 0.01 | | | | (0.08 | ) | | | (0.01 | ) | |
Net realized and unrealized gain (loss)
on investments and foreign currency | | | 5.45 | | | | (8.95 | ) | | | (0.02 | ) | | | 0.73 | | | | 0.61 | | |
| Total from investment operations | | | 5.45 | | | | (8.93 | ) | | | (0.01 | ) | | | 0.65 | | | | 0.60 | | |
| Less Distributions to Shareholders: | |
| From net investment income | | | (0.05 | ) | | | — | | | | — | | | | — | | | | — | | |
| Increase from regulatory settlements | | | — | (f) | | | — | | | | — | | | | — | | | | — | | |
| Net Asset Value, End of Period | | $ | 16.60 | | | $ | 11.20 | | | $ | 20.13 | | | $ | 20.14 | | | $ | 19.49 | | |
| Total return (g)(h) | | | 48.79 | % | | | (44.36 | )% | | | (0.05 | )%(i) | | | 3.34 | % | | | 3.18 | %(i) | |
Ratios to Average Net Assets/
Supplemental Data: | |
| Net expenses before interest expense | | | 1.53 | %(j) | | | 1.49 | %(j) | | | 1.45 | %(j)(k) | | | 1.47 | %(j) | | | 1.54 | %(k) | |
| Interest expense | | | — | %(l) | | | — | | | | — | | | | — | | | | — | | |
| Net expenses | | | 1.53 | %(j) | | | 1.49 | %(j) | | | 1.45 | %(j)(k) | | | 1.47 | %(j) | | | 1.54 | %(k) | |
| Waiver/Reimbursement | | | — | %(l) | | | 0.02 | % | | | 0.01 | %(k) | | | 0.01 | % | | | 0.07 | %(k)(m) | |
| Net investment income (loss) | | | (0.02 | )%(j) | | | 0.15 | %(j) | | | 0.06 | %(j)(k) | | | (0.42 | )%(j) | | | (0.35 | )%(k) | |
| Portfolio turnover rate | | | 69 | % | | | 21 | %(i)(n) | | | — | | | | — | | | | — | | |
Turnover of Columbia Marsico
Growth Master Portfolio | | | — | | | | 54 | %(i) | | | 58 | %(i) | | | 42 | % | | | 62 | %(i) | |
| Net assets, end of period (000s) | | $ | 14,848 | | | $ | 9,941 | | | $ | 11,860 | | | $ | 3,669 | | | $ | 10 | | |
(a) The per share amounts and percentages reflect income and expenses assuming inclusion of the Fund's proportionate share of the income and expenses of Columbia Marsico Growth Master Portfolio.
(b) Effective November 10, 2008, the Fund converted to a stand-alone fund. Prior to November 10, 2008, the Fund operated in a master-feeder structure.
(c) The Fund changed its fiscal year end from March 31 to February 29. Per share data and total return reflect activity from April 1, 2007 through February 29, 2008.
(d) Class R shares commenced operations on January 23, 2006.
(e) Per share data was calculated using the average shares outstanding during the period.
(f) Rounds to less than $0.01 per share.
(g) Total return at net asset value assuming all distributions reinvested.
(h) Had the investment advisor and/or any of its affiliates not waived fees or reimbursed a portion of expenses, total return would have been reduced.
(i) Not annualized.
(j) The benefits derived from expense reductions had an impact of less than 0.01%.
(k) Annualized.
(l) Rounds to less than 0.01%.
(m) Bank of America Corporation assumed certain non-recurring costs. Absent these non-recurring costs, the waiver/reimbursement ratio would have been 0.01% for the period ended March 31, 2006.
(n) Amount represents results after the Fund's conversion to a stand-alone structure on November 10, 2008.
See Accompanying Notes to Financial Statements.
17
Financial Highlights – Columbia Marsico Growth Fund
Selected data for a share outstanding throughout each period is as follows:
| | | Year Ended February 28, | | Period Ended
February 29, | | Year Ended March 31, | |
| Class Z Shares | | 2010 | | 2009 (a)(b) | | 2008 (a)(c) | | 2007 (a) | | 2006 (a)(d) | | 2005 (a) | |
| Net Asset Value, Beginning of Period | | $ | 11.47 | | | $ | 20.63 | | | $ | 20.58 | | | $ | 19.82 | | | $ | 17.25 | | | $ | 15.96 | | |
| Income from Investment Operations: | |
| Net investment income (e) | | | 0.07 | | | | 0.11 | | | | 0.11 | | | | 0.05 | | | | 0.02 | | | | 0.01 | | |
Net realized and unrealized gain (loss)
on investments and foreign currency | | | 5.60 | | | | (9.17 | ) | | | (0.01 | ) | | | 0.71 | | | | 2.55 | | | | 1.28 | | |
| Total from investment operations | | | 5.67 | | | | (9.06 | ) | | | 0.10 | | | | 0.76 | | | | 2.57 | | | | 1.29 | | |
| Less Distributions to Shareholders: | |
| From net investment income | | | (0.12 | ) | | | (0.10 | ) | | | (0.05 | ) | | | — | | | | — | | | | — | | |
| Increase from regulatory settlements | | | — | (f) | | | — | | | | — | | | | — | | | | — | | | | — | | |
| Net Asset Value, End of Period | | $ | 17.02 | | | $ | 11.47 | | | $ | 20.63 | | | $ | 20.58 | | | $ | 19.82 | | | $ | 17.25 | | |
| Total return (g)(h) | | | 49.55 | % | | | (44.09 | )% | | | 0.46 | %(i) | | | 3.83 | % | | | 14.90 | % | | | 8.08 | % | |
Ratios to Average Net Assets/
Supplemental Data: | |
| Net expenses before interest expense | | | 1.03 | %(j) | | | 0.99 | %(j) | | | 0.95 | %(j)(k) | | | 0.97 | %(j) | | | 0.96 | % | | | 1.05 | % | |
| Interest expense | | | — | %(l) | | | — | | | | — | | | | — | | | | — | | | | — | | |
| Net expenses | | | 1.03 | %(j) | | | 0.99 | %(j) | | | 0.95 | %(j)(k) | | | 0.97 | %(j) | | | 0.96 | % | | | 1.05 | % | |
| Waiver/Reimbursement | | | — | %(l) | | | 0.02 | % | | | 0.01 | %(k) | | | 0.01 | % | | | 0.06 | %(m) | | | 0.03 | %(m) | |
| Net investment income | | | 0.48 | %(j) | | | 0.63 | %(j) | | | 0.54 | %(j)(k) | | | 0.25 | %(j) | | | 0.11 | % | | | 0.04 | % | |
| Portfolio turnover rate | | | 69 | % | | | 21 | %(i)(n) | | | — | | | | — | | | | — | | | | — | | |
Turnover of Columbia Marsico
Growth Master Portfolio | | | — | | | | 54 | %(i) | | | 58 | %(i) | | | 42 | % | | | 62 | % | | | 62 | % | |
| Net assets, end of period (000s) | | $ | 1,676,013 | | | $ | 1,329,782 | | | $ | 2,335,800 | | | $ | 2,044,397 | | | $ | 1,446,667 | | | $ | 774,996 | | |
(a) The per share amounts and percentages reflect income and expenses assuming inclusion of the Fund's proportionate share of the income and expenses of Columbia Marsico Growth Master Portfolio.
(b) Effective November 10, 2008, the Fund converted to a stand-alone fund. Prior to November 10, 2008, the Fund operated in a master-feeder structure.
(c) The Fund changed its fiscal year end from March 31 to February 29. Per share data and total return reflect activity from April 1, 2007 through February 29, 2008.
(d) On August 22, 2005, the Fund's Primary A shares were renamed Class Z shares.
(e) Per share data was calculated using the average shares outstanding during the period.
(f) Rounds to less than $0.01 per share.
(g) Total return at net asset value assuming all distributions reinvested.
(h) Had the investment advisor and/or any of its affiliates not waived fees or reimbursed a portion of expenses, total return would have been reduced.
(i) Not annualized.
(j) The benefits derived from expense reductions had an impact of less than 0.01%.
(k) Annualized.
(l) Rounds to less than 0.01%.
(m) Bank of America Corporation assumed certain non-recurring costs. Absent these non-recurring costs, the waiver/reimbursement ratio would have been -% and -% for the years ended March 31, 2006, March 31, 2005, respectively.
(n) Amount represents results after the Fund's conversion to a stand-alone structure on November 10, 2008.
See Accompanying Notes to Financial Statements.
18
Notes to Financial Statements – Columbia Marsico Growth Fund
February 28, 2010
Note 1. Organization
Columbia Marsico Growth Fund (the "Fund"), a series of Columbia Funds Series Trust (the "Trust"), is a diversified fund. The Trust is registered under the Investment Company Act of 1940, as amended (the "1940 Act"), as an open-end management investment company organized as a Delaware statutory trust.
Investment Objective
The Fund seeks long-term growth of capital.
Fund Shares
The Trust may issue an unlimited number of shares, and the Fund offers five classes of shares: Class A, Class B, Class C, Class R and Class Z shares. Each share class has its own expense structure and sales charges, as applicable. Effective June 22, 2009, the Fund no longer accepts investments from new or existing investors in the Fund's Class B shares, except in connection with the reinvestment of any dividend and/or capital gain distributions in Class B shares of the Fund and exchanges by existing Class B shareholders of the other Columbia Funds.
Class A shares are subject to a maximum front-end sales charge of 5.75% based on the amount of initial investment. Class A shares purchased without an initial sales charge in accounts aggregating $1 million to $50 million at the time of purchase are subject to a 1.00% contingent deferred sales charge ("CDSC") if the shares are sold within one year after purchase. Class B shares are subject to a maximum CDSC of 5.00% based upon the holding period after purchase. Class B shares will convert to Class A shares eight years after purchase. Class C shares are subject to a 1.00% CDSC on shares sold within one year after purchase. Class R and Class Z shares are offered continuously at net asset value. There are certain restrictions on the purchase of Class R and Class Z shares, as described in the Fund's prospectuses.
Note 2. Significant Accounting Policies
The preparation of financial statements in accordance with accounting principles generally accepted in the United States of America ("GAAP") requires management to make certain estimates and assumptions that affect the reported amounts of assets and liabilities, the disclosure of contingent assets and liabilities at the date of the financial statements and the reported amounts of revenue and expenses during the reporting period. Actual results could differ from those estimates.
The following is a summary of significant accounting policies consistently followed by the Fund in the preparation of its financial statements.
Security Valuation
Equity securities are valued at the last sale price on the principal exchange on which they trade, except for securities traded on the NASDAQ, which are valued at the NASDAQ official close price. Unlisted securities or listed securities for which there were no sales during the day are valued at the closing bid price on such exchanges or over-the-counter markets.
Short-term investments maturing in 60 days or less are valued at amortized cost, which approximates market value.
Foreign securities are generally valued at the last sale price on the foreign exchange or market on which they trade. If any foreign share prices are not readily available as a result of limited share activity, the securities are valued at the last sale price of the local shares in the principal market in which such securities are normally traded.
Generally, trading in foreign securities is substantially completed each day at various times prior to the close of the New York Stock Exchange ("NYSE"). The values of such securities used in computing the net asset value of the Fund's shares are determined as of such times. Foreign currency exchange rates are generally determined at 4:00 p.m. Eastern (U.S.) time. Occasionally, events affecting the values of such foreign securities may occur between the times at which they are determined and the close of the customary trading session of the NYSE, which would not be reflected in the computation of the Fund's net asset value. If events materially affecting the values of such foreign securities occur and it is determined that market quotations are not reliable, then these foreign securities will be valued at their fair value using procedures approved by the Board of Trustees.
Investments for which market quotations are not readily available, or that have quotations which management believes are not reliable, are valued at fair value as determined in good faith under consistently applied procedures established by and under the general supervision of the Board of Trustees. If a
19
Columbia Marsico Growth Fund, February 28, 2010
security is valued at fair value, such value is likely to be different from the last quoted market price for the security. The determination of fair value often requires significant judgment. To determine fair value, management may use assumptions including but not limited to future cash flows and estimated risk premiums. Multiple inputs from various sources may be used to determine value.
GAAP establishes a hierarchy that prioritizes the inputs to valuation techniques used to measure fair value giving the highest priority to unadjusted quoted prices in active markets for identical securities (level 1 measurements) and the lowest priority to unobservable inputs (level 3 measurements) when market prices are not readily available or reliable. The three levels of the fair value hierarchy are described below:
• Level 1 – quoted prices in active markets for identical securities
• Level 2 – prices determined using other significant observable inputs (including quoted prices for similar securities, interest rates, prepayment speeds, credit risk and others)
• Level 3 – prices determined using significant unobservable inputs. In situations where quoted prices or observable inputs are unavailable or less reliable, unobservable inputs may be used. Unobservable inputs may include management's own assumptions about the factors market participants would use in pricing an investment.
The inputs or methodology used for valuing securities are not necessarily an indication of the risk associated with investing in those securities.
Security Transactions
Security transactions are accounted for on the trade date. Cost is determined and gains (losses) are based upon the specific identification method for both financial statement and federal income tax purposes.
Repurchase Agreements
The Fund may engage in repurchase agreement transactions with institutions that Columbia Management Advisors, LLC ("Columbia"), the Fund's investment advisor, has determined are creditworthy. The Fund, through its custodian, receives delivery of the underlying securities collateralizing a repurchase agreement. Columbia is responsible for determining that the collateral is at least equal, at all times, to the value of the repurchase obligation including interest. A repurchase agreement transaction involves certain risks in the event of default or insolvency of the counterparty. These risks include possible delays in or restrictions on the Fund's ability to dispose of the underlying securities and a possible decline in the value of the underlying securities during the period while the Fund seeks to assert its rights.
Foreign Currency Transactions and Translations
The values of all assets and liabilities quoted in foreign currencies are translated into U.S. dollars at that day's exchange rates. Net realized and unrealized gains (losses) on foreign currency transactions and translations include gains (losses) arising from the fluctuation in exchange rates between trade and settlement dates on securities transactions, gains (losses) arising from the disposition of foreign currency and currency gains (losses) between the accrual and payment dates on dividends, interest income and foreign withholding taxes.
For financial statement purposes, the Fund does not distinguish that portion of gains (losses) on investments which is due to changes in foreign exchange rates from that which is due to changes in market prices of the investments. Such fluctuations are included with the net realized and unrealized gains (losses) on investments on the Statement of Operations.
Income Recognition
Interest income is recorded on the accrual basis.
Corporate actions and dividend income are recorded on the ex-date except for certain foreign securities which are recorded as soon after the ex-date as the Fund becomes aware of such, net of any non-reclaimable tax withholdings.
Expenses
General expenses of the Trust are allocated to the Fund and other series of the Trust based upon relative net assets or other expense allocation methodologies determined by the nature of the expense. Expenses directly attributable to the Fund are charged to the Fund.
20
Columbia Marsico Growth Fund, February 28, 2010
Determination of Class Net Asset Value
All income, expenses (other than class-specific expenses, as shown on the Statement of Operations) and realized and unrealized gains (losses) are allocated to each class of the Fund on a daily basis for purposes of determining the net asset value of each class. Income and expenses are allocated to each class based on the settled shares method, while realized and unrealized gains (losses) are allocated based on the relative net assets of each class.
Federal Income Tax Status
The Fund intends to qualify each year as a "regulated investment company" under Subchapter M of the Internal Revenue Code, as amended, and will distribute substantially all of its taxable income, if any, for its tax year, and as such will not be subject to federal income taxes. In addition, the Fund intends to distribute in each calendar year substantially all of its net investment income, capital gains and certain other amounts, if any, such that the Fund should not be subject to federal excise tax. Therefore, no provision is made for federal income or excise taxes.
Distributions to Shareholders
Distributions from net investment income, if any, are declared and paid semi-annually. The Fund may, however, declare and pay distributions from net investment income more frequently. The Fund will declare and distribute net realized capital gains (including net short-term capital gains) at least annually after the fiscal year in which the capital gains were earned, unless offset by any available capital loss carryforward. Income distributions and capital gain distributions are determined in accordance with federal income tax regulations which may differ from GAAP.
Indemnification
In the normal course of business, the Fund enters into contracts that contain a variety of representations and warranties and which provide general indemnities. The Fund's maximum exposure under these arrangements is unknown because this would involve future claims against the Fund. Also, under the Trust's organizational documents and by contract, the Trustees and officers of the Trust are indemnified against certain liabilities that may arise out of actions relating to their duties to the Trust. However, based on experience, the Fund expects the risk of loss due to these representations, warranties and indemnities to be minimal.
Note 3. Federal Tax Information
The timing and character of income and capital gain distributions are determined in accordance with income tax regulations, which may differ from GAAP. Reclassifications are made to the Fund's capital accounts for permanent tax differences to reflect income and gains available for distribution (or available capital loss carryforwards) under income tax regulations.
For the year ended February 28, 2010, permanent book and tax basis differences resulting primarily from differing treatments for foreign currency transactions, expired capital loss carryforwards, partnership adjustments and proceeds received from litigation settlements were identified and reclassified among the components of the Fund's net assets as follows:
Undistributed
Net Investment
Income | | Accumulated
Net Realized
Loss | | Paid-In Capital | |
| $ | 46,003 | | | $ | 18,816,627 | | | $ | (18,862,630 | ) | |
Net investment income and net realized gains (losses), as disclosed on the Statement of Operations, and net assets were not affected by this reclassification.
The tax character of distributions paid during the years ended February 28, 2010 and February 28, 2009 was as follows:
| | | February 28, | |
| Distributions paid from: | | 2010 | | 2009 | |
| Ordinary Income* | | $ | 23,393,079 | | | $ | 11,812,182 | | |
| Long-Term Capital Gains | | | — | | | | — | | |
* For tax purposes short-term capital gain distributions, if any, are considered ordinary income distributions.
21
Columbia Marsico Growth Fund, February 28, 2010
As of February 28, 2010, the components of distributable earnings on a tax basis were as follows:
Undistributed
Ordinary
Income | | Undistributed
Long-Term
Capital Gains | | Net Unrealized
Appreciation* | |
| $ | 42,624 | | | $ | — | | | $ | 737,538,216 | | |
* The differences between book-basis and tax-basis net unrealized appreciation are primarily due to deferral of losses from wash sales.
Unrealized appreciation and depreciation at February 28, 2010, based on cost of investments for federal income tax purposes were:
| Unrealized appreciation | | $ | 758,760,538 | | |
| Unrealized depreciation | | | (21,222,322 | ) | |
| Net unrealized appreciation | | $ | 737,538,216 | | |
The following capital loss carryforwards may be available to reduce taxable income arising from future net realized gains on investments, if any, to the extent permitted by the Internal Revenue Code:
| Year of Expiration | | | Capital Loss
Carryforwards | | |
| 2011 | | $ | 38,422,781 | | |
| 2013 | | | 30,480,049 | | |
| 2017 | | | 847,030,869 | | |
| 2018 | | | 322,911,728 | | |
| | | $ | 1,238,845,427 | | |
Capital loss carryforwards of $11,995,864 expired during the year ended February 28, 2010. Expired capital loss carryforwards are recorded as a reduction of paid-in capital.
Management is required to determine whether a tax position of the Fund is more likely than not to be sustained upon examination by the applicable taxing authority, including resolution of any related appeals or litigation processes, based on the technical merits of the position. The tax benefit to be recognized by the Fund is measured as the largest amount of benefit that is greater than fifty percent likely of being realized upon ultimate settlement. Management is not aware of any tax positions for which it is reasonably possible that the total amounts of unrecognized tax benefits will significantly change in the next twelve months. However, management's conclusions may be subject to review and adjustment at a later date based on factors including, but not limited to, new tax laws, regulations, and administrative interpretations (including relevant court decisions). The Fund's federal tax returns for the prior three fiscal year s remain subject to examination by the Internal Revenue Service.
Note 4. Fees and Compensation Paid to Affiliates
Investment Advisory Fee
Columbia, an indirect, wholly owned subsidiary of Bank of America Corporation ("BOA"), provides investment advisory services to the Fund. Columbia receives a monthly investment advisory fee based on the Fund's average daily net assets at the following annual rates:
| Average Daily Net Assets | | Annual Fee Rate | |
| First $500 million | | | 0.75 | % | |
| $500 million to $1 billion | | | 0.70 | % | |
| $1 billion to $1.5 billion | | | 0.65 | % | |
| $1.5 billion to $3 billion | | | 0.60 | % | |
| $3 billion to $6 billion | | | 0.58 | % | |
| Over $6 billion | | | 0.56 | % | |
For the year ended February 28, 2010, the Fund's effective investment advisory fee rate was 0.64% of the Fund's average daily net assets.
Bank of America, N.A., an indirect parent company of Columbia, entered into an agreement dated September 29, 2009, to sell a portion of the asset management business of Columbia Management Group, LLC to Ameriprise Financial, Inc. ("Ameriprise Financial"). The transaction ("Transaction") includes the sale of the part of the asset management business that advises long-term mutual funds, including the Fund. The Transaction is subject to certain approvals and other conditions to closing, and is currently expected to close on or about May 1, 2010 (the "Closing"). In connection with the Closing, certain changes will occur, including a change in the entities serving as the investment advisor, administrator, distributor and transfer agent of the Fund. RiverSource
22
Columbia Marsico Growth Fund, February 28, 2010
Investments, LLC (the "New Advisor"), a subsidiary of Ameriprise Financial, will become the investment advisor of the Fund upon the Closing. The New Advisor will serve as investment advisor under a new investment management services agreement effective upon the closing. The New Advisor expects to change its name to Columbia Management Investment Advisers, LLC upon or shortly after the Closing. Effective upon the Closing, as the context requires, references to Columbia shall be deemed to refer to the New Advisor.
To the extent that the Fund is not benefitting from a separate contractual expense limitation arrangement, Columbia has contractually agreed to waive a portion of its advisory fees through June 30, 2010.
The waiver amount is calculated based on the difference between the dollar amount of sub-advisory fees that would have been payable to Marsico Capital Management, LLC ("Marsico") based on the annualized rate of 0.45% of the Fund's average daily net assets, and the dollar amount of sub-advisory fees calculated on a monthly basis based on the annualized sub-advisory fee rate effective January 1, 2008 in which Marsico is entitled from the Fund which is described under the Sub-Advisory Fee note below. The annualized fee rate of 0.45% represents the sub-advisory fee rate which Marsico was entitled to receive prior to January 1, 2008.
In the absence of a separate contractual expense limitation arrangement, the advisory fee waiver for the Fund would be calculated as follows:
| Fund Average Daily Net Assets* | | Advisory Fee Waiver | |
| Assets up to $18 billion | | | 0.00 | % | |
Assets in excess of $18 billion and
up to $21 billion | | | 0.05 | % | |
| Assets in excess of $21 billion | | | 0.10 | % | |
* For purposes of the calculation, "Assets" are aggregate assets sub-advised by Marsico in the following Columbia Funds: (i) Columbia Marsico Growth Fund; (ii) Columbia Marsico Focused Equities Fund; (iii) Columbia Marsico 21st Century Fund; (iv) Columbia Marsico Growth Fund, Variable Series; (v) Columbia Marsico Focused Equities Fund, Variable Series; (vi) Columbia Marsico 21st Century Fund, Variable Series; and (vii) any future Columbia U.S. equity fund sub-advised by Marsico which Columbia and Marsico mutually agree in writing.
For the year ended February 28, 2010, Columbia did not waive investment advisory fees for the Fund.
Sub-Advisory Fee
Marsico has been retained by Columbia to serve as the investment sub-advisor to the Fund. As the sub-advisor, and subject to the oversight of Columbia and the Fund's Board of Trustees, Marsico is responsible for the daily investment operations, including placing all orders for the purchase and sale of the portfolio securities for the Fund. Columbia, from the investment advisory fee it receives, pays Marsico a monthly sub-advisory fee.
Marsico is entitled to receive a monthly sub-advisory fee for its services provided to the Fund at the following annual rates:
| Fund Average Daily Net Assets* | | Fee Rate | |
| Assets up to $18 billion | | | 0.45 | % | |
Assets in excess of $18 billion and
up to $21 billion | | | 0.40 | % | |
| Assets in excess of $21 billion | | | 0.35 | % | |
* For purposes of the calculation, "Assets" are aggregate assets sub-advised by Marsico in the following Columbia Funds: (i) Columbia Marsico Growth Fund; (ii) Columbia Marsico Focused Equities Fund; (iii) Columbia Marsico 21st Century Fund; (iv) Columbia Marsico Growth Fund, Variable Series; (v) Columbia Marsico Focused Equities Fund, Variable Series; (vi) Columbia Marsico 21st Century Fund, Variable Series; and (vii) any future Columbia U.S. equity fund sub-advised by Marsico which the Advisor and Marsico mutually agree in writing.
Administration Fee
Columbia provides administrative and other services to the Fund for a monthly administration fee at the annual rate of 0.22% of the Fund's average daily net assets, less the fees payable by the Fund as described under the Pricing and Bookkeeping Fees note below.
The New Advisor will become the administrator of the Fund under a new administrative services agreement effective upon the Closing.
Pricing and Bookkeeping Fees
The Fund has entered into a Financial Reporting Services Agreement (the "Financial Reporting Services Agreement") with State Street Bank and Trust Company ("State Street") and Columbia pursuant to which State Street provides financial reporting services to the Fund. The Fund has also entered into an Accounting Services Agreement (collectively with the Financial Reporting Services Agreement, the "State Street Agreements") with State Street and Columbia pursuant to which State Street provides accounting services to the Fund.
23
Columbia Marsico Growth Fund, February 28, 2010
Under the State Street Agreements, the Fund pays State Street an annual fee of $38,000 paid monthly plus an additional monthly fee based on an annualized percentage rate of average daily net assets of the Fund for the month. The aggregate fee will not exceed $140,000 per year (exclusive of out-of-pocket expenses and charges). The Fund also reimburses State Street for certain out-of-pocket expenses and charges.
Among other updates to the State Street Agreements, Columbia will assign and delegate its rights and obligations thereunder to the New Advisor upon the Closing.
The Fund has entered into a Pricing and Bookkeeping Oversight and Services Agreement (the "Services Agreement") with Columbia. Under the Services Agreement, Columbia provides services related to Fund expenses and the requirements of the Sarbanes-Oxley Act of 2002, and provides oversight of the accounting and financial reporting services provided by State Street. Under the Services Agreement, the Fund reimburses Columbia for out-of-pocket expenses and charges, including fees payable to third parties, such as for pricing the Fund's portfolio securities, incurred by Columbia in the performance of services under the Services Agreement.
The Services Agreement will be terminated upon the Closing, and the services provided thereunder will be covered under the administrative services agreement with the New Advisor.
Transfer Agent Fee
Columbia Management Services, Inc. (the "Transfer Agent"), an affiliate of Columbia and an indirect, wholly owned subsidiary of BOA, provides shareholder services to the Fund and has contracted with Boston Financial Data Services ("BFDS") to serve as sub-transfer agent. Effective January 1, 2010, the Transfer Agent is entitled to receive a fee for its services, paid monthly, at the annual rate of $22.36 per account plus reimbursement of certain sub-transfer agent fees paid by the Transfer Agent (exclusive of BFDS fees), calculated based on assets held in omnibus accounts and intended to recover the cost of payments to other parties (including affiliates of BOA) for services to those accounts. Prior to January 1, 2010, the annual rate was $17.34 per account. The Transfer Agent pays the fees of BFDS for services as sub-transfer agent and is not entitled to reimbursement for such fees from the Fund.
The Transfer Agent may also retain, as additional compensation for its services, fees for wire, telephone and redemption orders, Individual Retirement Account ("IRA") trustee agent fees and account transcript fees due to the Transfer Agent from shareholders of the Fund and credits (net of bank charges) earned with respect to balances in accounts the Transfer Agent maintains in connection with its services to the Fund. The Transfer Agent also receives reimbursement for certain out-of-pocket expenses.
Prior to May 1, 2009, the Transfer Agent voluntarily waived a portion of its fees for accounts other than omnibus accounts, so that transfer agent fees (exclusive of out-of-pocket expenses and sub-transfer agent fees) did not exceed 0.02% annually of the Fund's average daily net assets.
An annual minimum account balance fee of $20 may apply to certain accounts with a value below the Fund's initial minimum investment requirements to reduce the impact of small accounts on transfer agent fees. These minimum account balance fees are recorded as part of expense reductions on the Statement of Operations. For the year ended February 28, 2010, no minimum account balance fees were charged by the Fund.
RiverSource Service Corporation (the "New Transfer Agent"), a subsidiary of Ameriprise Financial, will become the transfer agent of the Fund upon the Closing. The New Transfer Agent expects to change its name to Columbia Management Investment Services Corp. upon or shortly after the Closing.
Underwriting Discounts, Service and Distribution Fees
Columbia Management Distributors, Inc. (the "Distributor"), an affiliate of Columbia and an indirect, wholly owned subsidiary of BOA, is the principal underwriter of the Fund's shares. For the year ended February 28, 2010, the Distributor has retained net underwriting discounts of $50,292 on sales of the Fund's Class A shares and received net CDSC fees of $16,223, $119,246 and $43,937 on Class A, Class B and Class C share redemptions, respectively.
RiverSource Fund Distributors, Inc. (the "New Distributor"), a subsidiary of Ameriprise Financial, will become the distributor of the Fund upon the Closing. The New Distributor expects to change its name to Columbia Management Investment Distributors, Inc. upon or shortly after the Closing.
24
Columbia Marsico Growth Fund, February 28, 2010
The Trust has adopted shareholder servicing plans and distribution plans for the Class B and Class C shares of the Fund and a combined distribution and shareholder servicing plan for the Class A shares of the Fund. The Trust has also adopted a distribution plan for the Class R shares of the Fund. The shareholder servicing plans permit the Fund to compensate or reimburse servicing agents for the shareholder services they have provided. The distribution plans, adopted pursuant to Rule 12b-1 under the 1940 Act, permit the Fund to compensate or reimburse the Distributor and/or selling agents for activities or expenses primarily intended to result in the sale of the classes' shares. Payments are made at an annual rate and paid monthly, as a percentage of average daily net assets, set from time to time by the Board of Trustees, and are charged as expenses of the Fund directly to the applicable share class. A substantial portion of the expenses incurred pursuant to these plans is paid to affiliates of BOA and the Distributor.
The annual rates in effect and plan limits, as a percentage of average daily net assets are as follows:
| | | Current
Rate | | Plan Limit | |
Class A Combined Distribution
and Shareholder Servicing Plan | | | 0.25 | % | | | 0.25 | % | |
Class B and Class C
Shareholder Servicing Plans | | | 0.25 | % | | | 0.25 | % | |
Class B and Class C
Distribution Plans | | | 0.75 | % | | | 0.75 | % | |
| Class R Distribution Plan | | | 0.50 | % | | | 0.50 | % | |
Expense Limits and Fee Waivers
Effective May 1, 2009, Columbia has voluntarily agreed to reimburse a portion of the Fund's expenses so that the Fund's ordinary operating expenses (excluding any distribution and service fees, brokerage commissions, interest, taxes and extraordinary expenses, but including custodian charges relating to overdrafts, if any) after giving effect to any balance credits from the Fund's custodian, do not exceed the annual rate of 1.20% of the Fund's average daily net assets. Columbia, in its discretion, may revise or discontinue this arrangement at any time.
Fees Paid to Officers and Trustees
All officers of the Fund are employees of Columbia or its affiliates and, with the exception of the Fund's Chief Compliance Officer, receive no compensation from the Fund. The Board of Trustees has appointed a Chief Compliance Officer to the Fund in accordance with federal securities regulations. The Fund, along with other affiliated funds, pays its pro-rata share of the expenses associated with the Chief Compliance Officer. The Fund's expenses for the Chief Compliance Officer will not exceed $15,000 per year.
Trustees are compensated for their services to the Fund, as set forth on the Statement of Operations. The Trust's eligible Trustees may participate in a non-qualified deferred compensation plan which may be terminated at any time. Any payments to plan participants are paid solely out of the Fund's assets. Income earned on the plan participant's deferral account is based on the rate of return of the eligible mutual funds selected by the participant or, if no funds are selected, on the rate of return of Columbia Treasury Reserves, another portfolio of the Trust. The expense for the deferred compensation plan, which includes trustees' fees deferred during the current period as well as any gains or losses on the trustees' deferred compensation balances as a result of market fluctuations, is included in "Trustees' fees" on the Statement of Operations. The liability for the deferred compensation plan is included in "Trustees' fees" on the Statement of Assets and Liabilities.
Other Related Party Transactions
In connection with the purchase and sale of its securities during the period, the Fund used one or more brokers that are affiliates of BOA. Total brokerage commissions paid to affiliated brokers for the year ended February 28, 2010 was $153,296.
Note 5. Custody Credits
The Fund has an agreement with its custodian bank under which custody fees may be reduced by balance credits. These credits are recorded as part of expense reductions on the Statement of Operations. The Fund could have invested a portion of the assets utilized in connection with the expense offset arrangement in an income-producing asset if it had not entered into such an agreement. For the year ended
25
Columbia Marsico Growth Fund, February 28, 2010
February 28, 2010, these custody credits reduced total expenses by $56 for the Fund.
Note 6. Portfolio Information
For the year ended February 28, 2010, the cost of purchases and proceeds from sales of securities, excluding short-term obligations, for the Fund were $2,457,499,914 and $3,291,868,440, respectively.
Note 7. Regulatory Settlements
During the year ended February 28, 2010, the Fund received payments totaling $47,849 relating to certain regulatory settlements with third parties that the Fund had participated in during the year. The payments have been included in "Increase from regulatory settlements" on the Statement of Changes in Net Assets.
Note 8. Line of Credit
The Fund and other affiliated funds participate in a $280,000,000 committed, unsecured revolving line of credit provided by State Street. The maximum amount that may be borrowed by any fund is limited to the lesser of $200,000,000 and the Fund's borrowing limit set forth in the Fund's registration statement. Borrowings are available for short-term liquidity or temporary or emergency purposes.
Effective October 15, 2009, interest is charged to each participating fund based on the fund's borrowings at a rate per annum equal to the greater of the Federal Funds Rate plus 1.25% or the overnight LIBOR Rate plus 1.25%. In addition, a commitment fee of 0.15% per annum is accrued and apportioned among the participating funds pro rata based on their relative net assets.
Prior to October 15, 2009, interest was charged to each participating fund based on the fund's borrowings at a rate per annum equal to the greater of the Federal Funds Rate plus 0.50% or the overnight LIBOR Rate plus 0.50%. In addition, an annual operations agency fee of $20,000, an amendment fee of 0.02% and a commitment fee of 0.12% per annum were accrued and apportioned among the participating funds pro rata based on their relative net assets.
For the year ended February 28, 2010, the average daily loan balance outstanding on days where borrowing existed was $5,032,258 at a weighted average interest rate of 0.99%.
Note 9. Shares of Beneficial Interest
As of February 28, 2010, 24.9% of the Fund's shares outstanding were beneficially owned by two participant accounts over which BOA and/or any of its affiliates had either sole or joint investment discretion.
As of February 28, 2010, the Fund had three shareholders that collectively held 19.1% of the shares outstanding, over which BOA and/or any of its affiliates did not have investment discretion.
As of February 28, 2010, no other shareholders owned more than 5% of the outstanding shares of the Fund.
Subscription and redemption activity of these accounts may have a significant effect on the operations of the Fund.
Note 10. Significant Risks and Contingencies
Foreign Securities Risk
There are certain additional risks involved when investing in foreign securities. These risks may involve foreign currency exchange rate fluctuations, adverse political and economic developments and the possible prevention of currency exchange or other foreign governmental laws or restrictions. In addition, the liquidity of foreign securities may be more limited than that of domestic securities.
Investments in emerging market countries are subject to additional risk. The risk of foreign investments is typically increased in less developed countries. These countries are also more likely to experience high levels of inflation, deflation or currency devaluation which could hurt their economies and securities markets.
Legal Proceedings
Columbia Management Advisors, LLC and Columbia Management Distributors, Inc. (collectively, the "Columbia Group") are subject to a settlement agreement with the New York Attorney General ("NYAG") (the "NYAG Settlement") and a settlement order with the Securities and Exchange Commission ("SEC") (the "SEC Order") on matters relating to mutual fund trading, each dated February 9, 2005. Under the terms of the SEC Order, the Columbia Group (or predecessor or affiliated entities) agreed, among other things, to: pay disgorgement and civil money penalties collectively totaling $375 million; cease and desist from violations of the antifraud
26
Columbia Marsico Growth Fund, February 28, 2010
provisions and certain other provisions of the federal securities laws; maintain certain compliance and ethics oversight structures; and retain an independent consultant to review the Columbia Group's applicable supervisory, compliance, control and other policies and procedures. The NYAG Settlement, among other things, requires Columbia Management Advisors, LLC and its affiliates to make certain disclosures to investors relating to expenses. In connection with the Columbia Group providing services to the Columbia Funds, the Columbia Funds have voluntarily undertaken to implement certain governance measures designed to maintain the independence of their boards of trustees and certain special consulting and compliance measures.
Pursuant to the SEC Order and related procedures, the $375 million in settlement amounts described above, of which approximately $90 million has been earmarked for certain Columbia Funds and their shareholders, is being distributed in accordance with a distribution plan developed by an independent distribution consultant and approved by the SEC on December 27, 2007. Distributions under the distribution plan began in mid-June 2008 and the distribution earmarked for the Columbia Funds and their shareholders has been substantially completed.
Civil Litigation
In connection with the events that resulted in the NYAG Settlement and SEC Order, various parties filed suits against Bank of America Corporation and certain of its affiliates, including Banc of America Capital Management, LLC ("BACAP," now known as Columbia Management Advisors, LLC) and BACAP Distributors, LLC (now known as Columbia Management Distributors, Inc.) (collectively "BAC"), Nations Funds Trust (now known as Columbia Funds Series Trust) and its Board of Trustees. On February 20, 2004, the Judicial Panel on Multidistrict Litigation transferred these cases and cases against other mutual fund companies based on similar allegations to the United States District Court in Maryland for consolidated or coordinated pretrial proceedings (the "MDL"). Subsequently, additional related cases were transferred to the MDL. On September 29, 2004, the plaintiffs in the MDL filed amended and consolidated complaints. One of these amended complaints is a putative class action that includes claims under the federal securities laws and state common law, and that names Nations Funds Trust, the Trustees, BAC and others as defendants. Another of the amended complaints is a derivative action purportedly on behalf of the Nations Funds Trust against BAC and others that asserts claims under federal securities laws and state common law. Nations Funds Trust is a nominal defendant in this action.
On February 25, 2005, BAC and other defendants filed motions to dismiss the claims in the pending cases. On December 15, 2005, BAC and others entered into a Stipulation of Settlement of the direct and derivative claims brought on behalf of the Nations Funds shareholders. The settlement is subject to court approval. If the settlement is approved, BAC would pay settlement administration costs and fees to plaintiffs' counsel as approved by the court. The stipulation has not yet been presented to the court for approval.
Note 11. Subsequent Events
In connection with the preparation of the financial statements of the Fund as of and for the fiscal year ended February 28, 2010, events and transactions through the date the financial statements were issued have been evaluated by the Fund's management for possible adjustment and/or disclosure. No subsequent events or transactions had occurred that would require adjustment of the financial statements as presented. On March 3, 2010, the Fund's shareholders approved, among other matters, a proposed investment management services agreement with the New Advisor and a proposed investment subadvisory agreement with Marsico, the effectiveness of each of which is conditioned on the Closing.
27
Report of Independent Registered Public Accounting Firm
To the Trustees of Columbia Funds Series Trust and the Shareholders of Columbia Marsico Growth Fund
In our opinion, the accompanying statement of assets and liabilities, including the investment portfolio, and the related statements of operations and of changes in net assets and the financial highlights present fairly, in all material respects, the financial position of Columbia Marsico Growth Fund (the "Fund") (a series of Columbia Funds Series Trust) at February 28, 2010, the results of its operations, the changes in its net assets and the financial highlights for each of the periods indicated, in conformity with accounting principles generally accepted in the United States of America. These financial statements and financial highlights (hereafter referred to as "financial statements") are the responsibility of the Fund's management. Our responsibility is to express an opinion on these financial statements based on our audits. We conducted our audits of these financial statements in accordance with the standards of the Publi c Company Accounting Oversight Board (United States). Those standards require that we plan and perform the audit to obtain reasonable assurance about whether the financial statements are free of material misstatement. An audit includes examining, on a test basis, evidence supporting the amounts and disclosures in the financial statements, assessing the accounting principles used and significant estimates made by management, and evaluating the overall financial statement presentation. We believe that our audits, which included confirmation of securities at February 28, 2010 by correspondence with the custodian and brokers, provide a reasonable basis for our opinion.
PricewaterhouseCoopers LLP
Boston, Massachusetts
April 21, 2010
28
Federal Income Tax Information (Unaudited)
For non-corporate shareholders, 100.00% or the maximum amount allowable under the Jobs and Growth Tax Relief Reconciliation Act of 2003, of the ordinary income distributed by the Fund for the fiscal year ended February 28, 2010 may represent qualified dividend income.
100.00% of the ordinary income distributed by the Fund for the fiscal year ended February 28, 2010, qualifies for the corporate dividends received deduction.
The Fund will notify shareholders in January 2011 of amounts for use in preparing 2010 income tax returns.
29
Fund Governance
The Trustees serve terms of indefinite duration. The names, addresses and ages of the Trustees and officers of the Funds of Columbia Funds Series Trust, the year each was first elected or appointed to office, their principal business occupations during at least the last five years, the number of Funds overseen by each Trustee and other directorships they hold are shown below. Each officer listed below serves as an officer of each Fund in the Columbia Funds Complex.
Independent Trustees
Name, Address and Year of Birth,
Position with Funds, Year First
Elected or Appointed to Office | | Principal Occupation(s) During Past Five Years, Number of Funds in the Columbia
Funds Complex Overseen by Trustee, Other Directorships Held
| |
| Edward J. Boudreau (Born 1944) | |
|
c/o Columbia Management
Advisors, LLC
One Financial Center
Boston, MA 02111
Trustee (since 2005) | | Managing Director—E.J. Boudreau & Associates (consulting), from 2000 through current; oversees 64; no other directorships held. | |
|
| William P. Carmichael (Born 1943) | |
|
c/o Columbia Management
Advisors, LLC
One Financial Center
Boston, MA 02111
Trustee (since 1999) | | Retired. Oversees 64; Director—Cobra Electronics Corporation (electronic equipment manufacturer); Director—The Finish Line (sportswear). | |
|
| William A. Hawkins (Born 1942) | |
|
c/o Columbia Management Advisors, LLC
One Financial Center
Boston, MA 02111
Trustee (since 2005) | | President and Chief Executive Officer—California General Bank, N.A., from January 2008 through current; oversees 64; no other directorships held. | |
|
| R. Glenn Hilliard (Born 1943) | |
|
c/o Columbia Management Advisors, LLC
One Financial Center
Boston, MA 02111
Trustee (since 2005) | | Chairman and Chief Executive Officer—Hilliard Group LLC (investing and consulting), from April 2003 through current; Non-Executive Director & Chairman—Conseco, Inc. (insurance), September 2003 through current; Executive Chairman—Conseco, Inc. (insurance), August 2004 through September 2005; oversees 64; Director—Conseco, Inc. (insurance). | |
|
| John J. Nagorniak (Born 1944) | |
|
c/o Columbia Management
Advisors, LLC
One Financial Center
Boston, MA 02111
Trustee (since 2008)` | | Retired. President and Director—Foxstone Financial, Inc. (consulting), 2000 through December 2007; Director—Mellon Financial Corporation affiliates (investing), 2000 through 2007; Chairman—Franklin Portfolio Associates (investing—Mellon affiliate), 1982 through 2007; oversees 64; Director—MIT Investment Company; Trustee—MIT 401k Plan; Trustee and Chairman—Research Foundation of CFA Institute. | |
|
30
Fund Governance (continued)
Independent Trustees (continued)
Name, Address and Year of Birth,
Position with Funds, Year First
Elected or Appointed to Office | | Principal Occupation(s) During Past Five Years, Number of Funds in the Columbia
Funds Complex Overseen by Trustee, Other Directorships Held
| |
| Minor M. Shaw (Born 1947) | |
|
c/o Columbia Management Advisors, LLC
One Financial Center
Boston, MA 02111
Trustee (since 2003) | | President—Micco Corporation and Mickel Investment Group; oversees 64; Board Member—Piedmont Natural Gas. | |
|
Interested Trustee
| Anthony M. Santomero1 (Born 1946) | |
|
c/o Columbia Management Advisors, LLC
One Financial Center
Boston, MA 02111
Trustee (since 2008) | | Richard K. Mellon Professor Emeritus of Finance, The Wharton School, University of Pennsylvania, from 1972 through current; Senior Advisor—McKinsey & Company (consulting), July 2006 through January 2008; President and Chief Executive Officer—Federal Reserve Bank of Philadelphia, July 2000 through April 2006; oversees 64; Director—Renaissance Reinsurance Ltd; Director—Penn Mutual Life Insurance Company; Director—Citigroup. | |
|
1 The Columbia Funds currently treat Mr. Santomero as an "interested person" (as defined in the 1940 Act) of the Funds because he serves as a Director of Citigroup, Inc. and Citibank, N.A. Citigroup, Inc., through its subsidiaries and affiliates, including Citibank, N.A., may engage from time-to-time in brokerage execution, principal transactions and/or lending relationships with the Columbia Funds or other funds or accounts advised/managed by the Advisor and/or any sub-advisor.
The Statement of Additional Information includes additional information about the Trustees of the Funds and is available, without charge, upon request by calling 800-345-6611.
31
Fund Governance (continued)
Officers
Name, Address and Year of Birth,
Position with Columbia Funds,
Year First Elected or
Appointed to Office | | Principal Occupation(s) During Past Five Years
| |
| J. Kevin Connaughton (Born 1964) | |
|
One Financial Center
Boston, MA 02111
President (since 2009) | | Managing Director of Columbia Management Advisors, LLC since December 2004; Senior Vice President and Chief Financial Officer—Columbia Funds, from June 2008 to January 2009; Treasurer—Columbia Funds, from October 2003 to May 2008; Treasurer—the Liberty Funds, Stein Roe Funds and Liberty All-Star Funds, December 2000—December 2006; Senior Vice President—Columbia Management Advisors, LLC, from April 2003 to December 2004; President—Columbia Funds, Liberty Funds and Stein Roe Funds, February 2004 to October 2004; Treasurer—Galaxy Funds, September 2002 to December 2005; Treasurer, December 2002 to December 2004, and President, February 2004 to December 2004—Columbia Management Multi-Strategy Hedge Fund, LLC; and a senior officer of various other Bank of America-affiliated entities, including other registered and unregistered funds | |
|
| James R. Bordewick, Jr. (Born 1959) | |
|
One Financial Center
Boston, MA 02111
Senior Vice President, Secretary and Chief Legal Officer (since 2006) | | Associate General Counsel, Bank of America since April 2005; Senior Vice President and Associate General Counsel, MFS Investment Management (investment management) prior to April 2005. | |
|
| Linda J. Wondrack (Born 1964) | |
|
One Financial Center
Boston, MA 02111
Senior Vice President and
Chief Compliance Officer (since 2007) | | Director (Columbia Management Group LLC and Investment Product Group Compliance), Bank of America since June 2005; Director of Corporate Compliance and Conflicts Officer, MFS Investment Management (investment management), August 2004 to May 2005; Managing Director, Deutsche Asset Management (investment management) prior to August 2004. | |
|
| Michael G. Clarke (Born 1969) | |
|
One Financial Center
Boston, MA 02111
Senior Vice President and
Chief Financial Officer (since 2009) | | Director of Fund Administration of the Advisor since January 2006; Managing Director of the Advisor September 2004 to December 2005; Vice President Fund Administration June 2002 to September 2004. | |
|
| Jeffrey R. Coleman (Born 1969) | |
|
One Financial Center
Boston, MA 02111
Treasurer (since 2008) | | Director of Fund Administration of the Advisor since January 2006; Fund Controller of the Advisor from October 2004 to January 2006; Vice President of CDC IXIS Asset Management Services, Inc. (investment management) from August 2000 to September 2004. | |
|
| Joseph F. DiMaria (Born 1968) | |
|
One Financial Center
Boston, MA 02111
Chief Accounting Officer (since 2008) | | Director of Fund Administration of the Advisor since January 2006; Head of Tax/Compliance and Assistant Treasurer of the Advisor from November 2004 to December 2005; Director of Trustee Administration (Sarbanes-Oxley) of the Advisor from May 2003 to October 2004. | |
|
32
Fund Governance (continued)
Officers (continued)
Name, Address and Year of Birth,
Position with Columbia Funds,
Year First Elected or
Appointed to Office | | Principal Occupation(s) During Past Five Years
| |
| Julian Quero (Born 1967) | |
|
One Financial Center
Boston, MA 02111
Deputy Treasurer (since 2008) | | Senior Tax Manager of the Advisor since August 2006; Senior Compliance Manager of the Advisor from April 2002 to August 2006. | |
|
| Barry S. Vallan (Born 1969) | |
|
One Financial Center
Boston, MA 02111
Controller (since 2006) | | Vice President—Fund Treasury of the Advisor since October 2004; Vice President—Trustee Reporting of the Advisor from April 2002 to October 2004. | |
|
| Stephen T. Welsh (Born 1957) | |
|
One Financial Center
Boston, MA 02111
Vice President (since 1996) | | President, Columbia Management Services, Inc. since July 2004; Senior Vice President and Controller, Columbia Management Services, Inc. prior to July 2004. | |
|
33
Board Consideration and Re-Approval of Current Investment Advisory and Sub-Advisory Agreements
Even though the following description of the Board's consideration of investment advisory and, as applicable, sub-advisory agreements covers multiple funds, for purposes of this shareholder report, the description is only relevant as to the Fund.
The Board of Trustees of Columbia Funds Series Trust (the "Board"), including a majority of the Trustees who have no direct or indirect interest in the investment advisory and sub-advisory agreements and are not "interested persons" of the Trust, as defined in the Investment Company Act of 1940 (the "1940 Act") (the "Independent Trustees"), are required annually to review and re-approve the existing investment advisory and sub-advisory agreements and approve any newly proposed terms therein. In this regard, the Board reviewed and re-approved, during the most recent six months covered by this report, (i) investment advisory agreements with Columbia Management Advisors, LLC ("CMA" or the "Adviser") for Columbia Convertible Securities Fund, Columbia Large Cap Value Fund, Columbia Mid Cap Value Fund, Columbia Small Cap Value Fund II, Columbia Marsico Growth Fund, Columbia Large Cap Core Fund, Columbia Marsico Focused Equities Fund, Columbia Marsico 21st Century Fund and Columbia Small Cap Growth Fund II; and (ii) investment sub-advisory agreements with Marsico Capital Management, LLC ("Marsico Capital" or the "Sub-Adviser") for Columbia Marsico Focused Equities Fund, Columbia Marsico 21st Century Fund and Columbia Marsico Growth Fund (the "Sub-Advised Funds"). The investment advisory agreements with CMA and the investment sub-advisory agreements with Marsico Capital are each referred to as an "Advisory Agreement" and collectively referred to as the "Advisory Agreements." The funds identified above are each referred to as a "Fund" and collectively referred to as the "Funds."
More specifically, at meetings held on November 5-6, 2009, the Board, including the Independent Trustees advised by their independent legal counsel, considered the factors and reached the conclusions described below relating to the selection of CMA and the Sub-Adviser and the re-approval of the Advisory Agreements. The Board also reviewed and considered a report prepared and provided by the Independent Fee Consultant (the "Fee Consultant") appointed by the Independent Trustees pursuant to an assurance of discontinuance entered into with the New York Attorney General ("NYAG") to settle a civil complaint filed by the NYAG relating to trading in mutual fund shares (the "NYAG Settlement"). The Fee Consultant's role was to manage the process by which management fees are negotiated so that they were negotiated in a manner that is at arms' length and reasonable. The Fee Consultant found that the fee negotiation process was, to the exte nt practicable, at arms' length and reasonable and consistent with the requirements of the NYAG Settlement. A summary of the Fee Consultant's report is available at http://www.columbiafunds.com.
In preparation for the November meetings, the Board met in August for review and discussion of the materials described below. The Investment Committee of the Board also met in June to discuss each Fund's performance with its respective portfolio manager(s). In addition to these meetings, the Investment Committee receives and discusses performance reports at its quarterly meetings. The Contracts Review Committee of the Board also provided support in managing and coordinating the process by which the Board reviewed the Advisory Agreements. The Board's review and conclusions are based on the comprehensive consideration of all information presented to it and are not the result of any single controlling factor. The Board evaluated all information available to it on a Fund-by-Fund basis, and its determinations were made separately in respect of each Fund.
Nature, Extent and Quality of Services. The Board received and considered various data and information regarding the nature, extent and quality of services provided to the Funds by CMA and the Sub-Adviser under the Advisory Agreements. The most recent investment adviser registration forms for CMA and the Sub-Adviser were made available to the Board, as were CMA's and the Sub-Adviser's responses to a detailed series of requests submitted by the Independent Trustees' independent legal counsel on behalf of such Trustees. The Board reviewed and analyzed those materials, which included, among other things, information about the background and experience of senior management and investment personnel of CMA and the Sub-Adviser.
In addition, the Board considered the investment and legal compliance programs of the Funds, CMA and the Sub-Adviser, including their compliance policies and procedures and reports of the Funds' Chief Compliance Officer.
The Board evaluated the ability of CMA and the Sub-Adviser, based on their resources, reputation and other attributes, to
34
attract and retain qualified investment professionals, including research, advisory and supervisory personnel. In this regard, the Board considered information regarding the nature of CMA's compensation structure applicable to portfolio managers and other key investment personnel.
Based on the above factors, together with those referenced below, the Board concluded that it was satisfied with the nature, extent and quality of the investment advisory services provided to each of the Funds by CMA and the Sub-Adviser.
The Board noted that Bank of America, N.A., the parent company of the Adviser, had entered into an agreement to sell a portion of the asset management business of the Adviser to Ameriprise Financial, Inc. (the "Transaction"). The Board noted that the Transaction was expected to close in the spring of 2010 and that its review of the Advisory Agreements was separate and distinct from any analysis regarding new advisory or sub-advisory arrangements that may result from the closing of the Transaction.
Investment Advisory and Sub-Advisory Fee Rates and Other Expenses. The Board reviewed and considered the proposed contractual investment advisory fee rates both separately and together with the administration fee rates payable by the Funds to CMA for investment advisory services (the "Contractual Management Rates"). The Board also reviewed and considered the proposed contractual investment sub-advisory fee rates (the "Sub-Advisory Agreement Rates") payable by CMA to the Sub-Adviser for investment sub-advisory services. In addition, the Board reviewed and considered the proposed fee waiver/cap arrangements applicable to the Contractual Management Rates and considered the Contractual Management Rates after taking the waivers/caps into account (the "Actual Management Rates"). The Board noted that, on a complex-wide basis, CMA had reduced annual managemen t fees by at least $32 million per year pursuant to the NYAG Settlement. The Board also noted reductions in net advisory rates and/or total expenses of certain funds across the fund complex. Additionally, the Board received and afforded specific attention to information comparing the Contractual Management Rates and Actual Management Rates with those of the other funds in their respective Peer Groups (as defined below).
The Board reviewed and considered statistical information regarding each Fund's total expense ratio and its various components, including contractual advisory fees, actual advisory fees, actual non-management fees, Rule 12b-1 and non-Rule 12b-1 service fees, fee waivers/caps and/or expense reimbursements. The Board also reviewed comparisons of these fees to the expense information for the group of Funds determined by Lipper Inc. ("Lipper") to be most similar to a given Fund (the "Peer Group") and to the performance of a broader universe of relevant funds as determined by Lipper (the "Universe"), which comparative data was provided by Lipper, an independent provider of investment company data. The Board was provided with a description of the methodology used by Lipper to select the mutual funds in each Fund's Peer Group and Universe and considered potential imprecision resulting from the selection methodology. For certain Funds, Lipper determined that the composition of the Peer Group and/or Universe for expenses would differ from the composition for performance to provide a more accurate basis of comparison. The Board also considered Lipper data that ranked each Fund based on: (i) each Fund's one- and three-year performance compared to actual management fees; and (ii) each Fund's one- and three-year performance compared to total expenses.
The Board concluded that the factors noted above supported the Contractual Management Rates and the Actual Management Rates, and the approval of the Advisory Agreements for all of the Funds.
With regard to the Sub-Advised Funds, the Board also reviewed the Sub-Advisory Agreement Rates, including comparative fee information provided by the Adviser and the Adviser's recommendation that the Board re-approve the Advisory Agreements with Marsico Capital. The Board also considered a breakpoint fee schedule charged by Marsico Capital for the Sub-Advised Funds, as well as a corresponding waiver of Contractual Management Rates, both of which were implemented on January 1, 2008. The Board concluded that the Sub-Advisory Agreement Rates are fair and equitable, based on its consideration of the factors described above.
The Fund-by-Fund discussion set forth below in "Fund-Specific Considerations for Certain Review Funds" provides additional information regarding those Funds highlighted as meeting agreed-upon criteria for warranting further review. Such criteria included, among other things, information relating to Actual Management Rates, total expense ratios and/or
35
performance information, relative to a Fund's Peer Group and/or Universe.
Fund Performance. The Board considered the performance results for each of the Funds over multiple measurement periods. It also considered these results in comparison to the performance results of each Fund's Peer Group and Universe, as well as to each Fund's benchmark index. The Board also considered certain risk-adjusted performance data.
The Fund-by-Fund discussion set forth below in "Fund-Specific Considerations for Certain Review Funds" provides additional information regarding those Funds highlighted as meeting agreed-upon criteria for warranting further review. Such criteria included, among other things, information relating to Actual Management Rates, total expense ratios and/or performance information, relative to a Fund's Peer Group and/or Universe.
Profitability. The Board received and considered a detailed profitability analysis of CMA based on the Contractual Management Rates and the Actual Management Rates, as well as on other relationships between the Funds and other funds in the complex on the one hand and CMA affiliates on the other. The analysis included complex-wide and per-Fund information and a comparison of results using alternative allocation methodologies. The Board concluded that, in light of the costs of providing investment management and other services, the profits and other ancillary benefits that CMA and its affiliates received from providing these services were not unreasonable.
Economies of Scale. The Board received and considered information regarding whether there have been economies of scale with respect to the management of the Funds, whether the Funds have appropriately benefited from any economies of scale and whether there is potential for realization of any further economies of scale. Most particularly, CMA provided information showing that, as a percentage of fund assets, CMA's complex-wide revenues declined over a five-year period during which fund assets increased by 53% and the shareholder benefit over a four-year period has remained steady at approximately 33% of the Adviser's total profits. The Board concluded that any potential economies of scale are shared fairly with Fund shareholders, most particularly through breakpoints and fee waiver arrangements.
The Board acknowledged the inherent limitations of any analysis of an investment adviser's economies of scale, stemming largely from the Board's understanding that economies of scale are generally realized, if at all, by an investment adviser across a variety of products and services, not just with respect to a single fund.
Information About Services to Other Clients. The Board also received and considered information about the nature and extent of services and fee rates offered by CMA and the Sub-Adviser to their other clients, including separate accounts and institutional investors. In this regard, the Board concluded that, where the Contractual Management Rates, Sub-Advisory Agreement Rates and Actual Management Rates were appreciably above the range of the fee rates offered to other CMA and Sub-Adviser clients, based on information provided by CMA and the Sub-Adviser, the costs associated with managing and operating a registered investment company provided a justification for the higher fee rates charged to the Funds.
Other Benefits to CMA and the Sub-Adviser. The Board received and considered information regarding any "fall-out" or ancillary benefits received by CMA and its affiliates and the Sub-Adviser as a result of their relationship with the Funds. Such benefits could include, among others, benefits attributable to CMA's and the Sub-Adviser's relationships with the Funds (such as soft-dollar credits) and benefits potentially derived from an increase in CMA's and the Sub-Adviser's business as a result of their relationship with the Funds (such as the ability to market to shareholders other financial products offered by CMA and its affiliates or a Sub-Adviser).
The Board considered the effectiveness of the policies of the Funds in achieving the best execution of portfolio transactions, whether and to what extent soft dollar credits are sought and how any such credits are utilized, any benefits that may be realized by using an affiliated broker, the extent to which efforts are made to recapture transaction costs, and the controls applicable to brokerage allocation procedures. The Board also reviewed CMA's and the Sub-Adviser's methods for allocating portfolio investment opportunities among the Funds and other clients. The Board concluded that the benefits were not unreasonable.
Other Factors and Broader Review. As discussed above, the Board reviews materials received from CMA and the Sub-
36
Adviser annually as part of the re-approval process under Section 15(c) of the 1940 Act. The Board also reviews and assesses the quality of the services the Funds receives throughout the year. In this regard, the Board and its Committees review reports of CMA and the Sub-Adviser at each of its quarterly meetings, which include, among other things, Fund performance reports and presentations relating to such reports. In addition, the Board and its Committees confer with portfolio managers at various times throughout the year including, most particularly, at the June Investment Committee meeting.
Fund-Specific Considerations for Certain "Review" Funds. For certain Funds highlighted as meeting agreed-upon criteria for warranting further review, the Board engaged in further analysis with regard to approval of the Funds' Advisory Agreements. Such criteria included, among other things, information relating to Actual Management Rates, total expense ratios, and/or performance information relative to a Fund's Peer Group and/or Universe.
The Board engaged in further review of Columbia Marsico Growth Fund because its Actual Management Rate was appreciably above the median range of its Peer Group, its total expense ratio was above the median range of its Peer Group and its performance over certain periods was appreciably below the median range of its Universe. However, the Board noted other factors such as positive performance over other periods, recent improvements in the Fund's total expense rankings, the inherently higher cost structure of subadvised funds, the implementation of a group breakpoint structure and contractual advisory fee waivers in January 2008 for the Funds subadvised by Marsico Capital, the recent implementation of additional voluntary expense limitations and recent enhancements to Columbia's subadviser oversight process. Taking into account these matters and other factors considered, the Board concluded that the Fund's performance, Actual Mana gement Rate and total expense ratio were acceptable.
Conclusion. After an evaluation of the above-described factors, and based on its deliberations and analysis of the information provided and alternatives considered, the Board, including all of the Independent Trustees, concluded that the compensation payable to CMA and the Sub-Adviser under the Advisory Agreements is fair and equitable. Accordingly, the Board unanimously re-approved the Advisory Agreements.
37
Board Consideration and Approval of Proposed Investment Advisory and Sub-Advisory Agreements
Even though the following description of the Board's consideration of investment advisory and, as applicable, sub-advisory agreements covers multiple funds and trusts, for purposes of this shareholder report, the description is only relevant as to the Fund.
At a meeting held on December 21, 2009, the Boards of Trustees (the "Boards") of Columbia Funds Series Trust, Columbia Funds Master Investment Trust, LLC and Columbia Funds Series Trust II (each a "Trust" and collectively the "Trusts") unanimously approved a new investment management services agreement with RiverSource Investments, LLC ("RiverSource") (the "Proposed Advisory Agreement") and new subadvisory agreements with Marsico Capital Management ("Marsico Capital"), MacKay Shields LLC ("Mackay Shields") and Brandes Investment Partners, L.P. ("Brandes") (each a "Proposed Subadvisory Agreement"), as applicable, for each Fund of the Trusts (each a "Fund" and collectively the "Funds"). As detailed below, the Trustees met on multiple occasions in advance of the December 21, 2009 meeting, held numerous discussions with the management teams of Columbia Management Advisors, LLC ("Columbia") and RiverSource, a subsidiary of Ameriprise Financial, Inc. ("Ameriprise") and reviewed and considered extensive materials in connection with the approval of the Proposed Advisory and Subadvisory Agreements.
Specifically, the Trustees of each Trust, including a majority of the Trustees who have no direct or indirect interest in the Proposed Advisory and Subadvisory Agreements and are not "interested persons" of the Trusts, as defined in the Investment Company Act of 1940, as amended (the "1940 Act") (the "Independent Trustees") reviewed and approved (i) the Proposed Advisory Agreement with RiverSource for each Fund and (ii) the Proposed Subadvisory Agreement for those Funds that currently have investment subadvisory agreements with Marsico Capital, Mackay Shields, and Brandes (the "Subadvised Funds") (Marsico Capital, MacKay Shields and Brandes are collectively referred to as the "Subadvisers"). Prior to approving the Proposed Advisory Agreements, the Trustees were presented with, and requested, received and evaluated, extensive materials about RiverSource, the sale of a portion of the asset management business of Columbia Managemen t Group, LLC to Ameriprise (the "Transaction") and related matters from RiverSource, Ameriprise and Columbia. In this regard, the Trustees reviewed RiverSource's responses to a series of detailed requests submitted by the Independent Trustees' independent legal counsel and by the Independent Fee Consultant (as defined below).
The Trustees also reviewed and considered information received in connection with their most recent consideration and reapproval in November 2009 of the current advisory agreement (the "Current Advisory Agreement") and current subadvisory agreement (the "Current Subadvisory Agreement"), as applicable, for each Fund, including information about the Subadvisers (the "Current Agreement Re-Approval Process"). Moreover, the Trustees and committees of the Boards met on several occasions, and received extensive materials, throughout the course of the year relating to the Current Agreement Re-Approval Process, which the Trustees considered relevant to their consideration and approval of the Proposed Advisory and Subadvisory Agreements. The Trustees also consulted with Fund counsel and with the Independent Trustees' independent legal counsel, who advised on the legal standards for consideration by the Trustees, and otherwise assisted the Trustees in their deliberations.
In advance of the meeting on December 21, 2009, the Trustees held several meetings, including meetings held in-person with representatives from RiverSource and Ameriprise on August 26, 2009, November 5-6, 2009, December 9-10, 2009 and December 14, 2009, and additional meetings with representatives of Columbia, to discuss the Transaction, RiverSource's plans and intentions regarding the Funds and various proposals that were being presented as a result of the Transaction, including the Proposed Advisory and Subadvisory Agreements. In addition to these meetings, telephonic meetings and discussions were held on several occasions between individual Trustees, members of the committees of the Boards, their independent legal counsel and representatives from RiverSource, Ameriprise and/or Columbia.
The Trustees also reviewed and considered a report prepared and provided by the Fee Consultant (the "Fee Consultant") appointed by the Independent Trustees pursuant to an assurance of discontinuance entered into by a predecessor to Columbia with the New York Attorney General ("NYAG") to settle a civil complaint filed by the NYAG relating to trading in mutual fund shares (the "NYAG Settlement"). The Fee Consultant's role was to manage the process by which management fees are negotiated so that they were negotiated
38
in a manner that is at arms' length and reasonable. The Fee Consultant found that the fee negotiation process was, to the extent practicable, at arms' length and reasonable and consistent with the requirements of the NYAG Settlement. A summary of the Fee Consultant's report is available at www.columbiafunds.com.
The following summarizes a number of the material factors considered by the Trustees in reaching their approvals and determinations with respect to the Proposed Advisory Agreements and Proposed Subadvisory Agreements. It is followed by a more detailed discussion of the Trustees' consideration of these and other factors considered relevant by the Trustees in their evaluation of the Proposed Advisory Agreements and Proposed Subadvisory Agreements. In voting to approve the Proposed Advisory and Subadvisory Agreements for each Fund, the Trustees also considered substantially the same factors, as relevant, and reached substantially the same conclusions in their approval of interim advisory and subadvisory agreements for each Fund.
(i) the terms and conditions of the Proposed Advisory Agreements compared to the terms and conditions of the Current Advisory Agreements, as described below;
(ii) the fact that each Fund's total advisory fees would remain the same;
(iii) the qualifications of the personnel of RiverSource, Ameriprise and the Subadvisers expected to provide advisory and administrative services to each Fund, including representations by Ameriprise regarding its retention of the same process for monitoring and evaluating portfolio management personnel for each Fund as currently used by Columbia;
(iv) the terms and conditions of the Proposed Subadvisory Agreements compared to the terms and conditions of the Current Subadvisory Agreements;
(v) the reputation, financial strength, regulatory and compliance histories and resources of RiverSource and Ameriprise, and the potential benefits to the Funds of the combination of RiverSource and Columbia, including that the Funds are expected to continue to have access to existing distribution channels and have the potential for expanded distribution of Fund shares, the expected depth and breadth of investment management capabilities, that there is not expected to be any diminution in the nature, quality and extent of services to be provided to the Funds under the Proposed Advisory Agreements and the potential for the realization of additional economies of scale over time and the potential of the Funds to share in, and benefit from, these economies, if any;
(vi) that Ameriprise has committed to refrain from imposing or seeking to impose, for a period of not less than two years after the closing of the Transaction (the "Closing"), any "unfair burden" (within the meaning of Section 15(f) of the 1940 Act) on any Fund;
(vii) the terms and conditions of certain other agreements and arrangements relating to the future operations of the Funds and their distribution channels, including the administrative services agreement and the new services and distribution agreement;
(viii) that the Trustees recently had completed the Current Agreement Re-Approval Process for each Fund and had determined that they were satisfied with the nature, extent and quality of services provided thereunder and that the management fee rates and (where applicable) subadvisory fee rates for each Fund were satisfactory;
(ix) that RiverSource was willing to commit to maintain net operating expense ratios at current levels for at least the period currently covered by Columbia's existing commitments;
(x) the capabilities of RiverSource and the Subadvisers with respect to compliance, including an assessment of RiverSource's compliance program by the Funds' Chief Compliance Officer;
(xi) that certain members of RiverSource's management and certain Columbia personnel that will be integrated into RiverSource and its affiliates as a result of the Transaction have substantial experience in integrating fund families; and
39
(xii) that Ameriprise and Bank of America Corporation would bear the costs of obtaining approvals of the Proposed Advisory and Subadvisory Agreements.
In their deliberations, the Trustees did not identify any single item that was paramount or controlling and individual Trustees may have attributed different weights to various factors. The Trustees also evaluated all information available to them on a Fund-by-Fund basis, and their determinations were made separately in respect of each Fund.
Nature, Extent and Quality of Services to be Provided. The Trustees received and considered various data and information regarding the expected nature, extent and quality of services to be provided to the Funds by RiverSource and the Subadvisers under the Proposed Advisory and Subadvisory Agreements. The most recent investment adviser registration forms for RiverSource and each Subadviser were made available to the Boards, as well as extensive materials from RiverSource, Ameriprise and Columbia. The Trustees reviewed and analyzed these materials, which included, among other things, information about the background and experience of expected senior management of RiverSource and Ameriprise after the Closing. The Trustees considered RiverSource's ability to provide administrative services to the Funds, noting that while the aggregate scope of advisory an d administrative services was not expected to change following the Closing, the allocation of services was expected to shift, to a limited extent, such that administrative services will be provided under a new administrative services agreement. The Trustees considered, among other things, the capacity and quality of RiverSource's and the Subadvisers' investment management, research and trade execution capabilities and other resources that would be dedicated to performing services for the Funds. The Trustees also considered matters related to RiverSource's and the Subadvisers' compliance programs and compliance records, including RiverSource's portfolio transaction policies and procedures. The Trustees discussed with senior management personnel their ability to administer and oversee outside service providers to the Funds and their shareholders and were satisfied with management's processes for providing services and overseeing and reviewing services to be rendered by outside sources.
In evaluating the services to be provided under the Proposed Advisory and Subadvisory Agreements, the Trustees factored in their extensive discussions with representatives of Columbia, RiverSource and Ameriprise at the meetings referenced above regarding the management of each Fund. The Trustees considered representations by Ameriprise that it was expected that there will be no diminution in the nature and quality of services provided to the Funds. The Trustees noted that Columbia Management Group's current President, Columbia's current Chief Investment Officer and Columbia's current President, were expected to continue to serve the Funds in similar capacities after the Closing. With respect to portfolio management, the Trustees reviewed information regarding the deliberative process for selecting portfolio management personnel to continue servicing the Funds after the Closing, including the expected role of Columbia's Chief Inv estment Officer in evaluating and selecting portfolio management personnel for each Fund utilizing Columbia's current analytical model for evaluating portfolio managers. In this regard, the Trustees also weighed representations by Ameriprise that this investment management evaluative process was likely to result in a significant number of Columbia investment professionals and personnel currently responsible for management of the Funds to remain in place. The Trustees noted that the portfolio management evaluation and selection process was designed to optimize the portfolio management resources available to each Fund by having the ability to select investment personnel for the Funds from the combined organization. Similarly, the Trustees evaluated the ability of RiverSource and the Subadvisers, based on their respective resources, reputations and other attributes, to attract and retain qualified investment professionals. In this regard, the Trustees considered information regarding the nature of the compensat ion structure applicable to portfolio managers and other key investment personnel.
The Trustees reviewed and considered information from Ameriprise and RiverSource regarding various contemplated service provider arrangements, including information regarding both immediate and potential future plans in respect of these arrangements. In this regard, the Trustees considered information regarding potential distribution, transfer agency and custody arrangements and the evaluation of fund accounting, financial reporting and valuation service model options, noting certain differences between Columbia's and RiverSource's current approaches, including that RiverSource has historically utilized services provided "in-house" or by its affiliates for fund accounting, financial reporting and valuation. The Trustees reviewed information
40
from Ameriprise and RiverSource regarding the expectation for rationalized or harmonized fees as part of the integration after the Closing in order to develop consistent service fee schedules across the combined fund family. The Trustees noted Ameriprise's representations that, to the extent any such proposals were recommended to the Board after the Closing, they would not result in an "unfair burden" (within the meaning of Section 15(f) of the 1940 Act) on any Fund.
In addition, the Trustees reviewed and evaluated materials and information received regarding the investment and legal compliance programs of the Funds, RiverSource and the Subadvisors, including their compliance policies and procedures and reports of the Funds' Chief Compliance Officer. In this regard, the Trustees considered that Columbia's current Chief Compliance Officer was expected to serve in the same role after the Closing.
The Trustees also noted that Ameriprise and certain of its affiliates have been involved in a number of legal, arbitration and regulatory proceedings, including routine litigation, class actions, and governmental actions, concerning matters arising in connection with the ordinary conduct of their business activities, and that Ameriprise indicated that neither Ameriprise nor any of its affiliates are the subject of any pending legal, arbitration or regulatory proceedings that are likely to have a material adverse effect on the Funds or the ability of Ameriprise or its affiliates, including RiverSource to provide services to the Funds.
Based on the foregoing and other information considered relevant, the Trustees concluded that, overall, they were satisfied with assurances from Columbia, RiverSource, Ameriprise and the Subadvisers as to the expected nature, extent and quality of services to be provided to each Fund under the Proposed Advisory and Subadvisory Agreements.
Investment Advisory and Subadvisory Fee Rates and Other Expenses. The Trustees reviewed and considered the proposed contractual investment advisory fee rates to be paid by each Fund to RiverSource for investment management services both separately and together with the administration fee rates to be paid by the Funds to RiverSource (the "Contractual Management Rates"), which are the same as the separate and aggregate advisory and administrative fee rates currently paid by each Fund to Columbia. The Trustees also reviewed and considered the proposed subadvisory fee rates and the fee arrangements under the Proposed Subadvisory Agreements, respectively, which are also the same as those currently in effect under the Current Subadvisory Agreements. In addition to the materials provided by Columbia, RiverSource provided information regarding the current fee s for each of the RiverSource funds and other relevant institutional accounts. The Trustees reviewed and considered the proposed fee waiver/cap arrangements applicable to the Contractual Management Rates and considered the Contractual Management Rates after taking the waivers/caps into account (the "Actual Management Rates"). In this regard, the Trustees noted that RiverSource had committed to maintain the Funds' current expense limitation and waiver arrangements (both contractual and voluntary). The Trustees considered the potential that, after the Closing, RiverSource would propose a common fee and expense structure for the combined fund family, subject to the commitment that Ameriprise will not seek any change that would result in an "unfair burden" on any Fund. The Trustees also considered the report prepared and provided by the Fee Consultant. Additionally, the Trustees received and afforded specific attention to information provided in connection with the Current Agreement Re-Approval Process, comparin g the Contractual Management Rates and Actual Management Rates with those of other funds in each Fund's Peer Group (as defined below).
During the Current Agreement Re-Approval Process, the Trustees reviewed and considered statistical information regarding each Fund's total expense ratio and its various components, including contractual advisory fees, actual advisory fees, actual nonmanagement fees, Rule 12b-1 and non-Rule 12b-1 service fees, fee waivers/caps and/or expense reimbursements. The Trustees also reviewed comparisons of these fees to the expense information for the group of Funds that was determined by Lipper Inc. ("Lipper") to be the most similar to a given Fund (the "Peer Group") and to the performance of a broader universe of relevant funds as determined by Lipper (the "Universe"), which comparative data was provided by Lipper, an independent provider of investment company data.
The Trustees were provided with a description of the methodology used by Lipper to select the mutual funds in each Fund's Peer Group and Universe and reviewed the degree of comparability resulting from the selection methodology. For
41
certain Funds, Lipper determined that changing the composition of the Peer Group and/or Universe for expenses from that used for performance would provide a more accurate basis of comparison. The Trustees also considered Lipper data that ranked each Fund based on: (i) each Fund's one- and three-year performance compared to actual management fees; and (ii) each Fund's one- and three-year performance compared to total expenses.
For each Fund, except as otherwise described in the Fund-specific discussion below, the Trustees noted that they had concluded during the Current Agreement Re-Approval Process that the Contractual Management Rates, the Actual Management Rates and the total expense ratio were at acceptable levels in light of the quality of services provided to the Fund and in comparison to such Fund's Peer Group and Universe, as applicable; that the advisory fee rate would not be increased for any Fund; that Ameriprise and RiverSource had represented that the overall expenses for each Fund were not expected to be adversely affected by the Transaction; and that RiverSource had committed to maintain the Funds' current expense limitation or waiver arrangements (both contractual and voluntary).
Based on the foregoing, other relevant information received and the additional information described in the Fund-specific discussion below, as applicable, the Trustees concluded that the Contractual Management Rates, the Actual Management Rates and the total expense ratio were acceptable.
Fund Performance. The Trustees reviewed detailed performance information for each Fund at various Board and committee meetings during the year in addition to the additional performance information that they reviewed and evaluated in connection with the Transaction. The Trustees also reviewed and evaluated detailed performance information for each Fund in connection with the Current Agreement Re-Approval Process. The Trustees considered the performance results for each of the Funds over multiple measurement periods. They also considered these results in comparison to the performance results of each Fund's Peer Group and Universe, as well as to each Fund's benchmark index. The Boards also noted certain risk-adjusted performance data.
The Trustees also reviewed and evaluated information and data regarding the investment performance record of RiverSource in managing funds with investment strategies generally similar to those of the Funds, as applicable. Investment performance for such funds was provided for a wide range of periods.
The Trustees recognized that the investment performance record of RiverSource in managing funds with similar objectives may be less relevant to their deliberations in situations where the current portfolio managers of Columbia are expected to continue managing a particular Fund following the Closing. They also recognized that for each Fund, it is not possible to predict with certainty what effect, if any, consummation of the Transaction will have on the future performance of the Funds, noting in particular that past investment performance is no assurance of future results. The Fund-by-Fund discussion set forth below provides additional information regarding those Funds highlighted as meeting agreed-upon criteria for warranting further review. Such criteria included, among other things, information relating to Actual Management Rates, total expense ratios and/or performance information, relative to a Fund's Peer Group and/or Univ erse.
Costs of Services to be Provided and Profitability. In considering the costs of services to be provided by RiverSource and the Subadvisers under the Proposed Advisory Agreement and Proposed Subadvisory Agreement, as applicable for each Fund, and the projected range of profitability to RiverSource and the Subadvisers from their relationships with the Funds, the Trustees considered, among other things, that there would be no increase in advisory or subadvisory fee rates under the Proposed Advisory and Subadvisory Agreements. The Trustees further noted, with respect to RiverSource, that it was not possible to predict with certainty how RiverSource's profitability would be affected by becoming the investment adviser to the Funds but, as a general matter, they were satisfied, based on their review of RiverSource's projected range of profitability assuming completion of the Transaction, that this projected profitability from their relationship with the Funds would not be excessive. The Trustees based their review, in part, on information regarding RiverSource's current profitability in managing the RiverSource Funds and the information available to the Trustees with respect to RiverSource's expense budgeting process. The Trustees also noted that they would have ongoing opportunities to address RiverSource's profitability in the future based on actual results. The Trustees did not consider
42
separate profitability information with respect to the Subadvisers, as their profitability from their relationships with the Funds was not a material factor in determining whether to approve the Proposed Subadvisory Agreements. The Trustees also noted that the subadvisory fees paid to the Subadvisers, none of which is affiliated with Columbia, had previously been negotiated on an arms' length basis.
The Trustees also reviewed information about the financial condition of RiverSource and the Subadvisers and were satisfied that RiverSource and the Subadvisers have adequate resources to perform the services required under the Proposed Advisory and Proposed Subadvisory Agreements.
Subject to the limitations noted above, the Trustees concluded that they were satisfied that RiverSource's projected range of future profitability, and each Subadviser's historical profitability, from their relationship with each Fund, as relevant, were not excessive.
Economies of Scale. The Trustees received and evaluated information regarding the potential to realize economies of scale with respect to management of the Funds, whether the Funds would appropriately benefit from any economies of scale and whether there was any potential for realization of further economies of scale in connection with the Transaction. The Trustees noted that the current and proposed investment advisory fee rates for most of the Funds contain breakpoints that reduce the fee rate on assets above specified levels. The Trustees noted that RiverSource had indicated that no changes to the Funds' breakpoint arrangements were proposed to be made at this time. In light of these factors and noting that it was not possible to evaluate with certainty if and how the Transaction would produce any immediate opportunities for additional economies of scale, the Trustees concluded that each Fund's breakpoint arrangements were acceptable. The Trustees also recognized that the Funds may benefit from certain economies of scale over time from becoming a part of the larger RiverSource fund complex, based on potential future synergies of operations, potential fee harmonization/rationalization initiatives and potential future Fund mergers. The Trustees noted, in particular, RiverSource's acknowledgement of the principle that the Funds should share in certain economies of scale if realized by RiverSource. In addition, the Trustees evaluated the likelihood that there would be potential Fund mergers after the Closing. The Trustees noted that any such potential Fund mergers, if approved, could result in the achievement of additional breakpoints for Funds that have implemented breakpoint fee schedules. The Trustees also noted that they expect to consider economies of scale from time to time following the Closing and thus be in a position to evaluate any additional e conomies of scale.
The Trustees acknowledged the inherent limitations of any analysis of an investment adviser's economies of scale, stemming largely from the Trustees' understanding that economies of scale are generally realized, if at all, by an investment adviser across a variety of products and services, not just with respect to a single fund.
Information About Investment Management Services to Non-Mutual Fund Clients. The Trustees also received and reviewed information about the nature and extent of services and fee rates offered by Riversource and the Subadvisers to the Funds compared with other clients with similar accounts, including separate accounts and institutional investments. The Trustees noted that the Funds may receive services different from those offered to other clients of RiverSource and the Subadvisers and concluded that the advisory fee rates under the Proposed Advisory Agreements and the subadvisory fee rates under the Proposed Subadvisory Agreements were not excessive, given the nature and extent of services expected to be offered and other factors, including the Trustees' review of Lipper data.
Other Benefits to RiverSource and the Subadvisers. The Trustees received and reviewed information regarding any expected "fall-out" or ancillary benefits to be received by RiverSource and its affiliates and by the Subadvisers as a result of their relationships with the Funds.
Among other things, the Trustees noted that RiverSource would benefit from soft dollar arrangements using portfolio brokerage of each Fund that invests in equity securities. The Trustees also noted that the Subadvisers also had benefited from, and expected to continue to benefit from, soft dollar arrangements using portfolio brokerage of the Subadvised Funds. The Trustees acknowledged RiverSource's representation that none of its affiliated broker dealers was expected to provide brokerage services to any Fund, but noted that broker-dealer affiliates of RiverSource will receive distribution related fees from the Funds in respect of shares held in certain accounts, and that such Funds' distributor
43
(which will also become a subsidiary of RiverSource following the closing of the Transaction) retains a portion of the distribution related fees from the Funds and receives a portion of the sales charges on sales or redemptions of certain classes of shares of the Funds. The Trustees recognized that RiverSource's and the Subadvisers' profitability would be somewhat lower without these benefits. The Trustees concluded that RiverSource and the Subadvisers may derive reputational benefits from their association with the Funds. The Trustees also noted, however, that such benefits were difficult to quantify with certainty.
Fund-Specific Considerations for Certain "Review" Funds. During the Current Agreement Re-Approval Process, a limited number of Funds were highlighted as meeting agreed-upon criteria for warranting further review. Such criteria included, among other things, information relating to Actual Management Rates, total expense ratios and/or performance information, relative to a Fund's Peer Group and/or Universe. For such "review" Funds, the Trustees engaged in further analysis with regard to the approval of the Funds' Current Advisory Agreements. For each such Fund, the Trustees subsequently considered the impact of transitioning investment management responsibilities to RiverSource.
The Trustees engaged in further review of Columbia Marsico Growth Fund because its Actual Management Rate was appreciably above the median range of its Peer Group, its total expense ratio was above the median range of its Peer Group and its performance over certain periods was appreciably below the median range of its Universe. However, the Trustees noted other factors such as positive performance over other periods, recent improvements in the Fund's total expense rankings, the inherently higher cost structure of subadvised funds, the implementation of a group breakpoint structure and contractual advisory fee waivers in January 2008 for the Funds subadvised by Marsico Capital, the recent implementation of additional voluntary expense limitations and recent enhancements to Columbia's subadviser oversight process. Taking into account these matters and other factors considered, the Trustees concluded that the Fund's performance, Ac tual Management Rate and total expense ratio were, at this time, acceptable, under the circumstances.
Conclusion. After an evaluation of the above-described factors and based on its deliberations and analysis of the information provided and alternatives considered, each Board, including all of the Independent Trustees, concluded that approval of the Proposed Advisory and Subadvisory Agreements was in the best interests of each of the Funds and its shareholders. Accordingly, the Boards unanimously approved the Proposed Advisory and Subadvisory Agreements.
44
Summary of Management Fee Evaluation by
Independent Fee Consultant
EXCERPTS FROM REPORT OF INDEPENDENT FEE CONSULTANT TO THE FUNDS SUPERVISED BY THE COLUMBIA NATIONS BOARD
Prepared Pursuant to the February 9, 2005
Assurance of Discontinuance among the
Office of Attorney General of New York State,
Columbia Management Advisors, LLC, and
Columbia Management Distributors, Inc.
November 12, 2009
I. Overview
On February 9, 2005, Columbia Management Advisors, LLC ("CMA") and Columbia Management Distributors, Inc.1 ("CMD") agreed to the New York Attorney General's Assurance of Discontinuance ("AOD"). Among other things, the AOD stipulates that CMA may manage or advise a Columbia Fund ("Columbia Fund" and, together with some or all of such funds, the "Columbia Funds") only if the Independent Members of the Columbia Fund's Board of Trustees appoint a Senior Officer or retain an Independent Fee Consultant ("IFC") who is to manage the process by which proposed management fees are negotiated. The AOD further stipulates that the Senior Officer or IFC is to prepare a written annual evaluation of the fee negotiation process.
With effect from January 1, 2007, the Independent Members of the Board of Trustees for certain Columbia Funds known collectively as the "Nations Funds" (together with the other members of that Board, the "Trustees") retained me as IFC for the Nations Funds.2 In this capacity, I have prepared the fifth annual written evaluation of the fee negotiation process. As was the case with the 2007 and 2008 reports, my immediate predecessor as IFC, John Rea, provided invaluable assistance in the preparation of this year's report.
A. Role of the Independent Fee Consultant
The AOD charges the IFC with "managing the process by which proposed management fees...to be charged the Columbia Fund are negotiated so that they are negotiated in a manner which is at arms' length and reasonable and consistent with this Assurance of Discontinuance." The AOD also provides that CMA "may manage or advise a Columbia Fund only if the reasonableness of the proposed management fees is determined by the Board of Trustees...using...an annual independent written evaluation prepared by or under the direction of...the Independent Fee Consultant." Therefore, the AOD makes clear that the IFC does not supplant the Trustees in negotiating management fees with CMA, nor does the IFC substitute his or her judgment for that of the Trustees with respect to the reasonableness of proposed fees or any other matter that is committed to the business judgment of the Trustees.
B. Elements Involved in Managing the Fee Negotiation Process
In preparing the report required by the AOD, the IFC must consider at least the following six factors set forth in the AOD:
1. The nature and quality of CMA's services, including the Fund's performance;
2. Management fees (including any components thereof) charged by other mutual fund companies for like services;
3. Possible economies of scale as the Fund grows larger;
4. Management fees (including any components thereof) charged to institutional and other clients of CMA for like services;
5. Costs to CMA and its affiliates of supplying services pursuant to the management fee agreements, excluding any intra-corporate profit; and
6. Profit margins of CMA and its affiliates from supplying such services.
C. Organization of the Annual Evaluation
This report, like last year's, focuses on the six factors and contains a section for each factor except that CMA's costs and profits from managing the Funds are treated in a single section. In addition to a discussion of these factors, the report offers recommendations to improve the fee review process in future years. A review of the status of recommendations made in the 2008 Report is being provided separately with the materials for the November meeting.
1 CMA and CMD are subsidiaries of Columbia Management Group, LLC ("CMG"), and are the successors to the entities named in the AOD.
2 I have no material relationship with Bank of America, CMG or any of its affiliates, aside from serving as IFC, and I am aware of no material relationship with any of their affiliates. I retained John Rea, an independent economic consultant, to assist me with this report.
Unless otherwise stated or required by the context, this report covers only the Nations Funds, which are also referred as the "Funds."
45
II. Summary of Findings
A. General
1. Based upon my examination of the information supplied by CMG in the light of the six factors set forth in the AOD, I conclude that the Trustees have the relevant information necessary to evaluate the reasonableness of the proposed management fees for each Nations Fund, subject to the following: on September 30, 2009, Ameriprise Financial, Inc. ("Ameriprise") announced that it had agreed to purchase the investment management business of CMG with the exception of its cash and liquidity management business which includes the Nations money market Funds. As a result, the Trustees requested information from CMG as to the plans of CMG and its parent with respect to the provision of investment management services to those Funds after the consummation of the proposed transaction. As of the date of this report, that information has not yet been provided. However, as the transaction is not expected to close until the spring o f 2010, the Trustees concluded that they would have ample opportunity to take appropriate steps with respect to the investment management agreements of the money market Funds, including invoking the 60-day termination provisions of those agreements, in response to the information to be provided by CMG and reviewed by the IFC.
2. In my view, the process by which the proposed management fees of the Funds have been negotiated in 2009 thus far has been, to the extent practicable, at arms' length and reasonable and consistent with the AOD.
B. Nature and Quality of Services, Including Performance
3. The performance of the Funds was relatively strong for the measuring periods ending March 31, 2009. Between one-third and nearly one-half of the Funds were ranked in either the first or second quintiles in the one-, three-, five-, and 10-year periods, and no more than 8% were in the fifth quintile for these periods. Overall, the performance was stronger in the two longer periods.
4. The strongest performing groups over the one-, three-, and five-year periods were active equity, quantitative strategies, and, to a lesser extent, money market Funds. Sub-advised Funds were the weakest performers, with over 60% of the Funds in the bottom two quintiles in the one- and three-year periods. For the same two periods, no more than 15% percent of the sub-advised Funds were in the top two quintiles. Almost half of fixed-income Funds ranked in the bottom two quintiles in the one- and three-year periods.
5. Overall performance of the Funds was less robust in 2009 than in 2008 and 2007 for the one- and three-year performance periods. For example, 62% of the Funds were in the top two quintiles in 2007 for the one-year period compared with 33% in 2009. The ranks of those in the bottom two quintiles rose significantly between 2007 and 2009, led by money market and fixed-income Funds in the one- and three-year periods. For the three-year period, there was a similar trend with respect to sub-advised Funds.
6. The performance of the active equity Funds against their benchmarks was strong for the one-, three-, and five-year performance periods. In contrast, more than half of the sub-advised Funds failed to beat their benchmarks on a net basis in the one- and three-year periods. The fixed-income Funds consistently produced gross returns below those of their benchmarks. Lipper quintile rankings of the actively managed equity Funds are highly correlated with their performance against their benchmarks in the sense that net returns in excess of the benchmark appear necessary to achieve a ranking in one of the top three quintiles. No such correlation was observed for fixed-income and quantitative strategies Funds.
7. The equity Funds' overall performance adjusted for risk was mixed. Based upon three-year returns, less than 40% of the equity Funds had a combination of risk-adjusted and unadjusted returns that placed them in the top half of their performance universes; 60% were in the bottom half of their universes. About 30% of the fixed income Funds posted high returns and low risk relative to comparable funds. Over 60% of the fixed-income Funds took on more risk than the typical fund in their performance universes.
8. The industry-standard procedure used by Lipper that includes all share classes in the performance universe tends to bias a Fund's ranking upward within that universe. The bias occurs because either no-12b-1 fee or low-12b-1 fee share classes of the Nations Funds are compared with funds in performance universes that
46
include all share classes of multi-class funds with 12b-1 fees of up to 100 basis points. Correcting this bias by limiting the performance universe to classes of comparable funds with low or no 12b-1 fees (a "filtered universe") lowers the relative performance for the Funds, but generally not to a material extent. The filtering process, however, did identify two Funds for further review that had not been so identified using unfiltered universes.
9. A small number of Funds have consistently underperformed over the past five years. The exact number depends on the criteria used to evaluate longer-term performance. For example, six different Funds have had below-median performance in at least four out of the five years between 2005 and 2009 for either the one- or three-year performance periods from 2005 to 2009. If the threshold were the 60th percentile, only two Funds would have satisfied the criteria.
10. The services performed by CMG professionals beyond portfolio management, such as compliance, legal, information technology, risk management, finance, and fund administration, are critical to the success of the Funds and appear to be of high quality.
C. Management Fees Charged by Other Mutual Fund Companies
11. The Funds' management fees and total expenses are generally low relative to those of their peers, with over half the Funds ranking in the most favorable two quintiles. For total expenses, slightly more than one-quarter are in the bottom two quintiles, while slightly less than two-fifths are in the bottom two quintiles for actual management fees. Fixed-income and quantitative strategies Funds have the lowest fees and expenses relative to their peers. The sub-advised Funds account for the majority of Funds in the fifth quintile for both management fees and total expenses.
12. The distribution of management fee rankings has changed little over the past three years, while the distribution of total expense rankings has moved in the direction of higher expenses. The most notable change involving total expenses has been a shift in the number of Funds from the first to the second quintile.
13. The management fees of the non-subadvised Funds are generally in line with those of Columbia Funds supervised by the Atlantic Board of Trustees (the "Atlantic Funds"). The sub-advised large cap equity, international equity, and high yield Funds, however, generally have higher management fees than those of comparable Atlantic and non-subadvised Funds.
14. The implementation of the new program of voluntary expense limits appears to have been associated, on balance, with less favorable expense rankings. This result reflects increases in expense limits for certain Funds, the removal of fee waivers, and the shift of certain expenses from CMA to the Funds. The decline in expense rankings is less significant, however, than CMA projected in December 2008.
D. Trustees' Advisory Contract Review Process
15. The Trustees' evaluation process identified 22 Funds in 2009 for further review based upon long-standing criteria relating to their relative performance or expenses or both. When compared in filtered universes, two more Funds met the criteria for further review. At the November meeting, CMG provided further information about each of those Funds to assist the Trustees in their evaluation.
E. Potential Economies of Scale
16. CMG presented to the Trustees its analysis of the sources and sharing of potential economies of scale. CMG views economies of scale as arising at the complex level and would regard estimates of scale economies for individual funds as unreliable. In its analysis, CMG did not identify specific sources of economies of scale or provide any estimates of any economies of scale that might arise from future asset growth. CMG's analysis included measures taken by the Trustees and CMG that seek to share any potential economies of scale through breakpoints in management fee schedules, the establishment of expense limits for each Fund, enhanced shareholder services, fund mergers, and operational consolidation.
17. An examination of the contractual fee schedules for five Nations Funds shows that the schedules for Small Cap II, Municipal Reserves, and Treasury Reserves compare favorably with those of their competitors, while the subadvised Marsico Growth and High Yield VS Funds have schedules generally above those of their peers, including
47
funds that do not have a sub-adviser. The group fee with breakpoints that characterizes the money market Fund schedules is not typically found among competitors, nearly all of which have flat fee schedules.
F. Management Fees Charged to Institutional Clients
18. CMG has provided Trustees with comparisons of mutual fund management fees and institutional fees based upon standardized fee schedules and upon actual fees. The results show that, consistent with industry practice, actual and scheduled institutional fees are generally, but not always, lower than the Funds' management fees. CMG provided additional data this year demonstrating that at small asset levels, the effective fee of certain Funds may be equal to or less than institutional fee levels at those asset levels, due to the effect of expense limits on small funds with high gross expenses. CMG also analyzed the differences between the services provided and risks borne on the one hand by a manager of mutual funds and on the other by institutional advisers, and suggested that these differences should be kept in mind when Trustees review the reasonableness of the Funds' management fees.
G. Revenues, Expenses, and Profits
19. The activity-based cost allocation methodology employed by CMG to allocate costs, both direct and indirect, for purposes of calculating Fund profitability is thoughtful and detailed. This year, CMG further refined the technique by allocating additional indirect expenses on an activity basis.
20. The materials provided on CMG's revenues and expenses with respect to the Funds and the methodology underlying their construction form a sufficient basis for Trustees to evaluate the expenses of and profitability to CMG arising out of its relationships with the Funds.
21. CMG provided a firm-wide pro forma 2009 income statement demonstrating the effect of market events beginning in the fourth quarter of 2008 on its revenues and profitability to provide an additional perspective on calendar 2008 profitability data.
22. In 2008, CMG's pre-tax pre- and post-distribution margins on the Nations Funds were above the industry mean and median, based on limited data available for publicly held mutual fund managers and excluding the costs of CMG's money market capital support programs. However, as is to be expected in a 63-Fund complex, some Nations Funds had relatively high pre-tax profit margins in 2008, when calculated solely with respect to management revenues and expenses, while other Nations Funds operated at a loss. There is a positive relationship between Fund size and profitability to CMG, with smaller Funds generally operating at a loss to CMG.
23. CMG pays a fixed percentage of its management fee revenues to an affiliate, U.S. Trust, Bank of America Private Wealth Management, with respect to assets of its clients invested in Nations Funds to compensate it for services it performs with respect to those client assets and for the effect of state law limitations on affiliates charging multiple fees. Based on our analysis of the services provided by this affiliate, we have concluded that all payments other than those for sub-transfer agent or sub-accounting services should be treated as a distribution expense.
III. Recommendations
1) Criteria for review. The Trustees may wish to consider modifying the criteria for identifying a Fund for further review (a "Review Fund") to include criteria that focus exclusively on performance. They may also wish to consider whether it would be useful to apply CMG's own internal monitoring standards for Fund performance to the contract review process, or whether such criteria are more relevant to their ongoing investment oversight.
2) Presentation of Review Fund discussion. CMG should consider whether it could more systematically present in one discussion all relevant information regarding each Review Fund, which is now split into several different portions of the 15(c) materials. For any Fund that has been a Review Fund in consecutive years, CMG should address under what circumstances it could reasonably be anticipated that the Fund would lose that status.
3) Refinement of tax-exempt performance data. Certain single-state tax-exempt Funds compete in extremely small universes and are compared to a multi-state benchmark of uncertain relevance. Notwithstanding the difficulties, CMG should work to improve the reliability of the calculation of relative performance of these Funds. If that is not possible,
48
CMG should provide guidance on how the Trustees should judge the quality of CMG's management of these Funds.
4) Development of risk metrics for asset-allocation, tax-exempt, and money market Funds. CMG has developed and shared with the Trustees quantitative risk metrics comparing equity and taxable fixed-income Funds against their peers. However, reliable risk metrics have not been developed for asset-allocation, tax-exempt fixed income, and money market Funds. We urge CMG to continue its efforts to provide reliable risk measures for these categories of Funds, especially in the cases of asset-allocation and money market funds, because their investors are likely to be motivated at least in part by a desire to manage risk.
5) Profitability data. For any period during which CMG is an affiliate of U.S. Trust, Bank of America Private Wealth Management, CMG should continue to present to the Trustees the profitability of each Fund, each investment style and each complex (of which Nations is one) calculated as follows:
a. Management-only profitability should be calculated without reference to any Private Bank expense.
b. Profitability excluding distribution (which essentially covers the management and transfer agency functions) should be adjusted by removing from the expense calculation any portion of the Private Bank payment not attributable to the performance by the Private Bank of sub-transfer agency or sub-accounting functions.
c. Total profitability, including distribution: No adjustment for Private Bank expenses should be made, because all such expenses represent legitimate fund expenses to be taken into account in calculating CMG's profit margin including distribution.
d. Distribution only: This should include all Private Bank expenses other than those attributable to sub-transfer agency services.
6) Contractual fee analysis. This year CMG presented a new Lipper report comparing the contractual management fees of Funds with those of competitors in similar investment styles. However, the reliability of the conclusion—that Fund management fee breakpoints compared favorably with competitive fee rates—was limited by the use of competitive funds at all asset levels. The sponsors of a $100 million mutual fund may not have given much thought to breakpoints at $5 billion; therefore, that fund's contractual fee at that level is unlikely to compare favorably with that of a $5 billion Fund. Limiting the competitors to the Lipper expense group, whose constituents are similar in size to the relevant Fund, would make the results more meaningful. In addition, the brea kpoints of a select group of Nations Funds (which would differ each year) should continue to be compared to those of industry rivals to ensure that the Funds' breakpoint schedules remain within industry norms. As breakpoint schedules change relatively little each year, performing such a comparison for each Nations Fund each year would not be an efficient use of Trustee and CMG resources.
7) Pro forma profitability data. In any year in which CMG or the Trustees believe that the prior year's profitability is unlikely to be representative of current business results due to changes in markets or for any other reason, CMG should, consistent with this year's practice, prepare a pro forma income statement based on year-to-date actual data and reasonable projections used for its own business planning purposes.
8) Additional institutional data and analysis. While CMG provided a substantial amount of information on its institutional business, we suggest some additional items for future years: (a) profitability data for the institutional business in the format, and based upon the same allocation methodologies, used to present Fund profitability, (b) an explanation of how CMA sets institutional fee breakpoints, which normally begin at asset levels far lower than those found in Fund management fee breakpoints, and (c) distinguishing in all institutional fee materials fees of accounts acquired prior to the development of current fee schedules (so-called "legacy" accounts) from the fees of accounts launched after that time.
9) Management fee disparities. In any future study of management fees, CMG and the Nations Trustees should analyze the differences in management fee schedules. As
49
part of that analysis, CMG should provide an explanation for any significant fee differences among comparable funds across fund families sponsored by CMG, such as differences in the management styles of different Funds included the same Lipper category. Finally, if CMG proposes a management fee change or an expense cap for any mutual fund managed by CMA that is comparable to any Nations Fund, CMG should provide the Trustees with sufficient information about the proposal to allow the Trustees to assess the applicability of the proposed change to the relevant Nations Fund or Funds.
10) Explanation of data supplied to Lipper. Each year, as part of the 15(c) process, CMG retains Lipper to compare the fees and expenses of each Fund to a group of competitors. In many cases, CMG, with the approval of the Trustees, adjusts the actual expense data, which is based on the most recent full fiscal year of the Fund (and each competitive fund) to reflect changes in fees or expense limits that occurred during or after the relevant fiscal year. This improves the reliability and usefulness of the comparison. However, to ensure that the Trustees know when and how CMG adjusted the data, we recommend that CMG prepare a table listing for each Fund what adjustments were made, e.g., to reflect a new expense limitation of x basis points that commenced on y date.
11) Reduction of volume of paper documents submitted. The effort to streamline and better organize the data presented to the Trustees and the process by which that data was prepared and organized continued to be well-received by all parties. Notwithstanding past success, it is always appropriate to look for opportunities to reduce and simplify the presentation of 15(c) data. One possibility would be to remove the 127 pages of biographical data, most if not all of which the Trustees have previously seen as part of their ongoing investment oversight duties, from the paper volume and post it on the Internet-based document storage and retrieval system used by the Funds to provide reference data to Trustees.
Respectfully submitted,
Steven E. Asher
50
This page intentionally left blank.
This page intentionally left blank.
Important Information About This Report
The fund mails one shareholder report to each shareholder address. If you would like more than one report, please call shareholder services at 1-800-345-6611 and additional reports will be sent to you. This report has been prepared for shareholders of Columbia Marsico Growth Fund.
A description of the policies and procedures that the fund uses to determine how to vote proxies and a copy of the fund's voting records are available (i) at www.columbiamanagement.com, (ii) on the Securities and Exchange Commission's website at www.sec.gov, and (iii) without charge, upon request, by calling 1-800-368-0346. Information regarding how the fund voted proxies relating to portfolio securities during the 12-month period ended June 30 is available from the SEC's website. Information regarding how the fund voted proxies relating to portfolio securities is also available from the fund's website, www.columbiamanagement.com.
The fund files a complete schedule of portfolio holdings with the SEC for the first and third quarters of each fiscal year on Form N-Q. The fund's Form N-Q is available on the SEC's website at www.sec.gov and may be reviewed and copied at the SEC's Public Reference Room in Washington, D.C. Information on the operation of the Public Reference Room may be obtained by calling 1-800-SEC-0330.
Please read and consider the investment objectives, risks, charges and expenses for any fund carefully before investing. For a prospectus which contains this and other important information about the fund, contact your Columbia Management representative or financial advisor or go to www.columbiamanagement.com.
Columbia Management Group, LLC ("Columbia Management") is the investment management division of Bank of America Corporation. Columbia Management entities furnish investment management services and products for institutional and individual investors. Columbia Funds are distributed by Columbia Management Distributors, Inc., member of FINRA, SIPC, part of Columbia Management and an affiliate of Bank of America Corporation.
Transfer Agent
Columbia Management Services, Inc.
P.O. Box 8081
Boston, MA 02266-8081
1-800-345-6611
Distributor
Columbia Management
Distributors, Inc.
One Financial Center
Boston, MA 02111
Investment Advisor
Columbia Management Advisors, LLC
100 Federal Street
Boston, MA 02110
53
Columbia Management®
One Financial Center
Boston, MA 02111-2621
PRSRT STD
U.S. Postage
PAID
Holliston, MA
Permit NO. 20
Columbia Management®
Columbia Marsico Growth Fund
Annual Report, February 28, 2010
©2010 Columbia Management Distributors, Inc.
One Financial Center, Boston, MA 02111-2621
800-345-6611 www.columbiafunds.com
SHC-42/35028-0210 (04/10) 10-K1W1U2
Columbia Management®
Annual Report
February 28, 2010
Columbia Marsico Focused Equities Fund
| NOT FDIC INSURED | | May Lose Value | |
|
| NOT BANK ISSUED | | No Bank Guarantee | |
|
Table of Contents
| Fund Profile | | | 1 | | |
|
| Economic Update | | | 2 | | |
|
| Performance Information | | | 4 | | |
|
| Understanding Your Expenses | | | 5 | | |
|
| Portfolio Managers' Report | | | 6 | | |
|
| Financial Statements | | | | | |
|
| Investment Portfolio | | | 8 | | |
|
Statement of Assets and
Liabilities | | | 10 | | |
|
| Statement of Operations | | | 11 | | |
|
Statement of Changes in Net
Assets | | | 12 | | |
|
| Financial Highlights | | | 14 | | |
|
| Notes to Financial Statements | | | 18 | | |
|
Report of Independent Registered
Public Accounting Firm | | | 27 | | |
|
| Federal Income Tax Information | | | 28 | | |
|
| Fund Governance | | | 29 | | |
|
Board Consideration and
Re-Approval of Current Investment
Advisory and Sub-Advisory
Agreements | | | 33 | | |
|
Board Consideration and
Approval of Proposed Investment
Advisory and Sub-Advisory
Agreements | | | 37 | | |
|
Summary of Management
Fee Evaluation by Independent
Fee Consultant | | | 44 | | |
|
Important Information About
This Report | | | 53 | | |
|
The views expressed in this report reflect the current views of the respective parties. These views are not guarantees of future performance and involve certain risks, uncertainties and assumptions that are difficult to predict, so actual outcomes and results may differ significantly from the views expressed. These views are subject to change at any time based upon economic, market or other conditions and the respective parties disclaim any responsibility to update such views. These views may not be relied on as investment advice and, because investment decisions for a Columbia Fund are based on numerous factors, may not be relied on as an indication of trading intent on behalf of any particular Columbia Fund. References to specific securities should not be construed as a recommendation or investment advice.
President's Message

Dear Shareholder:
As we previously announced, Bank of America, N.A. has reached a definitive agreement to sell Columbia Management's long-term asset management business to Ameriprise Financial, Inc. This includes the management of its equity and fixed-income mutual funds.
This transaction combines two leading asset management firms and will create one entity that is expected to rank as one of the top asset managers. It is anticipated that the combined U.S. asset management business will operate under the well-regarded Columbia Management brand. The combined U.S. asset management business will be led by Ted Truscott, currently president, U.S. asset management, annuities and chief investment officer, Ameriprise Financial. Michael A. Jones, currently president of Columbia Management, will serve as president, U.S. asset management. Colin Moore, chief investment officer at Columbia Management, will continue to serve in that role for the combined organization. I will also continue in my role as head of mutual funds, responsible for the delivery of mutual fund products and services to investors.
As a valued investor in Columbia funds, please know that our goal is to ensure a smooth transition and provide you with the highest quality products and services. We will work closely with colleagues at Ameriprise Financial to seek a seamless transition for our clients and to keep you informed as the transition progresses and key decisions are made. We want to assure you that the funds' portfolio managers continue to focus on providing uninterrupted service to Columbia fund shareholders. Columbia Management and Ameriprise Financial will operate independently until all required approvals, including fund board, fund shareholder and other client approvals, have been received and the transaction closes, which is expected to occur in the spring of this year.
Meanwhile, transition teams across the company have been formed to oversee integration efforts including rebranding initiatives, vendor and system consolidations and client communications. Throughout the transition, we seek to build on best practices from both legacy organizations with enhancements to productivity, quality and the delivery of world-class customer experiences.
Clearly, we have a lot of work ahead of us in 2010. We look forward to introducing our combined business with an even wider breadth of products and capabilities. Everyone at Columbia Management and Ameriprise Financial is excited about the opportunities for this combined organization. I share this optimism and believe it will position us as a best-in-class asset management business with the ability to deliver more for clients than ever before.
Sincerely,

J. Kevin Connaughton
President, Columbia Funds
Past performance is no guarantee of future results.
Fund Profile – Columbia Marsico Focused Equities Fund
Summary
g For the 12-month period that ended February 28, 2010, the fund's Class A shares returned 49.12% without sales charge.
g The fund underperformed its benchmark, the S&P 500 Index,1 but performed in line with the average fund in its peer group, the Lipper Large-Cap Growth Funds Classification.2
g Stock selection, primarily in the consumer discretionary and information technology sectors, hampered relative returns while sector positioning helped relative results.
Portfolio Management
Thomas F. Marsico has managed the fund since December 1997 and is Chief Investment Officer of Marsico Capital Management, LLC ("MCM"), investment sub-advisor to the fund. On February 1, 2010, A. Douglas Rao joined Tom F. Marsico as co-manager of the fund.
Columbia Management Advisors, LLC ("CMA") and MCM are SEC-registered investment advisors. CMA is an indirect, wholly owned subsidiary of Bank of America Corporation. CMA has retained MCM to serve as investment sub-advisor. As the investment sub-advisor, MCM makes the investment decisions and manages all or a portion of the fund. MCM is not affiliated with Bank of America.
Subject to satisfying various conditions to closing, effective on or about May 1, 2010, RiverSource Investments, LLC, a subsidiary of Ameriprise Financial, Inc., is expected to become the investment advisor to the fund and change its name to Columbia Management Investment Advisers, LLC. Please see the fund's prospectus dated July 1, 2009, including the supplements thereto, for more information regarding the expected change in investment advisor and any related changes to the portfolio management of the fund.
1The Standard & Poor's (S&P) 500 Index tracks the performance of 500 widely held, large-capitalization U.S. stocks.
2Lipper Inc., a widely respected data provider in the industry, calculates an average total return (assuming reinvestment of distributions) for mutual funds with investment objectives similar to those of the fund. Lipper makes no adjustment for the effect of sales loads.
Indices are not available for investment, are not professionally managed and do not reflect sales charges, fees, brokerage commissions, taxes or other expenses of investing. Securities in the fund may not match those in an index.
Performance data quoted represents past performance and current performance may be lower or higher. Past performance is no guarantee of future results. The investment return and principal value will fluctuate so that shares, when redeemed, may be worth more or less than the original cost. Please visit www.columbiafunds.com for daily and most recent month-end performance updates.
Summary
1-year return as of 02/28/10
| | | +49.12% | |
|
 | | Class A shares
(without sales charge) | |
|
| | | +53.62% | |
|
 | | S&P 500 Index | |
|
Morningstar Style BoxTM

The Morningstar Style BoxTM reveals a fund's investment strategy. For equity funds, the vertical axis shows the market capitalization of the stocks owned, and the horizontal axis shows investment style (value, blend or growth). Information shown is based on the most recent data provided by Morningstar.
1
Economic Update – Columbia Marsico Focused Equities Fund
Summary
For the 12-month period that ended February 28, 2010
g After a sharp decline, stock markets rebounded around the world, as measured by the S&P 500 Index and the MSCI EAFE Index.
| S&P Index | | MSCI Index | |
|
 | |  | |
|
g As investors grew more comfortable with risk, non-Treasury sectors of the bond market rebounded. The Barclays Capital Aggregate Bond Index delivered solid results. High-yield bonds were strong performers, as measured by the JPMorgan Developed BB High Yield Index.
Barclays
Aggregate
Index | |
JPMorgan
Index | |
|
 | |  | |
|
After a deep and difficult recession, the U.S. economy regained its footing midway through calendar year 2009. Gross domestic product (GDP) turned positive in the third quarter of 2009, rising 2.2%, and then gained 5.6% in the fourth quarter according to the estimate released by the Bureau of Economic Analysis. Growth was primarily the result of federal government stimulus spending and a slowdown in inventory reductions. Hopes for a sustained recovery now depend on a variety of factors, including a rebound in consumer spending, an increase in revenues to keep business profits moving higher and a turnaround in the labor market.
The housing market showed some signs of improvement. Existing home sales fell late in the period, but remained above levels of one year ago. According to the National Association of Realtors, the inventory of houses for sale fell over the course of 2009. Housing prices remained unchanged during the past year, but that was progress compared to 2008. The average home price fell in 2008 and since then distressed properties, which accounted for an estimated 38% of sales in January 2010, have weighed on prices because they were heavily discounted.
In the beleaguered labor market, the good news was that there was less bad news. Businesses continued to shed jobs throughout the period, raising the unemployment rate as high as 10.2% in October 2009. However, the pace of job losses slowed markedly by the period's end. Compared to monthly six figure losses of one year ago, 14,000 jobs were added to the labor market in January 2010 and only 14,000 were lost in February 2010.* The rate of unemployment at the end of the period was 9.7%.* Nevertheless, prospects for a quick recovery in the labor markets are dim. In fact, consumer confidence, as measured monthly by The Conference Board, an independen t research organization, took a sharp dive in February. Consumers surveyed cited worsening business conditions, a bleaker outlook for the labor markets and income for their pessimism.
Manufacturing activity remained slow during the first few months of the period. However, a key measure—the Institute for Supply Management's Index—rose above 50 in July and remained well above 50 for the remainder of the period. A value above 50 tends to indicate that the economy is growing. Industrial production turned positive in January 2010, and durable goods orders took a big jump forward. Manufacturing capacity utilization inched upward to 72.6%.
Consumer spending registered both ups and downs during the 12-month period, but the trend at the end of the period was upward, even though personal income decreased in January 2010. In light of uncertainty about the economy and pressure on consumers from a number of sectors, the Federal Reserve Board (the Fed) kept a key short-term interest rate—the federal funds rate—close to zero throughout the period.
*Source: U.S. Bureau of Labor Statistics
1The Standard & Poor's (S&P) 500 Index tracks the performance of 500 widely held, large-capitalization U.S. stocks.
2
Economic Update (continued) – Columbia Marsico Focused Equities Fund
Stocks bottomed, then rebounded
Against a strengthening economic backdrop, a stock market rally that began in mid-March 2009 continued throughout the period. The U.S. stock market returned 53.62% for the 12-month period, as measured by the S&P 500 Index.1 Mid-cap stocks outperformed large and small-cap stocks and value stocks outperformed growth stocks by a solid margin, as measured by their respective Russell indices.2 Outside the U.S., stock market returns were even stronger. The MSCI EAFE Index,3 a broad gauge of stock market performance in foreign developed markets, gained 54.58% (net of dividends, in U.S. dollars) for the period. Emerging stock markets were caught in last year's downdraft, but they bounced back stronger than domestic or developed world markets in 2009 as their economic growth generally outpaced the developed world. The MSCI Emerging Markets Index4 returned 91.63% (net of dividends, in U.S. d ollars).
Bond returns ranged from solid to strong
As hopes for a recovery materialized, bonds from non-Treasury sectors delivered solid returns. The Barclays Capital Aggregate Bond Index5 returned 9.32%. Municipal bonds delivered returns that were in line with taxable investment-grade bonds even without factoring in potential tax advantages to investors in higher income tax brackets. The Barclays Capital Municipal Bond Index6 returned 9.98%. High-yield bond prices rebounded strongly in 2009. For the 12-month period covered by this report, the JPMorgan Developed BB High Yield Index7 returned 32.79%.
Past performance is no guarantee of future results.
2The Russell 1000 Index tracks the performance of 1,000 of the largest U.S. companies, based on market capitalization. The Russell MidCap Index measures the performance of the 800 smallest companies in the Russell 1000 Index, which represents approximately 25% of the total market capitalization of the Russell 1000 Index. The Russell 2000 Index measures the performance of the 2,000 smallest companies in the Russell 3000 Index, which represents approximately 8% of the total market capitalization of the Russell 3000 Index. The Russell 3000 Growth Index measures the performance of those Russell 3000 Index companies with higher price-to-book ratios and higher forecasted growth values. The stocks in this index are also members of either the Russell 1000 Growth or the Russell 2000 Growth indexes. The Russell 3000 Value Index measures the performance of those Russell 3000 Index companies with lower price-to-book ratios and lo wer forecasted growth values. The stocks in this index are also members of either the Russell 1000 Value or the Russell 2000 Value indexes.
3The Morgan Stanley Capital International Europe, Australasia, Far East (MSCI EAFE) Index is a capitalization-weighted index that tracks the total return of common stocks in 21 developed-market countries within Europe, Australasia and the Far East.
4The Morgan Stanley Capital International Emerging Markets Index (MSCI EMI) is a free float-adjusted market capitalization index that is designed to measure equity market performance of emerging markets. As of June 2009, the MSCI Emerging Markets Index consisted of the following 22 emerging market country indices: Brazil, Chile, China, Colombia, Czech Republic, Egypt, Hungary, India, Indonesia, Israel, Korea, Malaysia, Mexico, Morocco, Peru, Philippines, Poland, Russia, South Africa, Taiwan, Thailand, and Turkey.
5The Barclays Capital Aggregate Bond Index is a market value-weighted index that tracks the daily price, coupon, pay-downs and total return performance of fixed-rate, publicly placed, dollar-denominated and non-convertible investment grade debt issues with at least $250 million par amount outstanding and with at least one year to final maturity.
6The Barclays Capital Municipal Bond Index is considered representative of the broad market for investment grade, tax-exempt bonds with maturity of at least one year.
7The JPMorgan Developed BB High Yield Index is an unmanaged index designed to mirror the investable universe of the U.S. dollar developed, BB-rated, high yield corporate debt market.
Indices are not available for investment, are not professionally managed and do not reflect sales charges, fees, brokerage commissions, taxes or other expenses of investing. Securities in the fund may not match those in an index.
3
Performance Information – Columbia Marsico Focused Equities Fund
Performance data quoted represents past performance and current performance may be lower or higher. Past performance is no guarantee of future results. The investment return and principal value will fluctuate so that shares, when redeemed, may be worth more or less than the original cost. Please visit www.columbiafunds.com for daily and most recent month-end performance updates.
Annual operating expense ratio (%)*
| Class A | | | 1.31 | | |
| Class B | | | 2.06 | | |
| Class C | | | 2.06 | | |
| Class Z | | | 1.06 | | |
*The annual operating expense ratio is as stated in the fund's prospectus that is current as of the date of this report. Differences in expense ratios disclosed elsewhere in this report may result from including fee waivers and expense reimbursements as well as different time periods used in calculating the ratios.
Performance of a $10,000 investment 03/01/00 – 02/28/10
The chart above shows the change in value of a hypothetical $10,000 investment in Class A shares of Columbia Marsico Focused Equities Fund during the stated time period, and does not reflect the deduction of taxes that a shareholder may pay on fund distributions or on the redemption of fund shares.
Performance of a $10,000 investment 03/01/00 – 02/28/10 ($)
| Sales charge | | without | | with | |
| Class A | | | 8,323 | | | | 7,844 | | |
| Class B | | | 7,721 | | | | 7,721 | | |
| Class C | | | 7,721 | | | | 7,721 | | |
| Class Z | | | 8,538 | | | | n/a | | |
Average annual total return as of 02/28/10 (%)
| Share class | | A | | B | | C | | Z | |
| Inception | | 12/31/97 | | 12/31/97 | | 12/31/97 | | 12/31/97 | |
| Sales charge | | without | | with | | without | | with | | without | | with | | without | |
| 1-year | | | 49.12 | | | | 40.53 | | | | 48.02 | | | | 43.02 | | | | 48.02 | | | | 47.02 | | | | 49.53 | | |
| 5-year | | | 1.48 | | | | 0.29 | | | | 0.71 | | | | 0.32 | | | | 0.72 | | | | 0.72 | | | | 1.73 | | |
| 10-year | | | –1.82 | | | | –2.40 | | | | –2.55 | | | | –2.55 | | | | –2.55 | | | | –2.55 | | | | –1.57 | | |
Average annual total return as of 03/31/10 (%)
| Share class | | A | | B | | C | | Z | |
| Sales charge | | without | | with | | without | | with | | without | | with | | without | |
| 1-year | | | 50.89 | | | | 42.17 | | | | 49.73 | | | | 44.73 | | | | 49.73 | | | | 48.73 | | | | 51.26 | | |
| 5-year | | | 3.21 | | | | 2.00 | | | | 2.44 | | | | 2.07 | | | | 2.44 | | | | 2.44 | | | | 3.47 | | |
| 10-year | | | –0.82 | | | | –1.40 | | | | –1.55 | | | | –1.55 | | | | –1.55 | | | | –1.55 | | | | –0.57 | | |
The "with sales charge" returns include the maximum initial sales charge of 5.75% for Class A shares and the applicable contingent deferred sales charge of 5.00% in the first year, declining to 1.00% in the sixth year and eliminated thereafter for Class B shares and 1.00% for Class C shares for the first year only. The "without sales charge" returns do not include the effect of sales charges. If they had, returns would be lower.
Performance results reflect any fee waivers or reimbursements of fund expenses by the investment advisor and/or any of its affiliates. Absent these fee waivers or expense reimbursement arrangements, performance results would have been lower.
All results shown assume the reinvestment of distributions. Class Z shares are sold at net asset value with no distribution and service (Rule 12b-1) fees. Class Z shares have limited eligibility and the investment minimum requirements may vary. Please see the fund's prospectus for details. Performance for different share classes will vary based on differences in sales charges and fees associated with each class.
The tables do not reflect the deduction of taxes that a shareholder may pay on fund distributions or on the redemption of fund shares.
4
Understanding Your Expenses – Columbia Marsico Focused Equities Fund
As a fund shareholder, you incur two types of costs. There are transaction costs, which generally include sales charges on purchases and may include redemption fees or exchange fees. There are also ongoing costs, which generally include investment advisory fees, distribution and service (Rule 12b-1) fees and other fund expenses. The information on this page is intended to help you understand the ongoing costs of investing in the fund and to compare these costs with the ongoing costs of investing in other mutual funds.
Analyzing your fund's expenses by share class
To illustrate these ongoing costs, we have provided an example and calculated the expenses paid by investors in each share class during the period. The information in the following table is based on an initial investment of $1,000, which is invested at the beginning of the period and held for the entire period. Expense information is calculated two ways and each method provides you with different information. The amount listed in the "Actual" column is calculated using the fund's actual operating expenses and total return for the period. The amount listed in the "Hypothetical" column for each share class assumes that the return each year is 5% before expenses and is calculated based on the fund's actual operating expenses. You should not use the hypothetical account values and expenses to estimate either your actual account balance at the end of the period or the expenses you paid during this period.
Compare with other funds
Since all mutual funds are required to include the same hypothetical calculations about expenses in shareholder reports, you can use this information to compare the ongoing cost of investing in the fund with other funds. To do so, compare the 5% hypothetical example with the 5% hypothetical examples that appear in the shareholder reports of other funds. As you compare hypothetical examples of other funds, it is important to note that hypothetical examples are meant to highlight the ongoing costs of investing in a fund and do not reflect any transaction costs, such as sales charges, redemption fees or exchange fees.
Estimating your actual expenses
To estimate the expenses that you paid over the period, first you will need your account balance at the end of the period:
g For shareholders who receive their account statements from Columbia Management Services, Inc., your account balance is available online at www.columbiafunds.com or by calling Shareholder Services at 800.345.6611.
g For shareholders who receive their account statements from their financial intermediary, contact your financial intermediary to obtain your account balance.
1. Divide your ending account balance by $1,000. For example, if an account balance was $8,600 at the end of the period, the result would be 8.6.
2. In the section of the table below titled "Expenses paid during the period," locate the amount for your share class. You will find this number in the column labeled "Actual." Multiply this number by the result from step 1. Your answer is an estimate of the expenses you paid on your account during the period.
If the value of your account falls below the minimum initial investment requirement applicable to you, your account generally will be subject to a $20 annual fee. This fee is not included in the accompanying table. If you are subject to the fee, keep it in mind when you are estimating the ongoing expenses of investing in the fund and when comparing the expenses of this fund with other funds.
09/01/09 – 02/28/10
| | | Account value at the
beginning of the period ($) | | Account value at the
end of the period ($) | | Expenses paid
during the period ($) | | Fund's annualized
expense ratio (%) | |
| | | Actual | | Hypothetical | | Actual | | Hypothetical | | Actual | | Hypothetical | | Actual | |
| Class A | | | 1,000.00 | | | | 1,000.00 | | | | 1,102.10 | | | | 1,018.50 | | | | 6.62 | | | | 6.36 | | | | 1.27 | | |
| Class B | | | 1,000.00 | | | | 1,000.00 | | | | 1,098.10 | | | | 1,014.78 | | | | 10.51 | | | | 10.09 | | | | 2.02 | | |
| Class C | | | 1,000.00 | | | | 1,000.00 | | | | 1,098.40 | | | | 1,014.78 | | | | 10.51 | | | | 10.09 | | | | 2.02 | | |
| Class Z | | | 1,000.00 | | | | 1,000.00 | | | | 1,103.60 | | | | 1,019.74 | | | | 5.32 | | | | 5.11 | | | | 1.02 | | |
Expenses paid during the period are equal to the annualized expense ratio for the share class, multiplied by the average account value over the period, then multiplied by the number of days in the fund's most recent fiscal half-year and divided by 365.
It is important to note that the expense amounts shown in the table are meant to highlight only ongoing costs of investing in the fund and do not reflect any transaction costs, such as sales charges, redemption fees or exchange fees. Therefore, the hypothetical examples provided may not help you determine the relative total costs of owning shares of different funds. If these transaction costs were included, your costs would have been higher.
5
Portfolio Managers' Report – Columbia Marsico Focused Equities Fund
Performance data quoted represents past performance and current performance may be lower or higher. Past performance is no guarantee of future results. The investment return and principal value will fluctuate so that shares, when redeemed, may be worth more or less than the original cost. Please visit www.columbiafunds.com for daily and most recent month-end performance updates.
Net asset value per share
as of 02/28/10 ($)
| Class A | | | 18.99 | | |
| Class B | | | 17.46 | | |
| Class C | | | 17.52 | | |
| Class Z | | | 19.39 | | |
Distributions declared per share
03/01/09 – 02/28/10 ($)
| Class A | | | 0.03 | | |
| Class Z | | | 0.07 | | |
For the 12-month period that ended February 28, 2010, the fund's Class A shares returned 49.12% without sales charge. The fund's benchmark, the S&P 500 Index1, returned 53.62%. The average return of the fund's peer group, the Lipper Large-Cap Growth Funds Classification2, was 49.40%. Stock selection in several sectors, particularly consumer discretionary and information technology, detracted from relative performance while sector positioning had a positive impact on relative results.
Limited exposure to weak sectors aided performance
The fund had little or no exposure to the utilities and telecommunication services sectors, which aided relative performance as they were the two weakest performing sectors in the index. In addition, the fund benefited from having less exposure than the index to energy, consumer staples and health care, which lagged the overall return of the index, and from stock selection in energy and health care, where several individual holdings in these sectors made meaningful contributions to performance. In the energy sector, Brazilian-based oil and natural gas producer Petroleo Brasileiro appreciated sharply during the period. We took profits and sold it from the portfolio. In health care, Intuitive Surgical (2.6% of net assets) turned in strong results. Intuitive Surgical produces and markets a robotic system to assist in minimally invasive surgery.
Stock selection disappointments
A weak outlook for consumer spending had a negative impact on the performance of several of the fund's holdings in the consumer discretionary and information technology sectors. Even though financial transaction processors Visa and MasterCard (2.8% and 2.5% of net assets, respectively) posted double-digit gains for the 12-month period, they underperformed the index, hampering the fund's relative returns. Aerospace/defense contractor Lockheed Martin and agricultural products company Monsanto were disappointments. Both stocks were sold before the end of the period.
Summary
Over the last year, we increased the fund's exposure to the financials and materials sectors, while decreasing holdings in the consumer staples and consumer discretionary sectors. At the end of the period, the fund's largest positions were in the information technology, financials, health care, industrials and materials sectors. The fund has no exposure to the telecommunication services or utilities sectors.
Source for all statistical data—Columbia Management Advisors, LLC.
Source for all stock-specific commentary—Marsico Capital Management, LLC.
Portfolio holdings and characteristics are subject to change periodically and may not be representative of current holdings and characteristics. The outlook for the fund may differ from those presented for other Columbia Funds.
1The Standard & Poor's (S&P) 500 Index tracks the performance of 500 widely held, large-capitalization U.S. stocks.
2Lipper Inc., a widely respected data provider in the industry, calculates an average total return (assuming reinvestment of distributions) for mutual funds with investment objectives similar to those of the fund. Lipper makes no adjustment for the effect of sales loads.
Indices are not available for investment, are not professionally managed and do not reflect sales charges, fees, brokerage commissions, taxes or other expenses of investing. Securities in the fund may not match those in an index.
6
Portfolio Managers' Report (continued) – Columbia Marsico Focused Equities Fund
Equity securities are subject to stock market fluctuations that occur in response to economic and business developments.
The fund normally invests in a core portfolio of 20-30 common stocks. By maintaining a relatively concentrated portfolio, the fund may be subject to a greater risk than a fund that is more diversified.
International investing involves special risks, including foreign taxation, currency fluctuations, risks associated with possible differences in financial standards and other risks associated with future political and economic developments.
Investing in emerging markets may involve greater risks than investing in more developed countries. In addition, concentration of investments in a single region may result in greater volatility.
Top 5 sectors
as of 02/28/10 (%)
| Information Technology | | | 23.4 | | |
| Financials | | | 19.7 | | |
| Health Care | | | 14.6 | | |
| Industrials | | | 12.3 | | |
| Materials | | | 12.1 | | |
Top 10 holdings
as of 02/28/10 (%)
| Dow Chemical | | | 7.1 | | |
| Apple | | | 5.9 | | |
| Union Pacific | | | 5.0 | | |
| Wells Fargo | | | 4.7 | | |
| Transocean | | | 4.6 | | |
| Google | | | 3.9 | | |
| Goldman Sachs Group | | | 3.8 | | |
| McDonald's | | | 3.8 | | |
| Baidu | | | 3.7 | | |
| BHP Billiton | | | 3.6 | | |
The fund is actively managed and the composition of its portfolio will change over time. Information provided is calculated as a percentage of net assets.
7
Investment Portfolio – Columbia Marsico Focused Equities Fund
February 28, 2010
| Common Stocks – 99.4% | |
| | | Shares | | Value ($) | |
| Consumer Discretionary – 9.3% | |
| Hotels, Restaurants & Leisure – 5.8% | |
| McDonald's Corp. | | | 1,742,765 | | | | 111,275,545 | | |
| Wynn Macau Ltd. (a) | | | 24,891,410 | | | | 31,265,983 | | |
| Wynn Resorts Ltd. (a) | | | 460,708 | | | | 29,287,207 | | |
| Hotels, Restaurants & Leisure Total | | | 171,828,735 | | |
| Internet & Catalog Retail – 3.5% | |
| Amazon.com, Inc. (a) | | | 369,972 | | | | 43,804,685 | | |
| Priceline.com, Inc. (a) | | | 258,526 | | | | 58,623,356 | | |
| Internet & Catalog Retail Total | | | 102,428,041 | | |
| Consumer Discretionary Total | | | 274,256,776 | | |
| Consumer Staples – 1.1% | |
| Food Products – 1.1% | |
Mead Johnson Nutrition Co.,
Class A | | | 665,290 | | | | 31,468,217 | | |
| Food Products Total | | | 31,468,217 | | |
| Consumer Staples Total | | | 31,468,217 | | |
| Energy – 6.9% | |
| Energy Equipment & Services – 4.6% | |
| Transocean Ltd. (a) | | | 1,715,855 | | | | 136,959,546 | | |
| Energy Equipment & Services Total | | | 136,959,546 | | |
| Oil, Gas & Consumable Fuels – 2.3% | |
| Southwestern Energy Co. (a) | | | 1,603,870 | | | | 68,244,669 | | |
| Oil, Gas & Consumable Fuels Total | | | 68,244,669 | | |
| Energy Total | | | 205,204,215 | | |
| Financials – 19.7% | |
| Capital Markets – 3.8% | |
| Goldman Sachs Group, Inc. | | | 722,441 | | | | 112,953,650 | | |
| Capital Markets Total | | | 112,953,650 | | |
| Commercial Banks – 9.4% | |
| ICICI Bank Ltd., ADR | | | 862,388 | | | | 32,986,341 | | |
| U.S. Bancorp | | | 4,261,338 | | | | 104,871,528 | | |
| Wells Fargo & Co. | | | 5,083,570 | | | | 138,984,804 | | |
| Commercial Banks Total | | | 276,842,673 | | |
| Consumer Finance – 3.0% | |
| American Express Co. | | | 2,352,483 | | | | 89,841,326 | | |
| Consumer Finance Total | | | 89,841,326 | | |
| Diversified Financial Services – 3.5% | |
| JPMorgan Chase & Co. | | | 2,422,658 | | | | 101,678,956 | | |
| Diversified Financial Services Total | | | 101,678,956 | | |
| Financials Total | | | 581,316,605 | | |
| | | Shares | | Value ($) | |
| Health Care – 14.6% | |
| Biotechnology – 2.5% | |
| Gilead Sciences, Inc. (a) | | | 1,573,456 | | | | 74,912,240 | | |
| Biotechnology Total | | | 74,912,240 | | |
| Health Care Equipment & Supplies – 2.6% | |
| Intuitive Surgical, Inc. (a) | | | 223,663 | | | | 77,642,374 | | |
| Health Care Equipment & Supplies Total | | | 77,642,374 | | |
| Pharmaceuticals – 9.5% | |
| Abbott Laboratories | | | 1,950,840 | | | | 105,891,595 | | |
| Johnson & Johnson | | | 1,356,487 | | | | 85,458,681 | | |
| Merck & Co., Inc. | | | 2,427,801 | | | | 89,537,301 | | |
| Pharmaceuticals Total | | | 280,887,577 | | |
| Health Care Total | | | 433,442,191 | | |
| Industrials – 12.3% | |
| Aerospace & Defense – 5.1% | |
| General Dynamics Corp. | | | 1,397,678 | | | | 101,401,539 | | |
| Goodrich Corp. | | | 778,123 | | | | 51,068,212 | | |
| Aerospace & Defense Total | | | 152,469,751 | | |
| Road & Rail – 7.2% | |
| Norfolk Southern Corp. | | | 1,270,589 | | | | 65,346,392 | | |
| Union Pacific Corp. | | | 2,175,561 | | | | 146,567,545 | | |
| Road & Rail Total | | | 211,913,937 | | |
| Industrials Total | | | 364,383,688 | | |
| Information Technology – 23.4% | |
| Communications Equipment – 1.5% | |
| Cisco Systems, Inc. (a) | | | 1,792,907 | | | | 43,621,427 | | |
| Communications Equipment Total | | | 43,621,427 | | |
| Computers & Peripherals – 8.1% | |
| Apple, Inc. (a) | | | 851,271 | | | | 174,187,072 | | |
International Business
Machines Corp. | | | 513,159 | | | | 65,253,299 | | |
| Computers & Peripherals Total | | | 239,440,371 | | |
| Internet Software & Services – 7.6% | |
| Baidu, Inc., ADR (a) | | | 211,609 | | | | 109,757,356 | | |
| Google, Inc., Class A (a) | | | 219,819 | | | | 115,800,649 | | |
| Internet Software & Services Total | | | 225,558,005 | | |
| IT Services – 5.3% | |
| MasterCard, Inc., Class A | | | 334,209 | | | | 74,986,473 | | |
| Visa, Inc., Class A | | | 960,977 | | | | 81,952,119 | | |
| IT Services Total | | | 156,938,592 | | |
See Accompanying Notes to Financial Statements.
8
Columbia Marsico Focused Equities Fund
February 28, 2010
| Common Stocks (continued) | |
| | | Shares | | Value ($) | |
| Software – 0.9% | |
| Adobe Systems, Inc. (a) | | | 778,673 | | | | 26,981,019 | | |
| Software Total | | | 26,981,019 | | |
| Information Technology Total | | | 692,539,414 | | |
| Materials – 12.1% | |
| Chemicals – 8.5% | |
| Dow Chemical Co. | | | 7,363,616 | | | | 208,463,969 | | |
Potash Corp. of
Saskatchewan, Inc. | | | 382,952 | | | | 42,300,878 | | |
| Chemicals Total | | | 250,764,847 | | |
| Metals & Mining – 3.6% | |
| BHP Billiton PLC, ADR | | | 1,720,793 | | | | 106,276,176 | | |
| Metals & Mining Total | | | 106,276,176 | | |
| Materials Total | | | 357,041,023 | | |
Total Common Stocks
(cost of $2,362,766,778) | | | 2,939,652,129 | | |
| | | Par ($) | | | |
| Short-Term Obligation – 0.4% | |
Repurchase agreement with
Fixed Income Clearing Corp.,
dated 02/26/10, due 03/01/10
at 0.050%, collateralized by a
U.S. Government Agency
obligation maturing 11/15/10,
market value $10,120,338
(repurchase proceeds
$9,920,041) | | | 9,920,000 | | | | 9,920,000 | | |
Total Short-Term Obligation
(cost of $9,920,000) | | | 9,920,000 | | |
Total Investments – 99.8%
(cost of $2,372,686,778) (b) | | | 2,949,572,129 | | |
| Other Assets & Liabilities, Net – 0.2% | | | 6,819,698 | | |
| Net Assets – 100.0% | | | 2,956,391,827 | | |
Notes to Investment Portfolio:
(a) Non-income producing security.
(b) Cost for federal income tax purposes is $2,441,794,209.
The following table summarizes the inputs used, as of February 28, 2010, in valuing the Fund's assets:
| Description | | Quoted
Prices
(Level 1) | | Other
Significant
Observable
Inputs
(Level 2) | | Significant
Unobservable
Inputs
(Level 3) | | Total | |
| Common Stocks | |
Consumer
Discretionary | | $ | 242,990,793 | | | $ | 31,265,983 | | | $ | — | | | $ | 274,256,776 | | |
| Consumer Staples | | | 31,468,217 | | | | — | | | | — | | | | 31,468,217 | | |
| Energy | | | 205,204,215 | | | | — | | | | — | | | | 205,204,215 | | |
| Financials | | | 581,316,605 | | | | — | | | | — | | | | 581,316,605 | | |
| Health Care | | | 433,442,191 | | | | — | | | | — | | | | 433,442,191 | | |
| Industrials | | | 364,383,688 | | | | — | | | | — | | | | 364,383,688 | | |
Information
Technology | | | 692,539,414 | | | | — | | | | — | | | | 692,539,414 | | |
| Materials | | | 357,041,023 | | | | — | | | | — | | | | 357,041,023 | | |
| Total Common Stocks | | | 2,908,386,146 | | | | 31,265,983 | | | | — | | | | 2,939,652,129 | | |
Total Short-Term
Obligation | | | — | | | | 9,920,000 | | | | — | | | | 9,920,000 | | |
| Total Investments | | $ | 2,908,386,146 | | | $ | 41,185,983 | | | $ | — | | | $ | 2,949,572,129 | | |
The Fund's assets assigned to the Level 2 input category include certain foreign securities for which a third party statistical pricing service may be employed for purposes of fair market valuation.
For more information on valuation inputs, and their aggregation into the levels used in the table above, please refer to the Security Valuation section in the accompanying Notes to Financial Statements.
At February 28, 2010, the Fund held investments in the following sectors:
| Sector (Unaudited) | | % of
Net Assets | |
| Information Technology | | | 23.4 | | |
| Financials | | | 19.7 | | |
| Health Care | | | 14.6 | | |
| Industrials | | | 12.3 | | |
| Materials | | | 12.1 | | |
| Consumer Discretionary | | | 9.3 | | |
| Energy | | | 6.9 | | |
| Consumer Staples | | | 1.1 | | |
| | | | 99.4 | | |
| Short-Term Obligation | | | 0.4 | | |
| Other Assets & Liabilities, Net | | | 0.2 | | |
| | | | 100.0 | | |
| Acronym | | Name | |
| ADR | | American Depositary Receipt | |
|
See Accompanying Notes to Financial Statements.
9
Statement of Assets and Liabilities – Columbia Marsico Focused Equities Fund
February 28, 2010
| | | | | ($) | |
| Assets | | Investments, at identified cost | | | 2,372,686,778 | | |
| | | Investments, at value | | | 2,949,572,129 | | |
| | | Cash | | | 12 | | |
| | | Receivable for: | | | | | |
| | | Investments sold | | | 7,983,946 | | |
| | | Fund shares sold | | | 3,969,989 | | |
| | | Dividends | | | 3,799,557 | | |
| | | Interest | | | 41 | | |
| | | Prepaid expenses | | | 34,142 | | |
| | | Total Assets | | | 2,965,359,816 | | |
| Liabilities | | Payable for: | | | | | |
| | | Fund shares repurchased | | | 4,692,109 | | |
| | | Investment advisory fee | | | 1,461,742 | | |
| | | Administration fee | | | 482,011 | | |
| | | Pricing and bookkeeping fees | | | 12,235 | | |
| | | Transfer agent fee | | | 948,035 | | |
| | | Trustees' fees | | | 60,681 | | |
| | | Custody fee | | | 13,549 | | |
| | | Distribution and service fees | | | 580,907 | | |
| | | Chief compliance officer expenses | | | 319 | | |
| | | Reports to shareholders | | | 653,654 | | |
| | | Other liabilities | | | 62,747 | | |
| | | Total Liabilities | | | 8,967,989 | | |
| | | Net Assets | | | 2,956,391,827 | | |
| Net Assets Consist of | | Paid-in capital | | | 2,887,005,219 | | |
| | | Accumulated net realized loss | | | (507,498,743 | ) | |
| | | Net unrealized appreciation on investments | | | 576,885,351 | | |
| | | Net Assets | | | 2,956,391,827 | | |
| Class A | | Net assets | | $ | 1,599,660,805 | | |
| | | Shares outstanding | | | 84,253,060 | | |
| | | Net asset value per share | | $ | 18.99 | (a) | |
| | | Maximum sales charge | | | 5.75 | % | |
| | | Maximum offering price per share | | $ | 20.15 | (b) | |
| Class B | | Net assets | | $ | 62,934,794 | | |
| | | Shares outstanding | | | 3,604,306 | | |
| | | Net asset value and offering price per share | | $ | 17.46 | (a) | |
| Class C | | Net assets | | $ | 298,344,047 | | |
| | | Shares outstanding | | | 17,033,617 | | |
| | | Net asset value and offering price per share | | $ | 17.52 | (a) | |
| Class Z | | Net assets | | $ | 995,452,181 | | |
| | | Shares outstanding | | | 51,350,988 | | |
| | | Net asset value, offering and redemption price per share | | $ | 19.39 | | |
(a) Redemption price per share is equal to net asset value less any applicable contingent deferred sales charge.
(b) On sales of $50,000 or more the offering price is reduced.
See Accompanying Notes to Financial Statements.
10
Statement of Operations – Columbia Marsico Focused Equities Fund
For the Year Ended February 28, 2010
| | | | | ($) | |
| Investment Income | | Dividends | | | 39,185,227 | | |
| | | Interest | | | 83,033 | | |
| | | Foreign taxes withheld | | | (463,121 | ) | |
| | | Total Investment Income | | | 38,805,139 | | |
| Expenses | | Investment advisory fee | | | 18,946,739 | | |
| | | Administration fee | | | 6,259,486 | | |
| | | Distribution fee: | | | | | |
| | | Class B | | | 520,025 | | |
| | | Class C | | | 2,265,084 | | |
| | | Service fee: | | | | | |
| | | Class B | | | 173,342 | | |
| | | Class C | | | 755,028 | | |
| | | Distribution and service fees: | | | | | |
| | | Class A | | | 3,765,167 | | |
| | | Transfer agent fee | | | 4,226,259 | | |
| | | Pricing and bookkeeping fees | | | 143,765 | | |
| | | Trustees' fees | | | 45,836 | | |
| | | Custody fee | | | 48,077 | | |
| | | Chief compliance officer expenses | | | 1,751 | | |
| | | Other expenses | | | 1,259,843 | | |
| | | Expenses before interest expense | | | 38,410,402 | | |
| | | Interest expense | | | 2,167 | | |
| | | Total Expenses | | | 38,412,569 | | |
| | | Fees waived by transfer agent | | | (360,809 | ) | |
| | | Expense reductions | | | (45 | ) | |
| | | Net Expenses | | | 38,051,715 | | |
| Net Realized and Unrealized Gain (Loss) on Investments and Foreign Currency | | Net Investment Income | | | 753,424 | | |
| | | Net realized gain (loss) on: | | | | | |
| | | Investments | | | 247,294,377 | | |
| | | Foreign currency transactions | | | (3,049 | ) | |
| | | Net realized gain | | | 247,291,328 | | |
| | | Net change in unrealized appreciation (depreciation) on: | | | | | |
| | | Investments | | | 867,972,949 | | |
| | | Foreign currency translations | | | 126 | | |
| | | Net change in unrealized appreciation (depreciation) | | | 867,973,075 | | |
| | | Net Gain | | | 1,115,264,403 | | |
| | | Net Increase Resulting from Operations | | | 1,116,017,827 | | |
See Accompanying Notes to Financial Statements.
11
Statement of Changes in Net Assets – Columbia Marsico Focused Equities Fund
| Increase (Decrease) in Net Assets | | | | Year Ended
February 28,
2010 ($) | | Year Ended
February 28,
2009 ($) | |
| Operations | | Net investment income | | | 753,424 | | | | 13,333,683 | | |
| | | Net realized gain (loss) on investments and
foreign currency transactions | | | 247,291,328 | | | | (741,614,943 | ) | |
| | | Net change in unrealized appreciation (depreciation)
on investments and foreign currency translations | | | 867,973,075 | | | | (1,125,212,355 | ) | |
| | | Net increase (decrease) resulting from operations | | | 1,116,017,827 | | | | (1,853,493,615 | ) | |
| Distributions to Shareholders | | From net investment income: | | | | | | | | | |
| | | Class A | | | (1,868,669 | ) | | | (5,115,178 | ) | |
| | | Class B | | | (15,297 | ) | | | — | | |
| | | Class C | | | (64,902 | ) | | | — | | |
| | | Class Z | | | (2,647,984 | ) | | | (5,515,027 | ) | |
| | | From return of capital: | | | | | | | | | |
| | | Class A | | | (1,054,336 | ) | | | — | | |
| | | Class B | | | (8,631 | ) | | | — | | |
| | | Class C | | | (36,619 | ) | | | — | | |
| | | Class Z | | | (1,494,039 | ) | | | — | | |
| | | Total distributions to shareholders | | | (7,190,477 | ) | | | (10,630,205 | ) | |
| | | Net Capital Stock Transactions | | | (662,561,084 | ) | | | (154,351,441 | ) | |
| | | Increase from regulatory settlements | | | 51,132 | | | | — | | |
| | | Total increase (decrease) in net assets | | | 446,317,398 | | | | (2,018,475,261 | ) | |
| Net Assets | | Beginning of period | | | 2,510,074,429 | | | | 4,528,549,690 | | |
| | | End of period | | | 2,956,391,827 | | | | 2,510,074,429 | | |
| | | Undistributed net investment income at end of period | | | — | | | | 3,795,338 | | |
See Accompanying Notes to Financial Statements.
12
Statement of Changes in Net Assets (continued) – Columbia Marsico Focused
Equities Fund
| | | Capital Stock Activity | |
| | | Year Ended
February 28, 2010 | | Year Ended
February 28, 2009 | |
| | | Shares | | Dollars ($) | | Shares | | Dollars ($) | |
| Class A | |
| Subscriptions | | | 15,121,111 | | | | 260,670,731 | | | | 68,650,195 | | | | 1,203,374,318 | | |
| Distributions reinvested | | | 153,240 | | | | 2,523,068 | | | | 247,808 | | | | 3,560,998 | | |
| Redemptions | | | (33,883,508 | ) | | | (535,196,732 | ) | | | (82,964,256 | ) | | | (1,329,128,330 | ) | |
| Net decrease | | | (18,609,157 | ) | | | (272,002,933 | ) | | | (14,066,253 | ) | | | (122,193,014 | ) | |
| Class B | |
| Subscriptions | | | 96,750 | | | | 1,333,604 | | | | 274,964 | | | | 4,508,854 | | |
| Distributions reinvested | | | 1,189 | | | | 17,007 | | | | — | | | | — | | |
| Redemptions | | | (1,995,401 | ) | | | (30,529,667 | ) | | | (4,547,035 | ) | | | (80,502,395 | ) | |
| Net decrease | | | (1,897,462 | ) | | | (29,179,056 | ) | | | (4,272,071 | ) | | | (75,993,541 | ) | |
| Class C | |
| Subscriptions | | | 1,220,722 | | | | 18,576,202 | | | | 3,062,920 | | | | 50,325,254 | | |
| Distributions reinvested | | | 3,190 | | | | 45,811 | | | | — | | | | — | | |
| Redemptions | | | (5,998,357 | ) | | | (92,853,105 | ) | | | (7,223,270 | ) | | | (118,765,016 | ) | |
| Net decrease | | | (4,774,445 | ) | | | (74,231,092 | ) | | | (4,160,350 | ) | | | (68,439,762 | ) | |
| Class Z | |
| Subscriptions | | | 13,863,230 | | | | 226,232,688 | | | | 35,635,168 | | | | 585,520,995 | | |
| Distributions reinvested | | | 157,915 | | | | 2,810,577 | | | | 258,336 | | | | 4,064,120 | | |
| Redemptions | | | (29,835,940 | ) | | | (516,191,268 | ) | | | (26,996,159 | ) | | | (477,310,239 | ) | |
| Net increase (decrease) | | | (15,814,795 | ) | | | (287,148,003 | ) | | | 8,897,345 | | | | 112,274,876 | | |
See Accompanying Notes to Financial Statements.
13
Financial Highlights – Columbia Marsico Focused Equities Fund
Selected data for a share outstanding throughout each period is as follows:
| | | Year Ended February 28, | | Period Ended
February 29, | | Year Ended March 31, | |
| Class A Shares | | 2010 | | 2009 | | 2008 (a)(b)(c) | | 2007 (a) | | 2006 (a)(d) | | 2005 (a) | |
| Net Asset Value, Beginning of Period | | $ | 12.76 | | | $ | 21.59 | | | $ | 21.81 | | | $ | 21.10 | | | $ | 17.67 | | | $ | 16.79 | | |
| Income from Investment Operations: | |
| Net investment income (loss) (e) | | | 0.01 | | | | 0.07 | | | | 0.02 | | | | (0.04 | ) | | | (0.05 | ) | | | (0.06 | ) | |
Net realized and unrealized gain (loss)
on investments and foreign currency | | | 6.25 | | | | (8.86 | ) | | | 0.02 | | | | 0.75 | | | | 3.48 | | | | 0.94 | | |
| Total from investment operations | | | 6.26 | | | | (8.79 | ) | | | 0.04 | | | | 0.71 | | | | 3.43 | | | | 0.88 | | |
| Less Distributions to Shareholders: | |
| From net investment income | | | (0.02 | ) | | | (0.04 | ) | | | — | | | | — | | | | — | | | | — | | |
| From net realized gains | | | — | | | | — | | | | (0.26 | ) | | | — | | | | — | | | | — | | |
| From return of capital | | | (0.01 | ) | | | — | | | | — | | | | — | | | | — | | | | — | | |
| Total distributions to shareholders | | | (0.03 | ) | | | (0.04 | ) | | | (0.26 | ) | | | — | | | | — | | | | — | | |
| Increase from regulatory settlements | | | — | (f) | | | — | | | | — | | | | — | | | | — | | | | — | | |
| Net Asset Value, End of Period | | $ | 18.99 | | | $ | 12.76 | | | $ | 21.59 | | | $ | 21.81 | | | $ | 21.10 | | | $ | 17.67 | | |
| Total return (g)(h) | | | 49.12 | % | | | (40.73 | )% | | | 0.00 | %(i) | | | 3.36 | % | | | 19.41 | % | | | 5.24 | % | |
Ratios to Average Net Assets/
Supplemental Data: | |
| Net expenses before interest expense (j) | | | 1.30 | % | | | 1.26 | % | | | 1.22 | %(k) | | | 1.24 | % | | | 1.22 | % | | | 1.30 | % | |
| Interest expense | | | — | %(l) | | | — | | | | — | %(k)(l) | | | — | | | | — | | | | — | | |
| Net expenses (j) | | | 1.30 | % | | | 1.26 | % | | | 1.22 | %(k) | | | 1.24 | % | | | 1.22 | % | | | 1.30 | % | |
| Waiver/Reimbursement | | | 0.01 | % | | | 0.05 | % | | | 0.03 | %(k) | | | 0.04 | % | | | 0.08 | %(m) | | | 0.03 | %(m) | |
| Net investment income (loss) (j) | | | 0.03 | % | | | 0.37 | % | | | 0.11 | %(k) | | | (0.19 | )% | | | (0.27 | )% | | | (0.37 | )% | |
| Portfolio turnover rate | | | 77 | % | | | 85 | % | | | — | %(i)(l)(n) | | | — | | | | — | | | | — | | |
Turnover of Columbia Marsico Focused
Equities Master Portfolio | | | — | | | | — | | | | 82 | %(i) | | | 52 | % | | | 71 | % | | | 89 | % | |
| Net assets, end of period (000s) | | $ | 1,599,661 | | | $ | 1,312,382 | | | $ | 2,524,540 | | | $ | 2,488,288 | | | $ | 2,061,076 | | | $ | 1,256,948 | | |
(a) The per share amounts and percentages reflect income and expenses assuming inclusion of the Fund's proportionate share of the income and expenses of Columbia Marsico Focused Equities Master Portfolio.
(b) The Fund changed its fiscal year end from March 31 to February 29. Per share data and total return reflect activity from April 1, 2007 through February 29, 2008.
(c) Effective February 28, 2008, the Fund converted to a stand-alone fund. Prior to February 28, 2008, the Fund operated in a master-feeder structure.
(d) On August 22, 2005, the Fund's Investor A shares were renamed Class A shares.
(e) Per share data was calculated using the average shares outstanding during the period.
(f) Rounds to less than $0.01 per share.
(g) Total return at net asset value assuming all distributions reinvested and no initial sales charge or contingent deferred sales charge.
(h) Had the investment advisor and/or any of its affiliates not waived fees or reimbursed a portion of expenses, total return would have been reduced.
(i) Not annualized.
(j) The benefits derived from expense reductions had an impact of less than 0.01%.
(k) Annualized.
(l) Rounds to less than 0.01%.
(m) Bank of America Corporation assumed certain non-recurring costs. Absent these non-recurring costs, the waiver/reimbursement ratio would have been 0.02% and -% for the years ended March 31, 2006 and March 31, 2005, respectively.
(n) Amount represents results after the Fund's conversion to a stand-alone structure on February 28, 2008.
See Accompanying Notes to Financial Statements.
14
Financial Highlights – Columbia Marsico Focused Equities Fund
Selected data for a share outstanding throughout each period is as follows:
| | | Year Ended February 28, | | Period Ended
February 29, | | Year Ended March 31, | |
| Class B Shares | | 2010 | | 2009 | | 2008 (a)(b)(c) | | 2007 (a) | | 2006 (a)(d) | | 2005 (a) | |
| Net Asset Value, Beginning of Period | | $ | 11.80 | | | $ | 20.07 | | | $ | 20.42 | | | $ | 19.91 | | | $ | 16.80 | | | $ | 16.08 | | |
| Income from Investment Operations: | |
| Net investment loss (e) | | | (0.11 | ) | | | (0.07 | ) | | | (0.13 | ) | | | (0.17 | ) | | | (0.18 | ) | | | (0.18 | ) | |
Net realized and unrealized gain (loss)
on investments and foreign currency | | | 5.77 | | | | (8.20 | ) | | | 0.04 | | | | 0.68 | | | | 3.29 | | | | 0.90 | | |
| Total from investment operations | | | 5.66 | | | | (8.27 | ) | | | (0.09 | ) | | | 0.51 | | | | 3.11 | | | | 0.72 | | |
| Less Distributions to Shareholders: | |
| From net investment income | | | — | | | | — | | | | — | | | | — | | | | — | | | | — | | |
| From net realized gains | | | — | | | | — | | | | (0.26 | ) | | | — | | | | — | | | | — | | |
| From return of capital | | | — | (f) | | | — | | | | — | | | | — | | | | — | | | | — | | |
| Total distributions to shareholders | | | — | (f) | | | — | | | | (0.26 | ) | | | — | | | | — | | | | — | | |
| Increase from regulatory settlements | | | — | (f) | | | — | | | | — | | | | — | | | | — | | | | — | | |
| Net Asset Value, End of Period | | $ | 17.46 | | | $ | 11.80 | | | $ | 20.07 | | | $ | 20.42 | | | $ | 19.91 | | | $ | 16.80 | | |
| Total return (g)(h) | | | 48.02 | % | | | (41.21 | )% | | | (0.64 | )%(i) | | | 2.56 | % | | | 18.51 | % | | | 4.48 | % | |
Ratios to Average Net Assets/
Supplemental Data: | |
| Net expenses before interest expense (j) | | | 2.05 | % | | | 2.01 | % | | | 1.97 | %(k) | | | 1.99 | % | | | 1.97 | % | | | 2.05 | % | |
| Interest expense | | | — | %(l) | | | — | | | | — | %(k)(l) | | | — | | | | — | | | | — | | |
| Net expenses (j) | | | 2.05 | % | | | 2.01 | % | | | 1.97 | %(k) | | | 1.99 | % | | | 1.97 | % | | | 2.05 | % | |
| Waiver/Reimbursement | | | 0.01 | % | | | 0.05 | % | | | 0.03 | %(k) | | | 0.04 | % | | | 0.08 | %(m) | | | 0.03 | %(m) | |
| Net investment loss (j) | | | (0.72 | )% | | | (0.40 | )% | | | (0.67 | )%(k) | | | (0.85 | )% | | | (1.01 | )% | | | (1.12 | )% | |
| Portfolio turnover rate | | | 77 | % | | | 85 | % | | | — | %(i)(l)(n) | | | — | | | | — | | | | — | | |
Turnover of Columbia Marsico Focused
Equities Master Portfolio | | | — | | | | — | | | | 82 | %(i) | | | 52 | % | | | 71 | % | | | 89 | % | |
| Net assets, end of period (000s) | | $ | 62,935 | | | $ | 64,937 | | | $ | 196,114 | | | $ | 348,836 | | | $ | 509,933 | | | $ | 517,489 | | |
(a) The per share amounts and percentages reflect income and expenses assuming inclusion of the Fund's proportionate share of the income and expenses of Columbia Marsico Focused Equities Master Portfolio.
(b) The Fund changed its fiscal year end from March 31 to February 29. Per share data and total return reflect activity from April 1, 2007 through February 29, 2008.
(c) Effective February 28, 2008, the Fund converted to a stand-alone fund. Prior to February 28, 2008, the Fund operated in a master-feeder structure.
(d) On August 22, 2005, the Fund's Investor B shares were renamed Class B shares.
(e) Per share data was calculated using the average shares outstanding during the period.
(f) Rounds to less than $0.01 per share.
(g) Total return at net asset value assuming all distributions reinvested and no contingent deferred sales charge.
(h) Had the investment advisor and/or any of its affiliates not waived fees or reimbursed a portion of expenses, total return would have been reduced.
(i) Not annualized.
(j) The benefits derived from expense reductions had an impact of less than 0.01%.
(k) Annualized.
(l) Rounds to less than 0.01%.
(m) Bank of America Corporation assumed certain non-recurring costs. Absent these non-recurring costs, the waiver/reimbursement ratio would have been 0.02% and -% for the years ended March 31, 2006 and March 31, 2005, respectively.
(n) Amount represents results after the Fund's conversion to a stand-alone structure on February 28, 2008.
See Accompanying Notes to Financial Statements.
15
Financial Highlights – Columbia Marsico Focused Equities Fund
Selected data for a share outstanding throughout each period is as follows:
| | | Year Ended February 28, | | Period Ended
February 29, | | Year Ended March 31, | |
| Class C Shares | | 2010 | | 2009 | | 2008 (a)(b)(c) | | 2007 (a) | | 2006 (a)(d) | | 2005 (a) | |
| Net Asset Value, Beginning of Period | | $ | 11.84 | | | $ | 20.13 | | | $ | 20.49 | | | $ | 19.97 | | | $ | 16.85 | | | $ | 16.13 | | |
| Income from Investment Operations: | |
| Net investment loss (e) | | | (0.11 | ) | | | (0.07 | ) | | | (0.15 | ) | | | (0.18 | ) | | | (0.19 | ) | | | (0.18 | ) | |
Net realized and unrealized gain (loss)
on investments and foreign currency | | | 5.79 | | | | (8.22 | ) | | | 0.05 | | | | 0.70 | | | | 3.31 | | | | 0.90 | | |
| Total from investment operations | | | 5.68 | | | | (8.29 | ) | | | (0.10 | ) | | | 0.52 | | | | 3.12 | | | | 0.72 | | |
| Less Distributions to Shareholders: | |
| From net investment income | | | — | | | | — | | | | — | | | | — | | | | — | | | | — | | |
| From net realized gains | | | — | | | | — | | | | (0.26 | ) | | | — | | | | — | | | | — | | |
| From return of capital | | | — | (f) | | | — | | | | — | | | | — | | | | — | | | | — | | |
| Total distributions to shareholders | | | — | (f) | | | — | | | | (0.26 | ) | | | — | | | | — | | | | — | | |
| Increase from regulatory settlements | | | — | (f) | | | — | | | | — | | | | — | | | | — | | | | — | | |
| Net Asset Value, End of Period | | $ | 17.52 | | | $ | 11.84 | | | $ | 20.13 | | | $ | 20.49 | | | $ | 19.97 | | | $ | 16.85 | | |
| Total return (g)(h) | | | 48.02 | % | | | (41.18 | )% | | | (0.69 | )%(i) | | | 2.60 | % | | | 18.52 | % | | | 4.46 | % | |
Ratios to Average Net Assets/
Supplemental Data: | |
| Net expenses before interest expense (j) | | | 2.05 | % | | | 2.01 | % | | | 1.97 | %(k) | | | 1.99 | % | | | 1.97 | % | | | 2.05 | % | |
| Interest expense | | | — | %(l) | | | — | | | | — | %(k)(l) | | | — | | | | — | | | | — | | |
| Net expenses (j) | | | 2.05 | % | | | 2.01 | % | | | 1.97 | %(k) | | | 1.99 | % | | | 1.97 | % | | | 2.05 | % | |
| Waiver/Reimbursement | | | 0.01 | % | | | 0.05 | % | | | 0.03 | %(k) | | | 0.04 | % | | | 0.08 | %(m) | | | 0.03 | %(m) | |
| Net investment loss (j) | | | (0.72 | )% | | | (0.38 | )% | | | (0.74 | )%(k) | | | (0.92 | )% | | | (1.01 | )% | | | (1.12 | )% | |
| Portfolio turnover rate | | | 77 | % | | | 85 | % | | | — | %(i)(l)(n) | | | — | | | | — | | | | — | | |
Turnover of Columbia Marsico Focused
Equities Master Portfolio | | | — | | | | — | | | | 82 | %(i) | | | 52 | % | | | 71 | % | | | 89 | % | |
| Net assets, end of period (000s) | | $ | 298,344 | | | $ | 258,191 | | | $ | 522,644 | | | $ | 582,805 | | | $ | 532,250 | | | $ | 382,989 | | |
(a) The per share amounts and percentages reflect income and expenses assuming inclusion of the Fund's proportionate share of the income and expenses of Columbia Marsico Focused Equities Master Portfolio.
(b) The Fund changed its fiscal year end from March 31 to February 29. Per share data and total return reflect activity from April 1, 2007 through February 29, 2008.
(c) Effective February 28, 2008, the Fund converted to a stand-alone fund. Prior to February 28, 2008, the Fund operated in a master-feeder structure.
(d) On August 22, 2005, the Fund's Investor C shares were renamed Class C shares.
(e) Per share data was calculated using the average shares outstanding during the period.
(f) Rounds to less than $0.01 per share.
(g) Total return at net asset value assuming all distributions reinvested and no contingent deferred sales charge.
(h) Had the investment advisor and/or any of its affiliates not waived fees or reimbursed a portion of expenses, total return would have been reduced.
(i) Not annualized.
(j) The benefits derived from expense reductions had an impact of less than 0.01%.
(k) Annualized.
(l) Rounds to less than 0.01%.
(m) Bank of America Corporation assumed certain non-recurring costs. Absent these non-recurring costs, the waiver/reimbursement ratio would have been 0.02% and -% for the years ended March 31, 2006 and March 31, 2005, respectively.
(n) Amount represents results after the Fund's conversion to a stand-alone structure on February 28, 2008.
See Accompanying Notes to Financial Statements.
16
Financial Highlights – Columbia Marsico Focused Equities Fund
Selected data for a share outstanding throughout each period is as follows:
| | | Year Ended February 28, | | Period Ended
February 29, | | Year Ended March 31, | |
| Class Z Shares | | 2010 | | 2009 | | 2008 (a)(b)(c) | | 2007 (a) | | 2006 (a)(d) | | 2005 (a) | |
| Net Asset Value, Beginning of Period | | $ | 13.02 | | | $ | 22.06 | | | $ | 22.22 | | | $ | 21.45 | | | $ | 17.92 | | | $ | 16.98 | | |
| Income from Investment Operations: | |
| Net investment income (loss) (e) | | | 0.05 | | | | 0.13 | | | | 0.09 | | | | 0.01 | | | | — | (f) | | | (0.02 | ) | |
Net realized and unrealized gain (loss)
on investments and foreign currency | | | 6.39 | | | | (9.07 | ) | | | 0.01 | | | | 0.76 | | | | 3.53 | | | | 0.96 | | |
| Total from investment operations | | | 6.44 | | | | (8.94 | ) | | | 0.10 | | | | 0.77 | | | | 3.53 | | | | 0.94 | | |
| Less Distributions to Shareholders: | |
| From net investment income | | | (0.05 | ) | | | (0.10 | ) | | | — | | | | — | | | | — | | | | — | | |
| From net realized gains | | | — | | | | — | | | | (0.26 | ) | | | — | | | | — | | | | — | | |
| From return of capital | | | (0.02 | ) | | | — | | | | — | | | | — | | | | — | | | | — | | |
| Total distributions to shareholders | | | (0.07 | ) | | | (0.10 | ) | | | (0.26 | ) | | | — | | | | — | | | | — | | |
| Increase from regulatory settlements | | | — | (f) | | | — | | | | — | | | | — | | | | — | | | | — | | |
| Net Asset Value, End of Period | | $ | 19.39 | | | $ | 13.02 | | | $ | 22.06 | | | $ | 22.22 | | | $ | 21.45 | | | $ | 17.92 | | |
| Total return (g)(h) | | | 49.53 | % | | | (40.60 | )% | | | 0.27 | %(i) | | | 3.59 | % | | | 19.70 | % | | | 5.54 | % | |
Ratios to Average Net Assets/
Supplemental Data: | |
| Net expenses before interest expense (j) | | | 1.05 | % | | | 1.01 | % | | | 0.97 | %(k) | | | 0.99 | % | | | 0.97 | % | | | 1.05 | % | |
| Interest expense | | | — | %(l) | | | — | | | | — | %(k)(l) | | | — | | | | — | | | | — | | |
| Net expenses (j) | | | 1.05 | % | | | 1.01 | % | | | 0.97 | %(k) | | | 0.99 | % | | | 0.97 | % | | | 1.05 | % | |
| Waiver/Reimbursement | | | 0.01 | % | | | 0.05 | % | | | 0.03 | %(k) | | | 0.04 | % | | | 0.08 | %(m) | | | 0.03 | %(m) | |
| Net investment income (loss) (j) | | | 0.28 | % | | | 0.65 | % | | | 0.40 | %(k) | | | 0.06 | % | | | (0.01 | )% | | | (0.12 | )% | |
| Portfolio turnover rate | | | 77 | % | | | 85 | % | | | — | %(i)(l)(n) | | | — | | | | — | | | | — | | |
Turnover of Columbia Marsico Focused
Equities Master Portfolio | | | — | | | | — | | | | 82 | %(i) | | | 52 | % | | | 71 | % | | | 89 | % | |
| Net assets, end of period (000s) | | $ | 995,452 | | | $ | 874,565 | | | $ | 1,285,252 | | | $ | 1,247,610 | | | $ | 1,022,812 | | | $ | 751,124 | | |
(a) The per share amounts and percentages reflect income and expenses assuming inclusion of the Fund's proportionate share of the income and expenses of Columbia Marsico Focused Equities Master Portfolio.
(b) The Fund changed its fiscal year end from March 31 to February 29. Per share data and total return reflect activity from April 1, 2007 through February 29, 2008.
(c) Effective February 28, 2008, the Fund converted to a stand-alone fund. Prior to February 28, 2008, the Fund operated in a master-feeder structure.
(d) On August 22, 2005, the Fund's Primary A shares were renamed Class Z shares.
(e) Per share data was calculated using the average shares outstanding during the period.
(f) Rounds to less than $0.01 per share.
(g) Total return at net asset value assuming all distributions reinvested.
(h) Had the investment advisor and/or any of its affiliates not waived fees or reimbursed a portion of expenses, total return would have been reduced.
(i) Not annualized.
(j) The benefits derived from expense reductions had an impact of less than 0.01%.
(k) Annualized.
(l) Rounds to less than 0.01%.
(m) Bank of America Corporation assumed certain non-recurring costs. Absent these non-recurring costs, the waiver/reimbursement ratio would have been 0.02% and -% for the years ended March 31, 2006 and March 31, 2005, respectively.
(n) Amount represents results after the Fund's conversion to a stand-alone structure on February 28, 2008.
See Accompanying Notes to Financial Statements.
17
Notes to Financial Statements – Columbia Marsico Focused Equities Fund
February 28, 2010
Note 1. Organization
Columbia Marsico Focused Equities Fund (the "Fund"), a series of Columbia Funds Series Trust (the "Trust"), is a non-diversified fund. The Trust is registered under the Investment Company Act of 1940, as amended (the "1940 Act"), as an open-end management investment company organized as a Delaware statutory trust.
Investment Objective
The Fund seeks long-term growth of capital.
Fund Shares
The Trust may issue an unlimited number of shares, and the Fund offers four classes of shares: Class A, Class B, Class C and Class Z. Each share class has its own expense structure and sales charges, as applicable. Effective June 22, 2009, the Fund no longer accepts investments from new or existing investors in the Fund's Class B shares, except in connection with the reinvestment of any dividend and/or capital gain distributions in Class B shares of the Fund and exchanges by existing Class B shareholders of the other Columbia Funds.
Class A shares are subject to a maximum front-end sales charge of 5.75% based on the amount of initial investment. Class A shares purchased without an initial sales charge in accounts aggregating $1 million to $50 million at the time of purchase are subject to a 1.00% contingent deferred sales charge ("CDSC") if the shares are sold within one year after purchase. Class B shares are subject to a maximum CDSC of 5.00% based upon the holding period after purchase. Class B shares will convert to Class A shares eight years after purchase. Class C shares are subject to a 1.00% CDSC on shares sold within one year after purchase. Class Z shares are offered continuously at net asset value. There are certain restrictions on the purchase of Class Z shares, as described in the Fund's prospectus.
Note 2. Significant Accounting Policies
The preparation of financial statements in accordance with accounting principles generally accepted in the United States of America ("GAAP") requires management to make certain estimates and assumptions that affect the reported amounts of assets and liabilities, the disclosure of contingent assets and liabilities at the date of the financial statements and the reported amounts of revenue and expenses during the reporting period. Actual results could differ from those estimates.
The following is a summary of significant accounting policies consistently followed by the Fund in the preparation of its financial statements.
Security Valuation
Equity securities are valued at the last sale price on the principal exchange on which they trade, except for securities traded on the NASDAQ, which are valued at the NASDAQ official close price. Unlisted securities or listed securities for which there were no sales during the day are valued at the closing bid price on such exchanges or over-the-counter markets.
Short-term investments maturing in 60 days or less are valued at amortized cost, which approximates market value.
Foreign securities are generally valued at the last sale price on the foreign exchange or market on which they trade. If any foreign share prices are not readily available as a result of limited share activity, the securities are valued at the last sale price of the local shares in the principal market in which such securities are normally traded.
Generally, trading in foreign securities is substantially completed each day at various times prior to the close of the New York Stock Exchange ("NYSE"). The values of such securities used in computing the net asset value of the Fund's shares are determined as of such times. Foreign currency exchange rates are generally determined at 4:00 p.m. Eastern (U.S.) time. Occasionally, events affecting the values of such foreign securities may occur between the times at which they are determined and the close of the customary trading session of the NYSE, which would not be reflected in the computation of the Fund's net asset value. If events materially affecting the values of such foreign securities occur and it is determined that market quotations are not reliable, then these foreign securities will be valued at their fair value using procedures approved by the Board of Trustees.
Investments for which market quotations are not readily available, or that have quotations which management believes are not reliable, are valued at fair value as determined in good faith under consistently applied procedures established by and under the general supervision of the Board of Trustees. If a security is valued at fair value, such value is likely to be
18
Columbia Marsico Focused Equities Fund, February 28, 2010
different from the last quoted market price for the security. The determination of fair value often requires significant judgment. To determine fair value, management may use assumptions including but not limited to future cash flows and estimated risk premiums. Multiple inputs from various sources may be used to determine value.
GAAP establishes a hierarchy that prioritizes the inputs to valuation techniques used to measure fair value giving the highest priority to unadjusted quoted prices in active markets for identical securities (level 1 measurements) and the lowest priority to unobservable inputs (level 3 measurements) when market prices are not readily available or reliable. The three levels of the fair value hierarchy are described below:
• Level 1 – quoted prices in active markets for identical securities
• Level 2 – prices determined using other significant observable inputs (including quoted prices for similar securities, interest rates, prepayment speeds, credit risk and others)
• Level 3 – prices determined using significant unobservable inputs. In situations where quoted prices or observable inputs are unavailable or less reliable, unobservable inputs may be used. Unobservable inputs may include management's own assumptions about the factors market participants would use in pricing an investment.
The inputs or methodology used for valuing securities are not necessarily an indication of the risk associated with investing in those securities.
Security Transactions
Security transactions are accounted for on the trade date. Cost is determined and gains (losses) are based upon the specific identification method for both financial statement and federal income tax purposes.
Repurchase Agreements
The Fund may engage in repurchase agreement transactions with institutions that Columbia Management Advisors, LLC ("Columbia"), the Fund's investment advisor, has determined are creditworthy. The Fund, through its custodian, receives delivery of the underlying securities collateralizing a repurchase agreement. Columbia is responsible for determining that the collateral is at least equal, at all times, to the value of the repurchase obligation including interest. A repurchase agreement transaction involves certain risks in the event of default or insolvency of the counterparty. These risks include possible delays in or restrictions on the Fund's ability to dispose of the underlying securities and a possible decline in the value of the underlying securities during the period while the Fund seeks to assert its rights.
Foreign Currency Transactions and Translations
The values of all assets and liabilities quoted in foreign currencies are translated into U.S. dollars at that day's exchange rates. Net realized and unrealized gains (losses) on foreign currency transactions and translations include gains (losses) arising from the fluctuation in exchange rates between trade and settlement dates on securities transactions, gains (losses) arising from the disposition of foreign currency and currency gains (losses) between the accrual and payment dates on dividends, interest income and foreign withholding taxes.
For financial statement purposes, the Fund does not distinguish that portion of gains (losses) on investments which is due to changes in foreign exchange rates from that which is due to changes in market prices of the investments. Such fluctuations are included with the net realized and unrealized gains (losses) on investments on the Statement of Operations.
Income Recognition
Interest income is recorded on the accrual basis.
Corporate actions and dividend income are recorded on the ex-date except for certain foreign securities which are recorded as soon after the ex-date as the Fund becomes aware of such, net of any non-reclaimable tax withholdings.
Expenses
General expenses of the Trust are allocated to the Fund and other series of the Trust based upon relative net assets or other expense allocation methodologies determined by the nature of the expense. Expenses directly attributable to the Fund are charged to the Fund.
19
Columbia Marsico Focused Equities Fund, February 28, 2010
Determination of Class Net Asset Value
All income, expenses (other than class-specific expenses, as shown on the Statement of Operations) and realized and unrealized gains (losses) are allocated to each class of the Fund on a daily basis for purposes of determining the net asset value of each class. Income and expenses are allocated to each class based on the settled shares method, while realized and unrealized gains (losses) are allocated based on the relative net assets of each class.
Federal Income Tax Status
The Fund intends to qualify each year as a "regulated investment company" under Subchapter M of the Internal Revenue Code, as amended, and will distribute substantially all of its taxable income, if any, for its tax year, and as such will not be subject to federal income taxes. In addition, the Fund intends to distribute in each calendar year substantially all of its net investment income, capital gains and certain other amounts, if any, such that the Fund should not be subject to federal excise tax. Therefore, no provision is made for federal income or excise taxes.
Distributions to Shareholders
Distributions from net investment income, if any, are declared and paid semi-annually. Net realized capital gains, if any, are distributed at least annually. Income distributions and capital gain distributions are determined in accordance with federal income tax regulations which differ from GAAP.
Indemnification
In the normal course of business, the Fund enters into contracts that contain a variety of representations and warranties and which provide general indemnities. The Fund's maximum exposure under these arrangements is unknown because this would involve future claims against the Fund. Also, under the Trust's organizational documents and by contract, the Trustees and officers of the Trust are indemnified against certain liabilities that may arise out of actions relating to their duties to the Trust. However, based on experience, the Fund expects the risk of loss due to these representations, warranties and indemnities to be minimal.
Note 3. Federal Tax Information
The timing and character of income and capital gain distributions are determined in accordance with income tax regulations, which may differ from GAAP. Reclassifications are made to the Fund's capital accounts for permanent tax differences to reflect income and gains available for distribution (or available capital loss carryforwards) under income tax regulations.
For the year ended February 28, 2010, permanent book and tax basis differences resulting primarily from differing treatments for foreign currency transactions, partnership adjustments and proceeds received from litigation settlements were identified and reclassified among the components of the Fund's net assets as follows:
Undistributed
Net Investment
Income | | Accumulated
Net Realized
Loss | | Paid-In Capital | |
| $ | 48,090 | | | $ | 6,107,993 | | | $ | (6,156,083 | ) | |
Net investment income and net realized gains (losses), as disclosed on the Statement of Operations, and net assets were not affected by this reclassification.
The tax character of distributions paid during the years ended February 28, 2010 and February 28, 2009 was as follows:
| | | February 28, | |
| Distributions paid from: | | 2010 | | 2009 | |
| Ordinary Income* | | $ | 4,596,852 | | | $ | 10,630,205 | | |
| Long-Term Capital Gains | | | — | | | | — | | |
| Return of Capital | | | 2,593,625 | | | | — | | |
* For tax purposes short-term capital gain distributions, if any, are considered ordinary income distributions.
20
Columbia Marsico Focused Equities Fund, February 28, 2010
As of February 28, 2010, the components of distributable earnings on a tax basis were as follows:
Undistributed
Ordinary
Income | | Undistributed
Long-Term
Capital Gains | | Net Unrealized
Appreciation* | |
| $ | — | | | $ | — | | | $ | 507,777,920 | | |
* The differences between book-basis and tax-basis net unrealized appreciation are primarily due to deferral of losses from wash sales.
Unrealized appreciation and depreciation at February 28, 2010, based on cost of investments for federal income tax purposes were:
| Unrealized appreciation | | $ | 552,989,984 | | |
| Unrealized depreciation | | | (45,212,064 | ) | |
| Net unrealized appreciation | | $ | 507,777,920 | | |
The following capital loss carryforwards may be available to reduce taxable income arising from future net realized gains on investments, if any, to the extent permitted by the Internal Revenue Code:
| Year of Expiration | | Capital Loss
Carryforwards | |
| 2017 | | $ | 262,876,521 | | |
| 2018 | | | 175,514,792 | | |
| | $ | 438,391,313 | | |
Management is required to determine whether a tax position of the Fund is more likely than not to be sustained upon examination by the applicable taxing authority, including resolution of any related appeals or litigation processes, based on the technical merits of the position. The tax benefit to be recognized by the Fund is measured as the largest amount of benefit that is greater than fifty percent likely of being realized upon ultimate settlement. Management is not aware of any tax positions for which it is reasonably possible that the total amounts of unrecognized tax benefits will significantly change in the next twelve months. However, management's conclusions may be subject to review and adjustment at a later date based on factors including, but not limited to, new tax laws, regulations, and administrative interpretations (including relevant court decisions). The Fund's federal tax returns for the prior three fiscal year s remain subject to examination by the Internal Revenue Service.
Note 4. Fees and Compensation Paid to Affiliates
Investment Advisory Fee
Columbia, an indirect, wholly owned subsidiary of Bank of America Corporation ("BOA"), provides investment advisory services to the Fund. Columbia receives a monthly investment advisory fee based on the Fund's average daily net assets at the following annual rates:
| Average Daily Net Assets | | Annual Fee Rate | |
| First $500 million | | | 0.75 | % | |
| $500 million to $1 billion | | | 0.70 | % | |
| $1 billion to $1.5 billion | | | 0.65 | % | |
| $1.5 billion to $3 billion | | | 0.60 | % | |
| $3 billion to $6 billion | | | 0.58 | % | |
| Over $6 billion | | | 0.56 | % | |
For the year ended February 28, 2010, the Fund's effective investment advisory fee rate was 0.65% of the Fund's average daily net assets.
Bank of America, N.A., an indirect parent company of Columbia, entered into an agreement dated September 29, 2009, to sell a portion of the asset management business of Columbia Management Group, LLC to Ameriprise Financial, Inc. ("Ameriprise Financial"). The transaction ("Transaction") includes the sale of the part of the asset management business that advises long-term mutual funds, including the Fund. The Transaction is subject to certain approvals and other conditions to closing, and is currently expected to close on or about May 1, 2010 (the "Closing"). In connection with the Closing, certain changes will occur, including a change in the entities serving as the investment advisor, administrator, distributor and transfer agent of the Fund. RiverSource Investments, LLC (the "New Advisor"), a subsidiary of Ameriprise Financial, will become the investment advisor of the Fund upon the Closing. The New Advisor will serve as inves tment advisor under a new investment management services agreement effective upon the closing. The New Advisor expects to change its name to Columbia Management
21
Columbia Marsico Focused Equities Fund, February 28, 2010
Investment Advisers, LLC upon or shortly after the Closing. Effective upon the Closing, as the context requires, references to Columbia shall be deemed to refer to the New Advisor.
To the extent that the Fund is not benefitting from a separate contractual expense limitation arrangement, Columbia has contractually agreed to waive a portion of its advisory fees through June 30, 2010.
The waiver amount is calculated based on the difference between the dollar amount of sub-advisory fees that would have been payable to Marsico Capital Management, LLC ("Marsico") based on the annualized rate of 0.45% of the Fund's average daily net assets, and the dollar amount of sub-advisory fees calculated on a monthly basis based on the annualized sub-advisory fee rate effective January 1, 2008 in which Marsico is entitled from the Fund which is described under the Sub-Advisory Fee note below. The annualized fee rate of 0.45% represents the sub-advisory fee rate which Marsico was entitled to receive prior to January 1, 2008.
In the absence of a separate contractual expense limitation arrangement, the advisory fee waiver for the Fund would be calculated as follows:
| Fund Average Daily Net Assets* | | Advisory Fee Waiver | |
| Assets up to $18 billion | | | 0.00 | % | |
Assets in excess of $18 billion and
up to $21 billion | | | 0.05 | % | |
| Assets in excess of $21 billion | | | 0.10 | % | |
* For purposes of the calculation, "Assets" are aggregate assets sub-advised by Marsico in the following Columbia Funds: (i) Columbia Marsico Growth Fund; (ii) Columbia Marsico Focused Equities Fund; (iii) Columbia Marsico 21st Century Fund; (iv) Columbia Marsico Growth Fund, Variable Series; (v) Columbia Marsico Focused Equities Fund, Variable Series; (vi) Columbia Marsico 21st Century Fund, Variable Series; and (vii) any future Columbia U.S. equity fund sub-advised by Marsico which Columbia and Marsico mutually agree in writing.
For the year ended February 28, 2010, Columbia did not waive investment advisory fees for the Fund.
Sub-Advisory Fee
Marsico has been retained by Columbia to serve as the investment sub-advisor to the Fund. As the sub-advisor, and subject to the oversight of Columbia and the Fund's Board of Trustees, Marsico is responsible for the daily investment operations, including placing all orders for the purchase and sale of the portfolio securities for the Fund. Columbia, from the investment advisory fee it receives, pays Marsico a monthly sub-advisory fee.
Marsico is entitled to receive a monthly sub-advisory fee for its services provided to the Fund at the following annual rates:
| Fund Average Daily Net Assets* | | Fee Rate | |
| Assets up to $18 billion | | | 0.45 | % | |
Assets in excess of $18 billion and
up to $21 billion | | | 0.40 | % | |
| Assets in excess of $21 billion | | | 0.35 | % | |
* For purposes of the calculation, "Assets" are aggregate assets sub-advised by Marsico in the following Columbia Funds: (i) Columbia Marsico Growth Fund; (ii) Columbia Marsico Focused Equities Fund; (iii) Columbia Marsico 21st Century Fund; (iv) Columbia Marsico Growth Fund, Variable Series; (v) Columbia Marsico Focused Equities Fund, Variable Series; (vi) Columbia Marsico 21st Century Fund, Variable Series; and (vii) any future Columbia U.S. equity fund sub-advised by Marsico which the Advisor and Marsico mutually agree in writing.
Administration Fee
Columbia provides administrative and other services to the Fund for a monthly administration fee at the annual rate of 0.22% of the Fund's average daily net assets, less the fees payable by the Fund as described under the Pricing and Bookkeeping Fees note below.
The New Advisor will become the administrator of the Fund under a new administrative services agreement effective upon the Closing.
Pricing and Bookkeeping Fees
The Fund has entered into a Financial Reporting Services Agreement (the "Financial Reporting Services Agreement") with State Street Bank and Trust Company ("State Street") and Columbia pursuant to which State Street provides financial reporting services to the Fund. The Fund has also entered into an Accounting Services Agreement (collectively with the Financial Reporting Services Agreement, the "State Street Agreements") with State Street and Columbia pursuant to which State Street provides accounting services to the Fund. Under the State Street Agreements, the Fund pays State Street an annual fee of $38,000 paid monthly plus an additional monthly fee based on an annualized percentage rate of average daily net assets of the Fund for the month. The aggregate fee will not exceed $140,000 per year (exclusive of
22
Columbia Marsico Focused Equities Fund, February 28, 2010
out-of-pocket expenses and charges). The Fund also reimburses State Street for certain out-of-pocket expenses and charges.
Among other updates to the State Street Agreements, Columbia will assign and delegate its rights and obligations thereunder to the New Advisor upon the Closing.
The Fund has entered into a Pricing and Bookkeeping Oversight and Services Agreement (the "Services Agreement") with Columbia. Under the Services Agreement, Columbia provides services related to Fund expenses and the requirements of the Sarbanes-Oxley Act of 2002, and provides oversight of the accounting and financial reporting services provided by State Street. Under the Services Agreement, the Fund reimburses Columbia for out-of-pocket expenses and charges, including fees payable to third parties, such as for pricing the Fund's portfolio securities, incurred by Columbia in the performance of services under the Services Agreement.
The Services Agreement will be terminated upon the Closing, and the services provided thereunder will be covered under the administrative services agreement with the New Advisor.
Transfer Agent Fee
Columbia Management Services, Inc. (the "Transfer Agent"), an affiliate of Columbia and an indirect, wholly owned subsidiary of BOA, provides shareholder services to the Fund and has contracted with Boston Financial Data Services ("BFDS") to serve as sub-transfer agent. Effective January 1, 2010, the Transfer Agent is entitled to receive a fee for its services, paid monthly, at the annual rate of $22.36 per account plus reimbursement of certain sub-transfer agent fees paid by the Transfer Agent (exclusive of BFDS fees), calculated based on assets held in omnibus accounts and intended to recover the cost of payments to other parties (including affiliates of BOA) for services to those accounts. Prior to January 1, 2010, the annual rate was $17.34 per account. The Transfer Agent pays the fees of BFDS for services as sub-transfer agent and is not entitled to reimbursement for such fees from the Fund.
The Transfer Agent may also retain, as additional compensation for its services, fees for wire, telephone and redemption orders, Individual Retirement Account ("IRA") trustee agent fees and account transcript fees due to the Transfer Agent from shareholders of the Fund and credits (net of bank charges) earned with respect to balances in accounts the Transfer Agent maintains in connection with its services to the Fund. The Transfer Agent also receives reimbursement for certain out-of-pocket expenses.
Prior to May 1, 2009, the Transfer Agent voluntarily waived a portion of its fees for accounts other than omnibus accounts, so that transfer agent fees (exclusive of out-of-pocket expenses and sub-transfer agent fees) did not exceed 0.02% annually of the Fund's average daily net assets.
An annual minimum account balance fee of $20 may apply to certain accounts with a value below the Fund's initial minimum investment requirements to reduce the impact of small accounts on transfer agent fees. These minimum account balance fees are recorded as part of expense reductions on the Statement of Operations. For the year ended February 28, 2010, no minimum account balance fees were charged by the Fund.
RiverSource Service Corporation (the "New Transfer Agent"), a subsidiary of Ameriprise Financial, will become the transfer agent of the Fund upon the Closing. The New Transfer Agent expects to change its name to Columbia Management Investment Services Corp. upon or shortly after the Closing.
Underwriting Discounts, Service and Distribution Fees
Columbia Management Distributors, Inc. (the "Distributor"), an affiliate of Columbia and an indirect, wholly owned subsidiary of BOA, is the principal underwriter of the Fund's shares. For the year ended February 28, 2010, the Distributor has retained net underwriting discounts of $39,267 on sales of the Fund's Class A shares and received net CDSC fees of $5,484, $118,597 and $24,741 on Class A, Class B and Class C share redemptions, respectively.
RiverSource Fund Distributors, Inc. (the "New Distributor"), a subsidiary of Ameriprise Financial, will become the distributor of the Fund upon the Closing. The New Distributor expects to change its name to Columbia Management Investment Distributors, Inc. upon or shortly after the Closing.
The Trust has adopted shareholder servicing plans and distribution plans for the Class B and Class C shares of the Fund and a combined distribution and shareholder servicing plan for the Class A shares of the Fund. The shareholder
23
Columbia Marsico Focused Equities Fund, February 28, 2010
servicing plans permit the Fund to compensate or reimburse servicing agents for the shareholder services they have provided. The distribution plans, adopted pursuant to Rule 12b-1 under the 1940 Act, permit the Fund to compensate or reimburse the Distributor and/or selling agents for activities or expenses primarily intended to result in the sale of the classes' shares. Payments are made at an annual rate and paid monthly, as a percentage of average daily net assets, set from time to time by the Board of Trustees, and are charged as expenses of the Fund directly to the applicable share class. A substantial portion of the expenses incurred pursuant to these plans is paid to affiliates of BOA and the Distributor.
The annual rates in effect and plan limits, as a percentage of average daily net assets are as follows:
| | | Current
Rate | | Plan Limit | |
Class A Combined Distribution
and Shareholder Servicing Plan | | | 0.25 | % | | | 0.25 | % | |
Class B and Class C
Shareholder Servicing Plans | | | 0.25 | % | | | 0.25 | % | |
Class B and Class C
Distribution Plans | | | 0.75 | % | | | 0.75 | % | |
Expense Limits and Fee Waivers
Effective May 1, 2009, Columbia has voluntarily agreed to reimburse a portion of the Fund's expenses so that the Fund's ordinary operating expenses (excluding any distribution and service fees, brokerage commissions, interest, taxes and extraordinary expenses, but including custodian charges relating to overdrafts, if any) after giving effect to any balance credits from the Fund's custodian, do not exceed the annual rate of 1.20% of the Fund's average daily net assets. Columbia, in its discretion, may revise or discontinue this arrangement at any time.
Fees Paid to Officers and Trustees
All officers of the Fund are employees of Columbia or its affiliates and, with the exception of the Fund's Chief Compliance Officer, receive no compensation from the Fund. The Board of Trustees has appointed a Chief Compliance Officer to the Fund in accordance with federal securities regulations. The Fund, along with other affiliated funds, pays its pro-rata share of the expenses associated with the Chief Compliance Officer. The Fund's expenses for the Chief Compliance Officer will not exceed $15,000 per year.
Trustees are compensated for their services to the Fund, as set forth on the Statement of Operations. The Trust's eligible Trustees may participate in a non-qualified deferred compensation plan which may be terminated at any time. Any payments to plan participants are paid solely out of the Fund's assets. Income earned on the plan participant's deferral account is based on the rate of return of the eligible mutual funds selected by the participant or, if no funds are selected, on the rate of return of Columbia Treasury Reserves, another portfolio of the Trust. The expense for the deferred compensation plan, which includes trustees' fees deferred during the current period as well as any gains or losses on the trustees' deferred compensation balances as a result of market fluctuations, is included in "Trustees' fees" on the Statement of Operations. The liability for the deferred compensation plan is included in "Trustees' fees" on the Statement of Assets and Liabilities.
Other Related Party Transactions
In connection with the purchase and sale of its securities during the period, the Fund used one or more brokers that are affiliates of BOA. Total brokerage commissions paid to affiliated brokers for the year ended February 28, 2010 was $77,640.
Note 5. Custody Credits
The Fund has an agreement with its custodian bank under which custody fees may be reduced by balance credits. These credits are recorded as part of expense reductions on the Statement of Operations. The Fund could have invested a portion of the assets utilized in connection with the expense offset arrangement in an income-producing asset if it had not entered into such an agreement. For the year ended February 28, 2010, these custody credits reduced total expenses by $45 for the Fund.
Note 6. Portfolio Information
For the year ended February 28, 2010, the cost of purchases and proceeds from sales of securities, excluding short-term obligations, for the Fund were $2,144,515,312 and $2,789,657,340, respectively.
24
Columbia Marsico Focused Equities Fund, February 28, 2010
Note 7. Regulatory Settlements
During the year ended February 28, 2010, the Fund received payments totaling $51,132 relating to certain regulatory settlements with third parties that the Fund had participated in during the year. The payments have been included in "Increase from regulatory settlements" on the Statement of Changes in Net Assets.
Note 8. Line of Credit
The Fund and other affiliated funds participate in a $280,000,000 committed, unsecured revolving line of credit provided by State Street. The maximum amount that may be borrowed by any fund is limited to the lesser of $200,000,000 and the Fund's borrowing limit set forth in the Fund's registration statement. Borrowings are available for short-term liquidity or temporary or emergency purposes.
Effective October 15, 2009, interest is charged to each participating fund based on the fund's borrowings at a rate per annum equal to the greater of the Federal Funds Rate plus 1.25% or the overnight LIBOR Rate plus 1.25%. In addition, a commitment fee of 0.15% per annum is accrued and apportioned among the participating funds pro rata based on their relative net assets.
Prior to October 15, 2009, interest was charged to each participating fund based on the fund's borrowings at a rate per annum equal to the greater of the Federal Funds Rate plus 0.50% or the overnight LIBOR Rate plus 0.50%. In addition, an annual operations agency fee of $20,000, an amendment fee of 0.02% and a commitment fee of 0.12% per annum were accrued and apportioned among the participating funds pro rata based on their relative net assets.
For the year ended February 28, 2010, the average daily loan balance outstanding on days where borrowing existed was $5,053,846 at a weighted average interest rate of 1.33%.
Note 9. Shares of Beneficial Interest
As of February 28, 2010, 20.5% of the Fund's shares outstanding were beneficially owned by three participant accounts over which BOA and/or any of its affiliates had either sole or joint investment discretion.
As of February 28, 2010, the Fund had one shareholder that held 12.8% of the shares outstanding, over which BOA and/or any of its affiliates did not have investment discretion.
As of February 28, 2010, no other shareholders owned more than 5% of the outstanding shares of the Fund.
Subscription and redemption activity of these accounts may have a significant effect on the operations of the Fund.
Note 10. Significant Risks and Contingencies
Non-Diversified Mutual Fund Risk
The Fund is a non-diversified fund, which generally means that it may invest a greater percentage of its total assets in the securities of fewer issuers than a "diversified" fund. This increases the risk that a change in the value of any one investment held by the Fund could affect the overall value of the Fund more than it would affect that of a diversified fund holding a greater number of investments. Accordingly, the Fund's value will likely be more volatile than the value of more diversified funds. The Fund may not operate as a non-diversified fund at all times.
Foreign Securities Risk
There are certain additional risks involved when investing in foreign securities. These risks may involve foreign currency exchange rate fluctuations, adverse political and economic developments and the possible prevention of currency exchange or other foreign governmental laws or restrictions. In addition, the liquidity of foreign securities may be more limited than that of domestic securities.
Investments in emerging market countries are subject to additional risk. The risk of foreign investments is typically increased in less developed countries. These countries are also more likely to experience high levels of inflation, deflation or currency devaluation which could hurt their economies and securities markets.
Legal Proceedings
Columbia Management Advisors, LLC and Columbia Management Distributors, Inc. (collectively, the "Columbia Group") are subject to a settlement agreement with the New York Attorney General ("NYAG") (the "NYAG Settlement") and
25
Columbia Marsico Focused Equities Fund, February 28, 2010
a settlement order with the Securities and Exchange Commission ("SEC") (the "SEC Order") on matters relating to mutual fund trading, each dated February 9, 2005. Under the terms of the SEC Order, the Columbia Group (or predecessor or affiliated entities) agreed, among other things, to: pay disgorgement and civil money penalties collectively totaling $375 million; cease and desist from violations of the antifraud provisions and certain other provisions of the federal securities laws; maintain certain compliance and ethics oversight structures; and retain an independent consultant to review the Columbia Group's applicable supervisory, compliance, control and other policies and procedures. The NYAG Settlement, among other things, requires Columbia Management Advisors, LLC and its affiliates to make certain disclosures to investors relating to expenses. In connection with the Columbia Group providing services to the Columbia Funds, the Columbia Funds have voluntarily undertaken to implement certain governance measures designed to maintain the independence of their boards of trustees and certain special consulting and compliance measures.
Pursuant to the SEC Order and related procedures, the $375 million in settlement amounts described above, of which approximately $90 million has been earmarked for certain Columbia Funds and their shareholders, is being distributed in accordance with a distribution plan developed by an independent distribution consultant and approved by the SEC on December 27, 2007. Distributions under the distribution plan began in mid-June 2008 and the distribution earmarked for the Columbia Funds and their shareholders has been substantially completed.
Civil Litigation
In connection with the events that resulted in the NYAG Settlement and SEC Order, various parties filed suits against Bank of America Corporation and certain of its affiliates, including Banc of America Capital Management, LLC ("BACAP," now known as Columbia Management Advisors, LLC) and BACAP Distributors, LLC (now known as Columbia Management Distributors, Inc.) (collectively "BAC"), Nations Funds Trust (now known as Columbia Funds Series Trust) and its Board of Trustees. On February 20, 2004, the Judicial Panel on Multidistrict Litigation transferred these cases and cases against other mutual fund companies based on similar allegations to the United States District Court in Maryland for consolidated or coordinated pretrial proceedings (the "MDL"). Subsequently, additional related cases were transferred to the MDL. On September 29, 2004, the plaintiffs in the MDL filed amended and consolidated complaints. One of these amended complaints is a putative class action that includes claims under the federal securities laws and state common law, and that names Nations Funds Trust, the Trustees, BAC and others as defendants. Another of the amended complaints is a derivative action purportedly on behalf of the Nations Funds Trust against BAC and others that asserts claims under federal securities laws and state common law. Nations Funds Trust is a nominal defendant in this action.
On February 25, 2005, BAC and other defendants filed motions to dismiss the claims in the pending cases. On December 15, 2005, BAC and others entered into a Stipulation of Settlement of the direct and derivative claims brought on behalf of the Nations Funds shareholders. The settlement is subject to court approval. If the settlement is approved, BAC would pay settlement administration costs and fees to plaintiffs' counsel as approved by the court. The stipulation has not yet been presented to the court for approval.
Note 11. Subsequent Events
In connection with the preparation of the financial statements of the Fund as of and for the fiscal year ended February 28, 2010, events and transactions through the date the financial statements were issued have been evaluated by the Fund's management for possible adjustment and/or disclosure. No subsequent events or transactions had occurred that would require adjustment of the financial statements as presented. On March 3, 2010, the Fund's shareholders approved, among other matters, a proposed investment management services agreement with the New Advisor and a proposed investment subadvisory agreement with Marsico, the effectiveness of each of which is conditioned on the Closing.
26
Report of Independent Registered Public Accounting Firm
To the Trustees of Columbia Funds Series Trust and the Shareholders of Columbia Marsico Focused Equities Fund
In our opinion, the accompanying statement of assets and liabilities, including the investment portfolio, and the related statement of operations and of changes in net assets and the financial highlights present fairly, in all material respects, the financial position of Columbia Marsico Focused Equities Fund (the "Fund") (a series of Columbia Funds Series Trust) at February 28, 2010, the results of its operations, the changes in its net assets and the financial highlights for each of the periods indicated, in conformity with accounting principles generally accepted in the United States of America. These financial statements and financial highlights (hereafter referred to as "financial statements") are the responsibility of the Fund's management. Our responsibility is to express an opinion on these financial statements based on our audits. We conducted our audits of these financial statements in accordance with the standards of the Public Company Accounting Oversight Board (United States). Those standards require that we plan and perform the audit to obtain reasonable assurance about whether the financial statements are free of material misstatement. An audit includes examining, on a test basis, evidence supporting the amounts and disclosures in the financial statements, assessing the accounting principles used and significant estimates made by management, and evaluating the overall financial statement presentation. We believe that our audits, which included confirmation of securities at February 28, 2010 by correspondence with the custodian and brokers, provide a reasonable basis for our opinion.
PricewaterhouseCoopers LLP
Boston, Massachusetts
April 21, 2010
27
Federal Income Tax Information (Unaudited)
For non-corporate shareholders, 100.00% or the maximum amount allowable under the Jobs and Growth Tax Relief Reconciliation Act of 2003, of the ordinary income distributed by the Fund for the fiscal year ended February 28, 2010 may represent qualified dividend income.
100.00% of the ordinary income distributed by the Fund for the fiscal year ended February 28, 2010, qualifies for the corporate dividends received deduction.
The Fund will notify shareholders in January 2011 of amounts for use in preparing 2010 income tax returns.
28
Fund Governance
The Trustees serve terms of indefinite duration. The names, addresses and ages of the Trustees and officers of the Funds of Columbia Funds Series Trust, the year each was first elected or appointed to office, their principal business occupations during at least the last five years, the number of Funds overseen by each Trustee and other directorships they hold are shown below. Each officer listed below serves as an officer of each Fund in the Columbia Funds Complex.
Independent Trustees
Name, Address and Year of Birth,
Position with Funds, Year First
Elected or Appointed to Office | | Principal Occupation(s) During Past Five Years, Number of Funds in the Columbia
Funds Complex Overseen by Trustee, Other Directorships Held
| |
| Edward J. Boudreau (Born 1944) | |
|
c/o Columbia Management
Advisors, LLC
One Financial Center
Boston, MA 02111
Trustee (since 2005) | | Managing Director—E.J. Boudreau & Associates (consulting), from 2000 through current; oversees 64; no other directorships held. | |
|
| William P. Carmichael (Born 1943) | |
|
c/o Columbia Management
Advisors, LLC
One Financial Center
Boston, MA 02111
Trustee (since 1999) | | Retired. Oversees 64; Director—Cobra Electronics Corporation (electronic equipment manufacturer); Director—The Finish Line (sportswear). | |
|
| William A. Hawkins (Born 1942) | |
|
c/o Columbia Management Advisors, LLC
One Financial Center
Boston, MA 02111
Trustee (since 2005) | | President and Chief Executive Officer—California General Bank, N.A., from January 2008 through current; oversees 64; no other directorships held. | |
|
| R. Glenn Hilliard (Born 1943) | |
|
c/o Columbia Management Advisors, LLC
One Financial Center
Boston, MA 02111
Trustee (since 2005) | | Chairman and Chief Executive Officer—Hilliard Group LLC (investing and consulting), from April 2003 through current; Non-Executive Director & Chairman—Conseco, Inc. (insurance), September 2003 through current; Executive Chairman—Conseco, Inc. (insurance), August 2004 through September 2005; oversees 64; Director—Conseco, Inc. (insurance). | |
|
| John J. Nagorniak (Born 1944) | |
|
c/o Columbia Management
Advisors, LLC
One Financial Center
Boston, MA 02111
Trustee (since 2008) | | Retired. President and Director—Foxstone Financial, Inc. (consulting), 2000 through December 2007; Director—Mellon Financial Corporation affiliates (investing), 2000 through 2007; Chairman—Franklin Portfolio Associates (investing—Mellon affiliate), 1982 through 2007; oversees 64; Director—MIT Investment Company; Trustee—MIT 401k Plan; Trustee and Chairman—Research Foundation of CFA Institute. | |
|
29
Fund Governance (continued)
Independent Trustees (continued)
Name, Address and Year of Birth,
Position with Funds, Year First
Elected or Appointed to Office | | Principal Occupation(s) During Past Five Years, Number of Funds in the Columbia
Funds Complex Overseen by Trustee, Other Directorships Held
| |
| Minor M. Shaw (Born 1947) | |
|
c/o Columbia Management Advisors, LLC
One Financial Center
Boston, MA 02111
Trustee (since 2003) | | President—Micco Corporation and Mickel Investment Group; oversees 64; Board Member—Piedmont Natural Gas. | |
|
Interested Trustee
| Anthony M. Santomero1 (Born 1946) | |
|
c/o Columbia Management Advisors, LLC
One Financial Center
Boston, MA 02111
Trustee (since 2008) | | Richard K. Mellon Professor Emeritus of Finance, The Wharton School, University of Pennsylvania, from 1972 through current; Senior Advisor—McKinsey & Company (consulting), July 2006 through January 2008; President and Chief Executive Officer—Federal Reserve Bank of Philadelphia, July 2000 through April 2006; oversees 64; Director—Renaissance Reinsurance Ltd; Director—Penn Mutual Life Insurance Company; Director—Citigroup. | |
|
1 The Columbia Funds currently treat Mr. Santomero as an "interested person" (as defined in the 1940 Act) of the Funds because he serves as a Director of Citigroup, Inc. and Citibank, N.A. Citigroup, Inc., through its subsidiaries and affiliates, including Citibank, N.A., may engage from time-to-time in brokerage execution, principal transactions and/or lending relationships with the Columbia Funds or other funds or accounts advised/managed by the Advisor and/or any sub-advisor.
The Statement of Additional Information includes additional information about the Trustees of the Funds and is available, without charge, upon request by calling 800-345-6611.
30
Fund Governance (continued)
Officers
Name, Address and Year of Birth,
Position with Columbia Funds,
Year First Elected or
Appointed to Office | | Principal Occupation(s) During Past Five Years
| |
| J. Kevin Connaughton (Born 1964) | |
|
One Financial Center
Boston, MA 02111
President (since 2009) | | Managing Director of Columbia Management Advisors, LLC since December 2004; Senior Vice President and Chief Financial Officer—Columbia Funds, from June 2008 to January 2009; Treasurer—Columbia Funds, from October 2003 to May 2008; Treasurer—the Liberty Funds, Stein Roe Funds and Liberty All-Star Funds, December 2000—December 2006; Senior Vice President—Columbia Management Advisors, LLC, from April 2003 to December 2004; President—Columbia Funds, Liberty Funds and Stein Roe Funds, February 2004 to October 2004; Treasurer—Galaxy Funds, September 2002 to December 2005; Treasurer, December 2002 to December 2004, and President, February 2004 to December 2004—Columbia Management Multi-Strategy Hedge Fund, LLC; and a senior officer of various other Bank of America-affiliated entities, including other registered and unregistered funds | |
|
| James R. Bordewick, Jr. (Born 1959) | |
|
One Financial Center
Boston, MA 02111
Senior Vice President, Secretary and Chief Legal Officer (since 2006) | | Associate General Counsel, Bank of America since April 2005; Senior Vice President and Associate General Counsel, MFS Investment Management (investment management) prior to April 2005. | |
|
| Linda J. Wondrack (Born 1964) | |
|
One Financial Center
Boston, MA 02111
Senior Vice President and
Chief Compliance Officer (since 2007) | | Director (Columbia Management Group LLC and Investment Product Group Compliance), Bank of America since June 2005; Director of Corporate Compliance and Conflicts Officer, MFS Investment Management (investment management), August 2004 to May 2005; Managing Director, Deutsche Asset Management (investment management) prior to August 2004. | |
|
| Michael G. Clarke (Born 1969) | |
|
One Financial Center
Boston, MA 02111
Senior Vice President and
Chief Financial Officer (since 2009) | | Director of Fund Administration of the Advisor since January 2006; Managing Director of the Advisor September 2004 to December 2005; Vice President Fund Administration June 2002 to September 2004. | |
|
| Jeffrey R. Coleman (Born 1969) | |
|
One Financial Center
Boston, MA 02111
Treasurer (since 2008) | | Director of Fund Administration of the Advisor since January 2006; Fund Controller of the Advisor from October 2004 to January 2006; Vice President of CDC IXIS Asset Management Services, Inc. (investment management) from August 2000 to September 2004. | |
|
| Joseph F. DiMaria (Born 1968) | |
|
One Financial Center
Boston, MA 02111
Chief Accounting Officer (since 2008) | | Director of Fund Administration of the Advisor since January 2006; Head of Tax/Compliance and Assistant Treasurer of the Advisor from November 2004 to December 2005; Director of Trustee Administration (Sarbanes-Oxley) of the Advisor from May 2003 to October 2004. | |
|
31
Fund Governance (continued)
Officers (continued)
Name, Address and Year of Birth,
Position with Columbia Funds,
Year First Elected or
Appointed to Office | | Principal Occupation(s) During Past Five Years
| |
| Julian Quero (Born 1967) | |
|
One Financial Center
Boston, MA 02111
Deputy Treasurer (since 2008) | | Senior Tax Manager of the Advisor since August 2006; Senior Compliance Manager of the Advisor from April 2002 to August 2006. | |
|
| Barry S. Vallan (Born 1969) | |
|
One Financial Center
Boston, MA 02111
Controller (since 2006) | | Vice President—Fund Treasury of the Advisor since October 2004; Vice President—Trustee Reporting of the Advisor from April 2002 to October 2004. | |
|
| Stephen T. Welsh (Born 1957) | |
|
One Financial Center
Boston, MA 02111
Vice President (since 1996) | | President, Columbia Management Services, Inc. since July 2004; Senior Vice President and Controller, Columbia Management Services, Inc. prior to July 2004. | |
|
32
Board Consideration and Re-Approval of Current Investment Advisory and Sub-Advisory Agreements
Even though the following description of the Board's consideration of investment advisory and, as applicable, sub-advisory agreements covers multiple funds, for purposes of this shareholder report, the description is only relevant as to the Fund.
The Board of Trustees of Columbia Funds Series Trust (the "Board"), including a majority of the Trustees who have no direct or indirect interest in the investment advisory and sub-advisory agreements and are not "interested persons" of the Trust, as defined in the Investment Company Act of 1940 (the "1940 Act") (the "Independent Trustees"), are required annually to review and re-approve the existing investment advisory and sub-advisory agreements and approve any newly proposed terms therein. In this regard, the Board reviewed and re-approved, during the most recent six months covered by this report, (i) investment advisory agreements with Columbia Management Advisors, LLC ("CMA" or the "Adviser") for Columbia Convertible Securities Fund, Columbia Large Cap Value Fund, Columbia Mid Cap Value Fund, Columbia Small Cap Value Fund II, Columbia Marsico Growth Fund, Columbia Large Cap Core Fund, Columbia Marsico Focused Equities Fund, Columbia Marsico 21st Century Fund and Columbia Small Cap Growth Fund II; and (ii) investment sub-advisory agreements with Marsico Capital Management, LLC ("Marsico Capital" or the "Sub-Adviser") for Columbia Marsico Focused Equities Fund, Columbia Marsico 21st Century Fund and Columbia Marsico Growth Fund (the "Sub-Advised Funds"). The investment advisory agreements with CMA and the investment sub-advisory agreements with Marsico Capital are each referred to as an "Advisory Agreement" and collectively referred to as the "Advisory Agreements." The funds identified above are each referred to as a "Fund" and collectively referred to as the "Funds."
More specifically, at meetings held on November 5-6, 2009, the Board, including the Independent Trustees advised by their independent legal counsel, considered the factors and reached the conclusions described below relating to the selection of CMA and the Sub-Adviser and the re-approval of the Advisory Agreements. The Board also reviewed and considered a report prepared and provided by the Independent Fee Consultant (the "Fee Consultant") appointed by the Independent Trustees pursuant to an assurance of discontinuance entered into with the New York Attorney General ("NYAG") to settle a civil complaint filed by the NYAG relating to trading in mutual fund shares (the "NYAG Settlement"). The Fee Consultant's role was to manage the process by which management fees are negotiated so that they were negotiated in a manner that is at arms' length and reasonable. Th e Fee Consultant found that the fee negotiation process was, to the extent practicable, at arms' length and reasonable and consistent with the requirements of the NYAG Settlement. A summary of the Fee Consultant's report is available at http://www.columbiafunds.com.
In preparation for the November meetings, the Board met in August for review and discussion of the materials described below. The Investment Committee of the Board also met in June to discuss each Fund's performance with its respective portfolio manager(s). In addition to these meetings, the Investment Committee receives and discusses performance reports at its quarterly meetings. The Contracts Review Committee of the Board also provided support in managing and coordinating the process by which the Board reviewed the Advisory Agreements. The Board's review and conclusions are based on the comprehensive consideration of all information presented to it and are not the result of any single controlling factor. The Board evaluated all information available to it on a Fund-by-Fund basis, and its determinations were made separately in respect of each Fund.
Nature, Extent and Quality of Services. The Board received and considered various data and information regarding the nature, extent and quality of services provided to the Funds by CMA and the Sub-Adviser under the Advisory Agreements. The most recent investment adviser registration forms for CMA and the Sub-Adviser were made available to the Board, as were CMA's and the Sub-Adviser's responses to a detailed series of requests submitted by the Independent Trustees' independent legal counsel on behalf of such Trustees. The Board reviewed and analyzed those materials, which included, among other things, information about the background and experience of senior management and investment personnel of CMA and the Sub-Adviser.
In addition, the Board considered the investment and legal compliance programs of the Funds, CMA and the Sub-Adviser, including their compliance policies and procedures and reports of the Funds' Chief Compliance Officer.
The Board evaluated the ability of CMA and the Sub-Adviser, based on their resources, reputation and other attributes, to attract and retain qualified investment professionals, including research, advisory and supervisory personnel. In
33
this regard, the Board considered information regarding the nature of CMA's compensation structure applicable to portfolio managers and other key investment personnel.
Based on the above factors, together with those referenced below, the Board concluded that it was satisfied with the nature, extent and quality of the investment advisory services provided to each of the Funds by CMA and the Sub-Adviser.
The Board noted that Bank of America, N.A., the parent company of the Adviser, had entered into an agreement to sell a portion of the asset management business of the Adviser to Ameriprise Financial, Inc. (the "Transaction"). The Board noted that the Transaction was expected to close in the spring of 2010 and that its review of the Advisory Agreements was separate and distinct from any analysis regarding new advisory or sub-advisory arrangements that may result from the closing of the Transaction.
Investment Advisory and Sub-Advisory Fee Rates and Other Expenses. The Board reviewed and considered the proposed contractual investment advisory fee rates both separately and together with the administration fee rates payable by the Funds to CMA for investment advisory services (the "Contractual Management Rates"). The Board also reviewed and considered the proposed contractual investment sub-advisory fee rates (the "Sub-Advisory Agreement Rates") payable by CMA to the Sub-Adviser for investment sub-advisory services. In addition, the Board reviewed and considered the proposed fee waiver/cap arrangements applicable to the Contractual Management Rates and considered the Contractual Management Rates after taking the waivers/caps into account (the "Actual Management Rates"). The Board noted that, on a complex-wide basis, CMA had reduced annual managemen t fees by at least $32 million per year pursuant to the NYAG Settlement. The Board also noted reductions in net advisory rates and/or total expenses of certain funds across the fund complex. Additionally, the Board received and afforded specific attention to information comparing the Contractual Management Rates and Actual Management Rates with those of the other funds in their respective Peer Groups (as defined below).
The Board reviewed and considered statistical information regarding each Fund's total expense ratio and its various components, including contractual advisory fees, actual advisory fees, actual non-management fees, Rule 12b-1 and non-Rule 12b-1 service fees, fee waivers/caps and/or expense reimbursements. The Board also reviewed comparisons of these fees to the expense information for the group of Funds determined by Lipper Inc. ("Lipper") to be most similar to a given Fund (the "Peer Group") and to the performance of a broader universe of relevant funds as determined by Lipper (the "Universe"), which comparative data was provided by Lipper, an independent provider of investment company data. The Board was provided with a description of the methodology used by Lipper to select the mutual funds in each Fund's Peer Group and Universe and considered potential i mprecision resulting from the selection methodology. For certain Funds, Lipper determined that the composition of the Peer Group and/or Universe for expenses would differ from the composition for performance to provide a more accurate basis of comparison. The Board also considered Lipper data that ranked each Fund based on: (i) each Fund's one- and three-year performance compared to actual management fees; and (ii) each Fund's one- and three-year performance compared to total expenses.
The Board concluded that the factors noted above supported the Contractual Management Rates and the Actual Management Rates, and the approval of the Advisory Agreements for all of the Funds.
With regard to the Sub-Advised Funds, the Board also reviewed the Sub-Advisory Agreement Rates, including comparative fee information provided by the Adviser and the Adviser's recommendation that the Board re-approve the Advisory Agreements with Marsico Capital. The Board also considered a breakpoint fee schedule charged by Marsico Capital for the Sub-Advised Funds, as well as a corresponding waiver of Contractual Management Rates, both of which were implemented on January 1, 2008. The Board concluded that the Sub-Advisory Agreement Rates are fair and equitable, based on its consideration of the factors described above.
The Fund-by-Fund discussion set forth below in "Fund-Specific Considerations for Certain Review Funds" provides additional information regarding those Funds highlighted as meeting agreed-upon criteria for warranting further review. Such criteria included, among other things, information relating to Actual Management Rates, total expense ratios and/or performance information, relative to a Fund's Peer Group and/or Universe.
34
Fund Performance. The Board considered the performance results for each of the Funds over multiple measurement periods. It also considered these results in comparison to the performance results of each Fund's Peer Group and Universe, as well as to each Fund's benchmark index. The Board also considered certain risk-adjusted performance data.
The Fund-by-Fund discussion set forth below in "Fund-Specific Considerations for Certain Review Funds" provides additional information regarding those Funds highlighted as meeting agreed-upon criteria for warranting further review. Such criteria included, among other things, information relating to Actual Management Rates, total expense ratios and/or performance information, relative to a Fund's Peer Group and/or Universe.
Profitability. The Board received and considered a detailed profitability analysis of CMA based on the Contractual Management Rates and the Actual Management Rates, as well as on other relationships between the Funds and other funds in the complex on the one hand and CMA affiliates on the other. The analysis included complex-wide and per-Fund information and a comparison of results using alternative allocation methodologies. The Board concluded that, in light of the costs of providing investment management and other services, the profits and other ancillary benefits that CMA and its affiliates received from providing these services were not unreasonable.
Economies of Scale. The Board received and considered information regarding whether there have been economies of scale with respect to the management of the Funds, whether the Funds have appropriately benefited from any economies of scale and whether there is potential for realization of any further economies of scale. Most particularly, CMA provided information showing that, as a percentage of fund assets, CMA's complex-wide revenues declined over a five-year period during which fund assets increased by 53% and the shareholder benefit over a four-year period has remained steady at approximately 33% of the Adviser's total profits. The Board concluded that any potential economies of scale are shared fairly with Fund shareholders, most particularly through breakpoints and fee waiver arrangements.
The Board acknowledged the inherent limitations of any analysis of an investment adviser's economies of scale, stemming largely from the Board's understanding that economies of scale are generally realized, if at all, by an investment adviser across a variety of products and services, not just with respect to a single fund.
Information About Services to Other Clients. The Board also received and considered information about the nature and extent of services and fee rates offered by CMA and the Sub-Adviser to their other clients, including separate accounts and institutional investors. In this regard, the Board concluded that, where the Contractual Management Rates, Sub-Advisory Agreement Rates and Actual Management Rates were appreciably above the range of the fee rates offered to other CMA and Sub-Adviser clients, based on information provided by CMA and the Sub-Adviser, the costs associated with managing and operating a registered investment company provided a justification for the higher fee rates charged to the Funds.
Other Benefits to CMA and the Sub-Adviser. The Board received and considered information regarding any "fall-out" or ancillary benefits received by CMA and its affiliates and the Sub-Adviser as a result of their relationship with the Funds. Such benefits could include, among others, benefits attributable to CMA's and the Sub-Adviser's relationships with the Funds (such as soft-dollar credits) and benefits potentially derived from an increase in CMA's and the Sub-Adviser's business as a result of their relationship with the Funds (such as the ability to market to shareholders other financial products offered by CMA and its affiliates or a Sub-Adviser).
The Board considered the effectiveness of the policies of the Funds in achieving the best execution of portfolio transactions, whether and to what extent soft dollar credits are sought and how any such credits are utilized, any benefits that may be realized by using an affiliated broker, the extent to which efforts are made to recapture transaction costs, and the controls applicable to brokerage allocation procedures. The Board also reviewed CMA's and the Sub-Adviser's methods for allocating portfolio investment opportunities among the Funds and other clients. The Board concluded that the benefits were not unreasonable.
Other Factors and Broader Review. As discussed above, the Board reviews materials received from CMA and the Sub-Adviser annually as part of the re-approval process under Section 15(c) of the 1940 Act. The Board also reviews and assesses the quality of the services the Funds receives throughout the year. In this regard, the Board and its Committees review reports of CMA and the Sub-Adviser at each of its quarterly meetings, which include, among other things, Fund performance reports and presentations relating to such reports. In addition, the Board and its Committees
35
confer with portfolio managers at various times throughout the year including, most particularly, at the June Investment Committee meeting.
Fund-Specific Considerations for Certain "Review" Funds. For certain Funds highlighted as meeting agreed-upon criteria for warranting further review, the Board engaged in further analysis with regard to approval of the Funds' Advisory Agreements. Such criteria included, among other things, information relating to Actual Management Rates, total expense ratios, and/or performance information relative to a Fund's Peer Group and/or Universe.
The Board engaged in further review of Columbia Marsico Focused Equities Fund because its Actual Management Rate and total expense ratio were appreciably above the median range of its Peer Group and its performance over certain periods was below the median range of its Universe. However, the Board noted other factors such as positive performance over other periods, the inherently higher cost structure of subadvised funds, the implementation of a group breakpoint structure and contractual advisory fee waivers in January 2008 for the Funds subadvised by Marsico Capital, the recent implementation of additional voluntary expense limitations and recent enhancements to Columbia's subadviser oversight process. Taking into account these matters and other factors considered, the Board concluded that the Fund's performance, Actual Management Rate and total expense ratio were acceptable.
Conclusion. After an evaluation of the above-described factors, and based on its deliberations and analysis of the information provided and alternatives considered, the Board, including all of the Independent Trustees, concluded that the compensation payable to CMA and the Sub-Adviser under the Advisory Agreements is fair and equitable. Accordingly, the Board unanimously re-approved the Advisory Agreements.
36
Board Consideration and Approval of Proposed Investment Advisory and Sub-Advisory Agreements
Even though the following description of the Board's consideration of investment advisory and, as applicable, sub-advisory agreements covers multiple funds and trusts, for purposes of this shareholder report, the description is only relevant as to the Fund.
At a meeting held on December 21, 2009, the Boards of Trustees (the "Boards") of Columbia Funds Series Trust, Columbia Funds Master Investment Trust, LLC and Columbia Funds Series Trust II (each a "Trust" and collectively the "Trusts") unanimously approved a new investment management services agreement with RiverSource Investments, LLC ("RiverSource") (the "Proposed Advisory Agreement") and new subadvisory agreements with Marsico Capital Management ("Marsico Capital"), MacKay Shields LLC ("Mackay Shields") and Brandes Investment Partners, L.P. ("Brandes") (each a "Proposed Subadvisory Agreement"), as applicable, for each Fund of the Trusts (each a "Fund" and collectively the "Funds"). As detailed below, the Trustees met on multiple occasions in advance of the December 21, 2009 meeting, held numerous discussions with the management teams of Columbia Management Advisors, LLC ("Columbia") and RiverSource, a subsidiary of Ameriprise Financial, Inc. ("Ameriprise") and reviewed and considered extensive materials in connection with the approval of the Proposed Advisory and Subadvisory Agreements.
Specifically, the Trustees of each Trust, including a majority of the Trustees who have no direct or indirect interest in the Proposed Advisory and Subadvisory Agreements and are not "interested persons" of the Trusts, as defined in the Investment Company Act of 1940, as amended (the "1940 Act") (the "Independent Trustees") reviewed and approved (i) the Proposed Advisory Agreement with RiverSource for each Fund and (ii) the Proposed Subadvisory Agreement for those Funds that currently have investment subadvisory agreements with Marsico Capital, Mackay Shields, and Brandes (the "Subadvised Funds") (Marsico Capital, MacKay Shields and Brandes are collectively referred to as the "Subadvisers"). Prior to approving the Proposed Advisory Agreements, the Trustees were presented with, and requested, received and evaluated, extensive materials about RiverSource, the sale of a portion of the asset management business of Columbia Managemen t Group, LLC to Ameriprise (the "Transaction") and related matters from RiverSource, Ameriprise and Columbia. In this regard, the Trustees reviewed RiverSource's responses to a series of detailed requests submitted by the Independent Trustees' independent legal counsel and by the Independent Fee Consultant (as defined below).
The Trustees also reviewed and considered information received in connection with their most recent consideration and reapproval in November 2009 of the current advisory agreement (the "Current Advisory Agreement") and current subadvisory agreement (the "Current Subadvisory Agreement"), as applicable, for each Fund, including information about the Subadvisers (the "Current Agreement Re-Approval Process"). Moreover, the Trustees and committees of the Boards met on several occasions, and received extensive materials, throughout the course of the year relating to the Current Agreement Re-Approval Process, which the Trustees considered relevant to their consideration and approval of the Proposed Advisory and Subadvisory Agreements. The Trustees also consulted with Fund counsel and with the Independent Trustees' independent legal counsel, who advised on the legal standards for consideration by the Trustees, and otherwise assisted the Trustees in their deliberations.
In advance of the meeting on December 21, 2009, the Trustees held several meetings, including meetings held in-person with representatives from RiverSource and Ameriprise on August 26, 2009, November 5-6, 2009, December 9-10, 2009 and December 14, 2009, and additional meetings with representatives of Columbia, to discuss the Transaction, RiverSource's plans and intentions regarding the Funds and various proposals that were being presented as a result of the Transaction, including the Proposed Advisory and Subadvisory Agreements. In addition to these meetings, telephonic meetings and discussions were held on several occasions between individual Trustees, members of the committees of the Boards, their independent legal counsel and representatives from RiverSource, Ameriprise and/or Columbia.
The Trustees also reviewed and considered a report prepared and provided by the Fee Consultant (the "Fee Consultant") appointed by the Independent Trustees pursuant to an assurance of discontinuance entered into by a predecessor to Columbia with the New York Attorney General ("NYAG") to settle a civil complaint filed by the NYAG relating to trading in mutual fund shares (the "NYAG Settlement"). The Fee Consultant's role was to manage the process by which management fees are negotiated so that they were negotiated in a manner that is at arms' length and reasonable. The Fee Consultant found that the fee negotiation process was, to the extent practicable, at arms' length and reasonable and consistent with the requirements of the NYAG Settlement. A summary of the Fee Consultant's report is available at www.columbiafunds.com.
37
The following summarizes a number of the material factors considered by the Trustees in reaching their approvals and determinations with respect to the Proposed Advisory Agreements and Proposed Subadvisory Agreements. It is followed by a more detailed discussion of the Trustees' consideration of these and other factors considered relevant by the Trustees in their evaluation of the Proposed Advisory Agreements and Proposed Subadvisory Agreements. In voting to approve the Proposed Advisory and Subadvisory Agreements for each Fund, the Trustees also considered substantially the same factors, as relevant, and reached substantially the same conclusions in their approval of interim advisory and subadvisory agreements for each Fund.
(i) the terms and conditions of the Proposed Advisory Agreements compared to the terms and conditions of the Current Advisory Agreements, as described below;
(ii) the fact that each Fund's total advisory fees would remain the same;
(iii) the qualifications of the personnel of RiverSource, Ameriprise and the Subadvisers expected to provide advisory and administrative services to each Fund, including representations by Ameriprise regarding its retention of the same process for monitoring and evaluating portfolio management personnel for each Fund as currently used by Columbia;
(iv) the terms and conditions of the Proposed Subadvisory Agreements compared to the terms and conditions of the Current Subadvisory Agreements;
(v) the reputation, financial strength, regulatory and compliance histories and resources of RiverSource and Ameriprise, and the potential benefits to the Funds of the combination of RiverSource and Columbia, including that the Funds are expected to continue to have access to existing distribution channels and have the potential for expanded distribution of Fund shares, the expected depth and breadth of investment management capabilities, that there is not expected to be any diminution in the nature, quality and extent of services to be provided to the Funds under the Proposed Advisory Agreements and the potential for the realization of additional economies of scale over time and the potential of the Funds to share in, and benefit from, these economies, if any;
(vi) that Ameriprise has committed to refrain from imposing or seeking to impose, for a period of not less than two years after the closing of the Transaction (the "Closing"), any "unfair burden" (within the meaning of Section 15(f) of the 1940 Act) on any Fund;
(vii) the terms and conditions of certain other agreements and arrangements relating to the future operations of the Funds and their distribution channels, including the administrative services agreement and the new services and distribution agreement;
(viii) that the Trustees recently had completed the Current Agreement Re-Approval Process for each Fund and had determined that they were satisfied with the nature, extent and quality of services provided thereunder and that the management fee rates and (where applicable) subadvisory fee rates for each Fund were satisfactory;
(ix) that RiverSource was willing to commit to maintain net operating expense ratios at current levels for at least the period currently covered by Columbia's existing commitments;
(x) the capabilities of RiverSource and the Subadvisers with respect to compliance, including an assessment of RiverSource's compliance program by the Funds' Chief Compliance Officer;
(xi) that certain members of RiverSource's management and certain Columbia personnel that will be integrated into RiverSource and its affiliates as a result of the Transaction have substantial experience in integrating fund families; and
(xii) that Ameriprise and Bank of America Corporation would bear the costs of obtaining approvals of the Proposed Advisory and Subadvisory Agreements.
In their deliberations, the Trustees did not identify any single item that was paramount or controlling and individual Trustees may have attributed different weights to various factors. The Trustees also evaluated all information available to them on a Fund-by-Fund basis, and their determinations were made separately in respect of each Fund.
Nature, Extent and Quality of Services to be Provided. The Trustees received and considered various data and information regarding the expected nature, extent and quality
38
of services to be provided to the Funds by RiverSource and the Subadvisers under the Proposed Advisory and Subadvisory Agreements. The most recent investment adviser registration forms for RiverSource and each Subadviser were made available to the Boards, as well as extensive materials from RiverSource, Ameriprise and Columbia. The Trustees reviewed and analyzed these materials, which included, among other things, information about the background and experience of expected senior management of RiverSource and Ameriprise after the Closing. The Trustees considered RiverSource's ability to provide administrative services to the Funds, noting that while the aggregate scope of advisory and administrative services was not expected to change following the Closing, the allocation of services was expected to shift, to a limited extent, such that administrative services will be provided under a new administrative services agreement. The T rustees considered, among other things, the capacity and quality of RiverSource's and the Subadvisers' investment management, research and trade execution capabilities and other resources that would be dedicated to performing services for the Funds. The Trustees also considered matters related to RiverSource's and the Subadvisers' compliance programs and compliance records, including RiverSource's portfolio transaction policies and procedures. The Trustees discussed with senior management personnel their ability to administer and oversee outside service providers to the Funds and their shareholders and were satisfied with management's processes for providing services and overseeing and reviewing services to be rendered by outside sources.
In evaluating the services to be provided under the Proposed Advisory and Subadvisory Agreements, the Trustees factored in their extensive discussions with representatives of Columbia, RiverSource and Ameriprise at the meetings referenced above regarding the management of each Fund. The Trustees considered representations by Ameriprise that it was expected that there will be no diminution in the nature and quality of services provided to the Funds. The Trustees noted that Columbia Management Group's current President, Columbia's current Chief Investment Officer and Columbia's current President, were expected to continue to serve the Funds in similar capacities after the Closing. With respect to portfolio management, the Trustees reviewed information regarding the deliberative process for selecting portfolio management personnel to continue servicing the Funds after the Closing, including the expected role of Columbia's Chief Investment Officer in evaluating and selecting portfolio management personnel for each Fund utilizing Columbia's current analytical model for evaluating portfolio managers. In this regard, the Trustees also weighed representations by Ameriprise that this investment management evaluative process was likely to result in a significant number of Columbia investment professionals and personnel currently responsible for management of the Funds to remain in place. The Trustees noted that the portfolio management evaluation and selection process was designed to optimize the portfolio management resources available to each Fund by having the ability to select investment personnel for the Funds from the combined organization. Similarly, the Trustees evaluated the ability of RiverSource and the Subadvisers, based on their respective resources, reputations and other attributes, to attract and retain qualified investment professionals. In this regard, t he Trustees considered information regarding the nature of the compensation structure applicable to portfolio managers and other key investment personnel.
The Trustees reviewed and considered information from Ameriprise and RiverSource regarding various contemplated service provider arrangements, including information regarding both immediate and potential future plans in respect of these arrangements. In this regard, the Trustees considered information regarding potential distribution, transfer agency and custody arrangements and the evaluation of fund accounting, financial reporting and valuation service model options, noting certain differences between Columbia's and RiverSource's current approaches, including that RiverSource has historically utilized services provided "in-house" or by its affiliates for fund accounting, financial reporting and valuation. The Trustees reviewed information from Ameriprise and RiverSource regarding the expectation for rationalized or harmonized fees as part of the integration after the Closing in order to develop consistent service fee schedules across the combined fund family. The Trustees noted Ameriprise's representations that, to the extent any such proposals were recommended to the Board after the Closing, they would not result in an "unfair burden" (within the meaning of Section 15(f) of the 1940 Act) on any Fund.
In addition, the Trustees reviewed and evaluated materials and information received regarding the investment and legal compliance programs of the Funds, RiverSource and the Subadvisors, including their compliance policies and
39
procedures and reports of the Funds' Chief Compliance Officer. In this regard, the Trustees considered that Columbia's current Chief Compliance Officer was expected to serve in the same role after the Closing.
The Trustees also noted that Ameriprise and certain of its affiliates have been involved in a number of legal, arbitration and regulatory proceedings, including routine litigation, class actions, and governmental actions, concerning matters arising in connection with the ordinary conduct of their business activities, and that Ameriprise indicated that neither Ameriprise nor any of its affiliates are the subject of any pending legal, arbitration or regulatory proceedings that are likely to have a material adverse effect on the Funds or the ability of Ameriprise or its affiliates, including RiverSource to provide services to the Funds.
Based on the foregoing and other information considered relevant, the Trustees concluded that, overall, they were satisfied with assurances from Columbia, RiverSource, Ameriprise and the Subadvisers as to the expected nature, extent and quality of services to be provided to each Fund under the Proposed Advisory and Subadvisory Agreements.
Investment Advisory and Subadvisory Fee Rates and Other Expenses. The Trustees reviewed and considered the proposed contractual investment advisory fee rates to be paid by each Fund to RiverSource for investment management services both separately and together with the administration fee rates to be paid by the Funds to RiverSource (the "Contractual Management Rates"), which are the same as the separate and aggregate advisory and administrative fee rates currently paid by each Fund to Columbia. The Trustees also reviewed and considered the proposed subadvisory fee rates and the fee arrangements under the Proposed Subadvisory Agreements, respectively, which are also the same as those currently in effect under the Current Subadvisory Agreements. In addition to the materials provided by Columbia, RiverSource provided information regarding the current fee s for each of the RiverSource funds and other relevant institutional accounts. The Trustees reviewed and considered the proposed fee waiver/cap arrangements applicable to the Contractual Management Rates and considered the Contractual Management Rates after taking the waivers/caps into account (the "Actual Management Rates"). In this regard, the Trustees noted that RiverSource had committed to maintain the Funds' current expense limitation and waiver arrangements (both contractual and voluntary). The Trustees considered the potential that, after the Closing, RiverSource would propose a common fee and expense structure for the combined fund family, subject to the commitment that Ameriprise will not seek any change that would result in an "unfair burden" on any Fund. The Trustees also considered the report prepared and provided by the Fee Consultant. Additionally, the Trustees received and afforded specific attention to information provide d in connection with the Current Agreement Re-Approval Process, comparing the Contractual Management Rates and Actual Management Rates with those of other funds in each Fund's Peer Group (as defined below).
During the Current Agreement Re-Approval Process, the Trustees reviewed and considered statistical information regarding each Fund's total expense ratio and its various components, including contractual advisory fees, actual advisory fees, actual nonmanagement fees, Rule 12b-1 and non-Rule 12b-1 service fees, fee waivers/caps and/or expense reimbursements. The Trustees also reviewed comparisons of these fees to the expense information for the group of Funds that was determined by Lipper Inc. ("Lipper") to be the most similar to a given Fund (the "Peer Group") and to the performance of a broader universe of relevant funds as determined by Lipper (the "Universe"), which comparative data was provided by Lipper, an independent provider of investment company data.
The Trustees were provided with a description of the methodology used by Lipper to select the mutual funds in each Fund's Peer Group and Universe and reviewed the degree of comparability resulting from the selection methodology. For certain Funds, Lipper determined that changing the composition of the Peer Group and/or Universe for expenses from that used for performance would provide a more accurate basis of comparison. The Trustees also considered Lipper data that ranked each Fund based on: (i) each Fund's one- and three-year performance compared to actual management fees; and (ii) each Fund's one- and three-year performance compared to total expenses.
For each Fund, except as otherwise described in the Fund-specific discussion below, the Trustees noted that they had concluded during the Current Agreement Re-Approval Process that the Contractual Management Rates, the Actual Management Rates and the total expense ratio were at
40
acceptable levels in light of the quality of services provided to the Fund and in comparison to such Fund's Peer Group and Universe, as applicable; that the advisory fee rate would not be increased for any Fund; that Ameriprise and RiverSource had represented that the overall expenses for each Fund were not expected to be adversely affected by the Transaction; and that RiverSource had committed to maintain the Funds' current expense limitation or waiver arrangements (both contractual and voluntary).
Based on the foregoing, other relevant information received and the additional information described in the Fund-specific discussion below, as applicable, the Trustees concluded that the Contractual Management Rates, the Actual Management Rates and the total expense ratio were acceptable.
Fund Performance. The Trustees reviewed detailed performance information for each Fund at various Board and committee meetings during the year in addition to the additional performance information that they reviewed and evaluated in connection with the Transaction. The Trustees also reviewed and evaluated detailed performance information for each Fund in connection with the Current Agreement Re-Approval Process. The Trustees considered the performance results for each of the Funds over multiple measurement periods. They also considered these results in comparison to the performance results of each Fund's Peer Group and Universe, as well as to each Fund's benchmark index. The Boards also noted certain risk-adjusted performance data.
The Trustees also reviewed and evaluated information and data regarding the investment performance record of RiverSource in managing funds with investment strategies generally similar to those of the Funds, as applicable. Investment performance for such funds was provided for a wide range of periods.
The Trustees recognized that the investment performance record of RiverSource in managing funds with similar objectives may be less relevant to their deliberations in situations where the current portfolio managers of Columbia are expected to continue managing a particular Fund following the Closing. They also recognized that for each Fund, it is not possible to predict with certainty what effect, if any, consummation of the Transaction will have on the future performance of the Funds, noting in particular that past investment performance is no assurance of future results. The Fund-by-Fund discussion set forth below provides additional information regarding those Funds highlighted as meeting agreed-upon criteria for warranting further review. Such criteria included, among other things, information relating to Actual Management Rates, total expense ratios and /or performance information, relative to a Fund's Peer Group and/or Universe.
Costs of Services to be Provided and Profitability. In considering the costs of services to be provided by RiverSource and the Subadvisers under the Proposed Advisory Agreement and Proposed Subadvisory Agreement, as applicable for each Fund, and the projected range of profitability to RiverSource and the Subadvisers from their relationships with the Funds, the Trustees considered, among other things, that there would be no increase in advisory or subadvisory fee rates under the Proposed Advisory and Subadvisory Agreements. The Trustees further noted, with respect to RiverSource, that it was not possible to predict with certainty how RiverSource's profitability would be affected by becoming the investment adviser to the Funds but, as a general matter, they were satisfied, based on their review of RiverSource's projected range of profitability assuming completion of the Transaction, that this projected profitability from their relationship with the Funds would not be excessive. The Trustees based their review, in part, on information regarding RiverSource's current profitability in managing the RiverSource Funds and the information available to the Trustees with respect to RiverSource's expense budgeting process. The Trustees also noted that they would have ongoing opportunities to address RiverSource's profitability in the future based on actual results. The Trustees did not consider separate profitability information with respect to the Subadvisers, as their profitability from their relationships with the Funds was not a material factor in determining whether to approve the Proposed Subadvisory Agreements. The Trustees also noted that the subadvisory fees paid to the Subadvisers, none of which is affiliated with Columbia, had previously been negotiated on an arms' length basis.
The Trustees also reviewed information about the financial condition of RiverSource and the Subadvisers and were satisfied that RiverSource and the Subadvisers have adequate resources to perform the services required under the Proposed Advisory and Proposed Subadvisory Agreements.
41
Subject to the limitations noted above, the Trustees concluded that they were satisfied that RiverSource's projected range of future profitability, and each Subadviser's historical profitability, from their relationship with each Fund, as relevant, were not excessive.
Economies of Scale. The Trustees received and evaluated information regarding the potential to realize economies of scale with respect to management of the Funds, whether the Funds would appropriately benefit from any economies of scale and whether there was any potential for realization of further economies of scale in connection with the Transaction. The Trustees noted that the current and proposed investment advisory fee rates for most of the Funds contain breakpoints that reduce the fee rate on assets above specified levels. The Trustees noted that RiverSource had indicated that no changes to the Funds' breakpoint arrangements were proposed to be made at this time. In light of these factors and noting that it was not possible to evaluate with certainty if and how the Transaction would produce any immediate opportunities for additional economies of scale, the Trustees concluded that each Fund's breakpoint arrangements were acceptable. The Trustees also recognized that the Funds may benefit from certain economies of scale over time from becoming a part of the larger RiverSource fund complex, based on potential future synergies of operations, potential fee harmonization/rationalization initiatives and potential future Fund mergers. The Trustees noted, in particular, RiverSource's acknowledgement of the principle that the Funds should share in certain economies of scale if realized by RiverSource. In addition, the Trustees evaluated the likelihood that there would be potential Fund mergers after the Closing. The Trustees noted that any such potential Fund mergers, if approved, could result in the achievement of additional breakpoints for Funds that have implemented breakpoint fee schedules. The Trustees also noted that they expect to consider economies of scale from time to time following the Closing and thus be in a position to evaluate any additional e conomies of scale.
The Trustees acknowledged the inherent limitations of any analysis of an investment adviser's economies of scale, stemming largely from the Trustees' understanding that economies of scale are generally realized, if at all, by an investment adviser across a variety of products and services, not just with respect to a single fund.
Information About Investment Management Services to Non-Mutual Fund Clients. The Trustees also received and reviewed information about the nature and extent of services and fee rates offered by Riversource and the Subadvisers to the Funds compared with other clients with similar accounts, including separate accounts and institutional investments. The Trustees noted that the Funds may receive services different from those offered to other clients of RiverSource and the Subadvisers and concluded that the advisory fee rates under the Proposed Advisory Agreements and the subadvisory fee rates under the Proposed Subadvisory Agreements were not excessive, given the nature and extent of services expected to be offered and other factors, including the Trustees' review of Lipper data.
Other Benefits to RiverSource and the Subadvisers. The Trustees received and reviewed information regarding any expected "fall-out" or ancillary benefits to be received by RiverSource and its affiliates and by the Subadvisers as a result of their relationships with the Funds.
Among other things, the Trustees noted that RiverSource would benefit from soft dollar arrangements using portfolio brokerage of each Fund that invests in equity securities. The Trustees also noted that the Subadvisers also had benefited from, and expected to continue to benefit from, soft dollar arrangements using portfolio brokerage of the Subadvised Funds. The Trustees acknowledged RiverSource's representation that none of its affiliated broker dealers was expected to provide brokerage services to any Fund, but noted that broker-dealer affiliates of RiverSource will receive distribution related fees from the Funds in respect of shares held in certain accounts, and that such Funds' distributor (which will also become a subsidiary of RiverSource following the closing of the Transaction) retains a portion of the distribution related fees from the Funds and receives a portion of the sales charges on sales or redemptions of certai n classes of shares of the Funds. The Trustees recognized that RiverSource's and the Subadvisers' profitability would be somewhat lower without these benefits. The Trustees concluded that RiverSource and the Subadvisers may derive reputational benefits from their association with the Funds. The Trustees also noted, however, that such benefits were difficult to quantify with certainty.
42
Fund-Specific Considerations for Certain "Review" Funds. During the Current Agreement Re-Approval Process, a limited number of Funds were highlighted as meeting agreed-upon criteria for warranting further review. Such criteria included, among other things, information relating to Actual Management Rates, total expense ratios and/or performance information, relative to a Fund's Peer Group and/or Universe. For such "review" Funds, the Trustees engaged in further analysis with regard to the approval of the Funds' Current Advisory Agreements. For each such Fund, the Trustees subsequently considered the impact of transitioning investment management responsibilities to RiverSource.
The Trustees engaged in further review of Columbia Marsico Focused Equities Fund because its Actual Management Rate and total expense ratio were appreciably above the median range of its Peer Group and its performance over certain periods was below the median range of its Universe. However, the Trustees noted other factors such as positive performance over other periods, the inherently higher cost structure of subadvised funds, the implementation of a group breakpoint structure and contractual advisory fee waivers in January 2008 for the Funds subadvised by Marsico Capital, the recent implementation of additional voluntary expense limitations and recent enhancements to Columbia's subadviser oversight process. Taking into account these matters and other factors considered, the Trustees concluded that the Fund's performance, Actual Management Rate and total expense ratio were, at this time, acceptable, under the circumstances.
Conclusion. After an evaluation of the above-described factors and based on its deliberations and analysis of the information provided and alternatives considered, each Board, including all of the Independent Trustees, concluded that approval of the Proposed Advisory and Subadvisory Agreements was in the best interests of each of the Funds and its shareholders. Accordingly, the Boards unanimously approved the Proposed Advisory and Subadvisory Agreements.
43
Summary of Management Fee Evaluation by
Independent Fee Consultant
EXCERPTS FROM REPORT OF INDEPENDENT FEE CONSULTANT TO THE FUNDS SUPERVISED BY THE COLUMBIA NATIONS BOARD
Prepared Pursuant to the February 9, 2005
Assurance of Discontinuance among the
Office of Attorney General of New York State,
Columbia Management Advisors, LLC, and
Columbia Management Distributors, Inc.
November 12, 2009
I. Overview
On February 9, 2005, Columbia Management Advisors, LLC ("CMA") and Columbia Management Distributors, Inc.1 ("CMD") agreed to the New York Attorney General's Assurance of Discontinuance ("AOD"). Among other things, the AOD stipulates that CMA may manage or advise a Columbia Fund ("Columbia Fund" and, together with some or all of such funds, the "Columbia Funds") only if the Independent Members of the Columbia Fund's Board of Trustees appoint a Senior Officer or retain an Independent Fee Consultant ("IFC") who is to manage the process by which proposed management fees are negotiated. The AOD further stipulates that the Senior Officer or IFC is to prepare a written annual evaluation of the fee negotiation process.
With effect from January 1, 2007, the Independent Members of the Board of Trustees for certain Columbia Funds known collectively as the "Nations Funds" (together with the other members of that Board, the "Trustees") retained me as IFC for the Nations Funds.2 In this capacity, I have prepared the fifth annual written evaluation of the fee negotiation process. As was the case with the 2007 and 2008 reports, my immediate predecessor as IFC, John Rea, provided invaluable assistance in the preparation of this year's report.
A. Role of the Independent Fee Consultant
The AOD charges the IFC with "managing the process by which proposed management fees ... to be charged the Columbia Fund are negotiated so that they are negotiated in a manner which is at arms' length and reasonable and consistent with this Assurance of Discontinuance." The AOD also provides that CMA "may manage or advise a Columbia Fund only if the reasonableness of the proposed management fees is determined by the Board of Trustees ... using ... an annual independent written evaluation prepared by or under the direction of ... the Independent Fee Consultant." Therefore, the AOD makes clear that the IFC does not supplant the Trustees in negotiating management fees with CMA, nor does the IFC substitute his or her judgment for that of the Trustees with respect to the reasonableness of proposed fees or any other matter that is committed to the business judgmen t of the Trustees.
B. Elements Involved in Managing the Fee Negotiation Process
In preparing the report required by the AOD, the IFC must consider at least the following six factors set forth in the AOD:
1. The nature and quality of CMA's services, including the Fund's performance;
2. Management fees (including any components thereof) charged by other mutual fund companies for like services;
3. Possible economies of scale as the Fund grows larger;
4. Management fees (including any components thereof) charged to institutional and other clients of CMA for like services;
5. Costs to CMA and its affiliates of supplying services pursuant to the management fee agreements, excluding any intra-corporate profit; and
6. Profit margins of CMA and its affiliates from supplying such services.
C. Organization of the Annual Evaluation
This report, like last year's, focuses on the six factors and contains a section for each factor except that CMA's costs and profits from managing the Funds are treated in a single section. In addition to a discussion of these factors, the report offers recommendations to improve the fee review process in future years. A review of the status of recommendations made in the 2008 Report is being provided separately with the materials for the November meeting.
1 CMA and CMD are subsidiaries of Columbia Management Group, LLC ("CMG"), and are the successors to the entities named in the AOD.
2 I have no material relationship with Bank of America, CMG or any of its affiliates, aside from serving as IFC, and I am aware of no material relationship with any of their affiliates. I retained John Rea, an independent economic consultant, to assist me with this report.
Unless otherwise stated or required by the context, this report covers only the Nations Funds, which are also referred as the "Funds."
44
II. Summary of Findings
A. General
1. Based upon my examination of the information supplied by CMG in the light of the six factors set forth in the AOD, I conclude that the Trustees have the relevant information necessary to evaluate the reasonableness of the proposed management fees for each Nations Fund, subject to the following: on September 30, 2009, Ameriprise Financial, Inc. ("Ameriprise") announced that it had agreed to purchase the investment management business of CMG with the exception of its cash and liquidity management business which includes the Nations money market Funds. As a result, the Trustees requested information from CMG as to the plans of CMG and its parent with respect to the provision of investment management services to those Funds after the consummation of the proposed transaction. As of the date of this report, that in formation has not yet been provided. However, as the transaction is not expected to close until the spring of 2010, the Trustees concluded that they would have ample opportunity to take appropriate steps with respect to the investment management agreements of the money market Funds, including invoking the 60-day termination provisions of those agreements, in response to the information to be provided by CMG and reviewed by the IFC.
In my view, the process by which the proposed management fees of the Funds have been negotiated in 2009 thus far has been, to the extent practicable, at arms' length and reasonable and consistent with the AOD.
B. Nature and Quality of Services, Including Performance
3. The performance of the Funds was relatively strong for the measuring periods ending March 31, 2009. Between one-third and nearly one-half of the Funds were ranked in either the first or second quintiles in the one-, three-, five-, and 10-year periods, and no more than 8% were in the fifth quintile for these periods. Overall, the performance was stronger in the two longer periods.
4. The strongest performing groups over the one-, three-, and five-year periods were active equity, quantitative strategies, and, to a lesser extent, money market Funds. Sub-advised Funds were the weakest performers, with over 60% of the Funds in the bottom two quintiles in the one- and three-year periods. For the same two periods, no more than 15% percent of the sub-advised Funds were in the top two quintiles. Almost half of fixed-income Funds ranked in the bottom two quintiles in the one- and three-year periods.
5. Overall performance of the Funds was less robust in 2009 than in 2008 and 2007 for the one- and three-year performance periods. For example, 62% of the Funds were in the top two quintiles in 2007 for the one-year period compared with 33% in 2009. The ranks of those in the bottom two quintiles rose significantly between 2007 and 2009, led by money market and fixed-income Funds in the one- and three-year periods. For the three-year period, there was a similar trend with respect to sub-advised Funds.
6. The performance of the active equity Funds against their benchmarks was strong for the one-, three-, and five-year performance periods. In contrast, more than half of the sub-advised Funds failed to beat their benchmarks on a net basis in the one- and three-year periods. The fixed-income Funds consistently produced gross returns below those of their benchmarks. Lipper quintile rankings of the actively managed equity Funds are highly correlated with their performance against their benchmarks in the sense that net returns in excess of the benchmark appear necessary to achieve a ranking in one of the top three quintiles. No such correlation was observed for fixed-income and quantitative strategies Funds.
7. The equity Funds' overall performance adjusted for risk was mixed. Based upon three-year returns, less than 40% of the equity Funds had a combination of risk-adjusted and unadjusted returns that placed them in the top half of their performance universes; 60% were in the bottom half of their universes. About 30% of the fixed income Funds posted high returns and low risk relative to comparable funds. Over 60% of the fixed-income Funds took on more risk than the typical fund in their performance universes.
8. The industry-standard procedure used by Lipper that includes all share classes in the performance universe tends to bias a Fund's ranking upward within that universe. The bias occurs because either no-12b-1 fee or low-12b-1 fee share classes of the Nations Funds are compared with funds in performance universes that
45
include all share classes of multi-class funds with 12b-1 fees of up to 100 basis points. Correcting this bias by limiting the performance universe to classes of comparable funds with low or no 12b-1 fees (a "filtered universe") lowers the relative performance for the Funds, but generally not to a material extent. The filtering process, however, did identify two Funds for further review that had not been so identified using unfiltered universes.
9. A small number of Funds have consistently underperformed over the past five years. The exact number depends on the criteria used to evaluate longer-term performance. For example, six different Funds have had below-median performance in at least four out of the five years between 2005 and 2009 for either the one- or three-year performance periods from 2005 to 2009. If the threshold were the 60th percentile, only two Funds would have satisfied the criteria.
10. The services performed by CMG professionals beyond portfolio management, such as compliance, legal, information technology, risk management, finance, and fund administration, are critical to the success of the Funds and appear to be of high quality.
C. Management Fees Charged by Other Mutual Fund Companies
11. The Funds' management fees and total expenses are generally low relative to those of their peers, with over half the Funds ranking in the most favorable two quintiles. For total expenses, slightly more than one-quarter are in the bottom two quintiles, while slightly less than two-fifths are in the bottom two quintiles for actual management fees. Fixed-income and quantitative strategies Funds have the lowest fees and expenses relative to their peers. The sub-advised Funds account for the majority of Funds in the fifth quintile for both management fees and total expenses.
12. The distribution of management fee rankings has changed little over the past three years, while the distribution of total expense rankings has moved in the direction of higher expenses. The most notable change involving total expenses has been a shift in the number of Funds from the first to the second quintile.
13. The management fees of the non-subadvised Funds are generally in line with those of Columbia Funds supervised by the Atlantic Board of Trustees (the "Atlantic Funds"). The sub-advised large cap equity, international equity, and high yield Funds, however, generally have higher management fees than those of comparable Atlantic and non-subadvised Funds.
14. The implementation of the new program of voluntary expense limits appears to have been associated, on balance, with less favorable expense rankings. This result reflects increases in expense limits for certain Funds, the removal of fee waivers, and the shift of certain expenses from CMA to the Funds. The decline in expense rankings is less significant, however, than CMA projected in December 2008.
D. Trustees' Advisory Contract Review Process
15. The Trustees' evaluation process identified 22 Funds in 2009 for further review based upon long-standing criteria relating to their relative performance or expenses or both. When compared in filtered universes, two more Funds met the criteria for further review. At the November meeting, CMG provided further information about each of those Funds to assist the Trustees in their evaluation.
E. Potential Economies of Scale
16. CMG presented to the Trustees its analysis of the sources and sharing of potential economies of scale. CMG views economies of scale as arising at the complex level and would regard estimates of scale economies for individual funds as unreliable. In its analysis, CMG did not identify specific sources of economies of scale or provide any estimates of any economies of scale that might arise from future asset growth. CMG's analysis included measures taken by the Trustees and CMG that seek to share any potential economies of scale through breakpoints in management fee schedules, the establishment of expense limits for each Fund, enhanced shareholder services, fund mergers, and operational consolidation.
17. An examination of the contractual fee schedules for five Nations Funds shows that the schedules for Small Cap II, Municipal Reserves, and Treasury Reserves compare favorably with those of their competitors, while the subadvised Marsico Growth and High Yield VS Funds have schedules generally above those of their peers, including funds that do not have a sub-adviser. The group fee with
46
breakpoints that characterizes the money market Fund schedules is not typically found among competitors, nearly all of which have flat fee schedules.
F. Management Fees Charged to Institutional Clients
18. CMG has provided Trustees with comparisons of mutual fund management fees and institutional fees based upon standardized fee schedules and upon actual fees. The results show that, consistent with industry practice, actual and scheduled institutional fees are generally, but not always, lower than the Funds' management fees. CMG provided additional data this year demonstrating that at small asset levels, the effective fee of certain Funds may be equal to or less than institutional fee levels at those asset levels, due to the effect of expense limits on small funds with high gross expenses. CMG also analyzed the differences between the services provided and risks borne on the one hand by a manager of mutual funds and on the other by institutional advisers, and suggested that these differences should be kept in mind when Trustees review the reasonableness of the Funds' management fees.
G. Revenues, Expenses, and Profits
19. The activity-based cost allocation methodology employed by CMG to allocate costs, both direct and indirect, for purposes of calculating Fund profitability is thoughtful and detailed. This year, CMG further refined the technique by allocating additional indirect expenses on an activity basis.
20. The materials provided on CMG's revenues and expenses with respect to the Funds and the methodology underlying their construction form a sufficient basis for Trustees to evaluate the expenses of and profitability to CMG arising out of its relationships with the Funds.
21. CMG provided a firm-wide pro forma 2009 income statement demonstrating the effect of market events beginning in the fourth quarter of 2008 on its revenues and profitability to provide an additional perspective on calendar 2008 profitability data.
22. In 2008, CMG's pre-tax pre- and post-distribution margins on the Nations Funds were above the industry mean and median, based on limited data available for publicly held mutual fund managers and excluding the costs of CMG's money market capital support programs. However, as is to be expected in a 63-Fund complex, some Nations Funds had relatively high pre-tax profit margins in 2008, when calculated solely with respect to management revenues and expenses, while other Nations Funds operated at a loss. There is a positive relationship between Fund size and profitability to CMG, with smaller Funds generally operating at a loss to CMG.
23. CMG pays a fixed percentage of its management fee revenues to an affiliate, U.S. Trust, Bank of America Private Wealth Management, with respect to assets of its clients invested in Nations Funds to compensate it for services it performs with respect to those client assets and for the effect of state law limitations on affiliates charging multiple fees. Based on our analysis of the services provided by this affiliate, we have concluded that all payments other than those for sub-transfer agent or sub-accounting services should be treated as a distribution expense.
III. Recommendations
1) Criteria for review. The Trustees may wish to consider modifying the criteria for identifying a Fund for further review (a "Review Fund") to include criteria that focus exclusively on performance. They may also wish to consider whether it would be useful to apply CMG's own internal monitoring standards for Fund performance to the contract review process, or whether such criteria are more relevant to their ongoing investment oversight.
2) Presentation of Review Fund discussion. CMG should consider whether it could more systematically present in one discussion all relevant information regarding each Review Fund, which is now split into several different portions of the 15(c) materials. For any Fund that has been a Review Fund in consecutive years, CMG should address under what circumstances it could reasonably be anticipated that the Fund would lose that status.
3) Refinement of tax-exempt performance data. Certain single-state tax-exempt Funds compete in extremely small universes and are compared to a multi-state benchmark of uncertain relevance. Notwithstanding the difficulties, CMG should work to improve the reliability of the calculation of relative performance of these Funds. If that is not possible, CMG should provide guidance on how the Trustees should judge the quality of CMG's management of these Funds.
47
4) Development of risk metrics for asset-allocation, tax-exempt, and money market Funds. CMG has developed and shared with the Trustees quantitative risk metrics comparing equity and taxable fixed-income Funds against their peers. However, reliable risk metrics have not been developed for asset-allocation, tax-exempt fixed income, and money market Funds. We urge CMG to continue its efforts to provide reliable risk measures for these categories of Funds, especially in the cases of asset-allocation and money market funds, because their investors are likely to be motivated at least in part by a desire to manage risk.
5) Profitability data. For any period during which CMG is an affiliate of U.S. Trust, Bank of America Private Wealth Management, CMG should continue to present to the Trustees the profitability of each Fund, each investment style and each complex (of which Nations is one) calculated as follows:
a. Management-only profitability should be calculated without reference to any Private Bank expense.
b. Profitability excluding distribution (which essentially covers the management and transfer agency functions) should be adjusted by removing from the expense calculation any portion of the Private Bank payment not attributable to the performance by the Private Bank of sub-transfer agency or sub-accounting functions.
c. Total profitability, including distribution: No adjustment for Private Bank expenses should be made, because all such expenses represent legitimate fund expenses to be taken into account in calculating CMG's profit margin including distribution.
d. Distribution only: This should include all Private Bank expenses other than those attributable to sub-transfer agency services.
6) Contractual fee analysis. This year CMG presented a new Lipper report comparing the contractual management fees of Funds with those of competitors in similar investment styles. However, the reliability of the conclusion—that Fund management fee breakpoints compared favorably with competitive fee rates—was limited by the use of competitive funds at all asset levels. The sponsors of a $100 million mutual fund may not have given much thought to breakpoints at $5 billion; therefore, that fund's contractual fee at that level is unlikely to compare favorably with that of a $5 billion Fund. Limiting the competitors to the Lipper expense group, whose constituents are similar in size to the rele vant Fund, would make the results more meaningful. In addition, the breakpoints of a select group of Nations Funds (which would differ each year) should continue to be compared to those of industry rivals to ensure that the Funds' breakpoint schedules remain within industry norms. As breakpoint schedules change relatively little each year, performing such a comparison for each Nations Fund each year would not be an efficient use of Trustee and CMG resources.
7) Pro forma profitability data. In any year in which CMG or the Trustees believe that the prior year's profitability is unlikely to be representative of current business results due to changes in markets or for any other reason, CMG should, consistent with this year's practice, prepare a pro forma income statement based on year-to-date actual data and reasonable projections used for its own business planning purposes.
8) Additional institutional data and analysis. While CMG provided a substantial amount of information on its institutional business, we suggest some additional items for future years: (a) profitability data for the institutional business in the format, and based upon the same allocation methodologies, used to present Fund profitability, (b) an explanation of how CMA sets institutional fee breakpoints, which normally begin at asset levels far lower than those found in Fund management fee breakpoints, and (c) distinguishing in all institutional fee materials fees of accounts acquired prior to the development of current fee schedules (so-called "legacy" accounts) from the fees of accounts launched after that time.
9) Management fee disparities. In any future study of management fees, CMG and the Nations Trustees should analyze the differences in management fee schedules. As part of that analysis, CMG should provide an explanation for any significant fee differences among comparable funds across fund families sponsored by CMG, such as differences in the management styles of different Funds included the same Lipper category. Finally, if CMG proposes a management fee change or an expense cap for
48
any mutual fund managed by CMA that is comparable to any Nations Fund, CMG should provide the Trustees with sufficient information about the proposal to allow the Trustees to assess the applicability of the proposed change to the relevant Nations Fund or Funds.
10) Explanation of data supplied to Lipper. Each year, as part of the 15(c) process, CMG retains Lipper to compare the fees and expenses of each Fund to a group of competitors. In many cases, CMG, with the approval of the Trustees, adjusts the actual expense data, which is based on the most recent full fiscal year of the Fund (and each competitive fund) to reflect changes in fees or expense limits that occurred during or after the relevant fiscal year. This improves the reliability and usefulness of the comparison. However, to ensure that the Trustees know when and how CMG adjusted the data, we recommend that CMG prepare a table listing for each Fund what adjustments were made, e.g., to reflect a new expense limitation of x basis points that commenced on y date.
11) Reduction of volume of paper documents submitted. The effort to streamline and better organize the data presented to the Trustees and the process by which that data was prepared and organized continued to be well-received by all parties. Notwithstanding past success, it is always appropriate to look for opportunities to reduce and simplify the presentation of 15(c) data. One possibility would be to remove the 127 pages of biographical data, most if not all of which the Trustees have previously seen as part of their ongoing investment oversight duties, from the paper volume and post it on the Internet-based document storage and retrieval system used by the Funds to provide reference data to Trustees.
Respectfully submitted,
Steven E. Asher
49
This page intentionally left blank.
This page intentionally left blank.
This page intentionally left blank.
Important Information About This Report
The fund mails one shareholder report to each shareholder address. If you would like more than one report, please call shareholder services at 1-800-345-6611 and additional reports will be sent to you. This report has been prepared for shareholders of Columbia Marsico Focused Equities Fund.
A description of the policies and procedures that the fund uses to determine how to vote proxies and a copy of the fund's voting records are available (i) at www.columbiamanagement.com, (ii) on the Securities and Exchange Commission's website at www.sec.gov, and (iii) without charge, upon request, by calling 1-800-368-0346. Information regarding how the fund voted proxies relating to portfolio securities during the 12-month period ended June 30 is available from the SEC's website. Information regarding how the fund voted proxies relating to portfolio securities is also available from the fund's website, www.columbiamanagement.com.
The fund files a complete schedule of portfolio holdings with the SEC for the first and third quarters of each fiscal year on Form N-Q. The fund's Form N-Q is available on the SEC's website at www.sec.gov and may be reviewed and copied at the SEC's Public Reference Room in Washington, D.C. Information on the operation of the Public Reference Room may be obtained by calling 1-800-SEC-0330.
Please read and consider the investment objectives, risks, charges and expenses for any fund carefully before investing. For a prospectus which contains this and other important information about the fund, contact your Columbia Management representative or financial advisor or go to www.columbiamanagement.com.
Columbia Management Group, LLC ("Columbia Management") is the investment management division of Bank of America Corporation. Columbia Management entities furnish investment management services and products for institutional and individual investors. Columbia Funds are distributed by Columbia Management Distributors, Inc., member of FINRA, SIPC, part of Columbia Management and an affiliate of Bank of America Corporation.
Transfer Agent
Columbia Management Services, Inc.
P.O. Box 8081
Boston, MA 02266-8081
1-800-345-6611
Distributor
Columbia Management
Distributors, Inc.
One Financial Center
Boston, MA 02111
Investment Advisor
Columbia Management Advisors, LLC
100 Federal Street
Boston, MA 02110
53
Columbia Management®
One Financial Center
Boston, MA 02111-2621
PRSRT STD
U.S. Postage
PAID
Holliston, MA
Permit NO. 20
Columbia Management®
Columbia Marsico Focused Equities Fund
Annual Report, February 28, 2010
©2010 Columbia Management Distributors, Inc.
One Financial Center, Boston, MA 02111-2621
800-345-6611 www.columbiafunds.com
SHC-42/35116-0210 (04/10) 10-92F3F1
Columbia Management®
Annual Report
February 28, 2010
International/Global
Stock Funds
g Columbia Global Value Fund
g Columbia International Value Fund
g Columbia Marsico Global Fund
g Columbia Marsico International Opportunities Fund
g Columbia Multi-Advisor International Equity Fund
| NOT FDIC INSURED | | May Lose Value | |
|
| NOT BANK ISSUED | | No Bank Guarantee | |
|
Table of Contents
| Economic Update | | | 1 | | |
|
| Columbia Global Value Fund | | | 3 | | |
|
| Columbia International Value Fund | | | 8 | | |
|
| Columbia Marsico Global Fund | | | 13 | | |
|
| Columbia Marsico International Opportunities Fund | | | 18 | | |
|
| Columbia Multi-Advisor International Equity Fund | | | 23 | | |
|
| Investment Portfolios | | | 28 | | |
|
| Financial Statements | | | 46 | | |
|
Report of Independent Registered
Public Accounting Firm | | | 96 | | |
|
| Federal Income Tax Information | | | 97 | | |
|
Columbia International Value
Master Portfolio | | | 98 | | |
|
| Investment Portfolio | | | 99 | | |
|
| Financial Statements | | | 102 | | |
|
Report of Independent Registered
Public Accounting Firm | | | 113 | | |
|
| Fund Governance | | | 114 | | |
|
Board Consideration and
Re-Approval of Current
Investment Advisory and
Sub-Advisory Agreements | | | 117 | | |
|
Board Consideration and
Approval of Proposed
Investment Advisory and
Sub-Advisory Agreements | | | 121 | | |
|
Summary of Management Fee
Evaluation by Independent
Fee Consultant | | | 128 | | |
|
Important Information About
This Report | | | 137 | | |
|
The views expressed in this report reflect the current views of the respective parties. These views are not guarantees of future performance and involve certain risks, uncertainties and assumptions that are difficult to predict, so actual outcomes and results may differ significantly from the views expressed. These views are subject to change at any time based upon economic, market or other conditions and the respective parties disclaim any responsibility to update such views. These views may not be relied on as investment advice and, because investment decisions for a Columbia Fund are based on numerous factors, may not be relied on as an indication of trading intent on behalf of any particular Columbia Fund. References to specific securities should not be construed as a recommendation or investment advice.
President's Message

Dear Shareholder:
As we previously announced, Bank of America has reached a definitive agreement to sell Columbia Management's long-term asset management business to Ameriprise Financial, Inc. This includes the management of its equity and fixed-income mutual funds.
This transaction combines two leading asset management firms and will create one entity that is expected to rank as one of the top asset managers. It is anticipated that the combined U.S. asset management business will operate under the well-regarded Columbia Management brand. The combined U.S. asset management business will be led by Ted Truscott, currently president, U.S. asset management, annuities and chief investment officer, Ameriprise Financial. Michael A. Jones, currently president of Columbia Management, will serve as president, U.S. asset management. Colin Moore, chief investment officer at Columbia Management, will continue to serve in that role for the combined organization. I will also continue in my role as head of mutual funds, responsible for the delivery of mutual fund products and services to investors.
As a valued investor in Columbia funds, please know that our goal is to ensure a smooth transition and provide you with the highest quality products and services. We will work closely with colleagues at Ameriprise Financial to seek a seamless transition for our clients and to keep you informed as the transition progresses and key decisions are made. We want to assure you that the funds' portfolio managers continue to focus on providing uninterrupted service to Columbia fund shareholders. Columbia Management and Ameriprise Financial will operate independently until all required approvals, including fund board, fund shareholder and other client approvals, have been received and the transaction closes, which is expected to occur in the spring of this year.
Meanwhile, transition teams across the company have been formed to oversee integration efforts including rebranding initiatives, vendor and system consolidations and client communications. Throughout the transition, we seek to build on best practices from both legacy organizations with enhancements to productivity, quality and the delivery of world-class customer experiences.
Clearly, we have a lot of work ahead of us in 2010. We look forward to introducing our combined business with an even wider breadth of products and capabilities. Everyone at Columbia Management and Ameriprise Financial is excited about the opportunities for this combined organization. I share this optimism and believe it will position us as a best-in-class asset management business with the ability to deliver more for clients than ever before.
Sincerely,

J. Kevin Connaughton
President, Columbia Funds
Past performance is no guarantee of future results.
Economic Update – International/Global Stock Funds
After a deep and difficult recession, the World Bank estimates that global gross domestic product (GDP) declined 2.2% in 2009. However, many economies began to regain their footing midway through the year. Growth turned positive in the second half of 2009 in the United States, Japan, the United Kingdom, Germany and France. In some smaller euro zone countries, such as Spain and Italy, recession continued through the year, and debt problems remain a problem for Greece, Spain, Portugal and Italy. For 2010, global economic growth is expected to rise at a rate of 2.7%.
Stimulus spending aided recovery
Growth around the world was aided by government stimulus spending, but the emerging markets of China, India and Brazil were notable for their use of stimulus to help jumpstart the global recovery. All three countries have capitalized on policies put in place over the past decade to stimulate domestic demand and succeeded through a combination of spending, tax cuts and other incentives.
Hopes for a sustained recovery around the world now depend on a number of factors including a rebound in consumer spending, an increase in revenues to keep business profits moving higher and a turnaround in the export markets, the latter of which appears to be underway. According to Moodys.com, surveys of manufacturers across the world show export orders up after the steepest decline in trade since the 1930s. The employment picture in developed countries is also improving, in the sense that job losses have slowed. However, it could take until 2011 for job growth to accelerate in a meaningful way, raising concerns about the sustainability of recovery where unemployment remains stubbornly high.
Manufacturing activity has picked up around the world, and the technology sector has been a significant beneficiary. Demand for both hardware and software have increased after a sharp decline in 2008 and 2009. India reports that its outsourcing pipeline is filling again. In the United States, the manufacturing sector was one of the first signs that the economy was on the mend. In Asia and South America, stimulus spending, strong domestic demand and a rebound in trade have driven manufacturing activity sharply higher. However, manufacturing in eurozone countries lags the rest of the world.
Stocks bottomed, then rebounded
Against a strengthening economic backdrop, a stock market rally that began in mid-March 2009 continued throughout the period. The U.S. stock market returned 53.62% for the 12-month period, as measured by the S&P 500 Index.1 Outside the U.S., stock market returns were even stronger. The MSCI EAFE Index,2 a broad gauge of stock market performance in foreign developed markets, gained 54.58% (net of dividends, in U.S. dollars) for the period. Emerging stock markets were caught in last year's
1The Standard & Poor's (S&P) 500 Index tracks the performance of 500 widely held, large-capitalization U.S. stocks.
2The Morgan Stanley Capital International Europe, Australasia, Far East (MSCI EAFE) Index is a capitalization-weighted index that tracks the total return of common stocks in 21 developed-market countries within Europe, Australasia and the Far East.
Indices are not available for investment, are not professionally managed and do not reflect sales charges, fees, brokerage commissions, taxes or other expenses of investing. Securities in the fund may not match those in an index.
Summary
For the 12-month period that ended February 28, 2010
g After a sharp decline, stock markets rebounded around the world, as measured by the S&P 500 Index, the MSCI EAFE Index and the MSCI Emerging Markets Index.
| S&P Index | | MSCI
EAFE Index | |
|
 | |  | |
|
MSCI
EMI Index | |
|
 | |
|
1
Economic Update (continued) – International/Global Stock Funds
downdraft, but they bounced back stronger than domestic or developed world markets in 2009 as their economic growth generally outpaced the developed world. The MSCI Emerging Markets Index3 returned 91.63% (in U.S. dollars), led by strong performances from India and the regions of Eastern Europe and South America.
Past performance is no guarantee of future results.
3The Morgan Stanley Capital International Emerging Markets Index (MSCI EMI) is a free float-adjusted market capitalization index that is designed to measure equity market performance of emerging markets. As of June 2009, the MSCI Emerging Markets Index consisted of the following 22 emerging market country indices: Brazil, Chile, China, Colombia, Czech Republic, Egypt, Hungary, India, Indonesia, Israel, Korea, Malaysia, Mexico, Morocco, Peru, Philippines, Poland, Russia, South Africa, Taiwan, Thailand and Turkey.
Indices are not available for investment, are not professionally managed and do not reflect sales charges, fees, brokerage commissions, taxes or other expenses of investing. Securities in the fund may not match those in an index.
2
Fund Profile – Columbia Global Value Fund
Performance data quoted represents past performance and current performance may be lower or higher. Past performance is no guarantee of future results. The investment return and principal value will fluctuate so that shares, when redeemed, may be worth more or less than the original cost. Please visit www.columbiafunds.com for daily and most recent month-end performance updates.
Summary
1-year return as of 02/28/10
| | | | | +48.97% | |
|
| |  | | | Class A shares
(without sales charge) | |
|
| | | | | +54.30% | |
|
| |  | | | MSCI World Index | |
|
Morningstar Style BoxTM
The Morningstar Style BoxTM reveals a fund's investment strategy. For equity funds, the vertical axis shows the market capitalization of the stocks owned, and the horizontal axis shows investment style (value, blend or growth). Information shown is based on the most recent data provided by Morningstar.
Summary
g For the 12-month period that ended February 28, 2010, the fund's Class A shares returned 48.97% without sales charge. The MSCI World Index1 returned 54.30% for the same period.
g The fund underperformed its benchmark, the MSCI World Index.
g Overweights in telecommunication services, pharmaceuticals (in the health care sector) and an overweight in Japan, as well as stock selection in certain segments of the financials sector, were the primary detractors from relative performance. Industry weights are a residual of our bottom-up, stock-specific investment approach.
Portfolio Management
Columbia Management Advisors, LLC ("CMA") is an SEC-registered investment adviser and indirect, wholly owned subsidiary of Bank of America Corporation. CMA has retained Brandes Investment Partners, L.P. ("Brandes") to serve as an investment subadvisor. As the investment subadvisor, Brandes manages the fund on a day-to-day basis. Brandes is an SEC-registered investment advisor and unaffiliated with Bank of America Corporation.
The following are the seven voting members of Brandes' Large Cap Investment Committee who are jointly responsible for making day-to-day investment decisions for the Fund: Glenn R. Carlson, Brent V. Woods, Amelia Maccoun Morris, Jim Brown, Keith Colestock, Brent Fredberg, and Jeffrey Germain. Chief Executive Officer (CEO) Glenn R. Carlson has been with Brandes since 1986, serving as Managing Partner from 1996-2002, co-CEO from 2002-2004, and CEO since 2004. Brent V. Woods has been with Brandes since 1995, serving as Managing Partner from 1998-2002 and Managing Director of Investments since 2002. Amelia Maccoun Morris has been with Brandes since 1998, serving as a Senior Research Analyst from 1998-2004, and Director of Investments since 2004. Jim Brown has been with Brandes since 1996, serving as a Senior Research Analyst from 1996-2004, and Director of Investments since 2004. Keith Colestock has been with Brandes since 1995, serving as a Portfolio Manager from 1995-2001, Senior Research Analyst from 2001-2004, and Director of Investments since 2004. Brent Fredberg has been with Brandes since 1999, serving as an Analyst from 1999-2003, and Senior Research Analyst since 2003. Jeffrey Germain has been with Brandes since 2001, serving as a Research Associate from 2001-2004, Senior Research Associate from 2004-2005, and Research Analyst since 2005.
Subject to satisfying various conditions to closing, effective on or about May 1, 2010, RiverSource Investments, LLC, a subsidiary of Ameriprise Financial, Inc., is expected to become the investment advisor to the fund and change its name to Columbia Management Investment Advisers, LLC. Please see the fund's prospectus dated July 1, 2009, including the supplements thereto, for more information regarding the expected change in investment advisor and any related changes to the portfolio management of the fund.
1The Morgan Stanley Capital International (MSCI) World Index is an index that tracks the performance of global stocks. Indices are not available for investment, are not professionally managed and do not reflect sales charges, fees, brokerage commissions, taxes or other expenses of investing. Securities in the fund may not match those in an index.
3
Performance Information – Columbia Global Value Fund
Performance data quoted represents past performance and current performance may be lower or higher. Past performance is no guarantee of future results. The investment return and principal value will fluctuate so that shares, when redeemed, may be worth more or less than the original cost. Please visit www.columbiafunds.com for daily and most recent month-end performance updates.
Annual operating expense ratio (%)*
| Class A | | | 1.63 | | |
| Class B | | | 2.38 | | |
| Class C | | | 2.38 | | |
| Class Z | | | 1.38 | | |
*The annual operating expense ratio is as stated in the fund's prospectus that is current as of the date of this report. Differences in expense ratios disclosed elsewhere in this report may result from including fee waivers and expense reimbursements as well as different time periods used in calculating the ratios.
Performance of a $10,000 investment 04/16/01 – 02/28/10
The chart above shows the change in value of a hypothetical $10,000 investment in Class A shares of Columbia Global Value Fund during the stated time period, and does not reflect the deduction of taxes that a shareholder may pay on fund distributions or on the redemption of fund shares.
Performance of a $10,000 investment 04/16/01 – 02/28/10 ($)
| Sales charge | | without | | with | |
| Class A | | | 12,292 | | | | 11,585 | | |
| Class B | | | 11,511 | | | | 11,511 | | |
| Class C | | | 11,529 | | | | 11,529 | | |
| Class Z | | | 12,611 | | | | n/a | | |
Average annual total return as of 02/28/10 (%)
| Share class | | A | | B | | C | | Z | |
| Inception | | 04/16/01 | | 04/16/01 | | 04/16/01 | | 04/16/01 | |
| Sales charge | | without | | with | | without | | with | | without | | with | | without | |
| 1-year | | | 48.97 | | | | 40.49 | | | | 47.63 | | | | 42.63 | | | | 47.88 | | | | 46.88 | | | | 49.50 | | |
| 5-year | | | –2.54 | | | | –3.68 | | | | –3.26 | | | | –3.47 | | | | –3.23 | | | | –3.23 | | | | –2.24 | | |
| Life | | | 2.35 | | | | 1.67 | | | | 1.60 | | | | 1.60 | | | | 1.62 | | | | 1.62 | | | | 2.65 | | |
Average annual total return as of 03/31/10 (%)
| Share class | | A | | B | | C | | Z | |
| Sales charge | | without | | with | | without | | with | | without | | with | | without | |
| 1-year | | | 44.73 | | | | 36.50 | | | | 43.79 | | | | 38.79 | | | | 43.78 | | | | 42.78 | | | | 45.04 | | |
| 5-year | | | –0.97 | | | | –2.14 | | | | –1.72 | | | | –1.94 | | | | –1.72 | | | | –1.72 | | | | –0.70 | | |
| Life | | | 2.90 | | | | 2.23 | | | | 2.14 | | | | 2.14 | | | | 2.13 | | | | 2.13 | | | | 3.17 | | |
The "with sales charge" returns include the maximum initial sales charge of 5.75% for Class A shares and the applicable contingent deferred sales charge of 5.00% in the first year, declining to 1.00% in the sixth year and eliminated thereafter for Class B shares and 1.00% for Class C shares for the first year only. The "without sales charge" returns do not include the effect of sales charges. If they had, returns would be lower.
Performance results reflect any fee waivers or reimbursements of fund expenses by the investment advisor and/or any of its affiliates. Absent these fee waivers or expense reimbursement arrangements, performance results would have been lower.
All results shown assume reinvestment of distributions. Class Z shares are sold at net asset value with no distribution and service (Rule 12b-1) fees. Class Z shares have limited eligibility and the investment minimum requirements may vary. Please see the fund's prospectus for details. Performance for different share classes will vary based on differences in sales charges and fees associated with each class.
The tables do not reflect the deduction of taxes that a shareholder may pay on fund distributions or on the redemption of fund shares.
4
Understanding Your Expenses – Columbia Global Value Fund
As a fund shareholder, you incur two types of costs. There are transaction costs, which generally include sales charges on purchases and may include redemption fees or exchange fees. There are also ongoing costs, which generally include investment advisory fees, distribution and service (Rule 12b-1) fees and other fund expenses. The information on this page is intended to help you understand the ongoing costs of investing in the fund and to compare these costs with the ongoing costs of investing in other mutual funds.
Analyzing your fund's expenses by share class
To illustrate these ongoing costs, we have provided an example and calculated the expenses paid by investors in each share class during the period. The information in the following table is based on an initial investment of $1,000, which is invested at the beginning of the period and held for the entire period. Expense information is calculated two ways and each method provides you with different information. The amount listed in the "Actual" column is calculated using the fund's actual operating expenses and total return for the period. The amount listed in the "Hypothetical" column for each share class assumes that the return each year is 5% before expenses and is calculated based on the fund's actual operating expenses. You should not use the hypothetical account values and expenses to estimate either your actual account balance at the end of the period or the expenses you paid during this period.
Compare with other funds
Since all mutual funds are required to include the same hypothetical calculations about expenses in shareholder reports, you can use this information to compare the ongoing cost of investing in the fund with other funds. To do so, compare the 5% hypothetical example with the 5% hypothetical examples that appear in the shareholder reports of other funds. As you compare hypothetical examples of other funds, it is important to note that hypothetical examples are meant to highlight the ongoing costs of investing in a fund and do not reflect any transaction costs, such as sales charges, redemption fees or exchange fees.
Estimating your actual expenses
To estimate the expenses that you paid over the period, first you will need your account balance at the end of the period:
g For shareholders who receive their account statements from Columbia Management Services, Inc., your account balance is available online at www.columbiafunds.com or by calling Shareholder Services at 800.345.6611.
g For shareholders who receive their account statements from their financial intermediary, contact your financial intermediary to obtain your account balance.
1. Divide your ending account balance by $1,000. For example, if an account balance was $8,600 at the end of the period, the result would be 8.6.
2. In the section of the table below titled "Expenses paid during the period," locate the amount for your share class. You will find this number in the column labeled "Actual." Multiply this number by the result from step 1. Your answer is an estimate of the expenses you paid on your account during the period.
If the value of your account falls below the minimum initial investment requirement applicable to you, your account generally will be subject to a $20 annual fee. This fee is not included in the accompanying table. If you are subject to the fee, keep it in mind when you are estimating the ongoing expenses of investing in the fund and when comparing the expenses of this fund with other funds.
09/01/09 – 02/28/10
| | | Account value at the
beginning of the period ($) | | Account value at the
end of the period ($) | | Expenses paid
during the period ($) | | Fund's annualized
expense ratio (%) | |
| | | Actual | | Hypothetical | | Actual | | Hypothetical | | Actual | | Hypothetical | | Actual | |
| Class A | | | 1,000.00 | | | | 1,000.00 | | | | 998.30 | | | | 1,016.71 | | | | 8.08 | | | | 8.15 | | | | 1.63 | | |
| Class B | | | 1,000.00 | | | | 1,000.00 | | | | 994.70 | | | | 1,012.99 | | | | 11.77 | | | | 11.88 | | | | 2.38 | | |
| Class C | | | 1,000.00 | | | | 1,000.00 | | | | 996.50 | | | | 1,012.99 | | | | 11.78 | | | | 11.88 | | | | 2.38 | | |
| Class Z | | | 1,000.00 | | | | 1,000.00 | | | | 998.30 | | | | 1,017.95 | | | | 6.84 | | | | 6.90 | | | | 1.38 | | |
Expenses paid during the period are equal to the annualized expense ratio for the share class, multiplied by the average account value over the period, then multiplied by the number of days in the fund's most recent fiscal half-year and divided by 365.
Had the investment advisor and/or any of its affiliates not waived fees or reimbursed a portion of expenses, account value at the end of the period would have been reduced.
It is important to note that the expense amounts shown in the table are meant to highlight only ongoing costs of investing in the fund and do not reflect any transaction costs, such as sales charges, redemption fees or exchange fees. Therefore, the hypothetical examples provided may not help you determine the relative total costs of owning shares of different funds. If these transaction costs were included, your costs would have been higher.
5
Portfolio Managers' Report – Columbia Global Value Fund
Performance data quoted represents past performance and current performance may be lower or higher. Past performance is no guarantee of future results. The investment return and principal value will fluctuate so that shares, when redeemed, may be worth more or less than the original cost. Please visit www.columbiafunds.com for daily and most recent month-end performance updates.
Net asset value per share
as of 02/28/10 ($)
| Class A | | | 5.85 | | |
| Class B | | | 5.62 | | |
| Class C | | | 5.63 | | |
| Class Z | | | 5.91 | | |
Distributions declared per share
03/01/09 – 02/28/10 ($)
| Class A | | | 0.27 | | |
| Class B | | | 0.22 | | |
| Class C | | | 0.22 | | |
| Class Z | | | 0.29 | | |
For the 12-month period that ended February 28, 2010, the fund's Class A shares returned 48.97% without sales charge. The MSCI World Index returned 54.30% for the same period. In a period of rising stock market performance around the world, the fund generated strong positive returns. However, overweights in telecommunication services, pharmaceuticals (in the health care sector) and an overweight in Japan detracted from the fund's returns relative to its benchmark. Stock selection in commercial banks and insurance (in the financials sector) also hampered relative performance. This negative performance was largely the result of the fund's exposure to Japanese companies in the financials sector. Please keep in mind that industry weights are not strategic. They are a residual of our bottom-up, stock-specific investment approach.
Strong gains from a range of industry groups
Positions in commercial banks in the financials sector, pharmaceuticals in the health care sector, semiconductors & semiconductor equipment in the technology sector and diversified telecommunication services made the largest positive contributions to the fund's absolute returns. Top performers from these groups included Fifth Third Bancorp and PNC Financial Services Group (1.5% and 2.1% of net assets, respectively), both commercial banks located in the United States, and French pharmaceuticals firm Sanofi-Aventis (2.6% of net assets).
In commercial banks, performance was amplified relative to the benchmark by an overweight in the group relative to the benchmark. However, stock selection in commercial banks detracted from performance. In the semiconductors & semiconductor equipment industry, stock selection aided relative performance while overweights in pharmaceuticals and telecommunications detracted from relative performance. An underweight in the oil, gas and & consumable fuels industry also benefited the fund's relative return as the group underperformed the overall return of the index.
Country weights delivered mixed results
The fund's positions in the United States, Netherlands and France generated strong absolute returns relative to the benchmark. Stock selection in the U.S. market and an overweight in Netherlands aided relative returns. U.S. based Micron Technology and France-based STMicroelectronics (1.8% of net assets) were top performers in these markets. In France, Carrefour, a food & staples retailing firm, generated strong returns. The fund's holdings in Japan, Sweden and Germany were also solid performers, but stock selection within these country allocations detracted from relative returns relative to the benchmark. A lack of exposure to Australia and Canada, and an overweight in Japan also hampered performance relative to the benchmark.
6
Portfolio Managers' Report (continued) – Columbia Global Value Fund
Stock-specific research drove portfolio changes
During the period, our company-by-company analysis led to several adjustments in the portfolio. For example, we sold our positions in U.S. based Wyeth, a pharmaceutical company, and Unisys, a technology company, as well as South Korea-based KT Corporation, a telecommunications company. We used the proceeds to pursue what we believe to be more attractive opportunities. For example, we invested in Valero Energy (1.0% of net assets), a U.S.-based oil, gas & consumable fuels company, and Seven & I Holdings (0.5% of net assets), a Japan-based food & staples retailer. We made these investments at prices that we considered to be attractive.
Looking ahead
Looking ahead, we plan to continue to incorporate what we have learned during the difficult market environment of the past two years to help us evaluate individual companies and determine their individual values. We will seek to avoid the temptation to make knee-jerk reactions that deviate from our philosophy. Our goal is to exercise patience in analyzing companies and searching for opportunities to invest when we believe there are meaningful discounts between intrinsic value and market price, in order to build portfolios that have an opportunity for long-term appreciation. We appreciate your trust and will continue to work diligently on behalf of the fund's shareholders to position the portfolio for the long term.
The foregoing reflects the thoughts and opinions of Brandes Investment Partners® exclusively and is subject to change without notice.
Brandes Investment Partners® is a registered trademark of Brandes Investment Partners, L.P. in the United States and Canada.
Source for all statistical data: Columbia Management Advisors, LLC.
Source for all stock-specific commentary: Brandes
Portfolio holdings and characteristics are subject to change periodically and may not be representative of current holdings and characteristics. The outlook for the fund may differ from those presented for other Columbia Funds.
Equity investments are affected by stock market fluctuations that occur in response to economic and business developments.
International investing may involve certain risks, including currency fluctuations, risks associated with possible differences in financial accounting standards and other monetary and political risks. Significant levels of foreign taxes, including potentially confiscatory levels of taxation and withholding taxes, may also apply to some foreign investments.
Investing in emerging markets may involve greater risks than investing in more developed countries. In addition, concentration of investments in a single region may result in greater volatility.
Top 5 sectors
as of 02/28/10 (%)
| Financials | | | 21.0 | | |
| Telecommunication Services | | | 19.7 | | |
| Information Technology | | | 18.4 | | |
| Health Care | | | 16.2 | | |
| Consumer Staples | | | 13.0 | | |
Top 10 holdings
as of 02/28/10 (%)
| Nippon Telegraph & Telephone | | | 3.5 | | |
| Deutsche Telekom AG | | | 3.3 | | |
| Pfizer | | | 3.3 | | |
| AT&T | | | 2.9 | | |
| Verizon Communications | | | 2.8 | | |
| Safeway | | | 2.8 | | |
| Microsoft | | | 2.7 | | |
| Sanofi-Aventis | | | 2.6 | | |
| Dell | | | 2.5 | | |
| GlaxoSmithKline | | | 2.5 | | |
The fund is actively managed and the composition of its portfolio will change over time. Information provided is calculated as a percentage of net assets.
7
Fund Profile – Columbia International Value Fund
Performance data quoted represents past performance and current performance may be lower or higher. Past performance is no guarantee of future results. The investment return and principal value will fluctuate so that shares, when redeemed, may be worth more or less than the original cost. Please visit www.columbiafunds.com for daily and most recent month-end performance updates.
Summary
1-year return as of 02/28/10
| | | | | +45.57% | |
|
| |  | | | Class A shares
(without sales charge) | |
|
| | | | | +60.15% | |
|
| |  | | | MSCI EAFE Value Index | |
|
| | | | | +54.58% | |
|
| |  | | | MSCI EAFE Index | |
|
Morningstar Style BoxTM

The Morningstar Style BoxTM reveals a fund's investment strategy. For equity funds, the vertical axis shows the market capitalization of the stocks owned, and the horizontal axis shows investment style (value, blend or growth). Information shown is based on the most recent data provided by Morningstar.
The fund is a feeder fund that invests all or substantially all of its assets in a master portfolio. Holding information referenced in this section is that of the master portfolio.
Summary
g For the 12-month period that ended February 28, 2010, the fund's Class A shares returned 45.57% without sales charge.
g The fund underperformed its benchmark, the MSCI EAFE Value Index.1 Prior to April 1, 2009, the fund's benchmark was the MSCI EAFE Index2. The fund changed its benchmark effective April 1, 2009 because the Advisor believes that the MSCI EAFE Value Index more closely aligns with the historical value bias of the fund and better conveys the fund's characteristics and risk profile compared to the prior benchmark.
g Although the fund enjoyed strong gains from all sectors of the market, stock selection and sector allocation within commercial banks and within companies based in Japan had a negative impact on relative performance. Sector allocation is a residual of our investment process.
Portfolio Management
Columbia Management Advisors, LLC ("CMA") is an SEC-registered investment adviser and indirect, wholly owned subsidiary of Bank of America Corporation. CMA has retained Brandes Investment Partners, L.P. ("Brandes") to serve as an investment subadvisor. As the investment subadvisor, Brandes manages the master portfolio on a day-to-day basis. Brandes is an SEC-registered investment advisor and unaffiliated with Bank of America Corporation.
The following are the seven voting members of Brandes' Large Cap Investment Committee who are jointly responsible for making day-to-day investment decisions for the Fund: Glenn R. Carlson, Brent V. Woods, Amelia Maccoun Morris, Jim Brown, Keith Colestock, Brent Fredberg, and Jeffrey Germain. Chief Executive Officer (CEO) Glenn R. Carlson has been with Brandes since 1986, serving as Managing Partner from 1996-2002, co-CEO from 2002-2004, and CEO since 2004. Brent V. Woods has been with Brandes since 1995, serving as Managing Partner from 1998-2002 and Managing Director of Investments since 2002. Amelia Maccoun Morris has been with Brandes since 1998, serving as a Senior Research Analyst from 1998-2004, and Director of Investments since 2004. Jim Brown has been with Brandes since 1996, serving as a Senior Research Analyst from 1996-2004, and Director of Investments since 2004. Keith Colestock has been with Brandes since 1995, serv ing as a Portfolio Manager from 1995-2001, Senior Research Analyst from 2001-2004, and Director of Investments since 2004. Brent Fredberg has been with Brandes since 1999, serving as an Analyst from 1999-2003, and Senior Research Analyst since 2003. Jeffrey Germain has been with Brandes since 2001, serving as a Research Associate from 2001-2004, Senior Research Associate from 2004-2005, and Research Analyst since 2005.
Subject to satisfying various conditions to closing, effective on or about May 1, 2010, RiverSource Investments, LLC, a subsidiary of Ameriprise Financial, Inc., is expected to become the investment advisor to the fund and change its name to Columbia Management Investment Advisers, LLC. Please see the fund's prospectus dated July 1, 2009, including the supplements thereto, for more information regarding the expected change in investment advisor and any related changes to the portfolio management of the fund.
1The Morgan Stanley Capital International Europe, Australasia, Far East (MSCI EAFE) Value Index is a subset of the MSCI EAFE Index, and constituents of the index include securities from Europe, Australasia and the Far East. The index generally represents approximately 50% of the free float-adjusted market capitalization of the underlying MSCI EAFE Index, and consists of those securities classified by Morgan Stanley Capital International, Inc. (MSCI) as most representing the value style, such as higher book value-to-price ratios, higher forward earnings-to-price ratios, higher dividend yields and lower forecasted growth rates than securities representing the growth style.
2The Morgan Stanley Capital International (MSCI) Europe, Australasia, Far East (EAFE) Index is a free float-adjusted market capitalization index that is designed to measure developed market equity performance, excluding the U.S. and Canada.
Indices are not investments, do not incur fees or expenses and are not professionally managed. It is not possible to invest directly in an index. Securities in the fund may not match those in an index.
8
Performance Information – Columbia International Value Fund
Performance of a $10,000 investment 03/01/00 – 02/28/10
The chart above shows the change in value of a hypothetical $10,000 investment in Class A shares of Columbia International Value Fund during the stated time period, and does not reflect the deduction of taxes that a shareholder may pay on fund distributions or on the redemption of fund shares.
Performance of a $10,000 investment 03/01/00 – 02/28/10 ($)
| Sales charge | | without | | with | |
| Class A | | | 17,652 | | | | 16,636 | | |
| Class B | | | 16,390 | | | | 16,390 | | |
| Class C | | | 16,385 | | | | 16,385 | | |
| Class Z | | | 18,110 | | | | n/a | | |
Performance data quoted represents past performance and current performance may be lower or higher. Past performance is no guarantee of future results. The investment return and principal value will fluctuate so that shares, when redeemed, may be worth more or less than the original cost. Please visit www.columbiafunds.com for daily and most recent month-end performance updates.
Annual operating expense ratio (%)*
| Class A | | | 1.38 | | |
| Class B | | | 2.13 | | |
| Class C | | | 2.13 | | |
| Class Z | | | 1.13 | | |
*The annual operating expense ratio is as stated in the fund's prospectus that is current as of the date of this report. Differences in expense ratios disclosed elsewhere in this report may result from including fee waivers and expense reimbursements as well as different time periods used in calculating the ratios.
Average annual total return as of 02/28/10 (%)
| Share class | | A | | B | | C | | Z | |
| Inception | | 12/27/95 | | 05/22/98 | | 06/15/98 | | 12/27/95 | |
| Sales charge | | without | | with | | without | | with | | without | | with | | without | |
| 1-year | | | 45.57 | | | | 37.25 | | | | 44.61 | | | | 39.61 | | | | 44.44 | | | | 43.44 | | | | 45.94 | | |
| 5-year | | | 2.23 | | | | 1.02 | | | | 1.48 | | | | 1.27 | | | | 1.47 | | | | 1.47 | | | | 2.49 | | |
| 10-year | | | 5.85 | | | | 5.22 | | | | 5.07 | | | | 5.07 | | | | 5.06 | | | | 5.06 | | | | 6.12 | | |
Average annual total return as of 03/31/10 (%)
| Share class | | A | | B | | C | | Z | |
| Sales charge | | without | | with | | without | | with | | without | | with | | without | |
| 1-year | | | 44.33 | | | | 36.02 | | | | 43.23 | | | | 38.23 | | | | 43.32 | | | | 42.32 | | | | 44.56 | | |
| 5-year | | | 4.08 | | | | 2.86 | | | | 3.31 | | | | 3.09 | | | | 3.31 | | | | 3.31 | | | | 4.34 | | |
| 10-year | | | 5.71 | | | | 5.08 | | | | 4.92 | | | | 4.92 | | | | 4.92 | | | | 4.92 | | | | 5.97 | | |
The "with sales charge" returns include the maximum initial sales charge of 5.75% for Class A shares and the applicable contingent deferred sales charge of 5.00% in the first year, declining to 1.00% in the sixth year and eliminated thereafter for Class B shares and 1.00% for Class C shares for the first year only. The "without sales charge" returns do not include the effect of sales charges. If they had, returns would be lower.
Performance results reflect any fee waivers or reimbursements of fund expenses by the investment advisor and/or any of its affiliates. Absent these fee waivers or expense reimbursement arrangements, performance results would have been lower.
All results shown assume reinvestment of distributions. Class Z shares are sold at net asset value with no distribution and service (Rule 12b-1) fees. Class Z shares have limited eligibility and the investment minimum requirements may vary. Please see the fund's prospectus for details. Performance for different share classes will vary based on differences in sales charges and fees associated with each class.
The tables do not reflect the deduction of taxes that a shareholder may pay on fund distributions or on the redemption of fund shares.
9
Understanding Your Expenses – Columbia International Value Fund
Estimating your actual expenses
To estimate the expenses that you paid over the period, first you will need your account balance at the end of the period:
g For shareholders who receive their account statements from Columbia Management Services, Inc., your account balance is available online at www.columbiafunds.com or by calling Shareholder Services at 800.345.6611.
g For shareholders who receive their account statements from their financial intermediary, contact your financial intermediary to obtain your account balance.
1. Divide your ending account balance by $1,000. For example, if an account balance was $8,600 at the end of the period, the result would be 8.6.
2. In the section of the table below titled "Expenses paid during the period," locate the amount for your share class. You will find this number in the column labeled "Actual." Multiply this number by the result from step 1. Your answer is an estimate of the expenses you paid on your account during the period.
If the value of your account falls below the minimum initial investment requirement applicable to you, your account generally will be subject to a $20 annual fee. This fee is not included in the accompanying table. If you are subject to the fee, keep it in mind when you are estimating the ongoing expenses of investing in the fund and when comparing the expenses of this fund with other funds.
As a fund shareholder, you incur two types of costs. There are transaction costs, which generally include sales charges on purchases and may include redemption fees or exchange fees. There are also ongoing costs, which generally include investment advisory fees, distribution and service (Rule 12b-1) fees and other fund expenses. The information on this page is intended to help you understand the ongoing costs of investing in the fund and to compare these costs with the ongoing costs of investing in other mutual funds.
Analyzing your fund's expenses by share class
To illustrate these ongoing costs, we have provided an example and calculated the expenses paid by investors in each share class during the period. The information in the following table is based on an initial investment of $1,000, which is invested at the beginning of the period and held for the entire period. Expense information is calculated two ways and each method provides you with different information. The amount listed in the "Actual" column is calculated using the fund's actual operating expenses and total return for the period. The amount listed in the "Hypothetical" column for each share class assumes that the return each year is 5% before expenses and is calculated based on the fund's actual operating expenses. You should not use the hypothetical account values and expenses to estimate either your actual account balance at the end of the period or the expenses you paid during this period.
Compare with other funds
Since all mutual funds are required to include the same hypothetical calculations about expenses in shareholder reports, you can use this information to compare the ongoing cost of investing in the fund with other funds. To do so, compare the 5% hypothetical example with the 5% hypothetical examples that appear in the shareholder reports of other funds. As you compare hypothetical examples of other funds, it is important to note that hypothetical examples are meant to highlight the ongoing costs of investing in a fund and do not reflect any transaction costs, such as sales charges, redemption fees or exchange fees.
09/01/09 – 02/28/10
| | | Account value at the
beginning of the period ($) | | Account value at the
end of the period ($) | | Expenses paid
during the period ($) | | Fund's annualized
expense ratio (%) | |
| | | Actual | | Hypothetical | | Actual | | Hypothetical | | Actual | | Hypothetical | | Actual | |
| Class A | | | 1,000.00 | | | | 1,000.00 | | | | 989.40 | | | | 1,017.80 | | | | 6.95 | | | | 7.05 | | | | 1.41 | | |
| Class B | | | 1,000.00 | | | | 1,000.00 | | | | 986.90 | | | | 1,014.08 | | | | 10.64 | | | | 10.79 | | | | 2.16 | | |
| Class C | | | 1,000.00 | | | | 1,000.00 | | | | 986.10 | | | | 1,014.08 | | | | 10.64 | | | | 10.79 | | | | 2.16 | | |
| Class Z | | | 1,000.00 | | | | 1,000.00 | | | | 991.40 | | | | 1,019.04 | | | | 5.73 | | | | 5.81 | | | | 1.16 | | |
Expenses paid during the period are equal to the annualized expense ratio for the share class, multiplied by the average account value over the period, then multiplied by the number of days in the fund's most recent fiscal half-year and divided by 365.
It is important to note that the expense amounts shown in the table are meant to highlight only ongoing costs of investing in the fund and do not reflect any transaction costs, such as sales charges, redemption fees or exchange fees. Therefore, the hypothetical examples provided may not help you determine the relative total costs of owning shares of different funds. If these transaction costs were included, your costs would have been higher.
10
Portfolio Managers' Report – Columbia International Value Fund
For the 12-month period that ended February 28, 2010, the fund's Class A shares returned 45.57% without sales charge. The fund's benchmark, the MSCI EAFE Value Index, returned 60.15% over the same period. In a strong rally for stock markets around the world, gains were made across almost all sectors and countries. The fund's commercial bank holdings generated strong returns. However, stock selection and an underweight in the industry, as well as stock selection and an overweight in Japan, were the largest detractors from performance relative to the benchmark, for the period.
Mixed results from stock selection and sector allocation
Broad market gains produced strong returns across most industries. Share prices for the fund's commercial banks, diversified telecommunication services, and semiconductors & semiconductor equipment holdings generally advanced. Top performers from these industries included Barclays (1.2% of net assets), a commercial bank domiciled in the United Kingdom; Portugal Telecom (3.1% of net assets), a diversified telecommunication services firm based in Portugal; and United Microelectronics, a Taiwan-based semiconductors & semiconductor equipment company. The fund had more exposure than the benchmark to both diversified telecommunication and semiconductors & semiconductor equipment stocks, which also aided performance, as did stock selection in the semiconductors & semiconductor equipment industry.
Despite strong absolute returns, the fund's holdings in the commercial banks industry were the largest detractors from performance relative to the benchmark. This negative performance relative to the benchmark, was largely the result of the fund's exposure to Japanese commercial banks. Stock selection and industry weight (which was a residual of stock selection) accounted for much of the performance shortfall relative to the benchmark.
The impact of country allocations
Among countries, investments in companies based in Japan, the United Kingdom and France generally had positive impact on fund performance. Top performers from these markets included Sony, a Japan-based household durables firm; AstraZeneca, a U.K. pharmaceuticals company and Sanofi-Aventis (2.7% and 2.5% of net assets, respectively), a French-based pharmaceuticals company. However, an overweight in Japan and individual stock selection detracted from performance during a period in which Japan lagged overall index performance.
Stock-specific research drove portfolio changes
During the period, our company-by-company analysis drove several adjustments to the portfolio. For example, we sold the fund's positions in United Microelectronics, to pursue what we believe to be more attractive opportunities. We purchased shares of the Japan-based office electronics company, Canon, and UBS (1.9% and 0.7% of net assets, respectively), a capital markets firm based in Switzerland, at prices that we considered to be attractive.
Performance data quoted represents past performance and current performance may be lower or higher. Past performance is no guarantee of future results. The investment return and principal value will fluctuate so that shares, when redeemed, may be worth more or less than the original cost. Please visit www.columbiafunds.com for daily and most recent month-end performance updates.
Net asset value per share
as of 02/28/10 ($)
| Class A | | | 13.48 | | |
| Class B | | | 13.02 | | |
| Class C | | | 12.99 | | |
| Class Z | | | 13.62 | | |
Distributions declared per share
03/01/09 – 02/28/10 ($)
| Class A | | | 0.21 | | |
| Class B | | | 0.13 | | |
| Class C | | | 0.13 | | |
| Class Z | | | 0.24 | | |
11
Portfolio Managers' Report (continued) – Columbia International Value Fund
Top 5 sectors
as of 02/28/10 (%)
| Telecommunication Services | | | 20.6 | | |
| Financials | | | 18.8 | | |
| Information Technology | | | 15.4 | | |
| Health Care | | | 12.8 | | |
| Consumer Staples | | | 11.2 | | |
Top 10 holdings
as of 02/28/10 (%)
| Portugal Telecom | | | 3.1 | | |
| Sanofi-Aventis | | | 2.7 | | |
| Deutsche Telekom | | | 2.6 | | |
| AstraZeneca | | | 2.3 | | |
| Carrefour SA | | | 2.2 | | |
| Nippon Telegraph & Telephone | | | 2.2 | | |
| GlaxoSmithKline | | | 2.1 | | |
| Nokia | | | 2.1 | | |
| Unilever NV | | | 2.1 | | |
| Rohm | | | 2.0 | | |
The master portfolio is actively managed and the composition of its portfolio will change over time. Information provided is calculated as a percentage of net assets.
The fund is a feeder fund that invests all or substantially all of its assets in a master portfolio. Holdings information referenced in this section is that of the master portfolio.
Looking ahead
Looking ahead, we plan to continue to incorporate what we have learned during the difficult market environment of the past two years to help us evaluate individual companies and determine their individual values. We will seek to avoid the temptation to make knee-jerk reactions that deviate from our philosophy. Our goal is to exercise patience in analyzing companies and searching for opportunities to invest when we believe there are meaningful discounts between intrinsic value and market price, in order to build portfolios that have an opportunity for long-term appreciation. We appreciate your trust and will continue to work diligently on behalf of the fund's shareholders to position the portfolio for the long term.
The foregoing reflects the thoughts and opinions of Brandes Investment Partners® exclusively and is subject to change without notice.
Brandes Investment Partners® is a registered trademark of Brandes Investment Partners, L.P. in the United States and Canada.
Source for all statistical data: Columbia Management Advisors, LLC.
Source for all stock-specific commentary: Brandes
Portfolio holdings and characteristics are subject to change periodically and may not be representative of current holdings and characteristics. The outlook for the fund may differ from those presented for other Columbia Funds.
Equity investments are affected by stock market fluctuations that occur in response to economic and business developments.
International investing may involve certain risks, including currency fluctuations, risks associated with possible differences in financial accounting standards and other monetary and political risks. Significant levels of foreign taxes, including potentially confiscatory levels of taxation and withholding taxes, may also apply to some foreign investments.
Investing in emerging markets may involve greater risks than investing in more developed countries. In addition, concentration of investments in a single region may result in greater volatility.
12
Fund Profile – Columbia Marsico Global Fund
Summary
g For the 12-month period ended February 28, 2010, the fund's Class A shares returned 58.22% without sales charge.
g The fund performed in line with its benchmark but outperformed its peer group average. As of August 31, 2009 and going forward, fund performance will only be compared to the MSCI All Country World Index ND (net of dividends)1, which includes the impact of an estimated withholding tax on dividend reinvestment in its return.
g As global equities appreciated sharply, sector positioning benefited fund performance, as did stock selection in several sectors. Changing currency values hampered returns relative to the benchmark.
Portfolio Management
Corydon J. Gilchrist has managed the fund since April 2008. He is associated with Marsico Capital Management, LLC, investment sub-advisor to the fund.
James G. Gendelman has managed the fund since 2000. He is associated with Marsico Capital Management, LLC, investment sub-advisor to the fund.
Thomas F. Marsico has managed the fund since April 2008. He is associated with Marisco Capital Management, LLC ("MCM"), investment sub-advisor to the fund.
Columbia Management Advisors, LLC ("CMA") and MCM are SEC-registered investment advisors. CMA is an indirect, wholly owned subsidiary of Bank of America Corporation. CMA has retained MCM to serve as investment sub-advisor. As the investment sub-advisor, MCM makes the investment decisions and manages all or a portion of the fund. MCM is not affiliated with Bank of America.
Subject to satisfying various conditions to closing, effective on or about May 1, 2010, RiverSource Investments, LLC, a subsidiary of Ameriprise Financial, Inc., is expected to become the investment advisor to the fund and change its name to Columbia Management Investment Advisers, LLC. Please see the fund's prospectus dated July 1, 2009, including the supplements thereto, for more information regarding the expected change in investment advisor and any related changes to the portfolio management of the fund.
1The Morgan Stanley Capital International (MSCI) All Country World Index (ACWI) is a free float-adjusted market capitalization index that is designed to measure equity market performance in the global developed and emerging markets. Indices are not available for investment, are not professionally managed and do not reflect sales charges, fees, brokerage commissions, taxes or other expenses of investing. Securities in the fund may not match those in an index.
Performance data quoted represents past performance and current performance may be lower or higher. Past performance is no guarantee of future results. The investment return and principal value will fluctuate so that shares, when redeemed, may be worth more or less than the original cost. Please visit www.columbiafunds.com for daily and most recent month-end performance updates.
Summary
1-year return as of 02/28/10
| | | | | +58.22% | |
|
| |  | | | Class A shares
(without sales charge) | |
|
| | | | | +58.12% | |
|
| |  | | | MSCI All Country World Index ND | |
|
| | | | | +58.96% | |
|
| |  | | | MSCI All Country World Index GD | |
|
Morningstar Style BoxTM
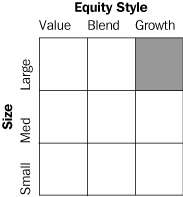
The Morningstar Style BoxTM reveals a fund's investment strategy. For equity funds, the vertical axis shows the market capitalization of the stocks owned, and the horizontal axis shows investment style (value, blend or growth). Information shown is based on the most recent data provided by Morningstar.
13
Performance Information – Columbia Marsico Global Fund
Performance data quoted represents past performance and current performance may be lower or higher. Past performance is no guarantee of future results. The investment return and principal value will fluctuate so that shares, when redeemed, may be worth more or less than the original cost. Please visit www.columbiafunds.com for daily and most recent month-end performance updates.
Annual operating expense ratio (%)*
| Class A | | | 8.79 | | |
| Class C | | | 9.54 | | |
| Class R | | | 9.04 | | |
| Class Z | | | 8.54 | | |
Annual operating expense ratio
after contractual waivers (%)*
| Class A | | | 1.60 | | |
| Class C | | | 2.35 | | |
| Class R | | | 1.85 | | |
| Class Z | | | 1.35 | | |
*The annual operating expense ratio and annual operating expense ratio after contractual waivers are as stated in the fund's prospectus that is current as of the date of this report. The contractual waiver expires 06/30/10. Differences in expense ratios disclosed elsewhere in this report may result from including fee waivers and expense reimbursements as well as different time periods used in calculating the ratios.
Performance of a $10,000 investment 04/30/08 – 02/28/10
The chart above shows the change in value of a hypothetical $10,000 investment in Class A shares of Columbia Marsico Global Fund during the stated time period, and does not reflect the deduction of taxes that a shareholder may pay on fund distributions or on the redemption of fund shares.
Performance of a $10,000 investment 04/30/08 – 02/28/10 ($)
| Sales charge | | without | | with | |
| Class A | | | 7,879 | | | | 7,426 | | |
| Class C | | | 7,780 | | | | 7,780 | | |
| Class R | | | 7,845 | | | | n/a | | |
| Class Z | | | 7,923 | | | | n/a | | |
Average annual total return as of 02/28/10 (%)
| Share class | | A | | C | | R | | Z | |
| Inception | | 04/30/08 | | 04/30/08 | | 04/30/08 | | 04/30/08 | |
| Sales charge | | without | | with | | without | | with | | without | | without | |
| 1-year | | | 58.22 | | | | 49.23 | | | | 57.17 | | | | 56.17 | | | | 57.86 | | | | 58.79 | | |
| Life | | | –12.19 | | | | –14.98 | | | | –12.80 | | | | –12.80 | | | | –12.40 | | | | –11.93 | | |
Average annual total return as of 03/31/10 (%)
| Share class | | A | | C | | R | | Z | |
| Sales charge | | without | | with | | without | | with | | without | | without | |
| 1-year | | | 60.37 | | | | 51.10 | | | | 59.27 | | | | 58.27 | | | | 59.82 | | | | 60.73 | | |
| Life | | | –8.85 | | | | –11.62 | | | | –9.54 | | | | –9.54 | | | | –9.11 | | | | –8.66 | | |
The "with sales charge" returns include the maximum initial sales charge of 5.75% for Class A shares and 1.00% for Class C shares for the first year only. The "without sales charge" returns do not include the effect of sales charges. If they had, returns would be lower.
Performance results reflect any fee waivers or reimbursements of fund expenses by the investment advisor and/or any of its affiliates. Absent these fee waivers or expense reimbursement arrangements, performance results would have been lower.
All results shown assume reinvestment of distributions. Class R shares are sold at net asset value with distribution and service (Rule 12b-1) fees. Class Z shares are sold at net asset value with no distribution and service (Rule 12b-1) fees. Class R and Class Z shares have limited eligibility and the investment minimum requirements may vary. Please see the fund's prospectus for details. Performance for different share classes will vary based on differences in sales charges and fees associated with each class.
The tables do not reflect the deduction of taxes that a shareholder may pay on fund distributions or on the redemption of fund shares.
14
Understanding Your Expenses – Columbia Marsico Global Fund
As a fund shareholder, you incur two types of costs. There are transaction costs, which generally include sales charges on purchases and may include redemption fees or exchange fees. There are also ongoing costs, which generally include investment advisory fees, distribution and service (Rule 12b-1) fees and other fund expenses. The information on this page is intended to help you understand the ongoing costs of investing in the fund and to compare these costs with the ongoing costs of investing in other mutual funds.
Analyzing your fund's expenses by share class
To illustrate these ongoing costs, we have provided an example and calculated the expenses paid by investors in each share class during the period. The information in the following table is based on an initial investment of $1,000, which is invested at the beginning of the period and held for the entire period. Expense information is calculated two ways and each method provides you with different information. The amount listed in the "Actual" column is calculated using the fund's actual operating expenses and total return for the period. The amount listed in the "Hypothetical" column for each share class assumes that the return each year is 5% before expenses and is calculated based on the fund's actual operating expenses. You should not use the hypothetical account values and expenses to estimate either your actual account balance at the end of the period or the expenses you paid during this period.
Compare with other funds
Since all mutual funds are required to include the same hypothetical calculations about expenses in shareholder reports, you can use this information to compare the ongoing cost of investing in the fund with other funds. To do so, compare the 5% hypothetical example with the 5% hypothetical examples that appear in the shareholder reports of other funds. As you compare hypothetical examples of other funds, it is important to note that hypothetical examples are meant to highlight the ongoing costs of investing in a fund and do not reflect any transaction costs, such as sales charges, redemption fees or exchange fees.
Estimating your actual expenses
To estimate the expenses that you paid over the period, first you will need your account balance at the end of the period:
g For shareholders who receive their account statements from Columbia Management Services, Inc., your account balance is available online at www.columbiafunds.com or by calling Shareholder Services at 800.345.6611.
g For shareholders who receive their account statements from their financial intermediary, contact your financial intermediary to obtain your account balance.
1. Divide your ending account balance by $1,000. For example, if an account balance was $8,600 at the end of the period, the result would be 8.6.
2. In the section of the table below titled "Expenses paid during the period," locate the amount for your share class. You will find this number in the column labeled "Actual." Multiply this number by the result from step 1. Your answer is an estimate of the expenses you paid on your account during the period.
If the value of your account falls below the minimum initial investment requirement applicable to you, your account generally will be subject to a $20 annual fee. This fee is not included in the accompanying table. If you are subject to the fee, keep it in mind when you are estimating the ongoing expenses of investing in the fund and when comparing the expenses of this fund with other funds.
09/01/09 – 02/28/10
| | | Account value at the
beginning of the period ($) | | Account value at the
end of the period ($) | | Expenses paid
during the period ($) | | Fund's annualized
expense ratio (%) | |
| | | Actual | | Hypothetical | | Actual | | Hypothetical | | Actual | | Hypothetical | | Actual | |
| Class A | | | 1,000.00 | | | | 1,000.00 | | | | 1,138.40 | | | | 1,016.86 | | | | 8.48 | | | | 8.00 | | | | 1.60 | | |
| Class C | | | 1,000.00 | | | | 1,000.00 | | | | 1,134.10 | | | | 1,013.14 | | | | 12.43 | | | | 11.73 | | | | 2.35 | | |
| Class R | | | 1,000.00 | | | | 1,000.00 | | | | 1,137.00 | | | | 1,015.62 | | | | 9.80 | | | | 9.25 | | | | 1.85 | | |
| Class Z | | | 1,000.00 | | | | 1,000.00 | | | | 1,140.10 | | | | 1,018.10 | | | | 7.16 | | | | 6.76 | | | | 1.35 | | |
Expenses paid during the period are equal to the annualized expense ratio for the share class, multiplied by the average account value over the period, then multiplied by the number of days in the fund's most recent fiscal half-year and divided by 365.
Had the investment advisor and/or any of its affiliates not waived fees or reimbursed a portion of expenses, account value at the end of the period would have been reduced.
It is important to note that the expense amounts shown in the table are meant to highlight only ongoing costs of investing in the fund and do not reflect any transaction costs, such as sales charges, redemption fees or exchange fees. Therefore, the hypothetical examples provided may not help you determine the relative total costs of owning shares of different funds. If these transaction costs were included, your costs would have been higher.
15
Portfolio Managers' Report – Columbia Marsico Global Fund
Performance data quoted represents past performance and current performance may be lower or higher. Past performance is no guarantee of future results. The investment return and principal value will fluctuate so that shares, when redeemed, may be worth more or less than the original cost. Please visit www.columbiafunds.com for daily and most recent month-end performance updates.
Net asset value per share
as of 02/28/10 ($)
| Class A | | | 7.85 | | |
| Class C | | | 7.78 | | |
| Class R | | | 7.83 | | |
| Class Z | | | 7.88 | | |
Distributions declared per share
03/01/09 – 02/28/10 ($)
| Class A | | | 0.03 | | |
| Class C | | | 0.00 | | |
| Class R | | | 0.02 | | |
| Class Z | | | 0.04 | | |
For the 12-month period ended February 28, 2010, the fund's Class A shares returned 58.22% without sales charge. The fund's return was slightly higher than the 58.12% return of its benchmark, the MSCI All Country World Index ND (net of dividends), and well above the 51.81% average return of its peer group, the Lipper Global Large-Cap Growth Funds Classification1. Sector allocation plus stock selection across a range of sectors enhanced relative performance.
Favorable stock selection and sector positioning aided returns
Financials was the best-performing sector within the fund's benchmark, and several of the fund's financials holdings did even better, including Standard Chartered (1.8% of net assets), a major bank operating in Asia, Africa and the Middle East, India-headquartered ICICI Bank (1.6% of net assets) and Brazil-based Itau Unibanco (sold during the period). In the consumer discretionary sector, Lululemon Athletica, a Canada-based apparel maker, Hong Kong-based consumer product distributor Li & Fung and Brazil-headquartered homebuilder Gafisa (1.2%, 2.5% and 3.5% of net assets, respectively) were strong performers. Certain energy positions also contributed positively to overall returns, including Brazilian oil and gas producer OGX Petroleo e Gas Participacoes (1.4% of net assets) and Texas-based contract offshore drilling provider Pride International, which was sold before the end of the reporting period.
We were underweight telecommunications, which was one of the weakest sectors within the benchmark for the period. In addition, stock selection within telecommunications was favorable, as wireless communications tower company Crown Castle International (4.0% of net assets) performed well.
Fluctuating currency values, cash weighed on returns
During the reporting period, the Australian and Canadian dollars appreciated sharply compared to many other world currencies. Because the fund does not actively manage its currency exposure, which is solely a residual of the investment process, and because it had less exposure to companies whose securities trade in these two currencies, currency exposure had a negative impact on returns. In addition, the fund maintained a modest cash position as equity values soared, which hampered results relative to the index, which is fully invested.
Disappointments in health care and materials
Stock selection in the health care and materials sectors detracted from the fund's otherwise strong results. Switzerland-based biotechnology holding Lonza posted a double-digit loss following an announcement that one of its clients had cancelled a
1Lipper Inc., a widely respected data provider in the industry, calculates an average total return (assuming reinvestment of distributions) for mutual funds with investment objectives similar to those of the fund. Lipper makes no adjustment for the effect of sales loads.
16
Portfolio Managers' Report (continued) – Columbia Marsico Global Fund
major new product order. US-based Genzyme, which has been plagued by manufacturing difficulties in key products, posted negative returns as well. Both were sold. Agricultural products firm Monsanto, which was a large position early in the reporting period, had a material, negative impact on performance and was also sold.
Summary
Over the fiscal year, the fund significantly increased its consumer discretionary and financials holdings while lowering exposure to the consumer staples, health care and industrials sectors. At the end of the period, the fund emphasized financials, consumer discretionary, information technology and health care sectors and had no exposure to utilities. The fund's largest country weights were in the United States, Brazil, Switzerland and United Kingdom.
Source for all statistical data—Columbia Management Advisors, LLC.
Source for all stock-specific commentary—Marsico Capital Management, LLC.
Portfolio holdings and characteristics are subject to change periodically and may not be representative of current holdings and characteristics. The outlook for the fund may differ from those presented for other Columbia Funds.
Equity investments are affected by stock market fluctuations that occur in response to economic and business developments.
International investing may involve certain risks, including currency fluctuations, risks associated with possible differences in financial accounting standards and other monetary and political risks. Significant levels of foreign taxes, including potentially confiscatory levels of taxation and withholding taxes, may also apply to some foreign investments.
Investing in emerging markets may involve greater risks than investing in more developed countries. In addition, concentration of investments in a single region may result in greater volatility.
Top 5 sectors
as of 02/28/10 (%)
| Financials | | | 25.9 | | |
| Consumer Discretionary | | | 22.4 | | |
| Information Technology | | | 14.2 | | |
| Health Care | | | 7.1 | | |
| Consumer Staples | | | 5.4 | | |
Top 10 holdings
as of 02/28/10 (%)
| Wells Fargo | | | 5.3 | | |
| JPMorgan Chase | | | 4.7 | | |
| Crown Castle International | | | 4.0 | | |
| Intuitive Surgical | | | 3.5 | | |
| Anheuser-Busch InBev | | | 3.4 | | |
| Walt Disney | | | 3.2 | | |
| HSBC Holdings | | | 3.0 | | |
| MasterCard | | | 2.9 | | |
| PNC Financial Services Group | | | 2.7 | | |
| Apple | | | 2.6 | | |
The fund is actively managed and the composition of its portfolio will change over time. Information provided is calculated as a percentage of net assets.
17
Fund Profile – Columbia Marsico International Opportunities Fund
Performance data quoted represents past performance and current performance may be lower or higher. Past performance is no guarantee of future results. The investment return and principal value will fluctuate so that shares, when redeemed, may be worth more or less than the original cost. Please visit www.columbiafunds.com for daily and most recent month-end performance updates.
Summary
1-year return as of 02/28/10
| | | | | +51.97% | |
|
| |  | | | Class A shares
(without sales charge) | |
|
| | | | | +54.58% | |
|
| |  | | | MSCI EAFE Index | |
|
Morningstar Style BoxTM

The Morningstar Style BoxTM reveals a fund's investment strategy. For equity funds, the vertical axis shows the market capitalization of the stocks owned, and the horizontal axis shows investment style (value, blend or growth). Information shown is based on the most recent data provided by Morningstar.
Summary
g For the 12-month period that ended February 28, 2010, the fund's Class A shares returned 51.97% without sales charge.
g The fund, its benchmark, the MSCI EAFE Index1 and its peer group, the Lipper International Large-Cap Growth Fund Classification2 all recorded total returns in excess of 50% for the 12-month period. The fund's return was slightly lower than the return of the benchmark and the average fund in its peer group.
g Stock selection in health care and the effects of currency fluctuation hampered the fund's relative performance.
Portfolio Management
James G. Gendelman has managed the fund since 2000. He is associated with Marsico Capital Management, LLC, investment sub-advisor to the fund.
Columbia Management Advisors, LLC ("CMA") and Marsico Capital Management, LLC ("MCM") are SEC-registered investment advisors. CMA is an indirect, wholly owned subsidiary of Bank of America Corporation. CMA has retained MCM to serve as investment sub-advisor. As the investment sub-advisor, MCM makes the investment decisions and manages all or a portion of the fund. MCM is not affiliated with Bank of America.
Subject to satisfying various conditions to closing, effective on or about May 1, 2010, RiverSource Investments, LLC, a subsidiary of Ameriprise Financial, Inc., is expected to become the investment advisor to the fund and change its name to Columbia Management Investment Advisers, LLC. Please see the fund's prospectus dated July 1, 2009, including the supplements thereto, for more information regarding the expected change in investment advisor and any related changes to the portfolio management of the fund.
1The Morgan Stanley Capital International Europe, Australasia, Far East (MSCI EAFE) Index is a capitalization-weighted index that tracks the total return of common stocks in 21 developed-market countries within Europe, Australasia and the Far East.
Indices are not available for investment, are not professionally managed and do not reflect sales charges, fees, brokerage commissions, taxes or other expenses of investing. Securities in the fund may not match those in an index.
2Lipper Inc., a widely respected data provider in the industry, calculates an average total return (assuming reinvestment of distributions) for mutual funds with investment objectives similar to those of the fund. Lipper makes no adjustment for the effect of sales loads.
18
Performance Information – Columbia Marsico International Opportunities Fund
Performance of a $10,000 investment 08/01/00 – 02/28/10
The chart above shows the change in value of a hypothetical $10,000 investment in Class A shares of Columbia Marsico International Opportunities Fund during the stated time period, and does not reflect the deduction of taxes that a shareholder may pay on fund distributions or on the redemption of fund shares.
Performance of a $10,000 investment 08/01/00 – 02/28/10 ($)
| Sales charge | | without | | with | |
| Class A | | | 13,774 | | | | 12,982 | | |
| Class B | | | 12,819 | | | | 12,819 | | |
| Class C | | | 12,818 | | | | 12,818 | | |
| Class R | | | 13,642 | | | | n/a | | |
| Class Z | | | 14,109 | | | | n/a | | |
Average annual total return as of 02/28/10 (%)
| Share class | | A | | B | | C | | R | | Z | |
| Inception | | 08/01/00 | | 08/01/00 | | 08/01/00 | | 01/23/06 | | 08/01/00 | |
| Sales charge | | without | | with | | without | | with | | without | | with | | without | | without | |
| 1-year | | | 51.97 | | | | 43.28 | | | | 50.91 | | | | 45.91 | | | | 50.67 | | | | 49.67 | | | | 51.73 | | | | 52.47 | | |
| 5-year | | | 2.65 | | | | 1.44 | | | | 1.88 | | | | 1.57 | | | | 1.88 | | | | 1.88 | | | | 2.46 | | | | 2.90 | | |
| Life | | | 3.40 | | | | 2.76 | | | | 2.63 | | | | 2.63 | | | | 2.62 | | | | 2.62 | | | | 3.29 | | | | 3.66 | | |
Average annual total return as of 03/31/10 (%)
| Share class | | A | | B | | C | | R | | Z | |
| Sales charge | | without | | with | | without | | with | | without | | with | | without | | without | |
| 1-year | | | 52.52 | | | | 43.71 | | | | 51.12 | | | | 46.12 | | | | 51.26 | | | | 50.26 | | | | 51.89 | | | | 52.96 | | |
| 5-year | | | 4.59 | | | | 3.35 | | | | 3.78 | | | | 3.46 | | | | 3.80 | | | | 3.80 | | | | 4.37 | | | | 4.83 | | |
| Life | | | 4.05 | | | | 3.42 | | | | 3.26 | | | | 3.26 | | | | 3.27 | | | | 3.27 | | | | 3.94 | | | | 4.31 | | |
The "with sales charge" returns include the maximum initial sales charge of 5.75% for Class A shares and the applicable contingent deferred sales charge of 5.00% in the first year, declining to 1.00% in the sixth year and eliminated thereafter for Class B shares and 1.00% for Class C shares for the first year only. The "without sales charge" returns do not include the effect of sales charges. If they had, returns would be lower.
Performance results reflect any fee waivers or reimbursements of fund expenses by the investment advisor and/or any of its affiliates. Absent these fee waivers or expense reimbursement arrangements, performance results would have been lower.
All results shown assume reinvestment of distributions. Class R shares are sold at net asset value with distribution and service (Rule 12b-1) fees. Class Z shares are sold at net asset value with no distribution and service (Rule 12b-1) fees. Class R and Class Z shares have limited eligibility and the investment minimum requirements may vary. Please see the fund's prospectus for details. Performance for different share classes will vary based on differences in sales charges and fees associated with each class.
The tables do not reflect the deduction of taxes that a shareholder may pay on fund distributions or on the redemption of fund shares.
The returns for Class R shares include the returns for Class A shares prior to January 23, 2006, the date on which Class R shares were initially offered by the fund. If differences in expenses had been reflected, the returns would have been lower, since Class R shares are subject to a higher Rule 12b-1 fee.
Performance data quoted represents past performance and current performance may be lower or higher. Past performance is no guarantee of future results. The investment return and principal value will fluctuate so that shares, when redeemed, may be worth more or less than the original cost. Please visit www.columbiafunds.com for daily and most recent month-end performance updates.
Annual operating expense ratio (%)*
| Class A | | | 1.52 | | |
| Class B | | | 2.27 | | |
| Class C | | | 2.27 | | |
| Class R | | | 1.77 | | |
| Class Z | | | 1.27 | | |
*The annual operating expense ratio is as stated in the fund's prospectus that is current as of the date of this report. Differences in expense ratios disclosed elsewhere in this report may result from including fee waivers and expense reimbursements as well as different time periods used in calculating the ratios.
19
Understanding Your Expenses – Columbia Marsico International Opportunities Fund
Estimating your actual expenses
To estimate the expenses that you paid over the period, first you will need your account balance at the end of the period:
g For shareholders who receive their account statements from Columbia Management Services, Inc., your account balance is available online at www.columbiafunds.com or by calling Shareholder Services at 800.345.6611.
g For shareholders who receive their account statements from their financial intermediary, contact your financial intermediary to obtain your account balance.
1. Divide your ending account balance by $1,000. For example, if an account balance was $8,600 at the end of the period, the result would be 8.6.
2. In the section of the table below titled "Expenses paid during the period," locate the amount for your share class. You will find this number in the column labeled "Actual." Multiply this number by the result from step 1. Your answer is an estimate of the expenses you paid on your account during the period.
If the value of your account falls below the minimum initial investment requirement applicable to you, your account generally will be subject to a $20 annual fee. This fee is not included in the accompanying table. If you are subject to the fee, keep it in mind when you are estimating the ongoing expenses of investing in the fund and when comparing the expenses of this fund with other funds.
As a fund shareholder, you incur two types of costs. There are transaction costs, which generally include sales charges on purchases and may include redemption fees or exchange fees. There are also ongoing costs, which generally include investment advisory fees, distribution and service (Rule 12b-1) fees and other fund expenses. The information on this page is intended to help you understand the ongoing costs of investing in the fund and to compare these costs with the ongoing costs of investing in other mutual funds.
Analyzing your fund's expenses by share class
To illustrate these ongoing costs, we have provided an example and calculated the expenses paid by investors in each share class during the period. The information in the following table is based on an initial investment of $1,000, which is invested at the beginning of the period and held for the entire period. Expense information is calculated two ways and each method provides you with different information. The amount listed in the "Actual" column is calculated using the fund's actual operating expenses and total return for the period. The amount listed in the "Hypothetical" column for each share class assumes that the return each year is 5% before expenses and is calculated based on the fund's actual operating expenses. You should not use the hypothetical account values and expenses to estimate either your actual account balance at the end of the period or the expenses you paid during this period.
Compare with other funds
Since all mutual funds are required to include the same hypothetical calculations about expenses in shareholder reports, you can use this information to compare the ongoing cost of investing in the fund with other funds. To do so, compare the 5% hypothetical example with the 5% hypothetical examples that appear in the shareholder reports of other funds. As you compare hypothetical examples of other funds, it is important to note that hypothetical examples are meant to highlight the ongoing costs of investing in a fund and do not reflect any transaction costs, such as sales charges, redemption fees or exchange fees.
09/01/09 – 02/28/10
| | | Account value at the
beginning of the period ($) | | Account value at the
end of the period ($) | | Expenses paid
during the period ($) | | Fund's annualized
expense ratio (%) | |
| | | Actual | | Hypothetical | | Actual | | Hypothetical | | Actual | | Hypothetical | | Actual | |
| Class A | | | 1,000.00 | | | | 1,000.00 | | | | 1,016.30 | | | | 1,018.00 | | | | 6.85 | | | | 6.85 | | | | 1.37 | | |
| Class B | | | 1,000.00 | | | | 1,000.00 | | | | 1,013.30 | | | | 1,014.28 | | | | 10.58 | | | | 10.59 | | | | 2.12 | | |
| Class C | | | 1,000.00 | | | | 1,000.00 | | | | 1,012.20 | | | | 1,014.28 | | | | 10.58 | | | | 10.59 | | | | 2.12 | | |
| Class R | | | 1,000.00 | | | | 1,000.00 | | | | 1,015.50 | | | | 1,016.76 | | | | 8.10 | | | | 8.10 | | | | 1.62 | | |
| Class Z | | | 1,000.00 | | | | 1,000.00 | | | | 1,018.00 | | | | 1,019.24 | | | | 5.60 | | | | 5.61 | | | | 1.12 | | |
Expenses paid during the period are equal to the annualized expense ratio for the share class, multiplied by the average account value over the period, then multiplied by the number of days in the fund's most recent fiscal half-year and divided by 365.
It is important to note that the expense amounts shown in the table are meant to highlight only ongoing costs of investing in the fund and do not reflect any transaction costs, such as sales charges, redemption fees or exchange fees. Therefore, the hypothetical examples provided may not help you determine the relative total costs of owning shares of different funds. If these transaction costs were included, your costs would have been higher.
20
Portfolio Manager's Report – Columbia Marsico International Opportunities Fund
For the 12-month period that ended February 28, 2010, the fund's Class A shares returned 51.97% without sales charge. The fund's benchmark, the MSCI EAFE Index, returned 54.58%. The fund's return was slightly lower than the 53.38% average return of its peer group, the Lipper International Large-Cap Growth Funds Classification. Currency fluctuations were a drag on relative performance, as was stock selection in health care. The fund had strong stock selection in the technology, energy and consumer discretionary sectors and benefited from its lack of exposure to utilities, which underperformed the benchmark for the period.
Favorable stock selection aided performance
In a time when equity prices were rising worldwide, fund performance benefited from good stock selection in a number of sectors. In the technology sector, Taiwan-based HON HAI Precision Industry (0.9% of net assets), which manufactures electronics and computer components, and Dutch semiconductor firm ASML (sold during the period), were strong performers. Two of the fund's Brazil-based stocks also posted solid results. Homebuilder Gafisa (1.6% of net assets) was one of the strongest-performing stocks in the fund and energy company Petroleo Brasileiro also aided fund results prior to being sold.
In the financials sector, Credit Suisse Group and ICICI Bank (3.0% and 1.8% of net assets, respectively) and Brazil-based Itau Unibanco were strong performers. Credit Suisse was the fund's largest position while Itau Unibanco was sold prior to the end of the reporting period. Despite these holdings, the fund's financials underperformed the index because it had less exposure to financials than the index. A lack of exposure to the utility sector aided the fund's performance, as utilities was the weakest performing sector in the benchmark.
Fluctuating currency, cash hampered relative returns
During the reporting period, the Australian and Canadian dollars appreciated sharply compared to many other world currencies. Because the fund does not actively manage its currency exposure, which is solely a residual of the investment process, and because it had less exposure to companies whose securities trade in these two currencies, currency had a negative impact on returns. In addition, the fund maintained a modest cash position as equity values soared, which negatively impacted results relative to the index, which is fully invested at all times.
Disappointments from individual holdings
Several individual stock holdings had a negative impact on results relative to the benchmark. Specialty chemical producer Akzo Nobel (1.0% of net assets) and automobile manufacturer Fiat (sold from the portfolio) had negative performance and were among the fund's weakest holdings.
In health care, Swiss biotechnology firm Lonza Group (1.0% of assets) detracted from the fund's relative results as it posted a double-digit negative return following an announcement that one of its clients cancelled a major new product order. The fund was overweight relative to the index in health care, which also detracted from returns because the sector underperformed the index for the period.
Performance data quoted represents past performance and current performance may be lower or higher. Past performance is no guarantee of future results. The investment return and principal value will fluctuate so that shares, when redeemed, may be worth more or less than the original cost. Please visit www.columbiafunds.com for daily and most recent month-end performance updates.
Net asset value per share
as of 02/28/10 ($)
| Class A | | | 10.00 | | |
| Class B | | | 9.51 | | |
| Class C | | | 9.51 | | |
| Class R | | | 9.99 | | |
| Class Z | | | 10.15 | | |
Distributions declared per share
03/01/09 – 02/28/10 ($)
| Class A | | | 0.25 | | |
| Class B | | | 0.11 | | |
| Class C | | | 0.11 | | |
| Class R | | | 0.20 | | |
| Class Z | | | 0.30 | | |
21
Portfolio Manager's Report (continued) – Columbia Marsico International Opportunities Fund
Top 5 sectors
as of 02/28/10 (%)
| Consumer Discretionary | | | 17.5 | | |
| Financials | | | 16.5 | | |
| Consumer Staples | | | 12.3 | | |
| Health Care | | | 10.7 | | |
| Information Technology | | | 10.6 | | |
Top 10 holdings
as of 02/28/10 (%)
| Credit Suisse Group | | | 3.0 | | |
| HSBC Holdings | | | 3.0 | | |
| Anheuser-Busch InBev | | | 3.0 | | |
| Telefonica | | | 3.0 | | |
| BASF | | | 3.0 | | |
Teva Pharmaceutical
Industries | | | 2.5 | | |
| Research In Motion | | | 2.5 | | |
| Inditex SA | | | 2.3 | | |
| Transocean | | | 2.0 | | |
| Novo-Nordisk | | | 2.0 | | |
The fund is actively managed and the composition of its portfolio will change over time. Information provided is calculated as a percentage of net assets.
Summary
During the period, we increased the fund's exposure to the consumer discretionary sector and lowered its exposure to the energy and telecommunication services sectors. At the end of the period, the fund's biggest sector weights were in consumer discretionary, financials, consumer staples, health care and information technology. The fund continues to have little or no exposure to the utilities sector. The fund's largest country weights are in Switzerland, Japan, Germany, the United Kingdom, Brazil and France.
Source for all statistical data—Columbia Management Advisors, LLC.
Source for all stock-specific commentary—Marsico Capital Management, LLC.
Portfolio holdings and characteristics are subject to change periodically and may not be representative of current holdings and characteristics. The outlook for the fund may differ from those presented for other Columbia Funds.
Equity investments are affected by stock market fluctuations that occur in response to economic and business developments.
The fund normally invests in a core portfolio of 35-50 stocks. By maintaining a relatively concentrated portfolio, the fund may be subject to greater risk than a fund that is more fully diversified.
International investing may involve certain risks, including currency fluctuations, risks associated with possible differences in financial accounting standards and other monetary and political risks. Significant levels of foreign taxes, including potentially confiscatory levels of taxation and withholding taxes, may also apply to some foreign investments.
Investing in emerging markets may involve greater risks than investing in more developed countries. In addition, concentration of investments in a single region may result in greater volatility.
22
Fund Profile – Columbia Multi-Advisor International Equity Fund
Summary
g For the 12-month period that ended February 28, 2010, the fund's Class A shares returned 49.61% without sales charge.
g The MSCI EAFE Index1 returned 54.58%. The average fund in its peer group, the Lipper International Large-Cap Core Funds Classification2, returned 52.19%.
g In the Columbia-advised portion of the fund, defensive stocks, particularly in the consumer areas, fell short of expectations and generally accounted for the shortfall relative to the index. Unfavorable currency exposure, health care investments and an underweight in financials held back returns relative to the benchmark in the Marsico-advised portion of the fund.
Portfolio Management
Columbia Multi-Advisor International Equity Fund is managed by Marsico Capital Management, LLC ("MCM") and Columbia Management Advisors, LLC ("CMA"). Each manages approximately one-half of the fund's assets. James G. Gendelman manages MCM's portion of the fund. He has been with MCM since 2000. Fred Copper has co-managed CMA's portion of the fund since 2009 and has been associated with CMA or its predecessors since 2005. Colin Moore has co-managed CMA's portion of the fund since 2009 and has been associated with CMA or its predecessors since 2002.
CMA and MCM are SEC-registered investment advisors. CMA is an indirect, wholly owned subsidiary of Bank of America Corporation. CMA has retained MCM to serve as investment sub-advisor. As the investment sub-advisor, MCM makes the investment decisions and manages a portion of the fund. MCM is not affiliated with Bank of America.
Subject to satisfying various conditions to closing, effective on or about May 1, 2010, RiverSource Investments, LLC, a subsidiary of Ameriprise Financial, Inc., is expected to become the investment advisor to the fund and change its name to Columbia Management Investment Advisers, LLC. Please see the fund's prospectus dated July 1, 2009, including the supplements thereto, for more information regarding the expected change in investment advisor and any related changes to the portfolio management of the fund.
1The Morgan Stanley Capital International Europe, Australasia, Far East (MSCI EAFE) Index is a capitalization-weighted index that tracks the total return of common stocks in 21 developed-market countries within Europe, Australasia and the Far East. Indices are not available for investment, are not professionally managed and do not reflect sales charges, fees, brokerage commissions, taxes or other expenses of investing. Securities in the fund may not match those in an index.
2Lipper Inc., a widely respected data provider in the industry, calculates an average total return (assuming reinvestment of distributions) for mutual funds with investment objectives similar to those of the fund. Lipper makes no adjustment for the effect of sales loads.
Performance data quoted represents past performance and current performance may be lower or higher. Past performance is no guarantee of future results. The investment return and principal value will fluctuate so that shares, when redeemed, may be worth more or less than the original cost. Please visit www.columbiafunds.com for daily and most recent month-end performance updates.
Summary
1-year return as of 02/28/10
| | | | | +49.61% | |
|
| |  | | | Class A shares
(without sales charge) | |
|
| | | | | +54.58% | |
|
| |  | | | MSCI EAFE Index | |
|
Morningstar Style BoxTM
The Morningstar Style BoxTM reveals a fund's investment strategy. For equity funds, the vertical axis shows the market capitalization of the stocks owned, and the horizontal axis shows investment style (value, blend or growth). Information shown is based on the most recent data provided by Morningstar.
23
Performance Information – Columbia Multi-Advisor International Equity Fund
Performance data quoted represents past performance and current performance may be lower or higher. Past performance is no guarantee of future results. The investment return and principal value will fluctuate so that shares, when redeemed, may be worth more or less than the original cost. Please visit www.columbiafunds.com for daily and most recent month-end performance updates.
Annual operating expense ratio (%)*
| Class A | | | 1.27 | | |
| Class B | | | 2.02 | | |
| Class C | | | 2.02 | | |
| Class R | | | 1.52 | | |
| Class Z | | | 1.02 | | |
*The annual operating expense ratio is as stated in the fund's prospectus that is current as of the date of this report. Differences in expense ratios disclosed elsewhere in this report may result from including fee waivers and expense reimbursements as well as different time periods used in calculating the ratios.
Performance of a $10,000 investment 03/01/00 – 02/28/10
The chart above shows the change in value of a hypothetical $10,000 investment in Class A shares of Columbia Multi-Advisor International Equity Fund during the stated time period, and does not reflect the deduction of taxes that a shareholder may pay on fund distributions or on the redemption of fund shares.
Performance of a $10,000 investment 03/01/00 – 02/28/10 ($)
| Sales charge | | without | | with | |
| Class A | | | 9,805 | | | | 9,242 | | |
| Class B | | | 9,024 | | | | 9,024 | | |
| Class C | | | 9,150 | | | | 9,150 | | |
| Class R | | | 9,705 | | | | n/a | | |
| Class Z | | | 9,965 | | | | n/a | | |
Average annual total return as of 02/28/10 (%)
| Share class | | A | | B | | C | | R | | Z | |
| Inception | | 06/03/92 | | 06/07/93 | | 06/17/92 | | 01/23/06 | | 12/02/91 | |
| Sales charge | | without | | with | | without | | with | | without | | with | | without | | without | |
| 1-year | | | 49.61 | | | | 41.08 | | | | 48.47 | | | | 43.47 | | | | 48.67 | | | | 47.67 | | | | 49.28 | | | | 50.09 | | |
| 5-year | | | 1.06 | | | | –0.13 | | | | 0.31 | | | | 0.00 | | | | 0.31 | | | | 0.31 | | | | 0.85 | | | | 1.31 | | |
| 10-year | | | –0.20 | | | | –0.79 | | | | –1.02 | | | | –1.02 | | | | –0.88 | | | | –0.88 | | | | –0.30 | | | | –0.03 | | |
Average annual total return as of 03/31/10 (%)
| Share class | | A | | B | | C | | R | | Z | |
| Sales charge | | without | | with | | without | | with | | without | | with | | without | | without | |
| 1-year | | | 48.97 | | | | 40.46 | | | | 47.97 | | | | 42.97 | | | | 48.02 | | | | 47.02 | | | | 48.63 | | | | 49.38 | | |
| 5-year | | | 2.78 | | | | 1.57 | | | | 2.02 | | | | 1.71 | | | | 2.03 | | | | 2.03 | | | | 2.57 | | | | 3.05 | | |
| 10-year | | | 0.23 | | | | –0.37 | | | | –0.60 | | | | –0.60 | | | | –0.47 | | | | –0.47 | | | | 0.12 | | | | 0.39 | | |
The "with sales charge" returns include the maximum initial sales charge of 5.75% for Class A shares and the applicable contingent deferred sales charge of 5.00% in the first year, declining to 1.00% in the sixth year and eliminated thereafter for Class B shares and 1.00% for Class C shares for the first year only. The "without sales charge" returns do not include the effect of sales charges. If they had, returns would be lower.
Performance results reflect any fee waivers or reimbursements of fund expenses by the investment advisor and/or any of its affiliates. Absent these fee waivers or expense reimbursement arrangements, performance results would have been lower.
All results shown assume reinvestment of distributions. Class R shares are sold at net asset value with distribution and service (Rule 12b-1) fees. Class Z shares are sold at net asset value with no distribution and service (Rule 12b-1) fees. Class R and Class Z shares have limited eligibility and the investment minimum requirements may vary. Please see the fund's prospectus for details. Performance for different share classes will vary based on differences in sales charges and fees associated with each class.
The tables do not reflect the deduction of taxes that a shareholder may pay on fund distributions or on the redemption of fund shares.
The returns for Class R shares include the returns for Class A shares prior to January 23, 2006, the date on which Class R shares were initially offered by the fund. If differences in expenses had been reflected, the returns would have been lower, since Class R shares are subject to a higher distribution and service (Rule 12b-1) fee.
24
Understanding Your Expenses – Columbia Multi-Advisor International Equity Fund
As a fund shareholder, you incur two types of costs. There are transaction costs, which generally include sales charges on purchases and may include redemption fees or exchange fees. There are also ongoing costs, which generally include investment advisory fees, distribution and service (Rule 12b-1) fees and other fund expenses. The information on this page is intended to help you understand the ongoing costs of investing in the fund and to compare these costs with the ongoing costs of investing in other mutual funds.
Analyzing your fund's expenses by share class
To illustrate these ongoing costs, we have provided an example and calculated the expenses paid by investors in each share class during the period. The information in the following table is based on an initial investment of $1,000, which is invested at the beginning of the period and held for the entire period. Expense information is calculated two ways and each method provides you with different information. The amount listed in the "Actual" column is calculated using the fund's actual operating expenses and total return for the period. The amount listed in the "Hypothetical" column for each share class assumes that the return each year is 5% before expenses and is calculated based on the fund's actual operating expenses. You should not use the hypothetical account values and expenses to estimate either your actual account balance at the end of the period or the expenses you paid during this period.
Compare with other funds
Since all mutual funds are required to include the same hypothetical calculations about expenses in shareholder reports, you can use this information to compare the ongoing cost of investing in the fund with other funds. To do so, compare the 5% hypothetical example with the 5% hypothetical examples that appear in the shareholder reports of other funds. As you compare hypothetical examples of other funds, it is important to note that hypothetical examples are meant to highlight the ongoing costs of investing in a fund and do not reflect any transaction costs, such as sales charges, redemption fees or exchange fees.
Estimating your actual expenses
To estimate the expenses that you paid over the period, first you will need your account balance at the end of the period:
g For shareholders who receive their account statements from Columbia Management Services, Inc., your account balance is available online at www.columbiafunds.com or by calling Shareholder Services at 800.345.6611.
g For shareholders who receive their account statements from their financial intermediary, contact your financial intermediary to obtain your account balance.
1. Divide your ending account balance by $1,000. For example, if an account balance was $8,600 at the end of the period, the result would be 8.6.
2. In the section of the table below titled "Expenses paid during the period," locate the amount for your share class. You will find this number in the column labeled "Actual." Multiply this number by the result from step 1. Your answer is an estimate of the expenses you paid on your account during the period.
If the value of your account falls below the minimum initial investment requirement applicable to you, your account generally will be subject to a $20 annual fee. This fee is not included in the accompanying table. If you are subject to the fee, keep it in mind when you are estimating the ongoing expenses of investing in the fund and when comparing the expenses of this fund with other funds.
09/01/09 – 02/28/10
| | | Account value at the
beginning of the period ($) | | Account value at the
end of the period ($) | | Expenses paid
during the period ($) | | Fund's annualized
expense ratio (%) | |
| | | Actual | | Hypothetical | | Actual | | Hypothetical | | Actual | | Hypothetical | | Actual | |
| Class A | | | 1,000.00 | | | | 1,000.00 | | | | 993.90 | | | | 1,018.60 | | | | 6.18 | | | | 6.26 | | | | 1.25 | | |
| Class B | | | 1,000.00 | | | | 1,000.00 | | | | 990.00 | | | | 1,014.88 | | | | 9.87 | | | | 9.99 | | | | 2.00 | | |
| Class C | | | 1,000.00 | | | | 1,000.00 | | | | 989.90 | | | | 1,014.88 | | | | 9.87 | | | | 9.99 | | | | 2.00 | | |
| Class R | | | 1,000.00 | | | | 1,000.00 | | | | 992.90 | | | | 1,017.36 | | | | 7.41 | | | | 7.50 | | | | 1.50 | | |
| Class Z | | | 1,000.00 | | | | 1,000.00 | | | | 995.00 | | | | 1,019.84 | | | | 4.95 | | | | 5.01 | | | | 1.00 | | |
Expenses paid during the period are equal to the annualized expense ratio for the share class, multiplied by the average account value over the period, then multiplied by the number of days in the fund's most recent fiscal half-year and divided by 365.
It is important to note that the expense amounts shown in the table are meant to highlight only ongoing costs of investing in the fund and do not reflect any transaction costs, such as sales charges, redemption fees or exchange fees. Therefore, the hypothetical examples provided may not help you determine the relative total costs of owning shares of different funds. If these transaction costs were included, your costs would have been higher.
25
Portfolio Managers' Report – Columbia Multi-Advisor International Equity Fund
Performance data quoted represents past performance and current performance may be lower or higher. Past performance is no guarantee of future results. The investment return and principal value will fluctuate so that shares, when redeemed, may be worth more or less than the original cost. Please visit www.columbiafunds.com for daily and most recent month-end performance updates.
Net asset value per share
as of 02/28/10 ($)
| Class A | | | 10.68 | | |
| Class B | | | 9.75 | | |
| Class C | | | 9.63 | | |
| Class R | | | 10.68 | | |
| Class Z | | | 10.81 | | |
Distributions declared per share
03/01/09 – 02/28/10 ($)
| Class A | | | 0.43 | | |
| Class B | | | 0.36 | | |
| Class C | | | 0.36 | | |
| Class R | | | 0.41 | | |
| Class Z | | | 0.46 | | |
For the 12-month period that ended February 28, 2010, the fund's Class A shares returned 49.61% without sales charge. The fund's benchmark, the MSCI EAFE Index, returned 54.58%. The average return of the fund's peer group, the Lipper International Large Cap Core Funds Classification, was 52.19%. In the Columbia-advised portion of the fund, an out-of-index weight in China and an overweight in Switzerland aided performance relative to the benchmark. Stock selection in the financials sector also helpful. However, defensive stocks, particularly in the consumer areas, fell short of expectations and generally accounted for the shortfall relative to the index. The Marsico-advised portion of the fund benefited from stock selection in the information technology, energy and consumer discretionary sectors. However, unfavorable currency exposure and an overweight and stock selection in health care detracted from results relative to the benc hmark. An underweight in the strongly-performing financials industry also held back relative returns.
Positioned to capitalize on economic recovery
Since taking over the Columbia-advised portion of the fund in July, the manager has shifted the fund's focus from sector allocation to stock selection. During the period, the manager favored companies that stand to benefit from a global economic recovery. In this regard, Clariant (0.3% of net assets), a Swiss chemical manufacturer, aided relative results, as chemical manufacturing is usually one of the early beneficiaries of an economic recovery. Eastern Platinum (0.2% of net assets) in Canada also helped the fund's return in the face of rising global demand for raw materials. The Turkish airline Turk Hava Yollari (0.2% of net assets) did well on the strength of an upturn in air traffic in the Middle East. In the financials sector, UK-based Barclays (0.8% of net assets) was noteworthy because it was one of the few banks in the UK that did not need bailout money. National Bank of Greece and Spain's Banco Santander (0.3% and 1.5% of net assets, respectively) also helped boost relative returns.
In China, the government has identified consumer demand as an engine of economic growth, and Columbia's manager focused on companies that have the potential to benefit from broad consumption trends, such as Dongfeng Motor Group (0.2% of net assets). Coal is the main source of energy in China, and Yanzhou Coal Mining (0.3% of net assets) was another top performer for the portfolio.
As the stock market gained strength, defensive stocks, particularly in the consumer areas, fell short of expectations and were the major area of disappointment for the fund. Game Group (0.3% of net assets), a UK-based hardware and software retailer, did poorly. A trough in the hardware cycle hurt unit growth. It remains in the portfolio.
For Marsico, stock-specific gains benefited results
Information technology holdings were particularly strong in the Marsico portion of the portfolio. Taiwan-based HON HAI Precision Industry (0.5% of net assets), a manufacturer of electronics and computer components, helped drive returns. Dutch semiconductor company ASML Holdings also benefited results, and the manager took
26
Portfolio Managers' Report (continued) – Columbia Multi-Advisor International Equity Fund
profits in the stock. In Brazil, energy company Petrobras (Petroleo Brasileiro) figured heavily in performance before being sold. Brazil-based Gafisa (0.8% of net assets), a homebuilder, was also a strong contributor to return. In the financials sector, Swiss-based bank Credit Suisse Group and ICICI Bank in India (1.6% and 1.0% of net assets, respectively) benefited results. Itau Unibanco in Brazil also registered strong results, and the manager took profits in the company.
During the reporting period, the Australian dollar appreciated sharply compared to many other world currencies. Marsico's portfolio performance was hampered by having a significant underweight in companies whose securities were denominated in the Australian dollar. Among health care stocks, certain pharmaceutical companies declined, as did Swiss biotechnology company Lonza Group (0.5% of net assets). In the materials sector, specialty chemical company Akzo Nobel (0.5% of net assets) posted relatively poor performance.
Summary
The Columbia manager believes that reasonable valuations, combined with low interest rates, could help relieve the crisis of confidence that has resulted from debt problems in Europe, particularly in Greece. Columbia has invested in companies, particularly financial institutions, that have the potential to benefit from a solution to Europe's debt problems. The manager has also boosted investment in Japan, where valuations appear compelling.
At the end of the period, Marsico's primary sector allocations included consumer discretionary, financials, consumer staples, health care and information technology. Marsico had significant weights in Switzerland, Japan, Germany, Brazil and France.
Sources for all statistical data—Columbia Management Advisors, LLC.
Source for all stock-specific commentary—Marsico Capital Management, LLC and Columbia Management Advisors, LLC.
Portfolio holdings and characteristics are subject to change periodically and may not be representative of current holdings and characteristics. The outlook for the fund may differ from those presented for other Columbia Funds.
Equity investments are affected by to stock market fluctuations that occur in response to economic and business developments.
International investing may involve certain risks, including currency fluctuations, risks associated with possible differences in financial accounting standards and other monetary and political risks. Significant levels of foreign taxes, including potentially confiscatory levels of taxation and withholding taxes, may also apply to some foreign investments.
Investing in emerging markets may involve greater risks than investing in more developed countries. In addition, concentration of investments in a single region may result in greater volatility.
Top 5 sectors
as of 02/28/10 (%)
| Financials | | | 25.0 | | |
| Consumer Discretionary | | | 12.8 | | |
| Industrials | | | 9.7 | | |
| Energy | | | 8.6 | | |
| Health Care | | | 7.8 | | |
Top 10 holdings
as of 02/28/10 (%)
| Telefonica | | | 1.9 | | |
| BASF | | | 1.8 | | |
| Anheuser-Busch InBev | | | 1.6 | | |
| Credit Suisse Group | | | 1.6 | | |
| HSBC Holdings | | | 1.6 | | |
HSBC Holdings
(Hong Kong Registered
Shares) | | | 1.5 | | |
| Banco Santander | | | 1.5 | | |
| Schneider Electric | | | 1.5 | | |
Teva Pharmaceutical
Industries | | | 1.3 | | |
| Research In Motion | | | 1.3 | | |
The fund is actively managed and the composition of its portfolio will change over time. Information provided is calculated as a percentage of net assets.
27
Investment Portfolio – Columbia Global Value Fund
February 28, 2010
| Common Stocks – 99.5% | |
| | | Shares | | Value ($) | |
| Consumer Discretionary – 4.5% | |
| Automobiles – 0.5% | |
| Toyota Motor Corp. | | | 7,000 | | | | 262,367 | | |
| Automobiles Total | | | 262,367 | | |
| Multiline Retail – 1.8% | |
| Marks & Spencer Group PLC | | | 191,019 | | | | 961,468 | | |
| Multiline Retail Total | | | 961,468 | | |
| Specialty Retail – 2.2% | |
| Home Depot, Inc. | | | 38,100 | | | | 1,188,720 | | |
| Specialty Retail Total | | | 1,188,720 | | |
| Consumer Discretionary Total | | | 2,412,555 | | |
| Consumer Staples – 13.0% | |
| Food & Staples Retailing – 8.8% | |
| Carrefour SA | | | 18,500 | | | | 853,581 | | |
| Koninklijke Ahold NV | | | 76,660 | | | | 939,457 | | |
| Safeway, Inc. | | | 60,100 | | | | 1,497,692 | | |
| Seven & I Holdings Co., Ltd. | | | 12,800 | | | | 288,719 | | |
| SUPERVALU, Inc. | | | 23,186 | | | | 354,050 | | |
| Wm. Morrison Supermarkets PLC | | | 177,232 | | | | 806,676 | | |
| Food & Staples Retailing Total | | | 4,740,175 | | |
| Food Products – 4.2% | |
| Sara Lee Corp. | | | 78,260 | | | | 1,061,206 | | |
| Unilever NV | | | 39,100 | | | | 1,176,615 | | |
| Food Products Total | | | 2,237,821 | | |
| Consumer Staples Total | | | 6,977,996 | | |
| Energy – 2.0% | |
| Oil, Gas & Consumable Fuels – 2.0% | |
| ENI SpA | | | 24,200 | | | | 546,014 | | |
| Valero Energy Corp. | | | 30,200 | | | | 529,104 | | |
| Oil, Gas & Consumable Fuels Total | | | 1,075,118 | | |
| Energy Total | | | 1,075,118 | | |
| Financials – 21.0% | |
| Commercial Banks – 11.2% | |
| Fifth Third Bancorp. | | | 68,025 | | | | 830,585 | | |
| Intesa Sanpaolo SpA (a) | | | 142,178 | | | | 499,964 | | |
Mitsubishi UFJ Financial
Group, Inc. | | | 197,500 | | | | 998,115 | | |
| Mizuho Financial Group, Inc. | | | 506,900 | | | | 981,336 | | |
PNC Financial Services
Group, Inc. | | | 20,863 | | | | 1,121,595 | | |
| | | Shares | | Value ($) | |
Sumitomo Mitsui Financial
Group, Inc. | | | 28,300 | | | | 909,728 | | |
| Wells Fargo & Co. | | | 25,159 | | | | 687,847 | | |
| Commercial Banks Total | | | 6,029,170 | | |
| Diversified Financial Services – 3.7% | |
| Bank of America Corp. (b) | | | 71,524 | | | | 1,191,590 | | |
| Citigroup, Inc. (a) | | | 232,369 | | | | 790,054 | | |
| Diversified Financial Services Total | | | 1,981,644 | | |
| Insurance – 6.1% | |
| Aegon NV (a) | | | 178,682 | | | | 1,126,490 | | |
Mitsui Sumitomo Insurance
Group Holdings, Inc. | | | 44,600 | | | | 1,144,053 | | |
| Tokio Marine Holdings, Inc. | | | 37,300 | | | | 1,051,680 | | |
| Insurance Total | | | 3,322,223 | | |
| Financials Total | | | 11,333,037 | | |
| Health Care – 16.2% | |
| Health Care Equipment & Supplies – 1.6% | |
| Boston Scientific Corp. (a) | | | 112,473 | | | | 870,541 | | |
| Health Care Equipment & Supplies Total | | | 870,541 | | |
| Health Care Providers & Services – 0.6% | |
| Tenet Healthcare Corp. (a) | | | 59,100 | | | | 311,457 | | |
| Health Care Providers & Services Total | | | 311,457 | | |
| Pharmaceuticals – 14.0% | |
| AstraZeneca PLC | | | 25,500 | | | | 1,121,173 | | |
| Bristol-Myers Squibb Co. | | | 40,292 | | | | 987,557 | | |
| Daiichi Sankyo Co., Ltd. | | | 47,100 | | | | 953,186 | | |
| GlaxoSmithKline PLC | | | 73,020 | | | | 1,351,678 | | |
| Pfizer, Inc. | | | 100,800 | | | | 1,769,040 | | |
| Sanofi-Aventis SA | | | 18,849 | | | | 1,378,764 | | |
| Pharmaceuticals Total | | | 7,561,398 | | |
| Health Care Total | | | 8,743,396 | | |
| Industrials – 0.9% | |
| Industrial Conglomerates – 0.9% | |
| General Electric Co. | | | 30,040 | | | | 482,442 | | |
| Industrial Conglomerates Total | | | 482,442 | | |
| Industrials Total | | | 482,442 | | |
| Information Technology – 18.4% | |
| Communications Equipment – 5.0% | |
| Alcatel-Lucent (a) | | | 250,100 | | | | 759,424 | | |
| Motorola, Inc. (a) | | | 93,600 | | | | 632,736 | | |
See Accompanying Notes to Financial Statements.
28
Columbia Global Value Fund
February 28, 2010
| Common Stocks (continued) | |
| | | Shares | | Value ($) | |
Telefonaktiebolaget LM Ericsson,
Class B | | | 132,289 | | | | 1,322,927 | | |
| Communications Equipment Total | | | 2,715,087 | | |
| Computers & Peripherals – 2.5% | |
| Dell, Inc. (a) | | | 103,030 | | | | 1,363,087 | | |
| Computers & Peripherals Total | | | 1,363,087 | | |
| Electronic Equipment, Instruments & Components – 2.5% | |
| FUJIFILM Holdings Corp. | | | 25,300 | | | | 804,747 | | |
| Hitachi Ltd. (a) | | | 156,000 | | | | 514,469 | | |
Electronic Equipment, Instruments &
Components Total | | | 1,319,216 | | |
| Office Electronics – 1.7% | |
| Xerox Corp. | | | 97,300 | | | | 911,701 | | |
| Office Electronics Total | | | 911,701 | | |
| Semiconductors & Semiconductor Equipment – 4.0% | |
| Intel Corp. | | | 57,659 | | | | 1,183,739 | | |
| STMicroelectronics NV | | | 112,500 | | | | 974,261 | | |
Semiconductors & Semiconductor
Equipment Total | | | 2,158,000 | | |
| Software – 2.7% | |
| Microsoft Corp. | | | 50,400 | | | | 1,444,464 | | |
| Software Total | | | 1,444,464 | | |
| Information Technology Total | | | 9,911,555 | | |
| Materials – 3.8% | |
| Chemicals – 3.8% | |
| Akzo Nobel NV | | | 16,700 | | | | 849,209 | | |
| Dow Chemical Co. | | | 43,000 | | | | 1,217,330 | | |
| Chemicals Total | | | 2,066,539 | | |
| Materials Total | | | 2,066,539 | | |
| Telecommunication Services – 19.7% | |
| Diversified Telecommunication Services – 19.7% | |
| AT&T, Inc. | | | 62,827 | | | | 1,558,738 | | |
Brasil Telecom SA, ADR
(Ordinary) (a) | | | 11,568 | | | | 123,315 | | |
Brasil Telecom SA, ADR
(Preference) (a) | | | 15,672 | | | | 321,903 | | |
Deutsche Telekom AG,
Registered Shares | | | 138,403 | | | | 1,780,913 | | |
Nippon Telegraph &
Telephone Corp. | | | 43,000 | | | | 1,873,037 | | |
| | | Shares | | Value ($) | |
Tele Norte Leste Participacoes
SA, ADR | | | 14,700 | | | | 255,339 | | |
| Telecom Italia SpA | | | 832,893 | | | | 1,186,278 | | |
Telecom Italia SpA,
Savings Shares | | | 565,300 | | | | 600,398 | | |
| Telefonica SA | | | 42,374 | | | | 995,012 | | |
Telefonos de Mexico SA de CV,
ADR, Class L | | | 23,700 | | | | 371,142 | | |
| Verizon Communications, Inc. | | | 52,800 | | | | 1,527,504 | | |
Diversified Telecommunication
Services Total | | | 10,593,579 | | |
| Telecommunication Services Total | | | 10,593,579 | | |
Total Common Stocks
(cost of $68,276,918) | | | 53,596,217 | | |
| Short-Term Obligation – 1.0% | |
| | | Par ($) | | | |
Repurchase agreement with
Fixed Income Clearing Corp.,
dated 02/26/10 due 03/01/10,
at 0.050%, collateralized by a
U.S. Government Agency
obligation maturing 02/25/13,
market value $585,731
(repurchase proceeds $573,002) | | | 573,000 | | | | 573,000 | | |
Total Short-Term Obligation
(cost of $573,000) | | | 573,000 | | |
Total Investments – 100.5%
(cost of $68,849,918) (c) | | | 54,169,217 | | |
| Other Assets & Liabilities, Net – (0.5)% | | | (290,570 | ) | |
| Net Assets – 100.0% | | | 53,878,647 | | |
Notes to Investment Portfolio:
(a) Non-income producing security.
(b) Investments in affiliates during the year ended February 28, 2010:
| Affiliate | | Value,
beginning of
period | | Purchases | | Sales
Proceeds | | Dividend
Income | | Value,
end of
period | |
Bank of
America Corp. | | $ | 282,520 | | | $ | — | | | $ | — | | | $ | 2,861 | | | $ | 1,191,590 | | |
(c) Cost for federal income tax purposes is $74,204,733.
See Accompanying Notes to Financial Statements.
29
Columbia Global Value Fund
February 28, 2010
The following table summarizes the inputs used, as of February 28, 2010 in valuing the Fund's assets:
| Description | | Quoted Prices
(Level 1) | | Other
Significant
Observable
Inputs
(Level 2) | | Significant
Unobservable
Inputs
(Level 3) | | Total | |
| Common Stocks | |
Consumer
Discretionary | | $ | 1,188,720 | | | $ | 1,223,835 | | | $ | — | | | $ | 2,412,555 | | |
| Consumer Staples | | | 2,912,948 | | | | 4,065,048 | | | | — | | | | 6,977,996 | | |
| Energy | | | 529,104 | | | | 546,014 | | | | — | | | | 1,075,118 | | |
| Financials | | | 4,621,671 | | | | 6,711,366 | | | | — | | | | 11,333,037 | | |
| Health Care | | | 3,938,595 | | | | 4,804,801 | | | | — | | | | 8,743,396 | | |
| Industrials | | | 482,442 | | | | — | | | | — | | | | 482,442 | | |
| Information Technology | | | 5,535,727 | | | | 4,375,828 | | | | — | | | | 9,911,555 | | |
| Materials | | | 1,217,330 | | | | 849,209 | | | | — | | | | 2,066,539 | | |
Telecommunication
Services | | | 4,157,941 | | | | 6,435,638 | | | | — | | | | 10,593,579 | | |
| Total Common Stocks | | | 24,584,478 | | | | 29,011,739 | | | | — | | | | 53,596,217 | | |
Total Short-Term
Obligation | | | — | | | | 573,000 | | | | — | | | | 573,000 | | |
| Total Investments | | $ | 24,584,478 | | | $ | 29,584,739 | | | $ | — | | | $ | 54,169,217 | | |
The Fund's assets assigned to the Level 2 input category include certain foreign securities for which a third party statistical pricing service may be employed for purposes of fair market valuation.
For more information on valuation inputs, and their aggregation into the levels used in the table above, please refer to the Security Valuation section in the accompanying Notes to Financial Statements.
The Fund was invested in the following countries at February 28, 2010:
Summary of Securities
By Country (Unaudited) | | Value | | % of Total
Investments | |
| United States* | | $ | 24,085,780 | | | | 44.5 | | |
| Japan | | | 9,781,437 | | | | 18.1 | | |
| Netherlands | | | 5,066,032 | | | | 9.4 | | |
| United Kingdom | | | 4,240,995 | | | | 7.8 | | |
| France | | | 2,991,768 | | | | 5.5 | | |
| Italy | | | 2,832,653 | | | | 5.2 | | |
| Germany | | | 1,780,914 | | | | 3.3 | | |
| Sweden | | | 1,322,927 | | | | 2.4 | | |
| Spain | | | 995,012 | | | | 1.8 | | |
| Brazil | | | 700,557 | | | | 1.3 | | |
| Mexico | | | 371,142 | | | | 0.7 | | |
| | | $ | 54,169,217 | | | | 100.0 | | |
* Includes short-term obligation.
Certain securities are listed by country of underlying exposure but may trade predominantly on another exchange.
| Acronym | | Name | |
| ADR | | American Depositary Receipt | |
|
See Accompanying Notes to Financial Statements.
30
Investment Portfolio – Columbia International Value Fund
February 28, 2010
| Investment Company – 99.9% | |
| | | Value ($) | |
Investment in Columbia Funds
Master Investment Trust, LLC,
Columbia International Value
Master Portfolio (a) | | | 1,638,707,783 | | |
| Total Investments – 99.9% | | | 1,638,707,783 | | |
| Other Assets & Liabilities, Net – 0.1% | | | 2,072,106 | | |
| Net Assets – 100.0% | | | 1,640,779,889 | | |
Notes to Investment Portfolio:
(a) The financial statements of Columbia International Value Master Portfolio, including its investment portfolio, are included elsewhere within this report and should be read in conjunction with Columbia International Value Fund's financial statements.
Columbia International Value Fund invests only in Columbia International Value Master Portfolio (the "Master Portfolio"). At February 28, 2010, Columbia International Value Fund owned 86.4% of the Master Portfolio. Columbia International Value Master Portfolio was invested in the following countries at February 28, 2010.
Summary of Securities
By Country (Unaudited) | | Value | | % of Total
Investments | |
| Japan | | $ | 584,851,970 | | | | 31.2 | | |
| United Kingdom | | | 291,331,584 | | | | 15.5 | | |
| France | | | 191,609,247 | | | | 10.2 | | |
| Netherlands | | | 150,919,204 | | | | 8.0 | | |
| Italy | | | 119,318,374 | | | | 6.4 | | |
| Switzerland | | | 84,032,878 | | | | 4.5 | | |
| Germany | | | 79,977,132 | | | | 4.3 | | |
| Brazil | | | 74,131,274 | | | | 4.0 | | |
| South Korea | | | 60,469,844 | | | | 3.2 | | |
| Portugal | | | 58,804,532 | | | | 3.1 | | |
| Finland | | | 40,143,908 | | | | 2.1 | | |
| Mexico | | | 37,577,445 | | | | 2.0 | | |
| Sweden | | | 32,930,604 | | | | 1.8 | | |
| Spain | | | 25,431,898 | | | | 1.4 | | |
| United States* | | | 25,250,000 | | | | 1.3 | | |
| New Zealand | | | 11,744,172 | | | | 0.6 | | |
| Bermuda | | | 6,470,321 | | | | 0.4 | | |
| | | $ | 1,874,994,387 | | | | 100.0 | | |
* Includes short-term obligation.
Certain securities are listed by country of underlying exposure but may trade predominantly on another exchange.
See Accompanying Notes to Financial Statements.
31
Investment Portfolio – Columbia Marsico Global Fund
February 28, 2010
| Common Stocks – 92.4% | |
| | | Shares | | Value ($) | |
| Consumer Discretionary – 22.4% | |
| Distributors – 2.5% | |
| Li & Fung Ltd. | | | 30,000 | | | | 139,523 | | |
| Distributors Total | | | 139,523 | | |
| Hotels, Restaurants & Leisure – 0.5% | |
Chipotle Mexican Grill, Inc.,
Class A (a) | | | 248 | | | | 25,968 | | |
| Hotels, Restaurants & Leisure Total | | | 25,968 | | |
| Household Durables – 6.2% | |
| Cyrela Brazil Realty SA | | | 8,800 | | | | 109,808 | | |
| Gafisa SA | | | 11,192 | | | | 84,850 | | |
| Gafisa SA, ADR | | | 3,492 | | | | 107,240 | | |
PDG Realty SA Empreendimentos
e Participacoes | | | 4,500 | | | | 40,265 | | |
| Household Durables Total | | | 342,163 | | |
| Internet & Catalog Retail – 0.9% | |
| Amazon.com, Inc. (a) | | | 415 | | | | 49,136 | | |
| Internet & Catalog Retail Total | | | 49,136 | | |
| Media – 3.2% | |
| Walt Disney Co. | | | 5,708 | | | | 178,318 | | |
| Media Total | | | 178,318 | | |
| Multiline Retail – 0.8% | |
| Lojas Renner SA | | | 2,100 | | | | 45,343 | | |
| Multiline Retail Total | | | 45,343 | | |
| Specialty Retail – 2.9% | |
| Inditex SA | | | 2,228 | | | | 131,392 | | |
| Rue21, Inc. (a) | | | 992 | | | | 28,510 | | |
| Specialty Retail Total | | | 159,902 | | |
| Textiles, Apparel & Luxury Goods – 5.4% | |
| Compagnie Financiere Richemont SA | | | 3,217 | | | | 108,466 | | |
| Lululemon Athletica, Inc. (a) | | | 2,312 | | | | 66,239 | | |
| Polo Ralph Lauren Corp. | | | 1,574 | | | | 125,810 | | |
| Textiles, Apparel & Luxury Goods Total | | | 300,515 | | |
| Consumer Discretionary Total | | | 1,240,868 | | |
| Consumer Staples – 5.4% | |
| Beverages – 3.4% | |
| Anheuser-Busch InBev NV | | | 3,725 | | | | 186,452 | | |
| Beverages Total | | | 186,452 | | |
| Food Products – 2.0% | |
| Nestle SA, Registered Shares | | | 2,268 | | | | 112,846 | | |
| Food Products Total | | | 112,846 | | |
| Consumer Staples Total | | | 299,298 | | |
| | | Shares | | Value ($) | |
| Energy – 3.9% | |
| Energy Equipment & Services – 1.5% | |
| National-Oilwell Varco, Inc. | | | 1,900 | | | | 82,593 | | |
| Energy Equipment & Services Total | | | 82,593 | | |
| Oil, Gas & Consumable Fuels – 2.4% | |
| OGX Petroleo e Gas Participacoes SA | | | 8,600 | | | | 74,952 | | |
| Petroleo Brasileiro SA, ADR | | | 1,305 | | | | 55,658 | | |
| Oil, Gas & Consumable Fuels Total | | | 130,610 | | |
| Energy Total | | | 213,203 | | |
| Financials – 25.9% | |
| Capital Markets – 2.0% | |
Credit Suisse Group AG,
Registered Shares | | | 1,266 | | | | 56,214 | | |
| Julius Baer Group Ltd. | | | 1,745 | | | | 54,287 | | |
| Capital Markets Total | | | 110,501 | | |
| Commercial Banks – 15.1% | |
| First Midwest Bancorp, Inc. | | | 3,438 | | | | 46,723 | | |
| HSBC Holdings PLC | | | 14,913 | | | | 163,632 | | |
| ICICI Bank Ltd., ADR | | | 2,261 | | | | 86,483 | | |
| PNC Financial Services Group, Inc. | | | 2,742 | | | | 147,410 | | |
| Standard Chartered PLC | | | 4,250 | | | | 100,745 | | |
| Wells Fargo & Co. | | | 10,632 | | | | 290,679 | | |
| Commercial Banks Total | | | 835,672 | | |
| Diversified Financial Services – 4.7% | |
| JPMorgan Chase & Co. | | | 6,263 | | | | 262,858 | | |
| Diversified Financial Services Total | | | 262,858 | | |
| Real Estate Management & Development – 4.1% | |
| BR Malls Participacoes SA (a) | | | 6,600 | | | | 85,826 | | |
| Hang Lung Properties Ltd. | | | 27,000 | | | | 103,657 | | |
| IFM Investments Ltd., ADR (a) | | | 5,300 | | | | 37,100 | | |
Real Estate Management &
Development Total | | | 226,583 | | |
| Financials Total | | | 1,435,614 | | |
| Health Care – 7.1% | |
| Biotechnology – 3.5% | |
| Celgene Corp. (a) | | | 1,176 | | | | 69,995 | | |
| Gilead Sciences, Inc. (a) | | | 2,616 | | | | 124,548 | | |
| Biotechnology Total | | | 194,543 | | |
| Health Care Equipment & Supplies – 3.6% | |
| Intuitive Surgical, Inc. (a) | | | 566 | | | | 196,481 | | |
| Health Care Equipment & Supplies Total | | | 196,481 | | |
| Health Care Total | | | 391,024 | | |
See Accompanying Notes to Financial Statements.
32
Columbia Marsico Global Fund
February 28, 2010
| Common Stocks (continued) | |
| | | Shares | | Value ($) | |
| Industrials – 5.0% | |
| Aerospace & Defense – 1.6% | |
| Precision Castparts Corp. | | | 784 | | | | 88,396 | | |
| Aerospace & Defense Total | | | 88,396 | | |
| Commercial Services & Supplies – 0.6% | |
| Ritchie Bros Auctioneers, Inc. | | | 1,714 | | | | 35,943 | | |
| Commercial Services & Supplies Total | | | 35,943 | | |
| Construction & Engineering – 0.4% | |
| AECOM Technology Corp. (a) | | | 801 | | | | 21,707 | | |
| Construction & Engineering Total | | | 21,707 | | |
| Electrical Equipment – 1.4% | |
| ABB Ltd., Registered Shares (a) | | | 3,832 | | | | 77,514 | | |
| Electrical Equipment Total | | | 77,514 | | |
| Marine – 1.0% | |
| Kuehne & Nagel International AG | | | 581 | | | | 52,705 | | |
| Marine Total | | | 52,705 | | |
| Industrials Total | | | 276,265 | | |
| Information Technology – 14.2% | |
| Communications Equipment – 1.8% | |
| Research In Motion Ltd. (a) | | | 1,404 | | | | 99,515 | | |
| Communications Equipment Total | | | 99,515 | | |
| Computers & Peripherals – 3.0% | |
| Apple, Inc. (a) | | | 712 | | | | 145,689 | | |
| Compellent Technologies, Inc. (a) | | | 1,345 | | | | 20,888 | | |
| Computers & Peripherals Total | | | 166,577 | | |
| Electronic Equipment, Instruments & Components – 0.3% | |
| Digital China Holdings Ltd. | | | 9,000 | | | | 14,146 | | |
Electronic Equipment, Instruments &
Components Total | | | 14,146 | | |
| Internet Software & Services – 2.9% | |
| Baidu, Inc., ADR (a) | | | 86 | | | | 44,607 | | |
| Google, Inc., Class A (a) | | | 150 | | | | 79,020 | | |
| OpenTable, Inc. (a) | | | 1,128 | | | | 38,442 | | |
| Internet Software & Services Total | | | 162,069 | | |
| IT Services – 2.9% | |
| MasterCard, Inc., Class A | | | 719 | | | | 161,322 | | |
| IT Services Total | | | 161,322 | | |
| | | Shares | | Value ($) | |
| Semiconductors & Semiconductor Equipment – 1.1% | |
| Cree, Inc. (a) | | | 938 | | | | 63,625 | | |
Semiconductors & Semiconductor
Equipment Total | | | 63,625 | | |
| Software – 2.2% | |
| Adobe Systems, Inc. (a) | | | 1,448 | | | | 50,173 | | |
| Citrix Systems, Inc. (a) | | | 1,629 | | | | 70,063 | | |
| Software Total | | | 120,236 | | |
| Information Technology Total | | | 787,490 | | |
| Materials – 4.5% | |
| Chemicals – 2.1% | |
| Novozymes A/S, Class B | | | 679 | | | | 69,694 | | |
| Praxair, Inc. | | | 652 | | | | 48,991 | | |
| Chemicals Total | | | 118,685 | | |
| Metals & Mining – 2.4% | |
| BHP Billiton PLC | | | 4,351 | | | | 133,153 | | |
| Metals & Mining Total | | | 133,153 | | |
| Materials Total | | | 251,838 | | |
| Telecommunication Services – 4.0% | |
| Wireless Telecommunication Services – 4.0% | |
| Crown Castle International Corp. (a) | | | 5,846 | | | | 220,979 | | |
| Wireless Telecommunication Services Total | | | 220,979 | | |
| Telecommunication Services Total | | | 220,979 | | |
Total Common Stocks
(cost of $4,278,749) | | | 5,116,579 | | |
| Preferred Stock – 0.8% | |
| Consumer Discretionary – 0.8% | |
| Multiline Retail – 0.8% | |
| Lojas Americanas SA | | | 6,500 | | | | 46,759 | | |
| Multiline Retail Total | | | 46,759 | | |
| Consumer Discretionary Total | | | 46,759 | | |
Total Preferred Stock
(cost of $40,047) | | | 46,759 | | |
See Accompanying Notes to Financial Statements.
33
Columbia Marsico Global Fund
February 28, 2010
| Short-Term Obligation – 7.9% | |
| | | Par ($) | | Value ($) | |
Repurchase agreement with
State Street Bank and Trust Co.,
dated 02/26/10, due 03/01/10
at 0.010%, collateralized by a
U.S. Government Agency
obligation maturing 09/17/10,
market value $447,931
(repurchase proceeds $435,000) | | | 435,000 | | | | 435,000 | | |
Total Short-Term Obligation
(cost of $435,000) | | | 435,000 | | |
Total Investments – 101.1%
(cost of $4,753,796) (b) | | | 5,598,338 | | |
| Other Assets & Liabilities, Net – (1.1)% | | | (61,849 | ) | |
| Net Assets – 100.0% | | | 5,536,489 | | |
Notes to Investment Portfolio:
(a) Non-income producing security.
(b) Cost for federal income tax purposes is $4,889,279.
The following table summarizes the inputs used, as of February 28, 2010, in valuing the Fund's assets:
| Description | | Quoted Prices
(Level 1) | | Other
Significant
Observable
Inputs
(Level 2) | | Significant
Unobservable
Inputs
(Level 3) | | Total | |
| Common Stocks | |
Consumer
Discretionary | | $ | 861,487 | | | $ | 379,381 | | | $ | — | | | $ | 1,240,868 | | |
| Consumer Staples | | | — | | | | 299,298 | | | | — | | | | 299,298 | | |
| Energy | | | 213,203 | | | | — | | | | — | | | | 213,203 | | |
| Financials | | | 957,079 | | | | 478,535 | | | | — | | | | 1,435,614 | | |
| Health Care | | | 391,024 | | | | — | | | | — | | | | 391,024 | | |
| Industrials | | | 146,046 | | | | 130,219 | | | | — | | | | 276,265 | | |
Information
Technology | | | 773,344 | | | | 14,146 | | | | — | | | | 787,490 | | |
| Materials | | | 48,991 | | | | 202,847 | | | | — | | | | 251,838 | | |
Telecommunication
Services | | | 220,979 | | | | — | | | | — | | | | 220,979 | | |
| Total Common Stocks | | | 3,612,153 | | | | 1,504,426 | | | | — | | | | 5,116,579 | | |
| Total Preferred Stock | | | 46,759 | | | | — | | | | — | | | | 46,759 | | |
Total Short-Term
Obligation | | | — | | | | 435,000 | | | | — | | | | 435,000 | | |
| Total Investments | | $ | 3,658,912 | | | $ | 1,939,426 | | | $ | — | | | $ | 5,598,338 | | |
The Fund's assets assigned to the Level 2 input category include certain foreign securities for which a third party statistical pricing service may be employed for purposes of fair market valuation.
For more information on valuation inputs, and their aggregation into the levels used in the table above, please refer to the Security Valuation section in the accompanying Notes to Financial Statements.
The Fund was invested in the following countries at February 28, 2010:
Summary of Securities
By Country (Unaudited) | | Value | | % of Total
Investments | |
| United States* | | $ | 3,110,425 | | | | 55.6 | | |
| Brazil | | | 650,701 | | | | 11.6 | | |
| Switzerland | | | 462,032 | | | | 8.3 | | |
| United Kingdom | | | 397,530 | | | | 7.1 | | |
| Hong Kong | | | 243,180 | | | | 4.3 | | |
| Canada | | | 201,697 | | | | 3.6 | | |
| Belgium | | | 186,452 | | | | 3.3 | | |
| Spain | | | 131,392 | | | | 2.4 | | |
| India | | | 86,483 | | | | 1.5 | | |
| Denmark | | | 69,694 | | | | 1.2 | | |
| China | | | 58,752 | | | | 1.1 | | |
| | | $ | 5,598,338 | | | | 100.0 | | |
* Includes short-term obligation.
Certain securities are listed by country of underlying exposure but may trade predominantly on another exchange.
| Acronym | | Name | |
| ADR | | American Depositary Receipt | |
|
See Accompanying Notes to Financial Statements.
34
Investment Portfolio – Columbia Marsico International Opportunities Fund
February 28, 2010
| Common Stocks – 93.8% | |
| | | Shares | | Value ($) | |
| Consumer Discretionary – 17.5% | |
| Automobiles – 2.6% | |
| Daimler AG, Registered Shares | | | 360,865 | | | | 15,065,462 | | |
| Honda Motor Co., Ltd. | | | 479,700 | | | | 16,629,816 | | |
| Automobiles Total | | | 31,695,278 | | |
| Distributors – 1.9% | |
China Resources
Enterprise Ltd. | | | 1,986,000 | | | | 6,972,102 | | |
| Li & Fung Ltd. | | | 3,336,000 | | | | 15,514,980 | | |
| Distributors Total | | | 22,487,082 | | |
| Hotels, Restaurants & Leisure – 2.9% | |
| Accor SA | | | 277,539 | | | | 14,037,506 | | |
| Compass Group PLC | | | 1,890,174 | | | | 14,053,295 | | |
Ctrip.com International Ltd.,
ADR (a) | | | 163,666 | | | | 6,256,951 | | |
| Hotels, Restaurants & Leisure Total | | | 34,347,752 | | |
| Household Durables – 5.3% | |
| Cyrela Brazil Realty SA | | | 1,577,700 | | | | 19,686,874 | | |
| Gafisa SA | | | 2,480,264 | | | | 18,802,876 | | |
| Panasonic Corp. | | | 959,700 | | | | 13,340,419 | | |
PDG Realty SA
Empreendimentos e
Participacoes | | | 1,367,128 | | | | 12,232,775 | | |
| Household Durables Total | | | 64,062,944 | | |
| Media – 1.0% | |
| Publicis Groupe SA | | | 309,224 | | | | 12,197,961 | | |
| Media Total | | | 12,197,961 | | |
| Specialty Retail – 2.3% | |
| Inditex SA | | | 460,496 | | | | 27,156,863 | | |
| Specialty Retail Total | | | 27,156,863 | | |
| Textiles, Apparel & Luxury Goods – 1.5% | |
| Adidas AG | | | 242,555 | | | | 12,018,710 | | |
| Swatch Group AG | | | 21,703 | | | | 6,034,616 | | |
| Textiles, Apparel & Luxury Goods Total | | | 18,053,326 | | |
| Consumer Discretionary Total | | | 210,001,206 | | |
| Consumer Staples – 12.3% | |
| Beverages – 5.6% | |
| Anheuser-Busch InBev NV | | | 716,877 | | | | 35,882,749 | | |
| Heineken NV | | | 379,517 | | | | 18,639,873 | | |
| Pernod-Ricard SA | | | 170,309 | | | | 12,831,098 | | |
| Beverages Total | | | 67,353,720 | | |
| Food & Staples Retailing – 3.6% | |
| FamilyMart Co., Ltd. | | | 422,300 | | | | 13,532,423 | | |
| | | Shares | | Value ($) | |
| Metro AG | | | 352,771 | | | | 18,087,606 | | |
| Tesco PLC | | | 1,863,131 | | | | 11,923,261 | | |
| Food & Staples Retailing Total | | | 43,543,290 | | |
| Food Products – 2.1% | |
| JBS SA | | | 1,525,600 | | | | 7,665,356 | | |
| Nestle SA, Registered Shares | | | 361,386 | | | | 17,980,993 | | |
| Food Products Total | | | 25,646,349 | | |
| Household Products – 1.0% | |
| Reckitt Benckiser Group PLC | | | 225,913 | | | | 11,877,394 | | |
| Household Products Total | | | 11,877,394 | | |
| Consumer Staples Total | | | 148,420,753 | | |
| Energy – 5.5% | |
| Energy Equipment & Services – 2.0% | |
| Transocean Ltd. (a) | | | 304,403 | | | | 24,297,447 | | |
| Energy Equipment & Services Total | | | 24,297,447 | | |
| Oil, Gas & Consumable Fuels – 3.5% | |
| CNOOC Ltd. | | | 7,846,300 | | | | 12,312,044 | | |
OGX Petroleo e Gas
Participacoes SA | | | 2,026,300 | | | | 17,659,976 | | |
Reliance Industries Ltd.,
GDR (b) | | | 284,450 | | | | 12,060,680 | | |
| Oil, Gas & Consumable Fuels Total | | | 42,032,700 | | |
| Energy Total | | | 66,330,147 | | |
| Financials – 16.5% | |
| Capital Markets – 4.6% | |
Credit Suisse Group AG,
Registered Shares | | | 817,435 | | | | 36,296,625 | | |
| Daiwa Securities Group, Inc. | | | 2,458,000 | | | | 12,145,444 | | |
| Julius Baer Group Ltd. | | | 208,750 | | | | 6,494,229 | | |
| Capital Markets Total | | | 54,936,298 | | |
| Commercial Banks – 8.9% | |
Banco Bilbao Vizcaya
Argentaria SA | | | 545,495 | | | | 7,093,486 | | |
| BNP Paribas | | | 164,874 | | | | 11,927,723 | | |
| HSBC Holdings PLC | | | 3,284,610 | | | | 36,040,239 | | |
| ICICI Bank Ltd., ADR | | | 579,769 | | | | 22,176,164 | | |
| Mizuho Financial Group, Inc. | | | 6,162,900 | | | | 11,931,102 | | |
| Standard Chartered PLC | | | 497,559 | | | | 11,850,545 | | |
| Toronto-Dominion Bank | | | 92,870 | | | | 5,934,783 | | |
| Commercial Banks Total | | | 106,954,042 | | |
See Accompanying Notes to Financial Statements.
35
Columbia Marsico International Opportunities Fund
February 28, 2010
| Common Stocks (continued) | |
| | | Shares | | Value ($) | |
| Real Estate Management & Development – 3.0% | |
| CapitaLand Ltd. | | | 7,618,000 | | | | 20,485,196 | | |
| Cheung Kong Holdings Ltd. | | | 686,000 | | | | 8,387,032 | | |
| Hang Lung Properties Ltd. | | | 1,866,000 | | | | 7,163,840 | | |
Real Estate Management &
Development Total | | | 36,036,068 | | |
| Financials Total | | | 197,926,408 | | |
| Health Care – 10.2% | |
| Biotechnology – 1.6% | |
Actelion Ltd., Registered
Shares (a) | | | 115,416 | | | | 5,882,268 | | |
| CSL Ltd. | | | 456,357 | | | | 14,065,072 | | |
| Biotechnology Total | | | 19,947,340 | | |
| Health Care Equipment & Supplies – 1.6% | |
| Covidien PLC | | | 386,285 | | | | 18,974,319 | | |
| Health Care Equipment & Supplies Total | | | 18,974,319 | | |
| Life Sciences Tools & Services – 1.0% | |
Lonza Group AG,
Registered Shares | | | 151,989 | | | | 11,969,531 | | |
| Life Sciences Tools & Services Total | | | 11,969,531 | | |
| Pharmaceuticals – 6.0% | |
| Novartis AG, Registered Shares | | | 322,547 | | | | 17,940,129 | | |
| Novo-Nordisk A/S, Class B | | | 342,730 | | | | 24,204,805 | | |
Teva Pharmaceutical
Industries Ltd., ADR | | | 500,751 | | | | 30,050,067 | | |
| Pharmaceuticals Total | | | 72,195,001 | | |
| Health Care Total | | | 123,086,191 | | |
| Industrials – 9.0% | |
| Building Products – 0.5% | |
| Daikin Industries Ltd. | | | 171,324 | | | | 6,594,947 | | |
| Building Products Total | | | 6,594,947 | | |
| Electrical Equipment – 4.6% | |
| ABB Ltd., Registered Shares (a) | | | 653,886 | | | | 13,226,849 | | |
| Alstom SA | | | 282,706 | | | | 18,090,569 | | |
| Schneider Electric SA | | | 225,847 | | | | 24,119,156 | | |
| Electrical Equipment Total | | | 55,436,574 | | |
| Road & Rail – 1.3% | |
| Canadian National Railway Co. | | | 288,660 | | | | 15,200,836 | | |
| Road & Rail Total | | | 15,200,836 | | |
| | | Shares | | Value ($) | |
| Trading Companies & Distributors – 2.6% | |
| Marubeni Corp. | | | 4,047,000 | | | | 24,187,709 | | |
| Noble Group Ltd. | | | 3,053,000 | | | | 6,884,833 | | |
| Trading Companies & Distributors Total | | | 31,072,542 | | |
| Industrials Total | | | 108,304,899 | | |
| Information Technology – 10.6% | |
| Communications Equipment – 2.5% | |
| Research In Motion Ltd. (a) | | | 421,121 | | | | 29,849,056 | | |
| Communications Equipment Total | | | 29,849,056 | | |
| Electronic Equipment, Instruments & Components – 0.9% | |
HON HAI Precision Industry
Co., Ltd. | | | 2,875,390 | | | | 11,385,908 | | |
Electronic Equipment, Instruments &
Components Total | | | 11,385,908 | | |
| Internet Software & Services – 1.0% | |
| Baidu, Inc., ADR (a) | | | 12,174 | | | | 6,314,410 | | |
| Tencent Holdings Ltd. | | | 327,100 | | | | 6,392,697 | | |
| Internet Software & Services Total | | | 12,707,107 | | |
| Office Electronics – 1.5% | |
| Canon, Inc. | | | 436,800 | | | | 18,166,200 | | |
| Office Electronics Total | | | 18,166,200 | | |
| Semiconductors & Semiconductor Equipment – 1.6% | |
| Infineon Technologies AG (a) | | | 2,146,731 | | | | 11,712,849 | | |
| Sumco Corp. (a) | | | 393,000 | | | | 7,126,152 | | |
Semiconductors & Semiconductor
Equipment Total | | | 18,839,001 | | |
| Software – 3.1% | |
| Autonomy Corp. PLC (a) | | | 641,163 | | | | 14,957,967 | | |
Longtop Financial Technologies
Ltd., ADR (a) | | | 254,775 | | | | 8,458,530 | | |
| Nintendo Co., Ltd. | | | 49,100 | | | | 13,357,499 | | |
| Software Total | | | 36,773,996 | | |
| Information Technology Total | | | 127,721,268 | | |
| Materials – 9.2% | |
| Chemicals – 6.6% | |
| Akzo Nobel NV | | | 236,247 | | | | 12,013,355 | | |
| BASF SE | | | 635,466 | | | | 35,684,247 | | |
| Novozymes A/S, Class B | | | 73,206 | | | | 7,514,009 | | |
| Syngenta AG, Registered Shares | | | 92,492 | | | | 23,935,560 | | |
| Chemicals Total | | | 79,147,171 | | |
See Accompanying Notes to Financial Statements.
36
Columbia Marsico International Opportunities Fund
February 28, 2010
| Common Stocks (continued) | |
| | | Shares | | Value ($) | |
| Metals & Mining – 2.6% | |
| ThyssenKrupp AG | | | 375,864 | | | | 11,899,241 | | |
| Vale SA, ADR | | | 713,299 | | | | 19,872,510 | | |
| Metals & Mining Total | | | 31,771,751 | | |
| Materials Total | | | 110,918,922 | | |
| Telecommunication Services – 3.0% | |
| Diversified Telecommunication Services – 3.0% | |
| Telefonica SA | | | 1,526,307 | | | | 35,840,219 | | |
Diversified Telecommunication
Services Total | | | 35,840,219 | | |
| Telecommunication Services Total | | | 35,840,219 | | |
Total Common Stocks
(cost of $985,168,708) | | | 1,128,550,013 | | |
| Preferred Stock – 0.5% | |
| Health Care – 0.5% | |
| Health Care Equipment & Supplies – 0.5% | |
| Fresenius AG | | | 88,419 | | | | 6,218,441 | | |
| Health Care Equipment & Supplies Total | | | 6,218,441 | | |
| Health Care Total | | | 6,218,441 | | |
Total Preferred Stock
(cost of $6,353,670) | | | 6,218,441 | | |
| Short-Term Obligation – 2.1% | |
| | | Par ($) | | | |
Repurchase agreement with
Fixed Income Clearing Corp.,
dated 02/26/10, due 03/01/10
at 0.050%, collateralized by
U.S. Government Agency obligations
with various maturities to
01/15/14, market value
$25,485,938 (repurchase
proceeds $24,986,104) | | | 24,986,000 | | | | 24,986,000 | | |
Total Short-Term Obligation
(cost of $24,986,000) | | | 24,986,000 | | |
Total Investments – 96.4%
(cost of $1,016,508,378) (c) | | | 1,159,754,454 | | |
| Other Assets & Liabilities, Net – 3.6% | | | 43,217,914 | | |
| Net Assets – 100.0% | | | 1,202,972,368 | | |
Notes to Investment Portfolio:
(a) Non-income producing security.
(b) Security exempt from registration pursuant to Rule 144A under the Securities Act of 1933.This security may be resold in transactions exempt from registration, normally on foreign exchanges or to qualified institutional buyers. At February 28, 2010, this security which is not illiquid, amounted to $12,060,680, which represents 1.0% of net assets.
(c) Cost for federal income tax purposes is $1,062,984,695.
The following table summarizes the inputs used, as of February 28, 2010, in valuing the Fund's assets:
| Description | | Quoted Prices
(Level 1) | | Other
Significant
Observable
Inputs
(Level 2) | | Significant
Unobservable
Inputs
(Level 3) | | Total | |
| Common Stocks | |
Consumer
Discretionary | | $ | 56,979,476 | | | $ | 153,021,730 | | | $ | — | | | $ | 210,001,206 | | |
Consumer
Staples | | | 7,665,356 | | | | 140,755,397 | | | | — | | | | 148,420,753 | | |
| Energy | | | 54,018,103 | | | | 12,312,044 | | | | — | | | | 66,330,147 | | |
| Financials | | | 28,110,947 | | | | 169,815,461 | | | | — | | | | 197,926,408 | | |
| Health Care | | | 49,024,386 | | | | 74,061,805 | | | | — | | | | 123,086,191 | | |
| Industrials | | | 15,200,836 | | | | 93,104,063 | | | | — | | | | 108,304,899 | | |
Information
Technology | | | 44,621,996 | | | | 83,099,272 | | | | — | | | | 127,721,268 | | |
| Materials | | | 19,872,510 | | | | 91,046,412 | | | | — | | | | 110,918,922 | | |
Telecommunication
Services | | | — | | | | 35,840,219 | | | | — | | | | 35,840,219 | | |
Total Common
Stocks | | | 275,493,610 | | | | 853,056,403 | | | | — | | | | 1,128,550,013 | | |
Total Preferred
Stock | | | — | | | | 6,218,441 | | | | — | | | | 6,218,441 | | |
Total Short-Term
Obligation | | | — | | | | 24,986,000 | | | | — | | | | 24,986,000 | | |
| Total Investments | | $ | 275,493,610 | | | $ | 884,260,844 | | | $ | — | | | $ | 1,159,754,454 | | |
The Fund's assets assigned to the Level 2 input category include certain foreign securities for which a third party statistical pricing service may be employed for purposes of fair market valuation.
See Accompanying Notes to Financial Statements.
37
Columbia Marsico International Opportunities Fund
February 28, 2010
The following table reconciles asset balances for the year ending February 28, 2010, in which significant unobservable inputs (Level 3) were used in determining value:
Investments
in Securities | | Balance as of
February 28,
2009 | | Realized
Gain/(Loss) | | Change in
Unrealized
Appreciation
(Depreciation) | | Net
Purchases
(Sales) | |
Net Transfers into
(out of) Level 3 | | Balance as of
February 28,
2010 | |
Rights
Industrials | | $ | 746,858 | | | $ | — | | | $ | 33,232 | | | $ | — | | | $ | (780,090 | ) | | $ | — | | |
The information in the above reconciliation represents fiscal year to date activity for any securities identified as using Level 3 inputs at either the beginning or the end of the current fiscal period.
For more information on valuation inputs, and their aggregation into the levels used in the tables above, please refer to the Security Valuation section in the accompanying Notes to Financial Statements.
The Fund was invested in the following countries at February 28, 2010.
Summary of Securities
By Country (Unaudited) | | Value | | % of Total
Investments | |
| Switzerland | | $ | 164,058,248 | | | | 14.2 | | |
| Japan | | | 137,011,711 | | | | 11.8 | | |
| Germany | | | 110,686,554 | | | | 9.5 | | |
| United Kingdom | | | 100,702,702 | | | | 8.7 | | |
| Brazil | | | 95,920,367 | | | | 8.3 | | |
| France | | | 93,204,013 | | | | 8.0 | | |
| Spain | | | 70,090,568 | | | | 6.0 | | |
| Canada | | | 50,984,675 | | | | 4.4 | | |
| China | | | 46,706,734 | | | | 4.0 | | |
| Hong Kong | | | 37,950,685 | | | | 3.3 | | |
| Belgium | | | 35,882,749 | | | | 3.1 | | |
| India | | | 34,236,844 | | | | 3.0 | | |
| Denmark | | | 31,718,813 | | | | 2.7 | | |
| Netherlands | | | 30,653,228 | | | | 2.6 | | |
| Israel | | | 30,050,068 | | | | 2.6 | | |
| United States* | | | 24,986,000 | | | | 2.2 | | |
| Singapore | | | 20,485,196 | | | | 1.8 | | |
| Ireland | | | 18,974,319 | | | | 1.6 | | |
| Australia | | | 14,065,072 | | | | 1.2 | | |
| Taiwan | | | 11,385,908 | | | | 1.0 | | |
| | | $ | 1,159,754,454 | | | | 100.0 | | |
* Includes short-term obligation.
Certain securities are listed by country of underlying exposure but may trade predominantly on another exchange.
| Acronym | | Name | |
| ADR | | American Depositary Receipt | |
|
| GDR | | Global Depositary Receipt | |
|
See Accompanying Notes to Financial Statements.
38
Investment Portfolio – Columbia Multi-Advisor International Equity Fund
February 28, 2010
| Common Stocks – 95.7% | |
| | | Shares | | Value ($) | |
| Consumer Discretionary – 12.8% | |
| Automobiles – 3.1% | |
| Daimler AG, Registered Shares | | | 224,651 | | | | 9,378,774 | | |
Dongfeng Motor Group Co.,
Ltd., Class H | | | 2,104,000 | | | | 3,057,544 | | |
| Honda Motor Co., Ltd. | | | 465,200 | | | | 16,127,143 | | |
| Nissan Motor Co., Ltd. (a) | | | 566,500 | | | | 4,495,273 | | |
| Toyota Motor Corp. | | | 266,500 | | | | 9,988,688 | | |
| Automobiles Total | | | 43,047,422 | | |
| Distributors – 1.0% | |
China Resources
Enterprise Ltd. | | | 1,218,000 | | | | 4,275,941 | | |
| Li & Fung Ltd. | | | 2,078,000 | | | | 9,664,307 | | |
| Distributors Total | | | 13,940,248 | | |
| Hotels, Restaurants & Leisure – 1.5% | |
| Accor SA | | | 173,542 | | | | 8,777,494 | | |
| Compass Group PLC | | | 1,181,906 | | | | 8,787,378 | | |
Ctrip.com International Ltd.,
ADR (a) | | | 101,760 | | | | 3,890,285 | | |
| Hotels, Restaurants & Leisure Total | | | 21,455,157 | | |
| Household Durables – 2.8% | |
| Cyrela Brazil Realty SA | | | 977,290 | | | | 12,194,831 | | |
| Gafisa SA | | | 1,528,706 | | | | 11,589,117 | | |
| Panasonic Corp. | | | 594,400 | | | | 8,262,525 | | |
PDG Realty SA
Empreendimentos e
Participacoes | | | 853,200 | | | | 7,634,255 | | |
| Household Durables Total | | | 39,680,728 | | |
| Leisure Equipment & Products – 0.3% | |
| Altek Corp. | | | 2,406,000 | | | | 3,863,403 | | |
| Leisure Equipment & Products Total | | | 3,863,403 | | |
| Media – 1.0% | |
| Daiichikosho Co., Ltd. | | | 251,700 | | | | 3,396,796 | | |
| Publicis Groupe SA | | | 192,503 | | | | 7,593,667 | | |
| Vivendi | | | 143,343 | | | | 3,610,886 | | |
| Media Total | | | 14,601,349 | | |
| Specialty Retail – 1.9% | |
| Game Group PLC | | | 3,449,233 | | | | 4,312,699 | | |
| Inditex SA | | | 288,006 | | | | 16,984,598 | | |
| USS Co., Ltd. | | | 73,390 | | | | 4,758,021 | | |
| Specialty Retail Total | | | 26,055,318 | | |
| | | Shares | | Value ($) | |
| Textiles, Apparel & Luxury Goods – 1.2% | |
| Adidas AG | | | 150,996 | | | | 7,481,920 | | |
| Polo Ralph Lauren Corp. (b) | | | 61,820 | | | | 4,941,273 | | |
| Swatch Group AG | | | 13,591 | | | | 3,779,038 | | |
| Textiles, Apparel & Luxury Goods Total | | | 16,202,231 | | |
| Consumer Discretionary Total | | | 178,845,856 | | |
| Consumer Staples – 7.8% | |
| Beverages – 3.0% | |
| Anheuser-Busch InBev NV | | | 446,267 | | | | 22,337,565 | | |
| Heineken NV | | | 235,463 | | | | 11,564,700 | | |
| Pernod-Ricard SA | | | 105,371 | | | | 7,938,663 | | |
| Beverages Total | | | 41,840,928 | | |
| Food & Staples Retailing – 2.9% | |
| FamilyMart Co., Ltd. | | | 446,600 | | | | 14,311,106 | | |
| Koninklijke Ahold NV | | | 333,047 | | | | 4,081,442 | | |
Matsumotokiyoshi Holdings
Co., Ltd. | | | 198,200 | | | | 4,359,084 | | |
| Metro AG | | | 217,214 | | | | 11,137,200 | | |
| Tesco PLC | | | 1,142,998 | | | | 7,314,710 | | |
| Food & Staples Retailing Total | | | 41,203,542 | | |
| Food Products – 1.4% | |
| JBS SA | | | 946,100 | | | | 4,753,666 | | |
| Nestle SA, Registered Shares | | | 224,969 | | | | 11,193,478 | | |
| Toyo Suisan Kaisha Ltd. | | | 113,500 | | | | 3,163,104 | | |
| Food Products Total | | | 19,110,248 | | |
| Household Products – 0.5% | |
| Reckitt Benckiser Group PLC | | | 140,635 | | | | 7,393,896 | | |
| Household Products Total | | | 7,393,896 | | |
| Consumer Staples Total | | | 109,548,614 | | |
| Energy – 8.6% | |
| Energy Equipment & Services – 1.7% | |
| Noble Corp. | | | 122,889 | | | | 5,193,289 | | |
| Shinko Plantech Co., Ltd. | | | 323,800 | | | | 3,199,914 | | |
| Transocean Ltd. (a) | | | 189,308 | | | | 15,110,565 | | |
| Energy Equipment & Services Total | | | 23,503,768 | | |
| Oil, Gas & Consumable Fuels – 6.9% | |
| AWE Ltd. (a) | | | 2,105,717 | | | | 4,755,603 | | |
| BP PLC | | | 1,954,131 | | | | 17,243,279 | | |
| CNOOC Ltd. | | | 4,855,089 | | | | 7,618,377 | | |
See Accompanying Notes to Financial Statements.
39
Columbia Multi-Advisor International Equity Fund
February 28, 2010
| Common Stocks (continued) | |
| | | Shares | | Value ($) | |
| ENI SpA | | | 352,467 | | | | 7,952,552 | | |
OGX Petroleo e Gas
Participacoes SA | | | 1,265,100 | | | | 11,025,828 | | |
Reliance Industries
Ltd., GDR (c) | | | 177,100 | | | | 7,509,040 | | |
| Repsol YPF SA | | | 143,039 | | | | 3,239,984 | | |
Royal Dutch Shell PLC,
Class B | | | 620,584 | | | | 16,242,657 | | |
| Total SA | | | 317,512 | | | | 17,717,305 | | |
Yanzhou Coal Mining Co.,
Ltd., Class H | | | 2,006,000 | | | | 4,258,985 | | |
| Oil, Gas & Consumable Fuels Total | | | 97,563,610 | | |
| Energy Total | | | 121,067,378 | | |
| Financials – 25.0% | |
| Capital Markets – 3.1% | |
Credit Suisse Group AG,
Registered Shares | | | 508,362 | | | | 22,572,834 | | |
| Daiwa Securities Group, Inc. | | | 1,521,000 | | | | 7,515,550 | | |
Intermediate Capital
Group PLC | | | 1,242,237 | | | | 4,591,449 | | |
| Julius Baer Group Ltd. | | | 129,950 | | | | 4,042,754 | | |
Tokai Tokyo
Financial Holdings | | | 1,434,000 | | | | 5,520,041 | | |
| Capital Markets Total | | | 44,242,628 | | |
| Commercial Banks – 14.2% | |
Australia & New Zealand
Banking Group Ltd. | | | 485,388 | | | | 10,066,013 | | |
Banco Bilbao Vizcaya
Argentaria SA | | | 1,199,504 | | | | 15,598,062 | | |
| Banco Santander SA | | | 1,619,022 | | | | 21,051,168 | | |
Bangkok Bank PCL, Foreign
Registered Shares | | | 1,055,600 | | | | 3,719,262 | | |
| Bank of China Ltd., Class H | | | 6,935,000 | | | | 3,359,327 | | |
Governor & Co. of the Bank
of Ireland (a) | | | 1,168,116 | | | | 1,590,565 | | |
| Barclays PLC | | | 2,486,459 | | | | 11,847,972 | | |
| BNP Paribas | | | 206,597 | | | | 14,946,152 | | |
Commonwealth Bank
of Australia | | | 122,751 | | | | 5,931,711 | | |
| DBS Group Holdings Ltd. | | | 896,000 | | | | 8,923,668 | | |
| HSBC Holdings PLC | | | 2,042,696 | | | | 22,413,392 | | |
HSBC Holdings PLC
(Hong Kong Registered Shares) | | | 1,922,436 | | | | 21,262,296 | | |
| ICICI Bank Ltd., ADR | | | 361,970 | | | | 13,845,352 | | |
| Mizuho Financial Group, Inc. | | | 3,847,700 | | | | 7,448,977 | | |
| National Australia Bank Ltd. | | | 151,818 | | | | 3,461,350 | | |
| National Bank of Greece SA (a) | | | 247,382 | | | | 4,614,814 | | |
| | | Shares | | Value ($) | |
| National Bank of Pakistan | | | 3,284,743 | | | | 3,416,133 | | |
| Standard Chartered PLC | | | 309,739 | | | | 7,377,167 | | |
Sumitomo Mitsui Financial
Group, Inc. | | | 172,700 | | | | 5,551,592 | | |
Svenska Handelsbanken AB,
Class A | | | 112,192 | | | | 3,060,583 | | |
| Toronto-Dominion Bank | | | 150,113 | | | | 9,592,851 | | |
| Commercial Banks Total | | | 199,078,407 | | |
| Consumer Finance – 0.3% | |
| Hitachi Capital Corp. | | | 308,100 | | | | 4,241,165 | | |
| Consumer Finance Total | | | 4,241,165 | | |
| Diversified Financial Services – 0.5% | |
| ING Groep NV (a) | | | 764,657 | | | | 6,835,448 | | |
| Diversified Financial Services Total | | | 6,835,448 | | |
| Insurance – 3.4% | |
| Allianz SE, Registered Shares | | | 28,848 | | | | 3,331,019 | | |
Baloise Holding AG,
Registered Shares | | | 83,119 | | | | 7,149,356 | | |
| Brit Insurance Holdings NV | | | 435,113 | | | | 5,102,376 | | |
| Lincoln National Corp. | | | 120,997 | | | | 3,046,704 | | |
Muenchener
Rueckversicherungs-
Gesellschaft AG,
Registered Shares | | | 51,766 | | | | 8,010,869 | | |
| Sampo Oyj, Class A | | | 219,262 | | | | 5,314,335 | | |
| XL Capital Ltd., Class A | | | 223,210 | | | | 4,078,047 | | |
Zurich Financial Services AG,
Registered Shares | | | 47,882 | | | | 11,544,275 | | |
| Insurance Total | | | 47,576,981 | | |
| Real Estate Investment Trusts (REITs) – 0.8% | |
Japan Retail Fund
Investment Corp. | | | 5,768 | | | | 6,842,784 | | |
| Wereldhave NV | | | 46,284 | | | | 4,167,686 | | |
| Real Estate Investment Trusts (REITs) Total | | | 11,010,470 | | |
| Real Estate Management & Development – 2.7% | |
| CapitaLand Ltd. | | | 4,685,500 | | | | 12,599,552 | | |
| Cheung Kong Holdings Ltd. | | | 925,300 | | | | 11,312,712 | | |
| Hang Lung Properties Ltd. | | | 1,157,000 | | | | 4,441,888 | | |
| Hongkong Land Holdings Ltd. | | | 1,102,000 | | | | 5,069,200 | | |
Sinolink Worldwide
Holdings Ltd. | | | 25,934,000 | | | | 4,343,410 | | |
Real Estate Management &
Development Total | | | 37,766,762 | | |
| Financials Total | | | 350,751,861 | | |
See Accompanying Notes to Financial Statements.
40
Columbia Multi-Advisor International Equity Fund
February 28, 2010
| Common Stocks (continued) | |
| | | Shares | | Value ($) | |
| Health Care – 7.8% | |
| Biotechnology – 0.9% | |
Actelion Ltd., Registered
Shares (a) | | | 71,531 | | | | 3,645,634 | | |
| CSL Ltd. | | | 285,776 | | | | 8,807,710 | | |
| Biotechnology Total | | | 12,453,344 | | |
| Health Care Equipment & Supplies – 0.8% | |
| Covidien PLC | | | 240,500 | | | | 11,813,360 | | |
| Health Care Equipment & Supplies Total | | | 11,813,360 | | |
| Health Care Providers & Services – 0.4% | |
| Miraca Holdings, Inc. | | | 178,100 | | | | 5,392,414 | | |
| Health Care Providers & Services Total | | | 5,392,414 | | |
| Life Sciences Tools & Services – 0.5% | |
Lonza Group AG,
Registered Shares | | | 94,616 | | | | 7,451,258 | | |
| Life Sciences Tools & Services Total | | | 7,451,258 | | |
| Pharmaceuticals – 5.2% | |
| Astellas Pharma, Inc. | | | 87,100 | | | | 3,279,301 | | |
| AstraZeneca PLC | | | 108,346 | | | | 4,763,712 | | |
| Novartis AG, Registered Shares | | | 200,791 | | | | 11,168,036 | | |
| Novo-Nordisk A/S, Class B | | | 212,639 | | | | 15,017,318 | | |
| Sanofi-Aventis SA | | | 209,130 | | | | 15,297,410 | | |
| Santen Pharmaceutical Co., Ltd. | | | 147,700 | | | | 4,746,283 | | |
Teva Pharmaceutical
Industries Ltd., ADR | | | 311,417 | | | | 18,688,134 | | |
| Pharmaceuticals Total | | | 72,960,194 | | |
| Health Care Total | | | 110,070,570 | | |
| Industrials – 9.7% | |
| Aerospace & Defense – 0.3% | |
| BAE Systems PLC | | | 814,711 | | | | 4,649,819 | | |
| Aerospace & Defense Total | | | 4,649,819 | | |
| Airlines – 0.2% | |
| Turk Hava Yollari A.O. | | | 920,174 | | | | 2,915,521 | | |
| Airlines Total | | | 2,915,521 | | |
| Building Products – 0.3% | |
| Daikin Industries Ltd. | | | 105,488 | | | | 4,060,656 | | |
| Building Products Total | | | 4,060,656 | | |
| Commercial Services & Supplies – 0.1% | |
| Aeon Delight Co., Ltd. | | | 141,200 | | | | 1,932,570 | | |
| Commercial Services & Supplies Total | | | 1,932,570 | | |
| | | Shares | | Value ($) | |
| Construction & Engineering – 1.4% | |
| COMSYS Holdings Corp. | | | 232,600 | | | | 2,233,190 | | |
| JGC Corp. | | | 192,000 | | | | 3,608,982 | | |
| Maire Tecnimont SpA | | | 1,266,828 | | | | 3,932,947 | | |
| Monadelphous Group Ltd. | | | 203,417 | | | | 2,590,517 | | |
| Toyo Engineering Corp. | | | 836,000 | | | | 2,804,074 | | |
| Vinci SA | | | 77,210 | | | | 4,042,364 | | |
| Construction & Engineering Total | | | 19,212,074 | | |
| Electrical Equipment – 2.9% | |
| ABB Ltd., Registered Shares (a) | | | 404,328 | | | | 8,178,774 | | |
| Alstom SA | | | 175,242 | | | | 11,213,867 | | |
| Schneider Electric SA | | | 196,905 | | | | 21,028,317 | | |
| Electrical Equipment Total | | | 40,420,958 | | |
| Industrial Conglomerates – 0.8% | |
| DCC PLC | | | 147,145 | | | | 3,856,930 | | |
| Siemens AG, Registered Shares | | | 51,201 | | | | 4,391,528 | | |
| Tyco International Ltd. | | | 98,479 | | | | 3,551,153 | | |
| Industrial Conglomerates Total | | | 11,799,611 | | |
| Machinery – 0.2% | |
| Demag Cranes AG | | | 98,194 | | | | 3,235,682 | | |
| Machinery Total | | | 3,235,682 | | |
| Professional Services – 0.6% | |
| Atkins WS PLC | | | 578,069 | | | | 5,081,497 | | |
| Teleperformance | | | 111,866 | | | | 3,565,867 | | |
| Professional Services Total | | | 8,647,364 | | |
| Road & Rail – 0.7% | |
| Canadian National Railway Co. | | | 179,986 | | | | 9,478,063 | | |
| Road & Rail Total | | | 9,478,063 | | |
| Trading Companies & Distributors – 2.2% | |
| ITOCHU Corp. | | | 347,000 | | | | 2,796,466 | | |
| Marubeni Corp. | | | 2,535,000 | | | | 15,150,937 | | |
| Mitsui & Co., Ltd. | | | 527,800 | | | | 8,192,202 | | |
| Noble Group Ltd. | | | 1,883,000 | | | | 4,246,361 | | |
| Trading Companies & Distributors Total | | | 30,385,966 | | |
| Industrials Total | | | 136,738,284 | | |
| Information Technology – 7.4% | |
| Communications Equipment – 1.3% | |
| Research In Motion Ltd. (a) | | | 261,895 | | | | 18,563,118 | | |
| Communications Equipment Total | | | 18,563,118 | | |
See Accompanying Notes to Financial Statements.
41
Columbia Multi-Advisor International Equity Fund
February 28, 2010
| Common Stocks (continued) | |
| | | Shares | | Value ($) | |
| Electronic Equipment, Instruments & Components – 1.0% | |
| FUJIFILM Holdings Corp. | | | 118,700 | | | | 3,775,634 | | |
HON HAI Precision Industry
Co., Ltd. | | | 1,768,337 | | | | 7,002,223 | | |
| Venture Corp., Ltd. | | | 630,000 | | | | 3,782,599 | | |
Electronic Equipment, Instruments &
Components Total | | | 14,560,456 | | |
| Internet Software & Services – 0.6% | |
| Baidu, Inc., ADR (a) | | | 7,614 | | | | 3,949,229 | | |
| Tencent Holdings Ltd. | | | 202,800 | | | | 3,963,433 | | |
| Internet Software & Services Total | | | 7,912,662 | | |
| IT Services – 0.5% | |
| Cap Gemini SA | | | 95,948 | | | | 4,420,462 | | |
| Redecard SA | | | 126,500 | | | | 1,840,993 | | |
| IT Services Total | | | 6,261,455 | | |
| Office Electronics – 1.2% | |
| Canon, Inc. | | | 387,500 | | | | 16,115,848 | | |
| Office Electronics Total | | | 16,115,848 | | |
| Semiconductors & Semiconductor Equipment – 1.0% | |
| Infineon Technologies AG (a) | | | 1,339,642 | | | | 7,309,264 | | |
| Sumco Corp. (a) | | | 241,800 | | | | 4,384,488 | | |
United Microelectronics
Corp., ADR (a) | | | 868,942 | | | | 2,980,471 | | |
Semiconductors & Semiconductor
Equipment Total | | | 14,674,223 | | |
| Software – 1.8% | |
| Autonomy Corp. PLC (a) | | | 399,781 | | | | 9,326,663 | | |
Longtop Financial
Technologies Ltd., ADR (a) | | | 158,602 | | | | 5,265,586 | | |
| Nintendo Co., Ltd. | | | 30,500 | | | | 8,297,428 | | |
| NSD Co., Ltd. | | | 235,900 | | | | 2,657,841 | | |
| Software Total | | | 25,547,518 | | |
| Information Technology Total | | | 103,635,280 | | |
| Materials – 7.4% | |
| Chemicals – 4.9% | |
| Akzo Nobel NV | | | 147,068 | | | | 7,478,530 | | |
| BASF SE | | | 459,302 | | | | 25,791,853 | | |
Clariant AG, Registered
Shares (a) | | | 330,915 | | | | 3,585,619 | | |
| Kansai Paint Co., Ltd. | | | 808,000 | | | | 6,548,033 | | |
Makhteshim-Agan
Industries Ltd. | | | 1,009,677 | | | | 5,170,256 | | |
| Novozymes A/S, Class B | | | 44,911 | | | | 4,609,754 | | |
| | | Shares | | Value ($) | |
| Syngenta AG, Registered Shares | | | 57,847 | | | | 14,969,947 | | |
| Chemicals Total | | | 68,153,992 | | |
| Metals & Mining – 2.2% | |
| BlueScope Steel Ltd. | | | 1,042,910 | | | | 2,261,868 | | |
| Eastern Platinum Ltd. (a) | | | 2,199,300 | | | | 2,738,152 | | |
| First Quantum Minerals Ltd. | | | 38,928 | | | | 3,033,735 | | |
| ThyssenKrupp AG | | | 233,981 | | | | 7,407,456 | | |
| Vale SA, ADR | | | 446,100 | | | | 12,428,346 | | |
| Yamato Kogyo Co., Ltd. | | | 82,400 | | | | 2,603,374 | | |
| Metals & Mining Total | | | 30,472,931 | | |
| Paper & Forest Products – 0.3% | |
| Svenska Cellulosa AB, Class B | | | 326,991 | | | | 4,833,916 | | |
| Paper & Forest Products Total | | | 4,833,916 | | |
| Materials Total | | | 103,460,839 | | |
| Telecommunication Services – 5.1% | |
| Diversified Telecommunication Services – 3.9% | |
| BCE, Inc. | | | 212,400 | | | | 5,894,393 | | |
| France Telecom SA | | | 114,391 | | | | 2,682,975 | | |
Nippon Telegraph &
Telephone Corp. | | | 188,400 | | | | 8,206,517 | | |
| Tele2 AB, Class B | | | 378,484 | | | | 5,626,989 | | |
| Telefonica SA | | | 1,131,944 | | | | 26,579,922 | | |
| Telenor ASA (a) | | | 388,900 | | | | 4,916,203 | | |
| Diversified Telecommunication Services Total | | | 53,906,999 | | |
| Wireless Telecommunication Services – 1.2% | |
| Softbank Corp. | | | 207,700 | | | | 5,440,012 | | |
| Vodafone Group PLC | | | 5,448,492 | | | | 11,751,464 | | |
| Wireless Telecommunication Services Total | | | 17,191,476 | | |
| Telecommunication Services Total | | | 71,098,475 | | |
| Utilities – 4.1% | |
| Electric Utilities – 1.9% | |
| E.ON AG | | | 141,827 | | | | 5,051,021 | | |
| Enel SpA | | | 1,684,764 | | | | 9,136,091 | | |
| Fortum Oyj | | | 266,729 | | | | 6,795,315 | | |
Okinawa Electric
Power Co., Inc. | | | 95,200 | | | | 5,261,208 | | |
| Electric Utilities Total | | | 26,243,635 | | |
| Independent Power Producers & Energy Traders – 0.6% | |
| Drax Group PLC | | | 794,689 | | | | 4,845,754 | | |
| Energy Development Corp. | | | 31,183,000 | | | | 3,245,060 | | |
Independent Power Producers &
Energy Traders Total | | | 8,090,814 | | |
See Accompanying Notes to Financial Statements.
42
Columbia Multi-Advisor International Equity Fund
February 28, 2010
| Common Stocks (continued) | |
| | | Shares | | Value ($) | |
| Multi-Utilities – 1.2% | |
| AGL Energy Ltd. | | | 484,647 | | | | 6,241,477 | | |
| RWE AG | | | 135,237 | | | | 11,468,581 | | |
| Multi-Utilities Total | | | 17,710,058 | | |
| Water Utilities – 0.4% | |
Cia de Saneamento Basico do
Estado de Sao Paulo | | | 164,200 | | | | 2,757,640 | | |
| Guangdong Investment Ltd. | | | 5,252,000 | | | | 2,638,805 | | |
| Water Utilities Total | | | 5,396,445 | | |
| Utilities Total | | | 57,440,952 | | |
Total Common Stocks
(cost of $1,172,793,601) | | | 1,342,658,109 | | |
| Preferred Stock – 0.3% | |
| Health Care – 0.3% | |
| Health Care Equipment & Supplies – 0.3% | |
| Fresenius SE | | | 54,799 | | | | 3,853,971 | | |
| Health Care Equipment & Supplies Total | | | 3,853,971 | | |
| Health Care Total | | | 3,853,971 | | |
Total Preferred Stock
(cost of $3,937,118) | | | 3,853,971 | | |
| Investment Company – 0.8% | |
| iShares MSCI EAFE Index Fund | | | 217,733 | | | | 11,457,110 | | |
Total Investment Company
(cost of $11,556,849) | | | 11,457,110 | | |
| Short-Term Obligation – 1.6% | |
| | | Par ($) | | | |
Repurchase agreement with
Fixed Income Clearing Corp.,
dated 02/26/10, due 03/01/10
at 0.050%, collateralized by
U.S. Government Agency obligations
maturing 06/15/12, market value
$22,685,117 (repurchase
proceeds $22,235,093) | | | 22,235,000 | | | | 22,235,000 | | |
Total Short-Term Obligation
(cost of $22,235,000) | | | 22,235,000 | | |
Total Investments – 98.4%
(cost of $1,210,522,568) (d) | | | 1,380,204,190 | | |
| Other Assets & Liabilities, Net – 1.6% | | | 22,784,271 | | |
| Net Assets – 100.0% | | | 1,402,988,461 | | |
Notes to Investment Portfolio:
(a) Non-income producing security.
(b) All or a portion of this security is pledged as collateral for open written options contracts.
(c) Security exempt from registration pursuant to Rule 144A under the Securities Act of 1933. This security may be resold in transactions exempt from registration, normally on a foreign exchange or to qualified institutional buyers. At February 28, 2010, this security, which is not illiquid, amounted to $7,509,040 which represents 0.5% of net assets.
(d) Cost for federal income tax purposes is $1,246,876,100.
The following table summarizes the inputs used, as of February 28, 2010, in valuing the Fund's assets:
| Description | | Quoted Prices
(Level 1) | | Other
Significant
Observable
Inputs
(Level 2) | | Significant
Unobservable
Inputs
(Level 3) | | Total | |
| Common Stocks | |
Consumer
Discretionary | | $ | 40,249,761 | | | $ | 138,596,095 | | | $ | — | | | $ | 178,845,856 | | |
| Consumer Staples | | | 4,753,666 | | | | 104,794,948 | | | | — | | | | 109,548,614 | | |
| Energy | | | 38,838,722 | | | | 82,228,656 | | | | — | | | | 121,067,378 | | |
| Financials | | | 35,632,154 | | | | 315,119,707 | | | | — | | | | 350,751,861 | | |
| Health Care | | | 30,501,494 | | | | 79,569,076 | | | | — | | | | 110,070,570 | | |
| Industrials | | | 13,029,216 | | | | 123,709,068 | | | | — | | | | 136,738,284 | | |
Information
Technology | | | 32,599,397 | | | | 71,035,883 | | | | — | | | | 103,635,280 | | |
| Materials | | | 18,200,233 | | | | 85,260,606 | | | | — | | | | 103,460,839 | | |
Telecommunication
Services | | | 5,894,393 | | | | 65,204,082 | | | | — | | | | 71,098,475 | | |
| Utilities | | | 2,757,640 | | | | 54,683,312 | | | | — | | | | 57,440,952 | | |
Total Common
Stocks | | | 222,456,676 | | | | 1,120,201,433 | | | | — | | | | 1,342,658,109 | | |
Total Preferred
Stock | | | — | | | | 3,853,971 | | | | — | | | | 3,853,971 | | |
Total Investment
Company | | | 11,457,110 | | | | — | | | | — | | | | 11,457,110 | | |
Total Short-Term
Obligation | | | — | | | | 22,235,000 | | | | — | | | | 22,235,000 | | |
| Total Investments | | | 233,913,786 | | | | 1,146,290,404 | | | | — | | | | 1,380,204,190 | | |
Total Written Call
Options | | | (16,686 | ) | | | — | | | | — | | | | (16,686 | ) | |
Unrealized
Depreciation on
Forward Foreign
Currency Exchange
Contracts | | | — | | | | (3,924,566 | ) | | | — | | | | (3,924,566 | ) | |
| Total | | $ | 233,897,100 | | | $ | 1,142,365,838 | | | $ | — | | | $ | 1,376,262,938 | | |
The Fund's assets assigned to the Level 2 input category include certain foreign securities for which a third party statistical pricing service may be employed for purposes of fair market valuation.
See Accompanying Notes to Financial Statements.
43
Columbia Multi-Advisor International Equity Fund
February 28, 2010
The following table reconciles asset balances for the year ending February 28, 2010, in which significant unobservable inputs (Level 3) were used in determining value:
Investments
in Securities | | Balance as of
February 28,
2009 | | Realized
Gain/(Loss) | | Change in
Unrealized
Appreciation
(Depreciation) | | Net
Purchases
(Sales) | | Net Transfers into
(out of) Level 3 | | Balance as of
February 28,
2010 | |
Rights
Industrials | | $ | 419,147 | | | $ | — | | | $ | 116,985 | | | $ | — | | | $ | (536,132 | ) | | $ | — | | |
The information in the above reconciliation represents fiscal year to date activity for any securities identified as using Level 3 inputs at either the beginning or the end of the current fiscal period.
For more information on valuation inputs, and their aggregation into the levels used in the tables above, please refer to the Security Valuation section in the accompanying Notes to Financial Statements.
At February 28, 2010, the Fund had the following written call option contracts:
Equity Risk
| Name of Issuer | | Strike
Price | | Number of
Contracts | | Expiration
Date | | Premium | | Value | |
Polo Ralph
Lauren Corp. | | $ | 85.0 | | | | 618 | | | | 03/20/10 | | | $ | 39,551 | | | $ | (16,686 | ) | |
| Total written call options (proceeds $39,551) | | $ | (16,686 | ) | |
For the year ended February 28, 2010, transactions in written call option contracts were as follows:
| | | Number of
contracts | | Premium
received | |
| Options outstanding at February 28, 2009 | | | — | | | | — | | |
| Options written | | | 3,708 | | | $ | 211,284 | | |
Options terminated in closing
purchase transactions | | | (2,472 | ) | | | (111,170 | ) | |
| Options exercised | | | — | | | | — | | |
| Options expired | | | (618 | ) | | | (60,563 | ) | |
| Options outstanding at February 28, 2010 | | | 618 | | | $ | 39,551 | | |
Forward foreign currency exchange contracts outstanding on February 28, 2010 are:
Foreign Exchange Rate Risk
Forward
Foreign
Currency
Exchange
Contracts
to Buy | |
Value | |
Aggregate
Face Value | |
Settlement
Date | |
Unrealized
Appreciation
(Depreciation) | |
| AUD | | | | $ | 21,324,967 | | | $ | 21,280,489 | | | 03/11/10 | | $ | 44,478 | | |
| EUR | | | | | 40,056,496 | | | | 42,755,092 | | | 03/11/10 | | | (2,698,596 | ) | |
| EUR | | | | | 1,970,282 | | | | 2,072,249 | | | 03/11/10 | | | (101,967 | ) | |
| EUR | | | | | 1,315,337 | | | | 1,399,387 | | | 03/11/10 | | | (84,050 | ) | |
| EUR | | | | | 4,742,565 | | | | 4,900,713 | | | 03/11/10 | | | (158,148 | ) | |
| EUR | | | | | 2,562,591 | | | | 2,543,835 | | | 03/11/10 | | | 18,756 | | |
| GBP | | | | | 20,043,761 | | | | 21,470,573 | | | 03/11/10 | | | (1,426,812 | ) | |
| GBP | | | | | 1,573,495 | | | | 1,637,331 | | | 03/11/10 | | | (63,836 | ) | |
| JPY | | | | | 7,180,288 | | | | 7,107,938 | | | 03/11/10 | | | 72,350 | | |
| NOK | | | | | 1,339,218 | | | | 1,380,110 | | | 03/11/10 | | | (40,892 | ) | |
| | | | | | | | | | | | | | | $ | (4,438,717 | ) | |
Forward
Foreign
Currency
Exchange
Contracts
to Sell | |
Value | |
Aggregate
Face Value | |
Settlement
Date | |
Unrealized
Appreciation
(Depreciation) | |
| AUD | | | | $ | 1,390,506 | | | $ | 1,405,833 | | | 03/11/10 | | $ | 15,327 | | |
| CAD | | | | | 14,376,324 | | | | 14,252,334 | | | 03/11/10 | | | (123,990 | ) | |
| CAD | | | | | 2,095,577 | | | | 2,102,884 | | | 03/11/10 | | | 7,307 | | |
| CHF | | | | | 13,789,914 | | | | 14,274,150 | | | 03/11/10 | | | 484,236 | | |
| EUR | | | | | 5,138,800 | | | | 5,271,746 | | | 03/11/10 | | | 132,946 | | |
| GBP | | | | | 2,444,100 | | | | 2,500,848 | | | 03/11/10 | | | 56,748 | | |
| ILS | | | | | 7,134,947 | | | | 7,127,151 | | | 03/11/10 | | | (7,796 | ) | |
| JPY | | | | | 1,440,934 | | | | 1,395,069 | | | 03/11/10 | | | (45,865 | ) | |
| JPY | | | | | 1,680,404 | | | | 1,644,168 | | | 03/11/10 | | | (36,236 | ) | |
| SEK | | | | | 1,383,510 | | | | 1,403,259 | | | 03/11/10 | | | 19,749 | | |
| SGD | | | | | 3,538,842 | | | | 3,559,037 | | | 03/11/10 | | | 20,195 | | |
| THB | | | | | 4,289,313 | | | | 4,257,530 | | | 03/11/10 | | | (31,783 | ) | |
| TWD | | | | | 9,241,936 | | | | 9,265,249 | | | 03/11/10 | | | 23,313 | | |
| | | | | | | | | | | | | | | $ | 514,151 | | |
See Accompanying Notes to Financial Statements.
44
Columbia Multi-Advisor International Equity Fund
February 28, 2010
The Fund was invested in the following countries at February 28, 2010:
Summary of Securities
By Country (Unaudited) | | Value | | % of Total
Investments | |
| Japan | | $ | 226,669,221 | | | | 16.4 | | |
| United Kingdom | | | 174,308,180 | | | | 12.6 | | |
| France | | | 122,835,427 | | | | 8.9 | | |
| Switzerland | | | 109,281,002 | | | | 7.9 | | |
| Germany | | | 107,849,139 | | | | 7.8 | | |
| Spain | | | 83,453,733 | | | | 6.1 | | |
| United States* | | | 81,426,501 | | | | 5.9 | | |
| Brazil | | | 64,224,677 | | | | 4.7 | | |
| Canada | | | 49,300,311 | | | | 3.6 | | |
| Australia | | | 44,116,249 | | | | 3.2 | | |
| China | | | 42,277,514 | | | | 3.1 | | |
| Hong Kong | | | 34,831,517 | | | | 2.5 | | |
| Netherlands | | | 34,127,804 | | | | 2.5 | | |
| Singapore | | | 29,552,180 | | | | 2.1 | | |
| Israel | | | 23,858,391 | | | | 1.7 | | |
| Belgium | | | 22,337,565 | | | | 1.6 | | |
| India | | | 21,354,393 | | | | 1.6 | | |
| Italy | | | 21,021,590 | | | | 1.5 | | |
| Denmark | | | 19,627,072 | | | | 1.4 | | |
| Taiwan | | | 13,846,097 | | | | 1.0 | | |
| Sweden | | | 13,521,487 | | | | 1.0 | | |
| Finland | | | 12,109,650 | | | | 0.9 | | |
| Ireland | | | 5,447,496 | | | | 0.4 | | |
| Norway | | | 4,916,204 | | | | 0.4 | | |
| Greece | | | 4,614,814 | | | | 0.3 | | |
| Thailand | | | 3,719,262 | | | | 0.3 | | |
| Pakistan | | | 3,416,133 | | | | 0.2 | | |
| Philippines | | | 3,245,060 | | | | 0.2 | | |
| Turkey | | | 2,915,521 | | | | 0.2 | | |
| | | $ | 1,380,204,190 | | | | 100.0 | | |
* Includes short-term obligation.
Certain securities are listed by country of underlying exposure but may trade predominantly on another exchange.
| Acronym | | Name | |
| ADR | | American Depositary Receipt | |
|
| AUD | | Australian Dollar | |
|
| CAD | | Canadian Dollar | |
|
| CHF | | Swiss Franc | |
|
| EUR | | Euro | |
|
| GBP | | Pound Sterling | |
|
| GDR | | Global Depositary Receipt | |
|
| ILS | | Israeli Shekel | |
|
| JPY | | Japanese Yen | |
|
| NOK | | Norwegian Krone | |
|
| SEK | | Swedish Krona | |
|
| SGD | | Singapore Dollar | |
|
| THB | | Thailand Baht | |
|
| TWD | | New Taiwan Dollar | |
|
See Accompanying Notes to Financial Statements.
45
Statements of Assets and Liabilities – International/Global Stock Funds
February 28, 2010
| | | ($) | | ($) | | ($) | | ($) | | ($) | |
| | | Columbia
Global
Value
Fund | | Columbia
International
Value
Fund | | Columbia
Marsico
Global
Fund | | Columbia
Marsico
International
Opportunities
Fund | | Columbia
Multi-Advisor
International
Equity
Fund | |
| Assets | |
| Unaffiliated investments, at identified cost | | | 60,402,031 | | | | — | | | | 4,753,796 | | | | 1,016,508,378 | | | | 1,210,522,568 | | |
| Affiliated investments, at identified cost | | | 8,447,887 | | | | — | | | | — | | | | — | | | | — | | |
Investment in Columbia International Value
Master Portfolio, at identified cost | | | — | | | | 2,015,331,886 | | | | — | | | | — | | | | — | | |
| Total investments, at identified cost | | | 68,849,918 | | | | 2,015,331,886 | | | | 4,753,796 | | | | 1,016,508,378 | | | | 1,210,522,568 | | |
| Unaffiliated investments, at value | | | 52,977,627 | | | | — | | | | 5,598,338 | | | | 1,159,754,454 | | | | 1,380,204,190 | | |
| Affiliated investments, at value | | | 1,191,590 | | | | — | | | | — | | | | — | | | | — | | |
Investment in Columbia International Value
Master Portfolio, at value | | | — | | | | 1,638,707,783 | | | | — | | | | — | | | | — | | |
| Total investments, at value | | | 54,169,217 | | | | 1,638,707,783 | | | | 5,598,338 | | | | 1,159,754,454 | | | | 1,380,204,190 | | |
| Cash | | | 902 | | | | — | | | | 765 | | | | 676 | | | | 505 | | |
Foreign currency (cost of $—, $—, $—,
$40,829 and $457,315, respectively) | | | — | | | | — | | | | — | | | | 40,833 | | | | 459,881 | | |
Unrealized appreciation on forward foreign
currency exchange contracts | | | — | | | | — | | | | — | | | | — | | | | 895,405 | | |
| Receivable for: | |
| Investments sold | | | — | | | | — | | | | 43,791 | | | | 56,356,586 | | | | 35,306,582 | | |
| Fund shares sold | | | — | | | | 4,598,528 | | | | 8,395 | | | | 2,067,437 | | | | 4,602,658 | | |
| Dividends | | | 139,419 | | | | — | | | | 2,236 | | | | 790,608 | | | | 1,795,993 | | |
| Interest | | | 2 | | | | — | | | | — | | | | 104 | | | | 133 | | |
| Foreign tax reclaims | | | — | | | | — | | | | 3,837 | | | | 2,950,570 | | | | 635,186 | | |
Expense reimbursement due from
investment advisor | | | 9,919 | | | | — | | | | 11,192 | | | | — | | | | — | | |
| Prepaid expenses | | | 723 | | | | — | | | | 59 | | | | 15,091 | | | | 17,393 | | |
| Total Assets | | | 54,320,182 | | | | 1,643,306,311 | | | | 5,668,613 | | | | 1,221,976,359 | | | | 1,423,917,926 | | |
| Liabilities | |
Written options, at value (premium of $—,
$—, $—, $— and $39,551, respectively) | | | — | | | | — | | | | — | | | | — | | | | 16,686 | | |
Unrealized depreciation on forward foreign
currency exchange contracts | | | — | | | | — | | | | — | | | | — | | | | 4,819,971 | | |
| Payable for: | |
| Investments purchased | | | — | | | | — | | | | — | | | | 15,089,382 | | | | 13,124,944 | | |
| Fund shares repurchased | | | 228,245 | | | | 1,740,555 | | | | 32,074 | | | | 2,087,427 | | | | 1,450,516 | | |
| Foreign capital gains taxes withheld | | | — | | | | — | | | | — | | | | — | | | | 64,112 | | |
| Investment advisory fee | | | 38,582 | | | | — | | | | 3,302 | | | | 742,097 | | | | 698,435 | | |
| Administration fee | | | 3,551 | | | | 210,981 | | | | — | | | | 192,468 | | | | 170,206 | | |
| Pricing and bookkeeping fees | | | 5,660 | | | | 3,167 | | | | 2,743 | | | | 13,507 | | | | 13,968 | | |
| Transfer agent fee | | | 20,464 | | | | 346,685 | | | | 2,413 | | | | 414,158 | | | | 294,145 | | |
| Trustees' fees | | | 41,379 | | | | 23,679 | | | | 11,217 | | | | 45,018 | | | | 78,598 | | |
| Audit fee | | | 45,950 | | | | 18,260 | | | | 35,000 | | | | 40,623 | | | | 36,723 | | |
| Custody fee | | | 4,109 | | | | 530 | | | | 4,668 | | | | 102,966 | | | | 113,009 | | |
| Distribution and service fees | | | 26,482 | | | | 128,912 | | | | 1,803 | | | | 82,676 | | | | 6,955 | | |
| Chief compliance officer expenses | | | 118 | | | | 206 | | | | 104 | | | | 209 | | | | 218 | | |
| Interest payable | | | — | | | | — | | | | — | | | | — | | | | 39 | | |
| Other liabilities | | | 26,995 | | | | 53,447 | | | | 38,800 | | | | 193,460 | | | | 40,940 | | |
| Total Liabilities | | | 441,535 | | | | 2,526,422 | | | | 132,124 | | | | 19,003,991 | | | | 20,929,465 | | |
| Net Assets | | | 53,878,647 | | | | 1,640,779,889 | | | | 5,536,489 | | | | 1,202,972,368 | | | | 1,402,988,461 | | |
See Accompanying Notes to Financial Statements.
46
Statements of Assets and Liabilities (continued) – International/Global Stock Funds
February 28, 2010
| | | ($) | | ($) | | ($) | | ($) | | ($) | |
| | | Columbia
Global
Value
Fund | | Columbia
International
Value
Fund | | Columbia
Marsico
Global
Fund | | Columbia
Marsico
International
Opportunities
Fund | | Columbia
Multi-Advisor
International
Equity
Fund | |
| Net Assets Consist of | |
| Paid-in capital | | | 140,810,101 | | | | 2,202,943,526 | | | | 6,717,785 | | | | 1,950,633,456 | | | | 1,933,384,639 | | |
Undistributed (overdistributed) net
investment income | | | 682,456 | | | | 13,350,907 | | | | — | | | | (3,524,958 | ) | | | (6,317,871 | ) | |
| Accumulated net investment loss | | | — | | | | — | | | | (26,339 | ) | | | — | | | | — | | |
| Accumulated net realized loss | | | (72,932,723 | ) | | | (198,890,441 | ) | | | (1,999,652 | ) | | | (887,320,939 | ) | | | (689,810,772 | ) | |
| Net unrealized appreciation (depreciation) on: | |
| Investments | | | (14,680,701 | ) | | | (376,624,103 | ) | | | 844,542 | | | | 143,246,076 | | | | 169,681,622 | | |
| Foreign currency translations | | | (486 | ) | | | — | | | | 153 | | | | (61,267 | ) | | | (3,907,910 | ) | |
| Foreign capital gains tax | | | — | | | | — | | | | — | | | | — | | | | (64,112 | ) | |
| Written options | | | — | | | | — | | | | — | | | | — | | | | 22,865 | | |
| Net Assets | | | 53,878,647 | | | | 1,640,779,889 | | | | 5,536,489 | | | | 1,202,972,368 | | | | 1,402,988,461 | | |
| Class A | |
| Net assets | | $ | 15,640,918 | | | $ | 380,578,107 | | | $ | 1,990,037 | | | $ | 168,800,724 | | | $ | 24,243,219 | | |
| Shares outstanding | | | 2,671,771 | | | | 28,224,101 | | | | 253,348 | | | | 16,883,134 | | | | 2,269,339 | | |
| Net asset value per share (a)(b) | | $ | 5.85 | | | $ | 13.48 | | | $ | 7.85 | | | $ | 10.00 | | | $ | 10.68 | | |
| Maximum sales charge | | | 5.75 | % | | | 5.75 | % | | | 5.75 | % | | | 5.75 | % | | | 5.75 | % | |
| Maximum offering price per share (c) | | $ | 6.21 | | | $ | 14.30 | | | $ | 8.33 | | | $ | 10.61 | | | $ | 11.33 | | |
| Class B | |
| Net assets | | $ | 6,276,906 | | | $ | 8,476,206 | | | | — | | | $ | 17,810,168 | | | $ | 1,190,129 | | |
| Shares outstanding | | | 1,115,996 | | | | 651,211 | | | | — | | | | 1,873,681 | | | | 122,047 | | |
Net asset value and offering
price per share (a)(b) | | $ | 5.62 | | | $ | 13.02 | | | | — | | | $ | 9.51 | | | $ | 9.75 | | |
| Class C | |
| Net assets | | $ | 19,665,314 | | | $ | 63,913,975 | | | $ | 1,425,988 | | | $ | 44,465,610 | | | $ | 1,727,848 | | |
| Shares outstanding | | | 3,495,884 | | | | 4,919,043 | | | | 183,355 | | | | 4,674,018 | | | | 179,399 | | |
Net asset value and offering
price per share (a)(b) | | $ | 5.63 | | | $ | 12.99 | | | $ | 7.78 | | | $ | 9.51 | | | $ | 9.63 | | |
| Class R | |
| Net assets | | | — | | | | — | | | $ | 984,155 | | | $ | 3,326,661 | | | $ | 289,013 | | |
| Shares outstanding | | | — | | | | — | | | | 125,654 | | | | 333,115 | | | | 27,060 | | |
Net asset value and offering
price per share (b) | | | — | | | | — | | | $ | 7.83 | | | $ | 9.99 | | | $ | 10.68 | | |
| Class Z | |
| Net assets | | $ | 12,295,509 | | | $ | 1,187,811,601 | | | $ | 1,136,309 | | | $ | 968,569,205 | | | $ | 1,375,538,252 | | |
| Shares outstanding | | | 2,082,215 | | | | 87,241,118 | | | | 144,259 | | | | 95,423,191 | | | | 127,215,145 | | |
Net asset value and offering
price per share (b) | | $ | 5.91 | | | $ | 13.62 | | | $ | 7.88 | | | $ | 10.15 | | | $ | 10.81 | | |
(a) Redemption price per share is equal to net asset value less any applicable contingent deferred sales charge.
(b) Redemption price per share is equal to net asset value less any applicable redemption fees.
(c) On sales of $50,000 or more the offering price is reduced.
See Accompanying Notes to Financial Statements.
47
Statements of Operations – International/Global Stock Funds
For the Year Ended February 28, 2010
| | | ($) | | ($) | | ($) | | ($) | | ($) | |
| | | Columbia
Global
Value
Fund | | Columbia
International
Value
Fund | | Columbia
Marsico
Global
Fund | | Columbia
Marsico
International
Opportunities
Fund | | Columbia
Multi-Advisor
International
Equity
Fund | |
| Investment Income | |
| Dividends | | | 2,195,066 | | | | — | | | | 60,424 | | | | 27,047,055 | | | | 41,837,251 | | |
| Dividends from affiliates | | | 2,861 | | | | — | | | | — | | | | — | | | | — | | |
| Interest | | | 1,306 | | | | — | | | | 135 | | | | 49,351 | | | | 40,281 | | |
| Foreign taxes withheld | | | (202,336 | ) | | | — | | | | (4,524 | ) | | | (2,686,990 | ) | | | (3,894,701 | ) | |
| Allocated from Master Portfolio: | |
| Dividends | | | — | | | | 65,952,980 | | | | — | | | | — | | | | — | | |
| Interest | | | — | | | | 18,858 | | | | — | | | | — | | | | — | | |
| Foreign taxes withheld | | | — | | | | (6,475,552 | ) | | | — | | | | — | | | | — | | |
| Expenses (a) | | | — | | | | (13,078,201 | ) | | | — | | | | — | | | | — | | |
| Total Investment Income | | | 1,996,897 | | | | 46,418,085 | | | | 56,035 | | | | 24,409,416 | | | | 37,982,831 | | |
| Expenses | |
| Investment advisory fee | | | 600,279 | | | | — | | | | 37,247 | | | | 10,350,691 | | | | 9,501,068 | | |
| Administration fee | | | 65,422 | | | | 2,523,528 | | | | — | | | | 2,706,440 | | | | 2,340,535 | | |
| Distribution fee: | |
| Class B | | | 60,336 | | | | 117,908 | | | | — | | | | 141,837 | | | | 9,896 | | |
| Class C | | | 175,288 | | | | 471,362 | | | | 8,834 | | | | 353,171 | | | | 13,300 | | |
| Class R | | | — | | | | — | | | | 4,318 | | | | 15,664 | | | | 992 | | |
| Service fee: | |
| Class B | | | 20,112 | | | | 39,414 | | | | — | | | | 47,279 | | | | 3,299 | | |
| Class C | | | 58,429 | | | | 157,299 | | | | 2,945 | | | | 117,724 | | | | 4,433 | | |
| Distribution and service fees—Class A | | | 43,756 | | | | 839,422 | | | | 4,057 | | | | 554,223 | | | | 58,172 | | |
| Transfer agent fee | | | 116,551 | | | | 1,663,353 | | | | 6,809 | | | | 1,659,399 | | | | 1,840,067 | | |
| Pricing and bookkeeping fees | | | 59,373 | | | | 38,000 | | | | 22,418 | | | | 151,423 | | | | 155,605 | | |
| Trustees' fees | | | 38,858 | | | | 12,882 | | | | 29,672 | | | | 41,127 | | | | 50,304 | | |
| Custody fee | | | 16,438 | | | | 3,599 | | | | 21,659 | | | | 342,855 | | | | 556,411 | | |
| Registration fees | | | 52,546 | | | | 101,375 | | | | 18,656 | | | | 113,047 | | | | 62,113 | | |
| Audit fee | | | 46,752 | | | | 22,980 | | | | 44,954 | | | | 57,119 | | | | 55,741 | | |
| Legal fees | | | 55,565 | | | | 30,827 | | | | 35,333 | | | | 54,123 | | | | 55,449 | | |
| Reports to shareholders | | | 51,249 | | | | 195,760 | | | | 24,428 | | | | 243,968 | | | | 137,550 | | |
| Chief compliance officer expenses | | | 610 | | | | 1,176 | | | | 587 | | | | 985 | | | | 1,091 | | |
| Other expenses | | | 5,737 | | | | 10,194 | | | | 165 | | | | 48,580 | | | | 47,477 | | |
| Expenses before interest expense | | | 1,467,301 | | | | 6,229,079 | | | | 262,082 | | | | 16,999,655 | | | | 14,893,503 | | |
| Interest expense | | | 391 | | | | — | | | | — | | | | — | | | | 2,759 | | |
Interest expense allocated from
Master Portfolio | | | — | | | | 45 | | | | — | | | | — | | | | — | | |
| Total Expenses | | | 1,467,692 | | | | 6,229,124 | | | | 262,082 | | | | 16,999,655 | | | | 14,896,262 | | |
| Fees waived by transfer agent | | | (11,254 | ) | | | — | | | | — | | | | — | | | | — | | |
Fees waived or expenses reimbursed by
investment advisor | | | (187,426 | ) | | | — | | | | (178,993 | ) | | | — | | | | — | | |
| Expense reductions | | | — | | | | — | * | | | (1 | ) | | | (21 | ) | | | (16 | ) | |
| Net Expenses | | | 1,269,012 | | | | 6,229,124 | | | | 83,088 | | | | 16,999,634 | | | | 14,896,246 | | |
| Net Investment Income (Loss) | | | 727,885 | | | | 40,188,961 | | | | (27,053 | ) | | | 7,409,782 | | | | 23,086,585 | | |
See Accompanying Notes to Financial Statements.
48
Statements of Operations (continued) – International/Global Stock Funds
For the Year Ended February 28, 2010
| | | ($) | | ($) | | ($) | | ($) | | ($) | |
| | | Columbia
Global
Value
Fund | | Columbia
International
Value
Fund | | Columbia
Marsico
Global
Fund | | Columbia
Marsico
International
Opportunities
Fund | | Columbia
Multi-Advisor
International
Equity
Fund | |
Net Realized and Unrealized Gain (Loss)
on Investments, Foreign Currency, Foreign
Capital Gains Tax and Written Options | |
| Net realized gain (loss) on: | |
| Investments | | | (37,717,986 | ) | | | — | | | | 114,960 | | | | (57,584,371 | ) | | | (143,284,094 | ) | |
| Foreign currency transactions | | | 15,442 | | | | — | | | | (2,915 | ) | | | (1,032,089 | ) | | | (2,462,347 | ) | |
| Written options | | | — | | | | — | | | | — | | | | — | | | | (134,189 | ) | |
| Allocated from Master Portfolio: | |
| Investments | | | — | | | | (159,876,930 | ) | | | — | | | | — | | | | — | | |
| Foreign currency transactions | | | — | | | | (99,762 | ) | | | — | | | | — | | | | — | | |
| Net realized gain (loss) | | | (37,702,544 | ) | | | (159,976,692 | ) | | | 112,045 | | | | (58,616,460 | ) | | | (145,880,630 | ) | |
Net change in unrealized appreciation
(depreciation) on: | |
| Investments | | | 64,453,095 | | | | — | | | | 1,805,452 | | | | 571,634,915 | | | | 677,866,754 | | |
| Foreign currency translations | | | (4,618 | ) | | | — | | | | 261 | | | | 332,780 | | | | (3,640,325 | ) | |
| Foreign capital gains tax | | | — | | | | — | | | | — | | | | — | | | | (64,112 | ) | |
| Written options | | | — | | | | — | | | | — | | | | — | | | | 22,865 | | |
| Allocated from Master Portfolio: | |
| Investments | | | — | | | | 603,196,909 | | | | — | | | | — | | | | — | | |
Net change in unrealized
appreciation (depreciation) | | | 64,448,477 | | | | 603,196,909 | | | | 1,805,713 | | | | 571,967,695 | | | | 674,185,182 | | |
| Net Gain | | | 26,745,933 | | | | 443,220,217 | | | | 1,917,758 | | | | 513,351,235 | | | | 528,304,552 | | |
| Net Increase Resulting from Operations | | | 27,473,818 | | | | 483,409,178 | | | | 1,890,705 | | | | 520,761,017 | | | | 551,391,137 | | |
* Rounds to less than $1.00.
(a) Expenses allocated from Master Portfolio include the Fund's pro-rata portion of the Master Portfolio's investment advisory, administration, pricing and bookkeeping, Trustees' fees and other expenses.
See Accompanying Notes to Financial Statements.
49
Statements of Changes in Net Assets – International/Global Stock Funds
| Increase (Decrease) in Net Assets | | Columbia
Global Value Fund | | Columbia
International Value Fund | | Columbia
Marsico Global Fund | | Columbia
Marsico International
Opportunities Fund | |
Columbia Multi-Advisor
International Equity Fund | |
| | | Year Ended February 28, | | Year Ended February 28, | | Year Ended
February 28, | | Period Ended
February 28, | | Year Ended February 28, | | Year Ended February 28, | |
| | | 2010 ($) | | 2009 ($) | | 2010 ($) | | 2009 ($) | | 2010 ($) | | 2009 ($)(a) | | 2010 ($) | | 2009 ($) | | 2010 ($) | | 2009 ($) | |
| Operations | |
| Net investment income (loss) | | | 727,885 | | | | 3,557,259 | | | | 40,188,961 | | | | 68,577,762 | | | | (27,053 | ) | | | (2,724 | ) | | | 7,409,782 | | | | 29,529,687 | | | | 23,086,585 | | | | 46,475,156 | | |
Net realized gain (loss) on investments,
foreign currency transactions and
written options | | | (37,702,544 | ) | | | (35,267,032 | ) | | | (159,976,692 | )(b) | | | 612,141 | (b) | | | 112,045 | | | | (2,110,222 | ) | | | (58,616,460 | ) | | | (809,465,919 | ) | | | (145,880,630 | ) | | | (531,975,204 | ) | |
Net change in unrealized appreciation
(depreciation) on investments, foreign
currency translations, foreign capital
gains tax and written options | | | 64,448,477 | | | | (61,349,407 | ) | | | 603,196,909 | (b) | | | (1,063,642,912 | )(b) | | | 1,805,713 | | | | (961,018 | ) | | | 571,967,695 | | | | (903,111,442 | ) | | | 674,185,182 | | | | (858,099,830 | ) | |
| Net increase (decrease) resulting from operations | | | 27,473,818 | | | | (93,059,180 | ) | | | 483,409,178 | | | | (994,453,009 | ) | | | 1,890,705 | | | | (3,073,964 | ) | | | 520,761,017 | | | | (1,683,047,674 | ) | | | 551,391,137 | | | | (1,343,599,878 | ) | |
| Distributions to Shareholders | |
| From net investment income: | |
| Class A | | | (901,429 | ) | | | — | | | | (5,462,082 | ) | | | (15,716,871 | ) | | | (7,179 | ) | | | — | | | | (5,996,940 | ) | | | — | | | | (963,875 | ) | | | (158,648 | ) | |
| Class B | | | (368,815 | ) | | | — | | | | (112,512 | ) | | | (961,592 | ) | | | — | | | | — | | | | (227,998 | ) | | | — | | | | (48,849 | ) | | | — | | |
| Class C | | | (1,033,688 | ) | | | — | | | | (642,030 | ) | | | (2,426,795 | ) | | | — | | | | — | | | | (570,820 | ) | | | — | | | | (67,661 | ) | | | — | | |
| Class R | | | — | | | | — | | | | — | | | | — | | | | (1,931 | ) | | | — | | | | (64,392 | ) | | | — | | | | (7,655 | ) | | | (528 | ) | |
| Class Z | | | (1,181,811 | ) | | | (167,262 | ) | | | (20,344,658 | ) | | | (48,475,840 | ) | | | (6,194 | ) | | | — | | | | (30,799,010 | ) | | | — | | | | (61,842,478 | ) | | | (16,730,152 | ) | |
| From net realized gains: | |
| Class A | | | — | | | | (6,633,069 | ) | | | — | | | | (70,649,622 | ) | | | — | | | | — | | | | — | | | | (5,202,687 | ) | | | — | | | | (512,920 | ) | |
| Class B | | | — | | | | (1,846,971 | ) | | | — | | | | (4,728,265 | ) | | | — | | | | — | | | | — | | | | (370,849 | ) | | | — | | | | (40,298 | ) | |
| Class C | | | — | | | | (5,823,816 | ) | | | — | | | | (10,603,426 | ) | | | — | | | | — | | | | — | | | | (963,694 | ) | | | — | | | | (50,546 | ) | |
| Class R | | | — | | | | — | | | | — | | | | — | | | | — | | | | — | | | | — | | | | (34,263 | ) | | | — | | | | (2,479 | ) | |
| Class Z | | | — | | | | (4,631,685 | ) | | | — | | | | (153,916,735 | ) | | | — | | | | — | | | | — | | | | (20,805,912 | ) | | | — | | | | (31,250,024 | ) | |
| From return of capital: | |
| Class A | | | — | | | | — | | | | — | | | | (287,483 | ) | | | — | | | | — | | | | — | | | | — | | | | — | | | | — | | |
| Class B | | | — | | | | — | | | | — | | | | (21,779 | ) | | | — | | | | — | | | | — | | | | — | | | | — | | | | — | | |
| Class C | | | — | | | | — | | | | — | | | | (46,825 | ) | | | — | | | | — | | | | — | | | | — | | | | — | | | | — | | |
| Class R | | | — | | | | — | | | | — | | | | — | | | | — | | | | — | | | | — | | | | — | | | | — | | | | — | | |
| Class Z | | | — | | | | — | | | | — | | | | (732,864 | ) | | | — | | | | — | | | | — | | | | — | | | | — | | | | — | | |
| Total distributions to shareholders | | | (3,485,743 | ) | | | (19,102,803 | ) | | | (26,561,282 | ) | | | (308,568,097 | ) | | | (15,304 | ) | | | — | | | | (37,659,160 | ) | | | (27,377,405 | ) | | | (62,930,518 | ) | | | (48,745,595 | ) | |
| Net Capital Stock Transactions | | | (35,539,358 | ) | | | (69,889,382 | ) | | | 29,692,285 | | | | (491,788,857 | ) | | | 334,429 | | | | 6,400,396 | | | | (358,865,166 | ) | | | (459,278,854 | ) | | | (264,703,264 | ) | | | (31,050,681 | ) | |
| Redemption Fees | | | 1,259 | | | | 1,213 | | | | 111,554 | | | | 46,200 | | | | 10 | | | | 217 | | | | 114,599 | | | | 235,668 | | | | 64,736 | | | | 166,089 | | |
| Increase from regulatory settlements | | | — | | | | — | | | | 417,242 | (b) | | | — | | | | — | | | | — | | | | — | | | | — | | | | 4,074,606 | | | | — | | |
| Total increase (decrease) in net assets | | | (11,550,024 | ) | | | (182,050,152 | ) | | | 487,068,977 | | | | (1,794,763,763 | ) | | | 2,209,840 | | | | 3,326,649 | | | | 124,351,290 | | | | (2,169,468,265 | ) | | | 227,896,697 | | | | (1,423,230,065 | ) | |
| Net Assets | |
| Beginning of period | | �� | 65,428,671 | | | | 247,478,823 | | | | 1,153,710,912 | | | | 2,948,474,675 | | | | 3,326,649 | | | | — | | | | 1,078,621,078 | | | | 3,248,089,343 | | | | 1,175,091,764 | | | | 2,598,321,829 | | |
| End of period | | | 53,878,647 | | | | 65,428,671 | | | | 1,640,779,889 | | | | 1,153,710,912 | | | | 5,536,489 | | | | 3,326,649 | | | | 1,202,972,368 | | | | 1,078,621,078 | | | | 1,402,988,461 | | | | 1,175,091,764 | | |
Undistributed (overdistributed) net investment
income at end of period | | | 682,456 | | | | 3,424,873 | | | | 13,350,907 | | | | (418,865 | ) | | | — | | | | — | | | | (3,524,958 | ) | | | 26,783,663 | | | | (6,317,871 | ) | | | 29,410,962 | | |
| Accumulated net investment loss, at end of period | | | — | | | | — | | | | — | | | | — | | | | (26,339 | ) | | | (86 | ) | | | — | | | | — | | | | — | | | | — | | |
(a) The Fund commenced operations on April 30, 2008.
(b) Allocated from Master Portfolio.
See Accompanying Notes to Financial Statements.
50
See Accompanying Notes to Financial Statements.
51
Statements of Changes in Net Assets – Capital Stock Activity
| | | Columbia Global Value Fund | | Columbia International Value Fund | |
| | | Year Ended
February 28, 2010 | | Year Ended
February 28, 2009 | | Year Ended
February 28, 2010 | | Year Ended
February 28, 2009 | |
| | | Shares | | Dollars ($) | | Shares | | Dollars ($) | | Shares | | Dollars ($) | | Shares | | Dollars ($) | |
| Class A | |
| Subscriptions | | | 427,165 | | | | 2,365,575 | | | | 865,805 | | | | 6,593,927 | | | | 11,513,261 | | | | 151,911,595 | | | | 5,188,262 | | | | 80,701,279 | | |
| Distributions reinvested | | | 149,841 | | | | 755,198 | | | | 517,133 | | | | 4,219,803 | | | | 337,933 | | | | 4,687,130 | | | | 4,682,704 | | | | 72,546,804 | | |
| Redemptions | | | (1,774,695 | ) | | | (9,485,370 | ) | | | (6,655,682 | ) | | | (40,173,276 | ) | | | (9,268,575 | ) | | | (118,955,238 | ) | | | (30,092,388 | ) | | | (455,400,344 | ) | |
| Net increase (decrease) | | | (1,197,689 | ) | | | (6,364,597 | ) | | | (5,272,744 | ) | | | (29,359,546 | ) | | | 2,582,619 | | | | 37,643,487 | | | | (20,221,422 | ) | | | (302,152,261 | ) | |
| Class B | |
| Subscriptions | | | 10,044 | | | | 48,814 | | | | 42,932 | | | | 335,049 | | | | 79,922 | | | | 1,055,427 | | | | 45,185 | | | | 681,538 | | |
| Distributions reinvested | | | 61,839 | | | | 300,533 | | | | 177,419 | | | | 1,396,290 | | | | 7,253 | | | | 97,260 | | | | 314,164 | | | | 4,676,823 | | |
| Redemptions | | | (818,402 | ) | | | (4,385,237 | ) | | | (893,872 | ) | | | (5,834,103 | ) | | | (1,497,283 | ) | | | (18,383,672 | ) | | | (1,870,593 | ) | | | (28,024,189 | ) | |
| Net decrease | | | (746,519 | ) | | | (4,035,890 | ) | | | (673,521 | ) | | | (4,102,764 | ) | | | (1,410,108 | ) | | | (17,230,985 | ) | | | (1,511,244 | ) | | | (22,665,828 | ) | |
| Class C | |
| Subscriptions | | | 51,641 | | | | 251,491 | | | | 215,776 | | | | 1,698,276 | | | | 642,151 | | | | 8,330,678 | | | | 242,479 | | | | 3,574,333 | | |
| Distributions reinvested | | | 142,059 | | | | 691,830 | | | | 492,408 | | | | 3,875,249 | | | | 33,260 | | | | 445,349 | | | | 597,194 | | | | 8,774,413 | | |
| Redemptions | | | (2,071,935 | ) | | | (10,710,243 | ) | | | (3,337,025 | ) | | | (21,170,736 | ) | | | (1,235,742 | ) | | | (14,921,103 | ) | | | (2,276,085 | ) | | | (31,995,645 | ) | |
| Net decrease | | | (1,878,235 | ) | | | (9,766,922 | ) | | | (2,628,841 | ) | | | (15,597,211 | ) | | | (560,331 | ) | | | (6,145,076 | ) | | | (1,436,412 | ) | | | (19,646,899 | ) | |
| Class Z | |
| Subscriptions | | | 175,537 | | | | 952,921 | | | | 1,946,837 | | | | 8,797,728 | | | | 29,734,906 | | | | 387,997,483 | | | | 23,409,638 | | | | 347,508,796 | | |
| Distributions reinvested | | | 35,230 | | | | 178,616 | | | | 141,253 | | | | 1,159,690 | | | | 764,486 | | | | 10,702,805 | | | | 8,033,128 | | | | 120,862,229 | | |
| Redemptions | | | (3,059,097 | ) | | | (16,503,486 | ) | | | (4,269,948 | ) | | | (30,787,279 | ) | | | (32,234,509 | ) | | | (383,275,429 | ) | | | (41,267,291 | ) | | | (615,694,894 | ) | |
| Net increase (decrease) | | | (2,848,330 | ) | | | (15,371,949 | ) | | | (2,181,858 | ) | | | (20,829,861 | ) | | | (1,735,117 | ) | | | 15,424,859 | | | | (9,824,525 | ) | | | (147,323,869 | ) | |
See Accompanying Notes to Financial Statements.
52
See Accompanying Notes to Financial Statements.
53
Statements of Changes in Net Assets (continued) – Capital Stock Activity
| | | Columbia Marsico Global Fund | | Columbia Marsico International Opportunities Fund | |
| | | Year Ended
February 28, 2010 | | Period Ended
February 28, 2009 (a) | | Year Ended
February 28, 2010 | | Year Ended
February 28, 2009 | |
| | | Shares | | Dollars ($) | | Shares | | Dollars ($) | | Shares | | Dollars ($) | | Shares | | Dollars ($) | |
| Class A | |
| Subscriptions | | | 60,337 | | | | 431,019 | | | | 241,432 | | | | 2,213,067 | | | | 3,599,341 | | | | 33,799,461 | | | | 13,475,313 | | | | 159,192,848 | | |
| Distributions reinvested | | | 893 | | | | 6,994 | | | | — | | | | — | | | | 612,199 | | | | 5,585,316 | | | | 327,476 | | | | 4,754,957 | | |
| Redemptions | | | (31,342 | ) | | | (199,132 | ) | | | (17,972 | ) | | | (115,674 | ) | | | (16,628,228 | ) | | | (161,225,189 | ) | | | (25,620,827 | ) | | | (233,324,059 | ) | |
| Net increase (decrease) | | | 29,888 | | | | 238,881 | | | | 223,460 | | | | 2,097,393 | | | | (12,416,688 | ) | | | (121,840,412 | ) | | | (11,818,038 | ) | | | (69,376,254 | ) | |
| Class B | |
| Subscriptions | | | — | | | | — | | | | — | | | | — | | | | 104,917 | | | | 926,130 | | | | 331,625 | | | | 3,946,145 | | |
| Distributions reinvested | | | — | | | | — | | | | — | | | | — | | | | 23,266 | | | | 199,106 | | | | 23,218 | | | | 320,175 | | |
| Redemptions | | | — | | | | — | | | | — | | | | — | | | | (649,513 | ) | | | (5,638,652 | ) | | | (1,147,897 | ) | | | (11,572,046 | ) | |
| Net decrease | | | — | | | | — | | | | — | | | | — | | | | (521,330 | ) | | | (4,513,416 | ) | | | (793,054 | ) | | | (7,305,726 | ) | |
| Class C | |
| Subscriptions | | | 33,090 | | | | 250,189 | | | | 191,782 | | | | 1,718,833 | | | | 382,994 | | | | 3,548,154 | | | | 1,236,446 | | | | 14,495,661 | | |
| Distributions reinvested | | | — | | | | — | | | | — | | | | — | | | | 52,934 | | | | 453,616 | | | | 51,163 | | | | 705,538 | | |
| Redemptions | | | (28,904 | ) | | | (177,715 | ) | | | (12,613 | ) | | | (88,797 | ) | | | (1,817,095 | ) | | | (15,707,197 | ) | | | (3,125,022 | ) | | | (29,145,367 | ) | |
| Net increase (decrease) | | | 4,186 | | | | 72,474 | | | | 179,169 | | | | 1,630,036 | | | | (1,381,167 | ) | | | (11,705,427 | ) | | | (1,837,413 | ) | | | (13,944,168 | ) | |
| Class R | |
| Subscriptions | | | 375 | | | | 2,449 | | | | 125,032 | | | | 1,250,177 | | | | 156,809 | | | | 1,508,570 | | | | 282,635 | | | | 3,014,362 | | |
| Distributions reinvested | | | 247 | | | | 1,931 | | | | — | | | | — | | | | 6,574 | | | | 60,626 | | | | 2,314 | | | | 33,555 | | |
| Redemptions | | | — | | | | — | | | | — | | | | — | | | | (215,226 | ) | | | (1,993,518 | ) | | | (155,739 | ) | | | (1,676,928 | ) | |
| Net increase (decrease) | | | 622 | | | | 4,380 | | | | 125,032 | | | | 1,250,177 | | | | (51,843 | ) | | | (424,322 | ) | | | 129,210 | | | | 1,370,989 | | |
| Class Z | |
| Subscriptions | | | 1,980 | | | | 13,500 | | | | 141,647 | | | | 1,422,790 | | | | 17,351,987 | | | | 171,310,738 | | | | 29,968,893 | | | | 355,905,964 | | |
| Distributions reinvested | | | 789 | | | | 6,194 | | | | — | | | | — | | | | 1,114,727 | | | | 10,453,698 | | | | 459,765 | | | | 6,781,537 | | |
| Redemptions | | | (157 | ) | | | (1,000 | ) | | | — | | | | — | | | | (42,970,610 | ) | | | (402,146,025 | ) | | | (78,938,540 | ) | | | (732,711,196 | ) | |
| Net increase (decrease) | | | 2,612 | | | | 18,694 | | | | 141,647 | | | | 1,422,790 | | | | (24,503,896 | ) | | | (220,381,589 | ) | | | (48,509,882 | ) | | | (370,023,695 | ) | |
(a) The Fund commenced operations on April 30, 2008.
See Accompanying Notes to Financial Statements.
54
See Accompanying Notes to Financial Statements.
55
Statements of Changes in Net Assets (continued) – Capital Stock Activity
| | | Columbia Multi-Advisor International Equity Fund | |
| | | Year Ended
February 28, 2010 | | Year Ended
February 28, 2009 | |
| | | Shares | | Dollars ($) | | Shares | | Dollars ($) | |
| Class A | |
| Subscriptions | | | 205,292 | | | | 2,168,886 | | | | 303,061 | | | | 4,101,058 | | |
| Distributions reinvested | | | 76,464 | | | | 792,878 | | | | 42,175 | | | | 554,054 | | |
| Redemptions | | | (289,456 | ) | | | (2,912,919 | ) | | | (710,083 | ) | | | (7,743,019 | ) | |
| Net increase (decrease) | | | (7,700 | ) | | | 48,845 | | | | (364,847 | ) | | | (3,087,907 | ) | |
| Class B | |
| Subscriptions | | | 11,123 | | | | 109,561 | | | | 30,582 | | | | 351,078 | | |
| Distributions reinvested | | | 4,441 | | | | 41,580 | | | | 2,408 | | | | 34,273 | | |
| Redemptions | | | (54,596 | ) | | | (508,773 | ) | | | (117,000 | ) | | | (1,367,398 | ) | |
| Net decrease | | | (39,032 | ) | | | (357,632 | ) | | | (84,010 | ) | | | (982,047 | ) | |
| Class C | |
| Subscriptions | | | 27,871 | | | | 266,977 | | | | 38,313 | | | | 416,847 | | |
| Distributions reinvested | | | 4,990 | | | | 46,261 | | | | 2,181 | | | | 30,637 | | |
| Redemptions | | | (53,754 | ) | | | (495,500 | ) | | | (110,481 | ) | | | (1,137,680 | ) | |
| Net decrease | | | (20,893 | ) | | | (182,262 | ) | | | (69,987 | ) | | | (690,196 | ) | |
| Class R | |
| Subscriptions | | | 11,671 | | | | 121,158 | | | | 3,071 | | | | 34,167 | | |
| Distributions reinvested | | | 577 | | | | 5,998 | | | | 177 | | | | 2,416 | | |
| Redemptions | | | (200 | ) | | | (2,249 | ) | | | (688 | ) | | | (7,675 | ) | |
| Net increase | | | 12,048 | | | | 124,907 | | | | 2,560 | | | | 28,908 | | |
| Class Z | |
| Subscriptions | | | 15,059,511 | | | | 151,650,965 | | | | 38,249,816 | | | | 449,368,814 | | |
| Distributions reinvested | | | 2,808,809 | | | | 29,505,142 | | | | 1,836,310 | | | | 23,496,332 | | |
| Redemptions | | | (44,278,243 | ) | | | (445,493,229 | ) | | | (46,138,899 | ) | | | (499,184,585 | ) | |
| Net decrease | | | (26,409,923 | ) | | | (264,337,122 | ) | | | (6,052,773 | ) | | | (26,319,439 | ) | |
See Accompanying Notes to Financial Statements.
56
Financial Highlights – Columbia Global Value Fund
Selected data for a share outstanding throughout each period is as follows:
| | | | | Year | | Period | | | |
| | | Year Ended
February 28, | | Ended
February 29, | | Ended
February 28, | | Year Ended
March 31, | |
| Class A Shares | | 2010 | | 2009 | | 2008 | | 2007 (a) | | 2006 (b) | | 2005 | |
| Net Asset Value, Beginning of Period | | $ | 4.14 | | | $ | 9.33 | | | $ | 13.43 | | | $ | 12.64 | | | $ | 11.98 | | | $ | 12.04 | | |
| Income from Investment Operations: | |
| Net investment income (c) | | | 0.07 | | | | 0.18 | | | | 0.19 | (d) | | | 0.14 | | | | 0.16 | | | | 0.11 | | |
Net realized and unrealized gain (loss)
on investments and foreign currency | | | 1.91 | | | | (4.58 | ) | | | (1.21 | ) | | | 2.07 | | | | 1.76 | | | | 0.85 | | |
| Total from investment operations | | | 1.98 | | | | (4.40 | ) | | | (1.02 | ) | | | 2.21 | | | | 1.92 | | | | 0.96 | | |
| Less Distributions to Shareholders: | |
| From net investment income | | | (0.27 | ) | | | — | | | | (0.19 | ) | | | (0.12 | ) | | | (0.17 | ) | | | (0.11 | ) | |
| From net realized gains | | | — | | | | (0.79 | ) | | | (2.89 | ) | | | (1.30 | ) | | | (1.09 | ) | | | (0.91 | ) | |
| Total distributions to shareholders | | | (0.27 | ) | | | (0.79 | ) | | | (3.08 | ) | | | (1.42 | ) | | | (1.26 | ) | | | (1.02 | ) | |
| Redemption Fees: | |
| Redemption fees added to paid-in-capital (e) | | | — | | | | — | | | | — | | | | — | | | | — | | | | — | | |
| Net Asset Value, End of Period | | $ | 5.85 | | | $ | 4.14 | | | $ | 9.33 | | | $ | 13.43 | | | $ | 12.64 | | | $ | 11.98 | | |
| Total return (f) | | | 48.97 | %(g) | | | (51.34 | )%(g) | | | (10.43 | )%(g) | | | 19.27 | %(g)(h) | | | 16.97 | % | | | 8.64 | % | |
Ratios to Average Net Assets/
Supplemental Data: | |
| Net expenses before interest expense | | | 1.62 | % | | | 1.60 | %(i) | | | 1.51 | %(i) | | | 1.53 | %(i)(j) | | | 1.45 | %(i) | | | 1.52 | %(i) | |
| Interest expense | | | — | %(k) | | | — | %(k) | | | — | %(k) | | | — | %(j)(k) | | | — | %(k) | | | — | | |
| Net expenses | | | 1.62 | % | | | 1.60 | %(i) | | | 1.51 | %(i) | | | 1.53 | %(i)(j) | | | 1.45 | %(i) | | | 1.52 | %(i) | |
| Waiver/Reimbursement | | | 0.30 | % | | | 0.03 | % | | | 0.01 | % | | | 0.01 | %(j) | | | — | | | | — | | |
| Net investment income | | | 1.29 | % | | | 2.45 | %(i) | | | 1.50 | %(i) | | | 1.17 | %(i)(j) | | | 1.32 | %(i) | | | 0.94 | %(i) | |
| Portfolio turnover rate | | | 5 | % | | | 10 | % | | | 38 | % | | | 12 | %(h) | | | 16 | % | | | 18 | % | |
| Net assets, end of period (000s) | | $ | 15,641 | | | $ | 16,031 | | | $ | 85,257 | | | $ | 114,224 | | | $ | 119,611 | | | $ | 126,679 | | |
(a) The Fund changed its fiscal year end from March 31 to February 28. Per share data and total return reflect activity from April 1, 2006 through February 28, 2007.
(b) On August 22, 2005, the Fund's Investor A shares were renamed Class A shares.
(c) Per share data was calculated using the average shares outstanding during the period.
(d) Net investment income per share reflects a special dividend. The effect of this dividend amounted to $0.05 per share.
(e) Rounds to less than $0.01 per share.
(f) Total return at net asset value assuming all distributions reinvested and no initial sales charge or contingent deferred sales charge.
(g) Had the investment advisor and/or any of its affiliates not waived fees or reimbursed a portion of expenses, total return would have been reduced.
(h) Not annualized.
(i) The benefits derived from expense reductions had an impact of less than 0.01%.
(j) Annualized.
(k) Rounds to less than 0.01%.
See Accompanying Notes to Financial Statements.
57
Financial Highlights – Columbia Global Value Fund
Selected data for a share outstanding throughout each period is as follows:
| | | | | Year | | Period | | | |
| | | Year Ended
February 28, | | Ended
February 29, | | Ended
February 28, | | Year Ended
March 31, | |
| Class B Shares | | 2010 | | 2009 | | 2008 | | 2007 (a) | | 2006 (b) | | 2005 | |
| Net Asset Value, Beginning of Period | | $ | 3.98 | | | $ | 9.05 | | | $ | 13.12 | | | $ | 12.40 | | | $ | 11.78 | | | $ | 11.86 | | |
| Income from Investment Operations: | |
| Net investment income (c) | | | 0.03 | | | | 0.12 | | | | 0.10 | (d) | | | 0.05 | | | | 0.07 | | | | 0.02 | | |
Net realized and unrealized gain (loss)
on investments and foreign currency | | | 1.83 | | | | (4.40 | ) | | | (1.17 | ) | | | 2.02 | | | | 1.71 | | | | 0.84 | | |
| Total from investment operations | | | 1.86 | | | | (4.28 | ) | | | (1.07 | ) | | | 2.07 | | | | 1.78 | | | | 0.86 | | |
| Less Distributions to Shareholders: | |
| From net investment income | | | (0.22 | ) | | | — | | | | (0.11 | ) | | | (0.05 | ) | | | (0.07 | ) | | | (0.03 | ) | |
| From net realized gains | | | — | | | | (0.79 | ) | | | (2.89 | ) | | | (1.30 | ) | | | (1.09 | ) | | | (0.91 | ) | |
| Total distributions to shareholders | | | (0.22 | ) | | | (0.79 | ) | | | (3.00 | ) | | | (1.35 | ) | | | (1.16 | ) | | | (0.94 | ) | |
| Redemption Fees: | |
| Redemption fees added to paid-in-capital | | | — | (e) | | | — | (e) | | | — | (e) | | | — | (e) | | | — | (e) | | | — | | |
| Net Asset Value, End of Period | | $ | 5.62 | | | $ | 3.98 | | | $ | 9.05 | | | $ | 13.12 | | | $ | 12.40 | | | $ | 11.78 | | |
| Total return (f) | | | 47.63 | %(g) | | | (51.61 | )%(g) | | | (11.08 | )%(g) | | | 18.44 | %(g)(h) | | | 16.08 | % | | | 7.85 | % | |
Ratios to Average Net Assets/
Supplemental Data: | |
| Net expenses before interest expense | | | 2.37 | % | | | 2.35 | %(i) | | | 2.26 | %(i) | | | 2.28 | %(i)(j) | | | 2.20 | %(i) | | | 2.27 | %(i) | |
| Interest expense | | | — | %(k) | | | — | %(k) | | | — | %(k) | | | — | %(j)(k) | | | — | %(k) | | | — | | |
| Net expenses | | | 2.37 | % | | | 2.35 | %(i) | | | 2.26 | %(i) | | | 2.28 | %(i)(j) | | | 2.20 | %(i) | | | 2.27 | %(i) | |
| Waiver/Reimbursement | | | 0.30 | % | | | 0.03 | % | | | 0.01 | % | | | 0.01 | %(j) | | | — | | | | — | | |
| Net investment income | | | 0.61 | % | | | 1.67 | %(i) | | | 0.76 | %(i) | | | 0.41 | %(i)(j) | | | 0.58 | %(i) | | | 0.19 | %(i) | |
| Portfolio turnover rate | | | 5 | % | | | 10 | % | | | 38 | % | | | 12 | %(h) | | | 16 | % | | | 18 | % | |
| Net assets, end of period (000s) | | $ | 6,277 | | | $ | 7,408 | | | $ | 22,943 | | | $ | 32,635 | | | $ | 32,564 | | | $ | 34,324 | | |
(a) The Fund changed its fiscal year end from March 31 to February 28. Per share data and total return reflect activity from April 1, 2006 through February 28, 2007.
(b) On August 22, 2005, the Fund's Investor B shares were renamed Class B shares.
(c) Per share data was calculated using the average shares outstanding during the period.
(d) Net investment income per share reflects a special dividend. The effect of this dividend amounted to $0.05 per share.
(e) Rounds to less than $0.01 per share.
(f) Total return at net asset value assuming all distributions reinvested and no contingent deferred sales charge.
(g) Had the investment advisor and/or any of its affiliates not waived fees or reimbursed a portion of expenses, total return would have been reduced.
(h) Not annualized.
(i) The benefits derived from expense reductions had an impact of less than 0.01%.
(j) Annualized.
(k) Rounds to less than 0.01%.
See Accompanying Notes to Financial Statements.
58
Financial Highlights – Columbia Global Value Fund
Selected data for a share outstanding throughout each period is as follows:
| | | | | Year | | Period | | | |
| | | Year Ended
February 28, | | Ended
February 29, | | Ended
February 28, | | Year Ended
March 31, | |
| Class C Shares | | 2010 | | 2009 | | 2008 | | 2007 (a) | | 2006 (b) | | 2005 | |
| Net Asset Value, Beginning of Period | | $ | 3.98 | | | $ | 9.05 | | | $ | 13.13 | | | $ | 12.41 | | | $ | 11.78 | | | $ | 11.86 | | |
| Income from Investment Operations: | |
| Net investment income (c) | | | 0.03 | | | | 0.12 | | | | 0.09 | (d) | | | 0.04 | | | | 0.07 | | | | 0.02 | | |
Net realized and unrealized gain (loss)
on investments and foreign currency | | | 1.84 | | | | (4.40 | ) | | | (1.17 | ) | | | 2.03 | | | | 1.72 | | | | 0.84 | | |
| Total from investment operations | | | 1.87 | | | | (4.28 | ) | | | (1.08 | ) | | | 2.07 | | | | 1.79 | | | | 0.86 | | |
| Less Distributions to Shareholders: | |
| From net investment income | | | (0.22 | ) | | | — | | | | (0.11 | ) | | | (0.05 | ) | | | (0.07 | ) | | | (0.03 | ) | |
| From net realized gains | | | — | | | | (0.79 | ) | | | (2.89 | ) | | | (1.30 | ) | | | (1.09 | ) | | | (0.91 | ) | |
| Total distributions to shareholders | | | (0.22 | ) | | | (0.79 | ) | | | (3.00 | ) | | | (1.35 | ) | | | (1.16 | ) | | | (0.94 | ) | |
| Redemption Fees: | |
| Redemption fees added to paid-in-capital | | | — | (e) | | | — | (e) | | | — | (e) | | | — | (e) | | | — | (e) | | | — | | |
| Net Asset Value, End of Period | | $ | 5.63 | | | $ | 3.98 | | | $ | 9.05 | | | $ | 13.13 | | | $ | 12.41 | | | $ | 11.78 | | |
| Total return (f) | | | 47.88 | %(g) | | | (51.61 | )%(g) | | | (11.14 | )%(g) | | | 18.44 | %(g)(h) | | | 16.16 | % | | | 7.84 | % | |
Ratios to Average Net Assets/
Supplemental Data: | |
| Net expenses before interest expense | | | 2.37 | % | | | 2.35 | %(i) | | | 2.26 | %(i) | | | 2.28 | %(i)(j) | | | 2.20 | %(i) | | | 2.27 | %(i) | |
| Interest expense | | | — | %(k) | | | — | %(k) | | | — | %(k) | | | — | %(j)(k) | | | — | %(k) | | | — | | |
| Net expenses | | | 2.37 | % | | | 2.35 | %(i) | | | 2.26 | %(i) | | | 2.28 | %(i)(j) | | | 2.20 | %(i) | | | 2.27 | %(i) | |
| Waiver/Reimbursement | | | 0.30 | % | | | 0.03 | % | | | 0.01 | % | | | 0.01 | %(j) | | | — | | | | — | | |
| Net investment income | | | 0.53 | % | | | 1.69 | %(i) | | | 0.74 | %(i) | | | 0.39 | %(i)(j) | | | 0.58 | %(i) | | | 0.19 | %(i) | |
| Portfolio turnover rate | | | 5 | % | | | 10 | % | | | 38 | % | | | 12 | %(h) | | | 16 | % | | | 18 | % | |
| Net assets, end of period (000s) | | $ | 19,665 | | | $ | 21,375 | | | $ | 72,405 | | | $ | 97,465 | | | $ | 92,558 | | | $ | 98,850 | | |
(a) The Fund changed its fiscal year end from March 31 to February 28. Per share data and total return reflect activity from April 1, 2006 through February 28, 2007.
(b) On August 22, 2005, the Fund's Investor C shares were renamed Class C shares.
(c) Per share data was calculated using the average shares outstanding during the period.
(d) Net investment income per share reflects a special dividend. The effect of this dividend amounted to $0.05 per share.
(e) Rounds to less than $0.01 per share.
(f) Total return at net asset value assuming all distributions reinvested and no contingent deferred sales charge.
(g) Had the investment advisor and/or any of its affiliates not waived fees or reimbursed a portion of expenses, total return would have been reduced.
(h) Not annualized.
(i) The benefits derived from expense reductions had an impact of less than 0.01%.
(j) Annualized.
(k) Rounds to less than 0.01%.
See Accompanying Notes to Financial Statements.
59
Financial Highlights – Columbia Global Value Fund
Selected data for a share outstanding throughout each period is as follows:
| | | | | Year | | Period | | | |
| | | Year Ended
February 28, | | Ended
February 29, | | Ended
February 28, | | Year Ended
March 31, | |
| Class Z Shares | | 2010 | | 2009 | | 2008 | | 2007 (a) | | 2006 (b) | | 2005 | |
| Net Asset Value, Beginning of Period | | $ | 4.18 | | | $ | 9.40 | | | $ | 13.53 | | | $ | 12.72 | | | $ | 12.04 | | | $ | 12.10 | | |
| Income from Investment Operations: | |
| Net investment income (c) | | | 0.10 | | | | 0.21 | | | | 0.23 | (d) | | | 0.17 | | | | 0.20 | | | | 0.14 | | |
Net realized and unrealized gain (loss)
on investments and foreign currency | | | 1.92 | | | | (4.61 | ) | | | (1.23 | ) | | | 2.09 | | | | 1.77 | | | | 0.85 | | |
| Total from investment operations | | | 2.02 | | | | (4.40 | ) | | | (1.00 | ) | | | 2.26 | | | | 1.97 | | | | 0.99 | | |
| Less Distributions to Shareholders: | |
| From net investment income | | | (0.29 | ) | | | (0.03 | ) | | | (0.24 | ) | | | (0.15 | ) | | | (0.20 | ) | | | (0.14 | ) | |
| From net realized gains | | | — | | | | (0.79 | ) | | | (2.89 | ) | | | (1.30 | ) | | | (1.09 | ) | | | (0.91 | ) | |
| Total distributions to shareholders | | | (0.29 | ) | | | (0.82 | ) | | | (3.13 | ) | | | (1.45 | ) | | | (1.29 | ) | | | (1.05 | ) | |
| Redemption Fees: | |
| Redemption fees added to paid-in-capital (e) | | | — | | | | — | | | | — | | | | — | | | | — | | | | — | | |
| Net Asset Value, End of Period | | $ | 5.91 | | | $ | 4.18 | | | $ | 9.40 | | | $ | 13.53 | | | $ | 12.72 | | | $ | 12.04 | | |
| Total return (f) | | | 49.50 | %(g) | | | (51.10 | )%(g) | | | (10.26 | )%(g) | | | 19.54 | %(g)(h) | | | 17.34 | % | | | 8.84 | % | |
Ratios to Average Net Assets/
Supplemental Data: | |
| Net expenses before interest expense | | | 1.37 | % | | | 1.35 | %(i) | | | 1.26 | %(i) | | | 1.28 | %(i)(j) | | | 1.20 | %(i) | | | 1.27 | %(i) | |
| Interest expense | | | — | %(k) | | | — | %(k) | | | — | %(k) | | | — | %(j)(k) | | | — | %(k) | | | — | | |
| Net expenses | | | 1.37 | % | | | 1.35 | %(i) | | | 1.26 | %(i) | | | 1.28 | %(i)(j) | | | 1.20 | %(i) | | | 1.27 | %(i) | |
| Waiver/Reimbursement | | | 0.30 | % | | | 0.03 | % | | | 0.01 | % | | | 0.01 | %(j) | | | — | | | | — | | |
| Net investment income | | | 1.86 | % | | | 2.81 | %(i) | | | 1.77 | %(i) | | | 1.42 | %(i)(j) | | | 1.60 | %(i) | | | 1.19 | %(i) | |
| Portfolio turnover rate | | | 5 | % | | | 10 | % | | | 38 | % | | | 12 | %(h) | | | 16 | % | | | 18 | % | |
| Net assets, end of period (000s) | | $ | 12,296 | | | $ | 20,615 | | | $ | 66,875 | | | $ | 117,125 | | | $ | 117,072 | | | $ | 134,337 | | |
(a) The Fund changed its fiscal year end from March 31 to February 28. Per share data and total return reflect activity from April 1, 2006 through February 28, 2007.
(b) On August 22, 2005, the Fund's Primary A shares were renamed Class Z shares.
(c) Per share data was calculated using the average shares outstanding during the period.
(d) Net investment income per share reflects a special dividend. The effect of this dividend amounted to $0.05 per share.
(e) Rounds to less than $0.01 per share.
(f) Total return at net asset value assuming all distributions reinvested.
(g) Had the investment advisor and/or any of its affiliates not waived fees or reimbursed a portion of expenses, total return would have been reduced.
(h) Not annualized.
(i) The benefits derived from expense reductions had an impact of less than 0.01%.
(j) Annualized.
(k) Rounds to less than 0.01%.
See Accompanying Notes to Financial Statements.
60
Financial Highlights – Columbia International Value Fund
Selected data for a share outstanding throughout each period is as follows:
| | | | | Period | | | |
| | | Year Ended
February 28, | | Ended
February 29, | | Year Ended March 31, | |
| Class A Shares (a) | | 2010 | | 2009 | | 2008 (b) | | 2007 | | 2006 (c) | | 2005 | |
| Net Asset Value, Beginning of Period | | $ | 9.40 | | | $ | 18.95 | | | $ | 26.02 | | | $ | 24.97 | | | $ | 22.34 | | | $ | 20.64 | | |
| Income from Investment Operations: | |
| Net investment income (d) | | | 0.33 | (e) | | | 0.52 | | | | 0.65 | | | | 0.29 | | | | 0.31 | | | | 0.23 | | |
Net realized and unrealized gain (loss)
on investments and foreign currency | | | 3.96 | | | | (7.83 | ) | | | (1.95 | ) | | | 4.34 | | | | 4.73 | | | | 2.51 | | |
| Total from investment operations | | | 4.29 | | | | (7.31 | ) | | | (1.30 | ) | | | 4.63 | | | | 5.04 | | | | 2.74 | | |
| Less Distributions to Shareholders: | |
| From net investment income | | | (0.21 | ) | | | (0.53 | ) | | | (0.68 | ) | | | (0.34 | ) | | | (0.35 | ) | | | (0.25 | ) | |
| From net realized gains | | | — | | | | (1.70 | ) | | | (5.09 | ) | | | (3.24 | ) | | | (2.06 | ) | | | (0.79 | ) | |
| From return of capital | | | — | | | | (0.01 | ) | | | — | | | | — | | | | — | | | | — | | |
| Total distributions to shareholders | | | (0.21 | ) | | | (2.24 | ) | | | (5.77 | ) | | | (3.58 | ) | | | (2.41 | ) | | | (1.04 | ) | |
| Redemption Fees: | |
| Redemption fees added to paid-in-capital (f) | | | — | | | | — | | | | — | | | | — | | | | — | | | | — | | |
| Increase from regulatory settlements | | | — | (f) | | | — | | | | — | | | | — | | | | — | | | | — | | |
| Net Asset Value, End of Period | | $ | 13.48 | | | $ | 9.40 | | | $ | 18.95 | | | $ | 26.02 | | | $ | 24.97 | | | $ | 22.34 | | |
| Total return (g) | | | 45.57 | % | | | (42.59 | )% | | | (7.28 | )%(h) | | | 20.46 | % | | | 24.28 | % | | | 13.38 | % | |
Ratios to Average Net Assets/
Supplemental Data: | |
| Net expenses before interest expense | | | 1.42 | %(i) | | | 1.38 | %(i) | | | 1.32 | %(i)(j) | | | 1.30 | %(i) | | | 1.27 | % | | | 1.33 | % | |
| Interest expense | | | — | %(k) | | | — | %(k) | | | — | %(j)(k) | | | — | %(k) | | | — | %(k) | | | — | | |
| Net expenses | | | 1.42 | %(i) | | | 1.38 | %(i) | | | 1.32 | %(i)(j) | | | 1.30 | %(i) | | | 1.27 | % | | | 1.33 | % | |
| Waiver/Reimbursement | | | — | | | | — | | | | — | | | | — | | | | 0.06 | %(l) | | | 0.07 | %(l) | |
| Net investment income | | | 2.56 | %(i) | | | 3.31 | %(i) | | | 2.71 | %(i)(j) | | | 1.15 | %(i) | | | 1.38 | % | | | 1.10 | % | |
| Net assets, end of period (000s) | | $ | 380,578 | | | $ | 241,097 | | | $ | 868,942 | | | $ | 1,073,616 | | | $ | 1,010,361 | | | $ | 906,848 | | |
(a) The per share amounts and percentages reflect income and expenses assuming inclusion of the Fund's proportionate share of the income and expenses of Columbia International Value Master Portfolio.
(b) The Fund changed its fiscal year end from March 31 to February 29. Per share data and total return reflect activity from April 1, 2007 through February 29, 2008.
(c) On August 22, 2005, the Fund's Investor A shares were renamed Class A shares.
(d) Per share data was calculated using the average shares outstanding during the period.
(e) Net investment income per share reflects a special dividend. The effect of this dividend amounted to $0.13 per share.
(f) Rounds to less than $0.01 per share.
(g) Total return at net asset value assuming all distributions reinvested and no initial sales charge or contingent deferred sales charge.
(h) Not annualized.
(i) The benefits derived from expense reductions had an impact of less than 0.01%.
(j) Annualized.
(k) Rounds to less than 0.01%.
(l) Bank of America Corporation assumed certain non-recurring costs. Absent these non-recurring costs, the waiver/reimbursement ratio would have been -% and 0.04% for the years ended March 31, 2006 and March 31, 2005, respectively.
See Accompanying Notes to Financial Statements.
61
Financial Highlights – Columbia International Value Fund
Selected data for a share outstanding throughout each period is as follows:
| | | | | Period | | | |
| | | Year Ended
February 28, | | Ended
February 29, | | Year Ended March 31, | |
| Class B Shares (a) | | 2010 | | 2009 | | 2008 (b) | | 2007 | | 2006 (c) | | 2005 | |
| Net Asset Value, Beginning of Period | | $ | 9.09 | | | $ | 18.39 | | | $ | 25.43 | | | $ | 24.54 | | | $ | 22.00 | | | $ | 20.35 | | |
| Income from Investment Operations: | |
| Net investment income (d) | | | 0.24 | (e) | | | 0.37 | | | | 0.49 | | | | 0.11 | | | | 0.15 | | | | 0.08 | | |
Net realized and unrealized gain (loss)
on investments and foreign currency | | | 3.82 | | | | (7.53 | ) | | | (1.91 | ) | | | 4.22 | | | | 4.63 | | | | 2.45 | | |
| Total from investment operations | | | 4.06 | | | | (7.16 | ) | | | (1.42 | ) | | | 4.33 | | | | 4.78 | | | | 2.53 | | |
| Less Distributions to Shareholders: | |
| From net investment income | | | (0.13 | ) | | | (0.43 | ) | | | (0.53 | ) | | | (0.20 | ) | | | (0.18 | ) | | | (0.09 | ) | |
| From net realized gains | | | — | | | | (1.70 | ) | | | (5.09 | ) | | | (3.24 | ) | | | (2.06 | ) | | | (0.79 | ) | |
| From return of capital | | | — | | | | (0.01 | ) | | | — | | | | — | | | | — | | | | — | | |
| Total distributions to shareholders | | | (0.13 | ) | | | (2.14 | ) | | | (5.62 | ) | | | (3.44 | ) | | | (2.24 | ) | | | (0.88 | ) | |
| Redemption Fees: | |
| Redemption fees added to paid-in-capital (f) | | | — | | | | — | | | | — | | | | — | | | | — | | | | — | | |
| Increase from regulatory settlements | | | — | (f) | | | — | | | | — | | | | — | | | | — | | | | — | | |
| Net Asset Value, End of Period | | $ | 13.02 | | | $ | 9.09 | | | $ | 18.39 | | | $ | 25.43 | | | $ | 24.54 | | | $ | 22.00 | | |
| Total return (g) | | | 44.61 | % | | | (43.01 | )% | | | (7.90 | )%(h) | | | 19.51 | % | | | 23.36 | % | | | 12.54 | % | |
Ratios to Average Net Assets/
Supplemental Data: | |
| Net expenses before interest expense | | | 2.17 | %(i) | | | 2.13 | %(i) | | | 2.07 | %(i)(j) | | | 2.05 | %(i) | | | 2.02 | % | | | 2.08 | % | |
| Interest expense | | | — | %(k) | | | — | %(k) | | | — | %(j)(k) | | | — | %(k) | | | — | %(k) | | | — | | |
| Net expenses | | | 2.17 | %(i) | | | 2.13 | %(i) | | | 2.07 | %(i)(j) | | | 2.05 | %(i) | | | 2.02 | % | | | 2.08 | % | |
| Waiver/Reimbursement | | | — | | | | — | | | | — | | | | — | | | | 0.06 | %(l) | | | 0.07 | %(l) | |
| Net investment income | | | 1.95 | %(i) | | | 2.43 | %(i) | | | 2.10 | %(i)(j) | | | 0.45 | %(i) | | | 0.67 | % | | | 0.35 | % | |
| Net assets, end of period (000s) | | $ | 8,476 | | | $ | 18,743 | | | $ | 65,705 | | | $ | 110,726 | | | $ | 114,932 | | | $ | 111,402 | | |
(a) The per share amounts and percentages reflect income and expenses assuming inclusion of the Fund's proportionate share of the income and expenses of Columbia International Value Master Portfolio.
(b) The Fund changed its fiscal year end from March 31 to February 29. Per share data and total return reflect activity from April 1, 2007 through February 29, 2008.
(c) On August 22, 2005, the Fund's Investor B shares were renamed Class B shares.
(d) Per share data was calculated using the average shares outstanding during the period.
(e) Net investment income per share reflects a special dividend. The effect of this dividend amounted to $0.13 per share.
(f) Rounds to less than $0.01 per share.
(g) Total return at net asset value assuming all distributions reinvested and no contingent deferred sales charge.
(h) Not annualized.
(i) The benefits derived from expense reductions had an impact of less than 0.01%.
(j) Annualized.
(k) Rounds to less than 0.01%.
(l) Bank of America Corporation assumed certain non-recurring costs. Absent these non-recurring costs, the waiver/reimbursement ratio would have been -% and 0.04% for the years ended March 31, 2006 and March 31, 2005, respectively.
See Accompanying Notes to Financial Statements.
62
Financial Highlights – Columbia International Value Fund
Selected data for a share outstanding throughout each period is as follows:
| | | | | Period | | | |
| | | Year Ended
February 28, | | Ended
February 29, | | Year Ended March 31, | |
| Class C Shares (a) | | 2010 | | 2009 | | 2008 (b) | | 2007 | | 2006 (c) | | 2005 | |
| Net Asset Value, Beginning of Period | | $ | 9.08 | | | $ | 18.37 | | | $ | 25.40 | | | $ | 24.52 | | | $ | 21.98 | | | $ | 20.33 | | |
| Income from Investment Operations: | |
| Net investment income (d) | | | 0.22 | (e) | | | 0.34 | | | | 0.46 | | | | 0.10 | | | | 0.15 | | | | 0.08 | | |
Net realized and unrealized gain (loss)
on investments and foreign currency | | | 3.82 | | | | (7.49 | ) | | | (1.87 | ) | | | 4.22 | | | | 4.63 | | | | 2.45 | | |
| Total from investment operations | | | 4.04 | | | | (7.15 | ) | | | (1.41 | ) | | | 4.32 | | | | 4.78 | | | | 2.53 | | |
| Less Distributions to Shareholders: | |
| From net investment income | | | (0.13 | ) | | | (0.43 | ) | | | (0.53 | ) | | | (0.20 | ) | | | (0.18 | ) | | | (0.09 | ) | |
| From net realized gains | | | — | | | | (1.70 | ) | | | (5.09 | ) | | | (3.24 | ) | | | (2.06 | ) | | | (0.79 | ) | |
| From return of capital | | | — | | | | (0.01 | ) | | | — | | | | — | | | | — | | | | — | | |
| Total distributions to shareholders | | | (0.13 | ) | | | (2.14 | ) | | | (5.62 | ) | | | (3.44 | ) | | | (2.24 | ) | | | (0.88 | ) | |
| Redemption Fees: | |
| Redemption fees added to paid-in-capital (f) | | | — | | | | — | | | | — | | | | — | | | | — | | | | — | | |
| Increase from regulatory settlements | | | — | (f) | | | — | | | | — | | | | — | | | | — | | | | — | | |
| Net Asset Value, End of Period | | $ | 12.99 | | | $ | 9.08 | | | $ | 18.37 | | | $ | 25.40 | | | $ | 24.52 | | | $ | 21.98 | | |
| Total return (g) | | | 44.44 | % | | | (43.00 | )% | | | (7.86 | )%(h) | | | 19.48 | % | | | 23.38 | % | | | 12.54 | % | |
Ratios to Average Net Assets/
Supplemental Data: | |
| Net expenses before interest expense | | | 2.17 | %(i) | | | 2.13 | %(i) | | | 2.07 | %(i)(j) | | | 2.05 | %(i) | | | 2.02 | % | | | 2.08 | % | |
| Interest expense | | | — | %(k) | | | — | %(k) | | | — | %(j)(k) | | | — | %(k) | | | — | %(k) | | | — | | |
| Net expenses | | | 2.17 | %(i) | | | 2.13 | %(i) | | | 2.07 | %(i)(j) | | | 2.05 | %(i) | | | 2.02 | % | | | 2.08 | % | |
| Waiver/Reimbursement | | | — | | | | — | | | | — | | | | — | | | | 0.06 | %(l) | | | 0.07 | %(l) | |
| Net investment income | | | 1.81 | %(i) | | | 2.28 | %(i) | | | 1.99 | %(i)(j) | | | 0.42 | %(i) | | | 0.67 | % | | | 0.35 | % | |
| Net assets, end of period (000s) | | $ | 63,914 | | | $ | 49,750 | | | $ | 127,020 | | | $ | 170,731 | | | $ | 168,819 | | | $ | 162,797 | | |
(a) The per share amounts and percentages reflect income and expenses assuming inclusion of the Fund's proportionate share of the income and expenses of Columbia International Value Master Portfolio.
(b) The Fund changed its fiscal year end from March 31 to February 29. Per share data and total return reflect activity from April 1, 2007 through February 29, 2008.
(c) On August 22, 2005, the Fund's Investor C shares were renamed Class C shares.
(d) Per share data was calculated using the average shares outstanding during the period.
(e) Net investment income per share reflects a special dividend. The effect of this dividend amounted to $0.13 per share.
(f) Rounds to less than $0.01 per share.
(g) Total return at net asset value assuming all distributions reinvested and no contingent deferred sales charge.
(h) Not annualized.
(i) The benefits derived from expense reductions had an impact of less than 0.01%.
(j) Annualized.
(k) Rounds to less than 0.01%.
(l) Bank of America Corporation assumed certain non-recurring costs. Absent these non-recurring costs, the waiver/reimbursement ratio would have been -% and 0.04% for the years ended March 31, 2006 and March 31, 2005, respectively.
See Accompanying Notes to Financial Statements.
63
Financial Highlights – Columbia International Value Fund
Selected data for a share outstanding throughout each period is as follows:
| | | Year Ended
February 28, | | Period
Ended
February 29, | | Year Ended March 31, | |
| Class Z Shares (a) | | 2010 | | 2009 | | 2008 (b) | | 2007 | | 2006 (c) | | 2005 | |
| Net Asset Value, Beginning of Period | | $ | 9.49 | | | $ | 19.10 | | | $ | 26.17 | | | $ | 25.09 | | | $ | 22.42 | | | $ | 20.71 | | |
| Income from Investment Operations: | |
| Net investment income (d) | | | 0.36 | (e) | | | 0.50 | | | | 0.73 | | | | 0.36 | | | | 0.38 | | | | 0.29 | | |
Net realized and unrealized gain (loss)
on investments and foreign currency | | | 4.01 | | | | (7.83 | ) | | | (1.98 | ) | | | 4.35 | | | | 4.75 | | | | 2.51 | | |
| Total from investment operations | | | 4.37 | | | | (7.33 | ) | | | (1.25 | ) | | | 4.71 | | | | 5.13 | | | | 2.80 | | |
| Less Distributions to Shareholders: | |
| From net investment income | | | (0.24 | ) | | | (0.57 | ) | | | (0.73 | ) | | | (0.39 | ) | | | (0.40 | ) | | | (0.30 | ) | |
| From net realized gains | | | — | | | | (1.70 | ) | | | (5.09 | ) | | | (3.24 | ) | | | (2.06 | ) | | | (0.79 | ) | |
| From return of capital | | | — | | | | (0.01 | ) | | | — | | | | — | | | | — | | | | — | | |
| Total distributions to shareholders | | | (0.24 | ) | | | (2.28 | ) | | | (5.82 | ) | | | (3.63 | ) | | | (2.46 | ) | | | (1.09 | ) | |
| Redemption Fees: | |
| Redemption fees added to paid-in-capital (f) | | | — | | | | — | | | | — | | | | — | | | | — | | | | — | | |
| Increase from regulatory settlements | | | — | (f) | | | — | | | | — | | | | — | | | | — | | | | — | | |
| Net Asset Value, End of Period | | $ | 13.62 | | | $ | 9.49 | | | $ | 19.10 | | | $ | 26.17 | | | $ | 25.09 | | | $ | 22.42 | | |
| Total return (g) | | | 45.94 | % | | | (42.41 | )% | | | (7.05 | )%(h) | | | 20.70 | % | | | 24.66 | % | | | 13.63 | % | |
Ratios to Average Net Assets/
Supplemental Data: | |
| Net expenses before interest expense | | | 1.17 | %(i) | | | 1.13 | %(i) | | | 1.07 | %(i)(j) | | | 1.05 | %(i) | | | 1.02 | % | | | 1.08 | % | |
| Interest expense | | | — | %(k) | | | — | %(k) | | | — | %(j)(k) | | | — | %(k) | | | — | %(k) | | | — | | |
| Net expenses | | | 1.17 | %(i) | | | 1.13 | %(i) | | | 1.07 | %(i)(j) | | | 1.05 | %(i) | | | 1.02 | % | | | 1.08 | % | |
| Waiver/Reimbursement | | | — | | | | — | | | | — | | | | — | | | | 0.06 | %(l) | | | 0.07 | %(l) | |
| Net investment income | | | 2.76 | %(i) | | | 3.20 | %(i) | | | 3.04 | %(i)(j) | | | 1.43 | %(i) | | | 1.69 | % | | | 1.35 | % | |
| Net assets, end of period (000s) | | $ | 1,187,812 | | | $ | 844,122 | | | $ | 1,886,808 | | | $ | 2,651,855 | | | $ | 2,585,390 | | | $ | 2,577,677 | | |
(a) The per share amounts and percentages reflect income and expenses assuming inclusion of the Fund's proportionate share of the income and expenses of Columbia International Value Master Portfolio.
(b) The Fund changed its fiscal year end from March 31 to February 29. Per share data and total return reflect activity from April 1, 2007 through February 29, 2008.
(c) On August 22, 2005, the Fund's Primary A shares were renamed Class Z shares.
(d) Per share data was calculated using the average shares outstanding during the period.
(e) Net investment income per share reflects a special dividend. The effect of this dividend amounted to $0.13 per share.
(f) Rounds to less than $0.01 per share.
(g) Total return at net asset value assuming all distributions reinvested.
(h) Not annualized.
(i) The benefits derived from expense reductions had an impact of less than 0.01%.
(j) Annualized.
(k) Rounds to less than 0.01%.
(l) Bank of America Corporation assumed certain non-recurring costs. Absent these non-recurring costs, the waiver/reimbursement ratio would have been -% and 0.04% for the years ended March 31, 2006 and March 31, 2005, respectively.
See Accompanying Notes to Financial Statements.
64
Financial Highlights – Columbia Marsico Global Fund
Selected data for a share outstanding throughout each period is as follows:
| Class A Shares | | Year Ended
February 28,
2010 | | Period Ended
February 28,
2009 (a) | |
| Net Asset Value, Beginning of Period | | $ | 4.98 | | | $ | 10.00 | | |
| Income from Investment Operations: | |
| Net investment income (loss) (b) | | | (0.03 | ) | | | 0.01 | | |
Net realized and unrealized gain (loss) on investments and
foreign currency | | | 2.93 | | | | (5.03 | ) | |
| Total from investment operations | | | 2.90 | | | | (5.02 | ) | |
| Less Distributions to Shareholders: | |
| From net investment income | | | (0.03 | ) | | | — | | |
| Redemption Fees: | |
| Redemption fees added to paid-in-capital (c) | | | — | | | | — | | |
| Net Asset Value, End of Period | | $ | 7.85 | | | $ | 4.98 | | |
| Total return (d)(e) | | | 58.22 | % | | | (50.20 | )%(f) | |
| Ratios to Average Net Assets/Supplemental Data: | |
| Net expenses | | | 1.60 | %(g) | | | 1.60 | %(h)(i) | |
| Waiver/Reimbursement | | | 3.84 | % | | | 7.19 | %(h) | |
| Net investment income (loss) | | | (0.42 | )%(g) | | | 0.09 | %(h)(i) | |
| Portfolio turnover rate | | | 137 | % | | | 168 | %(f) | |
| Net assets, end of period (000s) | | $ | 1,990 | | | $ | 1,113 | | |
(a) Class A shares commenced operations on April 30, 2008. Per share data and total return reflect activity from that date.
(b) Per share data was calculated using the average shares outstanding during the period.
(c) Rounds to less than $0.01 per share.
(d) Total return at net asset value assuming all distributions reinvested and no initial sales charge or contingent deferred sales charge.
(e) Had the investment advisor and/or any of its affiliates not waived fees or reimbursed a portion of expenses, total return would have been reduced.
(f) Not annualized.
(g) The benefits derived from expense reductions had an impact of less than 0.01%.
(h) Annualized.
(i) The benefits derived from expense reductions had an impact of 0.01%.
See Accompanying Notes to Financial Statements.
65
Financial Highlights – Columbia Marsico Global Fund
Selected data for a share outstanding throughout each period is as follows:
| Class C Shares | | Year Ended
February 28,
2010 | | Period Ended
February 28,
2009 (a) | |
| Net Asset Value, Beginning of Period | | $ | 4.95 | | | $ | 10.00 | | |
| Income from Investment Operations: | |
| Net investment loss (b) | | | (0.08 | ) | | | (0.04 | ) | |
Net realized and unrealized gain (loss) on investments and
foreign currency | | | 2.91 | | | | (5.01 | ) | |
| Total from investment operations | | | 2.83 | | | | (5.05 | ) | |
| Redemption Fees: | |
| Redemption fees added to paid-in-capital (c) | | | — | | | | — | | |
| Net Asset Value, End of Period | | $ | 7.78 | | | $ | 4.95 | | |
| Total return (d)(e) | | | 57.17 | % | | | (50.50 | )%(f) | |
| Ratios to Average Net Assets/Supplemental Data: | |
| Net expenses | | | 2.35 | %(g) | | | 2.35 | %(h)(i) | |
| Waiver/Reimbursement | | | 3.84 | % | | | 7.19 | %(h) | |
| Net investment loss | | | (1.15 | )%(g) | | | (0.63 | )%(h)(i) | |
| Portfolio turnover rate | | | 137 | % | | | 168 | %(f) | |
| Net assets, end of period (000s) | | $ | 1,426 | | | $ | 886 | | |
(a) Class C shares commenced operations on April 30, 2008. Per share data and total return reflect activity from that date.
(b) Per share data was calculated using the average shares outstanding during the period.
(c) Rounds to less than $0.01 per share.
(d) Total return at net asset value assuming no contingent deferred sales charge.
(e) Had the investment advisor and/or any of its affiliates not waived fees or reimbursed a portion of expenses, total return would have been reduced.
(f) Not annualized.
(g) The benefits derived from expense reductions had an impact of less than 0.01%.
(h) Annualized.
(i) The benefits derived from expense reductions had an impact of 0.01%.
See Accompanying Notes to Financial Statements.
66
Financial Highlights – Columbia Marsico Global Fund
Selected data for a share outstanding throughout each period is as follows:
| Class R Shares | | Year Ended
February 28,
2010 | | Period Ended
February 28,
2009 (a) | |
| Net Asset Value, Beginning of Period | | $ | 4.97 | | | $ | 10.00 | | |
| Income from Investment Operations: | |
| Net investment loss (b) | | | (0.05 | ) | | | (0.01 | ) | |
Net realized and unrealized gain (loss) on investments and
foreign currency | | | 2.93 | | | | (5.02 | ) | |
| Total from investment operations | | | 2.88 | | | | (5.03 | ) | |
| Less Distributions to Shareholders: | |
| From net investment income | | | (0.02 | ) | | | — | | |
| Redemption Fees: | |
| Redemption fees added to paid-in-capital (c) | | | — | | | | — | | |
| Net Asset Value, End of Period | | $ | 7.83 | | | $ | 4.97 | | |
| Total return (d)(e) | | | 57.86 | % | | | (50.30 | )%(f) | |
| Ratios to Average Net Assets/Supplemental Data: | |
| Net expenses | | | 1.85 | %(g) | | | 1.85 | %(h)(i) | |
| Waiver/Reimbursement | | | 3.84 | % | | | 7.19 | %(h) | |
| Net investment loss | | | (0.62 | )%(g) | | | (0.12 | )%(h)(i) | |
| Portfolio turnover rate | | | 137 | % | | | 168 | %(f) | |
| Net assets, end of period (000s) | | $ | 984 | | | $ | 621 | | |
(a) Class R shares commenced operations on April 30, 2008. Per share data and total return reflect activity from that date.
(b) Per share data was calculated using the average shares outstanding during the period.
(c) Rounds to less than $0.01 per share.
(d) Total return at net asset value assuming all distributions reinvested.
(e) Had the investment advisor and/or any of its affiliates not waived fees or reimbursed a portion of expenses, total return would have been reduced.
(f) Not annualized.
(g) The benefits derived from expense reductions had an impact of less than 0.01%.
(h) Annualized.
(i) The benefits derived from expense reductions had an impact of 0.01%.
See Accompanying Notes to Financial Statements.
67
Financial Highlights – Columbia Marsico Global Fund
Selected data for a share outstanding throughout each period is as follows:
| Class Z Shares | | Year Ended
February 28,
2010 | | Period Ended
February 28,
2009 (a) | |
| Net Asset Value, Beginning of Period | | $ | 4.99 | | | $ | 10.00 | | |
| Income from Investment Operations: | |
| Net investment income (loss) (b) | | | (0.01 | ) | | | 0.02 | | |
Net realized and unrealized gain (loss) on investments and
foreign currency | | | 2.94 | | | | (5.03 | ) | |
| Total from investment operations | | | 2.93 | | | | (5.01 | ) | |
| Less Distributions to Shareholders: | |
| From net investment income | | | (0.04 | ) | | | — | | |
| Redemption Fees: | |
| Redemption fees added to paid-in-capital (c) | | | — | | | | — | | |
| Net Asset Value, End of Period | | $ | 7.88 | | | $ | 4.99 | | |
| Total return (d)(e) | | | 58.79 | % | | | (50.10 | )%(f) | |
| Ratios to Average Net Assets/Supplemental Data: | |
| Net expenses | | | 1.35 | %(g) | | | 1.35 | %(h)(i) | |
| Waiver/Reimbursement | | | 3.84 | % | | | 7.19 | %(h) | |
| Net investment income (loss) | | | (0.13 | )%(g) | | | 0.35 | %(h)(i) | |
| Portfolio turnover rate | | | 137 | % | | | 168 | %(f) | |
| Net assets, end of period (000s) | | $ | 1,136 | | | $ | 707 | | |
(a) Class Z shares commenced operations on April 30, 2008. Per share data and total return reflect activity from that date.
(b) Per share data was calculated using the average shares outstanding during the period.
(c) Rounds to less than $0.01 per share.
(d) Total return at net asset value assuming all distributions reinvested.
(e) Had the investment advisor and/or any of its affiliates not waived fees or reimbursed a portion of expenses, total return would have been reduced.
(f) Not annualized.
(g) The benefits derived from expense reductions had an impact of less than 0.01%.
(h) Annualized.
(i) The benefits derived from expense reductions had an impact of 0.01%.
See Accompanying Notes to Financial Statements.
68
Financial Highlights – Columbia Marsico International Opportunities Fund
Selected data for a share outstanding throughout each period is as follows:
| | | Year Ended | | Year
Ended | | Period
Ended | | Year Ended | |
| | | February 28, | | February 29, | | February 28, | | March 31, | |
| Class A Shares | | 2010 | | 2009 | | 2008 | | 2007 (a) | | 2006 (b) | | 2005 | |
| Net Asset Value, Beginning of Period | | $ | 6.76 | | | $ | 14.58 | | | $ | 14.85 | | | $ | 14.67 | | | $ | 11.41 | | | $ | 11.05 | | |
| Income from Investment Operations: | |
| Net investment income (c) | | | 0.05 | | | | 0.12 | (d) | | | 0.14 | (e) | | | — | (f) | | | 0.09 | | | | 0.05 | | |
Net realized and unrealized gain (loss)
on investments and foreign currency | | | 3.44 | | | | (7.82 | ) | | | 1.54 | | | | 1.38 | | | | 3.74 | | | | 0.51 | | |
| Total from investment operations | | | 3.49 | | | | (7.70 | ) | | | 1.68 | | | | 1.38 | | | | 3.83 | | | | 0.56 | | |
| Less Distributions to Shareholders: | |
| From net investment income | | | (0.25 | ) | | | — | | | | (0.16 | ) | | | (0.04 | ) | | | (0.10 | ) | | | (0.04 | ) | |
| From net realized gains | | | — | | | | (0.12 | ) | | | (1.79 | ) | | | (1.16 | ) | | | (0.47 | ) | | | (0.16 | ) | |
| Total distributions to shareholders | | | (0.25 | ) | | | (0.12 | ) | | | (1.95 | ) | | | (1.20 | ) | | | (0.57 | ) | | | (0.20 | ) | |
| Redemption Fees: | |
| Redemption fees added to paid-in-capital (f) | | | — | | | | — | | | | — | | | | — | | | | — | | | | — | | |
| Net Asset Value, End of Period | | $ | 10.00 | | | $ | 6.76 | | | $ | 14.58 | | | $ | 14.85 | | | $ | 14.67 | | | $ | 11.41 | | |
| Total return (g) | | | 51.97 | % | | | (53.26 | )% | | | 10.55 | % | | | 10.52 | %(h) | | | 35.26 | % | | | 5.24 | % | |
Ratios to Average Net Assets/
Supplemental Data: | |
| Net expenses before interest expense (i) | | | 1.47 | % | | | 1.52 | % | | | 1.44 | % | | | 1.40 | %(j) | | | 1.34 | % | | | 1.37 | % | |
| Interest expense | | | — | | | | — | | | | — | | | | — | %(j)(k) | | | — | %(k) | | | — | %(k) | |
| Net expenses (i) | | | 1.47 | % | | | 1.52 | % | | | 1.44 | % | | | 1.40 | %(j) | | | 1.34 | % | | | 1.37 | % | |
| Net investment income (loss) (i) | | | 0.50 | % | | | 1.05 | % | | | 0.90 | % | | | (0.03 | )%(j) | | | 0.74 | % | | | 0.47 | % | |
| Portfolio turnover rate | | | 116 | % | | | 117 | % | | | 116 | % | | | 109 | %(h) | | | 118 | % | | | 165 | % | |
| Net assets, end of period (000s) | | $ | 168,801 | | | $ | 198,012 | | | $ | 599,356 | | | $ | 452,047 | | | $ | 150,043 | | | $ | 52,794 | | |
(a) The Fund changed its fiscal year end from March 31 to February 28. Per share data and total return reflect activity from April 1, 2006 through February 28, 2007.
(b) On August 22, 2005, the Fund's Investor A shares were renamed Class A shares.
(c) Per share data was calculated using the average shares outstanding during the period.
(d) Net investment income per share reflects special dividends. The effect of these dvidends amounted to $0.03 per share.
(e) Net investment income per share reflects special dividends. The effect of these dvidends amounted to $0.04 per share.
(f) Rounds to less than $0.01 per share.
(g) Total return at net asset value assuming all distributions reinvested and no initial sales charge or contingent deferred sales charge.
(h) Not annualized.
(i) The benefits derived from expense reductions had an impact of less than 0.01%.
(j) Annualized.
(k) Rounds to less than 0.01%.
See Accompanying Notes to Financial Statements.
69
Financial Highlights – Columbia Marsico International Opportunities Fund
Selected data for a share outstanding throughout each period is as follows:
| | | Year Ended | | Year
Ended | | Period
Ended | | Year Ended | |
| | | February 28, | | February 29, | | February 28, | | March 31, | |
| Class B Shares | | 2010 | | 2009 | | 2008 | | 2007 (a) | | 2006 (b) | | 2005 | |
| Net Asset Value, Beginning of Period | | $ | 6.38 | | | $ | 13.87 | | | $ | 14.23 | | | $ | 14.17 | | | $ | 11.05 | | | $ | 10.75 | | |
| Income from Investment Operations: | |
| Net investment income (loss) (c) | | | (0.03 | ) | | | 0.03 | (d) | | | 0.03 | (e) | | | (0.08 | ) | | | 0.01 | | | | (0.03 | ) | |
Net realized and unrealized gain (loss)
on investments and foreign currency | | | 3.27 | | | | (7.40 | ) | | | 1.46 | | | | 1.30 | | | | 3.59 | | | | 0.49 | | |
| Total from investment operations | | | 3.24 | | | | (7.37 | ) | | | 1.49 | | | | 1.22 | | | | 3.60 | | | | 0.46 | | |
| Less Distributions to Shareholders: | |
| From net investment income | | | (0.11 | ) | | | — | | | | (0.06 | ) | | | — | | | | (0.01 | ) | | | — | | |
| From net realized gains | | | — | | | | (0.12 | ) | | | (1.79 | ) | | | (1.16 | ) | | | (0.47 | ) | | | (0.16 | ) | |
| Total distributions to shareholders | | | (0.11 | ) | | | (0.12 | ) | | | (1.85 | ) | | | (1.16 | ) | | | (0.48 | ) | | | (0.16 | ) | |
| Redemption Fees: | |
| Redemption fees added to paid-in-capital (f) | | | — | | | | — | | | | — | | | | — | | | | — | | | | — | | |
| Net Asset Value, End of Period | | $ | 9.51 | | | $ | 6.38 | | | $ | 13.87 | | | $ | 14.23 | | | $ | 14.17 | | | $ | 11.05 | | |
| Total return (g) | | | 50.91 | % | | | (53.60 | )% | | | 9.68 | % | | | 9.76 | %(h) | | | 34.22 | % | | | 4.45 | % | |
Ratios to Average Net Assets/
Supplemental Data: | |
| Net expenses before interest expense (i) | | | 2.22 | % | | | 2.27 | % | | | 2.19 | % | | | 2.15 | %(j) | | | 2.09 | % | | | 2.12 | % | |
| Interest expense | | | — | | | | — | | | | — | | | | — | %(j)(k) | | | — | %(k) | | | — | | |
| Net expenses (i) | | | 2.22 | % | | | 2.27 | % | | | 2.19 | % | | | 2.15 | %(j) | | | 2.09 | % | | | 2.12 | % | |
| Net investment income (loss) (i) | | | (0.35 | )% | | | 0.32 | % | | | 0.22 | % | | | (0.63 | )%(j) | | | 0.12 | % | | | (0.28 | )% | |
| Portfolio turnover rate | | | 116 | % | | | 117 | % | | | 116 | % | | | 109 | %(h) | | | 118 | % | | | 165 | % | |
| Net assets, end of period (000s) | | $ | 17,810 | | | $ | 15,281 | | | $ | 44,224 | | | $ | 40,953 | | | $ | 28,883 | | | $ | 16,618 | | |
(a) The Fund changed its fiscal year end from March 31 to February 28. Per share data and total return reflect activity from April 1, 2006 through February 28, 2007.
(b) On August 22, 2005, the Fund's Investor B shares were renamed Class B shares.
(c) Per share data was calculated using the average shares outstanding during the period.
(d) Net investment income per share reflects special dividends. The effect of these dvidends amounted to $0.03 per share.
(e) Net investment income per share reflects special dividends. The effect of these dvidends amounted to $0.04 per share.
(f) Rounds to less than $0.01 per share.
(g) Total return at net asset value assuming all distributions reinvested and no contingent deferred sales charge.
(h) Not annualized.
(i) The benefits derived from expense reductions had an impact of less than 0.01%.
(j) Annualized.
(k) Rounds to less than 0.01%.
See Accompanying Notes to Financial Statements.
70
Financial Highlights – Columbia Marsico International Opportunities Fund
Selected data for a share outstanding throughout each period is as follows:
| | | Year Ended | | Year
Ended | | Period
Ended | | Year Ended | |
| | | February 28, | | February 29, | | February 28, | | March 31, | |
| Class C Shares | | 2010 | | 2009 | | 2008 | | 2007 (a) | | 2006 (b) | | 2005 | |
| Net Asset Value, Beginning of Period | | $ | 6.39 | | | $ | 13.88 | | | $ | 14.24 | | | $ | 14.18 | | | $ | 11.05 | | | $ | 10.75 | | |
| Income from Investment Operations: | |
| Net investment income (loss) (c) | | | (0.03 | ) | | | 0.03 | (d) | | | 0.02 | (e) | | | (0.09 | ) | | | 0.01 | | | | (0.03 | ) | |
Net realized and unrealized gain (loss)
on investments and foreign currency | | | 3.26 | | | | (7.40 | ) | | | 1.47 | | | | 1.31 | | | | 3.60 | | | | 0.49 | | |
| Total from investment operations | | | 3.23 | | | | (7.37 | ) | | | 1.49 | | | | 1.22 | | | | 3.61 | | | | 0.46 | | |
| Less Distributions to Shareholders: | |
| From net investment income | | | (0.11 | ) | | | — | | | | (0.06 | ) | | | — | | | | (0.01 | ) | | | — | | |
| From net realized gains | | | — | | | | (0.12 | ) | | | (1.79 | ) | | | (1.16 | ) | | | (0.47 | ) | | | (0.16 | ) | |
| Total distributions to shareholders | | | (0.11 | ) | | | (0.12 | ) | | | (1.85 | ) | | | (1.16 | ) | | | (0.48 | ) | | | (0.16 | ) | |
| Redemption Fees: | |
| Redemption fees added to paid-in-capital (f) | | | — | | | | — | | | | — | | | | — | | | | — | | | | — | | |
| Net Asset Value, End of Period | | $ | 9.51 | | | $ | 6.39 | | | $ | 13.88 | | | $ | 14.24 | | | $ | 14.18 | | | $ | 11.05 | | |
| Total return (g) | | | 50.67 | % | | | (53.57 | )% | | | 9.67 | % | | | 9.76 | %(h) | | | 34.32 | % | | | 4.45 | % | |
Ratios to Average Net Assets/
Supplemental Data: | |
| Net expenses before interest expense (i) | | | 2.22 | % | | | 2.27 | % | | | 2.19 | % | | | 2.15 | %(j) | | | 2.09 | % | | | 2.12 | % | |
| Interest expense | | | — | | | | — | | | | — | | | | — | %(j)(k) | | | — | %(k) | | | — | | |
| Net expenses (i) | | | 2.22 | % | | | 2.27 | % | | | 2.19 | % | | | 2.15 | %(j) | | | 2.09 | % | | | 2.12 | % | |
| Net investment income (loss) (i) | | | (0.35 | )% | | | 0.30 | % | | | 0.16 | % | | | (0.69 | )%(j) | | | 0.05 | % | | | (0.28 | )% | |
| Portfolio turnover rate | | | 116 | % | | | 117 | % | | | 116 | % | | | 109 | %(h) | | | 118 | % | | | 165 | % | |
| Net assets, end of period (000s) | | $ | 44,466 | | | $ | 38,668 | | | $ | 109,553 | | | $ | 86,563 | | | $ | 46,365 | | | $ | 19,530 | | |
(a) The Fund changed its fiscal year end from March 31 to February 28. Per share data and total return reflect activity from April 1, 2006 through February 28, 2007.
(b) On August 22, 2005, the Fund's Investor C shares were renamed Class C shares.
(c) Per share data was calculated using the average shares outstanding during the period.
(d) Net investment income per share reflects special dividends. The effect of these dvidends amounted to $0.03 per share.
(e) Net investment income per share reflects special dividends. The effect of these dvidends amounted to $0.04 per share.
(f) Rounds to less than $0.01 per share.
(g) Total return at net asset value assuming all distributions reinvested and no contingent deferred sales charge.
(h) Not annualized.
(i) The benefits derived from expense reductions had an impact of less than 0.01%.
(j) Annualized.
(k) Rounds to less than 0.01%.
See Accompanying Notes to Financial Statements.
71
Financial Highlights – Columbia Marsico International Opportunities Fund
Selected data for a share outstanding throughout each period is as follows:
| | | Year Ended | | Year
Ended | | Period
Ended | | Period
Ended | |
| | | February 28, | | February 29, | | February 28, | | March 31, | |
| Class R Shares | | 2010 | | 2009 | | 2008 | | 2007 (a) | | 2006 (b) | |
| Net Asset Value, Beginning of Period | | $ | 6.73 | | | $ | 14.56 | | | $ | 14.84 | | | $ | 14.67 | | | $ | 13.76 | | |
| Income from Investment Operations: | |
| Net investment income (loss) (c) | | | 0.01 | | | | 0.06 | (d) | | | 0.08 | (e) | | | (0.17 | ) | | | (0.01 | ) | |
Net realized and unrealized gain (loss)
on investments and foreign currency | | | 3.45 | | | | (7.77 | ) | | | 1.56 | | | | 1.51 | | | | 0.92 | | |
| Total from investment operations | | | 3.46 | | | | (7.71 | ) | | | 1.64 | | | | 1.34 | | | | 0.91 | | |
| Less Distributions to Shareholders: | |
| From net investment income | | | (0.20 | ) | | | — | | | | (0.13 | ) | | | (0.01 | ) | | | — | | |
| From net realized gains | | | — | | | | (0.12 | ) | | | (1.79 | ) | | | (1.16 | ) | | | — | | |
| Total distributions to shareholders | | | (0.20 | ) | | | (0.12 | ) | | | (1.92 | ) | | | (1.17 | ) | | | — | | |
| Redemption Fees: | |
| Redemption fees added to paid-in-capital (f) | | | — | | | | — | | | | — | | | | — | | | | — | | |
| Net Asset Value, End of Period | | $ | 9.99 | | | $ | 6.73 | | | $ | 14.56 | | | $ | 14.84 | | | $ | 14.67 | | |
| Total return (g) | | | 51.73 | % | | | (53.40 | )% | | | 10.26 | % | | | 10.25 | %(h) | | | 6.61 | %(h) | |
Ratios to Average Net Assets/
Supplemental Data: | |
| Net expenses before interest expense (i) | | | 1.72 | % | | | 1.77 | % | | | 1.69 | % | | | 1.65 | %(j) | | | 1.64 | %(j) | |
| Interest expense | | | — | | | | — | | | | — | | | | — | %(j)(k) | | | — | %(j)(k) | |
| Net expenses (i) | | | 1.72 | % | | | 1.77 | % | | | 1.69 | % | | | 1.65 | %(j) | | | 1.64 | %(j) | |
| Net investment income (loss) (i) | | | 0.15 | % | | | 0.58 | % | | | 0.51 | % | | | (1.26 | )%(j) | | | (0.30 | )%(j) | |
| Portfolio turnover rate | | | 116 | % | | | 117 | % | | | 116 | % | | | 109 | %(h) | | | 118 | %(h) | |
| Net assets, end of period (000s) | | $ | 3,327 | | | $ | 2,592 | | | $ | 3,724 | | | $ | 2,037 | | | $ | 11 | | |
(a) The Fund changed its fiscal year end from March 31 to February 28. Per share data and total return reflect activity from April 1, 2006 through February 28, 2007.
(b) Class R shares commenced operations on January 23, 2006.
(c) Per share data was calculated using the average shares outstanding during the period.
(d) Net investment income per share reflects special dividends. The effect of these dividends amounted to $0.03 per share.
(e) Net investment income per share reflects special dividends. The effect of these dividends amounted to $0.04 per share.
(f) Rounds to less than $0.01 per share.
(g) Total return at net asset value assuming all distributions reinvested.
(h) Not annualized.
(i) The benefits derived from expense reductions had an impact of less than 0.01%.
(j) Annualized.
(k) Rounds to less than 0.01%.
See Accompanying Notes to Financial Statements.
72
Financial Highlights – Columbia Marsico International Opportunities Fund
Selected data for a share outstanding throughout each period is as follows:
| | | Year Ended | | Year
Ended | | Period
Ended | | Year Ended | |
| | | February 28, | | February 29, | | February 28, | | March 31, | |
| Class Z Shares | | 2010 | | 2009 | | 2008 | | 2007 (a) | | 2006 (b) | | 2005 | |
| Net Asset Value, Beginning of Period | | $ | 6.87 | | | $ | 14.79 | | | $ | 15.04 | | | $ | 14.83 | | | $ | 11.53 | | | $ | 11.15 | | |
| Income from Investment Operations: | |
| Net investment income (c) | | | 0.06 | | | | 0.15 | (d) | | | 0.20 | (e) | | | 0.05 | | | | 0.13 | | | | 0.08 | | |
Net realized and unrealized gain (loss)
on investments and foreign currency | | | 3.52 | | | | (7.95 | ) | | | 1.54 | | | | 1.39 | | | | 3.77 | | | | 0.52 | | |
| Total from investment operations | | | 3.58 | | | | (7.80 | ) | | | 1.74 | | | | 1.44 | | | | 3.90 | | | | 0.60 | | |
| Less Distributions to Shareholders: | |
| From net investment income | | | (0.30 | ) | | | — | | | | (0.20 | ) | | | (0.07 | ) | | | (0.13 | ) | | | (0.06 | ) | |
| From net realized gains | | | — | | | | (0.12 | ) | | | (1.79 | ) | | | (1.16 | ) | | | (0.47 | ) | | | (0.16 | ) | |
| Total distributions to shareholders | | | (0.30 | ) | | | (0.12 | ) | | | (1.99 | ) | | | (1.23 | ) | | | (0.60 | ) | | | (0.22 | ) | |
| Redemption Fees: | |
| Redemption fees added to paid-in-capital (f) | | | — | | | | — | | | | — | | | | — | | | | — | | | | — | | |
| Net Asset Value, End of Period | | $ | 10.15 | | | $ | 6.87 | | | $ | 14.79 | | | $ | 15.04 | | | $ | 14.83 | | | $ | 11.53 | | |
| Total return (g) | | | 52.47 | % | | | (53.17 | )% | | | 10.77 | % | | | 10.81 | %(h) | | | 35.53 | % | | | 5.55 | % | |
Ratios to Average Net Assets/
Supplemental Data: | |
| Net expenses before interest expense (i) | | | 1.22 | % | | | 1.27 | % | | | 1.19 | % | | | 1.15 | %(j) | | | 1.09 | % | | | 1.12 | % | |
| Interest expense | | | — | | | | — | | | | — | | | | — | %(j)(k) | | | — | %(k) | | | — | | |
| Net expenses (i) | | | 1.22 | % | | | 1.27 | % | | | 1.19 | % | | | 1.15 | %(j) | | | 1.09 | % | | | 1.12 | % | |
| Net investment income (i) | | | 0.65 | % | | | 1.32 | % | | | 1.23 | % | | | 0.37 | %(j) | | | 1.08 | % | | | 0.72 | % | |
| Portfolio turnover rate | | | 116 | % | | | 117 | % | | | 116 | % | | | 109 | %(h) | | | 118 | % | | | 165 | % | |
| Net assets, end of period (000s) | | $ | 968,569 | | | $ | 824,068 | | | $ | 2,491,232 | | | $ | 2,322,301 | | | $ | 1,744,737 | | | $ | 991,889 | | |
(a) The Fund changed its fiscal year end from March 31 to February 28. Per share data and total return reflect activity from April 1, 2006 through February 28, 2007.
(b) On August 22, 2005, the Fund's Primary A shares were renamed Class Z shares.
(c) Per share data was calculated using the average shares outstanding during the period.
(d) Net investment income per share reflects special dividends. The effect of these dividends amounted to $0.03 per share.
(e) Net investment income per share reflects special dividends. The effect of these dividends amounted to $0.04 per share.
(f) Rounds to less than $0.01 per share.
(g) Total return at net asset value assuming all distributions reinvested.
(h) Not annualized.
(i) The benefits derived from expense reductions had an impact of less than 0.01%.
(j) Annualized.
(k) Rounds to less than 0.01%.
See Accompanying Notes to Financial Statements.
73
Financial Highlights – Columbia Multi-Advisor International Equity Fund
Selected data for a share outstanding throughout each period is as follows:
| | | Year Ended | | Year
Ended | | Period
Ended | |
Year Ended | |
| | | February 28, | | February 29, | | February 28, | | March 31, | |
| Class A Shares | | 2010 | | 2009 | | 2008 | | 2007 (a) | | 2006 (b) | | 2005 | |
| Net Asset Value, Beginning of Period | | $ | 7.44 | | | $ | 15.77 | | | $ | 17.12 | | | $ | 16.39 | | | $ | 13.30 | | | $ | 12.00 | | |
| Income from Investment Operations: | |
| Net investment income (c) | | | 0.13 | | | | 0.26 | | | | 0.28 | | | | 0.16 | | | | 0.21 | | | | 0.13 | | |
Net realized and unrealized gain (loss)
on investments, foreign currency,
foreign capital gains tax
and written options | | | 3.51 | | | | (8.33 | ) | | | 0.76 | | | | 1.91 | | | | 3.20 | | | | 1.18 | | |
| Total from investment operations | | | 3.64 | | | | (8.07 | ) | | | 1.04 | | | | 2.07 | | | | 3.41 | | | | 1.31 | | |
| Less Distributions to Shareholders: | |
| From net investment income | | | (0.43 | ) | | | (0.07 | ) | | | (0.28 | ) | | | (0.18 | ) | | | (0.27 | ) | | | (0.01 | ) | |
| From net realized gains | | | — | | | | (0.19 | ) | | | (2.11 | ) | | | (1.16 | ) | | | (0.05 | ) | | | — | | |
| Total distributions to shareholders | | | (0.43 | ) | | | (0.26 | ) | | | (2.39 | ) | | | (1.34 | ) | | | (0.32 | ) | | | (0.01 | ) | |
| Redemption Fees: | |
| Redemption fees added to paid-in-capital (d) | | | — | | | | — | | | | — | | | | — | | | | — | | | | — | | |
| Increase from regulatory settlements | | | 0.03 | | | | — | | | | — | | | | — | | | | — | | | | — | | |
| Net Asset Value, End of Period | | $ | 10.68 | | | $ | 7.44 | | | $ | 15.77 | | | $ | 17.12 | | | $ | 16.39 | | | $ | 13.30 | | |
| Total return (e) | | | 49.61 | % | | | (51.87 | )% | | | 5.14 | % | | | 13.55 | %(f) | | | 25.86 | % | | | 10.88 | % | |
Ratios to Average Net Assets/
Supplemental Data: | |
| Net expenses before interest expense | | | 1.26 | %(g) | | | 1.27 | %(g) | | | 1.19 | %(g) | | | 1.15 | %(g)(h) | | | 1.14 | %(i) | | | 1.26 | %(g) | |
| Interest expense | | | — | %(j) | | | — | | | | — | %(j) | | | — | %(h)(j) | | | — | | | | — | %(j) | |
| Net expenses | | | 1.26 | %(g) | | | 1.27 | %(g) | | | 1.19 | %(g) | | | 1.15 | %(g)(h) | | | 1.14 | %(i) | | | 1.26 | %(g) | |
| Waiver/Reimbursement | | | — | | | | — | | | | — | | | | — | | | | 0.08 | %(k) | | | 0.12 | %(k) | |
| Net investment income | | | 1.26 | %(g) | | | 2.05 | %(g) | | | 1.56 | %(g) | | | 1.06 | %(g)(h) | | | 1.43 | %(i) | | | 1.01 | %(g) | |
| Portfolio turnover rate | | | 127 | % | | | 83 | % | | | 78 | % | | | 73 | %(f) | | | 74 | % | | | 153 | % | |
| Net assets, end of period (000s) | | $ | 24,243 | | | $ | 16,936 | | | $ | 41,660 | | | $ | 42,865 | | | $ | 39,330 | | | $ | 28,527 | | |
(a) The Fund changed its fiscal year end from March 31 to February 28. Per share data and total return reflect activity from April 1, 2006 through February 28, 2007.
(b) On August 22, 2005, the Fund's Investor A shares were renamed Class A shares.
(c) Per share data was calculated using the average shares outstanding during the period.
(d) Rounds to less than $0.01 per share.
(e) Total return at net asset value assuming all distributions reinvested and no initial sales charge or contingent deferred sales charge.
(f) Not annualized.
(g) The benefits derived from expense reductions had an impact of less than 0.01%.
(h) Annualized.
(i) The benefits derived from expense reductions had an impact of 0.01%.
(j) Rounds to less than 0.01%.
(k) Bank of America Corporation assumed certain non-recurring costs. Absent these non-recurring costs, the waiver/reimbursement ratio would have been -% and 0.09% for the years ended March 31, 2006 and March 31, 2005, respectively.
See Accompanying Notes to Financial Statements.
74
Financial Highlights – Columbia Multi-Advisor International Equity Fund
Selected data for a share outstanding throughout each period is as follows:
| | |
Year Ended | | Year
Ended | | Period
Ended | |
Year Ended | |
| | | February 28, | | February 29, | | February 28, | | March 31, | |
| Class B Shares | | 2010 | | 2009 | | 2008 | | 2007 (a) | | 2006 (b) | | 2005 | |
| Net Asset Value, Beginning of Period | | $ | 6.82 | | | $ | 14.47 | | | $ | 15.89 | | | $ | 15.31 | | | $ | 12.44 | | | $ | 11.30 | | |
| Income from Investment Operations: | |
| Net investment income (c) | | | 0.06 | | | | 0.17 | | | | 0.15 | | | | 0.05 | | | | 0.16 | | | | 0.03 | | |
Net realized and unrealized gain (loss)
on investments, foreign currency,
foreign capital gains tax
and written options | | | 3.20 | | | | (7.63 | ) | | | 0.70 | | | | 1.76 | | | | 2.92 | | | | 1.11 | | |
| Total from investment operations | | | 3.26 | | | | (7.46 | ) | | | 0.85 | | | | 1.81 | | | | 3.08 | | | | 1.14 | | |
| Less Distributions to Shareholders: | |
| From net investment income | | | (0.36 | ) | | | — | | | | (0.16 | ) | | | (0.07 | ) | | | (0.16 | ) | | | — | | |
| From net realized gains | | | — | | | | (0.19 | ) | | | (2.11 | ) | | | (1.16 | ) | | | (0.05 | ) | | | — | | |
| Total distributions to shareholders | | | (0.36 | ) | | | (0.19 | ) | | | (2.27 | ) | | | (1.23 | ) | | | (0.21 | ) | | | — | | |
| Redemption Fees: | |
| Redemption fees added to paid-in-capital (d) | | | — | | | | — | | | | — | | | | — | | | | — | | | | — | | |
| Increase from regulatory settlements | | | 0.03 | | | | — | | | | — | | | | — | | | | — | | | | — | | |
| Net Asset Value, End of Period | | $ | 9.75 | | | $ | 6.82 | | | $ | 14.47 | | | $ | 15.89 | | | $ | 15.31 | | | $ | 12.44 | | |
| Total return (e) | | | 48.47 | % | | | (52.23 | )% | | | 4.40 | % | | | 12.76 | %(f) | | | 24.96 | % | | | 10.09 | % | |
Ratios to Average Net Assets/
Supplemental Data: | |
| Net expenses before interest expense | | | 2.01 | %(g) | | | 2.02 | %(g) | | | 1.94 | %(g) | | | 1.90 | %(g)(h) | | | 1.89 | %(i) | | | 2.01 | %(g) | |
| Interest expense | | | — | %(j) | | | — | | | | — | %(j) | | | — | %(h)(j) | | | — | | | | — | %(j) | |
| Net expenses | | | 2.01 | %(g) | | | 2.02 | %(g) | | | 1.94 | %(g) | | | 1.90 | %(g)(h) | | | 1.89 | %(i) | | | 2.01 | %(g) | |
| Waiver/Reimbursement | | | — | | | | — | | | | — | | | | — | | | | 0.08 | %(k) | | | 0.12 | %(k) | |
| Net investment income | | | 0.60 | %(g) | | | 1.44 | %(g) | | | 0.89 | %(g) | | | 0.36 | %(g)(h) | | | 1.19 | %(i) | | | 0.26 | %(g) | |
| Portfolio turnover rate | | | 127 | % | | | 83 | % | | | 78 | % | | | 73 | %(f) | | | 74 | % | | | 153 | % | |
| Net assets, end of period (000s) | | $ | 1,190 | | | $ | 1,098 | | | $ | 3,545 | | | $ | 4,587 | | | $ | 4,712 | | | $ | 9,976 | | |
(a) The Fund changed its fiscal year end from March 31 to February 28. Per share data and total return reflect activity from April 1, 2006 through February 28, 2007.
(b) On August 22, 2005, the Fund's Investor B shares were renamed Class B shares.
(c) Per share data was calculated using the average shares outstanding during the period.
(d) Rounds to less than $0.01 per share.
(e) Total return at net asset value assuming all distributions reinvested and no contingent deferred sales charge.
(f) Not annualized.
(g) The benefits derived from expense reductions had an impact of less than 0.01%.
(h) Annualized.
(i) The benefits derived from expense reductions had an impact of 0.01%.
(j) Rounds to less than 0.01%.
(k) Bank of America Corporation assumed certain non-recurring costs. Absent these non-recurring costs, the waiver/reimbursement ratio would have been -% and 0.09% for the years ended March 31, 2006 and March 31, 2005, respectively.
See Accompanying Notes to Financial Statements.
75
Financial Highlights – Columbia Multi-Advisor International Equity Fund
Selected data for a share outstanding throughout each period is as follows:
| | | Year Ended | | Year
Ended | | Period
Ended | |
Year Ended | |
| | | February 28, | | February 29, | | February 28, | | March 31, | |
| Class C Shares | | 2010 | | 2009 | | 2008 | | 2007 (a) | | 2006 (b) | | 2005 | |
| Net Asset Value, Beginning of Period | | $ | 6.73 | | | $ | 14.29 | | | $ | 15.72 | | | $ | 15.16 | | | $ | 12.32 | | | $ | 11.20 | | |
| Income from Investment Operations: | |
| Net investment income (c) | | | 0.05 | | | | 0.16 | | | | 0.13 | | | | 0.05 | | | | 0.09 | | | | 0.03 | | |
Net realized and unrealized gain (loss)
on investments, foreign currency,
foreign capital gains tax
and written options | | | 3.18 | | | | (7.53 | ) | | | 0.71 | | | | 1.74 | | | | 2.96 | | | | 1.09 | | |
| Total from investment operations | | | 3.23 | | | | (7.37 | ) | | | 0.84 | | | | 1.79 | | | | 3.05 | | | | 1.12 | | |
| Less Distributions to Shareholders: | |
| From net investment income | | | (0.36 | ) | | | — | | | | (0.16 | ) | | | (0.07 | ) | | | (0.16 | ) | | | — | | |
| From net realized gains | | | — | | | | (0.19 | ) | | | (2.11 | ) | | | (1.16 | ) | | | (0.05 | ) | | | — | | |
| Total distributions to shareholders | | | (0.36 | ) | | | (0.19 | ) | | | (2.27 | ) | | | (1.23 | ) | | | (0.21 | ) | | | — | | |
| Redemption Fees: | |
| Redemption fees added to paid-in-capital (d) | | | — | | | | — | | | | — | | | | — | | | | — | | | | — | | |
| Increase from regulatory settlements | | | 0.03 | | | | — | | | | — | | | | — | | | | — | | | | — | | |
| Net Asset Value, End of Period | | $ | 9.63 | | | $ | 6.73 | | | $ | 14.29 | | | $ | 15.72 | | | $ | 15.16 | | | $ | 12.32 | | |
| Total return (e) | | | 48.67 | % | | | (52.26 | )% | | | 4.37 | % | | | 12.75 | %(f) | | | 24.96 | % | | | 10.00 | % | |
Ratios to Average Net Assets/
Supplemental Data: | |
| Net expenses before interest expense | | | 2.01 | %(g) | | | 2.02 | %(g) | | | 1.94 | %(g) | | | 1.90 | %(g)(h) | | | 1.89 | %(i) | | | 2.01 | %(g) | |
| Interest expense | | | — | %(j) | | | — | | | | — | %(j) | | | — | %(h)(j) | | | — | | | | — | %(j) | |
| Net expenses | | | 2.01 | %(g) | | | 2.02 | %(g) | | | 1.94 | %(g) | | | 1.90 | %(g)(h) | | | 1.89 | %(i) | | | 2.01 | %(g) | |
| Waiver/Reimbursement | | | — | | | | — | | | | — | | | | — | | | | 0.08 | %(k) | | | 0.12 | %(k) | |
| Net investment income | | | 0.55 | %(g) | | | 1.38 | %(g) | | | 0.79 | %(g) | | | 0.34 | %(g)(h) | | | 0.70 | %(i) | | | 0.26 | %(g) | |
| Portfolio turnover rate | | | 127 | % | | | 83 | % | | | 78 | % | | | 73 | %(f) | | | 74 | % | | | 153 | % | |
| Net assets, end of period (000s) | | $ | 1,728 | | | $ | 1,349 | | | $ | 3,863 | | | $ | 3,533 | | | $ | 3,276 | | | $ | 2,563 | | |
(a) The Fund changed its fiscal year end from March 31 to February 28. Per share data and total return reflect activity from April 1, 2006 through February 28, 2007.
(b) On August 22, 2005, the Fund's Investor C shares were renamed Class C shares.
(c) Per share data was calculated using the average shares outstanding during the period.
(d) Rounds to less than $0.01 per share.
(e) Total return at net asset value assuming all distributions reinvested and no contingent deferred sales charge.
(f) Not annualized.
(g) The benefits derived from expense reductions had an impact of less than 0.01%.
(h) Annualized.
(i) The benefits derived from expense reductions had an impact of 0.01%.
(j) Rounds to less than 0.01%.
(k) Bank of America Corporation assumed certain non-recurring costs. Absent these non-recurring costs, the waiver/reimbursement ratio would have been -% and 0.09% for the years ended March 31, 2006 and March 31, 2005, respectively.
See Accompanying Notes to Financial Statements.
76
Financial Highlights – Columbia Multi-Advisor International Equity Fund
Selected data for a share outstanding throughout each period is as follows:
| | | Year Ended | | Year
Ended | | Period
Ended | | Period
Ended | |
| | | February 28, | | February 29, | | February 28, | | March 31, | |
| Class R Shares | | 2010 | | 2009 | | 2008 | | 2007 (a) | | 2006 (b) | |
| Net Asset Value, Beginning of Period | | $ | 7.44 | | | $ | 15.76 | | | $ | 17.12 | | | $ | 16.38 | | | $ | 15.44 | | |
| Income from Investment Operations: | |
| Net investment income (c) | | | 0.09 | | | | 0.21 | | | | 0.06 | | | | 0.12 | | | | 0.03 | | |
Net realized and unrealized gain (loss)
on investments, foreign currency,
foreign capital gains tax
and written options | | | 3.53 | | | | (8.30 | ) | | | 0.93 | | | | 1.91 | | | | 0.91 | | |
| Total from investment operations | | | 3.62 | | | | (8.09 | ) | | | 0.99 | | | | 2.03 | | | | 0.94 | | |
| Less Distributions to Shareholders: | |
| From net investment income | | | (0.41 | ) | | | (0.04 | ) | | | (0.24 | ) | | | (0.13 | ) | | | — | | |
| From net realized gains | | | — | | | | (0.19 | ) | | | (2.11 | ) | | | (1.16 | ) | | | — | | |
| Total distributions to shareholders | | | (0.41 | ) | | | (0.23 | ) | | | (2.35 | ) | | | (1.29 | ) | | | — | | |
| Redemption Fees: | |
| Redemption fees added to paid-in-capital (d) | | | — | | | | — | | | | — | | | | — | | | | — | | |
| Increase from regulatory settlements | | | 0.03 | | | | — | | | | — | | | | — | | | | — | | |
| Net Asset Value, End of Period | | $ | 10.68 | | | $ | 7.44 | | | $ | 15.76 | | | $ | 17.12 | | | $ | 16.38 | | |
| Total return (e) | | | 49.28 | % | | | (52.00 | )% | | | 4.87 | % | | | 13.31 | %(f) | | | 6.09 | %(f) | |
Ratios to Average Net Assets/
Supplemental Data: | |
| Net expenses before interest expense | | | 1.51 | %(g) | | | 1.52 | %(g) | | | 1.44 | %(g) | | | 1.40 | %(g)(h) | | | 1.39 | %(h)(i) | |
| Interest expense | | | — | %(j) | | | — | | | | — | %(j) | | | — | %(h)(j) | | | — | | |
| Net expenses | | | 1.51 | %(g) | | | 1.52 | %(g) | | | 1.44 | %(g) | | | 1.40 | %(g)(h) | | | 1.39 | %(h)(i) | |
| Waiver/Reimbursement | | | — | | | | — | | | | — | | | | — | | | | 0.08 | %(h)(k) | |
| Net investment income | | | 0.86 | %(g) | | | 1.70 | %(g) | | | 0.31 | %(g) | | | 0.80 | %(g)(h) | | | 0.85 | %(h)(i) | |
| Portfolio turnover rate | | | 127 | % | | | 83 | % | | | 78 | % | | | 73 | %(f) | | | 74 | % | |
| Net assets, end of period (000s) | | $ | 289 | | | $ | 112 | | | $ | 196 | | | $ | 12 | | | $ | 11 | | |
(a) The Fund changed its fiscal year end from March 31 to February 28. Per share data and total return reflect activity from April 1, 2006 through February 28, 2007.
(b) Class R shares commenced operations on January 23, 2006.
(c) Per share data was calculated using the average shares outstanding during the period.
(d) Rounds to less than $0.01 per share.
(e) Total return at net asset value assuming all distributions reinvested.
(f) Not annualized.
(g) The benefits derived from expense reductions had an impact of less than 0.01%.
(h) Annualized.
(i) The benefits derived from expense reductions had an impact of 0.01%.
(j) Rounds to less than 0.01%.
(k) Bank of America Corporation assumed certain non-recurring costs. Absent these non-recurring costs, the waiver/reimbursement ratio would have been -% for the period ended March 31, 2006.
See Accompanying Notes to Financial Statements.
77
Financial Highlights – Columbia Multi-Advisor International Equity Fund
Selected data for a share outstanding throughout each period is as follows:
| | | Year Ended | | Year
Ended | | Period
Ended | |
Year Ended | |
| | | February 28, | | February 29, | | February 28, | | March 31, | |
| Class Z Shares | | 2010 | | 2009 | | 2008 | | 2007 (a) | | 2006 (b) | | 2005 | |
Net Asset Value,
Beginning of Period | | $ | 7.52 | | | $ | 15.96 | | | $ | 17.29 | | | $ | 16.58 | | | $ | 13.44 | | | $ | 12.13 | | |
Income from Investment
Operations: | |
| Net investment income (c) | | | 0.17 | | | | 0.29 | | | | 0.32 | | | | 0.19 | | | | 0.24 | | | | 0.16 | | |
Net realized and unrealized
gain (loss) on investments,
foreign currency, foreign capital
gains tax and written options | | | 3.55 | | | | (8.43 | ) | | | 0.78 | | | | 1.93 | | | | 3.25 | | | | 1.19 | | |
| Total from investment operations | | | 3.72 | | | | (8.14 | ) | | | 1.10 | | | | 2.12 | | | | 3.49 | | | | 1.35 | | |
Less Distributions
to Shareholders: | |
| From net investment income | | | (0.46 | ) | | | (0.11 | ) | | | (0.32 | ) | | | (0.25 | ) | | | (0.30 | ) | | | (0.04 | ) | |
| From net realized gains | | | — | | | | (0.19 | ) | | | (2.11 | ) | | | (1.16 | ) | | | (0.05 | ) | | | — | | |
Total distributions
to shareholders | | | (0.46 | ) | | | (0.30 | ) | | | (2.43 | ) | | | (1.41 | ) | | | (0.35 | ) | | | (0.04 | ) | |
| Redemption Fees: | |
Redemption fees added to
paid-in-capital (d) | | | — | | | | — | | | | — | | | | — | | | | — | | | | — | | |
Increase from regulatory
settlements | | | 0.03 | | | | — | | | | — | | | | — | | | | — | | | | — | | |
| Net Asset Value, End of Period | | $ | 10.81 | | | $ | 7.52 | | | $ | 15.96 | | | $ | 17.29 | | | $ | 16.58 | | | $ | 13.44 | | |
| Total return (e) | | | 50.09 | % | | | (51.76 | )% | | | 5.42 | % | | | 13.73 | %(f) | | | 26.24 | % | | | 11.10 | % | |
Ratios to Average Net Assets/
Supplemental Data: | |
Net expenses before
interest expense | | | 1.01 | %(g) | | | 1.02 | %(g) | | | 0.94 | %(g) | | | 0.90 | %(g)(h) | | | 0.89 | %(i) | | | 1.01 | %(g) | |
| Interest expense | | | — | %(j) | | | — | | | | — | %(j) | | | — | %(h)(j) | | | — | | | | — | %(j) | |
| Net expenses | | | 1.01 | %(g) | | | 1.02 | %(g) | | | 0.94 | %(g) | | | 0.90 | %(g)(h) | | | 0.89 | %(i) | | | 1.01 | %(g) | |
| Waiver/Reimbursement | | | — | | | | — | | | | — | | | | — | | | | 0.08 | %(k) | | | 0.12 | %(k) | |
| Net investment income | | | 1.59 | %(g) | | | 2.28 | %(g) | | | 1.79 | %(g) | | | 1.26 | %(g)(h) | | | 1.68 | %(i) | | | 1.26 | %(g) | |
| Portfolio turnover rate | | | 127 | % | | | 83 | % | | | 78 | % | | | 73 | %(f) | | | 74 | % | | | 153 | % | |
| Net assets, end of period (000s) | | $ | 1,375,538 | | | $ | 1,155,598 | | | $ | 2,549,057 | | | $ | 2,352,583 | | | $ | 1,841,838 | | | $ | 1,199,712 | | |
(a) The Fund changed its fiscal year end from March 31 to February 28. Per share data and total return reflect activity from April 1, 2006 through February 28, 2007.
(b) On August 22, 2005, the Fund's Primary A shares were renamed Class Z shares.
(c) Per share data was calculated using the average shares outstanding during the period.
(d) Rounds to less than $0.01 per share.
(e) Total return at net asset value assuming all distributions reinvested.
(f) Not annualized.
(g) The benefits derived from expense reductions had an impact of less than 0.01%.
(h) Annualized.
(i) The benefits derived from expense reductions had an impact of 0.01%.
(j) Rounds to less than 0.01%.
(k) Bank of America Corporation assumed certain non-recurring costs. Absent these non-recurring costs, the waiver/reimbursement ratio would have been -% and 0.09% for the years ended March 31, 2006 and March 31, 2005, respectively.
See Accompanying Notes to Financial Statements.
78
Notes to Financial Statements – International/Global Stock Funds
February 28, 2010
Note 1. Organization
Columbia Funds Series Trust (the "Trust") is registered under the Investment Company Act of 1940, as amended (the "1940 Act"), as an open-end management investment company organized as a Delaware statutory trust. Information presented in these financial statements pertains to the following series of the Trust (each a "Fund" and collectively, the "Funds"):
Columbia Global Value Fund
Columbia International Value Fund
Columbia Marsico Global Fund
Columbia Marsico International Opportunities Fund
Columbia Multi-Advisor International Equity Fund
Investment Objectives
Columbia Global Value Fund and Columbia International Value Fund each seek long-term capital appreciation. Columbia Marsico Global Fund and Columbia Marsico International Opportunities Fund each seek long-term growth of capital. Columbia Multi-Advisor International Equity Fund seeks long-term capital growth.
Columbia International Value Fund (the "Feeder Fund") seeks to achieve its investment objective by investing all or substantially all of its assets in Columbia International Value Master Portfolio (the "Master Portfolio"). The Master Portfolio is a series of Columbia Funds Master Investment Trust, LLC (the "Master Trust"). The Master Portfolio has the same investment objective as the Feeder Fund. The value of the Feeder Fund's investment in the Master Portfolio included on the Statements of Assets and Liabilities reflects the Feeder Fund's proportionate amount of beneficial interests in the net assets of the Master Portfolio which is equal to 86.4% at February 28, 2010. The financial statements of the Master Portfolio, including its investment portfolio, are included elsewhere within this report and should be read in conjunction with the Feeder Fund's financial statements. Another fund that is managed by Columbia Management Advi sors, LLC ("Columbia"), not registered under the 1940 Act, and whose financial statements are not presented here, also invests in the Master Portfolio.
Fund Shares
The Trust may issue an unlimited number of shares. Columbia Global Value Fund and Columbia International Value Fund each offer four classes of shares: Class A, Class B, Class C and Class Z shares. Columbia Marsico Global Fund offers four classes of shares: Class A, Class C, Class R and Class Z shares. Columbia Marsico International Opportunities Fund and Columbia Multi-Advisor International Equity Fund each offer five classes of shares: Class A, Class B, Class C, Class R and Class Z shares. Each share class has its own expense structure and sales charges, as applicable.
Subject to certain limited exceptions, Columbia Global Value Fund is no longer accepting new investments from current or prospective investors. Effective March 31, 2009, Columbia International Value Fund was reopened for purchases from new and existing investors. Effective June 22, 2009, Columbia Global Value Fund, Columbia International Value Fund, Columbia Marsico International Opportunities Fund and Columbia Multi-Advisor International Equity Fund no longer accept investments from new or existing investors in the Funds' Class B shares, except in connection with the reinvestment of any dividend and/or capital gain distributions in Class B shares of the Funds and exchanges by existing Class B shareholders of the other Columbia Funds.
Class A shares are subject to a maximum front-end sales charge of 5.75% based on the amount of initial investment. Class A shares purchased without an initial sales charge in accounts aggregating $1 million to $50 million at the time of purchase are subject to a 1.00% contingent deferred sales charge ("CDSC") if the shares are sold within one year after purchase. Class B shares are subject to a maximum CDSC of 5.00% based upon the holding period after purchase. Class B shares will convert to Class A shares eight years after purchase. Class C shares are subject to a 1.00% CDSC on shares sold within one year after purchase. Class R and Class Z shares are offered continuously at net asset value. There are certain restrictions on the purchase of Class R and Class Z shares, as described in the Funds' prospectuses.
Note 2. Significant Accounting Policies
The preparation of financial statements in accordance with accounting principles generally accepted in the United States of America ("GAAP") requires management to make certain estimates and assumptions that affect the reported amounts of assets and liabilities, the disclosure of contingent assets and liabilities at the date of the financial statements and the reported amounts of revenue and expenses during the reporting period. Actual results could differ from those estimates.
79
International/Global Stock Funds, February 28, 2010 (continued)
The following is a summary of significant accounting policies consistently followed by the Funds in the preparation of their financial statements.
Security Valuation
Equity securities are valued at the last sale price on the principal exchange on which they trade, except for securities traded on the NASDAQ, which are valued at the NASDAQ official close price. Unlisted securities or listed securities for which there were no sales during the day are valued at the closing bid price on such exchanges or over-the-counter markets.
Short-term investments maturing in 60 days or less are valued at amortized cost, which approximates market value.
Investments in other open-end investment companies are valued at net asset value.
Written options are valued at the last reported sale price, or in the absence of a sale, at the last quoted ask price.
Forward foreign currency exchange contracts are valued at the prevailing forward exchange rate of the underlying currencies.
Foreign securities are generally valued at the last sale price on the foreign exchange or market on which they trade. If any foreign share prices are not readily available as a result of limited share activity, the securities are valued at the last sale price of the local shares in the principal market in which such securities are normally traded.
Generally, trading in foreign securities is substantially completed each day at various times prior to the close of the New York Stock Exchange ("NYSE"). The values of such securities used in computing the net asset value of the Funds' shares are determined as of such times. Foreign currency exchange rates are generally determined at 4:00 p.m. Eastern (U.S.) time. Occasionally, events affecting the values of such foreign securities may occur between the times at which they are determined and the close of the customary trading session of the NYSE, which would not be reflected in the computation of the Funds' net asset values. If events materially affecting the values of such foreign securities occur and it is determined that market quotations are not reliable, then these foreign securities will be valued at their fair value using procedures approved by the Board of Trustees.
Certain Funds may use a systematic fair valuation model provided by an independent third party to value securities principally traded in foreign markets in order to adjust for possible stale pricing that may occur between the close of the foreign exchanges and the time for valuation.
The Feeder Fund invests all or substantially all of its assets in the Master Portfolio. See the Notes to Financial Statements for the Master Portfolio included elsewhere in this report for the Master Portfolio's valuation policies.
Investments for which market quotations are not readily available, or that have quotations which management believes are not reliable, are valued at fair value as determined in good faith under consistently applied procedures established by and under the general supervision of the Board of Trustees. If a security is valued at fair value, such value is likely to be different from the last quoted market price for the security. The determination of fair value often requires significant judgment. To determine fair value, management may use assumptions including but not limited to future cash flows and estimated risk premiums. Multiple inputs from various sources may be used to determine value.
GAAP establishes a hierarchy that prioritizes the inputs to valuation techniques used to measure fair value giving the highest priority to unadjusted quoted prices in active markets for identical securities (level 1 measurements) and the lowest priority to unobservable inputs (level 3 measurements) when market prices are not readily available or reliable. The three levels of the fair value hierarchy are described below:
• Level 1 – quoted prices in active markets for identical securities
• Level 2 – prices determined using other significant observable inputs (including quoted prices for similar securities, interest rates, prepayment speeds, credit risk and others)
• Level 3 – prices determined using significant unobservable inputs. In situations where quoted prices or observable inputs are unavailable or less reliable, unobservable inputs may be used. Unobservable inputs may include management's own assumptions about the factors market participants would use in pricing an investment
The inputs or methodology used for valuing securities are not necessarily an indication of the risk associated with investing in those securities.
80
International/Global Stock Funds, February 28, 2010 (continued)
Security Transactions
Security transactions are accounted for on the trade date. Cost is determined and gains (losses) are based upon the specific identification method for both financial statement and federal income tax purposes.
Repurchase Agreements
Each Fund may engage in repurchase agreement transactions with institutions that Columbia has determined are creditworthy. Each Fund, through its custodian, receives delivery of the underlying securities collateralizing a repurchase agreement. Columbia is responsible for determining that the collateral is at least equal, at all times, to the value of the repurchase obligation including interest. A repurchase agreement transaction involves certain risks in the event of default or insolvency of the counterparty. These risks include possible delays in or restrictions on each Fund's ability to dispose of the underlying securities and a possible decline in the value of the underlying securities during the period while the Funds seek to assert their rights.
Foreign Currency Transactions and Translations
The values of all assets and liabilities quoted in foreign currencies are translated into U.S. dollars at that day's exchange rates. Net realized and unrealized gains (losses) on foreign currency transactions and translations include gains (losses) arising from the fluctuation in exchange rates between trade and settlement dates on securities transactions, gains (losses) arising from the disposition of foreign currency and currency gains (losses) between the accrual and payment dates on dividends, interest income and foreign withholding taxes.
For financial statement purposes, the Funds do not distinguish that portion of gains (losses) on investments which is due to changes in foreign exchange rates from that which is due to changes in market prices of the investments. Such fluctuations are included with the net realized and unrealized gains (losses) on investments on the Statements of Operations.
Income Recognition
Interest income is recorded on the accrual basis.
Corporate actions and dividend income are recorded on the ex-date except for certain foreign securities which are recorded as soon after the ex-date as the Funds become aware of such, net of any non-reclaimable tax withholdings.
Expenses
General expenses of the Trust are allocated to the Funds and other series of the Trust based upon relative net assets or other expense allocation methodologies determined by the nature of the expense. Expenses directly attributable to a Fund are charged to such Fund.
Determination of Class Net Asset Value
All income, expenses (other than class-specific expenses, as shown on the Statements of Operations) and realized and unrealized gains (losses) are allocated to each class of a Fund on a daily basis for purposes of determining the net asset value of each class. Income and expenses are allocated to each class based on the settled shares method, while realized and unrealized gains (losses) are allocated based on the relative net assets of each class.
The Feeder Fund records its proportionate share of investment income, realized and unrealized gains (losses) and expenses reported by the Master Portfolio on a daily basis. The investment income, realized and unrealized gains (losses) and expenses are allocated daily to investors of the Master Portfolio based upon the relative value of their investment in the Master Portfolio.
Federal Income Tax Status
Each Fund intends to qualify each year as a "regulated investment company" under Subchapter M of the Internal Revenue Code, as amended, and will distribute substantially all of its taxable income for its tax year, and as such will not be subject to federal income taxes. In addition, each Fund intends to distribute in each calendar year substantially all of its net investment income, capital gains and certain other amounts, if any, such that each Fund should not be subject to federal excise tax. Therefore, no federal income or excise tax provision is recorded.
81
International/Global Stock Funds, February 28, 2010 (continued)
Foreign Capital Gains Taxes
Realized gains in certain countries may be subject to foreign taxes at the fund level, at rates ranging from approximately 10% to 15%. The Funds accrue for such foreign taxes on net realized and unrealized gains at the appropriate rate for each jurisdiction.
Distributions to Shareholders
Distributions from net investment income, if any, are declared and paid annually by each of the Funds. The Funds may, however, declare and pay distributions from net investment income more frequently. Each Fund will distribute net realized capital gains (including net short-term capital gains) at least annually after the fiscal year in which the capital gains were earned, unless offset by any available capital loss carryforward. Income distributions and capital gain distributions are determined in accordance with federal income tax regulations which may differ from GAAP.
Indemnification
In the normal course of business, each Fund enters into contracts that contain a variety of representations and warranties and which provide general indemnities. A Fund's maximum exposure under these arrangements is unknown because this would involve future claims against a Fund. Also, under the Trust's organizational documents and by contract, the Trustees and officers of the Trust are indemnified against certain liabilities that may arise out of actions relating to their duties to the Trust. However, based on experience, the Funds expect the risk of loss due to these representations, warranties and indemnities to be minimal.
Note 3. Federal Tax Information
The timing and character of income and capital gain distributions are determined in accordance with income tax regulations, which may differ from GAAP. Reclassifications are made to each Fund's capital accounts for permanent tax differences to reflect income and gains available for distribution (or available capital loss carryforwards) under income tax regulations.
For the year ended February 28, 2010, permanent book and tax differences resulting primarily from differing treatments for passive foreign investment companies (PFIC) adjustments, proceeds from litigation, net operating losses, distribution reclasses and foreign currency transactions were identified and reclassified among the components of each Fund's net assets as follows:
| | | Undistributed
(Overdistributed) Net
Investment Income
(Loss) | | Accumulated
Net Realized
Gain (Loss) | | Paid-In Capital | |
| Columbia Global Value Fund | | $ | 15,441 | | | $ | (15,441 | ) | | $ | — | | |
| Columbia International Value Fund | | | 142,093 | | | | (6,507,080 | ) | | | 6,364,987 | | |
| Columbia Marsico Global Fund | | | 16,104 | | | | (4,049 | ) | | | (12,055 | ) | |
| Columbia Marsico International Opportunities Fund | | | (59,243 | ) | | | 59,243 | | | | — | | |
| Columbia Multi-Advisor International Equity Fund | | | 4,115,100 | | | | 356,492 | | | | (4,471,592 | ) | |
Net investment income and net realized gains (losses), as disclosed on the Statements of Operations, and net assets were not affected by these reclassifications.
82
International/Global Stock Funds, February 28, 2010 (continued)
The tax character of distributions paid during the years ended February 28, 2010 and February 28, 2009 was as follows:
| | | February 28, 2010 | |
| | | Ordinary
Income* | | Long-Term
Capital Gains | |
| Columbia Global Value Fund | | $ | 3,485,743 | | | $ | — | | |
| Columbia International Value Fund | | | 26,561,282 | | | | — | | |
| Columbia Marsico Global Fund | | | 15,304 | | | | — | | |
| Columbia Marsico International Opportunities Fund | | | 37,659,160 | | | | — | | |
| Columbia Multi-Advisor International Equity Fund | | | 62,930,518 | | | | — | | |
* For tax purposes short-term capital gain distributions, if any, are considered ordinary income distributions.
| | | February 28, 2009 | |
| | | Ordinary
Income* | | Long-Term
Capital Gains | | Tax Return
of Capital | |
| Columbia Global Value Fund | | $ | 233,979 | | | $ | 18,868,824 | | | $ | — | | |
| Columbia International Value Fund | | | 84,192,381 | | | | 223,286,765 | | | | 1,088,951 | | |
| Columbia Marsico Global Fund | | | — | | | | — | | | | — | | |
| Columbia Marsico International Opportunities Fund | | | 548,803 | | | | 26,828,602 | | | | — | | |
| Columbia Multi-Advisor International Equity Fund | | | 23,022,083 | | | | 25,723,512 | | | | — | | |
* For tax purposes short-term capital gain distributions, if any, are considered ordinary income distributions.
As of February 28, 2010, the components of distributable earnings on a tax basis were as follows:
| | | Undistributed
Ordinary
Income | | Undistributed
Long-Term
Capital Gains | | Net Unrealized
Appreciation
(Depreciation)* | |
| Columbia Global Value Fund | | $ | 684,810 | | | $ | — | | | $ | (20,035,516 | ) | |
| Columbia International Value Fund | | | 13,702,344 | | | | — | | | | (423,306,525 | ) | |
| Columbia Marsico Global Fund | | | — | | | | — | | | | 709,059 | | |
| Columbia Marsico International Opportunities Fund | | | 284,959 | | | | — | | | | 96,769,759 | | |
| Columbia Multi-Advisor International Equity Fund | | | — | | | | — | | | | 133,328,090 | | |
* The differences between book-basis and tax-basis net unrealized appreciation/depreciation are primarily due to deferral of losses from wash sales, changes in the value of assets and liabilities resulting from changes in exchange rates, PFIC adjustments and the realization for tax purposes of unrealized gains on certain forward foreign currency exchange contracts.
83
International/Global Stock Funds, February 28, 2010 (continued)
Unrealized appreciation and depreciation at February 28, 2010, based on cost of investments for federal income tax purposes, excluding any unrealized appreciation and depreciation from changes in the value of other assets and liabilities resulting from changes in exchange rates, were:
| | | Unrealized
Appreciation | | Unrealized
Depreciation | | Net
Unrealized
Appreciation
(Depreciation) | |
| Columbia Global Value Fund | | $ | 8,150,337 | | | $ | (28,185,853 | ) | | $ | (20,035,516 | ) | |
| Columbia International Value Fund | | | N/A* | | | | N/A* | | | | N/A* | | |
| Columbia Marsico Global Fund | | | 774,469 | | | | (65,410 | ) | | | 709,059 | | |
| Columbia Marsico International Opportunities Fund | | | 132,046,409 | | | | (35,276,650 | ) | | | 96,769,759 | | |
| Columbia Multi-Advisor International Equity Fund | | | 172,731,143 | | | | (39,403,053 | ) | | | 133,328,090 | | |
* See the Master Portfolio notes to finanical statements for tax basis information.
The following capital loss carryforwards, determined as of February 28, 2010, may be available to reduce taxable income arising from future net realized gains on investments, if any, to the extent permitted by the Internal Revenue Code:
| | | Year of Expiration | |
| | | 2017 | | 2018 | | Total | |
| Columbia Global Value Fund | | $ | 18,857,402 | | | $ | 47,353,774 | | | $ | 66,211,176 | | |
| Columbia International Value Fund | | | — | | | | 185,725,377 | | | | 185,725,377 | | |
| Columbia Marsico Global Fund | | | 698,414 | | | | 1,180,712 | | | | 1,879,126 | | |
| Columbia Marsico International Opportunities Fund | | | 417,923,082 | | | | 420,548,594 | | | | 838,471,676 | | |
| Columbia Multi-Advisor International Equity Fund | | | 250,073,781 | | | | 404,868,172 | | | | 654,941,953 | | |
Under current tax rules, certain currency and capital losses realized after October 31 may be deferred and treated as occurring on the first day of the following fiscal year. As of February 28, 2010, post-October currency and capital losses as follows attributed to security transactions were deferred to March 1, 2010:
| | | Currency | | Capital | |
| Columbia Global Value Fund | | $ | — | | | $ | 1,366,732 | | |
Columbia International
Value Fund | | | — | | | | 13,165,066 | | |
| Columbia Marsico Global Fund | | | 1,701 | | | | 9,681 | | |
Columbia Marsico International
Opportunities Fund | | | — | | | | 6,184,202 | | |
Columbia Multi-Advisor
International Equity Fund | | | 5,271,786 | | | | 3,460,196 | | |
Management is required to determine whether a tax position of the Funds is more likely than not to be sustained upon examination by the applicable taxing authority, including resolution of any related appeals or litigation processes, based on the technical merits of the position. The tax benefit to be recognized by each Fund is measured as the largest amount of benefit that is greater than fifty percent likely of being realized upon ultimate settlement. Management is not aware of any tax positions for which it is reasonably possible that the total amounts of unrecognized tax benefits will significantly change in the next twelve months. However, management's conclusions may be subject to review and adjustment at a later date based on factors including, but not limited to, new tax laws, regulations, and administrative interpretations (including relevant court decisions). The Funds' federal tax returns for the prior three fiscal ye ars remain subject to examination by the Internal Revenue Service.
84
International/Global Stock Funds, February 28, 2010 (continued)
Note 4. Fees and Compensation Paid to Affiliates
Investment Advisory Fee
Columbia, an indirect, wholly owned subsidiary of Bank of America Corporation ("BOA"), provides investment advisory services to the Funds. Columbia receives a monthly investment advisory fee based on each Fund's average daily net assets at the following annual rates:
| | | First
$500
Million | | $500 Million
to $1
Billion | | $1 Billion
to $1.5
Billion | | $1.5 Billion
to $3
Billion | | $3 Billion
to $6
Billion | | Over
$6 Billion | |
| Columbia Global Value Fund | | | 0.90 | % | | | 0.85 | % | | | 0.80 | % | | | 0.75 | % | | | 0.73 | % | | | 0.71 | % | |
| Columbia Marsico Global Fund | | | 0.80 | % | | | 0.80 | % | | | 0.80 | % | | | 0.80 | % | | | 0.80 | % | | | 0.80 | % | |
Columbia Marsico International
Opportunities Fund | | | 0.80 | % | | | 0.80 | % | | | 0.80 | % | | | 0.80 | % | | | 0.80 | % | | | 0.80 | % | |
Columbia Multi-Advisor
International Equity Fund | | | 0.70 | % | | | 0.65 | % | | | 0.60 | % | | | 0.55 | % | | | 0.53 | % | | | 0.51 | % | |
The Feeder Fund indirectly pays for investment advisory, sub-advisory services and a portion of the administrative services through its investment in the Master Portfolio (See Notes to Financial Statements of the Master Portfolio).
For the year ended February 28, 2010, the effective investment advisory fee rates for the Funds, net of any fee waivers, as a percentage of each Fund's average daily net assets, were as follows:
| | | Effective
Rates | |
| Columbia Global Value Fund | | | 0.90 | % | |
| Columbia Marsico Global Fund | | | 0.80 | % | |
Columbia Marsico International
Opportunities Fund | | | 0.80 | % | |
Columbia Multi-Advisor
International Equity Fund | | | 0.65 | % | |
Bank of America, N.A., an indirect parent company of Columbia, entered into an agreement dated September 29, 2009, to sell a portion of the asset management business of Columbia Management Group, LLC to Ameriprise Financial, Inc. ("Ameriprise Financial"). The transaction ("Transaction") includes the sale of the part of the asset management business that advises long-term mutual funds, including the Funds. The Transaction is subject to certain approvals and other conditions to closing, and is currently expected to close on or about May 1, 2010 (the "Closing"). In connection with the Closing, certain changes will occur, including a change in the entities serving as the investment advisor, administrator, distributor and transfer agent of the Funds. RiverSource Investments, LLC (the "New Advisor"), a subsidiary of Ameriprise Financial, will become the investment advisor of the Funds upon the Closing. The New Advisor will serve as in vestment advisor under a new investment management services agreement effective upon the closing. The New Advisor expects to change its name to Columbia Management Investment Advisers, LLC upon or shortly after the Closing. Effective upon the Closing, as the context requires, references to Columbia shall be deemed to refer to the New Advisor.
To the extent that the Funds are not benefitting from a separate contractual expense limitation arrangement, Columbia has contractually agreed to waive a portion of its advisory fees for Columbia Marsico International Opportunities Fund and Columbia Multi-Advisor International Equity Fund through June 30, 2011.
85
International/Global Stock Funds, February 28, 2010 (continued)
The waiver amount is calculated based on the difference between the dollar amount of sub-advisory fees that would have been payable to Marsico Capital Management, LLC ("Marsico") based on the annualized rate of 0.45% of each Fund's average daily net assets, and the dollar amount of sub-advisory fees calculated on a monthly basis based on the annualized sub-advisory fee rate effective January 1, 2008 to which Marsico is entitled from each Fund which is described under the Sub-Advisory Fee note below. The annualized fee rate of 0.45% represented the sub-advisory fee rate which Marsico was entitled to receive prior to January 1, 2008.
In the absence of a separate contractual expense limitation arrangement, the advisory fee waiver for Columbia Marsico International Opportunities Fund and Columbia Multi-Advisor International Equity Fund was calculated as follows:
| Fund Average Daily Net Assets* | | Advisory Fee Waiver | |
| Assets up to $6 billion | | | 0.00 | % | |
Assets in excess of $6 billion
and up to $10 billion | | | 0.05 | % | |
| Assets in excess of $10 billion | | | 0.10 | % | |
* For purposes of the calculation, "Assets" are aggregate assets sub-advised by Marsico in the following Columbia Funds: (i) Columbia Marsico International Opportunities Fund; (ii) Columbia Multi-Advisor International Equity Fund; (iii) Columbia Marsico International Opportunities Fund, Variable Series; and (iv) any future Columbia international equity fund sub-advised by Marsico which Columbia and Marsico mutually agree in writing.
Sub-Advisory Fee
Brandes Investment Partners, L.P. ("Brandes") has been retained by Columbia to serve as the investment sub-advisor to Columbia Global Value Fund. As the sub-advisor, and subject to the oversight of Columbia and the Fund's Board of Trustees, Brandes is responsible for the daily investment operations, including placing all orders for the purchase and sale of the portfolio securities for the Fund. Columbia, from the investment advisory fee it receives, pays Brandes a monthly sub-advisory fee.
Columbia Multi-Advisor International Equity Fund is a "multi-manager" fund, which means that the Fund is managed by more than one sub-advisor. Prior to July 8, 2009, Causeway Capital Management LLC ("Causeway") and Marsico were co-investment sub-advisors of the Fund. Effective July 8, 2009, Columbia assumed day-to-day management responsibility for the portion of the Fund's assets that were sub-advised by Causeway.
Marsico has also been retained by Columbia to serve as the investment sub-advisor to Columbia Marsico Global Fund and Columbia Marsico International Opportunities Fund.
Pursuant to the sub-advisory agreement, Columbia, from the investment advisory fee it receives, pays Marsico a monthly sub-advisory fee for its services provided to Columbia Multi-Advisor International Equity Fund and Columbia Marsico International Opportunities Fund at the following annual rates:
| Fund Average Daily Net Assets* | | Annual Fee Rate | |
| Assets up to $6 billion | | | 0.45 | % | |
Assets in excess of $6 billion
and up to $10 billion | | | 0.40 | % | |
| Assets in excess of $10 billion | | | 0.35 | % | |
* For purposes of the calculation, "Assets" are aggregate assets sub-advised by Marsico in the following Columbia Funds: (i) Columbia Marsico International Opportunities Fund; (ii) Columbia Multi-Advisor International Equity Fund; (iii) Columbia Marsico International Opportunities Fund, Variable Series; and (vi) any future Columbia international equity fund sub-advised by Marsico which Columbia and Marsico mutually agree in writing.
Columbia, from the investment advisory fee it receives, pays Marsico a monthly sub-advisory fee for its services provided to Columbia Marsico Global Fund, based on the Fund's average daily net assets, at the following annual rates:
| Fund Average Daily Net Assets | | Annual Fee Rate | |
| Assets up to $1.5 billion | | | 0.45 | % | |
Assets in excess of $1.5 billion
and up to $3 billion | | | 0.40 | % | |
| Assets in excess of $3 billion | | | 0.35 | % | |
Administration Fee
Columbia provides administrative and other services to the Funds for a monthly administration fee based on each Fund's average daily net assets at the following annual rates, less the
86
International/Global Stock Funds, February 28, 2010 (continued)
fees payable by the Funds as described under the Pricing and Bookkeeping Fees note below:
| | | Annual
Fee Rate | |
| Columbia Global Value Fund | | | 0.17 | % | |
| Columbia International Value Fund | | | 0.17 | % | |
| Columbia Marsico Global Fund | | | 0.22 | % | |
Columbia Marsico International
Opportunities Fund | | | 0.22 | % | |
Columbia Multi-Advisor International
Equity Fund | | | 0.17 | % | |
The New Advisor will become the administrator of the Funds under a new administrative services agreement effective upon the Closing.
Pricing and Bookkeeping Fees
The Funds have entered into a Financial Reporting Services Agreement (the "Financial Reporting Services Agreement") with State Street Bank and Trust Company ("State Street") and Columbia pursuant to which State Street provides financial reporting services to the Funds. The Funds have also entered into an Accounting Services Agreement (collectively with the Financial Reporting Services Agreement, the "State Street Agreements") with State Street and Columbia pursuant to which State Street provides accounting services to the Funds. Under the State Street Agreements, each Fund pays State Street an annual fee of $38,000 paid monthly. In addition, each Fund except Columbia International Value Fund pays State Street a monthly fee based on an annualized percentage rate of average daily net assets of each Fund for the month. The aggregate fee for each Fund except Columbia International Value Fund will not exceed $140,000 per year (exclus ive of out-of-pocket expenses and charges). In addition, Columbia Multi-Advisor International Equity Fund also pays a multi-manager fee of $3,000 for each investment sub-advisor managing a portion of the Fund. The Funds also reimburse State Street for certain out-of-pocket expenses and charges.
Among other updates to the State Street Agreements, Columbia will assign and delegate its rights and obligations thereunder to the New Advisor upon the Closing.
The Funds have entered into a Pricing and Bookkeeping Oversight and Services Agreement (the "Services Agreement") with Columbia. Under the Services Agreement, Columbia provides services related to Fund expenses and the requirements of the Sarbanes-Oxley Act of 2002, and provides oversight of the accounting and financial reporting services provided by State Street. Under the Services Agreement, the Funds reimburse Columbia for out-of-pocket expenses and charges, including fees payable to third parties, such as for pricing the Funds' portfolio securities, incurred by Columbia in the performance of services under the Services Agreement.
The Services Agreement will be terminated upon the Closing, and the services provided thereunder will be covered under the administrative services agreement with the New Advisor.
Transfer Agent Fee
Columbia Management Services, Inc. (the "Transfer Agent"), an affiliate of Columbia and an indirect, wholly owned subsidiary of BOA, provides shareholder services to the Funds and has contracted with Boston Financial Data Services ("BFDS") to serve as sub-transfer agent. Effective January 1, 2010, the Transfer Agent is entitled to receive a fee for its services, paid monthly, at the annual rate of $22.36 per account plus reimbursement of certain sub-transfer agent fees paid by the Transfer Agent (exclusive of BFDS fees), calculated based on assets held in omnibus accounts and intended to recover the cost of payments to other parties (including affiliates of BOA) for services to those accounts. Prior to January 1, 2010, the annual rate was $17.34 per account. The Transfer Agent pays the fees of BFDS for services as sub-transfer agent and is not entitled to reimbursement for such fees from the Funds.
The Transfer Agent may also retain, as additional compensation for its services, fees for wire, telephone and redemption orders, Individual Retirement Account ("IRA") trustee agent fees and account transcript fees due to the Transfer Agent from shareholders of the Funds and credits (net of bank charges) earned with respect to balances in accounts the Transfer Agent maintains in connection with its services to the Funds. The Transfer Agent also receives reimbursement for certain out-of-pocket expenses.
Prior to May 1, 2009, the Transfer Agent voluntarily waived a portion of its fees for accounts other than omnibus accounts, so that transfer agent fees (exclusive of out-of-pocket expenses and sub-transfer agent fees) did not exceed 0.02% annually for Columbia Global Value Fund.
87
International/Global Stock Funds, February 28, 2010 (continued)
An annual minimum account balance fee of $20 may apply to certain accounts with a value below each Fund's initial minimum investment requirements to reduce the impact of small accounts on transfer agent fees. These minimum account balance fees are recorded as part of expense reductions on the Statements of Operations. For the year ended February 28, 2010, no minimum account balance fees were charged by the Funds.
RiverSource Service Corporation (the "New Transfer Agent"), a subsidiary of Ameriprise Financial, will become the transfer agent of the Funds upon the Closing. The New Transfer Agent expects to change its name to Columbia Management Investment Services Corp. upon or shortly after the Closing.
Underwriting Discounts, Service and Distribution Fees
Columbia Management Distributors, Inc. (the "Distributor"), an affiliate of Columbia and an indirect, wholly owned subsidiary of BOA, is the principal underwriter of the Funds' shares. For the year ended February 28, 2010, the Distributor has retained net underwriting discounts on sales of Class A shares and received net CDSC fees on Class A, Class B and Class C share redemptions as follows:
| | | Front End Sales Charge | | CDSC | |
| | | Class A | | Class A | | Class B | | Class C | |
| Columbia Global Value Fund | | $ | 1 | | | $ | — | | | $ | 2,301 | | | $ | — | | |
| Columbia International Value Fund | | | 33,003 | | | | 1,157 | | | | 507 | | | | 827 | | |
| Columbia Marsico Global Fund | | | 1,779 | | | | — | | | | — | | | | 743 | | |
Columbia Marsico International
Opportunities Fund | | | 10,761 | | | | 1 | | | | 38,709 | | | | 4,361 | | |
| Columbia Multi-Advisor International Equity Fund | | | 2,007 | | | | — | | | | 1,146 | | | | — | | |
RiverSource Fund Distributors, Inc. (the "New Distributor"), a subsidiary of Ameriprise Financial, will become the distributor of the Funds upon the Closing. The New Distributor expects to change its name to Columbia Management Investment Distributors, Inc. upon or shortly after the Closing.
The Trust has adopted shareholder servicing plans and distribution plans for the Class B and Class C shares of each Fund and a combined distribution and shareholder servicing plan for Class A shares of each Fund. The Trust has also adopted a distribution plan for Class R shares of Columbia Marsico Global Fund, Columbia Marsico International Opportunities Fund and Columbia Multi-Advisor International Equity Fund. The shareholder servicing plans permit the Funds to compensate or reimburse servicing agents for the shareholder services they have provided. The distribution plans, adopted pursuant to Rule 12b-1 under the 1940 Act, permit the Funds to compensate or reimburse the Distributor and/or selling agents for activities or expenses primarily intended to result in the sale of the classes' shares. Payments are made at an annual rate and paid monthly, as a percentage of average daily net assets, set from time to time by the Board o f Trustees, and are charged as expenses of each Fund directly to the applicable share class. A substantial portion of the expenses incurred pursuant to these plans is paid to affiliates of BOA and the Distributor.
The annual rates in effect and plan limits, as a percentage of average daily net assets are as follows:
| | | Current
Rate | | Plan Limit | |
Class A Combined Distribution
and Shareholder Servicing Plan | | | 0.25 | % | | | 0.25 | % | |
Class B and Class C
Shareholder Servicing Plans | | | 0.25 | % | | | 0.25 | % | |
Class B and Class C
Distribution Plans | | | 0.75 | % | | | 0.75 | % | |
| Class R Distribution Plan | | | 0.50 | % | | | 0.50 | % | |
Expense Limits and Fee Waivers
Columbia has contractually agreed to bear a portion of Columbia Marsico Global Fund's expenses through June 30,
88
International/Global Stock Funds, February 28, 2010 (continued)
2010 so that the Fund's ordinary operating expenses (excluding any distribution and service fees, brokerage commissions, interest, taxes and extraordinary expenses, but including custodian charges relating to overdrafts, if any) after giving effect to any balance credits from the Fund's custodian, do not exceed the annual rate of 1.35% of the Fund's average daily net assets. There is no guarantee that this expense limitation will continue after June 30, 2010.
Effective May 1, 2009, Columbia has voluntarily agreed to reimburse a portion of expenses for Columbia International Value Fund and Columbia Multi-Advisor International Equity Fund so that each Fund's ordinary operating expenses (excluding any distribution and service fees, brokerage commissions, interest, taxes and extraordinary expenses, but including custodian charges relating to overdrafts, if any) after giving effect to any balance credits from the Funds' custodian, do not exceed the annual rate of 1.35% of each Fund's average daily net assets. Columbia, in its discretion, may revise or discontinue these arrangements at any time.
Effective July 1, 2009, Columbia has voluntarily agreed to reimburse a portion of expenses for Columbia Global Value Fund and Columbia Marsico International Opportunities Fund so that the expenses incurred by the Funds excluding any distribution and service fees, brokerage commissions, interest, taxes and extraordinary expenses, but including custodian charges relating to overdrafts, if any) after giving effect to any balance credits from the Funds' custodian, do not exceed the annual rate of 1.35% of each Fund's average daily net assets. Columbia, in its discretion, may revise or discontinue these arrangements at any time.
Prior to July 1, 2009, Columbia contractually agreed to waive fees and/or reimburse expenses for Columbia Global Value Fund and Columbia Marsico International Opportunities Fund, so that the expenses incurred by the Funds (exclusive of distribution and service fees, brokerage commissions, interest, taxes and extraordinary expenses, but inclusive of custodial charges relating to overdrafts, if any) after giving effect to any balance credits from the Funds' custodian, did not exceed the following annual rates, based on each Fund's average daily net assets:
| | | Annual Rate | |
| Columbia Global Value Fund | | | 1.40 | % | |
Columbia Marsico International
Opportunities Fund | | | 1.50 | % | |
Columbia is entitled to recover from Columbia Global Value Fund and Columbia Marsico Global Fund any fees waived and/or expenses reimbursed for a three year period following the date of such fee waiver and/or reimbursement if such recovery does not cause a Fund's expenses to exceed the expense limitations in effect at the time of recovery.
At February 28, 2010, the amounts potentially recoverable by Columbia pursuant to this arrangement are as follows:
| | | Amount of Potential Recovery expiring | | Total
Potential | | Amount
expired | | Amount recovered
during the year | |
| | | 2/28/2013 | | 2/29/2012 | | 2/28/2011 | | Recovery | | 2/28/2010 | | ended 2/28/2010 | |
| Columbia Global Value Fund | | $ | 187,426 | | | $ | — | | | $ | — | | | $ | 187,426 | | | $ | — | | | $ | — | | |
| Columbia Marsico Global Value Fund | | | 178,993 | | | | 272,206 | | | | — | | | | 451,199 | | | | — | | | | — | | |
Fees Paid to Officers and Trustees
All officers of the Funds are employees of Columbia or its affiliates and, with the exception of the Funds' Chief Compliance Officer, receive no compensation from the Funds. The Board of Trustees has appointed a Chief Compliance Officer to the Funds in accordance with federal securities regulations. The Funds, along with other affiliated funds, pay their pro-rata share of the expenses associated with the Chief Compliance Officer. Each Fund's expenses for the Chief Compliance Officer will not exceed $15,000 per year.
Trustees are compensated for their services to the Funds, as set forth on the Statement of Operations.
89
International/Global Stock Funds, February 28, 2010 (continued)
The Trust's eligible Trustees may participate in a non-qualified deferred compensation plan which may be terminated at any time. Any payments to plan participants are paid solely out of the Funds' assets. Income earned on the plan participant's deferral account is based on the rate of return of the eligible mutual funds selected by the participant or, if no funds are selected, on the rate of return of Columbia Treasury Reserves, another portfolio of the Trust. The expense for the deferred compensation plan, which includes trustees' fees deferred during the current period as well as any gains or losses on the trustees' deferred compensation balances as a result of market fluctuations, is included in "Trustees' fees" on the Statements of Operations. The liability for the deferred compensation plan is included in "Trustees' fees" on the Statements of Assets and Liabilities.
Other Related Party Transactions
In connection with the purchase and sale of its securities during the period, the Funds used one broker that is an affiliate of BOA. Total brokerage commissions paid to the affiliated broker for the year ended February 28, 2010 were as follows:
| | | Amount | |
| Columbia Global Value Fund | | $ | 2,509 | | |
| Columbia Marsico Global Fund | | | 841 | | |
Columbia Marsico International
Opportunities Fund | | | 189,035 | | |
Columbia Multi-Advisor
International Equity Fund | | | 143,860 | | |
Note 5. Custody Credits
Each Fund has an agreement with its custodian bank under which custody fees may be reduced by balance credits. These credits are recorded as part of expense reductions on the Statements of Operations. The Funds could have invested a portion of the assets utilized in connection with the expense offset arrangement in an income-producing asset if they had not entered into such an agreement. For the year ended February 28, 2010, these custody credits reduced total expenses for the Funds as follows:
| | | Custody
Credits | |
| Columbia Global Value Fund | | $ | — | | |
| Columbia International Value Fund | | | — | * | |
| Columbia Marsico Global Fund | | | 1 | | |
Columbia Marsico International
Opportunities Fund | | | 21 | | |
Columbia Multi-Advisor International
Equity Fund | | | 16 | | |
* Rounds to less than $1.00.
Note 6. Objectives and Strategies for Investing in Derivative Instruments
Columbia Multi-Advisor International Equity Fund uses derivative instruments including foreign forward currency exchange contracts and written options contracts in order to meet its investment objectives. Columbia Multi-Advisor International Equity Fund employs strategies in differing combinations to permit it to increase, decrease or change the level of exposure to market risk factors. The achievement of any strategy relating to derivatives depends on an analysis of various risk factors, and if the strategies for the use of derivatives do not work as intended, Columbia Multi-Advisor International Equity Fund may not achieve its investment objectives.
In pursuit of its investment objectives, Columbia Multi-Advisor International Equity Fund is exposed to the following market risks:
Equity Risk: Equity risk relates to change in value of equity securities such as common stocks due to general market conditions such as real or perceived adverse economic conditions, changes in the general outlook for corporate earnings, or adverse investor sentiment. Equity securities generally have greater price volatility than fixed income securities.
90
International/Global Stock Funds, February 28, 2010 (continued)
Foreign Exchange Rate Risk: Foreign exchange rate risk relates to the change in the U.S. dollar value of a security held that is denominated in a foreign currency. The U.S. dollar value of a foreign-currency-denominated security will decrease as the dollar appreciates against the currency, while the U.S. dollar value will increase as the dollar depreciates against the currency.
The following notes provide more detailed information about each derivative type held by Columbia Multi-Advisor International Equity Fund:
Forward Foreign Currency Exchange Contracts—Columbia Multi-Advisor International Equity Fund entered into forward foreign currency exchange contracts to shift its investment exposure from one currency to another.
Forward foreign currency exchange contracts are agreements to exchange one currency for another at a future date at a specified price. These contracts are used to minimize the exposure to foreign exchange rate fluctuations during the period between the trade and settlement dates of the contract. Columbia Multi-Advisor International Equity Fund may utilize forward foreign currency exchange contracts in connection with the settlement of purchases and sales of securities. Columbia Multi-Advisor International Equity Fund may also enter into these contracts to reduce the exposure to adverse price movements in certain other foreign-currency-denominated assets. Contracts to buy generally are used to acquire exposure to foreign currencies, while contracts to sell are generally used to reduce the exposure to foreign exchange rate fluctuations. Forward foreign currency exchange contracts are valued daily at the current exchange rate of th e underlying currency, resulting in unrealized gains (losses) which become realized at the time the forward foreign currency exchange contracts are closed or mature. Realized and unrealized gains (losses) arising from such transactions are included in net realized and unrealized gains (losses) on foreign currency transactions. The use of forward foreign currency exchange contracts does not eliminate fluctuations in the prices of Columbia Multi-Advisor International Equity Fund's portfolio securities. While the maximum potential loss from such contracts is the aggregate face value in U.S. dollars at the time the contract was opened, exposure is typically limited to the change in value of the contract (in U.S. dollars) over the period it remains open. Columbia Multi-Advisor International Equity Fund could also be exposed to risk that counterparties of the contracts may be unable to fulfill the terms of the contracts.
During the year ended February 28, 2010, Columbia Multi-Advisor International Equity Fund entered into 58 forward foreign currency exchange contracts.
Options—Columbia Multi-Advisor International Equity Fund had written covered call options to decrease the Fund's exposure to equity risk and to increase return on investments. A written covered call option becomes more valuable as the price of the underlying instruments depreciates relative to the strike price.
Writing put options tends to increase a Fund's exposure to the underlying instrument. Writing call options tends to decrease a Fund's exposure to the underlying instrument. When a Fund writes a call or put option, an amount equal to the premium received is recorded as a liability and subsequently marked-to-market to reflect the current value of the option written. Premiums received from writing options which expire are treated as realized gains. Premiums received from writing options which are exercised or closed are added to the proceeds or offset against the amounts paid on the underlying security transaction to determine the realized gain or loss. A Fund, as a writer of an option, has no control over whether the underlying security may be sold (call) or purchased (put) and as a result bears the market risk of an unfavorable change in the price of the security underlying the written option. There is the risk that a Fund may no t be able to enter into a closing transaction because of an illiquid market. A Fund identifies within its portfolio of investments cash or liquid portfolio securities equal to the amount of the written options contract commitment.
Columbia Multi-Advisor International Equity Fund may also purchase put and call options. Purchasing call options tends to increase a Fund's exposure to the underlying instrument. Purchasing put options tends to decrease a Fund's exposure to the underlying instrument. A Fund may pay a premium, which is included in the Fund's Statement of Assets and Liabilities as an investment and subsequently marked-to-market to reflect the current value of the option. The risk associated with purchasing put and call options is limited to the premium paid. Premiums paid for purchasing options which expire are treated as realized losses. Premiums paid for purchasing options which are exercised are added to the amounts paid (call) or offset against the proceeds (put) on the underlying security to determine the realized gain or loss. If a Fund enters into a closing transaction, the Fund will realize a
91
International/Global Stock Funds, February 28, 2010 (continued)
gain or loss, depending on whether the proceeds from the closing transaction are greater or less than the cost of the option.
During the year ended February 28, 2010, Columbia Multi-Advisor International Equity Fund entered into 3,708 written options contracts.
The following table is a summary of Columbia Multi-Advisor International Equity Fund's value in derivative instruments as of February 28, 2010:
| | | Fair Value of Derivative Instruments | | | |
| | | Statement of Assets and Liabilities | | | |
| Asset | | Fair Value | | Liability | | Fair Value | |
Unrealized Appreciation on Forward Foreign
Currency Exchange Contracts | | $ | 895,405 | | | Unrealized Depreciation on Forward Foreign
Currency Exchange Contracts | | $ | 4,819,971 | | |
| | | | | Written Options | | | 16,686 | | |
The effect of derivative instruments on Columbia Multi-Advisor International Equity Fund's Statement of Operations for the year ended February 28, 2010:
| | | Amount of Realized Gain or (Loss) and Change in
Unrealized Appreciation (Depreciation) on Derivatives
Recognized in Income | |
| | | Risk Exposure | | Net Realized
Gain (Loss) | | Change in
Unrealized
Appreciation
(Depreciation) | |
| Forward Foreign Currency Exchange Contracts | | Foreign Exchange Rate Risk | | $ | (1,223,571 | ) | | $ | (3,924,566 | ) | |
| Written Options | | Equity Risk | | | (134,189 | ) | | | 22,865 | | |
Note 7. Portfolio Information
For the year ended February 28, 2010, the cost of purchases and proceeds from sales of securities, excluding short-term obligations, for the Funds were as follows:
| | | Purchases | | Sales | |
Columbia Global
Value Fund | | $ | 2,961,135 | | | $ | 40,506,761 | | |
Columbia Marsico
Global Fund | | | 6,282,115 | | | | 5,987,572 | | |
Columbia Marsico
International
Opportunities Fund | | | 1,399,237,110 | | | | 1,796,824,944 | | |
Columbia Multi-Advisor
International
Equity Fund | | | 1,764,542,560 | | | | 2,050,407,242 | | |
Note 8. Regulatory Settlements
During the year ended February 28, 2010, the following Funds received payments relating to certain regulatory settlements with third parties in which the Funds had participated during the year.
| | | Amount | |
| Columbia International Value Fund | | $ | 417,242 | * | |
Columbia Multi-Advisor International
Equity Fund | | | 4,074,606 | | |
* Allocated from Master Portfolio
The payments have been included in "Increase from regulatory settlements" on the Statements of Changes in Net Assets.
92
International/Global Stock Funds, February 28, 2010 (continued)
Note 9. Redemption Fees
The Funds may impose a 2.00% redemption fee on the proceeds of fund shares that are redeemed within 60 days of purchase. The redemption fee is designed to offset brokerage commissions and other costs associated with short term trading of fund shares. The redemption fees, which are retained by the Funds, are accounted for as an addition to paid-in capital and are allocated to each class of the Funds based on the relative net assets at the time of the redemption. Effective March 1, 2010, the Funds will no longer assess the 2.00% redemption fee on the proceeds from Fund shares that are redeemed within 60 days of purchase. For the year ended February 28, 2010, the Funds assessed redemption fees as follows:
| | | Redemption Fee | |
| | | Class A | | Class B | | Class C | | Class R | | Class Z | |
| Columbia Global Value Fund | | $ | 308 | | | $ | 148 | | | $ | 406 | | | $ | — | | | $ | 397 | | |
| Columbia International Value Fund | | | 24,673 | | | | 1,098 | | | | 4,596 | | | | — | | | | 81,187 | | |
| Columbia Marsico Global Fund | | | 4 | | | | 2 | | | | 2 | | | | — | | | | 2 | | |
| Columbia Marsico International Opportunities Fund | | | 18,022 | | | | 1,698 | | | | 4,228 | | | | 285 | | | | 90,366 | | |
| Columbia Multi-Advisor International Equity Fund | | | 1,020 | | | | 59 | | | | 78 | | | | 9 | | | | 63,570 | | |
Note 10. Line of Credit
The Funds and other affiliated funds participate in a $280,000,000 committed, unsecured revolving line of credit provided by State Street. The maximum amount that may be borrowed by any fund is limited to the lesser of $200,000,000 and the Fund's borrowing limit set forth in the Fund's registration statement. Borrowings are available for short-term liquidity or temporary or emergency purposes.
Effective October 15, 2009, interest is charged to each participating fund based on the fund's borrowings at a rate per annum equal to the greater of the Federal Funds Rate plus 1.25% or the overnight LIBOR Rate plus 1.25%. In addition, a commitment fee of 0.15% per annum is accrued and apportioned among the participating funds pro rata based on their relative net assets.
Prior to October 15, 2009, interest was charged to each participating fund based on the fund's borrowings at a rate per annum equal to the greater of the Federal Funds Rate plus 0.50% or the overnight LIBOR Rate plus 0.50%. In addition, an annual operations agency fee of $20,000, an amendment fee of 0.02% and a commitment fee of 0.12% per annum were accrued and apportioned among the participating funds pro rata based on their relative net assets.
For the year ended February 28, 2010, the average daily loan balance outstanding on days where borrowing existed, and the weighted average interest rate of each Fund that borrowed were as follows:
| | | Average Daily
Loan Balance
Outstanding on
Days Where
Borrowing
Existed | | Weighted
Average
Interest
Rate | |
| Columbia Global Value Fund | | $ | 3,080,000 | | | | 0.77 | % | |
Columbia Multi-Advisor
International Equity Fund | | | 3,872,727 | | | | 1.14 | | |
Note 11. Shares of Beneficial Interest
As of February 28, 2010, the Funds had shareholders that held greater than 5% of the shares outstanding of a Fund, whose shares were beneficially owned by participant accounts over
93
International/Global Stock Funds, February 28, 2010 (continued)
which BOA and/or any of its affiliates had either sole or joint investment discretion. The percentages of shares of beneficial interest outstanding held therein are as follows:
| | | % of Shares
Outstanding
Held | |
| Columbia Global Value Fund | | | 33.3 | | |
| Columbia International Value Fund | | | 37.9 | | |
| Columbia Marsico Global Fund | | | 71.1 | | |
Columbia Marsico International
Opportunities Fund | | | 52.5 | | |
Columbia Multi-Advisor International
Equity Fund | | | 78.8 | | |
As of February 28, 2010, the Funds had shareholders that held greater than 5% of the shares outstanding of a Fund, over which BOA and/or any of its affiliates did not have investment discretion. The number of accounts and the percentages of shares of beneficial interest outstanding held therein are as follows:
| | | Number of
Shareholders | | % of Shares
Outstanding
Held | |
Columbia International
Value Fund | | | 1 | | | | 17.7 | | |
Columbia Marsico International
Opportunities Fund | | | 2 | | | | 12.0 | | |
As of February 28, 2010, no other shareholders owned more than 5% of the outstanding shares of each Fund. Subscription and redemption activity of these accounts may have a significant effect on the operations of the Funds.
Note 12. Significant Risks and Contingencies
Foreign Securities Risk
There are certain additional risks involved when investing in foreign securities. These risks may involve foreign currency exchange rate fluctuations, adverse political and economic developments and the possible prevention of currency exchange or other foreign governmental laws or restrictions. In addition, the liquidity of foreign securities may be more limited than that of domestic securities.
Investments in emerging market countries are subject to additional risk. The risk of foreign investments is typically increased in less developed countries. These countries are also more likely to experience high levels of inflation, deflation or currency devaluation which could hurt their economies and securities markets.
Legal Proceedings
Columbia Management Advisors, LLC and Columbia Management Distributors, Inc. (collectively, the "Columbia Group") are subject to a settlement agreement with the New York Attorney General ("NYAG") (the "NYAG Settlement") and a settlement order with the Securities and Exchange Commission ("SEC") (the "SEC Order") on matters relating to mutual fund trading, each dated February 9, 2005. Under the terms of the SEC Order, the Columbia Group (or predecessor or affiliated entities) agreed, among other things, to: pay disgorgement and civil money penalties collectively totaling $375 million; cease and desist from violations of the antifraud provisions and certain other provisions of the federal securities laws; maintain certain compliance and ethics oversight structures; and retain an independent consultant to review the Columbia Group's applicable supervisory, compliance, control and other policies and procedures. The NYAG Settlement, a mong other things, requires Columbia Management Advisors, LLC and its affiliates to make certain disclosures to investors relating to expenses. In connection with the Columbia Group providing services to the Columbia Funds, the Columbia Funds have voluntarily undertaken to implement certain governance measures designed to maintain the independence of their boards of trustees and certain special consulting and compliance measures.
Pursuant to the SEC Order and related procedures, the $375 million in settlement amounts described above, of which approximately $90 million has been earmarked for certain Columbia Funds and their shareholders, is being distributed in accordance with a distribution plan developed by an independent distribution consultant and approved by the SEC on December 27, 2007. Distributions under the distribution plan began in mid-June 2008 and the distribution earmarked for the Columbia Funds and their shareholders has been substantially completed.
94
International/Global Stock Funds, February 28, 2010 (continued)
Civil Litigation
In connection with the events that resulted in the NYAG Settlement and SEC Order, various parties filed suits against Bank of America Corporation and certain of its affiliates, including Banc of America Capital Management, LLC ("BACAP," now known as Columbia Management Advisors, LLC) and BACAP Distributors, LLC (now known as Columbia Management Distributors, Inc.) (collectively "BAC"), Nations Funds Trust (now known as Columbia Funds Series Trust) and its Board of Trustees. On February 20, 2004, the Judicial Panel on Multidistrict Litigation transferred these cases and cases against other mutual fund companies based on similar allegations to the United States District Court in Maryland for consolidated or coordinated pretrial proceedings (the "MDL"). Subsequently, additional related cases were transferred to the MDL. On September 29, 2004, the plaintiffs in the MDL filed amended and consolidated complaints. One of these amended complaints is a putative class action that includes claims under the federal securities laws and state common law, and that names Nations Funds Trust, the Trustees, BAC and others as defendants. Another of the amended complaints is a derivative action purportedly on behalf of the Nations Funds Trust against BAC and others that asserts claims under federal securities laws and state common law. Nations Funds Trust is a nominal defendant in this action.
On February 25, 2005, BAC and other defendants filed motions to dismiss the claims in the pending cases. On December 15, 2005, BAC and others entered into a Stipulation of Settlement of the direct and derivative claims brought on behalf of the Nations Funds shareholders. The settlement is subject to court approval. If the settlement is approved, BAC would pay settlement administration costs and fees to plaintiffs' counsel as approved by the court. The stipulation has not yet been presented to the court for approval.
Note 13. Subsequent Events
In connection with the preparation of the financial statements of the Funds as of and for the fiscal year ended February 28, 2010, events and transactions through the date the financial statements were issued have been evaluated by the Funds' management for possible adjustment and/or disclosure. No subsequent events or transactions had occurred that would require adjustment of the financial statements as presented. On March 3, 2010, the shareholders of each of Columbia Marsico Global Fund, Columbia Marsico International Opportunities Fund, Columbia Multi-Advisor International Equity Fund and Columbia International Value Fund approved, among other matters, a proposed investment management services agreement with the New Advisor and, as applicable, a proposed investment subadvisory agreement with a current sub-advisor, the effectiveness of each of which is conditioned on the Closing.
95
Report of Independent Registered Public Accounting Firm
To the Shareholders and Trustees of Columbia Funds Series Trust
In our opinion, the accompanying statements of assets and liabilities, including the investment portfolios, and the related statements of operations and of changes in net assets and the financial highlights present fairly, in all material respects, the financial position of Columbia Global Value Fund, Columbia International Value Fund, Columbia Marsico Global Fund, Columbia Marsico International Opportunities Fund and Columbia Multi-Advisor International Equity Fund (constituting series of Columbia Funds Series Trust, hereafter referred to as the "Funds") at February 28, 2010, the results of each of their operations for the year then ended, and the changes in each of their net assets and the financial highlights for each of the periods indicated, in conformity with accounting principles generally accepted in the United States of America. These financial statements and the financial highlights (hereafter referred to as "financial statements") are the responsibility of the Funds' management. Our responsibility is to express an opinion on these financial statements based on our audits. We conducted our audits of these financial statements in accordance with the standards of the Public Company Accounting Oversight Board (United States). Those standards require that we plan and perform the audit to obtain reasonable assurance about whether the financial statements are free of material misstatement. An audit includes examining, on a test basis, evidence supporting the amounts and disclosures in the financial statements, assessing the accounting principles used and significant estimates made by management, and evaluating the overall financial statement presentation. We believe that our audits, which included confirmation of securities at February 28, 2010 by correspondence with the custodian and brokers, provide a reasonable basis for our opinion.
PricewaterhouseCoopers LLP
Boston, Massachusetts
April 21, 2010
96
Federal Income Tax Information (Unaudited)
Columbia Global Value Fund
23.79% of the ordinary income distributed by the Fund for the fiscal year ended February 28, 2010, qualifies for the corporate dividends received deduction.
Foreign taxes paid during the fiscal year ended February 28, 2010, of $199,982 are being passed through to shareholders. This represents $0.02 per share. Eligible shareholders may claim this amount as a foreign tax credit.
Gross income derived from sources within foreign countries was $1,428,922 ($0.15 per share) for the fiscal year ended February 28, 2010.
For non-corporate shareholders 63.11%, or the maximum amount allowable under the Jobs and Growth Tax Relief Reconciliation Act of 2003, of ordinary income distributed by the Fund for the fiscal year ended February 28, 2010 may represent qualified dividend income.
The Fund will notify shareholders in January 2011 of amounts for use in preparing 2010 income tax returns.
Columbia International Value Fund
Foreign taxes paid during the fiscal year ended February 28, 2010, of $6,326,963 are being passed through to shareholders. This represents $0.05 per share. Eligible shareholders may claim this amount as a foreign tax credit.
Gross income derived from sources within foreign countries was $65,952,980 ($0.54 per share) for the fiscal year ended February 28, 2010.
For non-corporate shareholders 100.00%, or the maximum amount allowable under the Jobs and Growth Tax Relief Reconciliation Act of 2003, of ordinary income distributed by the Fund for the fiscal year ended February 28, 2010 may represent qualified dividend income.
The Fund will notify shareholders in January 2011 of amounts for use in preparing 2010 income tax returns.
Columbia Marsico Global Fund
10.12% of the ordinary income distributed by the Fund for the fiscal year ended February 28, 2010, qualifies for the corporate dividends received deduction.
For non-corporate shareholders 10.12%, or the maximum amount allowable under the Jobs and Growth Tax Relief Reconciliation Act of 2003, of ordinary income distributed by the Fund for the fiscal year ended February 28, 2010 may represent qualified dividend income.
The Fund will notify shareholders in January 2011 of amounts for use in preparing 2010 income tax returns.
Columbia Marsico International Opportunities Fund
Foreign taxes paid during the fiscal year ended February 28, 2010, of $2,688,336 are being passed through to shareholders. This represents $0.02 per share. Eligible shareholders may claim this amount as a foreign tax credit.
Gross income derived from sources within foreign countries was $27,047,054 ($0.23 per share) for the fiscal year ended February 28, 2010.
For non-corporate shareholders 88.81%, or the maximum amount allowable under the Jobs and Growth Tax Relief Reconciliation Act of 2003, of ordinary income distributed by the Fund for the fiscal year ended February 28, 2010 may represent qualified dividend income.
The Fund will notify shareholders in January 2011 of amounts for use in preparing 2010 income tax returns.
Columbia Multi-Advisor International Equity Fund
Foreign taxes paid during the fiscal year ended February 28, 2010, of $3,965,560 are being passed through to shareholders. This represents $0.03 per share. Eligible shareholders may claim this amount as a foreign tax credit.
Gross income derived from sources within foreign countries was $41,675,488 ($0.32 per share) for the fiscal year ended February 28, 2010.
For non-corporate shareholders 53.59%, or the maximum amount allowable under the Jobs and Growth Tax Relief Reconciliation Act of 2003, of ordinary income distributed by the Fund for the fiscal year ended February 28, 2010 may represent qualified dividend income.
The Fund will notify shareholders in January 2011 of amounts for use in preparing 2010 income tax returns.
97
Columbia Funds Master Investment Trust, LLC
Columbia International Value Master Portfolio Annual Report
February 28, 2010
The following pages should be read in conjunction with Columbia International Value Fund's Annual Report.
98
Investment Portfolio – Columbia International Value Master Portfolio
February 28, 2010
| Common Stocks – 97.6% | |
| | | Shares | | Value ($) | |
| Consumer Discretionary – 7.5% | |
| Automobiles – 1.6% | |
| Nissan Motor Co., Ltd. (a) | | | 1,330,900 | | | | 10,560,915 | | |
| Renault SA (a) | | | 125,200 | | | | 5,148,454 | | |
| Toyota Motor Corp. | | | 387,300 | | | | 14,516,394 | | |
| Automobiles Total | | | 30,225,763 | | |
| Household Durables – 1.6% | |
| Sony Corp. | | | 897,900 | | | | 30,824,413 | | |
| Household Durables Total | | | 30,824,413 | | |
| Media – 1.7% | |
British Sky Broadcasting
Group PLC | | | 1,083,100 | | | | 8,984,215 | | |
| ITV PLC (a) | | | 27,185,276 | | | | 22,384,129 | | |
| Media Total | | | 31,368,344 | | |
| Multiline Retail – 1.3% | |
Marks & Spencer Group
PLC, ADR | | | 2,485,740 | | | | 24,983,676 | | |
| Multiline Retail Total | | | 24,983,676 | | |
| Specialty Retail – 1.3% | |
| Kingfisher PLC | | | 7,819,700 | | | | 25,635,468 | | |
| Specialty Retail Total | | | 25,635,468 | | |
| Consumer Discretionary Total | | | 143,037,664 | | |
| Consumer Staples – 11.2% | |
| Food & Staples Retailing – 7.8% | |
| Carrefour SA | | | 891,160 | | | | 41,117,692 | | |
| J Sainsbury PLC | | | 4,965,329 | | | | 25,015,015 | | |
| Koninklijke Ahold NV | | | 2,496,732 | | | | 30,597,081 | | |
| Seven & I Holdings Co., Ltd. | | | 1,041,300 | | | | 23,487,705 | | |
Wm. Morrison
Supermarkets PLC | | | 6,214,365 | | | | 28,284,844 | | |
| Food & Staples Retailing Total | | | 148,502,337 | | |
| Food Products – 2.1% | |
| Unilever NV | | | 1,288,649 | | | | 38,778,631 | | |
| Food Products Total | | | 38,778,631 | | |
| Tobacco – 1.3% | |
| Japan Tobacco, Inc. | | | 6,829 | | | | 24,788,705 | | |
| Tobacco Total | | | 24,788,705 | | |
| Consumer Staples Total | | | 212,069,673 | | |
| | | Shares | | Value ($) | |
| Energy – 3.6% | |
| Oil, Gas & Consumable Fuels – 3.6% | |
| BP PLC | | | 3,064,170 | | | | 27,038,278 | | |
| ENI SpA | | | 1,571,047 | | | | 35,446,817 | | |
| Petroleo Brasileiro SA, ADR | | | 170,243 | | | | 6,537,331 | | |
| Oil, Gas & Consumable Fuels Total | | | 69,022,426 | | |
| Energy Total | | | 69,022,426 | | |
| Financials – 18.8% | |
| Capital Markets – 1.2% | |
Deutsche Bank AG,
Registered Shares | | | 132,250 | | | | 8,397,949 | | |
| UBS AG, Registered Shares (a) | | | 975,930 | | | | 13,454,525 | | |
| Capital Markets Total | | | 21,852,474 | | |
| Commercial Banks – 9.6% | |
| Barclays PLC | | | 4,818,407 | | | | 22,959,699 | | |
Chuo Mitsui Trust
Holdings, Inc. | | | 1,436,000 | | | | 5,172,154 | | |
| Credit Agricole SA | | | 956,132 | | | | 14,216,937 | | |
| HSBC Holdings PLC | | | 983,039 | | | | 10,786,352 | | |
| Intesa Sanpaolo SpA (a) | | | 8,435,186 | | | | 29,662,008 | | |
Mitsubishi UFJ Financial
Group, Inc. | | | 4,958,431 | | | | 25,058,647 | | |
| Mizuho Financial Group, Inc. | | | 11,539,600 | | | | 22,340,157 | | |
| Natixis (a) | | | 3,977,546 | | | | 19,633,095 | | |
Royal Bank of Scotland
Group PLC (a) | | | 1,097,466 | | | | 630,376 | | |
Royal Bank of Scotland
Group PLC, ADR (a) | | | 20,467 | | | | 236,189 | | |
| San-In Godo Bank Ltd. | | | 233,000 | | | | 1,846,272 | | |
Sumitomo Mitsui Financial
Group, Inc. | | | 781,042 | | | | 25,107,276 | | |
Yamaguchi Financial
Group, Inc. | | | 425,000 | | | | 4,654,454 | | |
| Commercial Banks Total | | | 182,303,616 | | |
| Consumer Finance – 0.4% | |
| Takefuji Corp. | | | 1,689,230 | | | | 7,491,211 | | |
| Consumer Finance Total | | | 7,491,211 | | |
| Insurance – 7.6% | |
| Aegon NV (a) | | | 5,311,757 | | | | 33,487,656 | | |
Mitsui Sumitomo Insurance
Group Holdings, Inc. | | | 1,373,000 | | | | 35,219,393 | | |
| Nipponkoa Insurance Co., Ltd. | | | 1,611,000 | | | | 9,882,323 | | |
| Sompo Japan Insurance, Inc. | | | 1,408,000 | | | | 9,746,412 | | |
See Accompanying Notes to Financial Statements.
99
Columbia International Value Master Portfolio
February 28, 2010
| Common Stocks (continued) | |
| | | Shares | | Value ($) | |
Swiss Reinsurance Co., Ltd.,
Registered Shares | | | 451,300 | | | | 20,282,768 | | |
| Tokio Marine Holdings, Inc. | | | 1,021,900 | | | | 28,812,646 | | |
| XL Capital Ltd., Class A | | | 354,150 | | | | 6,470,321 | | |
| Insurance Total | | | 143,901,519 | | |
| Financials Total | | | 355,548,820 | | |
| Health Care – 12.8% | |
| Pharmaceuticals – 12.8% | |
| Astellas Pharma, Inc. | | | 635,900 | | | | 23,941,533 | | |
| AstraZeneca PLC | | | 991,685 | | | | 43,601,998 | | |
| Daiichi Sankyo Co., Ltd. | | | 852,600 | | | | 17,254,486 | | |
| GlaxoSmithKline PLC | | | 2,198,848 | | | | 40,703,016 | | |
| Ono Pharmaceutical Co., Ltd. | | | 730,800 | | | | 33,724,802 | | |
| Sanofi-Aventis SA | | | 697,686 | | | | 51,034,230 | | |
| Taisho Pharmaceutical Co., Ltd. | | | 382,000 | | | | 6,595,622 | | |
| Takeda Pharmaceutical Co., Ltd. | | | 565,400 | | | | 25,614,666 | | |
| Pharmaceuticals Total | | | 242,470,353 | | |
| Health Care Total | | | 242,470,353 | | |
| Industrials – 1.3% | |
| Air Freight & Logistics – 0.2% | |
Deutsche Post AG,
Registered Shares | | | 225,000 | | | | 3,659,605 | | |
| Air Freight & Logistics Total | | | 3,659,605 | | |
| Commercial Services & Supplies – 1.1% | |
| Dai Nippon Printing Co., Ltd. | | | 1,555,000 | | | | 20,565,311 | | |
| Commercial Services & Supplies Total | | | 20,565,311 | | |
| Industrials Total | | | 24,224,916 | | |
| Information Technology – 15.4% | |
| Communications Equipment – 5.3% | |
| Alcatel-Lucent (a) | | | 9,071,300 | | | | 27,544,821 | | |
| Nokia Oyj | | | 2,979,465 | | | | 40,143,907 | | |
Telefonaktiebolaget LM
Ericsson, Class B | | | 3,292,968 | | | | 32,930,604 | | |
| Communications Equipment Total | | | 100,619,332 | | |
| Computers & Peripherals – 0.6% | |
| NEC Corp. (a) | | | 3,879,000 | | | | 10,784,096 | | |
| Computers & Peripherals Total | | | 10,784,096 | | |
| Electronic Equipment, Instruments & Components – 4.2% | |
| FUJIFILM Holdings Corp. | | | 890,505 | | | | 28,325,366 | | |
| Hitachi Ltd. (a) | | | 3,889,000 | | | | 12,825,449 | | |
| | | Shares | | Value ($) | |
| TDK Corp. | | | 185,000 | | | | 11,410,884 | | |
| Tyco Electronics Ltd. | | | 1,038,543 | | | | 26,617,857 | | |
Electronic Equipment, Instruments &
Components Total | | | 79,179,556 | | |
| Office Electronics – 1.9% | |
| Canon, Inc. | | | 855,200 | | | | 35,567,156 | | |
| Office Electronics Total | | | 35,567,156 | | |
| Semiconductors & Semiconductor Equipment – 3.4% | |
| Rohm Co., Ltd. | | | 551,500 | | | | 37,679,160 | | |
| STMicroelectronics NV | | | 3,166,900 | | | | 27,425,656 | | |
Semiconductors & Semiconductor
Equipment Total | | | 65,104,816 | | |
| Information Technology Total | | | 291,254,956 | | |
| Materials – 3.4% | |
| Chemicals – 2.1% | |
| Akzo Nobel NV | | | 405,700 | | | | 20,630,180 | | |
| BASF SE | | | 328,308 | | | | 18,435,957 | | |
| Chemicals Total | | | 39,066,137 | | |
| Construction Materials – 1.3% | |
| Cemex SAB de CV, ADR (a) | | | 2,032,228 | | | | 19,428,100 | | |
| Italcementi SpA | | | 890,500 | | | | 5,480,724 | | |
| Construction Materials Total | | | 24,908,824 | | |
| Materials Total | | | 63,974,961 | | |
| Telecommunication Services – 20.6% | |
| Diversified Telecommunication Services – 17.8% | |
Brasil Telecom SA, ADR
(Ordinary) (a) | | | 199,977 | | | | 2,131,755 | | |
Brasil Telecom SA, ADR
(Preference) (a) | | | 352,511 | | | | 7,240,576 | | |
Deutsche Telekom AG,
Registered Shares | | | 3,845,600 | | | | 49,483,621 | | |
| France Telecom SA | | | 1,403,318 | | | | 32,914,017 | | |
| KT Corp., ADR (a) | | | 286,131 | | | | 5,487,993 | | |
Nippon Telegraph &
Telephone Corp. | | | 942,500 | | | | 41,054,364 | | |
Portugal Telecom SGPS
SA, ADR | | | 5,584,476 | | | | 58,804,532 | | |
| Swisscom AG, ADR | | | 688,200 | | | | 23,677,727 | | |
Tele Norte Leste Participacoes
SA, ADR | | | 691,100 | | | | 12,004,407 | | |
Telecom Corp. of New Zealand
Ltd., ADR | | | 1,486,604 | | | | 11,744,172 | | |
| Telecom Italia SpA | | | 16,491,810 | | | | 23,489,056 | | |
See Accompanying Notes to Financial Statements.
100
Columbia International Value Master Portfolio
February 28, 2010
| Common Stocks (continued) | |
| | | Shares | | Value ($) | |
Telecom Italia SpA,
Savings Shares | | | 23,764,310 | | | | 25,239,769 | | |
| Telefonica SA, ADR | | | 362,381 | | | | 25,431,898 | | |
Telefonos de Mexico SA de CV,
ADR, Class L | | | 1,158,962 | | | | 18,149,345 | | |
Diversified Telecommunication
Services Total | | | 336,853,232 | | |
| Wireless Telecommunication Services – 2.8% | |
| SK Telecom Co., Ltd. | | | 160,077 | | | | 23,806,606 | | |
| SK Telecom Co., Ltd., ADR | | | 617,639 | | | | 10,302,218 | | |
| Tim Participacoes SA, ADR | | | 127,738 | | | | 3,626,482 | | |
| Vivo Participacoes SA, ADR | | | 228,230 | | | | 6,175,904 | | |
| Vodafone Group PLC | | | 4,677,390 | | | | 10,088,329 | | |
Wireless Telecommunication
Services Total | | | 53,999,539 | | |
| Telecommunication Services Total | | | 390,852,771 | | |
| Utilities – 3.0% | |
| Electric Utilities – 3.0% | |
Centrais Electricas Brasileiras
SA, ADR | | | 2,801,140 | | | | 36,414,820 | | |
Korea Electric Power Corp.,
ADR (a) | | | 1,294,050 | | | | 20,873,027 | | |
| Electric Utilities Total | | | 57,287,847 | | |
| Utilities Total | | | 57,287,847 | | |
Total Common Stocks
(cost of $2,273,050,912) | | | 1,849,744,387 | | |
| Short-Term Obligation – 1.3% | |
| | | Par ($) | | | |
Repurchase agreement with
Fixed Income Clearing Corp.,
dated 02/26/10, due 03/01/10
at 0.040%, collateralized by
a U.S. Government Agency
obligation maturing 01/15/13,
market value $25,757,438
(repurchase proceeds
$25,250,084) | | | 25,250,000 | | | | 25,250,000 | | |
Total Short-Term Obligation
(cost of $25,250,000) | | | 25,250,000 | | |
Total Investments – 98.9%
(cost of $2,298,300,912) (b) | | | 1,874,994,387 | | |
| Other Assets & Liabilities, Net – 1.1% | | | 21,372,124 | | |
| Net Assets – 100.0% | | | 1,896,366,511 | | |
Notes to Investment Portfolio:
(a) Non-income producing security.
(b) Cost for federal income tax purposes is $2,298,300,912.
The following table summarizes the inputs used, as of February 28, 2010, in valuing the Master Portfolio's assets:
| Description | | Quoted Prices
(Level 1) | | Other
Significant
Observable
Inputs
(Level 2) | | Significant
Unobservable
Inputs
(Level 3) | | Total | |
| Common Stocks | |
Consumer
Discretionary | | $ | — | | | $ | 143,037,664 | | | $ | — | | | $ | 143,037,664 | | |
| Consumer Staples | | | — | | | | 212,069,673 | | | | — | | | | 212,069,673 | | |
| Energy | | | 6,537,331 | | | | 62,485,095 | | | | — | | | | 69,022,426 | | |
| Financials | | | 6,706,510 | | | | 348,842,310 | | | | — | | | | 355,548,820 | | |
| Health Care | | | — | | | | 242,470,353 | | | | — | | | | 242,470,353 | | |
| Industrials | | | — | | | | 24,224,916 | | | | — | | | | 24,224,916 | | |
Information
Technology | | | 26,617,857 | | | | 264,637,099 | | | | — | | | | 291,254,956 | | |
| Materials | | | 19,428,100 | | | | 44,546,861 | | | | — | | | | 63,974,961 | | |
Telecommunication
Services | | | 161,099,282 | | | | 229,753,489 | | | | — | | | | 390,852,771 | | |
| Utilities | | | 57,287,847 | | | | — | | | | — | | | | 57,287,847 | | |
Total Common
Stocks | | | 277,676,927 | | | | 1,572,067,460 | | | | — | | | | 1,849,744,387 | | |
Total Short-Term
Obligation | | | — | | | | 25,250,000 | | | | — | | | | 25,250,000 | | |
| Total Investments | | $ | 277,676,927 | | | $ | 1,597,317,460 | | | $ | — | | | $ | 1,874,994,387 | | |
The Master Portfolio's assets assigned to the Level 2 input category include certain foreign securities for which a third party statistical pricing service may be employed for purposes of fair market valuation.
For more information on valuation inputs, and their aggregation into the levels used in the table above, please refer to the Security Valuation section in the accompanying Notes to Financial Statements.
The Master Portfolio was invested in the following countries at February 28, 2010.
Summary of Securities
By Country (Unaudited) | | Value | | % of Total
Investments | |
| Japan | | $ | 584,851,970 | | | | 31.2 | | |
| United Kingdom | | | 291,331,584 | | | | 15.5 | | |
| France | | | 191,609,247 | | | | 10.2 | | |
| Netherlands | | | 150,919,204 | | | | 8.0 | | |
| Italy | | | 119,318,374 | | | | 6.4 | | |
| Switzerland | | | 84,032,878 | | | | 4.5 | | |
| Germany | | | 79,977,132 | | | | 4.3 | | |
| Brazil | | | 74,131,274 | | | | 4.0 | | |
| South Korea | | | 60,469,844 | | | | 3.2 | | |
| Portugal | | | 58,804,532 | | | | 3.1 | | |
| Finland | | | 40,143,908 | | | | 2.1 | | |
| Mexico | | | 37,577,445 | | | | 2.0 | | |
| Sweden | | | 32,930,604 | | | | 1.8 | | |
| Spain | | | 25,431,898 | | | | 1.4 | | |
| United States* | | | 25,250,000 | | | | 1.3 | | |
| New Zealand | | | 11,744,172 | | | | 0.6 | | |
| Bermuda | | | 6,470,321 | | | | 0.4 | | |
| | | $ | 1,874,994,387 | | | | 100.0 | | |
* Includes short-term obligation.
Certain securities are listed by country of underlying exposure but may trade predominantly on another exchange.
| Acronym | | Name | |
| ADR | | American Depositary Receipt | |
|
See Accompanying Notes to Financial Statements.
101
Statement of Assets and Liabilities – Columbia International Value Master Portfolio
February 28, 2010
| | | | | ($) | |
| Assets | | Investments, at identified cost | | | 2,298,300,912 | | |
| | | Investments, at value | | | 1,874,994,387 | | |
| | | Cash | | | 17 | | |
| | | Receivable for: | | | | | |
| | | Dividends | | | 22,718,913 | | |
| | | Interest | | | 84 | | |
| | | Prepaid expenses | | | 25,853 | | |
| | | Total Assets | | | 1,897,739,254 | | |
| Liabilities | | Payable for: | | | | | |
| | | Investment advisory fee | | | 1,135,792 | | |
| | | Administration fee | | | 61,242 | | |
| | | Pricing and bookkeeping fees | | | 13,622 | | |
| | | Trustees' fees | | | 38,161 | | |
| | | Custody fee | | | 71,498 | | |
| | | Other liabilities | | | 52,428 | | |
| | | Total Liabilities | | | 1,372,743 | | |
| | | Net Assets | | | 1,896,366,511 | | |
See Accompanying Notes to Financial Statements.
102
Statement of Operations – Columbia International Value Master Portfolio
For the Year Ended February 28, 2010
| | | | | ($) | |
| Investment Income | | Dividends | | | 77,372,112 | | |
| | | Interest | | | 22,199 | | |
| | | Foreign taxes withheld | | | (7,646,803 | ) | |
| | | Total Investment Income | | | 69,747,508 | | |
| Expenses | | Investment advisory fee | | | 13,867,175 | | |
| | | Administration fee | | | 744,088 | | |
| | | Pricing and bookkeeping fees | | | 151,931 | | |
| | | Trustees' fees | | | 36,614 | | |
| | | Custody fee | | | 410,269 | | |
| | | Other expenses | | | 129,256 | | |
| | | Expenses before interest expense | | | 15,339,333 | | |
| | | Interest expense | | | 53 | | |
| | | Total Expenses | | | 15,339,386 | | |
| | | Custody earnings credit | | | (8 | ) | |
| | | Net Expenses | | | 15,339,378 | | |
| | | Net Investment Income | | | 54,408,130 | | |
| Net Realized and Unrealized Gain (Loss) on Investments and Foreign Currency | | Net realized loss on: | | | | | |
| | | Investments | | | (188,049,417 | ) | |
| | | Foreign currency transactions | | | (115,838 | ) | |
| | | Net realized loss | | | (188,165,255 | ) | |
| | | Net change in unrealized appreciation (depreciation) on: | | | | | |
| | | Investments | | | 712,086,163 | | |
| | | Foreign currency translations | | | 157,614 | | |
| | | Net change in unrealized appreciation (depreciation) | | | 712,243,777 | | |
| | | Net Gain | | | 524,078,522 | | |
| | | Net Increase Resulting from Operations | | | 578,486,652 | | |
See Accompanying Notes to Financial Statements.
103
Statement of Changes in Net Assets – Columbia International Value Master Portfolio
| Increase (Decrease) in Net Assets | |
| | Year Ended
February 28,
2010 ($) | | Year Ended
February 28,
2009 ($) | |
| Operations | | Net investment income | | | 54,408,130 | | | | 89,138,505 | | |
| | | Net realized loss on investments and
foreign currency transactions | | | (188,165,255 | ) | | | (141,329 | ) | |
| | | Net change in unrealized appreciation (depreciation)
on investments and foreign currency translations | | | 712,243,777 | | | | (1,226,863,915 | ) | |
| | | Net Increase (Decrease) Resulting from Operations | | | 578,486,652 | | | | (1,137,866,739 | ) | |
| | | Contributions | | | 554,246,078 | | | | 430,376,554 | | |
| | | Withdrawals | | | (587,073,502 | ) | | | (1,334,632,286 | ) | |
| | | Increase from regulatory settlements | | | 494,889 | | | | — | | |
| | | Total Increase (Decrease) in Net Assets | | | 546,154,117 | | | | (2,042,122,471 | ) | |
| Net Assets | | Beginning of period | | | 1,350,212,394 | | | | 3,392,334,865 | | |
| | | End of period | | | 1,896,366,511 | | | | 1,350,212,394 | | |
See Accompanying Notes to Financial Statements.
104
Financial Highlights – Columbia International Value Master Portfolio
Selected data for a share outstanding throughout each period is as follows:
| | | Year Ended | | Period
Ended | | | |
| | | February 28, | | February 29, | | Year Ended March 31, | |
| | | 2010 | | 2009 | | 2008 (a) | | 2007 | | 2006 | | 2005 | |
| Total return | | | 46.24 | % | | | (42.12 | )% | | | (6.79 | )%(b) | | | 20.95 | % | | | 24.88 | % | | | 13.85 | % | |
Ratios to Average Net Assets/
Supplemental Data: | |
| Net expenses before interest expense (c) | | | 0.87 | % | | | 0.84 | % | | | 0.81 | %(d) | | | 0.80 | % | | | 0.80 | % | | | 0.86 | % | |
| Interest expense (e) | | | — | % | | | — | % | | | — | %(d) | | | — | % | | | — | % | | | — | % | |
| Net expenses (c) | | | 0.87 | % | | | 0.84 | % | | | 0.81 | %(d) | | | 0.80 | % | | | 0.80 | % | | | 0.86 | % | |
| Waiver/Reimbursement | | | — | | | | — | | | | — | | | | — | | | | — | | | | 0.05 | % | |
| Net investment income (c) | | | 3.08 | % | | | 3.58 | % | | | 3.27 | %(d) | | | 1.66 | % | | | 1.88 | % | | | 1.57 | % | |
| Portfolio turnover rate | | | 22 | % | | | 5 | % | | | 24 | %(b) | | | 19 | % | | | 20 | % | | | 21 | % | |
(a) The Master Portfolio changed its fiscal year end from March 31 to February 29. Per share data and total return reflect activity from April 1, 2007 through February 29, 2008.
(b) Not annualized.
(c) The benefits derived from custody credits had an impact of less than 0.01%.
(d) Annualized.
(e) Rounds to less than 0.01%.
See Accompanying Notes to Financial Statements.
105
Notes to Financial Statements – Columbia International Value Master Portfolio
February 28, 2010
Note 1. Organization
Columbia Funds Master Investment Trust, LLC (the "Master Trust") is registered under the Investment Company Act of 1940, as amended (the "1940 Act"), as an open-end management investment company. Information presented in these financial statements pertains to Columbia International Value Master Portfolio (the "Master Portfolio").
The following investors were invested in the Master Portfolio at February 28, 2010:
| Columbia International Value Master Portfolio*: | |
Columbia International
Value Fund (the "Feeder Fund") | | | 86.4 | % | |
Banc of America Capital Management
Funds VII, LLC—International Value Fund | | | 13.6 | % | |
* The Master Portfolio serves as a master portfolio for the Columbia International Value Fund, which operates as a feeder fund in a master/feeder structure.
Note 2. Significant Accounting Policies
The preparation of financial statements in accordance with accounting principles generally accepted in the United States of America ("GAAP") requires management to make certain estimates and assumptions that affect the reported amounts of assets and liabilities, the disclosure of contingent assets and liabilities at the date of the financial statements and the reported amounts of revenue and expenses during the reporting period. Actual results could differ from those estimates.
Management has evaluated the events and transactions that have occurred through the date the financial statements were issued and noted no items requiring adjustment of the financial statements or additional disclosures.
The following is a summary of significant accounting policies consistently followed by the Master Portfolio in the preparation of its financial statements.
Security Valuation
Equity securities are valued at the last sale price on the principal exchange on which they trade, except for securities traded on the NASDAQ, which are valued at the NASDAQ official close price. Unlisted securities or listed securities for which there were no sales during the day are valued at the closing bid price on such exchanges or over-the-counter markets.
Short-term investments maturing in 60 days or less are valued at amortized cost, which approximates market value.
Investments in other open-end investment companies are valued at net asset value.
Foreign securities are generally valued at the last sale price on the foreign exchange or market on which they trade. If any foreign share prices are not readily available as a result of limited share activity, the securities are valued at the last sale price of the local shares in the principal market in which such securities are normally traded.
Generally, trading in foreign securities is substantially completed each day at various times prior to the close of the New York Stock Exchange ("NYSE"). The values of such securities used in computing the net asset value of the Master Portfolio's shares are determined as of such times. Foreign currency exchange rates are generally determined at 4:00 p.m. Eastern (U.S.) time. Occasionally, events affecting the values of such foreign securities may occur between the times at which they are determined and the close of the customary trading session of the NYSE, which would not be reflected in the computation of the Master Portfolio's net asset value. If events materially affecting the values of such foreign securities occur and it is determined that market quotations are not reliable, then these foreign securities will be valued at their fair value using procedures approved by the Board of Trustees.
The Master Portfolio may use a systematic fair valuation model provided by an independent third party to value securities principally traded in foreign markets in order to adjust for possible stale pricing that may occur between the close of the foreign exchanges and the time for valuation.
Investments for which market quotations are not readily available, or that have quotations which management believes are not reliable, are valued at fair value as determined in good faith under consistently applied procedures established by and under the general supervision of the Board of Trustees. If a security is valued at fair value, such value is likely to be different from the last quoted market price for the security. The determination of fair value often requires significant judgment. To determine fair value, management may use
106
Columbia International Value Master Portfolio, February 28, 2010 (continued)
assumptions including but not limited to future cash flows and estimated risk premiums. Multiple inputs from various sources may be used to determine value.
GAAP establishes a hierarchy that prioritizes the inputs to valuation techniques used to measure fair value giving the highest priority to unadjusted quoted prices in active markets for identical securities (level 1 measurements) and the lowest priority to unobservable inputs (level 3 measurements) when market prices are not readily available or reliable. The three levels of the fair value hierarchy are described below:
• Level 1 – quoted prices in active markets for identical securities
• Level 2 – prices determined using other significant observable inputs (including quoted prices for similar securities, interest rates, prepayment speeds, credit risk and others)
• Level 3 – prices determined using significant unobservable inputs. In situations where quoted prices or observable inputs are unavailable or less reliable, unobservable inputs may be used. Unobservable inputs may include management's own assumptions about the factors market participants would use in pricing an investment
The inputs or methodology used for valuing securities are not necessarily an indication of the risk associated with investing in those securities.
Security Transactions
Security transactions are accounted for on the trade date. Cost is determined and gains (losses) are based upon the specific identification method for both financial statement and federal income tax purposes.
Repurchase Agreements
The Master Portfolio may engage in repurchase agreement transactions with institutions that Columbia Management Advisors, LLC ("Columbia"), the Master Portfolio's investment advisor, has determined are creditworthy. The Master Portfolio, through its custodian, receives delivery of the underlying securities collateralizing a repurchase agreement. Columbia is responsible for determining that the collateral is at least equal, at all times, to the value of the repurchase obligation including interest. A repurchase agreement transaction involves certain risks in the event of default or insolvency of the counterparty. These risks include possible delays in or restrictions on the Master Portfolio's ability to dispose of the underlying securities and a possible decline in the value of the underlying securities during the period while the Master Portfolio seeks to assert its rights.
Restricted Securities
Restricted securities are securities that may only be resold upon registration under federal securities laws or in transactions exempt from registration. In some cases, the issuer of restricted securities has agreed to register such securities for resale at the issuer's expense either upon demand by the Master Portfolio or in connection with another registered offering of the securities. Many restricted securities may be resold in the secondary market in transactions exempt from registration. Such restricted securities may be determined to be liquid under criteria established by the Board of Trustees. The Master Portfolio will not incur any registration costs upon such resale.
Foreign Currency Transactions and Translations
The values of all assets and liabilities quoted in foreign currencies are translated into U.S. dollars at that day's exchange rates. Net realized and unrealized gains (losses) on foreign currency transactions and translations include gains (losses) arising from the fluctuation in exchange rates between trade and settlement dates on securities transactions, gains (losses) arising from the disposition of foreign currency and currency gains (losses) between the accrual and payment dates on dividends, interest income and foreign withholding taxes.
For financial statement purposes, the Master Portfolio does not distinguish that portion of gains (losses) on investments which is due to changes in foreign exchange rates from that which is due to changes in market prices of the investments. Such fluctuations are included with the net realized and unrealized gains (losses) on investments on the Statement of Operations.
Income Recognition
Interest income is recorded on the accrual basis.
107
Columbia International Value Master Portfolio, February 28, 2010 (continued)
Corporate actions and dividend income are recorded on the ex-date except for certain foreign securities which are recorded as soon after the ex-date as the Master Portfolio becomes aware of such, net of any non-reclaimable tax withholdings.
Each investor in the Master Portfolio is treated as an owner of its proportionate share of the net assets, income, expenses, realized and unrealized gains (losses) of the Master Portfolio.
Federal Income Tax Status
The Master Portfolio is treated as a partnership for federal income tax purposes and therefore is not subject to federal income tax. Each investor in the Master Portfolio will be subject to taxation on its allocated share of the Master Portfolio's ordinary income and capital gains.
The Master Portfolio's assets, income and distributions will be managed in such a way that the Feeder Fund will be able to continue to qualify as a registered investment company by investing its assets through its Master Portfolio.
Foreign Tax
The Master Portfolio may be subject to foreign taxes on income, gains on investments or currency repatriation, a portion of which may be recoverable. The Master Portfolio will accrue such taxes and recoveries as applicable, based upon its current interpretation of tax rules and regulations that exist in the markets in which it invests.
Indemnification
In the normal course of business, the Master Portfolio enters into contracts that contain a variety of representations and warranties and which provide general indemnities. The Master Portfolio's maximum exposure under these arrangements is unknown because this would involve future claims against the Master Portfolio. Also, under the Master Trust's organizational documents and by contract, the Trustees and officers of the Master Trust are indemnified against certain liabilities that may arise out of actions relating to their duties to the Master Trust. However, based on experience, the Master Portfolio expects the risk of loss due to these representations, warranties and indemnities to be minimal.
Note 3. Federal Tax Information
Unrealized appreciation and depreciation at February 28, 2010, based on cost of investments for federal income tax purposes were:
| Unrealized appreciation | | $ | 192,313,125 | | |
| Unrealized depreciation | | | (615,619,650 | ) | |
| Net unrealized depreciation | | $ | (423,306,525 | ) | |
Management is required to determine whether a tax position of the Master Portfolio is more likely than not to be sustained upon examination by the applicable taxing authority, including resolution of any related appeals or litigation processes, based on the technical merits of the position. The tax benefit to be recognized by the Master Portfolio is measured as the largest amount of benefit that is greater than fifty percent likely of being realized upon ultimate settlement. Management is not aware of any tax positions for which it is reasonably possible that the total amounts of unrecognized tax benefits will significantly change in the next twelve months. However, management's conclusions may be subject to review and adjustment at a later date based on factors including, but not limited to, new tax laws, regulations, and administrative interpretations (including relevant court decisions). The Master Portfolio's federal tax ret urns for the prior three fiscal years remain subject to examination by the Internal Revenue Service.
Note 4. Fees and Compensation Paid to Affiliates
Investment Advisory Fee
Columbia, an indirect, wholly owned subsidiary of Bank of America Corporation ("BOA"), provides investment advisory services to the Master Portfolio. Columbia receives a monthly investment advisory fee based on the average daily net assets of the Master Portfolio at the following annual rates:
| Average Daily Net Assets | | Annual Fee Rate | |
| First $500 million | | | 0.85 | % | |
| $500 million to $1 billion | | | 0.80 | % | |
| $1 billion to $1.5 billion | | | 0.75 | % | |
| $1.5 billion to $3 billion | | | 0.70 | % | |
| $3 billion to $6 billion | | | 0.68 | % | |
| Over $6 billion | | | 0.66 | % | |
108
Columbia International Value Master Portfolio, February 28, 2010 (continued)
For the year ended February 28, 2010, the effective investment advisory fee rate for the Master Portfolio was 0.78% of the Master Portfolio's average daily net assets.
Bank of America, N.A., an indirect parent company of Columbia, entered into an agreement dated September 29, 2009, to sell a portion of the asset management business of Columbia Management Group, LLC to Ameriprise Financial, Inc. ("Ameriprise Financial"). The transaction ("Transaction") includes the sale of the part of the asset management business that advises long-term mutual funds, including the Master Portfolio. The Transaction is subject to certain approvals and other conditions to closing, and is currently expected to close on or about May 1, 2010 (the "Closing"). In connection with the Closing, certain changes will occur, including a change in the entities serving as the investment advisor, and administrator of the Master Portfolio. RiverSource Investments, LLC (the "New Advisor"), a subsidiary of Ameriprise Financial, will become the investment advisor of the Master Portfolio upon the Closing. The New Advisor will serve as investment advisor under a new investment management services agreement effective upon the closing. The New Advisor expects to change its name to Columbia Management Investment Advisers, LLC upon or shortly after the Closing. Effective upon the Closing, as the context requires, references to Columbia shall be deemed to refer to the New Advisor.
Sub-Advisory Fee
Brandes Investment Partners, L.P. ("Brandes") has been retained by Columbia to serve as the investment sub-advisor to the Master Portfolio. As the sub-advisor, and subject to the oversight of Columbia and the Master Portfolio's Board of Trustees, Brandes is responsible for the daily investment operations, including placing all orders for the purchase and sale of the portfolio securities for the Master Portfolio. Columbia, from the investment advisory fee it receives, pays Brandes a monthly sub-advisory fee.
Administration Fee
Columbia provides administrative and other services to the Master Portfolio for a monthly administration fee at the annual rate of 0.05% of the Master Portfolio's average daily net assets less the fees payable by the Master Portfolio as described under the Pricing and Bookkeeping Fees note below.
The New Advisor will become the administrator of the Master Portfolio under a new administrative services agreement effective upon the Closing.
Pricing and Bookkeeping Fees
The Master Portfolio has entered into a Financial Reporting Services Agreement (the "Financial Reporting Services Agreement") with State Street Bank and Trust Company ("State Street") and Columbia pursuant to which State Street provides financial reporting services to the Master Portfolio. The Master Portfolio has also entered into an Accounting Services Agreement (collectively with the Financial Reporting Services Agreement, the "State Street Agreements") with State Street and Columbia pursuant to which State Street provides accounting services to the Master Portfolio. Under the State Street Agreements, the Master Portfolio pays State Street an annual fee of $38,000 paid monthly plus an additional monthly fee based on an annualized percentage rate of average daily net assets of the Master Portfolio for the month. The aggregate fee will not exceed $140,000 per year (exclusive of out-of-pocket expenses and charges). The Master Po rtfolio also reimburses State Street for certain out-of-pocket expenses and charges.
Among other updates to the State Street Agreements, Columbia will assign and delegate its rights and obligations thereunder to the New Advisor upon the Closing.
The Master Portfolio has entered into a Pricing and Bookkeeping Oversight and Services Agreement (the "Services Agreement") with Columbia. Under the Services Agreement, Columbia provides services related to Master Portfolio expenses and the requirements of the Sarbanes-Oxley Act of 2002, and provides oversight of the accounting and financial reporting services provided by State Street. Under the Services Agreement, the Master Portfolio reimburses Columbia for out-of-pocket expenses.
The Services Agreement will be terminated upon the Closing, and the services provided thereunder will be covered under the administrative services agreement with the New Advisor.
109
Columbia International Value Master Portfolio, February 28, 2010 (continued)
Expense Limits and Fee Waivers
Columbia and/or some of the Master Portfolio's other service providers voluntarily agreed to waive fee and/or reimburse the Master Portfolio for certain expenses so that the Master Portfolio's ordinary operating expenses (excluding any brokerage commissions, interest, taxes and extraordinary expenses, but including custodian charges relating to overdrafts, if any) after giving effect to any balance credits from the Master Portfolio's custodian, do not exceed the annual rate of 0.90% of the Master Portfolio's average daily net assets. Columbia, in its discretion, may revise or discontinue these arrangements at any time.
Fees Paid to Officers and Trustees
All officers of the Master Portfolio are employees of Columbia or its affiliates and receive no compensation from the Master Portfolio. The Board of Trustees has appointed a Chief Compliance Officer to the Master Portfolio in accordance with federal securities regulations.
Trustees are compensated for their services to the Master Portolio, as set forth on the Statement of Operations.
The Master Trust's eligible Trustees may participate in a non-qualified deferred compensation plan which may be terminated at any time. Any payments to plan participants are paid solely out of the Master Portfolio's assets. Income earned on the plan participant's deferral account is based on the rate of return of the eligible mutual funds selected by the participant or, if no funds are selected, on the rate of return of Columbia Treasury Reserves, a portfolio of Columbia Funds Series Trust. The expense for the deferred compensation plan, which includes trustees' fees deferred during the current period as well as any gains or losses on the trustees' deferred compensation balances as a result of market fluctuations, is included in "Trustees' fees" on the Statement of Operations. The liability for the deferred compensation plan is included in "Trustees' fees" on the Statement of Assets and Liabilities.
Other Related Party Transactions
In connection with the purchase and sale of its securities during the period, the Master Portfolio used one broker that is an affiliate of BOA. Total brokerage commissions paid to the affiliated broker for the year ended February 28, 2010 was $13,345.
Note 5. Custody Credits
The Master Portfolio has an agreement with its custodian bank under which custody fees may be reduced by balance credits. These credits are recorded as part of expense reductions on the Statement of Operations. The Master Portfolio could have invested a portion of the assets utilized in connection with the expense offset arrangement in an income-producing asset if it had not entered into such an agreement.
Note 6. Portfolio Information
For the year ended February 28, 2010, the cost of purchases and proceeds from sales of securities, excluding short-term obligations, for the Master Portfolio were $381,078,142 and $376,375,978, respectively.
Note 7. Regulatory Settlements
During the year ended February 28, 2010, the Master Portfolio received payments totaling $494,889 relating to certain regulatory settlements with third parties that the Master Portfolio had participated in during the year. The payments have been included in "Increase from regulatory settlements" on the Statement of Changes in Net Assets.
Note 8. Line of Credit
The Master Portfolio and other affiliated funds participate in a $280,000,000 committed, unsecured revolving line of credit provided by State Street. The maximum amount that may be borrowed by the Master Portfolio is limited to the lesser of $200,000,000 and the Master Portfolio's borrowing limit set forth in the Master Portfolio's registration statement. Borrowings are available for short-term liquidity or temporary or emergency purposes.
Effective October 15, 2009, interest is charged to each participating fund based on the fund's borrowings at a rate per annum equal to the greater of the Federal Funds Rate plus 1.25% or the overnight LIBOR Rate plus 1.25%. In addition, a commitment fee of 0.15% per annum is accrued and apportioned among the participating funds pro rata based on their relative net assets.
110
Columbia International Value Master Portfolio, February 28, 2010 (continued)
Prior to October 15, 2009, interest was charged to each participating fund based on the fund's borrowings at a rate per annum equal to the greater of the Federal Funds Rate plus 0.50% or the overnight LIBOR Rate plus 0.50%. In addition, an annual operations agency fee of $20,000, an amendment fee of 0.02% and a commitment fee of 0.12% per annum were accrued and apportioned among the participating funds pro rata based on their relative net assets.
For the year ended February 28, 2010, the average daily loan balance outstanding on days where borrowing existed was $1,150,000 at a weighted average interest rate of 0.83%.
Note 9. Significant Risks and Contingencies
Foreign Securities Risk
There are certain additional risks involved when investing in foreign securities. These risks may involve foreign currency exchange rate fluctuations, adverse political and economic developments and the possible prevention of currency exchange or other foreign governmental laws or restrictions. In addition, the liquidity of foreign securities may be more limited than that of domestic securities.
Investments in emerging market countries are subject to additional risk. The risk of foreign investments is typically increased in less developed countries. These countries are also more likely to experience high levels of inflation, deflation or currency devaluation which could hurt their economies and securities markets.
Legal Proceedings
Columbia Management Advisors, LLC and Columbia Management Distributors, Inc. (collectively, the "Columbia Group") are subject to a settlement agreement with the New York Attorney General ("NYAG") (the "NYAG Settlement") and a settlement order with the Securities and Exchange Commission ("SEC") (the "SEC Order") on matters relating to mutual fund trading, each dated February 9, 2005. Under the terms of the SEC Order, the Columbia Group (or predecessor or affiliated entities) agreed, among other things, to: pay disgorgement and civil money penalties collectively totaling $375 million; cease and desist from violations of the antifraud provisions and certain other provisions of the federal securities laws; maintain certain compliance and ethics oversight structures; and retain an independent consultant to review the Columbia Group's applicable supervisory, compliance, control and other policies and procedures. The NYAG Settlement, a mong other things, requires Columbia Management Advisors, LLC and its affiliates to make certain disclosures to investors relating to expenses. In connection with the Columbia Group providing services to the Columbia Funds, the Columbia Funds have voluntarily undertaken to implement certain governance measures designed to maintain the independence of their boards of trustees and certain special consulting and compliance measures.
Pursuant to the SEC Order and related procedures, the $375 million in settlement amounts described above, of which approximately $90 million has been earmarked for certain Columbia Funds and their shareholders, is being distributed in accordance with a distribution plan developed by an independent distribution consultant and approved by the SEC on December 27, 2007. Distributions under the distribution plan began in mid-June 2008 and the distribution earmarked for the Columbia Funds and their shareholders has been substantially completed.
Civil Litigation
In connection with the events that resulted in the NYAG Settlement and SEC Order, various parties filed suits against Bank of America Corporation and certain of its affiliates, including Banc of America Capital Management, LLC ("BACAP," now known as Columbia Management Advisors, LLC) and BACAP Distributors, LLC (now known as Columbia Management Distributors, Inc.) (collectively "BAC"), Nations Funds Trust (now known as Columbia Funds Series Trust) and its Board of Trustees. On February 20, 2004, the Judicial Panel on Multidistrict Litigation transferred these cases and cases against other mutual fund companies based on similar allegations to the United States District Court in Maryland for consolidated or coordinated pretrial proceedings (the "MDL"). Subsequently, additional related cases were transferred to the MDL. On September 29, 2004, the plaintiffs in the MDL filed amended and consolidated complaints. One of these amended complaints is a putative class action that includes claims under the federal securities laws and state common law, and that names Nations Funds Trust, the Trustees, BAC and others as defendants. Another of the amended complaints is a derivative action purportedly on behalf of the Nations Funds Trust against BAC and others that asserts claims under
111
Columbia International Value Master Portfolio, February 28, 2010 (continued)
federal securities laws and state common law. Nations Funds Trust is a nominal defendant in this action.
On February 25, 2005, BAC and other defendants filed motions to dismiss the claims in the pending cases. On December 15, 2005, BAC and others entered into a Stipulation of Settlement of the direct and derivative claims brought on behalf of the Nations Funds shareholders. The settlement is subject to court approval. If the settlement is approved, BAC would pay settlement administration costs and fees to plaintiffs' counsel as approved by the court. The stipulation has not yet been presented to the court for approval.
112
Report of Independent Registered Public Accounting Firm
To the Holders and Trustees of Columbia Funds Master Investment Trust, LLC
In our opinion, the accompanying statement of assets and liabilities, including the investment portfolio and the related statements of operations and of changes in net assets and the financial highlights present fairly, in all material respects, the financial position of Columbia International Value Master Portfolio (constituting a series of Columbia Funds Master Investment Trust, LLC, hereafter referred to as the "Portfolio") at February 28, 2010, and the results of its operations for the year then ended, and the changes in its net assets and the financial highlights for each of the periods indicated, in conformity with accounting principles generally accepted in the United States of America. These financial statements and financial highlights (hereafter referred to as "financial statements") are the responsibility of the Portfolio's management. Our responsibility is to express an opinion on these financial statements based on our audits. We conducted our audits of these financial statements in accordance with the standards of the Public Company Accounting Oversight Board (United States). Those standards require that we plan and perform the audit to obtain reasonable assurance about whether the financial statements are free of material misstatement. An audit includes examining, on a test basis, evidence supporting the amounts and disclosures in the financial statements, assessing the accounting principles used and significant estimates made by management, and evaluating the overall financial statement presentation. We believe that our audits, which included confirmation of securities at February 28, 2010 by correspondence with the custodian and brokers, provide a reasonable basis for our opinion.
PricewaterhouseCoopers LLP
Boston, Massachusetts
April 21, 2010
113
Fund Governance
The Trustees serve terms of indefinite duration. The names, addresses and ages of the Trustees and officers of the Funds of Columbia Funds Series Trust, the year each was first elected or appointed to office, their principal business occupations during at least the last five years, the number of Funds overseen by each Trustee and other directorships they hold are shown below. Each officer listed below serves as an officer of each Fund in the Columbia Funds Complex.
Independent Trustees
Name, Address and Year of Birth,
Position with Funds, Year First
Elected or Appointed to Office | | Principal Occupation(s) During Past Five Years, Number of Funds in the Columbia Funds
Complex Overseen by Trustee, Other Directorships Held | |
| Edward J. Boudreau (Born 1944) | |
|
c/o Columbia Management
Advisors, LLC
One Financial Center
Boston, MA 02111
Trustee (since 2005) | | Managing Director—E.J. Boudreau & Associates (consulting), from 2000 through current; oversees 64; no other directorships held. | |
|
| William P. Carmichael (Born 1943) | |
|
c/o Columbia Management
Advisors, LLC
One Financial Center
Boston, MA 02111
Trustee (since 1999) | | Retired. Oversees 64; Director—Cobra Electronics Corporation (electronic equipment manufacturer); Director—The Finish Line (sportswear). | |
|
| William A. Hawkins (Born 1942) | |
|
c/o Columbia Management
Advisors, LLC
One Financial Center
Boston, MA 02111
Trustee (since 2005) | | President and Chief Executive Officer—California General Bank, N.A., from January 2008 through current; oversees 64; no other directorships held. | |
|
| R. Glenn Hilliard (Born 1943) | |
|
c/o Columbia Management
Advisors, LLC
One Financial Center
Boston, MA 02111
Trustee (since 2005) | | Chairman and Chief Executive Officer—Hilliard Group LLC (investing and consulting), from April 2003 through current; Non-Executive Director & Chairman—Conseco, Inc. (insurance), September 2003 through current; Executive Chairman—Conseco, Inc. (insurance), August 2004 through September 2005; oversees 64; Director—Conseco, Inc. (insurance). | |
|
| John J. Nagorniak (Born 1944) | |
|
c/o Columbia Management
Advisors, LLC
One Financial Center
Boston, MA 02111
Trustee (since 2008) | | Retired. President and Director—Foxstone Financial, Inc. (consulting), 2000 through December 2007; Director—Mellon Financial Corporation affiliates (investing), 2000 through 2007; Chairman—Franklin Portfolio Associates (investing—Mellon affiliate), 1982 through 2007; oversees 64; Director—MIT Investment Company; Trustee—MIT 401k Plan; Trustee and Chairman—Research Foundation of CFA Institute. | |
|
114
Fund Governance (continued)
Independent Trustees (continued)
Name, Address and Year of Birth,
Position with Funds, Year First
Elected or Appointed to Office | | Principal Occupation(s) During Past Five Years, Number of Funds in the Columbia Funds
Complex Overseen by Trustee, Other Directorships Held | |
| Minor M. Shaw (Born 1947) | |
|
c/o Columbia Management
Advisors, LLC
One Financial Center
Boston, MA 02111
Trustee (since 2003) | | President—Micco Corporation and Mickel Investment Group; oversees 64; Board Member—Piedmont Natural Gas. | |
|
Interested Trustee
| Anthony M. Santomero1 (Born 1946) | |
|
c/o Columbia Management
Advisors, LLC
One Financial Center
Boston, MA 02111
Trustee (since 2008) | | Richard K. Mellon Professor Emeritus of Finance, The Wharton School, University of Pennsylvania, from 1972 through current; Senior Advisor—McKinsey & Company (consulting), July 2006 through January 2008; President and Chief Executive Officer—Federal Reserve Bank of Philadelphia, July 2000 through April 2006; oversees 64; Director—Renaissance Reinsurance Ltd; Director—Penn Mutual Life Insurance Company; Director—Citigroup. | |
|
1 The Columbia Funds currently treat Mr. Santomero as an "interested person" (as defined in the 1940 Act) of the Funds because he serves as a Director of Citigroup, Inc. and Citibank, N.A. Citigroup, Inc., through its subsidiaries and affiliates, including Citibank, N.A., may engage from time-to-time in brokerage execution, principal transactions and/or lending relationships with the Columbia Funds or other funds or accounts advised/managed by the Advisor and/or any sub-advisor.
The Statement of Additional Information includes additional information about the Trustees of the Funds and is available, without charge, upon request by calling 800-426-3750.
Officers
Name, Address and Year of Birth,
Position with Columbia Funds,
Year First Elected or
Appointed to Office | | Principal Occupation(s) During Past Five Years
| |
| J. Kevin Connaughton (Born 1964) | |
|
One Financial Center
Boston, MA 02111
President (since 2009) | | Managing Director of Columbia Management Advisors, LLC since December 2004; Senior Vice President and Chief Financial Officer—Columbia Funds, from June 2008 to January 2009; Treasurer—Columbia Funds, from October 2003 to May 2008; Treasurer—the Liberty Funds, Stein Roe Funds and Liberty All-Star Funds, December 2000—December 2006; Senior Vice President—Columbia Management Advisors, LLC, from April 2003 to December 2004; President—Columbia Funds, Liberty Funds and Stein Roe Funds, February 2004 to October 2004; Treasurer—Galaxy Funds, September 2002 to December 2005; Treasurer, December 2002 to December 2004, and President, February 2004 to December 2004—Columbia Management Multi-Strategy Hedge Fund, LLC; and a senior officer of various other Bank of America-affiliated entities, including other registered and unregistered funds | |
|
115
Fund Governance (continued)
Officers (continued)
Name, Address and Year of Birth,
Position with Columbia Funds,
Year First Elected or
Appointed to Office | | Principal Occupation(s) During Past Five Years
| |
| James R. Bordewick, Jr. (Born 1959) | |
|
One Financial Center
Boston, MA 02111
Senior Vice President, Secretary and Chief Legal Officer (since 2006) | | Associate General Counsel, Bank of America since April 2005; Senior Vice President and Associate General Counsel, MFS Investment Management (investment management) prior to April 2005. | |
|
| Linda J. Wondrack (Born 1964) | |
|
One Financial Center
Boston, MA 02111
Senior Vice President and
Chief Compliance Officer (since 2007) | | Director (Columbia Management Group LLC and Investment Product Group Compliance), Bank of America since June 2005; Director of Corporate Compliance and Conflicts Officer, MFS Investment Management (investment management), August 2004 to May 2005; Managing Director, Deutsche Asset Management (investment management) prior to August 2004. | |
|
| Michael G. Clarke (Born 1969) | |
|
One Financial Center
Boston, MA 02111
Senior Vice President and
Chief Financial Officer (since 2009) | | Director of Fund Administration of the Advisor since January 2006; Managing Director of the Advisor September 2004 to December 2005; Vice President Fund Administration June 2002 to September 2004. | |
|
| Jeffrey R. Coleman (Born 1969) | |
|
One Financial Center
Boston, MA 02111
Treasurer (since 2008) | | Director of Fund Administration of the Advisor since January 2006; Fund Controller of the Advisor from October 2004 to January 2006; Vice President of CDC IXIS Asset Management Services, Inc. (investment management) from August 2000 to September 2004. | |
|
| Joseph F. DiMaria (Born 1968) | |
|
One Financial Center
Boston, MA 02111
Chief Accounting Officer (since 2008) | | Director of Fund Administration of the Advisor since January 2006; Head of Tax/Compliance and Assistant Treasurer of the Advisor from November 2004 to December 2005; Director of Trustee Administration (Sarbanes-Oxley) of the Advisor from May 2003 to October 2004. | |
|
| Julian Quero (Born 1967) | |
|
One Financial Center
Boston, MA 02111
Deputy Treasurer (since 2008) | | Senior Tax Manager of the Advisor since August 2006; Senior Compliance Manager of the Advisor from April 2002 to August 2006. | |
|
| Barry S. Vallan (Born 1969) | |
|
One Financial Center
Boston, MA 02111
Controller (since 2006) | | Vice President—Fund Treasury of the Advisor since October 2004; Vice President—Trustee Reporting of the Advisor from April 2002 to October 2004. | |
|
| Stephen T. Welsh (Born 1957) | |
|
One Financial Center
Boston, MA 02111
Vice President (since 1996) | | President, Columbia Management Services, Inc. since July 2004; Senior Vice President and Controller, Columbia Management Services, Inc. prior to July 2004. | |
|
116
Board Consideration and Re-Approval of Current Investment Advisory and Sub-Advisory Agreements
The Boards of Trustees of Columbia Funds Series Trust and Columbia Funds Master Investment Trust, LLC (the "Boards"), including a majority of the Trustees who have no direct or indirect interest in the investment advisory and sub-advisory agreements and are not "interested persons" of the Trusts, as defined in the Investment Company Act of 1940 (the "1940 Act") (the "Independent Trustees"), are required annually to review and re-approve the existing investment advisory and sub-advisory agreements and approve any newly proposed terms therein. In this regard, the Boards reviewed and re-approved, during the most recent six months covered by this report, (i) investment advisory agreements with Columbia Management Advisors, LLC ("CMA" or the "Adviser") for Columbia Global Value Fund, Columbia International Value Master Portfolio, Columbia Multi-Advisor International Equity Fund, Columbia Marsico International Opportunities Fund and C olumbia Marsico Global Fund; (ii) investment sub-advisory agreements with Marsico Capital Management, LLC ("Marsico Capital") for Columbia Marsico International Opportunities Fund, Columbia Multi-Advisor International Equity Fund and Columbia Marsico Global Fund; and (iii) investment sub-advisory agreements with Brandes Investment Partners, L.P. ("Brandes") for Columbia Global Value Fund and Columbia International Value Master Portfolio. Brandes and Marsico Capital are hereafter referred to as the "Sub-Advisers". The investment advisory agreements with CMA and the investment sub-advisory agreements with the Sub-Advisers are each referred to as an "Advisory Agreement" and collectively referred to as the "Advisory Agreements." The funds and master portfolio identified above are each referred to as a "Fund" and collectively referred to as the "Funds."
More specifically, at meetings held on November 5-6, 2009, the Boards, including the Independent Trustees advised by their independent legal counsel, considered the factors and reached the conclusions described below relating to the selection of CMA and the Sub-Advisers and the re-approval of the Advisory Agreements. The Boards also reviewed and considered a report prepared and provided by the Independent Fee Consultant (the "Fee Consultant") appointed by the Independent Trustees pursuant to an assurance of discontinuance entered into with the New York Attorney General ("NYAG") to settle a civil complaint filed by the NYAG relating to trading in mutual fund shares (the "NYAG Settlement"). The Fee Consultant's role was to manage the process by which management fees are negotiated so that they were negotiated in a manner that is at arms' length and reasonable. The Fee Consultant found that the fee negotiation process was, to the e xtent practicable, at arms' length and reasonable and consistent with the requirements of the NYAG Settlement. A summary of the Fee Consultant's report is available at http://www.columbiafunds.com.
In preparation for the November meetings, the Boards met in August for review and discussion of the materials described below. The Investment Committees of the Boards also met in June to discuss each Fund's performance with its respective portfolio manager(s). In addition to these meetings, the Investment Committees receive and discuss performance reports at their quarterly meetings. The Contracts Review Committees of the Boards also provided support in managing and coordinating the process by which the Boards reviewed the Advisory Agreements. The Boards' review and conclusions are based on the comprehensive consideration of all information presented to them and are not the result of any single controlling factor. The Boards evaluated all information available to them on a Fund-by-Fund basis, and their determinations were made separately in respect of each Fund.
The Boards noted that Bank of America, N.A., the parent company of the Adviser, had entered into an agreement to sell a portion of the asset management business of the Adviser to Ameriprise Financial, Inc. (the "Transaction"). The Boards noted that the Transaction was expected to close in the spring of 2010 and that their review of the Advisory Agreements was separate and distinct from any analysis regarding new advisory or sub-advisory arrangements that may result from the closing of the Transaction.
Nature, Extent and Quality of Services
The Boards received and considered various data and information regarding the nature, extent and quality of services provided to the Funds by CMA and the Sub-Advisers under the Advisory Agreements. The most recent investment adviser registration forms for CMA and the Sub-Advisers were made available to the Boards, as were CMA's and the Sub-Advisers' responses to a detailed series of requests submitted by the Independent Trustees' independent legal counsel on behalf of such Trustees. The Boards reviewed and analyzed those materials, which included, among other things, information about the background and experience of senior
117
management and investment personnel of CMA and the Sub-Advisers.
In addition, the Boards considered the investment and legal compliance programs of the Funds, CMA and the Sub-Advisers, including their compliance policies and procedures and reports of the Funds' Chief Compliance Officer.
The Boards evaluated the ability of CMA and the Sub-Advisers, based on their resources, reputation and other attributes, to attract and retain qualified investment professionals, including research, advisory and supervisory personnel. In this regard, the Boards considered information regarding the nature of CMA's compensation structure applicable to portfolio managers and other key investment personnel.
Based on the above factors, together with those referenced below, the Boards concluded that they were satisfied with the nature, extent and quality of the investment advisory services provided to each of the Funds by CMA and the Sub-Advisers.
Investment Advisory and Sub-Advisory Fee Rates and Other Expenses
The Boards reviewed and considered the proposed contractual investment advisory fee rates both separately and together with the administration fee rates payable by the Funds to CMA for investment advisory services (the "Contractual Management Rates"). The Boards also reviewed and considered the proposed contractual investment sub-advisory fee rates (the "Sub-Advisory Agreement Rates") payable by CMA to the Sub-Advisers for investment sub-advisory services. In addition, the Boards reviewed and considered the proposed fee waiver/cap arrangements applicable to the Contractual Management Rates and considered the Contractual Management Rates after taking the waivers/caps into account (the "Actual Management Rates"). The Boards noted that, on a complex-wide basis, CMA had reduced annual management fees by at least $32 million per year pursuant to the NYAG Settlement. The Boards also noted reductions in net advisory rates and/or total expenses of certain funds across the fund complex. Additionally, the Boards received and afforded specific attention to information comparing the Contractual Management Rates and Actual Management Rates with those of the other funds in their respective Peer Groups (as defined below).
The Boards reviewed and considered statistical information regarding each Fund's total expense ratio and its various components, including contractual advisory fees, actual advisory fees, actual non-management fees, Rule 12b-1 and non-Rule 12b-1 service fees, fee waivers/caps and/or expense reimbursements. The Boards also reviewed comparisons of these fees to the expense information for the group of Funds determined by Lipper Inc. ("Lipper") to be most similar to a given Fund (the "Peer Group") and to the performance of a broader universe of relevant funds as determined by Lipper (the "Universe"), which comparative data was provided by Lipper, an independent provider of investment company data. The Boards were provided with a description of the methodology used by Lipper to select the mutual funds in each Fund's Peer Group and Universe and considered potential imprecision resulting from the selection methodology. For certain Fun ds, Lipper determined that the composition of the Peer Group and/or Universe for expenses would differ from the composition for performance to provide a more accurate basis of comparison. The Boards also considered Lipper data that ranked each Fund based on: (i) each Fund's one- and three-year performance compared to actual management fees; and (ii) each Fund's one- and three-year performance compared to total expenses.
The Boards concluded that the factors noted above supported the Contractual Management Rates and the Actual Management Rates, and the approval of the Advisory Agreements for all of the Funds.
With regard to the Funds with a sub-adviser, the Boards also reviewed the Sub-Advisory Agreement Rates, including comparative fee information provided by the Adviser and the Adviser's recommendation that the Boards re-approve the Advisory Agreements with Marsico Capital and Brandes. The Boards also considered a breakpoint fee schedule charged by Marsico Capital, which serves as Sub-Adviser to certain of the Funds, as well as a corresponding waiver of Contractual Management Rates, both of which were implemented on January 1, 2008. The Boards concluded that the Sub-Advisory Agreement Rates are fair and equitable, based on their consideration of the factors described above.
The Fund-by-Fund discussion set forth below in "Fund-Specific Considerations for Certain Review Funds" provides additional information regarding those Funds highlighted as meeting agreed-upon criteria for warranting further review. Such
118
criteria included, among other things, information relating to Actual Management Rates, total expense ratios and/or performance information, relative to a Fund's Peer Group and/or Universe.
Fund Performance
The Boards considered the performance results for each of the Funds over multiple measurement periods. They also considered these results in comparison to the performance results of each Fund's Peer Group and Universe, as well as to each Fund's benchmark index. The Boards also considered certain risk-adjusted performance data.
The Fund-by-Fund discussion set forth below in "Fund-Specific Considerations for Certain Review Funds" provides additional information regarding those Funds highlighted as meeting agreed-upon criteria for warranting further review. Such criteria included, among other things, information relating to Actual Management Rates, total expense ratios and/or performance information, relative to a Fund's Peer Group and/or Universe.
Profitability
The Boards received and considered a detailed profitability analysis of CMA based on the Contractual Management Rates and the Actual Management Rates, as well as on other relationships between the Funds and other funds in the complex on the one hand and CMA affiliates on the other. The analysis included complex-wide and per-Fund information and a comparison of results using alternative allocation methodologies. The Boards concluded that, in light of the costs of providing investment management and other services, the profits and other ancillary benefits that CMA and its affiliates received from providing these services were not unreasonable.
Economies of Scale
The Boards received and considered information regarding whether there have been economies of scale with respect to the management of the Funds, whether the Funds have appropriately benefited from any economies of scale and whether there is potential for realization of any further economies of scale. Most particularly, CMA provided information showing that, as a percentage of fund assets, CMA's complex-wide revenues declined over a five-year period during which fund assets increased by 53% and the shareholder benefit over a four-year period has remained steady at approximately 33% of the Adviser's total profits. The Boards concluded that any potential economies of scale are shared fairly with Fund shareholders, most particularly through breakpoints and fee waiver arrangements.
The Boards acknowledged the inherent limitations of any analysis of an investment adviser's economies of scale, stemming largely from the Boards' understanding that economies of scale are generally realized, if at all, by an investment adviser across a variety of products and services, not just with respect to a single fund.
Information About Services to Other Clients
The Boards also received and considered information about the nature and extent of services and fee rates offered by CMA and the Sub-Advisers to their other clients, including separate accounts and institutional investors. In this regard, the Boards concluded that, where the Contractual Management Rates, Sub-Advisory Agreement Rates and Actual Management Rates were appreciably above the range of the fee rates offered to other CMA and Sub-Adviser clients, based on information provided by CMA and the Sub-Advisers, the costs associated with managing and operating a registered investment company provided a justification for the higher fee rates charged to the Funds.
Other Benefits to CMA and the Sub-Advisers
The Boards received and considered information regarding any "fall-out" or ancillary benefits received by CMA and its affiliates and the Sub-Advisers as a result of their relationship with the Funds. Such benefits could include, among others, benefits attributable to CMA's and the Sub-Advisers' relationships with the Funds (such as soft-dollar credits) and benefits potentially derived from an increase in CMA's and the Sub-Advisers' business as a result of their relationship with the Funds (such as the ability to market to shareholders other financial products offered by CMA and its affiliates or a Sub-Adviser).
The Boards considered the effectiveness of the policies of the Funds in achieving the best execution of portfolio transactions, whether and to what extent soft dollar credits are sought and how any such credits are utilized, any benefits that may be realized by using an affiliated broker, the extent to which efforts are made to recapture transaction costs, and the controls applicable to brokerage allocation procedures. The
119
Boards also reviewed CMA's and the Sub-Advisers' methods for allocating portfolio investment opportunities among the Funds and other clients. The Boards concluded that the benefits were not unreasonable.
Other Factors and Broader Review
As discussed above, the Boards review materials received from CMA and the Sub-Advisers annually as part of the re-approval process under Section 15(c) of the 1940 Act. The Boards also reviews and assesses the quality of the services the Funds receives throughout the year. In this regard, the Boards and their Committees review reports of CMA and the Sub-Advisers at each of their quarterly meetings, which include, among other things, Fund performance reports and presentations relating to such reports. In addition, the Boards and their Committees confer with portfolio managers at various times throughout the year including, most particularly, at the June Investment Committee meeting.
Fund-Specific Considerations for Certain "Review" Funds
For certain Funds highlighted as meeting agreed-upon criteria for warranting further review, the Boards engaged in further analysis with regard to approval of the Funds' Advisory Agreements. Such criteria included, among other things, information relating to Actual Management Rates, total expense ratios, and/or performance information relative to a Fund's Peer Group and/or Universe.
Columbia Marsico International Opportunities Fund—The Boards engaged in further review of Columbia Marsico International Opportunities Fund because its Actual Management Rate was appreciably above the median range of its Peer Group and its performance over certain periods was below the median range of its Universe. However, the Boards noted other factors such as the inherently higher cost structure of subadvised funds, the implementation of a group breakpoint structure and contractual advisory fee waivers in January 2008 for the Funds subadvised by Marsico Capital, the recent implementation of additional voluntary expense limitations and recent enhancements to Columbia's subadviser oversight process. Taking into account these matters and other factors considered, the Boards concluded that the Fund's performance and Actual Management Rate were acc eptable.
Columbia Global Value Fund—The Boards engaged in further review of Columbia Global Value Fund because its Actual Management Rate was appreciably above the median of its Peer Group and its performance over some periods was below the median of its Universe. However, the Boards noted other factors such as recent improvements in the Fund's total expense rankings, the inherently higher cost structure of subadvised funds, the recent implementation of additional voluntary expense limitations and recent enhancements to Columbia's subadviser oversight process. Taking into account these matters and other factors considered, the Boards concluded that the Fund's performance and Actual Management Rate were acceptable.
Columbia Multi-Advisor International Equity Fund—The Boards engaged in further review of Columbia Multi-Advisor International Equity Fund because its Actual Management Rate was above the median range of its Peer Group and its performance over certain periods was below the median range of its Universe. However, the Boards noted other factors such as a total expense ratio that was appreciably below the median range of the Fund's Peer Group and recent actions taken by Columbia regarding portfolio management responsibilities. Taking into account these matters and other factors considered, the Boards concluded that the Fund's performance and Actual Management Rate were acceptable.
Conclusion
After an evaluation of the above-described factors, and based on its deliberations and analysis of the information provided and alternatives considered, the Boards, including all of the Independent Trustees, concluded that the compensation payable to CMA and the Sub-Advisers under the Advisory Agreements is fair and equitable. Accordingly, the Boards unanimously re-approved the Advisory Agreements.
120
Board Consideration and Approval of Proposed Investment Advisory and Sub-Advisory Agreements
Even though the following description of the Board's consideration of investment advisory and, as applicable, sub-advisory agreements covers multiple funds and trusts, for purposes of this shareholder report, the description is only relevant as to the Funds.
At a meeting held on December 21, 2009, the Boards of Trustees (the "Boards") of Columbia Funds Series Trust, Columbia Funds Master Investment Trust, LLC and Columbia Funds Series Trust II (each a "Trust" and collectively the "Trusts") unanimously approved a new investment management services agreement with RiverSource Investments, LLC ("RiverSource") (the "Proposed Advisory Agreement") and new subadvisory agreements with Marsico Capital Management ("Marsico Capital"), MacKay Shields LLC ("Mackay Shields") and Brandes Investment Partners, L.P. ("Brandes") (each a "Proposed Subadvisory Agreement"), as applicable, for each Fund of the Trusts (each a "Fund" and collectively the "Funds"). As detailed below, the Trustees met on multiple occasions in advance of the December 21, 2009 meeting, held numerous discussions with the management teams of Columbia Management Advisors, LLC ("Columbia") and RiverSource, a subsidiary of Ameriprise Financial, Inc. ("Ameriprise") and reviewed and considered extensive materials in connection with the approval of the Proposed Advisory and Subadvisory Agreements.
Specifically, the Trustees of each Trust, including a majority of the Trustees who have no direct or indirect interest in the Proposed Advisory and Subadvisory Agreements and are not "interested persons" of the Trusts, as defined in the Investment Company Act of 1940, as amended (the "1940 Act") (the "Independent Trustees") reviewed and approved (i) the Proposed Advisory Agreement with RiverSource for each Fund and (ii) the Proposed Subadvisory Agreement for those Funds that currently have investment subadvisory agreements with Marsico Capital, Mackay Shields, and Brandes (the "Subadvised Funds") (Marsico Capital, MacKay Shields and Brandes are collectively referred to as the "Subadvisers"). Prior to approving the Proposed Advisory Agreements, the Trustees were presented with, and requested, received and evaluated, extensive materials about RiverSource, the sale of a portion of the asset management business of Columbia Managemen t Group, LLC to Ameriprise (the "Transaction") and related matters from RiverSource, Ameriprise and Columbia. In this regard, the Trustees reviewed RiverSource's responses to a series of detailed requests submitted by the Independent Trustees' independent legal counsel and by the Independent Fee Consultant (as defined below).
The Trustees also reviewed and considered information received in connection with their most recent consideration and reapproval in November 2009 of the current advisory agreement (the "Current Advisory Agreement") and current subadvisory agreement (the "Current Subadvisory Agreement"), as applicable, for each Fund, including information about the Subadvisers (the "Current Agreement Re-Approval Process"). Moreover, the Trustees and committees of the Boards met on several occasions, and received extensive materials, throughout the course of the year relating to the Current Agreement Re-Approval Process, which the Trustees considered relevant to their consideration and approval of the Proposed Advisory and Subadvisory Agreements. The Trustees also consulted with Fund counsel and with the Independent Trustees' independent legal counsel, who advised on the legal standards for consideration by the Trustees, and otherwise assisted the Trustees in their deliberations.
In advance of the meeting on December 21, 2009, the Trustees held several meetings, including meetings held in-person with representatives from RiverSource and Ameriprise on August 26, 2009, November 5-6, 2009, December 9-10, 2009 and December 14, 2009, and additional meetings with representatives of Columbia, to discuss the Transaction, RiverSource's plans and intentions regarding the Funds and various proposals that were being presented as a result of the Transaction, including the Proposed Advisory and Subadvisory Agreements. In addition to these meetings, telephonic meetings and discussions were held on several occasions between individual Trustees, members of the committees of the Boards, their independent legal counsel and representatives from RiverSource, Ameriprise and/or Columbia.
The Trustees also reviewed and considered a report prepared and provided by the Fee Consultant (the "Fee Consultant") appointed by the Independent Trustees pursuant to an assurance of discontinuance entered into by a predecessor to Columbia with the New York Attorney General ("NYAG") to settle a civil complaint filed by the NYAG relating to trading in mutual fund shares (the "NYAG Settlement"). The Fee Consultant's role was to manage the process by which management fees are negotiated so that they were negotiated
121
in a manner that is at arms' length and reasonable. The Fee Consultant found that the fee negotiation process was, to the extent practicable, at arms' length and reasonable and consistent with the requirements of the NYAG Settlement. A summary of the Fee Consultant's report is available at www.columbiafunds.com.
The following summarizes a number of the material factors considered by the Trustees in reaching their approvals and determinations with respect to the Proposed Advisory Agreements and Proposed Subadvisory Agreements. It is followed by a more detailed discussion of the Trustees' consideration of these and other factors considered relevant by the Trustees in their evaluation of the Proposed Advisory Agreements and Proposed Subadvisory Agreements. In voting to approve the Proposed Advisory and Subadvisory Agreements for each Fund, the Trustees also considered substantially the same factors, as relevant, and reached substantially the same conclusions in their approval of interim advisory and subadvisory agreements for each Fund.
(i) the terms and conditions of the Proposed Advisory Agreements compared to the terms and conditions of the Current Advisory Agreements, as described below;
(ii) the fact that each Fund's total advisory fees would remain the same;
(iii) the qualifications of the personnel of RiverSource, Ameriprise and the Subadvisers expected to provide advisory and administrative services to each Fund, including representations by Ameriprise regarding its retention of the same process for monitoring and evaluating portfolio management personnel for each Fund as currently used by Columbia;
(iv) the terms and conditions of the Proposed Subadvisory Agreements compared to the terms and conditions of the Current Subadvisory Agreements;
(v) the reputation, financial strength, regulatory and compliance histories and resources of RiverSource and Ameriprise, and the potential benefits to the Funds of the combination of RiverSource and Columbia, including that the Funds are expected to continue to have access to existing distribution channels and have the potential for expanded distribution of Fund shares, the expected depth and breadth of investment management capabilities, that there is not expected to be any diminution in the nature, quality and extent of services to be provided to the Funds under the Proposed Advisory Agreements and the potential for the realization of additional economies of scale over time and the potential of the Funds to share in, and benefit from, these economies, if any;
(vi) that Ameriprise has committed to refrain from imposing or seeking to impose, for a period of not less than two years after the closing of the Transaction (the "Closing"), any "unfair burden" (within the meaning of Section 15(f) of the 1940 Act) on any Fund;
(vii) the terms and conditions of certain other agreements and arrangements relating to the future operations of the Funds and their distribution channels, including the administrative services agreement and the new services and distribution agreement;
(viii) that the Trustees recently had completed the Current Agreement Re-Approval Process for each Fund and had determined that they were satisfied with the nature, extent and quality of services provided thereunder and that the management fee rates and (where applicable) subadvisory fee rates for each Fund were satisfactory;
(ix) that RiverSource was willing to commit to maintain net operating expense ratios at current levels for at least the period currently covered by Columbia's existing commitments;
(x) the capabilities of RiverSource and the Subadvisers with respect to compliance, including an assessment of RiverSource's compliance program by the Funds' Chief Compliance Officer;
(xi) that certain members of RiverSource's management and certain Columbia personnel that will be integrated into RiverSource and its affiliates as a result of the Transaction have substantial experience in integrating fund families; and
122
(xii) that Ameriprise and Bank of America Corporation would bear the costs of obtaining approvals of the Proposed Advisory and Subadvisory Agreements.
In their deliberations, the Trustees did not identify any single item that was paramount or controlling and individual Trustees may have attributed different weights to various factors. The Trustees also evaluated all information available to them on a Fund-by-Fund basis, and their determinations were made separately in respect of each Fund.
Nature, Extent and Quality of Services to be Provided
The Trustees received and considered various data and information regarding the expected nature, extent and quality of services to be provided to the Funds by RiverSource and the Subadvisers under the Proposed Advisory and Subadvisory Agreements. The most recent investment adviser registration forms for RiverSource and each Subadviser were made available to the Boards, as well as extensive materials from RiverSource, Ameriprise and Columbia. The Trustees reviewed and analyzed these materials, which included, among other things, information about the background and experience of expected senior management of RiverSource and Ameriprise after the Closing. The Trustees considered RiverSource's ability to provide administrative services to the Funds, noting that while the aggregate scope of advisory and administrative services was not expected to change following the Closing, the allocation of services was expected to shift, to a lim ited extent, such that administrative services will be provided under a new administrative services agreement. The Trustees considered, among other things, the capacity and quality of RiverSource's and the Subadvisers' investment management, research and trade execution capabilities and other resources that would be dedicated to performing services for the Funds. The Trustees also considered matters related to RiverSource's and the Subadvisers' compliance programs and compliance records, including RiverSource's portfolio transaction policies and procedures. The Trustees discussed with senior management personnel their ability to administer and oversee outside service providers to the Funds and their shareholders and were satisfied with management's processes for providing services and overseeing and reviewing services to be rendered by outside sources.
In evaluating the services to be provided under the Proposed Advisory and Subadvisory Agreements, the Trustees factored in their extensive discussions with representatives of Columbia, RiverSource and Ameriprise at the meetings referenced above regarding the management of each Fund. The Trustees considered representations by Ameriprise that it was expected that there will be no diminution in the nature and quality of services provided to the Funds. The Trustees noted that Columbia Management Group's current President, Columbia's current Chief Investment Officer and Columbia's current President, were expected to continue to serve the Funds in similar capacities after the Closing. With respect to portfolio management, the Trustees reviewed information regarding the deliberative process for selecting portfolio management personnel to continue servicing the Funds after the Closing, including the expected role of Columbia's Chief Inv estment Officer in evaluating and selecting portfolio management personnel for each Fund utilizing Columbia's current analytical model for evaluating portfolio managers. In this regard, the Trustees also weighed representations by Ameriprise that this investment management evaluative process was likely to result in a significant number of Columbia investment professionals and personnel currently responsible for management of the Funds to remain in place. The Trustees noted that the portfolio management evaluation and selection process was designed to optimize the portfolio management resources available to each Fund by having the ability to select investment personnel for the Funds from the combined organization. Similarly, the Trustees evaluated the ability of RiverSource and the Subadvisers, based on their respective resources, reputations and other attributes, to attract and retain qualified investment professionals. In this regard, the Trustees considered information regarding the nature of the compensat ion structure applicable to portfolio managers and other key investment personnel.
The Trustees reviewed and considered information from Ameriprise and RiverSource regarding various contemplated service provider arrangements, including information regarding both immediate and potential future plans in respect of these arrangements. In this regard, the Trustees considered information regarding potential distribution, transfer agency and custody arrangements and the evaluation of fund accounting, financial reporting and valuation service model options, noting certain differences between Columbia's and RiverSource's current approaches, including that RiverSource has historically utilized services provided "in-house" or by its affiliates for fund accounting, financial
123
reporting and valuation. The Trustees reviewed information from Ameriprise and RiverSource regarding the expectation for rationalized or harmonized fees as part of the integration after the Closing in order to develop consistent service fee schedules across the combined fund family. The Trustees noted Ameriprise's representations that, to the extent any such proposals were recommended to the Board after the Closing, they would not result in an "unfair burden" (within the meaning of Section 15(f) of the 1940 Act) on any Fund.
In addition, the Trustees reviewed and evaluated materials and information received regarding the investment and legal compliance programs of the Funds, RiverSource and the Subadvisors, including their compliance policies and procedures and reports of the Funds' Chief Compliance Officer. In this regard, the Trustees considered that Columbia's current Chief Compliance Officer was expected to serve in the same role after the Closing.
The Trustees also noted that Ameriprise and certain of its affiliates have been involved in a number of legal, arbitration and regulatory proceedings, including routine litigation, class actions, and governmental actions, concerning matters arising in connection with the ordinary conduct of their business activities, and that Ameriprise indicated that neither Ameriprise nor any of its affiliates are the subject of any pending legal, arbitration or regulatory proceedings that are likely to have a material adverse effect on the Funds or the ability of Ameriprise or its affiliates, including RiverSource to provide services to the Funds.
Based on the foregoing and other information considered relevant, the Trustees concluded that, overall, they were satisfied with assurances from Columbia, RiverSource, Ameriprise and the Subadvisers as to the expected nature, extent and quality of services to be provided to each Fund under the Proposed Advisory and Subadvisory Agreements.
Investment Advisory and Subadvisory Fee Rates and Other Expenses
The Trustees reviewed and considered the proposed contractual investment advisory fee rates to be paid by each Fund to RiverSource for investment management services both separately and together with the administration fee rates to be paid by the Funds to RiverSource (the "Contractual Management Rates"), which are the same as the separate and aggregate advisory and administrative fee rates currently paid by each Fund to Columbia. The Trustees also reviewed and considered the proposed subadvisory fee rates and the fee arrangements under the Proposed Subadvisory Agreements, respectively, which are also the same as those currently in effect under the Current Subadvisory Agreements. In addition to the materials provided by Columbia, RiverSource provided information regarding the current fees for each of the RiverSource funds and other relevant institutional accounts. The Trustees reviewed and considered the proposed fee waiver/cap a rrangements applicable to the Contractual Management Rates and considered the Contractual Management Rates after taking the waivers/caps into account (the "Actual Management Rates"). In this regard, the Trustees noted that RiverSource had committed to maintain the Funds' current expense limitation and waiver arrangements (both contractual and voluntary). The Trustees considered the potential that, after the Closing, RiverSource would propose a common fee and expense structure for the combined fund family, subject to the commitment that Ameriprise will not seek any change that would result in an "unfair burden" on any Fund. The Trustees also considered the report prepared and provided by the Fee Consultant. Additionally, the Trustees received and afforded specific attention to information provided in connection with the Current Agreement Re-Approval Process, comparing the Contractual Management Rates and Actual Management Rates with those of other funds in each Fund's Peer Group (as defined below).
During the Current Agreement Re-Approval Process, the Trustees reviewed and considered statistical information regarding each Fund's total expense ratio and its various components, including contractual advisory fees, actual advisory fees, actual nonmanagement fees, Rule 12b-1 and non-Rule 12b-1 service fees, fee waivers/caps and/or expense reimbursements. The Trustees also reviewed comparisons of these fees to the expense information for the group of Funds that was determined by Lipper Inc. ("Lipper") to be the most similar to a given Fund (the "Peer Group") and to the performance of a broader universe of relevant funds as determined by Lipper (the "Universe"), which comparative data was provided by Lipper, an independent provider of investment company data.
The Trustees were provided with a description of the methodology used by Lipper to select the mutual funds in each Fund's Peer Group and Universe and reviewed the degree of
124
comparability resulting from the selection methodology. For certain Funds, Lipper determined that changing the composition of the Peer Group and/or Universe for expenses from that used for performance would provide a more accurate basis of comparison. The Trustees also considered Lipper data that ranked each Fund based on: (i) each Fund's one- and three-year performance compared to actual management fees; and (ii) each Fund's one- and three-year performance compared to total expenses.
For each Fund, except as otherwise described in the Fund-specific discussion below, the Trustees noted that they had concluded during the Current Agreement Re-Approval Process that the Contractual Management Rates, the Actual Management Rates and the total expense ratio were at acceptable levels in light of the quality of services provided to the Fund and in comparison to such Fund's Peer Group and Universe, as applicable; that the advisory fee rate would not be increased for any Fund; that Ameriprise and RiverSource had represented that the overall expenses for each Fund were not expected to be adversely affected by the Transaction; and that RiverSource had committed to maintain the Funds' current expense limitation or waiver arrangements (both contractual and voluntary).
Based on the foregoing, other relevant information received and the additional information described in the Fund-specific discussion below, as applicable, the Trustees concluded that the Contractual Management Rates, the Actual Management Rates and the total expense ratio were acceptable.
Fund Performance
The Trustees reviewed detailed performance information for each Fund at various Board and committee meetings during the year in addition to the additional performance information that they reviewed and evaluated in connection with the Transaction. The Trustees also reviewed and evaluated detailed performance information for each Fund in connection with the Current Agreement Re-Approval Process. The Trustees considered the performance results for each of the Funds over multiple measurement periods. They also considered these results in comparison to the performance results of each Fund's Peer Group and Universe, as well as to each Fund's benchmark index. The Boards also noted certain risk-adjusted performance data.
The Trustees also reviewed and evaluated information and data regarding the investment performance record of RiverSource in managing funds with investment strategies generally similar to those of the Funds, as applicable. Investment performance for such funds was provided for a wide range of periods.
The Trustees recognized that the investment performance record of RiverSource in managing funds with similar objectives may be less relevant to their deliberations in situations where the current portfolio managers of Columbia are expected to continue managing a particular Fund following the Closing. They also recognized that for each Fund, it is not possible to predict with certainty what effect, if any, consummation of the Transaction will have on the future performance of the Funds, noting in particular that past investment performance is no assurance of future results. The Fund-by-Fund discussion set forth below provides additional information regarding those Funds highlighted as meeting agreed-upon criteria for warranting further review. Such criteria included, among other things, information relating to Actual Management Rates, total expense ratios and/or performance information, relative to a Fund's Peer Group and/or Univ erse.
Costs of Services to be Provided and Profitability
In considering the costs of services to be provided by RiverSource and the Subadvisers under the Proposed Advisory Agreement and Proposed Subadvisory Agreement, as applicable for each Fund, and the projected range of profitability to RiverSource and the Subadvisers from their relationships with the Funds, the Trustees considered, among other things, that there would be no increase in advisory or subadvisory fee rates under the Proposed Advisory and Subadvisory Agreements. The Trustees further noted, with respect to RiverSource, that it was not possible to predict with certainty how RiverSource's profitability would be affected by becoming the investment adviser to the Funds but, as a general matter, they were satisfied, based on their review of RiverSource's projected range of profitability assuming completion of the Transaction, that this projected profitability from their relationship with the Funds would not be excessive. The Trustees based their review, in part, on information regarding RiverSource's current profitability in managing the RiverSource Funds and the information available to the Trustees with respect to RiverSource's expense budgeting
125
process. The Trustees also noted that they would have ongoing opportunities to address RiverSource's profitability in the future based on actual results. The Trustees did not consider separate profitability information with respect to the Subadvisers, as their profitability from their relationships with the Funds was not a material factor in determining whether to approve the Proposed Subadvisory Agreements. The Trustees also noted that the subadvisory fees paid to the Subadvisers, none of which is affiliated with Columbia, had previously been negotiated on an arms' length basis.
The Trustees also reviewed information about the financial condition of RiverSource and the Subadvisers and were satisfied that RiverSource and the Subadvisers have adequate resources to perform the services required under the Proposed Advisory and Proposed Subadvisory Agreements.
Subject to the limitations noted above, the Trustees concluded that they were satisfied that RiverSource's projected range of future profitability, and each Subadviser's historical profitability, from their relationship with each Fund, as relevant, were not excessive.
Economies of Scale
The Trustees received and evaluated information regarding the potential to realize economies of scale with respect to management of the Funds, whether the Funds would appropriately benefit from any economies of scale and whether there was any potential for realization of further economies of scale in connection with the Transaction. The Trustees noted that the current and proposed investment advisory fee rates for most of the Funds contain breakpoints that reduce the fee rate on assets above specified levels. The Trustees noted that RiverSource had indicated that no changes to the Funds' breakpoint arrangements were proposed to be made at this time. In light of these factors and noting that it was not possible to evaluate with certainty if and how the Transaction would produce any immediate opportunities for additional economies of scale, the Trustees concluded that each Fund's breakpoint arrangements were acceptable. The Truste es also recognized that the Funds may benefit from certain economies of scale over time from becoming a part of the larger RiverSource fund complex, based on potential future synergies of operations, potential fee harmonization/ rationalization initiatives and potential future Fund mergers. The Trustees noted, in particular, RiverSource's acknowledgement of the principle that the Funds should share in certain economies of scale if realized by RiverSource. In addition, the Trustees evaluated the likelihood that there would be potential Fund mergers after the Closing. The Trustees noted that any such potential Fund mergers, if approved, could result in the achievement of additional breakpoints for Funds that have implemented breakpoint fee schedules. The Trustees also noted that they expect to consider economies of scale from time to time following the Closing and thus be in a position to evaluate any additional economies of scale.
The Trustees acknowledged the inherent limitations of any analysis of an investment adviser's economies of scale, stemming largely from the Trustees' understanding that economies of scale are generally realized, if at all, by an investment adviser across a variety of products and services, not just with respect to a single fund.
Information About Investment Management Services to Non-Mutual Fund Clients
The Trustees also received and reviewed information about the nature and extent of services and fee rates offered by Riversource and the Subadvisers to the Funds compared with other clients with similar accounts, including separate accounts and institutional investments. The Trustees noted that the Funds may receive services different from those offered to other clients of RiverSource and the Subadvisers and concluded that the advisory fee rates under the Proposed Advisory Agreements and the subadvisory fee rates under the Proposed Subadvisory Agreements were not excessive, given the nature and extent of services expected to be offered and other factors, including the Trustees' review of Lipper data.
Other Benefits to RiverSource and the Subadvisers
The Trustees received and reviewed information regarding any expected "fall-out" or ancillary benefits to be received by RiverSource and its affiliates and by the Subadvisers as a result of their relationships with the Funds.
Among other things, the Trustees noted that RiverSource would benefit from soft dollar arrangements using portfolio brokerage of each Fund that invests in equity securities. The Trustees also noted that the Subadvisers also had benefited from, and expected to continue to benefit from, soft dollar arrangements using portfolio brokerage of the Subadvised
126
Funds. The Trustees acknowledged RiverSource's representation that none of its affiliated broker dealers was expected to provide brokerage services to any Fund, but noted that broker-dealer affiliates of RiverSource will receive distribution related fees from the Funds in respect of shares held in certain accounts, and that such Funds' distributor (which will also become a subsidiary of RiverSource following the closing of the Transaction) retains a portion of the distribution related fees from the Funds and receives a portion of the sales charges on sales or redemptions of certain classes of shares of the Funds. The Trustees recognized that RiverSource's and the Subadvisers' profitability would be somewhat lower without these benefits. The Trustees concluded that RiverSource and the Subadvisers may derive reputational benefits from their association with the Funds. The Trustees also noted, however, that such benefits were diffi cult to quantify with certainty.
Fund-Specific Considerations for Certain "Review" Funds
During the Current Agreement Re-Approval Process, a limited number of Funds were highlighted as meeting agreed-upon criteria for warranting further review. Such criteria included, among other things, information relating to Actual Management Rates, total expense ratios and/or performance information, relative to a Fund's Peer Group and/or Universe. For such "review" Funds, the Trustees engaged in further analysis with regard to the approval of the Funds' Current Advisory Agreements. For each such Fund, the Trustees subsequently considered the impact of transitioning investment management responsibilities to RiverSource.
Columbia Marsico International Opportunities Fund—The Trustees engaged in further review of Columbia Marsico International Opportunities Fund because its Actual Management Rate was appreciably above the median range of its Peer Group and its performance over certain periods was below the median range of its Universe. However, the Trustees noted other factors such as the inherently higher cost structure of subadvised funds, the implementation of a group breakpoint structure and contractual advisory fee waivers in January 2008 for the Funds subadvised by Marsico Capital, the recent implementation of additional voluntary expense limitations and recent enhancements to Columbia's subadviser oversight process. Taking into account these matters and other factors considered, the Trustees concluded that the Fund's performance and Actual Management Rate we re, at this time, acceptable, under the circumstances.
Columbia Global Value Fund—The Trustees engaged in further review of Columbia Global Value Fund because its Actual Management Rate was appreciably above the median of its Peer Group and its performance over some periods was below the median of its Universe. However, the Trustees noted other factors such as recent improvements in the Fund's total expense rankings, the inherently higher cost structure of subadvised funds, the recent implementation of additional voluntary expense limitations and recent enhancements to Columbia's subadviser oversight process. Taking into account these matters and other factors considered, the Trustees concluded that the Fund's performance and Actual Management Rate were, at this time, acceptable, under the circumstances.
Columbia Multi-Advisor International Equity Fund—The Trustees engaged in further review of Columbia Multi-Advisor International Equity Fund because its Actual Management Rate was above the median range of its Peer Group and its performance over certain periods was below the median range of its Universe. However, the Trustees noted other factors such as a total expense ratio that was appreciably below the median range of the Fund's Peer Group and recent actions taken by Columbia regarding portfolio management responsibilities. Taking into account these matters and other factors considered, the Trustees concluded that the Fund's performance and Actual Management Rate were, at this time, acceptable, under the circumstances.
Conclusion
After an evaluation of the above-described factors and based on its deliberations and analysis of the information provided and alternatives considered, each Board, including all of the Independent Trustees, concluded that approval of the Proposed Advisory and Subadvisory Agreements was in the best interests of each of the Funds and its shareholders. Accordingly, the Boards unanimously approved the Proposed Advisory and Subadvisory Agreements.
127
Summary of Management Fee Evaluation by
Independent Fee Consultant
EXCERPTS FROM REPORT OF INDEPENDENT FEE CONSULTANT TO THE FUNDS SUPERVISED BY THE COLUMBIA NATIONS BOARD
Prepared Pursuant to the February 9, 2005
Assurance of Discontinuance among the
Office of Attorney General of New York State,
Columbia Management Advisors, LLC, and
Columbia Management Distributors, Inc.
November 12, 2009
I. Overview
On February 9, 2005, Columbia Management Advisors, LLC ("CMA") and Columbia Management Distributors, Inc.1 ("CMD") agreed to the New York Attorney General's Assurance of Discontinuance ("AOD"). Among other things, the AOD stipulates that CMA may manage or advise a Columbia Fund ("Columbia Fund" and, together with some or all of such funds, the "Columbia Funds") only if the Independent Members of the Columbia Fund's Board of Trustees appoint a Senior Officer or retain an Independent Fee Consultant ("IFC") who is to manage the process by which proposed management fees are negotiated. The AOD further stipulates that the Senior Officer or IFC is to prepare a written annual evaluation of the fee negotiation process.
With effect from January 1, 2007, the Independent Members of the Board of Trustees for certain Columbia Funds known collectively as the "Nations Funds" (together with the other members of that Board, the "Trustees") retained me as IFC for the Nations Funds.2 In this capacity, I have prepared the fifth annual written evaluation of the fee negotiation process. As was the case with the 2007 and 2008 reports, my immediate predecessor as IFC, John Rea, provided invaluable assistance in the preparation of this year's report.
A. Role of the Independent Fee Consultant
The AOD charges the IFC with "managing the process by which proposed management fees ... to be charged the Columbia Fund are negotiated so that they are negotiated in a manner which is at arms' length and reasonable and consistent with this Assurance of Discontinuance." The AOD also provides that CMA "may manage or advise a Columbia Fund only if the reasonableness of the proposed management fees is determined by the Board of Trustees ... using ... an annual independent written evaluation prepared by or under the direction of ... the Independent Fee Consultant." Therefore, the AOD makes clear that the IFC does not supplant the Trustees in negotiating management fees with CMA, nor does the IFC substitute his or her judgment for that of the Trustees with respect to the reasonableness of proposed fees or any other matter that is committed to the business judgmen t of the Trustees.
B. Elements Involved in Managing the Fee Negotiation Process
In preparing the report required by the AOD, the IFC must consider at least the following six factors set forth in the AOD:
1. The nature and quality of CMA's services, including the Fund's performance;
2. Management fees (including any components thereof) charged by other mutual fund companies for like services;
3. Possible economies of scale as the Fund grows larger;
4. Management fees (including any components thereof) charged to institutional and other clients of CMA for like services;
5. Costs to CMA and its affiliates of supplying services pursuant to the management fee agreements, excluding any intra-corporate profit; and
6. Profit margins of CMA and its affiliates from supplying such services.
C. Organization of the Annual Evaluation
This report, like last year's, focuses on the six factors and contains a section for each factor except that CMA's costs and profits from managing the Funds are treated in a single section. In addition to a discussion of these factors, the report offers recommendations to improve the fee review process in future years. A review of the status of recommendations made in the 2008 Report is being provided separately with the materials for the November meeting.
1 CMA and CMD are subsidiaries of Columbia Management Group, LLC ("CMG"), and are the successors to the entities named in the AOD.
2 I have no material relationship with Bank of America, CMG or any of its affiliates, aside from serving as IFC, and I am aware of no material relationship with any of their affiliates. I retained John Rea, an independent economic consultant, to assist me with this report.
Unless otherwise stated or required by the context, this report covers only the Nations Funds, which are also referred as the "Funds."
128
II. Summary of Findings
A. General
1. Based upon my examination of the information supplied by CMG in the light of the six factors set forth in the AOD, I conclude that the Trustees have the relevant information necessary to evaluate the reasonableness of the proposed management fees for each Nations Fund, subject to the following: on September 30, 2009, Ameriprise Financial, Inc. ("Ameriprise") announced that it had agreed to purchase the investment management business of CMG with the exception of its cash and liquidity management business which includes the Nations money market Funds. As a result, the Trustees requested information from CMG as to the plans of CMG and its parent with respect to the provision of investment management services to those Funds after the consummation of the proposed transaction. As of the date of this report, that in formation has not yet been provided. However, as the transaction is not expected to close until the spring of 2010, the Trustees concluded that they would have ample opportunity to take appropriate steps with respect to the investment management agreements of the money market Funds, including invoking the 60-day termination provisions of those agreements, in response to the information to be provided by CMG and reviewed by the IFC.
In my view, the process by which the proposed management fees of the Funds have been negotiated in 2009 thus far has been, to the extent practicable, at arms' length and reasonable and consistent with the AOD.
B. Nature and Quality of Services, Including Performance
3. The performance of the Funds was relatively strong for the measuring periods ending March 31, 2009. Between one-third and nearly one-half of the Funds were ranked in either the first or second quintiles in the one-, three-, five-, and 10-year periods, and no more than 8% were in the fifth quintile for these periods. Overall, the performance was stronger in the two longer periods.
4. The strongest performing groups over the one-, three-, and five-year periods were active equity, quantitative strategies, and, to a lesser extent, money market Funds. Sub-advised Funds were the weakest performers, with over 60% of the Funds in the bottom two quintiles in the one- and three-year periods. For the same two periods, no more than 15% percent of the sub-advised Funds were in the top two quintiles. Almost half of fixed-income Funds ranked in the bottom two quintiles in the one- and three-year periods.
5. Overall performance of the Funds was less robust in 2009 than in 2008 and 2007 for the one- and three-year performance periods. For example, 62% of the Funds were in the top two quintiles in 2007 for the one-year period compared with 33% in 2009. The ranks of those in the bottom two quintiles rose significantly between 2007 and 2009, led by money market and fixed-income Funds in the one- and three-year periods. For the three-year period, there was a similar trend with respect to sub-advised Funds.
6. The performance of the active equity Funds against their benchmarks was strong for the one-, three-, and five-year performance periods. In contrast, more than half of the sub-advised Funds failed to beat their benchmarks on a net basis in the one- and three-year periods. The fixed-income Funds consistently produced gross returns below those of their benchmarks. Lipper quintile rankings of the actively managed equity Funds are highly correlated with their performance against their benchmarks in the sense that net returns in excess of the benchmark appear necessary to achieve a ranking in one of the top three quintiles. No such correlation was observed for fixed-income and quantitative strategies Funds.
7. The equity Funds' overall performance adjusted for risk was mixed. Based upon three-year returns, less than 40% of the equity Funds had a combination of risk-adjusted and unadjusted returns that placed them in the top half of their performance universes; 60% were in the bottom half of their universes. About 30% of the fixed income Funds posted high returns and low risk relative to comparable funds. Over 60% of the fixed-income Funds took on more risk than the typical fund in their performance universes.
8. The industry-standard procedure used by Lipper that includes all share classes in the performance universe tends to bias a Fund's ranking upward within that universe. The bias occurs because either no-12b-1 fee or low-12b-1 fee share classes of the Nations Funds are compared with funds in performance universes that
129
include all share classes of multi-class funds with 12b-1 fees of up to 100 basis points. Correcting this bias by limiting the performance universe to classes of comparable funds with low or no 12b-1 fees (a "filtered universe") lowers the relative performance for the Funds, but generally not to a material extent. The filtering process, however, did identify two Funds for further review that had not been so identified using unfiltered universes.
9. A small number of Funds have consistently underperformed over the past five years. The exact number depends on the criteria used to evaluate longer-term performance. For example, six different Funds have had below-median performance in at least four out of the five years between 2005 and 2009 for either the one- or three-year performance periods from 2005 to 2009. If the threshold were the 60th percentile, only two Funds would have satisfied the criteria.
10. The services performed by CMG professionals beyond portfolio management, such as compliance, legal, information technology, risk management, finance, and fund administration, are critical to the success of the Funds and appear to be of high quality.
C. Management Fees Charged by Other Mutual Fund Companies
11. The Funds' management fees and total expenses are generally low relative to those of their peers, with over half the Funds ranking in the most favorable two quintiles. For total expenses, slightly more than one-quarter are in the bottom two quintiles, while slightly less than two-fifths are in the bottom two quintiles for actual management fees. Fixed-income and quantitative strategies Funds have the lowest fees and expenses relative to their peers. The sub-advised Funds account for the majority of Funds in the fifth quintile for both management fees and total expenses.
12. The distribution of management fee rankings has changed little over the past three years, while the distribution of total expense rankings has moved in the direction of higher expenses. The most notable change involving total expenses has been a shift in the number of Funds from the first to the second quintile.
13. The management fees of the non-subadvised Funds are generally in line with those of Columbia Funds supervised by the Atlantic Board of Trustees (the "Atlantic Funds"). The sub-advised large cap equity, international equity, and high yield Funds, however, generally have higher management fees than those of comparable Atlantic and non-subadvised Funds.
14. The implementation of the new program of voluntary expense limits appears to have been associated, on balance, with less favorable expense rankings. This result reflects increases in expense limits for certain Funds, the removal of fee waivers, and the shift of certain expenses from CMA to the Funds. The decline in expense rankings is less significant, however, than CMA projected in December 2008.
D. Trustees' Advisory Contract Review Process
15. The Trustees' evaluation process identified 22 Funds in 2009 for further review based upon long-standing criteria relating to their relative performance or expenses or both. When compared in filtered universes, two more Funds met the criteria for further review. At the November meeting, CMG provided further information about each of those Funds to assist the Trustees in their evaluation.
E. Potential Economies of Scale
16. CMG presented to the Trustees its analysis of the sources and sharing of potential economies of scale. CMG views economies of scale as arising at the complex level and would regard estimates of scale economies for individual funds as unreliable. In its analysis, CMG did not identify specific sources of economies of scale or provide any estimates of any economies of scale that might arise from future asset growth. CMG's analysis included measures taken by the Trustees and CMG that seek to share any potential economies of scale through breakpoints in management fee schedules, the establishment of expense limits for each Fund, enhanced shareholder services, fund mergers, and operational consolidation.
17. An examination of the contractual fee schedules for five Nations Funds shows that the schedules for Small Cap II, Municipal Reserves, and Treasury Reserves compare favorably with those of their competitors, while the subadvised Marsico Growth and High Yield VS Funds have schedules generally above those of their peers, including funds that do not have a sub-adviser. The group fee with
130
breakpoints that characterizes the money market Fund schedules is not typically found among competitors, nearly all of which have flat fee schedules.
F. Management Fees Charged to Institutional Clients
18. CMG has provided Trustees with comparisons of mutual fund management fees and institutional fees based upon standardized fee schedules and upon actual fees. The results show that, consistent with industry practice, actual and scheduled institutional fees are generally, but not always, lower than the Funds' management fees. CMG provided additional data this year demonstrating that at small asset levels, the effective fee of certain Funds may be equal to or less than institutional fee levels at those asset levels, due to the effect of expense limits on small funds with high gross expenses. CMG also analyzed the differences between the services provided and risks borne on the one hand by a manager of mutual funds and on the other by institutional advisers, and suggested that these differences should be kept in mind when Trustees review the reasonableness of the Funds' management fees.
G. Revenues, Expenses, and Profits
19. The activity-based cost allocation methodology employed by CMG to allocate costs, both direct and indirect, for purposes of calculating Fund profitability is thoughtful and detailed. This year, CMG further refined the technique by allocating additional indirect expenses on an activity basis.
20. The materials provided on CMG's revenues and expenses with respect to the Funds and the methodology underlying their construction form a sufficient basis for Trustees to evaluate the expenses of and profitability to CMG arising out of its relationships with the Funds.
21. CMG provided a firm-wide pro forma 2009 income statement demonstrating the effect of market events beginning in the fourth quarter of 2008 on its revenues and profitability to provide an additional perspective on calendar 2008 profitability data.
22. In 2008, CMG's pre-tax pre- and post-distribution margins on the Nations Funds were above the industry mean and median, based on limited data available for publicly held mutual fund managers and excluding the costs of CMG's money market capital support programs. However, as is to be expected in a 63-Fund complex, some Nations Funds had relatively high pre-tax profit margins in 2008, when calculated solely with respect to management revenues and expenses, while other Nations Funds operated at a loss. There is a positive relationship between Fund size and profitability to CMG, with smaller Funds generally operating at a loss to CMG.
23. CMG pays a fixed percentage of its management fee revenues to an affiliate, U.S. Trust, Bank of America Private Wealth Management, with respect to assets of its clients invested in Nations Funds to compensate it for services it performs with respect to those client assets and for the effect of state law limitations on affiliates charging multiple fees. Based on our analysis of the services provided by this affiliate, we have concluded that all payments other than those for sub-transfer agent or sub-accounting services should be treated as a distribution expense.
III. Recommendations
1) Criteria for review. The Trustees may wish to consider modifying the criteria for identifying a Fund for further review (a "Review Fund") to include criteria that focus exclusively on performance. They may also wish to consider whether it would be useful to apply CMG's own internal monitoring standards for Fund performance to the contract review process, or whether such criteria are more relevant to their ongoing investment oversight.
2) Presentation of Review Fund discussion. CMG should consider whether it could more systematically present in one discussion all relevant information regarding each Review Fund, which is now split into several different portions of the 15(c) materials. For any Fund that has been a Review Fund in consecutive years, CMG should address under what circumstances it could reasonably be anticipated that the Fund would lose that status.
3) Refinement of tax-exempt performance data. Certain single-state tax-exempt Funds compete in extremely small universes and are compared to a multi-state benchmark of uncertain relevance. Notwithstanding the difficulties, CMG should work to improve the reliability of the calculation of relative performance of these Funds. If that is not possible, CMG should provide guidance on how the Trustees should judge the quality of CMG's management of these Funds.
131
4) Development of risk metrics for asset-allocation, tax-exempt, and money market Funds. CMG has developed and shared with the Trustees quantitative risk metrics comparing equity and taxable fixed-income Funds against their peers. However, reliable risk metrics have not been developed for asset-allocation, tax-exempt fixed income, and money market Funds. We urge CMG to continue its efforts to provide reliable risk measures for these categories of Funds, especially in the cases of asset-allocation and money market funds, because their investors are likely to be motivated at least in part by a desire to manage risk.
5) Profitability data. For any period during which CMG is an affiliate of U.S. Trust, Bank of America Private Wealth Management, CMG should continue to present to the Trustees the profitability of each Fund, each investment style and each complex (of which Nations is one) calculated as follows:
a. Management-only profitability should be calculated without reference to any Private Bank expense.
b. Profitability excluding distribution (which essentially covers the management and transfer agency functions) should be adjusted by removing from the expense calculation any portion of the Private Bank payment not attributable to the performance by the Private Bank of sub-transfer agency or sub-accounting functions.
c. Total profitability, including distribution: No adjustment for Private Bank expenses should be made, because all such expenses represent legitimate fund expenses to be taken into account in calculating CMG's profit margin including distribution.
d. Distribution only: This should include all Private Bank expenses other than those attributable to sub-transfer agency services.
6) Contractual fee analysis. This year CMG presented a new Lipper report comparing the contractual management fees of Funds with those of competitors in similar investment styles. However, the reliability of the conclusion—that Fund management fee breakpoints compared favorably with competitive fee rates—was limited by the use of competitive funds at all asset levels. The sponsors of a $100 million mutual fund may not have given much thought to breakpoints at $5 billion; therefore, that fund's contractual fee at that level is unlikely to compare favorably with that of a $5 billion Fund. Limiting the competitors to the Lipper expense group, whose constituents are similar in size to the rele vant Fund, would make the results more meaningful. In addition, the breakpoints of a select group of Nations Funds (which would differ each year) should continue to be compared to those of industry rivals to ensure that the Funds' breakpoint schedules remain within industry norms. As breakpoint schedules change relatively little each year, performing such a comparison for each Nations Fund each year would not be an efficient use of Trustee and CMG resources.
7) Pro forma profitability data. In any year in which CMG or the Trustees believe that the prior year's profitability is unlikely to be representative of current business results due to changes in markets or for any other reason, CMG should, consistent with this year's practice, prepare a pro forma income statement based on year-to-date actual data and reasonable projections used for its own business planning purposes.
8) Additional institutional data and analysis. While CMG provided a substantial amount of information on its institutional business, we suggest some additional items for future years: (a) profitability data for the institutional business in the format, and based upon the same allocation methodologies, used to present Fund profitability, (b) an explanation of how CMA sets institutional fee breakpoints, which normally begin at asset levels far lower than those found in Fund management fee breakpoints, and (c) distinguishing in all institutional fee materials fees of accounts acquired prior to the development of current fee schedules (so-called "legacy" accounts) from the fees of accounts launched after that time.
9) Management fee disparities. In any future study of management fees, CMG and the Nations Trustees should analyze the differences in management fee schedules. As part of that analysis, CMG should provide an explanation for any significant fee differences among comparable funds across fund families sponsored by CMG, such as differences in the management styles of different Funds included the same Lipper category. Finally, if CMG proposes a management fee change or an expense cap for
132
any mutual fund managed by CMA that is comparable to any Nations Fund, CMG should provide the Trustees with sufficient information about the proposal to allow the Trustees to assess the applicability of the proposed change to the relevant Nations Fund or Funds.
10) Explanation of data supplied to Lipper. Each year, as part of the 15(c) process, CMG retains Lipper to compare the fees and expenses of each Fund to a group of competitors. In many cases, CMG, with the approval of the Trustees, adjusts the actual expense data, which is based on the most recent full fiscal year of the Fund (and each competitive fund) to reflect changes in fees or expense limits that occurred during or after the relevant fiscal year. This improves the reliability and usefulness of the comparison. However, to ensure that the Trustees know when and how CMG adjusted the data, we recommend that CMG prepare a table listing for each Fund what adjustments were made, e.g., to reflect a new expense limitation of x basis points that commenced on y date.
11) Reduction of volume of paper documents submitted. The effort to streamline and better organize the data presented to the Trustees and the process by which that data was prepared and organized continued to be well-received by all parties. Notwithstanding past success, it is always appropriate to look for opportunities to reduce and simplify the presentation of 15(c) data. One possibility would be to remove the 127 pages of biographical data, most if not all of which the Trustees have previously seen as part of their ongoing investment oversight duties, from the paper volume and post it on the Internet-based document storage and retrieval system used by the Funds to provide reference data to Trustees.
Respectfully submitted,
Steven E. Asher
133
This page intentionally left blank.
This page intentionally left blank.
This page intentionally left blank.
Important Information About This Report
The funds mail one shareholder report to each shareholder address. If you would like more than one report, please call shareholder services at 1-800-345-6611 and additional reports will be sent to you. This report has been prepared for shareholders of the International/Global Stock Funds listed on the front cover.
A description of the policies and procedures that each fund uses to determine how to vote proxies and a copy of each fund's voting records are available (i) at www.columbiamanagement.com, (ii) on the Securities and Exchange Commission's website at www.sec.gov, and (iii) without charge, upon request, by calling 1-800-368-0346. Information regarding how each fund voted proxies relating to portfolio securities during the 12-month period ended June 30 is available from the SEC's website. Information regarding how each fund voted proxies relating to portfolio securities is also available from the funds' website, www.columbiamanagement.com.
Each fund files a complete schedule of portfolio holdings with the SEC for the first and third quarters of each fiscal year on Form N-Q. Each fund's Form N-Q is available on the SEC's website at www.sec.gov and may be reviewed and copied at the SEC's Public Reference Room in Washington, D.C. Information on the operation of the Public Reference Room may be obtained by calling 1-800-SEC-0330.
Please read and consider the investment objectives, risks, charges and expenses for any fund carefully before investing. For a prospectus which contains this and other important information about a fund, contact your Columbia Management representative or financial advisor or go to www.columbiamanagement.com.
Columbia Management Group, LLC ("Columbia Management") is the investment management division of Bank of America Corporation. Columbia Management entities furnish investment management services and products for institutional and individual investors. Columbia Funds are distributed by Columbia Management Distributors, Inc., member of FINRA, SIPC, part of Columbia Management and an affiliate of Bank of America Corporation.
| Transfer Agent | |
|
Columbia Management Services, Inc.
P.O. Box 8081
Boston, MA 02266-8081
800.345.6611 | |
|
| Distributor | |
|
Columbia Management
Distributors, Inc.
One Financial Center
Boston, MA 02111 | |
|
| Investment Advisor | |
|
Columbia Management Advisors, LLC
100 Federal Street
Boston, MA 02110 | |
|
137
Columbia Management®
One Financial Center
Boston, MA 02111-2621
PRSRT STD
U.S. Postage
PAID
Holliston, MA
Permit NO. 20
Columbia Management®
International/Global
Stock Funds
Annual Report, February 28, 2010
©2010 Columbia Management Distributors, Inc.
One Financial Center, Boston, MA 02111-2621
800-345-6611 www.columbiafunds.com
SHC-42/35030-0210 (04/10) 10/F6R3I2

Annual Report
February 28, 2010
Index Funds
| n | | Columbia Large Cap Index Fund |
| n | | Columbia Large Cap Enhanced Core Fund |
| n | | Columbia Mid Cap Index Fund |
| n | | Columbia Small Cap Index Fund |
| | |
| NOT FDIC INSURED | | May Lose Value |
| NOT BANK ISSUED | | No Bank Guarantee |
Table of contents
The views expressed in this report reflect the current views of the respective parties. These views are not guarantees of future performance and involve certain risks, uncertainties and assumptions that are difficult to predict so actual outcomes and results may differ significantly from the views expressed. These views are subject to change at any time based upon economic, market or other conditions and the respective parties disclaim any responsibility to update such views. These views may not be relied on as investment advice and, because investment decisions for a Columbia Fund are based on numerous factors, may not be relied on as an indication of trading intent on behalf of any particular Columbia Fund. References to specific company securities should not be construed as a recommendation or investment advice.
President’s Message

Dear Shareholder:
As we previously announced, Bank of America, N.A. has reached a definitive agreement to sell Columbia Management’s long-term asset management business to Ameriprise Financial, Inc. This includes the management of its equity and fixed-income mutual funds.
This transaction combines two leading asset management firms and will create one entity that is expected to rank as one of the top asset managers. It is anticipated that the combined U.S. asset management business will operate under the well-regarded Columbia Management brand. The combined U.S. asset management business will be led by Ted Truscott, currently president, U.S. asset management, annuities and chief investment officer, Ameriprise Financial. Michael A. Jones, currently president of Columbia Management, will serve as president, U.S. asset management. Colin Moore, chief investment officer at Columbia Management, will continue to serve in that role for the combined organization. I will also continue in my role as head of mutual funds, responsible for the delivery of mutual fund products and services to investors.
As a valued investor in Columbia funds, please know that our goal is to ensure a smooth transition and provide you with the highest quality products and services. We will work closely with colleagues at Ameriprise Financial to seek a seamless transition for our clients and to keep you informed as the transition progresses and key decisions are made. We want to assure you that the funds’ portfolio managers continue to focus on providing uninterrupted service to Columbia fund shareholders. Columbia Management and Ameriprise Financial will operate independently until all required approvals, including fund board, fund shareholder and other client approvals, have been received and the transaction closes, which is expected to occur in the spring of this year.
Meanwhile, transition teams across the company have been formed to oversee integration efforts including rebranding initiatives, vendor and system consolidations and client communications. Throughout the transition, we seek to build on best practices from both legacy organizations with enhancements to productivity, quality and the delivery of world-class customer experiences.
Clearly, we have a lot of work ahead of us in 2010. We look forward to introducing our combined business with an even wider breadth of products and capabilities. Everyone at Columbia Management and Ameriprise Financial is excited about the opportunities for this combined organization. I share this optimism and believe it will position us as a best-in-class asset management business with the ability to deliver more for clients than ever before.
Sincerely,

J. Kevin Connaughton
President, Columbia Funds
Economic Update
February 2010
Summary
For the 12-month period that ended February 28, 2010
| | n | | After a sharp decline, stock markets rebounded around the world, as measured by the S&P 500 Index and the MSCI EAFE Index. | |
| | |
| S&P Index | | MSCI Index |
| |

| |
|
53.62% | | 54.58% |
| | n | | As investors grew more comfortable with risk, non-Treasury sectors of the bond market rebounded. The Barclays Capital Aggregate Bond Index delivered solid results. High-yield bonds were strong performers, as measured by the JPMorgan Developed BB High Yield Index. | |
| | |
| Barclays Aggregate Index | | JPMorgan Index |
| |
| |
|
9.32% | | 32.79% |
After a deep and difficult recession, the U.S. economy regained its footing midway through calendar year 2009. Gross domestic product (GDP) turned positive in the third quarter of 2009, rising 2.2%, and then gained 5.6% in the fourth quarter according to the estimate released by the Bureau of Economic Analysis. Growth was primarily the result of federal government stimulus spending and a slowdown in inventory reductions. Hopes for a sustained recovery now depend on a variety of factors, including a rebound in consumer spending, an increase in revenues to keep business profits moving higher and a turnaround in the labor market.
The housing market showed some signs of improvement. Existing home sales fell late in the period, but remained above levels of one year ago. According to the National Association of Realtors, the inventory of houses for sale fell over the course of 2009. Housing prices remained unchanged during the past year, but that was progress compared to 2008. The average home price fell in 2008 and since then distressed properties, which accounted for an estimated 38% of sales in January 2010, have weighed on prices because they were heavily discounted.
In the beleaguered labor market, the good news was that there was less bad news. Businesses continued to shed jobs throughout the period, raising the unemployment rate as high as 10.2% in October 2009. However, the pace of job losses slowed markedly by the period’s end. Compared to six figure losses of one year ago, 14,000 jobs were added to the labor market in January 2010 and only 14,000 were lost in February 2010.* The rate of unemployment at the end of the period was 9.7%.* Nevertheless, prospects for a quick recovery in the labor markets are dim. In fact, consumer confidence, as measured monthly by The Conference Board, an independent research organization, took a sharp dive in February. Consumers surveyed cited worsening business conditions and a bleaker outlook for the labor markets and income for their pessimism.
Manufacturing activity remained slow during the first few months of the period. However, a key measure — the Institute for Supply Management’s Index — rose above 50 in July and remained well above 50 for the remainder of the period. A value above 50 tends to indicate that the economy is growing. Industrial production turned positive in January 2010, and durable goods orders took a big jump forward. Manufacturing capacity utilization inched upward to 72.6%.
Consumer spending registered both ups and downs during the 12-month period, but the trend at the end of the period was upward, even though personal income decreased in January 2010. In light of uncertainty about the economy and pressure on consumers from a number of sectors, the Federal Reserve Board (the Fed) kept a key short-term interest rate — the federal funds rate — close to zero throughout the period.
Stocks bottomed, then rebounded
Against a strengthening economic backdrop, a stock market rally that began in mid-March 2009 continued throughout the period. The U.S. stock market returned
| * | Source: U.S. Bureau of Labor Statistics |
1
Economic Update (continued)
February 2010
53.62% for the 12-month period, as measured by the S&P 500 Index.1 Mid-cap stocks outperformed large and small-cap stocks and value stocks outperformed growth stocks by a solid margin, as measured by their respective Russell indices.2 Outside the U.S., stock market returns were even stronger. The MSCI EAFE Index,3 a broad gauge of stock market performance in foreign developed markets, gained 54.58% (net of dividends, in U.S. dollars) for the period. Emerging stock markets were caught in last year’s downdraft, but they bounced back stronger than domestic or developed world markets in 2009 as their economic growth generally outpaced the developed world. The MSCI Emerging Markets Index4 returned 91.63% (net of dividends, in U.S. dollars).
Bond returns ranged from solid to strong
As hopes for a recovery materialized, bonds from non-Treasury sectors delivered solid returns. The Barclays Capital Aggregate Bond Index5 returned 9.32%. Municipal bonds delivered returns that were in line with taxable investment-grade bonds even without factoring in potential tax advantages to investors in higher income tax brackets. The Barclays Capital Municipal Bond Index6 returned 9.98%. High-yield bond prices rebounded strongly in 2009. For the 12-month period covered by this report, the JPMorgan Developed BB High Yield Index7 returned 32.79%.
Past performance is no guarantee of future results.
| 1 | The Standard & Poor’s (S&P) 500 Index tracks the performance of 500 widely held, large-capitalization U.S. stocks. |
| 2 | The Russell 1000 Index tracks the performance of 1,000 of the largest U.S. companies, based on market capitalization. The Russell Midcap Index measures the performance of the 800 smallest companies in the Russell 1000 Index, which represents approximately 25% of the total market capitalization of the Russell 1000 Index. The Russell 2000 Index measures the performance of the 2,000 smallest companies in the Russell 3000 Index, which represents approximately 8% of the total market capitalization of the Russell 3000 Index. The Russell 3000 Growth Index measures the performance of those Russell 3000 Index companies with higher price-to-book ratios and higher forecasted growth values. The stocks in this index are also members of either the Russell 1000 Growth or the Russell 2000 Growth indexes. The Russell 3000 Value Index measures the performance of those Russell 3000 Index companies with lower price-to-book ratios and lower forecasted growth values. The stocks in this index are also members of either the Russell 1000 Value or the Russell 2000 Value indexes. |
| 3 | The Morgan Stanley Capital International Europe, Australasia, Far East (MSCI EAFE) Index is a capitalization-weighted index that tracks the total return of common stocks in 21 developed-market countries within Europe, Australasia and the Far East. |
| 4 | The Morgan Stanley Capital International Emerging Markets Index (MSCI EMI) is a free float-adjusted market capitalization index that is designed to measure equity market performance of emerging markets. As of June 2009, the MSCI Emerging Markets Index consisted of the following 22 emerging market country indices: Brazil, Chile, China, Colombia, Czech Republic, Egypt, Hungary, India, Indonesia, Israel, Korea, Malaysia, Mexico, Morocco, Peru, Philippines, Poland, Russia, South Africa, Taiwan, Thailand, and Turkey. |
| 5 | The Barclays Capital Aggregate Bond Index is a market value-weighted index that tracks the daily price, coupon, pay-downs and total return performance of fixed-rate, publicly placed, dollar-denominated and non-convertible investment grade debt issues with at least $250 million par amount outstanding and with at least one year to final maturity. |
| 6 | The Barclays Capital Municipal Bond Index is considered representative of the broad market for investment-grade, tax-exempt bonds with a maturity of at least one year. |
| 7 | The JPMorgan Developed BB High Yield Index is an unmanaged index designed to mirror the investable universe of the U.S. dollar developed, BB-rated, high yield corporate debt market. |
Indices are not available for investment, are not professionally managed and do not reflect sales charges, fees, brokerage commissions, taxes or other expenses of investing. Securities in the fund may not match those in an index.
2
Fund Profile – Columbia Large Cap Index Fund
Performance data quoted represents past performance and current performance may be lower or higher. Past performance is no guarantee of future results. The investment return and principal value will fluctuate so that shares, when redeemed, may be worth more or less than the original cost. Please visit www.columbiafunds.com for daily and most recent month-end performance updates.
Summary
1-year return as of 02/28/10
| | |
| |
 | | +53.09% Class A Shares |
| |
| | +53.62% S&P 500 Index |
|
Morningstar Style BoxTM |
|
Equity Style |
|
The Morningstar Style BoxTM reveals a fund’s investment strategy. For equity funds the vertical axis shows the market capitalization of the stocks owned, and the horizontal axis shows investment style (value, blend or growth). Information shown is based on the most recent data provided by Morningstar.
Summary
| n | | For the 12-month period that ended February 28, 2010, the fund’s Class A shares returned 53.09% without sales charge. |
| n | | The fund’s return was in line with the return of its benchmark, the S&P 500 Index,1 and slightly ahead of the average return of funds in its peer group, the Lipper S&P 500 Index Objective Funds Classification.2 |
| n | | In a period of sharply rising stock prices, some of the strongest returns came from sectors that had been beaten down as the economy weakened and investor fears about the financial system clouded the markets. |
Portfolio Management
Cheryl D’Hollander has co-managed the fund since February 2009 and has been associated with the advisor or its predecessors since 2003
Alfred F. Alley III has co-managed the fund since July 2009 and has been associated with the advisor or its predecessors since 2005.
Subject to satisfying various conditions to closing, effective on or about May 1, 2010, RiverSource Investments, LLC, a subsidiary of Ameriprise Financial, Inc., is expected to become the investment advisor to the fund and change its name to Columbia Management Investment Advisers, LLC. Please see the fund’s prospectus dated July 1, 2009, including the supplements thereto, for more information regarding the expected change in investment advisor and any related changes to the portfolio management of the fund.
| 1 | The Standard & Poor’s (S&P) 500 Index tracks the performance of 500 widely held, large-capitalization U.S. stocks. Indices are not available for investment, are not professionally managed and do not reflect sales charges, fees, brokerage commissions, taxes or other expenses of investing. Securities in the fund may not match those in an index. |
| 2 | Lipper Inc., a widely respected data provider in the industry, calculates an average total return (assuming reinvestment of distributions) for mutual funds with investment objectives similar to those of the fund. Lipper makes no adjustment for the effect of sales loads. |
3
Performance Information – Columbia Large Cap Index Fund
Performance data quoted represents past performance and current performance may be lower or higher. Past performance is no guarantee of future results. The investment return and principal value will fluctuate so that shares, when redeemed, may be worth more or less than the original cost. Please visit www.columbiafunds.com for daily and most recent month-end performance updates.
| | |
| Annual operating expense ratio (%)* |
| |
Class A | | 0.45 |
Class B | | 1.20 |
Class Z | | 0.20 |
| * | The annual operating expense ratio is as stated in the fund’s prospectus that is current as of the date of this report. Differences in expense ratios disclosed elsewhere in this report may result from the inclusion of fee waivers and expense reimbursements as well as the use of different time periods used in calculating the ratios. | |
| | |
| Performance of a $10,000 investment 03/01/00 – 02/28/10 |
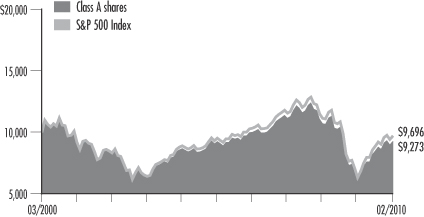
The chart above shows the change in value of a hypothetical $10,000 investment in Class A shares of Columbia Large Cap Index Fund during the stated time period, and does not reflect the deduction of taxes that a shareholder may pay on fund distributions or on the redemption of fund shares.
| | | | |
| Performance of a $10,000 investment 03/01/00 – 02/28/10 ($) |
| | |
| Sales charge | | without | | with |
Class A | | 9,273 | | n/a |
Class B | | 8,973 | | 8,973 |
Class Z | | 9,506 | | n/a |
| | | | | | | | |
| Average annual total return as of 02/28/10 (%) |
| | | |
| Share class | | A | | B | | Z |
| Inception | | 10/10/95 | | 09/23/05 | | 12/15/93 |
| Sales charge | | without | | without | | with | | without |
1-year | | 53.09 | | 51.94 | | 46.94 | | 53.49 |
5-year | | 0.02 | | –0.64 | | –1.02 | | 0.26 |
10-year | | –0.75 | | –1.08 | | –1.08 | | –0.51 |
| | | | | | | | |
| Average annual total return as of 03/31/10 (%) |
| | | |
| Share class | | A | | B | | Z |
| Sales charge | | without | | without | | with | | without |
1-year | | 49.21 | | 48.14 | | 43.14 | | 49.57 |
5-year | | 1.55 | | 0.88 | | 0.49 | | 1.81 |
10-year | | –1.10 | | –1.43 | | –1.43 | | –0.85 |
The “with sales charge” returns include the applicable contingent deferred sales charge of 5.00% in the first year, declining to 1.00% in the sixth year and eliminated thereafter for Class B shares. The “without sales charge” returns do not include the effect of sales charges. If they had, returns would be lower.
Performance results reflect any fee waivers or reimbursements of fund expenses by the investment advisor and/or any of its affiliates. Absent these fee waivers or expense reimbursement arrangements, performance results would have been lower.
All results shown assume reinvestment of distributions. Class A shares are sold at net asset value. Class Z shares are sold at net asset value with no distribution and service (Rule 12b-1) fees. Class Z shares have limited eligibility and the investment minimum requirements may vary. Please see the fund’s prospectus for details. Performance for different share classes will vary based on differences in sales charges and fees associated with each class.
Class B shares commenced operations on September 23, 2005 and have no performance prior to that date. Performance prior to September 23, 2005 is that of Class A shares at net asset value with no distribution and service (12b-1 fees) of 0.25%. If Class B shares’ distribution and service (12b-1) fees had been reflected, total returns would have been lower.
The tables do not reflect the deduction of taxes that a shareholder may pay on fund distributions or on the redemption of fund shares.
4
Understanding Your Expenses – Columbia Large Cap Index Fund
Estimating your actual expenses
To estimate the expenses that you paid over the period, first you will need your account balance at the end of the period:
| | n | | For shareholders who receive their account statements from Columbia Management Services, Inc., your account balance is available online at www.columbiafunds.com or by calling Shareholder Services at 800.345.6611. | |
| | n | | For shareholders who receive their account statements from their brokerage firm, contact your brokerage firm to obtain your account balance. | |
| | 1. | Divide your ending account balance by $1,000. For example, if an account balance was $8,600 at the end of the period, the result would be 8.6. | |
| | 2. | In the section of the table below titled “Expenses paid during the period,” locate the amount for your share class. You will find this number in the column labeled “Actual.” Multiply this number by the result from step 1. Your answer is an estimate of the expenses you paid on your account during the period. | |
If the value of your account falls below the minimum initial investment requirement applicable to you, your account generally will be subject to a $20 annual fee. This fee is not included in the accompanying table. If you are subject to the fee, keep it in mind when you are estimating the ongoing expenses of investing in the fund and when comparing the expenses of this fund with other funds.
As a fund shareholder, you incur two types of costs. There are transaction costs and ongoing costs, which generally include investment advisory fees, distribution and service (Rule 12b-1) fees and other fund expenses. The information on this page is intended to help you understand the ongoing costs of investing in the fund and to compare these costs with the ongoing costs of investing in other mutual funds.
Analyzing your fund’s expenses by share class
To illustrate these ongoing costs, we have provided an example and calculated the expenses paid by investors in each share class during the period. The information in the following table is based on an initial investment of $1,000, which is invested at the beginning of the reporting period and held for the entire period. Expense information is calculated two ways and each method provides you with different information. The amount listed in the “Actual” column is calculated using the fund’s actual operating expenses and total return for the period. The amount listed in the “Hypothetical” column for each share class assumes that the return each year is 5% before expenses and is calculated based on the fund’s actual operating expenses. You should not use the hypothetical account values and expenses to estimate either your actual account balance at the end of the period or the expenses you paid during this reporting period.
Compare with other funds
Since all mutual funds are required to include the same hypothetical calculations about expenses in shareholder reports, you can use this information to compare the ongoing cost of investing in the fund with other funds. To do so, compare the 5% hypothetical example with the 5% hypothetical examples that appear in the shareholder reports of other funds. As you compare hypothetical examples of other funds, it is important to note that hypothetical examples are meant to highlight the ongoing costs of investing in a fund and do not reflect any transaction costs, such as sales charges, redemption fees or exchange fees.
| | | | | | | | | | | | | | |
| 09/01/09 – 02/28/10 | | | | | | |
| | | | |
| | | Account value at the
beginning of the period ($) | | Account value at the
end of the period ($) | | Expenses paid
during the period ($) | | Fund’s annualized
expense ratio (%) |
| | | Actual | | Hypothetical | | Actual | | Hypothetical | | Actual | | Hypothetical | | Actual |
Class A | | 1,000.00 | | 1,000.00 | | 1,091.30 | | 1,022.86 | | 2.02 | | 1.96 | | 0.39 |
Class B | | 1,000.00 | | 1,000.00 | | 1,087.20 | | 1,019.14 | | 5.90 | | 5.71 | | 1.14 |
Class Z | | 1,000.00 | | 1,000.00 | | 1,092.40 | | 1,024.10 | | 0.73 | | 0.70 | | 0.14 |
Expenses paid during the period are equal to the annualized expense ratio for the share class, multiplied by the average account value over the period, then multiplied by the number of days in the fund’s most recent fiscal half-year and divided by 365.
Had the investment advisor not waived fees or reimbursed a portion of expenses, account value at the end of the period would have been reduced.
It is important to note that the expense amounts shown in the table are meant to highlight only ongoing costs of investing in the fund and do not reflect any transaction costs, such as sales charges, redemption fees or exchange fees. Therefore, the hypothetical examples provided may not help you determine the relative total costs of owning shares of different funds. If these transaction costs were included, your costs would have been higher.
5
Portfolio Manager’s Report – Columbia Large Cap Index Fund
Performance data quoted represents past performance and current performance may be lower or higher. Past performance is no guarantee of future results. The investment return and principal value will fluctuate so that shares, when redeemed, may be worth more or less than the original cost. Please visit www.columbiafunds.com for daily and most recent month-end performance updates.
| | |
| Net asset value per share |
| |
as of 02/28/10 ($) | | |
Class A | | 21.30 |
Class B | | 21.37 |
Class Z | | 21.37 |
| | |
| Distributions declared per share |
| |
03/01/09 – 02/28/10 ($) | | |
Class A | | 0.33 |
Class B | | 0.20 |
Class Z | | 0.38 |
| | |
| Top 5 sectors |
| |
as of 02/28/10 (%) | | |
Information Technology | | 18.4 |
Financials | | 15.6 |
Health Care | | 12.3 |
Consumer Staples | | 11.3 |
Energy | | 10.9 |
Sector Breakdown is calculated as a percentage of net assets.
For the 12-month period that ended February 28, 2010, the fund’s Class A shares returned 53.09% without sales charge. The fund’s benchmark, the S&P 500 Index, returned 53.62%. The average return for the Lipper S&P 500 Index Objective Funds Classification was 52.89%. The fund seeks to approximate the benchmark weights of securities, industries and sectors represented in the benchmark. As such, its return was in line with that of the benchmark, after fees and expenses, which the benchmark does not incur, and slightly ahead of the average return of funds in its peer group. In a period of sharply rising stock prices, some of the strongest returns came from sectors that had been beaten down as the economy weakened and investor fears about the financial system clouded the markets.
Financials, consumer discretionary and industrials led the market
As the economy revived and investor confidence strengthened, the strongest gains for the period came from the financials, consumer discretionary and industrials sectors. As investors gained confidence in the ability of the Federal Reserve Board to restore liquidity to the financial markets and quell a crisis that had been set off by a sinking subprime mortgage market, the financials sector rose more than 98% during the 12-month period covered by this report. In the financials sector, the Advisor’s parent company, Bank of America (1.6% of net assets), reported a triple-digit gain. JPMorgan Chase and Wells Fargo (1.6% and 1.4% of net assets, respectively) were other strong contributors to the fund’s return. Consumer discretionary stocks gained 77% for the period, led by solid contributions by Walt Disney, Ford Motor and Time Warner (0.6%, 0.4% and 0.3% of net assets, respectively). Within the industrials sector, General Electric, United Technologies and 3M (1.7%, 0.6% and 0.6% of net assets, respectively) were the fund’s top contributors.
Telecommunications, utilities and energy contributed modest returns
All ten sectors of the benchmark generated positive returns, but gains from telecommunications, utilities and energy were modest compared to returns from other sectors. Overall, the telecommunications sector returned 13%, utilities gained 20% and energy rose 30% for the period.
Looking ahead
While the economic conditions that elicited investor anxiety in 2009 have not been fully reversed, signs that the economy may be righting itself give reason for optimism about the stock market in 2010. Recent employment reports indicate that the number of jobs lost each month has slowed, and the unemployment rate has actually edged lower. We believe that shareholders should keep in mind that volatility is characteristic of the stock market. Yet, historically equities have also been the strongest performing asset class. Patience can help investors ride out the difficult periods and position them to reap potential rewards over the long term.
6
Portfolio Manager’s Report (continued) – Columbia Large Cap Index Fund
Portfolio characteristics and holdings are subject to change periodically and may not be representative of current characteristics and holdings. The outlook for the fund may differ from those presented for other Columbia Funds.
Equity securities are subject to stock market fluctuations that occur in response to economic and business developments.
| | |
| Top 10 holdings |
| |
as of 02/28/10 (%) | | |
Exxon Mobil | | 3.0 |
Microsoft | | 2.2 |
Procter & Gamble | | 1.8 |
Apple | | 1.8 |
Johnson & Johnson | | 1.7 |
General Electric | | 1.7 |
International Business Machines | | 1.6 |
Bank of America | | 1.6 |
JPMorgan Chase | | 1.6 |
AT&T | | 1.4 |
Information provided is calculated as a percentage of net assets.
7
Fund Profile – Columbia Large Cap Enhanced Core Fund
Performance data quoted represents past performance and current performance may be lower or higher. Past performance is no guarantee of future results. The investment return and principal value will fluctuate so that shares, when redeemed, may be worth more or less than the original cost. Please visit www.columbiafunds.com for daily and most recent month-end performance updates.
Summary
1-year return as of 02/28/10
| | |
| |
| | +50.49% Class A Shares |
| |
| | +53.62% S&P 500 Index |
|
Morningstar Style BoxTM |
|
Equity Style |
|
The Morningstar Style BoxTM reveals a fund’s investment strategy. For equity funds the vertical axis shows the market capitalization of the stocks owned, and the horizontal axis shows investment style (value, blend or growth). Information shown is based on the most recent data provided by Morningstar.
Summary
| n | | For the 12-month period that ended February 28, 2010, the fund’s Class A shares returned 50.49% without sales charge. |
| n | | In a period marked by strong gains for equities, the fund, its benchmark, the S& P 500 Index1, and the average fund in its peer group, the Lipper Large-Cap Core Funds Classification2, all returned more than 50%. |
| n | | The fund’s emphasis on higher-quality stocks and decisions to sell underperformers that subsequently generated strong gains generally accounted for the fund’s shortfall to the index. |
Portfolio Management
Brian M. Condon has managed the fund since February 2009 and has been associated with the advisor or its predecessors since 1999.
Subject to satisfying various conditions to closing, effective on or about May 1, 2010, RiverSource Investments, LLC, a subsidiary of Ameriprise Financial, Inc., is expected to become the investment advisor to the fund and change its name to Columbia Management Investment Advisers, LLC. Please see the fund’s prospectus dated July 1, 2009, including the supplements thereto, for more information regarding the expected change in investment advisor and any related changes to the portfolio management of the fund.
| 1 | The Standard & Poor’s (S&P) 500 Index tracks the performance of 500 widely held, large-capitalization U.S. stocks. Indices are not available for investment, are not professionally managed and do not reflect sales charges, fees, brokerage commissions, taxes or other expenses of investing. Securities in the fund may not match those in an index. |
| 2 | Lipper Inc., a widely respected data provider in the industry, calculates an average total return (assuming reinvestment of distributions) for mutual funds with investment objectives similar to those of the fund. Lipper makes no adjustment for the effect of sales loads. |
8
Performance Information – Columbia Large Cap Enhanced Core Fund
|
| Performance of a $10,000 investment 03/01/00 – 02/28/10 |
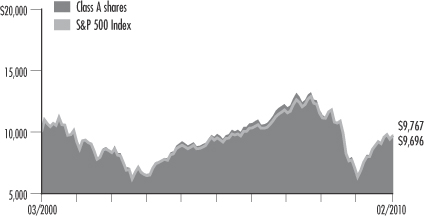
The chart above shows the change in value of a hypothetical $10,000 investment in Class A shares of Columbia Large Cap Enhanced Core Fund during the stated time period, and does not reflect the deduction of taxes that a shareholder may pay on fund distributions or on the redemption of fund shares.
| | |
| Performance of a $10,000 investment 03/01/00 – 02/28/10 ($) |
Class A | | 9,767 |
Class R | | 9,657 |
Class Y | | 10,030 |
Class Z | | 10,030 |
| | | | | | | | |
| Average annual total return as of 02/28/10 (%) |
| | | | |
| Share class | | A | | R | | Y | | Z |
| Inception | | 07/31/96 | | 01/23/06 | | 07/15/09 | | 07/31/96 |
1-year | | 50.49 | | 50.02 | | 50.86 | | 50.82 |
5-year | | –0.09 | | –0.32 | | 0.17 | | 0.16 |
10-year | | –0.24 | | –0.35 | | 0.03 | | 0.03 |
| | | | | | | | |
| Average annual total return as of 03/31/10 (%) |
| | | | |
| Share class | | A | | R | | Y | | Z |
1-year | | 47.37 | | 46.91 | | 47.85 | | 47.69 |
5-year | | 1.30 | | 1.07 | | 1.58 | | 1.56 |
10-year | | –0.67 | | –0.78 | | –0.40 | | –0.41 |
Performance data quoted represents past performance and current performance may be lower or higher. Past performance is no guarantee of future results. The investment return and principal value will fluctuate so that shares, when redeemed, may be worth more or less than the original cost. Please visit www.columbiafunds.com for daily and most recent month-end performance updates.
| | |
| Annual operating expense ratio (%)* |
| |
Class A | | 0.89 |
Class R | | 1.14 |
Class Y | | 0.55 |
Class Z | | 0.64 |
| * | The annual operating expense ratio is as stated in the fund’s prospectus that is current as of the date of this report. Differences in expense ratios disclosed elsewhere in this report may result from the inclusion of fee waivers and expense reimbursements as well as the use of different time periods used in calculating the ratios. |
Performance results reflect any fee waivers or reimbursements of fund expenses by the investment advisor and/or any of its affiliates. Absent these fee waivers or expense reimbursement arrangements, performance results would have been lower.
All results shown assume reinvestment of distributions. Class R shares, Class Y shares and Class Z shares, each sold at net asset value (NAV), have limited eligibility and the investment minimum requirements may vary. The returns for Class R shares include the returns for Class A shares prior to January 23, 2006, the date on which Class R shares were initially offered by the fund. If differences in expenses had been reflected, the returns would have been lower, since Class R shares are subject to a higher Rule 12b-1 fee. The returns for Class Y shares include the returns for Class Z shares prior to July 15, 2009, the date on which Class Y shares were initially offered by the fund. The returns shown have not been adjusted to reflect any differences in expenses between Class Y shares and Class Z shares. If differences in expenses had been reflected, the returns shown would have been lower. Only eligible investors may purchase Class R shares, Class Y shares and Class Z shares of the fund, directly or by exchange. Please see the fund’s prospectus for details.
The tables do not reflect the deduction of taxes that a shareholder may pay on fund distributions or on the redemption of fund shares.
9
Understanding Your Expenses – Columbia Large Cap Enhanced Core Fund
Estimating your actual expenses
To estimate the expenses that you paid over the period, first you will need your account balance at the end of the period:
| | n | | For shareholders who receive their account statements from Columbia Management Services, Inc., your account balance is available online at www.columbiafunds.com or by calling Shareholder Services at 800.345.6611. | |
| | n | | For shareholders who receive their account statements from their brokerage firm, contact your brokerage firm to obtain your account balance. | |
| | 1. | Divide your ending account balance by $1,000. For example, if an account balance was $8,600 at the end of the period, the result would be 8.6. | |
| | 2. | In the section of the table below titled “Expenses paid during the period,” locate the amount for your share class. You will find this number in the column labeled “Actual.” Multiply this number by the result from step 1. Your answer is an estimate of the expenses you paid on your account during the period. | |
If the value of your account falls below the minimum initial investment requirement applicable to you, your account generally will be subject to a $20 annual fee. This fee is not included in the accompanying table. If you are subject to the fee, keep it in mind when you are estimating the ongoing expenses of investing in the fund and when comparing the expenses of this fund with other funds.
As a fund shareholder, you incur two types of costs. There are transaction costs and ongoing costs, which generally include investment advisory fees, distribution and service (Rule 12b-1) fees and other fund expenses. The information on this page is intended to help you understand the ongoing costs of investing in the fund and to compare these costs with the ongoing costs of investing in other mutual funds.
Analyzing your fund’s expenses by share class
To illustrate these ongoing costs, we have provided an example and calculated the expenses paid by investors in each share class during the period. The information in the following table is based on an initial investment of $1,000, which is invested at the beginning of the reporting period and held for the entire period. Expense information is calculated two ways and each method provides you with different information. The amount listed in the “Actual” column is calculated using the fund’s actual operating expenses and total return for the period. The amount listed in the “Hypothetical” column for each share class assumes that the return each year is 5% before expenses and is calculated based on the fund’s actual operating expenses. You should not use the hypothetical account values and expenses to estimate either your actual account balance at the end of the period or the expenses you paid during this reporting period.
Compare with other funds
Since all mutual funds are required to include the same hypothetical calculations about expenses in shareholder reports, you can use this information to compare the ongoing costs of investing in the fund with other funds. To do so, compare the 5% hypothetical example with the 5% hypothetical examples that appear in the shareholder reports of other funds. As you compare hypothetical examples of other funds, it is important to note that hypothetical examples are meant to highlight the ongoing costs of investing in a fund and do not reflect any transaction costs, such as sales charges, redemption fees or exchange fees.
| | | | | | | | | | | | | | |
09/01/09 – 02/28/10 |
| | | | |
| | | Account value at the
beginning of the period ($) | | Account value at the
end of the period ($) | | Expenses paid
during the period ($) | | Fund’s annualized
expense ratio (%) |
| | | Actual | | Hypothetical | | Actual | | Hypothetical | | Actual | | Hypothetical | | Actual |
Class A | | 1,000.00 | | 1,000.00 | | 1,093.40 | | 1,019.98 | | 5.03 | | 4.86 | | 0.97 |
Class R | | 1,000.00 | | 1,000.00 | | 1,091.50 | | 1,018.74 | | 6.33 | | 6.11 | | 1.22 |
Class Z | | 1,000.00 | | 1,000.00 | | 1,094.60 | | 1,021.22 | | 3.74 | | 3.61 | | 0.72 |
Class Y | | 1,000.00 | | 1,000.00 | | 1,096.00 | | 1,021.97 | | 2.96 | | 2.86 | | 0.57 |
Expenses paid during the period are equal to the annualized expense ratio for the share class, multiplied by the average account value over the period, then multiplied by the number of days in the fund’s most recent fiscal half-year and divided by 365.
Had the investment advisor not waived fees or reimbursed a portion of expenses for Class A, Class R and Class Z shares, account value at the end of the period would have been reduced.
It is important to note that the expense amounts shown in the table are meant to highlight only ongoing costs of investing in the fund. Therefore, the hypothetical examples provided may not help you determine the relative total costs of owning shares of different funds. If these transaction costs were included, your costs would have been higher.
10
Portfolio Manager’s Report – Columbia Large Cap Enhanced Core Fund
Performance data quoted represents past performance and current performance may be lower or higher. Past performance is no guarantee of future results. The investment return and principal value will fluctuate so that shares, when redeemed, may be worth more or less than the original cost. Please visit www.columbiafunds.com for daily and most recent month-end performance updates.
| | |
| Net asset value per share |
| |
as of 02/28/10 ($) | | |
Class A | | 10.73 |
Class R | | 10.72 |
Class Y | | 10.70 |
Class Z | | 10.70 |
| | |
| Distributions declared per share |
| |
03/01/09 – 02/28/10 ($) | | |
Class A | | 0.16 |
Class R | | 0.14 |
Class Y | | 0.15 |
Class Z | | 0.18 |
For the 12-month period that ended February 28, 2010, the fund’s Class A shares returned 50.49% without sales charge. The fund’s benchmark, the S&P 500 Index, returned 53.62%. The average return of funds in its peer group, the Lipper Large-Cap Core Funds Classification, was 51.96%. Financials, technology and materials stocks produced the fund’s strongest returns for the period. An emphasis on higher-quality stocks, especially in the consumer discretionary sector, detracted from performance as lower-quality stocks were market leaders through most of the period. Decisions to sell certain underperformers that subsequently produced strong gains also contributed to the fund’s shortfall to the index.
Strong gains from financials, technology and materials stocks
All ten benchmark sectors enjoyed positive returns for the 12-month period covered by this report; however those sectors that were hurt the most in the economic downturn and financial crisis rebounded the strongest. Financials emerged as the top-performing sector as actions by the Federal Reserve helped provide liquidity and calm investor fears. In this environment, the fund’s positions in Wells Fargo, JPMorgan Chase and Genworth Financial (1.4%, 1.4% and 0.2% of net assets, respectively) made strong positive contributions to the fund’s performance.
Encouraged by signs of an increase in economic activity, investors favored sectors that stood to benefit from an economic rebound. Information technology was one such beneficiary. As a result, our decision to overweight Microsoft, Intel and Apple (2.8%, 1.6% and 1.9% of net assets, respectively) relative to the index was rewarded with substantial gains. Holdings in the materials sector also benefited relative performance as the economy gained ground, especially Dow Chemical and Eastman Chemical (0.1% and 0.8% of net assets, respectively), which delivered triple-digit returns for the period.
Focus on quality, early exits hampered returns
The fund’s stock selection methodology was not a good match for the market environment that prevailed as stocks began to rally in March 2009. We tend to avoid stocks that we classify as low quality, and many of those stocks turned out to be the best performers for the period. We believe that our investment process has served shareholders well over the long term and we remain committed to our investment discipline.
We also gave up some performance because we sold certain stocks that had underperformed, which subsequently turned around and delivered large gains. Johnson Controls, Gannett and CBS all scored triple-digit gains after we sold them at a loss. In the industrials sector, we sold both Fedex and Boeing prematurely and only captured a portion of the returns they generated during the period.
11
Portfolio Manager’s Report (continued) – Columbia Large Cap Enhanced Core Fund
| | |
| Top 5 sectors | | |
| |
as of 02/28/10 (%) | | |
Information Technology | | 18.9 |
Financials | | 14.3 |
Health Care | | 12.7 |
Consumer Staples | | 11.3 |
Energy | | 11.1 |
| | |
| Top 10 holdings | | |
| |
as of 02/28/10 (%) | | |
Microsoft | | 2.8 |
Exxon Mobil | | 2.7 |
International Business Machines | | 2.2 |
Procter & Gamble | | 2.1 |
Hewlett Packard | | 2.0 |
General Electric | | 1.9 |
Apple | | 1.9 |
Chevron | | 1.9 |
Johnson & Johnson | | 1.7 |
Intel | | 1.6 |
Information provided is calculated as a percentage of net assets.
Looking ahead
In the final months of the period, we observed that our valuation metrics, in particular, were once again driving returns. This shift came as no surprise because historically, investors have refocused on valuation in the aftermath of periods in which low-quality stocks have driven markets. With this in mind, we believe that the fund’s stock selection methodology will help the fund capitalize on this shift in focus, because it incorporates a strong valuation component in addition to its emphasis on quality and other fundamental factors.
Portfolio characteristics and holdings are subject to change periodically and may not be representative of current characteristics and holdings. The outlook for the fund may differ from those presented for other Columbia Funds.
Equity securities are subject to stock market fluctuations that occur in response to economic and business developments.
12
Fund Profile – Columbia Mid Cap Index Fund
Performance data quoted represents past performance and current performance may be lower or higher. Past performance is no guarantee of future results. The investment return and principal value will fluctuate so that shares, when redeemed, may be worth more or less than the original cost. Please visit www.columbiafunds.com for daily and most recent month-end performance updates.
Summary
1-year return as of 02/28/10
| | |
| |
| | +66.35% Class A Shares |
| |
| | +67.00% S&P MidCap 400 Index |
Morningstar Style BoxTM
Equity Style
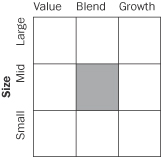
The Morningstar Style BoxTM reveals a fund’s investment strategy. For equity funds the vertical axis shows the market capitalization of the stocks owned, and the horizontal axis shows investment style (value, blend or growth). Information shown is based on the most recent data provided by Morningstar.
Summary
| n | | For the 12-month period that ended February 28, 2010, the fund’s Class A shares returned 66.35% without sales charge. |
| n | | The fund performed in line with its primary benchmark, the S&P MidCap 400 Index1, after accounting for fees and expenses. Its return was slightly higher than the return of the average fund in its peer group, the Lipper Mid-Cap Core Funds Classification.2 |
| n | | The portfolio is constructed to closely approximate the benchmark. |
Portfolio Management
Cheryl D’Hollander has co-managed the fund since February 2009 and has been associated with the advisor or its predecessors since 2003
Alfred F. Alley III has co-managed the fund since July 2009 and has been associated with the advisor or its predecessors since 2005.
Subject to satisfying various conditions to closing, effective on or about May 1, 2010, RiverSource Investments, LLC, a subsidiary of Ameriprise Financial, Inc., is expected to become the investment advisor to the fund and change its name to Columbia Management Investment Advisers, LLC. Please see the fund’s prospectus dated July 1, 2009, including the supplements thereto, for more information regarding the expected change in investment advisor and any related changes to the portfolio management of the fund.
| 1 | The Standard & Poor’s (S&P) MidCap 400 Index is a market value-weighted index that tracks the performance of 400 mid-cap U.S. companies. Indices are not available for investment, are not professionally managed and do not reflect sales charges, fees, brokerage commissions, taxes or other expenses of investing. Securities in the fund may not match those in an index. |
| 2 | Lipper Inc., a widely respected data provider in the industry, calculates an average total return (assuming reinvestment of distributions) for mutual funds with investment objectives similar to those of the fund. Lipper makes no adjustment for the effect of sales loads. |
13
Performance Information – Columbia Mid Cap Index Fund
Performance data quoted represents past performance and current performance may be lower or higher. Past performance is no guarantee of future results. The investment return and principal value will fluctuate so that shares, when redeemed, may be worth more or less than the original cost. Please visit www.columbiafunds.com for daily and most recent month-end performance updates.
| | |
| Annual operating expense ratio (%)* |
| |
Class A | | 0.50 |
Class Z | | 0.25 |
| * | The annual operating expense ratio is as stated in the fund’s prospectus that is current as of the date of this report and includes the expenses incurred by the investment companies in which the fund invests. Differences in expense ratios disclosed elsewhere in this report may result from expenses incurred by the investment companies, inclusion of fee waivers and expense reimbursements as well as the use of different time periods used in calculating the ratios. |
| | | | |
| Performance of a $10,000 investment 06/01/00 – 02/28/10 |
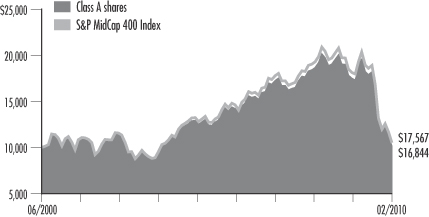
The chart above shows the change in value of a hypothetical $10,000 investment in Class A shares of Columbia Mid Cap Index Fund during the stated time period, and does not reflect the deduction of taxes that a shareholder may pay on fund distributions or on the redemption of fund shares.
| | |
| Performance of a $10,000 investment since inception – 02/28/10 ($) |
Class A | | 16,844 |
Class Z | | 16,433 |
| | | | |
| Average annual total return as of 02/28/10 (%) |
| | |
| Share class | | A | | Z |
| Inception | | 05/31/00 | | 03/31/00 |
1-year | | 66.35 | | 66.71 |
5-year | | 3.20 | | 3.47 |
Since inception | | 5.49 | | 5.14 |
| | | | |
| Average annual total return as of 03/31/10 (%) |
| | |
| Share class | | A | | Z |
1-year | | 63.33 | | 63.68 |
5-year | | 4.87 | | 5.13 |
Since inception | | 6.18 | | 5.82 |
Performance results reflect any fee waivers or reimbursements of fund expenses by the investment advisor and/or any of its affiliates. Absent these fee waivers or expense reimbursement arrangements, performance results would have been lower.
All results shown assume reinvestment of distributions. Class A shares are sold at net asset value. Class Z shares are sold at net asset value with no distribution and service (Rule 12b-1) fees. Class Z shares have limited eligibility and the investment minimum requirements may vary. Please see the fund’s prospectus for details. Performance for different share classes will vary based on differences in sales charges and fees associated with each class.
The tables do not reflect the deduction of taxes that a shareholder may pay on fund distributions or on the redemption of fund shares.
14
Understanding Your Expenses – Columbia Mid Cap Index Fund
As a fund shareholder, you incur two types of costs. There are transaction costs and ongoing costs, which generally include investment advisory fees, distribution and service (Rule 12b-1) fees and other fund expenses. The information on this page is intended to help you understand the ongoing costs of investing in the fund and to compare these costs with the ongoing costs of investing in other mutual funds.
Analyzing your fund’s expenses by share class
To illustrate these ongoing costs, we have provided an example and calculated the expenses paid by investors in each share class during the period. The information in the following table is based on an initial investment of $1,000 which is invested at the beginning of the reporting period and held for the entire period. Expense information is calculated two ways and each method provides you with different information. The amount listed in the “Actual” column is calculated using the fund’s actual operating expenses and total return for the period. The amount listed in the “Hypothetical” column for each share class assumes that the return each year is 5% before expenses and is calculated based on the fund’s actual operating expenses. You should not use the hypothetical account values and expenses to estimate either your actual account balance at the end of the period or the expenses you paid during this reporting period.
Compare with other funds
Since all mutual funds are required to include the same hypothetical calculations about expenses in shareholder reports, you can use this information to compare the ongoing costs of investing in the fund with other funds. To do so, compare the 5% hypothetical example with the 5% hypothetical examples that appear in the shareholder reports of other funds. As you compare hypothetical examples of other funds, it is important to note that hypothetical examples are meant to highlight the ongoing costs of investing in a fund and do not reflect any transaction costs, such as sales charges, redemption fees or exchange fees.
Estimating your actual expenses
To estimate the expenses that you paid over the period, first you will need your account balance at the end of the period:
| | n | | For shareholders who receive their account statements from Columbia Management Services, Inc., your account balance is available online at www.columbiafunds.com or by calling Shareholder Services at 800.345.6611. | |
| | n | | For shareholders who receive their account statements from their brokerage firm, contact your brokerage firm to obtain your account balance. | |
| | 1. | Divide your ending account balance by $1,000. For example, if an account balance was $8,600 at the end of the period, the result would be 8.6. | |
| | 2. | In the section of the table below titled “Expenses paid during the period,” locate the amount for your share class. You will find this number in the column labeled “Actual.” Multiply this number by the result from step 1. Your answer is an estimate of the expenses you paid on your account during the period. | |
If the value of your account falls below the minimum initial investment requirement applicable to you, your account generally will be subject to a $20 annual fee. This fee is not included in the accompanying table. If you are subject to the fee, keep it in mind when you are estimating the ongoing expenses of investing in the fund and when comparing the expenses of this fund with other funds.
| | | | | | | | | | | | | | |
| 09/01/09 – 02/28/10 |
| | | | |
| | | Account value at the
beginning of the period ($) | | Account value at the end
of the period ($) | | Expenses paid during
the period ($) | | Fund’s annualized
expense ratio (%) |
| | | Actual | | Hypothetical | | Actual | | Hypothetical | | Actual | | Hypothetical | | Actual |
Class A | | 1,000.00 | | 1,000.00 | | 1,134.70 | | 1,022.56 | | 2.38 | | 2.26 | | 0.45 |
Class Z | | 1,000.00 | | 1,000.00 | | 1,135.90 | | 1,023.80 | | 1.06 | | 1.00 | | 0.20 |
Expenses paid during the period are equal to the annualized expense ratio for the share class, multiplied by the average account value over the period, then multiplied by the number of days in the fund’s most recent fiscal half-year and divided by 365.
Had the investment advisor not waived fees or reimbursed a portion of expenses, account value at the end of the period would have been reduced.
It is important to note that the expense amounts shown in the table are meant to highlight only ongoing costs of investing in the fund. Therefore, the hypothetical examples provided may not help you determine the relative total costs of owning shares of different funds. If these transaction costs were included, your costs would have been higher.
15
Portfolio Manager’s Report – Columbia Mid Cap Index Fund
Performance data quoted represents past performance and current performance may be lower or higher. Past performance is no guarantee of future results. The investment return and principal value will fluctuate so that shares, when redeemed, may be worth more or less than the original cost. Please visit www.columbiafunds.com for daily and most recent month-end performance updates.
| | |
| Net asset value per share | | |
| |
as of 02/28/10 ($) | | |
Class A | | 9.44 |
Class Z | | 9.41 |
| | |
| Distribution declared per share |
| |
03/01/09 – 02/28/10 ($) | | |
Class A | | 0.09 |
Class Z | | 0.10 |
| | |
| Top 5 sectors |
| |
as of 02/28/10 (%) | | |
Financials | | 19.2 |
Information Technology | | 14.6 |
Consumer Discretionary | | 14.1 |
Industrials | | 14.0 |
Health Care | | 12.2 |
Sector Breakdown is calculated as a percentage of net assets.
For the 12-month period that ended February 28, 2010, the fund’s Class A shares returned 66.35% without sales charge. The fund’s benchmark, the S&P MidCap 400 Index, returned 67.00%. The average return of funds in its peer group, the Lipper Mid-Cap Core Funds Classification, was 65.01%. The fund seeks to approximate the benchmark weights of securities, industries and sectors represented in the S&P MidCap 400 Index. As such, its return was in line with the return of the index, after fees and expenses, which the index does not incur. Its return was slightly higher than the return of the average fund in its peer group. In a period of sharply rising stock prices, most sectors of the market rebounded strongly after being beaten down in a weak economy.
Materials, energy and technology led mid-cap market advance
As the economy revived and investor confidence strengthened, the strongest gains for the period came from the materials, energy and technology sectors. In materials, signs that the nation’s manufacturing sector was on the mend drove the sector up more than 95%. Lubrizol, a specialty chemicals manufacturer, Ashland, which distributes and manufactures specialty chemicals and plastics (0.6% and 0.4% of net assets, respectively), and Cliffs Natural Resources, iron ore producer, were the top three contributors to the fund’s return from materials stocks. Cliffs was sold before the end of the period. As energy prices moved higher, oil and gas exploration and production companies Newfield Exploration and Cimarex Energy (0.7% and 0.5% of net assets, respectively), along with FMC Technologies, which makes technology systems for the energy sector, led energy returns for the fund. By period end, FMC was no longer in the portfolio because its higher share price pushed its market capitalization into large-cap territory. In technology, Cree, F5 Networks (0.8% and 0.5% of nets assets, respectively) and Western Digital made the most significant contribution to the fund’s returns. Western Digital, which makes external storage drives, was no longer in the portfolio at the end of the period because it exceeded the market capitalization limits for mid-cap stocks.
Telecommunications and utilities stocks lagged the index average
Although all ten industry sectors made solid contributions to the fund’s returns, telecommunications, which accounts for less than one percent of the index, gained only 14% for the period. Utilities stocks, which, because of their defensive characteristics had held up somewhat better than other sectors in the market decline, gained 38%.
Looking ahead
While the economic conditions that elicited investor anxiety in 2009 have not been fully reversed, signs that the economy may be righting itself give reason for optimism about the stock market in 2010. Recent employment reports indicate that the number of jobs lost each month has slowed, and the unemployment rate has actually edged lower. We believe that shareholders should keep in mind that volatility is characteristic of the
16
Portfolio Manager’s Report (continued) – Columbia Mid Cap Index Fund
| | |
| Top 10 holdings |
| |
as of 02/28/10 (%) | | |
Vertex Pharmaceuticals | | 0.8 |
Cree | | 0.7 |
Newfield Exploration | | 0.7 |
New York Community Bancorp | | 0.7 |
Cerner | | 0.6 |
Lubrizol | | 0.6 |
Joy Global | | 0.6 |
Edwards Lifesciences | | 0.6 |
Everest Reinsurance Group | | 0.6 |
Henry Schein | | 0.6 |
Information provided is calculated as a percentage of net assets.
stock market. Yet, historically equities have also been the strongest performing asset class. Patience can help investors ride out the difficult periods and position them to reap potential rewards over the long term.
Portfolio characteristics and holdings are subject to change periodically and may not be representative of current characteristics and holdings. The outlook for the fund may differ from those presented for other Columbia Funds.
Equity securities are subject to stock market fluctuations that occur in response to economic and business developments.
Stocks of mid-cap companies pose special risks, including possible illiquidity and greater price volatility than stocks of larger, more established companies.
17
Fund Profile – Columbia Small Cap Index Fund
Performance data quoted represents past performance and current performance may be lower or higher. Past performance is no guarantee of future results. The investment return and principal value will fluctuate so that shares, when redeemed, may be worth more or less than the original cost. Please visit www.columbiafunds.com for daily and most recent month-end performance updates.
Summary
1-year return as of 02/28/10
| | |
| |
| | +63.90% Class A Shares |
| |
| | +64.66% S&P SmallCap 600 Index |
Morningstar Style BoxTM
Equity Style
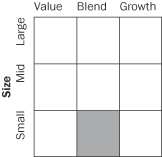
The Morningstar Style BoxTM reveals a fund’s investment strategy. For equity funds the vertical axis shows the market capitalization of the stocks owned, and the horizontal axis shows investment style (value, blend or growth). Information shown is based on the most recent data provided by Morningstar.
Summary
| n | | For the 12-month period that ended February 28, 2010, the fund’s Class A shares returned 63.90% without sales charge. |
| n | | The fund generally tracked its primary benchmark, S&P SmallCap 600 Index.1 Its return was slightly lower than the return of the average fund in its peer group, the Lipper Small-Cap Core Funds Classification.2 |
| n | | The portfolio is constructed to closely approximate the benchmark. |
Portfolio Management
Cheryl D’Hollander has co-managed the fund since February 2009 and has been associated with the advisor or its predecessors since 2003.
Alfred F. Alley III has co-managed the fund since July 2009 and has been associated with the advisor or its predecessors since 2005.
Subject to satisfying various conditions to closing, effective on or about May 1, 2010, RiverSource Investments, LLC, a subsidiary of Ameriprise Financial, Inc., is expected to become the investment advisor to the fund and change its name to Columbia Management Investment Advisers, LLC. Please see the fund’s prospectus dated July 1, 2009, including the supplements thereto, for more information regarding the expected change in investment advisor and any related changes to the portfolio management of the fund.
| 1 | The Standard & Poor’s (S&P) SmallCap 600 Index tracks the performance of 600 domestic companies traded on the New York Stock Exchange, the American Stock Exchange and NASDAQ. The S&P Small Cap 600 is heavily weighted with the stocks of companies with small market capitalizations. Indices are not available for investment, are not professionally managed and do not reflect sales charges, fees, brokerage commissions, taxes or other expenses of investing. Securities in the fund may not match those in an index. |
| 2 | Lipper Inc., a widely respected data provider in the industry, calculates an average total return (assuming reinvestment of distributions) for mutual funds with investment objectives similar to those of the fund. Lipper makes no adjustment for the effect of sales loads. |
18
Performance Information – Columbia Small Cap Index Fund
Performance data quoted represents past performance and current performance may be lower or higher. Past performance is no guarantee of future results. The investment return and principal value will fluctuate so that shares, when redeemed, may be worth more or less than the original cost. Please visit www.columbiafunds.com for daily and most recent month-end performance updates.
| | |
| Annual operating expense ratio (%)* |
| |
Class A | | 0.45 |
Class Z | | 0.20 |
| * | The annual operating expense ratio is as stated in the fund’s prospectus that is current as of the date of this report and includes the expenses incurred by the investment companies in which the fund invests. Differences in expense ratios disclosed elsewhere in this report may result from expenses incurred by the investment companies, inclusion of fee waivers and expense reimbursements as well as the use of different time periods used in calculating the ratios. |
| | |
| Performance of a $10,000 investment 03/01/00 – 02/28/10 |
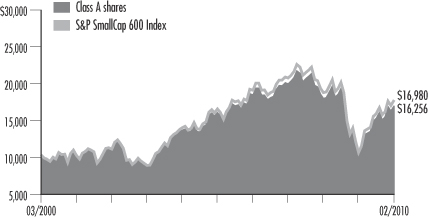
The chart above shows the change in value of a hypothetical $10,000 investment in Class A shares of Columbia Small Cap Index Fund during the stated time period, and does not reflect the deduction of taxes that a shareholder may pay on fund distributions or on the redemption of fund shares.
| | |
| Performance of a $10,000 investment 03/01/00 – 02/28/10 ($) |
Class A | | 16,256 |
Class Z | | 16,701 |
| | | | |
| Average annual total return as of 02/28/10 (%) |
| Share class | | A | | Z |
| Inception | | 10/15/96 | | 10/15/96 |
1-year | | 63.90 | | 64.34 |
5-year | | 1.09 | | 1.36 |
10-year | | 4.98 | | 5.26 |
| | | | |
| Average annual total return as of 03/31/10 (%) |
| Share class | | A | | Z |
1-year | | 63.36 | | 63.80 |
5-year | | 3.16 | | 3.43 |
10-year | | 6.11 | | 6.39 |
Performance results reflect any fee waivers or reimbursements of fund expenses by the investment advisor and/or any of its affiliates. Absent these fee waivers or expense reimbursement arrangements, performance results would have been lower.
All results shown assume reinvestment of distributions. Class A shares are sold at net asset value. Class Z shares are sold at net asset value with no distribution and service (Rule 12b-1) fees. Class Z shares have limited eligibility and the investment minimum requirements may vary. Please see the fund’s prospectus for details. Performance for different share classes will vary based on differences in sales charges and fees associated with each class.
The tables do not reflect the deduction of taxes that a shareholder may pay on fund distributions or on the redemption of fund shares.
19
Understanding Your Expenses – Columbia Small Cap Index Fund
Estimating your actual expenses
To estimate the expenses that you paid over the period, first you will need your account balance at the end of the period:
| | n | | For shareholders who receive their account statements from Columbia Management Services, Inc., your account balance is available online at www.columbiafunds.com or by calling Shareholder Services at 800.345.6611. | |
| | n | | For shareholders who receive their account statements from their brokerage firm, contact your brokerage firm to obtain your account balance. | |
| | 1. | Divide your ending account balance by $1,000. For example, if an account balance was $8,600 at the end of the period, the result would be 8.6. | |
| | 2. | In the section of the table below titled “Expenses paid during the period,” locate the amount for your share class, You will find this number in the column labeled “Actual”. Multiply this number by the result from step 1. Your answer is an estimate of the expenses you paid on your account during the period. | |
If the value of your account falls below the minimum initial investment requirement applicable to you, your account generally will be subject to a $20 annual fee. This fee is not included in the accompanying table. If you are subject to the fee, keep it in mind when you are estimating the ongoing expenses of investing in the fund and when comparing the expenses of this fund with other funds.
As a fund shareholder, you incur two types of costs. There are transaction costs and ongoing costs, which generally include investment advisory fees, distribution and service (Rule 12b-1) fees and other fund expenses. The information on this page is intended to help you understand the ongoing costs of investing in the fund and to compare these costs with the ongoing costs of investing in other mutual funds.
Analyzing your fund’s expenses by share class
To illustrate these ongoing costs, we have provided an example and calculated the expenses paid by investors in each share class during the period. The information in the following table is based on an initial investment of $1,000, which is invested at the beginning of the reporting period and held for the entire period. Expense information is calculated two ways and each method provides you with different information. The amount listed in the “Actual” column is calculated using the fund’s actual operating expenses and total return for the period. The amount listed in the “Hypothetical” column for each share class assumes that the return each year is 5% before expenses and is calculated based on the fund’s actual operating expenses. You should not use the hypothetical account values and expenses to estimate either your actual account balance at the end of the period or the expenses you paid during this reporting period.
Compare with other funds
Since all mutual funds are required to include the same hypothetical calculations about expenses in shareholder reports, you can use this information to compare the ongoing cost of investing in the fund with other funds. To do so, compare the 5% hypothetical example with the 5% hypothetical examples that appear in the shareholder reports of other funds. As you compare hypothetical examples of other funds, it is important to note that hypothetical examples are meant to highlight the ongoing costs of investing in a fund and do not reflect any transaction costs, such as sales charges, redemption fees or exchange fees.
| | | | | | | | | | | | | | |
| 09/01/09 – 02/28/10 |
| | | | |
| | | Account value at the
beginning of the period ($) | | Account value at the
end of the period ($) | | Expenses paid
during the period ($) | | Fund’s annualized
expense ratio (%) |
| | | Actual | | Hypothetical | | Actual | | Hypothetical | | Actual | | Hypothetical | | Actual |
Class A | | 1,000.00 | | 1,000.00 | | 1,110.70 | | 1,022.56 | | 2.36 | | 2.26 | | 0.45 |
Class Z | | 1,000.00 | | 1,000.00 | | 1,112.40 | | 1,023.80 | | 1.05 | | 1.00 | | 0.20 |
Expenses paid during the period are equal to the annualized expense ratio for the share class, multiplied by the average account value over the period, then multiplied by the number of days in the fund’s most recent fiscal half-year and divided by 365.
Had the investment advisor not waived fees or reimbursed a portion of expenses, account value at the end of the period would have been reduced.
It is important to note that the expense amounts shown in the table are meant to highlight only ongoing costs of investing in the fund. Therefore, the hypothetical examples provided may not help you determine the relative total costs of owning shares of different funds. If these transaction costs were included, your costs would have been higher.
20
Portfolio Manager’s Report – Columbia Small Cap Index Fund
Performance data quoted represents past performance and current performance may be lower or higher. Past performance is no guarantee of future results. The investment return and principal value will fluctuate so that shares, when redeemed, may be worth more or less than the original cost. Please visit www.columbiafunds.com for daily and most recent month-end performance updates.
| | |
| Net asset value per share |
| |
as of 02/28/10 ($) | | |
Class A | | 13.97 |
Class Z | | 14.01 |
| | |
| Distribution declared per share |
| |
03/01/09 – 02/28/10 ($) | | |
Class A | | 0.09 |
Class Z | | 0.11 |
| | |
| Top 5 sectors |
| |
as of 02/28/10 (%) | | |
Financials | | 18.3 |
Information Technology | | 17.7 |
Industrials | | 16.4 |
Consumer Discretionary | | 15.8 |
Health Care | | 13.3 |
Sector Breakdown is calculated as a percentage of net assets.
For the 12-month period that ended February 28, 2010, the fund’s Class A shares returned 63.90% without sales charge. The fund’s benchmark, the S&P SmallCap 600 Index returned 64.66%. The average return of the funds in its peer group, the Lipper Small-Cap Core Funds Classification, was 65.01%. The fund seeks to approximate the benchmark weights of securities, industries and sectors represented in the S&P SmallCap 600 Index. As such, its return was in line with the return of the index, after fees and expenses, which the index does not incur. In a period of sharply rising stock prices, most sectors of the market rebounded strongly after being beaten down in a weak economy.
Energy, consumer discretionary and materials stocks led small-cap market advance
As the economy revived and investor confidence strengthened, the strongest gains for the period came from the small-cap energy, consumer discretionary and materials sectors. In the energy sector, which rose 110% for the 12-month period, rebounding oil prices had a significant positive impact on small companies. Oil States International, an oil service company; Dril-Quip, which makes offshore drilling equipment (0.5% and 0.4% of net assets, respectively), and Atwood Oceanics, an offshore driller, made the highest contributions to the fund’s return for the period. Atwood Oceanics was no longer in the fund at the end of the period because it had exceeded the market-cap limits for the index and migrated into mid-cap range. Consumer discretionary stocks rose more than 98% for the period. Polaris Industries, which makes recreational vehicles; Deckers Outdoor, a footwear maker, and Tractor Supply, a retail farm and ranch chain (0.4%, 0.4% and 0.5% of net assets, respectively) were the top contributors for the sector to the fund’s return. In the materials sector, which gained 94% for the period, NewMarket, Texas Industries and OM Group (0.3%, 0.2% and 0.3% of net assets, respectively) led returns for the fund. NewMarket’s main business is the manufacture of petroleum additives. Texas Industries is a supplier of cement, aggregate and building materials. OM Group develops, produces and markets specialty chemicals.
Telecommunications and utilities lagged
As investors focused on companies with growth potential in a rebounding economy, utilities and telecommunications stocks were left behind. Utilities delivered a solid 22% return, but fell far short of the overall index return. Telecommunications was the only small-cap sector to lose ground as stocks rallied throughout the period. Telecommunications, which accounts for just 0.6% of the index, lost 25% for the period.
Looking ahead
While the economic conditions that elicited investor anxiety in 2009 have not been fully reversed, signs that the economy may be righting itself give reason for optimism about the stock market in 2010. Recent employment reports indicate that the number of jobs lost each month has slowed, and the unemployment rate has actually edged lower. We believe that shareholders should keep in mind that volatility is characteristic of the
21
Portfolio Manager’s Report (continued) – Columbia Small Cap Index Fund
| | |
| Top 10 holdings |
| |
as of 2/28/10 (%) | | |
iShares S&P SmallCap 600 Index | | 0.9 |
Skyworks Solutions | | 0.6 |
Mednax | | 0.6 |
Gardner Denver | | 0.5 |
Varian Semiconductor Equipment Associates | | 0.5 |
Oil States International | | 0.5 |
St. Mary Land & Exploration | | 0.5 |
Tractor Supply | | 0.5 |
Piedmont Natural Gas | | 0.5 |
Watsco, Inc. | | 0.5 |
Holdings are calculated as a percentage of net assets.
stock market. Yet, historically equities have also been the strongest performing asset class. Patience can help investors ride out the difficult periods and position them to reap potential rewards over the long term.
Portfolio characteristics and holdings are subject to change periodically and may not be representative of current characteristics and holdings. The outlook for the fund may differ from those presented for other Columbia Funds.
Equity securities are subject to stock market fluctuations that occur in response to economic and business developments.
Stocks of small-cap companies pose special risks, including possible illiquidity and greater price volatility than stocks of larger, more established companies.
22
Investment Portfolio – Columbia Large Cap Index Fund
February 28, 2010
Common Stocks – 97.7%
| | | | |
| | | Shares | | Value ($) |
| Consumer Discretionary – 9.7% | | | | |
| Auto Components – 0.2% | | | | |
Goodyear Tire & Rubber Co. (a) | | 63,835 | | 829,217 |
Johnson Controls, Inc. | | 176,840 | | 5,499,724 |
| | | | |
Auto Components Total | | | | 6,328,941 |
| | |
| Automobiles – 0.4% | | | | |
Ford Motor Co. (a) | | 871,301 | | 10,229,074 |
Harley-Davidson, Inc. | | 61,812 | | 1,521,193 |
| | | | |
Automobiles Total | | | | 11,750,267 |
| | |
| Distributors – 0.1% | | | | |
Genuine Parts Co. | | 42,052 | | 1,697,219 |
| | | | |
Distributors Total | | | | 1,697,219 |
| |
| Diversified Consumer Services – 0.2% | | |
Apollo Group, Inc., Class A (a) | | 33,862 | | 2,027,656 |
DeVry, Inc. | | 16,239 | | 1,025,493 |
H&R Block, Inc. | | 88,345 | | 1,526,602 |
| | | | |
Diversified Consumer Services Total | | 4,579,751 |
| |
| Hotels, Restaurants & Leisure – 1.5% | | |
Carnival Corp. | | 115,109 | | 4,139,320 |
Darden Restaurants, Inc. | | 36,829 | | 1,493,416 |
International Game Technology | | 78,214 | | 1,372,656 |
Marriott International, Inc., Class A | | 66,844 | | 1,812,141 |
McDonald’s Corp. | | 284,279 | | 18,151,214 |
Starbucks Corp. (a) | | 195,686 | | 4,483,166 |
Starwood Hotels & Resorts Worldwide, Inc. | | 49,285 | | 1,907,329 |
Wyndham Worldwide Corp. | | 47,062 | | 1,081,955 |
Wynn Resorts Ltd. (a) | | 18,148 | | 1,153,668 |
Yum! Brands, Inc. | | 123,212 | | 4,154,709 |
| | | | |
Hotels, Restaurants & Leisure Total | | 39,749,574 |
| | |
| Household Durables – 0.4% | | | | |
Black & Decker Corp. | | 15,876 | | 1,150,534 |
D.R. Horton, Inc. | | 72,821 | | 900,067 |
Fortune Brands, Inc. | | 39,564 | | 1,734,090 |
Harman International Industries, Inc. (a) | | 18,254 | | 787,478 |
Leggett & Platt, Inc. | | 40,087 | | 759,649 |
Lennar Corp., Class A | | 42,533 | | 697,966 |
Newell Rubbermaid, Inc. | | 73,187 | | 1,006,321 |
Pulte Homes, Inc. (a) | | 83,205 | | 901,110 |
Whirlpool Corp. | | 19,567 | | 1,646,759 |
| | | | |
Household Durables Total | | | | 9,583,974 |
| | |
| Internet & Catalog Retail – 0.5% | | | | |
Amazon.com, Inc. (a) | | 87,832 | | 10,399,309 |
Expedia, Inc. (a) | | 55,561 | | 1,235,676 |
| | | | |
| | | Shares | | Value ($) |
Priceline.com, Inc. (a) | | 11,600 | | 2,630,416 |
| | | | |
Internet & Catalog Retail Total | | | | 14,265,401 |
|
| Leisure Equipment & Products – 0.1% |
Eastman Kodak Co. (a) | | 70,659 | | 419,715 |
Hasbro, Inc. | | 32,794 | | 1,173,369 |
Mattel, Inc. | | 95,213 | | 2,093,734 |
| | | | |
Leisure Equipment & Products Total | | 3,686,818 |
| | |
| Media – 2.9% | | | | |
CBS Corp., Class B | | 178,427 | | 2,317,767 |
Comcast Corp., Class A | | 752,043 | | 12,363,587 |
DIRECTV, Class A (a) | | 252,091 | | 8,533,280 |
Discovery Communications, Inc., Class A (a) | | 74,600 | | 2,323,790 |
Gannett Co., Inc. | | 62,212 | | 942,512 |
Interpublic Group of Companies, Inc. (a) | | 128,069 | | 960,517 |
McGraw-Hill Companies, Inc. | | 82,918 | | 2,835,796 |
Meredith Corp. | | 9,707 | | 298,199 |
New York Times Co., Class A (a) | | 30,454 | | 333,167 |
News Corp., Class A | | 593,565 | | 7,935,964 |
Omnicom Group, Inc. | | 82,013 | | 3,003,316 |
Scripps Networks Interactive Inc., Class A | | 23,586 | | 933,534 |
Time Warner Cable, Inc. | | 92,879 | | 4,336,520 |
Time Warner, Inc. | | 307,642 | | 8,933,924 |
Viacom, Inc., Class B (a) | | 159,953 | | 4,742,606 |
Walt Disney Co. | | 506,721 | | 15,829,964 |
Washington Post Co., Class B | | 1,589 | | 667,873 |
| | | | |
Media Total | | | | 77,292,316 |
| | |
| Multiline Retail – 0.9% | | | | |
Big Lots, Inc. (a) | | 21,731 | | 727,989 |
Family Dollar Stores, Inc. | | 36,599 | | 1,207,401 |
J.C. Penney Co., Inc. | | 62,149 | | 1,714,069 |
Kohl’s Corp. (a) | | 80,763 | | 4,346,665 |
Macy’s, Inc. | | 110,962 | | 2,124,922 |
Nordstrom, Inc. | | 43,516 | | 1,607,481 |
Sears Holdings Corp. (a) | | 12,755 | | 1,220,271 |
Target Corp. | | 198,239 | | 10,213,273 |
| | | | |
Multiline Retail Total | | | | 23,162,071 |
| | |
| Specialty Retail – 2.0% | | | | |
Abercrombie & Fitch Co., Class A | | 23,144 | | 842,904 |
AutoNation, Inc. (a) | | 24,331 | | 431,875 |
Autozone, Inc. (a) | | 7,932 | | 1,316,157 |
Bed Bath & Beyond, Inc. (a) | | 69,249 | | 2,881,451 |
Best Buy Co., Inc. | | 89,961 | | 3,283,576 |
GameStop Corp., Class A (a) | | 43,433 | | 747,048 |
Gap, Inc. | | 125,394 | | 2,695,971 |
Home Depot, Inc. | | 448,015 | | 13,978,068 |
See Accompanying Notes to Financial Statements.
23
Columbia Large Cap Index Fund
February 28, 2010
Common Stocks (continued)
| | | | |
| | | Shares | | Value ($) |
| Consumer Discretionary (continued) |
| Specialty Retail (continued) | | | | |
Limited Brands, Inc. | | 70,435 | | 1,557,318 |
Lowe’s Companies, Inc. | | 387,841 | | 9,195,710 |
O’Reilly Automotive, Inc. (a) | | 36,166 | | 1,421,324 |
Office Depot, Inc. (a) | | 72,370 | | 522,511 |
RadioShack Corp. | | 32,961 | | 644,717 |
Ross Stores, Inc. | | 33,000 | | 1,614,030 |
Sherwin-Williams Co. | | 25,037 | | 1,586,845 |
Staples, Inc. | | 190,697 | | 4,912,355 |
Tiffany & Co. | | 32,800 | | 1,455,992 |
TJX Companies, Inc. | | 110,622 | | 4,605,194 |
Urban Outfitters, Inc. (a) | | 34,100 | | 1,098,361 |
| | | | |
Specialty Retail Total | | | | 54,791,407 |
|
| Textiles, Apparel & Luxury Goods – 0.5% |
Coach, Inc. | | 83,981 | | 3,060,268 |
NIKE, Inc., Class B | | 102,675 | | 6,940,830 |
Polo Ralph Lauren Corp. | | 15,088 | | 1,205,984 |
V.F. Corp. | | 23,395 | | 1,810,305 |
| | | | |
Textiles, Apparel & Luxury Goods Total | | 13,017,387 |
| | | | |
Consumer Discretionary Total | | | | 259,905,126 |
| | | | |
| Consumer Staples – 11.3% | | | | |
| Beverages – 2.5% | | | | |
Brown-Forman Corp., Class B | | 28,958 | | 1,516,241 |
Coca-Cola Co. | | 610,414 | | 32,181,026 |
Coca-Cola Enterprises, Inc. | | 83,764 | | 2,140,170 |
Constellation Brands, Inc., Class A (a) | | 52,567 | | 790,608 |
Dr Pepper Snapple Group, Inc. | | 66,914 | | 2,124,519 |
Molson Coors Brewing Co., Class B | | 41,387 | | 1,671,207 |
Pepsi Bottling Group, Inc. | | 37,912 | | 1,449,376 |
PepsiCo, Inc. | | 415,163 | | 25,935,233 |
| | | | |
Beverages Total | | | | 67,808,380 |
| | |
| Food & Staples Retailing – 2.7% | | | | |
Costco Wholesale Corp. | | 114,893 | | 7,005,026 |
CVS Caremark Corp. | | 371,633 | | 12,542,614 |
Kroger Co. | | 171,410 | | 3,788,161 |
Safeway, Inc. | | 107,082 | | 2,668,483 |
SUPERVALU, Inc. | | 55,856 | | 852,921 |
Sysco Corp. | | 155,959 | | 4,507,215 |
Wal-Mart Stores, Inc. | | 562,076 | | 30,391,449 |
Walgreen Co. | | 260,481 | | 9,179,351 |
Whole Foods Market, Inc. (a) | | 44,849 | | 1,591,691 |
| | | | |
Food & Staples Retailing Total | | | | 72,526,911 |
| | | | |
| | | Shares | | Value ($) |
| Food Products – 1.8% | | | | |
Archer-Daniels-Midland Co. | | 169,252 | | 4,969,239 |
Campbell Soup Co. | | 50,008 | | 1,666,767 |
ConAgra Foods, Inc. | | 116,660 | | 2,853,504 |
Dean Foods Co. (a) | | 47,600 | | 694,484 |
General Mills, Inc. | | 86,000 | | 6,192,860 |
H.J. Heinz Co. | | 83,150 | | 3,816,585 |
Hershey Co. | | 43,807 | | 1,741,766 |
Hormel Foods Corp. | | 18,375 | | 755,396 |
J.M. Smucker Co. | | 31,403 | | 1,874,131 |
Kellogg Co. | | 66,970 | | 3,492,485 |
Kraft Foods, Inc., Class A | | 456,805 | | 12,986,966 |
McCormick & Co., Inc. Non-Voting Shares | | 34,541 | | 1,281,817 |
Mead Johnson Nutrition Co., Class A | | 53,900 | | 2,549,470 |
Sara Lee Corp. | | 183,722 | | 2,491,270 |
Tyson Foods, Inc., Class A | | 80,341 | | 1,369,011 |
| | | | |
Food Products Total | | | | 48,735,751 |
| | |
| Household Products – 2.6% | | | | |
Clorox Co. | | 36,808 | | 2,256,699 |
Colgate-Palmolive Co. | | 131,009 | | 10,865,886 |
Kimberly-Clark Corp. | | 109,388 | | 6,644,227 |
Procter & Gamble Co. | | 769,693 | | 48,706,173 |
| | | | |
Household Products Total | | | | 68,472,985 |
| | |
| Personal Products – 0.2% | | | | |
Avon Products, Inc. | | 112,531 | | 3,425,443 |
Esteé Lauder Companies, Inc., Class A | | 31,114 | | 1,870,885 |
| | | | |
Personal Products Total | | | | 5,296,328 |
|
| Tobacco – 1.5% |
Altria Group, Inc. | | 545,904 | | 10,983,589 |
Lorillard, Inc. | | 42,311 | | 3,090,395 |
Philip Morris International, Inc. | | 501,759 | | 24,576,156 |
Reynolds American, Inc. | | 44,509 | | 2,350,075 |
| | | | |
Tobacco Total | | | | 41,000,215 |
| | | | |
Consumer Staples Total | | | | 303,840,570 |
| | | | |
| Energy – 10.9% | | | | |
| Energy Equipment & Services – 1.8% |
Baker Hughes, Inc. | | 81,655 | | 3,912,908 |
BJ Services Co. | | 77,368 | | 1,690,491 |
Cameron International Corp. (a) | | 64,387 | | 2,648,237 |
Diamond Offshore Drilling, Inc. | | 18,297 | | 1,597,694 |
FMC Technologies, Inc. (a) | | 32,179 | | 1,807,495 |
Halliburton Co. | | 237,575 | | 7,162,886 |
Helmerich & Payne, Inc. | | 27,800 | | 1,126,456 |
Nabors Industries Ltd. (a) | | 74,634 | | 1,644,933 |
See Accompanying Notes to Financial Statements.
24
Columbia Large Cap Index Fund
February 28, 2010
Common Stocks (continued)
| | | | |
| | | Shares | | Value ($) |
| Energy (continued) | | | | |
| Energy Equipment & Services (continued) |
National-Oilwell Varco, Inc. | | 110,164 | | 4,788,829 |
Rowan Companies, Inc. (a) | | 29,979 | | 780,054 |
Schlumberger Ltd. | | 316,330 | | 19,327,763 |
Smith International, Inc. | | 65,164 | | 2,671,072 |
| | | | |
Energy Equipment & Services Total | | 49,158,818 |
|
| Oil, Gas & Consumable Fuels – 9.1% |
Anadarko Petroleum Corp. | | 129,516 | | 9,082,957 |
Apache Corp. | | 88,536 | | 9,175,871 |
Cabot Oil & Gas Corp. | | 27,343 | | 1,097,548 |
Chesapeake Energy Corp. | | 170,642 | | 4,533,958 |
Chevron Corp. | | 528,522 | | 38,212,141 |
ConocoPhillips | | 390,885 | | 18,762,480 |
Consol Energy, Inc. | | 47,596 | | 2,396,935 |
Denbury Resources, Inc. (a) | | 65,775 | | 926,112 |
Devon Energy Corp. | | 117,035 | | 8,059,030 |
El Paso Corp. | | 184,752 | | 1,934,353 |
EOG Resources, Inc. | | 66,527 | | 6,256,864 |
Exxon Mobil Corp. (b) | | 1,250,701 | | 81,295,565 |
Hess Corp. | | 76,700 | | 4,509,960 |
Marathon Oil Corp. | | 186,527 | | 5,399,957 |
Massey Energy Co. | | 22,551 | | 971,272 |
Murphy Oil Corp. | | 50,307 | | 2,610,933 |
Noble Energy, Inc. | | 45,692 | | 3,319,067 |
Occidental Petroleum Corp. | | 213,863 | | 17,076,961 |
Peabody Energy Corp. | | 70,553 | | 3,243,321 |
Pioneer Natural Resources Co. | | 30,403 | | 1,418,300 |
Range Resources Corp. | | 41,535 | | 2,102,086 |
Southwestern Energy Co. (a) | | 90,927 | | 3,868,944 |
Spectra Energy Corp. | | 170,388 | | 3,714,458 |
Sunoco, Inc. | | 30,824 | | 812,829 |
Tesoro Corp. | | 36,934 | | 440,253 |
Valero Energy Corp. | | 148,649 | | 2,604,331 |
Williams Companies, Inc. | | 153,635 | | 3,309,298 |
XTO Energy, Inc. | | 152,936 | | 6,989,175 |
| | | | |
Oil, Gas & Consumable Fuels Total | | 244,124,959 |
| | | | |
Energy Total | | | | 293,283,777 |
| | | | |
| Financials – 15.6% | | | | |
Capital Markets – 2.6% |
Ameriprise Financial, Inc. | | 67,151 | | 2,688,055 |
Bank of New York Mellon Corp. | | 317,294 | | 9,049,225 |
Charles Schwab Corp. | | 251,054 | | 4,596,799 |
E*TRADE Financial Corp. (a) | | 407,950 | | 656,800 |
Federated Investors, Inc., Class B | | 23,244 | | 581,332 |
Franklin Resources, Inc. | | 39,277 | | 3,995,256 |
Goldman Sachs Group, Inc. | | 135,463 | | 21,179,640 |
| | | | |
| | | Shares | | Value ($) |
Invesco Ltd. | | 112,974 | | 2,214,290 |
Janus Capital Group, Inc. | | 47,950 | | 599,375 |
Legg Mason, Inc. | | 42,811 | | 1,106,664 |
Morgan Stanley | | 358,151 | | 10,092,695 |
Northern Trust Corp. | | 63,620 | | 3,390,310 |
State Street Corp. | | 130,369 | | 5,854,872 |
T. Rowe Price Group, Inc. | | 67,814 | | 3,437,492 |
| | | | |
Capital Markets Total | | | | 69,442,805 |
|
| Commercial Banks – 2.9% |
BB&T Corp. | | 181,162 | | 5,168,552 |
Comerica, Inc. | | 39,792 | | 1,435,695 |
Fifth Third Bancorp. | | 209,512 | | 2,558,142 |
First Horizon National Corp. (a) | | 58,455 | | 748,224 |
Huntington Bancshares, Inc. | | 188,404 | | 906,223 |
KeyCorp | | 231,461 | | 1,654,946 |
M&T Bank Corp. | | 21,741 | | 1,683,406 |
Marshall & Ilsley Corp. | | 138,277 | | 979,001 |
PNC Financial Services Group, Inc. | | 136,188 | | 7,321,467 |
Regions Financial Corp. | | 312,992 | | 2,112,696 |
SunTrust Banks, Inc. | | 131,468 | | 3,130,253 |
U.S. Bancorp | | 503,869 | | 12,400,216 |
Wells Fargo & Co. | | 1,346,550 | | 36,814,677 |
Zions Bancorporation | | 36,428 | | 675,375 |
| | | | |
Commercial Banks Total | | 77,588,873 |
|
| Consumer Finance – 0.7% |
American Express Co. | | 313,308 | | 11,965,233 |
Capital One Financial Corp. | | 118,504 | | 4,473,526 |
Discover Financial Services | | 143,039 | | 1,952,482 |
SLM Corp. (a) | | 125,072 | | 1,398,305 |
| | | | |
Consumer Finance Total | | 19,789,546 |
|
| Diversified Financial Services – 4.4% |
Bank of America Corp. (c) | | 2,617,817 | | 43,612,831 |
Citigroup, Inc. (a) | | 5,137,248 | | 17,466,643 |
CME Group, Inc. | | 17,520 | | 5,285,609 |
IntercontinentalExchange, Inc. (a) | | 19,320 | | 2,072,843 |
JPMorgan Chase & Co. | | 1,038,175 | | 43,572,205 |
Leucadia National Corp. (a) | | 49,950 | | 1,185,813 |
Moody’s Corp. | | 51,739 | | 1,377,292 |
NASDAQ OMX Group, Inc. (a) | | 38,909 | | 724,875 |
NYSE Euronext | | 68,533 | | 1,807,900 |
| | | | |
Diversified Financial Services Total | | 117,106,011 |
|
| Insurance – 3.7% |
AFLAC, Inc. | | 123,261 | | 6,095,256 |
Allstate Corp. | | 141,314 | | 4,416,063 |
American International Group, Inc. (a) | | 35,490 | | 879,087 |
See Accompanying Notes to Financial Statements.
25
Columbia Large Cap Index Fund
February 28, 2010
Common Stocks (continued)
| | | | |
| | | Shares | | Value ($) |
| Financials (continued) | | | | |
| Insurance (continued) |
Aon Corp. | | 72,190 | | 2,955,459 |
Assurant, Inc. | | 30,736 | | 938,063 |
Berkshire Hathaway, Inc., Class B (a) | | 435,700 | | 34,912,641 |
Chubb Corp. | | 90,024 | | 4,542,611 |
Cincinnati Financial Corp. | | 42,823 | | 1,151,939 |
Genworth Financial, Inc., Class A (a) | | 128,688 | | 2,051,287 |
Hartford Financial Services Group, Inc. | | 100,922 | | 2,459,469 |
Lincoln National Corp. | | 79,562 | | 2,003,371 |
Loews Corp. | | 95,074 | | 3,466,398 |
Marsh & McLennan Companies, Inc. | | 138,993 | | 3,227,417 |
MetLife, Inc. | | 215,726 | | 7,850,269 |
Principal Financial Group, Inc. | | 84,071 | | 1,951,288 |
Progressive Corp. | | 177,605 | | 3,045,926 |
Prudential Financial, Inc. | | 122,227 | | 6,405,917 |
Torchmark Corp. | | 21,771 | | 1,012,352 |
Travelers Companies, Inc. | | 143,955 | | 7,570,593 |
Unum Group | | 87,368 | | 1,818,128 |
XL Capital Ltd., Class A | | 90,146 | | 1,646,967 |
| | | | |
Insurance Total | | 100,400,501 |
|
| Real Estate Investment Trusts (REITs) – 1.2% |
Apartment Investment & Management Co., Class A | | 30,775 | | 513,635 |
AvalonBay Communities, Inc. | | 21,470 | | 1,748,087 |
Boston Properties, Inc. | | 36,573 | | 2,484,404 |
Equity Residential Property Trust | | 72,758 | | 2,625,109 |
HCP, Inc. | | 77,219 | | 2,222,363 |
Health Care REIT, Inc. | | 32,397 | | 1,372,337 |
Host Hotels & Resorts, Inc. (a) | | 166,237 | | 1,946,635 |
Kimco Realty Corp. | | 105,785 | | 1,469,354 |
Plum Creek Timber Co., Inc. | | 42,884 | | 1,532,245 |
ProLogis | | 124,617 | | 1,606,313 |
Public Storage | | 35,734 | | 2,936,977 |
Simon Property Group, Inc. | | 75,141 | | 5,882,789 |
Ventas, Inc. | | 41,226 | | 1,821,777 |
Vornado Realty Trust | | 41,293 | | 2,713,776 |
| | | | |
Real Estate Investment Trusts (REITs) Total | | 30,875,801 |
|
| Real Estate Management & Development – 0.0% |
CB Richard Ellis Group, Inc., Class A (a) | | 71,046 | | 937,807 |
| | | | |
Real Estate Management & Development Total | | 937,807 |
| | | | |
| | | Shares | | Value ($) |
| Thrifts & Mortgage Finance – 0.1% |
Hudson City Bancorp, Inc. | | 124,534 | | 1,683,700 |
People’s United Financial, Inc. | | 91,778 | | 1,447,339 |
| | | | |
Thrifts & Mortgage Finance Total | | 3,131,039 |
| | | | |
Financials Total | | 419,272,383 |
| | | | |
| Health Care – 12.3% |
| Biotechnology – 1.6% |
Amgen, Inc. (a) | | 266,694 | | 15,097,547 |
Biogen Idec, Inc. (a) | | 70,999 | | 3,905,655 |
Celgene Corp. (a) | | 121,091 | | 7,207,336 |
Cephalon, Inc. (a) | | 19,668 | | 1,350,602 |
Genzyme Corp. (a) | | 69,948 | | 4,001,026 |
Gilead Sciences, Inc. (a) | | 237,072 | | 11,286,998 |
| | | | |
Biotechnology Total | | | | 42,849,164 |
| |
| Health Care Equipment & Supplies – 1.9% | | |
Baxter International, Inc. | | 158,803 | | 9,040,655 |
Becton Dickinson & Co. | | 62,469 | | 4,864,461 |
Boston Scientific Corp. (a) | | 397,935 | | 3,080,017 |
C.R. Bard, Inc. | | 25,471 | | 2,133,960 |
CareFusion Corp. (a) | | 46,645 | | 1,177,320 |
DENTSPLY International, Inc. | | 40,051 | | 1,325,288 |
Hospira, Inc. (a) | | 42,707 | | 2,234,857 |
Intuitive Surgical, Inc. (a) | | 10,066 | | 3,494,311 |
Medtronic, Inc. | | 291,586 | | 12,654,832 |
St. Jude Medical, Inc. (a) | | 88,100 | | 3,367,182 |
Stryker Corp. | | 74,361 | | 3,948,569 |
Varian Medical Systems, Inc. (a) | | 32,818 | | 1,607,098 |
Zimmer Holdings, Inc. (a) | | 56,122 | | 3,217,474 |
| | | | |
Health Care Equipment & Supplies Total | | 52,146,024 |
| |
| Health Care Providers & Services – 2.2% | | |
Aetna, Inc. | | 114,178 | | 3,424,198 |
AmerisourceBergen Corp. | | 75,921 | | 2,128,825 |
Cardinal Health, Inc. | | 95,591 | | 3,247,226 |
CIGNA Corp. | | 71,994 | | 2,466,514 |
Coventry Health Care, Inc. (a) | | 39,027 | | 904,646 |
DaVita, Inc. (a) | | 26,887 | | 1,656,508 |
Express Scripts, Inc. (a) | | 72,396 | | 6,950,740 |
Humana, Inc. (a) | | 44,769 | | 2,118,917 |
Laboratory Corp. of America Holdings (a) | | 27,997 | | 2,052,460 |
McKesson Corp. | | 70,558 | | 4,173,506 |
Medco Health Solutions, Inc. (a) | | 125,554 | | 7,940,035 |
Patterson Companies, Inc. (a) | | 24,533 | | 728,139 |
Quest Diagnostics, Inc. | | 40,953 | | 2,324,083 |
Tenet Healthcare Corp. (a) | | 114,113 | | 601,376 |
UnitedHealth Group, Inc. | | 306,124 | | 10,365,359 |
WellPoint, Inc. (a) | | 120,716 | | 7,468,699 |
| | | | |
Health Care Providers & Services Total | | 58,551,231 |
See Accompanying Notes to Financial Statements.
26
Columbia Large Cap Index Fund
February 28, 2010
Common Stocks (continued)
| | | | |
| | | Shares | | Value ($) |
| Health Care (continued) |
| Life Sciences Tools & Services – 0.4% | | |
Life Technologies Corp. (a) | | 47,020 | | 2,386,735 |
Millipore Corp. (a) | | 14,616 | | 1,379,897 |
PerkinElmer, Inc. | | 30,745 | | 682,846 |
Thermo Fisher Scientific, Inc. (a) | | 107,604 | | 5,247,847 |
Waters Corp. (a) | | 24,954 | | 1,488,756 |
| | | | |
Life Sciences Tools & Services Total | | 11,186,081 |
|
| Pharmaceuticals – 6.2% |
Abbott Laboratories | | 407,497 | | 22,118,937 |
Allergan, Inc. | | 80,989 | | 4,732,187 |
Bristol-Myers Squibb Co. | | 450,936 | | 11,052,441 |
Eli Lilly & Co. | | 266,388 | | 9,147,764 |
Forest Laboratories, Inc. (a) | | 79,530 | | 2,376,356 |
Johnson & Johnson | | 726,918 | | 45,795,834 |
King Pharmaceuticals, Inc. (a) | | 65,355 | | 735,244 |
Merck & Co., Inc. | | 804,715 | | 29,677,889 |
Mylan, Inc. (a) | | 80,478 | | 1,717,401 |
Pfizer, Inc. | | 2,125,951 | | 37,310,440 |
Watson Pharmaceuticals, Inc. (a) | | 27,982 | | 1,113,404 |
| | | | |
Pharmaceuticals Total | | | | 165,777,897 |
| | | | |
Health Care Total | | | | 330,510,397 |
| | | | |
| Industrials – 10.0% | | | | |
| Aerospace & Defense – 2.8% | | | | |
Boeing Co. | | 191,385 | | 12,087,877 |
General Dynamics Corp. | | 101,666 | | 7,375,868 |
Goodrich Corp. | | 32,746 | | 2,149,120 |
Honeywell International, Inc. | | 201,053 | | 8,074,288 |
ITT Corp. | | 48,133 | | 2,465,854 |
L-3 Communications Holdings, Inc. | | 30,639 | | 2,801,017 |
Lockheed Martin Corp. | | 84,227 | | 6,549,492 |
Northrop Grumman Corp. | | 82,637 | | 5,062,343 |
Precision Castparts Corp. | | 37,055 | | 4,177,951 |
Raytheon Co. | | 101,006 | | 5,680,577 |
Rockwell Collins, Inc. | | 41,389 | | 2,329,373 |
United Technologies Corp. | | 246,991 | | 16,955,932 |
| | | | |
Aerospace & Defense Total | | | | 75,709,692 |
| | |
| Air Freight & Logistics – 1.0% | | | | |
C.H. Robinson Worldwide, Inc. | | 44,153 | | 2,354,680 |
Expeditors International of Washington, Inc. | | 55,841 | | 2,036,521 |
FedEx Corp. | | 82,340 | | 6,979,138 |
United Parcel Service, Inc., Class B | | 261,505 | | 15,360,804 |
| | | | |
Air Freight & Logistics Total | | | | 26,731,143 |
| | | | |
| | | Shares | | Value ($) |
| Airlines – 0.1% | | | | |
Southwest Airlines Co. | | 195,502 | | 2,459,415 |
| | | | |
Airlines Total | | | | 2,459,415 |
| | |
Building Products – 0.1% | | | | |
Masco Corp. | | 94,603 | | 1,264,842 |
| | | | |
Building Products Total | | | | 1,264,842 |
|
| Commercial Services & Supplies – 0.5% |
Avery Dennison Corp. | | 29,695 | | 938,362 |
Cintas Corp. | | 34,613 | | 858,056 |
Iron Mountain, Inc. (a) | | 47,665 | | 1,233,570 |
Pitney Bowes, Inc. | | 53,267 | | 1,219,815 |
R.R. Donnelley & Sons Co. | | 54,080 | | 1,075,651 |
Republic Services, Inc. | | 85,169 | | 2,396,656 |
Stericycle, Inc. (a) | | 22,212 | | 1,225,658 |
Waste Management, Inc. | | 129,037 | | 4,260,802 |
| | | | |
Commercial Services & Supplies Total | | 13,208,570 |
|
| Construction & Engineering – 0.2% |
Fluor Corp. | | 47,198 | | 2,020,074 |
Jacobs Engineering Group, Inc. (a) | | 32,746 | | 1,270,545 |
Quanta Services, Inc. (a) | | 55,243 | | 1,049,617 |
| | | | |
Construction & Engineering Total | | 4,340,236 |
|
| Electrical Equipment – 0.5% |
Emerson Electric Co. | | 198,131 | | 9,379,522 |
First Solar, Inc. (a) | | 12,800 | | 1,355,520 |
Rockwell Automation, Inc. | | 37,493 | | 2,027,996 |
Roper Industries, Inc. | | 24,000 | | 1,330,560 |
| | | | |
Electrical Equipment Total | | | | 14,093,598 |
|
| Industrial Conglomerates – 2.3% |
3M Co. | | 186,513 | | 14,949,017 |
General Electric Co. (b) | | 2,805,109 | | 45,050,051 |
Textron, Inc. | | 71,408 | | 1,422,447 |
| | | | |
Industrial Conglomerates Total | | | | 61,421,515 |
|
| Machinery – 1.6% |
Caterpillar, Inc. | | 164,083 | | 9,360,935 |
Cummins, Inc. | | 53,136 | | 3,017,062 |
Danaher Corp. | | 68,594 | | 5,073,898 |
Deere & Co. | | 111,403 | | 6,383,392 |
Dover Corp. | | 49,026 | | 2,218,917 |
Eaton Corp. | | 43,675 | | 2,975,141 |
Flowserve Corp. | | 14,763 | | 1,477,629 |
Illinois Tool Works, Inc. | | 101,632 | | 4,626,289 |
PACCAR, Inc. | | 95,763 | | 3,385,222 |
Pall Corp. | | 30,780 | | 1,214,886 |
Parker Hannifin Corp. | | 42,315 | | 2,552,018 |
See Accompanying Notes to Financial Statements.
27
Columbia Large Cap Index Fund
February 28, 2010
Common Stocks (continued)
| | | | |
| | | Shares | | Value ($) |
| Industrials (continued) | | | | |
| Machinery (continued) | | | | |
Snap-On, Inc. | | 15,254 | | 644,024 |
Stanley Works | | 21,166 | | 1,211,753 |
| | | | |
Machinery Total | | | | 44,141,166 |
|
| Professional Services – 0.1% |
Dun & Bradstreet Corp. | | 13,657 | | 958,175 |
Equifax, Inc. | | 33,335 | | 1,075,387 |
Robert Half International, Inc. | | 39,810 | | 1,110,699 |
| | | | |
Professional Services Total | | | | 3,144,261 |
|
| Road & Rail – 0.7% |
CSX Corp. | | 103,460 | | 4,910,212 |
Norfolk Southern Corp. | | 96,917 | | 4,984,441 |
Ryder System, Inc. | | 14,729 | | 519,786 |
Union Pacific Corp. | | 132,932 | | 8,955,629 |
| | | | |
Road & Rail Total | | | | 19,370,068 |
|
| Trading Companies & Distributors – 0.1% |
Fastenal Co. | | 34,774 | | 1,542,922 |
W.W. Grainger, Inc. | | 16,598 | | 1,687,187 |
| | | | |
Trading Companies & Distributors Total | | 3,230,109 |
| | | | |
Industrials Total | | | | 269,114,615 |
| | | | |
| Information Technology – 18.4% | | | | |
| Communications Equipment – 2.4% | | |
Cisco Systems, Inc. (a) | | 1,515,563 | | 36,873,648 |
Harris Corp. | | 34,658 | | 1,567,235 |
JDS Uniphase Corp. (a) | | 58,648 | | 629,293 |
Juniper Networks, Inc. (a) | | 138,447 | | 3,873,747 |
Motorola, Inc. (a) | | 608,817 | | 4,115,603 |
QUALCOMM, Inc. | | 440,007 | | 16,143,857 |
Tellabs, Inc. | | 101,726 | | 702,926 |
| | | | |
Communications Equipment Total | | 63,906,309 |
|
| Computers & Peripherals – 5.6% |
Apple, Inc. (a) | | 237,237 | | 48,543,435 |
Dell, Inc. (a) | | 453,595 | | 6,001,062 |
EMC Corp. (a) | | 537,383 | | 9,398,829 |
Hewlett-Packard Co. | | 624,640 | | 31,725,465 |
International Business Machines Corp. | | 346,057 | | 44,004,608 |
Lexmark International, Inc., Class A (a) | | 20,620 | | 695,100 |
NetApp, Inc. (a) | | 89,237 | | 2,678,002 |
QLogic Corp. (a) | | 30,203 | | 549,695 |
SanDisk Corp. (a) | | 60,132 | | 1,751,645 |
Teradata Corp. (a) | | 45,132 | | 1,376,075 |
Western Digital Corp. (a) | | 59,381 | | 2,293,888 |
| | | | |
Computers & Peripherals Total | | | | 149,017,804 |
| | | | |
| | | Shares | | Value ($) |
| Electronic Equipment, Instruments & Components – 0.5% |
Agilent Technologies, Inc. (a) | | 90,957 | | 2,861,507 |
Amphenol Corp., Class A | | 45,183 | | 1,881,872 |
Corning, Inc. | | 409,979 | | 7,227,930 |
FLIR Systems, Inc. (a) | | 39,976 | | 1,071,757 |
Jabil Circuit, Inc. | | 50,193 | | 761,428 |
Molex, Inc. | | 35,699 | | 730,044 |
| | | | |
Electronic Equipment, Instruments & Components Total | | 14,534,538 |
|
| Internet Software & Services – 1.8% |
Akamai Technologies, Inc. (a) | | 45,162 | | 1,187,761 |
eBay, Inc. (a) | | 296,310 | | 6,821,056 |
Google, Inc., Class A (a) | | 63,512 | | 33,458,121 |
Monster Worldwide, Inc. (a) | | 33,088 | | 461,578 |
VeriSign, Inc. (a) | | 50,713 | | 1,263,768 |
Yahoo!, Inc. (a) | | 313,745 | | 4,803,436 |
| | | | |
Internet Software & Services Total | | 47,995,720 |
|
| IT Services – 1.5% |
Automatic Data Processing, Inc. | | 132,923 | | 5,530,926 |
Cognizant Technology Solutions Corp., Class A (a) | | 77,680 | | 3,738,738 |
Computer Sciences Corp. (a) | | 40,186 | | 2,081,233 |
Fidelity National Information Services, Inc. | | 86,323 | | 1,945,721 |
Fiserv, Inc. (a) | | 40,500 | | 1,953,315 |
MasterCard, Inc., Class A | | 25,325 | | 5,682,170 |
Paychex, Inc. | | 84,759 | | 2,537,685 |
SAIC, Inc. (a) | | 80,700 | | 1,589,790 |
Total System Services, Inc. | | 51,984 | | 740,252 |
Visa, Inc., Class A | | 118,000 | | 10,063,040 |
Western Union Co. | | 182,322 | | 2,877,041 |
| | | | |
IT Services Total | | | | 38,739,911 |
|
| Office Electronics – 0.1% |
Xerox Corp. | | 355,982 | | 3,335,551 |
| | | | |
Office Electronics Total | | | | 3,335,551 |
|
| Semiconductors & Semiconductor Equipment – 2.4% |
Advanced Micro Devices, Inc. (a) | | 148,297 | | 1,173,029 |
Altera Corp. | | 77,803 | | 1,900,727 |
Analog Devices, Inc. | | 76,865 | | 2,247,533 |
Applied Materials, Inc. | | 351,337 | | 4,300,365 |
Broadcom Corp., Class A | | 113,460 | | 3,553,567 |
Intel Corp. | | 1,454,812 | | 29,867,290 |
KLA-Tencor Corp. | | 45,035 | | 1,311,870 |
Linear Technology Corp. | | 58,796 | | 1,597,487 |
LSI Corp. (a) | | 172,054 | | 927,371 |
MEMC Electronic Materials, Inc. (a) | | 58,899 | | 713,267 |
Microchip Technology, Inc. | | 48,347 | | 1,308,270 |
Micron Technology, Inc. (a) | | 223,907 | | 2,028,597 |
See Accompanying Notes to Financial Statements.
28
Columbia Large Cap Index Fund
February 28, 2010
Common Stocks (continued)
| | | | |
| | | Shares | | Value ($) |
| Information Technology (continued) |
| Semiconductors & Semiconductor Equipment (continued) |
National Semiconductor Corp. | | 62,292 | | 901,988 |
Novellus Systems, Inc. (a) | | 25,564 | | 565,476 |
NVIDIA Corp. (a) | | 146,148 | | 2,367,598 |
Teradyne, Inc. (a) | | 46,032 | | 459,860 |
Texas Instruments, Inc. | | 330,094 | | 8,047,692 |
Xilinx, Inc. | | 72,975 | | 1,884,944 |
| | | | |
Semiconductors & Semiconductor Equipment Total | | 65,156,931 |
|
| Software – 4.1% |
Adobe Systems, Inc. (a) | | 137,990 | | 4,781,353 |
Autodesk, Inc. (a) | | 60,516 | | 1,687,186 |
BMC Software, Inc. (a) | | 48,356 | | 1,781,435 |
CA, Inc. | | 104,467 | | 2,350,508 |
Citrix Systems, Inc. (a) | | 48,177 | | 2,072,093 |
Compuware Corp. (a) | | 60,671 | | 454,426 |
Electronic Arts, Inc. (a) | | 85,710 | | 1,421,072 |
Intuit, Inc. (a) | | 83,437 | | 2,700,021 |
McAfee, Inc. (a) | | 41,544 | | 1,648,881 |
Microsoft Corp. | | 2,035,091 | | 58,325,708 |
Novell, Inc. (a) | | 91,411 | | 428,718 |
Oracle Corp. | | 1,030,126 | | 25,392,606 |
Red Hat, Inc. (a) | | 49,500 | | 1,388,475 |
Salesforce.com, Inc. (a) | | 28,980 | | 1,969,191 |
Symantec Corp. (a) | | 213,558 | | 3,534,385 |
| | | | |
Software Total | | | | 109,936,058 |
| | | | |
Information Technology Total | | | | 492,622,822 |
| | | | |
| Materials – 3.3% | | | | |
| Chemicals – 1.8% | | | | |
Air Products & Chemicals, Inc. | | 55,819 | | 3,828,067 |
Airgas, Inc. | | 21,600 | | 1,385,424 |
CF Industries Holdings, Inc. | | 12,776 | | 1,357,322 |
Dow Chemical Co. | | 301,317 | | 8,530,284 |
E.I. Du Pont de Nemours & Co. | | 238,076 | | 8,027,923 |
Eastman Chemical Co. | | 19,175 | | 1,141,871 |
Ecolab, Inc. | | 62,545 | | 2,635,646 |
FMC Corp. | | 19,000 | | 1,086,230 |
International Flavors & Fragrances, Inc. | | 20,871 | | 878,878 |
Monsanto Co. | | 143,636 | | 10,147,883 |
PPG Industries, Inc. | | 44,003 | | 2,707,945 |
Praxair, Inc. | | 80,877 | | 6,077,098 |
Sigma-Aldrich Corp. | | 32,109 | | 1,531,278 |
| | | | |
Chemicals Total | | | | 49,335,849 |
|
| Construction Materials – 0.1% |
Vulcan Materials Co. | | 33,053 | | 1,434,831 |
| | | | |
Construction Materials Total | | | | 1,434,831 |
| | | | |
| | | Shares | | Value ($) |
| Containers & Packaging – 0.2% | | | | |
Ball Corp. | | 24,755 | | 1,337,760 |
Bemis Co., Inc. | | 28,524 | | 834,898 |
Owens-Illinois, Inc. (a) | | 44,439 | | 1,317,172 |
Pactiv Corp. (a) | | 34,845 | | 862,762 |
Sealed Air Corp. | | 41,845 | | 854,893 |
| | | | |
Containers & Packaging Total | | | | 5,207,485 |
| | |
| Metals & Mining – 1.0% | | | | |
AK Steel Holding Corp. | | 28,838 | | 620,882 |
Alcoa, Inc. | | 256,668 | | 3,413,685 |
Allegheny Technologies, Inc. | | 25,853 | | 1,128,742 |
Cliffs Natural Resources, Inc. | | 34,500 | | 1,945,800 |
Freeport-McMoRan Copper & Gold, Inc. | | 113,282 | | 8,514,275 |
Newmont Mining Corp. | | 129,100 | | 6,362,048 |
Nucor Corp. | | 82,958 | | 3,434,461 |
Titanium Metals Corp. (a) | | 22,262 | | 262,469 |
United States Steel Corp. | | 37,767 | | 1,999,385 |
| | | | |
Metals & Mining Total | | | | 27,681,747 |
| | |
Paper & Forest Products – 0.2% | | | | |
International Paper Co. | | 114,142 | | 2,644,670 |
MeadWestvaco Corp. | | 45,135 | | 1,035,397 |
Weyerhaeuser Co. | | 55,697 | | 2,250,159 |
| | | | |
Paper & Forest Products Total | | | | 5,930,226 |
| | | | |
Materials Total | | | | 89,590,138 |
| | | | |
| Telecommunication Services – 2.8% | | |
| Diversified Telecommunication Services – 2.5% |
AT&T, Inc. | | 1,554,654 | | 38,570,966 |
CenturyTel, Inc. | | 78,418 | | 2,687,385 |
Frontier Communications Corp. | | 82,287 | | 641,016 |
Qwest Communications International, Inc. | | 391,244 | | 1,784,072 |
Verizon Communications, Inc. | | 748,351 | | 21,649,794 |
Windstream Corp. | | 115,067 | | 1,165,629 |
| | | | |
Diversified Telecommunication Services Total | | 66,498,862 |
|
Wireless Telecommunication Services – 0.3% |
American Tower Corp., Class A (a) | | 105,803 | | 4,513,556 |
MetroPCS Communications, Inc. (a) | | 68,673 | | 423,712 |
Sprint Nextel Corp. (a) | | 782,150 | | 2,604,559 |
| | | | |
Wireless Telecommunication Services Total | | 7,541,827 |
| | | | |
Telecommunication Services Total | | 74,040,689 |
See Accompanying Notes to Financial Statements.
29
Columbia Large Cap Index Fund
February 28, 2010
Common Stocks (continued)
| | | | |
| | | Shares | | Value ($) |
| Utilities – 3.4% | | | | |
| Electric Utilities – 1.8% | | | | |
Allegheny Energy, Inc. | | 44,715 | | 1,012,795 |
American Electric Power Co., Inc. | | 125,866 | | 4,231,615 |
Duke Energy Corp. | | 343,675 | | 5,619,086 |
Edison International | | 85,816 | | 2,800,176 |
Entergy Corp. | | 49,822 | | 3,784,977 |
Exelon Corp. | | 173,698 | | 7,521,123 |
FirstEnergy Corp. | | 80,326 | | 3,104,600 |
FPL Group, Inc. | | 108,944 | | 5,051,733 |
Northeast Utilities | | 46,233 | | 1,183,565 |
Pepco Holdings, Inc. | | 58,333 | | 981,161 |
Pinnacle West Capital Corp. | | 26,711 | | 972,548 |
PPL Corp. | | 99,347 | | 2,829,403 |
Progress Energy, Inc. | | 73,643 | | 2,819,790 |
Southern Co. | | 210,800 | | 6,697,116 |
| | | | |
Electric Utilities Total | | | | 48,609,688 |
| | |
| Gas Utilities – 0.1% | | | | |
EQT Corp. | | 34,488 | | 1,509,195 |
Nicor, Inc. | | 11,888 | | 495,135 |
Questar Corp. | | 45,967 | | 1,930,155 |
| | | | |
Gas Utilities Total | | | | 3,934,485 |
|
| Independent Power Producers & Energy Traders – 0.2% |
AES Corp. (a) | | 175,855 | | 2,055,745 |
Constellation Energy Group, Inc. | | 52,887 | | 1,854,747 |
NRG Energy, Inc. (a) | | 67,600 | | 1,476,384 |
| | | | |
Independent Power Producers & Energy Traders Total | | 5,386,876 |
| | |
| Multi-Utilities – 1.3% | | | | |
Ameren Corp. | | 62,442 | | 1,542,942 |
CenterPoint Energy, Inc. | | 102,814 | | 1,375,651 |
CMS Energy Corp. | | 60,525 | | 924,217 |
Consolidated Edison, Inc. | | 73,896 | | 3,159,054 |
Dominion Resources, Inc. | | 157,375 | | 5,978,676 |
DTE Energy Co. | | 43,449 | | 1,886,556 |
Integrys Energy Group, Inc. | | 20,110 | | 886,449 |
NiSource, Inc. | | 72,643 | | 1,091,098 |
PG&E Corp. | | 97,745 | | 4,097,470 |
Public Service Enterprise Group, Inc. | | 133,298 | | 3,961,617 |
SCANA Corp. | | 29,243 | | 1,054,210 |
Sempra Energy | | 64,946 | | 3,193,395 |
TECO Energy, Inc. | | 56,273 | | 862,665 |
Wisconsin Energy Corp. | | 30,828 | | 1,493,000 |
| | | | |
| | | Shares | | Value ($) |
Xcel Energy, Inc. | | 120,346 | | 2,504,400 |
| | | | |
Multi-Utilities Total | | | | 34,011,400 |
| | | | |
Utilities Total | | | | 91,942,449 |
| | | | |
Total Common Stocks (cost of $2,317,044,455) | | | | 2,624,122,966 |
| | | | |
|
Short-Term Obligation – 2.1% |
| | | Par ($) | | |
Repurchase agreement with Fixed Income Clearing Corp., dated 02/26/10, due 03/01/10 at 0.050%, collateralized by U.S. Government Agency obligations with various maturities to 02/25/13, market value $56,529,231 (repurchase proceeds $55,420,231) | | 55,420,000 | | 55,420,000 |
|
Total Short-Term Obligation (cost of $55,420,000) | | 55,420,000 |
| | | | |
Total Investments – 99.8% (cost of $2,372,464,455) (d) | | 2,679,542,966 |
| | | | |
Other Assets & Liabilities, Net – 0.2% | | 5,077,265 |
| | | | |
Net Assets – 100.0% | | | | 2,684,620,231 |
Notes to Investment Portfolio:
| (a) | Non-income producing security. |
| (b) | A portion of these securities with a market value of $24,666,800 is pledged as collateral for open futures contracts. |
| (c) | Investments in affiliates during the year ended February 28, 2010: |
| | | | | | | | | | | | | | | |
Affiliate | | Value,
beginning
of period | | Purchases | | Sales
Proceeds | | Dividend
Income | | Value,
end
of period |
Bank of America Corp. | | $ | 5,544,271 | | $ | 16,585,865 | | $ | 1,120,628 | | $ | 76,424 | | $ | 43,612,831 |
| (d) | Cost for federal income tax purposes is $2,415,020,509. |
See Accompanying Notes to Financial Statements.
30
Columbia Large Cap Index Fund
February 28, 2010
The following table summarizes the inputs used, as of February 28, 2010, in valuing the Fund’s assets:
| | | | | | | | | | | | |
Description | | Quoted Prices
(Level 1) | | Other
Significant
Observable
Inputs
(Level 2) | | Significant
Unobservable
Inputs
(Level 3) | | Total |
Total Common Stocks | | $ | 2,624,122,966 | | $ | — | | $ | — | | $ | 2,624,122,966 |
| | | | | | | | | | | | |
Total Short-Term Obligation | | | — | | | 55,420,000 | | | — | | | 55,420,000 |
| | | | | | | | | | | | |
Total Investments | | | 2,624,122,966 | | | 55,420,000 | | | — | | | 2,679,542,966 |
| | | | | | | | | | | | |
Unrealized appreciation on futures contracts | | | 751,415 | | | — | | | — | | | 751,415 |
| | | | | | | | | | | | |
Total | | $ | 2,624,874,381 | | $ | 55,420,000 | | $ | — | | $ | 2,680,294,381 |
| | | | | | | | | | | | |
The following table reconciles asset balances for the year ended February 28, 2010, in which significant unobservable inputs (Level 3) were used in determining value:
| | | | | | | | | | | | | | | | | | | | |
Invest
ments in
Securities | | Balance
as of
February 28,
2009 | | Realized
Gain/
(Loss) | | Change in
Unrealized
Appreciation
(Depreci-
ation) | | | Net Purchases (Sales) | | | Net
Transfers
into
(out of) Level 3 | | Balance
as of
February 28,
2010 |
Common Stock | | $ | 643 | | $ | 6,558 | | $ | (643 | ) | | $ | (6,558 | ) | | $ | — | | $ | — |
The information in the above reconciliation represents fiscal year to date activity for any securities identified as using Level 3 inputs at either the beginning or the end of the current fiscal period.
For more information on valuation inputs, and their aggregation into the levels used in the tables above, please refer to the Security Valuation section in the accompanying Notes to Financial Statements.
At February 28, 2010, the Fund held the following open long futures contracts:
| | | | | | | | | | | | | |
Risk
Exposure/
Type | | Number of
Contracts | | Value | | Aggregate
Face Value | | Expiration
Date | | Unrealized
Appreciation |
Equity Risk S&P 500 Index | | 218 | | $ | 60,135,300 | | $ | 59,383,885 | | March-2010 | | $ | 751,415 |
| | | | | | | | | | | | | |
At February 28, 2010, the Fund held investments in the following sectors:
| | |
Sector (Unaudited) | | % of
Net Assets |
Information Technology | | 18.4 |
Financials | | 15.6 |
Health Care | | 12.3 |
Consumer Staples | | 11.3 |
Energy | | 10.9 |
Industrials | | 10.0 |
Consumer Discretionary | | 9.7 |
Utilities | | 3.4 |
Materials | | 3.3 |
Telecommunication Services | | 2.8 |
| | |
| | 97.7 |
Short-Term Obligation | | 2.1 |
Other Assets & Liabilities, Net | | 0.2 |
| | |
| | 100.0 |
| | |
See Accompanying Notes to Financial Statements.
31
Investment Portfolio – Columbia Large Cap Enhanced Core Fund
February 28, 2010
Common Stocks – 98.5%
| | | | |
| | | Shares | | Value ($) |
| Consumer Discretionary – 9.9% | | | | |
| Automobiles – 0.3% | | | | |
Ford Motor Co. (a) | | 120,300 | | 1,412,322 |
| | | | |
Automobiles Total | | | | 1,412,322 |
| |
| Diversified Consumer Services – 0.1% | | |
H&R Block, Inc. | | 34,100 | | 589,248 |
| | | | |
Diversified Consumer Services Total | | 589,248 |
| |
| Hotels, Restaurants & Leisure – 0.9% | | |
McDonald’s Corp. | | 53,200 | | 3,396,820 |
Starbucks Corp. (a) | | 52,700 | | 1,207,357 |
| | | | |
Hotels, Restaurants & Leisure Total | | 4,604,177 |
| |
| Household Durables – 0.4% | | |
Leggett & Platt, Inc. | | 87,400 | | 1,656,230 |
Whirlpool Corp. | | 3,900 | | 328,224 |
| | | | |
Household Durables Total | | 1,984,454 |
| |
| Internet & Catalog Retail – 0.5% | | |
Amazon.com, Inc. (a) | | 17,100 | | 2,024,640 |
Priceline.com, Inc. (a) | | 3,000 | | 680,280 |
| | | | |
Internet & Catalog Retail Total | | 2,704,920 |
| |
| Leisure Equipment & Products – 0.1% | | |
Mattel, Inc. | | 29,800 | | 655,302 |
| | | | |
Leisure Equipment & Products Total | | 655,302 |
| |
| Media – 3.8% | | |
CBS Corp., Class B | | 21,300 | | 276,687 |
Comcast Corp., Class A | | 237,800 | | 3,909,432 |
DIRECTV, Class A (a) | | 131,100 | | 4,437,735 |
News Corp., Class A | | 94,900 | | 1,268,813 |
Omnicom Group, Inc. | | 600 | | 21,972 |
Time Warner, Inc. | | 196,200 | | 5,697,648 |
Viacom, Inc., Class B (a) | | 23,600 | | 699,740 |
Walt Disney Co. | | 121,800 | | 3,805,032 |
| | | | |
Media Total | | 20,117,059 |
| |
| Multiline Retail – 1.1% | | |
Kohl’s Corp. (a) | | 16,300 | | 877,266 |
Nordstrom, Inc. | | 43,900 | | 1,621,666 |
Sears Holdings Corp. (a) | | 2,500 | | 239,175 |
Target Corp. | | 62,500 | | 3,220,000 |
| | | | |
Multiline Retail Total | | 5,958,107 |
| |
| Specialty Retail – 2.2% | | |
AutoNation, Inc. (a) | | 2,100 | | 37,275 |
Bed Bath & Beyond, Inc. (a) | | 600 | | 24,966 |
Gap, Inc. | | 152,100 | | 3,270,150 |
Home Depot, Inc. | | 105,600 | | 3,294,720 |
Limited Brands, Inc. | | 14,000 | | 309,540 |
Lowe’s Companies, Inc. | | 2,900 | | 68,759 |
| | | | |
| | | Shares | | Value ($) |
Ross Stores, Inc. | | 23,500 | | 1,149,385 |
Tiffany & Co. | | 12,100 | | 537,119 |
TJX Companies, Inc. | | 63,300 | | 2,635,179 |
| | | | |
Specialty Retail Total | | 11,327,093 |
| |
| Textiles, Apparel & Luxury Goods – 0.5% | | |
Coach, Inc. | | 16,700 | | 608,548 |
NIKE, Inc., Class B | | 13,400 | | 905,840 |
Polo Ralph Lauren Corp. | | 3,000 | | 239,790 |
V.F. Corp. | | 13,700 | | 1,060,106 |
| | | | |
Textiles, Apparel & Luxury Goods Total | | 2,814,284 |
| | | | |
Consumer Discretionary Total | | 52,166,966 |
| | | | |
| Consumer Staples – 11.3% | | | | |
| Beverages – 1.9% | | | | |
Brown-Forman Corp., Class B | | 17,000 | | 890,120 |
Coca-Cola Co. | | 113,500 | | 5,983,720 |
PepsiCo, Inc. | | 51,400 | | 3,210,958 |
| | | | |
Beverages Total | | 10,084,798 |
| |
| Food & Staples Retailing – 1.2% | | |
Safeway, Inc. | | 21,300 | | 530,796 |
Sysco Corp. | | 31,000 | | 895,900 |
Wal-Mart Stores, Inc. | | 51,300 | | 2,773,791 |
Walgreen Co. | | 52,000 | | 1,832,480 |
| | | | |
Food & Staples Retailing Total | | 6,032,967 |
| |
| Food Products – 2.3% | | |
Campbell Soup Co. | | 10,000 | | 333,300 |
ConAgra Foods, Inc. | | 13,100 | | 320,426 |
General Mills, Inc. | | 60,800 | | 4,378,208 |
H.J. Heinz Co. | | 21,000 | | 963,900 |
Hershey Co. | | 41,500 | | 1,650,040 |
Kellogg Co. | | 13,600 | | 709,240 |
Kraft Foods, Inc., Class A | | 27,800 | | 790,354 |
Sara Lee Corp. | | 209,500 | | 2,840,820 |
| | | | |
Food Products Total | | | | 11,986,288 |
| | |
| Household Products – 2.8% | | | | |
Colgate-Palmolive Co. | | 25,800 | | 2,139,852 |
Kimberly-Clark Corp. | | 25,400 | | 1,542,796 |
Procter & Gamble Co. | | 174,900 | | 11,067,672 |
| | | | |
Household Products Total | | | | 14,750,320 |
| | |
| Personal Products – 0.5% | | | | |
Esteé Lauder Companies, Inc., Class A | | 45,100 | | 2,711,863 |
| | | | |
Personal Products Total | | | | 2,711,863 |
| | |
| Tobacco – 2.6% | | | | |
Altria Group, Inc. | | 143,300 | | 2,883,196 |
Lorillard, Inc. | | 35,900 | | 2,622,136 |
See Accompanying Notes to Financial Statements.
32
Columbia Large Cap Enhanced Core Fund
February 28, 2010
Common Stocks (continued)
| | | | |
| | | Shares | | Value ($) |
| Consumer Staples (continued) | | | | |
| Tobacco (continued) | | | | |
Philip Morris International, Inc. | | 159,600 | | 7,817,208 |
Reynolds American, Inc. | | 8,900 | | 469,920 |
| | | | |
Tobacco Total | | | | 13,792,460 |
| | | | |
Consumer Staples Total | | | | 59,358,696 |
| | | | |
| Energy – 11.1% | | | | |
| Energy Equipment & Services – 0.7% |
National-Oilwell Varco, Inc. | | 21,900 | | 951,993 |
Rowan Companies, Inc. (a) | | 67,500 | | 1,756,350 |
Schlumberger Ltd. | | 15,400 | | 940,940 |
Smith International, Inc. | | 1,200 | | 49,188 |
| | | | |
Energy Equipment & Services Total | | 3,698,471 |
| |
Oil, Gas & Consumable Fuels – 10.4% | | |
Anadarko Petroleum Corp. | | 30,100 | | 2,110,913 |
Apache Corp. | | 55,400 | | 5,741,656 |
Chevron Corp. | | 136,300 | | 9,854,490 |
ConocoPhillips | | 109,900 | | 5,275,200 |
Consol Energy, Inc. | | 67,300 | | 3,389,228 |
EOG Resources, Inc. | | 13,300 | | 1,250,865 |
Exxon Mobil Corp. | | 215,300 | | 13,994,500 |
Marathon Oil Corp. | | 37,100 | | 1,074,045 |
Massey Energy Co. | | 11,800 | | 508,226 |
Murphy Oil Corp. | | 9,900 | | 513,810 |
Noble Energy, Inc. | | 4,000 | | 290,560 |
Peabody Energy Corp. | | 89,900 | | 4,132,703 |
Pioneer Natural Resources Co. | | 6,000 | | 279,900 |
Tesoro Corp. | | 7,300 | | 87,016 |
Valero Energy Corp. | | 46,000 | | 805,920 |
XTO Energy, Inc. | | 113,100 | | 5,168,670 |
| | | | |
Oil, Gas & Consumable Fuels Total | | | | 54,477,702 |
| | | | |
Energy Total | | | | 58,176,173 |
| | | | |
| Financials – 14.3% | | | | |
| Capital Markets – 2.5% | | | | |
Ameriprise Financial, Inc. | | 53,700 | | 2,149,611 |
Federated Investors, Inc., Class B | | 4,600 | | 115,046 |
Franklin Resources, Inc. | | 27,000 | | 2,746,440 |
Goldman Sachs Group, Inc. | | 33,300 | | 5,206,455 |
Morgan Stanley | | 10,100 | | 284,618 |
T. Rowe Price Group, Inc. | | 56,900 | | 2,884,261 |
| | | | |
Capital Markets Total | | | | 13,386,431 |
| | |
Commercial Banks – 2.9% | | | | |
Comerica, Inc. | | 7,900 | | 285,032 |
Fifth Third Bancorp. | | 166,400 | | 2,031,744 |
M&T Bank Corp. | | 6,700 | | 518,781 |
PNC Financial Services Group, Inc. | | 47,800 | | 2,569,728 |
| | | | |
| | | Shares | | Value ($) |
U.S. Bancorp | | 97,300 | | 2,394,553 |
Wells Fargo & Co. | | 266,600 | | 7,288,844 |
| | | | |
Commercial Banks Total | | | | 15,088,682 |
| | |
Consumer Finance – 2.0% | | | | |
American Express Co. | | 68,000 | | 2,596,920 |
Capital One Financial Corp. | | 23,600 | | 890,900 |
Discover Financial Services | | 252,200 | | 3,442,530 |
SLM Corp. (a) | | 325,100 | | 3,634,618 |
| | | | |
Consumer Finance Total | | | | 10,564,968 |
| |
Diversified Financial Services – 2.5% | | |
Citigroup, Inc. (a) | | 1,277,900 | | 4,344,860 |
CME Group, Inc. | | 3,500 | | 1,055,915 |
JPMorgan Chase & Co. | | 178,000 | | 7,470,660 |
| | | | |
Diversified Financial Services Total | | 12,871,435 |
| | |
Insurance – 2.2% | | | | |
AFLAC, Inc. | | 24,500 | | 1,211,525 |
Allstate Corp. | | 8,900 | | 278,125 |
Genworth Financial, Inc., Class A (a) | | 54,200 | | 863,948 |
Hartford Financial Services Group, Inc. | | 20,100 | | 489,837 |
Loews Corp. | | 25,000 | | 911,500 |
MetLife, Inc. | | 42,900 | | 1,561,131 |
Prudential Financial, Inc. | | 87,900 | | 4,606,839 |
Travelers Companies, Inc. | | 28,600 | | 1,504,074 |
Unum Group | | 11,100 | | 230,991 |
| | | | |
Insurance Total | | | | 11,657,970 |
|
| Real Estate Investment Trusts (REITs) – 1.6% |
Boston Properties, Inc. | | 13,500 | | 917,055 |
Equity Residential Property Trust | | 13,300 | | 479,864 |
Host Hotels & Resorts, Inc. (a) | | 143,700 | | 1,682,727 |
Public Storage | | 10,500 | | 862,995 |
Simon Property Group, Inc. | | 32,200 | | 2,520,938 |
Ventas, Inc. | | 42,100 | | 1,860,399 |
| | | | |
Real Estate Investment Trusts (REITs) Total | | 8,323,978 |
|
| Thrifts & Mortgage Finance – 0.6% |
Hudson City Bancorp, Inc. | | 251,100 | | 3,394,872 |
| | | | |
Thrifts & Mortgage Finance Total | | | | 3,394,872 |
| | | | |
Financials Total | | | | 75,288,336 |
| | | | |
| Health Care – 12.7% | | | | |
| Biotechnology – 1.0% | | | | |
Amgen, Inc. (a) | | 67,400 | | 3,815,514 |
Biogen Idec, Inc. (a) | | 2,900 | | 159,529 |
Gilead Sciences, Inc. (a) | | 21,600 | | 1,028,376 |
| | | | |
Biotechnology Total | | | | 5,003,419 |
See Accompanying Notes to Financial Statements.
33
Columbia Large Cap Enhanced Core Fund
February 28, 2010
Common Stocks (continued)
| | | | |
| | | Shares | | Value ($) |
| Health Care (continued) | | | | |
| Health Care Equipment & Supplies – 1.0% |
Becton Dickinson & Co. | | 600 | | 46,722 |
Hospira, Inc. (a) | | 37,400 | | 1,957,142 |
Medtronic, Inc. | | 63,100 | | 2,738,540 |
Stryker Corp. | | 1,100 | | 58,410 |
Zimmer Holdings, Inc. (a) | | 11,200 | | 642,096 |
| | | | |
Health Care Equipment & Supplies Total | | 5,442,910 |
|
| Health Care Providers & Services – 4.2% |
Aetna, Inc. | | 10,300 | | 308,897 |
AmerisourceBergen Corp. | | 90,000 | | 2,523,600 |
Cardinal Health, Inc. | | 92,600 | | 3,145,622 |
Coventry Health Care, Inc. (a) | | 7,900 | | 183,122 |
Humana, Inc. (a) | | 74,900 | | 3,545,017 |
Laboratory Corp. of America Holdings (a) | | 1,600 | | 117,296 |
McKesson Corp. | | 14,000 | | 828,100 |
Medco Health Solutions, Inc. (a) | | 78,800 | | 4,983,312 |
Quest Diagnostics, Inc. | | 8,100 | | 459,675 |
UnitedHealth Group, Inc. | | 123,300 | | 4,174,938 |
WellPoint, Inc. (a) | | 27,100 | | 1,676,677 |
| | | | |
Health Care Providers & Services Total | | 21,946,256 |
| |
| Life Sciences Tools & Services – 0.3% | | |
Thermo Fisher Scientific, Inc. (a) | | 31,000 | | 1,511,870 |
| | | | |
Life Sciences Tools & Services Total | | | | 1,511,870 |
| | |
| Pharmaceuticals – 6.2% | | | | |
Abbott Laboratories | | 116,300 | | 6,312,764 |
Bristol-Myers Squibb Co. | | 89,700 | | 2,198,547 |
Eli Lilly & Co. | | 19,400 | | 666,196 |
Forest Laboratories, Inc. (a) | | 75,200 | | 2,246,976 |
Johnson & Johnson | | 144,600 | | 9,109,800 |
Merck & Co., Inc. | | 149,900 | | 5,528,312 |
Mylan, Inc. (a) | | 45,500 | | 970,970 |
Pfizer, Inc. | | 315,600 | | 5,538,780 |
| | | | |
Pharmaceuticals Total | | | | 32,572,345 |
| | | | |
Health Care Total | | | | 66,476,800 |
| | | | |
| Industrials – 10.6% | | | | |
| Aerospace & Defense – 3.4% | | | | |
General Dynamics Corp. | | 31,800 | | 2,307,090 |
Goodrich Corp. | | 100 | | 6,563 |
ITT Corp. | | 30,700 | | 1,572,761 |
Lockheed Martin Corp. | | 19,500 | | 1,516,320 |
Northrop Grumman Corp. | | 16,400 | | 1,004,664 |
Raytheon Co. | | 90,500 | | 5,089,720 |
United Technologies Corp. | | 94,800 | | 6,508,020 |
| | | | |
Aerospace & Defense Total | | | | 18,005,138 |
| | | | |
| | | Shares | | Value ($) |
| Air Freight & Logistics – 0.7% | | | | |
United Parcel Service, Inc., Class B | | 62,600 | | 3,677,124 |
| | | | |
Air Freight & Logistics Total | | | | 3,677,124 |
| |
| Commercial Services & Supplies – 0.4% | | |
Pitney Bowes, Inc. | | 2,700 | | 61,830 |
R.R. Donnelley & Sons Co. | | 36,900 | | 733,941 |
Waste Management, Inc. | | 30,700 | | 1,013,714 |
| | | | |
Commercial Services & Supplies Total | | 1,809,485 |
| | |
| Electrical Equipment – 1.1% | | | | |
Emerson Electric Co. | | 117,300 | | 5,552,982 |
Rockwell Automation, Inc. | | 900 | | 48,681 |
| | | | |
Electrical Equipment Total | | | | 5,601,663 |
| | |
Industrial Conglomerates – 2.7% | | | | |
3M Co. | | 50,600 | | 4,055,590 |
General Electric Co. (b) | | 636,000 | | 10,214,160 |
| | | | |
Industrial Conglomerates Total | | | | 14,269,750 |
| | |
Machinery – 1.8% | | | | |
Caterpillar, Inc. | | 13,600 | | 775,880 |
Danaher Corp. | | 9,100 | | 673,127 |
Dover Corp. | | 51,900 | | 2,348,994 |
Eaton Corp. | | 8,700 | | 592,644 |
Illinois Tool Works, Inc. | | 35,500 | | 1,615,960 |
Parker Hannifin Corp. | | 34,400 | | 2,074,664 |
Stanley Works | | 24,900 | | 1,425,525 |
| | | | |
Machinery Total | | | | 9,506,794 |
| | |
Professional Services – 0.1% | | | | |
Dun & Bradstreet Corp. | | 4,000 | | 280,640 |
| | | | |
Professional Services Total | | | | 280,640 |
| | |
Road & Rail – 0.2% | | | | |
Ryder System, Inc. | | 28,200 | | 995,178 |
| | | | |
Road & Rail Total | | | | 995,178 |
| |
Trading Companies & Distributors – 0.2% | | |
W.W. Grainger, Inc. | | 12,300 | | 1,250,295 |
| | | | |
Trading Companies & Distributors Total | | 1,250,295 |
| | | | |
Industrials Total | | | | 55,396,067 |
| | | | |
| Information Technology – 18.9% | | | | |
| Communications Equipment – 1.4% | | | | |
Cisco Systems, Inc. (a) | | 292,200 | | 7,109,226 |
Harris Corp. | | 6,900 | | 312,018 |
QUALCOMM, Inc. | | 300 | | 11,007 |
| | | | |
Communications Equipment Total | | | | 7,432,251 |
| | |
Computers & Peripherals – 7.4% | | | | |
Apple, Inc. (a) | | 49,900 | | 10,210,538 |
Dell, Inc. (a) | | 115,900 | | 1,533,357 |
See Accompanying Notes to Financial Statements.
34
Columbia Large Cap Enhanced Core Fund
February 28, 2010
Common Stocks (continued)
| | | | |
| | | Shares | | Value ($) |
| Information Technology (continued) | | | | |
| Computers & Peripherals (continued) | | |
EMC Corp. (a) | | 119,800 | | 2,095,302 |
Hewlett-Packard Co. | | 202,300 | | 10,274,817 |
International Business Machines Corp. | | 89,100 | | 11,329,956 |
QLogic Corp. (a) | | 5,100 | | 92,820 |
Teradata Corp. (a) | | 97,300 | | 2,966,677 |
Western Digital Corp. (a) | | 11,800 | | 455,834 |
| | | | |
Computers & Peripherals Total | | | | 38,959,301 |
|
Electronic Equipment, Instruments & Components – 0.0% |
Amphenol Corp., Class A | | 4,100 | | 170,765 |
| | | | |
Electronic Equipment, Instruments & Components Total | | 170,765 |
| |
Internet Software & Services – 1.8% | | |
eBay, Inc. (a) | | 103,500 | | 2,382,570 |
Google, Inc., Class A (a) | | 12,800 | | 6,743,040 |
| | | | |
Internet Software & Services Total | | 9,125,610 |
| | |
IT Services – 1.0% | | | | |
Cognizant Technology Solutions Corp., Class A (a) | | 31,400 | | 1,511,282 |
Computer Sciences Corp. (a) | | 60,100 | | 3,112,579 |
Western Union Co. | | 36,100 | | 569,658 |
| | | | |
IT Services Total | | | | 5,193,519 |
| | |
Office Electronics – 0.5% | | | | |
Xerox Corp. | | 277,500 | | 2,600,175 |
| | | | |
Office Electronics Total | | | | 2,600,175 |
|
Semiconductors & Semiconductor Equipment – 2.9% |
Intel Corp. | | 419,500 | | 8,612,335 |
Micron Technology, Inc. (a) | | 139,000 | | 1,259,340 |
Texas Instruments, Inc. | | 223,200 | | 5,441,616 |
| | | | |
Semiconductors & Semiconductor Equipment Total | | 15,313,291 |
| | |
Software – 3.9% | | | | |
Microsoft Corp. (b) | | 517,600 | | 14,834,416 |
Oracle Corp. | | 223,000 | | 5,496,950 |
| | | | |
Software Total | | | | 20,331,366 |
| | | | |
Information Technology Total | | | | 99,126,278 |
| | | | |
| Materials – 3.4% | | | | |
| Chemicals – 1.6% | | | | |
CF Industries Holdings, Inc. | | 2,600 | | 276,224 |
Dow Chemical Co. | | 14,500 | | 410,495 |
Eastman Chemical Co. | | 68,900 | | 4,102,995 |
PPG Industries, Inc. | | 61,300 | | 3,772,402 |
| | | | |
Chemicals Total | | | | 8,562,116 |
| | | | |
| | | Shares | | Value ($) |
| Metals & Mining – 1.0% | | | | |
Cliffs Natural Resources, Inc. | | 21,400 | | 1,206,960 |
Freeport-McMoRan Copper & Gold, Inc. | | 51,700 | | 3,885,772 |
| | | | |
Metals & Mining Total | | | | 5,092,732 |
| | |
| Paper & Forest Products – 0.8% | | | | |
International Paper Co. | | 176,900 | | 4,098,773 |
| | | | |
Paper & Forest Products Total | | | | 4,098,773 |
| | | | |
Materials Total | | | | 17,753,621 |
| | | | |
| Telecommunication Services – 2.9% | | |
| Diversified Telecommunication Services – 2.6% |
AT&T, Inc. | | 308,800 | | 7,661,328 |
Qwest Communications International, Inc. | | 256,800 | | 1,171,008 |
Verizon Communications, Inc. | | 176,300 | | 5,100,359 |
| | | | |
Diversified Telecommunication Services Total | | 13,932,695 |
|
| Wireless Telecommunication Services – 0.3% |
Sprint Nextel Corp. (a) | | 406,600 | | 1,353,978 |
| | | | |
Wireless Telecommunication Services Total | | 1,353,978 |
| | | | |
Telecommunication Services Total | | 15,286,673 |
| | | | |
| Utilities – 3.4% | | | | |
| Electric Utilities – 1.1% | | | | |
Edison International | | 8,200 | | 267,566 |
Entergy Corp. | | 9,900 | | 752,103 |
Exelon Corp. | | 34,600 | | 1,498,180 |
FirstEnergy Corp. | | 44,100 | | 1,704,465 |
Pinnacle West Capital Corp. | | 43,000 | | 1,565,630 |
| | | | |
Electric Utilities Total | | | | 5,787,944 |
| | |
| Gas Utilities – 0.7% | | | | |
Questar Corp. | | 82,900 | | 3,480,971 |
| | | | |
Gas Utilities Total | | | | 3,480,971 |
|
| Independent Power Producers & Energy Traders – 0.8% |
AES Corp. (a) | | 339,900 | | 3,973,431 |
Constellation Energy Group, Inc. | | 8,900 | | 312,123 |
| | | | |
Independent Power Producers & Energy Traders Total | | | | 4,285,554 |
| | |
| Multi-Utilities – 0.8% | | | | |
DTE Energy Co. | | 11,400 | | 494,988 |
NiSource, Inc. | | 60,200 | | 904,204 |
See Accompanying Notes to Financial Statements.
35
Columbia Large Cap Enhanced Core Fund
February 28, 2010
Common Stocks (continued)
| | | | | |
| | | Shares | | Value ($) | |
| Utilities (continued) | | | | | |
| Multi-Utilities (continued) | |
Public Service Enterprise Group, Inc. | | 92,500 | | 2,749,100 | |
| | | | | |
Multi-Utilities Total | | | | 4,148,292 | |
| | | | | |
Utilities Total | | | | 17,702,761 | |
| | | | | |
Total Common Stocks
(cost of $399,926,964) | | 516,732,371 | |
| | |
Short-Term Obligation – 1.6% | | | | | |
| | | Par ($) | | | |
Repurchase agreement with Fixed Income Clearing Corp., dated 02/26/10, due 03/01/10 at 0.050%, collateralized by a U.S. Government Agency obligation maturing 08/24/12, market value $8,332,875 (repurchase proceeds $8,166,034) | | 8,166,000 | | 8,166,000 | |
| | | | | |
Total Short-Term Obligation (cost of $8,166,000) | | | | 8,166,000 | |
| | | | | |
Total Investments – 100.1% (cost of $408,092,964) (c) | | | | 524,898,371 | |
| | | | | |
Other Assets & Liabilities, Net – (0.1)% | | (286,303 | ) |
| | | | | |
Net Assets – 100.0% | | | | 524,612,068 | |
Notes to Investment Portfolio:
| (a) | Non-income producing security. |
| (b) | A portion of these securities with a market value of $6,145,900 is pledged as collateral for open futures contracts. |
| (c) | Cost for federal income tax purposes is $415,004,186. |
The following table summarizes the inputs used, as of February 28, 2010, in valuing the Fund’s assets:
| | | | | | | | | | | | |
Description | | Quoted Prices
(Level 1) | | Other
Significant
Observable
Inputs
(Level 2) | | Significant
Unobservable
Inputs
(Level 3) | | Total |
Total Common Stocks | | $ | 516,732,371 | | $ | — | | $ | — | | $ | 516,732,371 |
| | | | | | | | | | | | |
Total Short-Term Obligation | | | — | | | 8,166,000 | | | — | | | 8,166,000 |
| | | | | | | | | | | | |
Total Investments | | | 516,732,371 | | | 8,166,000 | | | — | | | 524,898,371 |
| | | | | | | | | | | | |
Unrealized appreciation on futures contracts | | | 233,123 | | | — | | | — | | | 233,123 |
| | | | | | | | | | | | |
Total | | $ | 516,965,494 | | $ | 8,166,000 | | $ | — | | $ | 525,131,494 |
| | | | | | | | | | | | |
The following table reconciles asset balances for the year ended February 28, 2010, in which significant unobservable inputs (Level 3) were used in determining value:
| | | | | | | | | | | | | | | | | | | | |
Invest
ments in
Securities | | Balance as of
February 28,
2009 | | Realized
Gain/
(Loss) | | Change in
Unrealized
Appreciation
(Depre-
ciation) | | | Net Purchases (Sales) | | | Net
Transfers
into
(out of)
Level 3 | | Balance
as of
February 28,
2010 |
Common Stocks | | $ | 972 | | $ | 9,919 | | $ | (972 | ) | | $ | (9,919 | ) | | $ | — | | $ | — |
The information in the above reconciliation represents fiscal year to date activity for any securities identified as using Level 3 inputs at either the beginning or the end of the current fiscal period.
For more information on valuation inputs, and their aggregation into the levels used in the tables above, please refer to the Security Valuation section in the accompanying Notes to Financial Statements.
At February 28, 2010, the Fund held the following open long futures contracts:
| | | | | | | | | | | | | |
Risk
Exposure/
Type | | Number of
Contracts | | Value | | Aggregate
Face Value | | Expiration
Date | | Unrealized
Appreciation |
Equity Risk S&P 500 Index | | 32 | | $ | 8,827,200 | | $ | 8,594,077 | | March-2010 | | $ | 233,123 |
| | | | | | | | | | | | | |
At February 28, 2010, the Fund held investments in the following sectors:
| | | |
Sector (Unaudited) | | % of
Net Assets | |
Information Technology | | 18.9 | |
Financials | | 14.3 | |
Health Care | | 12.7 | |
Consumer Staples | | 11.3 | |
Energy | | 11.1 | |
Industrials | | 10.6 | |
Consumer Discretionary | | 9.9 | |
Materials | | 3.4 | |
Utilities | | 3.4 | |
Telecommunication Services | | 2.9 | |
| | | |
| | 98.5 | |
Short-Term Obligation | | 1.6 | |
Other Assets & Liabilities, Net | | (0.1 | ) |
| | | |
| | 100.0 | |
| | | |
See Accompanying Notes to Financial Statements.
36
Investment Portfolio – Columbia Mid Cap Index Fund
February 28, 2010
Common Stocks – 97.9%
| | | | |
| | | Shares | | Value ($) |
| Consumer Discretionary – 14.1% | | | | |
| Auto Components – 0.8% | | | | |
BorgWarner, Inc. (a) | | 245,100 | | 9,181,446 |
Gentex Corp. | | 289,350 | | 5,616,284 |
| | | | |
Auto Components Total | | | | 14,797,730 |
| | |
Automobiles – 0.1% | | | | |
Thor Industries, Inc. | | 74,525 | | 2,528,633 |
| | | | |
Automobiles Total | | | | 2,528,633 |
| | |
Distributors – 0.3% | | | | |
LKQ Corp. (a) | | 296,900 | | 5,685,635 |
| | | | |
Distributors Total | | | | 5,685,635 |
| |
Diversified Consumer Services – 1.9% | | |
Brink’s Home Security Holdings, Inc. (a) | | 96,175 | | 4,024,924 |
Career Education Corp. (a) | | 147,150 | | 4,093,713 |
Corinthian Colleges, Inc. (a) | | 183,900 | | 2,982,858 |
ITT Educational Services, Inc. (a) | | 65,125 | | 7,101,230 |
Matthews International Corp., Class A | | 63,700 | | 2,135,224 |
Regis Corp. | | 119,875 | | 1,981,534 |
Service Corp. International | | 531,900 | | 4,287,114 |
Sotheby’s | | 140,425 | | 3,412,327 |
Strayer Education, Inc. | | 29,400 | | 6,668,802 |
| | | | |
Diversified Consumer Services Total | | 36,687,726 |
| |
Hotels, Restaurants & Leisure – 2.2% | | |
Bally Technologies, Inc. (a) | | 115,200 | | 4,770,432 |
Bob Evans Farms, Inc. | | 65,125 | | 1,856,713 |
Boyd Gaming Corp. (a) | | 115,700 | | 883,948 |
Brinker International, Inc. | | 215,162 | | 3,896,584 |
Burger King Holdings, Inc. | | 193,000 | | 3,452,770 |
Cheesecake Factory, Inc. (a) | | 126,500 | | 2,991,725 |
Chipotle Mexican Grill, Inc., Class A (a) | | 66,500 | | 6,963,215 |
International Speedway Corp., Class A | | 64,325 | | 1,718,121 |
Life Time Fitness, Inc. (a) | | 86,900 | | 2,203,784 |
Panera Bread Co., Class A (a) | | 66,200 | | 4,818,698 |
Scientific Games Corp., Class A (a) | | 136,400 | | 2,303,796 |
Wendy’s/Arby’s Group, Inc., Class A | | 758,200 | | 3,700,016 |
WMS Industries, Inc. (a) | | 110,900 | | 4,206,437 |
| | | | |
Hotels, Restaurants & Leisure Total | | 43,766,239 |
| |
Household Durables – 1.8% | | |
American Greetings Corp., Class A | | 82,850 | | 1,579,950 |
KB Home | | 155,300 | | 2,528,284 |
M.D.C. Holdings, Inc. | | 78,900 | | 2,699,958 |
Mohawk Industries, Inc. (a) | | 117,850 | | 6,078,703 |
| | | | |
| | | Shares | | Value ($) |
NVR, Inc. (a) | | 12,417 | | 8,794,961 |
Ryland Group, Inc. | | 91,950 | | 2,086,345 |
Toll Brothers, Inc. (a) | | 287,850 | | 5,420,215 |
Tupperware Brands Corp. | | 133,475 | | 6,237,287 |
| | | | |
Household Durables Total | | | | 35,425,703 |
| |
Internet & Catalog Retail – 0.3% | | |
NetFlix, Inc. (a) | | 90,600 | | 5,984,130 |
| | | | |
Internet & Catalog Retail Total | | | | 5,984,130 |
| |
Media – 0.8% | | |
DreamWorks Animation SKG, Inc., Class A (a) | | 158,500 | | 6,888,410 |
Harte-Hanks, Inc. | | 80,125 | | 952,686 |
John Wiley & Sons, Inc., Class A | | 89,800 | | 3,769,804 |
Lamar Advertising Co., Class A (a) | | 111,900 | | 3,365,952 |
Scholastic Corp. | | 53,500 | | 1,572,900 |
| | | | |
Media Total | | | | 16,549,752 |
| |
Multiline Retail – 0.7% | | |
99 Cents Only Stores (a) | | 95,451 | | 1,574,942 |
Dollar Tree, Inc. (a) | | 185,250 | | 10,325,835 |
Saks, Inc. (a) | | 334,975 | | 2,338,125 |
| | | | |
Multiline Retail Total | | | | 14,238,902 |
| |
Specialty Retail – 4.1% | | |
Aaron’s, Inc. | | 114,000 | | 3,382,380 |
Advance Auto Parts, Inc. | | 198,700 | | 8,106,960 |
Aeropostale, Inc. (a) | | 138,725 | | 4,905,316 |
American Eagle Outfitters, Inc. | | 436,199 | | 7,358,677 |
AnnTaylor Stores Corp. (a) | | 123,325 | | 2,122,423 |
Barnes & Noble, Inc. | | 83,150 | | 1,668,821 |
CarMax, Inc. (a) | | 465,650 | | 9,401,473 |
Chico’s FAS, Inc. (a) | | 373,600 | | 5,062,280 |
Coldwater Creek, Inc. (a) | | 121,700 | | 631,623 |
Collective Brands, Inc. (a) | | 134,600 | | 3,041,960 |
Dick’s Sporting Goods, Inc. (a) | | 187,700 | | 4,566,741 |
Foot Locker, Inc. | | 328,325 | | 4,258,375 |
Guess ?, Inc. | | 121,900 | | 4,972,301 |
J Crew Group, Inc. (a) | | 117,500 | | 4,944,400 |
PETsMART, Inc. | | 259,400 | | 7,060,868 |
Rent-A-Center, Inc. (a) | | 138,825 | | 3,087,468 |
Williams-Sonoma, Inc. | | 221,925 | | 4,762,511 |
| | | | |
Specialty Retail Total | | 79,334,577 |
|
Textiles, Apparel & Luxury Goods – 1.1% |
Fossil, Inc. (a) | | 100,900 | | 3,657,625 |
Hanesbrands, Inc. (a) | | 199,800 | | 5,180,814 |
Phillips-Van Heusen Corp. | | 108,400 | | 4,717,568 |
Timberland Co., Class A (a) | | 92,950 | | 1,718,646 |
Under Armour, Inc., Class A (a) | | 79,000 | | 2,058,740 |
See Accompanying Notes to Financial Statements.
37
Columbia Mid Cap Index Fund
February 28, 2010
Common Stocks (continued)
| | | | |
| | | Shares | | Value ($) |
| Consumer Discretionary (continued) |
| Textiles, Apparel & Luxury Goods (continued) |
Warnaco Group, Inc. (a) | | 95,600 | | 3,990,344 |
| | | | |
Textiles, Apparel & Luxury Goods Total | | 21,323,737 |
| | | | |
Consumer Discretionary Total | | 276,322,764 |
| | | | |
| Consumer Staples – 3.9% |
| Beverages – 0.3% |
Hansen Natural Corp. (a) | | 149,600 | | 6,223,360 |
| | | | |
Beverages Total | | 6,223,360 |
|
Food & Staples Retailing – 0.3% |
BJ’s Wholesale Club, Inc. (a) | | 116,850 | | 4,226,465 |
Ruddick Corp. | | 85,650 | | 2,509,545 |
| | | | |
Food & Staples Retailing Total | | 6,736,010 |
|
Food Products – 1.7% |
Corn Products International, Inc. | | 157,100 | | 5,118,318 |
Flowers Foods, Inc. | | 162,300 | | 4,137,027 |
Green Mountain Coffee Roasters, Inc. (a) | | 73,300 | | 6,185,787 |
Lancaster Colony Corp. | | 40,825 | | 2,349,071 |
Ralcorp Holdings, Inc. (a) | | 119,000 | | 7,950,390 |
Smithfield Foods, Inc. (a) | | 295,625 | | 5,087,706 |
Tootsie Roll Industries, Inc. | | 55,016 | | 1,496,985 |
| | | | |
Food Products Total | | 32,325,284 |
|
Household Products – 0.9% |
Church & Dwight Co., Inc. | | 147,700 | | 9,922,486 |
Energizer Holdings, Inc. (a) | | 146,475 | | 8,488,226 |
| | | | |
Household Products Total | | 18,410,712 |
|
Personal Products – 0.6% |
Alberto-Culver Co. | | 179,300 | | 4,970,196 |
NBTY, Inc. (a) | | 129,900 | | 5,897,460 |
| | | | |
Personal Products Total | | 10,867,656 |
|
Tobacco – 0.1% |
Universal Corp. | | 51,825 | | 2,749,316 |
| | | | |
Tobacco Total | | 2,749,316 |
| | | | |
Consumer Staples Total | | 77,312,338 |
| | | | |
| Energy – 6.3% |
| Energy Equipment & Services – 2.2% |
Atwood Oceanics, Inc. (a) | | 118,700 | | 3,971,702 |
Exterran Holdings, Inc. (a) | | 131,199 | | 2,984,777 |
Helix Energy Solutions Group, Inc. (a) | | 192,700 | | 2,217,977 |
Oceaneering International, Inc. (a) | | 115,200 | | 6,963,840 |
| | | | |
| | | Shares | | Value ($) |
Patterson-UTI Energy, Inc. | | 322,425 | | 4,978,242 |
Pride International, Inc. (a) | | 366,325 | | 10,249,773 |
Superior Energy Services, Inc. (a) | | 164,200 | | 3,394,014 |
Tidewater, Inc. | | 108,575 | | 4,839,188 |
Unit Corp. (a) | | 84,800 | | 3,686,256 |
| | | | |
Energy Equipment & Services Total | | 43,285,769 |
|
Oil, Gas & Consumable Fuels – 4.1% |
Arch Coal, Inc. | | 341,050 | | 7,670,215 |
Bill Barrett Corp. (a) | | 81,200 | | 2,753,492 |
Cimarex Energy Co. | | 175,300 | | 10,475,928 |
Comstock Resources, Inc. (a) | | 97,900 | | 3,379,508 |
Encore Acquisition Co. (a) | | 116,600 | | 5,775,198 |
Forest Oil Corp. (a) | | 235,750 | | 6,388,825 |
Frontier Oil Corp. | | 219,700 | | 2,722,083 |
Mariner Energy, Inc. (a) | | 213,700 | | 3,209,774 |
Newfield Exploration Co. (a) | | 278,900 | | 14,243,423 |
Overseas Shipholding Group, Inc. | | 49,025 | | 2,181,122 |
Patriot Coal Corp. (a) | | 157,400 | | 2,622,284 |
Plains Exploration & Production Co. (a) | | 292,425 | | 9,594,464 |
Quicksilver Resources, Inc. (a) | | 248,500 | | 3,707,620 |
Southern Union Co. | | 260,500 | | 6,236,370 |
| | | | |
Oil, Gas & Consumable Fuels Total | | 80,960,306 |
| | | | |
Energy Total | | 124,246,075 |
| | | | |
| Financials – 19.2% |
| Capital Markets – 2.1% |
Affiliated Managers Group, Inc. (a) | | 88,300 | | 6,280,779 |
Apollo Investment Corp. | | 365,700 | | 4,264,062 |
Eaton Vance Corp. | | 246,600 | | 7,444,854 |
Jefferies Group, Inc. | | 250,650 | | 6,256,224 |
Raymond James Financial, Inc. | | 207,280 | | 5,360,261 |
SEI Investments Co. | | 271,900 | | 4,790,878 |
Waddell & Reed Financial, Inc., Class A | | 179,150 | | 5,890,452 |
| | | | |
Capital Markets Total | | | | 40,287,510 |
| |
Commercial Banks – 3.6% | | |
Associated Banc Corp. | | 350,262 | | 4,521,882 |
Bancorpsouth, Inc. | | 154,200 | | 3,002,274 |
Bank of Hawaii Corp. | | 100,675 | | 4,249,492 |
Cathay General Bancorp | | 157,200 | | 1,529,556 |
City National Corp. | | 90,850 | | 4,535,232 |
Commerce Bancshares, Inc. | | 153,073 | | 6,200,987 |
Cullen/Frost Bankers, Inc. | | 125,850 | | 6,814,778 |
FirstMerit Corp. | | 180,174 | | 3,808,878 |
Fulton Financial Corp. | | 370,000 | | 3,559,400 |
International Bancshares Corp. | | 108,900 | | 2,308,680 |
See Accompanying Notes to Financial Statements.
38
Columbia Mid Cap Index Fund
February 28, 2010
Common Stocks (continued)
| | | | |
| | | Shares | | Value ($) |
| Financials (continued) |
| Commercial Banks (continued) | | |
PacWest Bancorp | | 62,500 | | 1,268,750 |
Prosperity Bancshares, Inc. | | 97,400 | | 4,074,242 |
SVB Financial Group (a) | | 86,100 | | 3,836,616 |
Synovus Financial Corp. | | 1,008,500 | | 2,874,225 |
TCF Financial Corp. | | 254,825 | | 3,679,673 |
Trustmark Corp. | | 117,400 | | 2,676,720 |
Valley National Bancorp | | 310,395 | | 4,469,688 |
Webster Financial Corp. | | 134,975 | | 2,159,600 |
Westamerica Bancorporation | | 61,350 | | 3,366,888 |
Wilmington Trust Corp. | | 185,325 | | 2,672,387 |
| | | | |
Commercial Banks Total | | | | 71,609,948 |
| |
Consumer Finance – 0.2% | | |
AmeriCredit Corp. (a) | | 201,650 | | 4,486,712 |
| | | | |
Consumer Finance Total | | | | 4,486,712 |
| |
Diversified Financial Services – 0.3% | | |
MSCI, Inc., Class A (a) | | 217,200 | | 6,511,656 |
| | | | |
Diversified Financial Services Total | | 6,511,656 |
| |
Insurance – 4.3% | | |
American Financial Group, Inc. | | 165,950 | | 4,293,127 |
Arthur J. Gallagher & Co. | | 213,700 | | 5,071,101 |
Brown & Brown, Inc. | | 247,450 | �� | 4,152,211 |
Everest Re Group Ltd. | | 126,725 | | 10,824,849 |
Fidelity National Financial, Inc., Class A | | 483,700 | | 6,892,725 |
First American Corp. | | 211,025 | | 6,801,336 |
Hanover Insurance Group, Inc. | | 105,075 | | 4,428,911 |
HCC Insurance Holdings, Inc. | | 236,175 | | 6,589,282 |
Horace Mann Educators Corp. | | 82,250 | | 1,105,440 |
Mercury General Corp. | | 74,700 | | 3,067,182 |
Old Republic International Corp. | | 505,233 | | 5,704,081 |
Protective Life Corp. | | 179,700 | | 3,299,292 |
Reinsurance Group of America, Inc. | | 152,800 | | 7,262,584 |
Stancorp Financial Group, Inc. | | 103,150 | | 4,433,387 |
Unitrin, Inc. | | 104,775 | | 2,531,364 |
W.R. Berkley Corp. | | 283,470 | | 7,296,518 |
| | | | |
Insurance Total | | | | 83,753,390 |
|
Real Estate Investment Trusts (REITs) – 6.9% |
Alexandria Real Estate Equities, Inc. | | 92,700 | | 5,712,174 |
AMB Property Corp. | | 307,125 | | 7,475,422 |
BRE Properties, Inc. | | 114,100 | | 3,846,311 |
Camden Property Trust | | 134,700 | | 5,394,735 |
Corporate Office Properties Trust SBI MD | | 122,300 | | 4,504,309 |
Cousins Properties, Inc. | | 209,453 | | 1,505,967 |
| | | | |
| | | Shares | | Value ($) |
Duke Realty Corp. | | 470,300 | | 5,220,330 |
Equity One, Inc. | | 69,000 | | 1,274,430 |
Essex Property Trust, Inc. | | 61,100 | | 5,248,490 |
Federal Realty Investment Trust | | 128,500 | | 8,861,360 |
Highwoods Properties, Inc. | | 149,200 | | 4,334,260 |
Hospitality Properties Trust | | 258,975 | | 5,689,681 |
Liberty Property Trust | | 236,425 | | 7,312,625 |
Macerich Co. | | 202,512 | | 7,217,528 |
Mack-Cali Realty Corp. | | 165,075 | | 5,536,616 |
Nationwide Health Properties, Inc. | | 235,600 | | 7,819,564 |
OMEGA Healthcare Investors, Inc. | | 178,700 | | 3,389,939 |
Potlatch Corp. | | 83,531 | | 2,758,194 |
Rayonier, Inc. | | 166,785 | | 6,933,252 |
Realty Income Corp. | | 218,900 | | 6,129,200 |
Regency Centers Corp. | | 168,600 | | 5,845,362 |
Senior Housing Properties Trust | | 267,400 | | 5,559,246 |
SL Green Realty Corp. | | 162,100 | | 8,276,826 |
UDR, Inc. | | 320,840 | | 5,390,112 |
Weingarten Realty Investors | | 218,800 | | 4,505,092 |
| | | | |
Real Estate Investment Trusts (REITs) Total | | 135,741,025 |
|
| Real Estate Management & Development – 0.3% |
Jones Lang LaSalle, Inc. | | 87,800 | | 5,591,982 |
| | | | |
Real Estate Management & Development Total | | | | 5,591,982 |
| |
| Thrifts & Mortgage Finance – 1.5% | | |
Astoria Financial Corp. | | 171,100 | | 2,270,497 |
First Niagara Financial Group, Inc. | | 395,063 | | 5,546,685 |
New York Community Bancorp, Inc. | | 873,003 | | 13,522,816 |
NewAlliance Bancshares, Inc. | | 222,600 | | 2,666,748 |
Washington Federal, Inc. | | 235,727 | | 4,594,319 |
| | | | |
Thrifts & Mortgage Finance Total | | | | 28,601,065 |
| | | | |
Financials Total | | | | 376,583,288 |
| | | | |
| Health Care – 12.2% | | | | |
| Biotechnology – 1.4% |
OSI Pharmaceuticals, Inc. (a) | | 121,900 | | 4,512,738 |
United Therapeutics Corp. (a) | | 99,500 | | 5,712,295 |
Vertex Pharmaceuticals, Inc. (a) | | 404,475 | | 16,425,730 |
| | | | |
Biotechnology Total | | | | 26,650,763 |
| |
| Health Care Equipment & Supplies – 3.9% | | |
Beckman Coulter, Inc. | | 145,500 | | 9,538,980 |
Edwards Lifesciences Corp. (a) | | 118,750 | | 10,904,812 |
See Accompanying Notes to Financial Statements.
39
Columbia Mid Cap Index Fund
February 28, 2010
Common Stocks (continued)
| | | | |
| | | Shares | | Value ($) |
| Health Care (continued) | | | | |
| Health Care Equipment & Supplies (continued) |
Gen-Probe, Inc. (a) | | 103,100 | | 4,647,748 |
Hill-Rom Holdings, Inc. | | 131,600 | | 3,453,184 |
Hologic, Inc. (a) | | 541,600 | | 9,342,600 |
IDEXX Laboratories, Inc. (a) | | 123,000 | | 6,495,630 |
Immucor, Inc. (a) | | 147,200 | | 2,845,376 |
Kinetic Concepts, Inc. (a) | | 130,100 | | 5,453,792 |
Masimo Corp. (a) | | 109,000 | | 3,018,210 |
ResMed, Inc. (a) | | 157,400 | | 8,984,392 |
STERIS Corp. | | 123,325 | | 3,898,303 |
Teleflex, Inc. | | 83,450 | | 5,085,443 |
Thoratec Corp. (a) | | 119,400 | | 3,444,690 |
| | | | |
Health Care Equipment & Supplies Total | | 77,113,160 |
| |
| Health Care Providers & Services – 3.2% | | |
Community Health Systems, Inc. (a) | | 195,150 | | 6,687,791 |
Health Management Associates, Inc., Class A (a) | | 521,400 | | 3,801,006 |
Health Net, Inc. (a) | | 218,225 | | 5,038,815 |
Henry Schein, Inc. (a) | | 189,950 | | 10,794,858 |
Kindred Healthcare, Inc. (a) | | 82,000 | | 1,428,440 |
LifePoint Hospitals, Inc. (a) | | 115,000 | | 3,507,500 |
Lincare Holdings, Inc. (a) | | 143,000 | | 5,742,880 |
Omnicare, Inc. | | 250,525 | | 6,781,712 |
Owens & Minor, Inc. | | 87,900 | | 3,924,735 |
Psychiatric Solutions, Inc. (a) | | 118,100 | | 2,533,245 |
Universal Health Services, Inc., Class B | | 206,600 | | 6,408,732 |
VCA Antech, Inc. (a) | | 179,400 | | 4,273,308 |
WellCare Health Plans, Inc. (a) | | 88,800 | | 2,370,960 |
| | | | |
Health Care Providers & Services Total | | 63,293,982 |
| |
| Health Care Technology – 0.6% | | |
Cerner Corp. (a) | | 142,200 | | 11,795,490 |
| | | | |
Health Care Technology Total | | | | 11,795,490 |
| |
| Life Sciences Tools & Services – 2.0% | | |
Affymetrix, Inc. (a) | | 149,200 | | 1,090,652 |
Bio-Rad Laboratories, Inc., Class A (a) | | 40,400 | | 3,772,956 |
Charles River Laboratories International, Inc. (a) | | 138,350 | | 5,246,232 |
Covance, Inc. (a) | | 134,450 | | 7,612,559 |
Mettler-Toledo International, Inc. (a) | | 70,900 | | 7,048,169 |
Pharmaceutical Product Development, Inc. | | 248,100 | | 5,224,986 |
Techne Corp. | | 78,200 | | 4,998,544 |
Varian, Inc. (a) | | 60,650 | | 3,134,392 |
| | | | |
Life Sciences Tools & Services Total | | 38,128,490 |
| | | | |
| | | Shares | | Value ($) |
| Pharmaceuticals – 1.1% | | |
Endo Pharmaceuticals Holdings, Inc. (a) | | 246,200 | | 5,601,050 |
Medicis Pharmaceutical Corp., Class A | | 124,900 | | 2,810,250 |
Perrigo Co. | | 168,925 | | 8,373,612 |
Valeant Pharmaceuticals International (a) | | 141,775 | | 5,276,866 |
| | | | |
Pharmaceuticals Total | | | | 22,061,778 |
| | | | |
Health Care Total | | | | 239,043,663 |
| | | | |
| Industrials – 14.0% | | | | |
| Aerospace & Defense – 0.6% | | |
Alliant Techsystems, Inc. (a) | | 69,175 | | 5,495,954 |
BE Aerospace, Inc. (a) | | 212,200 | | 5,495,980 |
| | | | |
Aerospace & Defense Total | | | | 10,991,934 |
| |
| Airlines – 0.3% | | |
AirTran Holdings, Inc. (a) | | 282,450 | | 1,361,409 |
Alaska Air Group, Inc. (a) | | 74,050 | | 2,591,750 |
JetBlue Airways Corp. (a) | | 432,780 | | 2,285,078 |
| | | | |
Airlines Total | | | | 6,238,237 |
| | |
Building Products – 0.2% | | | | |
Lennox International, Inc. | | 102,200 | | 4,312,840 |
| | | | |
Building Products Total | | | | 4,312,840 |
| |
Commercial Services & Supplies – 1.6% | | |
Brink’s Co. | | 100,475 | | 2,560,103 |
Clean Harbors, Inc. (a) | | 47,900 | | 2,722,636 |
Copart, Inc. (a) | | 141,175 | | 5,037,124 |
Corrections Corp. of America (a) | | 242,500 | | 5,189,500 |
Deluxe Corp. | | 107,500 | | 1,929,625 |
Herman Miller, Inc. | | 117,325 | | 2,135,315 |
HNI Corp. | | 94,525 | | 2,246,860 |
Mine Safety Appliances Co. | | 63,400 | | 1,609,726 |
Rollins, Inc. | | 91,477 | | 1,943,886 |
Waste Connections, Inc. (a) | | 165,200 | | 5,554,024 |
| | | | |
Commercial Services & Supplies Total | | 30,928,799 |
|
Construction & Engineering – 1.5% |
Aecom Technology Corp. (a) | | 236,400 | | 6,406,440 |
Granite Construction, Inc. | | 70,575 | | 1,949,987 |
KBR, Inc. | | 336,600 | | 6,970,986 |
Shaw Group, Inc. (a) | | 175,700 | | 6,096,790 |
URS Corp. (a) | | 176,200 | | 8,193,300 |
| | | | |
Construction & Engineering Total | | | | 29,617,503 |
| | |
Electrical Equipment – 1.3% | | | | |
AMETEK, Inc. | | 226,425 | | 8,839,632 |
Hubbell, Inc., Class B | | 124,025 | | 5,810,571 |
See Accompanying Notes to Financial Statements.
40
Columbia Mid Cap Index Fund
February 28, 2010
Common Stocks (continued)
| | | | |
| | | Shares | | Value ($) |
| Industrials (continued) | | | | |
| Electrical Equipment (continued) | | | | |
Regal-Beloit Corp. | | 77,300 | | 4,361,266 |
Thomas & Betts Corp. (a) | | 109,900 | | 3,967,390 |
Woodward Governor Co. | | 119,100 | | 3,428,889 |
| | | | |
Electrical Equipment Total | | | | 26,407,748 |
| | |
Industrial Conglomerates – 0.2% | | | | |
Carlisle Companies, Inc. | | 128,600 | | 4,410,980 |
| | | | |
Industrial Conglomerates Total | | | | 4,410,980 |
| | |
Machinery – 5.3% | | | | |
AGCO Corp. (a) | | 194,075 | | 6,647,069 |
Bucyrus International, Inc. | | 157,700 | | 9,865,712 |
Crane Co. | | 98,200 | | 3,109,994 |
Donaldson Co., Inc. | | 162,200 | | 6,692,372 |
Federal Signal Corp. | | 102,325 | | 784,833 |
Graco, Inc. | | 125,887 | | 3,450,563 |
Harsco Corp. | | 168,600 | | 5,061,372 |
IDEX Corp. | | 169,700 | | 5,260,700 |
Joy Global, Inc. | | 214,800 | | 10,911,840 |
Kennametal, Inc. | | 170,900 | | 4,451,945 |
Lincoln Electric Holdings, Inc. | | 89,300 | | 4,259,610 |
Nordson Corp. | | 70,525 | | 4,640,545 |
Oshkosh Corp. (a) | | 187,800 | | 7,158,936 |
Pentair, Inc. | | 206,475 | | 6,722,826 |
SPX Corp. | | 103,525 | | 6,158,702 |
Terex Corp. (a) | | 226,900 | | 4,417,743 |
Timken Co. | | 166,700 | | 4,372,541 |
Trinity Industries, Inc. | | 166,400 | | 2,800,512 |
Valmont Industries, Inc. | | 41,900 | | 2,983,280 |
Wabtec Corp. | | 99,900 | | 3,810,186 |
| | | | |
Machinery Total | | | | 103,561,281 |
| | |
Marine – 0.3% | | | | |
Alexander & Baldwin, Inc. | | 86,200 | | 2,773,916 |
Kirby Corp. (a) | | 113,000 | | 3,730,130 |
| | | | |
Marine Total | | | | 6,504,046 |
| | |
Professional Services – 1.1% | | | | |
Corporate Executive Board Co. | | 71,700 | | 1,640,496 |
FTI Consulting, Inc. (a) | | 108,800 | | 3,997,312 |
Korn/Ferry International (a) | | 95,825 | | 1,636,691 |
Manpower, Inc. | | 164,675 | | 8,484,056 |
Navigant Consulting, Inc. (a) | | 105,000 | | 1,221,150 |
Towers Watson & Co., Class A | | 89,500 | | 3,953,215 |
| | | | |
Professional Services Total | | | | 20,932,920 |
| | |
Road & Rail – 1.2% | | | | |
Con-way, Inc. | | 103,350 | | 3,357,842 |
J.B. Hunt Transport Services, Inc. | | 184,150 | | 6,533,642 |
Kansas City Southern (a) | | 201,500 | | 6,911,450 |
| | | | |
| | | Shares | | Value ($) |
Landstar System, Inc. | | 106,700 | | 4,256,263 |
Werner Enterprises, Inc. | | 91,943 | | 2,051,248 |
| | | | |
Road & Rail Total | | | | 23,110,445 |
| |
Trading Companies & Distributors – 0.4% | | |
GATX Corp. | | 96,775 | | 2,579,054 |
MSC Industrial Direct Co., Class A | | 92,300 | | 4,206,111 |
United Rentals, Inc. (a) | | 126,250 | | 953,187 |
| | | | |
Trading Companies & Distributors Total | | 7,738,352 |
| | | | |
Industrials Total | | | | 274,755,085 |
| | | | |
| Information Technology – 14.6% | | | | |
| Communications Equipment – 1.9% |
3Com Corp. (a) | | 823,300 | | 6,281,779 |
ADC Telecommunications, Inc. (a) | | 202,900 | | 1,286,386 |
Adtran, Inc. | | 117,375 | | 2,744,227 |
Ciena Corp. (a) | | 192,200 | | 2,756,148 |
CommScope, Inc. (a) | | 196,853 | | 5,017,783 |
F5 Networks, Inc. (a) | | 166,400 | | 9,285,120 |
Palm, Inc. (a) | | 347,100 | | 2,117,310 |
Plantronics, Inc. | | 103,125 | | 2,931,844 |
Polycom, Inc. (a) | | 177,200 | | 4,626,692 |
| | | | |
Communications Equipment Total | | 37,047,289 |
| |
Computers & Peripherals – 0.4% | | |
Diebold, Inc. | | 139,225 | | 4,031,956 |
NCR Corp. (a) | | 334,200 | | 4,217,604 |
| | | | |
Computers & Peripherals Total | | | | 8,249,560 |
|
Electronic Equipment, Instruments & Components – 2.4% |
Arrow Electronics, Inc. (a) | | 251,475 | | 7,094,110 |
Avnet, Inc. (a) | | 317,550 | | 8,767,555 |
Ingram Micro, Inc., Class A (a) | | 343,500 | | 6,079,950 |
Itron, Inc. (a) | | 84,200 | | 5,637,190 |
National Instruments Corp. | | 119,162 | | 3,767,902 |
Tech Data Corp. (a) | | 106,850 | | 4,577,454 |
Trimble Navigation Ltd. (a) | | 252,700 | | 6,790,049 |
Vishay Intertechnology, Inc. (a) | | 391,775 | | 4,015,694 |
| | | | |
Electronic Equipment, Instruments & Components Total | | 46,729,904 |
|
Internet Software & Services – 0.9% |
AOL, Inc. (a) | | 226,300 | | 5,607,714 |
Digital River, Inc. (a) | | 81,100 | | 2,132,119 |
Equinix, Inc. (a) | | 81,800 | | 7,727,646 |
ValueClick, Inc. (a) | | 179,800 | | 1,706,302 |
| | | | |
Internet Software & Services Total | | 17,173,781 |
See Accompanying Notes to Financial Statements.
41
Columbia Mid Cap Index Fund
February 28, 2010
Common Stocks (continued)
| | | | |
| | | Shares | | Value ($) |
| Information Technology (continued) | | | | |
| IT Services – 2.7% |
Acxiom Corp. (a) | | 165,975 | | 2,798,338 |
Alliance Data Systems Corp. (a) | | 109,725 | | 6,083,154 |
Broadridge Financial Solutions, Inc. | | 287,300 | | 6,044,792 |
Convergys Corp. (a) | | 258,200 | | 3,186,188 |
DST Systems, Inc. (a) | | 82,500 | | 3,170,475 |
Gartner, Inc. (a) | | 126,425 | | 3,007,651 |
Global Payments, Inc. | | 170,100 | | 7,281,981 |
Hewitt Associates, Inc., Class A (a) | | 174,700 | | 6,636,853 |
Lender Processing Services, Inc. | | 201,100 | | 7,677,998 |
Mantech International Corp., Class A (a) | | 46,700 | | 2,306,046 |
NeuStar, Inc., Class A (a) | | 156,100 | | 3,618,398 |
SRA International, Inc., Class A (a) | | 90,400 | | 1,723,024 |
| | | | |
IT Services Total | | | | 53,534,898 |
|
Office Electronics – 0.2% |
Zebra Technologies Corp., Class A (a) | | 123,475 | | 3,527,681 |
| | | | |
Office Electronics Total | | | | 3,527,681 |
|
Semiconductors & Semiconductor Equipment – 2.5% |
Atmel Corp. (a) | | 952,450 | | 4,295,550 |
Cree, Inc. (a) | | 217,575 | | 14,758,113 |
Fairchild Semiconductor International, Inc. (a) | | 260,150 | | 2,684,748 |
Integrated Device Technology, Inc. (a) | | 348,592 | | 1,906,798 |
International Rectifier Corp. (a) | | 149,675 | | 3,027,925 |
Intersil Corp., Class A | | 257,600 | | 3,822,784 |
Lam Research Corp. (a) | | 267,175 | | 9,059,904 |
RF Micro Devices, Inc. (a) | | 563,000 | | 2,370,230 |
Semtech Corp. (a) | | 129,400 | | 2,053,578 |
Silicon Laboratories, Inc. (a) | | 95,875 | | 4,356,560 |
| | | | |
Semiconductors & Semiconductor Equipment Total | | 48,336,190 |
|
Software – 3.6% |
ACI Worldwide, Inc. (a) | | 71,400 | | 1,302,336 |
Advent Software, Inc. (a) | | 32,925 | | 1,327,536 |
ANSYS, Inc. (a) | | 186,200 | | 8,166,732 |
Cadence Design Systems, Inc. (a) | | 564,275 | | 3,216,368 |
FactSet Research Systems, Inc. | | 88,400 | | 5,852,080 |
Fair Isaac Corp. | | 101,100 | | 2,321,256 |
Informatica Corp. (a) | | 187,800 | | 4,792,656 |
Jack Henry & Associates, Inc. | | 177,825 | | 4,015,289 |
Mentor Graphics Corp. (a) | | 206,375 | | 1,717,040 |
Micros Systems, Inc. (a) | | 167,300 | | 5,025,692 |
Parametric Technology Corp. (a) | | 247,500 | | 4,308,975 |
Quest Software, Inc. (a) | | 130,900 | | 2,205,665 |
| | | | |
| | | Shares | | Value ($) |
Rovi Corp. (a) | | 216,300 | | 7,246,050 |
Solera Holdings, Inc. | | 146,200 | | 4,994,192 |
Sybase, Inc. (a) | | 171,175 | | 7,598,458 |
Synopsys, Inc. (a) | | 305,925 | | 6,699,757 |
| | | | |
Software Total | | | | 70,790,082 |
| | | | |
Information Technology Total | | 285,389,385 |
| | | | |
| Materials – 6.5% | | | | |
| Chemicals – 3.5% | | | | |
Albemarle Corp. | | 192,450 | | 7,214,950 |
Ashland, Inc. | | 157,300 | | 7,405,684 |
Cabot Corp. | | 137,125 | | 3,984,852 |
Cytec Industries, Inc. | | 102,075 | | 4,355,540 |
Intrepid Potash, Inc. (a) | | 86,600 | | 2,383,232 |
Lubrizol Corp. | | 143,300 | | 11,322,133 |
Minerals Technologies, Inc. | | 39,300 | | 1,919,019 |
Olin Corp. | | 164,825 | | 2,886,086 |
RPM International, Inc. | | 271,100 | | 5,218,675 |
Scotts Miracle-Gro Co., Class A | | 94,650 | | 3,696,083 |
Sensient Technologies Corp. | | 102,700 | | 2,713,334 |
Terra Industries, Inc. | | 209,600 | | 8,629,232 |
Valspar Corp. | | 211,650 | | 5,790,744 |
| | | | |
Chemicals Total | | | | 67,519,564 |
| | |
Construction Materials – 0.4% | | | | |
Martin Marietta Materials, Inc. | | 93,675 | | 7,420,934 |
| | | | |
Construction Materials Total | | | | 7,420,934 |
| | |
Containers & Packaging – 1.4% | | | | |
AptarGroup, Inc. | | 141,900 | | 5,467,407 |
Greif, Inc., Class A | | 72,000 | | 3,689,280 |
Packaging Corp. of America | | 216,175 | | 5,144,965 |
Silgan Holdings, Inc. | | 56,200 | | 3,209,582 |
Sonoco Products Co. | | 210,000 | | 6,211,800 |
Temple-Inland, Inc. | | 224,400 | | 4,178,328 |
| | | | |
Containers & Packaging Total | | | | 27,901,362 |
| | |
Metals & Mining – 1.1% | | | | |
Carpenter Technology Corp. | | 92,500 | | 2,762,975 |
Commercial Metals Co. | | 236,500 | | 3,878,600 |
Reliance Steel & Aluminum Co. | | 134,300 | | 5,954,862 |
Steel Dynamics, Inc. | | 452,700 | | 7,392,591 |
Worthington Industries, Inc. | | 127,900 | | 2,025,936 |
| | | | |
Metals & Mining Total | | | | 22,014,964 |
| | |
| Paper & Forest Products – 0.1% | | | | |
Louisiana-Pacific Corp. (a) | | 261,500 | | 1,990,015 |
| | | | |
Paper & Forest Products Total | | | | 1,990,015 |
| | | | |
Materials Total | | | | 126,846,839 |
| | | | |
See Accompanying Notes to Financial Statements.
42
Columbia Mid Cap Index Fund
February 28, 2010
Common Stocks (continued)
| | | | |
| | | Shares | | Value ($) |
| Telecommunication Services – 0.8% |
| Diversified Telecommunication Services – 0.3% |
Cincinnati Bell, Inc. (a) | | 426,075 | | 1,261,182 |
tw telecom, Inc. (a) | | 313,700 | | 4,984,693 |
| | | | |
Diversified Telecommunication Services Total | | 6,245,875 |
|
Wireless Telecommunication Services – 0.5% |
Syniverse Holdings, Inc. (a) | | 145,700 | | 2,450,674 |
Telephone & Data Systems, Inc. | | 196,541 | | 6,134,045 |
| | | | |
Wireless Telecommunication Services Total | | 8,584,719 |
| | | | |
Telecommunication Services Total | | 14,830,594 |
| | | | |
| Utilities – 6.3% | | | | |
| Electric Utilities – 1.8% | | | | |
Cleco Corp. | | 127,000 | | 3,205,480 |
DPL, Inc. | | 251,425 | | 6,672,819 |
Great Plains Energy, Inc. | | 284,054 | | 5,059,002 |
Hawaiian Electric Industries, Inc. | | 193,300 | | 3,937,521 |
IDACORP, Inc. | | 100,000 | | 3,303,000 |
NV Energy, Inc. | | 492,700 | | 5,473,897 |
PNM Resources, Inc. | | 181,950 | | 2,223,429 |
Westar Energy, Inc. | | 228,925 | | 4,898,995 |
| | | | |
Electric Utilities Total | | | | 34,774,143 |
| | |
Gas Utilities – 2.3% | | | | |
AGL Resources, Inc. | | 162,525 | | 5,904,533 |
Atmos Energy Corp. | | 194,400 | | 5,338,224 |
Energen Corp. | | 150,600 | | 6,846,276 |
National Fuel Gas Co. | | 169,075 | | 8,409,791 |
ONEOK, Inc. | | 221,500 | | 9,819,095 |
UGI Corp. | | 228,400 | | 5,721,420 |
WGL Holdings, Inc. | | 105,225 | | 3,456,641 |
| | | | |
Gas Utilities Total | | | | 45,495,980 |
|
Independent Power Producers & Energy Traders – 0.2% |
Black Hills Corp. | | 81,600 | | 2,274,192 |
Dynegy, Inc., Class A (a) | | 1,059,100 | | 1,588,650 |
| | | | |
Independent Power Producers & Energy Traders Total | | 3,862,842 |
| | |
| Multi-Utilities – 1.8% | | | | |
Alliant Energy Corp. | | 232,275 | | 7,346,859 |
MDU Resources Group, Inc. | | 394,105 | | 8,055,506 |
NSTAR | | 224,200 | | 7,582,444 |
OGE Energy Corp. | | 203,150 | | 7,427,164 |
Vectren Corp. | | 170,400 | | 3,961,800 |
| | | | |
Multi-Utilities Total | | | | 34,373,773 |
| | | | | |
| | | Shares | | Value ($) | |
| Water Utilities – 0.2% | | | | | |
Aqua America, Inc. | | 286,074 | | 4,897,587 | |
| | | | | |
Water Utilities Total | | | | 4,897,587 | |
| | | | | |
Utilities Total | | | | 123,404,325 | |
| | | | | |
Total Common Stocks (cost of $1,773,613,791) | | | | 1,918,734,356 | |
| | |
Short-Term Obligation – 3.7% | | | | | |
| | | Par ($) | | | |
Repurchase agreement with Fixed Income Clearing Corp., dated 02/26/10 due 03/01/10 at 0.050%, collateralized by a U.S. Government Agency obligation maturing 10/01/12, market value $73,669,400 (repurchase proceeds $72,223,301) | | 72,223,000 | | 72,223,000 | |
| | | | | |
Total Short-Term Obligation
(cost of $72,223,000) | | 72,223,000 | |
| | | | | |
Total Investments – 101.6%
(cost of $1,845,836,791) (b) | | 1,990,957,356 | |
| | | | | |
Other Assets & Liabilities, Net – (1.6)% | | (31,552,955 | ) |
| | | | | |
Net Assets – 100.0% | | | | 1,959,404,401 | |
Notes to Investment Portfolio:
| (a) | Non-income producing security. |
| (b) | Cost for federal income tax purposes is $1,865,225,757. |
See Accompanying Notes to Financial Statements.
43
Columbia Mid Cap Index Fund
February 28, 2010
The following table summarizes the inputs used, as of February 28, 2010, in valuing the Fund’s assets:
| | | | | | | | | | | | |
Description | | Quoted
Prices
(Level 1) | | Other
Significant
Observable
Inputs
(Level 2) | | Significant
Unobservable
Inputs
(Level 3) | | Total |
Total Common Stocks | | $ | 1,918,734,356 | | $ | — | | $ | — | | $ | 1,918,734,356 |
| | | | | | | | | | | | |
Total Short-Term Obligation | | | — | | | 72,223,000 | | | — | | | 72,223,000 |
| | | | | | | | | | | | |
Total Investments | | | 1,918,734,356 | | | 72,223,000 | | | — | | | 1,990,957,356 |
| | | | | | | | | | | | |
Unrealized Appreciation on Futures Contracts | | | 678,508 | | | — | | | — | | | 678,508 |
| | | | | | | | | | | | |
Total | | $ | 1,919,412,864 | | $ | 72,223,000 | | $ | — | | $ | 1,991,635,864 |
| | | | | | | | | | | | |
For more information on valuation inputs, and their aggregation into the levels used in the table above, please refer to the Security Valuation section in the accompanying Notes to Financial Statements.
At February 28, 2010, the Fund held investments in the following sectors:
| | | |
Sector (Unaudited) | | % of
Net Assets | |
Financials | | 19.2 | |
Information Technology | | 14.6 | |
Consumer Discretionary | | 14.1 | |
Industrials | | 14.0 | |
Health Care | | 12.2 | |
Materials | | 6.5 | |
Energy | | 6.3 | |
Utilities | | 6.3 | |
Consumer Staples | | 3.9 | |
Telecommunication Services | | 0.8 | |
| | | |
| | 97.9 | |
Short-Term Obligation | | 3.7 | |
Other Assets & Liabilities, Net | | (1.6 | ) |
| | | |
| | 100.0 | |
| | | |
At February 28, 2010, the Fund held the following open long futures contracts:
| | | | | | | | | | | | | |
Risk
Exposure/
Type | | Number of
Contracts | | Value | | Aggregate
Face Value | | Expiration
Date | | Unrealized
Appreciation |
Equity Risk S&P Mid Cap 400 Index | | 531 | | $ | 39,171,870 | | $ | 38,493,362 | | March-2010 | | $ | 678,508 |
| | | | | | | | | | | | | |
On February 28, 2010, cash of $6,550,000 was pledged as collateral for open futures contracts and was being held at the broker of the futures contracts.
See Accompanying Notes to Financial Statements.
44
Investment Portfolio – Columbia Small Cap Index Fund
February 28, 2010
Common Stocks – 98.0%
| | | | |
| | | Shares | | Value ($) |
| Consumer Discretionary – 15.8% | | | | |
| Auto Components – 0.3% | | | | |
Drew Industries, Inc. (a) | | 64,400 | | 1,492,148 |
Spartan Motors, Inc. | | 112,400 | | 630,564 |
Standard Motor Products, Inc. | | 62,600 | | 507,686 |
Superior Industries International, Inc. | | 79,300 | | 1,145,885 |
| | | | |
Auto Components Total | | | | 3,776,283 |
| | |
Automobiles – 0.1% | | | | |
Winnebago Industries, Inc. (a) | | 99,400 | | 1,160,992 |
| | | | |
Automobiles Total | | | | 1,160,992 |
| | |
Distributors – 0.0% | | | | |
Audiovox Corp., Class A (a) | | 63,400 | | 457,748 |
| | | | |
Distributors Total | | | | 457,748 |
| |
Diversified Consumer Services – 1.2% | | |
American Public Education, Inc. (a) | | 62,300 | | 2,695,098 |
Capella Education Co. (a) | | 49,700 | | 4,128,579 |
Coinstar, Inc. (a) | | 106,200 | | 3,152,016 |
Hillenbrand, Inc. | | 211,600 | | 4,242,580 |
Pre-Paid Legal Services, Inc. (a) | | 25,100 | | 1,045,164 |
Universal Technical Institute, Inc. (a) | | 69,300 | | 1,750,518 |
| | | | |
Diversified Consumer Services Total | | 17,013,955 |
| |
Hotels, Restaurants & Leisure – 3.0% | | |
BJ’s Restaurants, Inc. (a) | | 72,300 | | 1,547,220 |
Buffalo Wild Wings, Inc. (a) | | 61,600 | | 2,707,320 |
California Pizza Kitchen, Inc. (a) | | 82,700 | | 1,285,158 |
CEC Entertainment, Inc. (a) | | 77,750 | | 2,725,138 |
CKE Restaurants, Inc. | | 188,700 | | 2,145,519 |
Cracker Barrel Old Country Store, Inc. | | 78,200 | | 3,415,776 |
DineEquity, Inc. (a) | | 51,700 | | 1,516,878 |
Interval Leisure Group, Inc. (a) | | 135,300 | | 1,942,908 |
Jack in the Box, Inc. (a) | | 195,900 | | 4,137,408 |
Landry’s Restaurants, Inc. (a) | | 27,600 | | 562,764 |
Marcus Corp. | | 71,400 | | 871,794 |
Monarch Casino & Resort, Inc. (a) | | 38,600 | | 298,378 |
Multimedia Games, Inc. (a) | | 93,100 | | 425,467 |
O’Charleys, Inc. (a) | | 64,100 | | 518,569 |
P.F. Chang’s China Bistro, Inc. (a) | | 79,100 | | 3,357,004 |
Papa John’s International, Inc. (a) | | 75,300 | | 1,838,073 |
Peet’s Coffee & Tea, Inc. (a) | | 44,400 | | 1,614,384 |
Pinnacle Entertainment, Inc. (a) | | 205,400 | | 1,485,042 |
Red Robin Gourmet Burgers, Inc. (a) | | 53,300 | | 1,056,939 |
Ruby Tuesday, Inc. (a) | | 220,500 | | 1,783,845 |
Ruth’s Hospitality Group, Inc. (a) | | 108,308 | | 392,075 |
Shuffle Master, Inc. (a) | | 183,350 | | 1,507,137 |
| | | | |
| | | Shares | | Value ($) |
Sonic Corp. (a) | | 208,800 | | 1,772,712 |
Steak N Shake Co. (a) | | 4,205 | | 1,438,446 |
Texas Roadhouse, Inc., Class A (a) | | 175,500 | | 2,356,965 |
| | | | |
Hotels, Restaurants & Leisure Total | | 42,702,919 |
| |
| Household Durables – 1.1% | | |
Blyth, Inc. | | 20,400 | | 588,336 |
Ethan Allen Interiors, Inc. | | 89,000 | | 1,420,440 |
Helen of Troy Ltd. (a) | | 103,100 | | 2,491,927 |
Kid Brands, Inc. (a) | | 58,100 | | 281,785 |
La-Z-Boy, Inc. (a) | | 176,200 | | 2,221,882 |
M/I Homes, Inc. (a) | | 63,300 | | 813,405 |
Meritage Home Corp. (a) | | 108,700 | | 2,325,093 |
National Presto Industries, Inc. | | 16,400 | | 2,069,024 |
Skyline Corp. | | 23,200 | | 395,560 |
Standard Pacific Corp. (a) | | 332,600 | | 1,403,572 |
Universal Electronics, Inc. (a) | | 46,800 | | 1,057,212 |
| | | | |
Household Durables Total | | | | 15,068,236 |
| |
| Internet & Catalog Retail – 0.6% | | |
Blue Nile, Inc. (a) | | 49,800 | | 2,551,752 |
HSN, Inc. (a) | | 135,000 | | 2,924,100 |
NutriSystem, Inc. | | 105,800 | | 2,047,230 |
PetMed Express, Inc. | | 78,100 | | 1,512,797 |
| | | | |
Internet & Catalog Retail Total | | | | 9,035,879 |
| |
| Leisure Equipment & Products – 1.2% | | |
Arctic Cat, Inc. (a) | | 41,800 | | 449,768 |
Brunswick Corp. | | 301,900 | | 3,483,926 |
Callaway Golf Co. | | 220,400 | | 1,747,772 |
Jakks Pacific, Inc. (a) | | 95,400 | | 1,178,190 |
Nautilus Group, Inc. (a) | | 70,400 | | 239,360 |
Polaris Industries, Inc. | | 111,800 | | 5,113,732 |
Pool Corp. | | 167,350 | | 3,343,653 |
RC2 Corp. (a) | | 73,100 | | 1,031,441 |
Sturm Ruger & Co., Inc. | | 65,200 | | 766,752 |
| | | | |
Leisure Equipment & Products Total | | 17,354,594 |
|
Media – 0.6% |
Arbitron, Inc. | | 90,700 | | 1,950,050 |
EW Scripps Co., Class A (a) | | 99,000 | | 754,380 |
Live Nation, Inc. (a) | | 477,560 | | 6,203,504 |
| | | | |
Media Total | | 8,907,934 |
|
Multiline Retail – 0.2% |
Fred’s, Inc., Class A | | 136,950 | | 1,417,433 |
Tuesday Morning Corp. (a) | | 106,900 | | 610,399 |
| | | | |
Multiline Retail Total | | 2,027,832 |
|
Specialty Retail – 4.8% |
Big 5 Sporting Goods Corp. | | 73,600 | | 1,124,608 |
Brown Shoe Co., Inc. | | 146,575 | | 2,027,132 |
Buckle, Inc. | | 87,050 | | 2,547,953 |
See Accompanying Notes to Financial Statements.
45
Columbia Small Cap Index Fund
February 28, 2010
Common Stocks (continued)
| | | | |
| | | Shares | | Value ($) |
| Consumer Discretionary (continued) | | |
| Specialty Retail (continued) |
Cabela’s, Inc. (a) | | 137,900 | | 2,131,934 |
Cato Corp., Class A | | 101,000 | | 1,979,600 |
Children’s Place Retail Stores, Inc. (a) | | 93,700 | | 3,580,277 |
Christopher & Banks Corp. | | 123,100 | | 854,314 |
Dress Barn, Inc. (a) | | 202,300 | | 5,029,178 |
Finish Line, Inc., Class A | | 192,799 | | 2,330,940 |
Genesco, Inc. (a) | | 77,500 | | 1,854,575 |
Group 1 Automotive, Inc. (a) | | 82,800 | | 2,299,356 |
Gymboree Corp. (a) | | 102,100 | | 4,441,350 |
Haverty Furniture Companies, Inc. | | 63,900 | | 848,592 |
Hibbett Sports, Inc. (a) | | 98,000 | | 2,254,980 |
HOT Topic, Inc. (a) | | 151,400 | | 979,558 |
Jo-Ann Stores, Inc. (a) | | 91,650 | | 3,468,952 |
Jos. A. Bank Clothiers, Inc. (a) | | 62,575 | | 2,798,980 |
Lithia Motors, Inc., Class A (a) | | 72,300 | | 461,274 |
Lumber Liquidators Holdings, Inc. (a) | | 53,000 | | 1,175,540 |
MarineMax, Inc. (a) | | 72,800 | | 770,224 |
Men’s Wearhouse, Inc. | | 178,400 | | 3,810,624 |
Midas, Inc. (a) | | 48,700 | | 441,709 |
Monro Muffler Brake, Inc. | | 67,400 | | 2,349,564 |
OfficeMax, Inc. (a) | | 260,800 | | 4,164,976 |
Pep Boys-Manny, Moe & Jack, Inc. | | 159,200 | | 1,512,400 |
Sonic Automotive, Inc., Class A (a) | | 135,400 | | 1,394,620 |
Stage Stores, Inc. | | 130,175 | | 1,731,328 |
Stein Mart, Inc. (a) | | 89,300 | | 729,581 |
Tractor Supply Co. (a) | | 123,600 | | 6,763,392 |
Zale Corp. (a) | | 81,100 | | 192,207 |
Zumiez, Inc. (a) | | 71,400 | | 1,023,876 |
| | | | |
Specialty Retail Total | | 67,073,594 |
|
Textiles, Apparel & Luxury Goods – 2.7% |
Carter’s, Inc. (a) | | 194,100 | | 5,562,906 |
CROCS, Inc. (a) | | 292,900 | | 2,064,945 |
Deckers Outdoor Corp. (a) | | 43,900 | | 5,276,780 |
Iconix Brand Group, Inc. (a) | | 244,200 | | 3,181,926 |
K-Swiss, Inc., Class A (a) | | 92,500 | | 863,950 |
Liz Claiborne, Inc. (a) | | 324,800 | | 2,244,368 |
Maidenform Brands, Inc. (a) | | 66,500 | | 1,145,130 |
Movado Group, Inc. (a) | | 61,100 | | 782,080 |
Oxford Industries, Inc. | | 47,400 | | 922,404 |
Perry Ellis International, Inc. (a) | | 34,800 | | 681,036 |
Quiksilver, Inc. (a) | | 439,700 | | 1,130,029 |
Skechers U.S.A., Inc., Class A (a) | | 114,300 | | 3,512,439 |
True Religion Apparel, Inc. (a) | | 86,700 | | 2,129,352 |
Unifirst Corp. | | 49,000 | | 2,575,440 |
Volcom, Inc. (a) | | 56,700 | | 915,138 |
| | | | |
| | | Shares | | Value ($) |
Wolverine World Wide, Inc. | | 169,500 | | 4,673,115 |
| | | | |
Textiles, Apparel & Luxury Goods Total | | 37,661,038 |
| | | | |
Consumer Discretionary Total | | 222,241,004 |
| | | | |
| Consumer Staples – 3.1% |
| Beverages – 0.1% |
Boston Beer Co., Inc., Class A (a) | | 34,600 | | 1,637,272 |
| | | | |
Beverages Total | | 1,637,272 |
|
Food & Staples Retailing – 1.1% |
Andersons, Inc. | | 62,600 | | 2,021,980 |
Casey’s General Stores, Inc. | | 174,100 | | 5,294,381 |
Great Atlantic & Pacific Tea Co., Inc. (a) | | 99,600 | | 724,092 |
Nash Finch Co. | | 43,900 | | 1,548,353 |
Spartan Stores, Inc. | | 76,700 | | 1,075,334 |
United Natural Foods, Inc. (a) | | 147,800 | | 4,340,886 |
| | | | |
Food & Staples Retailing Total | | 15,005,026 |
|
Food Products – 1.5% |
Cal-Maine Foods, Inc. | | 43,100 | | 1,381,786 |
Calavo Growers, Inc. | | 40,200 | | 711,138 |
Darling International, Inc. (a) | | 281,100 | | 2,265,666 |
Diamond Foods, Inc. | | 56,800 | | 1,979,480 |
Hain Celestial Group, Inc. (a) | | 139,400 | | 2,212,278 |
J & J Snack Foods Corp. | | 48,400 | | 2,067,164 |
Lance, Inc. | | 109,600 | | 2,377,224 |
Sanderson Farms, Inc. | | 59,800 | | 2,927,808 |
TreeHouse Foods, Inc. (a) | | 117,200 | | 5,043,116 |
| | | | |
Food Products Total | | | | 20,965,660 |
| | |
Household Products – 0.3% | | | | |
Central Garden & Pet Co., Class A (a) | | 232,500 | | 2,220,375 |
WD-40 Co. | | 56,600 | | 1,772,712 |
| | | | |
Household Products Total | | | | 3,993,087 |
| | |
Personal Products – 0.0% | | | | |
Mannatech, Inc. | | 53,400 | | 188,502 |
| | | | |
Personal Products Total | | | | 188,502 |
| | |
Tobacco – 0.1% | | | | |
Alliance One International, Inc. (a) | | 304,600 | | 1,562,598 |
| | | | |
Tobacco Total | | | | 1,562,598 |
| | | | |
Consumer Staples Total | | | | 43,352,145 |
| | | | |
| Energy – 5.0% | | | | |
| Energy Equipment & Services – 3.0% | | |
Basic Energy Services, Inc. (a) | | 77,900 | | 736,155 |
Bristow Group, Inc. (a) | | 122,700 | | 4,442,967 |
See Accompanying Notes to Financial Statements.
46
Columbia Small Cap Index Fund
February 28, 2010
Common Stocks (continued)
| | | | |
| | | Shares | | Value ($) |
| Energy (continued) | | | | |
| Energy Equipment & Services (continued) | | |
CARBO Ceramics, Inc. | | 65,450 | | 3,994,414 |
Dril-Quip, Inc. (a) | | 102,500 | | 5,608,800 |
Gulf Island Fabrication, Inc. | | 48,900 | | 975,555 |
Hornbeck Offshore Services, Inc. (a) | | 78,600 | | 1,483,968 |
ION Geophysical Corp. (a) | | 405,000 | | 1,854,900 |
Lufkin Industries, Inc. | | 50,900 | | 3,718,245 |
Matrix Service Co. (a) | | 89,600 | | 958,720 |
Oil States International, Inc. (a) | | 170,200 | | 7,322,004 |
Pioneer Drilling Co. (a) | | 185,100 | | 1,321,614 |
SEACOR Holdings, Inc. (a) | | 69,200 | | 5,285,496 |
Seahawk Drilling, Inc. (a) | | 39,800 | | 817,890 |
Superior Well Services, Inc. (a) | | 63,000 | | 1,127,070 |
TETRA Technologies, Inc. (a) | | 257,850 | | 2,599,128 |
| | | | |
Energy Equipment & Services Total | | 42,246,926 |
| |
Oil, Gas & Consumable Fuels – 2.0% | | |
Holly Corp. | | 140,900 | | 3,618,312 |
Penn Virginia Corp. | | 155,200 | | 3,926,560 |
Petroleum Development Corp. (a) | | 65,700 | | 1,544,607 |
Petroquest Energy, Inc. (a) | | 179,900 | | 964,264 |
St. Mary Land & Exploration Co. | | 213,800 | | 6,965,604 |
Stone Energy Corp. (a) | | 143,500 | | 2,446,675 |
Swift Energy Co. (a) | | 128,000 | | 3,813,120 |
World Fuel Services Corp. | | 203,100 | | 5,365,902 |
| | | | |
Oil, Gas & Consumable Fuels Total | | | | 28,645,044 |
| | | | |
Energy Total | | | | 70,891,970 |
| | | | |
| Financials – 18.3% | | | | |
| Capital Markets – 1.5% | | | | |
Greenhill & Co., Inc. | | 70,100 | | 5,008,645 |
Investment Technology Group, Inc. (a) | | 149,500 | | 2,544,490 |
LaBranche & Co., Inc. (a) | | 180,700 | | 847,483 |
optionsXpress Holdings, Inc. | | 145,900 | | 2,306,679 |
Piper Jaffray Companies, Inc. (a) | | 54,700 | | 2,367,963 |
Stifel Financial Corp. (a) | | 103,600 | | 5,666,920 |
SWS Group, Inc. | | 96,050 | | 1,157,402 |
TradeStation Group, Inc. (a) | | 113,100 | | 780,390 |
| | | | |
Capital Markets Total | | | | 20,679,972 |
| | |
Commercial Banks – 6.1% | | | | |
Bank of the Ozarks, Inc. | | 44,400 | | 1,363,968 |
Boston Private Financial Holdings, Inc. | | 221,900 | | 1,520,015 |
City Holding Co. | | 54,300 | | 1,742,487 |
Columbia Banking System, Inc. | | 96,100 | | 1,966,206 |
Community Bank System, Inc. | | 111,900 | | 2,507,679 |
East West Bancorp, Inc. | | 313,600 | | 5,494,272 |
| | | | |
| | | Shares | | Value ($) |
First Bancorp Puerto Rico | | 259,400 | | 549,928 |
First Commonwealth Financial Corp. | | 258,800 | | 1,451,868 |
First Financial Bancorp | | 167,700 | | 3,112,512 |
First Financial Bankshares, Inc. | | 71,200 | | 3,727,320 |
First Midwest Bancorp, Inc. | | 243,400 | | 3,307,806 |
Glacier Bancorp, Inc. | | 210,707 | | 3,055,252 |
Hancock Holding Co. | | 96,900 | | 3,907,008 |
Hanmi Financial Corp. (a) | | 175,000 | | 421,750 |
Home Bancshares, Inc. | | 66,700 | | 1,619,476 |
Independent Bank Corp. MA | | 71,600 | | 1,759,928 |
Nara Bancorp, Inc. (a) | | 110,700 | | 977,481 |
National Penn Bancshares, Inc. | | 429,700 | | 2,960,633 |
NBT Bancorp, Inc. | | 117,400 | | 2,493,576 |
Old National Bancorp | | 298,000 | | 3,385,280 |
Pinnacle Financial Partners, Inc. (a) | | 112,700 | | 1,702,897 |
PrivateBancorp, Inc. | | 200,200 | | 2,602,600 |
S&T Bancorp, Inc. | | 82,400 | | 1,460,952 |
Signature Bank (a) | | 138,800 | | 5,167,524 |
Simmons First National Corp., Class A | | 51,400 | | 1,365,184 |
South Financial Group, Inc. | | 736,600 | | 419,862 |
Sterling Bancorp NY | | 61,900 | | 506,961 |
Sterling Bancshares, Inc. | | 339,050 | | 1,600,316 |
Susquehanna Bancshares, Inc. | | 295,400 | | 2,466,590 |
Tompkins Financial Corp. | | 26,340 | | 944,552 |
UMB Financial Corp. | | 102,200 | | 3,915,282 |
Umpqua Holdings Corp. | | 378,700 | | 4,726,176 |
United Bankshares, Inc. | | 130,600 | | 3,215,372 |
United Community Banks, Inc. (a) | | 282,672 | | 1,173,089 |
Whitney Holding Corp. | | 329,700 | | 4,236,645 |
Wilshire Bancorp, Inc. | | 66,400 | | 624,160 |
Wintrust Financial Corp. | | 82,600 | | 2,811,704 |
| | | | |
Commercial Banks Total | | | | 86,264,311 |
| | |
| Consumer Finance – 0.9% | | | | |
Cash America International, Inc. | | 100,200 | | 3,840,666 |
EZCORP, Inc., Class A (a) | | 166,300 | | 3,281,099 |
First Cash Financial Services, Inc. (a) | | 90,800 | | 1,926,776 |
Rewards Network, Inc. | | 29,833 | | 434,070 |
World Acceptance Corp. (a) | | 55,600 | | 2,323,524 |
| | | | |
Consumer Finance Total | | | | 11,806,135 |
|
Diversified Financial Services – 0.2% |
Portfolio Recovery Associates, Inc. (a) | | 57,200 | | 3,050,476 |
| | | | |
Diversified Financial Services Total | | | | 3,050,476 |
See Accompanying Notes to Financial Statements.
47
Columbia Small Cap Index Fund
February 28, 2010
Common Stocks (continued)
| | | | |
| | | Shares | | Value ($) |
| Financials (continued) | | | | |
| Insurance – 2.8% |
American Physicians Capital, Inc. | | 30,266 | | 860,160 |
Amerisafe, Inc. (a) | | 64,500 | | 1,110,045 |
Delphi Financial Group, Inc., Class A | | 162,250 | | 3,460,792 |
eHealth, Inc. (a) | | 79,800 | | 1,332,660 |
Employers Holdings, Inc. | | 150,400 | | 1,982,272 |
Infinity Property & Casualty Corp. | | 46,500 | | 1,894,875 |
National Financial Partners Corp. (a) | | 141,400 | | 1,624,686 |
Navigators Group, Inc. (a) | | 45,900 | | 1,738,233 |
Presidential Life Corp. | | 70,800 | | 693,840 |
ProAssurance Corp. (a) | | 110,800 | | 5,907,856 |
RLI Corp. | | 60,600 | | 3,229,374 |
Safety Insurance Group, Inc. | | 51,500 | | 1,912,710 |
Selective Insurance Group, Inc. | | 181,500 | | 2,942,115 |
Stewart Information Services Corp. | | 62,400 | | 877,344 |
Tower Group, Inc. | | 153,600 | | 3,497,472 |
United Fire & Casualty Co. | | 76,400 | | 1,298,800 |
Zenith National Insurance Corp. | | 127,800 | | 4,867,902 |
| | | | |
Insurance Total | | | | 39,231,136 |
|
Real Estate Investment Trusts (REITs) – 6.2% |
Acadia Realty Trust | | 135,932 | | 2,274,142 |
BioMed Realty Trust, Inc. | | 335,700 | | 5,186,565 |
Cedar Shopping Centers, Inc. | | 180,300 | | 1,188,177 |
Colonial Properties Trust | | 226,700 | | 2,672,793 |
DiamondRock Hospitality Co. (a) | | 416,752 | | 3,725,763 |
EastGroup Properties, Inc. | | 89,300 | | 3,205,870 |
Entertainment Properties Trust | | 143,600 | | 5,488,392 |
Extra Space Storage, Inc. | | 295,500 | | 3,333,240 |
Franklin Street Properties Corp. | | 231,600 | | 3,003,852 |
Healthcare Realty Trust, Inc. | | 203,000 | | 4,240,670 |
Home Properties, Inc. | | 114,700 | | 5,253,260 |
Inland Real Estate Corp. | | 242,500 | | 2,037,000 |
Kilroy Realty Corp. | | 147,500 | | 4,178,675 |
Kite Realty Group Trust | | 215,400 | | 885,294 |
LaSalle Hotel Properties | | 217,100 | | 4,213,911 |
Lexington Realty Trust | | 349,851 | | 2,081,614 |
LTC Properties, Inc. | | 79,400 | | 2,070,752 |
Medical Properties Trust, Inc. | | 274,100 | | 2,820,489 |
Mid-America Apartment Communities, Inc. | | 98,700 | | 5,126,478 |
National Retail Properties, Inc. | | 281,700 | | 5,977,674 |
Parkway Properties, Inc. | | 73,900 | | 1,226,740 |
Pennsylvania Real Estate Investment Trust | | 135,700 | | 1,363,785 |
Post Properties, Inc. | | 165,700 | | 3,188,068 |
PS Business Parks, Inc. | | 61,700 | | 3,023,300 |
Sovran Self Storage, Inc. | | 94,000 | | 2,982,620 |
Tanger Factory Outlet Centers | | 137,700 | | 5,737,959 |
| | | | |
| | | Shares | | Value ($) |
Urstadt Biddle Properties, Inc., Class A | | 73,300 | | 1,155,941 |
| | | | |
Real Estate Investment Trusts (REITs) Total | | 87,643,024 |
|
Real Estate Management & Development – 0.2% |
Forestar Group Inc. (a) | | 122,800 | | 2,178,472 |
| | | | |
Real Estate Management & Development Total | | 2,178,472 |
|
Thrifts & Mortgage Finance – 0.4% |
Bank Mutual Corp. | | 158,700 | | 1,029,963 |
Brookline Bancorp, Inc. | | 201,800 | | 2,074,504 |
Dime Community Bancshares | | 87,000 | | 1,056,180 |
TrustCo Bank Corp. NY | | 262,100 | | 1,585,705 |
| | | | |
Thrifts & Mortgage Finance Total | | | | 5,746,352 |
| | | | |
Financials Total | | | | 256,599,878 |
| | | | |
| Health Care – 13.3% | | | | |
| Biotechnology – 1.1% | | | | |
ArQule, Inc. (a) | | 96,200 | | 316,498 |
Cubist Pharmaceuticals, Inc. (a) | | 198,100 | | 4,168,024 |
Emergent Biosolutions, Inc. (a) | | 56,900 | | 834,154 |
Martek Biosciences Corp. (a) | | 113,600 | | 2,252,688 |
Regeneron Pharmaceuticals, Inc. (a) | | 217,400 | | 5,317,604 |
Savient Pharmaceuticals, Inc. (a) | | 227,800 | | 3,070,744 |
| | | | |
Biotechnology Total | | | | 15,959,712 |
|
Health Care Equipment & Supplies – 3.9% |
Abaxis, Inc. (a) | | 75,300 | | 1,911,867 |
Align Technology, Inc. (a) | | 228,600 | | 4,137,660 |
American Medical Systems Holdings, Inc. (a) | | 254,500 | | 4,611,540 |
Analogic Corp. | | 44,000 | | 1,817,200 |
Cantel Medical Corp. | | 44,000 | | 860,200 |
CONMED Corp. (a) | | 99,500 | | 2,177,060 |
Cooper Companies, Inc. | | 154,500 | | 6,189,270 |
CryoLife, Inc. (a) | | 97,300 | | 685,965 |
Cyberonics, Inc. (a) | | 81,600 | | 1,456,560 |
Greatbatch, Inc. (a) | | 79,300 | | 1,547,936 |
Haemonetics Corp. (a) | | 87,600 | | 4,685,724 |
ICU Medical, Inc. (a) | | 43,500 | | 1,495,095 |
Integra LifeSciences Holdings Corp. (a) | | 70,100 | | 2,789,980 |
Invacare Corp. | | 110,400 | | 3,011,712 |
Kensey Nash Corp. (a) | | 37,900 | | 836,453 |
Meridian Bioscience, Inc. | | 138,700 | | 3,073,592 |
Merit Medical Systems, Inc. (a) | | 96,000 | | 1,413,120 |
Natus Medical, Inc. (a) | | 97,100 | | 1,308,908 |
Neogen Corp. (a) | | 76,100 | | 1,843,903 |
See Accompanying Notes to Financial Statements.
48
Columbia Small Cap Index Fund
February 28, 2010
Common Stocks (continued)
| | | | |
| | | Shares | | Value ($) |
| Health Care (continued) | | | | |
| Health Care Equipment & Supplies (continued) |
Osteotech, Inc. (a) | | 61,600 | | 239,624 |
Palomar Medical Technologies, Inc. (a) | | 61,800 | | 558,054 |
SurModics, Inc. (a) | | 59,700 | | 1,149,822 |
Symmetry Medical, Inc. (a) | | 122,400 | | 1,052,640 |
Theragenics Corp. (a) | | 114,400 | | 162,448 |
West Pharmaceutical Services, Inc. | | 112,800 | | 4,393,560 |
Zoll Medical Corp. (a) | | 72,100 | | 1,868,832 |
| | | | |
Health Care Equipment & Supplies Total | | 55,278,725 |
|
Health Care Providers & Services – 5.8% |
Air Methods Corp. (a) | | 37,300 | | 992,553 |
Almost Family, Inc. (a) | | 27,800 | | 1,002,468 |
Amedisys, Inc. (a) | | 95,599 | | 5,511,282 |
AMERIGROUP Corp. (a) | | 174,650 | | 4,589,802 |
AMN Healthcare Services, Inc. (a) | | 111,600 | | 1,028,952 |
AmSurg Corp. (a) | | 104,900 | | 2,167,234 |
Bio-Reference Labs, Inc. (a) | | 40,700 | | 1,612,127 |
Catalyst Health Solutions, Inc. (a) | | 131,400 | | 4,952,466 |
Centene Corp. (a) | | 164,200 | | 2,934,254 |
Chemed Corp. | | 77,100 | | 4,129,476 |
Corvel Corp. (a) | | 24,800 | | 798,560 |
Cross Country Healthcare, Inc. (a) | | 105,400 | | 1,036,082 |
Genoptix, Inc. (a) | | 58,700 | | 1,911,859 |
Gentiva Health Services, Inc. (a) | | 100,200 | | 2,776,542 |
Hanger Orthopedic Group, Inc. (a) | | 108,300 | | 2,019,795 |
Healthspring, Inc. (a) | | 167,300 | | 3,079,993 |
Healthways, Inc. (a) | | 115,600 | | 1,736,312 |
HMS Holdings Corp. (a) | | 88,000 | | 4,051,520 |
inVentiv Health, Inc. (a) | | 114,900 | | 1,686,732 |
IPC The Hospitalist Co., Inc. (a) | | 46,400 | | 1,533,984 |
Landauer, Inc. | | 32,000 | | 1,944,640 |
LCA-Vision, Inc. (a) | | 63,600 | | 505,620 |
LHC Group, Inc. (a) | | 51,700 | | 1,556,170 |
Magellan Health Services, Inc. (a) | | 120,200 | | 5,038,784 |
Medcath Corp. (a) | | 60,400 | | 408,908 |
Mednax, Inc. (a) | | 159,100 | | 8,511,850 |
Molina Healthcare, Inc. (a) | | 45,400 | | 970,652 |
MWI Veterinary Supply, Inc. (a) | | 41,700 | | 1,718,040 |
Odyssey Healthcare, Inc. (a) | | 113,250 | | 1,985,273 |
PharMerica Corp. (a) | | 104,700 | | 1,795,605 |
PSS World Medical, Inc. (a) | | 204,000 | | 4,302,360 |
RehabCare Group, Inc. (a) | | 84,300 | | 2,346,912 |
Res-Care, Inc. (a) | | 87,600 | | 798,912 |
| | | | |
Health Care Providers & Services Total | | 81,435,719 |
| | |
Health Care Technology – 0.9% | | | | |
Computer Programs & Systems, Inc. | | 33,400 | | 1,200,396 |
| | | | |
| | | Shares | | Value ($) |
Eclipsys Corp. (a) | | 194,700 | | 3,623,367 |
Omnicell, Inc. (a) | | 109,100 | | 1,476,123 |
Phase Forward, Inc. (a) | | 148,000 | | 1,765,640 |
Quality Systems, Inc. | | 64,600 | | 3,697,704 |
| | | | |
Health Care Technology Total | | | | 11,763,230 |
| |
Life Sciences Tools & Services – 0.8% | | |
Cambrex Corp. (a) | | 100,100 | | 377,377 |
Dionex Corp. (a) | | 60,600 | | 4,138,980 |
Enzo Biochem, Inc. (a) | | 114,220 | | 597,370 |
eResearchTechnology, Inc. (a) | | 144,200 | | 872,410 |
Kendle International, Inc. (a) | | 50,900 | | 866,827 |
PAREXEL International Corp. (a) | | 198,800 | | 4,005,820 |
| | | | |
Life Sciences Tools & Services Total | | 10,858,784 |
| |
Pharmaceuticals – 0.8% | | |
Par Pharmaceutical Companies, Inc. (a) | | 119,000 | | 2,978,570 |
Salix Pharmaceuticals Ltd. (a) | | 189,800 | | 5,420,688 |
Viropharma, Inc. (a) | | 264,800 | | 3,299,408 |
| | | | |
Pharmaceuticals Total | | | | 11,698,666 |
| | | | |
Health Care Total | | | | 186,994,836 |
| | | | |
| Industrials – 16.4% | | | | |
| Aerospace & Defense – 2.8% | | | | |
AAR Corp. (a) | | 133,100 | | 3,018,708 |
Aerovironment, Inc. (a) | | 50,700 | | 1,229,475 |
American Science & Engineering, Inc. | | 30,400 | | 2,259,024 |
Applied Signal Technology, Inc. | | 45,000 | | 831,150 |
Ceradyne, Inc. (a) | | 87,800 | | 1,979,012 |
Cubic Corp. | | 53,000 | | 1,827,970 |
Curtiss-Wright Corp. | | 155,900 | | 4,996,595 |
Esterline Technologies Corp. (a) | | 101,700 | | 4,184,955 |
GenCorp, Inc. (a) | | 174,000 | | 751,680 |
Moog, Inc., Class A (a) | | 155,075 | | 5,266,347 |
Orbital Sciences Corp. (a) | | 194,300 | | 3,584,835 |
Stanley, Inc. (a) | | 55,100 | | 1,389,071 |
Teledyne Technologies, Inc. (a) | | 123,200 | | 4,640,944 |
Triumph Group, Inc. | | 57,000 | | 2,983,380 |
| | | | |
Aerospace & Defense Total | | | | 38,943,146 |
| | |
Air Freight & Logistics – 0.4% | | | | |
Forward Air Corp. | | 99,050 | | 2,422,763 |
HUB Group, Inc., Class A (a) | | 129,500 | | 3,492,615 |
| | | | |
Air Freight & Logistics Total | | | | 5,915,378 |
| | |
Airlines – 0.4% | | | | |
Allegiant Travel Co. (a) | | 51,900 | | 2,706,066 |
Skywest, Inc. | | 190,100 | | 2,805,876 |
| | | | |
Airlines Total | | | | 5,511,942 |
See Accompanying Notes to Financial Statements.
49
Columbia Small Cap Index Fund
February 28, 2010
Common Stocks (continued)
| | | | |
| | | Shares | | Value ($) |
| Industrials (continued) | | | | |
| Building Products – 1.0% | | | | |
AAON, Inc. | | 43,000 | | 904,720 |
Apogee Enterprises, Inc. | | 95,600 | | 1,366,124 |
Gibraltar Industries, Inc. (a) | | 103,000 | | 1,203,040 |
Griffon Corp. (a) | | 150,700 | | 1,865,666 |
NCI Building Systems, Inc. (a) | | 308,200 | | 585,580 |
Quanex Building Products Corp. | | 128,700 | | 2,005,146 |
Simpson Manufacturing Co., Inc. | | 131,500 | | 3,232,270 |
Universal Forest Products, Inc. | | 66,200 | | 2,332,888 |
| | | | |
Building Products Total | | | | 13,495,434 |
| |
Commercial Services & Supplies – 2.4% | | |
ABM Industries, Inc. | | 158,700 | | 3,250,176 |
ATC Technology Corp. (a) | | 68,300 | | 1,530,603 |
Bowne & Co., Inc. | | 137,053 | | 1,525,400 |
Consolidated Graphics, Inc. (a) | | 38,200 | | 1,701,428 |
G&K Services, Inc., Class A | | 63,600 | | 1,588,092 |
Geo Group, Inc. (a) | | 175,600 | | 3,471,612 |
Healthcare Services Group, Inc. | | 148,700 | | 3,265,452 |
Interface, Inc., Class A | | 192,500 | | 1,655,500 |
Mobile Mini, Inc. (a) | | 121,400 | | 1,649,826 |
Standard Register Co. | | 43,400 | | 238,700 |
Sykes Enterprises, Inc. (a) | | 136,200 | | 3,242,922 |
Tetra Tech, Inc. (a) | | 209,500 | | 4,382,740 |
United Stationers, Inc. (a) | | 81,600 | | 4,660,176 |
Viad Corp. | | 70,300 | | 1,343,433 |
| | | | |
Commercial Services & Supplies Total | | 33,506,060 |
| | |
Construction & Engineering – 0.8% | | | | |
Comfort Systems USA, Inc. | | 130,700 | | 1,531,804 |
Dycom Industries, Inc. (a) | | 133,400 | | 1,204,602 |
EMCOR Group, Inc. (a) | | 225,400 | | 5,188,708 |
Insituform Technologies, Inc., Class A (a) | | 132,900 | | 3,264,024 |
| | | | |
Construction & Engineering Total | | 11,189,138 |
|
Electrical Equipment – 2.0% |
A.O. Smith Corp. | | 77,800 | | 3,524,340 |
Acuity Brands, Inc. | | 148,000 | | 5,769,040 |
AZZ, Inc. | | 42,100 | | 1,322,361 |
Baldor Electric Co. | | 143,400 | | 4,505,628 |
Belden, Inc. | | 159,550 | | 3,379,269 |
Brady Corp., Class A | | 179,000 | | 5,015,580 |
Encore Wire Corp. | | 64,500 | | 1,296,450 |
II-VI, Inc. (a) | | 84,900 | | 2,380,596 |
MagneTek, Inc. (a) | | 105,900 | | 153,555 |
Vicor Corp. (a) | | 66,900 | | 636,219 |
| | | | |
Electrical Equipment Total | | 27,983,038 |
|
Industrial Conglomerates – 0.2% |
Standex International Corp. | | 42,600 | | 1,060,740 |
| | | | |
| | | Shares | | Value ($) |
Tredegar Corp. | | 74,100 | | 1,241,175 |
| | | | |
Industrial Conglomerates Total | | 2,301,915 |
|
Machinery – 4.0% |
Actuant Corp., Class A | | 231,900 | | 4,199,709 |
Albany International Corp., Class A | | 93,800 | | 1,812,216 |
Astec Industries, Inc. (a) | | 67,800 | | 1,646,862 |
Badger Meter, Inc. | | 51,100 | | 1,836,023 |
Barnes Group, Inc. | | 147,800 | | 2,373,668 |
Briggs & Stratton Corp. | | 170,900 | | 2,992,459 |
Cascade Corp. | | 31,300 | | 864,506 |
CIRCOR International, Inc. | | 58,100 | | 1,795,871 |
CLARCOR, Inc. | | 172,100 | | 5,636,275 |
EnPro Industries, Inc. (a) | | 68,400 | | 1,893,312 |
ESCO Technologies, Inc. | | 90,400 | | 2,956,984 |
Gardner Denver, Inc. | | 178,000 | | 7,762,580 |
John Bean Technologies Corp. | | 94,400 | | 1,543,440 |
Kaydon Corp. | | 113,600 | | 3,692,000 |
Lindsay Corp. | | 42,400 | | 1,560,744 |
Lydall, Inc. (a) | | 57,600 | | 460,224 |
Mueller Industries, Inc. | | 128,700 | | 2,880,306 |
Robbins & Myers, Inc. | | 112,300 | | 2,714,291 |
Toro Co. | | 117,000 | | 5,150,340 |
Watts Water Technologies, Inc., Class A | | 100,300 | | 2,924,748 |
| | | | |
Machinery Total | | 56,696,558 |
|
Professional Services – 0.8% |
Administaff, Inc. | | 76,200 | | 1,373,124 |
CDI Corp. | | 43,400 | | 620,186 |
Exponent, Inc. (a) | | 47,100 | | 1,254,273 |
Heidrick & Struggles International, Inc. | | 58,400 | | 1,575,048 |
Kelly Services, Inc., Class A (a) | | 90,800 | | 1,428,284 |
On Assignment, Inc. (a) | | 123,400 | | 813,206 |
School Specialty, Inc. (a) | | 54,800 | | 1,169,980 |
SFN Group, Inc. (a) | | 169,800 | | 1,336,326 |
TrueBlue, Inc. (a) | | 149,800 | | 1,987,846 |
Volt Information Sciences, Inc. (a) | | 41,300 | | 439,845 |
| | | | |
Professional Services Total | | 11,998,118 |
|
Road & Rail – 0.8% |
Arkansas Best Corp. | | 86,500 | | 2,269,760 |
Heartland Express, Inc. | | 179,868 | | 2,753,779 |
Knight Transportation, Inc. | | 199,300 | | 3,936,175 |
Old Dominion Freight Line, Inc. (a) | | 95,650 | | 2,940,281 |
| | | | |
Road & Rail Total | | 11,899,995 |
|
Trading Companies & Distributors – 0.8% |
Applied Industrial Technologies, Inc. | | 127,325 | | 2,869,906 |
Kaman Corp. | | 88,000 | | 2,107,600 |
See Accompanying Notes to Financial Statements.
50
Columbia Small Cap Index Fund
February 28, 2010
Common Stocks (continued)
| | | | |
| | | Shares | | Value ($) |
| Industrials (continued) | | | | |
| Trading Companies & Distributors (continued) |
Lawson Products, Inc. | | 13,700 | | 242,901 |
Watsco, Inc. | | 109,600 | | 6,339,264 |
| | | | |
Trading Companies & Distributors Total | | 11,559,671 |
| | | | |
Industrials Total | | 231,000,393 |
| | | | |
| Information Technology – 17.7% |
| Communications Equipment – 2.1% |
Arris Group, Inc. (a) | | 428,600 | | 4,423,152 |
Bel Fuse, Inc., Class B | | 39,800 | | 904,654 |
Black Box Corp. | | 60,000 | | 1,735,800 |
Blue Coat Systems, Inc. (a) | | 138,700 | | 4,019,526 |
Comtech Telecommunications Corp. (a) | | 96,600 | | 3,054,492 |
Digi International, Inc. (a) | | 84,400 | | 856,660 |
EMS Technologies, Inc. (a) | | 52,200 | | 716,184 |
Harmonic, Inc. (a) | | 328,600 | | 2,155,616 |
NETGEAR, Inc. (a) | | 118,400 | | 3,001,440 |
Network Equipment Technologies, Inc. (a) | | 101,600 | | 518,160 |
PC-Tel, Inc. (a) | | 63,900 | | 389,151 |
Symmetricom, Inc. (a) | | 149,400 | | 876,978 |
Tekelec (a) | | 230,200 | | 3,802,904 |
Tollgrade Communications, Inc. (a) | | 43,400 | | 282,968 |
ViaSat, Inc. (a) | | 95,900 | | 2,915,360 |
| | | | |
Communications Equipment Total | | | | 29,653,045 |
| |
| Computers & Peripherals – 1.0% | | |
Adaptec, Inc. (a) | | 411,900 | | 1,268,652 |
Avid Technology, Inc. (a) | | 97,375 | | 1,309,694 |
Compellent Technologies, Inc. (a) | | 77,600 | | 1,205,128 |
Hutchinson Technology, Inc. (a) | | 79,900 | | 527,340 |
Intermec, Inc. (a) | | 170,100 | | 2,422,224 |
Intevac, Inc. (a) | | 75,400 | | 1,068,418 |
Novatel Wireless, Inc. (a) | | 105,500 | | 702,630 |
Stratasys, Inc. (a) | | 69,200 | | 1,824,804 |
Synaptics, Inc. (a) | | 116,300 | | 3,105,210 |
| | | | |
Computers & Peripherals Total | | | | 13,434,100 |
|
| Electronic Equipment, Instruments & Components – 3.5% |
Agilysys, Inc. | | 68,500 | | 748,020 |
Anixter International, Inc. (a) | | 98,700 | | 4,119,738 |
Benchmark Electronics, Inc. (a) | | 220,125 | | 4,358,475 |
Brightpoint, Inc. (a) | | 238,140 | | 1,697,938 |
Checkpoint Systems, Inc. (a) | | 133,300 | | 2,748,646 |
Cognex Corp. | | 135,600 | | 2,562,840 |
CTS Corp. | | 115,900 | | 922,564 |
Daktronics, Inc. | | 117,800 | | 891,746 |
DTS, Inc. (a) | | 59,900 | | 1,916,800 |
| | | | |
| | | Shares | | Value ($) |
Electro Scientific Industries, Inc. (a) | | 93,800 | | 1,173,438 |
FARO Technologies, Inc. (a) | | 55,100 | | 1,319,094 |
Gerber Scientific, Inc. (a) | | 86,200 | | 542,198 |
Insight Enterprises, Inc. (a) | | 156,900 | | 2,006,751 |
Keithley Instruments, Inc. | | 46,200 | | 332,178 |
Littelfuse, Inc. (a) | | 74,400 | | 2,647,896 |
LoJack Corp. (a) | | 62,000 | | 265,360 |
Mercury Computer Systems, Inc. (a) | | 80,400 | | 982,488 |
Methode Electronics, Inc. | | 128,300 | | 1,596,052 |
MTS Systems Corp. | | 56,700 | | 1,543,374 |
Newport Corp. (a) | | 123,900 | | 1,305,906 |
Park Electrochemical Corp. | | 70,200 | | 1,908,036 |
Plexus Corp. (a) | | 135,200 | | 4,663,048 |
RadiSys Corp. (a) | | 81,300 | | 669,099 |
Rogers Corp. (a) | | 53,800 | | 1,476,810 |
ScanSource, Inc. (a) | | 90,800 | | 2,360,800 |
SYNNEX Corp. (a) | | 70,500 | | 2,019,120 |
Technitrol, Inc. | | 140,800 | | 619,520 |
TTM Technologies, Inc. (a) | | 147,600 | | 1,260,504 |
| | | | |
Electronic Equipment, Instruments & Components Total | | 48,658,439 |
| |
| Internet Software & Services – 0.8% | | |
comScore, Inc. (a) | | 82,800 | | 1,285,056 |
DealerTrack Holdings, Inc. (a) | | 138,200 | | 1,965,204 |
InfoSpace, Inc. (a) | | 121,000 | | 1,219,680 |
j2 Global Communications, Inc. (a) | | 154,400 | | 3,350,480 |
Knot, Inc. (a) | | 102,600 | | 784,890 |
Perficient, Inc. (a) | | 104,800 | | 1,163,280 |
Stamps.com, Inc. (a) | | 39,900 | | 361,494 |
United Online, Inc. | | 289,200 | | 1,810,392 |
| | | | |
Internet Software & Services Total | | 11,940,476 |
| | |
| IT Services – 1.9% | | | | |
CACI International, Inc., Class A (a) | | 102,900 | | 5,099,724 |
CIBER, Inc. (a) | | 237,700 | | 886,621 |
CSG Systems International, Inc. (a) | | 120,100 | | 2,416,412 |
Cybersource Corp. (a) | | 239,299 | | 4,099,192 |
Forrester Research, Inc. (a) | | 50,700 | | 1,518,465 |
Heartland Payment Systems, Inc. | | 128,100 | | 1,958,649 |
Integral Systems, Inc. (a) | | 59,300 | | 507,608 |
MAXIMUS, Inc. | | 60,400 | | 3,477,832 |
NCI, Inc., Class A (a) | | 23,500 | | 661,995 |
Startek, Inc. (a) | | 40,700 | | 265,771 |
TeleTech Holdings, Inc. (a) | | 110,800 | | 1,937,892 |
Wright Express Corp. (a) | | 130,400 | | 3,692,928 |
| | | | |
IT Services Total | | | | 26,523,089 |
|
| Semiconductors & Semiconductor Equipment – 5.3% |
Actel Corp. (a) | | 89,500 | | 1,146,495 |
Advanced Energy Industries, Inc. (a) | | 113,500 | | 1,648,020 |
See Accompanying Notes to Financial Statements.
51
Columbia Small Cap Index Fund
February 28, 2010
Common Stocks (continued)
| | | | |
| | | Shares | | Value ($) |
| Information Technology (continued) |
| Semiconductors & Semiconductor Equipment (continued) |
ATMI, Inc. (a) | | 107,300 | | 1,806,932 |
Brooks Automation, Inc. (a) | | 220,230 | | 1,902,787 |
Cabot Microelectronics Corp. (a) | | 80,200 | | 2,839,080 |
Cohu, Inc. | | 80,200 | | 1,074,680 |
Cymer, Inc. (a) | | 98,600 | | 3,088,152 |
Cypress Semiconductor Corp. (a) | | 532,400 | | 6,303,616 |
Diodes, Inc. (a) | | 119,349 | | 2,340,434 |
DSP Group, Inc. (a) | | 78,300 | | 573,939 |
Exar Corp. (a) | | 149,100 | | 1,101,849 |
FEI Co. (a) | | 128,800 | | 2,740,864 |
Hittite Microwave Corp. (a) | | 73,100 | | 3,051,194 |
Kopin Corp. (a) | | 226,500 | | 860,700 |
Kulicke & Soffa Industries, Inc. (a) | | 236,900 | | 1,558,802 |
Micrel, Inc. | | 147,000 | | 1,447,950 |
Microsemi Corp. (a) | | 280,100 | | 4,344,351 |
MKS Instruments, Inc. (a) | | 169,300 | | 3,052,479 |
Pericom Semiconductor Corp. (a) | | 87,400 | | 820,686 |
Rudolph Technologies, Inc. (a) | | 105,900 | | 842,964 |
Sigma Designs, Inc. (a) | | 91,500 | | 1,070,550 |
Skyworks Solutions, Inc. (a) | | 596,200 | | 9,103,974 |
Standard Microsystems Corp. (a) | | 76,000 | | 1,483,520 |
Supertex, Inc. (a) | | 44,200 | | 1,056,822 |
Tessera Technologies, Inc. (a) | | 170,300 | | 3,058,588 |
TriQuint Semiconductor, Inc. (a) | | 520,100 | | 3,739,519 |
Ultratech, Inc. (a) | | 81,000 | | 1,044,900 |
Varian Semiconductor Equipment Associates, Inc. (a) | | 251,525 | | 7,565,872 |
Veeco Instruments, Inc. (a) | | 131,700 | | 4,490,970 |
| | | | |
Semiconductors & Semiconductor Equipment Total | | 75,160,689 |
| | |
Software – 3.1% | | | | |
Blackbaud, Inc. | | 151,000 | | 3,515,280 |
CommVault Systems, Inc. (a) | | 144,000 | | 3,153,600 |
Concur Technologies, Inc. (a) | | 145,900 | | 5,739,706 |
Ebix, Inc. (a) | | 103,300 | | 1,499,916 |
Epicor Software Corp. (a) | | 157,400 | | 1,348,918 |
EPIQ Systems, Inc. (a) | | 111,300 | | 1,293,306 |
Interactive Intelligence, Inc. (a) | | 43,700 | | 860,890 |
JDA Software Group, Inc. (a) | | 121,400 | | 3,435,620 |
Manhattan Associates, Inc. (a) | | 77,000 | | 1,945,790 |
Netscout Systems, Inc. (a) | | 116,800 | | 1,704,112 |
Phoenix Technologies Ltd. (a) | | 119,700 | | 331,569 |
Progress Software Corp. (a) | | 137,300 | | 3,847,146 |
Radiant Systems, Inc. (a) | | 94,000 | | 1,049,980 |
Smith Micro Software, Inc. (a) | | 101,500 | | 889,140 |
Sonic Solutions (a) | | 101,700 | | 924,453 |
Take-Two Interactive Software, Inc. (a) | | 277,550 | | 2,670,031 |
| | | | |
| | | Shares | | Value ($) |
Taleo Corp., Class A (a) | | 131,200 | | 3,088,448 |
THQ, Inc. (a) | | 230,850 | | 1,398,951 |
Tyler Technologies, Inc. (a) | | 94,500 | | 1,716,120 |
Websense, Inc. (a) | | 149,600 | | 3,210,416 |
| | | | |
Software Total | | | | 43,623,392 |
| | | | |
Information Technology Total | | 248,993,230 |
| | | | |
| Materials – 4.4% | | | | |
| Chemicals – 1.9% | | | | |
A. Schulman, Inc. | | 89,200 | | 2,101,552 |
American Vanguard Corp. | | 70,500 | | 454,725 |
Arch Chemicals, Inc. | | 85,600 | | 2,642,472 |
Balchem Corp. | | 95,650 | | 2,095,691 |
Calgon Carbon Corp. (a) | | 191,300 | | 2,967,063 |
H.B. Fuller Co. | | 166,300 | | 3,490,637 |
NewMarket Corp. | | 40,000 | | 3,562,000 |
OM Group, Inc. (a) | | 104,500 | | 3,596,890 |
Penford Corp. (a) | | 38,900 | | 433,346 |
PolyOne Corp. (a) | | 316,200 | | 2,513,790 |
Quaker Chemical Corp. | | 37,900 | | 750,799 |
Stepan Co. | | 26,100 | | 1,240,794 |
Zep, Inc. | | 73,850 | | 1,631,347 |
| | | | |
Chemicals Total | | | | 27,481,106 |
| | |
Construction Materials – 0.6% | | | | |
Eagle Materials, Inc. | | 149,800 | | 3,533,782 |
Headwaters, Inc. (a) | | 206,000 | | 1,027,940 |
Texas Industries, Inc. | | 94,800 | | 3,368,244 |
| | | | |
Construction Materials Total | | | | 7,929,966 |
| | |
Containers & Packaging – 0.5% | | | | |
Myers Industries, Inc. | | 96,500 | | 894,555 |
Rock-Tenn Co., Class A | | 132,500 | | 5,543,800 |
| | | | |
Containers & Packaging Total | | | | 6,438,355 |
| | |
Metals & Mining – 0.7% | | | | |
A.M. Castle & Co. | | 57,200 | | 658,944 |
AMCOL International Corp. | | 84,900 | | 2,159,856 |
Brush Engineered Materials, Inc. (a) | | 69,200 | | 1,421,368 |
Century Aluminum Co. (a) | | 196,100 | | 2,390,459 |
Olympic Steel, Inc. | | 30,900 | | 854,694 |
RTI International Metals, Inc. (a) | | 102,600 | | 2,465,478 |
| | | | |
Metals & Mining Total | | | | 9,950,799 |
| | |
Paper & Forest Products – 0.7% | | | | |
Buckeye Technologies, Inc. (a) | | 132,400 | | 1,463,020 |
Clearwater Paper Corp. (a) | | 38,900 | | 1,877,314 |
Deltic Timber Corp. | | 36,600 | | 1,681,404 |
Neenah Paper, Inc. | | 50,100 | | 709,917 |
Schweitzer-Mauduit International, Inc. | | 60,500 | | 2,776,950 |
See Accompanying Notes to Financial Statements.
52
Columbia Small Cap Index Fund
February 28, 2010
Common Stocks (continued)
| | | | |
| | | Shares | | Value ($) |
| Materials (continued) | | | | |
| Paper & Forest Products (continued) | | | | |
Wausau Paper Corp. (a) | | 167,300 | | 1,415,358 |
| | | | |
Paper & Forest Products Total | | | | 9,923,963 |
| | | | |
Materials Total | | | | 61,724,189 |
| | | | |
| Other – 0.0% | | | | |
| Other – 0.0% | | | | |
CSF Holdings, Inc. Escrow (a)(b)(c) | | 2,062 | | — |
| | | | |
Other Total | | | | — |
| | | | |
Other Total | | | | — |
| | | | |
| Telecommunication Services – 0.6% | | | | |
| Diversified Telecommunication Services – 0.4% |
Cbeyond, Inc. (a) | | 88,100 | | 1,092,440 |
General Communication, Inc., Class A (a) | | 152,500 | | 837,225 |
Iowa Telecommunications Services, Inc. | | 112,200 | | 1,812,030 |
Neutral Tandem, Inc. (a) | | 114,700 | | 1,848,964 |
| | | | |
Diversified Telecommunication Services Total | | 5,590,659 |
|
Wireless Telecommunication Services – 0.2% |
NTELOS Holdings Corp. | | 104,100 | | 1,778,028 |
USA Mobility, Inc. | | 77,300 | | 870,398 |
| | | | |
Wireless Telecommunication Services Total | | 2,648,426 |
| | | | |
Telecommunication Services Total | | 8,239,085 |
| | | | |
| Utilities – 3.4% | | | | |
| Electric Utilities – 1.0% | | | | |
ALLETE, Inc. | | 101,400 | | 3,189,030 |
Central Vermont Public Service Corp. | | 40,000 | | 786,400 |
El Paso Electric Co. (a) | | 151,300 | | 3,044,156 |
UIL Holdings Corp. | | 102,333 | | 2,812,111 |
Unisource Energy Corp. | | 122,300 | | 3,563,822 |
| | | | |
Electric Utilities Total | | | | 13,395,519 |
|
Gas Utilities – 1.9% |
Laclede Group, Inc. | | 75,800 | | 2,485,482 |
New Jersey Resources Corp. | | 142,150 | | 5,177,103 |
Northwest Natural Gas Co. | | 90,700 | | 3,989,893 |
Piedmont Natural Gas Co. | | 250,000 | | 6,457,500 |
South Jersey Industries, Inc. | | 101,900 | | 4,062,753 |
Southwest Gas Corp. | | 153,700 | | 4,392,746 |
| | | | |
Gas Utilities Total | | | | 26,565,477 |
| | | | | |
| | | Shares | | Value ($) | |
| Multi-Utilities – 0.4% | |
Avista Corp. | | 187,300 | | 3,813,428 | |
CH Energy Group, Inc. | | 54,000 | | 2,159,460 | |
| | | | | |
Multi-Utilities Total | | | | 5,972,888 | |
|
Water Utilities – 0.1% | |
American States Water Co. | | 63,300 | | 2,035,727 | |
| | | | | |
Water Utilities Total | | | | 2,035,727 | |
| | | | | |
Utilities Total | | | | 47,969,611 | |
| | | | | |
Total Common Stocks
(cost of $1,273,731,281) | | | | 1,378,006,341 | |
| | |
Investment Company – 0.9% | | | | | |
iShares S&P SmallCap 600 Index Fund | | 238,900 | | 13,182,502 | |
| | | | | |
Total Investment Company (cost of $10,475,991) | | | | 13,182,502 | |
| | |
Short-Term Obligation – 2.7% | | | | | |
| | | Par ($) | | | |
Repurchase agreement with Fixed Income Clearing Corp., dated 02/26/10, due 03/01/10, at 0.050%, collateralized by a U.S. Government Agency obligation maturing 10/10/12, market value $38,769,413 (repurchase proceeds $38,007,158) | | 38,007,000 | | 38,007,000 | |
| | | | | |
Total Short-Term Obligation
(cost of $38,007,000) | | 38,007,000 | |
| | | | | |
Total Investments – 101.6%
(cost of $1,322,214,272) (d) | | 1,429,195,843 | |
| | | | | |
Other Assets & Liabilities, Net – (1.6)% | | (22,969,018 | ) |
| | | | | |
Net Assets – 100.0% | | 1,406,226,825 | |
Notes to Investment Portfolio:
| (a) | Non-income producing security. |
| (b) | Represents fair value as determined in good faith under procedures approved by the Board of Trustees. At February 28, 2010, the security has no value. |
| (c) | Security has no value. |
| (d) | Cost for federal income tax purposes is $1,349,112,362. |
See Accompanying Notes to Financial Statements.
53
Columbia Small Cap Index Fund
February 28, 2010
The following table summarizes the inputs used, as of February 28, 2010, in valuing the Fund’s assets:
| | | | | | | | | | | | |
Description | | Quoted Prices
(Level 1) | | Other
Significant
Observable
Inputs
(Level 2) | | Significant
Unobservable
Inputs
(Level 3) | | Total |
Common Stocks | | | | | | | | | | | | |
Consumer Discretionary | | $ | 222,241,004 | | $ | — | | $ | — | | $ | 222,241,004 |
Consumer Staples | | | 43,352,145 | | | — | | | — | | | 43,352,145 |
Energy | | | 70,891,970 | | | — | | | — | | | 70,891,970 |
Financials | | | 256,599,878 | | | — | | | — | | | 256,599,878 |
Health Care | | | 186,994,836 | | | — | | | — | | | 186,994,836 |
Industrials | | | 231,000,393 | | | — | | | — | | | 231,000,393 |
Information Technology | | | 248,993,230 | | | — | | | — | | | 248,993,230 |
Materials | | | 61,724,189 | | | — | | | — | | | 61,724,189 |
Other | | | — | | | — | | | — | | | — |
Telecommunication Services | | | 8,239,085 | | | — | | | — | | | 8,239,085 |
Utilities | | | 47,969,611 | | | — | | | — | | | 47,969,611 |
| | | | | | | | | | | | |
Total Common Stocks | | | 1,378,006,341 | | | — | | | — | | | 1,378,006,341 |
| | | | | | | | | | | | |
Total Investment Company | | | 13,182,502 | | | — | | | — | | | 13,182,502 |
| | | | | | | | | | | | |
Total Short-Term Obligation | | | — | | | 38,007,000 | | | — | | | 38,007,000 |
| | | | | | | | | | | | |
Total Investments | | | 1,391,188,843 | | | 38,007,000 | | | — | | | 1,429,195,843 |
| | | | | | | | | | | | |
Unrealized Appreciation on Futures Contracts | | | 457,147 | | | — | | | — | | | 457,147 |
| | | | | | | | | | | | |
Total | | $ | 1,391,645,990 | | $ | 38,007,000 | | $ | — | | $ | 1,429,652,990 |
| | | | | | | | | | | | |
The following table reconciles asset balances for the year ending February 28, 2010, in which significant unobservable inputs (Level 3) were used in determining value:
| | | | | | | | | | | | | | | | | | |
Investments
in Securities | | Balance as
of
February 28,
2009 | | Realized
Gain/
(Loss) | | Change in
Unrealized
Appreciation
(Depreciation) | | Net
Purchases
(Sales) | | Net
Transfers
into/out
of
Level 3 | | Balance as
of
February 28,
2010 |
Common Stocks | | | | | | | | | | | | | | | | | | |
Other | | $ | — | | $ | — | | $ | — | | $ | — | | $ | — | | $ | — |
The information in the above reconciliation represents fiscal year to date activity for any securities identified as using Level 3 inputs at either the beginning or the end of the current fiscal period.
For more information on valuation inputs, and their aggregation into the levels used in the tables above, please refer to the Security Valuation section in the accompanying Notes to Financial Statements.
At February 28, 2010, the Fund held investments in the following sectors:
| | | |
Sector (Unaudited) | | % of
Net Assets | |
Financials | | 18.3 | |
Information Technology | | 17.7 | |
Industrials | | 16.4 | |
Consumer Discretionary | | 15.8 | |
Health Care | | 13.3 | |
Energy | | 5.0 | |
Materials | | 4.4 | |
Utilities | | 3.4 | |
Consumer Staples | | 3.1 | |
Telecommunication Services | | 0.6 | |
Other | | 0.0 | * |
| | | |
| | 98.0 | |
Short- Term Obligation | | 2.7 | |
Investment Company | | 0.9 | |
Other Assets & Liabilities, Net | | (1.6 | ) |
| | | |
| | 100.0 | |
| | | |
* Security has no value
At February 28, 2010, the Fund held the following open long futures contracts:
| | | | | | | | | | | | | |
Risk
Exposure/
Type | | Number
of
Contracts | | Value | | Aggregate
Face Value | | Expiration
Date | | Unrealized
Appreciation |
Equity Risk Russell 2000 Mini Index | | 223 | | $ | 14,002,170 | | $ | 13,545,023 | | March-2010 | | $ | 457,147 |
| | | | | | | | | | | | | |
On February 28, 2010, cash of $2,670,000 was pledged as collateral for open futures contracts and was being held at the broker of the futures contracts.
See Accompanying Notes to Financial Statements.
54
Statements of Assets and Liabilities – Index Funds
February 28, 2010
| | | | | | | | |
| | | ($) | | ($) | | ($) | | ($) |
| | | Columbia
Large Cap
Index Fund | | Columbia
Large Cap
Enhanced
Core Fund | | Columbia
Mid Cap
Index Fund | | Columbia
Small Cap
Index Fund |
Assets | | | | | | | | |
Unaffiliated investments, at identified cost | | 2,312,378,402 | | 408,092,964 | | 1,845,836,791 | | 1,322,214,272 |
Affiliated investments, at identified cost | | 60,086,053 | | — | | — | | — |
| | | | | | | | |
| | | | |
Total investments, at identified cost | | 2,372,464,455 | | 408,092,964 | | 1,845,836,791 | | 1,322,214,272 |
| | | | |
Unaffiliated investments, at value | | 2,635,930,135 | | 524,898,371 | | 1,990,957,356 | | 1,429,195,843 |
Affiliated investments, at value | | 43,612,831 | | — | | — | | — |
| | | | | | | | |
| | | | |
Total investments, at value | | 2,679,542,966 | | 524,898,371 | | 1,990,957,356 | | 1,429,195,843 |
| | | | |
Cash | | 1,058,414 | | 415 | | 833 | | 909 |
Cash collateral for open futures contracts | | — | | — | | 6,550,000 | | 2,670,000 |
Receivable for: | | | | | | | | |
Investments sold | | 287,582 | | — | | 12,218,552 | | 6,479,385 |
Fund shares sold | | 4,290,674 | | 85,939 | | 3,413,265 | | 2,490,232 |
Dividends | | 5,941,040 | | 1,268,691 | | 2,009,058 | | 710,036 |
Interest | | 231 | | 34 | | 301 | | 158 |
Futures variation margin | | 60,172 | | 8,936 | | — | | — |
Expense reimbursement due from investment advisor | | 134,101 | | — | | 45,536 | | 16,152 |
Trustees’ deferred compensation plan | | 9,327 | | — | | — | | 5,710 |
Other assets | | 3,973 | | 6,310 | | 20,081 | | — |
| | | | | | | | |
| | | | |
Total assets | | 2,691,328,480 | | 526,268,696 | | 2,015,214,982 | | 1,441,568,425 |
| | | | |
| | | | | | | | | |
Liabilities | | | | | | | | |
Payable for: | | | | | | | | |
Investments purchased | | 3,972,779 | | — | | 54,009,013 | | 33,925,324 |
Fund shares repurchased | | 2,210,116 | | 1,308,492 | | 1,261,552 | | 914,998 |
Futures variation margin | | — | | — | | 41,299 | | 210,022 |
Investment advisory fee | | 200,680 | | 139,633 | | 145,737 | | 104,548 |
Administration fee | | 200,688 | | 58,655 | | 134,071 | | 104,548 |
Pricing and bookkeeping fees | | — | | 9,579 | | 12,527 | | — |
Transfer agent fee | | — | | 32,579 | | 22,421 | | — |
Trustees’ fees | | 60,040 | | 57,214 | | 43,064 | | 57,582 |
Custody fee | | — | | 5,276 | | 10,963 | | — |
Distribution and service fees | | 52,820 | | 2,376 | | 31,219 | | 17,930 |
Chief compliance officer expenses | | — | | 141 | | 226 | | — |
Reports to shareholders | | — | | 7,208 | | 60,247 | | — |
Trustees’ deferred compensation plan | | 9,327 | | — | | — | | 5,710 |
Other liabilities | | 1,799 | | 35,475 | | 38,242 | | 938 |
| | | | | | | | |
| | | | |
Total liabilities | | 6,708,249 | | 1,656,628 | | 55,810,581 | | 35,341,600 |
| | | | |
| | | | | | | | | |
Net Assets | | 2,684,620,231 | | 524,612,068 | | 1,959,404,401 | | 1,406,226,825 |
See Accompanying Notes to Financial Statements.
55
Statements of Assets and Liabilities (continued) – Index Funds
February 28, 2010
| | | | | | | | | | | | | | | | |
| | | ($) | | | ($) | | | ($) | | | ($) | |
| | | Columbia
Large Cap
Index Fund | | | Columbia
Large Cap
Enhanced
Core Fund | | | Columbia
Mid Cap
Index Fund | | | Columbia
Small Cap
Index Fund | |
Net Assets Consist of | | | | | | | | | | | | | | | | |
Paid-in capital | | | 2,677,211,353 | | | | 672,122,690 | | | | 1,864,879,376 | | | | 1,362,950,604 | |
Undistributed (overdistributed) net investment income | | | 7,341,066 | | | | 644,315 | | | | 650,701 | | | | (28,438 | ) |
Accumulated net realized loss | | | (307,762,114 | ) | | | (265,193,467 | ) | | | (51,924,749 | ) | | | (64,134,059 | ) |
Net unrealized appreciation (depreciation) on: | | | | | | | | | | | | | | | | |
Investments | | | 307,078,511 | | | | 116,805,407 | | | | 145,120,565 | | | | 106,981,571 | |
Futures contracts | | | 751,415 | | | | 233,123 | | | | 678,508 | | | | 457,147 | |
| | | | |
| | | | | | | | | | | | | | | | | |
Net Assets | | | 2,684,620,231 | | | | 524,612,068 | | | | 1,959,404,401 | | | | 1,406,226,825 | |
| | | | |
| | | | | | | | | | | | | | | | | |
Class A | | | | | | | | | | | | | | | | |
Net assets | | $ | 268,090,825 | | | $ | 12,347,590 | | | $ | 168,264,287 | | | $ | 96,237,934 | |
Shares outstanding | | | 12,587,228 | | | | 1,150,938 | | | | 17,831,087 | | | | 6,887,311 | |
Net asset value and offering price per share | | $ | 21.30 | | | $ | 10.73 | | | $ | 9.44 | | | $ | 13.97 | |
| | | | |
| | | | | | | | | | | | | | | | | |
Class B | | | | | | | | | | | | | | | | |
Net assets | | $ | 3,769,026 | | | $ | — | | | $ | — | | | $ | — | |
Shares outstanding | | | 176,366 | | | | — | | | | — | | | | — | |
Net asset value and offering price per share (a) | | $ | 21.37 | | | $ | — | | | $ | — | | | $ | — | |
| | | | |
| | | | | | | | | | | | | | | | | |
Class R | | | | | | | | | | | | | | | | |
Net assets | | $ | — | | | $ | 111,689 | | | $ | — | | | $ | — | |
Shares outstanding | | | — | | | | 10,416 | | | | — | | | | — | |
Net asset value and offering price per share | | $ | — | | | $ | 10.72 | | | $ | — | | | $ | — | |
| | | | |
| | | | | | | | | | | | | | | | | |
Class Y (b) | | | | | | | | | | | | | | | | |
Net assets | | $ | — | | | $ | 60,328,905 | | | $ | — | | | $ | — | |
Shares outstanding | | | — | | | | 5,638,375 | | | | — | | | | — | |
Net asset value and offering price per share | | $ | — | | | $ | 10.70 | | | $ | — | | | $ | — | |
| | | | |
| | | | | | | | | | | | | | | | | |
Class Z | | | | | | | | | | | | | | | | |
Net assets | | $ | 2,412,760,380 | | | $ | 451,823,884 | | | $ | 1,791,140,114 | | | $ | 1,309,988,891 | |
Shares outstanding | | | 112,886,683 | | | | 42,230,840 | | | | 190,423,926 | | | | 93,520,515 | |
Net asset value and offering price per share | | $ | 21.37 | | | $ | 10.70 | | | $ | 9.41 | | | $ | 14.01 | |
| (a) | Redemption price per share is equal to net asset value less any applicable contingent deferred sales charge. |
| (b) | Class Y shares commenced operations on July 15, 2009. |
See Accompanying Notes to Financial Statements.
56
Statements of Operations – Index Funds
For the Year Ended February 28, 2010
| | | | | | | | | | | | |
| | | ($) | | | ($) | | | ($) | | | ($) | |
| | | Columbia
Large Cap
Index Fund | | | Columbia
Large Cap
Enhanced
Core Fund | | | Columbia
Mid Cap
Index Fund | | | Columbia
Small Cap
Index Fund | |
| Investment Income | | | | | | | | | | | | |
Dividends | | 47,597,476 | | | 11,743,259 | | | 24,740,832 | | | 13,398,376 | |
Dividends from affiliates | | 76,424 | | | — | | | — | | | — | |
Interest | | 54,310 | | | 5,456 | | | 31,113 | | | 14,514 | |
Foreign taxes withheld | | — | | | — | | | — | | | (3,153 | ) |
| | | | |
| | | | | | | | | | | | | |
Total Investment Income | | 47,728,210 | | | 11,748,715 | | | 24,771,945 | | | 13,409,737 | |
| | | | |
| Expenses | | | | | | | | | | | | |
Investment advisory fee | | 2,231,458 | | | 1,787,603 | | | 1,614,963 | | | 1,163,978 | |
Administration fee | | 2,231,508 | | | 760,800 | | | 1,474,963 | | | 1,163,978 | |
Distribution fee: | | | | | | | | | | | | |
Class B | | 28,498 | | | — | | | — | | | — | |
Class R | | — | | | 365 | | | — | | | — | |
Service fee: | | | | | | | | | | | | |
Class B | | 9,500 | | | — | | | — | | | — | |
Distribution and service fees: | | | | | | | | | | | | |
Class A | | 450,571 | | | 29,925 | | | 297,022 | | | 166,219 | |
Transfer agent fee – Class A, Class R and Class Z | | — | | | 446,394 | | | 166,166 | | | — | |
Transfer agent fee – Class Y | | — | | | 30 | | | — | | | — | |
Pricing and bookkeeping fees | | — | | | 117,947 | | | 145,331 | | | — | |
Trustees’ fees | | 45,658 | | | 44,214 | | | 41,868 | | | 45,492 | |
Custody fee | | — | | | 29,631 | | | 68,715 | | | — | |
Reports to shareholders | | — | | | 73,919 | | | 178,099 | | | — | |
Chief compliance officer expenses | | — | | | 781 | | | 1,231 | | | — | |
Other expenses | | 7,807 | | | 152,063 | | | 186,397 | | | 4,158 | |
| | | | |
| | | | | | | | | | | | | |
Expenses before interest expense | | 5,005,000 | | | 3,443,672 | | | 4,174,755 | | | 2,543,825 | |
| | | | | | | | | | | | |
Interest expense | | 23 | | | 3,235 | | | — | | | — | |
| | | | | | | | | | | | | |
Total Expenses | | 5,005,023 | | | 3,446,907 | | | 4,174,755 | | | 2,543,825 | |
Fees waived or expenses reimbursed by investment advisor | | (1,389,496 | ) | | (151,553 | ) | | (907,678 | ) | | (43,874 | ) |
Expense reductions | | — | | | (2 | ) | | (20 | ) | | — | |
| | | | |
| | | | | | | | | | | | | |
Net Expenses | | 3,615,527 | | | 3,295,352 | | | 3,267,057 | | | 2,499,951 | |
| | | | |
| | | | | | | | | | | | | |
Net Investment Income | | 44,112,683 | | | 8,453,363 | | | 21,504,888 | | | 10,909,786 | |
| | | | |
Net Realized and Unrealized Gain (Loss) on Investments and Futures Contracts | | | | | | | | | | | | |
Net realized gain on: | | | | | | | | | | | | |
Unaffiliated investments | | 12,444,321 | | | 1,430,398 | | | 22,665,601 | | | 11,551,858 | |
Affiliated investments | | 443,466 | | | — | | | — | | | — | |
Futures contracts | | 8,753,747 | | | 626,275 | | | 14,929,596 | | | 6,028,565 | |
| | | | |
| | | | | | | | | | | | | |
Net realized gain | | 21,641,534 | | | 2,056,673 | | | 37,595,197 | | | 17,580,423 | |
Net change in unrealized appreciation (depreciation) on: | | | | | | | | | | | | |
Investments | | 778,332,214 | | | 187,568,339 | | | 677,733,837 | | | 478,528,514 | |
Futures contracts | | 10,706,642 | | | 2,692,427 | | | 3,398,737 | | | 1,345,378 | |
| | | | |
| | | | | | | | | | | | | |
Net change in unrealized appreciation (depreciation) | | 789,038,856 | | | 190,260,766 | | | 681,132,574 | | | 479,873,892 | |
| | | | |
| | | | | | | | | | | | | |
Net Gain | | 810,680,390 | | | 192,317,439 | | | 718,727,771 | | | 497,454,315 | |
| | | | |
| | | | | | | | | | | | | |
Net Increase Resulting from Operations | | 854,793,073 | | | 200,770,802 | | | 740,232,659 | | | 508,364,101 | |
See Accompanying Notes to Financial Statements.
57
Statements of Changes in Net Assets – Index Funds
| | | | | | | | | | | | |
| Increase (Decrease) in Net Assets | | Columbia Large Cap Index Fund | | | Columbia Large Cap Enhanced Core Fund | |
| | | Year Ended
February 28,
2010 ($) | | | Year Ended
February 28,
2009 ($) | | | Year Ended
February 28,
2010 ($) | | | Year Ended
February 28,
2009 ($) | |
Operations | | | | | | | | | | | | |
Net investment income | | 44,112,683 | | | 51,500,703 | | | 8,453,363 | | | 11,957,791 | |
Net realized gain (loss) on investments, foreign currency transactions and futures contracts | | 21,641,534 | | | (8,396,487 | ) | | 2,056,673 | | | (220,912,313 | ) |
Net change in unrealized appreciation (depreciation) on investments, foreign currency translations and futures contracts | | 789,038,856 | | | (1,179,223,205 | ) | | 190,260,766 | | | (97,390,385 | ) |
| | | | | | | | | | | | |
Net increase (decrease) resulting from operations | | 854,793,073 | | | (1,136,118,989 | ) | | 200,770,802 | | | (306,344,907 | ) |
| | | | |
Distributions to Shareholders | | | | | | | | | | | | |
From net investment income: | | | | | | | | | | | | |
Class A | | (3,217,527 | ) | | (2,696,198 | ) | | (196,553 | ) | | (200,724 | ) |
Class B | | (37,629 | ) | | (61,085 | ) | | — | | | — | |
Class R | | — | | | — | | | (1,165 | ) | | (566 | ) |
Class Y | | — | | | — | | | (773,782 | ) | | — | |
Class Z | | (40,838,070 | ) | | (49,956,060 | ) | | (8,510,569 | ) | | (11,786,371 | ) |
| | | | | | | | | | | | |
Total distributions to shareholders | | (44,093,226 | ) | | (52,713,343 | ) | | (9,482,069 | ) | | (11,987,661 | ) |
| | | | |
Net Capital Stock Transactions | | 409,998,244 | | | 148,001,785 | | | (58,647,389 | ) | | (103,578,142 | ) |
Increase from Regulatory Settlements | | 22 | | | — | | | 3,773 | | | — | |
| | | | | | | | | | | | |
Total increase (decrease) in net assets | | 1,220,698,113 | | | (1,040,830,547 | ) | | 132,645,117 | | | (421,910,710 | ) |
| | | | |
Net Assets | | | | | | | | | | | | |
Beginning of period | | 1,463,922,118 | | | 2,504,752,665 | | | 391,966,951 | | | 813,877,661 | |
End of period | | 2,684,620,231 | | | 1,463,922,118 | | | 524,612,068 | | | 391,966,951 | |
Undistributed net investment income at end of period | | 7,341,066 | | | 7,321,585 | | | 644,315 | | | 1,669,247 | |
| (a) | Class Y shares commenced operations on July 15, 2009. |
See Accompanying Notes to Financial Statements.
58
Statements of Changes in Net Assets (continued) – Index Funds
| | | | | | | | | | | | |
| Increase (Decrease) in Net Assets | | Columbia Mid Cap Index Fund | | | Columbia Small Cap Index Fund | |
| | | Year Ended
February 28,
2010 ($) | | | Year Ended
February 28,
2009 ($) | | | Year Ended
February 28,
2010 ($) | | | Year Ended
February 28,
2009 ($) | |
Operations | | | | | | | | | | | | |
Net investment income | | 21,504,888 | | | 26,422,804 | | | 10,909,786 | | | 16,052,928 | |
Net realized gain (loss) on investments and futures contracts | | 37,595,197 | | | (3,623,292 | ) | | 17,580,423 | | | 56,345,366 | |
Net change in unrealized appreciation (depreciation) on investments and futures contracts | | 681,132,574 | | | (811,229,180 | ) | | 479,873,892 | | | (611,918,268 | ) |
| | | | | | | | | | | | |
Net increase (decrease) resulting from operations | | 740,232,659 | | | (788,429,668 | ) | | 508,364,101 | | | (539,519,974 | ) |
| | | | |
Distributions to Shareholders | | | | | | | | | | | | |
From net investment income: | | | | | | | | | | | | |
Class A | | (1,420,519 | ) | | (1,177,180 | ) | | (531,824 | ) | | (551,033 | ) |
Class Z | | (19,433,668 | ) | | (27,747,729 | ) | | (10,500,067 | ) | | (16,031,195 | ) |
From net realized gains: | | | | | | | | | | | | |
Class A | | — | | | (4,762,588 | ) | | — | | | (5,617,327 | ) |
Class Z | | — | | | (93,387,726 | ) | | — | | | (130,521,900 | ) |
| | | | | | | | | | | | |
Total distributions to shareholders | | (20,854,187 | ) | | (127,075,223 | ) | | (11,031,891 | ) | | (152,721,455 | ) |
| | | | |
Net Capital Stock Transactions | | 209,114,341 | | | (863,169 | ) | | 215,556,889 | | | 95,112,894 | |
Increase from Regulatory Settlements | | — | | | — | | | 6,338 | | | — | |
| | | | | | | | | | | | |
Total increase (decrease) in net assets | | 928,492,813 | | | (916,368,060 | ) | | 712,895,437 | | | (597,128,535 | ) |
| | | | |
Net Assets | | | | | | | | | | | | |
Beginning of period | | 1,030,911,588 | | | 1,947,279,648 | | | 693,331,388 | | | 1,290,459,923 | |
End of period | | 1,959,404,401 | | | 1,030,911,588 | | | 1,406,226,825 | | | 693,331,388 | |
Undistributed (overdistributed) net investment income at end of period | | 650,701 | | | — | | | (28,438 | ) | | 87,329 | |
See Accompanying Notes to Financial Statements.
59
Statements of Changes in Net Assets – Capital Stock Activity
| | | | | | | | | | | | |
| | | Columbia Large Cap Index Fund | |
| | | Year Ended
February 28, 2010 | | | Year Ended
February 28, 2009 | |
| | | Shares | | | Dollars ($) | | | Shares | | | Dollars ($) | |
Class A | | | | | | | | | | | | |
Subscriptions | | 8,157,569 | | | 157,125,207 | | | 3,381,162 | | | 71,580,226 | |
Distributions reinvested | | 154,936 | | | 3,183,979 | | | 156,557 | | | 2,646,314 | |
Redemptions | | (2,876,267 | ) | | (55,850,989 | ) | | (1,800,951 | ) | | (36,913,986 | ) |
| | | | | | | | | | | | |
Net increase | | 5,436,238 | | | 104,458,197 | | | 1,736,768 | | | 37,312,554 | |
| | | | |
Class B | | | | | | | | | | | | |
Subscriptions | | 889 | | | 15,369 | | | 1,704 | | | 35,091 | |
Distributions reinvested | | 1,679 | | | 34,166 | | | 3,305 | | | 55,529 | |
Redemptions | | (54,899 | ) | | (1,026,820 | ) | | (81,255 | ) | | (1,715,101 | ) |
| | | | | | | | | | | | |
Net decrease | | (52,331 | ) | | (977,285 | ) | | (76,246 | ) | | (1,624,481 | ) |
| | | | |
Class Z | | | | | | | | | | | | |
Subscriptions | | 38,391,355 | | | 702,045,640 | | | 23,350,037 | | | 521,275,666 | |
Distributions reinvested | | 1,549,157 | | | 31,776,881 | | | 2,102,984 | | | 37,444,733 | |
Redemptions | | (22,900,844 | ) | | (427,305,189 | ) | | (21,026,994 | ) | | (446,406,687 | ) |
| | | | | | | | | | | | |
Net increase | | 17,039,668 | | | 306,517,332 | | | 4,426,027 | | | 112,313,712 | |
See Accompanying Notes to Financial Statements.
60
Statements of Changes in Net Assets (continued) – Capital Stock Activity
| | | | | | | | | | | | |
| | | Columbia Large Cap Enhanced Core Fund | |
| | | Year Ended
February 28, 2010 | | | Year Ended
February 28, 2009 | |
| | | Shares | | | Dollars ($) | | | Shares | | | Dollars ($) | |
Class A | | | | | | | | | | | | |
Subscriptions | | 116,859 | | | 1,131,052 | | | 152,669 | | | 1,656,144 | |
Distributions reinvested | | 15,299 | | | 157,249 | | | 18,718 | | | 159,669 | |
Redemptions | | (264,447 | ) | | (2,636,744 | ) | | (227,018 | ) | | (2,557,738 | ) |
| | | | | | | | | | | | |
Net decrease | | (132,289 | ) | | (1,348,443 | ) | | (55,631 | ) | | (741,925 | ) |
Class R | | | | | | | | | | | | |
Subscriptions | | 6,304 | | | 61,414 | | | 1,898 | | | 18,723 | |
Distributions reinvested | | 112 | | | 1,165 | | | 66 | | | 566 | |
Redemptions | | (1,396 | ) | | (11,676 | ) | | (164 | ) | | (2,020 | ) |
| | | | | | | | | | | | |
Net increase | | 5,020 | | | 50,903 | | | 1,800 | | | 17,269 | |
Class Y (a) | | | | | | | | | | | | |
Subscriptions | | 5,690,356 | | | 53,539,583 | | | — | | | — | |
Distributions reinvested | | 26,473 | | | 281,937 | | | — | | | — | |
Redemptions | | (78,454 | ) | | (818,000 | ) | | — | | | — | |
| | | | | | | | | | | | |
Net increase | | 5,638,375 | | | 53,003,520 | | | — | | | — | |
Class Z | | | | | | | | | | | | |
Subscriptions | | 6,113,432 | | | 55,650,307 | | | 14,262,004 | | | 152,509,885 | |
Distributions reinvested | | 139,723 | | | 1,425,898 | | | 232,607 | | | 2,081,092 | |
Redemptions | | (17,028,334 | ) | | (167,429,574 | ) | | (23,214,920 | ) | | (257,444,463 | ) |
| | | | | | | | | | | | |
Net decrease | | (10,775,179 | ) | | (110,353,369 | ) | | (8,720,309 | ) | | (102,853,486 | ) |
| (a) | Class Y shares commenced operations on July 15, 2009. |
See Accompanying Notes to Financial Statements.
61
Statements of Changes in Net Assets (continued) – Capital Stock Activity
| | | | | | | | | | | | |
| | | Columbia Mid Cap Index Fund | |
| | | Year Ended
February 28, 2010 | | | Year Ended
February 28, 2009 | |
| | | Shares | | | Dollars ($) | | | Shares | | | Dollars ($) | |
Class A | | | | | | | | | | | | |
Subscriptions | | 12,078,503 | | | 97,893,567 | | | 6,621,736 | | | 60,401,482 | |
Distributions reinvested | | 157,418 | | | 1,407,319 | | | 798,261 | | | 5,686,579 | |
Redemptions | | (4,762,299 | ) | | (38,843,152 | ) | | (3,703,490 | ) | | (31,836,041 | ) |
| | | | | | | | | | | | |
Net increase | | 7,473,622 | | | 60,457,734 | | | 3,716,507 | | | 34,252,020 | |
| | | | |
Class Z | | | | | | | | | | | | |
Subscriptions | | 55,867,583 | | | 430,622,558 | | | 30,926,300 | | | 260,328,278 | |
Distributions reinvested | | 1,281,976 | | | 11,409,592 | | | 8,522,036 | | | 61,801,363 | |
Redemptions | | (36,866,052 | ) | | (293,375,543 | ) | | (42,287,879 | ) | | (357,244,830 | ) |
| | | | | | | | | | | | |
Net increase (decrease) | | 20,283,507 | | | 148,656,607 | | | (2,839,543 | ) | | (35,115,189 | ) |
See Accompanying Notes to Financial Statements.
62
Statements of Changes in Net Assets (continued) – Capital Stock Activity
| | | | | | | | | | | | |
| | | Columbia Small Cap Index Fund | |
| | | Year Ended
February 28, 2010 | | | Year Ended
February 28, 2009 | |
| | | Shares | | | Dollars ($) | | | Shares | | | Dollars ($) | |
Class A | | | | | | | | | | | | |
Subscriptions | | 5,177,725 | | | 63,525,376 | | | 1,775,675 | | | 24,120,882 | |
Distributions reinvested | | 39,416 | | | 515,540 | | | 524,381 | | | 5,753,859 | |
Redemptions | | (2,208,500 | ) | | (26,847,443 | ) | | (1,024,121 | ) | | (14,291,888 | ) |
| | | | | | | | | | | | |
Net increase | | 3,008,641 | | | 37,193,473 | | | 1,275,935 | | | 15,582,853 | |
| | | | |
Class Z | | | | | | | | | | | | |
Subscriptions | | 32,115,817 | | | 364,778,523 | | | 15,987,615 | | | 235,105,416 | |
Distributions reinvested | | 489,875 | | | 6,383,176 | | | 7,485,215 | | | 83,446,290 | |
Redemptions | | (15,864,879 | ) | | (192,798,283 | ) | | (16,753,664 | ) | | (239,021,665 | ) |
| | | | | | | | | | | | |
Net increase | | 16,740,813 | | | 178,363,416 | | | 6,719,166 | | | 79,530,041 | |
See Accompanying Notes to Financial Statements.
63
Financial Highlights – Columbia Large Cap Index Fund
Selected data for a share outstanding throughout each period is as follows:
| | | | | | | | | | | | | | | | | | | | | | | | |
| | | Year Ended
February 28, | | | Year Ended
February 29,
2008 | | | Period Ended
February 28,
2007 (a) | | | Year Ended
March 31, | |
| Class A Shares | | 2010 | | | 2009 | | | | | 2006 (b) | | | 2005 | |
Net Asset Value, Beginning of Period | | $ | 14.14 | | | $ | 25.64 | | | $ | 27.08 | | | $ | 24.97 | | | $ | 22.67 | | | $ | 21.65 | |
| | | | | | |
Income from Investment Operations: | | | | | | | | | | | | | | | | | | | | | | | | |
Net investment income (c) | | | 0.34 | | | | 0.45 | | | | 0.47 | | | | 0.39 | | | | 0.36 | | | | 0.37 | (d) |
Net realized and unrealized gain (loss) on investments and futures contracts | | | 7.15 | | | | (11.54 | ) | | | (1.49 | ) | | | 2.14 | | | | 2.19 | | | | 1.01 | |
| | | | | | | | | | | | | | | | | | | | | | | | |
Total from investment operations | | | 7.49 | | | | (11.09 | ) | | | (1.02 | ) | | | 2.53 | | | | 2.55 | | | | 1.38 | |
| | | | | | |
Less Distributions to Shareholders: | | | | | | | | | | | | | | | | | | | | | | | | |
From net investment income | | | (0.33 | ) | | | (0.41 | ) | | | (0.42 | ) | | | (0.42 | ) | | | (0.25 | ) | | | (0.36 | ) |
Increase from Regulatory Settlements | | | — | (e) | | | — | | | | — | | | | — | | | | — | | | | — | |
| | | | | | |
Net Asset Value, End of Period | | $ | 21.30 | | | $ | 14.14 | | | $ | 25.64 | | | $ | 27.08 | | | $ | 24.97 | | | $ | 22.67 | |
Total return (f)(g) | | | 53.09 | % | | | (43.51 | )% | | | (3.92 | )% | | | 10.20 | %(h) | | | 11.27 | % | | | 6.33 | % |
| | | | | | |
Ratios to Average Net Assets/Supplemental Data: | | | | | | | | | | | | | | | | | | | | | | | | |
Net expenses before interest expense | | | 0.39 | % | | | 0.39 | %(i) | | | 0.39 | % | | | 0.39 | %(j) | | | 0.39 | %(i) | | | 0.39 | %(i) |
Interest expense | | | — | %(k) | | | — | | | | — | | | | — | | | | — | %(k) | | | — | |
Net expenses | | | 0.39 | % | | | 0.39 | %(i) | | | 0.39 | % | | | 0.39 | %(j) | | | 0.39 | %(i) | | | 0.39 | %(i) |
Waiver/Reimbursement | | | 0.06 | % | | | 0.06 | % | | | 0.06 | % | | | 0.06 | %(j) | | | 0.14 | %(l) | | | 0.14 | %(l) |
Net investment income | | | 1.75 | % | | | 2.09 | %(i) | | | 1.67 | % | | | 1.63 | %(j) | | | 1.53 | %(i) | | | 1.67 | %(i) |
Portfolio turnover rate | | | 7 | % | | | 5 | % | | | 6 | % | | | 7 | %(h) | | | 12 | % | | | 4 | % |
Net assets, end of period (000s) | | $ | 268,091 | | | $ | 101,119 | | | $ | 138,795 | | | $ | 87,528 | | | $ | 70,808 | | | $ | 37,088 | |
| (a) | The Fund changed its fiscal year end from March 31 to February 28. Per share data and total return reflect activity from April 1, 2006 through February 28, 2007. |
| (b) | On August 22, 2005, the existing Investor A shares were renamed Class A shares. |
| (c) | Per share data was calculated using the average shares outstanding during the period. |
| (d) | Net investment income per share reflects a special dividend. The effect of this dividend amounted to $0.07 per share. |
| (e) | Rounds to less than $0.01 per share. |
| (f) | Total return at net asset value assuming all distributions reinvested. |
| (g) | Had the investment advisor and/or any of its affiliates not waived fees or reimbursed a portion of expenses, total return would have been reduced. |
| (i) | The benefits derived from expense reductions had an impact of less than 0.01%. |
| (k) | Rounds to less than 0.01%. |
| (l) | Bank of America Corporation assumed certain non-recurring costs. Absent these non-recurring costs, the waiver/reimbursement ratio would have been 0.08% and 0.11% for the years ended March 31, 2006 and March 31, 2005, respectively. |
See Accompanying Notes to Financial Statements.
64
Financial Highlights – Columbia Large Cap Index Fund
Selected data for a share outstanding throughout each period is as follows:
| | | | | | | | | | | | | | | | | | | | |
| | | Year Ended
February 28, | | | Year Ended
February 29,
2008 | | | Period Ended
February 28,
2007 (a) | | | Period Ended
March 31,
2006 (b) | |
| Class B Shares | | 2010 | | | 2009 | | | | |
Net Asset Value, Beginning of Period | | $ | 14.20 | | | $ | 25.70 | | | $ | 27.14 | | | $ | 25.06 | | | $ | 23.49 | |
| | | | | |
Income from Investment Operations: | | | | | | | | | | | | | | | | | | | | |
Net investment income (c) | | | 0.19 | | | | 0.28 | | | | 0.24 | | | | 0.20 | | | | 0.10 | |
Net realized and unrealized gain (loss) on investments and futures contracts | | | 7.18 | | | | (11.53 | ) | | | (1.48 | ) | | | 2.16 | | | | 1.55 | |
| | | | | | | | | | | | | | | | | | | | |
Total from investment operations | | | 7.37 | | | | (11.25 | ) | | | (1.24 | ) | | | 2.36 | | | | 1.65 | |
| | | | | |
Less Distributions to Shareholders: | | | | | | | | | | | | | | | | | | | | |
From net investment income | | | (0.20 | ) | | | (0.25 | ) | | | (0.20 | ) | | | (0.28 | ) | | | (0.08 | ) |
Increase from Regulatory Settlements | | | — | (d) | | | — | | | | — | | | | — | | | | — | |
| | | | | |
Net Asset Value, End of Period | | $ | 21.37 | | | $ | 14.20 | | | $ | 25.70 | | | $ | 27.14 | | | $ | 25.06 | |
Total return (e)(f) | | | 51.94 | % | | | (43.94 | )% | | | (4.63 | )% | | | 9.47 | %(g) | | | 7.01 | %(g) |
| | | | | |
Ratios to Average Net Assets/
Supplemental Data: | | | | | | | | | | | | | | | | | | | | |
Net expenses before interest expense | | | 1.14 | % | | | 1.14 | %(h) | | | 1.14 | % | | | 1.14 | %(i) | | | 1.14 | %(h)(i) |
Interest expense | | | — | %(j) | | | — | | | | — | | | | — | | | | — | %(j) |
Net expenses | | | 1.14 | % | | | 1.14 | %(h) | | | 1.14 | % | | | 1.14 | %(i) | | | 1.14 | %(h)(i) |
Waiver/Reimbursement | | | 0.06 | % | | | 0.06 | % | | | 0.06 | % | | | 0.06 | %(i) | | | 0.12 | %(i)(k) |
Net investment income | | | 1.01 | % | | | 1.28 | %(h) | | | 0.86 | % | | | 0.87 | %(i) | | | 0.85 | %(h)(i) |
Portfolio turnover rate | | | 7 | % | | | 5 | % | | | 6 | % | | | 7 | %(g) | | | 12 | %(g) |
Net assets, end of period (000s) | | $ | 3,769 | | | $ | 3,248 | | | $ | 7,836 | | | $ | 10,302 | | | $ | 12,071 | |
| (a) | The Fund changed its fiscal year end from March 31 to February 28. Per share data and total return reflect activity from April 1, 2006 through February 28, 2007. |
| (b) | Class B shares commenced operations on September 23, 2005. Per share data and total return reflect activity from that date. |
| (c) | Per share data was calculated using the average shares outstanding during the period. |
| (d) | Rounds to less than $0.01 per share. |
| (e) | Total return at net asset value assuming all distributions reinvested and no contingent deferred sales charge. |
| (f) | Had the investment advisor and/or any of its affiliates not waived fees or reimbursed a portion of expenses, total return would have been reduced. |
| (h) | The benefits derived from expense reductions had an impact of less than 0.01%. |
| (j) | Rounds to less than 0.01%. |
| (k) | Bank of America Corporation assumed certain non-recurring costs. Absent these non-recurring costs, the waiver/reimbursement ratio would have been 0.06% for the period ended March 31, 2006. |
See Accompanying Notes to Financial Statements.
65
Financial Highlights – Columbia Large Cap Index Fund
Selected data for a share outstanding throughout each period is as follows:
| | | | | | | | | | | | | | | | | | | | | | | | |
| | | Year Ended
February 28, | | | Year Ended
February 29,
2008 | | | Period Ended
February 28,
2007 (a) | | | Year Ended
March 31, | |
| Class Z Shares | | 2010 | | | 2009 | | | | | 2006 (b) | | | 2005 | |
Net Asset Value, Beginning of Period | | $ | 14.18 | | | $ | 25.79 | | | $ | 27.29 | | | $ | 25.15 | | | $ | 22.82 | | | $ | 21.79 | |
| | | | | | |
Income from Investment Operations: | | | | | | | | | | | | | | | | | | | | | | | | |
Net investment income (c) | | | 0.38 | | | | 0.51 | | | | 0.53 | | | | 0.45 | | | | 0.42 | | | | 0.43 | (d) |
Net realized and unrealized gain (loss) on investments and futures contracts | | | 7.19 | | | | (11.59 | ) | | | (1.49 | ) | | | 2.16 | | | | 2.22 | | | | 1.01 | |
| | | | | | | | | | | | | | | | | | | | | | | | |
Total from investment operations | | | 7.57 | | | | (11.08 | ) | | | (0.96 | ) | | | 2.61 | | | | 2.64 | | | | 1.44 | |
| | | | | | |
Less Distributions to Shareholders: | | | | | | | | | | | | | | | | | | | | | | | | |
From net investment income | | | (0.38 | ) | | | (0.53 | ) | | | (0.54 | ) | | | (0.47 | ) | | | (0.31 | ) | | | (0.41 | ) |
Increase from Regulatory Settlements | | | — | (e) | | | — | | | | — | | | | — | | | | — | | | | — | |
| | | | | | |
Net Asset Value, End of Period | | $ | 21.37 | | | $ | 14.18 | | | $ | 25.79 | | | $ | 27.29 | | | $ | 25.15 | | | $ | 22.82 | |
Total return (f)(g) | | | 53.49 | % | | | (43.37 | )% | | | (3.72 | )% | | | 10.44 | %(h) | | | 11.59 | % | | | 6.57 | % |
| | | | | | |
Ratios to Average Net Assets/Supplemental Data: | | | | | | | | | | | | | | | | | | | | | | | | |
Net expenses before interest expense | | | 0.14 | % | | | 0.14 | %(i) | | | 0.14 | % | | | 0.14 | %(j) | | | 0.14 | %(i) | | | 0.14 | %(i) |
Interest expense | | | — | %(k) | | | — | | | | — | | | | — | | | | — | %(k) | | | — | |
Net expenses | | | 0.14 | % | | | 0.14 | %(i) | | | 0.14 | % | | | 0.14 | %(j) | | | 0.14 | %(i) | | | 0.14 | %(i) |
Waiver/Reimbursement | | | 0.06 | % | | | 0.06 | % | | | 0.06 | % | | | 0.06 | %(j) | | | 0.14 | %(l) | | | 0.14 | %(l) |
Net investment income | | | 2.00 | % | | | 2.31 | %(i) | | | 1.87 | % | | | 1.87 | %(j) | | | 1.78 | %(i) | | | 1.92 | %(i) |
Portfolio turnover rate | | | 7 | % | | | 5 | % | | | 6 | % | | | 7 | %(h) | | | 12 | % | | | 4 | % |
Net assets, end of period (000s) | | $ | 2,412,760 | | | $ | 1,359,555 | | | $ | 2,358,122 | | | $ | 2,571,196 | | | $ | 2,367,063 | | | $ | 1,486,203 | |
| (a) | The Fund changed its fiscal year end from March 31 to February 28. Per share data and total return reflect activity from April 1, 2006 through February 28, 2007. |
| (b) | On August 22, 2005, the existing Primary A shares were renamed Class Z shares. |
| (c) | Per share data was calculated using the average shares outstanding during the period. |
| (d) | Net investment income per share reflects a special dividend. The effect of this dividend amounted to $0.07 per share. |
| (e) | Rounds to less than $0.01 per share. |
| (f) | Total return at net asset value assuming all distributions reinvested. |
| (g) | Had the investment advisor and/or any of its affiliates not waived fees or reimbursed a portion of expenses, total return would have been reduced. |
| (i) | The benefits derived from expense reductions had an impact of less than 0.01%. |
| (k) | Rounds to less than 0.01%. |
| (l) | Bank of America Corporation assumed certain non-recurring costs. Absent these non-recurring costs, the waiver/reimbursement ratio would have been 0.08% and 0.11% for the years ended March 31, 2006 and March 31, 2005, respectively. |
See Accompanying Notes to Financial Statements.
66
Financial Highlights – Columbia Large Cap Enhanced Core Fund
Selected data for a share outstanding throughout each period is as follows:
| | | | | | | | | | | | | | | | | | | | | | | | |
| | | Year Ended
February 28, | | | Year Ended
February 29,
2008 | | | Period Ended
February 28,
2007 (a) | | | Year Ended
March 31, | |
| Class A Shares | | 2010 | | | 2009 | | | | | 2006 (b) | | | 2005 | |
Net Asset Value, Beginning of Period | | $ | 7.24 | | | $ | 12.91 | | | $ | 14.58 | | | $ | 14.13 | | | $ | 13.41 | | | $ | 13.56 | |
| | | | | | |
Income from Investment Operations: | | | | | | | | | | | | | | | | | | | | | | | | |
Net investment income (c) | | | 0.13 | | | | 0.18 | | | | 0.19 | | | | 0.16 | | | | 0.17 | | | | 0.17 | (d) |
Net realized and unrealized gain (loss) on investments, foreign currency, swap contracts, futures contracts and written options | | | 3.52 | | | | (5.69 | ) | | | (0.85 | ) | | | 1.24 | | | | 1.42 | | | | 0.66 | |
| | | | | | | | | | | | | | | | | | | | | | | | |
Total from investment operations | | | 3.65 | | | | (5.51 | ) | | | (0.66 | ) | | | 1.40 | | | | 1.59 | | | | 0.83 | |
| | | | | | |
Less Distributions to Shareholders: | | | | | | | | | | | | | | | | | | | | | | | | |
From net investment income | | | (0.16 | ) | | | (0.16 | ) | | | (0.15 | ) | | | (0.14 | ) | | | (0.15 | ) | | | (0.21 | ) |
From net realized gains | | | — | | | | — | | | | (0.86 | ) | | | (0.81 | ) | | | (0.72 | ) | | | (0.77 | ) |
| | | | | | | | | | | | | | | | | | | | | | | | |
Total distributions to shareholders | | | (0.16 | ) | | | (0.16 | ) | | | (1.01 | ) | | | (0.95 | ) | | | (0.87 | ) | | | (0.98 | ) |
Increase from Regulatory Settlements | | | — | (e) | | | — | | | | — | | | | — | | | | — | | | | — | |
| | | | | | |
Net Asset Value, End of Period | | $ | 10.73 | | | $ | 7.24 | | | $ | 12.91 | | | $ | 14.58 | | | $ | 14.13 | | | $ | 13.41 | |
Total return (f)(g) | | | 50.49 | % | | | (42.89 | )% | | | (5.29 | )% | | | 10.56 | %(h) | | | 12.35 | % | | | 6.59 | % |
| | | | | | |
Ratios to Average Net Assets/Supplemental Data: | | | | | | | | | | | | | | | | | | | | | | | | |
Net expenses before interest expense (i) | | | 0.89 | % | | | 0.75 | % | | | 0.75 | % | | | 0.75 | %(j) | | | 0.75 | % | | | 0.75 | % |
Interest expense | | | — | %(k) | | | — | %(k) | | | — | | | | — | | | | — | | | | — | |
Net expenses (i) | | | 0.89 | % | | | 0.75 | % | | | 0.75 | % | | | 0.75 | %(j) | | | 0.75 | % | | | 0.75 | % |
Waiver/Reimbursement | | | 0.03 | % | | | 0.07 | % | | | 0.04 | % | | | 0.08 | %(j) | | | 0.15 | %(l) | | | 0.25 | %(l) |
Net investment income (i) | | | 1.39 | % | | | 1.63 | % | | | 1.28 | % | | | 1.26 | %(j) | | | 1.23 | % | | | 1.27 | % |
Portfolio turnover rate | | | 122 | % | | | 246 | % | | | 207 | % | | | 230 | %(h) | | | 269 | % | | | 218 | % |
Net assets, end of period (000s) | | $ | 12,348 | | | $ | 9,291 | | | $ | 17,281 | | | $ | 17,399 | | | $ | 18,508 | | | $ | 17,653 | |
| (a) | The Fund changed its fiscal year end from March 31 to February 28. Per share data and total return reflect activity from April 1, 2006 through February 28, 2007. |
| (b) | On August 22, 2005, the existing Investor A shares were renamed Class A shares. |
| (c) | Per share data was calculated using the average shares outstanding during the period. |
| (d) | Net investment income per share reflects a special dividend. The effect of this dividend amounted to $0.04 per share. |
| (e) | Rounds to less than $0.01 per share. |
| (f) | Total return at net asset value assuming all distributions reinvested. |
| (g) | Had the investment advisor and/or any of its affiliates not waived fees or reimbursed a portion of expenses, total return would have been reduced. |
| (i) | The benefits derived from expense reductions had an impact of less than 0.01%. |
| (k) | Rounds to less than 0.01%. |
| (l) | Bank of America Corporation assumed certain non-recurring costs. Absent these non-recurring costs, the waiver/reimbursement ratio would have been 0.09% and 0.22% for the years ended March 31, 2006 and March 31, 2005, respectively. |
See Accompanying Notes to Financial Statements.
67
Financial Highlights – Columbia Large Cap Enhanced Core Fund
Selected data for a share outstanding throughout each period is as follows:
| | | | | | | | | | | | | | | | | | | | |
| | | Year Ended
February 28, | | | Year Ended
February 29,
2008 | | | Period Ended
February 28,
2007 (a) | | | Period Ended
March 31,
2006 (b) | |
| Class R Shares | | 2010 | | | 2009 | | | | |
Net Asset Value, Beginning of Period | | $ | 7.24 | | | $ | 12.90 | | | $ | 14.58 | | | $ | 14.13 | | | $ | 13.68 | |
| | | | | |
Income from Investment Operations: | | | | | | | | | | | | | | | | | | | | |
Net investment income (c) | | | 0.11 | | | | 0.16 | | | | 0.16 | | | | 0.13 | | | | 0.03 | |
Net realized and unrealized gain (loss) on investments, foreign currency, swap contracts, futures contracts and written options | | | 3.51 | | | | (5.69 | ) | | | (0.86 | ) | | | 1.23 | | | | 0.42 | |
| | | | | | | | | | | | | | | | | | | | |
Total from investment operations | | | 3.62 | | | | (5.53 | ) | | | (0.70 | ) | | | 1.36 | | | | 0.45 | |
| | | | | |
Less Distributions to Shareholders: | | | | | | | | | | | | | | | | | | | | |
From net investment income | | | (0.14 | ) | | | (0.13 | ) | | | (0.12 | ) | | | (0.10 | ) | | | — | |
From net realized gains | | | — | | | | — | | | | (0.86 | ) | | | (0.81 | ) | | | — | |
| | | | | | | | | | | | | | | | | | | | |
Total distributions to shareholders | | | (0.14 | ) | | | (0.13 | ) | | | (0.98 | ) | | | (0.91 | ) | | | — | |
Increase from Regulatory Settlements | | | — | (d) | | | — | | | | — | | | | — | | | | — | |
| | | | | |
Net Asset Value, End of Period | | $ | 10.72 | | | $ | 7.24 | | | $ | 12.90 | | | $ | 14.58 | | | $ | 14.13 | |
Total return (e)(f) | | | 50.02 | % | | | (43.01 | )% | | | (5.57 | )% | | | 10.30 | %(g) | | | 3.29 | %(g) |
| | | | | |
Ratios to Average Net Assets/
Supplemental Data: | | | | | | | | | | | | | | | | | | | | |
Net expenses before interest expense (h) | | | 1.14 | % | | | 1.00 | % | | | 1.00 | % | | | 1.00 | %(i) | | | 1.00 | %(i) |
Interest expense | | | — | %(j) | | | — | %(j) | | | — | | | | — | | | | — | |
Net expenses (h) | | | 1.14 | % | | | 1.00 | % | | | 1.00 | % | | | 1.00 | %(i) | | | 1.00 | %(i) |
Waiver/Reimbursement | | | 0.03 | % | | | 0.07 | % | | | 0.04 | % | | | 0.08 | %(i) | | | 0.09 | %(i)(k) |
Net investment income (h) | | | 1.08 | % | | | 1.46 | % | | | 1.09 | % | | | 1.02 | %(i) | | | 0.91 | %(i) |
Portfolio turnover rate | | | 122 | % | | | 246 | % | | | 207 | % | | | 230 | %(g) | | | 269 | %(g) |
Net assets, end of period (000s) | | $ | 112 | | | $ | 39 | | | $ | 46 | | | $ | 11 | | | $ | 10 | |
| (a) | The Fund changed its fiscal year end from March 31 to February 28. Per share data and total return reflect activity from April 1, 2006 through February 28, 2007. |
| (b) | Class R shares commenced operations on January 23, 2006. Per share data and total return reflect activity from that date. |
| (c) | Per share data was calculated using the average shares outstanding during the period. |
| (d) | Rounds to less than $0.01 per share. |
| (e) | Total return at net asset value assuming all distributions reinvested. |
| (f) | Had the investment advisor and/or any of its affiliates not waived fees or reimbursed a portion of expenses, total return would have been reduced. |
| (h) | The benefits derived from expense reductions had an impact of less than 0.01%. |
| (j) | Rounds to less than 0.01%. |
| (k) | Bank of America Corporation assumed certain non-recurring costs. Absent these non-recurring costs, the waiver/reimbursement ratio would have been 0.03% for the period ended March 31, 2006. |
See Accompanying Notes to Financial Statements.
68
Financial Highlights – Columbia Large Cap Enhanced Core Fund
Selected data for a share outstanding throughout the period is as follows:
| | | | |
| Class Y Shares | | Period Ended
February 28,
2010 (a) | |
Net Asset Value, Beginning of Period | | $ | 9.10 | |
| |
Income from Investment Operations: | | | | |
Net investment income (b) | | | 0.11 | |
Net realized and unrealized gain on investments and futures contracts | | | 1.64 | |
| | | | |
Total from investment operations | | | 1.75 | |
| |
Less Distributions to Shareholders: | | | | |
From net investment income | | | (0.15 | ) |
| |
Net Asset Value, End of Period | | $ | 10.70 | |
Total return (c)(d) | | | 19.23 | % |
| |
Ratios to Average Net Assets/Supplemental Data: | | | | |
Net expenses before interest expense (e)(f) | | | 0.57 | % |
Interest expense (f)(g) | | | — | % |
Net expenses (e)(f) | | | 0.57 | % |
Net investment income (e)(f) | | | 1.62 | % |
Portfolio turnover rate (d) | | | 122 | % |
Net assets, end of period (000s) | | $ | 60,329 | |
| (a) | Class Y shares commenced operations on July 15, 2009. Per share data and total return reflect activity from that date. |
| (b) | Per share data was calculated using the average shares outstanding during the period. |
| (c) | Total return at net asset value assuming all distributions reinvested and no initial sales charge or contingent deferred sales charge. |
| (e) | The benefits derived from expense reductions had an impact of less than 0.01%. |
| (g) | Rounds to less than 0.01%. |
See Accompanying Notes to Financial Statements.
69
Financial Highlights – Columbia Large Cap Enhanced Core Fund
Selected data for a share outstanding throughout each period is as follows:
| | | | | | | | | | | | | | | | | | | | | | | | |
| | | Year Ended
February 28, | | | Year Ended
February 29,
2008 | | | Period Ended
February 28,
2007 (a) | | | Year Ended
March 31, | |
| Class Z Shares | | 2010 | | | 2009 | | | | | 2006 (b) | | | 2005 | |
Net Asset Value, Beginning of Period | | $ | 7.22 | | | $ | 12.90 | | | $ | 14.60 | | | $ | 14.18 | | | $ | 13.45 | | | $ | 13.59 | |
| | | | | | |
Income from Investment Operations: | | | | | | | | | | | | | | | | | | | | | | | | |
Net investment income (c) | | | 0.16 | | | | 0.21 | | | | 0.23 | | | | 0.20 | | | | 0.20 | | | | 0.20 | (d) |
Net realized and unrealized gain (loss) on investments, foreign currency, swap contracts, futures contracts and written options | | | 3.50 | | | | (5.68 | ) | | | (0.85 | ) | | | 1.23 | | | | 1.44 | | | | 0.67 | |
| | | | | | | | | | | | | | | | | | | | | | | | |
Total from investment operations | | | 3.66 | | | | (5.47 | ) | | | (0.62 | ) | | | 1.43 | | | | 1.64 | | | | 0.87 | |
| | | | | | |
Less Distributions to Shareholders: | | | | | | | | | | | | | | | | | | | | | | | | |
From net investment income | | | (0.18 | ) | | | (0.21 | ) | | | (0.22 | ) | | | (0.20 | ) | | | (0.19 | ) | | | (0.24 | ) |
From net realized gains | | | — | | | | — | | | | (0.86 | ) | | | (0.81 | ) | | | (0.72 | ) | | | (0.77 | ) |
| | | | | | | | | | | | | | | | | | | | | | | | |
Total distributions to shareholders | | | (0.18 | ) | | | (0.21 | ) | | | (1.08 | ) | | | (1.01 | ) | | | (0.91 | ) | | | (1.01 | ) |
Increase from Regulatory Settlements | | | — | (e) | | | — | | | | — | | | | — | | | | — | | | | — | |
| | | | | | |
Net Asset Value, End of Period | | $ | 10.70 | | | $ | 7.22 | | | $ | 12.90 | | | $ | 14.60 | | | $ | 14.18 | | | $ | 13.45 | |
Total return (f)(g) | | | 50.82 | % | | | (42.69 | )% | | | (5.10 | )% | | | 10.79 | %(h) | | | 12.66 | % | | | 6.90 | % |
| | | | | | |
Ratios to Average Net Assets/Supplemental Data: | | | | | | | | | | | | | | | | | | | | | | | | |
Net expenses before interest expense (i) | | | 0.64 | % | | | 0.50 | % | | | 0.50 | % | | | 0.50 | %(j) | | | 0.50 | % | | | 0.50 | % |
Interest expense | | | — | %(k) | | | — | %(k) | | | — | | | | — | | | | — | | | | — | |
Net expenses (i) | | | 0.64 | % | | | 0.50 | % | | | 0.50 | % | | | 0.50 | %(j) | | | 0.50 | % | | | 0.50 | % |
Waiver/Reimbursement | | | 0.03 | % | | | 0.07 | % | | | 0.04 | % | | | 0.08 | %(j) | | | 0.15 | %(l) | | | 0.25 | %(l) |
Net investment income (i) | | | 1.65 | % | | | 1.86 | % | | | 1.54 | % | | | 1.52 | %(j) | | | 1.49 | % | | | 1.52 | % |
Portfolio turnover rate | | | 122 | % | | | 246 | % | | | 207 | % | | | 230 | %(h) | | | 269 | % | | | 218 | % |
Net assets, end of period (000s) | | $ | 451,824 | | | $ | 382,637 | | | $ | 796,550 | | | $ | 610,807 | | | $ | 495,099 | | | $ | 325,008 | |
| (a) | The Fund changed its fiscal year end from March 31 to February 28. Per share data and total return reflect activity from April 1, 2006 through February 28, 2007. |
| (b) | On August 22, 2005, the Fund’s Primary A shares were renamed Class Z shares. |
| (c) | Per share data was calculated using the average shares outstanding during the period. |
| (d) | Net investment income per share reflects a special dividend. The effect of this dividend amounted to $0.04 per share. |
| (e) | Rounds to less than $0.01 per share. |
| (f) | Total return at net asset value assuming all distributions reinvested. |
| (g) | Had the investment advisor and/or any of its affiliates not waived fees or reimbursed a portion of expenses, total return would have been reduced. |
| (i) | The benefits derived from expense reductions had an impact of less than 0.01%. |
| (k) | Rounds to less than 0.01%. |
| (l) | Bank of America Corporation assumed certain non-recurring costs. Absent these non-recurring costs, the waiver/reimbursement ratio would have been 0.09% and 0.22% for the years ended March 31, 2006 and March 31, 2005, respectively. |
See Accompanying Notes to Financial Statements.
70
Financial Highlights – Columbia Mid Cap Index Fund
Selected data for a share outstanding throughout each period is as follows:
| | | | | | | | | | | | | | | | | | | | | | | | |
| | | Year Ended
February 28, | | | Year Ended
February 29,
2008 | | | Period Ended
February 28,
2007 (a) | | | Year Ended
March 31, | |
| Class A Shares | | 2010 | | | 2009 | | | | | 2006 (b) | | | 2005 | |
Net Asset Value, Beginning of Period | | $ | 5.73 | | | $ | 10.86 | | | $ | 12.61 | | | $ | 12.49 | | | $ | 10.92 | | | $ | 10.26 | |
| | | | | | |
Income from Investment Operations: | | | | | | | | | | | | | | | | | | | | | | | | |
Net investment income (c) | | | 0.09 | | | | 0.12 | | | | 0.14 | | | | 0.12 | | | | 0.12 | | | | 0.10 | |
Net realized and unrealized gain (loss) on investments and futures contracts | | | 3.71 | | | | (4.55 | ) | | | (0.64 | ) | | | 0.64 | | | | 2.15 | | | | 0.91 | |
| | | | | | | | | | | | | | | | | | | | | | | | |
Total from investment operations | | | 3.80 | | | | (4.43 | ) | | | (0.50 | ) | | | 0.76 | | | | 2.27 | | | | 1.01 | |
| | | | | | |
Less Distributions to Shareholders: | | | | | | | | | | | | | | | | | | | | | | | | |
From net investment income | | | (0.09 | ) | | | (0.14 | ) | | | (0.12 | ) | | | (0.10 | ) | | | (0.12 | ) | | | (0.08 | ) |
From net realized gains | | | — | | | | (0.56 | ) | | | (1.13 | ) | | | (0.54 | ) | | | (0.58 | ) | | | (0.27 | ) |
| | | | | | | | | | | | | | | | | | | | | | | | |
Total distributions to shareholders | | | (0.09 | ) | | | (0.70 | ) | | | (1.25 | ) | | | (0.64 | ) | | | (0.70 | ) | | | (0.35 | ) |
| | | | | | |
Net Asset Value, End of Period | | $ | 9.44 | | | $ | 5.73 | | | $ | 10.86 | | | $ | 12.61 | | | $ | 12.49 | | | $ | 10.92 | |
Total return (d)(e) | | | 66.35 | % | | | (42.11 | )% | | | (4.94 | )% | | | 6.61 | %(f)(g) | | | 21.37 | % | | | 10.03 | % |
| | | | | | |
Ratios to Average Net Assets/Supplemental Data: | | | | | | | | | | | | | | | | | | | | | | | | |
Net expenses before interest expense (h) | | | 0.43 | % | | | 0.39 | % | | | 0.39 | % | | | 0.39 | %(i) | | | 0.39 | % | | | 0.39 | % |
Interest expense | | | — | | | | — | %(j) | | | — | | | | — | | | | — | %(j) | | | — | %(j) |
Net expenses (h) | | | 0.43 | % | | | 0.39 | % | | | 0.39 | % | | | 0.39 | %(i) | | | 0.39 | % | | | 0.39 | % |
Waiver/Reimbursement | | | 0.06 | % | | | 0.10 | % | | | 0.08 | % | | | 0.09 | %(i) | | | 0.15 | %(k) | | | 0.14 | %(k) |
Net investment income (h) | | | 1.09 | % | | | 1.36 | % | | | 1.13 | % | | | 1.08 | %(i) | | | 1.00 | % | | | 0.96 | % |
Portfolio turnover rate | | | 15 | % | | | 28 | % | | | 26 | % | | | 18 | %(f) | | | 24 | % | | | 18 | % |
Net assets, end of period (000s) | | $ | 168,264 | | | $ | 59,374 | | | $ | 72,095 | | | $ | 49,555 | | | $ | 18,115 | | | $ | 9,606 | |
| (a) | The Fund changed its fiscal year end from March 31 to February 28. Per share data and total return reflect activity from April 1, 2006 through February 28, 2007. |
| (b) | On August 22, 2005, the existing Investor A shares were renamed Class A shares. |
| (c) | Per share data was calculated using the average shares outstanding during the period. |
| (d) | Total return at net asset value assuming all distributions reinvested. |
| (e) | Had the investment advisor and/or any of its affiliates not waived fees or reimbursed a portion of expenses, total return would have been reduced. |
| (g) | Total return includes a voluntary reimbursement by the investment advisor for realized investment losses due to a trading error. This reimbursement had an impact of less than 0.01% on the Fund’s total return. |
| (h) | The benefits derived from expense reductions had an impact of less than 0.01%. |
| (j) | Rounds to less than 0.01%. |
| (k) | Bank of America Corporation assumed certain non-recurring costs. Absent these non-recurring costs, the waiver/reimbursement ratio would have been 0.09% and 0.11% for the years ended March 31, 2006 and March 31, 2005, respectively. |
See Accompanying Notes to Financial Statements.
71
Financial Highlights – Columbia Mid Cap Index Fund
Selected data for a share outstanding throughout each period is as follows:
| | | | | | | | | | | | | | | | | | | | | | | | |
| | | Year Ended
February 28, | | | Year Ended
February 29,
2008 | | | Period Ended
February 28,
2007 (a) | | | Year Ended
March 31, | |
| Class Z Shares | | 2010 | | | 2009 | | | | | 2006 (b) | | | 2005 | |
Net Asset Value, Beginning of Period | | $ | 5.71 | | | $ | 10.84 | | | $ | 12.61 | | | $ | 12.52 | | | $ | 10.94 | | | $ | 10.27 | |
| | | | | | |
Income from Investment Operations: | | | | | | | | | | | | | | | | | | | | | | | | |
Net investment income (c) | | | 0.11 | | | | 0.15 | | | | 0.17 | | | | 0.14 | | | | 0.14 | | | | 0.13 | |
Net realized and unrealized gain (loss) on investments and futures contracts | | | 3.69 | | | | (4.55 | ) | | | (0.64 | ) | | | 0.64 | | | | 2.17 | | | | 0.91 | |
| | | | | | | | | | | | | | | | | | | | | | | | |
Total from investment operations | | | 3.80 | | | | (4.40 | ) | | | (0.47 | ) | | | 0.78 | | | | 2.31 | | | | 1.04 | |
| | | | | | |
Less Distributions to Shareholders: | | | | | | | | | | | | | | | | | | | | | | | | |
From net investment income | | | (0.10 | ) | | | (0.17 | ) | | | (0.17 | ) | | | (0.15 | ) | | | (0.15 | ) | | | (0.10 | ) |
From net realized gains | | | — | | | | (0.56 | ) | | | (1.13 | ) | | | (0.54 | ) | | | (0.58 | ) | | | (0.27 | ) |
| | | | | | | | | | | | | | | | | | | | | | | | |
Total distributions to shareholders | | | (0.10 | ) | | | (0.73 | ) | | | (1.30 | ) | | | (0.69 | ) | | | (0.73 | ) | | | (0.37 | ) |
| | | | | | |
Net Asset Value, End of Period | | $ | 9.41 | | | $ | 5.71 | | | $ | 10.84 | | | $ | 12.61 | | | $ | 12.52 | | | $ | 10.94 | |
Total return (d)(e) | | | 66.71 | % | | | (41.92 | )% | | | (4.75 | )% | | | 6.82 | %(f)(g) | | | 21.71 | % | | | 10.32 | % |
| | | | | | |
Ratios to Average Net Assets/Supplemental Data: | | | | | | | | | | | | | | | | | | | | | | | | |
Net expenses before interest expense (h) | | | 0.18 | % | | | 0.14 | % | | | 0.14 | % | | | 0.14 | %(i) | | | 0.14 | % | | | 0.14 | % |
Interest expense | | | — | | | | — | %(j) | | | — | | | | — | | | | — | %(j) | | | — | %(j) |
Net expenses (h) | | | 0.18 | % | | | 0.14 | % | | | 0.14 | % | | | 0.14 | %(i) | | | 0.14 | % | | | 0.14 | % |
Waiver/Reimbursement | | | 0.06 | % | | | 0.10 | % | | | 0.08 | % | | | 0.09 | %(i) | | | 0.15 | %(k) | | | 0.14 | %(k) |
Net investment income (h) | | | 1.35 | % | | | 1.59 | % | | | 1.38 | % | | | 1.30 | %(i) | | | 1.25 | % | | | 1.21 | % |
Portfolio turnover rate | | | 15 | % | | | 28 | % | | | 26 | % | | | 18 | %(g) | | | 24 | % | | | 18 | % |
Net assets, end of period (000s) | | $ | 1,791,140 | | | $ | 971,538 | | | $ | 1,875,184 | | | $ | 2,033,709 | | | $ | 1,996,247 | | | $ | 1,601,005 | |
| (a) | The Fund changed its fiscal year end from March 31 to February 28. Per share data and total return reflect activity from April 1, 2006 through February 28, 2007. |
| (b) | On August 22, 2005, the existing Primary A shares were renamed Class Z shares. |
| (c) | Per share data was calculated using the average shares outstanding during the period. |
| (d) | Total return at net asset value assuming all distributions reinvested. |
| (e) | Had the investment advisor and/or any of its affiliates not waived fees or reimbursed a portion of expenses, total return would have been reduced. |
| (f) | Total return includes a voluntary reimbursement by the investment advisor for realized investment losses due to trading errors. This reimbursement had an impact of less than 0.01% on the Fund’s total return. |
| (h) | The benefits derived from expense reductions had an impact of less than 0.01%. |
| (j) | Rounds to less than 0.01%. |
| (k) | Bank of America Corporation assumed certain non-recurring costs. Absent these non-recurring costs, the waiver/reimbursement ratio would have been 0.09% and 0.11% for the years ended March 31, 2006 and March 31, 2005, respectively. |
See Accompanying Notes to Financial Statements.
72
Financial Highlights – Columbia Small Cap Index Fund
Selected data for a share outstanding throughout each period is as follows:
| | | | | | | | | | | | | | | | | | | | | | | | |
| | | Year Ended
February 28, | | | Year Ended
February 29,
2008 | | | Period Ended
February 28,
2007 (a) | | | Year Ended
March 31, | |
| Class A Shares | | 2010 | | | 2009 | | | | | 2006 (b) | | | 2005 | |
Net Asset Value, Beginning of Period | | $ | 8.58 | | | $ | 17.70 | | | $ | 22.19 | | | $ | 23.24 | | | $ | 19.16 | | | $ | 17.88 | |
| | | | | | |
Income from Investment Operations: | | | | | | | | | | | | | | | | | | | | | | | | |
Net investment income (c) | | | 0.08 | | | | 0.17 | | | | 0.18 | | | | 0.10 | | | | 0.13 | | | | 0.12 | |
Net realized and unrealized gain (loss) on investments and futures contracts | | | 5.40 | | | | (7.25 | ) | | | (2.05 | ) | | | 0.48 | | | | 4.32 | | | | 2.03 | |
| | | | | | | | | | | | | | | | | | | | | | | | |
Total from investment operations | | | 5.48 | | | | (7.08 | ) | | | (1.87 | ) | | | 0.58 | | | | 4.45 | | | | 2.15 | |
| | | | | | |
Less Distributions to Shareholders: | | | | | | | | | | | | | | | | | | | | | | | | |
From net investment income | | | (0.09 | ) | | | (0.17 | ) | | | (0.17 | ) | | | (0.09 | ) | | | (0.09 | ) | | | (0.10 | ) |
From net realized gains | | | — | | | | (1.87 | ) | | | (2.45 | ) | | | (1.54 | ) | | | (0.28 | ) | | | (0.77 | ) |
| | | | | | | | | | | | | | | | | | | | | | | | |
Total distributions to shareholders | | | (0.09 | ) | | | (2.04 | ) | | | (2.62 | ) | | | (1.63 | ) | | | (0.37 | ) | | | (0.87 | ) |
Increase from Regulatory Settlements | | | — | (d) | | | — | | | | — | | | | — | | | | — | | | | — | |
| | | | | | |
Net Asset Value, End of Period | | $ | 13.97 | | | $ | 8.58 | | | $ | 17.70 | | | $ | 22.19 | | | $ | 23.24 | | | $ | 19.16 | |
Total return (e) | | | 63.90 | %(f) | | | (42.43 | )% | | | (9.74 | )% | | | 3.09 | %(f)(g)(h) | | | 23.46 | %(f) | | | 12.58 | %(f) |
| | | | | | |
Ratios to Average Net Assets/
Supplemental Data: | | | | | | | | | | | | | | | | | | | | | | | | |
Net expenses before interest expense | | | 0.45 | % | | | 0.45 | %(i) | | | 0.45 | %(i) | | | 0.45 | %(i)(j) | | | 0.46 | %(i) | | | 0.46 | %(i) |
Interest expense | | | — | | | | — | %(k) | | | — | %(k) | | | — | %(j)(k) | | | — | %(k) | | | — | |
Net expenses | | | 0.45 | % | | | 0.45 | %(i) | | | 0.45 | %(i) | | | 0.45 | %(i)(j) | | | 0.46 | %(i) | | | 0.46 | %(i) |
Waiver/Reimbursement | | | — | %(k) | | | — | | | | — | | | | — | %(j)(k) | | | 0.07 | %(l) | | | 0.11 | %(l) |
Net investment income | | | 0.68 | % | | | 1.15 | %(i) | | | 0.81 | %(i) | | | 0.51 | %(i)(j) | | | 0.62 | %(i) | | | 0.64 | %(i) |
Portfolio turnover rate | | | 14 | % | | | 35 | % | | | 24 | % | | | 15 | %(g) | | | 20 | % | | | 16 | % |
Net assets, end of period (000s) | | $ | 96,238 | | | $ | 33,273 | | | $ | 46,078 | | | $ | 51,681 | | | $ | 45,365 | | | $ | 14,337 | |
| (a) | The Fund changed its fiscal year end from March 31 to February 28. Per share data and total return reflect activity from April 1, 2006 through February 28, 2007. |
| (b) | On August 22, 2005, the existing Investor A shares were renamed Class A shares. |
| (c) | Per share data was calculated using the average shares outstanding during the period. |
| (d) | Rounds to less than $0.01 per share. |
| (e) | Total return at net asset value assuming all distributions reinvested. |
| (f) | Had the investment advisor and/or any of its affiliates not waived fees or reimbursed a portion of expenses, total return would have been reduced. |
| (h) | Total return includes a voluntary reimbursement by the investment advisor for realized investment losses due to trading errors. This reimbursement had an impact of less than 0.01% on the Fund’s total return. |
| (i) | The benefits derived from expense reductions had an impact of less than 0.01%. |
| (k) | Rounds to less than 0.01%. |
| (l) | Bank of America Corporation assumed certain non-recurring costs. Absent these non-recurring costs, the waiver/reimbursement ratio would have been 0.01% and 0.08% for the fiscal years ended March 31, 2006 and March 31, 2005, respectively. |
See Accompanying Notes to Financial Statements.
73
Financial Highlights – Columbia Small Cap Index Fund
Selected data for a share outstanding throughout each period is as follows:
| | | | | | | | | | | | | | | | | | | | | | | | |
| | | Year Ended
February 28, | | | Year Ended
February 29,
2008 | | | Period Ended
February 28,
2007 (a) | | | Year Ended
March 31, | |
| Class Z Shares | | 2010 | | | 2009 | | | | | 2006 (b) | | | 2005 | |
Net Asset Value, Beginning of Period | | $ | 8.60 | | | $ | 17.76 | | | $ | 22.27 | | | $ | 23.35 | | | $ | 19.24 | | | $ | 17.95 | |
| | | | | | |
Income from Investment Operations: | | | | | | | | | | | | | | | | | | | | | | | | |
Net investment income (c) | | | 0.12 | | | | 0.21 | | | | 0.23 | | | | 0.15 | | | | 0.18 | | | | 0.16 | |
Net realized and unrealized gain (loss) on investments and futures contracts | | | 5.40 | | | | (7.27 | ) | | | (2.05 | ) | | | 0.48 | | | | 4.35 | | | | 2.04 | |
| | | | | | | | | | | | | | | | | | | | | | | | |
Total from investment operations | | | 5.52 | | | | (7.06 | ) | | | (1.82 | ) | | | 0.63 | | | | 4.53 | | | | 2.20 | |
| | | | | | |
Less Distributions to Shareholders: | | | | | | | | | | | | | | | | | | | | | | | | |
From net investment income | | | (0.11 | ) | | | (0.23 | ) | | | (0.24 | ) | | | (0.17 | ) | | | (0.14 | ) | | | (0.14 | ) |
From net realized gains | | | — | | | | (1.87 | ) | | | (2.45 | ) | | | (1.54 | ) | | | (0.28 | ) | | | (0.77 | ) |
| | | | | | | | | | | | | | | | | | | | | | | | |
Total distributions to shareholders | | | (0.11 | ) | | | (2.10 | ) | | | (2.69 | ) | | | (1.71 | ) | | | (0.42 | ) | | | (0.91 | ) |
Increase from Regulatory Settlements | | | — | (d) | | | — | | | | — | | | | — | | | | — | | | | — | |
| | | | | | |
Net Asset Value, End of Period | | $ | 14.01 | | | $ | 8.60 | | | $ | 17.76 | | | $ | 22.27 | | | $ | 23.35 | | | $ | 19.24 | |
Total return (e) | | | 64.34 | %(f) | | | (42.28 | )% | | | (9.52 | )% | | | 3.34 | %(f)(g)(h) | | | 23.80 | %(f) | | | 12.84 | %(f) |
| | | | | | |
Ratios to Average Net Assets/Supplemental Data: | | | | | | | | | | | | | | | | | | | | | | | | |
Net expenses before interest expense | | | 0.20 | % | | | 0.20 | %(i) | | | 0.20 | %(i) | | | 0.20 | %(i)(j) | | | 0.21 | %(i) | | | 0.21 | %(i) |
Interest expense | | | — | | | | — | %(k) | | | — | %(k) | | | — | %(j)(k) | | | — | %(k) | | | — | |
Net expenses | | | 0.20 | % | | | 0.20 | %(i) | | | 0.20 | %(i) | | | 0.20 | %(i)(j) | | | 0.21 | %(i) | | | 0.21 | %(i) |
Waiver/Reimbursement | | | — | %(k) | | | — | | | | — | | | | — | %(j)(k) | | | 0.07 | %(l) | | | 0.11 | %(l) |
Net investment income | | | 0.95 | % | | | 1.39 | %(i) | | | 1.06 | %(i) | | | 0.76 | %(i)(j) | | | 0.87 | %(i) | | | 0.89 | %(i) |
Portfolio turnover rate | | | 14 | % | | | 35 | % | | | 24 | % | | | 15 | %(g) | | | 20 | % | | | 16 | % |
Net assets, end of period (000s) | | $ | 1,309,989 | | | $ | 660,059 | | | $ | 1,244,382 | | | $ | 1,521,291 | | | $ | 1,606,958 | | | $ | 1,072,113 | |
| (a) | The Fund changed its fiscal year end from March 31 to February 28. Per share data and total return reflect activity from April 1, 2006 through February 28, 2007. |
| (b) | On August 22, 2005 the existing Primary A shares were renamed Class Z shares. |
| (c) | Per share data was calculated using the average shares outstanding during the period. |
| (d) | Rounds to less than $0.01 per share. |
| (e) | Total return at net asset value assuming all distributions reinvested. |
| (f) | Had the investment advisor and/or any of its affiliates not waived fees or reimbursed a portion of expenses, total return would have been reduced. |
| (h) | Total return includes a voluntary reimbursement by the investment advisor for realized investment losses due to trading errors. This reimbursement had an impact of less than 0.01% on the Fund’s total return. |
| (i) | The benefits derived from expense reductions had an impact of less than 0.01%. |
| (k) | Rounds to less than 0.01%. |
| (l) | Bank of America Corporation assumed certain non-recurring costs. Absent these non-recurring costs, the waiver/reimbursement ratio would have been 0.01% and 0.08% for the fiscal years ended March 31, 2006 and March 31, 2005, respectively. |
See Accompanying Notes to Financial Statements.
74
Notes to Financial Statements – Index Funds
February 28, 2010
Note 1. Organization
Columbia Funds Series Trust (the “Trust”) is registered under the Investment Company Act of 1940, as amended (the “1940 Act”), as an open-end investment company organized as a Delaware statutory trust. Information presented in these financial statements pertains to the following series of the Trust (each a “Fund” and collectively, the “Funds”):
Columbia Large Cap Index Fund
Columbia Large Cap Enhanced Core Fund
Columbia Mid Cap Index Fund
Columbia Small Cap Index Fund
Investment Objectives
Columbia Large Cap Index Fund seeks total return before fees and expenses that corresponds to the total return of the Standard and Poor’s 500 Index. Columbia Large Cap Enhanced Core Fund seeks total return before fees and expenses that exceeds the total return of the Standard and Poor’s 500 Index. Columbia Mid Cap Index Fund seeks total return before fees and expenses that corresponds to the total return of the Standard and Poor’s MidCap 400 Index. Columbia Small Cap Index Fund seeks total return before fees and expenses that corresponds to the total return of the Standard and Poor’s SmallCap 600 Index.
Fund Shares
The Trust may issue an unlimited number of shares. Columbia Mid Cap Index Fund and Columbia Small Cap Index Fund each offer two classes of shares: Class A and Class Z shares. Columbia Large Cap Index Fund offers three classes of shares: Class A, Class B and Class Z shares. Columbia Large Cap Enhanced Core Fund offers four classes of shares: Class A, Class R, Class Y and Class Z shares. Each share class has its own expense structure and sales charges, as applicable. Class Y shares commenced operations effective July 15, 2009.
Effective June 22, 2009, Columbia Large Cap Index Fund no longer accepts investments from new or existing investors in the Fund’s Class B shares, except in connection with the reinvestment of any dividend and/or capital gain distributions in Class B shares of the Fund and exchanges by existing Class B shareholders of the other Columbia Funds.
Class A, Class R, Class Y and Class Z shares are offered continuously at net asset value. Class B shares are subject to a maximum contingent deferred sales charge (“CDSC”) of 5.00% based upon the holding period after purchase. Class B shares will convert to Class A shares eight years after purchase. There are certain restrictions on the purchase of Class R, Class Y and Class Z shares, as described in the Funds’ prospectuses.
Note 2. Significant Accounting Policies
The preparation of financial statements in accordance with accounting principles generally accepted in the United States of America (“GAAP”) requires management to make certain estimates and assumptions that affect the reported amounts of assets and liabilities, the disclosure of contingent assets and liabilities at the date of the financial statements and the reported amounts of revenue and expenses during the reporting period. Actual results could differ from those estimates.
The following is a summary of significant accounting policies consistently followed by the Funds in the preparation of their financial statements.
Security Valuation
Equity securities, exchange-traded funds and securities of certain investment companies are valued at the last sale price on the principal exchange on which they trade, except for securities traded on the NASDAQ, which are valued at the NASDAQ official close price. Unlisted securities or listed securities for which there were no sales during the day are valued at the closing bid price on such exchanges or over-the-counter markets.
Short-term investments maturing in 60 days or less are valued at amortized cost, which approximates market value.
Futures contracts are valued at the settlement price established each day by the board of trade or exchange on which they are traded.
Investments for which market quotations are not readily available, or that have quotations which management believes are not reliable, are valued at fair value as determined in good faith under consistently applied procedures established by and under the general supervision of the Board of Trustees. If a security is valued at fair value, such value is likely to be different from the last quoted market price for the security. The determination of fair value often
75
Index Funds
February 28, 2010
requires significant judgment. To determine fair value, management may use assumptions including but not limited to future cash flows and estimated risk premiums. Multiple inputs from various sources may be used to determine value.
GAAP establishes a hierarchy that prioritizes the inputs to valuation techniques used to measure fair value giving the highest priority to unadjusted quoted prices in active markets for identical securities (level 1 measurements) and the lowest priority to unobservable inputs (level 3 measurements) when market prices are not readily available or reliable. The three levels of the fair value hierarchy are described below:
| n | | Level 1 — quoted prices in active markets for identical securities |
| n | | Level 2 — prices determined using other significant observable inputs (including quoted prices for similar securities, interest rates, prepayment speeds, credit risk and others) |
| n | | Level 3 — prices determined using significant unobservable inputs. In situations where quoted prices or observable inputs are unavailable or less reliable, unobservable inputs may be used. Unobservable inputs may include management’s own assumptions about the factors market participants would use in pricing an investment. |
The inputs or methodology used for valuing securities are not necessarily an indication of the risk associated with investing in those securities.
Security Transactions
Security transactions are accounted for on the trade date. Cost is determined and gains (losses) are based upon the specific identification method for both financial statement and federal income tax purposes.
Repurchase Agreements
Each Fund may engage in repurchase agreement transactions with institutions that Columbia Management Advisors, LLC (“Columbia”), the Funds’ investment advisor, has determined are creditworthy. Each Fund, through its custodian, receives delivery of the underlying securities collateralizing a repurchase agreement. Columbia is responsible for determining that the collateral is at least equal, at all times, to the value of the repurchase obligation including interest. A repurchase agreement transaction involves certain risks in the event of default or insolvency of the counterparty. These risks include possible delays in or restrictions on each Fund’s ability to dispose of the underlying securities and a possible decline in the value of the underlying securities during the period while the Funds seek to assert their rights.
Foreign Currency Transactions and Translations
The values of all assets and liabilities quoted in foreign currencies are translated into U.S. dollars at that day’s exchange rates. Net realized and unrealized gains (losses) on foreign currency transactions and translations include gains (losses) arising from the fluctuation in exchange rates between trade and settlement dates on securities transactions, gains (losses) arising from the disposition of foreign currency and currency gains (losses) between the accrual and payment dates on dividends, interest income and foreign withholding taxes.
For financial statement purposes, the Funds do not distinguish that portion of gains (losses) on investments which is due to changes in foreign exchange rates from that which is due to changes in market prices of the investments. Such fluctuations are included with the net realized and unrealized gains (losses) on investments on the Statements of Operations.
Income Recognition
Interest income is recorded on the accrual basis.
Corporate actions and dividend income are recorded on the ex-date except for certain foreign securities which are recorded as soon after the ex-date as the Funds become aware of such, net of any non-reclaimable tax withholdings.
Distributions received from real estate investment trusts (REITs) in excess of their income are recorded as a reduction of the cost of the related investments. If the Funds no longer own the applicable securities, any distributions received in excess of income are recorded as realized gains.
Expenses
General expenses of the Trust are allocated to the Funds and other series of the Trust based upon relative net assets or other expense allocation methodologies determined by the nature of the expense. Expenses directly attributable to a specific class of shares are charged to that share class. Expenses directly attributable to a Fund are charged to such Fund.
76
Index Funds
February 28, 2010
Determination of Class Net Asset Value
All income, expenses (other than class-specific expenses, as shown on the Statements of Operations) and realized and unrealized gains (losses) are allocated to each class of the Funds on a daily basis, based on the relative net assets of each class, for purposes of determining the net asset value of each class.
Federal Income Tax Status
Each Fund intends to qualify each year as a “regulated investment company” under Subchapter M of the Internal Revenue Code, as amended, and will distribute substantially all of its taxable income for its tax year, and as such will not be subject to federal income taxes. In addition, each Fund intends to distribute in each calendar year substantially all of its net investment income, capital gains and certain other amounts, if any, such that each Fund should not be subject to federal excise tax. Therefore, no federal income or excise tax provision is recorded.
Distributions to Shareholders
Distributions from net investment income, if any, for Columbia Large Cap Index Fund, Columbia Mid Cap Index Fund and Columbia Small Cap Index Fund are declared and paid semiannually. Distributions from net investment income, if any, for Columbia Large Cap Enhanced Core Fund are declared and paid annually. Net realized capital gains, if any, are distributed at least annually for each of the Funds. Income distributions and capital gain distributions are determined in accordance with federal income tax regulations which may differ from GAAP.
Indemnification
In the normal course of business, each Fund enters into contracts that contain a variety of representations and warranties and which provide general indemnities. A Fund’s maximum exposure under these arrangements is unknown because this would involve future claims against a Fund. Also, under the Trust’s organizational documents and by contract, the Trustees and officers of the Trust are indemnified against certain liabilities that may arise out of actions relating to their duties to the Trust. However, based on experience, the Funds expect the risk of loss due to these representations, warranties and indemnities to be minimal.
Note 3. Federal Tax Information
The timing and character of income and capital gain distributions are determined in accordance with income tax regulations, which may differ from GAAP. Reclassifications are made to each Fund’s capital accounts for permanent tax differences to reflect income and gains available for distribution (or available capital loss carryforwards) under income tax regulations.
For the year ended February 28, 2010, permanent book and tax basis differences resulting primarily from differing treatments for proceeds from litigation settlements and foreign currency transactions were identified and reclassified among the components of the Fund’s net assets as follows:
| | | | | | | | | | |
| | | | | | | | |
| | | Undistributed Net Investment
Income | | Accumulated Net Realized
Gain/Loss | | Paid-In
Capital | |
Columbia
Large Cap
Index Fund | | $ | 24 | | $ | — | | $ | (24 | ) |
Columbia
Large Cap
Enhanced
Core Fund | | | 3,774 | | | — | | | (3,774 | ) |
Columbia
Small Cap
Index Fund | | | 6,338 | | | 308 | | | (6,646 | ) |
Net investment income and net realized gains (losses), as disclosed on the Statements of Operations, and net assets were not affected by these reclassifications.
The tax character of distributions paid during the years ended February 28, 2010 and February 28, 2009 was as follows:
February 28, 2010
| | | | | | |
| | | | | |
| | | Ordinary
Income* | | Long-Term
Capital Gains |
Columbia Large Cap Index Fund | | $ | 44,093,226 | | $ | — |
Columbia Large Cap Enhanced Core Fund | | | 9,482,069 | | | — |
Columbia Mid Cap Index Fund | | | 20,854,187 | | | — |
Columbia Small Cap Index Fund | | | 11,031,891 | | | — |
77
Index Funds
February 28, 2010
February 28, 2009
| | | | | | |
| | | | | |
| | | Ordinary
Income* | | Long-Term
Capital Gains |
Columbia Large Cap Index Fund | | $ | 52,713,343 | | $ | — |
Columbia Large Cap Enhanced Core Fund | | | 11,987,661 | | | — |
Columbia Mid Cap Index Fund | | | 30,143,307 | | | 96,931,916 |
Columbia Small Cap Index Fund | | | 21,983,814 | | | 130,767,641 |
| * | For tax purposes short-term capital gain distributions, if any, are considered ordinary income distributions. |
As of February 28, 2010, the components of distributable earnings on a tax basis were as follows:
| | | | | | | | | |
| | | | | | | |
| | | Undistributed
Ordinary Income | | Undistributed Long-Term Capital Gains | | Net Unrealized Appreciation (Depreciation)* |
Columbia Large Cap Index Fund | | $ | 7,230,892 | | $ | — | | $ | 264,522,457 |
Columbia Large Cap Enhanced Core Fund | | | 644,312 | | | — | | | 109,894,185 |
Columbia Mid Cap Index Fund | | | 650,701 | | | — | | | 125,731,599 |
Columbia Small Cap Index Fund | | | 265,763 | | | — | | | 80,083,481 |
| * | The differences between book-basis and tax-basis net unrealized appreciation/depreciation are primarily due to deferral of losses from wash sales and futures marked to market. |
Unrealized appreciation and depreciation at February 28, 2010, based on cost of investments for federal income tax purposes was:
| | | | | | | | | | |
| | | | | | | | |
| | | Unrealized Appreciation | | Unrealized Depreciation | | | Net Unrealized Appreciation (Depreciation) |
Columbia Large Cap Index Fund | | $ | 706,470,176 | | $ | (441,947,719 | ) | | $ | 264,522,457 |
Columbia Large Cap Enhanced Core Fund | | | 118,996,522 | | | (9,102,337 | ) | | | 109,894,185 |
Columbia Mid Cap Index Fund | | | 387,881,577 | | | (262,149,978 | ) | | | 125,731,599 |
Columbia Small Cap Index Fund | | | 304,796,695 | | | (224,713,214 | ) | | | 80,083,481 |
The following capital loss carryforwards may be available to reduce taxable income arising from future net realized gains on investments, if any, to the extent permitted by the Internal Revenue Code:
| | | |
| | | |
| Columbia Large Cap Index Fund | | |
Expiring in 2011 | | $ | 100,648,176 |
Expiring in 2013 | | | 19,822,029 |
Expiring in 2014 | | | 13,154,769 |
Expiring in 2015 | | | 108,188,982 |
Expiring in 2017 | | | 19,873,230 |
Total | | $ | 261,687,186 |
| | | |
| | | |
| Columbia Large Cap Enhanced Core Fund | | |
Expiring in 2017 | | $ | 125,697,411 |
Expiring in 2018 | | | 132,297,711 |
Total | | $ | 257,995,122 |
| | | |
| | | |
| Columbia Mid Cap Index Fund | | |
Expiring in 2018 | | $ | 31,857,274 |
78
Index Funds
February 28, 2010
| | | |
| | | |
| Columbia Small Cap Index Fund | | |
Expiring in 2018 | | $ | 36,774,231 |
The availability of a portion of the capital loss carryforwards acquired by Columbia Large Cap Index Fund as a result of its merger with Columbia Large Company Index Fund may be limited in a given year.
Capital loss carryforwards of $32,289,885 were utilized during the year ended February 28, 2010 for Columbia Large Cap Index Fund.
Under current tax rules, certain currency and capital losses realized after October 31 may be deferred and treated as occurring on the first day of the following fiscal year. As of February 28, 2010, post-October capital losses attributed to security transactions were deferred to March 1, 2010 as follows:
| | |
| | | |
Columbia Large Cap Index Fund | | $2,572,491 |
Management is required to determine whether a tax position of the Funds is more likely than not to be sustained upon examination by the applicable taxing authority, including resolution of any related appeals or litigation processes, based on the technical merits of the position. The tax benefit to be recognized by each Fund is measured as the largest amount of benefit that is greater than fifty percent likely of being realized upon ultimate settlement. Management is not aware of any tax positions for which it is reasonably possible that the total amounts of unrecognized tax benefits will significantly change in the next twelve months. However, management’s conclusions may be subject to review and adjustment at a later date based on factors including, but not limited to, new tax laws, regulations, and administrative interpretations (including relevant court decisions). The Funds’ federal tax returns for the prior three fiscal years remain subject to examination by the Internal Revenue Service.
Note 4. Fees and Compensation Paid to Affiliates
Investment Advisory Fee
Columbia, an indirect, wholly owned subsidiary of Bank of America Corporation (“BOA”), provides investment advisory services to the Funds. In rendering investment advisory services to the Funds, Columbia may use the portfolio management and research resources of Columbia Management Pte. Ltd (“Pte”), an affiliate of Columbia. Columbia, from the investment advisory fee it receives from the Funds, pays Pte. a fee for its advisory services. Columbia receives a monthly investment advisory fee based on each Fund’s average daily net assets at the following annual rates:
| | | | | | | | | | | | | | | | | | |
| | | | | | | | | | | | | | | | | | | |
| | | First
$500
Million | | | $500
Million
to $1
Billion | | | $1
Billion
to $1.5
Billion | | | $1.5
Billion
to $3
Billion | | | $3
Billion
to $6
Billion | | | Over $6
Billion | |
Columbia Large Cap Index Fund | | 0.10 | % | | 0.10 | % | | 0.10 | % | | 0.10 | % | | 0.10 | % | | 0.10 | % |
Columbia Large Cap Enhanced Core Fund | | 0.35 | % | | 0.30 | % | | 0.25 | % | | 0.20 | % | | 0.18 | % | | 0.16 | % |
Columbia Mid Cap Index Fund | | 0.10 | % | | 0.10 | % | | 0.10 | % | | 0.10 | % | | 0.10 | % | | 0.10 | % |
Columbia Small Cap Index Fund | | 0.10 | % | | 0.10 | % | | 0.10 | % | | 0.10 | % | | 0.10 | % | | 0.10 | % |
For the year ended February 28, 2010, the annualized effective investment advisory fee rates for the Funds, as a percentage of each Fund’s average daily net assets, were as follows:
| | | |
| | | | |
| | | Effective Rates | |
Columbia Large Cap Index Fund | | 0.10 | % |
Columbia Large Cap Enhanced Core Fund | | 0.35 | % |
Columbia Mid Cap Index Fund | | 0.10 | % |
Columbia Small Cap Index Fund | | 0.10 | % |
Bank of America, N.A., an indirect parent company of Columbia, entered into an agreement dated September 29, 2009, to sell a portion of the asset management business of Columbia Management Group, LLC to Ameriprise Financial, Inc. (“Ameriprise Financial”). The transaction (“Transaction”) includes the sale of the part of the asset management business that advises long-term mutual funds, including the Funds. The Transaction is subject to certain approvals and other conditions to closing, and is currently
79
Index Funds
February 28, 2010
expected to close on or about May 1, 2010 (the “Closing”). In connection with the Closing, certain changes will occur, including a change in the entities serving as the investment advisor, administrator, distributor and transfer agent of the Funds. RiverSource Investments, LLC (the “New Advisor”), a subsidiary of Ameriprise Financial, will become the investment advisor of the Funds upon the Closing. The New Advisor will serve as investment advisor under a new investment management services agreement effective upon the closing. The New Advisor expects to change its name to Columbia Management Investment Advisers, LLC upon or shortly after the Closing. Effective upon the Closing, as the context requires, references to Columbia shall be deemed to refer to the New Advisor.
Administration Fee
Columbia provides administrative and other services to the Funds. For Columbia Large Cap Index Fund and Columbia Small Cap Index Fund, Columbia, from the administration fee it receives from each Fund, pays all operating expenses of the Funds, with the exception of brokerage fees and commissions, interest, fees and expenses of Trustees who are not officers, directors or employees of Columbia or its affiliates, distribution (Rule 12b-1) and/or shareholder servicing fees and any extraordinary non-recurring expenses that may arise, including litigation.
For Columbia Large Cap Enhanced Core Fund and Columbia Mid Cap Index Fund, Columbia is entitled to receive an administration fee less the fees payable by the Funds as described under the Pricing and Bookkeeping Fees note below.
Columbia receives a monthly administration fee based on each Fund’s average daily net assets at the following annual rates:
| | | |
| | | | |
| | | Annual Fee Rate | |
Columbia Large Cap Index Fund | | 0.10 | % |
Columbia Large Cap Enhanced Core Fund | | 0.17 | % |
Columbia Mid Cap Index Fund | | 0.10 | % |
Columbia Small Cap Index Fund | | 0.10 | % |
The New Advisor will become the administrator of the Funds under a new administrative services agreement effective upon the Closing.
Pricing and Bookkeeping Fees
The Funds have entered into a Financial Reporting Services Agreement (the “Financial Reporting Services Agreement”) with State Street Bank and Trust Company (“State Street”) and Columbia pursuant to which State Street provides financial reporting services to the Funds. The Funds have also entered into an Accounting Services Agreement (collectively with the Financial Reporting Services Agreement, the “State Street Agreements”) with State Street and Columbia pursuant to which State Street provides accounting services to the Funds. Under the State Street Agreements, Columbia Large Cap Enhanced Core Fund and Columbia Mid Cap Index Fund pay State Street an annual fee of $38,000 paid monthly plus an additional monthly fee based on an annualized percentage rate of average daily net assets of each Fund for the month. The aggregate fee per Fund will not exceed $140,000 per year (exclusive of out-of-pocket expenses and charges). The Funds also reimburse State Street for certain out-of-pocket expenses and charges.
Among other updates to the State Street Agreements, Columbia will assign and delegate its rights and obligations thereunder to the New Advisor upon the Closing.
The Funds have entered into a Pricing and Bookkeeping Oversight and Services Agreement (the “Services Agreement”) with Columbia. Under the Services Agreement, Columbia provides services related to Fund expenses and the requirements of the Sarbanes-Oxley Act of 2002, and provides oversight of the accounting and financial reporting services provided by State Street. Under the Services Agreement, Columbia Large Cap Enhanced Core Fund and Columbia Mid Cap Index Fund reimburse Columbia for out-of-pocket expenses and charges, including fees payable to third parties, such as for pricing the Funds’ portfolio securities, incurred by Columbia in the performance of services under the Services Agreement.
The Services Agreement will be terminated upon the Closing, and the services provided thereunder will be covered under the administrative services agreement with the New Advisor.
Transfer Agent Fee
Columbia Management Services, Inc. (the “Transfer Agent”), an affiliate of Columbia and an indirect, wholly owned subsidiary of BOA, provides shareholder services to the Funds and has contracted with Boston Financial Data Services (“BFDS”) to serve as sub-transfer agent.
80
Index Funds
February 28, 2010
Columbia Large Cap Enhanced Core Fund and Columbia Mid Cap Index Fund pay a monthly fee to the Transfer Agent for its services. All share classes of these two Funds, with the exception of Class Y shares (the “Other Share Classes”), pay a monthly service fee (the “aggregate fee”) based on the following:
| (i) | Effective November 1, 2009, an annual rate of $22.36 is applied to the aggregate number of accounts for the Other Share Classes. Prior to November 1, 2009, the annual rate was $17.34 per account. |
| (ii) | An allocated portion of fees for wire, telephone and redemption orders, Individual Retirement Account (“IRA”) trustee agent fees and account transcript fees due to the Transfer Agent from shareholders of the Funds and credits (net of bank charges) earned with respect to balances in accounts the Transfer Agent maintains in connection with its services to the Funds. The Transfer Agent also receives reimbursement for certain out-of-pocket expenses. |
The aggregate fee is allocated to the Other Share Classes based on the relative average daily net assets of each share class.
The Class Y shares of Columbia Large Cap Enhanced Core Fund pay a monthly service fee based on the following:
| (i) | Effective November 1, 2009, an annual rate of $22.36 is applied to the aggregate number of accounts for Class Y shares. Prior to November 1, 2009, the annual rate was $17.34 per account. |
| (ii) | An allocated portion of fees for wire, telephone and redemption orders, IRA trustee agent fees and account transcript fees due to the Transfer Agent from shareholders of the Funds and credits (net of bank charges) earned with respect to balances in accounts the Transfer Agent maintains in connection with its services to the Funds. The Transfer Agent also receives reimbursement for certain out-of-pocket expenses. |
The Transfer Agent is also entitled to receive reimbursement of certain sub-transfer agent fees paid by the Transfer Agent (exclusive of BFDS fees), calculated based on the combined assets held in the Other Share Classes in omnibus accounts and intended to recover the cost of payments to other parties (including affiliates of BOA) for services to those accounts. Such fees are allocated to the Other Share Classes based on the relative average daily net assets of each share class. The Transfer Agent pays the fees of BFDS for services as sub-transfer agent and is not entitled to reimbursement for such fees from the Funds.
Annual minimum account balance fee of $20 may apply to certain accounts with a value below each Fund’s initial minimum investment requirements. The Transfer Agent will reduce the expenses paid by a Fund by any amounts it collects from the assessment of this fee. For Funds that do not have transfer agency expenses against which to offset the amount collected through assessment of this fee, the fee will be paid directly to the Fund. These minimum account balance fees are recorded as part of expense reductions on the Statements of Operations. For the year ended February 28, 2010 no minimum account balance fees were charged by the Funds.
RiverSource Service Corporation (the “New Transfer Agent”), a subsidiary of Ameriprise Financial, will become the transfer agent of the Funds upon the Closing. The New Transfer Agent expects to change its name to Columbia Management Investment Services Corp. upon or shortly after the Closing.
Underwriting Discounts, Distribution and Shareholder Servicing Fees
Columbia Management Distributors, Inc. (the “Distributor”), an affiliate of Columbia and an indirect, wholly owned subsidiary of BOA, is the principal underwriter of the Funds’ shares. For the year ended February 28, 2010, the Distributor has retained net underwriting discounts of $15 on sales of the Columbia Large Cap Index Fund’s Class A shares and received net CDSC fees of $4,216 on Class B share redemptions for Columbia Large Cap Index Fund.
RiverSource Fund Distributors, Inc. (the “New Distributor”), a subsidiary of Ameriprise Financial, will become the distributor of the Funds upon the Closing. The New Distributor expects to change its name to Columbia Management Investment Distributors, Inc. upon or shortly after the Closing.
The Trust has adopted a shareholder servicing plan and a distribution plan for the Class B shares of Columbia Large Cap Index Fund, a distribution plan for the Class R shares of Columbia Large Cap Enhanced Core Fund, and a combined distribution and shareholder servicing plan for the Class A shares of each Fund. The shareholder servicing plans permit the Funds to compensate or reimburse servicing agents for the shareholder services they have provided. The distribution
81
Index Funds
February 28, 2010
plans, adopted pursuant to Rule 12b-1 under the 1940 Act, permit the Funds to compensate or reimburse the Distributor and/or selling agents for activities or expenses primarily intended to result in the sale of the classes’ shares. Payments are made at an annual rate and paid monthly, as a percentage of average daily net assets, set from time to time by the Board of Trustees, and are charged as expenses of each Fund directly to the applicable share class. A substantial portion of the expenses incurred pursuant to these plans is paid to affiliates of BOA and the Distributor.
The annual rates in effect and plan limits, as a percentage of average daily net assets are as follows:
| | | | | | |
| | | | | | | |
| | | Current Rate | | | Plan Limit | |
Class A Combined Distribution and Shareholder Servicing Plan* | | 0.25 | % | | 0.25 | % |
Class B Shareholder Servicing Plans** | | 0.25 | % | | 0.25 | % |
Class B Distribution Plans** | | 0.75 | % | | 0.75 | % |
Class R Distribution Plans*** | | 0.50 | % | | 0.50 | % |
| ** | For Columbia Large Cap Index Fund |
| *** | For Columbia Large Cap Enhanced Core Fund |
Expense Limits and Fee Waivers
Effective July 1, 2009, Columbia has voluntarily agreed to reimburse a portion of the Funds’ expenses so that the Funds’ ordinary operating expenses (excluding any distribution and service fees, brokerage commissions, interest, taxes and extraordinary expenses, but including custodian charges relating to overdrafts, if any) after giving effect to any balance credits from the Funds’ custodian, do not exceed the following annual rates, based on each Fund’s average daily net assets:
| | | |
| | | | |
| Fund | | Annual Rate | |
Columbia Large Cap Index Fund | | 0.14 | % |
Columbia Large Cap Enhanced Core Fund | | 0.70 | % |
Columbia Mid Cap Index Fund | | 0.20 | % |
Columbia Small Cap Index Fund | | 0.20 | % |
Columbia, in its discretion, may revise or discontinue these arrangements at any time.
Prior to July 1, 2009, Columbia and/or some of the Funds’ other service providers contractually agreed to waive fees and/or reimburse certain expenses for the Funds so that the expenses incurred by the Funds (excluding any distribution and service fees, brokerage commissions, interest, taxes and extraordinary expenses, but including custodian charges relating to overdrafts, if any) after giving effect to any balance credits from the Funds’ custodian, did not exceed the following annual rates, based on each Fund’s average daily net assets:
| | | |
| | | | |
| Fund | | Annual Rate | |
Columbia Large Cap Index Fund | | 0.14 | % |
Columbia Large Cap Enhanced Core Fund | | 0.50 | % |
Columbia Mid Cap Index Fund | | 0.14 | % |
Columbia Small Cap Index Fund | | 0.21 | % |
Columbia is entitled to recover from Columbia Large Cap Index Fund, Columbia Large Cap Enhanced Core Fund and Columbia Small Cap Index Fund any fees waived and/or expenses reimbursed for a three year period following the date of such fee waiver and/or reimbursement if such recovery does not cause a Fund’s expenses to exceed the expense limitations in effect at the time of recovery.
At February 28, 2010, the amounts potentially recoverable by Columbia pursuant to this arrangement are as follows:
| | | | | | | | | | | | | | | | | |
| | | | | | | | | |
| | | Amount of Potential Recovery Expiring: | | Total
Potential
Recovery | | Amount
Expired
2/28/2010 | | Amount
Recovered During the
Year Ended
02/28/2010 |
| Fund | | 2/28/2013 | | 2/29/2012 | | 2/28/2011 | | | |
Columbia Large Cap Index Fund | | $ | 1,389,496 | | $ | 1,330,267 | | $ | 1,647,710 | | $ | 4,367,473 | | $ | 1,379,819 | | — |
Columbia Large Cap Enhanced Core Fund | | | 151,553 | | | 431,216 | | | 366,741 | | | 949,510 | | | 393,249 | | — |
Columbia Small Cap Index Fund | | | 43,874 | | | — | | | — | | | 43,874 | | | — | | — |
82
Index Funds
February 28, 2010
Fees Paid to Officers and Trustees
All officers of the Funds are employees of Columbia or its affiliates and, with the exception of the Funds’ Chief Compliance Officer, receive no compensation from the Funds. The Board of Trustees has appointed a Chief Compliance Officer to the Funds in accordance with federal securities regulations. The Funds, along with other affiliated funds, pay their pro-rata share of the expenses associated with the Chief Compliance Officer. Each Fund’s expenses for the Chief Compliance Officer will not exceed $15,000 per year.
Trustees are compensated for their services to the Funds, as set forth on the Statement of Operations.
The Trust’s eligible Trustees may participate in a non-qualified deferred compensation plan which may be terminated at any time. Any payments to plan participants are paid solely out of the Funds’ assets. Income earned on the plan participant’s deferral account is based on the rate of return of the eligible mutual funds selected by the participant or, if no funds are selected, on the rate of return of Columbia Treasury Reserves, another portfolio of the Trust. The expense for the deferred compensation plan, which includes trustees’ fees deferred during the current period as well as any gains or losses on the trustees’ deferred compensation balances as a result of market fluctuations, is included in “Trustees’ fees” on the Statements of Operations. The liability for the deferred compensation plan is included in “Trustees’ fees” on the Statements of Assets and Liabilities.
As a result of fund mergers, certain Funds assumed the liabilities of the deferred compensation plan of the acquired funds, which are included in “Trustees’ fee” on the Statements of Assets and Liabilities. The deferred compensation plan may be terminated at any time. Any payments to plan participants are paid solely out of the Funds’ assets.
Note 5. Custody Credits
Each Fund has an agreement with its custodian bank under which custody fees may be reduced by balance credits. These credits are recorded as part of expense reductions on the Statements of Operations. The Funds could have invested a portion of the assets utilized in connection with the expense offset arrangement in an income-producing asset if they had not entered into such an agreement. For the year ended February 28, 2010, these custody credits reduced total expenses for the Funds as follows:
| | | |
| | | |
| | | Custody
Credits |
Columbia Large Cap Enhanced Core Fund | | $ | 2 |
Columbia Mid Cap Index Fund | | | 20 |
Note 6. Objectives and Strategies for Investing in Derivative Instruments
Each Fund uses derivative instruments including futures contracts in order to meet its investment objectives. Each Fund employs strategies in differing combinations to permit it to increase, decrease or change the level of exposure to market risk factors. The achievement of any strategy relating to derivatives depends on an analysis of various risk factors, and if the strategies for the use of derivatives do not work as intended, each Fund may not achieve its investment objectives.
In pursuit of the Funds’ investment objectives, each Fund is exposed to the following market risks:
Equity Risk:
Equity risk relates to change in value of equity securities such as common stocks due to general market conditions such as real or perceived adverse economic conditions, changes in the general outlook for corporate earnings, or adverse investor sentiment. Equity securities generally have greater price volatility than fixed income securities.
The following notes provide more detailed information about the derivative type held by the Funds:
Each Fund uses equity index futures contracts to equitize cash in order to maintain appropriate equity market exposure while keeping sufficient cash to accommodate daily redemptions.
The use of futures contracts involves certain risks, which include, among these: (1) imperfect correlation between the price movement of the instruments and the underlying securities, (2) inability to close out positions due to differing trading hours, or the temporary absence of a liquid market, for either the instruments or the underlying securities, and (3) an inaccurate prediction of the future direction of interest rates by Columbia.
83
Index Funds
February 28, 2010
Upon entering into a futures contract, a Fund identifies within its portfolio of investments cash or securities in an amount sufficient to meet the initial margin requirement. Subsequent payments are made or received by a Fund equal to the daily change in the contract value and are recorded as variation margin receivable or payable and offset in unrealized gains or losses. A Fund recognizes a realized gain or loss when the contract is closed or expires.
Futures contracts involve, to varying degrees, risk of loss in excess of the variation margin disclosed on the Statement of Assets and Liabilities.
During the year ended February 28, 2010, the Funds entered into the following number of futures contracts:
| | |
| | | |
| | | Futures Contracts |
Columbia Large Cap Index Fund | | 4,143 |
Columbia Large Cap Enhanced Core Fund | | 793 |
Columbia Mid Cap Index Fund | | 7,278 |
Columbia Small Cap Index Fund | | 4,854 |
The following table is a summary of the value of the Funds’ derivative instruments as of February 28, 2010.
| | | | | | | | | |
| | | |
| | | Fair Value of Derivative Instruments |
| | | Assets | | Liabilities |
| | | Statement
of Assets
and
Liabilities | | Fair
Value* | | Statement
of Assets
and
Liabilities | | Fair
Value* |
Columbia Large Cap Index Fund | | Futures
Variation
Margin | | $ | 60,172 | | — | | — |
Columbia Large Cap Enhanced Core Fund | | Futures
Variation
Margin | | | 8,936 | | — | | — |
Columbia Mid Cap Index Fund | | — | | | — | | Futures
Variation
Margin | | 41,299 |
Columbia Small Cap Index Fund | | — | | | — | | Futures
Variation
Margin | | 210,022 |
| * | Includes only current day’s variation margin. |
The Effect of Derivative Instruments on the Statement of Operations for the Year Ended February 28, 2010.
| | | | | | | | |
| | | | | |
| | | | | Amount of Realized Gain or
(Loss) and Change in
Unrealized Appreciation
(Depreciation) on
Derivatives Recognized in
Income |
| | | Equity
Risk | | Net
Realized
Gain (Loss) | | Change in
Unrealized
Appreciation
(Depreciation) |
Columbia Large Cap Index Fund | | Futures
Contracts | | $ | 8,753,747 | | $ | 10,706,642 |
Columbia Large Cap Enhanced Core Fund | | Futures
Contracts | | | 626,275 | | | 2,692,427 |
Columbia Mid Cap Index Fund | | Futures
Contracts | | | 14,929,596 | | | 3,398,737 |
Columbia Small Cap Index Fund | | Futures
Contracts | | | 6,028,565 | | | 1,345,378 |
Note 7. Portfolio Information
For the year ended February 28, 2010, the cost of purchases and proceeds from sales of securities, excluding short-term obligations, for the Funds were as follows:
| | | | | | |
| | | | | |
| | | Purchases | | Sales |
Columbia Large Cap Index Fund | | $ | 601,822,410 | | $ | 147,750,807 |
Columbia Large Cap Enhanced Core Fund | | | 610,158,055 | | | 655,528,607 |
Columbia Mid Cap Index Fund | | | 446,964,118 | | | 225,325,427 |
Columbia Small Cap Index Fund | | | 383,109,685 | | | 156,859,357 |
84
Index Funds
February 28, 2010
Note 8. Regulatory Settlements
During the year ended February 28, 2010, the following Funds received payments relating to certain regulatory settlements with third parties that the Funds had participated in during the year:
| | | |
| | | |
| | | Amount |
Columbia Large Cap Index Fund | | $ | 22 |
Columbia Large Cap Enhanced Core Fund | | | 3,773 |
Columbia Small Cap Index Fund | | | 6,338 |
The payments have been included in “Increase from regulatory settlements” on the Statements of Changes in Net Assets.
Note 9. Line of Credit
The Funds and other affiliated funds participate in a $280,000,000 committed, unsecured revolving line of credit provided by State Street. The maximum amount that may be borrowed by any fund is limited to the lesser of $200,000,000 and the Fund’s borrowing limit set forth in the Fund’s registration statement. Borrowings are available for short-term liquidity or temporary or emergency purposes.
Effective October 15, 2009, interest is charged to each participating fund based on the fund’s borrowings at a rate per annum equal to the greater of the Federal Funds Rate plus 1.25% or the overnight LIBOR Rate plus 1.25%. In addition, a commitment fee of 0.15% per annum is accrued and apportioned among the participating funds pro rata based on their relative net assets.
Prior to October 15, 2009, interest was charged to each participating fund based on the fund’s borrowings at a rate per annum equal to the greater of the Federal Funds Rate plus 0.50% or the overnight LIBOR Rate plus 0.50%. In addition, an annual operations agency fee of $20,000, an amendment fee of 0.02% and a commitment fee of 0.12% per annum were accrued and apportioned among the participating funds pro rata based on their relative net assets.
For the year ended February 28, 2010, the average daily loan balance outstanding on days where borrowing existed, and the weighted average interest rate of each Fund that borrowed were as follows:
| | | | | | |
| | | | | | |
| Fund | | Average Daily
Loan Balance
Outstanding
on Days Were
Borrowing
Existed | | Weighted
Average
Interest
Rate | |
Columbia Large Cap Index Fund | | $ | 1,200,000 | | 1.000 | % |
Columbia Large Cap Enhanced Core Fund | | | 6,606,667 | | 0.965 | % |
Note 10. Shares of Beneficial Interest
As of February 28, 2010, the Funds had shareholders that held greater than 5% of the shares outstanding of a Fund, whose shares were beneficially owned by participant accounts over which BOA and/or any of its affiliates had either sole or joint investment discretion. The percentages of shares of beneficial interest outstanding held therein are as follows:
| | |
| | | |
| | | % of Shares
Outstanding Held |
Columbia Large Cap Index Fund | | 56.8 |
Columbia Large Cap Enhanced Core Fund | | 88.0 |
Columbia Mid Cap Index Fund | | 68.5 |
Columbia Small Cap Index Fund | | 61.7 |
As of February 28, 2010, no other shareholders owned more than 5% of the outstanding shares of each Fund. Subscription and redemption activity of these accounts may have a significant effect on the operations of the Funds.
Note 11. Significant Risks and Contingencies
Legal Proceedings
Columbia Management Advisors, LLC and Columbia Management Distributors, Inc. (collectively, the “Columbia Group”) are subject to a settlement agreement with the New York Attorney General (“NYAG”) (the “NYAG Settlement”) and a settlement order with the Securities and Exchange Commission (“SEC”) (the “SEC Order”) on matters relating to mutual fund trading, each dated February 9, 2005. Under the terms of the SEC Order, the Columbia Group (or predecessor or affiliated entities) agreed, among other things, to: pay disgorgement and civil money penalties
85
Index Funds
February 28, 2010
collectively totaling $375 million; cease and desist from violations of the antifraud provisions and certain other provisions of the federal securities laws; maintain certain compliance and ethics oversight structures; and retain an independent consultant to review the Columbia Group’s applicable supervisory, compliance, control and other policies and procedures. The NYAG Settlement, among other things, requires Columbia Management Advisors, LLC and its affiliates to make certain disclosures to investors relating to expenses. In connection with the Columbia Group providing services to the Columbia Funds, the Columbia Funds have voluntarily undertaken to implement certain governance measures designed to maintain the independence of their boards of trustees and certain special consulting and compliance measures.
Pursuant to the SEC Order and related procedures, the $375 million in settlement amounts described above, of which approximately $90 million has been earmarked for certain Columbia Funds and their shareholders, is being distributed in accordance with a distribution plan developed by an independent distribution consultant and approved by the SEC on December 27, 2007. Distributions under the distribution plan began in mid-June 2008 and the distribution earmarked for the Columbia Funds and their shareholders has been substantially completed.
Civil Litigation
In connection with the events that resulted in the NYAG Settlement and SEC Order, various parties filed suits against Bank of America Corporation and certain of its affiliates, including Banc of America Capital Management, LLC (“BACAP,” now known as Columbia Management Advisors, LLC) and BACAP Distributors, LLC (now known as Columbia Management Distributors, Inc.) (collectively “BAC”), Nations Funds Trust (now known as Columbia Funds Series Trust) and its Board of Trustees. On February 20, 2004, the Judicial Panel on Multidistrict Litigation transferred these cases and cases against other mutual fund companies based on similar allegations to the United States District Court in Maryland for consolidated or coordinated pretrial proceedings (the “MDL”). Subsequently, additional related cases were transferred to the MDL. On September 29, 2004, the plaintiffs in the MDL filed amended and consolidated complaints. One of these amended complaints is a putative class action that includes claims under the federal securities laws and state common law, and that names Nations Funds Trust, the Trustees, BAC and others as defendants. Another of the amended complaints is a derivative action purportedly on behalf of the Nations Funds Trust against BAC and others that asserts claims under federal securities laws and state common law. Nations Funds Trust is a nominal defendant in this action.
On February 25, 2005, BAC and other defendants filed motions to dismiss the claims in the pending cases. On December 15, 2005, BAC and others entered into a Stipulation of Settlement of the direct and derivative claims brought on behalf of the Nations Funds shareholders. The settlement is subject to court approval. If the settlement is approved, BAC would pay settlement administration costs and fees to plaintiffs’ counsel as approved by the court. The stipulation has not yet been presented to the court for approval.
Note 12. Subsequent Events
In connection with the preparation of the financial statements of the Funds as of and for the fiscal year ended February 28, 2010, events and transactions through the date the financial statements were issued have been evaluated by the Funds’ management for possible adjustment and/or disclosure. No subsequent events or transactions had occurred that would require adjustment of the financial statements as presented. On March 3, 2010, each Fund’s shareholders approved, among other matters, a proposed investment management services agreement with the New Advisor, the effectiveness of which is conditioned on the Closing.
86
Report of Independent Registered Public Accounting Firm
To the Shareholders and Trustees of Columbia Funds Series Trust
In our opinion, the accompanying statements of assets and liabilities, including the investment portfolios, and the related statements of operations and of changes in net assets and the financial highlights present fairly, in all material respects, the financial position of Columbia Large Cap Index Fund, Columbia Large Cap Enhanced Core Fund, Columbia Mid Cap Index Fund and Columbia Small Cap Index Fund (constituting part of Columbia Funds Series Trust, hereafter referred to as the “Funds”) at February 28, 2010, the results of each of their operations for the year then ended, the changes in each of their net assets and the financial highlights for each of the periods indicated, in conformity with accounting principles generally accepted in the United States of America. These financial statements and the financial highlights (hereafter referred to as “financial statements”) are the responsibility of the Funds’ management. Our responsibility is to express an opinion on these financial statements based on our audits. We conducted our audits of these financial statements in accordance with the standards of the Public Company Accounting Oversight Board (United States). Those standards require that we plan and perform the audit to obtain reasonable assurance about whether the financial statements are free of material misstatement. An audit includes examining, on a test basis, evidence supporting the amounts and disclosures in the financial statements, assessing the accounting principles used and significant estimates made by management, and evaluating the overall financial statement presentation. We believe that our audits, which included confirmation of securities at February 28, 2010 by correspondence with the custodian and brokers, provide a reasonable basis for our opinion.
PricewaterhouseCoopers LLP
Boston, Massachusetts
April 21, 2010
87
Federal Income Tax Information (unaudited) – Index Funds
Columbia Large Cap Index Fund
99.51% of the ordinary income distributed by the Fund for the fiscal year ended February 28, 2010, qualifies for the corporate dividends received deduction.
For non-corporate shareholders 99.83%, or the maximum amount allowable under the Jobs and Growth Tax Relief Reconciliation Act of 2003, of ordinary income distributed by the Fund for the fiscal year ended February 28, 2010 may represent qualified dividend income.
The Fund will notify shareholders in January 2011 of amounts for use in preparing 2010 income tax returns.
Columbia Large Cap Enhanced Core Fund
100.00% of the ordinary income distributed by the Fund for the fiscal year ended February 28, 2010, qualifies for the corporate dividends received deduction.
For non-corporate shareholders 100.00%, or the maximum amount allowable under the Jobs and Growth Tax Relief Reconciliation Act of 2003, of ordinary income distributed by the Fund for the fiscal year ended February 28, 2010 may represent qualified dividend income.
The Fund will notify shareholders in January 2011 of amounts for use in preparing 2010 income tax returns.
Columbia Mid Cap Index Fund
96.40% of the ordinary income distributed by the Fund for the fiscal year ended February 28, 2010, qualifies for the corporate dividends received deduction.
For non-corporate shareholders 96.40%, or the maximum amount allowable under the Jobs and Growth Tax Relief Reconciliation Act of 2003, of ordinary income distributed by the Fund for the fiscal year ended February 28, 2010 may represent qualified dividend income.
The Fund will notify shareholders in January 2011 of amounts for use in preparing 2010 income tax returns.
Columbia Small Cap Index Fund
80.81% of the ordinary income distributed by the Fund for the fiscal year ended February 28, 2010, qualifies for the corporate dividends received deduction.
For non-corporate shareholders 82.26%, or the maximum amount allowable under the Jobs and Growth Tax Relief Reconciliation Act of 2003, of ordinary income distributed by the Fund for the fiscal year ended February 28, 2010 may represent qualified dividend income.
The Fund will notify shareholders in January 2011 of amounts for use in preparing 2010 income tax returns.
88
Fund Governance
The Trustees serve terms of indefinite duration. The names, addresses and ages of the Trustees and officers of the Funds of Columbia Funds Series Trust, the year each was first elected or appointed to office, their principal business occupations during at least the last five years, the number of Funds overseen by each Trustee and other directorships they hold are shown below. Each officer listed below serves as an officer of each Fund in the Columbia Funds Complex.
Independent Trustees
| | |
Name, Address and Age, Position
with Funds, Year First Elected or
Appointed to Office | | Principal Occupation(s) During Past Five Years, Number of Funds in the Columbia
Funds Complex Overseen by Trustee, Other Directorships Held |
| |
| Edward J. Boudreau (Born 1944) | | |
c/o Columbia Management Advisors, LLC One Financial Center Boston, MA 02111 Trustee (since 2005) | | Managing Director–E.J. Boudreau & Associates (consulting), from 2000 through current; oversees 64 funds; no other directorships held. |
| |
| William P. Carmichael (Born 1943) | | |
c/o Columbia Management Advisors, LLC One Financial Center Boston, MA 02111 Trustee (since 1999) | | Retired. Oversees 64 funds; Director–Cobra Electronics Corporation (electronic equipment manufacturer); Director–Simmons Company (bedding); Director–The Finish Line (sportswear). |
| |
| William A. Hawkins (Born 1942) | | |
c/o Columbia Management Advisors, LLC One Financial Center Boston, MA 02111 Trustee (since 2005) | | President and Chief Executive Officer–California General Bank, N.A., from January 2008 through current; oversees 64 funds; no other directorships held. |
| |
| R. Glenn Hilliard (Born 1943) | | |
c/o Columbia Management Advisors, LLC One Financial Center Boston, MA 02111 Trustee (since 2005) | | Chairman and Chief Executive Officer–Hilliard Group LLC (investing and consulting), from April 2003 through current; Non-Executive Director & Chairman–Conseco, Inc. (insurance), September 2003 through current; Executive Chairman–Conseco, Inc. (insurance), August 2004 through September 2005; oversees 64 funds; Director–Conseco, Inc. (insurance). |
| |
| John J. Nagorniak (Born 1944) | | |
c/o Columbia Management Advisors, LLC One Financial Center Boston, MA 02111 Trustee (since 2008) | | Retired. President and Director–Foxstone Financial, Inc. (consulting), 2000 through December 2007; Director–Mellon Financial Corporation affiliates (investing), 2000 through 2007; Chairman–Franklin Portfolio Associates (investing–Mellon affiliate), 1982 through 2007; oversees 64 funds; Director–MIT Investment Company; Trustee–MIT 401k Plan; Trustee and Chairman–Research Foundation of CFA Institute. |
| |
| Minor M. Shaw (Born 1947) | | |
c/o Columbia Management Advisors, LLC One Financial Center Boston, MA 02111 Trustee (since 2003) | | President–Micco Corporation and Mickel Investment Group; oversees 64 funds; Board Member–Piedmont Natural Gas. |
89
Fund Governance (continued)
Interested Trustee
| | |
Name, Address and Age, Position
with Funds, Year First Elected or
Appointed to Office | | Principal Occupation(s) During Past Five Years, Number of Funds in the Columbia
Funds Complex Overseen by Trustee, Other Directorships Held |
|
| Anthony M. Santomero1 (Born 1946) |
c/o Columbia Management Advisors, LLC One Financial Center Boston, MA 02111 Trustee (since 2008) | | Richard K. Mellon Professor Emeritus of Finance, The Wharton School, University of Pennsylvania, from 1972 through current; Senior Advisor–McKinsey & Company (consulting), July 2006 through January 2008; President and Chief Executive Officer–Federal Reserve Bank of Philadelphia, July 2000 through April 2006; oversees 64 funds; Director���Renaissance Reinsurance Ltd; Trustee–Penn Mutual Life Insurance Company; Director–Citigroup |
| 1 | The Columbia Funds currently treat Mr. Santomero as an “interested person” (as defined in the 1940 Act) of the Funds because he serves as a Director of Citigroup, Inc. and Citibank, N.A. Citigroup, Inc., through its subsidiaries and affiliates, including Citibank, N.A., may engage from time-to-time in brokerage execution, principal transactions and/or lending relationships with the Columbia Funds or other funds or accounts advised/managed by the Advisor and/or any sub-advisor. |
The Statement of Additional Information includes additional information about the Trustees of the Funds and is available, without charge, upon request by calling 800-345-6611.
90
Fund Governance (continued)
Officers
| | |
Name, Address and Year of Birth,
Position with Columbia Funds, Year First
Elected or Appointed to Office | | Principal Occupation(s) During Past Five Years |
| |
| J. Kevin Connaughton (Born 1964) | | |
One Financial Center Boston, MA 02111 President (since 2009) | | Managing Director of Columbia Management Advisors, LLC since December 2004; Senior Vice President and Chief Financial Officer–Columbia Funds, from June 2008 to January 2009; Treasurer–Columbia Funds, from October 2003 to May 2008; Treasurer–the Liberty Funds, Stein Roe Funds and Liberty All-Star Funds, December 2000–December 2006; Senior Vice President–Columbia Management Advisors, LLC, from April 2003 to December 2004; President–Columbia Funds, Liberty Funds and Stein Roe Funds, February 2004 to October 2004; Treasurer–Galaxy Funds, September 2002 to December 2005; Treasurer, December 2002 to December 2004, and President, February 2004 to December 2004–Columbia Management Multi-Strategy Hedge Fund, LLC; and a senior officer of various other Bank of America-affiliated entities, including other registered and unregistered funds. |
| |
| James R. Bordewick, Jr. (Born 1959) | | |
One Financial Center Boston, MA 02111 Senior Vice President, Secretary and Chief Legal Officer
(since 2006) | | Associate General Counsel, Bank of America since April 2005; Senior Vice President and Associate General Counsel, MFS Investment Management (investment management) prior to April 2005. |
| |
| Linda J. Wondrack (Born 1964) | | |
One Financial Center Boston, MA 02111 Senior Vice President and Chief Compliance Officer
(since 2007) | | Director (Columbia Management Group LLC and Investment Product Group Compliance), Bank of America since June 2005; Director of Corporate Compliance and Conflicts Officer, MFS Investment Management (investment management), August 2004 to May 2005; Managing Director, Deutsche Asset Management (investment management) prior to August 2004. |
| |
| Michael G. Clarke (Born 1969) | | |
One Financial Center Boston, MA 02111 Senior Vice President and Chief Financial Officer
(since 2009) | | Director of Fund Administration of the Advisor since January 2006; Managing Director of the Advisor September 2004 to December 2005; Vice President Fund Administration June 2002 to September 2004. |
| |
| Jeffrey R. Coleman (Born 1969) | | |
One Financial Center Boston, MA 02111 Treasurer (since 2008) | | Director of Fund Administration of the Advisor since January 2006; Fund Controller of the Advisor from October 2004 to January 2006; Vice President of CDC IXIS Asset Management Services, Inc. (investment management) from August 2000 to September 2004. |
| |
| Joseph F. DiMaria (Born 1968) | | |
One Financial Center Boston, MA 02111 Chief Accounting Officer (since 2008) | | Director of Fund Administration of the Advisor since January 2006; Head of Tax/Compliance and Assistant Treasurer of the Advisor from November 2004 to December 2005; Director of Trustee Administration (Sarbanes-Oxley) of the Advisor from May 2003 to October 2004. |
91
Fund Governance (continued)
Officers (continued)
| | |
Name, Address and Year of Birth,
Position With Columbia Funds, Year First
Elected or Appointed to Office | | Principal Occupation(s) During Past Five Years |
| |
| Jullan Quero (Born 1967) | | |
One Financial Center Boston, MA 02111 Deputy Treasurer (since 2008) | | Senior Tax Manager of the Advisor since August 2006; Senior Compliance Manager of the Advisor from April 2002 to August 2006. |
| |
| Barry S. Vallan (Born 1969) | | |
One Financial Center Boston, MA 02111 Controller (since 2006) | | Vice President–Fund Treasury of the Advisor since October 2004; Vice President–Trustee Reporting of the Advisor from April 2002 to October 2004. |
| |
| Stephen T. Welsh (Born 1957) | | |
One Financial Center Boston, MA 02111 Vice President (since 1996) | | President, Columbia Management Services, Inc. since July 2004; Senior Vice President and Controller, Columbia Management Services, Inc. prior to July 2004. |
92
Board Consideration and Re-Approval of Current Investment Advisory Agreements
The Board of Trustees of Columbia Funds Series Trust (the “Board”), including a majority of the Trustees who have no direct or indirect interest in the investment advisory agreement and are not “interested persons” of the Trust, as defined in the Investment Company Act of 1940 (the “1940 Act”) (the “Independent Trustees”), are required annually to review and re-approve the existing investment advisory agreement and approve any newly proposed terms therein. In this regard, the Board reviewed and re-approved, during the most recent six months covered by this report, the investment advisory agreement with Columbia Management Advisors, LLC (“CMA” or the “Adviser”) for the Columbia Large Cap Index Fund, Columbia Large Cap Enhanced Core Fund, Columbia Mid Cap Index Fund and Columbia Small Cap Index Fund. The investment advisory agreement with CMA is referred to as an “Advisory Agreement.” The funds identified above are each referred to as a “Fund” and collectively referred to as the “Funds.”
More specifically, at meetings held on November 5-6, 2009, the Board, including the Independent Trustees advised by their independent legal counsel, considered the factors and reached the conclusions described below relating to the selection of CMA and the re-approval of the Advisory Agreement. The Board also reviewed and considered a report prepared and provided by the Independent Fee Consultant (the “Fee Consultant”) appointed by the Independent Trustees pursuant to an assurance of discontinuance entered into with the New York Attorney General (“NYAG”) to settle a civil complaint filed by the NYAG relating to trading in mutual fund shares (the “NYAG Settlement”). The Fee Consultant’s role was to manage the process by which management fees are negotiated so that they were negotiated in a manner that is at arms’ length and reasonable. The Fee Consultant found that the fee negotiation process was, to the extent practicable, at arms’ length and reasonable and consistent with the requirements of the NYAG Settlement. A summary of the Fee Consultant’s report is available at http://www.columbiafunds.com.
In preparation for the November meetings, the Board met in August for review and discussion of the materials described below. The Investment Committee of the Board also met in June to discuss each Fund’s performance with its respective portfolio manager(s). In addition to these meetings, the Investment Committee receives and discusses performance reports at its quarterly meetings. The Contracts Review Committee of the Board also provided support in managing and coordinating the process by which the Board reviewed the Advisory Agreement. The Board’s review and conclusions are based on the comprehensive consideration of all information presented to it and not the result of any single controlling factor. The Board evaluated all information available to it on a Fund-by-Fund basis, and its determinations were made separately in respect of each Fund.
The Board noted that Bank of America, N.A., the parent company of the Adviser, had entered into an agreement to sell a portion of the asset management business of the Adviser to Ameriprise Financial, Inc. (the “Transaction”). The Board noted that the Transaction was expected to close in the spring of 2010 and that its review of the Advisory Agreement was separate and distinct from any analysis regarding new advisory or sub-advisory arrangements that may result from the closing of the Transaction.
Nature, Extent and Quality of Services
The Board received and considered various data and information regarding the nature, extent and quality of services provided to the Funds by CMA under the Advisory Agreement. The most recent investment adviser registration forms for CMA were made available to the Board, as were CMA’s responses to a detailed series of requests submitted by the Independent Trustees’ independent legal counsel on behalf of such Trustees. The Board reviewed and analyzed those materials, which included, among other things, information about the background and experience of senior management and investment personnel of CMA.
In addition, the Board considered the investment and legal compliance programs of the Funds and CMA including their compliance policies and procedures and reports of the Funds’ Chief Compliance Officer.
The Board evaluated the ability of CMA, based on its resources, reputation and other attributes, to attract and retain qualified investment professionals, including research, advisory and supervisory personnel. In this regard, the Board considered information regarding the nature of CMA’s compensation structure applicable to portfolio managers and other key investment personnel.
Based on the above factors, together with those referenced below, the Board concluded that it was satisfied with the nature, extent and quality of the investment advisory services provided to each of the Funds by CMA.
93
Investment Advisory Fee Rates and Other Expenses
The Board reviewed and considered the proposed contractual investment advisory fee rates both separately and together with the administration fee rates payable by the Funds to CMA for investment advisory services (the “Contractual Management Rates”). In addition, the Board reviewed and considered the proposed fee waiver/cap arrangements applicable to the Contractual Management Rates and considered the Contractual Management Rates after taking the waivers/caps into account (the “Actual Management Rates”). The Board noted that, on a complex-wide basis, CMA had reduced annual management fees by at least $32 million per year pursuant to the NYAG Settlement. The Board also noted reductions in net advisory rates and/or total expenses of certain funds across the fund complex. Additionally, the Board received and afforded specific attention to information comparing the Contractual Management Rates and Actual Management Rates with those of the other funds in their respective Peer Groups (as defined below).
The Board reviewed and considered statistical information regarding each Fund’s total expense ratio and its various components, including contractual advisory fees, actual advisory fees, actual non-management fees, Rule 12b-1 and non-Rule 12b-1 service fees, fee waivers/caps and/or expense reimbursements. The Board also reviewed comparisons of these fees to the expense information for the group of Funds determined by Lipper Inc. (“Lipper”) to be most similar to a given Fund (the “Peer Group”) and to the performance of a broader universe of relevant funds as determined by Lipper (the “Universe”), which comparative data was provided by Lipper, an independent provider of investment company data. The Board was provided with a description of the methodology used by Lipper to select the mutual funds in each Fund’s Peer Group and Universe and considered potential imprecision resulting from the selection methodology. For certain Funds, Lipper determined that the composition of the Peer Group and/or Universe for expenses would differ from the composition for performance to provide a more accurate basis of comparison. The Board also considered Lipper data that ranked each Fund based on: (i) each Fund’s one- and three-year performance compared to actual management fees; and (ii) each Fund’s one- and three-year performance compared to total expenses.
The Board concluded that the factors noted above supported the Contractual Management Rates and the Actual Management Rates, and the approval of the Advisory Agreement for all of the Funds.
Fund Performance
The Board considered the performance results for each of the Funds over multiple measurement periods. It also considered these results in comparison to the performance results of each Fund’s Peer Group and Universe, as well as to each Fund’s benchmark index. The Board also considered certain risk-adjusted performance data.
Profitability
The Board received and considered a detailed profitability analysis of CMA based on the Contractual Management Rates and the Actual Management Rates, as well as on other relationships between the Funds and other funds in the complex on the one hand and CMA affiliates on the other. The analysis included complex-wide and per-Fund information and a comparison of results using alternative allocation methodologies. The Board concluded that, in light of the costs of providing investment management and other services, the profits and other ancillary benefits that CMA and its affiliates received from providing these services were not unreasonable.
Economies of Scale
The Board received and considered information regarding whether there have been economies of scale with respect to the management of the Funds, whether the Funds have appropriately benefited from any economies of scale and whether there is potential for realization of any further economies of scale. Most particularly, CMA provided information showing that, as a percentage of fund assets, CMA’s complex-wide revenues declined over a five-year period during which fund assets increased by 53% and the shareholder benefit over a four-year period has remained steady at approximately 33% of the Adviser’s total profits. The Board concluded that any potential economies of scale are shared fairly with Fund shareholders, most particularly through breakpoints and fee waiver arrangements.
94
Information About Services to Other Clients
The Board also received and considered information about the nature and extent of services and fee rates offered by CMA to their other clients, including separate accounts and institutional investors. In this regard, the Board concluded that, where the Contractual Management Rates and Actual Management Rates were appreciably above the range of the fee rates offered to other CMA clients, based on information provided by CMA, the costs associated with managing and operating a registered investment company provided a justification for the higher fee rates charged to the Funds.
Other Benefits to CMA
The Board received and considered information regarding any “fall-out” or ancillary benefits received by CMA and its affiliates as a result of their relationship with the Funds. Such benefits could include, among others, benefits attributable to CMA’s relationship with the Funds (such as soft-dollar credits) and benefits potentially derived from an increase in CMA’s business as a result of its relationship with the Funds (such as the ability to market to shareholders other financial products offered by CMA and its affiliates).
The Board considered the effectiveness of the policies of the Funds in achieving the best execution of portfolio transactions, whether and to what extent soft dollar credits are sought and how any such credits are utilized, any benefits that may be realized by using an affiliated broker, the extent to which efforts are made to recapture transaction costs, and the controls applicable to brokerage allocation procedures. The Board also reviewed CMA’s methods for allocating portfolio investment opportunities among the Funds and other clients. The Board concluded that the benefits were not unreasonable.
Other Factors and Broader Review
As discussed above, the Board reviews materials received from CMA annually as part of the re-approval process under Section 15(c) of the 1940 Act. The Board also reviews and assesses the quality of the services the Funds receives throughout the year. In this regard, the Board and its Committees review reports of CMA at each of its quarterly meetings, which include, among other things, Fund performance reports and presentations relating to such reports. In addition, the Board and its Committees confer with portfolio managers at various times throughout the year including, most particularly, at the June Investment Committee meeting.
Conclusion
After an evaluation of the above-described factors, and based on its deliberations and analysis of the information provided and alternatives considered, the Board, including all of the Independent Trustees, concluded that the compensation payable to CMA under the Advisory Agreement is fair and equitable. Accordingly, the Board unanimously re-approved the Advisory Agreement.
95
Board Consideration and Approval of Proposed Investment Advisory Agreements
Even though the following description of the Board’s consideration of investment advisory and, as applicable, sub-advisory agreements covers multiple funds and trusts, for purposes of this shareholder report, the description is only relevant as to the Funds.
At a meeting held on December 21, 2009, the Boards of Trustees (the “Boards”) of Columbia Funds Series Trust, Columbia Funds Master Investment Trust, LLC and Columbia Funds Series Trust II (each a “Trust” and collectively the “Trusts”) unanimously approved a new investment management services agreement with RiverSource Investments, LLC (“RiverSource”) (the “Proposed Advisory Agreement”) and new subadvisory agreements with Marsico Capital Management (“Marsico Capital”), MacKay Shields LLC (“Mackay Shields”) and Brandes Investment Partners, L.P. (“Brandes”) (each a “Proposed Subadvisory Agreement”), as applicable, for each Fund of the Trusts (each a “Fund” and collectively the “Funds”). As detailed below, the Trustees met on multiple occasions in advance of the December 21, 2009 meeting, held numerous discussions with the management teams of Columbia Management Advisors, LLC (“Columbia”) and RiverSource, a subsidiary of Ameriprise Financial, Inc. (“Ameriprise”) and reviewed and considered extensive materials in connection with the approval of the Proposed Advisory and Subadvisory Agreements.
Specifically, the Trustees of each Trust, including a majority of the Trustees who have no direct or indirect interest in the Proposed Advisory and Subadvisory Agreements and are not “interested persons” of the Trusts, as defined in the Investment Company Act of 1940, as amended (the “1940 Act”) (the “Independent Trustees”) reviewed and approved (i) the Proposed Advisory Agreement with RiverSource for each Fund and (ii) the Proposed Subadvisory Agreement for those Funds that currently have investment subadvisory agreements with Marsico Capital, Mackay Shields, and Brandes (the “Subadvised Funds”) (Marsico Capital, MacKay Shields and Brandes are collectively referred to as the “Subadvisers”). Prior to approving the Proposed Advisory Agreements, the Trustees were presented with, and requested, received and evaluated, extensive materials about RiverSource, the sale of a portion of the asset management business of Columbia Management Group, LLC to Ameriprise (the “Transaction”) and related matters from RiverSource, Ameriprise and Columbia. In this regard, the Trustees reviewed RiverSource’s responses to a series of detailed requests submitted by the Independent Trustees’ independent legal counsel and by the Independent Fee Consultant (as defined below).
The Trustees also reviewed and considered information received in connection with their most recent consideration and reapproval in November 2009 of the current advisory agreement (the “Current Advisory Agreement”) and current subadvisory agreement (the “Current Subadvisory Agreement”), as applicable, for each Fund, including information about the Subadvisers (the “Current Agreement Re-Approval Process”). Moreover, the Trustees and committees of the Boards met on several occasions, and received extensive materials, throughout the course of the year relating to the Current Agreement Re-Approval Process, which the Trustees considered relevant to their consideration and approval of the Proposed Advisory and Subadvisory Agreements. The Trustees also consulted with Fund counsel and with the Independent Trustees’ independent legal counsel, who advised on the legal standards for consideration by the Trustees, and otherwise assisted the Trustees in their deliberations.
In advance of the meeting on December 21, 2009, the Trustees held several meetings, including meetings held in-person with representatives from RiverSource and Ameriprise on August 26, 2009, November 5-6, 2009, December 9-10, 2009 and December 14, 2009, and additional meetings with representatives of Columbia, to discuss the Transaction, RiverSource’s plans and intentions regarding the Funds and various proposals that were being presented as a result of the Transaction, including the Proposed Advisory and Subadvisory Agreements. In addition to these meetings, telephonic meetings and discussions were held on several occasions between individual Trustees, members of the committees of the Boards, their independent legal counsel and representatives from RiverSource, Ameriprise and/or Columbia.
The Trustees also reviewed and considered a report prepared and provided by the Fee Consultant (the “Fee Consultant”) appointed by the Independent Trustees pursuant to an assurance of discontinuance entered into by a predecessor to Columbia with the New York Attorney General (“NYAG”) to settle a civil complaint filed by the NYAG relating to trading in mutual fund shares (the “NYAG Settlement”). The Fee Consultant’s role was to manage the process by which
96
management fees are negotiated so that they were negotiated in a manner that is at arms’ length and reasonable. The Fee Consultant found that the fee negotiation process was, to the extent practicable, at arms’ length and reasonable and consistent with the requirements of the NYAG Settlement. A summary of the Fee Consultant’s report is available at www.columbiafunds.com.
The following summarizes a number of the material factors considered by the Trustees in reaching their approvals and determinations with respect to the Proposed Advisory Agreements and Proposed Subadvisory Agreements. It is followed by a more detailed discussion of the Trustees’ consideration of these and other factors considered relevant by the Trustees in their evaluation of the Proposed Advisory Agreements and Proposed Subadvisory Agreements. In voting to approve the Proposed Advisory and Subadvisory Agreements for each Fund, the Trustees also considered substantially the same factors, as relevant, and reached substantially the same conclusions in their approval of interim advisory and subadvisory agreements for each Fund.
| | (i) | the terms and conditions of the Proposed Advisory Agreements compared to the terms and conditions of the Current Advisory Agreements, as described below; |
| | (ii) | the fact that each Fund’s total advisory fees would remain the same; |
| | (iii) | the qualifications of the personnel of RiverSource, Ameriprise and the Subadvisers expected to provide advisory and administrative services to each Fund, including representations by Ameriprise regarding its retention of the same process for monitoring and evaluating portfolio management personnel for each Fund as currently used by Columbia; |
| | (iv) | the terms and conditions of the Proposed Subadvisory Agreements compared to the terms and conditions of the Current Subadvisory Agreements; |
| | (v) | the reputation, financial strength, regulatory and compliance histories and resources of RiverSource and Ameriprise, and the potential benefits to the Funds of the combination of RiverSource and Columbia, including that the Funds are expected to continue to have access to existing distribution channels and have the potential for expanded distribution of Fund shares, the expected depth and breadth of investment management capabilities, that there is not expected to be any diminution in the nature, quality and extent of services to be provided to the Funds under the Proposed Advisory Agreements and the potential for the realization of additional economies of scale over time and the potential of the Funds to share in, and benefit from, these economies, if any; |
| | (vi) | that Ameriprise has committed to refrain from imposing or seeking to impose, for a period of not less than two years after the closing of the Transaction (the “Closing”), any “unfair burden” (within the meaning of Section 15(f) of the 1940 Act) on any Fund; |
| | (vii) | the terms and conditions of certain other agreements and arrangements relating to the future operations of the Funds and their distribution channels, including the administrative services agreement and the new services and distribution agreement; |
| | (viii) | that the Trustees recently had completed the Current Agreement Re-Approval Process for each Fund and had determined that they were satisfied with the nature, extent and quality of services provided thereunder and that the management fee rates and (where applicable) subadvisory fee rates for each Fund were satisfactory; |
| | (ix) | that RiverSource was willing to commit to maintain net operating expense ratios at current levels for at least the period currently covered by Columbia’s existing commitments; |
| | (x) | the capabilities of RiverSource and the Subadvisers with respect to compliance, including an assessment of RiverSource’s compliance program by the Funds’ Chief Compliance Officer; |
| | (xi) | that certain members of RiverSource’s management and certain Columbia personnel that will be integrated into RiverSource and its affiliates as a result of the Transaction have substantial experience in integrating fund families; and |
| | (xii) | that Ameriprise and Bank of America Corporation would bear the costs of obtaining approvals of the Proposed Advisory and Subadvisory Agreements. |
In their deliberations, the Trustees did not identify any single item that was paramount or controlling and individual Trustees may have attributed different weights to various
97
factors. The Trustees also evaluated all information available to them on a Fund-by-Fund basis, and their determinations were made separately in respect of each Fund.
Nature, Extent and Quality of Services to be Provided
The Trustees received and considered various data and information regarding the expected nature, extent and quality of services to be provided to the Funds by RiverSource and the Subadvisers under the Proposed Advisory and Subadvisory Agreements. The most recent investment adviser registration forms for RiverSource and each Subadviser were made available to the Boards, as well as extensive materials from RiverSource, Ameriprise and Columbia. The Trustees reviewed and analyzed these materials, which included, among other things, information about the background and experience of expected senior management of RiverSource and Ameriprise after the Closing. The Trustees considered RiverSource’s ability to provide administrative services to the Funds, noting that while the aggregate scope of advisory and administrative services was not expected to change following the Closing, the allocation of services was expected to shift, to a limited extent, such that administrative services will be provided under a new administrative services agreement. The Trustees considered, among other things, the capacity and quality of RiverSource’s and the Subadvisers’ investment management, research and trade execution capabilities and other resources that would be dedicated to performing services for the Funds. The Trustees also considered matters related to RiverSource’s and the Subadvisers’ compliance programs and compliance records, including RiverSource’s portfolio transaction policies and procedures. The Trustees discussed with senior management personnel their ability to administer and oversee outside service providers to the Funds and their shareholders and were satisfied with management’s processes for providing services and overseeing and reviewing services to be rendered by outside sources.
In evaluating the services to be provided under the Proposed Advisory and Subadvisory Agreements, the Trustees factored in their extensive discussions with representatives of Columbia, RiverSource and Ameriprise at the meetings referenced above regarding the management of each Fund. The Trustees considered representations by Ameriprise that it was expected that there will be no diminution in the nature and quality of services provided to the Funds. The Trustees noted that Columbia Management Group’s current President, Columbia’s current Chief Investment Officer and Columbia’s current President, were expected to continue to serve the Funds in similar capacities after the Closing. With respect to portfolio management, the Trustees reviewed information regarding the deliberative process for selecting portfolio management personnel to continue servicing the Funds after the Closing, including the expected role of Columbia’s Chief Investment Officer in evaluating and selecting portfolio management personnel for each Fund utilizing Columbia’s current analytical model for evaluating portfolio managers. In this regard, the Trustees also weighed representations by Ameriprise that this investment management evaluative process was likely to result in a significant number of Columbia investment professionals and personnel currently responsible for management of the Funds to remain in place. The Trustees noted that the portfolio management evaluation and selection process was designed to optimize the portfolio management resources available to each Fund by having the ability to select investment personnel for the Funds from the combined organization. Similarly, the Trustees evaluated the ability of RiverSource and the Subadvisers, based on their respective resources, reputations and other attributes, to attract and retain qualified investment professionals. In this regard, the Trustees considered information regarding the nature of the compensation structure applicable to portfolio managers and other key investment personnel.
The Trustees reviewed and considered information from Ameriprise and RiverSource regarding various contemplated service provider arrangements, including information regarding both immediate and potential future plans in respect of these arrangements. In this regard, the Trustees considered information regarding potential distribution, transfer agency and custody arrangements and the evaluation of fund accounting, financial reporting and valuation service model options, noting certain differences between Columbia’s and RiverSource’s current approaches, including that RiverSource has historically utilized services provided “in-house” or by its affiliates for fund accounting, financial reporting and valuation. The Trustees reviewed information from Ameriprise and RiverSource regarding the expectation for rationalized or harmonized fees as part of the
98
integration after the Closing in order to develop consistent service fee schedules across the combined fund family. The Trustees noted Ameriprise’s representations that, to the extent any such proposals were recommended to the Board after the Closing, they would not result in an “unfair burden” (within the meaning of Section 15(f) of the 1940 Act) on any Fund.
In addition, the Trustees reviewed and evaluated materials and information received regarding the investment and legal compliance programs of the Funds, RiverSource and the Subadvisors, including their compliance policies and procedures and reports of the Funds’ Chief Compliance Officer. In this regard, the Trustees considered that Columbia’s current Chief Compliance Officer was expected to serve in the same role after the Closing.
The Trustees also noted that Ameriprise and certain of its affiliates have been involved in a number of legal, arbitration and regulatory proceedings, including routine litigation, class actions, and governmental actions, concerning matters arising in connection with the ordinary conduct of their business activities, and that Ameriprise indicated that neither Ameriprise nor any of its affiliates are the subject of any pending legal, arbitration or regulatory proceedings that are likely to have a material adverse effect on the Funds or the ability of Ameriprise or its affiliates, including RiverSource to provide services to the Funds.
Based on the foregoing and other information considered relevant, the Trustees concluded that, overall, they were satisfied with assurances from Columbia, RiverSource, Ameriprise and the Subadvisers as to the expected nature, extent and quality of services to be provided to each Fund under the Proposed Advisory and Subadvisory Agreements.
Investment Advisory and Subadvisory Fee Rates and Other Expenses
The Trustees reviewed and considered the proposed contractual investment advisory fee rates to be paid by each Fund to RiverSource for investment management services both separately and together with the administration fee rates to be paid by the Funds to RiverSource (the “Contractual Management Rates”), which are the same as the separate and aggregate advisory and administrative fee rates currently paid by each Fund to Columbia. The Trustees also reviewed and considered the proposed subadvisory fee rates and the fee arrangements under the Proposed Subadvisory Agreements, respectively, which are also the same as those currently in effect under the Current Subadvisory Agreements. In addition to the materials provided by Columbia, RiverSource provided information regarding the current fees for each of the RiverSource funds and other relevant institutional accounts. The Trustees reviewed and considered the proposed fee waiver/cap arrangements applicable to the Contractual Management Rates and considered the Contractual Management Rates after taking the waivers/caps into account (the “Actual Management Rates”). In this regard, the Trustees noted that RiverSource had committed to maintain the Funds’ current expense limitation and waiver arrangements (both contractual and voluntary). The Trustees considered the potential that, after the Closing, RiverSource would propose a common fee and expense structure for the combined fund family, subject to the commitment that Ameriprise will not seek any change that would result in an “unfair burden” on any Fund. The Trustees also considered the report prepared and provided by the Fee Consultant. Additionally, the Trustees received and afforded specific attention to information provided in connection with the Current Agreement Re-Approval Process, comparing the Contractual Management Rates and Actual Management Rates with those of other funds in each Fund’s Peer Group (as defined below).
During the Current Agreement Re-Approval Process, the Trustees reviewed and considered statistical information regarding each Fund’s total expense ratio and its various components, including contractual advisory fees, actual advisory fees, actual nonmanagement fees, Rule 12b-1 and non-Rule 12b-1 service fees, fee waivers/caps and/or expense reimbursements. The Trustees also reviewed comparisons of these fees to the expense information for the group of Funds that was determined by Lipper Inc. (“Lipper”) to be the most similar to a given Fund (the “Peer Group”) and to the performance of a broader universe of relevant funds as determined by Lipper (the “Universe”), which comparative data was provided by Lipper, an independent provider of investment company data.
The Trustees were provided with a description of the methodology used by Lipper to select the mutual funds in each Fund’s Peer Group and Universe and reviewed the degree of comparability resulting from the selection
99
methodology. For certain Funds, Lipper determined that changing the composition of the Peer Group and/or Universe for expenses from that used for performance would provide a more accurate basis of comparison. The Trustees also considered Lipper data that ranked each Fund based on: (i) each Fund’s one- and three-year performance compared to actual management fees; and (ii) each Fund’s one- and three-year performance compared to total expenses.
For each Fund, except as otherwise described in the Fund-specific discussion below, the Trustees noted that they had concluded during the Current Agreement Re-Approval Process that the Contractual Management Rates, the Actual Management Rates and the total expense ratio were at acceptable levels in light of the quality of services provided to the Fund and in comparison to such Fund’s Peer Group and Universe, as applicable; that the advisory fee rate would not be increased for any Fund; that Ameriprise and RiverSource had represented that the overall expenses for each Fund were not expected to be adversely affected by the Transaction; and that RiverSource had committed to maintain the Funds’ current expense limitation or waiver arrangements (both contractual and voluntary).
Based on the foregoing, other relevant information received and the additional information described in the Fund-specific discussion below, as applicable, the Trustees concluded that the Contractual Management Rates, the Actual Management Rates and the total expense ratio were acceptable.
Fund Performance
The Trustees reviewed detailed performance information for each Fund at various Board and committee meetings during the year in addition to the additional performance information that they reviewed and evaluated in connection with the Transaction. The Trustees also reviewed and evaluated detailed performance information for each Fund in connection with the Current Agreement Re-Approval Process. The Trustees considered the performance results for each of the Funds over multiple measurement periods. They also considered these results in comparison to the performance results of each Fund’s Peer Group and Universe, as well as to each Fund’s benchmark index. The Boards also noted certain risk-adjusted performance data.
The Trustees also reviewed and evaluated information and data regarding the investment performance record of RiverSource in managing funds with investment strategies generally similar to those of the Funds, as applicable. Investment performance for such funds was provided for a wide range of periods.
The Trustees recognized that the investment performance record of RiverSource in managing funds with similar objectives may be less relevant to their deliberations in situations where the current portfolio managers of Columbia are expected to continue managing a particular Fund following the Closing. They also recognized that for each Fund, it is not possible to predict with certainty what effect, if any, consummation of the Transaction will have on the future performance of the Funds, noting in particular that past investment performance is no assurance of future results. The Fund-by-Fund discussion set forth below provides additional information regarding those Funds highlighted as meeting agreed-upon criteria for warranting further review. Such criteria included, among other things, information relating to Actual Management Rates, total expense ratios and/or performance information, relative to a Fund’s Peer Group and/or Universe.
Costs of Services to be Provided and Profitability
In considering the costs of services to be provided by RiverSource and the Subadvisers under the Proposed Advisory Agreement and Proposed Subadvisory Agreement, as applicable for each Fund, and the projected range of profitability to RiverSource and the Subadvisers from their relationships with the Funds, the Trustees considered, among other things, that there would be no increase in advisory or subadvisory fee rates under the Proposed Advisory and Subadvisory Agreements. The Trustees further noted, with respect to RiverSource, that it was not possible to predict with certainty how RiverSource’s profitability would be affected by becoming the investment adviser to the Funds but, as a general matter, they were satisfied, based on their review of RiverSource’s projected range of profitability assuming completion of the Transaction, that this projected profitability from their relationship with the Funds would not be excessive. The Trustees based their review, in part, on information regarding RiverSource’s current profitability in managing the RiverSource Funds and the information available to the Trustees with respect to RiverSource’s expense budgeting process. The Trustees also noted that they would have
100
ongoing opportunities to address RiverSource’s profitability in the future based on actual results. The Trustees did not consider separate profitability information with respect to the Subadvisers, as their profitability from their relationships with the Funds was not a material factor in determining whether to approve the Proposed Subadvisory Agreements. The Trustees also noted that the subadvisory fees paid to the Subadvisers, none of which is affiliated with Columbia, had previously been negotiated on an arms’ length basis.
The Trustees also reviewed information about the financial condition of RiverSource and the Subadvisers and were satisfied that RiverSource and the Subadvisers have adequate resources to perform the services required under the Proposed Advisory and Proposed Subadvisory Agreements.
Subject to the limitations noted above, the Trustees concluded that they were satisfied that RiverSource’s projected range of future profitability, and each Subadviser’s historical profitability, from their relationship with each Fund, as relevant, were not excessive.
Economies of Scale
The Trustees received and evaluated information regarding the potential to realize economies of scale with respect to management of the Funds, whether the Funds would appropriately benefit from any economies of scale and whether there was any potential for realization of further economies of scale in connection with the Transaction. The Trustees noted that the current and proposed investment advisory fee rates for most of the Funds contain breakpoints that reduce the fee rate on assets above specified levels. The Trustees noted that RiverSource had indicated that no changes to the Funds’ breakpoint arrangements were proposed to be made at this time. In light of these factors and noting that it was not possible to evaluate with certainty if and how the Transaction would produce any immediate opportunities for additional economies of scale, the Trustees concluded that each Fund’s breakpoint arrangements were acceptable. The Trustees also recognized that the Funds may benefit from certain economies of scale over time from becoming a part of the larger RiverSource fund complex, based on potential future synergies of operations, potential fee harmonization/rationalization initiatives and potential future Fund mergers. The Trustees noted, in particular, RiverSource’s acknowledgement of the principle that the Funds should share in certain economies of scale if realized by RiverSource. In addition, the Trustees evaluated the likelihood that there would be potential Fund mergers after the Closing. The Trustees noted that any such potential Fund mergers, if approved, could result in the achievement of additional breakpoints for Funds that have implemented breakpoint fee schedules. The Trustees also noted that they expect to consider economies of scale from time to time following the Closing and thus be in a position to evaluate any additional economies of scale.
The Trustees acknowledged the inherent limitations of any analysis of an investment adviser’s economies of scale, stemming largely from the Trustees’ understanding that economies of scale are generally realized, if at all, by an investment adviser across a variety of products and services, not just with respect to a single fund.
Information About Investment Management Services to Non-Mutual Fund Clients
The Trustees also received and reviewed information about the nature and extent of services and fee rates offered by Riversource and the Subadvisers to the Funds compared with other clients with similar accounts, including separate accounts and institutional investments. The Trustees noted that the Funds may receive services different from those offered to other clients of RiverSource and the Subadvisers and concluded that the advisory fee rates under the Proposed Advisory Agreements and the subadvisory fee rates under the Proposed Subadvisory Agreements were not excessive, given the nature and extent of services expected to be offered and other factors, including the Trustees’ review of Lipper data.
Other Benefits to RiverSource and the Subadvisers
The Trustees received and reviewed information regarding any expected “fall-out” or ancillary benefits to be received by RiverSource and its affiliates and by the Subadvisers as a result of their relationships with the Funds.
Among other things, the Trustees noted that RiverSource would benefit from soft dollar arrangements using portfolio brokerage of each Fund that invests in equity securities. The Trustees also noted that the Subadvisers also had benefited from, and expected to continue to benefit from, soft dollar arrangements using portfolio brokerage of the Subadvised
101
Funds. The Trustees acknowledged RiverSource’s representation that none of its affiliated broker dealers was expected to provide brokerage services to any Fund, but noted that broker-dealer affiliates of RiverSource will receive distribution related fees from the Funds in respect of shares held in certain accounts, and that such Funds’ distributor (which will also become a subsidiary of RiverSource following the closing of the Transaction) retains a portion of the distribution related fees from the Funds and receives a portion of the sales charges on sales or redemptions of certain classes of shares of the Funds. The Trustees recognized that RiverSource’s and the Subadvisers’ profitability would be somewhat lower without these benefits. The Trustees concluded that RiverSource and the Subadvisers may derive reputational benefits from their association with the Funds. The Trustees also noted, however, that such benefits were difficult to quantify with certainty.
Fund-Specific Considerations for Certain “Review” Funds
During the Current Agreement Re-Approval Process, a limited number of Funds were highlighted as meeting agreed-upon criteria for warranting further review. Such criteria included, among other things, information relating to Actual Management Rates, total expense ratios and/or performance information, relative to a Fund’s Peer Group and/or Universe. For such “review” Funds, the Trustees engaged in further analysis with regard to the approval of the Funds’ Current Advisory Agreements. For each such Fund, the Trustees subsequently considered the impact of transitioning investment management responsibilities to RiverSource.
None of the Funds were highlighted as review funds.
Conclusion
After an evaluation of the above-described factors and based on its deliberations and analysis of the information provided and alternatives considered, each Board, including all of the Independent Trustees, concluded that approval of the Proposed Advisory and Subadvisory Agreements was in the best interests of each of the Funds and its shareholders. Accordingly, the Boards unanimously approved the Proposed Advisory and Subadvisory Agreements.
102
Summary of Management Fee Evaluation by Independent Fee Consultant
REPORT OF INDEPENDENT FEE CONSULTANT TO THE FUNDS SUPERVISED BY THE COLUMBIA NATIONS BOARD
Prepared Pursuant to the February 9, 2005 Assurance of Discontinuance among the Office of Attorney General of New York State, Columbia Management Advisors, LLC, and Columbia Management Distributors, Inc. November 12, 2009
I. Overview
On February 9, 2005, Columbia Management Advisors, LLC (“CMA”) and Columbia Management Distributors, Inc.1 (“CMD”) agreed to the New York Attorney General’s Assurance of Discontinuance (“AOD”). Among other things, the AOD stipulates that CMA may manage or advise a Columbia Fund (“Columbia Fund” and, together with some or all of such funds, the “Columbia Funds”) only if the Independent Members of the Columbia Fund’s Board of Trustees appoint a Senior Officer or retain an Independent Fee Consultant (“IFC”) who is to manage the process by which proposed management fees are negotiated. The AOD further stipulates that the Senior Officer or IFC is to prepare a written annual evaluation of the fee negotiation process.
With effect from January 1, 2007, the Independent Members of the Board of Trustees for certain Columbia Funds known collectively as the “Nations Funds” (together with the other members of that Board, the “Trustees”) retained me as IFC for the Nations Funds.2 In this capacity, I have prepared the fifth annual written evaluation of the fee negotiation process. As was the case with the 2007 and 2008 reports, my immediate predecessor as IFC, John Rea, provided invaluable assistance in the preparation of this year’s report.
A. Role of the Independent Fee Consultant
The AOD charges the IFC with “managing the process by which proposed management fees … to be charged the Columbia Fund are negotiated so that they are negotiated in a manner which is at arms’ length and reasonable and consistent with this Assurance of Discontinuance.” The AOD also provides that CMA “may manage or advise a Columbia Fund only if the reasonableness of the proposed management fees is determined by the Board of Trustees … using … an annual independent written evaluation prepared by or under the direction of … the Independent Fee Consultant.” Therefore, the AOD makes clear that the IFC does not supplant the Trustees in negotiating management fees with CMA, nor does the IFC substitute his or her judgment for that of the Trustees with respect to the reasonableness of proposed fees or any other matter that is committed to the business judgment of the Trustees.
B. Elements Involved in Managing the Fee Negotiation Process
In preparing the report required by the AOD, the IFC must consider at least the following six factors set forth in the AOD:
| 1. | The nature and quality of CMA’s services, including the Fund’s performance; |
| 2. | Management fees (including any components thereof) charged by other mutual fund companies for like services; |
| 3. | Possible economies of scale as the Fund grows larger; |
| 4. | Management fees (including any components thereof) charged to institutional and other clients of CMA for like services; |
| 5. | Costs to CMA and its affiliates of supplying services pursuant to the management fee agreements, excluding any intra-corporate profit; and |
| 6. | Profit margins of CMA and its affiliates from supplying such services. |
C. Organization of the Annual Evaluation
This report, like last year’s, focuses on the six factors and contains a section for each factor except that CMA’s costs and profits from managing the Funds are treated in a single section. In addition to a discussion of these factors, the report
| 1 | CMA and CMD are subsidiaries of Columbia Management Group, LLC (“CMG”), and are the successors to the entities named in the AOD. |
| 2 | I have no material relationship with Bank of America, CMG or any of its affiliates, aside from serving as IFC, and I am aware of no material relationship with any of their affiliates. I retained John Rea, an independent economic consultant, to assist me with this report. |
| | Unless otherwise stated or required by the context, this report covers only the Nations Funds, which are also referred as the “Funds.” |
103
offers recommendations to improve the fee review process in future years. A review of the status of recommendations made in the 2008 Report is being provided separately with the materials for the November meeting.
II. Summary of Findings
A. General
| 1. | Based upon my examination of the information supplied by CMG in the light of the six factors set forth in the AOD, I conclude that the Trustees have the relevant information necessary to evaluate the reasonableness of the proposed management fees for each Nations Fund, subject to the following: on September 30, 2009, Ameriprise Financial, Inc. (“Ameriprise”) announced that it had agreed to purchase the investment management business of CMG with the exception of its cash and liquidity management business which includes the Nations money market Funds. As a result, the Trustees requested information from CMG as to the plans of CMG and its parent with respect to the provision of investment management services to those Funds after the consummation of the proposed transaction. As of the date of this report, that information has not yet been provided. However, as the transaction is not expected to close until the spring of 2010, the Trustees concluded that they would have ample opportunity to take appropriate steps with respect to the investment management agreements of the money market Funds, including invoking the 60-day termination provisions of those agreements, in response to the information to be provided by CMG and reviewed by the IFC. |
In my view, the process by which the proposed management fees of the Funds have been negotiated in 2009 thus far has been, to the extent practicable, at arms’ length and reasonable and consistent with the AOD.
B. Nature and Quality of Services, Including Performance
| 3. | The performance of the Funds was relatively strong for the measuring periods ending March 31, 2009. Between one-third and nearly one-half of the Funds were ranked in either the first or second quintiles in the one-, three-, five-, and 10-year periods, and no more than 8% were in the fifth quintile for these periods. Overall, the performance was stronger in the two longer periods. |
| 4. | The strongest performing groups over the one-, three-, and five-year periods were active equity, quantitative strategies, and, to a lesser extent, money market Funds. Sub-advised Funds were the weakest performers, with over 60% of the Funds in the bottom two quintiles in the one- and three-year periods. For the same two periods, no more than 15% percent of the sub-advised Funds were in the top two quintiles. Almost half of fixed-income Funds ranked in the bottom two quintiles in the one- and three-year periods. |
| 5. | Overall performance of the Funds was less robust in 2009 than in 2008 and 2007 for the one- and three-year performance periods. For example, 62% of the Funds were in the top two quintiles in 2007 for the one-year period compared with 33% in 2009. The ranks of those in the bottom two quintiles rose significantly between 2007 and 2009, led by money market and fixed-income Funds in the one- and three-year periods. For the three-year period, there was a similar trend with respect to sub-advised Funds. |
| 6. | The performance of the active equity Funds against their benchmarks was strong for the one-, three-, and five-year performance periods. In contrast, more than half of the sub-advised Funds failed to beat their benchmarks on a net basis in the one- and three-year periods. The fixed-income Funds consistently produced gross returns below those of their benchmarks. Lipper quintile rankings of the actively managed equity Funds are highly correlated with their performance against their benchmarks in the sense that net returns in excess of the benchmark appear necessary to achieve a ranking in one of the top three quintiles. No such correlation was observed for fixed-income and quantitative strategies Funds. |
| 7. | The equity Funds’ overall performance adjusted for risk was mixed. Based upon three-year returns, less than 40% of the equity Funds had a combination of risk-adjusted and unadjusted returns that placed them in the top half of their performance universes; 60% were in the bottom half of their universes. About 30% of the fixed income Funds posted high returns and low risk relative to comparable funds. Over 60% of the fixed-income Funds took on more risk than the typical fund in their performance universes. |
| 8. | The industry-standard procedure used by Lipper that includes all share classes in the performance universe tends to bias a Fund’s ranking upward within that |
104
| | universe. The bias occurs because either no-12b-1 fee or low-12b-1 fee share classes of the Nations Funds are compared with funds in performance universes that include all share classes of multi-class funds with 12b-1 fees of up to 100 basis points. Correcting this bias by limiting the performance universe to classes of comparable funds with low or no 12b-1 fees (a “filtered universe”) lowers the relative performance for the Funds, but generally not to a material extent. The filtering process, however, did identify two Funds for further review that had not been so identified using unfiltered universes. |
| 9. | A small number of Funds have consistently underperformed over the past five years. The exact number depends on the criteria used to evaluate longer-term performance. For example, six different Funds have had below-median performance in at least four out of the five years between 2005 and 2009 for either the one- or three-year performance periods from 2005 to 2009. If the threshold were the 60th percentile, only two Funds would have satisfied the criteria. |
| 10. | The services performed by CMG professionals beyond portfolio management, such as compliance, legal, information technology, risk management, finance, and fund administration, are critical to the success of the Funds and appear to be of high quality. |
C. Management Fees Charged by Other Mutual Fund Companies
| 11. | The Funds’ management fees and total expenses are generally low relative to those of their peers, with over half the Funds ranking in the most favorable two quintiles. For total expenses, slightly more than one-quarter are in the bottom two quintiles, while slightly less than two-fifths are in the bottom two quintiles for actual management fees. Fixed-income and quantitative strategies Funds have the lowest fees and expenses relative to their peers. The sub-advised Funds account for the majority of Funds in the fifth quintile for both management fees and total expenses. |
| 12. | The distribution of management fee rankings has changed little over the past three years, while the distribution of total expense rankings has moved in the direction of higher expenses. The most notable change involving total expenses has been a shift in the number of Funds from the first to the second quintile. |
| 13. | The management fees of the non-subadvised Funds are generally in line with those of Columbia Funds supervised by the Atlantic Board of Trustees (the “Atlantic Funds”). The sub-advised large cap equity, international equity, and high yield Funds, however, generally have higher management fees than those of comparable Atlantic and non-subadvised Funds. |
| 14. | The implementation of the new program of voluntary expense limits appears to have been associated, on balance, with less favorable expense rankings. This result reflects increases in expense limits for certain Funds, the removal of fee waivers, and the shift of certain expenses from CMA to the Funds. The decline in expense rankings is less significant, however, than CMA projected in December 2008. |
D. Trustees’ Advisory Contract Review Process
| 15. | The Trustees’ evaluation process identified 22 Funds in 2009 for further review based upon long-standing criteria relating to their relative performance or expenses or both. When compared in filtered universes, two more Funds met the criteria for further review. At the November meeting, CMG provided further information about each of those Funds to assist the Trustees in their evaluation. |
E. Potential Economies of Scale
| 16. | CMG presented to the Trustees its analysis of the sources and sharing of potential economies of scale. CMG views economies of scale as arising at the complex level and would regard estimates of scale economies for individual funds as unreliable. In its analysis, CMG did not identify specific sources of economies of scale or provide any estimates of any economies of scale that might arise from future asset growth. CMG’s analysis included measures taken by the Trustees and CMG that seek to share any potential economies of scale through breakpoints in management fee schedules, the establishment of expense limits for each Fund, enhanced shareholder services, fund mergers, and operational consolidation. |
| 17. | An examination of the contractual fee schedules for five Nations Funds shows that the schedules for Small Cap II, Municipal Reserves, and Treasury Reserves compare favorably with those of their competitors, while the |
105
| | subadvised Marsico Growth and High Yield VS Funds have schedules generally above those of their peers, including funds that do not have a sub-adviser. The group fee with breakpoints that characterizes the money market Fund schedules is not typically found among competitors, nearly all of which have flat fee schedules. |
F. Management Fees Charged to Institutional Clients
| 18. | CMG has provided Trustees with comparisons of mutual fund management fees and institutional fees based upon standardized fee schedules and upon actual fees. The results show that, consistent with industry practice, actual and scheduled institutional fees are generally, but not always, lower than the Funds’ management fees. CMG provided additional data this year demonstrating that at small asset levels, the effective fee of certain Funds may be equal to or less than institutional fee levels at those asset levels, due to the effect of expense limits on small funds with high gross expenses. CMG also analyzed the differences between the services provided and risks borne on the one hand by a manager of mutual funds and on the other by institutional advisers, and suggested that these differences should be kept in mind when Trustees review the reasonableness of the Funds’ management fees. |
G. Revenues, Expenses, and Profits
| 19. | The activity-based cost allocation methodology employed by CMG to allocate costs, both direct and indirect, for purposes of calculating Fund profitability is thoughtful and detailed. This year, CMG further refined the technique by allocating additional indirect expenses on an activity basis. |
| 20. | The materials provided on CMG’s revenues and expenses with respect to the Funds and the methodology underlying their construction form a sufficient basis for Trustees to evaluate the expenses of and profitability to CMG arising out of its relationships with the Funds. |
| 21. | CMG provided a firm-wide pro forma 2009 income statement demonstrating the effect of market events beginning in the fourth quarter of 2008 on its revenues and profitability to provide an additional perspective on calendar 2008 profitability data. |
| 22. | In 2008, CMG’s pre-tax pre- and post-distribution margins on the Nations Funds were above the industry mean and median, based on limited data available for publicly held mutual fund managers and excluding the costs of CMG’s money market capital support programs. However, as is to be expected in a 63-Fund complex, some Nations Funds had relatively high pre-tax profit margins in 2008, when calculated solely with respect to management revenues and expenses, while other Nations Funds operated at a loss. There is a positive relationship between Fund size and profitability to CMG, with smaller Funds generally operating at a loss to CMG. |
| 23. | CMG pays a fixed percentage of its management fee revenues to an affiliate, U.S. Trust, Bank of America Private Wealth Management, with respect to assets of its clients invested in Nations Funds to compensate it for services it performs with respect to those client assets and for the effect of state law limitations on affiliates charging multiple fees. Based on our analysis of the services provided by this affiliate, we have concluded that all payments other than those for sub-transfer agent or sub-accounting services should be treated as a distribution expense. |
III. Recommendations
| 1) | Criteria for review. The Trustees may wish to consider modifying the criteria for identifying a Fund for further review (a “Review Fund”) to include criteria that focus exclusively on performance. They may also wish to consider whether it would be useful to apply CMG’s own internal monitoring standards for Fund performance to the contract review process, or whether such criteria are more relevant to their ongoing investment oversight. |
| 2) | Presentation of Review Fund discussion. CMG should consider whether it could more systematically present in one discussion all relevant information regarding each Review Fund, which is now split into several different portions of the 15(c) materials. For any Fund that has been a Review Fund in consecutive years, CMG should address under what circumstances it could reasonably be anticipated that the Fund would lose that status. |
| 3) | Refinement of tax-exempt performance data. Certain single-state tax-exempt Funds compete in extremely small |
106
| | universes and are compared to a multi-state benchmark of uncertain relevance. Notwithstanding the difficulties, CMG should work to improve the reliability of the calculation of relative performance of these Funds. If that is not possible, CMG should provide guidance on how the Trustees should judge the quality of CMG’s management of these Funds. |
| 4) | Development of risk metrics for asset-allocation, tax-exempt, and money market Funds. CMG has developed and shared with the Trustees quantitative risk metrics comparing equity and taxable fixed-income Funds against their peers. However, reliable risk metrics have not been developed for asset-allocation, tax-exempt fixed income, and money market Funds. We urge CMG to continue its efforts to provide reliable risk measures for these categories of Funds, especially in the cases of asset-allocation and money market funds, because their investors are likely to be motivated at least in part by a desire to manage risk. |
| 5) | Profitability data. For any period during which CMG is an affiliate of U.S. Trust, Bank of America Private Wealth Management, CMG should continue to present to the Trustees the profitability of each Fund, each investment style and each complex (of which Nations is one) calculated as follows: |
| | a. | Management-only profitability should be calculated without reference to any Private Bank expense. |
| | b. | Profitability excluding distribution (which essentially covers the management and transfer agency functions) should be adjusted by removing from the expense calculation any portion of the Private Bank payment not attributable to the performance by the Private Bank of sub-transfer agency or sub-accounting functions. |
| | c. | Total profitability, including distribution: No adjustment for Private Bank expenses should be made, because all such expenses represent legitimate fund expenses to be taken into account in calculating CMG’s profit margin including distribution. |
| | d. | Distribution only: This should include all Private Bank expenses other than those attributable to sub-transfer agency services. |
| 6) | Contractual fee analysis. This year CMG presented a new Lipper report comparing the contractual management fees of Funds with those of competitors in similar investment styles. However, the reliability of the conclusion – that Fund management fee breakpoints compared favorably with competitive fee rates – was limited by the use of competitive funds at all asset levels. The sponsors of a $100 million mutual fund may not have given much thought to breakpoints at $5 billion; therefore, that fund’s contractual fee at that level is unlikely to compare favorably with that of a $5 billion Fund. Limiting the competitors to the Lipper expense group, whose constituents are similar in size to the relevant Fund, would make the results more meaningful. In addition, the breakpoints of a select group of Nations Funds (which would differ each year) should continue to be compared to those of industry rivals to ensure that the Funds’ breakpoint schedules remain within industry norms. As breakpoint schedules change relatively little each year, performing such a comparison for each Nations Fund each year would not be an efficient use of Trustee and CMG resources. |
| 7) | Pro forma profitability data. In any year in which CMG or the Trustees believe that the prior year’s profitability is unlikely to be representative of current business results due to changes in markets or for any other reason, CMG should, consistent with this year’s practice, prepare a pro forma income statement based on year-to-date actual data and reasonable projections used for its own business planning purposes. |
| 8) | Additional institutional data and analysis. While CMG provided a substantial amount of information on its institutional business, we suggest some additional items for future years: (a) profitability data for the institutional business in the format, and based upon the same allocation methodologies, used to present Fund profitability, (b) an explanation of how CMA sets institutional fee breakpoints, which normally begin at asset levels far lower than those found in Fund management fee breakpoints, and (c) distinguishing in all institutional fee materials fees of accounts acquired prior to the development of current fee schedules (so-called “legacy” accounts) from the fees of accounts launched after that time. |
| 9) | Management fee disparities. In any future study of management fees, CMG and the Nations Trustees should |
107
| | analyze the differences in management fee schedules. As part of that analysis, CMG should provide an explanation for any significant fee differences among comparable funds across fund families sponsored by CMG, such as differences in the management styles of different Funds included the same Lipper category. Finally, if CMG proposes a management fee change or an expense cap for any mutual fund managed by CMA that is comparable to any Nations Fund, CMG should provide the Trustees with sufficient information about the proposal to allow the Trustees to assess the applicability of the proposed change to the relevant Nations Fund or Funds. |
| 10) | Explanation of data supplied to Lipper. Each year, as part of the 15(c) process, CMG retains Lipper to compare the fees and expenses of each Fund to a group of competitors. In many cases, CMG, with the approval of the Trustees, adjusts the actual expense data, which is based on the most recent full fiscal year of the Fund (and each competitive fund) to reflect changes in fees or expense limits that occurred during or after the relevant fiscal year. This improves the reliability and usefulness of the comparison. However, to ensure that the Trustees know when and how CMG adjusted the data, we recommend that CMG prepare a table listing for each Fund what adjustments were made, e.g., to reflect a new expense limitation of x basis points that commenced on y date. |
| 11) | Reduction of volume of paper documents submitted. The effort to streamline and better organize the data presented to the Trustees and the process by which that data was prepared and organized continued to be well-received by all parties. Notwithstanding past success, it is always appropriate to look for opportunities to reduce and simplify the presentation of 15(c) data. One possibility would be to remove the 127 pages of biographical data, most if not all of which the Trustees have previously seen as part of their ongoing investment oversight duties, from the paper volume and post it on the Internet-based document storage and retrieval system used by the Funds to provide reference data to Trustees. |
Respectfully submitted,
Steven E. Asher
108
Important Information About This Report
Transfer Agent
Columbia Management Services, Inc.
P.O. Box 8081
Boston, MA 02266-8081
1-800-345-6611
Distributor
Columbia Management
Distributors, Inc.
One Financial Center
Boston, MA 02111
Investment Advisor
Columbia Management Advisors, LLC
100 Federal Street
Boston, MA 02110
The funds mail one shareholder report to each shareholder address. If you would like more than one report, please call shareholder services at 1-800-345-6611 and additional reports will be sent to you. This report has been prepared for shareholders of Columbia Index Funds.
A description of the policies and procedures that each fund uses to determine how to vote proxies and a copy of each fund’s voting records are available (i) at www.columbiamanagement.com, (ii) on the Securities and Exchange Commission’s website at www.sec.gov, and (iii) without charge, upon request, by calling 1-800-368-0346. Information regarding how each fund voted proxies relating to portfolio securities during the 12-month period ended June 30 is available from the SEC’s website. Information regarding how each fund voted proxies relating to portfolio securities is also available from the funds’ website, www.columbiamanagement.com.
Each fund files a complete schedule of portfolio holdings with the SEC for the first and third quarters of each fiscal year on
Form N-Q. Each fund’s Form N-Q is available on the SEC’s website at www.sec.gov and may be reviewed and copied at the SEC’s Public Reference Room in Washington, D.C. Information on the operation of the Public Reference Room may be obtained by calling
1-800-SEC-0330.
Please read and consider the investment objectives, risks, charges and expenses for any fund carefully before investing. For a prospectus which contains this and other important information about the fund, contact your Columbia Management representative or financial advisor or go to www.columbiamanagement.com.
Columbia Management Group, LLC (“Columbia Management”) is the investment management division of Bank of America Corporation. Columbia Management entities furnish investment management services and products for institutional and individual investors. Columbia Funds are distributed by Columbia Management Distributors, Inc., member of FINRA, SIPC, part of Columbia Management and an affiliate of Bank of America Corporation.
109

One Financial Center
Boston, MA 02111-2621
Index Funds
Annual Report, February 28, 2010
©2010 Columbia Management Distributors, Inc.
One Financial Center, Boston, MA 02111-2621
800.345.6611 www.columbiafunds.com
SHC-42/35117-0210 (04/10) 09/K6U0C2
Item 2. Code of Ethics.
(a) The registrant has, as of the end of the period covered by this report, adopted a code of ethics that applies to the registrant’s principal executive officer, principal financial officer, principal accounting officer or controller, or persons performing similar functions, regardless of whether these individuals are employed by the registrant or a third party.
(b) During the period covered by this report, there were not any amendments to a provision of the code of ethics adopted in 2(a) above.
(c) During the period covered by this report, there were no waivers, including any implicit waivers, from a provision of the code of ethics described in 2(a) above that relates to one or more of the items set forth in paragraph (b) of this item’s instructions.
Item 3. Audit Committee Financial Expert.
The registrant’s Board of Trustees has determined that William P. Carmichael qualifies as an audit committee financial expert, as defined in Item 3 of Form N-CSR and is “independent” (as defined in Item 3 of Form N-CSR).
Item 4. Principal Accountant Fees and Services.
Fee information below is disclosed for the nineteen series of the registrant whose reports to stockholders are included in this annual filing.
(a) Audit Fees. Aggregate Audit Fees billed by the principal accountant for professional services rendered during the fiscal years ended February 28, 2010 and February 28, 2009 are approximately as follows:
2010 | | 2009 | |
$ | 646,500 | | $ | 644,000 | |
| | | | | |
Audit Fees include amounts related to the audit of the registrant’s annual financial statements or services that are normally provided by the accountant in connection with statutory and regulatory filings or engagements for those fiscal years. In both fiscal years
2010 and 2009, Audit Fees also include fees for the review of and provision of consent in connection with filing Form N-1A for five funds.
(b) Audit-Related Fees. Aggregate Audit-Related Fees billed to the registrant by the principal accountant for professional services rendered during the fiscal years ended February 28, 2010 and February 28, 2009 are approximately as follows:
2010 | | 2009 | |
$ | 87,400 | | $ | 87,400 | |
| | | | | |
Audit-Related Fees include amounts for assurance and related services by the principal accountant that are reasonably related to the performance of the audit of the registrant’s financial statements and are not reported in Audit Fees above. In both fiscal years 2010 and 2009, Audit-Related Fees consist of agreed-upon procedures performed for semi-annual shareholder reports.
During the fiscal years ended February 28, 2010 and February 28, 2009, there were no Audit-Related Fees billed by the registrant’s principal accountant to the registrant’s investment adviser (not including any sub-adviser whose role is primarily portfolio management and is subcontracted with or overseen by another investment adviser) and any entity controlling, controlled by, or under common control with the adviser that provides ongoing services to the registrant for an engagement that related directly to the operations and financial reporting of the registrant.
(c) Tax Fees. Aggregate Tax Fees billed by the principal accountant to the registrant for professional services rendered during the fiscal years ended February 28, 2010 and February 28, 2009 are approximately as follows:
2010 | | 2009 | |
$ | 83,300 | | $ | 111,100 | |
| | | | | |
Tax Fees include amounts for the review of annual tax returns, the review of required shareholder distribution calculations and typically include amounts for professional services by the principal accountant for tax compliance, tax advice and tax planning. In fiscal year 2010, Tax Fees also include fees for the review of foreign tax filings.
During the fiscal years ended February 28, 2010 and February 28, 2009, there were no Tax Fees billed by the registrant’s principal accountant to the registrant’s investment adviser (not including any sub-adviser whose role is primarily portfolio management and is subcontracted with or overseen by another investment adviser) and any entity controlling, controlled by, or under common control with the adviser that provides ongoing services to the registrant for an engagement that related directly to the operations and financial reporting of the registrant.
(d) All Other Fees. Aggregate All Other Fees billed by the principal accountant to the registrant for professional services rendered during the fiscal years ended February 28, 2010 and February 28, 2009 are approximately as follows:
All Other Fees include amounts for products and services provided by the principal accountant, other than the services reported in paragraphs (a) through (c) above.
Aggregate All Other Fees billed by the registrant’s principal accountant to the registrant’s investment adviser (not including any sub-adviser whose role is primarily portfolio management and is subcontracted with or overseen by another investment adviser) and any entity controlling, controlled by, or under common control with the adviser that provides ongoing services to the registrant for an engagement that related directly to the operations and financial reporting of the registrant during the fiscal years ended February 28, 2010 and February 28, 2009 are approximately as follows:
2010 | | 2009 | |
$ | 1,119,400 | | $ | 893,100 | |
| | | | | |
In both fiscal years 2010 and 2009, All Other Fees consist of fees billed for internal control examinations of the registrant’s transfer agent and investment advisor. Fiscal year 2010 also includes fees for agreed upon procedures related to the sale of the long-term asset management business.
(e)(1) Audit Committee Pre-Approval Policies and Procedures
The registrant’s Audit Committee is required to pre-approve the engagement of the registrant’s independent accountants to provide audit and non-audit services to the registrant and non-audit services to its investment adviser (not including any sub-adviser whose role is primarily portfolio management and is subcontracted with or overseen by another investment adviser) or any entity controlling, controlled by or under common control with such investment adviser that provides ongoing services to the registrant (“Adviser Affiliates”), if the engagement relates directly to the operations and financial reporting of the registrant.
The Audit Committee has adop ted a Policy for Engagement of Independent Accountants for Audit and Non-Audit Services (“Policy”). The Policy sets forth the understanding of the Audit Committee regarding the engagement of the registrant’s independent accountants to provide (i) audit and permissible audit-related, tax and other services to the registrant (collectively “Fund Services”); (ii) non-audit services to the registrant’s investment adviser (not including any sub-adviser whose role is primarily portfolio management and is subcontracted with or overseen by another investment adviser) and Adviser Affiliates, if the engagement relates directly to the operations or
financial reporting of a Fund (collectively “Fund-related Adviser Services”); and (iii) certain other audit and non-audit services to the registrant’s investment adviser (not including any sub-adviser whose role is primarily portfolio management and is subcontracted with or overseen by another investment adviser) and Adviser Affiliates. Unless a type of service receives general pre-approval under the Policy, it requires specific pre-approval by the Audit Committee if it is to be provided by the independent accountants. Pre-approval of non-audit services to the registrant, the registrant’s investment adviser (not including any sub-adviser whose role is primarily portfolio management and is subcontracted with or overseen by another investment adv iser) and Adviser Affiliates may be waived provided that the “de minimis” requirements set forth under paragraph (c)(7)(i)(C) of Rule 2-01 of Regulation S-X are met.
Under the Policy, the Audit Committee may delegate pre-approval authority to any pre-designated member or members who are Independent Trustees/Directors. The member(s) to whom such authority is delegated must report, for informational purposes only, any pre-approval decisions to the Audit Committee at its next regular meeting. The Audit Committee’s responsibilities with respect to the pre-approval of services performed by the independent accountants may not be delegated to management.
The Policy requires the Fund Treasurer and/or Director of Board Administration to submit to the Audit Committee, on an annual basis, a schedule of the types of services that are subject to general pre-approval. The schedule(s) provide a description of each type of service that is subject to general pre-approval and, where possible, will provide estimated fee caps for each instance of providing each service. The Audit Committees will review and approve the types of services and review the projected fees for the next fiscal year and may add to, or subtract from, the list of general pre-approved services from time to time based on subsequent determinations. That approval acknowledges that the Audit Committee is in agreement with the specific types of services that the independent accountants will be permitted to perform.
The Fund Treasurer and/or Director of Board Administration shall report to the Audit Committee at each of its regular meetings regarding all Fund Services or Fund-related Adviser Services initiated since the last such report was rendered, including a general description of the services, actual billed and projected fees, and the means by which such Fund Services or Fund-related Adviser Services were pre-approved by the Audit Committee.
*****
(e)(2) The percentage of services described in paragraphs (b) through (d) of this Item approved pursuant to the “de minimis” exception under paragraph (c)(7)(i)(C) of Rule 2-01 of Regulation S-X during both fiscal years ended February 28, 2010 and February 28, 2009 was zero.
(f) Not applicable.
(g) The aggregate non-audit fees billed by the registrant’s accountant for services rendered to the registrant, and rendered to the registrant’s investment adviser (not including any sub-adviser whose role is primarily portfolio management and is subcontracted with or overseen by another investment adviser), and any entity controlling, controlled by, or under common control with the adviser that provides ongoing services to the registrant for the fiscal years ended February 28, 2010 and February 28, 2009 are approximately as follows:
2010 | | 2009 | |
$ | 1,290,100 | | $ | 1,091,600 | |
| | | | | |
(h) The registrant’s Audit Committee of the Board of Directors has considered whether the provision of non-audit services that were rendered to the registrant’s adviser (not including any sub-adviser whose role is primarily portfolio management and is subcontracted with or overseen by another investment adviser), and any entity controlling, controlled by, or under common control with the investment adviser that provides ongoing services to the registrant that were not pre-approved pursuant to paragraph (c)(7)(ii) of Rule 2-01 of Regulation S-X, is compatible with maintaining the principal accountant’s independence.
Item 5. Audit Committee of Listed Registrants.
Not applicable.
Item 6. Investments
(a) The registrant’s “Schedule I — Investments in securities of unaffiliated issuers” (as set forth in 17 CFR 210.12-12) is included in Item 1 of this Form N-CSR.
(b) Not applicable.
Item 7. Disclosure of Proxy Voting Policies and Procedures for Closed-End Management Investment Companies.
Not applicable.
Item 8. Portfolio Managers of Closed-End Management Investment Companies.
Not applicable.
Item 9. Purchases of Equity Securities by Closed-End Management Investment Company and Affiliated Purchasers.
Not applicable.
Item 10. Submission of Matters to a Vote of Security Holders.
There have not been any material changes to the procedures by which shareholders may recommend nominees to the registrant’s board of directors, since those procedures were last disclosed in response to requirements of Item 407(c)(2)(iv) of Regulation S-K (as required by Item 22(b)(15) of Schedule 14A) or this Item.
Item 11. Controls and Procedures.
(a) The registrant’s principal executive officer and principal financial officers, based on their evaluation of the registrant’s disclosure controls and procedures as of a date within 90 days of the filing of this report, have concluded that such controls and procedures are adequately designed to ensure that information required to be disclosed by the registrant in Form N-CSR is accumulated and communicated to the registrant’s management, including the principal executive officer and principal financial officer, or persons performing similar functions, as appropriate to allow timely decisions regarding required disclosure.
(b) There was no change in the registrant’s internal control over financial reporting that occurred during the registrant’s second fiscal quarter of the period covered by this report that has materially affected, or is reasonably likely to materially affect, the registrant’s internal control over financial reporting.
Item 12. Exhibits.
(a)(1) Code of ethics required to be disclosed under Item 2 of Form N-CSR attached hereto as Exhibit 99.CODE ETH.
(a)(2) Certifications pursuant to Rule 30a-2(a) under the Investment Company Act of 1940 (17 CFR 270.30a-2(a)) attached hereto as Exhibit 99.CERT.
(a)(3) Not applicable.
(b) Certification pursuant to Rule 30a-2(b) under the Investment Company Act of 1940 (17 CFR 270.30a-2(b)) attached hereto as Exhibit 99.906CERT.
SIGNATURES
Pursuant to the requirements of the Securities Exchange Act of 1934 and the Investment Company Act of 1940, the registrant has duly caused this report to be signed on its behalf by the undersigned, thereunto duly authorized.
(registrant) | | Columbia Funds Series Trust | |
| | |
| | |
By (Signature and Title) | | /s/ J. Kevin Connaughton | |
| | J. Kevin Connaughton, President | |
| | |
| | |
Date | | April 21, 2010 | |
| | | | | |
Pursuant to the requirements of the Securities Exchange Act of 1934 and the Investment Company Act of 1940, this report has been signed below by the following persons on behalf of the registrant and in the capacities and on the dates indicated.
By (Signature and Title) | | /s/ J. Kevin Connaughton | |
| | J. Kevin Connaughton, President | |
| | |
| | |
Date | | April 21, 2010 | |
| | |
By (Signature and Title) | | /s/ Michael G. Clarke | |
| | Michael G. Clarke, Chief Financial Officer | |
| | |
| | |
Date | | April 21, 2010 | |
| | | | |