UNITED STATES
SECURITIES AND EXCHANGE COMMISSION
Washington, D.C. 20549
FORM N-CSR
CERTIFIED SHAREHOLDER REPORT OF REGISTERED
MANAGEMENT INVESTMENT COMPANIES
Investment Company Act file number | 811-09645 |
|
Columbia Funds Series Trust |
(Exact name of registrant as specified in charter) |
|
One Financial Center, Boston, Massachusetts | | 02111 |
(Address of principal executive offices) | | (Zip code) |
|
James R. Bordewick, Jr., Esq. Columbia Management Advisors, LLC One Financial Center Boston, MA 02111 |
(Name and address of agent for service) |
|
Registrant’s telephone number, including area code: | 1-617-426-3750 | |
|
Date of fiscal year end: | March 31 | |
|
Date of reporting period: | March 31, 2009 | |
| | | | | | | | |
Form N-CSR is to be used by management investment companies to file reports with the Commission not later than 10 days after the transmission to stockholders of any report that is required to be transmitted to stockholders under Rule 30e-1 under the Investment Company Act of 1940 (17 CFR 270.30e-1). The Commission may use the information provided on Form N-CSR in its regulatory, disclosure review, inspection, and policymaking roles.
A registrant is required to disclose the information specified by Form N-CSR, and the Commission will make this information public. A registrant is not required to respond to the collection of information contained in Form N-CSR unless the Form displays a currently valid Office of Management and Budget (“OMB”) control number. Please direct comments concerning the accuracy of the information collection burden estimate and any suggestions for reducing the burden to Secretary, Securities and Exchange Commission, 450 Fifth Street, NW, Washington, DC 20549-0609. The OMB has reviewed this collection of information under the clearance requirements of 44 U.S.C. § 3507.
Item 1. Reports to Stockholders.
Columbia Management®
Annual Report
March 31, 2009
Columbia Asset Allocation Fund II
| NOT FDIC INSURED | | May Lose Value | |
|
| NOT BANK ISSUED | | No Bank Guarantee | |
|
Table of contents
| Fund Profile | | | 1 | | |
|
| Economic Update | | | 2 | | |
|
| Performance Information | | | 4 | | |
|
| Understanding Your Expenses | | | 5 | | |
|
| Portfolio Managers' Report | | | 6 | | |
|
| Financial Statements | | | | | |
|
| Investment Portfolio | | | 8 | | |
|
Statement of Assets and
Liabilities | | | 18 | | |
|
| Statement of Operations | | | 19 | | |
|
Statement of Changes in
Net Assets | | | 20 | | |
|
| Financial Highlights | | | 22 | | |
|
| Notes to Financial Statements | | | 26 | | |
|
| Report of Independent Registered Public Accounting Firm | | | 34 | | |
|
| Federal Income Tax Information | | | 35 | | |
|
| Fund Governance | | | 36 | | |
|
Board Consideration and
Re-Approval of Investment
Advisory Agreement | | | 40 | | |
|
Summary of Management
Fee Evaluation by Independent
Fee Consultant | | | 43 | | |
|
Important Information About
This Report | | | 49 | | |
|
The views expressed in this report reflect the current views of the respective parties. These views are not guarantees of future performance and involve certain risks, uncertainties and assumptions that are difficult to predict, so actual outcomes and results may differ significantly from the views expressed. These views are subject to change at any time based upon economic, market or other conditions and the respective parties disclaim any responsibility to update such views. These views may not be relied on as investment advice and, because investment decisions for a Columbia Fund are based on numerous factors, may not be relied on as an indication of trading intent on behalf of any particular Columbia Fund. References to specific securities should not be construed as a recommendation or investment advice.
President's Message

Dear Shareholder:
Recent events have shown great volatility in the markets and uncertainty in the economy. During these challenging times, it becomes even more important to focus on long-term horizons and key investment tools that can help manage volatility. This may be the time to reflect on your investment goals and evaluate your portfolio to ensure you are positioned for any potential market rebound.
A long-term financial plan can serve as a road map and guide you through the necessary steps designed to meet your financial goals. Your financial plan should take into account your investment goals, time horizon, overall financial situation, risk tolerance and willingness to ride out market volatility. Your investment professional can be a key resource as you work through this process. The knowledge and experience of an investment professional can help as you create or reevaluate your investment strategy.
The importance of diversification
Although diversification does not ensure a profit or guarantee against loss, a diversified portfolio can be a strategy for successful long-term investing. Diversification refers to the mix of investments within a portfolio. A mutual fund can contribute to portfolio diversification given that a mutual fund's portfolio represents several investments. Additionally, the way you allocate your money among stocks, bonds and cash, and geographically between foreign and domestic investments, can help to reduce risks. Diversification can result in multiple investments where the positive performance of certain holdings can offset any negative performance from other holdings. Having a diversified portfolio doesn't mean that the value of the portfolio will never go down, but rather helps strike a balance between risk and reward.
Reevaluate your strategy
An annual review of your investments is a key opportunity to determine if your investment needs have changed or if you need minor adjustments to rebalance your portfolio. Life events like a birth, marriage, home improvement, or change in employment can have a major affect on your spending and goals. Ask yourself how your spending or goals have changed and factor this into your financial plan. Are you using automated investments or payroll deductions to help keep your savings on track? Are you able to set aside additional savings or increase your 401(k) plan contributions? If during your review you find that your investments in any one category (e.g., stocks, bonds or cash) have grown too large based on your diversification plan, you may want to consider redirecting future investments to get back on track.
History has shown that the U.S. stock market has been remarkably resilient1. Volatility can lead to opportunity. Patience and a commitment to your long-term financial plan may position you to potentially benefit over your investment horizon. We appreciate your business and continued support of Columbia Funds.
Sincerely,

J. Kevin Connaughton
President, Columbia Funds
The board of trustees elected J. Kevin Connaughton president of Columbia Funds on January 16, 2009.
1The Dow Jones Industrial Average is the most widely used indicator of the overall condition of the stock market. The Dow Jones Industrial Average Index is a price-weighted average of 30 actively traded blue-chip stocks as selected by the editors of the Wall Street Journal. Indices are not investments, do not incur fees or expenses and are not professionally managed. It is not possible to invest directly in an index.
Fund Profile – Columbia Asset Allocation Fund II
Summary
g For the 12-month period that ended March 31, 2009, the fund's Class A shares returned negative 27.03% without sales charge.
g In a period of contracting economic growth and sharply falling stock prices, the fund's equity benchmark, the Russell 1000 Index,1 returned negative 38.27% while its fixed income benchmark, the Barclays Capital U.S. Aggregate Bond Index,2 returned 3.13%. The average return for funds in its peer group, the Lipper Mixed-Asset Target Allocation Growth Classification,3 was negative 29.69%.
g Reduced exposure to stocks and increased exposure to bonds helped the fund stem some losses.
Portfolio Management
Anwiti Bahuguna, PhD, has co-managed the fund since 2009 and has been with the advisor or its predecessors as an investment professional since 2002.
Colin Moore has co-managed the fund since 2009 and has been with the advisor or its predecessors as an investment professional since 2002.
Kent M. Peterson, PhD has co-managed the fund since 2009 and has been associated with the advisor or its predecessors as an investment professional since 2006.
Marie M. Schofield has co-managed the fund since 2009 and has been associated with the advisor or its predecessors as an investment professional since 1990.
1The Russell 1000 Index measures the performance of 1,000 of the largest U.S. companies, based on market capitalization.
2The Barclays Capital U.S. Aggregate Bond Index is a market value-weighted index that tracks the daily price, coupon, pay-downs and total return performance of fixed-rate, publicly placed, dollar-denominated and non-convertible investment-grade debt issues with at least $250 million par amount outstanding and with at least one year to final maturity.
3Lipper Inc., a widely respected data provider in the industry, calculates an average total return (assuming reinvestment of distributions) for mutual funds with investment objectives similar to those of the fund. Lipper makes no adjustment for the effect of sales loads.
Indices are not available for investment, and do not reflect sales charges, fees, brokerage commissions, taxes or other expenses of investing. Securities in the fund may not match those in an index.
Performance data quoted represents past performance and current performance may be lower or higher. Past performance is no guarantee of future results. The investment return and principal value will fluctuate so that shares, when redeemed, may be worth more or less than the original cost. Please visit www.columbiafunds.com for daily and most recent month-end performance updates.
Summary
1-year return as of 03/31/09
| | | | | –27.03% | |
|
| |  | | | Class A shares
(without sales charge) | |
|
| | | | | –38.27% | |
|
| |  | | | Russell 1000 Index | |
|
| | | | | +3.13% | |
|
| |  | | | Barclays Capital U.S.
Aggregate Bond Index | |
|
Morningstar Style BoxTM

The Morningstar Style BoxTM reveals a fund's investment strategy. For equity funds, the vertical axis shows the market capitalization of the stocks owned and the horizontal axis shows a fund's investment style (value, blend or growth.) Information shown is based on the most recent data provided by Morningstar.
1
Economic Update – Columbia Asset Allocation Fund II
Summary
For the 12-month period that ended March 31, 2009
g The broad U.S. stock market, as measured by the S&P 500 Index, returned negative 38.09%. Developed stock markets outside the United States returned negative 46.51%, as measured (in U.S. dollars) by the MSCI EAFE Index.
| S&P Index | | MSCI Index | |
|
 | |  | |
|
g Despite volatility in many segments of the bond market, the Barclays Capital U.S. Aggregate Bond Index delivered a modest gain. High-yield bonds lost ground, as measured by the Merrill Lynch U.S. High Yield, Cash Pay Index. Municipals recovered from an early setback, as measured by the Barclays Capital Municipal Bond Index.
Barclays
Aggregate Index | | Merrill
Lynch Index | |
|
 | |  | |
|
Barclays
Municipal Index | |
| |
|
 | | | |
|
Economic growth ground to a halt during the 12-month period that began April 1, 2008 and ended March 31, 2009. The National Bureau of Economic Research reported that the U.S. economy had slipped into recession late in 2007 and the downturn was even sharper than anticipated.
A host of factors weighed on consumers and businesses alike. The most severe housing downturn in decades showed few signs of abating as inventories of homes for sale rose, home prices declined and tighter credit standards, the result of continued turmoil in the subprime mortgage market, made it more difficult for homebuyers to qualify for loans. The labor market has contracted for 15 consecutive months, driving the unemployment rate to 8.5%. More than five million jobs have been lost since the recession commenced late in 2007, with nearly two-thirds of the decrease occurring in the most recent five months. Manufacturing activity slowed and consumer spending declined, resulting in one of the weakest holiday seasons in decades.
However, in March there were a few signs that this severe recession is no longer intensifying. Weekly chain store sales and mortgage purchase applications gained some momentum near the end of the period. The trade deficit has narrowed more than expected, raising hopes that first quarter real GDP would contract at a rate well below the fourth quarter's negative 6.3%.
A weakening economy and turmoil in the financial markets took a toll on consumer confidence, which continued to set new all-time lows during the period. However, the monthly Conference Board gauge was nearly unchanged in March, another indication that the worst could be behind us. Consumer confidence is surveyed monthly by The Conference Board.
In an effort to restore confidence in the capital markets, loosen the reins on credit and stimulate economic growth, the Federal Reserve Board (the Fed) brought a key short-term rate—the federal funds rate—down from 2.25% to a target between zero and 0.25% during the 12-month period—a record low. However, the Fed's efforts went largely unrewarded. The one bright spot during this period of uncertainty was lower energy and commodity prices. With oil trading near $50 per barrel at the end of the period, gasoline prices have come down from $4 per gallon or more last summer to just over $2 per gallon in recent months.
Stocks retreat as economic outlook darkens
Against a weakening economic backdrop, the U.S. stock market lost 38.09% for the 12-month period, as measured by the S&P 500 Index.1 Losses affected the stocks of companies of all sizes and investment style categories, although growth stocks held up better than value stocks, as measured by their respective Russell indices.2 Stock markets
1The Standard and Poor's (S&P) 500 Index tracks the performance of 500 widely held, large-capitalization U.S. stocks.
2The Russell 1000 Growth Index measures the performance of those Russell 1000 Index companies with higher price-to-book ratios and higher forecasted growth values. The Russell 1000 Value Index measures the performance of those companies in the Russell 1000 Index with lower price-to-book ratios and lower forecasted growth values. The Russell 2000 Growth Index measures the performance of those Russell 2000 Index companies with higher price-to-book ratios and higher forecasted growth values. The Russell 2000 Value Index measures the performance of those Russell 2000 Index companies with lower price-to-book ratios and lower forecasted growth values. The Russell 3000 Growth Index measures the performance of those Russell 3000 Index companies with higher price-to-book ratios and higher forecasted growth values. The Russell 3000 Value Index measures the performance of those Russell 3000 Index companies with lower price-to-bo ok ratios and lower forecasted growth values. The Russell Midcap Growth Index measures the performance of those Russell Midcap companies with higher price-to-book ratios and higher forecasted growth values. The Russell Midcap Value Index measures the performance of those Russell Midcap Index companies with lower price-to-book ratios and lower forecasted growth values.
Indices are not available for investment, and do not reflect sales charges, fees, brokerage commissions, taxes or other expenses of investing. Securities in the fund may not match those in an index.
2
Economic Update (continued) – Columbia Asset Allocation Fund II
outside the U.S. suffered even greater losses. The MSCI EAFE Index,3 a broad gauge of stock market performance in foreign developed markets, lost 46.51% (in U.S. dollars) for the period. Emerging stock markets, which generally have had a strong run over the past several years, were also caught in the downdraft. As investors backed away from risk, the MSCI Emerging Markets Index4 returned negative 47.07% (in U.S. dollars).
Some bond market segments delivered positive returns
The U.S. bond market seesawed during the 12-month period, but several sectors managed to deliver modest gains as investors sought refuge from the volatile stock market. Treasury prices rose and yields declined as the economy faltered and stock market volatility increased. The benchmark 10-year U.S. Treasury yield ended the period at 2.70%. In this environment, the Barclays Capital U.S. Aggregate Bond Index (formerly the Lehman Brothers U.S. Aggregate Bond Index)5 returned 3.13%. High-yield bond prices fell sharply as economic prospects weakened and default fears rose. The Merrill Lynch U.S. High Yield, Cash Pay Index6 returned negative 19.95%. The municipal market suffered a setback early in 2008, then rebounded in the first quarter of 2009. The Barclays Capital Municipal Bond Index (formerly the Lehman Brothers Municipal Bond Index)7 returned 2.27% for the 12-month period.
Past performance is no guarantee of future results.
3The Morgan Stanley Capital International (MSCI) Europe, Australasia, Far East (EAFE) Index is a free float-adjusted market capitalization index that is designed to measure developed market equity performance excluding the U.S. and Canada.
4The MSCI Emerging Markets Index is a widely accepted index composed of a sample of companies from 25 countries representing the global emerging stock markets.
5The Barclays Capital U.S. Aggregate Bond Index is a market value-weighted index that tracks the daily price, coupon, pay-downs and total return performance of fixed-rate, publicly placed, dollar-denominated and non-convertible investment-grade debt issues with at least $250 million par amount outstanding and with at least one year to final maturity.
6The Merrill Lynch U.S. High Yield, Cash Pay Index tracks the performance of non-investment-grade corporate bonds. As of 01/01/2009, Merrill Lynch & Co., Inc. is a wholly-owned subsidiary of Bank of America Corporation and an affiliate of Columbia Management.
7The Barlcays Capital Municipal Bond Index is considered representative of the broad market for investment-grade, tax-exempt bonds with maturities of at least one year.
Indices are not available for investment, and do not reflect sales charges, fees, brokerage commissions, taxes or other expenses of investing. Securities in the fund may not match those in an index.
3
Performance Information – Columbia Asset Allocation Fund II
Performance data quoted represents past performance and current performance may be lower or higher. Past performance is no guarantee of future results. The investment return and principal value will fluctuate so that shares, when redeemed, may be worth more or less than the original cost. Please visit www.columbiafunds.com for daily and most recent month-end performance updates.
Annual operating expense ratio (%)*
| Class A | | | 1.30 | | |
| Class B | | | 2.05 | | |
| Class C | | | 2.05 | | |
| Class Z | | | 1.05 | | |
* The annual operating expense ratio is as stated in the fund's prospectus that is current as of the date of this report. Differences in expense ratios disclosed elsewhere in this report may result from including fee waivers and expense reimbursements as well as different time periods used in calculating the ratios.
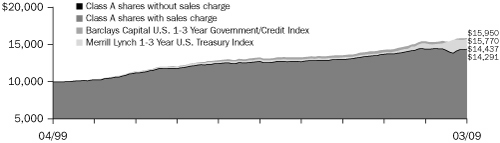
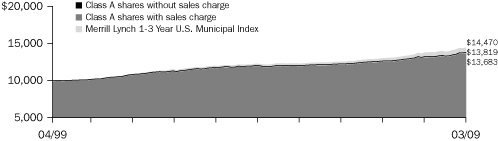
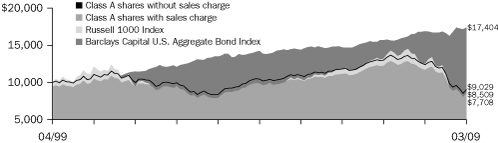
Performance of a $10,000 investment 04/01/99 – 03/31/09 ($)
 | |
|
The chart above shows the change in value of a hypothetical $10,000 investment in Class A shares of Columbia Asset Allocation Fund II during the stated time period, and does not reflect the deduction of taxes that a shareholder may pay on fund distributions or on the redemption of fund shares. The Russell 1000 Index measures the performance of 1,000 of the largest U.S. companies, based on market capitalization. The Barclays Capital U.S. Aggregate Bond Index is a market value-weighted index that tracks the daily price, coupon, pay-downs, and total return performance of fixed-rate, publicly placed, dollar-denominated and non-convertible investment-grade debt issues with at least $250 million par amount outstanding and with at least one year to final maturity. Indices are not available for investment, and do not reflect sales charges, fees, brokerage commissions, taxes or other expenses of investing. Securities in the fund may not match those in an index.
Performance of a $10,000 investment 04/01/99 – 03/31/09 ($)
| Sales charge | | without | | with | |
| Class A | | | 9,029 | | | | 8,509 | | |
| Class B | | | 8,362 | | | | 8,362 | | |
| Class C | | | 8,357 | | | | 8,357 | | |
| Class Z | | | 9,344 | | | | n/a | | |
Average annual total return as of 03/31/09 (%)
| Share class | | A | | B | | C | | Z | |
| Inception | | 01/18/94 | | 07/15/98 | | 11/11/96 | | 05/21/99 | |
| Sales charge | | without | | with | | without | | with | | without | | with | | without | |
| 1-year | | | –27.03 | | | | –31.23 | | | | –27.55 | | | | –31.11 | | | | –27.58 | | | | –28.29 | | | | –26.86 | | |
| 5-year | | | –2.82 | | | | –3.96 | | | | –3.54 | | | | –3.91 | | | | –3.54 | | | | –3.54 | | | | –2.60 | | |
| 10-year | | | –1.02 | | | | –1.60 | | | | –1.77 | | | | –1.77 | | | | –1.78 | | | | –1.78 | | | | –0.68 | | |
The "with sales charge" returns include the maximum initial sales charge of 5.75% for Class A shares and the applicable contingent deferred sales charge of 5.00% in the first year, declining to 1.00% in the sixth year and eliminated thereafter for Class B shares and 1.00% for Class C shares for the first year only. The "without sales charge" returns do not include the effect of sales charges. If they had, returns would be lower.
Performance results reflect any fee waivers or reimbursements of fund expenses by the investment advisor and/or any of its affiliates. Absent these fee waivers or expense reimbursement arrangements, performance results would have been lower.
All results shown assume reinvestment of distributions. Class Z shares are sold at net asset value with no distribution and service (Rule 12b-1) fees. Class Z shares have limited eligibility and the investment minimum requirements may vary. Please see the fund's prospectus for details. Performance for different share classes will vary based on differences in sales charges and fees associated with each class.
The tables do not reflect the deduction of taxes that a shareholder may pay on fund distributions or on the redemption of fund shares.
Class Z shares commenced operations on May 21, 1999 and have no performance prior to that date. Performance prior to May 21, 1999 is that of Class A shares at net asset value, which reflect distribution and service (Rule 12b-1) fees of 0.25%. These distribution and service (Rule 12b-1) fees are not applicable to Class Z shares. The inception date for Class A shares is January 18, 1994.
4
Understanding Your Expenses – Columbia Asset Allocation Fund II
As a fund shareholder, you incur two types of costs. There are transaction costs, which generally include sales charges on purchases and may include redemption fees or exchange fees. There are also ongoing costs, which generally include investment advisory fees, distribution and service (Rule 12b-1) fees and other fund expenses. The information on this page is intended to help you understand the ongoing costs of investing in the fund and to compare these costs with the ongoing costs of investing in other mutual funds.
Analyzing your fund's expenses by share class
To illustrate these ongoing costs, we have provided an example and calculated the expenses paid by investors in each share class during the period. The information in the following table is based on an initial investment of $1,000, which is invested at the beginning of the period and held for the entire period. Expense information is calculated two ways and each method provides you with different information. The amount listed in the "Actual" column is calculated using the fund's actual operating expenses and total return for the period. The amount listed in the "Hypothetical" column for each share class assumes that the return each year is 5% before expenses and is calculated based on the fund's actual operating expenses. You should not use the hypothetical account values and expenses to estimate either your actual account balance at the end of the period or the expenses you paid during this period.
Compare with other funds
Since all mutual funds are required to include the same hypothetical calculations about expenses in shareholder reports, you can use this information to compare the ongoing cost of investing in the fund with other funds. To do so, compare the 5% hypothetical example with the 5% hypothetical examples that appear in the shareholder reports of other funds. As you compare hypothetical examples of other funds, it is important to note that hypothetical examples are meant to highlight the ongoing costs of investing in a fund and do not reflect any transaction costs, such as sales charges, redemption fees or exchange fees.
Estimating your actual expenses
To estimate the expenses that you paid over the period, first you will need your account balance at the end of the period:
g For shareholders who receive their account statements from Columbia Management Services, Inc., your account balance is available online at www.columbiafunds.com or by calling Shareholder Services at 800.345.6611.
g For shareholders who receive their account statements from their financial intermediary, contact your financial intermediary to obtain your account balance.
1. Divide your ending account balance by $1,000. For example, if an account balance was $8,600 at the end of the period, the result would be 8.6.
2. In the section of the table below titled "Expenses paid during the period," locate the amount for your share class. You will find this number in the column labeled "Actual." Multiply this number by the result from step 1. Your answer is an estimate of the expenses you paid on your account during the period.
If the value of your account falls below the minimum initial investment requirement applicable to you, your account generally will be subject to a $20 annual fee. This fee is not included in the accompanying table. If you are subject to the fee, keep it in mind when you are estimating the ongoing expenses of investing in the fund and when comparing the expenses of this fund with other funds.
10/01/08 – 03/31/09
| | | Account value at the
beginning of the period ($) | | Account value at the
end of the period ($) | | Expenses paid
during the period ($) | | Fund's annualized
expense ratio (%) | |
| | | Actual | | Hypothetical | | Actual | | Hypothetical | | Actual | | Hypothetical | | Actual | |
| Class A | | | 1,000.00 | | | | 1,000.00 | | | | 809.02 | | | | 1,018.45 | | | | 5.86 | | | | 6.54 | | | | 1.30 | | |
| Class B | | | 1,000.00 | | | | 1,000.00 | | | | 805.88 | | | | 1,014.71 | | | | 9.23 | | | | 10.30 | | | | 2.05 | | |
| Class C | | | 1,000.00 | | | | 1,000.00 | | | | 805.68 | | | | 1,014.71 | | | | 9.23 | | | | 10.30 | | | | 2.05 | | |
| Class Z | | | 1,000.00 | | | | 1,000.00 | | | | 809.62 | | | | 1,019.70 | | | | 4.74 | | | | 5.29 | | | | 1.05 | | |
Expenses paid during the period are equal to the annualized expense ratio for the share class, multiplied by the average account value over the period, then multiplied by the number of days in the fund's most recent fiscal half-year and divided by 365.
Had the investment advisor and/or any of its affiliates not waived fees or reimbursed a portion of expense, account value at the end of the period would have been reduced.
It is important to note that the expense amounts shown in the table are meant to highlight only ongoing costs of investing in the fund and do not reflect any transaction costs, such as sales charges, redemption fees or exchange fees. Therefore, the hypothetical examples provided may not help you determine the relative total costs of owning shares of different funds. If these transaction costs were included, your costs would have been higher.
5
Portfolio Managers' Report – Columbia Asset Allocation Fund II
Performance data quoted represents past performance and current performance may be lower or higher. Past performance is no guarantee of future results. The investment return and principal value will fluctuate so that shares, when redeemed, may be worth more or less than the original cost. Please visit www.columbiafunds.com for daily and most recent month-end performance updates.
Net asset value per share
as of 03/31/09 ($)
| Class A | | | 15.94 | | |
| Class B | | | 15.81 | | |
| Class C | | | 15.79 | | |
| Class Z | | | 15.90 | | |
Distributions declared per share
04/01/08 – 03/31/09 ($)
| Class A | | | 0.46 | | |
| Class B | | | 0.31 | | |
| Class C | | | 0.31 | | |
| Class Z | | | 0.51 | | |
For the 12-month period ended March 31, 2009, the fund's Class A shares returned negative 27.03% without sales charge. The Russell 1000 Index1 returned negative 38.27% and the Barclays Capital U.S. Aggregate Bond Index1 returned 3.13%. The average return of the fund's peer group, the Lipper Mixed Asset Target Allocation Growth Classification,2 was negative 29.69%. The fund continued to stem losses by reducing exposure to stocks, from 63.3% to 59.8%, and raising its fixed income allocation commensurately.
On February 20, 2009, Anwiti Bahuguna, Colin Moore, Kent M. Peterson and Marie M. Schofield were named co-portfolio managers of the fund.
A challenging period for equities
A steady flow of negative news, a gloomy economic outlook, revelation of financial Ponzi schemes and uncertainty around the US government's proposed bailout of the financial system proved overwhelming for the equity markets. All equity sectors declined for the period. Health care and consumer staples held up better than other sectors, losing 21% and 27% respectively. In this environment, the equity portion of the fund benefited on several fronts. The fund had no exposure to Bank of America—the parent company of Columbia Management Advisor, LLC, the fund's investment advisor, and it had only a small position in Citigroup, which are included in the Russell 1000 Index. Both stocks lost significant ground during the period and these underweights aided performance. Within consumer staples, agricultural and alternative energy producer Bunge held up somewhat better than the market as a whole. In addition, the fund had more exposur e than the index to Verizon Communications which had only half of the loss for the overall sector. It was also overweight in Qwest Communications International, which gained significantly for the period and helped offset some losses.
Investments in materials, technology and industrials detracted from the fund's equity performance. In the materials sector, the fund had more exposure than the index to Freeport-McMoRan Copper & Gold which lost ground as metals prices declined. In the industrials sector, an emphasis on R.R. Donnelley & Sons was costly as excess print capacity and price erosion hurt its share price. In technology, Seagate Technology and MEMC Electronic Materials logged significant losses as demand for PC and solar panels suffered in a weak economic climate. Freeport-McMoRan, Seagate and MEMC were sold before the end of the reporting period.
Quality drove fixed income market performance
Within the fixed income portion of the portfolio, the fund benefited from a decision to lengthen the fund's duration against the benchmark. Duration is a measure of interest rate sensitivity. We seek to lengthen duration when we expect interest rates to fall. If
1The Russell 1000 Index tracks the performance of 1000 of the largest U.S. companies, based on market capitalization. The Barclays Capital U.S. Aggregate Bond Index is a market value-weighted index that tracks the daily price, coupon, pay-downs and total return performance of fixed-rate, publicly placed, dollar-denominated and non-convertible investment grade debt issues with at least $250 million par amount outstanding and with at least one year to final maturity. Indices are not available for investment, and do not reflect sales charges, fees, brokerage commissions, taxes or other expenses of investing. Securities in the fund may not match those in an index.
2Lipper Inc., a widely respected data provider in the industry, calculates an average total return (assuming reinvestment of distributions) for mutual funds with investment objectives similar to those of the fund. Lipper makes no adjustment for the effect of sales loads.
6
Portfolio Managers' Report (continued) – Columbia Asset Allocation Fund II
we are right, as we were during this period, it can have a positive impact on performance, which it did. Exposure to telecommunications, consumer non-cyclical and health care sectors also enhanced performance as these sectors outperformed the balance of the corporate bond market. We also did well to reduce exposure to corporate bonds at the beginning of the period, as corporates underperformed Treasuries. We also reduced exposure to the financials sector, which aided performance because financials were the worst performing sector within the corporate market. In general, exposure to higher quality securities benefited performance because lower quality securities underperformed. Agency pass-throughs and collateralized mortgage obligations also enhanced performance.
An underweight relative to the benchmark in Treasury securities was the biggest detractor from fixed income performance. Concerned investors gravitated to quality and all other major sectors underperformed. As a result, the fund's position in AAA-rated3 commercial mortgage backed securities, a small position in asset backed securities and corporate securities all detracted from performance. Within the corporate market, exposure to energy, brokerage, insurance and REITs had a negative impact on performance as these sectors underperformed.
Looking ahead
Despite the disappointing performance of the past year, we remain focused on the future potential of the portfolio. The equity portion of the portfolio remains sector neutral and fully invested, as we continue to select stocks on the basis of value and quality. Within the fixed income portion of the fund, we continue to maintain a highly diversified portfiolio. The fund is currently neutral in its duration positioning relative to its fixed income benchmark. We continue to favor high quality corporate bonds, with an emphasis on banking, electric utilities and energy. We continue to hold a relatively small position in Treasury Inflation Protected Securities (TIPS) and maintain exposure to the securitized sectors of the fixed income markets that we believe have been overly discounted relative to the quality of the underlying collateral.
Portfolio holdings and characteristics are subject to change periodically and may not be representative of current holdings and characteristics. The outlook for the fund may differ from those presented for other Columbia Funds.
Equity investments are affected by stock market fluctuations that occur in response to economic and business developments.
Stocks of mid-cap companies pose special risks, including possible illiquidity and greater price volatility than stocks of larger, more established companies.
Investing in fixed-income securities may involve certain risks, including the credit quality of individual issuers, possible prepayments, market or economic developments and yields and share price fluctuations due to changes in interest rates. When interest rates go up, bond prices typically drop, and vice versa.
3The credit quality ratings represent those of Moody's Investors Service, Inc. ("Moody's") or Standard & Poor's Corporation ("S&P") credit ratings. The ratings represent their opinions as to the quality of the securities they rate. Ratings are relative and subjective and are not absolute standards of quality. The security's credit quality does not eliminate risk.
Top 10 equity holdings
as of 03/31/09 (%)
| Exxon Mobil | | | 2.5 | | |
| Microsoft | | | 1.4 | | |
| Procter & Gamble | | | 1.3 | | |
| Chevron | | | 1.3 | | |
| Pfizer | | | 1.1 | | |
| Johnson & Johnson | | | 1.1 | | |
International Business
Machines | | | 1.0 | | |
| Wal-Mart Stores | | | 1.0 | | |
| AT&T | | | 0.9 | | |
| McDonald's | | | 0.9 | | |
Top 5 equity sectors
as of 03/31/09 (%)
| Information Technology | | | 10.9 | | |
| Health Care | | | 8.9 | | |
| Energy | | | 7.4 | | |
| Consumer Staples | | | 7.0 | | |
| Financials | | | 6.8 | | |
Portfolio structure
as of 03/31/09 (%)
| Common Stocks | | | 59.8 | | |
| Mortgage-Backed Securities | | | 16.0 | | |
Corporate Fixed-Income
Bonds & Notes | | | 7.9 | | |
Collateralized Mortgage
Obligations | | | 5.2 | | |
Government & Agency
Obligations | | | 4.5 | | |
Commercial Mortgage-Backed
Securities | | | 4.0 | | |
| Asset-Backed Securities | | | 1.4 | | |
| Short-Term Obligation | | | 4.5 | | |
| Other Assets & Liabilities, Net | | | (3.3 | ) | |
Holdings discussed in this report
as of 3/31/09 (%)
| Citigroup | | | 0.1 | | |
| Bunge | | | 0.4 | | |
| Verizon Communications | | | 0.7 | | |
Qwest Communications
International | | | 0.3 | | |
| R.R. Donnelley & Sons | | | 0.2 | | |
The fund is actively managed and the composition of its portfolio will change over time. Information provided is calculated as a percentage of net assets.
7
Investment Portfolio – Columbia Asset Allocation Fund II
March 31, 2009
| Common Stocks – 59.8% | |
| | | Shares | | Value ($) | |
| Consumer Discretionary – 5.6% | |
| Diversified Consumer Services – 0.5% | |
| Apollo Group, Inc., Class A (a) | | | 2,900 | | | | 227,157 | | |
| H&R Block, Inc. | | | 8,400 | | | | 152,796 | | |
| Hillenbrand, Inc. | | | 1,100 | | | | 17,611 | | |
| Diversified Consumer Services Total | | | 397,564 | | |
| Hotels, Restaurants & Leisure – 1.4% | |
| Brinker International, Inc. | | | 8,700 | | | | 131,370 | | |
| Darden Restaurants, Inc. | | | 7,400 | | | | 253,524 | | |
| McDonald's Corp. | | | 13,200 | | | | 720,324 | | |
| Yum! Brands, Inc. | | | 600 | | | | 16,488 | | |
| Hotels, Restaurants & Leisure Total | | | 1,121,706 | | |
| Household Durables – 0.0% | |
| Whirlpool Corp. | | | 500 | | | | 14,795 | | |
| Household Durables Total | | | 14,795 | | |
| Leisure Equipment & Products – 0.2% | |
| Hasbro, Inc. | | | 5,900 | | | | 147,913 | | |
| Leisure Equipment & Products Total | | | 147,913 | | |
| Media – 1.5% | |
| Comcast Corp., Class A | | | 9,100 | | | | 124,124 | | |
| DIRECTV Group, Inc. (a) | | | 19,100 | | | | 435,289 | | |
| DISH Network Corp., Class A (a) | | | 13,800 | | | | 153,318 | | |
| McGraw-Hill Companies, Inc. | | | 4,400 | | | | 100,628 | | |
| News Corp., Class A | | | 200 | | | | 1,324 | | |
| Time Warner Cable, Inc. | | | 1,615 | | | | 40,048 | | |
| Time Warner, Inc. | | | 6,433 | | | | 124,163 | | |
| Viacom, Inc., Class B (a) | | | 500 | | | | 8,690 | | |
| Walt Disney Co. | | | 11,000 | | | | 199,760 | | |
| Media Total | | | 1,187,344 | | |
| Multiline Retail – 0.3% | |
| Big Lots, Inc. (a) | | | 5,900 | | | | 122,602 | | |
| Dollar Tree, Inc. (a) | | | 100 | | | | 4,455 | | |
| Macy's, Inc. | | | 2,500 | | | | 22,250 | | |
| Target Corp. | | | 2,100 | | | | 72,219 | | |
| Multiline Retail Total | | | 221,526 | | |
| Specialty Retail – 1.6% | |
| Best Buy Co., Inc. | | | 3,000 | | | | 113,880 | | |
| GameStop Corp., Class A (a) | | | 800 | | | | 22,416 | | |
| Gap, Inc. | | | 16,500 | | | | 214,335 | | |
| Home Depot, Inc. | | | 13,700 | | | | 322,772 | | |
| Lowe's Companies, Inc. | | | 10,600 | | | | 193,450 | | |
| Ross Stores, Inc. | | | 400 | | | | 14,352 | | |
| Sherwin-Williams Co. | | | 3,600 | | | | 187,092 | | |
| TJX Companies, Inc. | | | 6,900 | | | | 176,916 | | |
| Specialty Retail Total | | | 1,245,213 | | |
| | | Shares | | Value ($) | |
| Textiles, Apparel & Luxury Goods – 0.1% | |
| Coach, Inc. (a) | | | 1,900 | | | | 31,730 | | |
| NIKE, Inc., Class B | | | 1,800 | | | | 84,402 | | |
| Textiles, Apparel & Luxury Goods Total | | | 116,132 | | |
| Consumer Discretionary Total | | | 4,452,193 | | |
| Consumer Staples – 7.0% | |
| Beverages – 1.2% | |
| Coca-Cola Co. | | | 11,400 | | | | 501,030 | | |
| Hansen Natural Corp. (a) | | | 300 | | | | 10,800 | | |
| Pepsi Bottling Group, Inc. | | | 4,400 | | | | 97,416 | | |
| PepsiCo, Inc. | | | 6,400 | | | | 329,472 | | |
| Beverages Total | | | 938,718 | | |
| Food & Staples Retailing – 1.6% | |
| CVS Caremark Corp. | | | 1,000 | | | | 27,490 | | |
| Kroger Co. | | | 11,200 | | | | 237,664 | | |
| Safeway, Inc. | | | 1,000 | | | | 20,190 | | |
| Sysco Corp. | | | 3,600 | | | | 82,080 | | |
| Wal-Mart Stores, Inc. | | | 15,100 | | | | 786,710 | | |
| Walgreen Co. | | | 2,800 | | | | 72,688 | | |
| Food & Staples Retailing Total | | | 1,226,822 | | |
| Food Products – 1.0% | |
| Archer-Daniels-Midland Co. | | | 5,600 | | | | 155,568 | | |
| Bunge Ltd. | | | 5,400 | | | | 305,910 | | |
| Dean Foods Co. (a) | | | 2,900 | | | | 52,432 | | |
| General Mills, Inc. | | | 1,100 | | | | 54,868 | | |
| H.J. Heinz Co. | | | 1,600 | | | | 52,896 | | |
| Kellogg Co. | | | 2,500 | | | | 91,575 | | |
| Kraft Foods, Inc., Class A | | | 2,900 | | | | 64,641 | | |
| Food Products Total | | | 777,890 | | |
| Household Products – 1.6% | |
| Colgate-Palmolive Co. | | | 1,600 | | | | 94,368 | | |
| Kimberly-Clark Corp. | | | 4,600 | | | | 212,106 | | |
| Procter & Gamble Co. | | | 21,200 | | | | 998,308 | | |
| Household Products Total | | | 1,304,782 | | |
| Personal Products – 0.1% | |
| Avon Products, Inc. | | | 1,100 | | | | 21,153 | | |
Estee Lauder Companies, Inc.,
Class A | | | 100 | | | | 2,465 | | |
| Herbalife Ltd. | | | 6,200 | | | | 92,876 | | |
| Personal Products Total | | | 116,494 | | |
| Tobacco – 1.5% | |
| Altria Group, Inc. | | | 31,000 | | | | 496,620 | | |
| Philip Morris International, Inc. | | | 12,900 | | | | 458,982 | | |
| Reynolds American, Inc. | | | 6,400 | | | | 229,376 | | |
| Tobacco Total | | | 1,184,978 | | |
| Consumer Staples Total | | | 5,549,684 | | |
See Accompanying Notes to Financial Statements.
8
Columbia Asset Allocation Fund II
March 31, 2009
| Common Stocks (continued) | |
| | | Shares | | Value ($) | |
| Energy – 7.4% | |
| Energy Equipment & Services – 0.2% | |
| BJ Services Co. | | | 500 | | | | 4,975 | | |
| ENSCO International, Inc. | | | 3,600 | | | | 95,040 | | |
| Exterran Holdings, Inc. (a) | | | 400 | | | | 6,408 | | |
| Key Energy Services, Inc. (a) | | | 7,600 | | | | 21,888 | | |
| Energy Equipment & Services Total | | | 128,311 | | |
| Oil, Gas & Consumable Fuels – 7.2% | |
| Anadarko Petroleum Corp. | | | 400 | | | | 15,556 | | |
| Apache Corp. | | | 7,500 | | | | 480,675 | | |
| Chevron Corp. | | | 14,700 | | | | 988,428 | | |
| ConocoPhillips | | | 9,300 | | | | 364,188 | | |
| Devon Energy Corp. | | | 1,700 | | | | 75,973 | | |
| El Paso Corp. | | | 1,700 | | | | 10,625 | | |
| Encore Acquisition Co. (a) | | | 2,100 | | | | 48,867 | | |
| EOG Resources, Inc. | | | 7,100 | | | | 388,796 | | |
| Exxon Mobil Corp. | | | 29,300 | | | | 1,995,330 | | |
| Hess Corp. | | | 1,400 | | | | 75,880 | | |
| Marathon Oil Corp. | | | 4,300 | | | | 113,047 | | |
| Massey Energy Co. | | | 1,000 | | | | 10,120 | | |
| Murphy Oil Corp. | | | 1,200 | | | | 53,724 | | |
| Newfield Exploration Co. (a) | | | 1,000 | | | | 22,700 | | |
| Occidental Petroleum Corp. | | | 8,200 | | | | 456,330 | | |
| Southwestern Energy Co. (a) | | | 400 | | | | 11,876 | | |
| Sunoco, Inc. | | | 13,200 | | | | 349,536 | | |
| Tesoro Corp. | | | 12,500 | | | | 168,375 | | |
| Valero Energy Corp. | | | 3,200 | | | | 57,280 | | |
| Walter Industries, Inc. | | | 600 | | | | 13,722 | | |
| XTO Energy, Inc. | | | 600 | | | | 18,372 | | |
| Oil, Gas & Consumable Fuels Total | | | 5,719,400 | | |
| Energy Total | | | 5,847,711 | | |
| Financials – 6.8% | |
| Capital Markets – 1.7% | |
| Bank of New York Mellon Corp. | | | 5,800 | | | | 163,850 | | |
| BlackRock, Inc., Class A | | | 600 | | | | 78,024 | | |
| Charles Schwab Corp. | | | 12,200 | | | | 189,100 | | |
| Franklin Resources, Inc. | | | 900 | | | | 48,483 | | |
| Goldman Sachs Group, Inc. | | | 3,800 | | | | 402,876 | | |
| Morgan Stanley | | | 11,000 | | | | 250,470 | | |
| Northern Trust Corp. | | | 2,200 | | | | 131,604 | | |
| Raymond James Financial, Inc. | | | 100 | | | | 1,970 | | |
| State Street Corp. | | | 500 | | | | 15,390 | | |
| T. Rowe Price Group, Inc. | | | 2,200 | | | | 63,492 | | |
| TD Ameritrade Holding Corp. (a) | | | 1,000 | | | | 13,810 | | |
| Capital Markets Total | | | 1,359,069 | | |
| | | Shares | | Value ($) | |
| Commercial Banks – 1.0% | |
| BB&T Corp. | | | 11,400 | | | | 192,888 | | |
| PNC Financial Services Group, Inc. | | | 4,700 | | | | 137,663 | | |
| SunTrust Banks, Inc. | | | 4,800 | | | | 56,352 | | |
| Wells Fargo & Co. | | | 28,300 | | | | 402,992 | | |
| Commercial Banks Total | | | 789,895 | | |
| Consumer Finance – 0.2% | |
| American Express Co. | | | 7,600 | | | | 103,588 | | |
| Capital One Financial Corp. | | | 1,700 | | | | 20,808 | | |
| SLM Corp. (a) | | | 5,400 | | | | 26,730 | | |
| Consumer Finance Total | | | 151,126 | | |
| Diversified Financial Services – 0.9% | |
| Citigroup, Inc. | | | 20,900 | | | | 52,877 | | |
| JPMorgan Chase & Co. | | | 21,900 | | | | 582,102 | | |
| Moody's Corp. | | | 1,200 | | | | 27,504 | | |
| Diversified Financial Services Total | | | 662,483 | | |
| Insurance – 2.0% | |
| AFLAC, Inc. | | | 22,300 | | | | 431,728 | | |
| Allstate Corp. | | | 3,300 | | | | 63,195 | | |
| American Financial Group, Inc. | | | 500 | | | | 8,025 | | |
| Assurant, Inc. | | | 700 | | | | 15,246 | | |
| Axis Capital Holdings Ltd. | | | 4,100 | | | | 92,414 | | |
| Genworth Financial, Inc., Class A | | | 52,200 | | | | 99,180 | | |
Hartford Financial Services
Group, Inc. | | | 16,500 | | | | 129,525 | | |
| Loews Corp. | | | 3,500 | | | | 77,350 | | |
Marsh & McLennan
Companies, Inc. | | | 1,900 | | | | 38,475 | | |
| MetLife, Inc. | | | 5,100 | | | | 116,127 | | |
| Progressive Corp. (a) | | | 4,100 | | | | 55,104 | | |
| Prudential Financial, Inc. | | | 7,700 | | | | 146,454 | | |
| Travelers Companies, Inc. | | | 6,400 | | | | 260,096 | | |
| Unum Group | | | 5,000 | | | | 62,500 | | |
| Insurance Total | | | 1,595,419 | | |
| Real Estate Investment Trusts (REITs) – 0.9% | |
| Annaly Capital Management, Inc. | | | 12,400 | | | | 171,988 | | |
| Boston Properties, Inc. | | | 500 | | | | 17,515 | | |
| Digital Realty Trust, Inc. | | | 800 | | | | 26,544 | | |
| Federal Realty Investment Trust | | | 100 | | | | 4,600 | | |
| HRPT Properties Trust | | | 7,600 | | | | 24,244 | | |
| Kimco Realty Corp. | | | 2,900 | | | | 22,098 | | |
| Public Storage | | | 2,600 | | | | 143,650 | | |
| Rayonier, Inc. | | | 3,100 | | | | 93,682 | | |
| Simon Property Group, Inc. | | | 4,813 | | | | 166,722 | | |
| Ventas, Inc. | | | 1,900 | | | | 42,959 | | |
| Real Estate Investment Trusts (REITs) Total | | | 714,002 | | |
See Accompanying Notes to Financial Statements.
9
Columbia Asset Allocation Fund II
March 31, 2009
| Common Stocks (continued) | |
| | | Shares | | Value ($) | |
| Thrifts & Mortgage Finance – 0.1% | |
| Hudson City Bancorp, Inc. | | | 5,900 | | | | 68,971 | | |
| Thrifts & Mortgage Finance Total | | | 68,971 | | |
| Financials Total | | | 5,340,965 | | |
| Health Care – 8.9% | |
| Biotechnology – 2.3% | |
| Amgen, Inc. (a) | | | 13,300 | | | | 658,616 | | |
| Biogen Idec, Inc. (a) | | | 8,600 | | | | 450,812 | | |
| Cephalon, Inc. (a) | | | 5,200 | | | | 354,120 | | |
| Gilead Sciences, Inc. (a) | | | 7,400 | | | | 342,768 | | |
| Biotechnology Total | | | 1,806,316 | | |
| Health Care Equipment & Supplies – 1.2% | |
| Baxter International, Inc. | | | 2,300 | | | | 117,806 | | |
| Becton Dickinson & Co. | | | 2,000 | | | | 134,480 | | |
| Hill-Rom Holdings, Inc. | | | 19,800 | | | | 195,822 | | |
| Medtronic, Inc. | | | 5,900 | | | | 173,873 | | |
| St. Jude Medical, Inc. (a) | | | 4,900 | | | | 178,017 | | |
| Varian Medical Systems, Inc. (a) | | | 600 | | | | 18,264 | | |
| Zimmer Holdings, Inc. (a) | | | 2,900 | | | | 105,850 | | |
| Health Care Equipment & Supplies Total | | | 924,112 | | |
| Health Care Providers & Services – 0.9% | |
| McKesson Corp. | | | 11,200 | | | | 392,448 | | |
| UnitedHealth Group, Inc. | | | 15,500 | | | | 324,415 | | |
| WellPoint, Inc. (a) | | | 1,200 | | | | 45,564 | | |
| Health Care Providers & Services Total | | | 762,427 | | |
| Pharmaceuticals – 4.5% | |
| Abbott Laboratories | | | 4,700 | | | | 224,190 | | |
| Bristol-Myers Squibb Co. | | | 8,400 | | | | 184,128 | | |
| Eli Lilly & Co. | | | 6,000 | | | | 200,460 | | |
Endo Pharmaceuticals
Holdings, Inc. (a) | | | 1,500 | | | | 26,520 | | |
| Forest Laboratories, Inc. (a) | | | 10,900 | | | | 239,364 | | |
| Johnson & Johnson | | | 16,800 | | | | 883,680 | | |
| King Pharmaceuticals, Inc. (a) | | | 6,100 | | | | 43,127 | | |
| Merck & Co., Inc. | | | 9,900 | | | | 264,825 | | |
| Mylan, Inc. (a) | | | 27,200 | | | | 364,752 | | |
| Pfizer, Inc. | | | 65,000 | | | | 885,300 | | |
| Schering-Plough Corp. | | | 9,800 | | | | 230,790 | | |
| Wyeth | | | 100 | | | | 4,304 | | |
| Pharmaceuticals Total | | | 3,551,440 | | |
| Health Care Total | | | 7,044,295 | | |
| | | Shares | | Value ($) | |
| Industrials – 6.0% | |
| Aerospace & Defense – 1.4% | |
| Boeing Co. | | | 7,800 | | | | 277,524 | | |
| General Dynamics Corp. | | | 400 | | | | 16,636 | | |
| Honeywell International, Inc. | | | 5,400 | | | | 150,444 | | |
| Lockheed Martin Corp. | | | 2,400 | | | | 165,672 | | |
| Northrop Grumman Corp. | | | 3,400 | | | | 148,376 | | |
| Precision Castparts Corp. | | | 100 | | | | 5,990 | | |
| Raytheon Co. | | | 3,400 | | | | 132,396 | | |
| United Technologies Corp. | | | 4,100 | | | | 176,218 | | |
| Aerospace & Defense Total | | | 1,073,256 | | |
| Air Freight & Logistics – 0.6% | |
| C.H. Robinson Worldwide, Inc. | | | 500 | | | | 22,805 | | |
| FedEx Corp. | | | 1,900 | | | | 84,531 | | |
| United Parcel Service, Inc., Class B | | | 7,100 | | | | 349,462 | | |
| Air Freight & Logistics Total | | | 456,798 | | |
| Commercial Services & Supplies – 0.5% | |
| Brink's Co. | | | 2,600 | | | | 68,796 | | |
| R.R. Donnelley & Sons Co. | | | 23,900 | | | | 175,187 | | |
| Steelcase, Inc., Class A | | | 2,500 | | | | 12,525 | | |
| Waste Management, Inc. | | | 6,100 | | | | 156,160 | | |
| Commercial Services & Supplies Total | | | 412,668 | | |
| Construction & Engineering – 0.4% | |
| Fluor Corp. | | | 6,100 | | | | 210,755 | | |
| Jacobs Engineering Group, Inc. (a) | | | 900 | | | | 34,794 | | |
| KBR, Inc. | | | 1,600 | | | | 22,096 | | |
| URS Corp. (a) | | | 1,300 | | | | 52,533 | | |
| Construction & Engineering Total | | | 320,178 | | |
| Electrical Equipment – 1.1% | |
| Emerson Electric Co. | | | 9,200 | | | | 262,936 | | |
| Rockwell Automation, Inc. | | | 8,700 | | | | 190,008 | | |
| Roper Industries, Inc. | | | 700 | | | | 29,715 | | |
| Thomas & Betts Corp. (a) | | | 14,600 | | | | 365,292 | | |
| Electrical Equipment Total | | | 847,951 | | |
| Industrial Conglomerates – 0.6% | |
| 3M Co. | | | 4,200 | | | | 208,824 | | |
| General Electric Co. | | | 29,400 | | | | 297,234 | | |
| Industrial Conglomerates Total | | | 506,058 | | |
| Machinery – 0.2% | |
| Caterpillar, Inc. | | | 1,900 | | | | 53,124 | | |
| Cummins, Inc. | | | 2,000 | | | | 50,900 | | |
| Dover Corp. | | | 1,000 | | | | 26,380 | | |
| Oshkosh Corp. | | | 2,900 | | | | 19,546 | | |
| Terex Corp. (a) | | | 100 | | | | 925 | | |
| Machinery Total | | | 150,875 | | |
See Accompanying Notes to Financial Statements.
10
Columbia Asset Allocation Fund II
March 31, 2009
| Common Stocks (continued) | |
| | | Shares | | Value ($) | |
| Professional Services – 0.4% | |
| Dun & Bradstreet Corp. | | | 800 | | | | 61,600 | | |
| Manpower, Inc. | | | 6,200 | | | | 195,486 | | |
| Robert Half International, Inc. | | | 900 | | | | 16,047 | | |
| Professional Services Total | | | 273,133 | | |
| Road & Rail – 0.8% | |
| Burlington Northern Santa Fe Corp. | | | 2,800 | | | | 168,420 | | |
| CSX Corp. | | | 4,700 | | | | 121,495 | | |
| J.B. Hunt Transport Services, Inc. | | | 300 | | | | 7,233 | | |
| Norfolk Southern Corp. | | | 1,600 | | | | 54,000 | | |
| Ryder System, Inc. | | | 6,300 | | | | 178,353 | | |
| Union Pacific Corp. | | | 3,200 | | | | 131,552 | | |
| Road & Rail Total | | | 661,053 | | |
| Industrials Total | | | 4,701,970 | | |
| Information Technology – 10.9% | |
| Communications Equipment – 1.1% | |
| Cisco Systems, Inc. (a) | | | 38,400 | | | | 643,968 | | |
| Harris Corp. | | | 200 | | | | 5,788 | | |
| QUALCOMM, Inc. | | | 5,500 | | | | 214,005 | | |
| Communications Equipment Total | | | 863,761 | | |
| Computers & Peripherals – 2.4% | |
| Apple, Inc. (a) | | | 3,700 | | | | 388,944 | | |
| Dell, Inc. (a) | | | 1,100 | | | | 10,428 | | |
| Hewlett-Packard Co. | | | 19,300 | | | | 618,758 | | |
International Business
Machines Corp. | | | 8,400 | | | | 813,876 | | |
Lexmark International, Inc.,
Class A (a) | | | 500 | | | | 8,435 | | |
| Western Digital Corp. (a) | | | 1,300 | | | | 25,142 | | |
| Computers & Peripherals Total | | | 1,865,583 | | |
| Electronic Equipment, Instruments & Components – 0.0% | |
| Agilent Technologies, Inc. (a) | | | 2,000 | | | | 30,740 | | |
Electronic Equipment, Instruments &
Components Total | | | 30,740 | | |
| Internet Software & Services – 1.0% | |
| eBay, Inc. (a) | | | 19,700 | | | | 247,432 | | |
| Google, Inc., Class A (a) | | | 900 | | | | 313,254 | | |
| IAC/InterActiveCorp (a) | | | 2,600 | | | | 39,598 | | |
| Sohu.com, Inc. (a) | | | 4,300 | | | | 177,633 | | |
| Internet Software & Services Total | | | 777,917 | | |
| IT Services – 1.4% | |
| Accenture Ltd., Class A | | | 8,200 | | | | 225,418 | | |
Affiliated Computer Services, Inc.,
Class A (a) | | | 100 | | | | 4,789 | | |
| Alliance Data Systems Corp. (a) | | | 900 | | | | 33,255 | | |
| | | Shares | | Value ($) | |
Broadridge Financial
Solutions, Inc. | | | 11,400 | | | | 212,154 | | |
| Computer Sciences Corp. (a) | | | 10,600 | | | | 390,504 | | |
| NeuStar, Inc., Class A (a) | | | 6,900 | | | | 115,575 | | |
| Paychex, Inc. | | | 400 | | | | 10,268 | | |
| Total System Services, Inc. | | | 8,300 | | | | 114,623 | | |
| Western Union Co. | | | 1,800 | | | | 22,626 | | |
| IT Services Total | | | 1,129,212 | | |
| Office Electronics – 0.0% | |
| Xerox Corp. | | | 3,700 | | | | 16,835 | | |
| Office Electronics Total | | | 16,835 | | |
| Semiconductors & Semiconductor Equipment – 1.4% | |
| Analog Devices, Inc. | | | 1,000 | | | | 19,270 | | |
| Intel Corp. | | | 38,800 | | | | 583,940 | | |
| Texas Instruments, Inc. | | | 28,400 | | | | 468,884 | | |
Semiconductors & Semiconductor
Equipment Total | | | 1,072,094 | | |
| Software – 3.6% | |
| Adobe Systems, Inc. (a) | | | 11,000 | | | | 235,290 | | |
| Amdocs Ltd. (a) | | | 1,600 | | | | 29,632 | | |
| Autodesk, Inc. (a) | | | 1,300 | | | | 21,853 | | |
| BMC Software, Inc. (a) | | | 4,400 | | | | 145,200 | | |
| CA, Inc. | | | 6,336 | | | | 111,577 | | |
| Compuware Corp. (a) | | | 1,200 | | | | 7,908 | | |
| FactSet Research Systems, Inc. | | | 2,900 | | | | 144,971 | | |
| Intuit, Inc. (a) | | | 3,800 | | | | 102,600 | | |
| Microsoft Corp. | | | 60,400 | | | | 1,109,548 | | |
| Oracle Corp. (a) | | | 38,400 | | | | 693,888 | | |
| Symantec Corp. (a) | | | 17,600 | | | | 262,944 | | |
| Software Total | | | 2,865,411 | | |
| Information Technology Total | | | 8,621,553 | | |
| Materials – 2.3% | |
| Chemicals – 1.6% | |
| Ashland, Inc. | | | 26,800 | | | | 276,844 | | |
| Dow Chemical Co. | | | 13,900 | | | | 117,177 | | |
| E.I. Du Pont de Nemours & Co. | | | 11,100 | | | | 247,863 | | |
| Eastman Chemical Co. | | | 400 | | | | 10,720 | | |
| FMC Corp. | | | 500 | | | | 21,570 | | |
| Monsanto Co. | | | 2,700 | | | | 224,370 | | |
| Mosaic Co. | | | 5,200 | | | | 218,296 | | |
| PPG Industries, Inc. | | | 1,000 | | | | 36,900 | | |
| Praxair, Inc. | | | 1,300 | | | | 87,477 | | |
| Chemicals Total | | | 1,241,217 | | |
| Containers & Packaging – 0.2% | |
| Owens-Illinois, Inc. (a) | | | 3,500 | | | | 50,540 | | |
| Packaging Corp. of America | | | 1,600 | | | | 20,832 | | |
See Accompanying Notes to Financial Statements.
11
Columbia Asset Allocation Fund II
March 31, 2009
| Common Stocks (continued) | |
| | | Shares | | Value ($) | |
| Pactiv Corp. (a) | | | 800 | | | | 11,672 | | |
| Sealed Air Corp. | | | 6,800 | | | | 93,840 | | |
| Containers & Packaging Total | | | 176,884 | | |
| Metals & Mining – 0.5% | |
| Cliffs Natural Resources, Inc. | | | 5,500 | | | | 99,880 | | |
| Nucor Corp. | | | 6,300 | | | | 240,471 | | |
| United States Steel Corp. | | | 600 | | | | 12,678 | | |
| Metals & Mining Total | | | 353,029 | | |
| Paper & Forest Products – 0.0% | |
| International Paper Co. | | | 500 | | | | 3,520 | | |
| Paper & Forest Products Total | | | 3,520 | | |
| Materials Total | | | 1,774,650 | | |
| Telecommunication Services – 2.3% | |
| Diversified Telecommunication Services – 1.9% | |
| AT&T, Inc. | | | 29,700 | | | | 748,440 | | |
| Embarq Corp. | | | 900 | | | | 34,065 | | |
Qwest Communications
International, Inc. | | | 63,400 | | | | 216,828 | | |
| Verizon Communications, Inc. | | | 17,200 | | | | 519,440 | | |
| Diversified Telecommunication Services Total | | | 1,518,773 | | |
| Wireless Telecommunication Services – 0.4% | |
| Sprint Nextel Corp. (a) | | | 88,000 | | | | 314,160 | | |
| Wireless Telecommunication Services Total | | | 314,160 | | |
| Telecommunication Services Total | | | 1,832,933 | | |
| Utilities – 2.6% | |
| Electric Utilities – 1.0% | |
| American Electric Power Co., Inc. | | | 2,400 | | | | 60,624 | | |
| Duke Energy Corp. | | | 4,000 | | | | 57,280 | | |
| Edison International | | | 2,000 | | | | 57,620 | | |
| Entergy Corp. | | | 2,000 | | | | 136,180 | | |
| Exelon Corp. | | | 7,400 | | | | 335,886 | | |
| FirstEnergy Corp. | | | 1,800 | | | | 69,480 | | |
| FPL Group, Inc. | | | 400 | | | | 20,292 | | |
| Pepco Holdings, Inc. | | | 5,600 | | | | 69,888 | | |
| Southern Co. | | | 400 | | | | 12,248 | | |
| Electric Utilities Total | | | 819,498 | | |
| Gas Utilities – 0.5% | |
| Energen Corp. | | | 5,800 | | | | 168,954 | | |
| ONEOK, Inc. | | | 3,800 | | | | 85,994 | | |
| Questar Corp. | | | 3,300 | | | | 97,119 | | |
| Gas Utilities Total | | | 352,067 | | |
| | | Shares | | Value ($) | |
| Independent Power Producers & Energy Traders – 0.0% | |
| Dynegy, Inc., Class A (a) | | | 400 | | | | 564 | | |
| Mirant Corp. (a) | | | 900 | | | | 10,260 | | |
Total Independent Power Producers &
Energy Traders | | | 10,824 | | |
| Multi-Utilities – 1.1% | |
| Consolidated Edison, Inc. | | | 600 | | | | 23,766 | | |
| Integrys Energy Group, Inc. | | | 600 | | | | 15,624 | | |
| MDU Resources Group, Inc. | | | 3,900 | | | | 62,946 | | |
| NiSource, Inc. | | | 14,700 | | | | 144,060 | | |
| PG&E Corp. | | | 2,000 | | | | 76,440 | | |
Public Service Enterprise
Group, Inc. | | | 16,000 | | | | 471,520 | | |
| Sempra Energy | | | 1,200 | | | | 55,488 | | |
| Multi-Utilities Total | | | 849,844 | | |
| Utilities Total | | | 2,032,233 | | |
Total Common Stocks
(cost of $53,679,276) | | | 47,198,187 | | |
| Mortgage-Backed Securities – 16.0% | |
| | | Par ($) | | | |
| Federal Home Loan Mortgage Corp. | |
| 5.000% 12/01/35 | | | 249,006 | | | | 257,461 | | |
| 5.000% 06/01/37 | | | 873,017 | | | | 901,384 | | |
| 5.000% 07/01/38 | | | 386,167 | | | | 398,715 | | |
| 5.500% 01/01/21 | | | 137,444 | | | | 143,575 | | |
| 5.500% 07/01/21 | | | 109,732 | | | | 114,558 | | |
| 5.500% 09/01/37 | | | 397,470 | | | | 412,869 | | |
| 6.000% 12/01/37 | | | 1,084,408 | | | | 1,134,953 | | |
| 6.500% 07/01/29 | | | 114,929 | | | | 122,294 | | |
| 6.500% 11/01/32 | | | 217,020 | | | | 230,520 | | |
| 6.500% 11/01/37 | | | 908,520 | | | | 958,881 | | |
| 8.000% 09/01/25 | | | 33,365 | | | | 36,549 | | |
| Federal National Mortgage Association | |
| 5.000% 10/01/20 | | | 287,531 | | | | 299,236 | | |
| 5.199% 08/01/36 (b) | | | 25,974 | | | | 26,500 | | |
| 5.500% 04/01/36 | | | 148,965 | | | | 154,795 | | |
| 5.500% 11/01/36 | | | 325,955 | | | | 338,712 | | |
| 5.500% 05/01/37 | | | 35,918 | | | | 37,317 | | |
| 5.500% 06/01/37 | | | 1,001,845 | | | | 1,040,845 | | |
| 5.500% 09/01/38 | | | 1,560,000 | | | | 1,620,728 | | |
| 6.000% 04/01/36 | | | 161,144 | | | | 168,605 | | |
| 6.000% 06/01/36 | | | 312,948 | | | | 327,437 | | |
| 6.000% 10/01/36 | | | 1,208,319 | | | | 1,264,263 | | |
| 6.000% 11/01/36 | | | 17,985 | | | | 18,818 | | |
| 6.500% 09/01/34 | | | 11,017 | | | | 11,658 | | |
| 6.500% 01/01/37 | | | 5,440 | | | | 5,737 | | |
| 7.500% 10/01/11 | | | 18,300 | | | | 19,054 | | |
| 8.500% 08/01/11 | | | 13,705 | | | | 14,281 | | |
| 10.000% 09/01/18 | | | 42,115 | | | | 47,333 | | |
See Accompanying Notes to Financial Statements.
12
Columbia Asset Allocation Fund II
March 31, 2009
| Mortgage-Backed Securities (continued) | |
| | | Par ($) | | Value ($) | |
| Government National Mortgage Association | |
| 7.500% 12/15/23 | | | 19,304 | | | | 20,757 | | |
TBA:
4.500% 04/01/39 (c) | | | 1,235,000 | | | | 1,263,173 | | |
| 5.000% 04/01/39 (c) | | | 1,215,000 | | | | 1,259,803 | | |
Total Mortgage-Backed Securities
(cost of $12,224,942) | | | 12,650,811 | | |
| Corporate Fixed-Income Bonds & Notes – 7.9% | |
| Basic Materials – 0.2% | |
| Chemicals – 0.1% | |
| EI Du Pont de Nemours & Co. | |
| 5.000% 07/15/13 | | | 85,000 | | | | 88,040 | | |
| Chemicals Total | | | 88,040 | | |
| Iron/Steel – 0.1% | |
| Nucor Corp. | |
| 5.850% 06/01/18 | | | 100,000 | | | | 99,850 | | |
| Iron/Steel Total | | | 99,850 | | |
| Basic Materials Total | | | 187,890 | | |
| Communications – 1.2% | |
| Media – 0.4% | |
| Comcast Cable Holdings LLC | |
| 9.875% 06/15/22 | | | 51,000 | | | | 57,445 | | |
| Comcast Corp. | |
| 7.050% 03/15/33 | | | 100,000 | | | | 92,935 | | |
| News America, Inc. | |
| 6.550% 03/15/33 | | | 125,000 | | | | 99,685 | | |
| Viacom, Inc. | |
| 6.125% 10/05/17 | | | 60,000 | | | | 51,053 | | |
| Media Total | | | 301,118 | | |
| Telecommunication Services – 0.8% | |
| AT&T, Inc. | |
| 5.100% 09/15/14 | | | 175,000 | | | | 175,589 | | |
| British Telecommunications PLC | |
| 5.150% 01/15/13 | | | 125,000 | | | | 116,013 | | |
| New Cingular Wireless Services, Inc. | |
| 8.750% 03/01/31 | | | 62,000 | | | | 67,993 | | |
| Telefonica Emisiones SAU | |
| 5.984% 06/20/11 | | | 75,000 | | | | 77,142 | | |
| Verizon Wireless Capital LLC | |
| 5.550% 02/01/14 (d) | | | 130,000 | | | | 130,109 | | |
| | | Par ($) | | Value ($) | |
| Vodafone Group PLC | |
| 5.750% 03/15/16 | | | 100,000 | | | | 100,076 | | |
| Telecommunication Services Total | | | 666,922 | | |
| Communications Total | | | 968,040 | | |
| Consumer Cyclical – 0.3% | |
| Retail – 0.3% | |
| CVS Caremark Corp. | |
| 5.750% 06/01/17 | | | 100,000 | | | | 97,516 | | |
| Wal-Mart Stores, Inc. | |
| 5.800% 02/15/18 | | | 100,000 | | | | 109,325 | | |
| Retail Total | | | 206,841 | | |
| Consumer Cyclical Total | | | 206,841 | | |
| Consumer Non-Cyclical – 0.9% | |
| Beverages – 0.3% | |
| Bottling Group LLC | |
| 6.950% 03/15/14 | | | 125,000 | | | | 142,129 | | |
| Diageo Capital PLC | |
| 5.750% 10/23/17 | | | 100,000 | | | | 101,940 | | |
| Beverages Total | | | 244,069 | | |
| Food – 0.3% | |
| Campbell Soup Co. | |
| 4.500% 02/15/19 | | | 60,000 | | | | 59,805 | | |
| ConAgra Foods, Inc. | |
| 6.750% 09/15/11 | | | 95,000 | | | | 100,462 | | |
| Kraft Foods, Inc. | |
| 6.500% 08/11/17 | | | 75,000 | | | | 77,230 | | |
| Food Total | | | 237,497 | | |
| Household Products/Wares – 0.1% | |
| Fortune Brands, Inc. | |
| 5.375% 01/15/16 | | | 100,000 | | | | 86,283 | | |
| Household Products/Wares Total | | | 86,283 | | |
| Pharmaceuticals – 0.2% | |
| Wyeth | |
| 5.500% 02/01/14 | | | 100,000 | | | | 105,042 | | |
| Pharmaceuticals Total | | | 105,042 | | |
| Consumer Non-Cyclical Total | | | 672,891 | | |
| Energy – 1.1% | |
| Oil & Gas – 0.6% | |
| Canadian Natural Resources Ltd. | |
| 5.700% 05/15/17 | | | 75,000 | | | | 66,870 | | |
| Chevron Corp. | |
| 4.950% 03/03/19 | | | 125,000 | | | | 127,748 | | |
See Accompanying Notes to Financial Statements.
13
Columbia Asset Allocation Fund II
March 31, 2009
| Corporate Fixed-Income Bonds & Notes (continued) | |
| | | Par ($) | | Value ($) | |
| Nexen, Inc. | |
| 5.875% 03/10/35 | | | 150,000 | | | | 99,243 | | |
| Talisman Energy, Inc. | |
| 6.250% 02/01/38 | | | 135,000 | | | | 95,233 | | |
| Valero Energy Corp. | |
| 6.875% 04/15/12 | | | 75,000 | | | | 75,694 | | |
| Oil & Gas Total | | | 464,788 | | |
| Oil & Gas Services – 0.2% | |
| Halliburton Co. | |
| 5.900% 09/15/18 | | | 75,000 | | | | 77,241 | | |
| Weatherford International Ltd. | |
| 5.150% 03/15/13 | | | 100,000 | | | | 93,042 | | |
| Oil & Gas Services Total | | | 170,283 | | |
| Pipelines – 0.3% | |
| Plains All American Pipeline LP/PAA Finance Corp. | |
| 6.650% 01/15/37 | | | 140,000 | | | | 101,473 | | |
| TransCanada Pipelines Ltd. | |
| 6.350% 05/15/67 (b) | | | 185,000 | | | | 105,450 | | |
| Pipelines Total | | | 206,923 | | |
| Energy Total | | | 841,994 | | |
| Financials – 2.6% | |
| Banks – 1.9% | |
| Bank of New York Mellon Corp. | |
| 5.125% 08/27/13 | | | 160,000 | | | | 163,761 | | |
| Capital One Financial Corp. | |
| 5.500% 06/01/15 | | | 125,000 | | | | 101,183 | | |
| Citigroup, Inc. | |
| 5.000% 09/15/14 | | | 190,000 | | | | 125,951 | | |
| Credit Suisse/New York | |
| 6.000% 02/15/18 | | | 100,000 | | | | 87,220 | | |
| Deutsche Bank AG | |
| 4.875% 05/20/13 | | | 150,000 | | | | 147,129 | | |
| Goldman Sachs Group, Inc. | |
| 6.345% 02/15/34 | | | 130,000 | | | | 76,748 | | |
| JPMorgan Chase & Co. | |
| 6.000% 01/15/18 | | | 140,000 | | | | 141,412 | | |
| Keycorp | |
| 6.500% 05/14/13 | | | 120,000 | | | | 117,100 | | |
| Merrill Lynch & Co., Inc. | |
| 6.050% 08/15/12 (e) | | | 200,000 | | | | 171,612 | | |
| Morgan Stanley | |
| 4.750% 04/01/14 | | | 100,000 | | | | 81,758 | | |
| SunTrust Preferred Capital I | |
| 5.853% 12/15/11 (b) | | | 165,000 | | | | 41,250 | | |
| USB Capital IX | |
| 6.189% 04/15/49 (b) | | | 285,000 | | | | 112,575 | | |
| | | Par ($) | | Value ($) | |
| Wachovia Corp. | |
| 4.875% 02/15/14 | | | 150,000 | | | | 125,949 | | |
| Banks Total | | | 1,493,648 | | |
| Diversified Financial Services – 0.2% | |
| AGFC Capital Trust I | |
| 6.000% 01/15/67 (b)(d) | | | 210,000 | | | | 19,030 | | |
| General Electric Capital Corp. | |
| 5.000% 01/08/16 | | | 175,000 | | | | 151,843 | | |
| Lehman Brothers Holdings, Inc. | |
| 5.750% 07/18/11 (f)(g) | | | 150,000 | | | | 19,125 | | |
| Diversified Financial Services Total | | | 189,998 | | |
| Insurance – 0.3% | |
| Chubb Corp. | |
| 5.750% 05/15/18 | | | 50,000 | | | | 49,371 | | |
| Principal Life Income Funding Trusts | |
| 5.300% 04/24/13 | | | 110,000 | | | | 101,055 | | |
| UnitedHealth Group, Inc. | |
| 5.250% 03/15/11 | | | 115,000 | | | | 115,984 | | |
| Insurance Total | | | 266,410 | | |
| Real Estate – 0.0% | |
| ERP Operating LP | |
| 5.200% 04/01/13 | | | 16,000 | | | | 14,178 | | |
| Real Estate Total | | | 14,178 | | |
| Real Estate Investment Trusts (REITs) – 0.2% | |
| Health Care Property Investors, Inc. | |
| 6.450% 06/25/12 | | | 58,000 | | | | 48,129 | | |
| Simon Property Group LP | |
| 5.750% 12/01/15 | | | 100,000 | | | | 77,207 | | |
| Real Estate Investment Trusts (REITs) Total | | | 125,336 | | |
| Financials Total | | | 2,089,570 | | |
| Industrials – 0.5% | |
| Aerospace & Defense – 0.2% | |
| United Technologies Corp. | |
| 5.375% 12/15/17 | | | 120,000 | | | | 122,854 | | |
| Aerospace & Defense Total | | | 122,854 | | |
| Transportation – 0.3% | |
| Burlington Northern Santa Fe Corp. | |
| 6.200% 08/15/36 | | | 75,000 | | | | 68,401 | | |
| Norfolk Southern Corp. | |
| 5.750% 04/01/18 | | | 100,000 | | | | 99,377 | | |
| United Parcel Service, Inc. | |
| 4.500% 01/15/13 | | | 100,000 | | | | 105,098 | | |
| Transportation Total | | | 272,876 | | |
| Industrials Total | | | 395,730 | | |
See Accompanying Notes to Financial Statements.
14
Columbia Asset Allocation Fund II
March 31, 2009
| Corporate Fixed-Income Bonds & Notes (continued) | |
| | | Par ($) | | Value ($) | |
| Technology – 0.2% | |
| Networking Products – 0.1% | |
| Cisco Systems, Inc. | |
| 4.950% 02/15/19 | | | 100,000 | | | | 98,387 | | |
| Networking Products Total | | | 98,387 | | |
| Software – 0.1% | |
| Oracle Corp. | |
| 6.500% 04/15/38 | | | 75,000 | | | | 74,803 | | |
| Software Total | | | 74,803 | | |
| Technology Total | | | 173,190 | | |
| Utilities – 0.9% | |
| Electric – 0.8% | |
| Commonwealth Edison Co. | |
| 5.950% 08/15/16 | | | 75,000 | | | | 71,823 | | |
| Consolidated Edison Co. of New York, Inc. | |
| 5.850% 04/01/18 | | | 100,000 | | | | 99,064 | | |
| Indiana Michigan Power Co. | |
| 5.650% 12/01/15 | | | 100,000 | | | | 89,527 | | |
| NY State Electric & Gas Corp. | |
| 5.750% 05/01/23 | | | 18,000 | | | | 14,203 | | |
| Pacific Gas & Electric Co. | |
| 5.800% 03/01/37 | | | 100,000 | | | | 95,097 | | |
| Progress Energy, Inc. | |
| 7.750% 03/01/31 | | | 100,000 | | | | 100,304 | | |
| Southern California Edison Co. | |
| 5.000% 01/15/14 | | | 125,000 | | | | 131,062 | | |
| Electric Total | | | 601,080 | | |
| Gas – 0.1% | |
| Atmos Energy Corp. | |
| 6.350% 06/15/17 | | | 110,000 | | | | 98,696 | | |
| Gas Total | | | 98,696 | | |
| Utilities Total | | | 699,776 | | |
Total Corporate Fixed-Income Bonds & Notes
(cost of $7,399,521) | | | 6,235,922 | | |
| Collateralized Mortgage Obligations – 5.2% | |
| Agency – 0.8% | |
| Federal National Mortgage Association | |
| 5.500% 08/25/17 | | | 262,272 | | | | 275,117 | | |
| 6.000% 04/25/17 | | | 212,131 | | | | 225,242 | | |
| 7.000% 01/25/21 | | | 19,734 | | | | 21,419 | | |
Vendee Mortgage Trust
I.O.:
0.300% 03/15/29 (b) | | | 6,773,110 | | | | 50,785 | | |
| 0.439% 03/15/28 (b) | | | 4,742,921 | | | | 81,585 | | |
| Agency Total | | | 654,148 | | |
| | | Par ($) | | Value ($) | |
| Non-Agency – 4.4% | |
| Bear Stearns Adjustable Rate Mortgage Trust | |
| 5.528% 02/25/47 (b) | | | 867,532 | | | | 419,788 | | |
| Countrywide Alternative Loan Trust | |
| 5.250% 03/25/35 | | | 697,901 | | | | 549,815 | | |
| 5.250% 08/25/35 | | | 109,895 | | | | 80,729 | | |
| 5.500% 10/25/35 | | | 1,044,861 | | | | 772,169 | | |
| Lehman Mortgage Trust | |
| 6.500% 01/25/38 | | | 465,162 | | | | 303,809 | | |
| WaMu Mortgage Pass-Through Certificates | |
| 5.695% 02/25/37 (b) | | | 919,495 | | | | 481,686 | | |
Washington Mutual Alternative Mortgage
Pass-Through Certificates | |
| 5.500% 10/25/35 | | | 886,922 | | | | 652,649 | | |
| Wells Fargo Alternative Loan Trust | |
| 5.500% 02/25/35 | | | 248,243 | | | | 202,961 | | |
| Non-Agency Total | | | 3,463,606 | | |
Total Collateralized Mortgage Obligations
(cost of $5,782,950) | | | 4,117,754 | | |
| Government & Agency Obligations – 4.5% | |
| Foreign Government Obligations – 0.7% | |
| Province of Ontario | |
| 5.450% 04/27/16 | | | 175,000 | | | | 191,766 | | |
| Province of Quebec | |
| 4.625% 05/14/18 | | | 190,000 | | | | 188,861 | | |
| United Mexican States | |
| 7.500% 04/08/33 | | | 191,000 | | | | 198,640 | | |
| Foreign Government Obligations Total | | | 579,267 | | |
| U.S. Government Agencies – 0.9% | |
| Federal Home Loan Mortgage Corp. | |
| 5.500% 08/23/17 | | | 585,000 | | | | 664,540 | | |
| Federal National Mortgage Association | |
| 5.375% 08/15/09 (h) | | | 45,000 | | | | 45,818 | | |
| U.S. Government Agencies Total | | | 710,358 | | |
| U.S. Government Obligations – 2.9% | |
| U.S. Treasury Bonds | |
| 5.375% 02/15/31 | | | 1,346,000 | | | | 1,697,011 | | |
| U.S. Treasury Inflation Indexed Bond | |
| 3.500% 01/15/11 | | | 570,101 | | | | 595,221 | | |
| U.S. Government Obligations Total | | | 2,292,232 | | |
Total Government & Agency Obligations
(cost of $3,298,159) | | | 3,581,857 | | |
See Accompanying Notes to Financial Statements.
15
Columbia Asset Allocation Fund II
March 31, 2009
| Commercial Mortgage-Backed Securities – 4.0% | |
| | | Par ($) | | Value ($) | |
| Bear Stearns Commercial Mortgage Securities | |
| 5.464% 04/12/38 (b) | | | 400,000 | | | | 194,575 | | |
| JPMorgan Chase Commercial Mortgage Securities Corp. | |
| 5.447% 06/12/47 | | | 287,000 | | | | 187,971 | | |
| 5.525% 04/15/43 (b) | | | 828,000 | | | | 399,570 | | |
| 4.529% 01/12/37 | | | 750,000 | | | | 630,441 | | |
| 5.447% 05/15/45 | | | 180,000 | | | | 141,354 | | |
| LB-UBS Commercial Mortgage Trust | |
| 5.084% 02/15/31 | | | 1,200,000 | | | | 1,098,461 | | |
Merrill Lynch Mortgage Investors, Inc.
I.O.,
0.379% 12/15/30 (b) | | | 1,814,968 | | | | 29,653 | | |
| Merrill Lynch Mortgage Trust | |
| 5.243% 11/12/37 (b) | | | 790,000 | | | | 397,814 | | |
| Morgan Stanley Capital I | |
| 5.370% 12/15/43 | | | 226,000 | | | | 101,298 | | |
Total Commercial Mortgage-Backed Securities
(cost of $4,716,957) | | | 3,181,137 | | |
| Asset-Backed Securities – 1.4% | |
| Citicorp Residential Mortgage Securities, Inc. | |
| 6.080% 06/25/37 | | | 290,000 | | | | 217,605 | | |
| First Plus Home Loan Trust | |
| 7.720% 05/10/24 | | | 6,779 | | | | 6,746 | | |
| Ford Credit Auto Owner Trust | |
| 5.470% 06/15/12 | | | 392,000 | | | | 377,960 | | |
| Harley-Davidson Motorcycle Trust | |
| 5.350% 03/15/13 | | | 470,388 | | | | 462,651 | | |
Total Asset-Backed Securities
(cost of $1,150,793) | | | 1,064,962 | | |
| Short-Term Obligation – 4.5% | |
Repurchase agreement with
Fixed Income Clearing Corp.,
dated 03/31/09, due on 04/01/09,
at 0.140%, collateralized by a
U.S. Government Agency
Obligation maturing 09/15/10,
market value $3,641,400
(repurchase proceeds
$3,566,014) | | | 3,566,000 | | | | 3,566,000 | | |
Total Short-Term Obligation
(cost of $3,566,000) | | | 3,566,000 | | |
Total Investments – 103.3%
(cost of $91,818,598) (i) | | | 81,596,630 | | |
| Other Assets & Liabilities, Net – (3.3)% | | | (2,615,654 | ) | |
| Net Assets – 100.0% | | | 78,980,976 | | |
Notes to Investment Portfolio:
On April 1, 2008, the Fund adopted Statement of Financial Accounting Standards No. 157, Fair Value Measurements ("SFAS 157"). SFAS 157 establishes a hierarchy that prioritizes the inputs to valuation techniques used to measure fair value giving the highest priority to unadjusted quoted prices in active markets for identical securities (level 1 measurements) and the lowest priority to unobservable inputs (level 3 measurements) when market prices are not readily available or reliable. The three levels of the fair value hierarchy under SFAS 157 are described below:
• Level 1 – quoted prices in active markets for identical securities
• Level 2 – prices determined using other significant observable inputs (including quoted prices for similar securities, interest rates, prepayment speeds, credit risk and others)
• Level 3 – prices determined using significant unobservable inputs. In situations where quoted prices or observable inputs are unavailable or less reliable, unobservable inputs may be used. Unobservable inputs may include management's own assumptions about the factors market participants would use in pricing an investment.
The inputs or methodology used for valuing securities are not necessarily an indication of the risk associated with investing in those securities.
The following table summarizes the inputs used, as of March 31, 2009 in valuing the Fund's assets:
| Valuation Inputs | | Investments in
Securities | | Other Financial
Instruments* | |
| Level 1 – Quoted Prices | | $ | 52,013,395 | | | $ | 15,742 | | |
Level 2 – Other Significant
Observable Inputs | | | 29,583,235 | | | | – | | |
Level 3 – Significant
Unobservable Inputs | | | – | | | | – | | |
| Total | | $ | 81,596,630 | | | $ | 15,742 | | |
* Other financial instruments consist of futures contracts which are not included in the investment portfolio.
(a) Non-income producing security.
(b) The interest rate shown on floating rate or variable rate securities reflects the rate at March 31, 2009.
(c) Security purchased on a delayed delivery basis.
(d) Security exempt from registration pursuant to Rule 144A under the Securities Act of 1933. These securities may be resold in transactions exempt from registration, normally to qualified institutional buyers. At March 31, 2009, these securities, which are not illiquid, amounted to $149,139, which represents 0.2% of net assets.
(e) Investments in affiliates during the year ended March 31, 2009:
Security name: Merrill Lynch & Co., Inc. 6.050% 08/15/12
| Par as of 03/31/08: | | $ | 200,000 | | |
| Par purchased: | | $ | – | | |
| Par sold: | | $ | – | | |
| Par as of 03/31/09: | | $ | 200,000 | | |
| Net realized gain (loss): | | $ | – | | |
| Interest income earned: | | $ | 11,798 | | |
| Value at end of period: | | $ | 171,612 | | |
As of 01/01/2009, Merrill Lynch & Co., Inc. is a wholly owned subsidiary of Bank of America Corporation and an affiliate of Columbia Management.
(f) Represents fair value as determined in good faith under procedures approved by the Board of Trustees.
(g) The issuer has filed for bankruptcy protection under Chapter 11 and is in default of certain debt covenants. Income is not being accrued. At March 31, 2009, the value of this security is $19,125 which represents less than 0.1% of net assets.
(h) A portion of this security with a market value of $35,636 is pledged as collateral for open futures contracts.
(i) Cost for federal income tax purposes is $92,344,633.
See Accompanying Notes to Financial Statements.
16
Columbia Asset Allocation Fund II
March 31, 2009
At March 31, 2009, the Fund held the following open long futures contract:
| Type | | Number
of
Contracts | | Value | | Aggregate
Face Value | | Expiration
Date | | Unrealized
Appreciation | |
| 10-Year U.S. Treasury Note | | | 9 | | | $ | 1,116,703 | | | $ | 1,093,060 | | | June-2009 | | $ | 23,643 | | |
At March 31, 2009, the Fund held the following open short futures contract:
| Type | | Number
of
Contracts | | Value | | Aggregate
Face Value | | Expiration
Date | | Unrealized
Depreciation | |
| 2-Year U.S. Treasury Note | | | 8 | | | $ | 1,743,125 | | | $ | 1,735,224 | | | June-2009 | | $ | (7,901 | ) | |
At March 31, 2009, the asset allocation of the Fund is as follows:
| Asset Allocation (Unaudited) | | % of
Net Assets | |
| Common Stocks | | | 59.8 | | |
| Mortgage-Backed Securities | | | 16.0 | | |
| Corporate Fixed-Income Bonds & Notes | | | 7.9 | | |
| Collateralized Mortgage Obligations | | | 5.2 | | |
| Government & Agency Obligations | | | 4.5 | | |
| Commercial Mortgage-Backed Securities | | | 4.0 | | |
| Asset-Backed Securities | | | 1.4 | | |
| | | | 98.8 | | |
| Short-Term Obligation | | | 4.5 | | |
| Other Assets & Liabilities, Net | | | (3.3 | ) | |
| | | | 100.0 | | |
| Acronym | | Name | |
| I.O. | | Interest Only | |
|
| TBA | | To Be Announced | |
|
See Accompanying Notes to Financial Statements.
17
Statement of Assets and Liabilities – Columbia Asset Allocation Fund II
March 31, 2009
| | | | | ($) | |
| Assets | | Unaffiliated investments, at identified cost | | | 91,617,447 | | |
| | | Affiliated investments, at identified cost | | | 201,151 | | |
| | | Total investments, at identified cost | | | 91,818,598 | | |
| | | Unaffiliated investments, at value | | | 81,425,018 | | |
| | | Affiliated investments, at value | | | 171,612 | | |
| | | Total investments, at value | | | 81,596,630 | | |
| | | Cash | | | 1 | | |
| | | Receivable for: | | | | | |
| | | Fund shares sold | | | 30,844 | | |
| | | Interest | | | 227,511 | | |
| | | Dividends | | | 77,770 | | |
| | | Futures variation margin | | | 813 | | |
| | | Other assets | | | 1,688 | | |
| | | Total Assets | | | 81,935,257 | | |
| Liabilities | | Payable for: | | | | | |
| | | Investments purchased | | | 98,316 | | |
| | | Investments purchased on a delayed delivery basis | | | 2,508,818 | | |
| | | Fund shares repurchased | | | 136,457 | | |
| | | Investment advisory fee | | | 39,159 | | |
| | | Administration fee | | | 3,441 | | |
| | | Transfer agent fee | | | 18,964 | | |
| | | Pricing and bookkeeping fees | | | 9,354 | | |
| | | Trustees' fees | | | 54,695 | | |
| | | Audit fee | | | 33,111 | | |
| | | Custody fee | | | 4,184 | | |
| | | Distribution and service fees | | | 15,236 | | |
| | | Chief compliance officer expenses | | | 208 | | |
| | | Other liabilities | | | 32,338 | | |
| | | Total Liabilities | | | 2,954,281 | | |
| | | Net Assets | | | 78,980,976 | | |
| Net Assets Consist of | | Paid-in capital | | | 106,479,720 | | |
| | | Undistributed net investment income | | | 61,033 | | |
| | | Accumulated net realized loss | | | (17,353,551 | ) | |
| | | Net unrealized appreciation (depreciation) on: | | | | | |
| | | Investments | | | (10,221,968 | ) | |
| | | Futures contracts | | | 15,742 | | |
| | | Net Assets | | | 78,980,976 | | |
| Class A | | Net assets | | $ | 58,511,213 | | |
| | | Shares outstanding | | | 3,671,561 | | |
| | | Net asset value per share | | $ | 15.94 | (a) | |
| | | Maximum sales charge | | | 5.75 | % | |
| | | Maximum offering price per share ($15.94/0.9425) | | $ | 16.91 | (b) | |
| Class B | | Net assets | | $ | 2,414,296 | | |
| | | Shares outstanding | | | 152,727 | | |
| | | Net asset value and offering price per share | | $ | 15.81 | (a) | |
| Class C | | Net assets | | $ | 514,847 | | |
| | | Shares outstanding | | | 32,601 | | |
| | | Net asset value and offering price per share | | $ | 15.79 | (a) | |
| Class Z | | Net assets | | $ | 17,540,620 | | |
| | | Shares outstanding | | | 1,103,192 | | |
| | | Net asset value, offering and redemption price per share | | $ | 15.90 | | |
(a) Redemption price per share is equal to net asset value less any applicable contingent deferred sales charge.
(b) On sales of $50,000 or more the offering price is reduced.
See Accompanying Notes to Financial Statements.
18
Statement of Operations – Columbia Asset Allocation Fund II
For the Year Ended March 31, 2009
| | | | | ($) | |
| Investment Income | | Dividends | | | 1,537,776 | | |
| | | Interest | | | 2,207,113 | | |
| | | Interest from affiliates | | | 11,798 | | |
| | | Total Investment Income | | | 3,756,687 | | |
| Expenses | | Investment advisory fee | | | 624,721 | | |
| | | Administration fee | | | 68,070 | | |
| | | Shareholder servicing and distribution fee: | | | | | |
| | | Class A | | | 193,639 | | |
| | | Distribution fees: | | | | | |
| | | Class B | | | 35,845 | | |
| | | Class C | | | 4,589 | | |
| | | Service fees: | | | | | |
| | | Class B | | | 11,950 | | |
| | | Class C | | | 1,530 | | |
| | | Transfer agent fee | | | 178,602 | | |
| | | Pricing and bookkeeping fees | | | 73,930 | | |
| | | Trustees' fees | | | 6,517 | | |
| | | Custody fee | | | 26,662 | | |
| | | Reports to shareholder fee | | | 69,832 | | |
| | | Chief compliance officer expenses | | | 698 | | |
| | | Other expenses | | | 128,497 | | |
| | | Total Expenses | | | 1,425,082 | | |
| | | Fees waived by transfer agent | | | (86,712 | ) | |
| | | Expense reductions | | | (2,689 | ) | |
| | | Net Expenses | | | 1,335,681 | | |
| | | Net Investment Income | | | 2,421,006 | | |
Net Realized and Unrealized
Gain (Loss) on Investments and
Futures Contracts | | Net realized gain (loss) on: | | | | | |
| | | Investments | | | (14,850,261 | ) | |
| | | Futures contracts | | | 27,663 | | |
| | | Net realized loss | | | (14,822,598 | ) | |
| | | Net change in unrealized appreciation (depreciation) on: | | | | | |
| | | Investments | | | (20,170,725 | ) | |
| | | Futures contracts | | | 15,742 | | |
| | | Net change in unrealized appreciation (depreciation) | | | (20,154,983 | ) | |
| | | Net Loss | | | (34,977,581 | ) | |
| | | Net Decrease Resulting from Operations | | | (32,556,575 | ) | |
See Accompanying Notes to Financial Statements.
19
Statement of Changes in Net Assets – Columbia Asset Allocation Fund II
| | | | | Year Ended March 31, | |
| Increase (Decrease) in Net Assets | | | | 2009 ($) | | 2008 ($) | |
| Operations | | Net investment income | | | 2,421,006 | | | | 2,916,348 | | |
| | | Net realized gain (loss) on investments and
futures contracts | | | (14,822,598 | ) | | | 6,250,787 | | |
| | | Net change in unrealized appreciation (depreciation)
on investments and futures contracts | | | (20,154,983 | ) | | | (15,442,284 | ) | |
| | | Net decrease resulting from operations | | | (32,556,575 | ) | | | (6,275,149 | ) | |
| Distributions to Shareholders | | From net investment income: | | | | | | | | | |
| | | Class A | | | (1,799,103 | ) | | | (2,158,384 | ) | |
| | | Class B | | | (68,331 | ) | | | (140,580 | ) | |
| | | Class C | | | (9,851 | ) | | | (11,412 | ) | |
| | | Class Z | | | (558,519 | ) | | | (648,679 | ) | |
| | | Total distributions to shareholders | | | (2,435,804 | ) | | | (2,959,055 | ) | |
| | | Net Capital Stock Transactions | | | (13,792,725 | ) | | | (20,403,352 | ) | |
| | | Total Decrease in Net Assets | | | (48,785,104 | ) | | | (29,637,556 | ) | |
| Net Assets | | Beginning of period | | | 127,766,080 | | | | 157,403,636 | | |
| | | End of period | | | 78,980,976 | | | | 127,766,080 | | |
| | | Undistributed net investment income at end of period | | | 61,033 | | | | 75,830 | | |
See Accompanying Notes to Financial Statements.
20
Statement of Changes in Net Assets (continued) – Capital Stock Activity
| | | Columbia Asset Allocation Fund II | |
| | | Year Ended
March 31, 2009 | | Year Ended
March 31, 2008 | |
| | | Shares | | Dollars ($) | | Shares | | Dollars ($) | |
| Class A | |
| Subscriptions | | | 164,420 | | | | 3,151,717 | | | | 273,802 | | | | 6,609,829 | | |
| Distributions reinvested | | | 89,853 | | | | 1,667,439 | | | | 82,971 | | | | 1,993,455 | | |
| Redemptions | | | (817,860 | ) | | | (15,164,420 | ) | | | (928,845 | ) | | | (22,512,345 | ) | |
| Net decrease | | | (563,587 | ) | | | (10,345,264 | ) | | | (572,072 | ) | | | (13,909,061 | ) | |
| Class B | |
| Subscriptions | | | 9,258 | | | | 172,963 | | | | 13,641 | | | | 324,546 | | |
| Distributions reinvested | | | 3,245 | | | | 60,650 | | | | 5,323 | | | | 127,517 | | |
| Redemptions | | | (190,745 | ) | | | (3,623,073 | ) | | | (327,512 | ) | | | (7,837,610 | ) | |
| Net decrease | | | (178,242 | ) | | | (3,389,460 | ) | | | (308,548 | ) | | | (7,385,547 | ) | |
| Class C | |
| Subscriptions | | | 12,900 | | | | 228,443 | | | | 9,746 | | | | 235,959 | | |
| Distributions reinvested | | | 444 | | | | 7,982 | | | | 362 | | | | 8,648 | | |
| Redemptions | | | (13,661 | ) | | | (255,908 | ) | | | (65,696 | ) | | | (1,577,945 | ) | |
| Net decrease | | | (317 | ) | | | (19,483 | ) | | | (55,588 | ) | | | (1,333,338 | ) | |
| Class Z | |
| Subscriptions | | | 38,365 | | | | 721,957 | | | | 186,485 | | | | 4,616,189 | | |
| Distributions reinvested | | | 26,566 | | | | 491,545 | | | | 24,351 | | | | 583,771 | | |
| Redemptions | | | (74,377 | ) | | | (1,252,020 | ) | | | (128,483 | ) | | | (2,975,366 | ) | |
| Net increase (decrease) | | | (9,446 | ) | | | (38,518 | ) | | | 82,353 | | | | 2,224,594 | | |
See Accompanying Notes to Financial Statements.
21
Financial Highlights – Columbia Asset Allocation Fund II
Selected data for a share outstanding throughout each period is as follows:
| | | Year Ended March 31, | |
| Class A Shares | | 2009 | | 2008 | | 2007 | | 2006 (a) | | 2005 | |
| Net Asset Value, Beginning of Period | | $ | 22.39 | | | $ | 24.00 | | | $ | 22.22 | | | $ | 20.84 | | | $ | 20.20 | | |
| Income from Investment Operations: | |
| Net investment income (b) | | | 0.45 | | | | 0.48 | | | | 0.43 | | | | 0.32 | | | | 0.31 | (c) | |
Net realized and unrealized gain (loss) on investments,
futures contracts and foreign currency | | | (6.44 | ) | | | (1.60 | ) | | | 1.78 | | | | 1.37 | | | | 0.65 | (d) | |
| Total from investment operations | | | (5.99 | ) | | | (1.12 | ) | | | 2.21 | | | | 1.69 | | | | 0.96 | | |
| Less Distributions to Shareholders: | |
| From net investment income | | | (0.46 | ) | | | (0.49 | ) | | | (0.43 | ) | | | (0.31 | ) | | | (0.32 | ) | |
| Net Asset Value, End of Period | | $ | 15.94 | | | $ | 22.39 | | | $ | 24.00 | | | $ | 22.22 | | | $ | 20.84 | | |
| Total return (e)(f) | | | (27.03 | )% | | | (4.78 | )% | | | 10.06 | % | | | 8.17 | % | | | 4.80 | %(g) | |
| Ratios to Average Net Assets/Supplemental Data: | |
| Net expenses before interest expense (h) | | | 1.29 | % | | | 1.22 | % | | | 1.22 | % | | | 1.13 | % | | | 1.25 | % | |
| Interest expense | | | — | | | | — | %(i) | | | — | %(i) | | | — | %(i) | | | — | %(i) | |
| Net expenses (h) | | | 1.29 | % | | | 1.22 | % | | | 1.22 | % | | | 1.13 | % | | | 1.25 | % | |
| Waiver/Reimbursement | | | 0.09 | % | | | 0.07 | % | | | 0.07 | % | | | 0.04 | % | | | 0.08 | % | |
| Net investment income (h) | | | 2.31 | % | | | 1.99 | % | | | 1.89 | % | | | 1.49 | % | | | 1.50 | % | |
| Portfolio turnover rate | | | 67 | % | | | 63 | % | | | 55 | % | | | 102 | % | | | 136 | % | |
| Net assets, end of period (000's) | | $ | 58,511 | | | $ | 94,827 | | | $ | 115,393 | | | $ | 119,408 | | | $ | 109,409 | | |
(a) On August 22, 2005, the Fund's Investor A shares were renamed Class A shares.
(b) Per share data was calculated using the average shares outstanding during the period.
(c) Net investment income per share reflects a special dividend. The effect of this dividend amounted to $0.03 per share.
(d) The effect of the investment advisor's reimbursement for the Fund exceeding certain investment restrictions is included in the net realized and unrealized gain (loss) on investments (per share). The effect of this reimbursement was to increase net realized and unrealized gain (loss) on investments by $0.01.
(e) Total return at net asset value assuming all distributions reinvested and no initial sales charge or contingent deferred sales charge.
(f) Had the investment advisor and/or any of its affiliates not waived fees or reimbursed a portion of expenses, total return would have been reduced.
(g) Without the effect of the investment advisor's reimbursement for the Fund exceeding certain investment restrictions, total return would have been 4.73%.
(h) The benefits derived from expense reductions had an impact of less than 0.01%.
(i) Rounds to less than 0.01%.
See Accompanying Notes to Financial Statements.
22
Financial Highlights – Columbia Asset Allocation Fund II
Selected data for a share outstanding throughout each period is as follows:
| | | Year Ended March 31, | |
| Class B Shares | | 2009 | | 2008 | | 2007 | | 2006 (a) | | 2005 | |
| Net Asset Value, Beginning of Period | | $ | 22.20 | | | $ | 23.81 | | | $ | 22.04 | | | $ | 20.67 | | | $ | 20.04 | | |
| Income from Investment Operations: | |
| Net investment income (b) | | | 0.29 | | | | 0.30 | | | | 0.26 | | | | 0.14 | | | | 0.15 | (c) | |
Net realized and unrealized gain (loss) on investments,
futures contracts and foreign currency | | | (6.37 | ) | | | (1.60 | ) | | | 1.77 | | | | 1.38 | | | | 0.64 | (d) | |
| Total from investment operations | | | (6.08 | ) | | | (1.30 | ) | | | 2.03 | | | | 1.52 | | | | 0.79 | | |
| Less Distributions to Shareholders: | |
| From net investment income | | | (0.31 | ) | | | (0.31 | ) | | | (0.26 | ) | | | (0.15 | ) | | | (0.16 | ) | |
| Net Asset Value, End of Period | | $ | 15.81 | | | $ | 22.20 | | | $ | 23.81 | | | $ | 22.04 | | | $ | 20.67 | | |
| Total return (e)(f) | | | (27.55 | )% | | | (5.54 | )% | | | 9.27 | % | | | 7.38 | % | | | 3.97 | %(g) | |
| Ratios to Average Net Assets/Supplemental Data: | |
| Net expenses before interest expense (h) | | | 2.04 | % | | | 1.97 | % | | | 1.97 | % | | | 1.88 | % | | | 2.00 | % | |
| Interest expense | | | — | | | | — | %(i) | | | — | %(i) | | | — | %(i) | | | — | %(i) | |
| Net expenses (h) | | | 2.04 | % | | | 1.97 | % | | | 1.97 | % | | | 1.88 | % | | | 2.00 | % | |
| Waiver/Reimbursement | | | 0.09 | % | | | 0.07 | % | | | 0.07 | % | | | 0.04 | % | | | 0.07 | % | |
| Net investment income (h) | | | 1.49 | % | | | 1.25 | % | | | 1.14 | % | | | 0.68 | % | | | 0.75 | % | |
| Portfolio turnover rate | | | 67 | % | | | 63 | % | | | 55 | % | | | 102 | % | | | 136 | % | |
| Net assets, end of period (000's) | | $ | 2,414 | | | $ | 7,349 | | | $ | 15,225 | | | $ | 22,247 | | | $ | 43,962 | | |
(a) On August 22, 2005, the Fund's Investor B shares were renamed Class B shares.
(b) Per share data was calculated using the average shares outstanding during the period.
(c) Net investment income per share reflects a special dividend. The effect of this dividend amounted to $0.03 per share.
(d) The effect of the investment advisor's reimbursement for the Fund exceeding certain investment restrictions is included in the net realized and unrealized gain (loss) on investments (per share). The effect of this reimbursement was to increase net realized and unrealized gain (loss) on investments by $0.01.
(e) Total return at net asset value assuming all distributions reinvested and no contingent deferred sales charge.
(f) Had the investment advisor and/or any of its affiliates not waived fees or reimbursed a portion of expenses, total return would have been reduced.
(g) Without the effect of the investment advisor's reimbursement for the Fund exceeding certain investment restrictions, total return would have been 3.92%.
(h) The benefits derived from expense reductions had an impact of less than 0.01%.
(i) Rounds to less than 0.01%.
See Accompanying Notes to Financial Statements.
23
Financial Highlights – Columbia Asset Allocation Fund II
Selected data for a share outstanding throughout each period is as follows:
| | | Year Ended March 31, | |
| Class C Shares | | 2009 | | 2008 | | 2007 | | 2006 (a) | | 2005 | |
| Net Asset Value, Beginning of Period | | $ | 22.18 | | | $ | 23.79 | | | $ | 22.02 | | | $ | 20.65 | | | $ | 20.02 | | |
| Income from Investment Operations: | |
| Net investment income (b) | | | 0.30 | | | | 0.32 | | | | 0.26 | | | | 0.15 | | | | 0.15 | (c) | |
Net realized and unrealized gain (loss) on investments,
futures contracts and foreign currency | | | (6.38 | ) | | | (1.62 | ) | | | 1.77 | | | | 1.37 | | | | 0.65 | (d) | |
| Total from investment operations | | | (6.08 | ) | | | (1.30 | ) | | | 2.03 | | | | 1.52 | | | | 0.80 | | |
| Less Distributions to Shareholders: | |
| From net investment income | | | (0.31 | ) | | | (0.31 | ) | | | (0.26 | ) | | | (0.15 | ) | | | (0.17 | ) | |
| Net Asset Value, End of Period | | $ | 15.79 | | | $ | 22.18 | | | $ | 23.79 | | | $ | 22.02 | | | $ | 20.65 | | |
| Total return (e)(f) | | | (27.58 | )% | | | (5.54 | )% | | | 9.28 | % | | | 7.39 | % | | | 4.02 | %(g) | |
| Ratios to Average Net Assets/Supplemental Data: | |
| Net expenses before interest expense (h) | | | 2.04 | % | | | 1.97 | % | | | 1.97 | % | | | 1.88 | % | | | 2.00 | % | |
| Interest expense | | | — | | | | — | %(i) | | | — | %(i) | | | — | %(i) | | | — | %(i) | |
| Net expenses (h) | | | 2.04 | % | | | 1.97 | % | | | 1.97 | % | | | 1.88 | % | | | 2.00 | % | |
| Waiver/Reimbursement | | | 0.09 | % | | | 0.07 | % | | | 0.07 | % | | | 0.04 | % | | | 0.07 | % | |
| Net investment income (h) | | | 1.59 | % | | | 1.32 | % | | | 1.14 | % | | | 0.73 | % | | | 0.75 | % | |
| Portfolio turnover rate | | | 67 | % | | | 63 | % | | | 55 | % | | | 102 | % | | | 136 | % | |
| Net assets, end of period (000's) | | $ | 515 | | | $ | 730 | | | $ | 2,105 | | | $ | 2,468 | | | $ | 2,628 | | |
(a) On August 22, 2005, the Fund's Investor C shares were renamed Class C shares.
(b) Per share data was calculated using the average shares outstanding during the period.
(c) Net investment income per share reflects a special dividend. The effect of this dividend amounted to $0.03 per share.
(d) The effect of the investment advisor's reimbursement for the Fund exceeding certain investment restrictions is included in the net realized and unrealized gain (loss) on investments (per share). The effect of this reimbursement was to increase net realized and unrealized gain (loss) on investments by $0.01.
(e) Total return at net asset value assuming all distributions reinvested and no contingent deferred sales charge.
(f) Had the investment advisor and/or any of its affiliates not waived fees or reimbursed a portion of expenses, total return would have been reduced.
(g) Without the effect of the investment advisor's reimbursement for the Fund exceeding certain investment restrictions, total return would have been 3.95%.
(h) The benefits derived from expense reductions had an impact of less than 0.01%.
(i) Rounds to less than 0.01%.
See Accompanying Notes to Financial Statements.
24
Financial Highlights – Columbia Asset Allocation Fund II
Selected data for a share outstanding throughout each period is as follows:
| | | Year Ended March 31, | |
| Class Z Shares | | 2009 | | 2008 | | 2007 | | 2006 (a) | | 2005 | |
| Net Asset Value, Beginning of Period | | $ | 22.34 | | | $ | 23.95 | | | $ | 22.17 | | | $ | 20.81 | | | $ | 20.18 | | |
| Income from Investment Operations: | |
| Net investment income (b) | | | 0.50 | | | | 0.54 | | | | 0.49 | | | | 0.37 | | | | 0.36 | (c) | |
Net realized and unrealized gain (loss) on investments,
futures contracts and foreign currency | | | (6.43 | ) | | | (1.60 | ) | | | 1.78 | | | | 1.36 | | | | 0.64 | (d) | |
| Total from investment operations | | | (5.93 | ) | | | (1.06 | ) | | | 2.27 | | | | 1.73 | | | | 1.00 | | |
| Less Distributions to Shareholders: | |
| From net investment income | | | (0.51 | ) | | | (0.55 | ) | | | (0.49 | ) | | | (0.37 | ) | | | (0.37 | ) | |
| Net Asset Value, End of Period | | $ | 15.90 | | | $ | 22.34 | | | $ | 23.95 | | | $ | 22.17 | | | $ | 20.81 | | |
| Total return (e)(f) | | | (26.86 | )% | | | (4.55 | )% | | | 10.35 | % | | | 8.35 | % | | | 5.01 | %(g) | |
| Ratios to Average Net Assets/Supplemental Data: | |
| Net expenses before interest expense (h) | | | 1.04 | % | | | 0.97 | % | | | 0.97 | % | | | 0.88 | % | | | 1.00 | % | |
| Interest expense | | | — | | | | — | %(i) | | | — | %(i) | | | — | %(i) | | | — | %(i) | |
| Net expenses (h) | | | 1.04 | % | | | 0.97 | % | | | 0.97 | % | | | 0.88 | % | | | 1.00 | % | |
| Waiver/Reimbursement | | | 0.09 | % | | | 0.07 | % | | | 0.07 | % | | | 0.04 | % | | | 0.07 | % | |
| Net investment income (h) | | | 2.58 | % | | | 2.24 | % | | | 2.15 | % | | | 1.72 | % | | | 1.75 | % | |
| Portfolio turnover rate | | | 67 | % | | | 63 | % | | | 55 | % | | | 102 | % | | | 136 | % | |
| Net assets, end of period (000's) | | $ | 17,541 | | | $ | 24,859 | | | $ | 24,680 | | | $ | 25,336 | | | $ | 26,425 | | |
(a) On August 22, 2005, the Fund's Primary A shares were renamed Class Z shares.
(b) Per share data was calculated using the average shares outstanding during the period.
(c) Net investment income per share reflects a special dividend. The effect of this dividend amounted to $0.03 per share.
(d) The effect of the investment advisor's reimbursement for the Fund exceeding certain investment restrictions is included in the net realized and unrealized gain (loss) on investments (per share). The effect of this reimbursement was to increase net realized and unrealized gain (loss) on investments by $0.01.
(e) Total return at net asset value assuming all distributions reinvested.
(f) Had the investment advisor and/or any of its affiliates not waived fees or reimbursed a portion of expenses, total return would have been reduced.
(g) Without the effect of the investment advisor's reimbursement for the Fund exceeding certain investment restrictions, total return would have been 4.94%.
(h) The benefits derived from expense reductions had an impact of less than 0.01%.
(i) Rounds to less than 0.01%.
See Accompanying Notes to Financial Statements.
25
Notes to Financial Statements – Columbia Asset Allocation Fund II
March 31, 2009
Note 1. Organization
Columbia Asset Allocation Fund II (the "Fund"), a series of Columbia Funds Series Trust (the "Trust"), is a diversified portfolio. The Trust is a Delaware statutory trust registered under the Investment Company Act of 1940, as amended (the "1940 Act"), as an open-end management investment company.
Investment Objective
The Fund seeks total return, consisting of long-term capital appreciation and current income.
Fund Shares
The Trust may issue an unlimited number of shares, and the Fund offers four classes of shares: Class A, Class B, Class C and Class Z. Each share class has its own expense structure and sales charges, as applicable. Beginning on or about June 22, 2009, the Fund will no longer accept investment in Class B shares from new or existing investors in the Fund's Class B shares, except in connection with the reinvestment of any dividend and/or capital gain distributions in Class B shares of the Fund and exchanges by existing Class B shareholders of the other Columbia Funds.
Class A shares are subject to a maximum front-end sales charge of 5.75% based on the amount of initial investment. Class A shares purchased without an initial sales charge in accounts aggregating $1 million to $50 million at the time of purchase are subject to a 1.00% contingent deferred sales charge ("CDSC") if the shares are sold within one year after purchase. Class B shares are subject to a maximum CDSC of 5.00% based upon the holding period after purchase. Class B shares will convert to Class A shares eight years after purchase. Class C shares are subject to a 1.00% CDSC on shares sold within one year after purchase. Class Z shares are offered continuously at net asset value. There are certain restrictions on the purchase of Class Z shares, as described in the Fund's prospectus.
Note 2. Significant Accounting Policies
The preparation of financial statements in accordance with accounting principles generally accepted in the United States of America ("GAAP") requires management to make certain estimates and assumptions that affect the reported amounts of assets and liabilities, the disclosure of contingent assets and liabilities at the date of the financial statements and the reported amounts of revenue and expenses during the reporting period. Actual results could differ from those estimates. The following is a summary of significant accounting policies consistently followed by the Fund in the preparation of its financial statements.
Security Valuation
Debt securities generally are valued by pricing services approved by the Trust's Board of Trustees, based upon market transactions for normal, institutional-size trading units of similar securities. The services may use various pricing techniques which take into account appropriate factors such as yield, quality, coupon rate, maturity, type of issue, trading characteristics and other data, as well as broker quotes. Debt securities for which quotations are readily available are valued at an over-the-counter or exchange bid quotation.
Certain debt securities, which tend to be more thinly traded and of lesser quality, are priced based on fundamental analysis of the financial condition of the issuer and the estimated value of any collateral. Valuations developed through pricing techniques may vary from the actual amounts realized upon sale of the securities, and the potential variation may be greater for those securities valued using fundamental analysis.
Equity securities are valued at the last sale price on the principal exchange on which they trade, except for securities traded on the NASDAQ, which are valued at the NASDAQ official close price. Unlisted securities or listed securities for which there were no sales during the day are valued at the closing bid price on such exchanges or over-the-counter markets.
Short-term investments maturing in 60 days or less are valued at amortized cost, which approximates market value.
Futures contracts are valued at the settlement price established each day by the board of trade or exchange on which they are traded.
Foreign securities are generally valued at the last sale price on the foreign exchange or market on which they trade. If any foreign share prices are not readily available as a result of limited share activity, the securities are valued at the last sale price of the local shares in the principal market in which such securities are normally traded.
Generally, trading in foreign securities is substantially completed each day at various times prior to the close of the New York Stock Exchange ("NYSE"). The values of such
26
Columbia Asset Allocation Fund II, March 31, 2009
securities used in computing the net asset value of the Fund's shares are determined as of such times. Foreign currency exchange rates are generally determined at 4:00 p.m. Eastern (U.S.) time. Occasionally, events affecting the values of such foreign securities and such exchange rates may occur between the times at which they are determined and the close of the customary trading session of the NYSE, which would not be reflected in the computation of the Fund's net asset value. If events materially affecting the values of such foreign securities occur and it is determined that market quotations are not reliable, then these foreign securities will be valued at their fair value using procedures approved by the Board of Trustees.
Investments for which market quotations are not readily available, or that have quotations which management believes are not reliable, are valued at fair value as determined in good faith under consistently applied procedures established by and under the general supervision of the Board of Trustees. If a security is valued at fair value, such value is likely to be different from the last quoted market price for the security. The determination of fair value often requires significant judgment. To determine fair value, management may use assumptions including but not limited to future cash flows and estimated risk premiums. Multiple inputs from various sources may be used to determine value.
Security Transactions
Security transactions are accounted for on the trade date. Cost is determined and gains (losses) are based upon the specific identification method for both financial statement and federal income tax purposes.
In March 2008, Statement of Financial Accounting Standards No. 161, Disclosures about Derivative Instruments and Hedging Activities—an amendment of FASB Statement No. 133 ("SFAS 161"), was issued. SFAS 161 is effective for fiscal years and interim periods beginning after November 15, 2008. SFAS 161 requires additional discussion about the reporting entity's derivative instruments and hedging activities, by providing for qualitative disclosures about the objectives and strategies for using derivatives, quantitative data about the fair value of and gains and losses on derivative contracts, and details of credit-risk-related contingent features in their derivative contracts. Management is evaluating the impact the application of SFAS 161 will have on the Fund's financial stateme nt disclosures.
Futures Contracts
The Fund may invest in futures contracts for both hedging and non-hedging purposes, including, for example, to seek to enhance returns or as a substitute for a position in an underlying asset.
The use of futures contracts involves certain risks, which include: (1) imperfect correlation between the price movement of the instruments and the underlying securities, (2) inability to close out positions due to differing trading hours, or the temporary absence of a liquid market, for either the instruments or the underlying securities, or (3) an inaccurate prediction of the future direction of interest rates by Columbia Management Advisors, LLC ("Columbia"), the Fund's investment advisor. Any of these risks may involve amounts exceeding the variation margin recorded in the Fund's Statement of Assets and Liabilities at any given time.
Upon entering into a futures contract, the Fund pledges cash or securities with the broker in an amount sufficient to meet the initial margin requirement. Subsequent payments are made or received by the Fund equal to the daily change in the contract value and are recorded as variation margin receivable or payable and offset in unrealized gains or losses. The Fund recognizes a realized gain or loss when the contract is closed or expires.
Repurchase Agreements
The Fund may engage in repurchase agreement transactions with institutions that Columbia has determined are creditworthy. The Fund, through its custodian, receives delivery of the underlying securities collateralizing a repurchase agreement. Columbia is responsible for determining that the collateral is at least equal, at all times, to the value of the repurchase obligation including interest. A repurchase agreement transaction involves certain risks in the event of default or insolvency of the counterparty. These risks include possible delays in or restrictions on the Fund's ability to dispose of the underlying securities and a possible decline in the value of the underlying securities during the period while the Fund seeks to assert its rights.
Treasury Inflation Protected Securities
The Fund may invest in treasury inflation protected securities ("TIPS"). The principal amount of TIPS is adjusted periodically
27
Columbia Asset Allocation Fund II, March 31, 2009
for inflation based on a monthly published index. Interest payments are based on the inflation-adjusted principal at the time the interest is paid. These adjustments are recorded as interest income on the Statement of Operations.
Income Recognition
Interest income is recorded on the accrual basis. Premium and discount are amortized and accreted, respectively, on all debt securities, unless otherwise noted.
Corporate actions and dividend income are recorded on the ex-date.
Distributions received from real estate investment trusts (REITs) in excess of their income are recorded as a reduction of the cost of the related investments. If the Fund no longer owns the applicable securities, any distributions received in excess of income are recorded as realized gains.
Expenses
General expenses of the Trust are allocated to the Fund and other series of the Trust based upon relative net assets or other expense allocation methodologies determined by the nature of the expense. Expenses directly attributable to the Fund are charged to the Fund.
Determination of Class Net Asset Value
All income, expenses (other than class-specific expenses, as shown on the Statement of Operations) and realized and unrealized gains (losses) are allocated to each class of the Fund on a daily basis, based on the relative net assets of each class, for purposes of determining the net asset value of each class.
Federal Income Tax Status
The Fund intends to qualify each year as a "regulated investment company" under Subchapter M of the Internal Revenue Code, as amended, and will distribute substantially all of its taxable income, if any, for its tax year, and as such will not be subject to federal income taxes. In addition, the Fund intends to distribute in each calendar year substantially all of its net investment income, capital gains and certain other amounts, if any, such that the Fund should not be subject to federal excise tax. Therefore, no provision is made for federal income or excise taxes.
Distributions to Shareholders
Distributions from net investment income are declared and paid quarterly. Net realized capital gains, if any, are distributed at least annually. Income distributions and capital gain distributions are determined in accordance with federal income tax regulations which may differ from GAAP.
Indemnification
In the normal course of business, the Fund enters into contracts that contain a variety of representations and warranties and which provide general indemnities. The Fund's maximum exposure under these arrangements is unknown because this would involve future claims against the Fund. Also, under the Trust's organizational documents and by contract, the Trustees and officers of the Trust are indemnified against certain liabilities that may arise out of actions relating to their duties to the Trust. However, based on experience, the Fund expects the risk of loss due to these representations, warranties and indemnities to be minimal.
Note 3. Federal Tax Information
The timing and character of income and capital gain distributions are determined in accordance with income tax regulations, which may differ from GAAP. Reclassifications are made to the Fund's capital accounts for permanent tax differences to reflect income and gains available for distribution (or available capital loss carryforwards) under income tax regulations.
For the year ended March 31, 2009, permanent book and tax differences were identified and reclassified among the components of the Fund's net assets as follows:
Undistributed
Net Investment
Income | | Accumulated
Net Realized
Loss | | Paid-In Capital | |
| $ | 1 | | | $ | (4 | ) | | $ | 3 | | |
Net investment income and net realized gains (losses), as disclosed on the Statement of Operations, and net assets were not affected by this reclassification.
28
Columbia Asset Allocation Fund II, March 31, 2009
The tax character of distributions paid during the years ended March 31, 2009 and March 31, 2008 was as follows:
| | | March 31, | |
| Distributions paid from: | | 2009 | | 2008 | |
| Ordinary Income* | | $ | 2,435,804 | | | $ | 2,959,055 | | |
* For tax purposes short-term capital gains distributions, if any, are considered ordinary income distributions.
As of March 31, 2009, the components of distributable earnings on a tax basis were as follows:
Undistributed
Ordinary
Income | | Undistributed
Long-term
Capital Gains | | Net Unrealized
Depreciation* | |
| $ | 84,800 | | | $ | — | | | $ | (10,748,003 | ) | |
* The differences between book-basis and tax-basis net unrealized depreciation are primarily due to deferral of losses from wash sales.
Unrealized appreciation and depreciation at March 31, 2009, based on cost of investments for federal income tax purposes were:
| Unrealized appreciation | | $ | 7,584,134 | | |
| Unrealized depreciation | | | (18,332,137 | ) | |
| Net unrealized depreciation | | $ | (10,748,003 | ) | |
The following capital loss carryforwards, determined as of March 31, 2009, may be available to reduce taxable income arising from future net realized gains on investments, if any, to the extent permitted by the Internal Revenue Code:
| Year of Expiration | | Capital Loss
Carryforward | |
| | 2012 | | | $ | 1,767,986 | | |
| | 2017 | | | | 4,810,145 | | |
| Total | | $ | 6,578,131 | | |
Under current tax rules, certain currency and capital losses realized after October 31 may be deferred and treated as occurring on the first day of the following fiscal year. As of March 31, 2009, post-October capital losses of $10,233,643 attributed to security transactions were deferred to April 1, 2009.
Under Financial Accounting Standards Board ("FASB") Interpretation No. 48, Accounting for Uncertainty in Income Taxes—an Interpretation of FASB Statement No. 109 ("FIN 48"), management determines whether a tax position of the Fund is more likely than not to be sustained upon examination by the applicable taxing authority, including resolution of any related appeals or litigation processes, based on the technical merits of the position. The tax benefit to be recognized is measured as the largest amount of benefit that is greater than fifty percent likely of being realized upon ultimate settlement. Management has evaluated the known implications of FIN 48 on its computation of net assets for the Fund. As a result of this evaluation, management has concluded that FIN 48 did not have any effect on the Fund's financial statements. However, management's conclusions regarding FIN 48 may be subject to review and adjustment at a later date based on factors including, but not limited to, further implementation guidance from the FASB, new tax laws, regulations, and administrative interpretations (including relevant court decisions). The Fund's federal tax returns for the prior three fiscal years remain subject to examination by the Internal Revenue Service. The Fund is not aware of any tax positions for which it is reasonably possible that the total amounts of unrecognized tax benefits will significantly change in the next twelve months.
Note 4. Fees and Compensation Paid to Affiliates
Investment Advisory Fee
Columbia, an indirect, wholly owned subsidiary of Bank of America Corporation ("BOA") provides investment advisory services to the Fund. In rendering investment advisory services to the Fund, Columbia may use the portfolio management and research resources of Columbia Management Pte. Ltd., an affiliate of Columbia. Columbia receives a monthly investment advisory fee at the annual rate of 0.60% of the Fund's average daily net assets.
Administration Fee
Columbia provides administrative and other services to the Fund for a monthly administration fee at the annual rate of 0.12% of the Fund's average daily net assets less the fees payable by the Fund as described under the Pricing and Bookkeeping Fees note below.
29
Columbia Asset Allocation Fund II, March 31, 2009
Pricing and Bookkeeping Fees
The Fund has entered into a Financial Reporting Services Agreement (the "Financial Reporting Services Agreement") with State Street Bank & Trust Company ("State Street") and Columbia pursuant to which State Street provides financial reporting services to the Fund. The Fund has also entered into an Accounting Services Agreement (collectively with the Financial Reporting Services Agreement, the "State Street Agreements") with State Street and Columbia pursuant to which State Street provides accounting services to the Fund. Under the State Street Agreements, the Fund pays State Street an annual fee of $38,000 paid monthly plus an additional monthly fee based on an annualized percentage rate of average daily net assets of the Fund for the month. The aggregate fee will not exceed $140,000 per year (exclusive of out-of-pocket expenses and charges). The Fund also reimburses State Street for certain out-of-pocket expenses and charge s.
The Fund has entered into a Pricing and Bookkeeping Oversight and Services Agreement (the "Services Agreement") with Columbia. Under the Services Agreement, Columbia provides services related to Fund expenses and the requirements of the Sarbanes-Oxley Act of 2002, and provides oversight of the accounting and financial reporting services provided by State Street. Under the Services Agreement, the Fund reimburses Columbia for out-of-pocket expenses.
Transfer Agent Fee
Columbia Management Services, Inc. (the "Transfer Agent"), an affiliate of Columbia and an indirect, wholly owned subsidiary of BOA, provides shareholder services to the Fund and has contracted with Boston Financial Data Services ("BFDS") to serve as sub-transfer agent. The Transfer Agent is entitled to receive a fee for its services, paid monthly, at the annual rate of $17.34 per open account plus reimbursement of certain sub-transfer agent fees paid by the Transfer Agent (exclusive of BFDS fees), calculated based on assets held in omnibus accounts and intended to recover the cost of payments to other parties (including affiliates of BOA) for services to those accounts. The Transfer Agent pays the fees of BFDS for services as sub-transfer agent and is not entitled to reimbursement for such fees from the Fund.
The Transfer Agent may also retain, as additional compensation for its services, fees for wire, telephone and redemption orders, Individual Retirement Account ("IRA") trustee agent fees and account transcript fees due to the Transfer Agent from shareholders of the Fund and credits (net of bank charges) earned with respect to balances in accounts the Transfer Agent maintains in connection with its services to the Fund. The Transfer Agent also receives reimbursement for certain out-of-pocket expenses.
The Transfer Agent has voluntarily agreed to waive a portion of its fees for accounts other than omnibus accounts, so that transfer agent fees (exclusive of out-of-pocket expenses and sub-transfer agent fees) will not exceed 0.02% annually of the Fund's average daily net assets. Effective May 1, 2009, the Transfer Agent has discontinued this arrangement.
An annual minimum account balance fee of $20 may apply to certain accounts with a value below the Fund's initial minimum investment requirements to reduce the impact of small accounts on transfer agent fees. These minimum account balance fees are recorded as part of expense reductions on the Statement of Operations. For the year ended March 31, 2009, these minimum account balance fees reduced total expenses by $2,424.
Underwriting Discounts, Service and Distribution Fees
Columbia Management Distributors, Inc. (the "Distributor"), an affiliate of Columbia and an indirect, wholly owned subsidiary of BOA, is the principal underwriter of the Fund's shares. For the year ended March 31, 2009, the Distributor has retained net underwriting discounts of $3,460 on sales of the Fund's Class A shares and received net CDSC fees of $6,156 and $350 on Class B and Class C share redemptions, respectively.
The Fund has adopted distribution and shareholder servicing plans (the "Plans") pursuant to Rule 12b-1 under the 1940 Act, which require the payment of distribution and service fees. The fees are intended to compensate the Distributor and/or eligible selling and/or servicing agents for selling shares of the Fund and providing services to investors. The Plans require the payment of a combined distribution and shareholder servicing fee for Class A shares of the Fund. The Plans also require the payment of a monthly shareholder servicing fee and distribution fee for the Class B and Class C shares of the Fund. A substantial portion of the expenses incurred pursuant to these plans is paid to affiliates of BOA
30
Columbia Asset Allocation Fund II, March 31, 2009
and the Distributor. The annual rates in effect and plan limits, as a percentage of average daily net assets are as follows:
| | | Current
Rate | | Plan
Limit | |
Class A Combined Distribution
and Shareholder Servicing Plan | | | 0.25 | % | | | 0.25 | % | |
Class B and Class C Shareholder
Servicing Plans | | | 0.25 | % | | | 0.25 | % | |
Class B and Class C
Distribution Plans | | | 0.75 | % | | | 0.75 | % | |
Expense Limits and Fee Waivers
Effective May 1, 2009, Columbia has voluntarily agreed to reimburse a portion of the Fund's expenses so that the Fund's ordinary operating expenses (excluding any distribution and service fees, brokerage commissions, interest, taxes and extraordinary expenses, but including custodian charges relating to overdrafts, if any), after giving effect to any balance credits from the Fund's custodian, do not exceed 0.95% of the Fund's average daily net assets on an annualized basis. Columbia, in its discretion, may revise or discontinue this arrangement at any time.
Fees Paid to Officers and Trustees
All officers of the Fund are employees of Columbia or its affiliates and, with the exception of the Fund's Chief Compliance Officer, receive no compensation from the Fund. The Board of Trustees has appointed a Chief Compliance Officer to the Fund in accordance with federal securities regulations. The Fund, along with other affiliated funds, pays its pro-rata share of the expenses associated with the Chief Compliance Officer. The Fund's expenses for the Chief Compliance Officer will not exceed $15,000 per year.
The Trust's eligible Trustees may participate in a non-qualified deferred compensation plan which may be terminated at any time. Any payments to plan participants are paid solely out of the Fund's assets. Income earned on the plan participant's deferral account is based on the rate of return of the eligible mutual funds selected by the participant or, if no funds are selected, on the rate of return of Columbia Treasury Reserves, another portfolio of the Trust. The expense for the deferred compensation plan is included in "Trustees' fees" on the Statement of Operations. The liability for the deferred compensation plan is included in "Trustees' fees" on the Statement of Assets and Liabilities
Note 5. Custody Credits
The Fund has an agreement with its custodian bank under which custody fees may be reduced by balance credits. These credits are recorded as part of expense reductions on the Statement of Operations. The Fund could have invested a portion of the assets utilized in connection with the expense offset arrangement in an income-producing asset if it had not entered into such an agreement.
For the year ended March 31, 2009, these custody credits reduced total expenses by $265 for the Fund.
Note 6. Portfolio Information
For the year ended March 31, 2009, the cost of purchases and proceeds from sales of securities, excluding short-term obligations, for the Fund were $70,326,758 and $84,203,493, respectively, of which $18,594,958 and $25,419,454, respectively, were U.S. Government securities.
Note 7. Line of Credit
The Fund and other affiliated funds participate in a $280,000,000 committed, unsecured revolving line of credit provided by State Street. The maximum amount that may be borrowed by any fund is limited to the lesser of $200,000,000 and the Fund's borrowing limit set forth in the Fund's registration statement. Borrowings are available for short-term liquidity or temporary or emergency purposes.
Interest is charged to each participating fund based on the fund's borrowings at a rate per annum equal to the greater of the Federal Funds Rate plus 0.50% or the overnight LIBOR Rate plus 0.50%. In addition, an annual operations agency fee of $20,000, an amendment fee of 0.02% and a commitment fee of 0.12% per annum are accrued and apportioned among the participating funds pro rata based on their relative net assets.
Prior to October 16, 2008, the Fund and other affiliated funds participated in a $350,000,000 committed, unsecured revolving line of credit and a $150,000,000 uncommitted, unsecured line of credit, both provided by State Street. Interest on the committed line of credit was charged to each participating fund based on the fund's borrowings at a rate per annum equal to the Federal Funds Rate plus 0.50%. In addition, a
31
Columbia Asset Allocation Fund II, March 31, 2009
commitment fee of 0.10% per annum was accrued and apportioned among the participating funds pro rata based on their relative net assets. Interest on the uncommitted line of credit was charged to each participating fund based on the fund's borrowings at a rate per annum equal to the Federal Funds Rate plus 0.375%. State Street charged an annual operations agency fee of $40,000 for the committed line of credit and was able to charge an annual administration fee of $15,000 for the uncommitted line of credit. The commitment fee, the operations agency fee and the administration fee were accrued and apportioned among the participating funds pro rata based on their relative net assets.
For the year ended March 31, 2009, the Fund did not borrow under these arrangements.
Note 8. Shares of Beneficial Interest
As of March 31, 2009, 21.2% of the Fund's shares outstanding were beneficially owned by one participant account over which BOA and/or any of its affiliates had either sole or joint investment discretion.
Subscription and redemption activity of this account may have a significant effect on the operations of the Fund.
Note 9. Significant Risks and Contingencies
Asset-Backed Securities Risk
The value of asset-backed securities may be affected by, among other factors, changes in interest rates, the market's assessment of the quality of underlying assets, the creditworthiness of the servicer for the underlying assets, factors concerning the interests in and structure of the issuer or the originator of the underlying assets, or the creditworthiness or rating of the entities that provide any supporting letters of credit, surety bonds, derivative instruments, or other credit enhancement. The value of asset-backed securities also will be affected by the exhaustion, termination or expiration of any credit enhancement. Most asset-backed securities are subject to prepayment risk, which is the possibility that the underlying debt may be refinanced or prepaid prior to maturity during periods of declining or low interest rates, causing the Fund to have to reinvest the money received in securities that have lower yields. In add ition, the impact of prepayments on the value of asset-backed securities may be difficult to predict and may result in greater volatility.
Mortgage-Backed Securities Risk
The value of the mortgage-backed securities may be affected by, among other things, changes in interest rates, factors concerning the interests in and structure of the issuer or the originator of the mortgages, the creditworthiness of the entities that provide any supporting letters of credit, surety bonds or other credit enhancements or the quality of underlying assets or the market's assessment thereof. Mortgage-backed securities are subject to prepayment risk, which is the possibility that the underlying mortgage may be refinanced or prepaid prior to maturity during periods of declining or low interest rates, causing the Funds to have to reinvest the money received in securities that have lower yields. In addition, the impact of prepayments on the value of mortgage-backed securities may be difficult to predict and may result in greater volatility.
Legal Proceedings
Columbia Management Advisors, LLC and Columbia Management Distributors, Inc. (collectively, the "Columbia Group") are subject to a settlement agreement with the New York Attorney General ("NYAG") (the "NYAG Settlement") and a settlement order with the SEC (the "SEC Order") on matters relating to mutual fund trading, each dated February 9, 2005. Under the terms of the SEC Order, the Columbia Group (or predecessor entities) agreed, among other things, to: pay disgorgement and civil money penalties collectively totaling $375 million; cease and desist from violations of the antifraud provisions and certain other provisions of the federal securities laws; maintain certain compliance and ethics oversight structures; and retain an independent consultant to review the Columbia Group's applicable supervisory, compliance, control and other policies and procedures. The NYAG Settlement, among other things, requires Columbia Management Advis ors, LLC and its affiliates to reduce management fees for certain funds in the Columbia family of mutual funds in a projected total of $160 million over five years through November 30, 2009 and to make certain disclosures to investors relating to expenses. In connection with the Columbia Group providing services to the Columbia Funds, the Columbia Funds have voluntarily undertaken to implement certain governance measures designed to maintain the independence of their boards of trustees and certain special consulting and compliance measures.
32
Columbia Asset Allocation Fund II, March 31, 2009
Pursuant to the SEC Order and related procedures, the $375 million in settlement amounts described above, of which approximately $90 million has been earmarked for certain Columbia Funds and their shareholders, is being distributed in accordance with a distribution plan developed by an independent distribution consultant and approved by the SEC on December 27, 2007. Distributions under the distribution plan began in mid-June 2008.
Civil Litigation
In connection with the events that resulted in the NYAG Settlement and SEC Order, various parties filed suits against Bank of America Corporation and certain of its affiliates, including Banc of America Capital Management, LLC ("BACAP," now known as Columbia Management Advisors, LLC) and BACAP Distributors, LLC (now known as Columbia Management Distributors, Inc.) (collectively "BAC"), Nations Funds Trust (now known as Columbia Funds Series Trust) and its Board of Trustees. On February 20, 2004, the Judicial Panel on Multidistrict Litigation transferred these cases and cases against other mutual fund companies based on similar allegations to the United States District Court in Maryland for consolidated or coordinated pretrial proceedings (the "MDL"). Subsequently, additional related cases were transferred to the MDL. On September 29, 2004, the plaintiffs in the MDL filed amended and consolidated complaints. One of these amended complaints is a putative class action that includes claims under the federal securities laws and state common law, and that names Nations Funds Trust, the Trustees, BAC and others as defendants. Another of the amended complaints is a derivative action purportedly on behalf of the Nations Funds Trust against BAC and others that asserts claims under federal securities laws and state common law. Nations Funds Trust is a nominal defendant in this action.
On February 25, 2005, BAC and other defendants filed motions to dismiss the claims in the pending cases. On December 15, 2005, BAC and others entered into a Stipulation of Settlement of the direct and derivative claims brought on behalf of the Nations Funds shareholders. The settlement is subject to court approval. If the settlement is approved, BAC would pay settlement administration costs and fees to plaintiffs' counsel as approved by the court. The stipulation has not yet been presented to the court for approval.
33
Report of Independent Registered Public Accounting Firm
To the Trustees of Columbia Funds Series Trust and the Shareholders of Columbia Asset Allocation Fund II
In our opinion, the accompanying statement of assets and liabilities, including the investment portfolio, and the related statements of operations and of changes in net assets and the financial highlights present fairly, in all material respects, the financial position of Columbia Asset Allocation Fund II (constituting part of Columbia Funds Series Trust, hereafter referred to as the "Fund") at March 31, 2009, the results of its operations for the year then ended, the changes in its net assets for each of the two years in the period then ended and the financial highlights for each of the five years in the period then ended, in conformity with accounting principles generally accepted in the United States of America. These financial statements and financial highlights (hereafter referred to as "financial statements") are the responsibility of the Fund's management. Our responsibility is to express an opinion on these financial sta tements based on our audits. We conducted our audits of these financial statements in accordance with the standards of the Public Company Accounting Oversight Board (United States). Those standards require that we plan and perform the audit to obtain reasonable assurance about whether the financial statements are free of material misstatement. An audit includes examining, on a test basis, evidence supporting the amounts and disclosures in the financial statements, assessing the accounting principles used and significant estimates made by management, and evaluating the overall financial statement presentation. We believe that our audits, which included confirmation of securities at March 31, 2009 by correspondence with the custodian and brokers, provide a reasonable basis for our opinion.
PricewaterhouseCoopers LLP
Boston, Massachusetts
May 22, 2009
34
Federal Income Tax Information (Unaudited)
For non-corporate shareholders 56.29% or the maximum amount allowable under the Jobs and Growth Tax Relief Reconciliation Act of 2003, of ordinary income distributed by the Fund for the period April 1, 2008 to March 31, 2009 may represent qualified dividend income. Find information will be provided in your 2009 Form 1099-DIV.
56.40% of the ordinary income distributed by the Fund, for the year ended March 31, 2009, qualifies for the corporate dividends received deduction.
35
Fund Governance
The Trustees serve terms of indefinite duration. The names, addresses and ages of the Trustees and officers of the Funds in the Columbia Funds Complex, the year each was first elected or appointed to office, their principal business occupations during at least the last five years, the number of Funds overseen by each Trustee and other directorships they hold are shown below. Each officer listed below serves as an officer of each Fund in the Columbia Funds Complex.
Independent Trustees
Name, Address and Year of Birth,
Position with Funds, Year First
Elected or Appointed to Office | | Principal Occupation(s) During Past Five Years, Number of Funds in the Columbia
Funds Complex Overseen by Trustee, Other Directorships Held
| |
| Edward J. Boudreau (Born 1944) | |
|
c/o Columbia Management
Advisors, LLC
One Financial Center
Boston, MA 02111
Trustee (since 2005) | | Managing Director—E.J. Boudreau & Associates (consulting), from 2000 through current; oversees 66; no other directorships held. | |
|
| William P. Carmichael (Born 1943) | |
|
c/o Columbia Management
Advisors, LLC
One Financial Center
Boston, MA 02111
Trustee (since 1999) | | Retired. Oversees 66; Director—Cobra Electronics Corporation (electronic equipment manufacturer); Director—Spectrum Brands, Inc. (consumer products); Director—Simmons Company (bedding); Director—The Finish Line (sportswear). | |
|
| William A. Hawkins (Born 1942) | |
|
c/o Columbia Management Advisors, LLC
One Financial Center
Boston, MA 02111
Trustee (since 2005) | | President and Chief Executive Officer—California General Bank, N.A., from January 2008 through current; President, Retail Banking—IndyMac Bancorp, Inc., from September 1999 to August 2003; oversees 66; no other directorships held. | |
|
| R. Glenn Hilliard (Born 1943) | |
|
c/o Columbia Management Advisors, LLC
One Financial Center
Boston, MA 02111
Trustee (since 2005) | | Chairman and Chief Executive Officer—Hilliard Group LLC (investing and consulting), from April 2003 through current; Non-Executive Director & Chairman—Conseco, Inc. (insurance), September 2003 through current; Executive Chairman—Conseco, Inc. (insurance), August 2004 through September 2005, Chairman and Chief Executive Officer—ING Americas, from 1999 through April 2003; oversees 66; Director—Conseco, Inc. (insurance). | |
|
| John J. Nagorniak (Born 1944) | |
|
c/o Columbia Management
Advisors, LLC
One Financial Center
Boston, MA 02111
Trustee (since 2008)` | | Retired. President and Director—Foxstone Financial, Inc. (consulting), 2000 through December 2007; Director—Mellon Financial Corporation affiliates (investing), 2000 through 2007; Chairman—Franklin Portfolio Associates (investing—Mellon affiliate), 1982 through 2007; oversees 66; Director—MIT Investment Company; Trustee—MIT 401k Plan; Trustee and Chairman—Research Foundation of CFA Institute. | |
|
36
Fund Governance (continued)
Independent Trustees (continued)
Name, Address and Year of Birth,
Position with Funds, Year First
Elected or Appointed to Office | | Principal Occupation(s) During Past Five Years, Number of Funds in the Columbia
Funds Complex Overseen by Trustee, Other Directorships Held
| |
| Anthony M. Santomero (Born 1946) | |
|
c/o Columbia Management Advisors, LLC
One Financial Center
Boston, MA 02111
Trustee (since 2008) | | Richard K. Mellon Professor Emeritus of Finance, The Wharton School, University of Pennsylvania, from 1972 through current; Senior Advisor—McKinsey & Company (consulting), July 2006 through December 2007; President and Chief Executive Officer—Federal Reserve Bank of Philadelphia, 2000 through April 2006; oversees 66; Director—Renaissance Reinsurance Ltd.; Director—Penn Mutual Life Insurance Company; Director—Citigroup. | |
|
| Minor M. Shaw (Born 1947) | |
|
c/o Columbia Management Advisors, LLC
One Financial Center
Boston, MA 02111
Trustee (since 2003) | | President—Micco Corporation, Chairman—The Daniel-Mickel Foundation; oversees 66; Board Member—Piedmont Natural Gas. | |
|
The Statement of Additional Information includes additional information about the Trustees of the Funds and is available, without charge, upon request by calling 800-345-6611.
37
Fund Governance (continued)
Officers
Name, Address and Year of Birth,
Position with Columbia Funds,
Year First Elected or
Appointed to Office | | Principal Occupation(s) During Past Five Years
| |
| J. Kevin Connaughton (Born 1964) | |
|
One Financial Center
Boston, MA 02111
President (since 2009) | | Managing Director of Columbia Management Advisors, LLC since December 2004; Senior Vice President and Chief Financial Officer—Columbia Funds, from June 2008 to January 2009; Treasurer—Columbia Funds, from October 2003 to May 2008; Treasurer—the Liberty Funds, Stein Roe Funds and Liberty All-Star Funds, December 2000—December 2006; Senior Vice President—Columbia Management Advisors, LLC, from April 2003 to December 2004; President—Columbia Funds, Liberty Funds and Stein Roe Funds, February 2004 to October 2004; Treasurer—Galaxy Funds, September 2002 to December 2005; Treasurer, December 2002 to December 2004, and President, February 2004 to December 2004—Columbia Management Multi-Strategy Hedge Fund, LLC; and a senior officer of various other Bank of America-affiliated entities, including other registered and unregistered funds | |
|
| James R. Bordewick, Jr. (Born 1959) | |
|
One Financial Center
Boston, MA 02111
Senior Vice President, Secretary and Chief Legal Officer (since 2006) | | Associate General Counsel, Bank of America since April 2005; Senior Vice President and Associate General Counsel, MFS Investment Management (investment management) prior to April 2005. | |
|
| Linda J. Wondrack (Born 1964) | |
|
One Financial Center
Boston, MA 02111
Senior Vice President and
Chief Compliance Officer (since 2007) | | Director (Columbia Management Group LLC and Investment Product Group Compliance), Bank of America since June 2005; Director of Corporate Compliance and Conflicts Officer, MFS Investment Management (investment management), August 2004 to May 2005; Managing Director, Deutsche Asset Management (investment management) prior to August 2004. | |
|
| Michael G. Clarke (Born 1969) | |
|
One Financial Center
Boston, MA 02111
Senior Vice President and
Chief Financial Officer (since 2009) | | Director of Fund Administration of the Advisor since January 2006; Managing Director of the Advisor September 2004 to December 2005; Vice President Fund Administration June 2002 to September 2004. | |
|
| Jeffrey R. Coleman (Born 1969) | |
|
One Financial Center
Boston, MA 02111
Treasurer (since 2008) | | Director of Fund Administration of the Advisor since January 2006; Fund Controller of the Advisor from October 2004 to January 2006; Vice President of CDC IXIS Asset Management Services, Inc. (investment management) from August 2000 to September 2004. | |
|
| Joseph F. DiMaria (Born 1968) | |
|
One Financial Center
Boston, MA 02111
Chief Accounting Officer (since 2008) | | Director of Fund Administration of the Advisor since January 2006; Head of Tax/Compliance and Assistant Treasurer of the Advisor from November 2004 to December 2005; Director of Trustee Administration (Sarbanes-Oxley) of the Advisor from May 2003 to October 2004. | |
|
38
Fund Governance (continued)
Officers (continued)
Name, Address and Year of Birth,
Position with Columbia Funds,
Year First Elected or
Appointed to Office | | Principal Occupation(s) During Past Five Years
| |
| Julian Quero (Born 1967) | |
|
One Financial Center
Boston, MA 02111
Deputy Treasurer (since 2008) | | Senior Tax Manager of the Advisor since August 2006; Senior Compliance Manager of the Advisor from April 2002 to August 2006. | |
|
| Barry S. Vallan (Born 1969) | |
|
One Financial Center
Boston, MA 02111
Controller (since 2006) | | Vice President—Fund Treasury of the Advisor since October 2004; Vice President—Trustee Reporting of the Advisor from April 2002 to October 2004. | |
|
39
Board Consideration and Re-Approval of Investment Advisory Agreement
The Board of Trustees of Columbia Funds Series Trust (the "Board"), including a majority of the Trustees who have no direct or indirect interest in the investment advisory agreement and are not "interested persons" of the Trust, as defined in the Investment Company Act of 1940 (the "1940 Act") (the "Independent Trustees"), are required annually to review and re-approve the existing investment advisory agreement and approve any newly proposed terms therein. In this regard, the Board reviewed and re-approved, during the most recent six months covered by this report, the investment advisory agreement with Columbia Management Advisors, LLC ("CMA") for Columbia Asset Allocation Fund II (the "Fund"). The investment advisory agreement with CMA is referred to as an "Advisory Agreement."
More specifically, at meetings held on November 10-11, 2008, the Board, including the Independent Trustees advised by their independent legal counsel, considered the factors and reached the conclusions described below relating to the selection of CMA and the re-approval of the Advisory Agreement. The Board also reviewed and considered a report prepared and provided by the Independent Fee Consultant (the "Consultant") appointed by the Independent Trustees pursuant to an assurance of discontinuance entered into with the New York Attorney General ("NYAG") to settle a civil complaint filed by the NYAG relating to trading in mutual fund shares (the "NYAG Settlement"). During the fee review process, the Consultant's role was to manage the review process to ensure that fees are negotiated in a manner that is at arms' length and reasonable. The Consultant found that the fee negotiation process was, to the extent practicable, at arms' le ngth and reasonable and consistent with the requirements of the NYAG Settlement. A summary of the Consultant's report is available at www.columbiafunds.com.
In preparation for the November meetings, the Board met in August for review and discussion of the materials described below. The Investment Committee of the Board also met in June to discuss the Fund's performance with its portfolio manager(s). In addition to these meetings, the Investment Committee receives and discusses performance reports at its quarterly meetings. The Contracts Review Committee also provided support in managing and coordinating the process by which the Board reviewed the Advisory Agreement. The Board's review and conclusions are based on comprehensive consideration of all information presented to them and are not the result of any single controlling factor.
Nature, Extent and Quality of Services
The Board received and considered various data and information regarding the nature, extent and quality of services provided to the Fund by CMA under the Advisory Agreement. The most recent investment adviser registration forms ("Forms ADV") for CMA were made available to the Board, as were CMA's responses to a detailed series of requests submitted by the Independent Trustees' independent legal counsel on behalf of such Trustees. The Board reviewed and analyzed those materials, which included, among other things, information about the background and experience of senior management and investment personnel of CMA.
In addition, the Board considered the investment and legal compliance programs of the Fund and CMA, including their compliance policies and procedures and reports of the Fund's Chief Compliance Officer.
The Board evaluated the ability of CMA, based on its resources, reputation and other attributes, to attract and retain qualified investment professionals, including research, advisory and supervisory personnel. In this regard, the Board considered information regarding CMA's compensation program for its personnel involved in the management of the Fund. The Board also considered CMA's investment in further developing its research and trading departments.
Based on the above factors, together with those referenced below, the Board concluded that they were satisfied with the nature, extent and quality of the investment advisory services provided to the Fund by CMA.
Fund Performance and Expenses
The Board considered the performance results for the Fund over multiple measurement periods. They also considered these results in comparison to the performance results of the group of funds that was determined by Lipper Inc. ("Lipper") to be the most similar to the Fund (the "Peer Group") and to the performance of a broader universe of relevant funds as determined by Lipper (the "Universe"), as well as to the Fund's benchmark index. Lipper is an independent provider of investment company data. The Board was provided with a description of the methodology used by Lipper to select the mutual funds in the Fund's Peer Group and Universe and
40
considered potential imprecision resulting from the selection methodology. The Board also considered certain risk-adjusted performance data.
The Board received and considered statistical information regarding the Fund's total expense ratio and its various components, including contractual advisory fees, actual advisory fees, actual non-management fees, Rule 12b-1 and non-Rule 12b-1 service fees, fee waivers/caps and/or expense reimbursements. The Board also considered comparisons of these fees to the expense information for the Fund's Peer Group and Universe, which comparative data was provided by Lipper. Lipper determined that the composition of the Peer Group and/or Universe for expenses would differ from the composition for performance to provide a more accurate basis of comparison. The Board also considered Lipper data that ranked the Fund based on: (i) the Fund's one-year performance compared to actual management fees; (ii) the Fund's one-year performance compared to total expenses; (iii) the Fund's three-year performance compared to actual management fees; and (iv) the Fund's three-year performance compared to total expenses.
Investment Advisory Fee Rates
The Board reviewed and considered the proposed contractual investment advisory fee rate together with the administration fee rate payable by the Fund to CMA for investment advisory services (the "Contractual Management Rate"). In addition, the Board reviewed and considered the proposed fee waiver/cap arrangements applicable to the Contractual Management Rate and considered the Contractual Management Rate after taking the waivers/caps into account (the "Actual Management Rate"). The Board noted that, on a complex-wide basis, CMA had reduced annual management fees by at least $32 million per year pursuant to the NYAG Settlement. The Board also noted reductions in net advisory rates and/or total expenses of certain funds across the fund complex. Additionally, the Board received and afforded specific attention to information comparing the Contractual Management Rate and Actual Management Rate with those of the other funds in the Fun d's Peer Group.
The Board concluded that the factors noted above supported the Contractual Management Rate and the Actual Management Rate, and the approval of the Advisory Agreement for the Fund.
Profitability
The Board received and considered a detailed profitability analysis of CMA based on the Contractual Management Rate, as well as on other relationships between the Fund and other funds in the complex on the one hand and CMA affiliates on the other. The analysis included complex-wide and Fund information and a comparison of results using alternative allocation methodologies. The Board concluded that, in light of the costs of providing investment management and other services, the profits and other ancillary benefits that CMA and its affiliates received from providing these services were not unreasonable.
Economies of Scale
The Board received and considered information regarding whether there have been economies of scale with respect to the management of the Fund, whether the Fund has appropriately benefited from any economies of scale and whether there is potential for realization of any further economies of scale. Most particularly, CMA provided information showing that, as a percentage of fund assets, CMA's complex-wide revenues, expenses and profits declined over a four-year period during which fund assets increased by 39% and the shareholder benefit over a two-year period increased from 33% to 41% of the Adviser's total profits. The Board concluded that any potential economies of scale are shared fairly with Fund shareholders, most particularly through CMA's assumption of certain Fund expenses.
The Board acknowledged the inherent limitations of any analysis of an investment adviser's economies of scale, stemming largely from the Board's understanding that economies of scale are realized, if at all, by an investment adviser across a variety of products and services, not just with respect to a single fund.
Information About Services to Other Clients
The Board also received and considered information about the nature and extent of services and fee rates offered by CMA to its other clients, including separate accounts and institutional investors. In this regard, the Board concluded that, where the Contractual Management Rate and Actual Management Rate were appreciably above the range of the fee rates offered to other CMA clients, based on information provided by CMA, the costs associated with managing and operating a
41
registered investment company provided a justification for the higher fee rates charged to the Fund.
Other Benefits to CMA
The Board received and considered information regarding any "fall-out" or ancillary benefits received by CMA and its affiliates as a result of their relationship with the Fund. Such benefits could include, among others, benefits attributable to CMA's relationships with the Fund (such as soft-dollar credits) and benefits potentially derived from an increase in CMA's business as a result of their relationship with the Fund (such as the ability to market to shareholders other financial products offered by CMA and its affiliates).
The Board considered the effectiveness of the policies of the Fund in achieving the best execution of portfolio transactions, whether and to what extent soft dollar credits are sought and how any such credits are utilized, any benefits that may be realized by using an affiliated broker, the extent to which efforts are made to recapture transaction costs, and the controls applicable to brokerage allocation procedures. The Board concluded that the benefits were not unreasonable.
Other Factors and Broader Review
As discussed above, the Board reviews materials received from CMA annually as part of the re-approval process under Section 15(c) of the 1940 Act. The Board also reviews and assesses the quality of the services the Fund receives throughout the year. In this regard, the Board and its Committees review reports of CMA at each of their quarterly meetings, which include, among other things, Fund performance reports. In addition, the Board and its Committees confer with portfolio managers at various times throughout the year including, most particularly, in the June Investment Committee meeting.
Conclusion
After considering the above-described factors, based on their deliberations and their evaluation of the information provided, the Board concluded that the compensation payable to CMA under the Advisory Agreement is fair and equitable. Accordingly, the Board unanimously re-approved the Advisory Agreement.
42
Summary of Management Fee Evaluation by
Independent Fee Consultant
EXCERPTS FROM REPORT OF INDEPENDENT FEE CONSULTANT TO THE FUNDS SUPERVISED BY THE COLUMBIA NATIONS BOARD
Prepared pursuant to the February 9, 2005
Assurance of Discontinuance among the
Office of Attorney General of New York State,
Columbia Management Advisors, LLC and
Columbia Management Distributors, Inc.
November 12, 2008
I. Overview
On February 9, 2005, Columbia Management Advisors, LLC ("CMA") and Columbia Management Distributors, Inc.1 ("CMD") agreed to the New York Attorney General's Assurance of Discontinuance ("AOD"). Among other matters, the AOD stipulates that CMA may manage or advise a Columbia Fund ("Columbia Fund" and together with all such funds or a group of such funds as the "Columbia Funds") only if the Independent Members of the Columbia Fund's Board of Trustees appoint a Senior Officer or retain an Independent Fee Consultant ("IFC") who is to manage the process by which proposed management fees are negotiated. The AOD further stipulates that the Senior Officer or IFC is to prepare a written annual evaluation of the fee negotiation process.
With effect from January 1, 2007, the Independent Members of the Board of Trustees for certain Columbia Funds known collectively as the "Nations Funds" (the "Trustees") retained me as IFC for the Nations Funds.2 In this capacity, I have prepared the fourth annual written evaluation of the fee negotiation process. As was the case with last year's report (the "2007 Report") my immediate predecessor as IFC, John Rea, provided invaluable assistance in the preparation of this year's report.
A. Role of the Independent Fee Consultant
The AOD charges the IFC with "managing the process by which proposed management fees...to be charged the Columbia Fund are negotiated so that they are negotiated in a manner which is at arms' length and reasonable and consistent with this Assurance of Discontinuance." The AOD also provides that CMA "may manage or advise a Columbia Fund only if the reasonableness of the proposed management fees is determined by the Board of Trustees...using...an annual independent written evaluation prepared by or under the direction of...the Independent Fee Consultant." Therefore, the AOD makes clear that the IFC does not supplant the Trustees in negotiating management fees with CMA, nor does the IFC substitute his or her judgment for that of the Trustees with respect to the reasonableness of proposed fees or any other matter that is committed to the business judgment of the Trustees.
B. Elements Involved in Managing the Fee Negotiation Process
In preparing the report required by the AOD, the IFC must consider at least the following six factors set forth in the AOD:
1. The nature and quality of CMA's services, including the Fund's performance;
2. Management fees (including any components thereof) charged by other mutual fund companies for like services;
3. Possible economies of scale as the Fund grows larger;
4. Management fees (including any components thereof) charged to institutional and other clients of CMA for like services;
5. Costs to CMA and its affiliates of supplying services pursuant to the management fee agreements, excluding any intra-corporate profit; and
6. Profit margins of CMA and its affiliates from supplying such services.
C. Organization of the Annual Evaluation
This report, like last year's, focuses on the six factors and contains a section for each factor except that CMA's costs and profits from managing the Funds have been combined into a single section. In addition to a discussion of these factors, the report offers recommendations to improve the fee review process in future years. A review of the status of recommendations made in the 2007 Report is being provided separately with the materials for the November meeting.
1 CMA and CMD are subsidiaries of Columbia Management Group, LLC ("CMG"), and are the successors to the entities named in the AOD.
2 I have no material relationship with Bank of America, CMG or any of its affiliates, aside from serving as IFC, and I am aware of no material relationship with any of their affiliates. I retained John Rea, an independent economic consultant, to assist me with this report.
Unless otherwise stated or required by the context, this report covers only the Nations Funds, which are also referred as the "Funds."
43
II. Summary of Findings
A. General
1. Based upon my examination of the information supplied by CMG in the light of the six factors set forth in the AOD, I conclude that the Trustees have the relevant information necessary to evaluate the reasonableness of the proposed management fees for each Nations Fund.
2. In my view, the process by which the proposed management fees of the Funds have been negotiated in 2008 thus far has been, to the extent practicable, at arms' length and reasonable and consistent with the AOD.
B. Nature and Quality of Services, Including Performance
3. The performance of the Funds has been relatively good for the most recent 1-, 3- and 5-year periods. The strongest records were posted by the Funds in the Active Equity and Quantitative Strategies Groups and by the sub-advised Funds. The 5-year performance rankings of the subadvised Funds were particularly strong, with all such Funds in the top two performance quintiles.
4. The 1- and 3-year performance records of the Funds declined slightly from 2007 to 2008, while the 5-year performance records improved year-over-year. Most Funds changed their 1-year performance quintile year-over-year, while the 5-year rankings were, as expected, much more stable, with less than half the Funds moving to a different 5-year performance quintile.
5. The performance of the actively-managed equity and sub-advised Funds against their benchmarks was strong, especially for the 1- and 3-year performance periods. However, no fixed-income Fund with a reliable benchmark exceeded it on a net basis in any performance period. Money market Funds do not have such benchmarks and therefore were excluded from this analysis.
6. The Nations equity Funds' overall performance adjusted for risk was strong. The performance of 13 of the 19 actively-managed Funds included in the risk analysis bettered the median in 3-year performance adjusted and unadjusted for risk. No relationship between risk and return was detected for fixed-income Funds.
7. The industry-standard procedure used by third parties such as Lipper and Morningstar to construct the performance universe in which each Fund's performance is ranked relative to comparable funds tends to bias a Fund's ranking upward within that universe. The bias occurs because either no-12b-1-fee or A share classes of the Funds are compared to the performance universe that includes all share classes of competitive multi-class funds. Therefore, the procedure ranks shares with zero or 25 basis point 12b-1 fees against classes of competitive funds with 12b-1 fees of up to 100 basis points. Correcting this bias by limiting the performance universe to classes of competitive funds with comparable 12b-1 fees in most cases lowers the relative performance for the Funds but does not call into question the general finding that the Nations Funds' performance has been strong.
8. A small number of Funds have consistently underperformed their peers in each of the past four years, depending on the exact criteria used to measure long-term underperformance. For example, one Fund has had below-median 1- and 3-year performance in each of the past four years; one additional Fund had below-median 3-year performance for those years.
9. The services performed by CMG professionals beyond portfolio management, such as compliance, legal, information technology, risk management, finance and fund administration, are critical to the success of the Funds and appear to be of high quality.
C. Management Fees Charged by Other Mutual Fund Companies
10. The Funds' management fees and total expenses are generally low relative to those of their peers, with the exception of subadvised Funds. Almost two-third of the Funds ranked in the two least expensive quintiles for total expenses and just over half were in those quintiles for actual management fees. Funds with lower actual management fees tended to have lower relative total expenses. All fixed-income Funds had total expenses in the two least expensive quintiles.
11. Generally, the Nations Funds with the highest relative fees and expenses are sub-advised. All eight Nations Funds with fifth-quintile total expense rankings were sub-advised. The actual management fees of 11 of the 14 sub-advised
44
Funds were in the fourth and fifth quintile. The average management fees of the sub-advised Funds were typically 20 points higher than internally-managed equity Funds. CMA presented data suggesting that such differentials were consistent with industry practice.
12. The management fees of the internally-advised Nations Funds are generally in line with those of Columbia Funds overseen by the Atlantic and Acorn/Wanger Boards of Trustees.
D. Trustees' Fee and Performance Evaluation Process
13. The Trustees' evaluation process identified 20 Funds in 2008 for further review based upon their relative performance or expenses or both. When compared in filtered universes, three more Funds met the criteria for review.
E. Potential Economies of Scale
14. CMG has prepared a memo for the Trustees containing its views on the sources and sharing of potential economies of scale. CMG views economies of scale as arising at the complex level and would regard estimates of scale economies for individual funds as unreliable. In its analysis, CMG did not identify specific sources of economies of scale or provide any estimates of any economies of scale that might arise from future asset growth. CMG's analysis included measures taken by the Trustees and CMG that seek to share any potential economies of scale through breakpoints in management fee schedules, expense reimbursements, fee waivers, enhanced shareholder services, fund mergers, and operational consolidation.
15. An examination of the management fee schedules of a selected number of the Nations Funds suggests that, as a general matter, the breakpoint schedules of these Funds are not out of line with those of competitors. A similar examination of five other Nations Funds in 2007 led to the same conclusion.
F. Management Fees Charged to Institutional Clients
16. CMG has provided Trustees with comparisons of mutual fund management fees and institutional fees based upon standardized fee schedules and actual fees. The results show that, consistent with industry practice, institutional fees are generally lower than the Funds' management fees. However, because the services provided and risks borne by the manager are more extensive for mutual funds than for institutional accounts, the differences are of limited value in assisting the Trustees in their review of the reasonableness of the Funds' management fees.
G. Revenues, Expenses, and Profits
17. The activity-based cost allocation methodology ("ABC") employed by CMG to allocate costs for purposes of calculating Fund profitability, both direct and indirect, for purposes of calculating Fund profitability is thoughtful and detailed. For comparison, CMG proposed a change to the method by which indirect expenses were allocated. Under this "hybrid" method, such costs are allocated to Funds 50% by assets and 50% per fund. Allocating indirect expenses equally to each Fund has an intuitive logic, as each Fund regardless of size has certain expenses, such as preparing and printing prospectuses and financial statements.
18. The materials provided on CMG's revenues and expenses with respect to the Funds and the methodology underlying their construction generally form a sufficient basis for Trustees to evaluate CMG's expenses and profitability for each Fund.
19. In 2007, CMG's complex-wide pre-tax margins on the Nations Funds were close to the industry average before distribution and below average when distribution revenues and expenses were included, based on limited data available about publicly-held mutual fund managers. However, as is to be expected in a complex comprising 65 Funds, some Nations Funds have higher pre-tax profit margins, when calculated solely with respect to management revenues and expenses, while other Nations Funds operate at a loss. A pro forma analysis of the complex's profitability taking into account expenses incurred in 2008 associated with support of the money market funds sharply reduced the profitability of the Nations Funds. There is a positive relationship between fund size and profitability, with smaller Funds generally operating at a loss.
45
20. CMG shares a fixed percentage of its management fee revenues with an affiliate, U.S. Trust, Bank of America Private Wealth Management, to compensate that affiliate for services it performs with respect to Nations Fund assets held for the benefit of its customers. Based on our analysis of the services provided by the affiliate, we believe all such payments should be regarded as a distribution expense, except for any portion attributable to payments by CMG for performance of sub-transfer agency or sub-accounting functions.
III. Recommendations
1) Criteria for review. The Trustees may wish to consider modifying the criteria for classifying a fund as a "Review Fund" to include criteria that focus exclusively on performance without regard to expense or fee levels. For example, a Fund whose one-year or three-year performance was median or below for four consecutive years could be treated as a Review Fund. Applying such criteria would add two Funds to the list of Review Funds.
2) Profitability data. CMG should present to the Trustees each year the profitability of each Fund, each investment style, and each complex (of which Nations is one) calculated as follows:
Exhibit 1. Management-only profitability should be calculated without reference to any Private Bank expense.
Exhibit 2. Profitability excluding distribution (which essentially covers the management and transfer agency functions) should be adjusted by removing from the expense calculation any portion of the Private Bank payment not attributable to the performance by the Private Bank of sub-transfer agency or sub-accounting functions.
Exhibit 3. Total profitability, including distribution: No adjustment for Private Bank expenses should be made, because all such expenses represent legitimate fund expenses to be taken into account in calculating CMG's profit margin including distribution.
Exhibit 4. Distribution only: This should include all Private Bank expenses other than those attributable to sub-transfer agency services.
Therefore, the following data need not be provided:
1. Adjusting total profitability data for Private Bank expenses
2. Adjusting profitability excluding distribution by backing out all Private Bank expenses.
3) Economies of scale. CMG and the IFC should continue to work on methods for more precisely quantifying to the extent possible the sources and magnitude of any economies of scale as CMG's mutual fund assets under management increase, to the extent that the data allows for meaningful year-over-year comparisons. The framework suggested in Section IV.D.4 may prove to be a useful model for such an analysis.
4) Competitive breakpoint analysis. As part of the annual fee evaluation process, the breakpoints of a select group of Nations Funds (which would differ each year) should continue to be compared to those of industry rivals to ensure that the Funds' breakpoint schedules remain within industry norms. As breakpoint schedules change relatively little each year, performing such a comparison for all Funds each year would not be an efficient use of Trustee and CMG resources.
5) Cost allocation methodology. CMG's point that the current ABC system of allocating indirect expenses creates anomalous results in several cases, including sub-advised Funds, is well-taken. We would like to work with CMG over the forthcoming year on alternatives to the current system of allocating indirect expenses that (1) resolve the anomalies, (2) limit the amount of incremental effort on CMG's part and (3) remain faithful to the general principle that expenses should be allocated by time and effort to the extent reasonably possible.
6) Management fee disparities. CMG and the Nations Trustees, as part of any future study of management fees, should analyze any differences in management fee schedules between Funds managed in similar investment styles. As part of that analysis, CMG should provide an explanation for any significant fee differences among comparable funds
46
across fund families managed by CMA, such as differences in the management styles of different Funds included the same Lipper category. Finally, whenever CMG proposes a management fee change or an expense cap for any mutual fund managed by CMA that is comparable to any Nations Fund, CMG should provide the Trustees with sufficient information about the proposal to allow the Trustees to assess the applicability of the proposed change to the relevant Nations Fund or Funds.
7) Tax-exempt Fund expense data. The expense rankings of certain tax-exempt Funds were adversely affected by including certain investment-related interest expenses that Lipper excluded in calculating the expense ratios of competitors. We recommend that CMG follow the Lipper practice and exclude such interest expenses from data submitted to Lipper to avoid unfairly disadvantaging the tax-exempt Funds.
8) Reduction of volume of paper documents submitted. The effort to rationalize and simplify the data presented to the Trustees and the process by which that data was prepared and organized was regarded as a success by all parties. We should continue to look for opportunities to reduce and simplify the presentation of 15(c) data, especially in the area of Fund and manager profitability. The Fund "Dashboard" volume presents a large volume of Fund data on a single page. If it is continued, the Trustees may wish to consider receiving the underlying Lipper data on CD, rather than the current paper volumes.
* * *
Respectfully submitted,
Steven E. Asher
47
This page intentionally left blank.
Important Information About This Report
The fund mails one shareholder report to each shareholder address. If you would like more than one report, please call shareholder services at 1-800-345-6611 and additional reports will be sent to you. This report has been prepared for shareholders of Columbia Asset Allocation Fund II.
A description of the policies and procedures that the fund uses to determine how to vote proxies and a copy of the fund's voting records are available (i) at www.columbiamanagement.com; (ii) on the Securities and Exchange Commission's website at www.sec.gov, and (iii) without charge, upon request, by calling 1-800-368-0346. Information regarding how the fund voted proxies relating to portfolio securities during the 12-month period ended June 30 is available from the SEC's website. Information regarding how the fund voted proxies relating to portfolio securities is also available from the fund's website, www.columbiamanagement.com.
The fund files a complete schedule of portfolio holdings with the SEC for the first and third quarters of each fiscal year on Form N-Q. The fund's Form N-Q is available on the SEC's website at www.sec.gov and may be reviewed and copied at the SEC's Public Reference Room in Washington, DC. Information on the operation of the Public Reference Room may be obtained by calling 1-800-SEC-0330.
Please read and consider the investment objectives, risks, charges and expenses for any fund carefully before investing. For a prospectus which contains this and other important information about a fund, contact your Columbia Management representative or financial advisor or go to www.columbiamanagement.com.
Columbia Management Group, LLC ("Columbia Management") is the investment management division of Bank of America Corporation. Columbia Management entities furnish investment management services and products for institutional and individual investors. Columbia Funds are distributed by Columbia Management Distributors, Inc., member of FINRA, SIPC, part of Columbia Management and an affiliate of Bank of America Corporation.
| Transfer Agent | |
|
Columbia Management Services, Inc.
P.O. Box 8081
Boston, MA 02266-8081
1-800-345-6611 | |
|
| Distributor | |
|
Columbia Management
Distributors, Inc.
One Financial Center
Boston, MA 02111 | |
|
| Investment Advisor | |
|
Columbia Management Advisors, LLC
100 Federal Street
Boston, MA 02110 | |
|
49
Columbia Management®
One Financial Center
Boston, MA 02111-2621
PRSRT STD
U.S. Postage
PAID
Holliston, MA
Permit NO. 20
Columbia Management®
Columbia Asset
Allocation Fund II
Annual Report, March 31, 2009
©2009 Columbia Management Distributors, Inc.
One Financial Center, Boston, MA 02111-2621
800-345-6611 www.columbiafunds.com
SHC-42/10813-0309 (05/09) 09/79009
Columbia Management®
Annual Report
March 31, 2009
Corporate Bond Funds
g Columbia Total Return Bond Fund
g Columbia Short Term Bond Fund
g Columbia High Income Fund
| NOT FDIC INSURED | | May Lose Value | |
|
| NOT BANK ISSUED | | No Bank Guarantee | |
|
Table of Contents
| Economic Update | | | 1 | | |
|
Columbia Total Return
Bond Fund | | | 3 | | |
|
Columbia Short Term
Bond Fund | | | 8 | | |
|
| Columbia High Income Fund | | | 13 | | |
|
| Financial Statements | | | | | |
|
| Investment Portfolios | | | 18 | | |
|
Statements of Assets and
Liabilities | | | 54 | | |
|
| Statements of Operations | | | 56 | | |
|
Statements of Changes in
Net Assets | | | 58 | | |
|
| Financial Highlights | | | 62 | | |
|
| Notes to Financial Statements | | | 74 | | |
|
Report of Independent Registered
Public Accounting Firm | | | 88 | | |
|
| Fund Governance | | | 89 | | |
|
Board Consideration and
Re-Approval of Investment
Advisory and Sub-Advisory
Agreements | | | 93 | | |
|
Summary of Management Fee
Evaluation by Independent
Fee Consultant | | | 96 | | |
|
Important Information About
This Report | | | 101 | | |
|
The views expressed in this report reflect the current views of the respective parties. These views are not guarantees of future performance and involve certain risks, uncertainties and assumptions that are difficult to predict so actual outcomes and results may differ significantly from the views expressed. These views are subject to change at any time based upon economic, market or other conditions and the respective parties disclaim any responsibility to update such views. These views may not be relied on as investment advice and, because investment decisions for a Columbia Fund are based on numerous factors, may not be relied on as an indication of trading intent on behalf of any particular Columbia Fund. References to specific company securities should not be construed as a recommendation or investment advice.
President's Message

Dear Shareholder:
Recent events have shown great volatility in the markets and uncertainty in the economy. During these challenging times, it becomes even more important to focus on long-term horizons and key investment tools that can help manage volatility. This may be the time to reflect on your investment goals and evaluate your portfolio to ensure you are positioned for any potential market rebound.
A long-term financial plan can serve as a road map and guide you through the necessary steps designed to meet your financial goals. Your financial plan should take into account your investment goals, time horizon, overall financial situation, risk tolerance and willingness to ride out market volatility. Your investment professional can be a key resource as you work through this process. The knowledge and experience of an investment professional can help as you create or reevaluate your investment strategy.
The importance of diversification
Although diversification does not ensure a profit or guarantee against loss, a diversified portfolio can be a strategy for successful long-term investing. Diversification refers to the mix of investments within a portfolio. A mutual fund can contribute to portfolio diversification given that a mutual fund's portfolio represents several investments. Additionally, the way you allocate your money among stocks, bonds and cash, and geographically between foreign and domestic investments, can help to reduce risks. Diversification can result in multiple investments where the positive performance of certain holdings can offset any negative performance from other holdings. Having a diversified portfolio doesn't mean that the value of the portfolio will never go down, but rather helps strike a balance between risk and reward.
Reevaluate your strategy
An annual review of your investments is a key opportunity to determine if your investment needs have changed or if you need minor adjustments to rebalance your portfolio. Life events like a birth, marriage, home improvement, or change in employment can have a major affect on your spending and goals. Ask yourself how your spending or goals have changed and factor this into your financial plan. Are you using automated investments or payroll deductions to help keep your savings on track? Are you able to set aside additional savings or increase your 401(k) plan contributions? If during your review you find that your investments in any one category (e.g., stocks, bonds or cash) have grown too large based on your diversification plan, you may want to consider redirecting future investments to get back on track.
History has shown that the U.S. stock market has been remarkably resilient1. Volatility can lead to opportunity. Patience and a commitment to your long-term financial plan may position you to potentially benefit over your investment horizon. We appreciate your business and continued support of Columbia Funds.
Sincerely,

J. Kevin Connaughton
President, Columbia Funds
The board of trustees elected J. Kevin Connaughton president of Columbia Funds on January 16, 2009.
1The Dow Jones Industrial Average is the most widely used indicator of the overall condition of the stock market. The Dow Jones Industrial Average Index is a price-weighted average of 30 actively traded blue-chip stocks as selected by the editors of the Wall Street Journal. Indices are not investments, do not incur fees or expenses and are not professionally managed. It is not possible to invest directly in an index.
Economic Update – Corporate Bond Funds
Economic growth ground to a halt during the 12-month period that began April 1, 2008 and ended March 31, 2009. The National Bureau of Economic Research reported that the U.S. economy had slipped into recession late in 2007 and the downturn was even sharper than anticipated.
A host of factors weighed on consumers and businesses alike. The most severe housing downturn in decades showed few signs of abating as inventories of homes for sale rose, home prices declined and tighter credit standards, the result of continued turmoil in the subprime mortgage market, made it more difficult for homebuyers to qualify for loans. The labor market has contracted for 15 consecutive months, driving the unemployment rate to 8.5%. More than five million jobs have been lost since the recession commenced late in 2007, with nearly two-thirds of the decrease occurring in the most recent five months. Manufacturing activity slowed and consumer spending declined, resulting in one of the weakest holiday seasons in decades.
However, in March there were a few signs that this severe recession is no longer intensifying. Weekly chain store sales and mortgage purchase applications gained some momentum near the end of the period. The trade deficit has narrowed more than expected, raising hopes that first quarter real GDP would contract at a rate well below the fourth quarter's negative 6.3%.
A weakening economy and turmoil in the financial markets took a toll on consumer confidence, which continued to set new all-time lows during the period. However, the monthly Conference Board gauge was nearly unchanged in March, another indication that the worst could be behind us.
In an effort to restore confidence in the capital markets, loosen the reins on credit and shore up economic growth, the Federal Reserve Board (the Fed) brought a key short-term rate—the federal funds rate—down from 2.25% to a target between zero and 0.25% during the 12-month period—a record low. However, the Fed's efforts went largely unrewarded. The one bright spot during this period of uncertainty was lower energy and commodity prices. With oil trading near $50 per barrel at the end of the period, gasoline prices have come down from $4 per gallon or more last summer to just over $2 per gallon in recent months.
Some bond market segments delivered positive returns
The U.S. bond market seesawed during the 12-month period, but several sectors managed to deliver modest gains as investors sought refuge from the volatile stock market. Treasury prices rose and yields declined as the economy faltered and stock market volatility increased. The benchmark 10-year U.S. Treasury yield ended the period at 2.70%. In this environment, the Barclays Capital U.S. Aggregate Bond Index1 (formerly the Lehman Brothers U.S. Aggregate Bond Index) returned 3.13%. High-yield bond prices fell sharply as economic prospects weakened and default fears rose. The Merrill Lynch U.S. High Yield, Cash Pay Index2 returned negative 19.95%. The municipal
1The Barclays Capital U.S. Aggregate Bond Index is a market value-weighted index that tracks the daily price, coupon, pay-downs and total return performance of fixed-rate, publicly placed, dollar-denominated and nonconvertible investment-grade debt issues with at least $250 million par amount outstanding and with at least one year to final maturity.
2The Merrill Lynch U.S. High Yield, Cash Pay Index tracks the performance of non-investment-grade corporate bonds. As of 01/01/2009, Merrill Lynch & Co., Inc. is a wholly-owned subsidiary of Bank of America Corporation and an affiliate of Columbia Management.
Summary
For the 12-month period that ended March 31, 2009
g Despite volatility in many segments of the bond market, the Barclays Capital U.S. Aggregate Bond Index delivered a modest gain. High-yield bonds lost ground, as measured by the Merrill Lynch U.S. High Yield, Cash Pay Index. Municipals recovered from an early setback, as measured by the Barclays Capital Municipal Bond Index.
Barclays
Aggregate Index | | Merrill
Lynch Index | |
|
 | |  | |
|
Barclays
Municipal Index | |
| |
|
 | | | |
|
g The broad U.S. stock market, as measured by the S&P 500 Index, returned negative 38.09%. Stock markets outside the United States returned negative 46.51%, as measured (in U.S. dollars) by the MSCI EAFE Index.
| S&P Index | | MSCI Index | |
|
 | |  | |
|
1
Economic Update (continued) – Corporate Bond Funds
market suffered a setback early in 2008, then rebounded in the first quarter of 2009. The Barclays Capital Municipal Bond Index3 returned 2.27% for the 12-month period.
Stocks retreat as economic outlook darkens
Against a weakening economic backdrop, the U.S. stock market lost 38.09% for the 12-month period, as measured by the S&P 500 Index.4 Losses affected the stocks of companies of all sizes and investment style categories, although growth stocks held up better than value stocks, as measured by their respective Russell indices.5 Stock markets outside the U.S. suffered even greater losses. The MSCI EAFE Index,6 a broad gauge of stock market performance in foreign developed markets, lost 46.51% (in U.S. dollars) for the period. Emerging stock markets, which generally have had a strong run over the past several years, were also caught in the downdraft. As investors backed away from risk, the MSCI Emerging Markets Index7 returned negative 47.07% (in U.S. dollars).
Past performance is no guarantee of future results.
3The Barlcays Capital Municipal Bond Index is considered representative of the broad market for investment-grade, tax-exempt bonds with maturities of at least one year.
4The Standard & Poor's (S&P) 500 Index tracks the performance of 500 widely held, large-capitalization U.S. stocks.
5The Russell 1000 Growth Index measures the performance of those Russell 1000 Index companies with higher price-to-book ratios and higher forecasted growth values. The Russell 1000 Value Index measures the performance of those companies in the Russell 1000 Index with lower price-to-book ratios and lower forecasted growth values. The Russell 2000 Growth Index measures the performance of those Russell 2000 Index companies with higher price-to-book ratios and higher forecasted growth values. The Russell 2000 Value Index measures the performance of those Russell 2000 Index companies with lower price-to-book ratios and lower forecasted growth values. The Russell 3000 Growth Index measures the performance of those Russell 3000 Index companies with higher price-to-book ratios and higher forecasted growth values. The Russell 3000 Value Index measures the performance of those Russell 3000 Index companies with lower price-to-bo ok ratios and lower forecasted growth values. The Russell Midcap Growth Index measures the performance of those Russell Midcap companies with higher price-to-book ratios and higher forecasted growth values. The Russell Midcap Value Index measures the performance of those Russell Midcap Index companies with lower price-to-book ratios and lower forecasted growth values.
6The Morgan Stanley Capital International (MSCI) Europe, Australasia, Far East (EAFE) Index is a free float-adjusted market capitalization index that is designed to measure developed market equity performance, excluding the U.S. and Canada.
7The Morgan Stanley Capital International (MSCI) Emerging Markets Index is a widely accepted index composed of a sample of companies from 25 countries representing the global emerging stock markets.
Indices are not available for investment, and do not reflect sales charges, fees, brokerage commissions, taxes or other expenses of investing. Securities in the fund may not match those in an index.
2
Fund Profile – Columbia Total Return Bond Fund
Summary
g For the 12-month period that ended March 31, 2009, the fund's Class A shares returned negative 3.45% without sales charge.
g The fund underperformed its benchmark, the Barclays Capital U.S. Aggregate Bond Index1 (formerly Lehman Brothers U.S. Aggregate Bond Index), whose conservative composition excluded some of the weakest performing segments of the market and was a good match for the risk-averse investment environment that prevailed during the period.
g The fund outperformed its peer group average we believe because of its quality orientation within non-Treasury market segments.
Portfolio Management
Alexander D. Powers has co-managed the fund since December 2007 and has been with the advisor or its predecessors since July 1996.
Jonathan P. Carlson has co-managed the fund since December 2007 and has been with the advisor or its predecessors since June 2007.
Carl W. Pappo has co-managed the fund since November 2006 and has been with the advisor or its predecessors since 1993.
Lee Reddin has co-managed the fund since December 2007 and has been with the advisor or its predecessors since 2000.
Kevin L. Cronk has co-managed the fund since November 2004 and has been with the advisor or its predecessors since 1999.
Laura Ostrander has co-managed the fund since November 2004 and has been with the advisor or its predecessors since 1996.
1The Barclays Capital U.S. Aggregate Bond Index is a market value-weighted index that tracks the daily price, coupon, pay-downs and total return performance of fixed-rate, publicly placed, dollar-denominated and non-convertible investment grade debt issues with at least $250 million par amount outstanding and with at least one year to final maturity. Indices are not available for investment, and do not reflect sales charges, fees, brokerage commissions, taxes or other expenses of investing. Securities in the fund may not match those in an index.
Performance data quoted represents past performance and current performance may be lower or higher. Past performance is no guarantee of future results. The investment return and principal value will fluctuate so that shares, when redeemed, may be worth more or less than the original cost. Please visit www.columbiafunds.com for daily and most recent month-end performance updates.
Summary
1-year return as of 03/31/09
| | –3.45% | |
|
| |  | | | Class A shares
(without sales charge) | |
|
| | + 3.13% | |
|
| |  | | | Barclays Capital
U.S. Aggregate Bond Index | |
|
Morningstar Style BoxTM
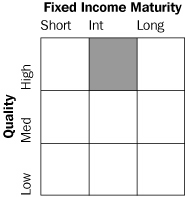
The Morningstar Style BoxTM reveals a fund's investment strategy. For fixed-income funds, the vertical axis shows the average credit quality of the bonds owned, and the horizontal axis shows interest rate sensitivity as measured by a bond's duration (short, intermediate or long). Information shown is based on the most recent data provided by Morningstar.
3
Performance Information – Columbia Total Return Bond Fund
Performance data quoted represents past performance and current performance may be lower or higher. Past performance is no guarantee of future results. The investment return and principal value will fluctuate so that shares, when redeemed, may be worth more or less than the original cost. Please visit www.columbiafunds.com for daily and most recent month-end performance updates.
Annual operating expense ratio (%)*
| Class A | | | 0.85 | | |
| Class B | | | 1.60 | | |
| Class C | | | 1.60 | | |
| Class Z | | | 0.60 | | |
*The annual operating expense ratio is as stated in the fund's prospectus that is current as of the date of this report. Differences in expense ratios disclosed elsewhere in this report may result from including fee waivers and expense reimbursements as well as different time periods used in calculating the ratios.
Performance of a $10,000 investment 04/01/99 – 03/31/09
The chart above shows the growth in value of a hypothetical $10,000 investment in Class A shares of Columbia Total Return Bond Fund during the stated time period, and does not reflect the deduction of taxes that a shareholder may pay on fund distributions or on the redemption of fund shares. The Barclays Capital U.S Aggregate Bond Index is a market value-weighted index that tracks the daily price, coupon, pay-downs, and total return performance of fixed-rate, publicly placed, dollar-denominated, and non-convertible investment grade debt issues with at least $250 million par amount outstanding and with at least one year to final maturity. Indices are not available for investment, and do not reflect sales charges, fees, brokerage commissions, taxes or other expenses of investing. Securities in the fund may not match those in an index.
Performance of a $10,000 investment 04/01/99 – 03/31/09 ($)
| Sales charge | | without | | with | |
| Class A | | | 14,599 | | | | 14,130 | | |
| Class B | | | 13,555 | | | | 13,555 | | |
| Class C | | | 13,515 | | | | 13,515 | | |
| Class Z | | | 14,963 | | | | n/a | | |
Average annual total return as of 03/31/09 (%)
| Share class | | A | | B | | C | | Z | |
| Inception | | 11/19/92 | | 06/07/93 | | 11/16/92 | | 10/30/92 | |
| Sales charge | | without | | with | | without | | with | | without | | with | | without | |
| 1-year | | | –3.45 | | | | –6.59 | | | | –4.16 | | | | –6.92 | | | | –4.17 | | | | –5.09 | | | | –3.20 | | |
| 5-year | | | 1.67 | | | | 1.00 | | | | 0.91 | | | | 0.91 | | | | 0.91 | | | | 0.91 | | | | 1.92 | | |
| 10-year | | | 3.86 | | | | 3.52 | | | | 3.09 | | | | 3.09 | | | | 3.06 | | | | 3.06 | | | | 4.11 | | |
The "with sales charge" returns include the maximum initial sales charge of 3.25% for Class A shares, the applicable contingent deferred sales charge of 3.00% in the first year, declining to 1.00% in the fourth year, and eliminated thereafter for Class B shares and 1.00% for Class C shares for the first year only. The "without sales charge" returns do not include the effect of sales charges. If they had, returns shown would be lower.
Performance results reflect any fee waivers or reimbursements of fund expenses by the investment advisor and/or any of its affiliates. Absent these fee waivers or expense reimbursement arrangements, performance results would have been lower.
All results shown assume reinvestment of distributions. Class Z shares are sold at net asset value with no distribution and service (Rule 12b-1) fees. Class Z shares have limited eligibility and the investment minimum requirements may vary. Please see the fund's prospectus for details. Performance for different share classes will vary based on differences in sales charges and fees associated with each class.
The tables do not reflect the deduction of taxes that a shareholder may pay on fund distributions or on the redemption of fund shares.
4
Understanding Your Expenses – Columbia Total Return Bond Fund
As a fund shareholder, you incur two types of costs. There are transaction costs, which generally include sales charges on purchases and may include redemption fees or exchange fees. There are also ongoing costs, which generally include investment advisory fees, distribution and service (Rule 12b-1) fees and other fund expenses. The information on this page is intended to help you understand the ongoing costs of investing in the fund and to compare these costs with the ongoing costs of investing in other mutual funds.
Analyzing your fund's expenses by share class
To illustrate these ongoing costs, we have provided an example and calculated the expenses paid by investors in each share class during the period. The information in the following table is based on an initial investment of $1,000, which is invested at the beginning of the reporting period and held for the entire period. Expense information is calculated two ways and each method provides you with different information. The amount listed in the "Actual" column is calculated using the fund's actual operating expenses and total return for the period. The amount listed in the "Hypothetical" column for each share class assumes that the return each year is 5% before expenses and is calculated based on the fund's actual operating expenses. You should not use the hypothetical account values and expenses to estimate either your actual account balance at the end of the period or the expenses you paid during this reporting period.
Compare with other funds
Since all mutual funds are required to include the same hypothetical calculations about expenses in shareholder reports, you can use this information to compare the ongoing cost of investing in the fund with other funds. To do so, compare the 5% hypothetical example with the 5% hypothetical examples that appear in the shareholder reports of other funds. As you compare hypothetical examples of other funds, it is important to note that hypothetical examples are meant to highlight the ongoing costs of investing in a fund and do not reflect any transaction costs, such as sales charges, redemption fees or exchange fees.
Estimating your actual expenses
To estimate the expenses that you paid over the period, first you will need your account balance at the end of the period:
g For shareholders who receive their account statements from Columbia Management Services, Inc., your account balance is available online at www.columbiafunds.com or by calling Shareholder Services at 800.345.6611.
g For shareholders who receive their account statements from their financial intermediary, contact your financial intermediary to obtain your account balance.
1. Divide your ending account balance by $1,000. For example, if an account balance was $8,600 at the end of the period, the result would be 8.6.
2. In the section of the table below titled "Expenses paid during the period," locate the amount for your share class. You will find this number in the column labeled "Actual." Multiply this number by the result from step 1. Your answer is an estimate of the expenses you paid on your account during the period.
If the value of your account falls below the minimum initial investment requirement applicable to you, your account generally will be subject to a $20 annual fee. This fee is not included in the accompanying table. If you are subject to the fee, keep it in mind when you are estimating the ongoing expenses of investing in the fund and when comparing the expenses of this fund with other funds.
10/01/08 – 03/31/09
| | | Account value at the
beginning of the period ($) | | Account value at the
end of the period ($) | | Expenses paid
during the period ($) | | Annualized
expense ratio (%) | |
| | | Actual | | Hypothetical | | Actual | | Hypothetical | | Actual | | Hypothetical | | Actual | |
| Class A | | | 1,000.00 | | | | 1,000.00 | | | | 1,013.51 | | | | 1,020.69 | | | | 4.27 | | | | 4.28 | | | | 0.85 | | |
| Class B | | | 1,000.00 | | | | 1,000.00 | | | | 1,009.82 | | | | 1,016.95 | | | | 8.02 | | | | 8.05 | | | | 1.60 | | |
| Class C | | | 1,000.00 | | | | 1,000.00 | | | | 1,009.72 | | | | 1,016.95 | | | | 8.02 | | | | 8.05 | | | | 1.60 | | |
| Class Z | | | 1,000.00 | | | | 1,000.00 | | | | 1,013.71 | | | | 1,021.94 | | | | 3.01 | | | | 3.02 | | | | 0.60 | | |
Expenses paid during the period are equal to the annualized expense ratio for the share class, multiplied by the average account value over the period, then multiplied by the number of days in the fund's most recent fiscal half-year and divided by 365.
It is important to note that the expense amounts shown in the table are meant to highlight only ongoing costs of investing in the fund and do not reflect any transaction costs, such as sales charges, redemption fees or exchange fees. Therefore, the hypothetical examples provided may not help you determine the relative total costs of owning shares of different funds. If these transaction costs were included, your costs would have been higher.
5
Portfolio Managers' Report – Columbia Total Return Bond Fund
Performance data quoted represents past performance and current performance may be lower or higher. Past performance is no guarantee of future results. The investment return and principal value will fluctuate so that shares, when redeemed, may be worth more or less than the original cost. Please visit www.columbiafunds.com for daily and most recent month-end performance updates.
Net asset value per share
as of 03/31/09 ($)
| Class A | | | 8.72 | | |
| Class B | | | 8.72 | | |
| Class C | | | 8.72 | | |
| Class Z | | | 8.72 | | |
Distributions declared per share
04/01/08 – 03/31/09 ($)
| Class A | | | 0.46 | | |
| Class B | | | 0.39 | | |
| Class C | | | 0.39 | | |
| Class Z | | | 0.48 | | |
Top 10 holdings
as of 03/31/09 (%)
Federal National Mortgage
Association
4.500% 02/01/39 | | | 8.0 | | |
Federal National Mortgage
Association
4.000% 03/01/39 | | | 4.9 | | |
Citibank NA
1.625% 03/30/11 | | | 4.1 | | |
Federal National Mortgage
Association
5.500% 06/01/38 | | | 2.7 | | |
Federal National Mortgage
Association
5.000% 03/01/38 | | | 2.5 | | |
Federal National Mortgage
Association
4.500% 03/01/39 | | | 2.3 | | |
Federal Home Loan
Mortgage Corp.
6.500% 10/01/37 | | | 2.2 | | |
Federal National Mortgage
Association
6.500% 12/01/37 | | | 1.6 | | |
Federal Home Loan
Mortgage Corp.
5.000% 04/01/37 | | | 1.5 | | |
Chase Commercial Mortgage
Securities Corp.
5.857% 02/12/16 | | | 1.1 | | |
GE Capital Commercial
Mortgage Corp.
5.189% 07/10/39 | | | 1.0 | | |
Carmax Auto Owner Trust
5.270% 11/15/12 | | | 1.0 | | |
U.S. Treasury Inflation
Indexed Bonds
3.375% 04/15/32 | | | 0.9 | | |
Wachovia Bank Commercial
Mortgage Trust
5.209% 10/15/44 | | | 0.8 | | |
Top 10 holdings are calculated as a percentage of net assets.
For the 12-month period that ended March 31, 2009, the fund's Class A shares returned negative 3.45% without sales charges. That was below the 3.13% return of its benchmark, the Barclays Capital U.S. Aggregate Bond Index1 (formerly Lehman Brothers U.S. Aggregate Bond Index). However, the fund performed better than the average fund in its peer group, the Lipper Intermediate Investment Grade Debt Funds Classification,2 which returned negative 4.81%. The fund's positions in high-yield bonds, non-dollar denominated securities, collateralized mortgage-backed securities and asset-backed securities hurt performance relative to the index. However, security selection and an emphasis on quality within these sectors created an advantage versus the peer group average.
Investors shunned risk as fear gripped fixed income markets
The 12-month period covered by this report was one of the most tumultuous in the history of the capital markets. In the wake of the highly publicized failures of Bear Stearns and Lehman Brothers, fear gripped the fixed-income marketplace and Treasury investments became the instruments of choice. Treasury securities with short to intermediate maturities performed especially well in this environment as consistent intervention by the Federal Reserve pushed short-term rates down to record lows.
Meanwhile, virtually all non-Treasury asset classes lost ground. Corporate bonds faltered as economic growth turned negative in the second half of 2008, and securitized investments declined sharply as investors lost confidence in the quality of underlying collateral. As a result, the fund's exposure to collateralized mortgage obligations was detrimental to performance, as were the fund's holdings in securities backed by credit cards and automobile loans. Although high yield bonds never amounted to more than 5% of the fund's assets and we reduced the fund's high-yield exposure during the year, high-yield investments also hurt overall results. Finally, the fund was hurt by its out-of-index non-dollar investments, which underperformed their domestic counterparts during the final quarter of the period.
Security selection aided performance
Although sector weights weighed on the fund's returns, security selection within non-Treasury sectors aided performance relative to competing funds. Within collateralized mortgage obligations and asset-backed securities, the fund's high-quality orientation proved extremely helpful. Within mortgages, the fund was aided by its emphasis on mortgage pools with lower coupons and, therefore, less repayment risk. Finally, the fund's positions in corporate bonds were conservative in nature, cushioning the declines of 2008 while enabling the fund to participate when the corporate sector rallied in early 2009.
1The Barclays Capital U.S. Aggregate Bond Index is a market value-weighted index that tracks the daily price, coupon, pay-downs and total return performance of fixed-rate, publicly placed, dollar-denominated and non-convertible investment grade debt issues with at least $250 million par amount outstanding and with at least one year to final maturity. Indices are not available for investment, and do not reflect sales charges, fees, brokerage commissions, taxes or other expenses of investing. Securities in the fund may not match those in an index.
2Lipper Inc., a widely respected data provider in the industry, calculates an average total return (assuming reinvestment of distributions) for mutual funds with investment objectives similar to those of the fund. Lipper makes no adjustment for the effect of sales loads.
6
Portfolio Managers' Report (continued) – Columbia Total Return Bond Fund
Looking ahead
Over the past several months, we adjusted the fund's allocations in keeping with the government's stated intentions to stimulate the economy. We have increased the fund's exposure to mortgage sectors, which we believe could benefit from the Treasury's aggressive mortgage repurchase program. We also believe that the fund's positions in commercial mortgage-backed securities and asset-backed securities, both of which underperformed in 2008, have an improved outlook as a result of the government's Term Asset-Backed Securities Loan Facility (TALF) program. And to the extent that the government's various programs prove inflationary down the road, we have instituted modest positions in Treasury Inflation Protection Securities (TIPS), which will be reviewed and potentially expanded when the economy begins to emerge from recession.
Investing in fixed-income securities may involve certain risks, including the credit quality of individual issuers, possible prepayments, market or economic developments and yields and share price fluctuations due to changes in interest rates. When interest rates go up, bond prices typically drop, and vice versa.
Portfolio structure
as of 03/31/09 (%)
| Asset Backed Securities | | | 7.6 | | |
| Agency | | | 5.1 | | |
| Corporate Bonds | | | 39.1 | | |
| Treasuries | | | 1.8 | | |
Commercial Mortgage
Backed Securities | | | 11.9 | | |
| Mortgage Backed Securities | | | 30.4 | | |
| Cash & Equivalents | | | 2.1 | | |
Municipal Bonds
Collateralized Mortgage | | | 1.1 | | |
| Obligations | | | 0.9 | | |
Maturity breakdown
as of 03/31/09 (%)
| 0-1 year | | | 3.6 | | |
| 1-5 years | | | 49.3 | | |
| 5-10 years | | | 35.6 | | |
| 10-20 years | | | 3.4 | | |
| Over 20 years | | | 8.1 | | |
Maturity breakdown and portfolio structure are calculated as a percentage of net assets.
The fund is actively managed and the composition of its portfolio will change over time.
Quality breakdown
as of 03/31/09 (%)
| AAA | | | 61.2 | | |
| AA | | | 8.1 | | |
| A | | | 12.9 | | |
| BBB | | | 13.3 | | |
| BB | | | 1.6 | | |
| B | | | 1.0 | | |
| CCC | | | 0.4 | | |
| Cash and Equivalents | | | 1.5 | | |
Quality breakdown is calculated as a percentage of investments. Ratings shown in the quality breakdown represent the rating assigned to a particular bond by one of the following nationally recognized rating agencies: Standard and Poor's, Moody's Investors Service, Inc. or Fitch Ratings Ltd. Ratings are relative and subjective and are not absolute standards of quality. The fund's credit quality does not remove market risk.
30-day SEC yields
as of 03/31/09 (%)
| Class A | | | 4.61 | | |
| Class B | | | 4.02 | | |
| Class C | | | 4.02 | | |
| Class Z | | | 5.02 | | |
The 30-day SEC yields reflect the portfolio's earning power net of expenses, expressed as an annualized percentage of the public offering price at the end of the period.
7
Fund Profile – Columbia Short Term Bond Fund
Performance data quoted represents past performance and current performance may be lower or higher. Past performance is no guarantee of future results. The investment return and principal value will fluctuate so that shares, when redeemed, may be worth more or less than the original cost. Please visit www.columbiafunds.com for daily and most recent month-end performance updates.
Summary
1-year return as of 03/31/09
| | +0.03% | |
|
| |  | | | Class A shares
(without sales charges) | |
|
| | +2.77% | |
|
| |  | | | Barclays Capital U.S. 1-3 Year
Government/Credit Index1 | |
|
| | +3.61% | |
|
| |  | | | Merrill Lynch 1-3 Year
U.S. Treasury Index2 | |
|
Morningstar Style BoxTM
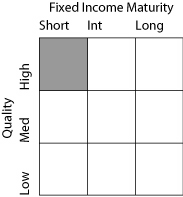
The Morningstar Style BoxTM reveals a fund's investment strategy. For fixed-income funds, the vertical axis shows the average credit quality of the bonds owned, and the horizontal axis shows interest rate sensitivity as measured by a bond's duration (short, intermediate or long). Information shown is based on the most recent data provided by Morningstar.
Summary
g For the 12-month period that ended March 31, 2009, the fund's Class A shares returned 0.03% without sales charge.
g The fund trailed its benchmark, the Barclays Capital U.S. Government/Credit Index,1 but outperformed the average return of its peer group, the Lipper Short Investment Grade Debt Funds Classification.3
g The fund's exposure to commercial mortgage backed securities (CMBS) and corporate bonds detracted from relative performance in an environment that favored Treasury securities as investors retreated from riskier assets.
Portfolio Management
Leonard Aplet has co-managed the fund since October 2004, and has been with the advisor or its predecessors since 1987.
Ronald Stahl has co-managed the fund since November 2006, and has been with the advisor or its predecessors since 1998.
1The Barclays Capital U.S. 1-3 Year Government/Credit Index consists of Treasury or government agency securities and investment grade corporate debt securities with maturities of one to three years.
2The Merrill Lynch 1-3 Year U.S. Treasury Index tracks the performance of sovereign debt publicly issued in the U.S. domestic market with maturities of 1–3 years and a minimum amount outstanding of $1 billion. As of 01/01/2009, Merrill Lynch & Co., Inc. is a wholly-owned subsidiary of Bank of America Corporation and an affiliate of Columbia Management.
3Lipper Inc., a widely respected data provider in the industry, calculates an average total return (assuming reinvestment of distributions) for mutual funds with investment objectives similar to those of the fund. makes no adjustment for the effect of sales loads.
Indices are not available for investment, and do not reflect sales charges, fees, brokerage commissions, taxes or other expenses of investing. Securities in the fund may not match those in an index.
8
Performance Information – Columbia Short Term Bond Fund
Performance of a $10,000 investment 04/01/99 – 03/31/09
The chart above shows the change in value of a hypothetical $10,000 investment in Class A shares of Columbia Short Term Bond Fund during the stated time period, and does not reflect the deduction of taxes that a shareholder may pay on fund distributions or on the redemptions of fund shares. The Barclays Capital U.S. 1-3 Year Government/Credit Index is an unmanaged index consisting of Treasury or government agency securities and investment grade corporate debt securities with maturities of one to three years. The Merrill Lynch 1-3 Year U.S. Treasury Index tracks the performance of sovereign debt publicly issued in the U.S. domestic market with maturities of 1-3 years and a minimum amount outstanding of $1 billion. Indices are not available for investment, and do not reflect sales charges, fees, brokerage commissions, taxes or other expenses of investing. Securities in the fund may not match those in an index.
Performance of a $10,000 investment 04/01/99 – 03/31/09 ($)
| Sales charge | | without | | with | |
| Class A | | | 14,437 | | | | 14,291 | | |
| Class B | | | 13,455 | | | | 13,455 | | |
| Class C | | | 13,587 | | | | 13,587 | | |
| Class Z | | | 14,771 | | | | n/a | | |
Performance data quoted represents past performance and current performance may be lower or higher. Past performance is no guarantee of future results. The investment return and principal value will fluctuate so that shares, when redeemed, may be worth more or less than the original cost. Please visit www.columbiafunds.com for daily and most recent month-end performance updates.
Annual operating expense ratio (%)*
| Class A | | | 0.75 | | |
| Class B | | | 1.50 | | |
| Class C | | | 1.50 | | |
| Class Z | | | 0.50 | | |
Annual operating expense ratio
after contractual waivers (%)*
| Class A | | | 0.73 | | |
| Class B | | | 1.48 | | |
| Class C | | | 1.48 | | |
| Class Z | | | 0.48 | | |
*The annual operating expense ratio and annual operating expense ratio after contractual waivers are as stated in the fund's prospectus that is current as of the date of this report. The contractual waiver expires 07/31/09. Differences in expense ratios disclosed elsewhere in this report may result from including fee waivers and expense reimbursements as well as different time periods used in calculating the ratios.
Average annual total return as of 03/31/09 (%)
| Share class | | A | | B | | C | | Z | |
| Inception | | 10/02/92 | | 06/07/93 | | 10/02/92 | | 09/30/92 | |
| Sales charge | | without | | with | | without | | with | | without | | with | | without | |
| 1-year | | | 0.03 | | | | –0.97 | | | | –0.72 | | | | –3.59 | | | | –0.29 | | | | –1.25 | | | | 0.27 | | |
| 5-year | | | 2.49 | | | | 2.28 | | | | 1.72 | | | | 1.72 | | | | 2.01 | | | | 2.01 | | | | 2.72 | | |
| 10-year | | | 3.74 | | | | 3.63 | | | | 3.01 | | | | 3.01 | | | | 3.11 | | | | 3.11 | | | | 3.98 | | |
The "with sales charge" returns include the maximum initial sales charge of 1.00% for Class A shares, the applicable contingent deferred sales charge of 3.00% in the first year, declining to 1.00% in the fourth year and eliminated thereafter for Class B shares and 1.00% for Class C shares for the first year only. The "without sales charge" returns do not include the effect of sales charges. If they had, returns shown would be lower.
Performance results reflect any fee waivers or reimbursements of fund expenses by the investment advisor and/or any of its affiliates. Absent these fee waivers or expense reimbursement arrangements, performance results would have been lower.
All results shown assume reinvestment of distributions. Class Z shares are sold at net asset value with no distribution and service (Rule 12b-1) fees. Class Z shares have limited eligibility and the investment minimum requirements may vary. Please see the fund's prospectus for details. Performance for different share classes will vary based on differences in sales charges and fees associated with each class.
The tables do not reflect the deduction of taxes that a shareholder may pay on fund distributions or on the redemption of fund shares.
9
Understanding Your Expenses – Columbia Short Term Bond Fund
Estimating your actual expenses
To estimate the expenses that you paid over the period, first you will need your account balance at the end of the period:
g For shareholders who receive their account statements from Columbia Management Services, Inc., your account balance is available online at www.columbiafunds.com or by calling Shareholder Services at 800.345.6611.
g For shareholders who receive their account statements from their financial intermediary, contact your financial intermediary to obtain your account balance.
1. Divide your ending account balance by $1,000. For example, if an account balance was $8,600 at the end of the period, the result would be 8.6.
2. In the section of the table below titled "Expenses paid during the period," locate the amount for your share class. You will find this number in the column labeled "Actual." Multiply this number by the result from step 1. Your answer is an estimate of the expenses you paid on your account during the period.
If the value of your account falls below the minimum initial investment requirement applicable to you, your account generally will be subject to a $20 annual fee. This fee is not included in the accompanying table. If you are subject to the fee, keep it in mind when you are estimating the ongoing expenses of investing in the fund and when comparing the expenses of this fund with other funds.
As a fund shareholder, you incur two types of costs. There are transaction costs, which generally include sales charges on purchases and may include redemption fees or exchange fees. There are also ongoing costs, which generally include investment advisory fees, distribution and service (Rule 12b-1) fees and other fund expenses. The information on this page is intended to help you understand the ongoing costs of investing in the fund and to compare these costs with the ongoing costs of investing in other mutual funds.
Analyzing your fund's expenses by share class
To illustrate these ongoing costs, we have provided an example and calculated the expenses paid by investors in each share class during the period. The information in the following table is based on an initial investment of $1,000, which is invested at the beginning of the reporting period and held for the entire period. Expense information is calculated two ways and each method provides you with different information. The amount listed in the "Actual" column is calculated using the fund's actual operating expenses and total return for the period. The amount listed in the "Hypothetical" column for each share class assumes that the return each year is 5% before expenses and is calculated based on the fund's actual operating expenses. You should not use the hypothetical account values and expenses to estimate either your actual account balance at the end of the period or the expenses you paid during this reporting period.
Compare with other funds
Since all mutual funds are required to include the same hypothetical calculations about expenses in shareholder reports, you can use this information to compare the ongoing cost of investing in the fund with other funds. To do so, compare the 5% hypothetical example with the 5% hypothetical examples that appear in the shareholder reports of other funds. As you compare hypothetical examples of other funds, it is important to note that hypothetical examples are meant to highlight the ongoing costs of investing in a fund and do not reflect any transaction costs, such as sales charges, redemption fees or exchange fees.
10/01/08 – 03/31/09
| | | Account value at the
beginning of the period ($) | | Account value at the
end of the period ($) | | Expenses paid
during the period ($) | | Annualized
expense ratio (%) | |
| | | Actual | | Hypothetical | | Actual | | Hypothetical | | Actual | | Hypothetical | | Actual | |
| Class A | | | 1,000.00 | | | | 1,000.00 | | | | 1,011.42 | | | | 1,021.29 | | | | 3.66 | | | | 3.68 | | | | 0.73 | | |
| Class B | | | 1,000.00 | | | | 1,000.00 | | | | 1,007.58 | | | | 1,017.55 | | | | 7.41 | | | | 7.44 | | | | 1.48 | | |
| Class C | | | 1,000.00 | | | | 1,000.00 | | | | 1,009.82 | | | | 1,019.75 | | | | 5.21 | | | | 5.24 | | | | 1.04 | | |
| Class Z | | | 1,000.00 | | | | 1,000.00 | | | | 1,011.62 | | | | 1,022.54 | | | | 2.41 | | | | 2.42 | | | | 0.48 | | |
Expenses paid during the period are equal to the annualized expense ratio for the share class, multiplied by the average account value over the period, then multiplied by the number of days in the fund's most recent fiscal half-year and divided by 365.
Had the investment advisor and/or any of its affiliates not waived fees or reimbursed a portion of expenses, account value at the end of the period would have been reduced.
It is important to note that the expense amounts shown in the table are meant to highlight only ongoing costs of investing in the fund and do not reflect any transaction costs, such as sales charges, redemption fees or exchange fees. Therefore, the hypothetical examples provided may not help you determine the relative total costs of owning shares of different funds. If these transaction costs were included, your costs would have been higher.
10
Portfolio Managers' Report – Columbia Short Term Bond Fund
For the 12-month period that ended March 31, 2009, the fund's Class A shares returned 0.03% without sales charge. The Fund trailed its new benchmark, the Barclays Capital U.S. 1-3 Year Government/Credit Index,1 which returned 2.77%. Effective February 27, 2009, the Fund changed its benchmark to Barclays Capital U.S. 1-3 Year Government/Credit Index from Merrill Lynch 1-3 Year U.S. Treasury Index because the advisor believes that the Barclays Capital U.S. 1-3 Year Government/Credit Index more closely reflects the Fund's investment universe, with its investment in a broad range of fixed income securities, than does the previous benchmark of the Fund. The Fund did considerably better than the average fund in its peer group, the Lipper Short Investment Grade Debt Funds Classification,2 which returned negative 4.96%. The Fund's positions in commercial mortgage backed securities (CMBS) and corporate bonds detract ed from performance relative to the benchmark. However, we believe that the Fund's emphasis on higher quality securities within non-Treasury sectors aided performance relative to its peers.
Government actions affected fixed income markets
During the period, the Federal Reserve Board lowered the federal funds target rate to between zero and 0.25%. In this environment, we shifted the fund's overall portfolio duration within a narrow range to take advantage of interest rate volatility, and these moves aided relative performance. However, we brought duration back in line with the benchmark by the end of the period. Duration is a measure, expressed in years, of interest rate sensitivity. We tend to use duration as a tool to anticipate or respond to interest rate changes. If we are right in our positioning, it can aid performance, as it did during this period.
The fund's positions in agency pass throughs and agency collateralized mortgage obligations (CMOs) also aided performance. These sectors benefited from Federal Reserve and U.S. Treasury plans to purchase agency and mortgage backed securities (MBS) to stabilize the housing market, and they outperformed Treasury issues. Our decision to increase the fund's Treasury holdings to enhance the liquidity of the fund's portfolio worked well, as Treasury issues outperformed most non-Treasury sectors during the period.
Corporate bond market a challenge
Corporate bonds overall underperformed Treasury securities during the period as business conditions deteriorated. Still, some sectors within the corporate market performed well. The fund's holdings in the consumer non-cyclical, health care, technology, and telecommunications sectors added to performance. While our decision to reduce the fund's exposure to the broad financial sector was a good call, holdings in
1The Barclays Capital U.S. 1-3 Year Government/Credit Index consists of Treasury or government agency securities and investment grade corporate debt securities with maturities of one to three years. Indices are not available for investment, and do not reflect sales charges, fees, brokerage commissions, taxes or other expenses of investing. Securities in the fund may not match those in an index.
2Lipper Inc., a widely respected data provider in the industry, calculates an average total return (assuming reinvestment of distributions) for mutual funds with investment objectives similar to those of the fund. Lipper makes no adjustment for the effect of sales loads.
Performance data quoted represents past performance and current performance may be lower or higher. Past performance is no guarantee of future results. The investment return and principal value will fluctuate so that shares, when redeemed, may be worth more or less than the original cost. Please visit www.columbiafunds.com for daily and most recent month-end performance updates.
Net asset value per share
as of 03/31/09 ($)
| Class A | | | 9.47 | | |
| Class B | | | 9.47 | | |
| Class C | | | 9.46 | | |
| Class Z | | | 9.45 | | |
Distributions declared per share
04/01/08 – 03/31/09 ($)
| Class A | | | 0.42 | | |
| Class B | | | 0.35 | | |
| Class C | | | 0.39 | | |
| Class Z | | | 0.44 | | |
Top 10 holdings
as of 03/31/09 (%)
United States Treasury Notes
0.875% 02/28/11 | | | 4.4 | | |
United States Treasury Notes
4.875% 06/30/09 | | | 1.7 | | |
AmeriCredit Automobile
Receivables Trust
5.420% 05/07/12 | | | 1.6 | | |
Countrywide Home Loan
5.500% 09/25/35 | | | 1.5 | | |
United States Treasury
Notes/Bond
1.875% 02/28/14 | | | 1.4 | | |
Federal National Mortgage
Association
5.000% 07/01/22 | | | 1.4 | | |
Federal Home Loan
Mortgage Corp.
6.625% 09/15/09 | | | 1.3 | | |
United States Treasury Notes
1.750% 01/31/14 | | | 1.2 | | |
Triad Auto Receivables
Owner Trust
4.880% 04/12/13 | | | 1.2 | | |
Federal National Mortgage
Association
2.750% 04/11/11 | | | 1.1 | | |
Top 10 holdings are calculated as a percentage of net assets.
11
Portfolio Managers' Report (continued) – Columbia Short Term Bond Fund
Portfolio structure
as of 03/31/09 (%)
| Corporate Bonds | | | 26.3 | | |
| Asset Backed Securities | | | 21.0 | | |
| Government Issues | | | 16.1 | | |
| Mortgage Backed Securities | | | 18.2 | | |
Collateralized Mortgage
Obligations | | | 14.9 | | |
| Cash and Equivalents | | | 3.5 | | |
The fund is actively managed and the composition of its portfolio will change over time. Portfolio structure is calculated as a percentage of net assets.
Quality breakdown
as of 03/31/09 (%)
| AAA | | | 63.5 | | |
| AA | | | 7.9 | | |
| A | | | 15.5 | | |
| BBB | | | 12.5 | | |
| B | | | 0.2 | | |
| CCC | | | 0.4 | | |
Quality breakdown is calculated as a percentage of investments. Ratings shown in the quality breakdown represent the rating assigned to a particular bond by one of the following nationally recognized rating agencies: Standard and Poor's, Moody's Investors Service, Inc. or Fitch Ratings Ltd. Ratings are relative and subjective and are not absolute standards of quality. The fund's credit quality does not remove market risk.
30-day SEC yields
as of 03/31/09 (%)
| Class A | | | 4.48 | | |
| Class B | | | 3.81 | | |
| Class C | | | 4.22 | | |
| Class Z | | | 4.80 | | |
The 30-day SEC yields reflect the fund's earning power, net of expenses, expressed as an annualized percentage of the public offering price per share at the end of the period. Had the investment advisor and/or its affiliates not waived fees or reimbursed a portion of expenses, the 30-day SEC yields would have been lower.
the finance, brokerage, insurance and real estate investment trust (REIT) industries detracted from performance. Returns were also hurt by the fund's holdings in CMBS. Although we invested in favorably structured securities with high-quality collateral, the segment underperformed Treasuries by nearly four percentage points.
Looking ahead
Although the U.S. economy is experiencing a deep recession, we believe the recession is also well advanced. The monetary and fiscal policies now in place are improving liquidity in the fixed income markets. The yield difference between non-Treasury and Treasury securities is still close to historical highs, and we believe many sectors of the securitized and corporate markets have the potential to perform well in 2009. As a result, we have maintained exposure to mortgage-backed securities, which have become heavily discounted relative to their underlying quality. Federal Reserve and Treasury plans to purchase mortgage-backed securities are stabilizing the mortgage markets and keeping mortgage yields as low as they have been in many years.
Although corporate bonds performed poorly relative to Treasuries in 2008, we are encouraged by the increased supply of corporate bonds and the attractive yields they offer relative to Treasuries. We continue to favor high quality corporates, with an emphasis on banking, electric utility and energy sectors. The fund also continues to hold a small position in Treasury Inflation Protected Securities. We believe a well-diversified portfolio has the potential to perform well in this environment.
Investing in fixed-income securities may involve certain risks, including the credit quality of individual issuers, possible prepayments, market or economic developments and yields and share price fluctuations due to changes in interest rates. When interest rates go up, bond prices typically drop, and vice versa.
12
Fund Profile – Columbia High Income Fund
Summary
g For the 12-month period that ended March 31, 2009, the fund's Class A shares returned negative 19.17% without sales charges.
g In an environment of contracting economic growth and falling stock prices, the high yield market also came under pressure.
g Although the fund, its benchmark, the Credit Suisse High Yield Index,1 and the average fund in its peer group, the Lipper High Current Yield Funds Classification,2 all lost more than 19% for the period, the fund held up somewhat better than these comparative measures.
Portfolio Management
The fund is managed by the High Yield Portfolio Management Team of MacKay Shields LLC, investment sub-advisor to the fund. J. Matthew Philo is the lead portfolio manager responsible for making the day-to-day investment decisions for the fund, and has been a portfolio manager for the fund since its inception.
1The Credit Suisse High Yield Index is a broad-based index that tracks the performance of high-yield bonds. Indices are not available for investment, and do not reflect sales charges, fees, brokerage commissions, taxes or other expenses of investing. Securities in the fund may not match those in an index. Indices are not available for investment, and do not reflect sales charges, fees, brokerage commissions, taxes or other expenses of investing. Securities in the portfolio may not match those in an index.
2Lipper Inc., a widely respected data provider in the industry, calculates an average total return (assuming reinvestment of distributions) for mutual funds with investment objectives similar to those of the fund. makes no adjustment for the effect of sales loads.
Performance data quoted represents past performance and current performance may be lower or higher. Past performance is no guarantee of future results. The investment return and principal value will fluctuate so that shares, when redeemed, may be worth more or less than the original cost. Please visit www.columbiafunds.com for daily and most recent month-end performance updates.
Summary
1-year return as of 03/31/09
| | –19.17% | |
|
| |  | | | Class A shares
(without sales charge) | |
|
| | –19.55% | |
|
| |  | | | Credit Suisse High Yield Index1 | |
|
Morningstar Style BoxTM
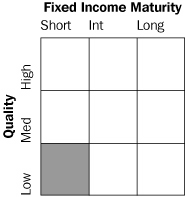
The Morningstar Style BoxTM reveals a fund's investment strategy. For fixed-income funds, the vertical axis shows the average credit quality of the bonds owned, and the horizontal axis shows interest rate sensitivity as measured by a bond's duration (short, intermediate or long). Information shown is based on the most recent data provided by Morningstar.
13
Performance Information – Columbia High Income Fund
Performance data quoted represents past performance and current performance may be lower or higher. Past performance is no guarantee of future results. The investment return and principal value will fluctuate so that shares, when redeemed, may be worth more or less than the original cost. Please visit www.columbiafunds.com for daily and most recent month-end performance updates.
Annual operating expense ratio (%)*
| Class A | | | 1.18 | | |
| Class B | | | 1.93 | | |
| Class C | | | 1.93 | | |
| Class Z | | | 0.93 | | |
*The annual operating expense ratio is as stated in the fund's prospectus that is current as of the date of this report. Differences in expense ratios disclosed elsewhere in this report may result from including fee waivers and expense reimbursements as well as different time periods used in calculating the ratios.
Performance of a $10,000 investment 02/14/00 – 03/31/09
The chart above shows the change in value of a hypothetical $10,000 investment in Class A shares of Columbia High Income Fund during the stated time period and does not reflect the deduction of taxes that a shareholder may pay on fund distributions or on the redemption of fund shares. The Credit Suisse High Yield Index is a broad-based index that tracks the performance of high yield bonds. Indices are not available for investment, and do not reflect sales charges, fees, brokerage commissions, taxes or other expenses of investing. Securities in the fund may not match those in an index. The return for the index shown is from January 31, 2000.
Performance of a $10,000 investment Inception – 03/31/09 ($)
| Sales charge | | without | | with | |
| Class A | | | 14,244 | | | | 13,565 | | |
| Class B | | | 13,309 | | | | 13,309 | | |
| Class C | | | 13,256 | | | | 13,256 | | |
| Class Z | | | 14,632 | | | | n/a | | |
Average annual total return as of 03/31/09 (%)
| Share class | | A | | B | | C | | Z | |
| Inception | | 02/14/00 | | 02/17/00 | | 03/08/00 | | 02/14/00 | |
| Sales charge | | without | | with | | without | | with | | without | | with | | without | |
| 1-year | | | –19.17 | | | | –23.01 | | | | –19.84 | | | | –23.52 | | | | –19.81 | | | | –20.55 | | | | –18.92 | | |
| 5-year | | | –0.37 | | | | –1.34 | | | | –1.12 | | | | –1.37 | | | | –1.12 | | | | –1.12 | | | | –0.13 | | |
| Life | | | 3.95 | | | | 3.40 | | | | 3.18 | | | | 3.18 | | | | 3.16 | | | | 3.16 | | | | 4.26 | | |
The "with sales charge" returns include the maximum initial sales charge of 4.75% for Class A shares, the applicable contingent deferred sales charge of 5.00% in the first year, declining to 1.00% in the sixth year and eliminated thereafter for Class B shares and 1.00% for Class C shares for the first year only. The "without sales charge" returns do not include the effect of sales charges. If they had, returns shown would be lower.
Performance results reflect any fee waivers or reimbursements of fund expenses by the investment advisor and/or any of its affiliates. Absent these fee waivers or expense reimbursement arrangements, performance results would have been lower.
All results shown assume reinvestment of distributions. Class Z shares are sold at net asset value with no distribution and service (Rule 12b-1) fees. Class Z shares have limited eligibility and the investment minimum requirements may vary. Please see the fund's prospectus for details. Performance for different share classes will vary based on differences in sales charges and fees associated with each class.
The tables do not reflect the deduction of taxes that a shareholder may pay on fund distributions or on the redemption of fund shares.
14
Understanding Your Expenses – Columbia High Income Fund
As a fund shareholder, you incur two types of costs. There are transaction costs, which generally include sales charges on purchases and may include redemption fees or exchange fees. There are also ongoing costs, which generally include investment advisory fees, distribution and service (Rule 12b-1) fees and other fund expenses. The information on this page is intended to help you understand the ongoing costs of investing in the fund and to compare these costs with the ongoing costs of investing in other mutual funds.
Analyzing your fund's expenses by share class
To illustrate these ongoing costs, we have provided an example and calculated the expenses paid by investors in each share class during the period. The information in the following table is based on an initial investment of $1,000, which is invested at the beginning of the reporting period and held for the entire period. Expense information is calculated two ways and each method provides you with different information. The amount listed in the "Actual" column is calculated using the fund's actual operating expenses and total return for the period. The amount listed in the "Hypothetical" column for each share class assumes that the return each year is 5% before expenses and is calculated based on the fund's actual operating expenses. You should not use the hypothetical account values and expenses to estimate either your actual account balance at the end of the period or the expenses you paid during this reporting period.
Compare with other funds
Since all mutual funds are required to include the same hypothetical calculations about expenses in shareholder reports, you can use this information to compare the ongoing cost of investing in the fund with other funds. To do so, compare the 5% hypothetical example with the 5% hypothetical examples that appear in the shareholder reports of other funds. As you compare hypothetical examples of other funds, it is important to note that hypothetical examples are meant to highlight the ongoing costs of investing in a fund and do not reflect any transaction costs, such as sales charges, redemption fees or exchange fees.
Estimating your actual expenses
To estimate the expenses that you paid over the period, first you will need your account balance at the end of the period:
g For shareholders who receive their account statements from Columbia Management Services, Inc., your account balance is available online at www.columbiafunds.com or by calling Shareholder Services at 800.345.6611.
g For shareholders who receive their account statements from their financial intermediary, contact your financial intermediary to obtain your account balance.
1. Divide your ending account balance by $1,000. For example, if an account balance was $8,600 at the end of the period, the result would be 8.6.
2. In the section of the table below titled "Expenses paid during the period," locate the amount for your share class. You will find this number in the column labeled "Actual." Multiply this number by the result from step 1. Your answer is an estimate of the expenses you paid on your account during the period.
If the value of your account falls below the minimum initial investment requirement applicable to you, your account generally will be subject to a $20 annual fee. This fee is not included in the accompanying table. If you are subject to the fee, keep it in mind when you are estimating the ongoing expenses of investing in the fund and when comparing the expenses of this fund with other funds.
10/01/08 – 03/31/09
| | | Account value at the
beginning of the period ($) | | Account value at the
end of the period ($) | | Expenses paid
during the period ($) | | Annualized
expense ratio (%) | |
| | | Actual | | Hypothetical | | Actual | | Hypothetical | | Actual | | Hypothetical | | Actual | |
| Class A | | | 1,000.00 | | | | 1,000.00 | | | | 851.21 | | | | 1,019.05 | | | | 5.45 | | | | 5.94 | | | | 1.18 | | |
| Class B | | | 1,000.00 | | | | 1,000.00 | | | | 847.52 | | | | 1,015.31 | | | | 8.89 | | | | 9.70 | | | | 1.93 | | |
| Class C | | | 1,000.00 | | | | 1,000.00 | | | | 846.92 | | | | 1,015.31 | | | | 8.89 | | | | 9.70 | | | | 1.93 | | |
| Class Z | | | 1,000.00 | | | | 1,000.00 | | | | 852.31 | | | | 1,020.29 | | | | 4.29 | | | | 4.68 | | | | 0.93 | | |
Expenses paid during the period are equal to the annualized expense ratio for the share class, multiplied by the average account value over the period, then multiplied by the number of days in the fund's most recent fiscal half-year and divided by 365.
Had the investment advisor and/or any of its affiliates not waived fees or reimbursed a portion of expenses, account value at the end of the period would have been reduced.
It is important to note that the expense amounts shown in the table are meant to highlight only ongoing costs of investing in the fund and do not reflect any transaction costs, such as sales charges, redemption fees or exchange fees. Therefore, the hypothetical examples provided may not help you determine the relative total costs of owning shares of different funds. If these transaction costs were included, your costs would have been higher.
15
Portfolio Managers' Report – Columbia High Income Fund
Performance data quoted represents past performance and current performance may be lower or higher. Past performance is no guarantee of future results. The investment return and principal value will fluctuate so that shares, when redeemed, may be worth more or less than the original cost. Please visit www.columbiafunds.com for daily and most recent month-end performance updates.
Net asset value per share
as of 03/31/09 ($)
| Class A | | | 5.92 | | |
| Class B | | | 5.90 | | |
| Class C | | | 5.87 | | |
| Class Z | | | 5.98 | | |
Distributions declared per share
04/01/08 – 03/31/09 ($)
| Class A | | | 0.63 | | |
| Class B | | | 0.58 | | |
| Class C | | | 0.58 | | |
| Class Z | | | 0.65 | | |
Top 10 issuers
as of 03/31/09 (%)
| Georgia-Pacific Corp. | | | 2.14 | | |
AMR Real Estate
Partners, LP | | | 1.95 | | |
| Sungard Data Systems, Inc. | | | 1.91 | | |
Community Health
Systems, Inc. | | | 1.73 | | |
Energy Future
Holdings Corp. | | | 1.51 | | |
| Reliant Energy, Inc. | | | 1.42 | | |
| ANR Pipeline Co. | | | 1.40 | | |
| Qwest Corp. | | | 1.40 | | |
| El Paso Natural Gas Co. | | | 1.35 | | |
| Ford Motor Co. | | | 1.26 | | |
Top 10 issuers are calculated as a percentage of total investments.
For the 12-month period that ended March 31, 2009, the fund's Class A shares returned negative 19.17% without sales charge, compared with negative 19.55% for its benchmark, the Credit Suisse High Yield Index.1 The average fund in its peer group, the Lipper High Current Yield Funds Classification,2 returned negative 20.73%. In an environment of contracting economy and falling stock prices, the high yield market also came under pressure. Although the fund, its benchmark and the average fund in its peer group all lost more than 19% for the period, the fund held up somewhat better than these comparative measures.
A challenging period for high yield
For the 12-month period covered by this report, all industries within the Credit Suisse index experienced negative performance. However, credit selection and sector weights helped the fund's relative performance. Positions in Ford Motor Co. and Ford Motor Credit Co. gained significant ground on news that the U.S. government had granted GMAC bank holding company status. In addition, Ford announced an exchange offer for some of its debt, which significantly lifted the value of the fund's Ford bonds in March.
Within the health care sector, Hanger Orthopedic Group reported solid earnings and was rewarded with strong performance. Talecris Biotherapeutics, a treatment provider for life-threatening disorders, also did well after agreeing to be acquired by an Australian competitor. Alliance Imaging, Inc. was another top performer for the year. Although the gaming/leisure industry was a weak performer overall, a decision to focus on companies outside of Las Vegas had a positive impact on performance. In that regard, Penn National Gaming, Inc. was one of the fund's top performers.
Performance disappointments
Among the fund's worst performers for the period were Lucent Technologies, Nortel Networks Ltd. and NXP BV/NXP Funding LLC in the technology sector. Weak business prospects continued to hold back capital spending. Elsewhere in the portfolio, drug retailer Rite Aid Corp. struggled to integrate its Brooks/Eckerd acquisition, lowering earnings expectations for the year. Chaparral Energy, Inc. and Energy Future Holdings Corp. were both hurt by the sharp decline in oil and gas prices during the year. Finally, Sovereign Real Estate Investment Corp. performed poorly due to general market fears about the financial sector.
1The Credit Suisse High Yield Index is a broad-based index that tracks the performance of high-yield bonds. Indices are not available for investment, and do not reflect sales charges, fees, brokerage commissions, taxes or other expenses of investing. Securities in the portfolio may not match those in an index.
2Lipper Inc., a widely respected data provider in the industry, calculates an average total return (assuming reinvestment of distributions) for mutual funds with investment objectives similar to those of the fund. Lipper makes no adjustment for the effect of sales loads.
16
Portfolio Managers' Report (continued) – Columbia High Income Fund
Looking ahead
Our disciplined investment process has helped position the fund for a difficult environment, with a conservative focus, an underweight in the weaker segments of the market and meaningful cash holdings. However, we plan to move cautiously in adding risk to the portfolio because we continue to believe that there is significant systemic risk in the market and that the current global recession will be severe and prolonged. As a result, we plan to postpone any major move until we are more confident that we are closer to the bottom of this recession. We believe that the high-yield market represents excellent value and that our disciplined investment process will allow us to take advantage of attractive opportunities going forward.
Holdings discussed in this report
as of 3/31/09 (%)
| Ford Motor Co. | | | 0.2 | | |
| Ford Motor Credit Co. | | | 1.0 | | |
| Hanger Orthopedic Group | | | 0.6 | | |
| Talecris Biotherapeutics | | | 0.8 | | |
| Alliance Imaging, Inc. | | | 0.9 | | |
| Penn National Gaming, Inc. | | | 0.7 | | |
| Lucent Technologies, Inc. | | | 1.0 | | |
| Nortel Networks, Ltd. | | | 0.2 | | |
| NXP B V/NXP Funding LLC | | | 0.6 | | |
| Rite Aid Corp. | | | 0.5 | | |
| Chaparral Energy, Inc. | | | 0.5 | | |
| Energy Future Holding Corp. | | | 0.5 | | |
| Sovereign Real Estate Investment Corp. | | | 0.8 | | |
Your fund is actively managed and the composition of its portfolio will change over time. Information provided is calculated as a percentage of net assets.
Source for all security-specific commentary—MacKay Shields LLC.
Source for all statistical data—Columbia Management Advisors, LLC.
Investments in high-yield bonds (sometimes referred to as "junk" bonds) offer the potential for high current income and attractive total return but involve certain risks. Changes in economic conditions or other circumstances may adversely affect a junk bond issuer's ability to make principal and interest payments. Rising interest rates tend to lower the value of all bonds. High-yield bonds issued by foreign entities have greater potential risks, including less regulation, currency fluctuations, economic instability and political developments.
Maturity breakdown
as of 03/31/09 (%)
| 0 – 1 year | | | 9.5 | | |
| 1 – 3 years | | | 7.6 | | |
| 3 – 5 years | | | 30.2 | | |
| 5 – 7 years | | | 25.5 | | |
| 7 – 10 years | | | 18.2 | | |
| 10 – 15 years | | | 2.3 | | |
| 15 years and over | | | 6.7 | | |
Portfolio structure
as of 03/31/09 (%)
| Corporate bonds | | | 88.2 | | |
| Cash and Equivalents, net | |
| other assets and liabilities | | | 9.7 | | |
| Convertible bonds | | | 0.6 | | |
| Asset backed securities | | | 1.4 | | |
| Preferred stocks | | | 1.3 | | |
| Common stocks | | | 0.2 | | |
Maturity breakdown and portfolio structure are calculated as a percentage of net assets.
The fund is actively managed and the composition of its portfolio will change over time.
Quality breakdown
as of 03/31/09 (%)
| Cash and Equivalents | | | 6.9 | | |
| AA | | | 1.0 | | |
| A | | | 2.0 | | |
| BBB | | | 11.9 | | |
| BB | | | 29.3 | | |
| B | | | 38.0 | | |
| CCC | | | 9.6 | | |
| CC | | | 0.5 | | |
| D | | | 0.5 | | |
| Not Rated | | | 0.3 | | |
Quality breakdown is calculated as a percentage of investments. Ratings shown in the quality breakdown represent the rating assigned to a particular bond by one of the following nationally recognized rating agencies: Standard and Poor's, Moody's Investors Service, Inc. or Fitch Ratings Ltd. Ratings are relative and subjective and are not absolute standards of quality. The fund's credit quality does not remove market risk.
30-day SEC yields
as of 03/31/09 (%)
| Class A | | | 9.71 | | |
| Class B | | | 9.46 | | |
| Class C | | | 9.46 | | |
| Class Z | | | 10.45 | | |
The 30-day SEC yields reflect the portfolio's earning power net of expenses, expressed as an annualized percentage of the public offering price per share at the end of the period.
17
Investment Portfolio – Columbia Total Return Bond Fund
March 31, 2009
| Corporate Fixed-Income Bonds & Notes – 39.1% | |
| | | Par ($) (a) | | Value ($) | |
| Basic Materials – 0.8% | |
| Chemicals – 0.2% | |
| Chemtura Corp. | |
| 6.875% 06/01/16 (b) | | | 115,000 | | | | 51,750 | | |
| Huntsman International LLC | |
| 6.875% 11/15/13 (c) | | EUR | 155,000 | | | | 63,839 | | |
| 7.875% 11/15/14 | | | 185,000 | | | | 75,850 | | |
| Ineos Group Holdings PLC | |
| 8.500% 02/15/16 (c) | | | 315,000 | | | | 18,113 | | |
| Lubrizol Corp. | |
| 6.500% 10/01/34 | | | 1,505,000 | | | | 1,149,293 | | |
| Mosaic Co. | |
| 7.625% 12/01/16 (c) | | | 150,000 | | | | 147,000 | | |
| NOVA Chemicals Corp. | |
| 6.500% 01/15/12 | | | 220,000 | | | | 191,400 | | |
| Terra Capital, Inc. | |
| 7.000% 02/01/17 | | | 205,000 | | | | 188,600 | | |
| Chemicals Total | | | 1,885,845 | | |
| Forest Products & Paper – 0.0% | |
| Cascades, Inc. | |
| 7.250% 02/15/13 | | | 120,000 | | | | 66,900 | | |
| Domtar Corp. | |
| 7.125% 08/15/15 | | | 105,000 | | | | 70,350 | | |
| Georgia-Pacific Corp. | |
| 8.000% 01/15/24 | | | 315,000 | | | | 250,425 | | |
| NewPage Corp. | |
| 10.000% 05/01/12 | | | 120,000 | | | | 41,700 | | |
| Westvaco Corp. | |
| 8.200% 01/15/30 | | | 10,000 | | | | 7,884 | | |
| Forest Products & Paper Total | | | 437,259 | | |
| Iron/Steel – 0.5% | |
| Nucor Corp. | |
| 5.000% 06/01/13 | | | 3,310,000 | | | | 3,463,974 | | |
| 5.850% 06/01/18 | | | 2,085,000 | | | | 2,081,885 | | |
| Russel Metals, Inc. | |
| 6.375% 03/01/14 | | | 115,000 | | | | 92,575 | | |
| Steel Dynamics, Inc. | |
| 7.750% 04/15/16 (c) | | | 310,000 | | | | 212,350 | | |
| United States Steel Corp. | |
| 7.000% 02/01/18 | | | 305,000 | | | | 208,137 | | |
| Iron/Steel Total | | | 6,058,921 | | |
| Metals & Mining – 0.1% | |
| FMG Finance Ltd. | |
| 10.625% 09/01/16 (c) | | | 300,000 | | | | 252,000 | | |
| Freeport-McMoRan Copper & Gold, Inc. | |
| 8.375% 04/01/17 | | | 670,000 | | | | 626,450 | | |
| | | Par ($) (a) | | Value ($) | |
| Noranda Aluminum Holding Corp. | |
| PIK, | |
| 8.345% 11/15/14 (d) | | | 205,000 | | | | 35,657 | | |
| Metals & Mining Total | | | 914,107 | | |
| Basic Materials Total | | | 9,296,132 | | |
| Communications – 4.7% | |
| Media – 1.8% | |
| Cablevision Systems Corp. | |
| 8.000% 04/15/12 | | | 200,000 | | | | 194,500 | | |
Charter Communications
Holdings II LLC | |
| 10.250% 09/15/10 (e) | | | 260,000 | | | | 234,000 | | |
Charter Communications Operating LLC/
Charter Communications
Operating Capital | |
| 8.375% 04/30/14 (c)(e) | | | 90,000 | | | | 79,200 | | |
| 10.875% 09/15/14 (c)(e) | | | 95,000 | | | | 92,150 | | |
| CMP Susquehanna Corp. | |
| 1.000% 05/15/14 (l) | | | 27,000 | | | | 12,150 | | |
| Comcast Cable Holdings LLC | |
| 9.875% 06/15/22 | | | 2,159,000 | | | | 2,431,854 | | |
| Comcast Corp. | |
| 5.700% 05/15/18 | | | 2,000,000 | | | | 1,875,904 | | |
| 6.300% 11/15/17 | | | 3,890,000 | | | | 3,785,059 | | |
| 6.950% 08/15/37 | | | 680,000 | | | | 633,224 | | |
| CSC Holdings, Inc. | |
| 7.625% 04/01/11 | | | 180,000 | | | | 178,650 | | |
| 8.625% 02/15/19 (c) | | | 75,000 | | | | 72,188 | | |
| DirecTV Holdings LLC | |
| 6.375% 06/15/15 | | | 395,000 | | | | 372,288 | | |
| EchoStar DBS Corp. | |
| 6.625% 10/01/14 | | | 415,000 | | | | 371,425 | | |
| Local TV Finance LLC | |
| PIK, | |
| 9.250% 06/15/15 (c) | | | 170,000 | | | | 12,370 | | |
| Quebecor Media, Inc. | |
| 7.750% 03/15/16 | | | 370,000 | | | | 281,200 | | |
| Time Warner Cable, Inc. | |
| 7.300% 07/01/38 | | | 3,485,000 | | | | 3,148,941 | | |
| Time Warner, Inc. | |
| 6.875% 05/01/12 | | | 4,545,000 | | | | 4,625,901 | | |
| TL Acquisitions, Inc. | |
| 10.500% 01/15/15 (c) | | | 385,000 | | | | 197,313 | | |
| Viacom, Inc. | |
| 5.750% 04/30/11 | | | 4,195,000 | | | | 4,086,597 | | |
| Media Total | | | 22,684,914 | | |
See Accompanying Notes to Financial Statements.
18
Columbia Total Return Bond Fund
March 31, 2009
| Corporate Fixed-Income Bonds & Notes (continued) | |
| | | Par ($) (a) | | Value ($) | |
| Telecommunication Services – 2.9% | |
| AT&T, Inc. | |
| 4.950% 01/15/13 | | | 805,000 | | | | 816,636 | | |
| 5.625% 06/15/16 | | | 2,445,000 | | | | 2,450,362 | | |
| 6.550% 02/15/39 | | | 2,715,000 | | | | 2,462,456 | | |
| British Telecommunications PLC | |
| 5.150% 01/15/13 | | | 750,000 | | | | 696,081 | | |
| Citizens Communications Co. | |
| 7.875% 01/15/27 | | | 320,000 | | | | 216,000 | | |
| Cricket Communications, Inc. | |
| 9.375% 11/01/14 | | | 300,000 | | | | 285,750 | | |
| Crown Castle International Corp. | |
| 9.000% 01/15/15 | | | 115,000 | | | | 115,288 | | |
| Deutsche Telekom International Finance BV | |
| 8.500% 06/15/10 | | | 5,505,000 | | | | 5,750,435 | | |
| Digicel Group Ltd. | |
| 8.875% 01/15/15 (c) | | | 400,000 | | | | 258,000 | | |
| Hellas Telecommunications Luxembourg II | |
| 6.844% 01/15/15 (c)(d) | | | 145,000 | | | | 23,925 | | |
| Inmarsat Finance PLC | |
| 10.375% 11/15/12 | | | 315,000 | | | | 322,875 | | |
| Intelsat Jackson Holdings Ltd. | |
| 11.250% 06/15/16 | | | 605,000 | | | | 586,850 | | |
| Lucent Technologies, Inc. | |
| 6.450% 03/15/29 | | | 450,000 | | | | 171,000 | | |
| MetroPCS Wireless, Inc. | |
| 9.250% 11/01/14 | | | 325,000 | | | | 315,250 | | |
| Nextel Communications, Inc. | |
| 7.375% 08/01/15 | | | 345,000 | | | | 182,850 | | |
| Nordic Telephone Co. Holdings ApS | |
| 8.250% 05/01/16 (c) | | EUR | 190,000 | | | | 210,782 | | |
| Orascom Telecom Finance SCA | |
| 7.875% 02/08/14 (c) | | | 170,000 | | | | 108,800 | | |
| Qwest Communications International, Inc. | |
| 7.500% 02/15/14 | | | 445,000 | | | | 384,925 | | |
| Qwest Corp. | |
| 7.500% 06/15/23 | | | 540,000 | | | | 407,700 | | |
| Syniverse Technologies, Inc. | |
| 7.750% 08/15/13 | | | 180,000 | | | | 151,200 | | |
| Telefonica Emisiones SAU | |
| 6.221% 07/03/17 | | | 1,075,000 | | | | 1,101,676 | | |
| 6.421% 06/20/16 | | | 3,700,000 | | | | 3,825,552 | | |
| Time Warner Telecom Holdings, Inc. | |
| 9.250% 02/15/14 | | | 180,000 | | | | 173,700 | | |
| Verizon Communications, Inc. | |
| 6.250% 04/01/37 | | | 1,245,000 | | | | 1,107,476 | | |
| Verizon Wireless Capital LLC | |
| 5.550% 02/01/14 (c) | | | 8,290,000 | | | | 8,296,931 | | |
| 8.500% 11/15/18 (c) | | | 2,630,000 | | | | 3,004,304 | | |
| | | Par ($) (a) | | Value ($) | |
| Virgin Media Finance PLC | |
| 8.750% 04/15/14 | | EUR | 165,000 | | | | 194,009 | | |
| West Corp. | |
| 11.000% 10/15/16 | | | 270,000 | | | | 179,550 | | |
| Wind Acquisition Financial SA | |
| PIK, | |
| 8.393% 12/21/11 (d)(f) | | | 549,561 | | | | 375,596 | | |
| Windstream Corp. | |
| 8.625% 08/01/16 | | | 430,000 | | | | 422,475 | | |
| Telecommunication Services Total | | | 34,598,434 | | |
| Communications Total | | | 57,283,348 | | |
| Consumer Cyclical – 1.7% | |
| Airlines – 0.2% | |
| Continental Airlines, Inc. | |
| 7.461% 04/01/15 | | | 2,561,253 | | | | 1,792,877 | | |
| Airlines Total | | | 1,792,877 | | |
| Apparel – 0.0% | |
| Levi Strauss & Co. | |
| 9.750% 01/15/15 | | | 250,000 | | | | 215,000 | | |
| Apparel Total | | | 215,000 | | |
| Auto Manufacturers – 0.0% | |
| Ford Motor Co. | |
| 7.450% 07/16/31 | | | 340,000 | | | | 107,950 | | |
| General Motors Corp. | |
| 7.200% 01/15/11 | | | 180,000 | | | | 28,800 | | |
| 8.375% 07/15/33 | | | 415,000 | | | | 49,800 | | |
| Auto Manufacturers Total | | | 186,550 | | |
| Auto Parts & Equipment – 0.0% | |
| Commercial Vehicle Group, Inc. | |
| 8.000% 07/01/13 | | | 170,000 | | | | 37,400 | | |
| Cooper-Standard Automotive, Inc. | |
| 7.000% 12/15/12 | | | 60,000 | | | | 7,200 | | |
| Goodyear Tire & Rubber Co. | |
| 9.000% 07/01/15 | | | 272,000 | | | | 209,440 | | |
| Hayes Lemmerz Finance Luxembourg SA | |
| 8.250% 06/15/15 | | EUR | 260,000 | | | | 34,544 | | |
| TRW Automotive, Inc. | |
| 7.000% 03/15/14 (c) | | | 140,000 | | | | 58,800 | | |
| Auto Parts & Equipment Total | | | 347,384 | | |
| Entertainment – 0.0% | |
| Six Flags, Inc. | |
| 9.625% 06/01/14 | | | 171,000 | | | | 15,390 | | |
| WMG Acquisition Corp. | |
| 7.375% 04/15/14 | | | 255,000 | | | | 175,313 | | |
See Accompanying Notes to Financial Statements.
19
Columbia Total Return Bond Fund
March 31, 2009
| Corporate Fixed-Income Bonds & Notes (continued) | |
| | | Par ($) (a) | | Value ($) | |
| WMG Holdings Corp. | |
| (g) 12/15/14 | |
| (9.500% 12/15/09) | | | 280,000 | | | | 100,800 | | |
| Entertainment Total | | | 291,503 | | |
| Home Builders – 0.0% | |
| D.R. Horton, Inc. | |
| 5.625% 09/15/14 | | | 180,000 | | | | 141,300 | | |
| 5.625% 01/15/16 | | | 90,000 | | | | 68,400 | | |
| KB Home | |
| 5.875% 01/15/15 | | | 290,000 | | | | 224,605 | | |
| Home Builders Total | | | 434,305 | | |
| Leisure Time – 0.0% | |
| Town Sports International, Inc. | |
| (h) 02/01/14 | | | 309,000 | | | | 160,680 | | |
| Leisure Time Total | | | 160,680 | | |
| Lodging – 0.1% | |
| Boyd Gaming Corp. | |
| 6.750% 04/15/14 | | | 275,000 | | | | 159,500 | | |
| Harrah's Operating Co., Inc. | |
| 10.000% 12/15/18 (c) | | | 56,000 | | | | 16,800 | | |
| 10.750% 02/01/16 | | | 245,000 | | | | 46,550 | | |
| Jacobs Entertainment, Inc. | |
| 9.750% 06/15/14 | | | 265,000 | | | | 157,012 | | |
| Majestic Star LLC | |
| 9.750% 01/15/11 (b) | | | 330,000 | | | | 23,100 | | |
| Mashantucket Western Pequot Tribe | |
| 8.500% 11/15/15 (c) | | | 410,000 | | | | 69,700 | | |
| MGM Mirage | |
| 7.500% 06/01/16 | | | 470,000 | | | | 164,500 | | |
| Seminole Indian Tribe of Florida | |
| 7.804% 10/01/20 (c) | | | 340,000 | | | | 265,384 | | |
| Snoqualmie Entertainment Authority | |
| 5.384% 02/01/14 (c)(d) | | | 55,000 | | | | 13,750 | | |
| 9.125% 02/01/15 (c) | | | 265,000 | | | | 68,900 | | |
| Starwood Hotels & Resorts Worldwide, Inc. | |
| 6.750% 05/15/18 | | | 150,000 | | | | 99,000 | | |
| Lodging Total | | | 1,084,196 | | |
| Restaurants – 0.3% | |
| McDonald's Corp. | |
| 5.000% 02/01/19 | | | 545,000 | | | | 566,841 | | |
| 5.700% 02/01/39 | | | 3,410,000 | | | | 3,305,044 | | |
| Restaurants Total | | | 3,871,885 | | |
| Retail – 1.1% | |
| AmeriGas Partners LP | |
| 7.125% 05/20/16 | | | 195,000 | | | | 183,300 | | |
| 7.250% 05/20/15 | | | 120,000 | | | | 112,800 | | |
| Best Buy Co., Inc. | |
| 6.750% 07/15/13 | | | 4,605,000 | | | | 4,381,377 | | |
| | | Par ($) (a) | | Value ($) | |
| CVS Pass-Through Trust | |
| 5.298% 01/11/27 (c) | | | 3,010,091 | | | | 2,184,703 | | |
| 6.036% 12/10/28 (c) | | | 3,827,631 | | | | 2,876,503 | | |
| Dollar General Corp. | |
| PIK, | |
| 11.875% 07/15/17 | | | 275,000 | | | | 270,187 | | |
| GameStop Corp./GameStop, Inc. | |
| 8.000% 10/01/12 | | | 140,000 | | | | 141,400 | | |
| Hanesbrands, Inc. | |
| 5.698% 12/15/14 (d) | | | 160,000 | | | | 106,400 | | |
| Inergy LP/Inergy Finance Corp. | |
| 8.250% 03/01/16 | | | 85,000 | | | | 80,750 | | |
| 8.750% 03/01/15 (c) | | | 120,000 | | | | 115,800 | | |
| Phillips-Van Heusen Corp. | |
| 8.125% 05/01/13 | | | 190,000 | | | | 180,500 | | |
| Rite Aid Corp. | |
| 9.500% 06/15/17 | | | 345,000 | | | | 79,350 | | |
| Starbucks Corp. | |
| 6.250% 08/15/17 | | | 3,345,000 | | | | 3,119,664 | | |
| Retail Total | | | 13,832,734 | | |
| Textiles – 0.0% | |
| INVISTA | |
| 9.250% 05/01/12 (c) | | | 120,000 | | | | 107,400 | | |
| Textiles Total | | | 107,400 | | |
| Consumer Cyclical Total | | | 22,324,514 | | |
| Consumer Non-Cyclical – 4.0% | |
| Agriculture – 0.0% | |
| Reynolds American, Inc. | |
| 7.625% 06/01/16 | | | 165,000 | | | | 146,084 | | |
| Agriculture Total | | | 146,084 | | |
| Beverages – 1.1% | |
| Anheuser-Busch InBev Worldwide, Inc. | |
| 7.750% 01/15/19 (c)(i) | | | 5,990,000 | | | | 5,972,635 | | |
| Bottling Group LLC | |
| 5.125% 01/15/19 | | | 1,815,000 | | | | 1,826,676 | | |
| Constellation Brands, Inc. | |
| 8.125% 01/15/12 | | | 210,000 | | | | 210,000 | | |
| Cott Beverages, Inc. | |
| 8.000% 12/15/11 | | | 155,000 | | | | 87,575 | | |
| PepsiCo, Inc. | |
| 7.900% 11/01/18 | | | 680,000 | | | | 835,487 | | |
| SABMiller PLC | |
| 6.200% 07/01/11 (c) | | | 3,720,000 | | | | 3,750,868 | | |
| Beverages Total | | | 12,683,241 | | |
See Accompanying Notes to Financial Statements.
20
Columbia Total Return Bond Fund
March 31, 2009
| Corporate Fixed-Income Bonds & Notes (continued) | |
| | | Par ($) (a) | | Value ($) | |
| Biotechnology – 0.0% | |
| Bio-Rad Laboratories, Inc. | |
| 7.500% 08/15/13 | | | 240,000 | | | | 230,400 | | |
| Biotechnology Total | | | 230,400 | | |
| Commercial Services – 0.1% | |
| ACE Cash Express, Inc. | |
| 10.250% 10/01/14 (c) | | | 190,000 | | | | 47,500 | | |
| ARAMARK Corp. | |
| 8.500% 02/01/15 | | | 210,000 | | | | 193,200 | | |
| Ashtead Holdings PLC | |
| 8.625% 08/01/15 (c) | | | 264,000 | | | | 150,480 | | |
| Corrections Corp. of America | |
| 6.250% 03/15/13 | | | 240,000 | | | | 229,800 | | |
| GEO Group, Inc. | |
| 8.250% 07/15/13 | | | 155,000 | | | | 143,763 | | |
| Iron Mountain, Inc. | |
| 8.000% 06/15/20 | | | 230,000 | | | | 213,900 | | |
| Rental Service Corp. | |
| 9.500% 12/01/14 | | | 215,000 | | | | 105,350 | | |
| Service Corp. International | |
| 6.750% 04/01/16 | | | 190,000 | | | | 165,300 | | |
| 7.375% 10/01/14 | | | 50,000 | | | | 46,500 | | |
| United Rentals North America, Inc. | |
| 6.500% 02/15/12 | | | 135,000 | | | | 108,000 | | |
| Commercial Services Total | | | 1,403,793 | | |
| Food – 1.0% | |
| Campbell Soup Co. | |
| 4.500% 02/15/19 | | | 2,640,000 | | | | 2,631,412 | | |
| ConAgra Foods, Inc. | |
| 7.000% 10/01/28 | | | 4,235,000 | | | | 4,095,419 | | |
| Dean Foods Co. | |
| 7.000% 06/01/16 | | | 225,000 | | | | 213,750 | | |
| Del Monte Corp. | |
| 6.750% 02/15/15 | | | 175,000 | | | | 164,500 | | |
| Kraft Foods, Inc. | |
| 6.500% 08/11/17 | | | 3,065,000 | | | | 3,156,147 | | |
| Kroger Co. | |
| 8.000% 09/15/29 | | | 750,000 | | | | 806,106 | | |
| New Albertson's, Inc. | |
| 8.000% 05/01/31 | | | 345,000 | | | | 282,037 | | |
| Pinnacle Foods Finance LLC | |
| 9.250% 04/01/15 | | | 335,000 | | | | 266,325 | | |
| Reddy Ice Holdings, Inc. | |
| 10.500% 11/01/12 | | | 205,000 | | | | 98,400 | | |
| Tyson Foods, Inc. | |
| 10.500% 03/01/14 (c) | | | 140,000 | | | | 142,800 | | |
| Food Total | | | 11,856,896 | | |
| | | Par ($) (a) | | Value ($) | |
| Healthcare Products – 0.0% | |
| Biomet, Inc. | |
| PIK, | |
| 10.375% 10/15/17 | | | 550,000 | | | | 464,750 | | |
| Healthcare Products Total | | | 464,750 | | |
| Healthcare Services – 0.3% | |
| Community Health Systems, Inc. | |
| 8.875% 07/15/15 | | | 420,000 | | | | 396,900 | | |
| DaVita, Inc. | |
| 7.250% 03/15/15 | | | 165,000 | | | | 158,606 | | |
| HCA, Inc. | |
| 9.250% 11/15/16 | | | 120,000 | | | | 109,200 | | |
| PIK, | |
| 9.625% 11/15/16 | | | 945,000 | | | | 719,311 | | |
| Healthsouth Corp. | |
| 10.750% 06/15/16 | | | 115,000 | | | | 112,700 | | |
| U.S. Oncology Holdings, Inc. | |
| PIK, | |
| 6.904% 03/15/12 (d) | | | 217,000 | | | | 129,507 | | |
| US Oncology, Inc. | |
| 9.000% 08/15/12 | | | 100,000 | | | | 97,000 | | |
| WellPoint, Inc. | |
| 7.000% 02/15/19 | | | 1,840,000 | | | | 1,840,992 | | |
| Healthcare Services Total | | | 3,564,216 | | |
| Household Products/Wares – 0.3% | |
| American Greetings Corp. | |
| 7.375% 06/01/16 | | | 210,000 | | | | 102,900 | | |
| Clorox Co. | |
| 5.950% 10/15/17 | | | 1,390,000 | | | | 1,372,621 | | |
| Fortune Brands, Inc. | |
| 5.125% 01/15/11 | | | 1,565,000 | | | | 1,535,938 | | |
| Jostens IH Corp. | |
| 7.625% 10/01/12 | | | 165,000 | | | | 156,337 | | |
| Household Products/Wares Total | | | 3,167,796 | | |
| Pharmaceuticals – 1.2% | |
| Abbott Laboratories | |
| 5.600% 05/15/11 (i) | | | 7,000,000 | | | | 7,505,673 | | |
| Elan Finance PLC | |
| 5.234% 11/15/11 (d) | | | 70,000 | | | | 57,400 | | |
| 8.875% 12/01/13 | | | 210,000 | | | | 168,000 | | |
| Novartis Securities Investment Ltd. | |
| 5.125% 02/10/19 | | | 4,165,000 | | | | 4,228,816 | | |
| Omnicare, Inc. | |
| 6.750% 12/15/13 | | | 225,000 | | | | 204,188 | | |
| Warner Chilcott Corp. | |
| 8.750% 02/01/15 | | | 225,000 | | | | 216,000 | | |
See Accompanying Notes to Financial Statements.
21
Columbia Total Return Bond Fund
March 31, 2009
| Corporate Fixed-Income Bonds & Notes (continued) | |
| | | Par ($) (a) | | Value ($) | |
| Wyeth | |
| 5.500% 02/15/16 | | | 2,150,000 | | | | 2,186,728 | | |
| Pharmaceuticals Total | | | 14,566,805 | | |
| Consumer Non-Cyclical Total | | | 48,083,981 | | |
| Energy – 4.6% | |
| Coal – 0.0% | |
| Arch Western Finance LLC | |
| 6.750% 07/01/13 | | | 255,000 | | | | 233,325 | | |
| Massey Energy Co. | |
| 6.875% 12/15/13 | | | 395,000 | | | | 343,650 | | |
| Coal Total | | | 576,975 | | |
| Oil & Gas – 2.1% | |
| Canadian Natural Resources Ltd. | |
| 6.250% 03/15/38 | | | 2,125,000 | | | | 1,636,781 | | |
| Chesapeake Energy Corp. | |
| 6.375% 06/15/15 | | | 450,000 | | | | 379,125 | | |
| 9.500% 02/15/15 | | | 45,000 | | | | 43,763 | | |
| Cimarex Energy Co. | |
| 7.125% 05/01/17 | | | 170,000 | | | | 136,850 | | |
| Compton Petroleum Corp. | |
| 7.625% 12/01/13 | | | 215,000 | | | | 67,725 | | |
| Devon Energy Corp. | |
| 6.300% 01/15/19 | | | 1,320,000 | | | | 1,287,891 | | |
| Forest Oil Corp. | |
| 8.500% 02/15/14 (c) | | | 155,000 | | | | 143,762 | | |
| Frontier Oil Corp. | |
| 8.500% 09/15/16 | | | 135,000 | | | | 132,975 | | |
| Gazprom International SA | |
| 7.201% 02/01/20 (c) | | | 2,422,154 | | | | 2,131,495 | | |
| 7.201% 02/01/20 | | | 176,498 | | | | 155,318 | | |
| Hess Corp. | |
| 7.300% 08/15/31 | | | 3,120,000 | | | | 2,714,107 | | |
| KCS Energy, Inc. | |
| 7.125% 04/01/12 | | | 95,000 | | | | 85,975 | | |
| Marathon Oil Corp. | |
| 6.000% 07/01/12 | | | 2,415,000 | | | | 2,453,705 | | |
| 6.000% 10/01/17 | | | 3,000,000 | | | | 2,780,394 | | |
| 7.500% 02/15/19 | | | 1,315,000 | | | | 1,324,848 | | |
| Newfield Exploration Co. | |
| 6.625% 04/15/16 | | | 345,000 | | | | 308,775 | | |
| Nexen, Inc. | |
| 5.875% 03/10/35 | | | 2,745,000 | | | | 1,816,150 | | |
| OPTI Canada, Inc. | |
| 8.250% 12/15/14 | | | 280,000 | | | | 125,300 | | |
| PetroHawk Energy Corp. | |
| 7.875% 06/01/15 (c) | | | 300,000 | | | | 264,000 | | |
| | | Par ($) (a) | | Value ($) | |
| Pioneer Natural Resources Co. | |
| 5.875% 07/15/16 | | | 190,000 | | | | 140,197 | | |
| Pride International, Inc. | |
| 7.375% 07/15/14 | | | 80,000 | | | | 78,800 | | |
| Qatar Petroleum | |
| 5.579% 05/30/11 (c) | | | 1,380,666 | | | | 1,375,157 | | |
| Quicksilver Resources, Inc. | |
| 7.125% 04/01/16 | | | 400,000 | | | | 190,000 | | |
| Range Resources Corp. | |
| 7.500% 05/15/16 | | | 235,000 | | | | 216,788 | | |
| Southwestern Energy Co. | |
| 7.500% 02/01/18 (c) | | | 310,000 | | | | 299,150 | | |
| Talisman Energy, Inc. | |
| 5.850% 02/01/37 | | | 2,210,000 | | | | 1,491,560 | | |
| Tesoro Corp. | |
| 6.625% 11/01/15 | | | 355,000 | | | | 280,450 | | |
| United Refining Co. | |
| 10.500% 08/15/12 | | | 140,000 | | | | 81,200 | | |
| Valero Energy Corp. | |
| 6.625% 06/15/37 | | | 2,720,000 | | | | 1,922,711 | | |
| 6.875% 04/15/12 | | | 2,035,000 | | | | 2,053,828 | | |
| Oil & Gas Total | | | 26,118,780 | | |
| Oil & Gas Services – 1.0% | |
| Halliburton Co. | |
| 5.900% 09/15/18 | | | 4,800,000 | | | | 4,943,429 | | |
| Seitel, Inc. | |
| 9.750% 02/15/14 | | | 165,000 | | | | 73,012 | | |
| Smith International, Inc. | |
| 9.750% 03/15/19 | | | 1,895,000 | | | | 1,979,454 | | |
| Weatherford International Ltd. | |
| 5.150% 03/15/13 | | | 4,090,000 | | | | 3,805,426 | | |
| 7.000% 03/15/38 | | | 1,510,000 | | | | 1,097,802 | | |
| Oil & Gas Services Total | | | 11,899,123 | | |
| Pipelines – 1.5% | |
| Atlas Pipeline Partners LP | |
| 8.125% 12/15/15 | | | 170,000 | | | | 96,900 | | |
| El Paso Corp. | |
| 6.875% 06/15/14 | | | 530,000 | | | | 472,080 | | |
| Enbridge Energy Partners LP | |
| 7.500% 04/15/38 | | | 1,265,000 | | | | 1,008,425 | | |
| Energy Transfer Partners LP | |
| 6.000% 07/01/13 | | | 2,580,000 | | | | 2,439,367 | | |
| Kinder Morgan Energy Partners LP | |
| 6.950% 01/15/38 | | | 2,220,000 | | | | 1,899,665 | | |
| Kinder Morgan Finance Co. ULC | |
| 5.700% 01/05/16 | | | 230,000 | | | | 193,200 | | |
| MarkWest Energy Partners LP | |
| 8.500% 07/15/16 | | | 220,000 | | | | 157,300 | | |
See Accompanying Notes to Financial Statements.
22
Columbia Total Return Bond Fund
March 31, 2009
| Corporate Fixed-Income Bonds & Notes (continued) | |
| | | Par ($) (a) | | Value ($) | |
| ONEOK Partners LP | |
| 6.850% 10/15/37 | | | 1,435,000 | | | | 1,099,991 | | |
| Plains All American Pipeline LP | |
| 6.500% 05/01/18 | | | 2,950,000 | | | | 2,549,756 | | |
| TEPPCO Partners LP | |
| 7.625% 02/15/12 | | | 3,991,000 | | | | 3,949,406 | | |
| TransCanada Pipelines Ltd. | |
| 6.350% 05/15/67 (d) | | | 6,425,000 | | | | 3,662,250 | | |
| Williams Companies, Inc. | |
| 7.625% 07/15/19 | | | 90,000 | | | | 84,150 | | |
| 7.875% 09/01/21 | | | 65,000 | | | | 60,125 | | |
| 8.125% 03/15/12 | | | 70,000 | | | | 71,050 | | |
| Pipelines Total | | | 17,743,665 | | |
| Energy Total | | | 56,338,543 | | |
| Financials – 16.2% | |
| Banks – 12.1% | |
| ANZ National International Ltd. | |
| 6.200% 07/19/13 (c) | | | 5,120,000 | | | | 4,937,047 | | |
| Bank of New York Mellon Corp. | |
| 4.500% 04/01/13 (i) | | | 3,755,000 | | | | 3,721,171 | | |
| 5.125% 08/27/13 | | | 1,105,000 | | | | 1,130,976 | | |
| Capital One Capital IV | |
| 6.745% 02/17/37 (d) | | | 2,815,000 | | | | 959,929 | | |
| Capital One Financial Corp. | |
| 5.700% 09/15/11 | | | 6,635,000 | | | | 5,974,055 | | |
| Chinatrust Commercial Bank | |
| 5.625% 12/29/49 (c)(d) | | | 1,220,000 | | | | 553,098 | | |
| Citibank NA | |
| 1.625% 03/30/11 (q) | | | 50,000,000 | | | | 50,084,450 | | |
| Citicorp Lease Pass-Through Trust | |
| 8.040% 12/15/19 (c) | | | 6,000,000 | | | | 5,633,208 | | |
| Citigroup, Inc. | |
| 6.500% 08/19/13 | | | 7,715,000 | | | | 7,089,429 | | |
| Comerica Bank | |
| 5.200% 08/22/17 | | | 2,750,000 | | | | 1,907,164 | | |
| 5.750% 11/21/16 | | | 615,000 | | | | 454,977 | | |
| Deutsche Bank AG | |
| 4.875% 05/20/13 | | | 6,800,000 | | | | 6,669,848 | | |
| GMAC LLC | |
| 6.875% 09/15/11 (c) | | | 266,000 | | | | 189,025 | | |
| 8.000% 11/01/31 (c) | | | 417,000 | | | | 200,644 | | |
| Goldman Sachs Capital II | |
| 5.793% 12/29/49 (d) | | | 755,000 | | | | 314,337 | | |
| Goldman Sachs Group, Inc. | |
| 1.700% 03/15/11 (q) | | | 4,928,000 | | | | 4,945,563 | | |
| 6.250% 09/01/17 (i) | | | 3,121,000 | | | | 2,892,162 | | |
| HSBC Bank USA | |
| 3.875% 09/15/09 | | | 6,645,000 | | | | 6,565,121 | | |
| | | Par ($) (a) | | Value ($) | |
| JPMorgan Chase & Co. | |
| 6.000% 01/15/18 | | | 2,445,000 | | | | 2,469,653 | | |
| KeyBank NA | |
| 5.800% 07/01/14 | | | 1,900,000 | | | | 1,589,040 | | |
| Keycorp | |
| 6.500% 05/14/13 | | | 6,755,000 | | | | 6,591,765 | | |
| Lloyds TSB Group PLC | |
| 6.267% 12/31/49 (c)(d) | | | 3,200,000 | | | | 688,000 | | |
| M&I Marshall & Ilsley Bank | |
| 5.300% 09/08/11 | | | 2,690,000 | | | | 2,485,824 | | |
| Merrill Lynch & Co., Inc. | |
| 5.700% 05/02/17 (j) | | | 3,535,000 | | | | 2,093,123 | | |
| 6.150% 04/25/13 (j) | | | 4,615,000 | | | | 3,879,355 | | |
| 7.750% 05/14/38 (j) | | | 2,235,000 | | | | 1,326,750 | | |
| National Australia Bank Ltd. | |
| 5.350% 06/12/13 (c) | | | 1,870,000 | | | | 1,810,057 | | |
| National City Bank of Cleveland | |
| 6.200% 12/15/11 | | | 890,000 | | | | 874,378 | | |
| National City Bank of Kentucky | |
| 6.300% 02/15/11 | | | 1,585,000 | | | | 1,557,017 | | |
| National City Corp. | |
| 4.900% 01/15/15 | | | 540,000 | | | | 496,787 | | |
| 6.875% 05/15/19 | | | 1,840,000 | | | | 1,557,794 | | |
| Northern Trust Co. | |
| 6.500% 08/15/18 | | | 5,805,000 | | | | 6,099,255 | | |
| Northern Trust Corp. | |
| 5.500% 08/15/13 | | | 2,415,000 | | | | 2,527,534 | | |
| Regions Financing Trust II | |
| 6.625% 05/15/47 (d) | | | 1,520,000 | | | | 550,585 | | |
| Union Planters Corp. | |
| 4.375% 12/01/10 | | | 2,955,000 | | | | 2,824,398 | | |
| USB Capital IX | |
| 6.189% 04/15/42 (d) | | | 3,550,000 | | | | 1,402,250 | | |
| Wachovia Capital Trust III | |
| 5.800% 03/15/42 (d) | | | 5,505,000 | | | | 1,981,800 | | |
| Wachovia Corp. | |
| 5.500% 05/01/13 | | | 1,045,000 | | | | 963,545 | | |
| Banks Total | | | 147,991,114 | | |
| Diversified Financial Services – 1.6% | |
| Eaton Vance Corp. | |
| 6.500% 10/02/17 | | | 3,015,000 | | | | 2,586,598 | | |
| Ford Motor Credit Co. | |
| 7.800% 06/01/12 | | | 350,000 | | | | 237,204 | | |
| 8.000% 12/15/16 | | | 130,000 | | | | 85,440 | | |
| Fund American Companies, Inc. | |
| 5.875% 05/15/13 | | | 3,225,000 | | | | 2,475,952 | | |
| General Electric Capital Corp. | |
| 5.450% 01/15/13 | | | 4,070,000 | | | | 3,919,451 | | |
| 6.875% 01/10/39 | | | 6,800,000 | | | | 5,546,012 | | |
See Accompanying Notes to Financial Statements.
23
Columbia Total Return Bond Fund
March 31, 2009
| Corporate Fixed-Income Bonds & Notes (continued) | |
| | | Par ($) (a) | | Value ($) | |
| International Lease Finance Corp. | |
| 4.875% 09/01/10 | | | 3,885,000 | | | | 2,838,020 | | |
| Lehman Brothers Holdings, Inc. | |
| 5.625% 01/24/13 (k)(l) | | | 11,045,000 | | | | 1,408,237 | | |
| 6.875% 05/02/18 (k)(l) | | | 660,000 | | | | 84,150 | | |
| Nuveen Investments, Inc. | |
| 10.500% 11/15/15 (c) | | | 230,000 | | | | 64,400 | | |
| Diversified Financial Services Total | | | 19,245,464 | | |
| Insurance – 1.7% | |
| Asurion Corp. | |
| 7.033% 07/02/15 (d)(f) | | | 210,000 | | | | 161,553 | | |
| Crum & Forster Holdings Corp. | |
| 7.750% 05/01/17 | | | 250,000 | | | | 195,000 | | |
| HUB International Holdings, Inc. | |
| 10.250% 06/15/15 (c) | | | 260,000 | | | | 123,500 | | |
| ING Groep NV | |
| 5.775% 12/29/49 (d) | | | 2,460,000 | | | | 676,500 | | |
| Liberty Mutual Group, Inc. | |
| 7.500% 08/15/36 (c) | | | 5,775,000 | | | | 3,244,262 | | |
| 10.750% 06/15/58 (c)(d) | | | 2,815,000 | | | | 1,379,350 | | |
| MetLife, Inc. | |
| 7.717% 02/15/19 | | | 4,100,000 | | | | 3,676,310 | | |
| New York Life Global Funding | |
| 4.650% 05/09/13 (c) | | | 8,400,000 | | | | 8,179,761 | | |
| Principal Life Income Funding Trusts | |
| 5.300% 04/24/13 | | | 4,100,000 | | | | 3,766,613 | | |
| USI Holdings Corp. | |
| 9.750% 05/15/15 (c) | | | 180,000 | | | | 81,000 | | |
| Insurance Total | | | 21,483,849 | | |
| Real Estate Investment Trusts (REITs) – 0.7% | |
| Camden Property Trust | |
| 5.375% 12/15/13 | | | 5,483,000 | | | | 4,185,475 | | |
| Highwoods Properties, Inc. | |
| 5.850% 03/15/17 | | | 1,040,000 | | | | 643,110 | | |
| Hospitality Properties Trust | |
| 5.625% 03/15/17 | | | 2,730,000 | | | | 1,316,510 | | |
| Host Marriott Corp. | |
| 6.750% 06/01/16 | | | 205,000 | | | | 149,650 | | |
| Liberty Property LP | |
| 5.500% 12/15/16 | | | 3,310,000 | | | | 2,138,257 | | |
| Real Estate Investment Trusts (REITs) Total | | | 8,433,002 | | |
| Savings & Loans – 0.1% | |
| Washington Mutual Bank | |
| 5.125% 01/15/15 (b) | | | 6,935,000 | | | | 693 | | |
| World Savings Bank | |
| 4.500% 06/15/09 | | | 1,125,000 | | | | 1,123,478 | | |
| Savings & Loans Total | | | 1,124,171 | | |
| Financials Total | | | 198,277,600 | | |
| | | Par ($) (a) | | Value ($) | |
| Industrials – 2.1% | |
| Aerospace & Defense – 0.5% | |
| BE Aerospace, Inc. | |
| 8.500% 07/01/18 | | | 285,000 | | | | 237,619 | | |
| Boeing Co. | |
| 6.000% 03/15/19 | | | 2,185,000 | | | | 2,244,176 | | |
| L-3 Communications Corp. | |
| 6.375% 10/15/15 | | | 220,000 | | | | 207,350 | | |
| Moog, Inc. | |
| 7.250% 06/15/18 (c) | | | 75,000 | | | | 69,188 | | |
| Raytheon Co. | |
| 5.375% 04/01/13 | | | 2,200,000 | | | | 2,308,156 | | |
| 7.200% 08/15/27 | | | 830,000 | | | | 913,291 | | |
| Sequa Corp. | |
| 11.750% 12/01/15 (c) | | | 260,000 | | | | 39,000 | | |
| Aerospace & Defense Total | | | 6,018,780 | | |
| Electrical Components & Equipment – 0.1% | |
| Belden, Inc. | |
| 7.000% 03/15/17 | | | 165,000 | | | | 135,300 | | |
| General Cable Corp. | |
| 3.810% 04/01/15 (d) | | | 125,000 | | | | 88,437 | | |
| 7.125% 04/01/17 | | | 145,000 | | | | 118,900 | | |
| Electrical Components & Equipment Total | | | 342,637 | | |
| Electronics – 0.0% | |
| Flextronics International Ltd. | |
| 6.250% 11/15/14 | | | 250,000 | | | | 211,250 | | |
| Electronics Total | | | 211,250 | | |
| Engineering & Construction – 0.0% | |
| Esco Corp. | |
| 8.625% 12/15/13 (c) | | | 160,000 | | | | 121,600 | | |
| Engineering & Construction Total | | | 121,600 | | |
| Environmental Control – 0.0% | |
| Allied Waste North America, Inc. | |
| 7.875% 04/15/13 | | | 250,000 | | | | 248,750 | | |
| Environmental Control Total | | | 248,750 | | |
| Machinery – 0.4% | |
| Caterpillar Financial Services Corp. | |
| 4.250% 02/08/13 | | | 2,315,000 | | | | 2,178,130 | | |
| 5.450% 04/15/18 | | | 715,000 | | | | 613,431 | | |
| 6.200% 09/30/13 | | | 415,000 | | | | 415,398 | | |
| John Deere Capital Corp. | |
| 4.950% 12/17/12 | | | 1,670,000 | | | | 1,676,248 | | |
| Machinery Total | | | 4,883,207 | | |
| Machinery-Construction & Mining – 0.2% | |
| Caterpillar, Inc. | |
| 8.250% 12/15/38 | | | 2,395,000 | | | | 2,594,971 | | |
See Accompanying Notes to Financial Statements.
24
Columbia Total Return Bond Fund
March 31, 2009
| Corporate Fixed-Income Bonds & Notes (continued) | |
| | | Par ($) (a) | | Value ($) | |
| Terex Corp. | |
| 8.000% 11/15/17 | | | 260,000 | | | | 210,600 | | |
| Machinery-Construction & Mining Total | | | 2,805,571 | | |
| Machinery-Diversified – 0.0% | |
| Manitowoc Co., Inc. | |
| 7.125% 11/01/13 | | �� | 280,000 | | | | 196,000 | | |
| Westinghouse Air Brake Technologies Corp. | |
| 6.875% 07/31/13 | | | 90,000 | | | | 85,500 | | |
| Machinery-Diversified Total | | | 281,500 | | |
| Miscellaneous Manufacturing – 0.1% | |
| American Railcar Industries, Inc. | |
| 7.500% 03/01/14 | | | 185,000 | | | | 128,575 | | |
| Bombardier, Inc. | |
| 6.300% 05/01/14 (c) | | | 310,000 | | | | 218,550 | | |
| Koppers Holdings, Inc. | |
| (g) 11/15/14 | |
| (9.875% 11/15/09) | | | 165,000 | | | | 134,475 | | |
| TriMas Corp. | |
| 9.875% 06/15/12 | | | 224,000 | | | | 109,760 | | |
| Trinity Industries, Inc. | |
| 6.500% 03/15/14 | | | 155,000 | | | | 125,550 | | |
| Miscellaneous Manufacturing Total | | | 716,910 | | |
| Packaging & Containers – 0.1% | |
| Berry Plastics Holding Corp. | |
| 8.875% 09/15/14 | | | 125,000 | | | | 70,000 | | |
| Crown Americas LLC & Crown Americas Capital Corp. | |
| 7.750% 11/15/15 | | | 200,000 | | | | 201,000 | | |
| Owens-Brockway Glass Container, Inc. | |
| 8.250% 05/15/13 | | | 200,000 | | | | 201,000 | | |
| Silgan Holdings, Inc. | |
| 6.750% 11/15/13 | | | 65,000 | | | | 61,100 | | |
| Solo Cup Co. | |
| 8.500% 02/15/14 | | | 375,000 | | | | 273,750 | | |
| Packaging & Containers Total | | | 806,850 | | |
| Transportation – 0.7% | |
| BNSF Funding Trust I | |
| 6.613% 12/15/55 (d) | | | 2,450,000 | | | | 1,776,250 | | |
| Bristow Group, Inc. | |
| 7.500% 09/15/17 | | | 140,000 | | | | 105,000 | | |
| Burlington Northern Santa Fe Corp. | |
| 6.200% 08/15/36 | | | 900,000 | | | | 820,818 | | |
| Navios Maritime Holdings, Inc. | |
| 9.500% 12/15/14 | | | 205,000 | | | | 116,850 | | |
| PHI, Inc. | |
| 7.125% 04/15/13 | | | 205,000 | | | | 126,331 | | |
| Ship Finance International Ltd. | |
| 8.500% 12/15/13 | | | 205,000 | | | | 139,400 | | |
| | | Par ($) (a) | | Value ($) | |
| TFM SA de CV | |
| 9.375% 05/01/12 | | | 320,000 | | | | 291,200 | | |
| Union Pacific Corp. | |
| 5.700% 08/15/18 | | | 2,775,000 | | | | 2,641,351 | | |
| 6.650% 01/15/11 | | | 2,635,000 | | | | 2,746,542 | | |
| Transportation Total | | | 8,763,742 | | |
| Industrials Total | | | 25,200,797 | | |
| Technology – 0.8% | |
| Computers – 0.0% | |
| Sungard Data Systems, Inc. | |
| 9.125% 08/15/13 | | | 265,000 | | | | 230,550 | | |
| Computers Total | | | 230,550 | | |
| Networking & Telecom Equipment – 0.2% | |
| Cisco Systems, Inc. | |
| 5.900% 02/15/39 | | | 3,315,000 | | | | 3,045,878 | | |
| Networking & Telecom Equipment Total | | | 3,045,878 | | |
| Semiconductors – 0.0% | |
| Amkor Technology, Inc. | |
| 9.250% 06/01/16 | | | 140,000 | | | | 107,800 | | |
| Freescale Semiconductor, Inc. | |
| PIK, | |
| 9.125% 12/15/14 | | | 151,782 | | | | 61,076 | | |
| Semiconductors Total | | | 168,876 | | |
| Software – 0.6% | |
| Oracle Corp. | |
| 5.000% 01/15/11 | | | 4,005,000 | | | | 4,198,806 | | |
| 6.500% 04/15/38 | | | 3,050,000 | | | | 3,041,997 | | |
| Software Total | | | 7,240,803 | | |
| Technology Total | | | 10,686,107 | | |
| Utilities – 4.2% | |
| Electric – 3.7% | |
| AEP Texas Central Co. | |
| 6.650% 02/15/33 | | | 2,830,000 | | | | 2,407,034 | | |
| AES Corp. | |
| 8.000% 10/15/17 | | | 315,000 | | | | 270,112 | | |
| CMS Energy Corp. | |
| 6.875% 12/15/15 | | | 160,000 | | | | 148,155 | | |
| Commonwealth Edison Co. | |
| 4.700% 04/15/15 | | | 1,125,000 | | | | 1,028,589 | | |
| 5.900% 03/15/36 | | | 815,000 | | | | 667,402 | | |
| 5.950% 08/15/16 | | | 3,430,000 | | | | 3,284,688 | | |
| 6.950% 07/15/18 | | | 1,630,000 | | | | 1,525,543 | | |
See Accompanying Notes to Financial Statements.
25
Columbia Total Return Bond Fund
March 31, 2009
| Corporate Fixed-Income Bonds & Notes (continued) | |
| | | Par ($) (a) | | Value ($) | |
| Consolidated Edison Co. of New York, Inc. | |
| 6.750% 04/01/38 | | | 5,035,000 | | | | 4,928,485 | | |
| Duke Energy Corp. | |
| 5.300% 10/01/15 | | | 6,000,000 | | | | 6,200,826 | | |
| Dynegy Holdings, Inc. | |
| 7.125% 05/15/18 | | | 450,000 | | | | 238,500 | | |
| Edison Mission Energy | |
| 7.000% 05/15/17 | | | 190,000 | | | | 138,700 | | |
| Energy Future Holdings Corp. | |
| PIK, | |
| 11.250% 11/01/17 | | | 510,000 | | | | 191,568 | | |
| Exelon Generation Co. LLC | |
| 6.200% 10/01/17 (i) | | | 3,000,000 | | | | 2,682,546 | | |
| 6.950% 06/15/11 | | | 800,000 | | | | 816,866 | | |
| FPL Energy National Wind LLC | |
| 5.608% 03/10/24 (c) | | | 491,933 | | | | 400,630 | | |
| Hydro Quebec | |
| 8.500% 12/01/29 | | | 1,510,000 | | | | 2,143,631 | | |
| Intergen NV | |
| 9.000% 06/30/17 (c) | | | 460,000 | | | | 416,300 | | |
| Ipalco Enterprises, Inc. | |
| 7.250% 04/01/16 (c) | | | 165,000 | | | | 146,025 | | |
| Kansas City Power & Light Co. | |
| 7.150% 04/01/19 | | | 4,965,000 | | | | 4,987,452 | | |
| MidAmerican Energy Holdings Co. | |
| 5.000% 02/15/14 | | | 3,300,000 | | | | 3,302,907 | | |
| Mirant Americas Generation LLC | |
| 8.500% 10/01/21 | | | 365,000 | | | | 270,100 | | |
| Mirant North America LLC | |
| 7.375% 12/31/13 | | | 65,000 | | | | 58,825 | | |
| NRG Energy, Inc. | |
| 7.375% 02/01/16 | | | 315,000 | | | | 292,950 | | |
| NSG Holdings LLC/NSG Holdings, Inc. | |
| 7.750% 12/15/25 (c) | | | 225,000 | | | | 177,750 | | |
| Oncor Electric Delivery Co. | |
| 5.950% 09/01/13 (c) | | | 3,110,000 | | | | 3,012,993 | | |
| Pacific Gas & Electric Co. | |
| 4.200% 03/01/11 | | | 3,476,000 | | | | 3,529,652 | | |
| Southern Power Co. | |
| 6.375% 11/15/36 | | | 965,000 | | | | 794,080 | | |
| Texas Competitive Electric Holdings Co.LLC | |
| PIK, | |
| 10.500% 11/01/16 | | | 595,000 | | | | 194,119 | | |
| Windsor Financing LLC | |
| 5.881% 07/15/17 (c) | | | 1,348,457 | | | | 1,192,266 | | |
| Electric Total | | | 45,448,694 | | |
| Gas – 0.5% | |
| Atmos Energy Corp. | |
| 6.350% 06/15/17 | | | 2,065,000 | | | | 1,852,792 | | |
| 8.500% 03/15/19 | | | 2,540,000 | | | | 2,593,383 | | |
| | | Par ($) (a) | | Value ($) | |
| Centerpoint Energy, Inc. | |
| 5.950% 02/01/17 | | | 30,000 | | | | 24,880 | | |
| 6.500% 05/01/18 | | | 50,000 | | | | 41,845 | | |
| Nakilat, Inc. | |
| 6.067% 12/31/33 (c) | | | 2,140,000 | | | | 1,447,753 | | |
| Gas Total | | | 5,960,653 | | |
| Utilities Total | | | 51,409,347 | | |
Total Corporate Fixed-Income Bonds & Notes
(cost of $548,094,598) | | | 478,900,369 | | |
| Mortgage-Backed Securities – 30.4% | |
| Federal Home Loan Mortgage Corp. | |
| 5.000% 03/01/37 | | | 7,686,267 | | | | 7,936,013 | | |
| 5.000% 04/01/37 | | | 18,143,718 | | | | 18,733,254 | | |
| 5.500% 12/01/17 | | | 137,243 | | | | 144,094 | | |
| 5.500% 12/01/18 | | | 1,122,630 | | | | 1,175,861 | | |
| 5.500% 07/01/19 | | | 854,284 | | | | 893,190 | | |
| 5.500% 04/01/37 | | | 48,789 | | | | 50,680 | | |
| 6.000% 05/01/17 | | | 71,401 | | | | 75,211 | | |
| 6.500% 10/01/37 | | | 25,293,169 | | | | 26,695,220 | | |
| 8.000% 11/01/09 | | | 1,881 | | | | 1,925 | | |
| 8.000% 04/01/10 | | | 1,966 | | | | 2,031 | | |
| 8.500% 11/01/26 | | | 137,202 | | | | 150,549 | | |
| Federal National Mortgage Association | |
| 4.000% 03/01/39 | | | 60,000,000 | | | | 60,328,125 | | |
| 4.500% 02/01/39 | | | 96,039,352 | | | | 98,249,945 | | |
| 4.500% 03/01/39 | | | 27,351,825 | | | | 27,981,398 | | |
| 5.000% 05/01/36 | | | 9,102,060 | | | | 9,412,810 | | |
| 5.000% 03/01/38 | | | 29,321,412 | | | | 30,288,743 | | |
| 5.199% 08/01/36 (d) | | | 35,772 | | | | 36,496 | | |
| 5.500% 05/01/37 | | | 7,027,635 | | | | 7,301,208 | | |
| 5.500% 06/01/38 | | | 31,337,820 | | | | 32,557,743 | | |
| 5.839% 07/01/37 (d) | | | 735,551 | | | | 757,518 | | |
| 5.911% 06/01/32 (d) | | | 21,755 | | | | 22,522 | | |
| 6.000% 05/01/38 | | | 2,613,891 | | | | 2,733,130 | | |
| 6.080% 07/01/32 (d) | | | 286,787 | | | | 298,113 | | |
| 6.500% 09/01/36 | | | 7,340,663 | | | | 7,742,034 | | |
| 6.500% 07/01/37 | | | 6,988,855 | | | | 7,370,990 | | |
| 6.500% 10/01/37 | | | 1,268,213 | | | | 1,337,485 | | |
| 6.500% 12/01/37 | | | 18,901,966 | | | | 19,934,419 | | |
| 6.500% 03/01/38 | | | 7,929,157 | | | | 8,362,260 | | |
| 7.000% 10/01/11 | | | 65,385 | | | | 67,795 | | |
| 8.000% 12/01/09 | | | 8,128 | | | | 8,177 | | |
| 10.000% 09/01/18 | | | 53,375 | | | | 59,988 | | |
| Government National Mortgage Association | |
| 7.000% 01/15/30 | | | 767,028 | | | | 823,923 | | |
| 7.500% 12/15/23 | | | 760,477 | | | | 817,726 | | |
| 7.500% 07/20/28 | | | 289,421 | | | | 310,928 | | |
| 8.000% 05/15/17 | | | 10,380 | | | | 11,161 | | |
See Accompanying Notes to Financial Statements.
26
Columbia Total Return Bond Fund
March 31, 2009
| Mortgage-Backed Securities (continued) | |
| | | Par ($) (a) | | Value ($) | |
| 8.500% 02/15/25 | | | 87,729 | | | | 94,907 | | |
| 9.500% 09/15/09 | | | 69 | | | | 71 | | |
| 13.000% 01/15/11 | | | 1,173 | | | | 1,264 | | |
| 13.000% 02/15/11 | | | 669 | | | | 732 | | |
Total Mortgage-Backed Securities
(cost of $364,135,451) | | | 372,769,639 | | |
| Commercial Mortgage-Backed Securities – 11.9% | |
| Bear Stearns Commercial Mortgage Securities | |
| 4.674% 06/11/41 | | | 11,460,000 | | | | 9,018,251 | | |
| 4.740% 03/13/40 | | | 640,000 | | | | 572,901 | | |
| 4.750% 02/13/46 (d) | | | 5,060,000 | | | | 3,894,558 | | |
| 4.830% 08/15/38 | | | 3,530,000 | | | | 3,294,586 | | |
| 4.933% 02/13/42 (d) | | | 6,960,000 | | | | 5,437,977 | | |
| 5.693% 09/11/38 (d) | | | 482,000 | | | | 414,944 | | |
| 5.742% 09/11/42 (d) | | | 3,670,000 | | | | 2,748,496 | | |
| Chase Commercial Mortgage Securities Corp. | |
| 5.857% 02/12/16 (c)(d) | | | 13,600,000 | | | | 13,512,054 | | |
| Credit Suisse Mortgage Capital Certificates | |
| 5.827% 06/15/38 (d) | | | 15,000,000 | | | | 10,104,741 | | |
| CS First Boston Mortgage Securities Corp. | |
| 4.577% 04/15/37 | | | 2,319,000 | | | | 2,209,498 | | |
| GE Capital Commercial Mortgage Corp. | |
| 5.189% 07/10/39 (d) | | | 14,309,000 | | | | 11,835,984 | | |
| GMAC Commercial Mortgage Securities, Inc. | |
| 1.109% 07/15/29 (d) | | | 8,259,375 | | | | 363,873 | | |
| Greenwich Capital Commercial Funding Corp. | |
| 4.533% 01/05/36 | | | 1,666,000 | | | | 1,569,346 | | |
| JPMorgan Chase Commercial Mortgage Securities Corp. | |
| 5.050% 12/12/34 | | | 7,975,000 | | | | 7,477,939 | | |
| 5.440% 06/12/47 | | | 3,015,000 | | | | 1,945,882 | | |
| 5.814% 06/12/43 (d) | | | 7,260,000 | | | | 5,135,254 | | |
| LB-UBS Commercial Mortgage Trust | |
| 4.853% 09/15/31 | | | 3,555,000 | | | | 3,360,279 | | |
| 5.084% 02/15/31 | | | 10,080,000 | | | | 9,227,073 | | |
| 6.462% 03/15/31 | | | 7,330,000 | | | | 7,321,704 | | |
| Merrill Lynch Mortgage Investors, Inc. | |
| I.O., | |
| 0.379% 12/15/30 (d) | | | 25,693,631 | | | | 419,780 | | |
| Merrill Lynch Mortgage Trust | |
| 4.747% 06/12/43 (d) | | | 6,450,000 | | | | 4,676,396 | | |
| Morgan Stanley Capital I | |
| 4.989% 08/13/42 | | | 4,090,000 | | | | 3,290,299 | | |
| 5.208% 11/14/42 (d) | | | 3,710,000 | | | | 2,897,400 | | |
| Morgan Stanley Dean Witter Capital I | |
| 5.980% 01/15/39 | | | 2,275,000 | | | | 2,219,497 | | |
| Wachovia Bank Commercial Mortgage Trust | |
| 5.209% 10/15/44 (d) | | | 12,960,000 | | | | 10,291,790 | | |
| 5.416% 01/15/45 (d) | | | 5,000,000 | | | | 3,880,476 | | |
| 5.418% 01/15/45 (d) | | | 9,000,000 | | | | 7,016,225 | | |
| 5.609% 03/15/45 (d) | | | 5,635,000 | | | | 2,737,366 | | |
| | | Par ($) (a) | | Value ($) | |
| 5.726% 06/15/45 | | | 5,441,579 | | | | 5,436,647 | | |
| 5.903% 02/15/51 (d) | | | 7,000,000 | | | | 3,143,896 | | |
Total Commercial Mortgage-Backed Securities
(cost of $175,399,864) | | | 145,455,112 | | |
| Asset-Backed Securities – 7.6% | |
| Bombardier Capital Mortgage Securitization Corp. | |
| 6.230% 04/15/28 | | | 98,079 | | | | 80,048 | | |
| Capital One Multi-Asset Execution Trust | |
| 0.536% 08/15/12 (d) | | | 6,265,000 | | | | 6,160,780 | | |
| 4.850% 11/15/13 | | | 3,905,000 | | | | 3,883,544 | | |
| 4.850% 02/18/14 | | | 5,000,000 | | | | 4,949,728 | | |
| Carmax Auto Owner Trust | |
| 5.270% 11/15/12 | | | 12,500,000 | | | | 11,819,267 | | |
| Chase Issuance Trust | |
| 4.260% 05/15/13 | | | 5,875,000 | | | | 5,853,765 | | |
| Contimortgage Home Equity Trust | |
| 6.880% 01/15/28 | | | 111,531 | | | | 80,849 | | |
| 8.180% 12/25/29 (d) | | | 89,507 | | | | 88,833 | | |
| Daimler Chrysler Auto Trust | |
| 4.940% 02/08/12 | | | 8,935,000 | | | | 8,650,391 | | |
| Discover Card Master Trust | |
| 5.100% 10/15/13 | | | 5,000,000 | | | | 4,906,448 | | |
| First Alliance Mortgage Loan Trust | |
| 7.625% 07/25/25 | | | 751,037 | | | | 523,758 | | |
| First Plus Home Loan Trust | |
| 7.720% 05/10/24 (d) | | | 97,921 | | | | 97,445 | | |
| Ford Credit Auto Owner Trust | |
| 4.950% 03/15/13 | | | 7,500,000 | | | | 6,946,770 | | |
| 5.160% 04/15/13 | | | 5,650,000 | | | | 5,246,139 | | |
| Franklin Auto Trust | |
| 5.360% 05/20/16 | | | 3,200,000 | | | | 3,067,211 | | |
| Harley-Davidson Motorcycle Trust | |
| 2.960% 02/15/12 | | | 332,786 | | | | 299,103 | | |
| Honda Auto Receivables Owner Trust | |
| 4.470% 01/18/12 | | | 7,550,000 | | | | 7,642,253 | | |
| IMC Home Equity Loan Trust | |
| 7.500% 04/25/26 | | | 205,068 | | | | 204,430 | | |
| Long Beach Auto Receivables Trust | |
| 4.250% 04/15/12 | | | 3,471,447 | | | | 3,305,636 | | |
| Master Asset Backed Securities Trust | |
| 0.662% 02/25/36 (d) | | | 107,576 | | | | 106,334 | | |
| Money Store Home Equity Trust | |
| 0.856% 08/15/29 (d) | | | 3,578,697 | | | | 1,268,895 | | |
| Morgan Stanley Mortgage Loan Trust | |
| 0.642% 10/25/36 (d) | | | 961,565 | | | | 875,347 | | |
| SACO I, Inc. | |
| 0.722% 04/25/35 (c)(d) | | | 291,667 | | | | 93,212 | | |
| SLM Student Loan Trust | |
| 1.380% 03/15/17 (d) | | | 3,600,688 | | | | 3,311,383 | | |
| 1.400% 12/15/20 (d) | | | 9,792,000 | | | | 8,465,019 | | |
See Accompanying Notes to Financial Statements.
27
Columbia Total Return Bond Fund
March 31, 2009
| Asset-Backed Securities (continued) | |
| | | Par ($) (a) | | Value ($) | |
| USAA Auto Owner Trust | |
| 4.280% 10/15/12 | | | 5,350,000 | | | | 5,403,798 | | |
Total Asset-Backed Securities
(cost of $100,252,879) | | | 93,330,386 | | |
| Government & Agency Obligations – 6.9% | |
| Foreign Government Obligations – 5.1% | |
| African Development Bank | |
| 1.950% 03/23/10 | | JPY | 497,000,000 | | | | 5,073,572 | | |
| Aries Vermoegensverwaltungs GmbH | |
| 7.750% 10/25/09 | | EUR | 750,000 | | | | 1,024,849 | | |
| Belgium Government Bond | |
| 3.750% 09/28/15 | | EUR | 1,305,000 | | | | 1,754,178 | | |
| Canada Housing Trust No. 1 | |
| 3.950% 12/15/11 (c) | | CAD | 760,000 | | | | 640,147 | | |
| Corp. Andina de Fomento | |
| 6.375% 06/18/09 | | EUR | 870,000 | | | | 1,146,045 | | |
| Eksportfinans A/S | |
| 1.600% 03/20/14 | | JPY | 150,000,000 | | | | 1,418,712 | | |
| 1.800% 06/21/10 | | JPY | 310,000,000 | | | | 3,148,749 | | |
| European Investment Bank | |
| 0.400% 09/21/11 (d) | | JPY | 435,000,000 | | | | 4,312,927 | | |
| 1.250% 09/20/12 | | JPY | 50,000,000 | | | | 504,489 | | |
| 1.400% 06/20/17 | | JPY | 68,300,000 | | | | 673,590 | | |
| 5.500% 12/07/11 | | GBP | 190,000 | | | | 294,589 | | |
| Federal Republic of Germany | |
| 4.250% 07/04/14 | | EUR | 1,425,000 | | | | 2,075,784 | | |
| 4.250% 07/04/17 | | EUR | 3,850,000 | | | | 5,633,168 | | |
| Government of Canada | |
| 4.000% 06/01/16 | | CAD | 330,000 | | | | 292,629 | | |
| 4.500% 06/01/15 | | CAD | 325,000 | | | | 295,480 | | |
| International American Development Bank | |
| 1.900% 07/08/09 | | JPY | 330,000,000 | | | | 3,344,954 | | |
| Japan Finance Organization for Municipal Enterprises | |
| 1.900% 06/22/18 | | JPY | 60,000,000 | | | | 615,234 | | |
| Kingdom of Norway | |
| 6.000% 05/16/11 | | NOK | 4,155,000 | | | | 667,285 | | |
| Kingdom of Sweden | |
| 4.000% 12/01/09 | | SEK | 1,405,000 | | | | 175,123 | | |
| 5.500% 10/08/12 | | SEK | 3,580,000 | | | | 489,982 | | |
| Kreditanstalt fuer Wiederaufbau | |
| 0.443% 08/08/11 (d) | | JPY | 400,000,000 | | | | 4,041,687 | | |
| 4.375% 03/15/18 | | | 4,210,000 | | | | 4,396,684 | | |
| New South Wales Treasury Corp. | |
| 5.500% 08/01/14 | | AUD | 330,000 | | | | 236,231 | | |
| Province of Ontario | |
| 1.875% 01/25/10 | | JPY | 415,000,000 | | | | 4,208,910 | | |
| Province of Quebec | |
| 5.125% 11/14/16 | | | 3,060,000 | | | | 3,163,251 | | |
| 6.000% 10/01/12 | | CAD | 550,000 | | | | 489,848 | | |
| | | Par ($) (a) | | Value ($) | |
| Republic of Finland | |
| 5.375% 07/04/13 | | EUR | 725,000 | | | | 1,068,324 | | |
| Republic of France | |
| 3.000% 10/25/15 | | EUR | 1,865,000 | | | | 2,475,039 | | |
| 4.000% 04/25/13 | | EUR | 2,820,000 | | | | 3,972,687 | | |
| Republic of Poland | |
| 5.750% 03/24/10 | | PLN | 2,105,000 | | | | 609,920 | | |
| Svensk Exportkredit AB | |
| 5.125% 03/01/17 | | | 310,000 | | | | 322,011 | | |
| United Kingdom Treasury | |
| 4.750% 06/07/10 | | GBP | 571,000 | | | | 857,700 | | |
| 5.000% 03/07/25 | | GBP | 1,630,000 | | | | 2,641,915 | | |
| 8.000% 09/27/13 | | GBP | 450,000 | | | | 799,336 | | |
| Foreign Government Obligations Total | | | 62,865,029 | | |
| U.S. Government Obligations – 1.8% | |
| U.S. Treasury Bond | |
| 4.500% 05/15/38 | | | 900,000 | | | | 1,050,750 | | |
| U.S. Treasury Inflation Indexed Bond | |
| 3.375% 04/15/32 (m) | | | 8,337,484 | | | | 10,711,065 | | |
| U.S. Treasury Notes | |
| 0.875% 02/28/11 | | | 3,690,000 | | | | 3,697,048 | | |
| 1.875% 02/28/14 | | | 5,515,000 | | | | 5,575,334 | | |
| 2.750% 02/15/19 (n) | | | 695,000 | | | | 698,802 | | |
| U.S. Government Obligations Total | | | 21,732,999 | | |
Total Government & Agency Obligations
(cost of $80,529,672) | | | 84,598,028 | | |
| Municipal Bonds – 1.1% | |
| California – 0.5% | |
| CA Los Angeles Community College District | |
| Series 2008 F-1, | |
| 5.000% 08/01/33 | | | 6,200,000 | | | | 5,971,468 | | |
| California Total | | | 5,971,468 | | |
| New York – 0.6% | |
| NY Triborough Bridge & Tunnel Authority | |
| Series 2008 C, | |
| 5.000% 11/15/38 | | | 7,500,000 | | | | 7,263,150 | | |
| New York Total | | | 7,263,150 | | |
| Virginia – 0.0% | |
| VA Tobacco Settlement Financing Corp. | |
| Series 2007 A1, | |
| 6.706% 06/01/46 | | | 310,000 | | | | 152,647 | | |
| Virginia Total | | | 152,647 | | |
Total Municipal Bonds
(cost of $13,877,291) | | | 13,387,265 | | |
See Accompanying Notes to Financial Statements.
28
Columbia Total Return Bond Fund
March 31, 2009
| Collateralized Mortgage Obligations – 0.9% | |
| | | Par ($) (a) | | Value ($) | |
| Non-Agency – 0.9% | |
| Bear Stearns Alt-A Trust | |
| 0.802% 01/25/35 (d) | | | 1,871,304 | | | | 879,292 | | |
| 4.907% 10/25/33 (d) | | | 1,513,941 | | | | 1,064,996 | | |
| Citigroup Mortgage Loan Trust, Inc. | |
| 5.902% 09/25/37 (d) | | | 5,143,120 | | | | 2,221,459 | | |
| Countrywide Alternative Loan Trust | |
| 0.612% 03/25/36 (d) | | | 39,079 | | | | 38,645 | | |
| Countrywide Home Loan Mortgage Pass Through Trust | |
| 4.593% 12/19/33 (d) | | | 2,572,341 | | | | 2,137,012 | | |
| Morgan Stanley Mortgage Loan Trust | |
| 0.742% 02/25/47 (d) | | | 7,463,034 | | | | 3,660,033 | | |
| Sequoia Mortgage Trust | |
| 1.425% 07/20/34 (d) | | | 2,011,500 | | | | 576,267 | | |
| Non-Agency Total | | | 10,577,704 | | |
Total Collateralized Mortgage Obligations
(cost of $20,606,377) | | | 10,577,704 | | |
| Preferred Stock – 0.0% | |
| | | Shares | | | |
| Communications – 0.0% | |
| Media – 0.0% | |
| CMP Susquehanna Radio Holdings Corp. | |
| | 0.00 | % (l)(o) | | | 6,343 | | | | 63 | | |
| Media Total | | | 63 | | |
| Communications Total | | | 63 | | |
Total Preferred Stock
(cost of $63) | | | 63 | | |
| Warrant – 0.0% | |
| | | Units | | | |
| Financials – 0.0% | |
| CNB Capital Trust I | |
| Expires 19/03/23 (l)(o) | | | 7,248 | | | | 73 | | |
| Financials Total | | | 73 | | |
Total Warrant
(cost of $73) | | | 73 | | |
| Convertible Bond – 0.0% | |
| | | Par ($) (a) | | Value ($) | |
| Consumer Discretionary – 0.0% | |
| Media – 0.0% | |
| Virgin Media, Inc. | |
| 6.500% 11/15/16 (c) | | | 215,000 | | | | 115,563 | | |
| Media Total | | | 115,563 | | |
| Consumer Discretionary Total | | | 115,563 | | |
Total Convertible Bond
(cost of $99,411) | | | 115,563 | | |
| Securities Lending Collateral – 0.1% | |
| | | Shares | | | |
State Street Navigator Securities
Lending Prime Portfolio (p)
(7 day yield of 0.943%) | | | 1,023,975 | | | | 1,023,975 | | |
Total Securities Lending Collateral
(cost of $1,023,975) | | | 1,023,975 | | |
| Short-Term Obligation – 2.3% | |
| | | Par ($) | | | |
Repurchase agreement with
Fixed Income Clearing Corp.,
dated 03/31/09, due 04/01/09
at 0.140%, collateralized by a
U.S. Government Agency
Obligation maturing 03/30/10,
market value of $28,503,563
(repurchase proceeds
$27,943,109) | | | 27,943,000 | | | | 27,943,000 | | |
Total Short-Term Obligation
(cost of $27,943,000) | | | 27,943,000 | | |
Total Investments – 100.3%
(cost of $1,331,962,654) (r) | | | 1,228,101,177 | | |
Obligation to Return Collateral for
Securities Loaned – (0.1)% | | | (1,023,975 | ) | |
| Other Assets & Liabilities, Net – (0.2)% | | | (2,176,722 | ) | |
| Net Assets – 100.0% | | | 1,224,900,480 | | |
See Accompanying Notes to Financial Statements.
29
Columbia Total Return Bond Fund
March 31, 2009
Notes to Investment Portfolio:
(a) Principal amount is stated in United States dollars unless otherwise noted.
(b) The issuer is in default of certain debt covenants. Income is not being accrued. At March 31, 2009, the value of these securities amounted to $75,543, which represents less than 0.1% of net assets.
(c) Security exempt from registration pursuant to Rule 144A under the Securities Act of 1933. These securities may be resold in transactions exempt from registration, normally to qualified institutional buyers. At March 31, 2009, these securities, which are not illiquid except for the following, amounted to $81,791,235, which represents 6.7% of net assets.
| Security | | Acquisition
Date | | Par/
Unit | | Cost | | Value | |
ACE Cash Express, Inc.
10.250% 10/01/14 | | 10/05/06 | | $ | 190,000 | | | $ | 191,367 | | | $ | 47,500 | | |
Local TV Finance
LLC, PIK,
9.250% 06/15/15 | | 05/07/07 | | | 170,000 | | | | 171,169 | | | | 12,370 | | |
Orascom Telecom
Finance SCA
7.875% 2/08/14 | | 02/08/07 | | | 170,000 | | | | 170,000 | | | | 108,800 | | |
Seminole Indian
Tribe of Florida
7.804% 10/01/20 | | 09/28/07 | | | 340,000 | | | | 344,643 | | | | 265,384 | | |
| | | | | | | $ | 434,054 | | |
(d) The interest rate shown on floating rate or variable rate securities reflects the rate at March 31, 2009.
(e) The issuer is in default of certain debt covenants. Income is being accrued. At March 31, 2009, the value of these securities amounted to $405,350, which represents less than 0.1% of net assets.
(f) Loan participation agreement.
(g) Step bond. Shown parenthetically is the next coupon rate to be paid and the date the security will begin accruing at this rate.
(h) Zero coupon bond.
(i) This security or a portion of this security is held as collateral for open credit default swap contracts. At March 31, 2009, market value of securities pledged amounted to $5,101,946.
(j) Investments in affiliates during the twelve months ended March 31, 2009: Security name: Merrill Lynch & Co., Inc.,
5.700% 05/02/17
6.150% 04/25/13
7.750% 05/14/38
| Par as of 03/31/08: | | $ | 3,535,000 | | |
| Par purchased prior to 01/01/09: | | $ | 6,850,000 | | |
| Par sold: | | $ | – | | |
| Par as of 03/31/09: | | $ | 10,385,000 | | |
| Net realized loss: | | $ | (60,896 | ) | |
| Interest income earned: | | $ | 641,975 | | |
| Value at end of period: | | $ | 7,299,228 | | |
Merrill Lynch & Co., Inc. became an affiliate on January 1, 2009.
(k) The issuer has filed for bankruptcy protection under Chapter 11, and is in default of certain debt covenants. Income is not being accrued. At March 31, 2009, the value of these securities amounted to $1,492,387, which represents 0.1% of net assets.
(l) Represents fair value as determined in good faith under procedures approved by the Board of Trustees. The value of these securities amounted to $1,504,673, which represents 0.1% of net assets.
(m) All or a portion of this security is held as collateral for open futures contracts. At March 31, 2009, market value of this security pledged amounted to $3,211,720.
(n) All or a portion of this security was on loan at March 31, 2009. The total market value of securities on loan at March 31, 2009 is $1,008,053.
(o) Non-income producing
(p) Investment made with cash collateral received from securities lending activity.
(q) Security is guaranteed by the Federal Deposit Insurance Company.
(r) Cost for federal income tax purposes is $1,334,090,119.
See Accompanying Notes to Financial Statements.
30
Columbia Total Return Bond Fund
March 31, 2009
At March 31, 2009, the Fund held the following open short futures contracts:
| Type | | Number
of
Contracts | | Value | | Aggregate
Face Value | | Expiration
Date | | Unrealized
Depreciation | |
| 5-Year U.S. Treasury Notes | | | 550 | | | $ | 65,321,094 | | | $ | 64,288,056 | | | Jun-2009 | | $ | (1,033,038 | ) | |
| 10-Year U.S. Treasury Notes | | | 375 | | | | 46,529,297 | | | | 45,397,219 | | | Jun-2009 | | | (1,132,078 | ) | |
| | | | | | | | | | | $ | (2,165,116 | ) | |
At March 31, 2009, the Fund held the following open long futures contracts:
| Type | | Number
of
Contracts | | Value | | Aggregate
Face Value | | Expiration
Date | | Unrealized
Appreciation | |
| 30-Year U.S. Treasury Bonds | | | 182 | | | $ | 23,605,969 | | | $ | 23,052,029 | | | Jun-2009 | | $ | 553,940 | | |
Forward foreign currency exchange contracts outstanding on March 31, 2009 are:
Forward
Foreign
Currency
Contracts
to Buy | | Value | | Aggregate
Face Value | | Settlement
Date | | Unrealized
Appreciation
(Depreciation) | |
| EUR | | | | $ | 8,967,944 | | | $ | 8,781,918 | | | 04/07/09 | | $ | 186,026 | | |
| EUR | | | | | 3,274,960 | | | | 3,236,052 | | | 04/07/09 | | | 38,908 | | |
| EUR | | | | | 1,567,730 | | | | 1,619,550 | | | 04/07/09 | | | (51,820 | ) | |
| | | $ | 173,114 | | |
Forward
Foreign
Currency
Contracts
to Sell | | Value | | Aggregate
Face Value | | Settlement
Date | | Unrealized
Appreciation
(Depreciation) | |
| CAD | | | | $ | 166,563 | | | $ | 163,114 | | | 04/07/09 | | $ | (3,449 | ) | |
| CAD | | | | | 168,942 | | | | 165,384 | | | 04/07/09 | | | (3,558 | ) | |
| EUR | | | | | 8,967,944 | | | | 8,464,095 | | | 04/07/09 | | | (503,849 | ) | |
| EUR | | | | | 3,321,461 | | | | 3,138,500 | | | 04/07/09 | | | (182,961 | ) | |
| EUR | | | | | 8,967,944 | | | | 8,554,207 | | | 04/07/09 | | | (413,737 | ) | |
| EUR | | | | | 892,775 | | | | 876,825 | | | 04/23/09 | | | (15,950 | ) | |
| EUR | | | | | 953,888 | | | | 933,386 | | | 04/23/09 | | | (20,502 | ) | |
| EUR | | | | | 952,559 | | | | 933,068 | | | 04/23/09 | | | (19,491 | ) | |
| EUR | | | | | 7,745,246 | | | | 7,943,958 | | | 04/29/09 | | | 198,712 | | |
| GBP | | | | | 642,843 | | | | 636,187 | | | 04/22/09 | | | (6,656 | ) | |
| GBP | | | | | 3,515,554 | | | | 3,477,947 | | | 04/23/09 | | | (37,607 | ) | |
| | | $ | (1,009,048 | ) | |
At March 31, 2009, the Fund has entered into the following credit default swap contracts:
Swap
Counterparty | | Referenced
Obligation | | Receive
Buy/Sell
Protection | | Fixed Rate | | Expiration
Date | | Notional
Amount | | Value of
Contract | |
| JPMorgan Chase | | Macy's, Inc.
7.450% 07/15/17 | | Buy | | | (3.600 | )% | | 12/20/13 | | $ | 7,055,000 | | | $ | 732,641 | | |
| Morgan Stanley | | Home Depot, Inc.
5.875% 12/16/36 | | Buy | | | (3.350 | )% | | 12/20/13 | | | 9,000,000 | | | | (598,281 | ) | |
| Morgan Stanley | | Limited Brands, Inc.
6.125% 12/01/12 | | Buy | | | (5.270 | )% | | 12/20/13 | | | 9,250,000 | | | | (197,050 | ) | |
| Barclays | | Limited Brands, Inc.
6.125% 12/01/12 | | Buy | | | (6.150 | )% | | 03/20/14 | | | 1,000,000 | | | | (57,533 | ) | |
| | | | | | | | | | | | | | | | | $ | (120,223 | ) | |
As of March 31, 2009, cash of $880,000 was pledged as collateral for open credit default swap contracts.
See Accompanying Notes to Financial Statements.
31
Columbia Total Return Bond Fund
March 31, 2009
On April 1, 2008, the Fund adopted Statement of Financial Accounting Standards No. 157, Fair Value Measurements ("SFAS 157"). SFAS 157 establishes a hierarchy that prioritizes the inputs to valuation techniques used to measure fair value giving the highest priority to unadjusted quoted prices in active markets for identical securities (level 1 measurements) and the lowest priority to unobservable inputs (level 3 measurements) when market prices are not readily available or reliable. The three levels of the fair value hierarchy under SFAS 157 are described below:
• Level 1 – quoted prices in active markets for identical securities
• Level 2 – prices determined using other significant observable inputs (including quoted prices for similar securities, interest rates, prepayment speeds, credit risk and others)
• Level 3 – prices determined using significant unobservable inputs. In situations where quoted prices or observable inputs are unavailable or less reliable, unobservable inputs may be used. Unobservable inputs may include management's own assumptions about the factors market participants would use in pricing an investment.
The inputs or methodology used for valuing securities are not necessarily an indication of the risk associated with investing in those securities.
The following table summarizes the inputs used, as of March 31, 2009 in valuing the Fund's assets:
| Valuation Inputs | | Investments in
Securities | | Other Financial
Instruments* | |
| Level 1 – Quoted Prices | | $ | 22,756,974 | | | $ | (1,611,176 | ) | |
Level 2 – Other Significant
Observable Inputs | | | 1,203,539,039 | | | | (956,157 | ) | |
Level 3 – Significant
Unobservable Inputs | | | 1,805,164 | | | | – | | |
| Total | | $ | 1,228,101,177 | | | $ | (2,567,333 | ) | �� |
* Other financial instruments consist of futures contracts, credit default swap contracts and forward foreign currency exchange contracts which are not included in the investment portfolio.
The following table reconciles asset balances for the year ended March 31, 2009, in which significant unobservable inputs (Level 3) were used in determining value:
| | | Investments in
Securities | | Other Financial
Instruments | |
| Balance as of March 31, 2008 | | $ | 22,668,473 | | | $ | – | | |
Accretion of Discounts/
Amortization of Premiums | | | 15,089 | | | | – | | |
| Realized loss | | | (2,180,986 | ) | | | – | | |
| Change in unrealized depreciation | | | (3,292,490 | ) | | | – | | |
| Net sales | | | (13,207,967 | ) | | | – | | |
| Transfers out of Level 3 | | | (2,196,955 | ) | | | – | | |
| Balance as of March 31, 2009 | | $ | 1,805,164 | | | $ | – | | |
The change in unrealized losses attributable to securities owned at March 31, 2009 which were valued using significant unobservable inputs (Level 3) amounted to $3,292,490. This amount is included in net change in unrealized depreciation on the Statement of Changes in Net Assets.
The information in the above reconciliation represents fiscal year to date activity for any securities identified as using Level 3 inputs at either the beginning or the end of the current fiscal period.
At March 31, 2009, the asset allocation of the Fund is as follows:
| Asset Allocation (Unaudited) | | % of
Net Assets | |
| Corporate Fixed-Income Bonds & Notes | | | 39.1 | | |
| Mortgage-Backed Securities | | | 30.4 | | |
| Commercial Mortgage-Backed Securities | | | 11.9 | | |
| Asset-Backed Securities | | | 7.6 | | |
| Government & Agency Obligations | | | 6.9 | | |
| Municipal Bonds | | | 1.1 | | |
| Collateralized Mortgage Obligations | | | 0.9 | | |
| Preferred Stock | | | 0.0 | * | |
| Warrant | | | 0.0 | * | |
| Convertible Bond | | | 0.0 | * | |
| | | | 97.9 | | |
| Securities Lending Collateral | | | 0.1 | | |
| Short-Term Obligation | | | 2.3 | | |
| Obligations to Return Collateral for Securities Loaned | | | (0.1 | ) | |
| Other Assets & Liabilities, Net | | | (0.2 | ) | |
| | | | 100.0 | % | |
* Rounds to less than 0.1%.
| Acronym | | Name | |
| AUD | | Australian Dollar | |
|
| CAD | | Canadian Dollar | |
|
| EUR | | Euro | |
|
| GBP | | Great Britain Pound | |
|
| I.O. | | Interest Only | |
|
| JPY | | Japanese Yen | |
|
| NOK | | Norwegian Krone | |
|
| PIK | | Payment-In-Kind | |
|
| PLN | | Polish Zloty | |
|
| SEK | | Swedish Krona | |
|
| TBA | | To Be Announced | |
|
See Accompanying Notes to Financial Statements.
32
Investment Portfolio – Columbia Short Term Bond Fund
March 31, 2009
| Corporate Fixed-Income Bonds & Notes – 26.3% | |
| | | Par ($) | | Value ($) | |
| Basic Materials – 0.6% | |
| Chemicals – 0.4% | |
| EI Du Pont de Nemours & Co. | |
| 5.000% 07/15/13 | | | 4,910,000 | | | | 5,085,582 | | |
| Chemicals Total | | | 5,085,582 | | |
| Iron/Steel – 0.2% | |
| Nucor Corp. | |
| 5.000% 06/01/13 | | | 2,504,000 | | | | 2,620,481 | | |
| Iron/Steel Total | | | 2,620,481 | | |
| Basic Materials Total | | | 7,706,063 | | |
| Communications – 3.1% | |
| Media – 0.4% | |
| Comcast Corp. | |
| 5.500% 03/15/11 | | | 2,885,000 | | | | 2,926,481 | | |
| 5.850% 01/15/10 | | | 2,500,000 | | | | 2,538,087 | | |
| Media Total | | | 5,464,568 | | |
| Telecommunication Services – 2.7% | |
| AT&T, Inc. | |
| 6.250% 03/15/11 | | | 8,500,000 | | | | 8,878,199 | | |
| British Telecommunications PLC | |
| 5.150% 01/15/13 | | | 3,605,000 | | | | 3,345,829 | | |
| Deutsche Telekom International Finance BV | |
| 8.500% 06/15/10 | | | 5,000,000 | | | | 5,222,920 | | |
| Telefonica Emisiones SAU | |
| 5.984% 06/20/11 | | | 5,000,000 | | | | 5,142,825 | | |
| Verizon Wireless Capital LLC | |
| 5.550% 02/01/14 (a) | | | 7,125,000 | | | | 7,130,957 | | |
| Vodafone Group PLC | |
| 7.750% 02/15/10 | | | 4,800,000 | | | | 4,980,398 | | |
| Telecommunication Services Total | | | 34,701,128 | | |
| Communications Total | | | 40,165,696 | | |
| Consumer Cyclical – 0.3% | |
| Retail – 0.3% | |
| CVS Caremark Corp. | |
| 5.750% 08/15/11 | | | 3,500,000 | | | | 3,670,929 | | |
| Retail Total | | | 3,670,929 | | |
| Consumer Cyclical Total | | | 3,670,929 | | |
| Consumer Non-Cyclical – 2.9% | |
| Beverages – 1.0% | |
| Bottling Group LLC | |
| 6.950% 03/15/14 | | | 6,125,000 | | | | 6,964,315 | | |
| | | Par ($) | | Value ($) | |
| Diageo Capital PLC | |
| 4.375% 05/03/10 | | | 6,030,000 | | | | 6,095,450 | | |
| Beverages Total | | | 13,059,765 | | |
| Cosmetics/Personal Care – 0.0% | |
| Procter & Gamble Co. | |
| 6.875% 09/15/09 | | | 200,000 | | | | 205,405 | | |
| Cosmetics/Personal Care Total | | | 205,405 | | |
| Food – 0.6% | |
| ConAgra Foods, Inc. | |
| 7.875% 09/15/10 | | | 3,796,000 | | | | 4,007,198 | | |
| Kraft Foods, Inc. | |
| 5.625% 08/11/10 | | | 4,100,000 | | | | 4,199,048 | | |
| Food Total | | | 8,206,246 | | |
| Healthcare Services – 0.3% | |
| UnitedHealth Group, Inc. | |
| 4.125% 08/15/09 | | | 3,675,000 | | | | 3,678,436 | | |
| Healthcare Services Total | | | 3,678,436 | | |
| Pharmaceuticals – 1.0% | |
| Abbott Laboratories | |
| 5.600% 05/15/11 | | | 6,775,000 | | | | 7,264,419 | | |
| Wyeth | |
| 6.950% 03/15/11 | | | 5,531,000 | | | | 5,891,433 | | |
| Pharmaceuticals Total | | | 13,155,852 | | |
| Consumer Non-Cyclical Total | | | 38,305,704 | | |
| Energy – 1.9% | |
| Oil & Gas – 1.5% | |
| Canadian Natural Resources Ltd. | |
| 5.450% 10/01/12 | | | 1,500,000 | | | | 1,434,448 | | |
| 6.700% 07/15/11 | | | 2,000,000 | | | | 2,031,008 | | |
| Chevron Corp. | |
| 3.450% 03/03/12 | | | 3,580,000 | | | | 3,674,680 | | |
| Conoco Funding Co. | |
| 6.350% 10/15/11 | | | 6,000,000 | | | | 6,492,006 | | |
| Occidental Petroleum Corp. | |
| 6.750% 01/15/12 | | | 1,750,000 | | | | 1,882,069 | | |
| Valero Energy Corp. | |
| 6.875% 04/15/12 | | | 3,415,000 | | | | 3,446,596 | | |
| Oil & Gas Total | | | 18,960,807 | | |
| Oil & Gas Services – 0.2% | |
| Weatherford International Ltd. | |
| 5.150% 03/15/13 | | | 3,585,000 | | | | 3,335,563 | | |
| Oil & Gas Services Total | | | 3,335,563 | | |
See Accompanying Notes to Financial Statements.
33
Columbia Short Term Bond Fund
March 31, 2009
| Corporate Fixed-Income Bonds & Notes (continued) | |
| | | Par ($) | | Value ($) | |
| Pipelines – 0.2% | |
| TransCanada Pipelines Ltd. | |
| 6.125% 02/19/10 | | | 2,500,000 | | | | 2,536,195 | | |
| Pipelines Total | | | 2,536,195 | | |
| Energy Total | | | 24,832,565 | | |
| Financials – 13.0% | |
| Banks – 8.8% | |
| American Express Credit Corp. | |
| 5.875% 05/02/13 | | | 9,000,000 | | | | 7,901,802 | | |
| Bank of New York Mellon Corp. | |
| 4.950% 11/01/12 | | | 2,625,000 | | | | 2,679,311 | | |
| 5.125% 08/27/13 | | | 4,080,000 | | | | 4,175,913 | | |
| Barclays Bank PLC | |
| 7.400% 12/15/09 | | | 3,165,000 | | | | 3,160,335 | | |
| Bear Stearns Companies LLC | |
| 5.500% 08/15/11 | | | 6,550,000 | | | | 6,558,522 | | |
| Capital One Bank | |
| 5.750% 09/15/10 | | | 5,650,000 | | | | 5,638,960 | | |
| Citigroup, Inc. | |
| 4.250% 07/29/09 | | | 4,625,000 | | | | 4,579,989 | | |
| Countrywide Home Loans, Inc. | |
| 4.125% 09/15/09 (b) | | | 4,625,000 | | | | 4,570,328 | | |
| Credit Suisse First Boston USA, Inc. | |
| 4.875% 08/15/10 | | | 7,500,000 | | | | 7,509,750 | | |
| Deutsche Bank AG | |
| 4.875% 05/20/13 | | | 6,150,000 | | | | 6,032,289 | | |
| Fifth Third Bank | |
| 4.200% 02/23/10 | | | 6,275,000 | | | | 6,002,282 | | |
| Goldman Sachs Group, Inc. | |
| 4.500% 06/15/10 | | | 3,135,000 | | | | 3,128,282 | | |
| JPMorgan Chase & Co. | |
| 2.200% 06/15/12 (k) | | | 6,850,000 | | | | 6,904,115 | | |
| 3.800% 10/02/09 | | | 2,500,000 | | | | 2,488,298 | | |
| Keycorp | |
| 6.500% 05/14/13 | | | 3,500,000 | | | | 3,415,423 | | |
| Merrill Lynch & Co., Inc. | |
| 6.150% 04/25/13 (b) | | | 2,000,000 | | | | 1,681,194 | | |
| Morgan Stanley | |
| 4.250% 05/15/10 | | | 2,000,000 | | | | 1,944,536 | | |
| PNC Funding Corp. | |
| 4.500% 03/10/10 | | | 4,000,000 | | | | 3,984,976 | | |
| Regions Bank | |
| 3.250% 12/09/11 (k) | | | 12,000,000 | | | | 12,488,316 | | |
| SunTrust Banks, Inc. | |
| 4.250% 10/15/09 | | | 5,525,000 | | | | 5,494,557 | | |
| U.S. Bancorp | |
| 2.250% 03/13/12 (k) | | | 4,790,000 | | | | 4,835,471 | | |
| | | Par ($) | | Value ($) | |
| U.S. Bank National Association | |
| 6.375% 08/01/11 | | | 8,850,000 | | | | 9,294,518 | | |
| Banks Total | | | 114,469,167 | | |
| Diversified Financial Services – 1.9% | |
| Citigroup Funding, Inc. | |
| 2.000% 03/30/12 (k) | | | 13,100,000 | | | | 13,142,090 | | |
| General Electric Capital Corp. | |
| 4.875% 10/21/10 | | | 5,490,000 | | | | 5,457,252 | | |
| 6.000% 06/15/12 | | | 5,345,000 | | | | 5,269,774 | | |
| Lehman Brothers Holdings, Inc. | |
| 3.950% 11/10/09 (c)(d) | | | 5,365,000 | | | | 684,038 | | |
| Diversified Financial Services Total | | | 24,553,154 | | |
| Insurance – 1.3% | |
| Allstate Corp. | |
| 7.200% 12/01/09 | | | 7,000,000 | | | | 6,940,542 | | |
| American International Group, Inc. | |
| 5.375% 10/18/11 | | | 6,000,000 | | | | 3,120,300 | | |
| Berkshire Hathaway Finance Corp. | |
| 5.000% 08/15/13 | | | 3,000,000 | | | | 3,085,047 | | |
| Principal Life Income Funding Trusts | |
| 5.300% 04/24/13 | | | 4,000,000 | | | | 3,674,744 | | |
| Insurance Total | | | 16,820,633 | | |
| Real Estate Investment Trusts (REITs) – 0.3% | |
| Simon Property Group LP | |
| 4.875% 03/18/10 | | | 4,350,000 | | | | 4,165,712 | | |
| Real Estate Investment Trusts (REITs) Total | | | 4,165,712 | | |
| Savings & Loans – 0.7% | |
| Western Financial Bank | |
| 9.625% 05/15/12 | | | 9,050,000 | | | | 9,035,511 | | |
| Savings & Loans Total | | | 9,035,511 | | |
| Financials Total | | | 169,044,177 | | |
| Industrials – 1.3% | |
| Aerospace & Defense – 0.3% | |
| United Technologies Corp. | |
| 6.100% 05/15/12 | | | 1,719,000 | | | | 1,843,165 | | |
| 6.500% 06/01/09 | | | 1,750,000 | | | | 1,760,960 | | |
| Aerospace & Defense Total | | | 3,604,125 | | |
| Machinery – 0.4% | |
| John Deere Capital Corp. | |
| 4.500% 04/03/13 | | | 5,015,000 | | | | 4,919,685 | | |
| Machinery Total | | | 4,919,685 | | |
| Miscellaneous Manufacturing – 0.1% | |
| 3M Co. | |
| 5.125% 11/06/09 | | | 1,850,000 | | | | 1,896,787 | | |
| Miscellaneous Manufacturing Total | | | 1,896,787 | | |
See Accompanying Notes to Financial Statements.
34
Columbia Short Term Bond Fund
March 31, 2009
| Corporate Fixed-Income Bonds & Notes (continued) | |
| | | Par ($) | | Value ($) | |
| Transportation – 0.5% | |
| Burlington Northern Santa Fe Corp. | |
| 6.750% 07/15/11 | | | 3,610,000 | | | | 3,807,174 | | |
| Norfolk Southern Corp. | |
| 8.625% 05/15/10 | | | 2,205,000 | | | | 2,299,220 | | |
| Transportation Total | | | 6,106,394 | | |
| Industrials Total | | | 16,526,991 | | |
| Technology – 0.7% | |
| Networking & Telecom Equipment – 0.4% | |
| Cisco Systems, Inc. | |
| 5.250% 02/22/11 | | | 4,765,000 | | | | 5,038,030 | | |
| Networking & Telecom Equipment Total | | | 5,038,030 | | |
| Software – 0.3% | |
| Oracle Corp. | |
| 5.000% 01/15/11 | | | 4,000,000 | | | | 4,193,564 | | |
| Software Total | | | 4,193,564 | | |
| Technology Total | | | 9,231,594 | | |
| Utilities – 2.5% | |
| Electric – 2.2% | |
| Consolidated Edison Co. of New York, Inc. | |
| 4.875% 02/01/13 | | | 4,015,000 | | | | 4,028,217 | | |
| Exelon Generation Co. LLC | |
| 6.950% 06/15/11 | | | 4,525,000 | | | | 4,620,400 | | |
| National Rural Utilities Cooperative Finance Corp. | |
| 5.500% 07/01/13 | | | 1,550,000 | | | | 1,562,794 | | |
| 5.750% 08/28/09 | | | 3,975,000 | | | | 4,011,300 | | |
| Ohio Power Co. | |
| 5.750% 09/01/13 | | | 4,970,000 | | | | 4,983,498 | | |
| Pacific Gas & Electric Co. | |
| 4.200% 03/01/11 | | | 4,850,000 | | | | 4,924,860 | | |
| Virginia Electric Power | |
| 5.100% 11/30/12 | | | 4,535,000 | | | | 4,644,312 | | |
| Electric Total | | | 28,775,381 | | |
| Gas – 0.3% | |
| Sempra Energy | |
| 4.750% 05/15/09 | | | 3,810,000 | | | | 3,813,864 | | |
| Gas Total | | | 3,813,864 | | |
| Utilities Total | | | 32,589,245 | | |
Total Corporate Fixed-Income Bonds & Notes
(cost of $350,160,065) | | | 342,072,964 | | |
| Asset-Backed Securities – 21.0% | |
| | | Par ($) | | Value ($) | |
| ABFS Mortgage Loan Trust | |
| 4.428% 12/15/33 | | | 3,944 | | | | 3,699 | | |
| AmeriCredit Automobile Receivables Trust | |
| 4.630% 06/06/12 | | | 7,378,435 | | | | 6,976,604 | | |
| 4.870% 12/06/10 | | | 709,465 | | | | 704,712 | | |
| 5.190% 11/06/11 | | | 8,655,943 | | | | 8,509,052 | | |
| 5.210% 10/06/11 | | | 836,034 | | | | 822,802 | | |
| 5.420% 08/08/11 | | | 12,649,853 | | | | 12,270,845 | | |
| 5.420% 05/07/12 | | | 21,154,242 | | | | 20,210,678 | | |
| Amresco Residential Securities Mortgage Loan Trust | |
| 1.002% 07/25/28 (e) | | | 14,774 | | | | 7,694 | | |
| Capital Auto Receivables Asset Trust | |
| 3.740% 03/15/11 | | | 7,562,805 | | | | 7,561,305 | | |
| 3.920% 11/16/09 | | | 370,077 | | | | 369,650 | | |
| 5.000% 04/15/11 | | | 806,610 | | | | 807,592 | | |
| 5.010% 04/16/12 | | | 12,650,000 | | | | 12,099,402 | | |
| 5.020% 09/15/11 | | | 3,833,191 | | | | 3,839,127 | | |
| Capital One Auto Finance Trust | |
| 5.030% 04/15/12 | | | 4,067,751 | | | | 3,995,190 | | |
| 5.070% 07/15/11 | | | 1,172,021 | | | | 1,147,493 | | |
| Capital One Prime Auto Receivables Trust | |
| 5.010% 11/15/11 | | | 8,790,000 | | | | 8,873,204 | | |
| 5.470% 06/15/11 | | | 3,159,697 | | | | 3,194,311 | | |
| Carmax Auto Owner Trust | |
| 5.190% 12/15/11 | | | 3,000,000 | | | | 3,024,424 | | |
| 5.230% 12/15/11 | | | 7,657,923 | | | | 7,749,731 | | |
| Cityscape Home Equity Loan Trust | |
| 7.380% 07/25/28 (e) | | | 186,917 | | | | 175,465 | | |
| 7.410% 05/25/28 | | | 20,197 | | | | 20,097 | | |
| CNH Equipment Trust | |
| 4.060% 10/17/11 (d) | | | 5,000,000 | | | | 5,000,000 | | |
| Drivetime Auto Owner Trust | |
| 5.227% 08/15/12 (a)(e) | | | 1,352,876 | | | | 1,285,671 | | |
| Fifth Third Auto Trust | |
| 4.070% 01/17/12 | | | 7,400,000 | | | | 7,315,878 | | |
| First Alliance Mortgage Loan Trust | |
| 6.680% 06/25/25 | | | 79,632 | | | | 60,600 | | |
| 8.225% 09/20/27 | | | 212,513 | | | | 155,933 | | |
| First Plus Home Loan Trust | |
| 7.720% 05/10/24 (e) | | | 27,870 | | | | 27,734 | | |
| Ford Credit Auto Owner Trust | |
| 5.160% 11/15/10 | | | 2,565,797 | | | | 2,578,508 | | |
| 5.160% 04/15/13 | | | 10,554,000 | | | | 9,799,602 | | |
| 5.240% 07/15/12 | | | 997,500 | | | | 948,579 | | |
| 5.250% 09/15/11 | | | 1,500,000 | | | | 1,473,942 | | |
| Franklin Auto Trust | |
| 5.360% 05/20/16 | | | 2,498,000 | | | | 2,394,342 | | |
| GE Equipment Midticket LLC | |
| 4.530% 06/14/11 | | | 3,000,000 | | | | 2,989,437 | | |
See Accompanying Notes to Financial Statements.
35
Columbia Short Term Bond Fund
March 31, 2009
| Asset-Backed Securities (continued) | |
| | | Par ($) | | Value ($) | |
| GS Auto Loan Trust | |
| 5.370% 12/15/10 | | | 544,134 | | | | 547,768 | | |
| 5.480% 12/15/14 | | | 9,140,000 | | | | 9,231,003 | | |
| Harley-Davidson Motorcycle Trust | |
| 5.100% 05/15/12 | | | 3,633,201 | | | | 3,602,800 | | |
| 5.240% 01/15/12 | | | 8,765,342 | | | | 8,716,548 | | |
| Household Automotive Trust | |
| 4.350% 06/18/12 | | | 2,029,383 | | | | 2,018,732 | | |
| Huntington Auto Trust | |
| 3.480% 07/15/11 (a) | | | 4,500,000 | | | | 4,503,516 | | |
| Hyundai Auto Receivables Trust | |
| 5.110% 04/15/11 | | | 7,090,338 | | | | 7,174,078 | | |
| IMC Home Equity Loan Trust | |
| 7.080% 08/20/28 | | | 21,200 | | | | 19,753 | | |
| 7.310% 11/20/28 | | | 154,824 | | | | 132,864 | | |
| 7.500% 04/25/26 | | | 138,990 | | | | 138,558 | | |
| 7.520% 08/20/28 | | | 491,260 | | | | 412,682 | | |
| Long Beach Auto Receivables Trust | |
| 4.250% 04/15/12 | | | 2,568,871 | | | | 2,446,171 | | |
| 4.522% 06/15/12 | | | 2,853,853 | | | | 2,740,115 | | |
| 4.972% 10/15/11 | | | 3,417,513 | | | | 3,374,750 | | |
| Merrill Auto Trust Securitization | |
| 4.270% 12/15/10 | | | 4,000,000 | | | | 4,009,168 | | |
| 5.500% 03/15/12 | | | 4,200,000 | | | | 4,263,493 | | |
| Nissan Auto Lease Trust | |
| 5.140% 07/15/11 | | | 6,000,000 | | | | 5,803,375 | | |
| 5.200% 05/17/10 | | | 1,100,000 | | | | 1,097,970 | | |
| Nissan Auto Receivables Owner Trust | |
| 5.030% 05/16/11 | | | 997,500 | | | | 1,013,199 | | |
| Novastar Home Equity Loan | |
| 1.302% 05/25/33 (e) | | | 3,045,762 | | | | 1,611,922 | | |
| Residential Asset Mortgage Products, Inc. | |
| 1.202% 03/25/33 (e) | | | 343,849 | | | | 137,014 | | |
| Residential Funding Mortgage Securities II, Inc. | |
| 0.812% 08/25/33 (e) | | | 23,178 | | | | 13,248 | | |
| 4.760% 07/25/28 (e) | | | 2,180,000 | | | | 1,560,335 | | |
| SLM Student Loan Trust | |
| 1.380% 03/15/17 (e) | | | 1,339,006 | | | | 1,231,421 | | |
| 1.400% 12/15/20 (e) | | | 9,415,000 | | | | 8,139,109 | | |
| Terwin Mortgage Trust | |
| 1.422% 07/25/34 (e) | | | 964,392 | | | | 368,116 | | |
| Triad Auto Receivables Owner Trust | |
| 4.880% 04/12/13 | | | 17,419,000 | | | | 15,720,647 | | |
| 5.260% 11/14/11 | | | 340,471 | | | | 332,139 | | |
| UPFC Auto Receivables Trust | |
| 4.980% 08/15/11 | | | 754,809 | | | | 708,896 | | |
| 5.010% 08/15/12 | | | 11,862,551 | | | | 11,343,478 | | |
| 5.490% 05/15/12 | | | 6,141,917 | | | | 5,969,176 | | |
| 5.530% 07/15/13 | | | 4,915,318 | | | | 4,543,720 | | |
| USAA Auto Owner Trust | |
| 4.170% 02/15/11 | | | 5,971,816 | | | | 5,977,125 | | |
| 4.900% 02/15/12 | | | 2,174,907 | | | | 2,198,384 | | |
| | | Par ($) | | Value ($) | |
| Volkswagen Auto Loan Enhanced Trust | |
| 4.860% 04/20/12 | | | 2,769,813 | | | | 2,772,228 | | |
| Wachovia Auto Loan Owner Trust | |
| 5.080% 04/20/12 (a) | | | 13,500,000 | | | | 13,590,291 | | |
Total Asset-Backed Securities
(cost of $278,667,728) | | | 273,857,095 | | |
| Government & Agency Obligations – 16.1% | |
| Foreign Government Obligations – 1.6% | |
| Financement-Quebec | |
| 5.000% 10/25/12 | | | 2,000,000 | | | | 2,090,850 | | |
| Morocco Government AID Bond | |
| 1.735% 05/01/23 (e) | | | 942,500 | | | | 911,115 | | |
| Province of Ontario | |
| 3.125% 09/08/10 | | | 8,000,000 | | | | 8,091,368 | | |
| Svensk Exportkredit AB | |
| 5.000% 05/22/09 | | | 4,915,000 | | | | 4,927,976 | | |
| United Mexican States | |
| 5.875% 02/17/14 | | | 4,225,000 | | | | 4,362,312 | | |
| Foreign Government Obligations Total | | | 20,383,621 | | |
| U.S. Government Agencies – 4.3% | |
| Federal Home Loan Bank | |
| 3.375% 02/27/13 (f) | | | 12,500,000 | | | | 13,038,412 | | |
| 5.250% 06/10/11 | | | 1,780,000 | | | | 1,920,768 | | |
| 5.375% 07/17/09 | | | 9,500,000 | | | | 9,636,012 | | |
| Federal Home Loan Mortgage Corp. | |
| 3.125% 10/25/10 (g) | | | 400,000 | | | | 411,821 | | |
| 6.625% 09/15/09 (f) | | | 15,950,000 | | | | 16,378,034 | | |
| Federal National Mortgage Association | |
| 2.750% 04/11/11 (f) | | | 14,000,000 | | | | 14,365,904 | | |
| 5.375% 08/15/09 | | | 1,000,000 | | | | 1,018,176 | | |
| U.S. Government Agencies Total | | | 56,769,127 | | |
| U.S. Government Obligations – 10.2% | |
| U.S. Treasury Inflation Indexed Bond | |
| 3.500% 01/15/11 (f)(g) | | | 12,129,800 | | | | 12,664,263 | | |
| U.S. Treasury Notes | |
| 0.875% 02/28/11 (f) | | | 57,000,000 | | | | 57,108,870 | | |
| 1.750% 01/31/14 (f) | | | 16,000,000 | | | | 16,108,800 | | |
| 1.875% 02/28/14 (f) | | | 18,500,000 | | | | 18,702,390 | | |
| 4.625% 07/31/09 | | | 5,750,000 | | | | 5,833,105 | | |
| 4.875% 06/30/09 (f) | | | 22,000,000 | | | | 22,251,790 | | |
| U.S. Government Obligations Total | | | 132,669,218 | | |
Total Government & Agency Obligations
(cost of $205,908,421) | | | 209,821,966 | | |
See Accompanying Notes to Financial Statements.
36
Columbia Short Term Bond Fund
March 31, 2009
| Collateralized Mortgage Obligations – 14.9% | |
| | | Par ($) | | Value ($) | |
| Agency – 6.2% | |
| Federal Home Loan Mortgage Corp. | |
| 3.500% 01/15/17 | | | 2,790,004 | | | | 2,816,059 | | |
| 4.000% 09/15/15 | | | 1,560,745 | | | | 1,579,058 | | |
| 4.500% 03/15/17 | | | 1,261,447 | | | | 1,287,192 | | |
| 4.500% 08/15/28 | | | 2,167,391 | | | | 2,243,784 | | |
| 5.000% 10/15/27 | | | 1,406,437 | | | | 1,416,360 | | |
| 5.500% 08/15/13 | | | 645,147 | | | | 657,546 | | |
| 5.500% 11/15/21 | | | 6,642,854 | | | | 6,809,741 | | |
| 5.500% 04/15/26 | | | 1,683,777 | | | | 1,715,377 | | |
| 5.500% 12/15/26 | | | 5,872,161 | | | | 5,991,780 | | |
| 5.500% 10/15/27 | | | 2,982,030 | | | | 3,040,334 | | |
| 5.500% 01/15/29 | | | 6,079,000 | | | | 6,293,076 | | |
| 5.500% 10/15/29 | | | 2,315,256 | | | | 2,366,882 | | |
| 6.000% 03/15/19 | | | 2,369,124 | | | | 2,404,907 | | |
| 6.000% 06/15/25 | | | 2,855,746 | | | | 2,905,882 | | |
| 6.000% 06/15/31 | | | 170,276 | | | | 172,078 | | |
| 7.000% 06/15/22 | | | 92,222 | | | | 92,133 | | |
| I.O., | |
| 5.500% 05/15/27 | | | 267,755 | | | | 3,000 | | |
| Federal National Mortgage Association | |
| (h) 05/25/23 | | | 1,035,598 | | | | 954,689 | | |
| 4.000% 04/25/26 | | | 7,135,686 | | | | 7,141,130 | | |
| 5.000% 04/25/16 | | | 1,036,219 | | | | 1,045,426 | | |
| 5.000% 12/25/16 | | | 4,205,188 | | | | 4,281,287 | | |
| 5.000% 04/25/31 | | | 2,081,933 | | | | 2,112,011 | | |
| 5.000% 09/25/33 | | | 3,686,302 | | | | 3,852,768 | | |
| 5.125% 10/15/15 | | | 3,295,563 | | | | 3,343,572 | | |
| 5.500% 12/25/29 | | | 4,418,352 | | | | 4,554,499 | | |
| 5.500% 06/25/30 | | | 1,520,810 | | | | 1,568,275 | | |
| Government National Mortgage Association | |
| 4.500% 08/20/35 | | | 474,608 | | | | 487,594 | | |
| 5.000% 05/16/27 | | | 300,166 | | | | 317,442 | | |
| 5.000% 06/20/28 | | | 8,641,556 | | | | 8,732,374 | | |
| Agency Total | | | 80,186,256 | | |
| Non-Agency – 8.7% | |
| Bank of America Mortgage Securities | |
| 4.610% 03/25/34 (e) | | | 3,251,067 | | | | 2,603,311 | | |
| 5.090% 11/25/35 (e) | | | 1,631,582 | | | | 971,376 | | |
| 5.250% 02/25/18 | | | 375,955 | | | | 376,046 | | |
| Bear Stearns Adjustable Rate Mortgage Trust | |
| 4.730% 04/25/34 (e) | | | 597,515 | | | | 338,936 | | |
| Bear Stearns Alt-A Trust | |
| 5.203% 09/25/34 (e) | | | 1,628,838 | | | | 1,035,531 | | |
| Chase Mortgage Finance Corp. | |
| 6.000% 03/25/37 (e) | | | 726,098 | | | | 523,953 | | |
| Countrywide Alternative Loan Trust | |
| 0.922% 03/25/34 (e) | | | 410,449 | | | | 341,200 | | |
| 5.250% 08/25/35 | | | 5,395,935 | | | | 3,963,852 | | |
| 5.500% 07/25/34 | | | 1,752,315 | | | | 1,597,712 | | |
| | | Par ($) | | Value ($) | |
| Countrywide Home Loan Mortgage Pass Through Trust | |
| 1.022% 03/25/34 (e) | | | 2,515,421 | | | | 1,871,574 | | |
| 5.500% 09/25/35 | | | 19,326,491 | | | | 18,856,167 | | |
| Credit Suisse Mortgage Capital Certificates | |
| 5.750% 02/25/36 | | | 3,434,826 | | | | 3,372,000 | | |
| GMAC Mortgage Corporation Loan Trust | |
| 1.022% 05/25/18 (e) | | | 1,882,597 | | | | 1,772,157 | | |
| IMPAC CMB Trust | |
| 0.902% 08/25/35 (e) | | | 1,125,831 | | | | 263,471 | | |
| JPMorgan Mortgage Trust | |
| 5.686% 04/25/37 (e) | | | 9,282,064 | | | | 5,803,756 | | |
| 5.754% 04/25/36 (e) | | | 13,363,165 | | | | 7,959,837 | | |
| 6.047% 10/25/36 (e) | | | 12,597,560 | | | | 8,268,331 | | |
| MASTR Asset Securitization Trust | |
| 5.750% 05/25/36 | | | 9,912,179 | | | | 9,464,456 | | |
| PNC Mortgage Securities Corp. | |
| (h) 04/28/27 (d) | | | 3,353 | | | | 1,106 | | |
| Residential Accredit Loans, Inc. | |
| 1.122% 07/25/32 (e) | | | 29,242 | | | | 20,804 | | |
| SACO I, Inc. | |
| 7.000% 08/25/36 (a)(d) | | | 120,572 | | | | 84,400 | | |
| Structured Adjustable Rate Mortgage Loan Trust | |
| 5.801% 07/25/36 (e) | | | 3,690,880 | | | | 1,804,064 | | |
| Structured Asset Securities Corp. | |
| 5.500% 05/25/33 | | | 267,206 | | | | 217,162 | | |
| 5.500% 07/25/33 | | | 165,548 | | | | 155,285 | | |
| 5.750% 04/25/33 | | | 1,640,267 | | | | 1,432,418 | | |
| Washington Mutual Alternative Mortgage Pass-Through Certificates | |
| 5.500% 10/25/35 | | | 2,572,073 | | | | 1,892,682 | | |
| Washington Mutual Mortgage Pass-Through Certificates | |
| 5.530% 01/25/37 (e) | | | 17,406,861 | | | | 11,428,095 | | |
| 5.609% 11/25/36 (e) | | | 12,288,411 | | | | 8,018,290 | | |
| 5.831% 07/25/37 (e) | | | 10,027,872 | | | | 4,880,921 | | |
| 6.063% 10/25/36 (e) | | | 6,884,883 | | | | 4,779,497 | | |
| Wells Fargo Mortgage Backed Securities Trust | |
| 4.500% 08/25/18 | | | 1,302,836 | | | | 1,229,023 | | |
| 4.956% 09/25/35 (e) | | | 3,784,619 | | | | 3,131,636 | | |
| 5.240% 04/25/36 (e) | | | 6,728,063 | | | | 4,068,849 | | |
| 5.250% 08/25/33 | | | 1,451,171 | | | | 1,430,982 | | |
| Non-Agency Total | | | 113,958,880 | | |
Total Collateralized Mortgage Obligations
(cost of $236,927,386) | | | 194,145,136 | | |
See Accompanying Notes to Financial Statements.
37
Columbia Short Term Bond Fund
March 31, 2009
| Mortgage-Backed Securities – 11.1% | |
| | | Par ($) | | Value ($) | |
| Federal Home Loan Mortgage Corp. | |
| 4.000% 05/01/11 | | | 3,122,894 | | | | 3,168,826 | | |
| 4.114% 03/01/34 (e) | | | 1,321,078 | | | | 1,336,880 | | |
| 4.500% 11/01/20 | | | 2,550,489 | | | | 2,631,999 | | |
| 4.500% 03/01/21 | | | 5,232,873 | | | | 5,391,246 | | |
| 4.890% 04/01/35 (e) | | | 677,870 | | | | 690,179 | | |
| 5.500% 05/01/17 | | | 116,176 | | | | 121,975 | | |
| 5.500% 09/01/17 | | | 392,867 | | | | 412,478 | | |
| 5.500% 01/01/19 | | | 10,715 | | | | 11,203 | | |
| 5.500% 07/01/19 | | | 424,034 | | | | 443,345 | | |
| 5.500% 12/01/20 | | | 5,785,886 | | | | 6,043,961 | | |
| 5.500% 01/01/21 | | | 10,854,415 | | | | 11,338,567 | | |
| 5.500% 02/01/21 | | | 10,115,426 | | | | 10,560,294 | | |
| 5.604% 01/01/36 (e) | | | 2,349,890 | | | | 2,423,033 | | |
| 5.886% 07/01/36 (e) | | | 98,257 | | | | 102,164 | | |
| 6.000% 03/01/17 | | | 52,523 | | | | 55,325 | | |
| 6.000% 04/01/17 | | | 56,270 | | | | 59,272 | | |
| 6.000% 06/01/17 | | | 3,478 | | | | 3,664 | | |
| 6.000% 08/01/17 | | | 161,705 | | | | 170,333 | | |
| 6.000% 08/01/21 | | | 1,654,568 | | | | 1,734,831 | | |
| 6.000% 09/01/21 | | | 569,660 | | | | 597,295 | | |
| 6.000% 10/01/21 | | | 6,728,265 | | | | 7,054,656 | | |
| 7.000% 11/01/28 | | | 288,193 | | | | 310,894 | | |
| 7.500% 09/01/15 | | | 77,701 | | | | 82,087 | | |
| 8.500% 07/01/30 | | | 40,706 | | | | 44,441 | | |
| Federal National Mortgage Association | |
| 3.218% 06/01/33 (e) | | | 2,513,406 | | | | 2,467,083 | | |
| 4.202% 03/01/34 (e) | | | 1,777,714 | | | | 1,779,589 | | |
| 4.277% 04/01/34 (e) | | | 2,040,506 | | | | 2,064,954 | | |
| 4.500% 11/01/14 | | | 1,877,729 | | | | 1,931,180 | | |
| 4.500% 06/01/34 (e) | | | 1,183,251 | | | | 1,206,288 | | |
| 4.615% 07/01/34 (e) | | | 3,639,311 | | | | 3,709,670 | | |
| 4.745% 07/01/34 (e) | | | 2,066,859 | | | | 2,110,159 | | |
| 4.805% 06/01/35 (e) | | | 2,934,447 | | | | 3,001,806 | | |
| 4.887% 01/01/35 (e) | | | 2,003,213 | | | | 2,038,705 | | |
| 4.995% 07/01/35 (e) | | | 2,632,648 | | | | 2,717,827 | | |
| 5.000% 07/01/22 | | | 16,999,445 | | | | 17,651,621 | | |
| 5.000% 01/01/24 | | | 9,507,498 | | | | 9,868,743 | | |
| 5.480% 10/01/35 (e) | | | 2,410,102 | | | | 2,512,064 | | |
| 5.500% 05/01/21 | | | 1,234,700 | | | | 1,289,387 | | |
| 5.500% 11/01/21 | | | 7,919,479 | | | | 8,270,246 | | |
| 5.500% 01/01/24 | | | 9,658,716 | | | | 10,081,446 | | |
| 5.634% 04/01/36 (e) | | | 4,891,018 | | | | 4,964,154 | | |
| 5.792% 07/01/36 (e) | | | 127,258 | | | | 132,356 | | |
| 6.000% 05/01/09 | | | 8,477 | | | | 8,571 | | |
| 6.000% 03/01/37 | | | 3,204,421 | | | | 3,334,257 | | |
| 6.108% 09/01/37 (e) | | | 1,783,124 | | | | 1,856,206 | | |
| 6.500% 03/01/12 | | | 14,637 | | | | 15,347 | | |
| 7.500% 08/01/15 | | | 44,276 | | | | 46,541 | | |
| 7.500% 10/01/28 | | | 1,505,080 | | | | 1,632,046 | | |
| | | Par ($) | | Value ($) | |
| 7.500% 01/01/29 | | | 543,273 | | | | 589,103 | | |
| 8.000% 05/01/15 | | | 71,548 | | | | 75,792 | | |
| 8.000% 01/01/16 | | | 148,509 | | | | 157,301 | | |
| 8.000% 08/01/30 | | | 20,359 | | | | 22,132 | | |
| 8.000% 05/01/31 | | | 53,460 | | | | 58,115 | | |
| 8.000% 07/01/31 | | | 26,442 | | | | 28,700 | | |
| 9.000% 04/01/16 | | | 787 | | | | 792 | | |
| Government National Mortgage Association | |
| 4.250% 03/20/30 (e) | | | 60,983 | | | | 62,321 | | |
| 4.625% 07/20/18 (e) | | | 286,940 | | | | 292,827 | | |
| 5.375% 04/20/22 (e) | | | 1,689,795 | | | | 1,723,869 | | |
| 5.375% 06/20/29 (e) | | | 292,183 | | | | 297,524 | | |
| 6.500% 09/15/13 | | | 31,781 | | | | 33,512 | | |
| 6.500% 03/15/32 | | | 2,677 | | | | 2,847 | | |
| 6.500% 11/15/33 | | | 273,940 | | | | 288,257 | | |
| 7.000% 11/15/13 | | | 42,121 | | | | 44,387 | | |
| 7.000% 04/15/29 | | | 59,789 | | | | 64,269 | | |
| 7.000% 08/15/29 | | | 2,978 | | | | 3,201 | | |
| 8.000% 10/15/17 | | | 308,775 | | | | 330,962 | | |
| 8.500% 09/15/09 | | | 54 | | | | 55 | | |
| 8.500% 04/15/10 | | | 2,195 | | | | 2,207 | | |
| 9.000% 12/15/09 | | | 507 | | | | 509 | | |
| Small Business Administration | |
| 0.875% 06/25/22 (e) | | | 192,851 | | | | 189,660 | | |
Total Mortgage-Backed Securities
(cost of $139,921,126) | | | 143,747,536 | | |
| Commercial Mortgage-Backed Securities – 7.1% | |
| Bear Stearns Commercial Mortgage Securities, Inc. | |
| 3.869% 02/11/41 | | | 1,288,017 | | | | 1,286,303 | | |
| 6.480% 02/15/35 | | | 765,000 | | | | 768,219 | | |
| 7.590% 10/15/32 (e) | | | 5,000,000 | | | | 4,086,454 | | |
| CS First Boston Mortgage Securities Corp. | |
| 3.727% 03/15/35 | | | 585,395 | | | | 562,092 | | |
| 4.302% 07/15/36 | | | 2,446,864 | | | | 2,434,855 | | |
| 4.512% 07/15/37 | | | 1,000,000 | | | | 940,463 | | |
| 4.938% 12/15/40 | | | 1,771,230 | | | | 1,764,378 | | |
| First Union National Bank Commercial Mortgage | |
| 6.141% 02/12/34 | | | 3,175,000 | | | | 3,150,923 | | |
| 7.390% 12/15/31 | | | 5,872,141 | | | | 5,891,017 | | |
| GE Capital Commercial Mortgage Corp. | |
| 4.970% 08/11/36 | | | 1,941,904 | | | | 1,906,397 | | |
| GS Mortgage Securities Trust | |
| 5.690% 08/10/45 | | | 7,435,078 | | | | 7,287,078 | | |
| JPMorgan Chase Commercial Mortgage Securities Corp. | |
| 4.334% 07/15/42 | | | 173,052 | | | | 172,503 | | |
| 4.914% 07/12/37 | | | 6,068,457 | | | | 6,020,173 | | |
| 5.538% 02/12/49 | | | 11,441,112 | | | | 11,319,047 | | |
| 5.651% 06/15/49 | | | 2,124,177 | | | | 2,104,298 | | |
See Accompanying Notes to Financial Statements.
38
Columbia Short Term Bond Fund
March 31, 2009
| Commercial Mortgage-Backed Securities (continued) | |
| | | Par ($) | | Value ($) | |
| JPMorgan Commercial Mortgage Finance Corp. | |
| 6.812% 01/15/30 | | | 8,428,000 | | | | 8,425,458 | | |
| LB Commercial Conduit Mortgage Trust | |
| 7.020% 06/15/31 | | | 3,900,000 | | | | 3,832,850 | | |
| LB-UBS Commercial Mortgage Trust | |
| 5.642% 12/15/25 | | | 2,380,951 | | | | 2,379,475 | | |
| Merrill Lynch Mortgage Investors, Inc. | |
| I.O., | |
| 0.379% 12/15/30 (e) | | | 5,055,201 | | | | 82,591 | | |
| Merrill Lynch Mortgage Trust | |
| 4.446% 09/12/42 | | | 1,147,507 | | | | 1,144,732 | | |
| Morgan Stanley Capital I | |
| 4.690% 06/13/41 | | | 1,398,711 | | | | 1,346,250 | | |
| 5.257% 12/15/43 | | | 3,797,876 | | | | 3,765,561 | | |
| 5.283% 11/12/41 | | | 1,372,000 | | | | 1,220,562 | | |
| Nomura Asset Securities Corp. | |
| 6.590% 03/15/30 | | | 129,987 | | | | 129,955 | | |
| PNC Mortgage Acceptance Corp. | |
| 5.910% 03/12/34 | | | 342,069 | | | | 341,854 | | |
| Prudential Securities Secured Financing Corp. | |
| 7.723% 06/16/31 (e) | | | 11,446,000 | | | | 11,405,612 | | |
| 7.723% 06/16/31 (e) | | | 1,430,000 | | | | 1,417,017 | | |
| Salomon Brothers Mortgage Securities VII | |
| 6.428% 12/18/35 | | | 1,110,353 | | | | 1,111,027 | | |
| Wachovia Bank Commercial Mortgage Trust | |
| 5.323% 10/15/48 | | | 6,117,473 | | | | 6,151,466 | | |
Total Commercial Mortgage-Backed Securities
(cost of $94,841,672) | | | 92,448,610 | | |
| Securities Lending Collateral – 9.1% | |
| | | Shares | | | |
State Street Navigator Securities
Lending Prime Portfolio
(7 day yield 0.943%) (i) | | | 118,034,036 | | | | 118,034,036 | | |
Total Securities Lending Collateral
(cost of $118,034,036) | | | 118,034,036 | | |
| Short-Term Obligations – 3.6% | |
| | | Par ($) | | | |
| Repurchase Agreement – 2.6% | |
Repurchase agreement with
Fixed Income Clearing Corp.,
dated 03/31/09, due 04/01/09
at 0.140%, collateralized by a
U.S. Treasury Obligation
maturing 04/29/13, market
value $34,278,256 (repurchase
proceeds $33,604,131) | | | 33,604,000 | | | | 33,604,000 | | |
| | | Par ($) | | Value ($) | |
| U.S. Government Obligations – 1.0% | |
Federal Home Loan Mortgage Corp.
(h) 08/17/09 (j) | | | 13,500,000 | | | | 13,484,988 | | |
Total Short-Term Obligations
(cost of $46,953,925) | | | 47,088,988 | | |
Total Investments – 109.2%
(cost of $1,471,414,359) (l) | | | 1,421,216,331 | | |
Obligations to Return Collateral for
Securities Loaned – (9.1)% | | | (118,034,036 | ) | |
| Other Assets & Liabilities, Net – (0.1)% | | | (1,278,578 | ) | |
| Net Assets – 100.0% | | | 1,301,903,717 | | |
Notes to Investment Portfolio:
(a) Security exempt from registration pursuant to Rule 144A under the Securities Act of 1933. These securities may be resold in transactions exempt from registration, normally to qualified institutional buyers. At March 31, 2009, these securities, which are not illiquid, amounted to $26,594,835, which represents 2.0% of net assets.
(b) Investments in affiliates during the twelve months ended March 31, 2009: Security name: Countrywide Home Loans, Inc., 4.125% 09/15/09
| Par as of 03/31/08: | | $ | 4,625,000 | | |
| Par purchased: | | $ | – | | |
| Par sold: | | $ | – | | |
| Par as of 03/31/09: | | $ | 4,625,000 | | |
| Net realized gain/loss: | | $ | – | | |
| Interest income earned: | | $ | 190,781 | | |
| Value at end of period: | | $ | 4,570,328 | | |
Security name: Merrill Lynch & Co., Inc. 6.150% 04/25/13
4.125% 01/15/09
| Par as of 03/31/08: | | $ | 4,500,000 | | |
| Par purchased prior to 01/01/09: | | $ | �� | | |
| Par matured: | | $ | 2,500,000 | | |
| Par as of 03/31/09: | | $ | 2,000,000 | | |
| Net realized gain/loss: | | $ | – | | |
| Interest income earned: | | $ | 114,800 | | |
| Value at end of period: | | $ | 1,681,194 | | |
Merrill Lynch & Co., Inc. became an affiliate on January 1, 2009.
(c) The issuer has filed for bankruptcy protection under Chapter 11, and is in default of certain debt covenants. Income is not being accrued. At March 31, 2009, the value of this security amounted to $684,038, which represents 0.1% of net assets.
(d) Represents fair value as determined in good faith under procedures approved by the Board of Trustees. The value of this security amounted to $5,769,544, which represents 0.4% of net assets.
(e) The interest rate shown on floating rate or variable rate securities reflects the rate at March 31, 2009.
(f) All or a portion of this security was on loan at March 31, 2009. The total market value of securities on loan at March 31, 2009 is $115,738,471.
(g) The security or a portion of the security is pledged as collateral for open futures contracts. At March 31, 2009, the total market value of securities pledged amounted to $1,224,087.
(h) Zero coupon bond.
(i) Investment made with cash collateral received from securities lending activity.
(j) The rate shown represents the annualized yield at the date of purchase or the date of coupon reset.
(k) Security is guaranteed by the Federal Deposit Insurance Company.
(l) Cost for federal income tax purposes is $1,471,678,145.
See Accompanying Notes to Financial Statements.
39
Columbia Short Term Bond Fund
March 31, 2009
At March 31, 2009, the Fund held the following open long futures contracts:
| Type | | Number
of
Contracts | |
Value | |
Aggregate
Face Value | |
Expiration
Date | |
Unrealized
Appreciation | |
| 5 Year U.S. Treasury Note | | | 587 | | | $ | 69,715,422 | | | $ | 68,982,940 | | | June-2009 | | $ | 732,482 | | |
On April 1, 2008, the Fund adopted Statement of Financial Accounting Standards No. 157, Fair Value Measurements ("SFAS 157"). SFAS 157 establishes a hierarchy that prioritizes the inputs to valuation techniques used to measure fair value giving the highest priority to unadjusted quoted prices in active markets for identical securities (level 1 measurements) and the lowest priority to unobservable inputs (level 3 measurements) when market prices are not readily available or reliable. The three levels of the fair value hierarchy under SFAS 157 are described below:
• Level 1 – quoted prices in active markets for identical securities
• Level 2 – prices determined using other significant observable inputs (including quoted prices for similar securities, interest rates, prepayment speeds, credit risk and others)
• Level 3 – prices determined using significant unobservable inputs. In situations where quoted prices or observable inputs are unavailable or less reliable, unobservable inputs may be used. Unobservable inputs may include management's own assumptions about the factors market participants would use in pricing an investment.
The inputs or methodology used for valuing securities are not necessarily an indication of the risk associated with investing in those securities.
The following table summarizes the inputs used, as of March 31, 2009 in valuing the Fund's assets:
| Valuation Inputs | | Investments in
Securities | | Other Financial
Instruments* | |
| Level 1 – Quoted Prices | | $ | 250,703,254 | | | $ | 732,482 | | |
Level 2 – Other Significant
Observable Inputs | | | 1,160,924,054 | | | | – | | |
Level 3 – Significant
Unobservable Inputs | | | 9,589,023 | | | | – | | |
| Total | | $ | 1,421,216,331 | | | $ | 732,482 | | |
* Other financial instruments consist of futures contracts which are not included in the investment portfolio.
The following table reconciles asset balances for the year ended March 31, 2009, in which significant unobservable inputs (Level 3) were used in determining value:
| | | Investments in
Securities | | Other Financial
Instruments | |
Balance as of
March 31, 2008 | | $ | 10,584,107 | | | $ | – | | |
Accretion of Discounts/
Amortization of Premiums | | | 90 | | | | – | | |
| Realized gain | | | 6 | | | | – | | |
Change in unrealized
depreciation | | | (160,504 | ) | | | – | | |
| Net purchases | | | 9,470,638 | | | | – | | |
| Transfers out of Level 3 | | | (10,305,314 | ) | | | – | | |
Balance as of
March 31, 2009 | | $ | 9,589,023 | | | $ | – | | |
The change in unrealized losses attributable to securities owned at March 31, 2009 which were valued using significant unobservable inputs (Level 3) amounted to $160,504. This amount is included in net change in unrealized depreciation on the Statement of Changes in Net Assets.
The information in the above reconciliation represents fiscal year to date activity for any securities identified as Level 3 at either the beginning or the end of the current fiscal period.
At March 31, 2009, the asset allocation of the Fund is as follows:
| Asset Allocation (Unaudited) | | % of
Net Assets | |
| Corporate Fixed-Income Bonds & Notes | | | 26.3 | | |
| Asset-Backed Securities | | | 21.0 | | |
| Government & Agency Obligations | | | 16.1 | | |
| Collateralized Mortgage Obligations | | | 14.9 | | |
| Mortgage-Backed Securities | | | 11.1 | | |
| Commercial Mortgage-Backed Securities | | | 7.1 | | |
| | | | 96.5 | | |
| Securities Lending Collateral | | | 9.1 | | |
| Short-Term Obligations | | | 3.6 | | |
| Obligations to Return Collateral for Securities Loaned | | | (9.1 | ) | |
| Other Assets & Liabilities, Net | | | (0.1 | ) | |
| | | | 100.0 | | |
| Acronym | | Name | |
| I.O. | | Interest Only | |
|
See Accompanying Notes to Financial Statements.
40
Investment Portfolio – Columbia High Income Fund
March 31, 2009
| Corporate Fixed-Income Bonds & Notes – 88.2% | |
| | | Par ($) (a) | | Value ($) | |
| Basic Materials – 6.5% | |
| Chemicals – 1.6% | |
| Agricultural Chemicals – 0.3% | |
| Mosaic Co. | |
| 7.625% 12/01/16 (b) | | | 1,640,000 | | | | 1,607,200 | | |
| | | | 1,607,200 | | |
| Chemicals-Diversified – 1.3% | |
| EquiStar Chemicals LP | |
| 7.550% 02/15/26 (d) | | | 2,925,000 | | | | 292,500 | | |
| INVISTA | |
| 9.250% 05/01/12 (b) | | | 5,740,000 | | | | 5,137,300 | | |
| Millennium America, Inc. | |
| 7.625% 11/15/26 (d) | | | 4,720,000 | | | | 47,200 | | |
| NOVA Chemicals Corp. | |
| 5.720% 11/15/13 (c) | | | 2,730,000 | | | | 2,047,500 | | |
| Tronox Worldwide LLC/Tronox Finance Corp. | |
| 9.500% 12/01/12 (e) | | | 5,525,000 | | | | 732,063 | | |
| | | | 8,256,563 | | |
| Chemicals-Specialty – 0.0% | |
| MacDermid, Inc. | |
| 9.500% 04/15/17 (b) | | | 890,000 | | | | 307,050 | | |
| | | | 307,050 | | |
| Chemicals Total | | | 10,170,813 | | |
| Forest Products & Paper – 3.5% | |
| Paper & Related Products – 3.5% | |
| Bowater, Inc. | |
| 9.375% 12/15/21 | | | 5,545,000 | | | | 499,050 | | |
| 9.500% 10/15/12 | | | 105,000 | | | | 9,450 | | |
| Domtar Corp. | |
| 7.875% 10/15/11 | | | 5,005,000 | | | | 4,054,050 | | |
| Georgia-Pacific Corp. | |
| 7.000% 01/15/15 (b) | | | 4,750,000 | | | | 4,441,250 | | |
| 7.750% 11/15/29 | | | 2,930,000 | | | | 2,168,200 | | |
| 8.000% 01/15/24 | | | 921,000 | | | | 732,195 | | |
| 8.875% 05/15/31 | | | 6,745,000 | | | | 5,396,000 | | |
| Norske Skog | |
| 7.375% 03/01/14 | | | 1,850,000 | | | | 656,750 | | |
| 8.625% 06/15/11 | | | 2,580,000 | | | | 1,180,350 | | |
| Smurfit Capital Funding PLC | |
| 7.500% 11/20/25 | | | 4,100,000 | | | | 2,316,500 | | |
| | | | 21,453,795 | | |
| Forest Products & Paper Total | | | 21,453,795 | | |
| | | Par ($) (a) | | Value ($) | |
| Iron/Steel – 0.0% | |
| Steel-Specialty – 0.0% | |
| UCAR Finance, Inc. | |
| 10.250% 02/15/12 | | | 138,000 | | | | 124,890 | | |
| | | | 124,890 | | |
| Iron/Steel Total | | | 124,890 | | |
| Metals & Mining – 1.4% | |
| Metal-Diversified – 1.4% | |
| Allegheny Ludlum Corp. | |
| 6.950% 12/15/25 | | | 3,850,000 | | | | 3,029,815 | | |
| Allegheny Technologies, Inc. | |
| 8.375% 12/15/11 | | | 2,320,000 | | | | 2,258,576 | | |
| Freeport-McMoRan Copper & Gold, Inc. | |
| 7.084% 04/01/15 (c) | | | 1,285,000 | | | | 1,056,912 | | |
| 8.375% 04/01/17 | | | 2,220,000 | | | | 2,075,700 | | |
| | | | 8,421,003 | | |
| Metals & Mining Total | | | 8,421,003 | | |
| Basic Materials Total | | | 40,170,501 | | |
| Communications – 16.6% | |
| Advertising – 0.8% | |
| Advertising Agencies – 0.8% | |
| Interpublic Group of Companies, Inc. | |
| 6.250% 11/15/14 | | | 8,096,000 | | | | 5,100,480 | | |
| | | | 5,100,480 | | |
| Advertising Total | | | 5,100,480 | | |
| Internet – 0.5% | |
| E-Commerce/Services – 0.5% | |
| Expedia, Inc. | |
| 7.456% 08/15/18 | | | 3,425,000 | | | | 2,877,000 | | |
| | | | 2,877,000 | | |
| Internet Total | | | 2,877,000 | | |
| Media – 6.3% | |
| Cable TV – 4.4% | |
| Charter Communications Operating LLC/Charter Communications Operating Capital | |
| 8.000% 04/30/12 (b) | | | 5,230,000 | | | | 4,785,450 | | |
| Charter Term Loan Incremental Term Loan | |
| 3.180% 03/06/14 (c)(f)(g) | | | 2,470,000 | | | | 2,014,080 | | |
| CSC Holdings, Inc. | |
| 6.750% 04/15/12 | | | 2,300,000 | | | | 2,213,750 | | |
| 8.500% 06/15/15 (b) | | | 1,080,000 | | | | 1,055,700 | | |
See Accompanying Notes to Financial Statements.
41
Columbia High Income Fund
March 31, 2009
| Corporate Fixed-Income Bonds & Notes (continued) | |
| | | Par ($) (a) | | Value ($) | |
| Rainbow National Services LLC | |
| 8.750% 09/01/12 (b) | | | 4,605,000 | | | | 4,605,000 | | |
| 10.375% 09/01/14 (b) | | | 1,556,000 | | | | 1,587,120 | | |
| Shaw Communications, Inc. | |
| 7.500% 11/20/13 | | CAD | 6,060,000 | | | | 5,099,379 | | |
| Videotron Ltee | |
| 6.375% 12/15/15 | | | 665,000 | | | | 602,656 | | |
| 6.875% 01/15/14 | | | 5,500,000 | | | | 5,197,500 | | |
| | | | 27,160,635 | | |
| Multimedia – 0.9% | |
| CanWest MediaWorks LP | |
| 9.250% 08/01/15 (b) | | | 2,310,000 | | | | 161,700 | | |
| CW Media Holdings, Inc. | |
| PIK, | |
| 13.500% 08/15/15 (b) | | | 1,100,577 | | | | 448,485 | | |
| Lamar Media Corp. | |
| 6.625% 08/15/15 | | | 4,620,000 | | | | 3,332,650 | | |
| 7.250% 01/01/13 | | | 800,000 | | | | 689,000 | | |
| LBI Media, Inc. | |
| 8.500% 08/01/17 (b) | | | 2,065,000 | | | | 557,550 | | |
| | | | 5,189,385 | | |
| Publishing-Books – 0.3% | |
| Houghton Mifflin Co. | |
| 7.200% 03/15/11 | | | 2,270,000 | | | | 1,949,363 | | |
| | | | 1,949,363 | | |
| Publishing-Newspapers – 0.4% | |
| Morris Publishing Group LLC | |
| 7.000% 08/01/13 (e) | | | 5,550,000 | | | | 256,687 | | |
| Sun Media Corp. | |
| 7.625% 02/15/13 | | | 3,800,000 | | | | 2,166,000 | | |
| | | | 2,422,687 | | |
| Publishing-Periodicals – 0.1% | |
| Ziff Davis Media, Inc. | |
| (h) 05/01/12 (i) | | | 3,090,000 | | | | 157,899 | | |
| PIK, | |
| 13.500% 07/15/11 (i) | | | 794,255 | | | | 453,917 | | |
| | | | 611,816 | | |
| Television – 0.2% | |
| ION Media Networks, Inc. | |
| 4.344% 01/15/12 (b)(c) | | | 5,235,000 | | | | 871,882 | | |
| PIK, | |
| 10.070% 01/15/13 (b)(c)(j) | | | 1,473,804 | | | | — | | |
| | | | 871,882 | | |
| Media Total | | | 38,205,768 | | |
| | | Par ($) (a) | | Value ($) | |
| Telecommunication Services – 9.0% | |
| Cellular Telecommunications – 2.3% | |
| Centennial Cellular Operating Co./Centennial Communications Corp. | |
| 8.125% 02/01/14 | | | 1,535,000 | | | | 1,581,050 | | |
| 10.125% 06/15/13 | | | 2,800,000 | | | | 2,898,000 | | |
| Millicom International Cellular SA | |
| 10.000% 12/01/13 | | | 5,115,000 | | | | 4,999,912 | | |
| Rogers Wireless, Inc. | |
| 8.000% 12/15/12 | | | 3,025,000 | | | | 3,051,469 | | |
| Sprint Nextel Corp. | |
| 6.000% 12/01/16 | | | 2,335,000 | | | | 1,669,525 | | |
| | | | 14,199,956 | | |
| Media – 1.6% | |
| Nielsen Finance LLC | |
| 2.533% 08/09/13 (c)(f) | | | 5,848,813 | | | | 4,542,580 | | |
| 4.388% 08/04/13 (c) | | | 465,000 | | | | 361,150 | | |
| Quebecor Media, Inc. | |
| 7.750% 03/15/16 | | | 6,885,000 | | | | 5,232,600 | | |
| Quebecor World, Inc.. | |
| 9.750% 01/15/15 (b)(d) | | | 1,885,000 | | | | 65,975 | | |
| | | | 10,202,305 | | |
| Satellite Telecommunications – 1.8% | |
| Inmarsat Finance II PLC | |
| 10.375% 11/15/12 | | | 5,755,000 | | | | 5,898,875 | | |
| Intelsat Subsidiary Holding Co., Ltd. | |
| 8.500% 01/15/13 (b) | | | 4,795,000 | | | | 4,519,287 | | |
| 8.875% 01/15/15 (b) | | | 915,000 | | | | 848,663 | | |
| Loral Cyberstar, Inc. | |
| 10.000% 07/15/15 (i)(j) | | | 1,164,000 | | | | — | | |
| | | | 11,266,825 | | |
| Telecommunication Equipment – 1.2% | |
| Lucent Technologies, Inc. | |
| 6.450% 03/15/29 | | | 14,580,000 | | | | 5,540,400 | | |
| 6.500% 01/15/28 | | | 920,000 | | | | 349,600 | | |
| Nortel Networks Ltd. | |
| 10.750% 07/15/16 (d) | | | 5,140,000 | | | | 976,600 | | |
| 10.750% 07/15/16 (b)(d) | | | 2,445,000 | | | | 440,100 | | |
| | | | 7,306,700 | | |
| Telecommunication Services – 0.5% | |
| Colo.Com, Inc. | |
| 13.875% 03/15/10 (b)(d)(i)(j) | | | 944,357 | | | | — | | |
| GCI, Inc. | |
| 7.250% 02/15/14 | | | 3,225,000 | | | | 2,821,875 | | |
| PAETEC Holding Corp. | |
| 9.500% 07/15/15 | | | 110,000 | | | | 77,000 | | |
| | | | 2,898,875 | | |
See Accompanying Notes to Financial Statements.
42
Columbia High Income Fund
March 31, 2009
| Corporate Fixed-Income Bonds & Notes (continued) | |
| | | Par ($) (a) | | Value ($) | |
| Telephone-Integrated – 1.6% | |
| Local Insight Regatta Holdings, Inc. | |
| 11.000% 12/01/17 | | | 1,130,000 | | | | 262,725 | | |
| Qwest Corp. | |
| 6.950% 06/30/10 (c)(f) | | | 5,675,000 | | | | 5,611,156 | | |
| 7.125% 11/15/43 | | | 2,950,000 | | | | 1,814,250 | | |
| 7.250% 09/15/25 | | | 1,410,000 | | | | 930,600 | | |
| Virgin Media Finance PLC | |
| 9.125% 08/15/16 | | | 1,115,000 | | | | 1,036,950 | | |
| | | | 9,655,681 | | |
| Telecommunication Services Total | | | 55,530,342 | | |
| Communications Total | | | 101,713,590 | | |
| Consumer Cyclical – 9.3% | |
| Airlines – 0.3% | |
| DAE Aviation Holdings, Inc. | |
| 4.270% 07/31/14 (c)(f) | | | 777,532 | | | | 380,991 | | |
| 4.920% 07/31/14 (c)(f) | | | 413,752 | | | | 202,739 | | |
| 7.170% 07/31/14 | | | 1,171,390 | | | | 573,981 | | |
| 11.250% 08/01/15 (b) | | | 2,565,000 | | | | 641,250 | | |
| Delta Air Lines, Inc. | |
| 2.875% 02/06/24 (k) | | | 1,555,000 | | | | 9,330 | | |
| 2.875% 02/18/49 (k) | | | 905,000 | | | | 5,430 | | |
| 8.000% 06/03/23 (k) | | | 2,885,000 | | | | 17,310 | | |
| 8.300% 12/15/29 (k) | | | 1,023,000 | | | | 6,240 | | |
| 9.250% 03/15/49 (k) | | | 715,000 | | | | 4,362 | | |
| 9.750% 05/15/49 (k) | | | 2,335,000 | | | | 14,243 | | |
| 10.000% 08/15/49 (k) | | | 1,945,000 | | | | 11,865 | | |
| 10.375% 12/15/22 (k) | | | 2,990,000 | | | | 18,239 | | |
| 10.375% 02/01/49 (k) | | | 4,295,000 | | | | 26,199 | | |
| Northwest Airlines, Inc. | |
| 7.625% 11/15/23 (k) | | | 2,552,500 | | | | 6,381 | | |
| 7.875% 03/15/13 (k) | | | 2,390,800 | | | | 5,977 | | |
| 8.700% 03/15/49 (k) | | | 260,000 | | | | 650 | | |
| 8.875% 06/01/49 (k) | | | 971,900 | | | | 2,430 | | |
| 9.875% 03/15/37 (k) | | | 4,278,500 | | | | 10,696 | | |
| 10.000% 02/01/49 (k) | | | 2,426,300 | | | | 6,066 | | |
| Airlines Total | | | 1,944,379 | | |
| Apparel – 0.4% | |
| Textile-Apparel – 0.4% | |
| Unifi, Inc. | |
| 11.500% 05/15/14 | | | 4,560,000 | | | | 2,211,600 | | |
| | | | 2,211,600 | | |
| Apparel Total | | | 2,211,600 | | |
| | | Par ($) (a) | | Value ($) | |
| Auto Manufacturers – 0.2% | |
| Auto-Cars/Light Trucks – 0.2% | |
| Ford Motor Co. | |
| 7.450% 07/16/31 | | | 3,760,000 | | | | 1,193,800 | | |
| | | | 1,193,800 | | |
| Auto Manufacturers Total | | | 1,193,800 | | |
| Auto Parts & Equipment – 1.2% | |
| Auto/Truck Parts & Equipment-Original – 0.7% | |
| Collins & Aikman Products Co. | |
| 12.875% 08/15/12 (b)(d)(i) | | | 6,910,000 | | | | 691 | | |
| Johnson Controls, Inc. | |
| 5.250% 01/15/11 | | | 2,055,000 | | | | 1,990,944 | | |
| Lear Corp. | |
| 8.500% 12/01/13 | | | 466,000 | | | | 104,850 | | |
| 8.750% 12/01/16 | | | 2,505,000 | | | | 513,525 | | |
| Tenneco Automotive, Inc. | |
| 8.125% 11/15/15 | | | 2,670,000 | | | | 534,000 | | |
| 8.625% 11/15/14 | | | 3,145,000 | | | | 581,825 | | |
| 10.250% 07/15/13 | | | 1,489,000 | | | | 789,170 | | |
| | | | 4,515,005 | | |
| Auto/Truck Parts & Equipment-Replacement – 0.2% | |
| Allison Transmission | |
| PIK, | |
| 11.250% 11/01/15 (b) | | | 2,690,000 | | | | 1,076,000 | | |
| | | | 1,076,000 | | |
| Rubber-Tires – 0.3% | |
| Goodyear Tire & Rubber Co. | |
| 6.318% 12/01/09 (c) | | | 305,000 | | | | 291,275 | | |
| 8.625% 12/01/11 | | | 1,980,000 | | | | 1,643,400 | | |
| | | | 1,934,675 | | |
| Auto Parts & Equipment Total | | | 7,525,680 | | |
| Distribution/Wholesale – 0.3% | |
| ACE Hardware Corp. | |
| 9.125% 06/01/16 (b) | | | 2,375,000 | | | | 1,947,500 | | |
| Distribution/Wholesale Total | | | 1,947,500 | | |
| Entertainment – 0.5% | |
| Gambling (Non-Hotel) – 0.5% | |
| Global Cash Access LLC | |
| 8.750% 03/15/12 | | | 1,115,000 | | | | 914,300 | | |
| Isle of Capri Casinos, Inc. | |
| 7.000% 03/01/14 | | | 2,926,000 | | | | 1,726,340 | | |
| | | | 2,640,640 | | |
See Accompanying Notes to Financial Statements.
43
Columbia High Income Fund
March 31, 2009
| Corporate Fixed-Income Bonds & Notes (continued) | |
| | | Par ($) (a) | | Value ($) | |
| Motion Pictures & Services – 0.0% | |
| United Artists Theatre Circuit, Inc. | |
| 9.300% 07/01/15 (i) | | | 211,683 | | | | 127,010 | | |
| | | | 127,010 | | |
| Entertainment Total | | | 2,767,650 | | |
| Housewares – 0.1% | |
| Libbey Glass, Inc. | |
| 9.568% 06/01/11 (c) | | | 1,630,000 | | | | 733,500 | | |
| Housewares Total | | | 733,500 | | |
| Leisure Time – 0.5% | |
| Recreational Centers – 0.5% | |
| Town Sports International, Inc. | |
| 2.375% 02/27/14 (c)(f) | | | 2,033,500 | | | | 1,016,750 | | |
| 11.000% 02/01/14 | | | 3,325,000 | | | | 1,729,000 | | |
| | | | 2,745,750 | | |
| Leisure Time Total | | | 2,745,750 | | |
| Lodging – 3.7% | |
| Casino Hotels – 3.3% | |
| Boyd Gaming Corp. | |
| 7.750% 12/15/12 | | | 5,831,000 | | | | 4,693,955 | | |
| Chukchansi Economic Development Authority | |
| 8.000% 11/15/13 (b) | | | 1,475,000 | | | | 320,813 | | |
| FireKeepers Development Authority | |
| 13.875% 05/01/15 (b) | | | 1,940,000 | | | | 1,183,400 | | |
| Galaxy Entertainment Finance Co., Ltd. | |
| 9.875% 12/15/12 (b) | | | 3,315,000 | | | | 2,187,900 | | |
| Jacobs Entertainment, Inc. | |
| 9.750% 06/15/14 | | | 3,955,000 | | | | 2,343,337 | | |
| Mohegan Tribal Gaming Authority | |
| 6.375% 07/15/09 | | | 1,795,000 | | | | 1,471,900 | | |
| MTR Gaming Group, Inc. | |
| 9.000% 06/01/12 | | | 1,170,000 | | | | 561,600 | | |
| Penn National Gaming, Inc. | |
| 6.750% 03/01/15 | | | 3,215,000 | | | | 2,732,750 | | |
| 6.875% 12/01/11 | | | 1,295,000 | | | | 1,246,437 | | |
| Pinnacle Entertainment, Inc. | |
| 7.500% 06/15/15 | | | 925,000 | | | | 573,500 | | |
| 8.250% 03/15/12 | | | 1,260,000 | | | | 1,102,500 | | |
| 8.750% 10/01/13 | | | 655,000 | | | | 576,400 | | |
| Seminole Hard Rock Entertainment, Inc. | |
| 3.820% 03/15/14 (b)(c) | | | 2,045,000 | | | | 1,063,400 | | |
| | | | 20,057,892 | | |
| Hotels & Motels – 0.4% | |
| Gaylord Entertainment Co. | |
| 6.750% 11/15/14 | | | 1,740,000 | | | | 1,070,100 | | |
| | | Par ($) (a) | | Value ($) | |
| Starwood Hotels & Resorts Worldwide, Inc. | |
| 6.750% 05/15/18 | | | 2,000,000 | | | | 1,320,000 | | |
| 7.875% 05/01/12 | | | 505,000 | | | | 431,775 | | |
| | | | 2,821,875 | | |
| Lodging Total | | | 22,879,767 | | |
| Retail – 2.1% | |
| Retail-Automobiles – 0.6% | |
| Asbury Automotive Group, Inc. | |
| 7.625% 03/15/17 | | | 625,000 | | | | 293,750 | | |
| 8.000% 03/15/14 | | | 1,690,000 | | | | 819,650 | | |
| KAR Holdings, Inc. | |
| 8.750% 05/01/14 | | | 1,075,000 | | | | 569,750 | | |
| 10.000% 05/01/15 | | | 4,225,000 | | | | 1,837,875 | | |
| | | | 3,521,025 | | |
| Retail-Drug Stores – 0.5% | |
| Rite Aid Corp. | |
| 7.500% 03/01/17 | | | 3,185,000 | | | | 1,640,275 | | |
| 8.625% 03/01/15 | | | 5,180,000 | | | | 1,165,500 | | |
| | | | 2,805,775 | | |
| Retail-Miscellaneous/Diversified – 0.6% | |
| Harry & David Holdings, Inc. | |
| 9.000% 03/01/13 | | | 570,000 | | | | 122,550 | | |
| Sally Holdings LLC | |
| 9.250% 11/15/14 | | | 2,000,000 | | | | 1,895,000 | | |
| Susser Holdings LLC | |
| 10.625% 12/15/13 | | | 1,805,000 | | | | 1,750,850 | | |
| | | | 3,768,400 | | |
| Retail-Propane Distributors – 0.2% | |
| AmeriGas Partners LP | |
| 7.125% 05/20/16 | | | 845,000 | | | | 794,300 | | |
| 7.250% 05/20/15 | | | 505,000 | | | | 474,700 | | |
| | | | 1,269,000 | | |
| Retail-Restaurants – 0.1% | |
| Wendy's International, Inc. | |
| 6.250% 11/15/11 | | | 640,000 | | | | 582,400 | | |
| | | | 582,400 | | |
| Retail-Toy Store – 0.1% | |
| Toys R Us, Inc. | |
| 7.625% 08/01/11 | | | 1,985,000 | | | | 796,481 | | |
| | | | 796,481 | | |
| Retail Total | | | 12,743,081 | | |
| Consumer Cyclical Total | | | 56,692,707 | | |
See Accompanying Notes to Financial Statements.
44
Columbia High Income Fund
March 31, 2009
| Corporate Fixed-Income Bonds & Notes (continued) | |
| | | Par ($) (a) | | Value ($) | |
| Consumer Non-Cyclical – 12.7% | |
| Agriculture – 0.6% | |
| Tobacco – 0.6% | |
| Reynolds American, Inc. | |
| 7.625% 06/01/16 | | | 2,165,000 | | | | 1,916,804 | | |
| 7.750% 06/01/18 | | | 2,185,000 | | | | 1,924,933 | | |
| | | | 3,841,737 | | |
| Agriculture Total | | | 3,841,737 | | |
| Beverages – 0.4% | |
| Beverages-Wine/Spirits – 0.4% | |
| Constellation Brands, Inc. | |
| 7.250% 05/15/17 | | | 2,575,000 | | | | 2,446,250 | | |
| | | | 2,446,250 | | |
| Beverages Total | | | 2,446,250 | | |
| Commercial Services – 1.3% | |
| Commercial Services – 0.6% | |
| Language Line Holdings, Inc. | |
| 11.125% 06/15/12 | | | 3,895,000 | | | | 3,593,137 | | |
| | | | 3,593,137 | | |
| Commercial Services-Finance – 0.1% | |
| Cardtronics, Inc. | |
| 9.250% 08/15/13 | | | 680,000 | | | | 435,200 | | |
| | | | 435,200 | | |
| Printing-Commercial – 0.0% | |
| Vertis, Inc. | |
| PIK, | |
| 18.500% 10/01/12 (g) | | | 1,908,328 | | | | 309,670 | | |
| | | | 309,670 | | |
| Schools – 0.6% | |
| Knowledge Learning Corp., Inc. | |
| 7.750% 02/01/15 (b) | | | 4,700,000 | | | | 3,783,500 | | |
| | | | 3,783,500 | | |
| Commercial Services Total | | | 8,121,507 | | |
| Food – 1.0% | |
| Fisheries – 0.4% | |
| ASG Consolidated LLC/ASG Finance, Inc. | |
| 11.500% 11/01/11 | | | 2,590,000 | | | | 2,162,650 | | |
| | | | 2,162,650 | | |
| Food-Retail – 0.6% | |
Pinnacle Foods Finance LLC/Pinnacle Foods
Finance Corp. | |
| 10.625% 04/01/17 | | | 1,560,000 | | | | 1,092,000 | | |
| | | Par ($) (a) | | Value ($) | |
| Pinnacle Foods Term B Loan | |
| 3.247% 02/02/14 (c)(f) | | | 1,615,888 | | | | 1,316,445 | | |
| Stater Brothers Holdings | |
| 7.750% 04/15/15 | | | 1,155,000 | | | | 1,108,800 | | |
| 8.125% 06/15/12 | | | 385,000 | | | | 379,225 | | |
| | | | 3,896,470 | | |
| Food Total | | | 6,059,120 | | |
| Healthcare Products – 3.5% | |
| Medical Products – 3.5% | |
| Biomet, Inc. | |
| 10.000% 10/15/17 | | | 1,855,000 | | | | 1,836,450 | | |
| 11.625% 10/15/17 | | | 1,990,000 | | | | 1,756,175 | | |
| DJO Finance LLC/DJO Finance Corp. | |
| 10.875% 11/15/14 | | | 4,700,000 | | | | 3,489,750 | | |
| Hanger Orthopedic Group, Inc. | |
| 10.250% 06/01/14 | | | 3,560,000 | | | | 3,560,000 | | |
| Invacare Corp. | |
| 9.750% 02/15/15 | | | 2,110,000 | | | | 2,030,875 | | |
| Phibro Animal Health Corp. | |
| 10.000% 08/01/13 (b) | | | 3,285,000 | | | | 2,628,000 | | |
| ReAble Therapeutics Finance LLC/ReAble Therapeutics Finance Corp. | |
| 11.750% 11/15/14 | | | 2,760,000 | | | | 1,697,400 | | |
| Universal Hospital Services, Inc. | |
| 5.943% 06/01/15 (c) | | | 1,240,000 | | | | 899,000 | | |
| PIK, | |
| 8.500% 06/01/15 | | | 1,820,000 | | | | 1,619,800 | | |
| VWR Funding, Inc. | |
| PIK, | |
| 10.250% 07/15/15 | | | 2,510,000 | | | | 1,706,800 | | |
| | | | 21,224,250 | | |
| Healthcare Products Total | | | 21,224,250 | | |
| Healthcare Services – 4.7% | |
| Medical Products – 1.1% | |
| Rural/Metro Corp. | |
| 9.875% 03/15/15 | | | 2,410,000 | | | | 1,952,100 | | |
| Talecris Biotherapeutics | |
| 5.500% 12/06/13 (c)(f) | | | 1,632,425 | | | | 1,469,182 | | |
| 6.250% 12/06/13 | | | 4,175 | | | | 3,758 | | |
| 7.740% 12/06/14 (c)(f)(g) | | | 3,730,000 | | | | 3,189,150 | | |
| | | | 6,614,190 | | |
| Medical-Hospitals – 2.4% | |
| Community Health Systems, Inc. | |
| 2.729% 07/14/25 (c)(f) | | | 300,000 | | | | 258,750 | | |
| 2.768% 07/25/14 | | | 150,000 | | | | 129,375 | | |
| 2.768% 07/25/14 (c)(f) | | | 911,365 | | | | 786,053 | | |
| 3.506% 07/25/14 (c)(f) | | | 6,481,499 | | | | 5,590,293 | | |
| 8.875% 07/15/15 | | | 3,985,000 | | | | 3,765,825 | | |
See Accompanying Notes to Financial Statements.
45
Columbia High Income Fund
March 31, 2009
| Corporate Fixed-Income Bonds & Notes (continued) | |
| | | Par ($) (a) | | Value ($) | |
| HCA, Inc. | |
| 6.300% 10/01/12 | | | 4,305,000 | | | | 3,594,675 | | |
| 6.750% 07/15/13 | | | 360,000 | | | | 269,100 | | |
| Vanguard Health Holding Co. LLC | |
| 9.000% 10/01/14 | | | 455,000 | | | | 401,537 | | |
| | | | 14,795,608 | | |
| Medical-Nursing Homes – 0.2% | |
| Skilled Healthcare Group, Inc. | |
| 11.000% 01/15/14 | | | 1,329,000 | | | | 1,325,677 | | |
| | | | 1,325,677 | | |
| MRI/Medical Diagnostic Imaging – 0.9% | |
| Alliance Imaging, Inc. | |
| 7.250% 12/15/12 | | | 5,875,000 | | | | 5,640,000 | | |
| | | | 5,640,000 | | |
| Physical Therapy/Rehab Centers – 0.1% | |
| Psychiatric Solutions, Inc. | |
| 7.750% 07/15/15 | | | 170,000 | | | | 153,425 | | |
| | | | 153,425 | | |
| Healthcare Services Total | | | 28,528,900 | | |
| Household Products/Wares – 0.3% | |
| Consumer Products-Miscellaneous – 0.2% | |
| Jarden Corp. | |
| 7.500% 05/01/17 | | | 1,225,000 | | | | 986,125 | | |
| | | | 986,125 | | |
| Office Supplies & Forms – 0.1% | |
| ACCO Brands Corp. | |
| 7.625% 08/15/15 | | | 2,865,000 | | | | 573,000 | | |
| | | | 573,000 | | |
| Household Products/Wares Total | | | 1,559,125 | | |
| Pharmaceuticals – 0.9% | |
| Medical-Drugs – 0.6% | |
| Angiotech Pharmaceuticals, Inc. | |
| 5.011% 12/01/13 (c) | | | 2,137,000 | | | | 1,389,050 | | |
| Catalent Pharma Solutions, Inc. | |
| 9.500% 04/15/15 | | | 3,895,000 | | | | 934,800 | | |
| Warner Chilcott Corp. | |
| 3.459% 01/18/11 | | | 15,549 | | | | 14,325 | | |
| 3.459% 01/18/12 (c)(f) | | | 91,994 | | | | 84,749 | | |
| 8.750% 02/01/15 | | | 685,000 | | | | 657,600 | | |
| Series B, | |
| 3.459% 01/18/12 (c)(f) | | | 459,731 | | | | 423,527 | | |
| Series C, | |
| 3.459% 01/18/11 | | | 177,951 | | | | 163,937 | | |
| | | | 3,667,988 | | |
| | | Par ($) (a) | | Value ($) | |
| Vitamins & Nutrition Products – 0.3% | |
| NBTY, Inc. | |
| 7.125% 10/01/15 | | | 2,635,000 | | | | 2,147,525 | | |
| | | | 2,147,525 | | |
| Pharmaceuticals Total | | | 5,815,513 | | |
| Consumer Non-Cyclical Total | | | 77,596,402 | | |
| Diversified – 0.6% | |
| Holding Companies – 0.6% | |
| Diversified Operations – 0.6% | |
| Leucadia National Corp. | |
| 7.125% 03/15/17 | | | 5,630,000 | | | | 3,856,550 | | |
| | | | 3,856,550 | | |
| Holding Companies Total | | | 3,856,550 | | |
| Diversified Total | | | 3,856,550 | | |
| Energy – 13.3% | |
| Coal – 0.3% | |
| Peabody Energy Corp. | |
| 7.875% 11/01/26 | | | 1,855,000 | | | | 1,655,588 | | |
| Coal Total | | | 1,655,588 | | |
| Energy-Alternate Sources – 0.0% | |
| Salton Sea Funding | |
| 8.300% 05/30/11 | | | 2,159 | | | | 2,232 | | |
| Energy-Alternate Sources Total | | | 2,232 | | |
| Oil & Gas – 7.6% | |
| Oil & Gas Drilling – 0.6% | |
| Parker Drilling Co. | |
| 9.625% 10/01/13 | | | 5,885,000 | | | | 3,942,950 | | |
| | | | 3,942,950 | | |
| Oil Companies-Exploration & Production – 6.7% | |
| Chaparral Energy, Inc. | |
| 8.500% 12/01/15 | | | 5,825,000 | | | | 2,009,625 | | |
| 8.875% 02/01/17 | | | 3,280,000 | | | | 1,131,600 | | |
| Chesapeake Energy Corp. | |
| 6.500% 08/15/17 | | | 2,000,000 | | | | 1,630,000 | | |
| 6.875% 11/15/20 | | | 1,885,000 | | | | 1,475,012 | | |
| 7.500% 09/15/13 | | | 1,040,000 | | | | 951,600 | | |
| Denbury Resources, Inc. | |
| 9.750% 03/01/16 | | | 1,625,000 | | | | 1,568,125 | | |
| Forest Oil Corp. | |
| 7.250% 06/15/19 | | | 2,000,000 | | | | 1,580,000 | | |
See Accompanying Notes to Financial Statements.
46
Columbia High Income Fund
March 31, 2009
| Corporate Fixed-Income Bonds & Notes (continued) | |
| | | Par ($) (a) | | Value ($) | |
| Hilcorp Energy LP/Hilcorp Finance Co. | |
| 7.750% 11/01/15 (b) | | | 2,570,000 | | | | 1,876,100 | | |
| 9.000% 06/01/16 (b) | | | 1,110,000 | | | | 821,400 | | |
| Linn Energy LLC | |
| 9.875% 07/01/18 (b) | | | 2,390,000 | | | | 1,959,800 | | |
| Mariner Energy, Inc. | |
| 7.500% 04/15/13 | | | 3,755,000 | | | | 2,778,700 | | |
| 8.000% 05/15/17 | | | 190,000 | | | | 125,400 | | |
| Newfield Exploration Co. | |
| 6.625% 04/15/16 | | | 2,000,000 | | | | 1,790,000 | | |
| 7.125% 05/15/18 | | | 2,930,000 | | | | 2,593,050 | | |
| PetroHawk Energy Corp. | |
| 7.875% 06/01/15 (b) | | | 2,090,000 | | | | 1,839,200 | | |
| 10.500% 08/01/14 (b) | | | 1,000,000 | | | | 995,000 | | |
| Petroquest Energy, Inc. | |
| 10.375% 05/15/12 | | | 3,225,000 | | | | 1,983,375 | | |
| Plains Exploration & Production Co. | |
| 7.000% 03/15/17 | | | 1,175,000 | | | | 934,125 | | |
| 7.625% 06/01/18 | | | 930,000 | | | | 753,300 | | |
| 10.000% 03/01/16 | | | 2,520,000 | | | | 2,381,400 | | |
| SandRidge Energy, Inc. | |
| 8.000% 06/01/18 (b) | | | 1,530,000 | | | | 1,124,550 | | |
| Stone Energy Corp. | |
| 6.750% 12/15/14 | | | 4,150,000 | | | | 1,639,250 | | |
| 8.250% 12/15/11 | | | 1,195,000 | | | | 627,375 | | |
| Venoco, Inc. | |
| 8.750% 12/15/11 | | | 1,440,000 | | | | 784,800 | | |
| W&T Offshore, Inc. | |
| 8.250% 06/15/14 (b) | | | 1,860,000 | | | | 1,190,400 | | |
| Whiting Petroleum Corp. | |
| 7.000% 02/01/14 | | | 5,620,000 | | | | 4,215,000 | | |
| | | | 40,758,187 | | |
| Oil Refining & Marketing – 0.3% | |
| Frontier Oil Corp. | |
| 8.500% 09/15/16 | | | 1,900,000 | | | | 1,871,500 | | |
| | | | 1,871,500 | | |
| Oil & Gas Total | | | 46,572,637 | | |
| Oil & Gas Services – 0.6% | |
| Oil Field Machinery & Equipment – 0.3% | |
| Complete Production Services, Inc. | |
| 8.000% 12/15/16 | | | 2,650,000 | | | | 1,682,750 | | |
| | | | 1,682,750 | | |
| Oil-Field Services – 0.3% | |
| Allis-Chalmers Energy, Inc. | |
| 8.500% 03/01/17 | | | 615,000 | | | | 265,988 | | |
| 9.000% 01/15/14 | | | 4,075,000 | | | | 1,894,875 | | |
| | | | 2,160,863 | | |
| Oil & Gas Services Total | | | 3,843,613 | | |
| | | Par ($) (a) | | Value ($) | |
| Pipelines – 4.7% | |
| ANR Pipeline Co. | |
| 7.375% 02/15/24 | | | 1,205,000 | | | | 1,158,185 | | |
| 9.625% 11/01/21 | | | 5,980,000 | | | | 7,173,817 | | |
| Copano Energy LLC/Copano Energy Finance Corp. | |
| 7.750% 06/01/18 (b) | | | 6,145,000 | | | | 4,885,275 | | |
| El Paso Natural Gas Co. | |
| 7.625% 08/01/10 | | | 5,240,000 | | | | 5,143,013 | | |
| 8.375% 06/15/32 | | | 1,860,000 | | | | 1,769,654 | | |
| 8.625% 01/15/22 | | | 1,235,000 | | | | 1,185,600 | | |
| MarkWest Energy Partners LP | |
| 6.875% 11/01/14 | | | 1,065,000 | | | | 750,825 | | |
| 8.500% 07/15/16 | | | 5,100,000 | | | | 3,646,500 | | |
| 8.750% 04/15/18 | | | 2,535,000 | | | | 1,768,162 | | |
| Regency Energy Partners LP/Regency Energy Finance Corp. | |
| 8.375% 12/15/13 | | | 1,198,000 | | | | 1,018,300 | | |
| Pipelines Total | | | 28,499,331 | | |
| Retail – 0.1% | |
| Energy-Alternate Sources – 0.1% | |
| MXEnergy Holdings, Inc. | |
| 9.134% 08/01/11 (c) | | | 2,830,000 | | | | 919,750 | | |
| | | | 919,750 | | |
| Retail Total | | | 919,750 | | |
| Energy Total | | | 81,493,151 | | |
| Financials – 11.9% | |
| Diversified Financial Services – 5.9% | |
| Finance-Auto Loans – 2.0% | |
| AmeriCredit Corp. | |
| 8.500% 07/01/15 | | | 2,610,000 | | | | 2,244,600 | | |
| Daimler Chrysler 2nd Lien | |
| 7.060% 08/03/13 (c)(f) | | | 6,415,000 | | | | 1,706,390 | | |
| Ford Motor Credit Co. | |
| 5.700% 01/15/10 | | | 2,435,000 | | | | 2,085,726 | | |
| 7.250% 10/25/11 | | | 1,950,000 | | | | 1,388,314 | | |
| 7.375% 10/28/09 | | | 2,355,000 | | | | 2,112,082 | | |
| 7.875% 06/15/10 | | | 885,000 | | | | 731,368 | | |
| GMAC LLC | |
| 8.000% 11/01/31 (b) | | | 4,872,000 | | | | 2,344,212 | | |
| | | | 12,612,692 | | |
| Finance-Investment Banker/Broker – 0.3% | |
| LaBranche & Co., Inc. | |
| 11.000% 05/15/12 | | | 1,795,000 | | | | 1,617,744 | | |
| | | | 1,617,744 | | |
See Accompanying Notes to Financial Statements.
47
Columbia High Income Fund
March 31, 2009
| Corporate Fixed-Income Bonds & Notes (continued) | |
| | | Par ($) (a) | | Value ($) | |
| Finance-Other Services – 1.9% | |
| AMR Real Estate Partners, LP | |
| 7.125% 02/15/13 | | | 6,570,000 | | | | 5,223,150 | | |
| 8.125% 06/01/12 | | | 7,620,000 | | | | 6,477,000 | | |
| | | | 11,700,150 | | |
| Investment Management/Advisor Service – 0.4% | |
| Janus Capital Group, Inc. | |
| 6.950% 06/15/17 | | | 3,065,000 | | | | 1,519,394 | | |
| Nuveen Investments, Inc. | |
| 10.500% 11/15/15 (b) | | | 3,665,000 | | | | 1,026,200 | | |
| | | | 2,545,594 | | |
| Special Purpose Entity – 1.3% | |
| Cedar Brakes LLC | |
| 8.500% 02/15/14 (b) | | | 1,512,649 | | | | 1,448,391 | | |
| 9.875% 09/01/13 (b) | | | 2,350,269 | | | | 2,413,820 | | |
| Harley-Davidson Funding Corp. | |
| 6.800% 06/15/18 (b) | | | 5,780,000 | | | | 3,750,237 | | |
| | | | 7,612,448 | | |
| Diversified Financial Services Total | | | 36,088,628 | | |
| Insurance – 3.3% | |
| Insurance Brokers – 1.3% | |
| HUB International Holdings, Inc. | |
| 9.000% 12/15/14 (b) | | | 5,845,000 | | | | 3,696,963 | | |
| USI Holdings Corp. | |
| 5.113% 11/15/14 (b)(c) | | | 1,365,000 | | | | 641,550 | | |
| 9.750% 05/15/15 (b) | | | 2,390,000 | | | | 1,075,500 | | |
| Willis North America, Inc. | |
| 6.200% 03/28/17 | | | 3,235,000 | | | | 2,267,492 | | |
| | | | 7,681,505 | | |
| Multi-Line Insurance – 0.9% | |
| Fairfax Financial Holdings Ltd. | |
| 7.375% 04/15/18 | | | 875,000 | | | | 771,094 | | |
| 7.750% 07/15/37 | | | 3,590,000 | | | | 2,656,600 | | |
| 8.300% 04/15/26 | | | 185,000 | | | | 138,750 | | |
| Trinity Acquisition Ltd. | |
| 12.875% 12/31/16 (b)(i) | | | 1,840,000 | | | | 1,867,826 | | |
| | | | 5,434,270 | | |
| Mutual Insurance – 0.0% | |
| Lumbermens Mutual Casualty | |
| 8.300% 12/01/37 (b)(d) | | | 180,000 | | | | 1,800 | | |
| 8.450% 12/01/97 (b)(d) | | | 4,600,000 | | | | 46,000 | | |
| 9.150% 07/01/26 (b)(d) | | | 9,865,000 | | | | 98,650 | | |
| | | | 146,450 | | |
| Property/Casualty Insurance – 0.9% | |
| Crum & Forster Holdings Corp. | |
| 7.750% 05/01/17 | | | 6,950,000 | | | | 5,421,000 | | |
| | | | 5,421,000 | | |
| | | Par ($) (a) | | Value ($) | |
| Reinsurance – 0.2% | |
| Allied World Assurance Co. Holdings Ltd. | |
| 7.500% 08/01/16 | | | 2,235,000 | | | | 1,422,034 | | |
| | | | 1,422,034 | | |
| Insurance Total | | | 20,105,259 | | |
| Real Estate Investment Trusts (REITs) – 2.7% | |
| REITS-Health Care – 0.4% | |
| Omega Healthcare Investors, Inc. | |
| 7.000% 04/01/14 | | | 2,920,000 | | | | 2,686,400 | | |
| | | | 2,686,400 | | |
| REITS-Hotels – 0.9% | |
| Host Hotels & Resorts LP | |
| 3.250% 04/15/24 (b) | | | 1,185,000 | | | | 1,075,387 | | |
| 6.875% 11/01/14 | | | 1,090,000 | | | | 839,300 | | |
| 7.000% 08/15/12 | | | 1,355,000 | | | | 1,144,975 | | |
| Host Marriott Corp. | |
| 6.375% 03/15/15 | | | 1,635,000 | | | | 1,209,900 | | |
| 6.750% 06/01/16 | | | 1,315,000 | | | | 959,950 | | |
| | | | 5,229,512 | | |
| REITS-Office Property – 0.4% | |
| LNR Property | |
| 4.000% 07/12/11 (c)(f) | | | 4,672,800 | | | | 2,421,867 | | |
| | | | 2,421,867 | | |
| REITS-Single Tenant – 1.0% | |
| Trustreet Properties, Inc. | |
| 7.500% 04/01/15 | | | 5,950,000 | | | | 5,861,315 | | |
| | | | 5,861,315 | | |
| Real Estate Investment Trusts (REITs) Total | | | 16,199,094 | | |
| Financials Total | | | 72,392,981 | | |
| Industrials – 6.6% | |
| Aerospace & Defense – 0.2% | |
| Aerospace/Defense-Equipment – 0.2% | |
| BE Aerospace, Inc. | |
| 8.500% 07/01/18 | | | 1,620,000 | | | | 1,350,675 | | |
| | | | 1,350,675 | | |
| Aerospace & Defense Total | | | 1,350,675 | | |
| Building Materials – 0.9% | |
| Building & Construction Products-Miscellaneous – 0.2% | |
| Building Materials Corp. of America | |
| 7.750% 08/01/14 | | | 1,750,000 | | | | 1,203,125 | | |
| | | | 1,203,125 | | |
See Accompanying Notes to Financial Statements.
48
Columbia High Income Fund
March 31, 2009
| Corporate Fixed-Income Bonds & Notes (continued) | |
| | | Par ($) (a) | | Value ($) | |
| Building Products-Cement/Aggregation – 0.7% | |
| Texas Industries, Inc. | |
| 7.250% 07/15/13 (b) | | | 5,730,000 | | | | 4,326,150 | | |
| 7.250% 07/15/13 | | | 70,000 | | | | 52,850 | | |
| | | | 4,379,000 | | |
| Building Materials Total | | | 5,582,125 | | |
| Building Products – 0.1% | |
| Chemical-Plastics – 0.1% | |
| CPG International I, Inc. | |
| 10.500% 07/01/13 | | | 1,230,000 | | | | 578,100 | | |
| | | | 578,100 | | |
| Building Products Total | | | 578,100 | | |
| Electrical Components & Equipment – 0.2% | |
| Wire & Cable Products – 0.2% | |
| Belden, Inc. | |
| 7.000% 03/15/17 | | | 1,135,000 | | | | 930,700 | | |
| | | | 930,700 | | |
| Electrical Components & Equipment Total | | | 930,700 | | |
| Environmental Control – 0.7% | |
| Pollution Control – 0.7% | |
| Geo Sub Corp. | |
| 11.000% 05/15/12 | | | 6,165,000 | | | | 4,392,563 | | |
| | | | 4,392,563 | | |
| Environmental Control Total | | | 4,392,563 | | |
| Hand/Machine Tools – 0.2% | |
| Machine Tools & Related Products – 0.2% | |
| Thermadyne Holdings Corp. | |
| 9.500% 02/01/14 | | | 2,055,000 | | | | 1,315,200 | | |
| | | | 1,315,200 | | |
| Hand/Machine Tools Total | | | 1,315,200 | | |
| Metal Fabricate/Hardware – 0.6% | |
| Metal Processors & Fabrication – 0.3% | |
| Metals USA, Inc. | |
| 11.125% 12/01/15 | | | 1,465,000 | | | | 879,000 | | |
| Neenah Foundry Co. | |
| 9.500% 01/01/17 | | | 3,770,000 | | | | 999,050 | | |
| | | | 1,878,050 | | |
| Steel Pipe & Tube – 0.3% | |
| Mueller Water Products, Inc. | |
| 7.375% 06/01/17 | | | 3,265,000 | | | | 1,681,475 | | |
| | | | 1,681,475 | | |
| Metal Fabricate/Hardware Total | | | 3,559,525 | | |
| | | Par ($) (a) | | Value ($) | |
| Miscellaneous Manufacturing – 1.2% | |
| Diversified Manufacturing Operators – 1.2% | |
| Actuant Corp. | |
| 6.875% 06/15/17 | | | 2,215,000 | | | | 1,877,212 | | |
| Polypore, Inc. | |
| 8.750% 05/15/12 | | | 2,565,000 | | | | 1,872,450 | | |
| RBS Global, Inc. & Rexnord Corp. | |
| 9.500% 08/01/14 | | | 4,560,000 | | | | 3,693,600 | | |
| | | | 7,443,262 | | |
| Miscellaneous Manufacturing Total | | | 7,443,262 | | |
| Packaging & Containers – 0.6% | |
| Containers-Metal/Glass – 0.6% | |
| Owens-Brockway Glass Container, Inc. | |
| 6.750% 12/01/14 | | | 4,120,000 | | | | 3,955,200 | | |
| | | | 3,955,200 | | |
| Packaging & Containers Total | | | 3,955,200 | | |
| Transportation – 1.9% | |
| Automotive – 0.8% | |
| BHM Technologies | |
| 8.500% 10/11/26 (c)(f)(i) | | | 1,695,343 | | | | 220,395 | | |
| 12.250% 11/26/10 (c)(f)(i) | | | 565,000 | | | | 480,250 | | |
| Navistar | |
| 3.729% 01/19/12 (c)(f) | | | 1,365,333 | | | | 1,061,547 | | |
| 3.768% 01/19/12 (c)(f) | | | 3,754,667 | | | | 2,919,253 | | |
| | | | 4,681,445 | | |
| Transportation-Railroad – 0.6% | |
| Kansas City Southern de Mexico SA de CV | |
| 7.375% 06/01/14 | | | 4,350,000 | | | | 3,436,500 | | |
| | | | 3,436,500 | | |
| Transportation-Shipping – 0.5% | |
| CEVA Group PLC | |
| 10.000% 09/01/14 (b) | | | 475,000 | | | | 181,688 | | |
| Great Lakes Dredge & Dock Corp. | |
| 7.750% 12/15/13 | | | 2,945,000 | | | | 2,356,000 | | |
| Greenbrier Companies, Inc. | |
| 8.375% 05/15/15 | | | 2,130,000 | | | | 844,013 | | |
| | | | 3,381,701 | | |
| Transportation Total | | | 11,499,646 | | |
| Industrials Total | | | 40,606,996 | | |
See Accompanying Notes to Financial Statements.
49
Columbia High Income Fund
March 31, 2009
| Corporate Fixed-Income Bonds & Notes (continued) | |
| | | Par ($) (a) | | Value ($) | |
| Technology – 3.1% | |
| Semiconductors – 0.5% | |
| Electronic Components-Miscellaneous – 0.5% | |
| NXP BV/NXP Funding LLC | |
| 7.875% 10/15/14 | | | 14,410,000 | | | | 3,350,325 | | |
| | | | 3,350,325 | | |
| Semiconductors Total | | | 3,350,325 | | |
| Software – 2.6% | |
| Application Software – 0.6% | |
| SS&C Technologies, Inc. | |
| 11.750% 12/01/13 | | | 4,495,000 | | | | 3,820,750 | | |
| | | | 3,820,750 | | |
| Software – 1.9% | |
| Sungard Data Systems, Inc. | |
| 2.283% 12/13/12 (b) | | | 1,218,252 | | | | 1,030,946 | | |
| 2.991% 12/13/12 (b)(c)(f) | | | 4,501,002 | | | | 3,808,973 | | |
| 4.875% 01/15/14 | | | 3,585,000 | | | | 2,939,700 | | |
| 10.625% 05/15/15 (b) | | | 4,190,000 | | | | 3,666,250 | | |
| | | | 11,445,869 | | |
| Transactional Software – 0.1% | |
| Open Solutions, Inc. | |
| 9.750% 02/01/15 (b) | | | 3,540,000 | | | | 535,425 | | |
| | | | 535,425 | | |
| Software Total | | | 15,802,044 | | |
| Technology Total | | | 19,152,369 | | |
| Utilities – 7.6% | |
| Electric – 6.8% | |
| Electric-Generation – 1.2% | |
| Intergen NV | |
| 9.000% 06/30/17 (b) | | | 5,835,000 | | | | 5,280,675 | | |
| Reliant Energy Mid-Atlantic Power Holdings LLC | |
| 9.681% 07/02/26 | | | 2,490,000 | | | | 2,241,000 | | |
| | | | 7,521,675 | | |
| Electric-Integrated – 2.8% | |
| Energy Future Holdings Corp. | |
| 10.875% 11/01/17 | | | 4,610,000 | | | | 2,973,450 | | |
| Ipalco Enterprises, Inc. | |
| 7.250% 04/01/16 (b) | | | 2,475,000 | | | | 2,190,375 | | |
| PNM Resources, Inc. | |
| 9.250% 05/15/15 | | | 2,915,000 | | | | 2,576,131 | | |
| Public Service Co. of New Mexico | |
| 7.950% 05/15/18 | | | 3,265,000 | | | | 2,865,038 | | |
| | | Par ($) (a) | | Value ($) | |
| Texas Competitive Electric Holdings Co. LLC | |
| 3.969% 10/10/14 | | | 2,745,607 | | | | 1,805,665 | | |
| 4.018% 10/10/14 | | | 19,711 | | | | 12,957 | | |
| 4.033% 10/10/14 (c)(f) | | | 6,458,908 | | | | 4,242,797 | | |
| Western Resources | |
| 7.125% 08/01/09 | | | 375,000 | | | | 373,479 | | |
| | | | 17,039,892 | | |
| Independent Power Producer – 2.8% | |
| AES Eastern Energy LP | |
| 9.000% 01/02/17 | | | 3,998,261 | | | | 3,638,418 | | |
| 9.670% 01/02/29 | | | 1,175,000 | | | | 1,045,750 | | |
| Calpine Corp. | |
| 4.335% 03/29/14 (c)(f) | | | 7,919,799 | | | | 6,028,947 | | |
| Reliant Energy, Inc. | |
| 7.625% 06/15/14 | | | 1,130,000 | | | | 915,300 | | |
| 7.875% 06/15/17 | | | 6,700,000 | | | | 5,293,000 | | |
| | | | 16,921,415 | | |
| Electric Total | | | 41,482,982 | | |
| Gas Utilities – 0.8% | |
| Retail-Propane Distributors – 0.8% | |
| Star Gas Partners LP/Star Gas Finance Co. | |
| 10.250% 02/15/13 | | | 5,640,000 | | | | 4,709,400 | | |
| | | | 4,709,400 | | |
| Gas Utilities Total | | | 4,709,400 | | |
| Utilities Total | | | 46,192,382 | | |
Total Corporate Fixed-Income Bonds & Notes
(cost of $754,005,152) | | | 539,867,629 | | |
| Preferred Stock – 0.8% | |
| | | Shares | | | |
| Financials – 0.8% | |
| Real Estate Investment Trusts (REITs) – 0.8% | |
| REITS-Diversified – 0.8% | |
Sovereign Real Estate
Investment Corp., 12.00% (b) | | | 7,527,000 | | | | 4,600,879 | | |
| | | | 4,600,879 | | |
| Real Estate Investment Trusts (REITs) Total | | | 4,600,879 | | |
| Financials Total | | | 4,600,879 | | |
Total Preferred Stock
(cost of $9,802,860) | | | 4,600,879 | | |
See Accompanying Notes to Financial Statements.
50
Columbia High Income Fund
March 31, 2009
| Convertible Bonds – 0.6% | |
| | | Par ($) (a) | | Value ($) | |
| Communications – 0.3% | |
| Media – 0.3% | |
| Television – 0.3% | |
| Sinclair Broadcast Group, Inc. | |
| 3.000% 05/15/27 | | | 3,540,000 | | | | 2,026,650 | | |
| | | | 2,026,650 | | |
| Media Total | | | 2,026,650 | | |
| Internet – 0.0% | |
| Web Portals/ISP – 0.0% | |
| At Home Corp. | |
| 4.750% 12/15/06 (e)(i) | | | 3,896,787 | | | | 389 | | |
| | | | 389 | | |
| Internet Total | | | 389 | | |
| Communications Total | | | 2,027,039 | | |
| Consumer Cyclical – 0.0% | |
| Airlines – 0.0% | |
| Delta Air Lines, Inc. | |
| 8.000% 06/03/49 (k) | | | 2,256,000 | | | | 13,536 | | |
| Airlines Total | | | 13,536 | | |
| Consumer Cyclical Total | | | 13,536 | | |
| Consumer Discretionary – 0.3% | |
| Specialty Retail – 0.3% | |
| United Auto Group, Inc. | |
| 3.500% 04/01/26 | | | 1,989,000 | | | | 1,588,714 | | |
| Specialty Retail Total | | | 1,588,714 | | |
| Consumer Discretionary Total | | | 1,588,714 | | |
| Financials – 0.0% | |
| Insurance – 0.0% | |
| Life/Health Insurance – 0.0% | |
| Conseco, Inc. | |
| 3.500% 09/30/35 (b)(l) | |
| (0.000% 09/30/10) | | | 695,000 | | | | 159,850 | | |
| | | | 159,850 | | |
| Insurance Total | | | 159,850 | | |
| Financials Total | | | 159,850 | | |
Total Convertible Bonds
(cost of $5,526,239) | | | 3,789,139 | | |
| Convertible Preferred Stock – 0.5% | |
| | | Shares | | Value ($) | |
| Technology – 0.5% | |
| Software – 0.5% | |
| Quadramed Corp. 5.50% (b) | | | 246,600 | | | | 3,018,631 | | |
| Software Total | | | 3,018,631 | | |
| Technology Total | | | 3,018,631 | | |
Total Convertible Preferred Stock
(cost of $5,957,100) | | | 3,018,631 | | |
| Common Stocks – 0.2% | |
| Communications – 0.0% | |
| Media – 0.0% | |
| Haights Cross Communications (i)(j) | | | 275,078 | | | | — | | |
| Vertis Holdings, Inc. (i) | | | 1,908 | | | | 19 | | |
| Ziff Davis Media, Inc. (i) | | | 12,260 | | | | 123 | | |
| Media Total | | | 142 | | |
| Communications Total | | | 142 | | |
| Consumer Cyclical – 0.0% | |
| Airlines – 0.0% | |
| Delta Air Lines, Inc. (k)(m) | | | 2,739 | | | | 15,420 | | |
| Airlines Total | | | 15,420 | | |
| Consumer Cyclical Total | | | 15,420 | | |
| Consumer Discretionary – 0.0% | |
| Media – 0.0% | |
| AH Belo Corp., Class A | | | 18,600 | | | | 18,228 | | |
| Media Total | | | 18,228 | | |
| Consumer Discretionary Total | | | 18,228 | | |
| Financials – 0.0% | |
| Diversified Financial Services – 0.0% | |
| Adelphia Recovery Trust (i)(m) | | | 1,410,902 | | | | 14,109 | | |
| Diversified Financial Services Total | | | 14,109 | | |
| Financials Total | | | 14,109 | | |
| Information Technology – 0.0% | |
| Communications Equipment – 0.0% | |
| Loral Space & Communications, Inc. (m) | | | 49 | | | | 1,047 | | |
| Communications Equipment Total | | | 1,047 | | |
| Information Technology Total | | | 1,047 | | |
See Accompanying Notes to Financial Statements.
51
Columbia High Income Fund
March 31, 2009
| Common Stocks (continued) | |
| | | Shares | | Value ($) | |
| Technology – 0.1% | |
| Software – 0.1% | |
| Quadramed Corp. (m) | | | 94,933 | | | | 573,395 | | |
| Software Total | | | 573,395 | | |
| Technology Total | | | 573,395 | | |
| Transportation – 0.0% | |
| Automotive – 0.0% | |
| BHM Technologies (i) | | | 116,497 | | | | 1,165 | | |
| Automotive Total | | | 1,165 | | |
| Transportation Total | | | 1,165 | | |
| Utilities – 0.1% | |
| Gas Utilities – 0.1% | |
| Star Gas Partners LP | | | 296,500 | | | | 770,900 | | |
| Gas Utilities Total | | | 770,900 | | |
| Utilities Total | | | 770,900 | | |
Total Common Stocks
(cost of $4,396,734) | | | 1,394,406 | | |
| Warrants – 0.0% | |
| | | Units | | | |
| Communications – 0.0% | |
| Media – 0.0% | |
| Multimedia – 0.0% | |
| Haights Cross Communications | |
| Expires 12/10/11 (i)(j)(m) | | | 1,366 | | | | — | | |
| | | | — | | |
| Media Total | | | — | | |
| Telecommunication Services – 0.0% | |
| Colo.Com, Inc. | |
| Expires 03/15/10 (b)(i)(j)(m) | | | 1,145 | | | | — | | |
| Telecommunication Services Total | | | — | | |
| Communications Total | | | — | | |
Total Warrants
(cost of $23,848) | | | — | | |
| Short-Term Obligation – 7.6% | |
| | | Par ($) | | Value ($) | |
Repurchase agreement with
Fixed Income Clearing Corp.,
dated 03/31/09, due 04/01/09,
at 0.140%, collateralized by
a U.S. Government Agency
Obligation maturing 03/30/10,
market value $47,151,825
(repurchase proceeds
$46,227,180) | | | 46,227,000 | | | | 46,227,000 | | |
Total Short-Term Obligation
(cost of $46,227,000) | | | 46,227,000 | | |
Investments Total – 97.9%
(cost of $825,938,933) (n) | | | 598,897,684 | | |
| Other Assets & Liabilities, Net – 2.1% | | | 12,711,650 | | |
| Net Assets – 100.0% | | | 611,609,334 | | |
Notes to Investment Portfolio:
(a) Principal amount is stated in United States dollars unless otherwise noted.
(b) Security exempt from registration pursuant to Rule 144A under the Securities Act of 1933. These securities may be resold in transactions exempt from registration, normally to qualified institutional buyers. At March 31, 2009, these securities, which are not illiquid except for the following, amounted to $109,250,269, which represents 17.9% of net assets.
| Security | | Acquisition
Date | | Shares/
Par | | Cost | | Value | |
Colo.Com, Inc.
13.875% 03/15/10 | | 01/12/04 | | | 945,502 | | | $ | 171,420 | | | $ | – | | |
Quadramed Corp.,
5.50% Preferred Stock | | 06/21/05 | | | 246,600 | | | | 5,957,100 | | | | 3,018,631 | | |
Sovereign Real Estate
Investment Corp.,
12.00% Preferred Stock | | 07/27/05 | | | 7,527,000 | | | | 9,802,860 | | | | 4,600,879 | | |
| | | | | | | $ | 7,619,510 | | |
(c) The interest rate shown on floating rate or variable rate securities reflects the rate at March 31, 2009.
(d) The issuer has filed for bankruptcy protection under Chapter 11, and is in default of certain debt covenants. Income is not being accrued. At March 31, 2009, the value of these securities amounted to $1,969,516, which represents 0.3% of net assets.
(e) The issuer is in default of certain debt covenants. Income is not being accrued. At March 31, 2009, the value of these securities amounted to $989,139, which represents 0.2% of net assets.
(f) Loan participation agreement.
(g) Security purchased on a delayed delivery basis.
(h) Zero coupon bond.
(i) Represents fair value as determined in good faith under procedures approved by the Board of Trustees. The value of these securities amounted to $3,323,793, which represents 0.5% of net assets.
(j) Security has no value.
(k) Position reflects anticipated residual bankruptcy claims. Income is not being accrued.
(l) Step bond. Shown parenthetically is the next coupon rate to be paid and the date the security will begin accruing at this rate.
(m) Non-income producing security.
(n) Cost for federal income tax purposes is $829,719,309.
See Accompanying Notes to Financial Statements.
52
Columbia High Income Fund
March 31, 2009
On April 1, 2008, the Fund adopted Statement of Financial Accounting Standards No. 157, Fair Value Measurements ("SFAS 157"). SFAS 157 establishes a hierarchy that prioritizes the inputs to valuation techniques used to measure fair value giving the highest priority to unadjusted quoted prices in active markets for identical securities (level 1 measurements) and the lowest priority to unobservable inputs (level 3 measurements) when market prices are not readily available or reliable. The three levels of the fair value hierarchy under SFAS 157 are described below:
• Level 1 – quoted prices in active markets for identical securities
• Level 2 – prices determined using other significant observable inputs (including quoted prices for similar securities, interest rates, prepayment speeds, credit risk and others)
• Level 3 – prices determined using significant unobservable inputs. In situations where quoted prices or observable inputs are unavailable or less reliable, unobservable inputs may be used. Unobservable inputs may include management's own assumptions about the factors market participants would use in pricing an investment.
The inputs or methodology used for valuing securities are not necessarily an indication of the risk associated with investing in those securities.
The following table summarizes the inputs used, as of March 31, 2009 in valuing the Fund's assets:
| Valuation Inputs | | Investments in
Securities | | Other Financial
Instruments | |
| Level 1 – Quoted Prices | | $ | 1,378,991 | | | $ | – | | |
Level 2 – Other Significant
Observable Inputs | | | 596,062,726 | | | | – | | |
Level 3 – Significant
Unobservable Inputs | | | 1,455,967 | | | | – | | |
| Total | | $ | 598,897,684 | | | $ | – | | |
The following table reconciles asset balances for the year ended March 31, 2009, in which significant unobservable inputs (Level 3) were used in determining value:
| | | Investments in
Securities | | Other Financial
Instruments | |
Balance as of
March 31, 2008 | | $ | 2,862,210 | | | $ | – | | |
Accretion of Discounts/
Amortization of Premiums | | | (24,717 | ) | | | – | | |
| Realized loss | | | (2,231,666 | ) | | | – | | |
Change in unrealized
depreciation | | | (6,568,687 | ) | | | – | | |
| Net sales | | | (22,277 | ) | | | – | | |
| Transfers into Level 3 | | | 7,441,104 | | | | – | | |
Balance as of
March 31, 2009 | | $ | 1,455,967 | | | $ | – | | |
The change in unrealized losses attributable to securities owned at March 31, 2009 which were valued using significant unobservable inputs (Level 3) amounted to $6,568,687. This amount is included in net change in unrealized depreciation on the Statement of Changes in Net Assets.
The information in the above reconciliation represents fiscal year to date activity for any securities identified as using Level 3 inputs at either the beginning or the end of the current fiscal period.
At March 31, 2009, the asset allocation of the Fund is as follows:
| Asset Allocation (Unaudited) | | % of
Net Assets | |
| Corporate Fixed-Income Bonds & Notes | | | 88.2 | | |
| Preferred Stock | | | 0.8 | | |
| Convertible Bonds | | | 0.6 | | |
| Convertible Preferred Stock | | | 0.5 | | |
| Common Stocks | | | 0.2 | | |
| Warrants | | | 0.0 | * | |
| | | | 90.3 | | |
| Short Term Obligation | | | 7.6 | | |
| Other Assets & Liabilities, Net | | | 2.1 | | |
| | | | 100.0 | | |
* Represent less than 0.1%
| Acronym | | Name | |
| CAD | | Canadian Dollar | |
|
| PIK | | Payment-In-Kind | |
|
See Accompanying Notes to Financial Statements.
53
Statements of Assets and Liabilities – Corporate Bond Funds
March 31, 2009
| | | ($) | | ($) | | ($) | |
| | | Columbia
Total Return
Bond Fund | | Columbia
Short Term
Bond Fund | | Columbia
High Income
Fund | |
| Assets | |
| Unaffiliated investments, at identified cost | | | 1,321,610,872 | | | | 1,464,824,720 | | | | 825,938,933 | | |
| Affiliated investments, at identified cost | | | 10,351,782 | | | | 6,589,639 | | | | — | | |
| Total investments, at identified cost | | | 1,331,962,654 | | | | 1,471,414,359 | | | | 825,938,933 | | |
| Unaffiliated investments, at value | | | 1,220,801,949 | | | | 1,414,964,809 | | | | 598,897,684 | | |
| Affiliated investments, at value | | | 7,299,228 | | | | 6,251,522 | | | | — | | |
Total investments, at value (including securities on loan of
$1,008,053, $115,738,471 and $—, respectively) | | | 1,228,101,177 | | | | 1,421,216,331 | | | | 598,897,684 | | |
| Cash | | | 2,901 | | | | 475 | | | | 204,209 | | |
| Cash collateral for open credit default swap contracts | | | 880,000 | | | | — | | | | — | | |
| Foreign currency (cost of $135,611, $— and $—, respectively) | | | 132,886 | | | | — | | | | — | | |
Unrealized appreciation on forward foreign currency
exchange contracts | | | 423,646 | | | | — | | | | — | | |
| Open credit default swap contracts | | | 732,641 | | | | — | | | | — | | |
| Receivable for: | |
| Investments sold | | | 89,231,905 | | | | — | | | | 478,557 | | |
| Fund shares sold | | | 494,742 | | | | 4,238,324 | | | | 412,542 | | |
| Dividends | | | 10 | | | | — | | | | — | | |
| Interest | | | 11,520,349 | | | | 8,242,264 | | | | 16,854,070 | | |
| Securities lending | | | 5,830 | | | | 61,388 | | | | — | | |
| Foreign tax reclaims | | | 13,341 | | | | — | | | | — | | |
| Futures variation margin | | | — | | | | 160,276 | | | | — | | |
| Expense reimbursement due from investment advisor | | | — | | | | 23,276 | | | | — | | |
| Trustees' deferred compensation plan | | | 4,661 | | | | 9,304 | | | | — | | |
| Other assets | | | 18,694 | | | | 16,903 | | | | 8,887 | | |
| Total Assets | | | 1,331,562,783 | | | | 1,433,968,541 | | | | 616,855,949 | | |
| Liabilities | |
| Collateral on securities loaned | | | 1,023,975 | | | | 118,034,036 | | | | — | | |
| Open credit default swap contracts | | | 852,864 | | | | — | | | | — | | |
Unrealized depreciation on forward foreign currency
exchange contracts | | | 1,259,580 | | | | — | | | | — | | |
| Payable for: | |
| Investments purchased | | | 97,259,079 | | | | 8,699,964 | | | | 1,241,419 | | |
| Investments purchased on a delayed delivery basis | | | — | | | | — | | | | 2,291,886 | | |
| Fund shares repurchased | | | 1,958,102 | | | | 1,617,834 | | | | 1,064,719 | | |
| Futures variation margin | | | 131,078 | | | | — | | | | — | | |
| Distributions | | | 3,363,465 | | | | 2,913,217 | | | | — | | |
| Investment advisory fee | | | 378,641 | | | | 320,209 | | | | 271,076 | | |
| Administration fee | | | 143,924 | | | | 119,320 | | | | 103,624 | | |
| Transfer agent fee | | | 105,390 | | | | 115,853 | | | | 82,545 | | |
| Trustees' fees | | | 63,945 | | | | 86,740 | | | | 47,356 | | |
| Pricing and bookkeeping fees | | | 24,387 | | | | 19,363 | | | | 16,499 | | |
| Custody fee | | | 21,060 | | | | 8,324 | | | | 3,554 | | |
| Distribution and service fees | | | 11,334 | | | | 49,255 | | | | 62,926 | | |
| Chief compliance officer expenses | | | 294 | | | | 258 | | | | 226 | | |
| Interest payable | | | 116 | | | | — | | | | — | | |
| Trustees' deferred compensation plan | | | 4,661 | | | | 9,304 | | | | — | | |
| Other liabilities | | | 60,408 | | | | 71,147 | | | | 60,785 | | |
| Total Liabilities | | | 106,662,303 | | | | 132,064,824 | | | | 5,246,615 | | |
| Net Assets | | | 1,224,900,480 | | | | 1,301,903,717 | | | | 611,609,334 | | |
See Accompanying Notes to Financial Statements.
54
Statements of Assets and Liabilities (continued) – Corporate Bond Funds
March 31, 2009
| | | ($) | | ($) | | ($) | |
| | | Columbia
Total Return
Bond Fund | | Columbia
Short Term
Bond Fund | | Columbia
High Income
Fund | |
| Net Assets Consist of | |
| Paid-in capital | | | 1,422,022,010 | | | | 1,391,575,373 | | | | 880,618,604 | | |
| Undistributed (Overdistributed) net investment income | | | (6,237,590 | ) | | | (995,592 | ) | | | 1,828,682 | | |
| Accumulated net realized loss | | | (84,406,089 | ) | | | (39,210,518 | ) | | | (43,794,723 | ) | |
| Net unrealized appreciation (depreciation) on: | |
| Investments | | | (103,861,477 | ) | | | (50,198,028 | ) | | | (227,041,249 | ) | |
Foreign currency translations and forward foreign currency
exchange contracts | | | (863,638 | ) | | | — | | | | (1,980 | ) | |
| Futures contracts | | | (1,611,176 | ) | | | 732,482 | | | | — | | |
| Credit default swap contracts | | | (141,560 | ) | | | — | | | | — | | |
| Net Assets | | | 1,224,900,480 | | | | 1,301,903,717 | | | | 611,609,334 | | |
| Class A | |
| Net assets | | $ | 18,220,644 | | | $ | 121,913,984 | | | $ | 70,835,750 | | |
| Shares outstanding | | | 2,090,546 | | | | 12,873,127 | | | | 11,966,663 | | |
| Net asset value per share (a) | | $ | 8.72 | | | $ | 9.47 | | | $ | 5.92 | | |
| Maximum sales charge | | | 3.25 | % | | | 1.00 | % | | | 4.75 | % | |
| Maximum offering price per share (b) | | $ | 9.01 | | | $ | 9.57 | | | $ | 6.22 | | |
| Class B | |
| Net assets | | $ | 4,861,329 | | | $ | 10,501,572 | | | $ | 36,666,802 | | |
| Shares outstanding | | | 557,555 | | | | 1,109,469 | | | | 6,211,123 | | |
| Net asset value per share (a) | | $ | 8.72 | | | $ | 9.47 | | | $ | 5.90 | | |
| Class C | |
| Net assets | | $ | 3,529,313 | | | $ | 35,925,661 | | | $ | 17,990,882 | | |
| Shares outstanding | | | 404,912 | | | | 3,797,518 | | | | 3,062,921 | | |
| Net asset value per share (a) | | $ | 8.72 | | | $ | 9.46 | | | $ | 5.87 | | |
| Class Z | |
| Net assets | | $ | 1,198,289,194 | | | $ | 1,133,562,500 | | | $ | 486,115,900 | | |
| Shares outstanding | | | 137,355,352 | | | | 119,913,535 | | | | 81,345,696 | | |
| Net asset value per share | | $ | 8.72 | | | $ | 9.45 | | | $ | 5.98 | | |
(a) Redemption price per share is equal to net asset value less any applicable contingent deferred sales charge.
(b) On sales of $50,000 or more the offering price is reduced.
See Accompanying Notes to Financial Statements.
55
Statements of Operations – Corporate Bond Funds
For the Year Ended March 31, 2009
| | | ($) | | ($) | | ($) | |
| | | Columbia
Total Return
Bond Fund | | Columbia
Short Term
Bond Fund | | Columbia
High Income
Fund | |
| Investment Income | |
| Interest | | | 83,106,642 | | | | 61,334,677 | | | | 64,376,723 | | |
| Interest from affiliates | | | 641,975 | | | | 305,581 | | | | — | | |
| Dividends | | | 502 | | | | — | | | | 388,160 | | |
| Securities lending | | | 351,566 | | | | 713,520 | | | | — | | |
| Foreign taxes withheld | | | (989 | ) | | | — | | | | — | | |
| Total Investment Income | | | 84,099,696 | | | | 62,353,778 | | | | 64,764,883 | | |
| Expenses | |
| Investment advisory fee | | | 5,302,451 | | | | 3,615,919 | | | | 3,760,114 | | |
| Administration fee | | | 2,099,443 | | | | 1,550,851 | | | | 1,462,420 | | |
| Shareholder servicing and distribution fee: | |
| Class A | | | 48,524 | | | | 218,682 | | | | 212,923 | | |
| Distribution fee: | |
| Class B | | | 43,034 | | | | 91,255 | | | | 377,997 | | |
| Class C | | | 22,949 | | | | 181,761 | | | | 161,528 | | |
| Service fee: | |
| Class B | | | 14,345 | | | | 30,419 | | | | 125,999 | | |
| Class C | | | 7,650 | | | | 60,587 | | | | 53,843 | | |
| Transfer agent fee | | | 1,003,556 | | | | 638,703 | | | | 756,665 | | |
| Pricing and bookkeeping fees | | | 191,276 | | | | 171,635 | | | | 159,698 | | |
| Trustees' fees | | | 9,034 | | | | 11,737 | | | | (2,655 | ) | |
| Custody fee | | | 96,840 | | | | 42,467 | | | | 21,817 | | |
| Chief compliance officer expenses | | | 728 | | | | 800 | | | | 870 | | |
| Other expenses | | | 260,262 | | | | 232,823 | | | | 294,066 | | |
| Expenses before interest expense | | | 9,100,092 | | | | 6,847,639 | | | | 7,385,285 | | |
| Interest expense | | | 1,400 | | | | — | | | | — | | |
| Total Expenses | | | 9,101,492 | | | | 6,847,639 | | | | 7,385,285 | | |
| Fees waived by transfer agent | | | — | | | | — | | | | (10,337 | ) | |
Fees waived or expenses reimbursed by investment advisor
and/or administrator | | | — | | | | (463,357 | ) | | | — | | |
| Fees waived by distributor—Class C | | | — | | | | (106,633 | ) | | | — | | |
| Expense reductions | | | (6,006 | ) | | | (4,808 | ) | | | (2,748 | ) | |
| Net Expenses | | | 9,095,486 | | | | 6,272,841 | | | | 7,372,200 | | |
| Net Investment Income | | | 75,004,210 | | | | 56,080,937 | | | | 57,392,683 | | |
See Accompanying Notes to Financial Statements.
56
Statements of Operations – Corporate Bond Funds
For the Year Ended March 31, 2009 (continued)
| | | ($) | | ($) | | ($) | |
| | | Columbia
Total Return
Bond Fund | | Columbia
Short Term
Bond Fund | | Columbia
High Income
Fund | |
| Net Realized and Unrealized Gain (Loss) on Investments, | |
| Foreign Currency, Futures Contracts and Credit Default Swap Contracts | |
| Net realized gain (loss) on: | |
| Affiliated investments | | | (60,896 | ) | | | — | | | | — | | |
| Unaffiliated investments | | | (54,875,367 | ) | | | 975,833 | | | | (42,528,975 | ) | |
| Foreign currency transactions | | | 4,762,150 | | | | — | | | | (64,112 | ) | |
| Futures contracts | | | (468,487 | ) | | | 914,675 | | | | — | | |
| Credit default swap contracts | | | 3,463,548 | | | | — | | | | — | | |
| Net realized gain (loss) | | | (47,179,052 | ) | | | 1,890,508 | | | | (42,593,087 | ) | |
| Net change in unrealized appreciation (depreciation) on: | |
| Investments | | | (89,406,209 | ) | | | (56,644,055 | ) | | | (159,017,002 | ) | |
| Foreign currency translations | | | (905,176 | ) | | | — | | | | (26,740 | ) | |
| Futures contracts | | | (3,099,996 | ) | | | 336,730 | | | | — | | |
| Credit default swap contracts | | | (251,559 | ) | | | — | | | | — | | |
| Net change in unrealized appreciation (depreciation) | | | (93,662,940 | ) | | | (56,307,325 | ) | | | (159,043,742 | ) | |
| Net Loss | | | (140,841,992 | ) | | | (54,416,817 | ) | | | (201,636,829 | ) | |
| Net Increase (Decrease) Resulting from Operations | | | (65,837,782 | ) | | | 1,664,120 | | | | (144,244,146 | ) | |
See Accompanying Notes to Financial Statements.
57
Statements of Changes in Net Assets – Corporate Bond Funds
Increase (Decrease)
in Net Assets | | Columbia Total Return
Bond Fund | | Columbia Short Term
Bond Fund | | Columbia High Income
Fund | |
| | | Year Ended March 31, | | Year Ended March 31, | | Year Ended March 31, | |
| | | 2009 ($) | | 2008 ($) | | 2009 ($) | | 2008 ($) | | 2009 ($) | | 2008 ($) | |
| Operations | |
| Net investment income | | | 75,004,210 | | | | 92,437,288 | | | | 56,080,937 | | | | 43,492,484 | | | | 57,392,683 | | | | 65,528,392 | | |
Net realized gain (loss)
on investments, foreign
currency transactions,
futures contracts and
credit default
swap contracts | | | (47,179,052 | ) | | | (35,328,826 | ) | | | 1,890,508 | | | | (806,785 | ) | | | (42,593,087 | ) | | | 10,190,567 | | |
Net change in unrealized
appreciation (depreciation)
on investments, foreign
currency translations,
futures contracts and
credit default
swap contracts | | | (93,662,940 | ) | | | (9,720,848 | ) | | | (56,307,325 | ) | | | 6,077,170 | | | | (159,043,742 | ) | | | (109,204,314 | ) | |
Net increase (decrease)
resulting from operations | | | (65,837,782 | ) | | | 47,387,614 | | | | 1,664,120 | | | | 48,762,869 | | | | (144,244,146 | ) | | | (33,485,355 | ) | |
Distributions
to Shareholders | |
| From net investment income: | |
| Class A | | | (992,675 | ) | | | (1,120,562 | ) | | | (3,827,846 | ) | | | (3,406,469 | ) | | | (6,762,477 | ) | | | (8,032,994 | ) | |
| Class B | | | (249,664 | ) | | | (308,699 | ) | | | (440,891 | ) | | | (629,365 | ) | | | (3,648,567 | ) | | | (5,296,951 | ) | |
| Class C | | | (133,621 | ) | | | (97,398 | ) | | | (985,739 | ) | | | (697,958 | ) | | | (1,577,538 | ) | | | (2,121,810 | ) | |
| Class Z | | | (78,657,832 | ) | | | (90,617,590 | ) | | | (50,075,377 | ) | | | (39,527,069 | ) | | | (44,798,872 | ) | | | (50,271,068 | ) | |
| From net realized gains: | |
| Class A | | | — | | | | — | | | | — | | | | — | | | | (744,301 | ) | | | (935,610 | ) | |
| Class B | | | — | | | | — | | | | — | | | | — | | | | (469,197 | ) | | | (675,252 | ) | |
| Class C | | | — | | | | — | | | | — | | | | — | | | | (195,286 | ) | | | (266,709 | ) | |
| Class Z | | | — | | | | — | | | | — | | | | — | | | | (4,685,440 | ) | | | (5,484,036 | ) | |
Total distributions
to shareholders | | | (80,033,792 | ) | | | (92,144,249 | ) | | | (55,329,853 | ) | | | (44,260,861 | ) | | | (62,881,678 | ) | | | (73,084,430 | ) | |
Net Capital
Stock Transactions | | | (345,366,302 | ) | | | (140,111,581 | ) | | | 154,132,956 | | | | 215,736,800 | | | | 82,772,300 | | | | (149,511,672 | ) | |
Increase from regulatory
settlement | | | 3,547 | | | | — | | | | 6,972 | | | | — | | | | — | | | | — | | |
Total increase (decrease) in
net assets | | | (491,234,329 | ) | | | (184,868,216 | ) | | | 100,474,195 | | | | 220,238,808 | | | | (124,353,524 | ) | | | (256,081,457 | ) | |
| Net Assets | |
| Beginning of period | | | 1,716,134,809 | | | | 1,901,003,025 | | | | 1,201,429,522 | | | | 981,190,714 | | | | 735,962,858 | | | | 992,044,315 | | |
| End of period | | | 1,224,900,480 | | | | 1,716,134,809 | | | | 1,301,903,717 | | | | 1,201,429,522 | | | | 611,609,334 | | | | 735,962,858 | | |
Undistributed (Overdistributed)
net investment income
at end of period | | | (6,237,590 | ) | | | 1,655,654 | | | | (995,592 | ) | | | (1,753,648 | ) | | | 1,828,682 | | | | 1,051,985 | | |
See Accompanying Notes to Financial Statements.
58
This page intentionally left blank.
Statements of Changes in Net Assets – Capital Stock Activity
| | | Columbia Total Return Bond Fund | | Columbia Short Term Bond Fund | |
| | | Year Ended
March 31, 2009 | | Year Ended
March 31, 2008 | | Year Ended
March 31, 2009 | | Year Ended
March 31, 2008 | |
| | | Shares | | Dollars ($) | | Shares | | Dollars ($) | | Shares | | Dollars ($) | | Shares | | Dollars ($) | |
| Class A | |
| Subscriptions | | | 404,055 | | | | 3,578,667 | | | | 413,486 | | | | 3,969,229 | | | | 9,010,357 | | | | 86,048,590 | | | | 1,711,653 | | | | 16,927,363 | | |
| Distributions reinvested | | | 85,082 | | | | 755,655 | | | | 89,080 | | | | 855,591 | | | | 335,479 | | | | 3,209,803 | | | | 249,705 | | | | 2,462,221 | | |
| Redemptions | | | (827,483 | ) | | | (7,475,067 | ) | | | (610,163 | ) | | | (5,853,888 | ) | | | (4,175,154 | ) | | | (39,743,789 | ) | | | (2,959,292 | ) | | | (29,107,470 | ) | |
| Net increase (decrease) | | | (338,346 | ) | | | (3,140,745 | ) | | | (107,597 | ) | | | (1,029,068 | ) | | | 5,170,682 | | | | 49,514,604 | | | | (997,934 | ) | | | (9,717,886 | ) | |
| Class B | |
| Subscriptions | | | 119,710 | | | | 1,059,089 | | | | 164,923 | | | | 1,586,627 | | | | 127,014 | | | | 1,216,785 | | | | 27,033 | | | | 267,921 | | |
| Distributions reinvested | | | 21,946 | | | | 195,171 | | | | 26,071 | | | | 250,484 | | | | 38,957 | | | | 373,741 | | | | 52,850 | | | | 520,430 | | |
| Redemptions | | | (355,397 | ) | | | (3,184,498 | ) | | | (316,244 | ) | | | (3,032,896 | ) | | | (476,096 | ) | | | (4,560,754 | ) | | | (724,365 | ) | | | (7,125,790 | ) | |
| Net decrease | | | (213,741 | ) | | | (1,930,238 | ) | | | (125,250 | ) | | | (1,195,785 | ) | | | (310,125 | ) | | | (2,970,228 | ) | | | (644,482 | ) | | | (6,337,439 | ) | |
| Class C | |
| Subscriptions | | | 162,011 | | | | 1,423,328 | | | | 170,135 | | | | 1,634,256 | | | | 3,151,689 | | | | 30,058,483 | | | | 653,782 | | | | 6,468,016 | | |
| Distributions reinvested | | | 8,067 | | | | 71,352 | | | | 4,790 | | | | 45,988 | | | | 63,710 | | | | 608,097 | | | | 48,442 | | | | 477,091 | | |
| Redemptions | | | (93,363 | ) | | | (824,923 | ) | | | (80,288 | ) | | | (771,211 | ) | | | (1,304,482 | ) | | | (12,405,109 | ) | | | (605,403 | ) | | | (5,957,303 | ) | |
| Net increase (decrease) | | | 76,715 | | | | 669,757 | | | | 94,637 | | | | 909,033 | | | | 1,910,917 | | | | 18,261,471 | | | | 96,821 | | | | 987,804 | | |
| Class Z | |
| Subscriptions | | | 20,480,028 | | | | 185,365,087 | | | | 25,942,843 | | | | 249,416,250 | | | | 44,428,970 | | | | 425,054,819 | | | | 20,398,735 | | | | 200,947,809 | | |
| Proceeds received in connection with merger | | | — | | | | — | | | | — | | | | — | | | | — | | | | — | | | | 26,159,873 | | | | 258,296,287 | | |
| Distributions reinvested | | | 2,360,282 | | | | 20,993,268 | | | | 2,666,535 | | | | 25,632,269 | | | | 1,792,719 | | | | 17,158,946 | | | | 1,313,370 | | | | 12,926,285 | | |
| Redemptions | | | (62,341,691 | ) | | | (547,323,431 | ) | | | (43,096,517 | ) | | | (413,844,280 | ) | | | (36,950,138 | ) | | | (352,886,656 | ) | | | (24,535,676 | ) | | | (241,366,060 | ) | |
| Net increase (decrease) | | | (39,501,381 | ) | | | (340,965,076 | ) | | | (14,487,139 | ) | | | (138,795,761 | ) | | | 9,271,551 | | | | 89,327,109 | | | | 23,336,302 | | | | 230,804,321 | | |
See Accompanying Notes to Financial Statements.
60
| | | Columbia High Income Fund | |
| | | Year Ended
March 31, 2009 | | Year Ended
March 31, 2008 | |
| | | Shares | | Dollars ($) | | Shares | | Dollars ($) | |
| Class A | |
| Subscriptions | | | 5,988,663 | | | | 42,803,769 | | | | 5,419,513 | | | | 46,923,569 | | |
| Distributions reinvested | | | 831,113 | | | | 5,732,753 | | | | 758,829 | | | | 6,556,065 | | |
| Redemptions | | | (7,180,568 | ) | | | (52,486,092 | ) | | | (7,355,098 | ) | | | (64,178,306 | ) | |
| Net increase (decrease) | | | (360,792 | ) | | | (3,949,570 | ) | | | (1,176,756 | ) | | | (10,698,672 | ) | |
| Class B | |
| Subscriptions | | | 265,822 | | | | 1,758,334 | | | | 350,884 | | | | 3,077,375 | | |
| Distributions reinvested | | | 367,188 | | | | 2,538,733 | | | | 418,082 | | | | 3,608,309 | | |
| Redemptions | | | (2,512,623 | ) | | | (17,454,327 | ) | | | (2,953,921 | ) | | | (25,577,756 | ) | |
| Net decrease | | | (1,879,613 | ) | | | (13,157,260 | ) | | | (2,184,955 | ) | | | (18,892,072 | ) | |
| Class C | |
| Subscriptions | | | 931,515 | | | | 5,907,948 | | | | 764,751 | | | | 6,626,251 | | |
| Distributions reinvested | | | 160,500 | | | | 1,096,492 | | | | 168,858 | | | | 1,450,520 | | |
| Redemptions | | | (1,413,827 | ) | | | (9,816,481 | ) | | | (1,486,245 | ) | | | (12,880,529 | ) | |
| Net increase (decrease) | | | (321,812 | ) | | | (2,812,041 | ) | | | (552,636 | ) | | | (4,803,758 | ) | |
| Class Z | |
| Subscriptions | | | 42,874,424 | | | | 297,133,259 | | | | 21,860,199 | | | | 193,255,324 | | |
| Proceeds received in connection with merger | | | — | | | | — | | | | — | | | | — | | |
| Distributions reinvested | | | 2,250,474 | | | | 15,464,375 | | | | 1,815,406 | | | | 15,811,134 | | |
| Redemptions | | | (31,102,146 | ) | | | (209,906,463 | ) | | | (36,893,057 | ) | | | (324,183,628 | ) | |
| Net increase (decrease) | | | 14,022,752 | | | | 102,691,171 | | | | (13,217,452 | ) | | | (115,117,170 | ) | |
See Accompanying Notes to Financial Statements.
61
Financial Highlights – Columbia Total Return Bond Fund
Selected data for a share outstanding throughout each period is as follows:
| | | Year Ended March 31, | |
| Class A Shares | | 2009 | | 2008 | | 2007 | | 2006 (a) | | 2005 | |
| Net Asset Value, Beginning of Period | | $ | 9.51 | | | $ | 9.74 | | | $ | 9.56 | | | $ | 9.80 | | | $ | 10.17 | | |
| Income from Investment Operations: | |
| Net investment income (b) | | | 0.43 | | | | 0.45 | | | | 0.44 | | | | 0.35 | | | | 0.31 | | |
Net realized and unrealized gain (loss) on investments,
foreign currency, futures contracts and credit default
swap contracts | | | (0.76 | ) | | | (0.23 | ) | | | 0.18 | | | | (0.17 | ) | | | (0.19 | ) | |
| Total from investment operations | | | (0.33 | ) | | | 0.22 | | | | 0.62 | | | | 0.18 | | | | 0.12 | | |
| Less Distributions to Shareholders: | |
| From net investment income | | | (0.46 | ) | | | (0.45 | ) | | | (0.44 | ) | | | (0.39 | ) | | | (0.34 | ) | |
| From net realized gains | | | — | | | | — | | | | — | | | | (0.03 | ) | | | (0.15 | ) | |
| Total distributions to shareholders | | | (0.46 | ) | | | (0.45 | ) | | | (0.44 | ) | | | (0.42 | ) | | | (0.49 | ) | |
| Increase from regulatory settlement | | | — | (c) | | | — | | | | — | | | | — | | | | — | | |
| Net Asset Value, End of Period | | $ | 8.72 | | | $ | 9.51 | | | $ | 9.74 | | | $ | 9.56 | | | $ | 9.80 | | |
| Total return (d) | | | (3.45 | )% | | | 2.34 | % | | | 6.65 | % | | | 1.84 | %(e) | | | 1.21 | %(e) | |
| Ratios to Average Net Assets/Supplemental Data: | |
| Net expenses before interest expense (f) | | | 0.85 | % | | | 0.85 | % | | | 0.79 | % | | | 0.79 | % | | | 0.83 | % | |
| Interest expense | | | — | %(g) | | | — | | | | — | | | | — | | | | — | | |
| Net expenses (f) | | | 0.85 | % | | | 0.85 | % | | | 0.79 | % | | | 0.79 | % | | | 0.83 | % | |
| Waiver/Reimbursement | | | — | | | | — | | | | — | | | | 0.06 | %(h) | | | 0.08 | %(h) | |
| Net investment income (f) | | | 4.79 | % | | | 4.74 | % | | | 4.60 | % | | | 3.91 | % | | | 3.08 | % | |
| Portfolio turnover rate | | | 223 | % | | | 253 | % | | | 320 | % | | | 199 | % | | | 402 | % | |
| Net assets, end of period (000's) | | $ | 18,221 | | | $ | 23,087 | | | $ | 24,704 | | | $ | 35,849 | | | $ | 30,409 | | |
(a) On August 22, 2005, the Fund's Investor A shares were renamed Class A shares.
(b) Per share data was calculated using the average shares outstanding during the period.
(c) Rounds to less than $0.01 per share.
(d) Total return at net asset value assuming all distributions reinvested and no initial sales charge or contingent deferred sales charge.
(e) Had the investment advisor and/or any of its affiliates not waived fees or reimbursed a portion of expenses, total return would have been reduced.
(f) The benefits derived from expense reductions had an impact of less than 0.01%.
(g) Rounds to less than 0.01%.
(h) Bank of America Corporation assumed certain non-recurring costs. Absent these non-recurring costs, the waiver/reimbursement ratio would have been —% and 0.06% for the periods ended March 31, 2006 and March 31, 2005, respectively.
See Accompanying Notes to Financial Statements.
62
Financial Highlights – Columbia Total Return Bond Fund
Selected data for a share outstanding throughout each period is as follows:
| | | Year Ended March 31, | |
| Class B Shares | | 2009 | | 2008 | | 2007 | | 2006 (a) | | 2005 | |
| Net Asset Value, Beginning of Period | | $ | 9.51 | | | $ | 9.74 | | | $ | 9.57 | | | $ | 9.81 | | | $ | 10.17 | | |
| Income from Investment Operations: | |
| Net investment income (b) | | | 0.36 | | | | 0.38 | | | | 0.37 | | | | 0.28 | | | | 0.23 | | |
Net realized and unrealized gain (loss) on investments,
foreign currency, futures contracts and credit default
swap contracts | | | (0.76 | ) | | | (0.23 | ) | | | 0.17 | | | | (0.17 | ) | | | (0.18 | ) | |
| Total from investment operations | | | (0.40 | ) | | | 0.15 | | | | 0.54 | | | | 0.11 | | | | 0.05 | | |
| Less Distributions to Shareholders: | |
| From net investment income | | | (0.39 | ) | | | (0.38 | ) | | | (0.37 | ) | | | (0.32 | ) | | | (0.26 | ) | |
| From net realized gains | | | — | | | | — | | | | — | | | | (0.03 | ) | | | (0.15 | ) | |
| Total distributions to shareholders | | | (0.39 | ) | | | (0.38 | ) | | | (0.37 | ) | | | (0.35 | ) | | | (0.41 | ) | |
| Increase from regulatory settlement | | | — | (c) | | | — | | | | — | | | | — | | | | — | | |
| Net Asset Value, End of Period | | $ | 8.72 | | | $ | 9.51 | | | $ | 9.74 | | | $ | 9.57 | | | $ | 9.81 | | |
| Total return (d) | | | (4.16 | )% | | | 1.58 | % | | | 5.75 | % | | | 1.09 | %(e) | | | 0.55 | %(e) | |
| Ratios to Average Net Assets/Supplemental Data: | |
| Net expenses before interest expense (f) | | | 1.60 | % | | | 1.60 | % | | | 1.54 | % | | | 1.54 | % | | | 1.58 | % | |
| Interest expense | | | — | %(g) | | | — | | | | — | | | | — | | | | — | | |
| Net expenses (f) | | | 1.60 | % | | | 1.60 | % | | | 1.54 | % | | | 1.54 | % | | | 1.58 | % | |
| Waiver/Reimbursement | | | — | | | | — | | | | — | | | | 0.06 | %(h) | | | 0.08 | %(h) | |
| Net investment income (f) | | | 4.04 | % | | | 3.99 | % | | | 3.85 | % | | | 3.14 | % | | | 2.32 | % | |
| Portfolio turnover rate | | | 223 | % | | | 253 | % | | | 320 | % | | | 199 | % | | | 402 | % | |
| Net assets, end of period (000's) | | $ | 4,861 | | | $ | 7,334 | | | $ | 8,735 | | | $ | 10,108 | | | $ | 9,707 | | |
(a) On August 22, 2005, the Fund's Investor B shares were renamed Class B shares.
(b) Per share data was calculated using the average shares outstanding during the period.
(c) Rounds to less than $0.01 per share.
(d) Total return at net asset value assuming all distributions reinvested and no contingent deferred sales charge.
(e) Had the investment advisor and/or any of its affiliates not waived fees or reimbursed a portion of expenses, total return would have been reduced.
(f) The benefits derived from expense reductions had an impact of less than 0.01%.
(g) Rounds to less than 0.01%.
(h) Bank of America Corporation assumed certain non-recurring costs. Absent these non-recurring costs, the waiver/reimbursement ratio would have been —% and 0.06% for the periods ended March 31, 2006 and March 31, 2005, respectively.
See Accompanying Notes to Financial Statements.
63
Financial Highlights – Columbia Total Return Bond Fund
Selected data for a share outstanding throughout each period is as follows:
| | | Year Ended March 31, | |
| Class C Shares | | 2009 | | 2008 | | 2007 | | 2006 (a) | | 2005 | |
| Net Asset Value, Beginning of Period | | $ | 9.51 | | | $ | 9.74 | | | $ | 9.56 | | | $ | 9.80 | | | $ | 10.17 | | |
| Income from Investment Operations: | |
| Net investment income (b) | | | 0.36 | | | | 0.38 | | | | 0.37 | | | | 0.28 | | | | 0.23 | | |
Net realized and unrealized gain (loss) on investments,
foreign currency, futures contracts and credit default
swap contracts | | | (0.76 | ) | | | (0.23 | ) | | | 0.18 | | | | (0.17 | ) | | | (0.19 | ) | |
| Total from investment operations | | | (0.40 | ) | | | 0.15 | | | | 0.55 | | | | 0.11 | | | | 0.04 | | |
| Less Distributions to Shareholders: | |
| From net investment income | | | (0.39 | ) | | | (0.38 | ) | | | (0.37 | ) | | | (0.32 | ) | | | (0.26 | ) | |
| From net realized gains | | | — | | | | — | | | | — | | | | (0.03 | ) | | | (0.15 | ) | |
| Total distributions to shareholders | | | (0.39 | ) | | | (0.38 | ) | | | (0.37 | ) | | | (0.35 | ) | | | (0.41 | ) | |
| Increase from regulatory settlement | | | — | (c) | | | — | | | | — | | | | — | | | | — | | |
| Net Asset Value, End of Period | | $ | 8.72 | | | $ | 9.51 | | | $ | 9.74 | | | $ | 9.56 | | | $ | 9.80 | | |
| Total return (d) | | | (4.17 | )% | | | 1.57 | % | | | 5.86 | % | | | 1.08 | %(e) | | | 0.45 | %(e) | |
| Ratios to Average Net Assets/Supplemental Data: | |
| Net expenses before interest expense (f) | | | 1.60 | % | | | 1.60 | % | | | 1.54 | % | | | 1.54 | % | | | 1.58 | % | |
| Interest expense | | | — | %(g) | | | — | | | | — | | | | — | | | | — | | |
| Net expenses (f) | | | 1.60 | % | | | 1.60 | % | | | 1.54 | % | | | 1.54 | % | | | 1.58 | % | |
| Waiver/Reimbursement | | | — | | | | — | | | | — | | | | 0.06 | %(h) | | | 0.08 | %(h) | |
| Net investment income (f) | | | 4.04 | % | | | 3.97 | % | | | 3.84 | % | | | 3.20 | % | | | 2.32 | % | |
| Portfolio turnover rate | | | 223 | % | | | 253 | % | | | 320 | % | | | 199 | % | | | 402 | % | |
| Net assets, end of period (000's) | | $ | 3,529 | | | $ | 3,120 | | | $ | 2,275 | | | $ | 2,956 | | | $ | 1,470 | | |
(a) On August 22, 2005, the Fund's Investor C shares were renamed Class C shares.
(b) Per share data was calculated using the average shares outstanding during the period.
(c) Rounds to less than $0.01 per share.
(d) Total return at net asset value assuming all distributions reinvested and no contingent deferred sales charge.
(e) Had the investment advisor and/or any of its affiliates not waived fees or reimbursed a portion of expenses, total return would have been reduced.
(f) The benefits derived from expense reductions had an impact of less than 0.01%.
(g) Rounds to less than 0.01%.
(h) Bank of America Corporation assumed certain non-recurring costs. Absent these non-recurring costs, the waiver/reimbursement ratio would have been —% and 0.06% for the periods ended March 31, 2006 and March 31, 2005, respectively.
See Accompanying Notes to Financial Statements.
64
Financial Highlights – Columbia Total Return Bond Fund
Selected data for a share outstanding throughout each period is as follows:
| | | Year Ended March 31, | |
| Class Z Shares | | 2009 | | 2008 | | 2007 | | 2006 (a) | | 2005 | |
| Net Asset Value, Beginning of Period | | $ | 9.51 | | | $ | 9.75 | | | $ | 9.57 | | | $ | 9.81 | | | $ | 10.17 | | |
| Income from Investment Operations: | |
| Net investment income (b) | | | 0.45 | | | | 0.48 | | | | 0.47 | | | | 0.37 | | | | 0.33 | | |
Net realized and unrealized gain (loss) on investments,
foreign currency, futures contracts and credit default
swap contracts | | | (0.76 | ) | | | (0.24 | ) | | | 0.18 | | | | (0.16 | ) | | | (0.18 | ) | |
| Total from investment operations | | | (0.31 | ) | | | 0.24 | | | | 0.65 | | | | 0.21 | | | | 0.15 | | |
| Less Distributions to Shareholders: | |
| From net investment income | | | (0.48 | ) | | | (0.48 | ) | | | (0.47 | ) | | | (0.42 | ) | | | (0.36 | ) | |
| From net realized gains | | | — | | | | — | | | | — | | | | (0.03 | ) | | | (0.15 | ) | |
| Total distributions to shareholders | | | (0.48 | ) | | | (0.48 | ) | | | (0.47 | ) | | | (0.45 | ) | | | (0.51 | ) | |
| Increase from regulatory settlement | | | — | (c) | | | — | | | | — | | | | — | | | | — | | |
| Net Asset Value, End of Period | | $ | 8.72 | | | $ | 9.51 | | | $ | 9.75 | | | $ | 9.57 | | | $ | 9.81 | | |
| Total return (d) | | | (3.20 | )% | | | 2.49 | % | | | 6.91 | % | | | 2.10 | %(e) | | | 1.56 | %(e) | |
| Ratios to Average Net Assets/Supplemental Data: | |
| Net expenses before interest expense (f) | | | 0.60 | % | | | 0.60 | % | | | 0.54 | % | | | 0.54 | % | | | 0.58 | % | |
| Interest expense | | | — | %(g) | | | — | | | | — | | | | — | | | | — | | |
| Net expenses (f) | | | 0.60 | % | | | 0.60 | % | | | 0.54 | % | | | 0.54 | % | | | 0.58 | % | |
| Waiver/Reimbursement | | | — | | | | — | | | | — | | | | 0.06 | %(h) | | | 0.08 | %(h) | |
| Net investment income (f) | | | 5.03 | % | | | 4.98 | % | | | 4.85 | % | | | 4.13 | % | | | 3.30 | % | |
| Portfolio turnover rate | | | 223 | % | | | 253 | % | | | 320 | % | | | 199 | % | | | 402 | % | |
| Net assets, end of period (000's) | | $ | 1,198,289 | | | $ | 1,682,595 | | | $ | 1,865,289 | | | $ | 1,997,046 | | | $ | 1,861,448 | | |
(a) On August 22, 2005, the Fund's Primary A shares were renamed Class Z shares.
(b) Per share data was calculated using the average shares outstanding during the period.
(c) Rounds to less than $0.01 per share.
(d) Total return at net asset value assuming all distributions reinvested.
(e) Had the investment advisor and/or any of its affiliates not waived fees or reimbursed a portion of expenses, total return would have been reduced.
(f) The benefits derived from expense reductions had an impact of less than 0.01%.
(g) Rounds to less than 0.01%.
(h) Bank of America Corporation assumed certain non-recurring costs. Absent these non-recurring costs, the waiver/reimbursement ratio would have been —% and 0.06% for the periods ended March 31, 2006 and March 31, 2005, respectively.
See Accompanying Notes to Financial Statements.
65
Financial Highlights – Columbia Short Term Bond Fund
Selected data for a share outstanding throughout each period is as follows:
| | | Year Ended March 31, | |
| Class A Shares | | 2009 | | 2008 | | 2007 | | 2006 (a) | | 2005 | |
| Net Asset Value, Beginning of Period | | $ | 9.89 | | | $ | 9.84 | | | $ | 9.75 | | | $ | 9.82 | | | $ | 10.07 | | |
| Income from Investment Operations: | |
| Net investment income (b) | | | 0.42 | | | | 0.44 | | | | 0.40 | | | | 0.31 | | | | 0.21 | | |
Net realized and unrealized gain (loss) on
investments and futures contracts | | | (0.42 | ) | | | 0.05 | | | | 0.09 | | | | (0.07 | ) | | | (0.23 | ) | |
| Total from investment operations | | | — | | | | 0.49 | | | | 0.49 | | | | 0.24 | | | | (0.02 | ) | |
| Less Distributions to Shareholders: | |
| From net investment income | | | (0.42 | ) | | | (0.44 | ) | | | (0.40 | ) | | | (0.31 | ) | | | (0.21 | ) | |
| From net realized gains | | | — | | | | — | | | | — | | | | — | | | | (0.02 | ) | |
| Total distributions to shareholders | | | (0.42 | ) | | | (0.44 | ) | | | (0.40 | ) | | | (0.31 | ) | | | (0.23 | ) | |
| Increase from regulatory settlement | | | — | (c) | | | — | | | | — | | | | — | | | | — | | |
| Net Asset Value, End of Period | | $ | 9.47 | | | $ | 9.89 | | | $ | 9.84 | | | $ | 9.75 | | | $ | 9.82 | | |
| Total return (d)(e) | | | 0.03 | % | | | 5.13 | % | | | 5.12 | % | | | 2.47 | % | | | (0.19 | )% | |
| Ratios to Average Net Assets/Supplemental Data: | |
| Net expenses (f) | | | 0.73 | % | | | 0.73 | % | | | 0.73 | % | | | 0.72 | % | | | 0.73 | % | |
| Waiver/Reimbursement | | | 0.04 | % | | | 0.02 | % | | | 0.02 | % | | | 0.08 | %(g) | | | 0.10 | %(g) | |
| Net investment income (f) | | | 4.43 | % | | | 4.43 | % | | | 4.05 | % | | | 3.27 | % | | | 2.10 | % | |
| Portfolio turnover rate | | | 58 | % | | | 58 | % | | | 72 | % | | | 80 | % | | | 128 | % | |
| Net assets, end of period (000's) | | $ | 121,914 | | | $ | 76,196 | | | $ | 85,635 | | | $ | 83,675 | | | $ | 38,130 | | |
(a) On August 22, 2005, the Fund's Investor A shares were renamed Class A shares.
(b) Per share data was calculated using the average shares outstanding during the period.
(c) Rounds to less than $0.01 per share.
(d) Total return at net asset value assuming all distributions reinvested and no initial sales charge or contingent deferred sales charge.
(e) Had the investment advisor and/or any of its affiliates not waived fees or reimbursed a portion of expenses, total return would have been reduced.
(f) The benefits derived from expense reductions had an impact of less than 0.01%.
(g) Bank of America Corporation assumed certain non-recurring costs. Absent these non-recurring costs, the waiver/reimbursement ratio would have been 0.02% and 0.08% for the periods ended March 31, 2006 and March 31, 2005, respectively.
See Accompanying Notes to Financial Statements.
66
Financial Highlights – Columbia Short Term Bond Fund
Selected data for a share outstanding throughout each period is as follows:
| | | Year Ended March 31, | |
| Class B Shares | | 2009 | | 2008 | | 2007 | | 2006 (a) | | 2005 | |
| Net Asset Value, Beginning of Period | | $ | 9.89 | | | $ | 9.84 | | | $ | 9.74 | | | $ | 9.81 | | | $ | 10.07 | | |
| Income from Investment Operations: | |
| Net investment income (b) | | | 0.35 | | | | 0.36 | | | | 0.32 | | | | 0.25 | | | | 0.14 | | |
Net realized and unrealized gain (loss) on
investments and futures contracts | | | (0.42 | ) | | | 0.06 | | | | 0.11 | | | | (0.08 | ) | | | (0.24 | ) | |
| Total from investment operations | | | (0.07 | ) | | | 0.42 | | | | 0.43 | | | | 0.17 | | | | (0.10 | ) | |
| Less Distributions to Shareholders: | |
| From net investment income | | | (0.35 | ) | | | (0.37 | ) | | | (0.33 | ) | | | (0.24 | ) | | | (0.14 | ) | |
| From net realized gains | | | — | | | | — | | | | — | | | | — | | | | (0.02 | ) | |
| Total distributions to shareholders | | | (0.35 | ) | | | 0.37 | | | | (0.33 | ) | | | (0.24 | ) | | | (0.16 | ) | |
| Increase from regulatory settlement | | | — | (c) | | | — | | | | — | | | | — | | | | — | | |
| Net Asset Value, End of Period | | $ | 9.47 | | | $ | 9.89 | | | $ | 9.84 | | | $ | 9.74 | | | $ | 9.81 | | |
| Total return (d)(e) | | | (0.72 | )% | | | 4.35 | % | | | 4.45 | % | | | 1.71 | % | | | (1.03 | )% | |
| Ratios to Average Net Assets/Supplemental Data: | |
| Net expenses (f) | | | 1.48 | % | | | 1.48 | % | | | 1.48 | % | | | 1.47 | % | | | 1.48 | % | |
| Waiver/Reimbursement | | | 0.04 | % | | | 0.02 | % | | | 0.02 | % | | | 0.08 | %(g) | | | 0.10 | %(g) | |
| Net investment income (f) | | | 3.69 | % | | | 3.69 | % | | | 3.30 | % | | | 2.69 | % | | | 1.37 | % | |
| Portfolio turnover rate | | | 58 | % | | | 58 | % | | | 72 | % | | | 80 | % | | | 128 | % | |
| Net assets, end of period (000's) | | $ | 10,502 | | | $ | 14,035 | | | $ | 20,303 | | | $ | 28,061 | | | $ | 1,477 | | |
(a) On August 22, 2005, the Fund's Investor B shares were renamed Class B shares.
(b) Per share data was calculated using the average shares outstanding during the period.
(c) Rounds to less than $0.01 per share.
(d) Total return at net asset value assuming all distributions reinvested and no contingent deferred sales charge.
(e) Had the investment advisor and/or any of its affiliates not waived fees or reimbursed a portion of expenses, total return would have been reduced.
(f) The benefits derived from expense reductions had an impact of less than 0.01%.
(g) Bank of America Corporation assumed certain non-recurring costs. Absent these non-recurring costs, the waiver/reimbursement ratio would have been 0.02% and 0.08% for the periods ended March 31, 2006 and March 31, 2005, respectively.
See Accompanying Notes to Financial Statements.
67
Financial Highlights – Columbia Short Term Bond Fund
Selected data for a share outstanding throughout each period is as follows:
| | | Year Ended March 31, | |
| Class C Shares | | 2009 | | 2008 | | 2007 | | 2006 (a) | | 2005 | |
| Net Asset Value, Beginning of Period | | $ | 9.88 | | | $ | 9.83 | | | $ | 9.74 | | | $ | 9.81 | | | $ | 10.07 | | |
| Income from Investment Operations: | |
| Net investment income (b) | | | 0.39 | | | | 0.41 | | | | 0.37 | | | | 0.26 | | | | 0.13 | | |
Net realized and unrealized gain (loss) on
investments and futures contracts | | | (0.42 | ) | | | 0.05 | | | | 0.09 | | | | (0.07 | ) | | | (0.23 | ) | |
| Total from investment operations | | | (0.03 | ) | | | 0.46 | | | | 0.46 | | | | 0.19 | | | | (0.10 | ) | |
| Less Distributions to Shareholders: | |
| From net investment income | | | (0.39 | ) | | | (0.41 | ) | | | (0.37 | ) | | | (0.26 | ) | | | (0.14 | ) | |
| From net realized gains | | | — | | | | — | | | | — | | | | — | | | | (0.02 | ) | |
| Total distributions to shareholders | | | (0.39 | ) | | | (0.41 | ) | | | (0.37 | ) | | | (0.26 | ) | | | (0.16 | ) | |
| Increase from regulatory settlement | | | — | (c) | | | — | | | | — | | | | — | | | | — | | |
| Net Asset Value, End of Period | | $ | 9.46 | | | $ | 9.88 | | | $ | 9.83 | | | $ | 9.74 | | | $ | 9.81 | | |
| Total return (d)(e) | | | (0.29 | )% | | | 4.80 | % | | | 4.80 | % | | | 1.94 | % | | | (1.03 | )% | |
| Ratios to Average Net Assets/Supplemental Data: | |
| Net expenses (f) | | | 1.04 | % | | | 1.04 | % | | | 1.04 | % | | | 1.20 | % | | | 1.48 | % | |
| Waiver/Reimbursement | | | 0.48 | % | | | 0.46 | % | | | 0.46 | % | | | 0.35 | %(g) | | | 0.10 | %(g) | |
| Net investment income (f) | | | 4.12 | % | | | 4.12 | % | | | 3.75 | % | | | 2.69 | % | | | 1.36 | % | |
| Portfolio turnover rate | | | 58 | % | | | 58 | % | | | 72 | % | | | 80 | % | | | 128 | % | |
| Net assets, end of period (000's) | | $ | 35,926 | | | $ | 18,644 | | | $ | 17,598 | | | $ | 22,091 | | | $ | 17,980 | | |
(a) On August 22, 2005, the Fund's Investor C shares were renamed Class C shares.
(b) Per share data was calculated using the average shares outstanding during the period.
(c) Rounds to less than $0.01 per share.
(d) Total return at net asset value assuming all distributions reinvested and no contingent deferred sales charge.
(e) Had the investment advisor and/or any of its affiliates not waived fees or reimbursed a portion of expenses, total return would have been reduced.
(f) The benefits derived from expense reductions had an impact of less than 0.01%.
(g) Bank of America Corporation assumed certain non-recurring costs. Absent these non-recurring costs, the waiver/reimbursement ratio would have been 0.02% and 0.08% for the periods ended March 31, 2006 and March 31, 2005, respectively.
See Accompanying Notes to Financial Statements.
68
Financial Highlights – Columbia Short Term Bond Fund
Selected data for a share outstanding throughout each period is as follows:
| | | Year Ended March 31, | |
| Class Z Shares | | 2009 | | 2008 | | 2007 | | 2006 (a) | | 2005 | |
| Net Asset Value, Beginning of Period | | $ | 9.87 | | | $ | 9.82 | | | $ | 9.73 | | | $ | 9.80 | | | $ | 10.06 | | |
| Income from Investment Operations: | |
| Net investment income (b) | | | 0.45 | | | | 0.46 | | | | 0.42 | | | | 0.33 | | | | 0.24 | | |
Net realized and unrealized gain (loss) on
investments and futures contracts | | | (0.43 | ) | | | 0.06 | | | | 0.09 | | | | (0.07 | ) | | | (0.25 | ) | |
| Total from investment operations | | | 0.02 | | | | 0.52 | | | | 0.51 | | | | 0.26 | | | | (0.01 | ) | |
| Less Distributions to Shareholders: | |
| From net investment income | | | (0.44 | ) | | | (0.47 | ) | | | (0.42 | ) | | | (0.33 | ) | | | (0.23 | ) | |
| From net realized gains | | | — | | | | — | | | | — | | | | — | | | | (0.02 | ) | |
| Total distributions to shareholders | | | (0.44 | ) | | | (0.47 | ) | | | (0.42 | ) | | | (0.33 | ) | | | (0.25 | ) | |
| Increase from regulatory settlement | | | — | (c) | | | — | | | | — | | | | — | | | | — | | |
| Net Asset Value, End of Period | | $ | 9.45 | | | $ | 9.87 | | | $ | 9.82 | | | $ | 9.73 | | | $ | 9.80 | | |
| Total return (d)(e) | | | 0.27 | % | | | 5.39 | % | | | 5.39 | % | | | 2.73 | % | | | (0.04 | )% | |
| Ratios to Average Net Assets/Supplemental Data: | |
| Net expenses (f) | | | 0.48 | % | | | 0.48 | % | | | 0.48 | % | | | 0.47 | % | | | 0.48 | % | |
| Waiver/Reimbursement | | | 0.04 | % | | | 0.02 | % | | | 0.02 | % | | | 0.08 | %(g) | | | 0.10 | %(g) | |
| Net investment income (f) | | | 4.68 | % | | | 4.67 | % | | | 4.29 | % | | | 3.40 | % | | | 2.37 | % | |
| Portfolio turnover rate | | | 58 | % | | | 58 | % | | | 72 | % | | | 80 | % | | | 128 | % | |
| Net assets, end of period (000's) | | $ | 1,133,563 | | | $ | 1,092,555 | | | $ | 857,655 | | | $ | 1,130,604 | | | $ | 926,514 | | |
(a) On August 22, 2005, the Fund's Primary A shares were renamed Class Z shares.
(b) Per share data was calculated using the average shares outstanding during the period.
(c) Rounds to less than $0.01 per share.
(d) Total return at net asset value assuming all distributions reinvested.
(e) Had the investment advisor and/or any of its affiliates not waived fees or reimbursed a portion of expenses, total return would have been reduced.
(f) The benefits derived from expense reductions had an impact of less than 0.01%.
(g) Bank of America Corporation assumed certain non-recurring costs. Absent these non-recurring costs, the waiver/reimbursement ratio would have been 0.02% and 0.08% for the periods ended March 31, 2006 and March 31, 2005, respectively.
See Accompanying Notes to Financial Statements.
69
Financial Highlights – Columbia High Income Fund
Selected data for a share outstanding throughout each period is as follows:
| | | Year Ended March 31, | |
| Class A Shares (a) | | 2009 | | 2008 (b) | | 2007 | | 2006 (c) | | 2005 | |
| Net Asset Value, Beginning of Period | | $ | 8.03 | | | $ | 9.11 | | | $ | 8.91 | | | $ | 9.31 | | | $ | 9.79 | | |
| Income from Investment Operations: | |
| Net investment income (d) | | | 0.57 | | | | 0.64 | | | | 0.62 | | | | 0.63 | | | | 0.66 | | |
Net realized and unrealized gain (loss) on investments
and foreign currency | | | (2.05 | ) | | | (1.00 | ) | | | 0.32 | | | | (0.10 | ) | | | 0.03 | | |
| Total from investment operations | | | (1.48 | ) | | | (0.36 | ) | | | 0.94 | | | | 0.53 | | | | 0.69 | | |
| Less Distributions to Shareholders: | |
| From net investment income | | | (0.57 | ) | | | (0.65 | ) | | | (0.62 | ) | | | (0.66 | ) | | | (0.65 | ) | |
| From net realized gains | | | (0.06 | ) | | | (0.07 | ) | | | (0.12 | ) | | | (0.27 | ) | | | (0.52 | ) | |
| Total distributions to shareholders | | | (0.63 | ) | | | (0.72 | ) | | | (0.74 | ) | | | (0.93 | ) | | | (1.17 | ) | |
| Net Asset Value, End of Period | | $ | 5.92 | | | $ | 8.03 | | | $ | 9.11 | | | $ | 8.91 | | | $ | 9.31 | | |
| Total return (e) | | | (19.17 | )%(f) | | | (4.22 | )%(g) | | | 11.10 | % | | | 6.03 | % | | | 7.64 | % | |
| Ratios to Average Net Assets/Supplemental Data: | |
| Net expenses before interest expense (h) | | | 1.18 | % | | | 1.16 | % | | | 1.13 | % | | | 1.08 | % | | | 1.09 | % | |
| Interest expense | | | — | | | | — | %(i) | | | — | | | | — | | | | — | | |
| Net expenses (h) | | | 1.18 | % | | | 1.16 | % | | | 1.13 | % | | | 1.08 | % | | | 1.09 | % | |
| Waiver/Reimbursement | | | — | %(i) | | | — | | | | — | | | | — | | | | — | | |
| Net investment income (h) | | | 8.06 | % | | | 7.28 | % | | | 6.88 | % | | | 6.90 | % | | | 6.90 | % | |
| Portfolio turnover rate | | | 25 | % | | | 2 | %(j)(k) | | | — | | | | — | | | | — | | |
| Turnover of Columbia High Income Master Portfolio | | | — | | | | 32 | %(j) | | | 44 | % | | | 34 | % | | | 33 | % | |
| Net assets, end of period (000's) | | $ | 70,836 | | | $ | 98,973 | | | $ | 123,071 | | | $ | 109,029 | | | $ | 134,980 | | |
(a) Through February 27, 2008, the per share amounts and percentages reflect income and expenses assuming inclusion of the Fund's proportionate share of income and expense of the Columbia High Income Master Portfolio.
(b) Effective February 28, 2008, the Fund converted to a stand-alone fund. Prior to February 28, 2008, the Fund operated in a master-feeder structure.
(c) On August 22, 2005, the Fund's Investor A shares were renamed Class A shares.
(d) Per share data was calculated using the average shares outstanding during the period.
(e) Total return at net asset value assuming all distributions reinvested and no initial sales charge or contingent deferred sales charge.
(f) Had the investment advisor and/or any of its affiliates not waived fees or reimbursed a portion of expenses, total return would have been reduced.
(g) Includes a reimbursement by the investment sub-advisor for a realized investment loss on disposal of an investment not meeting the Fund's investment restrictions. This reimbursement increased total return and net asset value per share by less than 0.01% and $0.01, respectively.
(h) The benefits derived from expense reductions had an impact of less than 0.01%.
(i) Rounds to less than 0.01%.
(j) Not annualized.
(k) Amount represents results after the Fund's conversion to a stand-alone structure on February 28, 2008.
See Accompanying Notes to Financial Statements.
70
Financial Highlights – Columbia High Income Fund
Selected data for a share outstanding throughout each period is as follows:
| | | Year Ended March 31, | |
| Class B Shares (a) | | 2009 | | 2008 (b) | | 2007 | | 2006 (c) | | 2005 | |
| Net Asset Value, Beginning of Period | | $ | 8.01 | | | $ | 9.09 | | | $ | 8.89 | | | $ | 9.29 | | | $ | 9.77 | | |
| Income from Investment Operations: | |
| Net investment income (d) | | | 0.52 | | | | 0.57 | | | | 0.55 | | | | 0.56 | | | | 0.58 | | |
Net realized and unrealized gain (loss) on investments
and foreign currency | | | (2.05 | ) | | | (1.00 | ) | | | 0.32 | | | | (0.10 | ) | | | 0.04 | | |
| Total from investment operations | | | (1.53 | ) | | | (0.43 | ) | | | 0.87 | | | | 0.46 | | | | 0.62 | | |
| Less Distributions to Shareholders: | |
| From net investment income | | | (0.52 | ) | | | (0.58 | ) | | | (0.55 | ) | | | (0.59 | ) | | | (0.58 | ) | |
| From net realized gains | | | (0.06 | ) | | | (0.07 | ) | | | (0.12 | ) | | | (0.27 | ) | | | (0.52 | ) | |
| Total distributions to shareholders | | | (0.58 | ) | | | (0.65 | ) | | | (0.67 | ) | | | (0.86 | ) | | | (1.10 | ) | |
| Net Asset Value, End of Period | | $ | 5.90 | | | $ | 8.01 | | | $ | 9.09 | | | $ | 8.89 | | | $ | 9.29 | | |
| Total return (e) | | | (19.84 | )%(f) | | | (4.95 | )%(g) | | | 10.29 | % | | | 5.25 | % | | | 6.89 | % | |
| Ratios to Average Net Assets/Supplemental Data: | |
| Net expenses before interest expense (h) | | | 1.93 | % | | | 1.91 | % | | | 1.88 | % | | | 1.83 | % | | | 1.84 | % | |
| Interest expense | | | — | | | | — | %(i) | | | — | | | | — | | | | — | | |
| Net expenses (h) | | | 1.93 | % | | | 1.91 | % | | | 1.88 | % | | | 1.83 | % | | | 1.84 | % | |
| Waiver/Reimbursement | | | — | %(i) | | | — | | | | — | | | | — | | | | — | | |
| Net investment income (h) | | | 7.29 | % | | | 6.54 | % | | | 6.16 | % | | | 6.22 | % | | | 6.17 | % | |
| Portfolio turnover rate | | | 25 | % | | | 2 | %(j)(k) | | | — | | | | — | | | | — | | |
| Turnover of Columbia High Income Master Portfolio | | | — | | | | 32 | %(j) | | | 44 | % | | | 34 | % | | | 33 | % | |
| Net assets, end of period (000's) | | $ | 36,667 | | | $ | 64,786 | | | $ | 93,413 | | | $ | 102,085 | | | $ | 130,088 | | |
(a) Through February 27, 2008, the per share amounts and percentages reflect income and expenses assuming inclusion of the Fund's proportionate share of income and expense of the Columbia High Income Master Portfolio.
(b) Effective February 28, 2008, the Fund converted to a stand-alone fund. Prior to February 28, 2008, the Fund operated in a master-feeder structure.
(c) On August 22, 2005, the Fund's Investor B shares were renamed Class B shares.
(d) Per share data was calculated using the average shares outstanding during the period.
(e) Total return at net asset value assuming all distributions reinvested and no contingent deferred sales charge.
(f) Had the investment advisor and/or any of its affiliates not waived fees or reimbursed a portion of expenses, total return would have been reduced.
(g) Includes a reimbursement by the investment sub-advisor for a realized investment loss on disposal of an investment not meeting the Fund's investment restrictions. This reimbursement increased total return and net asset value per share by less than 0.01% and $0.01, respectively.
(h) The benefits derived from expense reductions had an impact of less than 0.01%.
(i) Rounds to less than 0.01%.
(j) Not annualized.
(k) Amount represents results after the Fund's conversion to a stand-alone structure on February 28, 2008.
See Accompanying Notes to Financial Statements.
71
Financial Highlights – Columbia High Income Fund
Selected data for a share outstanding throughout each period is as follows:
| | | Year Ended March 31, | |
| Class C Shares (a) | | 2009 | | 2008 (b) | | 2007 | | 2006 (c) | | 2005 | |
| Net Asset Value, Beginning of Period | | $ | 7.97 | | | $ | 9.05 | | | $ | 8.86 | | | $ | 9.25 | | | $ | 9.74 | | |
| Income from Investment Operations: | |
| Net investment income (d) | | | 0.52 | | | | 0.57 | | | | 0.55 | | | | 0.56 | | | | 0.58 | | |
Net realized and unrealized gain (loss) on investments
and foreign currency | | | (2.04 | ) | | | (1.00 | ) | | | 0.31 | | | | (0.09 | ) | | | 0.03 | | |
| Total from investment operations | | | (1.52 | ) | | | (0.43 | ) | | | 0.86 | | | | 0.47 | | | | 0.61 | | |
| Less Distributions to Shareholders: | |
| From net investment income | | | (0.52 | ) | | | (0.58 | ) | | | (0.55 | ) | | | (0.59 | ) | | | (0.58 | ) | |
| From net realized gains | | | (0.06 | ) | | | (0.07 | ) | | | (0.12 | ) | | | (0.27 | ) | | | (0.52 | ) | |
| Total distributions to shareholders | | | (0.58 | ) | | | (0.65 | ) | | | (0.67 | ) | | | (0.86 | ) | | | (1.10 | ) | |
| Net Asset Value, End of Period | | $ | 5.87 | | | $ | 7.97 | | | $ | 9.05 | | | $ | 8.86 | | | $ | 9.25 | | |
| Total return (e) | | | (19.81 | )%(f) | | | (4.98 | )%(g) | | | 10.21 | % | | | 5.39 | % | | | 6.80 | % | |
| Ratios to Average Net Assets/Supplemental Data: | |
| Net expenses before interest expense (h) | | | 1.93 | % | | | 1.91 | % | | | 1.88 | % | | | 1.83 | % | | | 1.84 | % | |
| Interest expense | | | — | | | | — | %(i) | | | — | | | | — | | | | — | | |
| Net expenses (h) | | | 1.93 | % | | | 1.91 | % | | | 1.88 | % | | | 1.83 | % | | | 1.84 | % | |
| Waiver/Reimbursement | | | — | %(i) | | | — | | | | — | | | | — | | | | — | | |
| Net investment income (h) | | | 7.32 | % | | | 6.54 | % | | | 6.16 | % | | | 6.23 | % | | | 6.21 | % | |
| Portfolio turnover rate | | | 25 | % | | | 2 | %(j)(k) | | | — | | | | — | | | | — | | |
| Turnover of Columbia High Income Master Portfolio | | | — | | | | 32 | %(j) | | | 44 | % | | | 34 | % | | | 33 | % | |
| Net assets, end of period (000's) | | $ | 17,991 | | | $ | 26,976 | | | $ | 35,639 | | | $ | 39,547 | | | $ | 49,066 | | |
(a) Through February 27, 2008, the per share amounts and percentages reflect income and expenses assuming inclusion of the Fund's proportionate share of income and expense of the Columbia High Income Master Portfolio.
(b) Effective February 28, 2008, the Fund converted to a stand-alone fund. Prior to February 28, 2008, the Fund operated in a master-feeder structure.
(c) On August 22, 2005, the Fund's Investor C shares were renamed Class C shares.
(d) Per share data was calculated using the average shares outstanding during the period.
(e) Total return at net asset value assuming all distributions reinvested and no contingent deferred sales charge.
(f) Had the investment advisor and/or any of its affiliates not waived fees or reimbursed a portion of expenses, total return would have been reduced.
(g) Includes a reimbursement by the investment sub-advisor for a realized investment loss on disposal of an investment not meeting the Fund's investment restrictions. This reimbursement increased total return and net asset value per share by less than 0.01% and $0.01, respectively.
(h) The benefits derived from expense reductions had an impact of less than 0.01%.
(i) Rounds to less than 0.01%.
(j) Not annualized.
(k) Amount represents results after the Fund's conversion to a stand-alone structure on February 28, 2008.
See Accompanying Notes to Financial Statements.
72
Financial Highlights – Columbia High Income Fund
Selected data for a share outstanding throughout each period is as follows:
| | | Year Ended March 31, | |
| Class Z Shares (a) | | 2009 | | 2008 (b) | | 2007 | | 2006 (c) | | 2005 | |
| Net Asset Value, Beginning of Period | | $ | 8.10 | | | $ | 9.19 | | | $ | 8.98 | | | $ | 9.37 | | | $ | 9.86 | | |
| Income from Investment Operations: | |
| Net investment income (d) | | | 0.60 | | | | 0.66 | | | | 0.64 | | | | 0.66 | | | | 0.67 | | |
Net realized and unrealized gain (loss) on investments
and foreign currency | | | (2.07 | ) | | | (1.01 | ) | | | 0.33 | | | | (0.10 | ) | | | 0.04 | | |
| Total from investment operations | | | (1.47 | ) | | | (0.35 | ) | | | 0.97 | | | | 0.56 | | | | 0.71 | | |
| Less Distributions to Shareholders: | |
| From net investment income | | | (0.59 | ) | | | (0.67 | ) | | | (0.64 | ) | | | (0.68 | ) | | | (0.68 | ) | |
| From net realized gains | | | (0.06 | ) | | | (0.07 | ) | | | (0.12 | ) | | | (0.27 | ) | | | (0.52 | ) | |
| Total distributions to shareholders | | | (0.65 | ) | | | (0.74 | ) | | | (0.76 | ) | | | (0.95 | ) | | | (1.20 | ) | |
| Net Asset Value, End of Period | | $ | 5.98 | | | $ | 8.10 | | | $ | 9.19 | | | $ | 8.98 | | | $ | 9.37 | | |
| Total return (e) | | | (18.92 | )%(f) | | | (4.05 | )%(g) | | | 11.41 | % | | | 6.37 | % | | | 7.76 | % | |
| Ratios to Average Net Assets/Supplemental Data: | |
| Net expenses before interest expense (h) | | | 0.93 | % | | | 0.91 | % | | | 0.88 | % | | | 0.83 | % | | | 0.84 | % | |
| Interest expense | | | — | | | | — | %(i) | | | — | | | | — | | | | — | | |
| Net expenses (h) | | | 0.93 | % | | | 0.91 | % | | | 0.88 | % | | | 0.83 | % | | | 0.84 | % | |
| Waiver/Reimbursement | | | — | %(i) | | | — | | | | — | | | | — | | | | — | | |
| Net investment income (h) | | | 8.41 | % | | | 7.54 | % | | | 7.14 | % | | | 7.19 | % | | | 7.09 | % | |
| Portfolio turnover rate | | | 25 | % | | | 2 | %(j)(k) | | | — | | | | — | | | | — | | |
| Turnover of Columbia High Income Master Portfolio | | | — | | | | 32 | %(j) | | | 44 | % | | | 34 | % | | | 33 | % | |
| Net assets, end of period (000's) | | $ | 486,116 | | | $ | 545,228 | | | $ | 739,921 | | | $ | 681,752 | | | $ | 707,834 | | |
(a) Through February 27, 2008, the per share amounts and percentages reflect income and expenses assuming inclusion of the Fund's proportionate share of income and expense of the Columbia High Income Master Portfolio.
(b) Effective February 28, 2008, the Fund converted to a stand-alone fund. Prior to February 28, 2008, the Fund operated in a master-feeder structure.
(c) On August 22, 2005, the Fund's Primary A shares were renamed Class Z shares.
(d) Per share data was calculated using the average shares outstanding during the period.
(e) Total return at net asset value assuming all distributions reinvested.
(f) Had the investment advisor and/or any of its affiliates not waived fees or reimbursed a portion of expenses, total return would have been reduced.
(g) Includes a reimbursement by the investment sub-advisor for a realized investment loss on disposal of an investment not meeting the Fund's investment restrictions. This reimbursement increased total return and net asset value per share by less than 0.01% and $0.01, respectively.
(h) The benefits derived from expense reductions had an impact of less than 0.01%.
(i) Rounds to less than 0.01%.
(j) Not annualized.
(k) Amount represents results after the Fund's conversion to a stand-alone structure on February 28, 2008.
See Accompanying Notes to Financial Statements.
73
Notes to Financial Statements – Corporate Bond Funds
March 31, 2009
Note 1. Organization
Columbia Funds Series Trust (the "Trust") is registered under the Investment Company Act of 1940, as amended (the "1940 Act"), as an open-end management investment company. Information presented in these financial statements pertains to the following diversified series of the Trust (each, a "Fund" and collectively, the "Funds"):
Columbia Total Return Bond Fund
Columbia Short Term Bond Fund
Columbia High Income Fund
Investment Objectives
Columbia Total Return Bond Fund seeks total return, consisting of current income and capital appreciation. Columbia Short Term Bond Fund seeks current income, consistent with minimal fluctuation of principal. Columbia High Income Fund seeks total return, consisting of a high level of income and capital appreciation.
Fund Shares
The Trust may issue an unlimited number of shares, and each Fund offers four classes of shares: Class A, Class B, Class C and Class Z shares. Each share class has its own expense structure and sales charges, as applicable. Beginning on or about June 22, 2009, except in connection with the reinvestment of any dividend and/or capital gain distributions in Class B shares of the Funds and exchanges by existing Class B shareholders of the other Columbia Funds, the Funds will no longer accept investments in Class B shares from new or existing investors in the Funds' Class B shares.
Class A shares are subject to a maximum front-end sales charge of 1.00%, 3.25% and 4.75% for Columbia Short Term Bond Fund, Columbia Total Return Bond Fund and Columbia High Income Fund, respectively, based on the amount of initial investment. Class A shares purchased without an initial sales charge in accounts aggregating $1 million to $50 million at the time of purchase are subject to a 1.00% contingent deferred sales charge ("CDSC") if the shares are sold within one year after purchase. Class B shares are subject to a maximum CDSC of 3.00%, 3.00% and 5.00% for Columbia Short Term Bond Fund, Columbia Total Return Bond Fund and Columbia High Income Fund, respectively, based upon the holding period after purchase. Class B shares will convert to Class A shares eight years after purchase. Class C shares are subject to a 1.00% CDSC on shares sold within twelve months after purchase. Class Z shares are offered continuously at net as set value. There are certain restrictions on the purchase of Class Z shares, as described in each Fund's prospectus.
Note 2. Significant Accounting Policies
The preparation of financial statements in accordance with accounting principles generally accepted in the United States of America ("GAAP") requires management to make certain estimates and assumptions that affect the reported amounts of assets and liabilities, the disclosure of contingent assets and liabilities at the date of the financial statements and the reported amounts of revenue and expenses during the reporting period. Actual results could differ from those estimates. The following is a summary of significant accounting policies consistently followed by the Funds in the preparation of their financial statements.
Security Valuation
Equity securities and securities of certain investment companies are valued at the last sale price on the principal exchange on which they trade, except for securities traded on the NASDAQ, which are valued at the NASDAQ official close price. Unlisted securities or listed securities for which there were no sales during the day are valued at the closing bid price on such exchanges or over-the-counter markets.
Debt securities generally are valued by pricing services approved by the Trust's Board of Trustees, based upon market transactions for normal, institutional-size trading units of similar securities. The services may use various pricing techniques which take into account appropriate factors such as yield, quality, coupon rate, maturity, type of issue, trading characteristics and other data, as well as broker quotes. Debt securities for which quotations are readily available are valued at an over-the-counter or exchange bid quotation.
Certain debt securities, which tend to be more thinly traded and of lesser quality, are priced based on fundamental analysis of the financial condition of the issuer and the estimated value of any collateral. Valuations developed through pricing techniques may vary from the actual amounts realized upon sale of the securities, and the potential variation may be greater for those securities valued using fundamental analysis.
74
Corporate Bond Funds, March 31, 2009 (continued)
Short-term investments maturing in 60 days or less are valued at amortized cost, which approximates market value.
Investments in other open-end investment companies are valued at net asset value.
Forward foreign currency exchange contracts are valued at the prevailing forward exchange rate of the underlying currencies.
Futures contracts are valued at the settlement price established each day by the board of trade or exchange on which they are traded.
Credit default swap contracts are marked to market daily based upon quotations from market makers. Quotations obtained from independent pricing services use information provided by market makers.
Foreign securities are generally valued at the last sale price on the foreign exchange or market on which they trade. If any foreign share prices are not readily available as a result of limited share activity, the securities are valued at the last sale price of the local shares in the principal market in which such securities are normally traded.
Generally, trading in foreign securities is substantially completed each day at various times prior to the close of the New York Stock Exchange ("NYSE"). The values of such securities used in computing the net asset value of the Funds' shares are determined as of such times. Foreign currency exchange rates are generally determined at 4:00 p.m. Eastern (U.S.) time. Occassionally, events affecting the values of such foreign securities and such exchange rates may occur between the times at which they are determined and the close of the customary trading session of the NYSE, which would not be reflected in the computation of the Funds' net asset values. If events materially affecting the values of such foreign securities occur and it is determined that market quotations are not reliable, then these foreign securities will be valued at their fair value using procedures approved by the Board of Trustees. The Funds may use a systematic fair valuation model provided by an independent third party to value securities principally traded in foreign markets in order to adjust for possible stale pricing that may occur between the close of the foreign exchanges and the time for valuation.
Investments for which market quotations are not readily available, or that have quotations which management believes are not reliable, are valued at fair value as determined in good faith under consistently applied procedures established by and under the general supervision of the Board of Trustees. If a security is valued at fair value, such value is likely to be different from the last quoted market price for the security. The determination of fair value often requires significant judgment. To determine fair value, management may use assumptions including but not limited to future cash flows and estimated risk premiums. Multiple inputs from various sources may be used to determine value.
Security Transactions
Security transactions are accounted for on the trade date. Cost is determined and gains (losses) are based upon the specific identification method for both financial statement and federal income tax purposes.
In March 2008, Statement of Financial Accounting Standards No. 161, Disclosures about Derivative Instruments and Hedging Activities—an amendment of FASB Statement No. 133 ("SFAS 161"), was issued. SFAS 161 is effective for fiscal years and interim periods beginning after November 15, 2008. SFAS 161 requires additional discussion about the reporting entity's derivative instruments and hedging activities, by providing for qualitative disclosures about the objectives and strategies for using derivatives, quantitative data about the fair value of and gains and losses on derivative contracts, and details of credit-risk-related contingent features in their derivative contracts. Management is evaluating the impact the application of SFAS 161 will have on the Funds' financial stateme nt disclosures.
Futures Contracts
The Funds may invest in futures contracts for both hedging and non-hedging purposes, including, for example, to seek to enhance returns or as a substitute for a position in an underlying asset.
The use of futures contracts involves certain risks, which include: (1) imperfect correlation between the price movement of the instruments and the underlying securities, (2) inability to close out positions due to differing trading hours, or the temporary absence of a liquid market, for either the instruments or the underlying securities, or (3) an inaccurate prediction of the future direction of interest rates by Columbia Management Advisors, LLC ("Columbia"), the Funds' investment advisor. Any of these risks may involve amounts exceeding the variation margin recorded in the Funds' Statements of Assets and Liabilities at any given time.
75
Corporate Bond Funds, March 31, 2009 (continued)
Upon entering into a futures contract, a Fund pledges cash or securities with the broker in an amount sufficient to meet the initial margin requirement. Subsequent payments are made or received by a Fund equal to the daily change in the contract value and are recorded as variation margin receivable or payable and offset in unrealized gains or losses. A Fund recognizes a realized gain or loss when the contract is closed or expires.
Forward Foreign Currency Exchange Contracts
Forward foreign currency exchange contracts are agreements to exchange one currency for another at a future date at a specified price. These contracts are used to minimize the exposure to foreign exchange rate fluctuations during the period between trade and settlement dates of the contract. Certain Funds may utilize forward foreign currency exchange contracts in connection with the settlement of purchases and sales of securities. Certain Funds may also enter into these contracts to hedge certain other foreign currency denominated assets. Contracts to buy generally are used to acquire exposure to foreign currencies, while contracts to sell are generally used to hedge the Funds' investments against currency fluctuations. Forward foreign currency exchange contracts are valued daily at the current exchange rate of the underlying currency, resulting in unrealized gains (losses) which become realized at the time the forward foreign c urrency exchange contracts are closed or mature. Realized and unrealized gains (losses) arising from such transactions are included in net realized and unrealized gains (losses) on foreign currency transactions. The use of forward foreign currency exchange contracts does not eliminate fluctuations in the prices of the Funds' portfolio securities. While the maximum potential loss from such contracts is the aggregate face value in U.S. dollars at the time the contract was opened, exposure is typically limited to the change in value of the contract (in U.S. dollars) over the period it remains open. The Funds could also be exposed to risk that counterparties of the contracts may be unable to fulfill the terms of the contracts.
Foreign Currency Transactions and Translations
The values of all assets and liabilities quoted in foreign currencies are translated into U.S. dollars at that day's exchange rates. Net realized and unrealized gains (losses) on foreign currency transactions and translations include gains (losses) arising from the fluctuation in exchange rates between trade and settlement dates on securities transactions, gains (losses) arising from the disposition of foreign currency and currency gains (losses) between the accrual and payment dates on dividends, interest income and foreign withholding taxes.
Credit Default Swaps
The Funds may engage in credit default swap transactions for hedging purposes or to seek to increase total return. Credit default swaps are agreements in which one party pays fixed periodic payments to a counterparty in consideration for a guarantee from the counterparty to make a specific payment should a negative credit event take place. The Funds may receive an upfront payment as the protection seller or make an upfront payment as the protection buyer.
If the Fund is a seller of protection and a credit event occurs, as defined under the terms of that particular swap agreement, the Fund will either (i) pay to the buyer of protection an amount equal to the notional amount of the swap and take delivery of the referenced obligation or underlying securities comprising the referenced index or (ii) pay a net settlement amount in the form of cash or securities equal to the notional amount of the swap less the recovery value of the referenced obligation or underlying securities comprising the referenced index. Recovery values are assumed by market makers considering either industry standard recovery rates or entity specific factors and considerations until a credit event occurs. If a credit event has occurred, the recovery value is determined by a facilitated auction whereby a minimum number of allowable broker bids, together with a specified valuation method, are used to calculate the settlement value.
If the Fund is a buyer of protection and a credit event occurs, as defined under the terms of that particular swap agreement, the Fund will either (i) receive from the seller of protection an amount equal to the notional amount of the swap and deliver the referenced obligation or underlying securities compromising the referenced index or (ii) receive a net settlement amount in the form of cash or securities equal to the notional amount of the swap less the recovery value of the referenced obligation or underlying securities compromising the referenced index.
Credit default swaps are marked to market daily and any change is recorded as unrealized appreciation/depreciation on the Funds' Statements of Assets and Liabilities. Periodic
76
Corporate Bond Funds, March 31, 2009 (continued)
payments received or made are recorded as realized gain or loss and initial premiums received or made are amortized on the Statements of Operations. Gains or losses are realized as a result of a credit event or termination of the contract. Collateral, in the form of restricted cash or securities, may be required to be held in segregated accounts with the Funds' custodian in compliance with the terms of the swap contract.
By entering into these agreements, the Funds could be exposed to risks in excess of the amounts recorded on the Statements of Assets and Liabilities. Risks include the possibility that there will be no liquid market for these agreements, or that the counterparty to an agreement will default on its obligation to perform.
Delayed Delivery Securities
Each Fund may trade securities on other than normal settlement terms, including securities purchased or sold on a "when-issued" basis. This may increase the risk if the other party to the transaction fails to deliver and causes the Funds to subsequently invest at less advantageous prices. Each Fund holds until the settlement date, in a segregated account, cash or liquid securities in an amount equal to the delayed delivery commitment.
Stripped Securities
Stripped mortgage-backed securities are derivative multi-class mortgage securities structured so that one class receives most, if not all, of the principal from the underlying mortgage assets, while the other class receives most, if not all, of the interest and the remainder of the principal. If the underlying mortgage assets experience greater than anticipated prepayments of principal, a Fund may fail to fully recoup its initial investment in an interest-only security. The market value of these securities can be extremely volatile in response to changes in interest rates. Credit risk reflects the risk that a Fund may not receive all or part of its principal because the issuer or credit enhancer has defaulted on its obligation.
For financial statement purposes, the Funds do not distinguish that portion of gains (losses) on investments which is due to changes in foreign exchange rates from that which is due to changes in market prices of the investments. Such fluctuations are included with the net realized and unrealized gains (losses) on investments on the Statements of Operations.
Repurchase Agreements
Each Fund may engage in repurchase agreement transactions with institutions that Columbia has determined are creditworthy. Each Fund, through its custodian, receives delivery of the underlying securities collateralizing a repurchase agreement. Columbia is responsible for determining that the collateral is at least equal, at all times, to the value of the repurchase obligation including interest. A repurchase agreement transaction involves certain risks in the event of default or insolvency of the counterparty. These risks include possible delays in or restrictions on each Fund's ability to dispose of the underlying securities and a possible decline in the value of the underlying securities during the period while the Funds seek to assert their rights.
Treasury Inflation Protected Securities
The Funds may invest in treasury inflation protected securities ("TIPS"). The principal amount of TIPS is adjusted periodically for inflation based on a monthly published index. Interest payments are based on the inflation-adjusted principal at the time the interest is paid. These adjustments are recorded as interest income on the Statements of Operations.
Loan Participations and Commitments
The Funds may invest in loan participations. When a Fund purchases a loan participation, the Fund typically enters into a contractual relationship with the lender or third party selling such participation ("Selling Participant"), but not the borrower. However, the Fund assumes the credit risk of the borrower, Selling Participant and any other persons interpositioned between the Fund and the borrower. The Funds may not directly benefit from the collateral supporting the senior loan which it has purchased from the Selling Participant.
Income Recognition
Interest income is recorded on the accrual basis. Original issue discount is accreted to interest income over the life of the security with a corresponding increase in the cost basis. Premium and discount are amortized and accreted, respectively, on all debt securities, unless otherwise noted. Dividend income is recorded on the ex-date.
77
Corporate Bond Funds, March 31, 2009 (continued)
Expenses
General expenses of the Trust are allocated to the Funds and other series of the Trust based upon relative net assets or other expense allocation methodologies determined by the nature of the expense. Expenses directly attributable to a Fund are charged to such Fund.
Determination of Class Net Asset Value
All income, expenses (other than class-specific expenses, as shown on the Statements of Operations) and realized and unrealized gains (losses) are allocated to each class of a Fund on a daily basis for purposes of determining the net asset value of each class. Income and expenses are allocated to each class based on the settled shares method, while realized and unrealized gains (losses) are allocated based on the relative net assets of each class.
Federal Income Tax Status
Each Fund intends to qualify each year as a "regulated investment company" under Subchapter M of the Internal Revenue Code, as amended, and will distribute substantially all of its tax-exempt or taxable income, if any, for its tax year, and as such will not be subject to federal income taxes. In addition, each Fund intends to distribute in each calendar year substantially all of its net investment income, capital gains and certain other amounts, if any, such that each Fund should not be subject to federal excise tax. Therefore, no federal income or excise tax provision is recorded.
Distributions to Shareholders
Distributions from net investment income are declared daily and paid monthly for each Fund, except Columbia High Income Fund for which distributions from net investment income are declared and distributed monthly. Net realized capital gains, if any, are distributed at least annually. Income distributions and capital gain distributions are determined in accordance with federal income tax regulations which may differ from GAAP.
Indemnification
In the normal course of business, each Fund enters into contracts that contain a variety of representations and warranties and which provide general indemnities. A Fund's maximum exposure under these arrangements is unknown because this would involve future claims against a Fund. Also, under the Trust's organizational documents and by contract, the Trustees and officers of the Trust are indemnified against certain liabilities that may arise out of actions relating to their duties to the Trust. However, based on experience, the Funds expect the risk of loss due to these representations, warranties and indemnities to be minimal.
Note 3. Federal Tax Information
The timing and character of income and capital gain distributions are determined in accordance with income tax regulations, which may differ from GAAP. Reclassifications are made to each Fund's capital accounts for permanent tax differences to reflect income and gains available for distribution (or available capital loss carryforwards) under income tax regulations.
For the year ended March 31, 2009, permanent book and tax basis differences resulting primarily from differing treatments for discount accretion/premium amortization on debt securities, defaulted bonds, market discount accretion adjustments, foreign currency transactions and distribution reclassifications were identified and reclassified among the components of the Fund's net assets as follows:
| | | Undistributed or
(Overdistributed)
Net Investment
Income | | Accumulated
Net Realized
Loss | | Paid-In Capital | |
| Columbia Total Return Bond Fund | | $ | (2,863,662 | ) | | $ | 2,867,210 | | | $ | (3,548 | ) | |
| Columbia Short Term Bond Fund | | | 6,972 | | | | 2 | | | | (6,974 | ) | |
| Columbia High Income Fund | | | 171,468 | | | | (197,530 | ) | | | 26,062 | | |
Net investment income and net realized gains (losses), as disclosed on the Statements of Operations, and net assets were not affected by these reclassifications.
78
Corporate Bond Funds, March 31, 2009 (continued)
The tax character of distributions paid during the years ended March 31, 2009 and March 31, 2008 was as follows:
| | | March 31, 2009 | |
| | | Ordinary
Income* | | Long-Term
Capital Gains | |
| Columbia Total Return Bond Fund | | $ | 80,033,792 | | | $ | — | | |
| Columbia Short Term Bond Fund | | | 55,329,853 | | | | — | | |
| Columbia High Income Fund | | | 56,809,056 | | | | 6,072,622 | | |
| | | March 31, 2008 | |
| | | Ordinary
Income* | | Long-Term
Capital Gains | |
| Columbia Total Return Bond Fund | | $ | 92,144,249 | | | $ | — | | |
| Columbia Short Term Bond Fund | | | 44,260,861 | | | | — | | |
| Columbia High Income Fund | | | 68,744,683 | | | | 4,339,747 | | |
* For tax purposes short-term capital gain distributions, if any, are considered ordinary income distributions.
As of March 31, 2009, the components of distributable earnings on a tax basis were as follows:
| | | Undistributed
Ordinary
Income | | Undistributed
Long-Term
Capital Gains | | Net Unrealized
Depreciation* | |
| Columbia Total Return Bond Fund | | $ | — | | | $ | — | | | $ | (105,988,942 | ) | |
| Columbia Short Term Bond Fund | | | 2,218,315 | | | | — | | | | (50,461,814 | ) | |
| Columbia High Income Fund | | | 2,495,330 | | | | — | | | | (230,821,625 | ) | |
* The differences between book-basis and tax-basis net unrealized appreciation/depreciation are primarily due to deferral of losses from wash sales and restructured notes.
Unrealized appreciation and depreciation at March 31, 2009, based on cost of investments for federal income tax purposes, were:
| | | Unrealized
Appreciation | | Unrealized
Depreciation | | Net
Unrealized
Depreciation | |
| Columbia Total Return Bond Fund | | $ | 20,295,211 | | | $ | (126,284,153 | ) | | $ | (105,988,942 | ) | |
| Columbia Short Term Bond Fund | | | 15,056,617 | | | | (65,518,431 | ) | | | (50,461,814 | ) | |
| Columbia High Income Fund | | | 7,907,791 | | | | (238,729,416 | ) | | | (230,821,625 | ) | |
79
Corporate Bond Funds, March 31, 2009 (continued)
The following capital loss carryforwards may be available to reduce taxable income arising from future net realized gains on investments, if any, to the extent permitted by the Internal Revenue Code:
| | | Year of Expiration | |
| | | 2012 | | 2013 | | 2014 | | 2015 | | 2016 | | 2017 | | Total | |
Columbia Total Return
Bond Fund | | $ | — | | | $ | 325,588 | | | $ | 72,823 | | | $ | 1,644,323 | | | $ | 10,231,964 | | | $ | 66,036,800 | | | $ | 78,311,498 | | |
Columbia Short Term
Bond Fund | | | 3,650,095 | | | | 9,446,701 | | | | 11,783,069 | | | | 12,691,619 | | | | 642,768 | | | | — | | | | 38,214,252 | | |
Columbia High
Income Fund | | | — | | | | — | | | | — | | | | — | | | | — | | | | 16,962,990 | | | | 16,962,990 | | |
Of the capital loss carryforwards attributable to the Columbia Short Term Bond Fund, $2,682,071 ($721,262 expiring March 31, 2012 and $1,960,809 expiring March 31, 2013) remain from the merger with Short-Intermediate Government Fund, $11,850,394 ($2,523,063 expiring March 31, 2012, $4,970,323 expiring March 31, 2013 and $4,357,008 expiring March 31, 2014) remain from the merger with Short Term Government Securities Fund and $1,966,535 ($405,770 expiring March 31, 2012 and $1,560,765 expiring March 31, 2013) remain from the merger with Short Term Bond Fund, Inc. The availability of a portion of the remaining capital loss carryforwards from the Fund may be limited in a given year.
Capital loss carryforwards of $2,422,987 were utilized during the year ended March 31, 2009 for Columbia Short Term Bond Fund. Any capital loss carryforwards acquired as part of a merger that are permanently lost due to provisions under the Internal Revenue Code are included as being expired. Expired capital loss carryforwards are recorded as a reduction of paid-in capital.
Under current tax rules, certain currency and capital losses realized after October 31 may be deferred and treated as occurring on the first day of the following fiscal year. As of March 31, 2009, post-October currency and capital losses attributed to security transactions were deferred to April 1, 2009 as follows:
| | | Currency
Losses | | Capital
Losses | |
Columbia Total Return
Bond Fund | | $ | 3,399,005 | | | $ | 5,600,924 | | |
| Columbia High Income Fund | | | — | | | | 22,879,374 | | |
Under Financial Accounting Standards Board ("FASB") Interpretation No. 48, Accounting for Uncertainty in Income Taxes—an Interpretation of FASB Statement No. 109 ("FIN 48"), management determines whether a tax position of the Funds is more likely than not to be sustained upon examination by the applicable taxing authority, including resolution of any related appeals or litigation processes, based on the technical merits of the position. The tax benefit to be recognized is measured as the largest amount of benefit that is greater than fifty percent likely of being realized upon ultimate settlement. Management has evaluated the known implications of FIN 48 on its computation of net assets for each Fund. As a result of this evaluation, management has concluded that FIN 48 did no t have any effect on the Funds' financial statements. However, management's conclusions regarding FIN 48 may be subject to review and adjustment at a later date based on factors including, but not limited to, further implementation guidance from the FASB, new tax laws, regulations, and administrative interpretations (including relevant court decisions). The Funds' federal tax returns for the prior three fiscal years remain subject to examination by the Internal Revenue Service. The Funds are not aware of any tax positions for which it is reasonably possible that the total amounts of unrecognized tax benefits will significantly change in the next twelve months.
80
Corporate Bond Funds, March 31, 2009 (continued)
Note 4. Fees and Compensation Paid to Affiliates
Investment Advisory Fee
Columbia, an indirect, wholly owned subsidiary of Bank of America Corporation ("BOA"), provides investment advisory services to the Funds. Columbia receives an investment advisory fee, calculated daily and payable monthly, based on the average daily net assets of each Fund at the following annual rates:
| | | First
$500
Million | | $500 Million
to $1
Billion | | $1 Billion
to $1.5
Billion | | $1.5 Billion
to $3
Billion | | $3 Billion
to $6
Billion | | Over
$6 Billion | |
| Columbia Total Return Bond Fund | | | 0.40 | % | | | 0.35 | % | | | 0.32 | % | | | 0.29 | % | | | 0.28 | % | | | 0.27 | % | |
| Columbia Short Term Bond Fund | | | 0.30 | % | | | 0.30 | % | | | 0.30 | % | | | 0.30 | % | | | 0.30 | % | | | 0.30 | % | |
| Columbia High Income Fund | | | 0.55 | % | | | 0.52 | % | | | 0.49 | % | | | 0.46 | % | | | 0.46 | % | | | 0.46 | % | |
For the year ended March 31, 2009, the effective investment advisory fee rates for the Funds, as a percentage of each Fund's average daily net assets, were as follows:
| | | Effective
Fee Rate | |
| Columbia Total Return Bond Fund | | | 0.36 | % | |
| Columbia Short Term Bond Fund | | | 0.30 | % | |
| Columbia High Income Fund | | | 0.54 | % | |
Sub-Advisory Fee
MacKay Shields LLC ("MacKay Shields") has been retained by Columbia to serve as the investment sub-advisor to Columbia High Income Fund. As the sub-advisor, and subject to the oversight of Columbia and the Fund's Board of Trustees, MacKay Shields is responsible for the daily investment operations, including placing all orders for the purchase and sale of the portfolio securities for Columbia High Income Fund. Columbia, from the investment advisory fee it receives, pays MacKay Shields a monthly sub-advisory fee based on Columbia High Income Fund's average daily net assets at the following annual rates:
| Average Daily Net Assets | | Annual Fee Rate | |
| First $100 million | | | 0.400 | % | |
| $100 million to $200 million | | | 0.375 | % | |
| Over $200 million | | | 0.350 | % | |
Administration Fee
Columbia provides administrative and other services to the Funds. Under the administration agreement, Columbia is entitled to receive an administration fee, computed daily and paid monthly, based on the Funds' average daily net assets at the annual rates listed below less the fees payable by the Funds as described under the Pricing and Bookkeeping Fees note below:
| | | Annual Fee Rate | |
| Columbia Total Return Bond Fund | | | 0.15 | % | |
| Columbia Short Term Bond Fund | | | 0.14 | % | |
| Columbia High Income Fund | | | 0.23 | % | |
Columbia has contractually agreed to waive a portion of its administration fee for Columbia Short Term Bond Fund until July 31, 2009, at an annual rate of 0.02% of the Fund's average daily net assets.
Pricing and Bookkeeping Fees
The Funds have entered into a Financial Reporting Services Agreement (the "Financial Reporting Services Agreement") with State Street Bank & Trust Company ("State Street") and Columbia pursuant to which State Street provides financial reporting services to the Funds. The Funds have also entered into an Accounting Services Agreement (collectively with the Financial Reporting Services Agreement, the "State Street Agreements") with State Street and Columbia pursuant to which State Street provides accounting services to the Funds. Under
81
Corporate Bond Funds, March 31, 2009 (continued)
the State Street Agreements, each Fund pays State Street an annual fee of $38,000 paid monthly plus an additional monthly fee based on an annualized percentage rate of average daily net assets of each Fund for the month. The aggregate fee per Fund will not exceed $140,000 per year (exclusive of out-of-pocket expenses and charges). The Funds also reimburse State Street for certain out-of-pocket expenses and charges.
The Funds have entered into a Pricing and Bookkeeping Oversight and Services Agreement (the "Services Agreement") with Columbia. Under the Services Agreement, Columbia provides services related to Fund expenses and the requirements of the Sarbanes-Oxley Act of 2002, and provides oversight of the accounting and financial reporting services provided by State Street. Under the Services Agreement, the Funds reimburse Columbia for out-of-pocket expenses.
Transfer Agent Fee
Columbia Management Services, Inc. (the "Transfer Agent"), an affiliate of Columbia and an indirect, wholly owned subsidiary of BOA, provides shareholder services to the Funds and has contracted with Boston Financial Data Services ("BFDS") to serve as sub-transfer agent. The Transfer Agent is entitled to receive a fee for its services, paid monthly, at the annual rate of $17.34 per open account plus reimbursement of certain sub-transfer agent fees paid by the Transfer Agent (exclusive of BFDS fees), calculated based on assets held in omnibus accounts and intended to recover the cost of payments to other parties (including affiliates of BOA) for services to those accounts. The Transfer Agent pays the fees of BFDS for services as sub-transfer agent and is not entitled to reimbursement for such fees from the Funds.
The Transfer Agent may also retain, as additional compensation for its services, fees for wire, telephone and redemption orders, Individual Retirement Account ("IRA") trustee agent fees and account transcript fees due to the Transfer Agent from shareholders of the Funds and credits (net of bank charges) earned with respect to balances in accounts the Transfer Agent maintains in connection with its services to the Funds. The Transfer Agent also receives reimbursement for certain out-of-pocket expenses.
The Transfer Agent has voluntarily agreed to waive a portion of its fees until April 30, 2009, for accounts other than omnibus accounts, so that transfer agent fees (exclusive of out-of-pocket expenses and sub-transfer agent fees) will not exceed 0.02% annually for Columbia High Income Fund.
An annual minimum account balance fee of $20 may apply to certain accounts with a value below each Fund's initial minimum investment requirements to reduce the impact of small accounts on transfer agent fees. These minimum account balance fees are recorded as part of expense reductions on the Statements of Operations. For the year ended March 31, 2009, these minimum account balance fees reduced total expenses of the Funds as follows:
| Fund | | Minimum
Account
Balance Fees | |
| Columbia Total Return Bond Fund | | $ | 3,885 | | |
| Columbia Short Term Bond Fund | | | 2,401 | | |
| Columbia High Income Fund | | | 420 | | |
Underwriting Discounts, Service and Distribution Fees
Columbia Management Distributors, Inc. (the "Distributor"), an affiliate of Columbia and an indirect, wholly owned subsidiary of BOA, is the principal underwriter of the Funds' shares. For the year ended March 31, 2009, the Distributor has retained net underwriting discounts on the sale of Class A shares and received net CDSC fees on Class A, class B and Class C share redemptions as follows:
| | | Front End Sales Charge | | Contingent Deferred Sales Charge | |
| Fund | | Class A | | Class A | | Class B | | Class C | |
| Columbia Total Return Bond Fund | | $ | 1,140 | | | $ | 118 | | | $ | 8,232 | | | $ | 278 | | |
| Columbia Short Term Bond Fund | | | 18,408 | | | | 904 | | | | 2,819 | | | | 14,417 | | |
| Columbia High Income Fund | | | 13,352 | | | | 5,276 | | | | 70,082 | | | | 4,660 | | |
82
Corporate Bond Funds, March 31, 2009 (continued)
The Trust has adopted shareholder servicing plans and distribution plans for the Class B and Class C shares of each Fund and a combined distribution and shareholder servicing plan for Class A shares of each Fund. The shareholder servicing plans permit the Funds to compensate or reimburse servicing agents for the shareholder services they have provided. The distribution plans, adopted pursuant to Rule 12b-1 under the 1940 Act, permit the Funds to compensate or reimburse the Distributor and/or selling agents for activities or expenses primarily intended to result in the sale of the classes' shares. Payments are made at an annual rate and paid monthly, as a percentage of average daily net assets, set from time to time by the Board of Trustees, and are charged as expenses of each Fund directly to the applicable share class. A substantial portion of the expenses incurred pursuant to these plans is paid to affiliates of BOA and the Di stributor.
The annual rates in effect and plan limits, as a percentage of average daily net assets are as follows:
| | | Current
Rate | | Plan
Limit | |
Class A Combined Distribution
and Shareholder Servicing Plan | | | 0.25 | %* | | | 0.25 | % | |
Class B and Class C
Shareholder Servicing Plans | | | 0.25 | % | | | 0.25 | % | |
Class B and Class C
Distribution Plans | | | 0.75 | % | | | 0.75 | % | |
* Columbia Short Term Bond Fund pays its shareholder servicing fees, at the rates shown above, under a separate shareholder servicing plan.
The Distributor has voluntarily agreed to waive 0.44% of the distribution fees on Class C shares for Columbia Short Term Bond Fund. This arrangement may be modified or terminated by the Distributor at any time.
Fee Waivers and Expense Reimbursements
Columbia has contractually agreed to bear a portion of each Fund's expenses through July 31, 2009, so that a Fund's ordinary operating expenses (excluding any distribution and service fees, brokerage commissions, interest, taxes and extraordinary expenses, but including custodial charges relating to overdrafts, if any), after giving effect to any balance credits from the Fund's custodian, do not exceed the following annual rates, based on each Fund's average daily net assets:
| Fund | | Annual rate | |
| Columbia Total Return Bond Fund | | | 0.60 | % | |
| Columbia Short Term Bond Fund | | | 0.48 | % | |
| Columbia High Income Fund | | | 0.93 | % | |
Effective August 1, 2009, Columbia has voluntarily agreed to bear a portion of each Fund's expenses so that a Fund's ordinary operating expenses (excluding any distribution and service fees, brokerage commissions, interest, taxes and extraordinary expenses, but including custodian charges relating to overdrafts, if any), after giving effect to any balance credits from the Fund's custodian, do not exceed the following annual rates, based on each Fund's average daily net assets:
| Fund | | Annual rate | |
| Columbia Total Return Bond Fund | | | 0.70 | % | |
| Columbia Short Term Bond Fund | | | 0.48 | % | |
| Columbia High Income Fund | | | 1.00 | % | |
Columbia and/or the Distributor are entitled to recover from Columbia Total Return Bond Fund any fees waived and/or expenses reimbursed for a three year period following the date of such fee waiver and/or reimbursement under these arrangements, if such recovery does not cause the Fund's expenses to exceed the expense limitation in effect at the time of recovery. At March 31, 2009, no amounts were potentially recoverable from the Fund.
Fees Paid to Officers and Trustees
All officers of the Funds are employees of Columbia or its affiliates and, with the exception of the Funds' Chief Compliance Officer, receive no compensation from the Funds. The Board of Trustees has appointed a Chief Compliance Officer to the Funds in accordance with federal securities regulations. The Funds, along with other affiliated funds, pay their pro-rata share of the expenses associated with the Chief Compliance Officer. Each Fund's expenses for the Chief Compliance Officer will not exceed $15,000 per year.
83
Corporate Bond Funds, March 31, 2009 (continued)
The Trust's eligible Trustees may participate in a non-qualified deferred compensation plan which may be terminated at any time. Any payments to plan participants are paid solely out of the Funds' assets. Income earned on the plan participant's deferral account is based on the rate of return of the eligible mutual funds selected by the participant or, if no funds are selected, on the rate of return of Columbia Treasury Reserves, another portfolio of the Trust. The expense for the deferred compensation plan, which includes trustees' fees deferred during the current period as well as any gains or losses on the trustees' deferred compensation balances as a result of market fluctuations, is included in "Trustees' fees" on the Statements of Operations. The liability for the deferred compensation plan is included in "Trustees' fees" on the Statements of Assets and Liabilities
Note 5. Custody Credits
Each Fund has an agreement with its custodian bank under which custody fees may be reduced by balance credits. These credits are recorded as part of expense reductions on the Statements of Operations. The Funds could have invested a portion of the assets utilized in connection with the expense offset arrangement in an income-producing asset if they had not entered into such an agreement.
For the year ended March 31, 2009, these custody credits reduced total expenses for the Funds as follows:
| | | Custody Credits | |
| Columbia Total Return Bond Fund | | $ | 2,121 | | |
| Columbia Short Term Bond Fund | | | 2,407 | | |
| Columbia High Income Fund | | | 2,328 | | |
Note 6. Portfolio Information
For the year ended March 31, 2009, the cost of purchases and proceeds from sales of securities, excluding short-term obligations, for the Funds were as follows:
| | | U.S Government Securities | | Other Investment Securities | |
| | | Purchases | | Sales | | Purchases | | Sales | |
| Columbia Total Return Bond Fund | | $ | 2,614,118,021 | | | $ | 2,943,747,199 | | | $ | 773,883,889 | | | $ | 823,624,380 | | |
| Columbia Short Term Bond Fund | | | 254,684,086 | | | | 252,941,802 | | | | 584,577,534 | | | | 423,506,068 | | |
| Columbia High Income Fund | | | — | | | | — | | | | 251,492,998 | | | | 156,007,046 | | |
Note 7. Shares of Beneficial Interest
As of March 31, 2009, the Funds had shareholders whose shares were beneficially owned by participant accounts over which BOA and/or any of its affiliates had either sole or joint investment discretion. Subscription and redemption activity of these accounts may have a significant effect on the operations of the Funds. The percentages of shares of beneficial interest outstanding held therein are as follows:
| | | % of Shares
Outstanding
Held | |
| Columbia Total Return Bond Fund | | | 71.0 | | |
| Columbia Short Term Bond Fund | | | 59.1 | | |
| Columbia High Income Fund | | | 54.1 | | |
As of March 31, 2009, the Funds had shareholders that held greater than 5% of the shares outstanding of a Fund, over which BOA and/or any of its affiliates did not have investment discretion. The percentages of shares of beneficial interest outstanding held therein are as follows:
| | | % of Shares
Outstanding
Held | |
| Columbia Total Return Bond Fund | | | 8.8 | | |
| Columbia High Income Fund | | | 7.0 | | |
Subscription and redemption activity of these accounts may have a significant effect on the operations of the Funds.
84
Corporate Bond Funds, March 31, 2009 (continued)
An unlimited number of shares of beneficial interest without par value were authorized for the Trust. The Trust's Declaration of Trust authorizes the Board of Trustees to classify or reclassify any authorized but unissued shares into one or more additional classes or series of shares.
Class B shares generally convert to Class A shares as follows:
Columbia Total Return Bond Fund
| Class B Shares purchased: | | Will convert
to Class A
Shares after: | |
| –after November 15, 1998 | | Eight years | |
–between August 1, 1998
and November 15, 1998 | |
| |
| $0 - $249,999 | | Six years | |
| $250,000 - $499,999 | | Six years | |
| $500,000 - $999,999 | | Five years | |
Columbia High Income Fund
| Class B Shares purchased: | | Will convert
to Class A
Shares after: | |
| –after November 15, 1998 | | Eight years | |
–between August 1, 1997
and November 15, 1998 | |
| |
| $0 - $249,999 | | Nine years | |
| $250,000 - $499,999 | | Six years | |
| $500,000 - $999,999 | | Five years | |
| –before August 1, 1997 | | Eight Years | |
Note 8. Regulatory Settlements
As of March 31, 2009, Columbia Total Return Bond Fund and Columbia Short Term Bond Fund received payments of $3,547 and $6,972, respectively, relating to certain regulatory settlements the Funds had participated in during the year. The payments have been included in "Increase from regulatory settlements" on the Statements of Changes in Net Assets.
Note 9. Line of Credit
The Funds and other affiliated funds participate in a $280,000,000 committed, unsecured revolving line of credit provided by State Street. The maximum amount that may be borrowed by any fund is limited to the lesser of $200,000,000 and the Fund's borrowing limit set forth in the Fund's registration statement. Borrowings are available for short-term liquidity or temporary or emergency purposes.
Interest is charged to each participating fund based on the fund's borrowings at a rate per annum equal to the greater of the Federal Funds Rate plus 0.50% or the overnight LIBOR Rate plus 0.50%. In addition, an annual operations agency fee of $20,000, an amendment fee of 0.02% and a commitment fee of 0.12% per annum are accrued and apportioned among the participating funds pro rata based on their relative net assets. Prior to December 18, 2008, the Funds and other affiliated funds participated in a $350,000,000 committed, unsecured revolving line of credit and a $150,000,000 uncommitted, unsecured line of credit, both provided by State Street. Interest on the committed line of credit was charged to each participating fund based on the fund's borrowings at a rate per annum equal to the Federal Funds Rate plus 0.50%. In addition, a commitment fee of 0.10% per annum was accrued and apportioned among the participating funds pro rat a based on their relative net assets. Interest on the uncommitted line of credit was charged to each participating fund based on the fund's borrowings at a rate per annum equal to the Federal Funds Rate plus 0.375%. State Street charged an annual operations agency fee of $40,000 for the committed line of credit and was able to charge an annual administration fee of $15,000 for the uncommitted line of credit. The commitment fee, the operations agency fee and the administration fee were accrued and apportioned among the participating funds pro rata based on their relative net assets.
For the year ended March 31, 2009, the average daily loan balance outstanding on days where borrowing existed and the weighted average interest rate of the Funds were as follows:
| | | Average
Borrowings | | Weighted
Average
Interest
Rate | |
Columbia Total Return
Bond Fund | | $ | 3,710,000 | | | | 1.254 | % | |
85
Corporate Bond Funds, March 31, 2009 (continued)
Note 10. Securities Lending
Each Fund may lend its securities to certain approved brokers, dealers and other financial institutions. Each loan is collateralized by cash, in an amount at least equal to the market value of the securities loaned plus accrued income from the investment of collateral. The market value of the loaned securities is determined at the close of business of the Funds and any additional required collateral is delivered to the Funds on the next business day. The collateral received is invested and the income generated by the investment of the collateral, net of any fees remitted to State Street as the lending agent and borrower rebates, is paid to the Funds. Generally, in the event of borrower default, the Funds have the right to use the collateral to offset any losses incurred. In the event the Funds are delayed or prevented from exercising their right to dispose of the collateral, there may be a potential loss to the Funds. The Funds bear the risk of loss with respect to the investment of collateral.
Note 11. Significant Risks and Contingencies
Foreign Securities Risk
There are certain additional risks involved when investing in foreign securities. These risks may involve foreign currency exchange rate fluctuations, adverse political and economic developments and the possible prevention of currency exchange or other foreign governmental laws or restrictions. In addition, the liquidity of foreign securities may be more limited than that of domestic securities.
Asset-Backed Securities Risk
The value of asset-backed securities may be affected by, among other factors, changes in interest rates, the market's assessment of the quality of underlying assets, the creditworthiness of the servicer for the underlying assets, factors concerning the interests in and structure of the issuer or the originator of the underlying assets, or the creditworthiness or rating of the entities that provide any supporting letters of credit, surety bonds, derivative instruments, or other credit enhancement. The value of asset-backed securities also will be affected by the exhaustion, termination or expiration of any credit enhancement. Most asset-backed securities are subject to prepayment risk, which is the possibility that the underlying debt may be refinanced or prepaid prior to maturity during periods of declining or low interest rates, causing the Fund to have to reinvest the money received in securities that have lower yields. In add ition, the impact of prepayments on the value of asset-backed securities may be difficult to predict and may result in greater volatility.
Legal Proceedings
Columbia Management Advisors, LLC and Columbia Management Distributors, Inc. (collectively, the "Columbia Group") are subject to a settlement agreement with the New York Attorney General ("NYAG") (the "NYAG Settlement") and a settlement order with the SEC (the "SEC Order") on matters relating to mutual fund trading, each dated February 9, 2005. Under the terms of the SEC Order, the Columbia Group (or predecessor entities) agreed, among other things, to: pay disgorgement and civil money penalties collectively totaling $375 million; cease and desist from violations of the antifraud provisions and certain other provisions of the federal securities laws; maintain certain compliance and ethics oversight structures; and retain an independent consultant to review the Columbia Group's applicable supervisory, compliance, control and other policies and procedures. The NYAG Settlement, among other things, requires Columbia Management Advis ors, LLC and its affiliates to reduce management fees for certain funds in the Columbia family of mutual funds in a projected total of $160 million over five years through November 30, 2009 and to make certain disclosures to investors relating to expenses. In connection with the Columbia Group providing services to the Columbia Funds, the Columbia Funds have voluntarily undertaken to implement certain governance measures designed to maintain the independence of their boards of trustees and certain special consulting and compliance measures.
Pursuant to the SEC Order and related procedures, the $375 million in settlement amounts described above, of which approximately $90 million has been earmarked for certain Columbia Funds and their shareholders, is being distributed in accordance with a distribution plan developed by an independent distribution consultant and approved by the SEC on December 27, 2007. Distributions under the distribution plan began in mid-June 2008.
86
Corporate Bond Funds, March 31, 2009 (continued)
Civil Litigation
In connection with the events that resulted in the NYAG Settlement and SEC Order, various parties filed suits against Bank of America Corporation and certain of its affiliates, including Banc of America Capital Management, LLC ("BACAP," now known as Columbia Management Advisors, LLC) and BACAP Distributors, LLC (now known as Columbia Management Distributors, Inc.) (collectively "BAC"), Nations Funds Trust (now known as Columbia Funds Series Trust) and its Board of Trustees. On February 20, 2004, the Judicial Panel on Multidistrict Litigation transferred these cases and cases against other mutual fund companies based on similar allegations to the United States District Court in Maryland for consolidated or coordinated pretrial proceedings (the "MDL"). Subsequently, additional related cases were transferred to the MDL. On September 29, 2004, the plaintiffs in the MDL filed amended and consolidated complaints. One of these amended complaints is a putative class action that includes claims under the federal securities laws and state common law, and that names Nations Funds Trust, the Trustees, BAC and others as defendants. Another of the amended complaints is a derivative action purportedly on behalf of the Nations Funds Trust against BAC and others that asserts claims under federal securities laws and state common law. Nations Funds Trust is a nominal defendant in this action.
On February 25, 2005, BAC and other defendants filed motions to dismiss the claims in the pending cases. On December 15, 2005, BAC and others entered into a Stipulation of Settlement of the direct and derivative claims brought on behalf of the Nations Funds shareholders. The settlement is subject to court approval. If the settlement is approved, BAC would pay settlement administration costs and fees to plaintiffs' counsel as approved by the court. The stipulation has not yet been presented to the court for approval.
Note 12. Business Combinations and Mergers
As of the close of business on March 28, 2008, Short-Term Government Securities Fund, a series of Excelsior Funds, Inc., merged into Columbia Short Term Bond Fund. Columbia Short Term Bond Fund received a tax-free transfer of assets from Short-Term Government Securities Fund as follows:
Shares
Issued | | Net Assets
Received | | Unrealized
Depreciation1 | |
| | 26,159,873 | | | $ | 258,296,287 | | | $ | (4,243,156 | ) | |
Net Assets
of Columbia
Short Term
Bond Fund
Prior to
Combination | | Net Assets
of Short-Term
Government
Securities
Fund Immediately
Prior to Combination | | Net Assets
of Columbia
Short Term
Bond Fund
Immediately
After Combination | |
| $ | 937,733,531 | | | $ | 258,296,287 | | | $ | 1,196,029,818 | | |
1 Unrealized depreciation is included in the Net Assets Received.
87
Report of Independent Registered Public Accounting Firm
To the Shareholders and Trustees of Columbia Funds Series Trust
In our opinion, the accompanying statements of assets and liabilities, including the investment portfolios, and the related statements of operations and of changes in net assets and the financial highlights present fairly, in all material respects, the financial position of Columbia Total Return Bond Fund, Columbia Short Term Bond Fund and Columbia High Income Fund (constituting part of Columbia Funds Series Trust, hereafter referred to as the "Funds") at March 31, 2009, the results of each of their operations for the year then ended, the changes in each of their net assets for each of the two years in the period then ended and the financial highlights for each of the five years in the period then ended, in conformity with accounting principles generally accepted in the United States of America. These financial statements and financial highlights (hereafter referred to as "financial statements") are the responsibility of the Fun ds' management. Our responsibility is to express an opinion on these financial statements based on our audits. We conducted our audits of these financial statements in accordance with the standards of the Public Company Accounting Oversight Board (United States). Those standards require that we plan and perform the audit to obtain reasonable assurance about whether the financial statements are free of material misstatement. An audit includes examining, on a test basis, evidence supporting the amounts and disclosures in the financial statements, assessing the accounting principles used and significant estimates made by management, and evaluating the overall financial statement presentation. We believe that our audits, which included confirmation of securities at March 31, 2009 by correspondence with the custodian and brokers, provide a reasonable basis for our opinion.
PricewaterhouseCoopers LLP
Boston, Massachusetts
May 22, 2009
88
Fund Governance
The Trustees serve terms of indefinite duration. The names, addresses and ages of the Trustees and officers of the Funds in the Columbia Funds Series Trust, the year each was first elected or appointed to office, their principal business occupations during at least the last five years, the number of Funds overseen by each Trustee and other directorships they hold are shown below. Each officer listed below serves as an officer of each Fund in the Columbia Funds Complex.
Independent Trustees
Name, Address and Age,
Position with Funds, Year First
Elected or Appointed to Office | | Principal Occupation(s) During Past Five Years, Number of Funds in the Columbia
Funds Complex Overseen by Trustee, Other Directorships Held
| |
| Edward J. Boudreau (Born 1944) | |
|
c/o Columbia Management
Advisors, LLC
One Financial Center
Boston, MA 02111
Trustee (since 2005) | | Managing Director—E.J. Boudreau & Associates (consulting), from 2000 through current; oversees 66; no other directorships held. | |
|
| William P. Carmichael (Born 1943) | |
|
c/o Columbia Management
Advisors, LLC
One Financial Center
Boston, MA 02111
Trustee (since 1999) | | Retired. Oversees 66; Director—Cobra Electronics Corporation (electronic equipment manufacturer); Director—Spectrum Brands, Inc. (consumer products); Director—Simmons Company (bedding); Director—The Finish Line (sportswear). | |
|
| William A. Hawkins (Born 1942) | |
|
c/o Columbia Management Advisors, LLC
One Financial Center
Boston, MA 02111
Trustee (since 2005) | | President and Chief Executive Officer—California General Bank, N.A., from January 2008 through current; President, Retail Banking—IndyMac Bancorp, Inc., from September 1999 to August 2003; oversees 66; no other directorships held. | |
|
| R. Glenn Hilliard (Born 1943) | |
|
c/o Columbia Management Advisors, LLC
One Financial Center
Boston, MA 02111
Trustee (since 2005) | | Chairman and Chief Executive Officer—Hilliard Group LLC (investing and consulting), from April 2003 through current; Non-Executive Director & Chairman—Conseco, Inc. (insurance), September 2003 through current; Executive Chairman—Conseco, Inc. (insurance), August 2004 through September 2005; oversees 66; Director—Conseco, Inc. (insurance). | |
|
| John J. Nagorniak (Born 1944) | |
|
c/o Columbia Management
Advisors, LLC
One Financial Center
Boston, MA 02111
Trustee (since 2008)` | | Retired. President and Director—Foxstone Financial, Inc. (consulting), 2000 through December 2007; Director—Mellon Financial Corporation affiliates (investing), 2000 through 2007; Chairman—Franklin Portfolio Associates (investing—Mellon affiliate), 1982 through 2007; oversees 66; Director—MIT Investment Company; Trustee—MIT 401k Plan; Trustee and Chairman—Research Foundation of CFA Institute. | |
|
| Minor M. Shaw (Born 1947) | |
|
c/o Columbia Management Advisors, LLC
One Financial Center
Boston, MA 02111
Trustee (since 2003) | | President—Micco Corporation and Mickel Investment Group; oversees 66; Board Member—Piedmont Natural Gas. | |
|
89
Fund Governance (continued)
Interested Trustee
Name, Address and Age,
Position with Funds, Year First
Elected or Appointed to Office | | Principal Occupation(s) During Past Five Years, Number of Funds in the Columbia
Funds Complex Overseen by Trustee, Other Directorships Held
| |
| Anthony M. Santomero (Born 1946) | |
|
c/o Columbia Management Advisors, LLC
One Financial Center
Boston, MA 02111
Trustee1 (since 2008) | | Richard K. Mellon Professor Emeritus of Finance, The Wharton School, University of Pennsylvania, from 1972 through current; Senior Advisor—McKinsey & Company (consulting), July 2006 through December 2007; President and Chief Executive Officer—Federal Reserve Bank of Philadelphia, 2000 through April 2006; oversees 66; Director—Renaissance Reinsurance Ltd; Director—Penn Mutual Life Insurance Company; Director—Citigroup. | |
|
1 Mr. Santomero is currently deemed by the Columbia Funds to be an "interested person" (as defined in the 1940 Act) of the Funds because he serves as a Director of Citigroup, Inc. ("Citigroup"), a company that may through subsidiaries and affiliates engage from time-to-time in brokerage execution, principal transactions and lending relationships with the Columbia Funds or other funds or accounts advised/managed by the Advisor.
The Statement of Additional Information includes additional information about the Trustees of the Funds and is available, without charge, upon request by calling 800-345-6611.
90
Fund Governance (continued)
Officers
Name, Address and Year of Birth,
Position with Columbia Funds,
Year First Elected or
Appointed to Office | | Principal Occupation(s) During Past Five Years
| |
| J. Kevin Connaughton (Born 1964) | |
|
One Financial Center
Boston, MA 02111
President (since 2009) | | Managing Director of Columbia Management Advisors, LLC since December 2004; Senior Vice President and Chief Financial Officer—Columbia Funds, from June 2008 to January 2009; Treasurer—Columbia Funds, from October 2003 to May 2008; Treasurer—the Liberty Funds, Stein Roe Funds and Liberty All-Star Funds, December 2000—December 2006; Senior Vice President—Columbia Management Advisors, LLC, from April 2003 to December 2004; President—Columbia Funds, Liberty Funds and Stein Roe Funds, February 2004 to October 2004; Treasurer—Galaxy Funds, September 2002 to December 2005; Treasurer, December 2002 to December 2004, and President, February 2004 to December 2004—Columbia Management Multi-Strategy Hedge Fund, LLC; and a senior officer of various other Bank of America-affiliated entities, including other registered and unregistered funds | |
|
| James R. Bordewick, Jr. (Born 1959) | |
|
One Financial Center
Boston, MA 02111
Senior Vice President, Secretary and Chief Legal Officer (since 2006) | | Associate General Counsel, Bank of America since April 2005; Senior Vice President and Associate General Counsel, MFS Investment Management (investment management) prior to April 2005. | |
|
| Linda J. Wondrack (Born 1964) | |
|
One Financial Center
Boston, MA 02111
Senior Vice President and
Chief Compliance Officer (since 2007) | | Director (Columbia Management Group LLC and Investment Product Group Compliance), Bank of America since June 2005; Director of Corporate Compliance and Conflicts Officer, MFS Investment Management (investment management), August 2004 to May 2005; Managing Director, Deutsche Asset Management (investment management) prior to August 2004. | |
|
| Michael G. Clarke (Born 1969) | |
|
One Financial Center
Boston, MA 02111
Senior Vice President and
Chief Financial Officer (since 2009) | | Director of Fund Administration of the Advisor since January 2006; Managing Director of the Advisor September 2004 to December 2005; Vice President Fund Administration June 2002 to September 2004. | |
|
| Jeffrey R. Coleman (Born 1969) | |
|
One Financial Center
Boston, MA 02111
Treasurer (since 2008) | | Director of Fund Administration of the Advisor since January 2006; Fund Controller of the Advisor from October 2004 to January 2006; Vice President of CDC IXIS Asset Management Services, Inc. (investment management) from August 2000 to September 2004. | |
|
| Joseph F. DiMaria (Born 1968) | |
|
One Financial Center
Boston, MA 02111
Chief Accounting Officer (since 2008) | | Director of Fund Administration of the Advisor since January 2006; Head of Tax/Compliance and Assistant Treasurer of the Advisor from November 2004 to December 2005; Director of Trustee Administration (Sarbanes-Oxley) of the Advisor from May 2003 to October 2004. | |
|
91
Fund Governance (continued)
Officers (continued)
Name, Address and Year of Birth,
Position with Columbia Funds,
Year First Elected or
Appointed to Office | | Principal Occupation(s) During Past Five Years
| |
| Julian Quero (Born 1967) | |
|
One Financial Center
Boston, MA 02111
Deputy Treasurer (since 2008) | | Senior Tax Manager of the Advisor since August 2006; Senior Compliance Manager of the Advisor from April 2002 to August 2006. | |
|
| Barry S. Vallan (Born 1969) | |
|
One Financial Center
Boston, MA 02111
Controller (since 2006) | | Vice President—Fund Treasury of the Advisor since October 2004; Vice President—Trustee Reporting of the Advisor from April 2002 to October 2004. | |
|
92
Board Consideration and Re-Approval of Investment Advisory and Sub-Advisory Agreements
The Board of Trustees of Columbia Funds Series Trust (the "Board"), including a majority of the Trustees who have no direct or indirect interest in the investment advisory and sub-advisory agreements and are not "interested persons" of the Trust, as defined in the Investment Company Act of 1940 (the "1940 Act") (the "Independent Trustees"), are required annually to review and re-approve the existing investment advisory and sub-advisory agreements and approve any newly proposed terms therein. In this regard, the Board reviewed and re-approved, during the most recent six months covered by this report, (i) investment advisory agreements with Columbia Management Advisors, LLC ("CMA") for Columbia Short Term Bond Fund, Columbia Total Return Bond Fund and Columbia High Income Fund; and (ii) an investment sub-advisory agreement with MacKay Shields LLC ("MacKay Shields" or the "Sub-Adviser") for Columbia High Income Fund. The investment advisory agreements with CMA and the investment sub-advisory agreement with MacKay Shields are each referred to as an "Advisory Agreement" and collectively referred to as the "Advisory Agreements." The funds identified above are each referred to as a "Fund" and collectively referred to as the "Funds."
More specifically, at meetings held on November 10-11, 2008, the Board, including the Independent Trustees advised by their independent legal counsel, considered the factors and reached the conclusions described below relating to the selection of CMA and the Sub-Adviser and the re-approval of the Advisory Agreements. The Board also reviewed and considered a report prepared and provided by the Independent Fee Consultant (the "Consultant") appointed by the Independent Trustees pursuant to an assurance of discontinuance entered into with the New York Attorney General ("NYAG") to settle a civil complaint filed by the NYAG relating to trading in mutual fund shares (the "NYAG Settlement"). During the fee review process, the Consultant's role was to manage the review process to ensure that fees are negotiated in a manner that is at arms' length and reasonable. The Consultant found that the fee negotiation process was, to the extent pra cticable, at arms' length and reasonable and consistent with the requirements of the NYAG Settlement. A summary of the Consultant's report is available at www.columbiafunds.com.
In preparation for the November meetings, the Board met in August for review and discussion of the materials described below. The Investment Committee of the Board also met in June to discuss each Fund's performance with its respective portfolio manager(s). In addition to these meetings, the Investment Committee receives and discusses performance reports at its quarterly meetings. The Contracts Review Committee also provided support in managing and coordinating the process by which the Board reviewed the Advisory Agreements. The Board's review and conclusions are based on comprehensive consideration of all information presented to them and are not the result of any single controlling factor.
Nature, Extent and Quality of Services. The Board received and considered various data and information regarding the nature, extent and quality of services provided to the Funds by CMA and the Sub-Adviser under the Advisory Agreements. The most recent investment adviser registration forms ("Forms ADV") for CMA and the Sub-Adviser were made available to the Board, as were CMA's and the Sub-Adviser's responses to a detailed series of requests submitted by the Independent Trustees' independent legal counsel on behalf of such Trustees. The Board reviewed and analyzed those materials, which included, among other things, information about the background and experience of senior management and investment personnel of CMA and the Sub-Adviser.
In addition, the Board considered the investment and legal compliance programs of the Funds, CMA and the Sub-Adviser, including their compliance policies and procedures and reports of the Funds' Chief Compliance Officer.
The Board evaluated the ability of CMA and the Sub-Adviser, based on their resources, reputation and other attributes, to attract and retain qualified investment professionals, including research, advisory and supervisory personnel. In this regard, the Board considered information regarding CMA's compensation program for its personnel involved in the management of the Funds. The Board also considered CMA's investment in further developing its research and trading departments.
Based on the above factors, together with those referenced below, the Board concluded that it was satisfied with the nature, extent and quality of the investment advisory services provided to each of the Funds by CMA and the Sub-Adviser.
Fund Performance and Expenses. The Board considered the performance results for each of the Funds over multiple measurement periods. It also considered these results in
93
comparison to the performance results of the group of funds that was determined by Lipper Inc. ("Lipper") to be the most similar to a given Fund (the "Peer Group") and to the performance of a broader universe of relevant funds as determined by Lipper (the "Universe"), as well as to each Fund's benchmark index. Lipper is an independent provider of investment company data. The Board was provided with a description of the methodology used by Lipper to select the mutual funds in each Fund's Peer Group and Universe and considered potential imprecision resulting from the selection methodology. The Board also considered certain risk-adjusted performance data.
The Board received and considered statistical information regarding each Fund's total expense ratio and its various components, including contractual advisory fees, actual advisory fees, actual non-management fees, Rule 12b-1 and non-Rule 12b-1 service fees, fee waivers/caps and/or expense reimbursements. The Board also considered comparisons of these fees to the expense information for each Fund's Peer Group and Universe, which comparative data was provided by Lipper. For certain Funds, Lipper determined that the composition of the Peer Group and/or Universe for expenses would differ from the composition for performance to provide a more accurate basis of comparison. The Board also considered Lipper data that ranked each Fund based on: (i) each Fund's one-year performance compared to actual management fees; (ii) each Fund's one-year performance compared to total expenses; (iii) each Fund's three-year performance compared to act ual management fees; and (iv) each Fund's three-year performance compared to total expenses.
Investment Advisory and Sub-Advisory Fee Rates. The Board reviewed and considered the proposed contractual investment advisory fee rates together with the administration fee rates payable by the Funds to CMA for investment advisory services (the "Contractual Management Rates"). The Board also reviewed and considered the proposed contractual investment sub-advisory fee rates (the "Sub-Advisory Agreement Rates") payable by CMA to the Sub-Adviser for investment sub-advisory services. In addition, the Board reviewed and considered the proposed fee waiver/cap arrangements applicable to the Contractual Management Rates and considered the Contractual Management Rates after taking the waivers/caps into account (the "Actual Management Rates"). The Board noted that, on a complex-wide basis, CMA had reduced annual management fees by at least $32 million per year pursuant to the NYAG Settlement. The Board also noted reductions in net advisory rates and/or total expenses of certain funds across the fund complex. Additionally, the Board received and afforded specific attention to information comparing the Contractual Management Rates and Actual Management Rates with those of the other funds in their respective Peer Groups.
For certain Funds highlighted as meeting agreed-upon criteria for warranting further review, the Board engaged in further analysis with regard to approval of the Funds' Advisory Agreements. The Board engaged in further review of Columbia High Income Fund because its Actual Management Rate and total expense ratio were appreciably above the median range of its Peer Group and its performance over some periods was appreciably below the median range of its Peer Group. However, the Board noted other factors such as the positive performance of the Fund relative to its performance Universe over some periods, that outweighed the factors noted above. The Board also engaged in further review of Columbia Total Return Bond Fund because its Actual Management Rate was appreciably above the median of its Peer Group and its performance over some periods was appreciably below the median range of its Peer Group. However, the Board noted other fact ors such as total expenses that were not appreciably outside the median range of its expense Universe and the recent change in the portfolio management team, that outweighed the factors noted above.
The Board concluded that the factors noted above supported the Contractual Management Rates and the Actual Management Rates, and the approval of the Advisory Agreements for all of the Funds.
With regard to the Funds with a sub-adviser, the Board also reviewed the Sub-Advisory Agreement Rates charged by MacKay Shields, which serves as Sub-Adviser to Columbia High Income Fund. The Board concluded that the Sub-Advisory Agreement Rates are fair and equitable, based on their consideration of the factors described above.
Profitability. The Board received and considered a detailed profitability analysis of CMA based on the Contractual Management Rates and the Actual Management Rates, as well as on other relationships between the Funds and other funds in the complex on the one hand and CMA affiliates on
94
the other. The analysis included complex-wide and per-Fund information and a comparison of results using alternative allocation methodologies. The Board concluded that, in light of the costs of providing investment management and other services, the profits and other ancillary benefits that CMA and its affiliates received from providing these services were not unreasonable.
Economies of Scale. The Board received and considered information regarding whether there have been economies of scale with respect to the management of the Funds, whether the Funds have appropriately benefited from any economies of scale and whether there is potential for realization of any further economies of scale. Most particularly, CMA provided information showing that, as a percentage of fund assets, CMA's complex-wide revenues, expenses and profits declined over a four-year period during which fund assets increased by 39% and the shareholder benefit over a two-year period increased from 33% to 41% of the Adviser's total profits. The Board concluded that any potential economies of scale are shared fairly with Fund shareholders, most particularly through breakpoints and fee waiver arrangements.
The Board acknowledged the inherent limitations of any analysis of an investment adviser's economies of scale, stemming largely from the Board's understanding that economies of scale are realized, if at all, by an investment adviser across a variety of products and services, not just with respect to a single fund.
Information About Services to Other Clients. The Board also received and considered information about the nature and extent of services and fee rates offered by CMA and the Sub-Adviser to their other clients, including separate accounts and institutional investors. In this regard, the Board concluded that, where the Contractual Management Rates, Sub-Advisory Agreement Rates and Actual Management Rates were appreciably above the range of the fee rates offered to other CMA and Sub-Adviser clients, based on information provided by CMA and the Sub-Adviser, the costs associated with managing and operating a registered investment company provided a justification for the higher fee rates charged to the Funds.
Other Benefits to CMA and the Sub-Adviser. The Board received and considered information regarding any "fall-out" or ancillary benefits received by CMA and its affiliates and the Sub-Adviser as a result of their relationships with the Funds.
Such benefits could include, among others, benefits attributable to CMA's and the Sub-Adviser's relationships with the Funds (such as soft-dollar credits) and benefits potentially derived from an increase in CMA's and the Sub-Adviser's business as a result of their relationships with the Funds (such as the ability to market to shareholders other financial products offered by CMA and its affiliates or a Sub-Adviser).
The Board considered the effectiveness of the policies of the Funds in achieving the best execution of portfolio transactions, whether and to what extent soft dollar credits are sought and how any such credits are utilized, any benefits that may be realized by using an affiliated broker, the extent to which efforts are made to recapture transaction costs, and the controls applicable to brokerage allocation procedures. The Board also reviewed CMA's and the Sub-Adviser's methods for allocating portfolio investment opportunities among the Funds and other clients. The Board concluded that the benefits were not unreasonable.
Other Factors and Broader Review. As discussed above, the Board reviews materials received from CMA and the Sub-Adviser annually as part of the re-approval process under Section 15(c) of the 1940 Act. The Board also reviews and assesses the quality of the services the Funds receive throughout the year. In this regard, the Board and its Committees review reports of CMA and the Sub-Adviser at each of its quarterly meetings, which include, among other things, Fund performance reports. In addition, the Board and its Committees confer with portfolio managers at various times throughout the year including, most particularly, in the June Investment Committee meeting.
Conclusion. After considering the above-described factors, based on their deliberations and their evaluation of the information provided, the Board concluded that the compensation payable to CMA and the Sub-Adviser under the Advisory Agreements is fair and equitable. Accordingly, the Board unanimously re-approved the Advisory Agreements.
95
Summary of Management Fee Evaluation by
Independent Fee Consultant
EXCERPTS FROM REPORT OF INDEPENDENT FEE CONSULTANT TO THE FUNDS SUPERVISED BY THE COLUMBIA NATIONS BOARD
Prepared pursuant to the February 9, 2005
Assurance of Discontinuance among the
Office of Attorney General of New York State,
Columbia Management Advisors, LLC and
Columbia Management Distributors, Inc.
November 12, 2008
I. Overview
On February 9, 2005, Columbia Management Advisors, LLC ("CMA") and Columbia Management Distributors, Inc.1 ("CMD") agreed to the New York Attorney General's Assurance of Discontinuance ("AOD"). Among other matters, the AOD stipulates that CMA may manage or advise a Columbia Fund ("Columbia Fund" and together with all such funds or a group of such funds as the "Columbia Funds") only if the Independent Members of the Columbia Fund's Board of Trustees appoint a Senior Officer or retain an Independent Fee Consultant ("IFC") who is to manage the process by which proposed management fees are negotiated. The AOD further stipulates that the Senior Officer or IFC is to prepare a written annual evaluation of the fee negotiation process.
With effect from January 1, 2007, the Independent Members of the Board of Trustees for certain Columbia Funds known collectively as the "Nations Funds" (the "Trustees") retained me as IFC for the Nations Funds.2 In this capacity, I have prepared the fourth annual written evaluation of the fee negotiation process. As was the case with last year's report (the "2007 Report") my immediate predecessor as IFC, John Rea, provided invaluable assistance in the preparation of this year's report.
A. Role of the Independent Fee Consultant
The AOD charges the IFC with "managing the process by which proposed management fees...to be charged the Columbia Fund are negotiated so that they are negotiated in a manner which is at arms' length and reasonable and consistent with this Assurance of Discontinuance." The AOD also provides that CMA "may manage or advise a Columbia Fund only if the reasonableness of the proposed management fees is determined by the Board of Trustees...using...an annual independent written evaluation prepared by or under the direction of...the Independent Fee Consultant." Therefore, the AOD makes clear that the IFC does not supplant the Trustees in negotiating management fees with CMA, nor does the IFC substitute his or her judgment for that of the Trustees with respect to the reasonableness of proposed fees or any other matter that is committed to the business judgment of the Trustees.
B. Elements Involved in Managing the Fee Negotiation Process
In preparing the report required by the AOD, the IFC must consider at least the following six factors set forth in the AOD:
1. The nature and quality of CMA's services, including the Fund's performance;
2. Management fees (including any components thereof) charged by other mutual fund companies for like services;
3. Possible economies of scale as the Fund grows larger;
4. Management fees (including any components thereof) charged to institutional and other clients of CMA for like services;
5. Costs to CMA and its affiliates of supplying services pursuant to the management fee agreements, excluding any intra-corporate profit; and
6. Profit margins of CMA and its affiliates from supplying such services.
C. Organization of the Annual Evaluation
This report, like last year's, focuses on the six factors and contains a section for each factor except that CMA's costs and profits from managing the Funds have been combined into a single section. In addition to a discussion of these factors, the report offers recommendations to improve the fee review process in future years. A review of the status of recommendations made in the 2007 Report is being provided separately with the materials for the November meeting.
1 CMA and CMD are subsidiaries of Columbia Management Group, LLC ("CMG"), and are the successors to the entities named in the AOD.
2 I have no material relationship with Bank of America, CMG or any of its affiliates, aside from serving as IFC, and I am aware of no material relationship with any of their affiliates. I retained John Rea, an independent economic consultant, to assist me with this report.
Unless otherwise stated or required by the context, this report covers only the Nations Funds, which are also referred as the "Funds."
96
II. Summary of Findings
A. General
1. Based upon my examination of the information supplied by CMG in the light of the six factors set forth in the AOD, I conclude that the Trustees have the relevant information necessary to evaluate the reasonableness of the proposed management fees for each Nations Fund.
2. In my view, the process by which the proposed management fees of the Funds have been negotiated in 2008 thus far has been, to the extent practicable, at arms' length and reasonable and consistent with the AOD.
B. Nature and Quality of Services, Including Performance
3. The performance of the Funds has been relatively good for the most recent 1-, 3- and 5-year periods. The strongest records were posted by the Funds in the Active Equity and Quantitative Strategies Groups and by the sub-advised Funds. The 5-year performance rankings of the subadvised Funds were particularly strong, with all such Funds in the top two performance quintiles.
4. The 1- and 3-year performance records of the Funds declined slightly from 2007 to 2008, while the 5-year performance records improved year-over-year. Most Funds changed their 1-year performance quintile year-over-year, while the 5-year rankings were, as expected, much more stable, with less than half the Funds moving to a different 5-year performance quintile.
5. The performance of the actively-managed equity and sub-advised Funds against their benchmarks was strong, especially for the 1- and 3-year performance periods. However, no fixed-income Fund with a reliable benchmark exceeded it on a net basis in any performance period. Money market Funds do not have such benchmarks and therefore were excluded from this analysis.
6. The Nations equity Funds' overall performance adjusted for risk was strong. The performance of 13 of the 19 actively-managed Funds included in the risk analysis bettered the median in 3-year performance adjusted and unadjusted for risk. No relationship between risk and return was detected for fixed-income Funds.
7. The industry-standard procedure used by third parties such as Lipper and Morningstar to construct the performance universe in which each Fund's performance is ranked relative to comparable funds tends to bias a Fund's ranking upward within that universe. The bias occurs because either no-12b-1-fee or A share classes of the Funds are compared to the performance universe that includes all share classes of competitive multi-class funds. Therefore, the procedure ranks shares with zero or 25 basis point 12b-1 fees against classes of competitive funds with 12b-1 fees of up to 100 basis points. Correcting this bias by limiting the performance universe to classes of competitive funds with comparable 12b-1 fees in most cases lowers the relative performance for the Funds but does not call into question the general finding that the Nations Funds' performance has been strong.
8. A small number of Funds have consistently underperformed their peers in each of the past four years, depending on the exact criteria used to measure long-term underperformance. For example, one Fund has had below-median 1- and 3-year performance in each of the past four years; one additional Fund had below-median 3-year performance for those years.
9. The services performed by CMG professionals beyond portfolio management, such as compliance, legal, information technology, risk management, finance and fund administration, are critical to the success of the Funds and appear to be of high quality.
C. Management Fees Charged by Other Mutual Fund Companies
10. The Funds' management fees and total expenses are generally low relative to those of their peers, with the exception of subadvised Funds. Almost two-third of the Funds ranked in the two least expensive quintiles for total expenses and just over half were in those quintiles for actual management fees. Funds with lower actual management fees tended to have lower relative total expenses. All fixed-income Funds had total expenses in the two least expensive quintiles.
11. Generally, the Nations Funds with the highest relative fees and expenses are sub-advised. All eight Nations Funds with fifth-quintile total expense rankings were sub-advised. The actual management fees of 11 of the 14 sub-advised
97
Funds were in the fourth and fifth quintile. The average management fees of the sub-advised Funds were typically 20 points higher than internally-managed equity Funds. CMA presented data suggesting that such differentials were consistent with industry practice.
12. The management fees of the internally-advised Nations Funds are generally in line with those of Columbia Funds overseen by the Atlantic and Acorn/Wanger Boards of Trustees.
D. Trustees' Fee and Performance Evaluation Process
13. The Trustees' evaluation process identified 20 Funds in 2008 for further review based upon their relative performance or expenses or both. When compared in filtered universes, three more Funds met the criteria for review.
E. Potential Economies of Scale
14. CMG has prepared a memo for the Trustees containing its views on the sources and sharing of potential economies of scale. CMG views economies of scale as arising at the complex level and would regard estimates of scale economies for individual funds as unreliable. In its analysis, CMG did not identify specific sources of economies of scale or provide any estimates of any economies of scale that might arise from future asset growth. CMG's analysis included measures taken by the Trustees and CMG that seek to share any potential economies of scale through breakpoints in management fee schedules, expense reimbursements, fee waivers, enhanced shareholder services, fund mergers, and operational consolidation.
15. An examination of the management fee schedules of a selected number of the Nations Funds suggests that, as a general matter, the breakpoint schedules of these Funds are not out of line with those of competitors. A similar examination of five other Nations Funds in 2007 led to the same conclusion.
F. Management Fees Charged to Institutional Clients
16. CMG has provided Trustees with comparisons of mutual fund management fees and institutional fees based upon standardized fee schedules and actual fees. The results show that, consistent with industry practice, institutional fees are generally lower than the Funds' management fees. However, because the services provided and risks borne by the manager are more extensive for mutual funds than for institutional accounts, the differences are of limited value in assisting the Trustees in their review of the reasonableness of the Funds' management fees.
G. Revenues, Expenses, and Profits
17. The activity-based cost allocation methodology ("ABC") employed by CMG to allocate costs for purposes of calculating Fund profitability, both direct and indirect, for purposes of calculating Fund profitability is thoughtful and detailed. For comparison, CMG proposed a change to the method by which indirect expenses were allocated. Under this "hybrid" method, such costs are allocated to Funds 50% by assets and 50% per fund. Allocating indirect expenses equally to each Fund has an intuitive logic, as each Fund regardless of size has certain expenses, such as preparing and printing prospectuses and financial statements.
18. The materials provided on CMG's revenues and expenses with respect to the Funds and the methodology underlying their construction generally form a sufficient basis for Trustees to evaluate CMG's expenses and profitability for each Fund.
19. In 2007, CMG's complex-wide pre-tax margins on the Nations Funds were close to the industry average before distribution and below average when distribution revenues and expenses were included, based on limited data available about publicly-held mutual fund managers. However, as is to be expected in a complex comprising 65 Funds, some Nations Funds have higher pre-tax profit margins, when calculated solely with respect to management revenues and expenses, while other Nations Funds operate at a loss. A pro forma analysis of the complex's profitability taking into account expenses incurred in 2008 associated with support of the money market funds sharply reduced the profitability of the Nations Funds. There is a positive relationship between fund size and profitability, with smaller Funds generally operating at a loss.
98
20. CMG shares a fixed percentage of its management fee revenues with an affiliate, U.S. Trust, Bank of America Private Wealth Management, to compensate that affiliate for services it performs with respect to Nations Fund assets held for the benefit of its customers. Based on our analysis of the services provided by the affiliate, we believe all such payments should be regarded as a distribution expense, except for any portion attributable to payments by CMG for performance of sub-transfer agency or sub-accounting functions.
III. Recommendations
1) Criteria for review. The Trustees may wish to consider modifying the criteria for classifying a fund as a "Review Fund" to include criteria that focus exclusively on performance without regard to expense or fee levels. For example, a Fund whose one-year or three-year performance was median or below for four consecutive years could be treated as a Review Fund. Applying such criteria would add two Funds to the list of Review Funds.
2) Profitability data. CMG should present to the Trustees each year the profitability of each Fund, each investment style, and each complex (of which Nations is one) calculated as follows:
Exhibit 1. Management-only profitability should be calculated without reference to any Private Bank expense.
Exhibit 2. Profitability excluding distribution (which essentially covers the management and transfer agency functions) should be adjusted by removing from the expense calculation any portion of the Private Bank payment not attributable to the performance by the Private Bank of sub-transfer agency or sub-accounting functions.
Exhibit 3. Total profitability, including distribution: No adjustment for Private Bank expenses should be made, because all such expenses represent legitimate fund expenses to be taken into account in calculating CMG's profit margin including distribution.
Exhibit 4. Distribution only: This should include all Private Bank expenses other than those attributable to sub-transfer agency services.
Therefore, the following data need not be provided:
1. Adjusting total profitability data for Private Bank expenses
2. Adjusting profitability excluding distribution by backing out all Private Bank expenses.
3) Economies of scale. CMG and the IFC should continue to work on methods for more precisely quantifying to the extent possible the sources and magnitude of any economies of scale as CMG's mutual fund assets under management increase, to the extent that the data allows for meaningful year-over-year comparisons. The framework suggested in Section IV.D.4 may prove to be a useful model for such an analysis.
4) Competitive breakpoint analysis. As part of the annual fee evaluation process, the breakpoints of a select group of Nations Funds (which would differ each year) should continue to be compared to those of industry rivals to ensure that the Funds' breakpoint schedules remain within industry norms. As breakpoint schedules change relatively little each year, performing such a comparison for all Funds each year would not be an efficient use of Trustee and CMG resources.
5) Cost allocation methodology. CMG's point that the current ABC system of allocating indirect expenses creates anomalous results in several cases, including sub-advised Funds, is well-taken. We would like to work with CMG over the forthcoming year on alternatives to the current system of allocating indirect expenses that (1) resolve the anomalies, (2) limit the amount of incremental effort on CMG's part and (3) remain faithful to the general principle that expenses should be allocated by time and effort to the extent reasonably possible.
6) Management fee disparities. CMG and the Nations Trustees, as part of any future study of management fees, should analyze any differences in management fee schedules between Funds managed in similar investment styles. As part of that analysis, CMG should provide an explanation for any significant fee differences among comparable funds
99
across fund families managed by CMA, such as differences in the management styles of different Funds included the same Lipper category. Finally, whenever CMG proposes a management fee change or an expense cap for any mutual fund managed by CMA that is comparable to any Nations Fund, CMG should provide the Trustees with sufficient information about the proposal to allow the Trustees to assess the applicability of the proposed change to the relevant Nations Fund or Funds.
7) Tax-exempt Fund expense data. The expense rankings of certain tax-exempt Funds were adversely affected by including certain investment-related interest expenses that Lipper excluded in calculating the expense ratios of competitors. We recommend that CMG follow the Lipper practice and exclude such interest expenses from data submitted to Lipper to avoid unfairly disadvantaging the tax-exempt Funds.
8) Reduction of volume of paper documents submitted. The effort to rationalize and simplify the data presented to the Trustees and the process by which that data was prepared and organized was regarded as a success by all parties. We should continue to look for opportunities to reduce and simplify the presentation of 15(c) data, especially in the area of Fund and manager profitability. The Fund "Dashboard" volume presents a large volume of Fund data on a single page. If it is continued, the Trustees may wish to consider receiving the underlying Lipper data on CD, rather than the current paper volumes.
* * *
Respectfully submitted,
Steven E. Asher
100
Important Information About This Report
Transfer Agent
Columbia Management Services, Inc.
P.O. Box 8081
Boston, MA 02266-8081
1-800-345-6611
Distributor
Columbia Management
Distributors, Inc.
One Financial Center
Boston, MA 02111
Investment Advisor
Columbia Management Advisors, LLC
100 Federal Street
Boston, MA 02110
The funds mail one shareholder report to each shareholder address. If you would like more than one report, please call shareholder services at 1-800-345-6611 and additional reports will be sent to you. This report has been prepared for shareholders of Corporate Bond Funds.
A description of the policies and procedures that each fund uses to determine how to vote proxies and a copy of each fund's voting records are available (i) at www.columbiamanagement.com; (ii) on the Securities and Exchange Commission's website at www.sec.gov, and (iii) without charge, upon request, by calling 1-800-368-0346. Information regarding how each fund voted proxies relating to portfolio securities during the 12-month period ended June 30 is available from the SEC's website. Information regarding how each fund voted proxies relating to portfolio securities is also available from the funds' website columbiamanagement.com.
Each fund files a complete schedule of portfolio holdings with the SEC for the first and third quarters of each fiscal year on Form N-Q. Each fund's Form N-Q is available on the SEC's website at www.sec.gov and may be reviewed and copied at the SEC's Public Reference Room in Washington, DC. Information on the operation of the Public Reference Room may be obtained by calling 1-800-SEC-0330.
Please read and consider the investment objectives, risks, charges and expenses for any fund carefully before investing. For a prospectus which contains this and other important information about the fund, contact your Columbia Management representative or financial advisor or go to www.columbiamanagement.com.
Columbia Management Group, LLC ("Columbia Management") is the investment management division of Bank of America Corporation. Columbia Management entities furnish investment management services and products for institutional and individual investors. Columbia Funds are distributed by Columbia Management Distributors, Inc., member of FINRA, SIPC, part of Columbia Management and an affiliate of Bank of America Corporation.
101
Columbia Management®
One Financial Center
Boston, MA 02111-2621
PRSRT STD
U.S. Postage
PAID
Holliston, MA
Permit NO. 20
Columbia Management®
Corporate Bond Funds
Annual Report, March 31, 2009
©2009 Columbia Management Distributors, Inc.
One Financial Center, Boston, MA 02111-2621
800-345-6611 www.columbiafunds.com
SHC-42/10814-0309 (05/09) 09/78647
Columbia Management®
Annual Report
March 31, 2009
Fixed Income Sector Portfolios
g Corporate Bond Portfolio
g Mortgage- and Asset-Backed Portfolio
| NOT FDIC INSURED | | May Lose Value | |
|
| NOT BANK ISSUED | | No Bank Guarantee | |
|
Table of Contents
| Economic Update | | | 1 | | |
|
| Corporate Bond Portfolio | | | 3 | | |
|
Mortgage- and Asset-Backed
Portfolio | | | 8 | | |
|
| Investment Portfolios | | | 13 | | |
|
Statements of Assets and
Liabilities | | | 20 | | |
|
| Statements of Operations | | | 21 | | |
|
Statements of Changes in
Net Assets | | | 22 | | |
|
| Financial Highlights | | | 24 | | |
|
| Notes to Financial Statements | | | 26 | | |
|
Report of Independent Registered
Public Accounting Firm | | | 34 | | |
|
| Fund Governance | | | 35 | | |
|
Board Consideration and
Re-Approval of Investment
Advisory Agreement | | | 39 | | |
|
Summary of Management Fee
Evaluation by Independent Fee
Consultant | | | 42 | | |
|
Important Information About
This Report | | | 49 | | |
|
The views expressed in this report reflects the current views of the respective parties. These views are not guarantees of future performance and involve certain risks, uncertainties and assumptions that are difficult to predict so actual outcomes and results may differ significantly from the views expressed. These views are subject to change at any time based upon economic, market or other conditions and the respective parties disclaim any responsibility to update such views. These views may not be relied on as investment advice and, because investment decisions for a Columbia Fund are based on numerous factors, may not be relied on as an indication of trading intent on behalf of any particular Columbia Fund. References to specific securities should not be construed as a recommendation or investment advice.
President's Message

Dear Shareholder:
Recent events have shown great volatility in the markets and uncertainty in the economy. During these challenging times, it becomes even more important to focus on long-term horizons and key investment tools that can help manage volatility. This may be the time to reflect on your investment goals and evaluate your portfolio to ensure you are positioned for any potential market rebound.
A long-term financial plan can serve as a road map and guide you through the necessary steps designed to meet your financial goals. Your financial plan should take into account your investment goals, time horizon, overall financial situation, risk tolerance and willingness to ride out market volatility. Your investment professional can be a key resource as you work through this process. The knowledge and experience of an investment professional can help as you create or reevaluate your investment strategy.
The importance of diversification
Although diversification does not ensure a profit or guarantee against loss, a diversified portfolio can be a strategy for successful long-term investing. Diversification refers to the mix of investments within a portfolio. A mutual fund can contribute to portfolio diversification given that a mutual fund's portfolio represents several investments. Additionally, the way you allocate your money among stocks, bonds and cash, and geographically between foreign and domestic investments, can help to reduce risks. Diversification can result in multiple investments where the positive performance of certain holdings can offset any negative performance from other holdings. Having a diversified portfolio doesn't mean that the value of the portfolio will never go down, but rather helps strike a balance between risk and reward.
Reevaluate your strategy
An annual review of your investments is a key opportunity to determine if your investment needs have changed or if you need minor adjustments to rebalance your portfolio. Life events like a birth, marriage, home improvement, or change in employment can have a major affect on your spending and goals. Ask yourself how your spending or goals have changed and factor this into your financial plan. Are you using automated investments or payroll deductions to help keep your savings on track? Are you able to set aside additional savings or increase your 401(k) plan contributions? If during your review you find that your investments in any one category (e.g., stocks, bonds or cash) have grown too large based on your diversification plan, you may want to consider redirecting future investments to get back on track.
History has shown that the U.S. stock market has been remarkably resilient1. Volatility can lead to opportunity. Patience and a commitment to your long-term financial plan may position you to potentially benefit over your investment horizon. We appreciate your business and continued support of Columbia Funds.
Sincerely,

J. Kevin Connaughton
President, Columbia Funds
The board of trustees elected J. Kevin Connaughton president of Columbia Funds on January 16, 2009.
1The Dow Jones Industrial Average is the most widely used indicator of the overall condition of the stock market. The Dow Jones Industrial Average Index is a price-weighted average of 30 actively traded blue-chip stocks as selected by the editors of the Wall Street Journal. Indices are not available for investment, and do not reflect sales charges, fees, brokerage commissions, taxes or other expenses of investing.
Economic Update – Fixed Income Sector Portfolios
Economic growth ground to a halt during the 12-month period that began April 1, 2008 and ended March 31, 2009. The National Bureau of Economic Research reported that the U.S. economy had slipped into recession late in 2007 and the downturn was even sharper than anticipated.
A host of factors weighed on consumers and businesses alike. The most severe housing downturn in decades showed few signs of abating as inventories of homes for sale rose, home prices declined and tighter credit standards, the result of continued turmoil in the subprime mortgage market, made it more difficult for homebuyers to qualify for loans. The labor market has contracted for 15 consecutive months, driving the unemployment rate to 8.5%. More than five million jobs have been lost since the recession commenced late in 2007, with nearly two-thirds of the decrease occurring in the most recent five months. Manufacturing activity slowed and consumer spending declined, resulting in one of the weakest holiday seasons in decades.
However, in March there were a few signs that this severe recession is no longer intensifying. Weekly chain store sales and mortgage purchase applications gained some momentum near the end of the period. The trade deficit has narrowed more than expected, raising hopes that first quarter real GDP will contract at a rate well below the fourth quarter's negative 6.3%.
A weakening economy and turmoil in the financial markets took a toll on consumer confidence, which continued to set new all-time lows during the period. However, the monthly Conference Board gauge was nearly unchanged in March, another indication that the worst could be behind us. Consumer confidence is surveyed monthly by the Conference Board.
In an effort to restore confidence in the capital markets, loosen the reins on credit and shore up economic growth, the Federal Reserve Board (the Fed) brought a key short-term rate—the federal funds rate—down from 2.25% to a target between zero and 0.25% during the 12-month period—a record low. However, the Fed's efforts went largely unrewarded. The one bright spot during this period of uncertainty was lower energy and commodity prices. With oil trading near $50 per barrel at the end of the period, gasoline prices have come down from $4 per gallon or more last summer to just over $2 per gallon in recent months.
Some bond sectors delivered positive returns
The U.S. bond market seesawed during the 12-month period, but several sectors managed to deliver modest gains as investors sought refuge from the volatile stock market. Treasury prices rose and yields declined as the economy faltered and stock market volatility increased. The benchmark 10-year U.S. Treasury yield ended the period at 2.70%. In this environment, the Barclays Capital U.S. Aggregate Bond Index returned 3.13%. High-yield bond prices fell sharply as economic prospects weakened and default fears rose. The Merrill Lynch U.S. High Yield, Cash Pay Index returned negative 19.95%. The municipal market suffered a setback early in 2008, then rebounded in the first quarter of 2009. The Barclays Capital Municipal Bond Index returned 2.27% for the 12-month period.
Summary
For the 12-month period that ended March 31, 2009
g Despite volatility in many segments of the bond market, the Barclays Capital U.S. Aggregate Bond Index delivered a modest gain. High-yield bonds lost ground, as measured by the Merrill Lynch U.S. High Yield, Cash Pay Index. Municipals recovered from an early setback, as measured by the Barclays Capital Municipal Bond Index.
Barclays
Aggregate Index | | Merrill
Lynch Index | |
|
 | |  | |
|
Barclays
Municipal Index | |
| |
|
 | | | |
|
g The broad U.S. stock market, as measured by the S&P 500 Index, returned negative 38.09%. Stock markets outside the United States returned negative 46.51%, as measured (in U.S. dollars) by the MSCI EAFE Index.
| S&P Index | | MSCI Index | |
|
 | |  | |
|
The Standard & Poor's (S&P) 500 Index tracks the performance of 500 widely held, large-capitalization U.S. stocks.
1
Economic Update (continued) – Fixed Income Sector Portfolios
The Morgan Stanley Capital International (MSCI) Europe, Australasia, Far East (EAFE) Index is a free float-adjusted market capitalization index that is designed to measure developed market equity performance, excluding the U.S. and Canada.
The Barclays Capital U.S. Aggregate Bond Index (formerly the Lehman Brothers U.S. Aggregate Bond Index) is a market value-weighted index that tracks the daily price, coupon, pay-downs and total return performance of fixed-rate, publicly placed, dollar-denominated and non-convertible investment grade debt issues with at least $250 million par amount outstanding and with at least one year to final maturity.
The Merrill Lynch U.S. High Yield, Cash Pay Index tracks the performance of non-investment-grade corporate bonds. As of 01/01/2009, Merrill Lynch & Co., Inc. is a wholly owned subsidiary of Bank of America Corporation and an affiliate of Columbia Management.
The Barclays Capital Municipal Bond Index (formerly the Lehman Brothers Municipal Bond Index) is considered representative of the broad market for investment-grade, tax-exempt bonds with maturities of at least one year.
Indices are not available for investment, and do not reflect sales charges, fees, brokerage commissions, taxes or other expenses of investing. Securities in the portfolio may not match those in an index.
Stocks retreated as economic outlook darkened
Against a weakening economic backdrop, the U.S. stock market lost 38.09% for the 12-month period, as measured by the S&P 500 Index. Losses affected the stocks of companies of all sizes and investment style categories, although growth stocks held up better than value stocks, as measured by their respective Russell indices1. Stock markets outside the U.S. suffered even greater losses. The MSCI EAFE Index, a broad gauge of stock market performance in foreign developed markets, lost 46.51% (in U.S. dollars) for the period. Emerging stock markets, which generally have had a strong run over the past several years, were also caught in the downdraft. As investors backed away from risk, the MSCI Emerging Markets Index2 returned negative 47.07% (in U.S. dollars).
Past performance is no guarantee of future results.
1The Russell 1000 Growth Index measures the performance of those Russell 1000 Index companies with higher price-to-book ratios and higher forecasted growth values. The Russell 1000 Value Index measures the performance of those companies in the Russell 1000 Index with lower price-to-book ratios and lower forecasted growth values. The Russell 2000 Growth Index measures the performance of those Russell 2000 Index companies with higher price-to-book ratios and higher forecasted growth values. The Russell 2000 Value Index measures the performance of those Russell 2000 Index companies with lower price-to-book ratios and lower forecasted growth values. The Russell 3000 Growth Index measures the performance of those Russell 3000 Index companies with higher price-to book ratios and higher forecasted growth values. The Russell 3000 Value Index measures the performance of those Russell 3000 Index companies with lower price-to-bo ok ratios and lower forecasted growth values. The Russell Midcap Growth Index measures the performance of those Russell Midcap companies with higher price-to-book ratios and higher forecasted growth values. The Russell Midcap Value Index measures the performance of those Russell Midcap Index companies with lower price-to-book ratios and lower forecasted growth values.
2The MSCI Emerging Markets Index is a widely accepted index composed of a sample of companies from 25 countries representing the global emerging stock markets. Indices are not available for investment, and do not reflect sales charges, fees, brokerage commissions, taxes or other expenses of investing. Securities in the portfolio may not match those in an index.
2
Portfolio Profile – Corporate Bond Portfolio
Summary
g For the 12-month period that ended March 31, 2009, the portfolio returned negative 4.65%.
g In a challenging period for the corporate bond market, the portfolio held up better than its benchmark, the Barclays Capital U.S. Credit Bond Index.1
g Positive sector weights and security selection aided relative returns.
Portfolio Management
Carl Pappo has managed the portfolio since November 2006 and has been associated with the advisor or its predecessors or affiliate organizations since 1993.
1Barclays Capital U.S. Credit Bond Index is an index (formerly Lehman Brothers U.S. Credit Bond Index) of publicly issued investment grade corporate securities and dollar-denominated SEC registered global debentures. Indices are not available for investment, and do not reflect sales charges, fees, brokerage commissions, taxes or other expenses of investing. Securities in the portfolio may not match those in an index.
Performance data quoted represents past performance and current performance may be lower or higher. Past performance is no guarantee of future results. The investment return and principal value will fluctuate so that shares, when redeemed, may be worth more or less than the original cost. Please call 1-800-345-6611 for daily and most recent month-end performance updates.
Summary
1-year return as of 03/31/09
| | | | | –4.65% | |
|
| |  | | | Portfolio Performance | |
|
| | | | | –5.21% | |
|
| |  | | | Barclays Capital
U.S. Credit Bond Index | |
|
3
Performance Information – Corporate Bond Portfolio
Performance data quoted represents past performance and current performance may be lower or higher. Past performance is no guarantee of future results. The investment return and principal value will fluctuate so that shares, when redeemed, may be worth more or less than the original cost. Please call 1-800-345-6611 for daily and most recent month-end performance updates.
Performance of a $10,000 investment 08/30/02 – 03/31/09
The chart above shows the change in value of a hypothetical $10,000 investment in the Corporate Bond Portfolio during the stated time period, and does not reflect the deduction of taxes that a shareholder may pay on portfolio distributions or on the redemption of portfolio shares. The Barclays Capital U.S. Credit Bond Index is an index of publicly issued investment grade corporate securities and dollar-denominated SEC registered global debentures. Indices are not available for investment, and do not reflect sales charges, fees, brokerage commissions, taxes or other expenses of investing. Securities in the portfolio may not match those in an index.
Performance of a $10,000 investment 08/30/02 – 03/31/09 ($)
| Portfolio | | | 12,418 | | |
| Barclays Capital U.S. Credit Bond Index | | | 12,689 | | |
Average annual total return as of 03/31/09 (%)
| Inception | | 08/30/02 | |
| 1-year | | | –4.65 | | |
| 5-year | | | 1.48 | | |
| Life | | | 3.34 | | |
No fees or expenses are charged to the portfolio. Participants in wrap fee programs eligible to invest in the portfolio, however, pay an asset-based fee, which is negotiable, for investment services, brokerage services and investment consultation. The portfolio may incur significant costs that are in addition to the wrap fees paid to the program sponsor that are not included in this table. All results shown assume reinvestment of distributions.
The table does not reflect the deduction of taxes that a shareholder may pay on portfolio distributions or on the redemption of portfolio shares.
4
Understanding Your Expenses – Corporate Bond Portfolio
The information on this page is intended to help you understand your ongoing costs of investing in the portfolio.
The table below reflects the fact that no fees or expenses are charged to the portfolio. Participants in the wrap fee programs eligible to invest in the portfolio pay an asset-based fee, which is negotiable, for investment services, brokerage services and investment consultation. Please read the wrap program documents for information regarding fees charged.
The information in the following table is based on an initial investment of $1,000, which is invested at the beginning of the period and held for the entire period. The amount listed in the "Actual" column is calculated using the portfolio's actual total return for the period. The amount listed in the "Hypothetical" column is calculated using a hypothetical annual return of 5%. You should not use the hypothetical account value to estimate your actual account balance.
| | | Account value at the
beginning of the period ($)
10/01/08 | | Account value at the
end of the period ($)
03/31/09 | | Expenses paid
during the period* | |
| | Actual | | Hypothetical | | Actual | | Hypothetical | | Actual | | Hypothetical | |
| | | 1,000.00 | | | | 1,000.00 | | | | 1,029.32 | | | | 1,024.93 | | | | — | | | | — | | |
* No fees or expenses are charged to the portfolio. Participants in wrap fee programs pay an asset-based fee that is not included in this table.
5
Portfolio Manager's Report – Corporate Bond Portfolio
Performance data quoted represents past performance and current performance may be lower or higher. Past performance is no guarantee of future results. The investment return and principal value will fluctuate so that shares, when redeemed, may be worth more or less than the original cost. Please call 1-800-345-6611 for daily and most recent month-end performance updates.
Net asset value per share
as of 03/31/09 ($) 8.64
Distributions declared per share
04/01/08 – 03/31/09 ($) 0.57
For the 12-month period that ended March 31, 2009, the portfolio returned negative 4.65%, compared with negative 5.21% for its benchmark, the Barclays Capital U.S. Credit Bond Index.1 Sector weights, security selection and the portfolio's increasingly defensive positioning combined to shore up comparative returns. Lower quality assets were laggards during this troubled period.
Flight to quality left corporates behind
The portfolio's core commitment to investment-grade corporate bonds accounted for the period's negative return. As the economic outlook darkened over the summer and fall, credit fears, waves of layoffs and declining earnings drove market participants to shun risk. Corporate issues were sold off almost indiscriminately, with declines worsening down the ratings spectrum. Investors flooded the Treasury and agency markets despite high valuations and near-negligible yields. The portfolio had no representation in these government-related market segments, which were the period's best-performers.
The financials sector came under intense pressure as several legendary firms failed or were forced to merge, and major banks were forced to seek government bailouts as they wrestled with depressed assets tied to subprime mortgages. The portfolio had less exposure to this volatile sector than the index, which benefited relative returns. Good security selection, emphasizing higher-quality insurance companies and regional banks, also helped shore up returns. Two bank holdings, Bank of New York Mellon Corp. and Northern Trust Corp. contributed positive returns. As part of a broader defensive strategy, the portfolio was overweight in the utilities sector, which was more resilient to the selloff. Bonds of pipeline companies fell as energy prices declined dramatically.
Some underweights helped comparative results
The portfolio had less exposure than its benchmark to consumer-sensitive and industrial securities, which benefited relative terms. Consumer spending has been hobbled by falling home values and unemployment fears, and the sagging global economy reduced demand for industrial products.
We reduced exposure to the financials sector late in the first quarter. Bank holdings were pared back in favor of well-capitalized non-bank finance companies, including MetLife, Inc. and New York Life Global Funding. There were no other noteworthy shifts in sector allocations.
Looking ahead
We believe that an economic upturn will be slow in arriving and is most likely to come about gradually. Further contraction is not out of the question if credit conditions stay
1Barclays Capital U.S. Credit Bond Index is an index of publicly issued investment grade corporate securities and dollar-denominated SEC registered global debentures. Indices are not available for investment, and do not reflect sales charges, fees, brokerage commissions, taxes or other expenses of investing. Securities in the portfolio may not match those in an index.
6
Portfolio Manager's Report (continued) – Corporate Bond Portfolio
tight, businesses remain cautious and consumers are unable or unwilling to increase spending. We also expect earnings to recover slowly, triggering more market volatility in corporate sectors. However, corporate and high-yield bonds are trading at attractive valuations, with prospects of a slow recovery apparently built into recent lower prices.
Portfolio holdings and characteristics are subject to change periodically and may not be representative of current holdings and characteristics. The outlook for this portfolio may differ from that presented for other Columbia Funds.
Investing in fixed-income securities may involve certain risks, including the credit quality of individual issuers, possible prepayments, market or economic developments and yields and share price fluctuations due to changes in interest rates. When interest rates go up, bond prices typically drop, and vice versa.
Top 10 holdings
as of 03/31/09 (%)
International Bank for
Reconstruction & Development,
5.000% 04/01/16 | | | 3.0 | | |
Citigroup Inc.,
6.500% 08/19/13 | | | 2.3 | | |
Abbott Laboratories,
5.600% 05/15/11 | | | 2.2 | | |
Exelon Generation Co. LLC,
6.200% 10/01/17 | | | 2.1 | | |
Union Pacific Corp.,
6.650% 01/15/11 | | | 2.1 | | |
Time Warner Inc.,
6.875% 05/01/12 | | | 1.9 | | |
Oracle Corp.,
5.000% 01/15/11 | | | 1.9 | | |
Anheuser-Busch, InBev
Worldwide, Inc.
7.750% 01/15/19 | | | 1.8 | | |
Capital One Financial Corp.,
5.700% 09/15/11 | | | 1.8 | | |
Eaton Vance Corp.,
6.500% 10/02/17 | | | 1.7 | | |
Portfolio structure
as of 03/31/09 (%)
Corporate Fixed-Income
Bonds & Notes | | | 94.4 | | |
Government & Agency
Obligations | | | 4.6 | | |
| Other assets & liabilities, net | | | 1.0 | | |
Holdings discussed in this report
as of 3/31/09 (%)
Bank of New York
Mellon Corp. | | | 0.7 | | |
| Northern Trust Corp. | | | 0.7 | | |
| MetLife, Inc. | | | 0.9 | | |
| New York Life Global Funding | | | 0.7 | | |
The portfolio is actively managed and the composition of its portfolio will change over time. Information provided is calculated as a percentage of net assets.
7
Portfolio Profile – Mortgage- and Asset-Backed Portfolio
Performance data quoted represents past performance and current performance may be lower or higher. Past performance is no guarantee of future results. The investment return and principal value will fluctuate so that shares, when redeemed, may be worth more or less than the original cost. Please call 1-800-345-6611 for daily and most recent month-end performance updates.
Summary
1-year return as of 03/31/09
| | | | | +0.10% | |
|
| |  | | | Portfolio Performance | |
|
| | | | | +4.86% | |
|
| |  | | | Barclays Capital
U.S. Securitized Index | |
|
Summary
g For the 12-month period that ended March 31, 2009, the portfolio returned 0.10%.
g An above-average commitment to commercial mortgage-backed securities hurt performance relative to the portfolio's benchmark, the Barclays Capital U.S. Securitized Index.1
g The credit quality of the portfolio has steadily gone up over the past year through selective replacement and retirement of below-grade issues.
Portfolio Management
Lee Reddin has co-managed the portfolio since December 2007 and has been associated with the advisor or its predecessors or affiliate organizations since 2000.
Michael Zazzarino has co-managed the portfolio since December 2007 and has been associated with the advisor or its predecessors or affiliate organizations since 2005.
1The Barclays Capital U.S. Securitized Index is the largest component of the U.S. Aggregate Index and consists of the U.S. MBS Index, the ERISA-Eligible CMBS Index, and the fixed-rate ABS Index. As of April 1, 2007, the U.S. MBS Index will include both fixed-rate agency passthroughs and agency hybrid ARM securities. Indices are not available for investment, and do not reflect sales charges, fees, brokerage commissions, taxes or other expenses of investing. Securities in the portfolio may not match those in an index.
8
Performance Information – Mortgage- and Asset-Backed Portfolio
Performance of a $10,000 investment 08/30/02 – 03/31/09
The chart above shows the change in value of a hypothetical $10,000 investment in the Mortgage- and Asset-Backed Portfolio during the stated time period, and does not reflect the deduction of taxes that a shareholder may pay on Portfolio distributions or on the redemption of Portfolio shares. The Barclays Capital U.S. Securitized Index is the largest component of the U.S. Aggregate Index and consists of the U.S. MBS Index, the ERISA-Eligible CMBS Index, and the fixed-rate ABS Index. As of April 1, 2007, the U.S. MBS Index will include both fixed-rate agency passthroughs and agency hybrid ARM securities. Indices are not available for investment, and do not reflect sales charges, fees, brokerage commissions, taxes or other expenses of investing. Securities in the portfolio may not match those in an index.
Performance of a $10,000 investment 08/30/02 – 03/31/09 ($)
| Portfolio | | | 11,912 | | |
| Barclays Capital U.S. Securitized Index | | | 13,641 | | |
Performance data quoted represents past performance and current performance may be lower or higher. Past performance is no guarantee of future results. The investment return and principal value will fluctuate so that shares, when redeemed, may be worth more or less than the original cost. Please call 1-800-345-6611 for daily and most recent month-end performance updates.
Average annual total return as of 03/31/09 (%)
| Inception | | 08/30/02 | |
| 1-year | | | 0.10 | | |
| 5-year | | | 2.22 | | |
| Life | | | 2.69 | | |
No fees or expenses are charged to the portfolio. Participants in the wrap fee programs eligible to invest in the portfolio, however, pay an asset-based fee, which is negotiable, for investment services, brokerage services and investment consultation. The portfolio may incur significant costs that are in addition to the wrap fees paid to the program sponsor that are not included in this table. All results shown assume reinvestment of distributions.
The table does not reflect the deduction of taxes that a shareholder may pay on portfolio distributions or on the redemption of portfolio shares.
9
Understanding Your Expenses – Mortgage- and Asset-Backed Portfolio
The information on this page is intended to help you understand your ongoing costs of investing in the portfolio.
The table below reflects the fact that no fees or expenses are charged to the portfolio. Participants in the wrap fee programs eligible to invest in the portfolio pay an asset-based fee, which is negotiable, for investment services, brokerage services and investment consultation. Please read the wrap program documents for information regarding fees charged.
The information in the following table is based on an initial investment of $1,000, which is invested at the beginning of the period and held for the entire period. The amount listed in the "Actual" column is calculated using the portfolio's actual total return for the period. The amount listed in the "Hypothetical" column is calculated using a hypothetical annual return of 5%. You should not use the hypothetical account value to estimate your actual account balance.
| | | Account value at the
beginning of the period ($)
10/01/08 | | Account value at the
end of the period ($)
03/31/09 | | Expenses paid
during the period* | |
| | Actual | | Hypothetical | | Actual | | Hypothetical | | Actual | | Hypothetical | |
| | | 1,000.00 | | | | 1,000.00 | | | | 1,022.29 | | | | 1,024.93 | | | | — | | | | — | | |
* No fees or expenses are charged to the portfolio. Participants in wrap fee programs pay an asset-based fee that is not included in this table.
10
Portfolio Managers' Report – Mortgage- and Asset-Backed Portfolio
For the 12-month period that ended March 31, 2009, the portfolio returned 0.10%, compared with 4.86% for its benchmark, the Barclays Capital U.S. Securitized Index.1 The portfolio's underperformance can be traced to its overweight position in commercial mortgage-backed securities (CMBS), which lagged the broader market for most of the reporting period.
A challenging investment environment
During the past 12 months, mortgage-backed and asset-backed securities faced an extremely challenging investment environment. Overly abundant mortgage money was one of the precipitants of the financial crisis that began in 2007, and as the period wore on investors became less confident about a wider range of securitized investments and the quality of underlying collateral. Treasury securities were the big winners, while yields spiked and liquidity dried up for many asset classes of lesser quality. The portfolio was especially hurt by its overweight position in CMBS, to which it devoted about 12% of total assets, as opposed to the 8% position represented in the index.
Although CMBS were a drag on overall results, the extent of the losses was kept in check because the credit quality of the portfolio's investments in this sector was well above average. We sought to improve the credit quality of the portfolio throughout the period, selling as many BBB credit card assets,2 subprime mortgages and other high-yield securities as we could in an illiquid market. We used other types of hedging maneuvers in different asset classes. Toward the end of 2008, for example, the portfolio adopted a "down in coupon" strategy with respect to most of its mortgage holdings, especially residential mortgages. We made this move because we believe that the prepayment risk of higher-coupon mortgage pools would go up as the Treasury bought back mortgages and the Federal Reserve's push for lower short-term rates would increase refinancing activity. In this scenario, we preferred mortgage pools with rates of 4% to 4.5%, with anything in the 6% range considered too vulnerable to prepayment.
As we proceeded with the down-in-coupon strategy in early 2009, most of the non-Treasury segments of the fixed-income market staged an impressive rebound. We did some selective buying of CMBS and asset-backed securities during this period, restricting ourselves to higher quality names but also seeking to replenish some of the current yield that we were sacrificing because of our focus on lower-coupon mortgage pools.
1The Barclays Capital U.S. Securitized Index is the largest component of the U.S. Aggregate Index and consists of the U.S. MBS Index, the ERISA-Eligible CMBS Index, and the fixed-rate ABS Index. As of April 1, 2007, the U.S. MBS Index will include both fixed-rate agency passthroughs and agency hybrid ARM securities. Indices are not available for investment, and do not reflect sales charges, fees, brokerage commissions, taxes or other expenses of investing. Securities in the portfolio may not match those in an index.
2The credit quality ratings represent those of Moody's Investors Service, Inc. ("Moody's") or Standard & Poor's Corporation ("S&P") credit ratings. The ratings represent their opinions as to the quality of the securities they rate. Ratings are relative and subjective and are not absolute standards of quality. The security's credit quality does not eliminate risk.
Performance data quoted represents past performance and current performance may be lower or higher. Past performance is no guarantee of future results. The investment return and principal value will fluctuate so that shares, when redeemed, may be worth more or less than the original cost. Please call 1-800-345-6611 for daily and most recent month-end performance updates.
Net asset value per share
as of 03/31/09 ($) 8.88
Distributions declared per share
04/01/08 – 03/31/09 ($) 0.44
11
Portfolio Managers' Report (continued) – Mortgage- and Asset-Backed Portfolio
Top 10 holdings
as of 03/31/09 (%)
U.S. Treasury Bill
0.090% 04/09/09 | | | 17.7 | | |
Federal National Mortgage
Association, 4.500% 02/01/39 | | | 7.6 | | |
Federal Home Loan Mortgage
Corp., 6.500% 10/01/37 | | | 7.2 | | |
Federal National Mortgage
Association, 6.000% 09/01/36 | | | 6.5 | | |
Federal Home Loan Mortgage
Corp., 5.500% 05/01/37 | | | 5.7 | | |
Federal National Mortgage
Association, 4.000% 03/01/39 | | | 5.7 | | |
Federal Home Loan Mortgage
Corp., 5.000% 06/01/37 | | | 4.6 | | |
Federal National Mortgage
Association, TBA,
4.500% 04/01/39 | | | 4.2 | | |
Federal Home Loan Mortgage
Corp., 6.500% 01/01/39 | | | 3.9 | | |
Federal National Mortgage
Association, 5.500% 04/01/37 | | | 3.7 | | |
Portfolio structure
as of 03/31/09 (%)
| Mortgage-Backed Securities | | | 62.7 | | |
Government & Agency
Obligations | | | 17.7 | | |
Commercial Mortgage-
Backed Securities | | | 12.1 | | |
| Asset-Backed Securities | | | 8.3 | | |
Corporate Fixed-Income
Bonds & Notes | | | 3.1 | | |
Collateralized Mortgage
Obligations | | | 0.8 | | |
Cash equivalents, net other
assets & liabilities | | | (4.7) | | |
The portfolio is actively managed and the composition of its portfolio will change over time. Portfolio structure and top holdings are calculated as a percentage of net assets.
Looking ahead
As a result of our year-long efforts to improve the portfolio's credit quality, it enters the new reporting period with only a handful of illiquid and/or non-performing residual assets. The vast majority of CMBS and asset-backed securities held by the portfolio now carry AAA credit ratings, and our confidence in the issuers is such that we would consider increasing these positions should their yield advantage widen in the months ahead. Finally, our recent asset allocation decisions have recognized the fact that the Treasury has become an active player throughout the fixed-income markets, and whenever possible we have positioned the portfolio with the potential to benefit from government-sponsored programs.
Portfolio holdings and characteristics are subject to change periodically and may not be representative of current holdings and characteristics. The outlook for the portfolio may differ from that presented for other Columbia Funds.
Investing in fixed-income securities may involve certain risks, including the credit quality of individual issuers, possible prepayments, market or economic developments and yields and share price fluctuations due to changes in interest rates. When interest rates go up, bond prices typically drop, and vice versa.
12
Investment Portfolio – Corporate Bond Portfolio
March 31, 2009
| Corporate Fixed-Income Bonds & Notes – 94.4% | |
| | | Par ($) | | Value ($) | |
| Basic Materials – 2.3% | |
| Chemicals – 0.8% | |
| Lubrizol Corp. | |
| 6.500% 10/01/34 | | | 200,000 | | | | 152,730 | | |
| Chemicals Total | | | 152,730 | | |
| Iron/Steel – 1.5% | |
| Nucor Corp. | |
| 5.000% 06/01/13 | | | 180,000 | | | | 188,373 | | |
| 5.850% 06/01/18 | | | 110,000 | | | | 109,836 | | |
| Iron/Steel Total | | | 298,209 | | |
| Basic Materials Total | | | 450,939 | | |
| Communications – 10.6% | |
| Media – 5.3% | |
| Comcast Cable Holdings LLC | |
| 9.875% 06/15/22 | | | 72,000 | | | | 81,099 | | |
| Comcast Corp. | |
| 5.700% 05/15/18 | | | 45,000 | | | | 42,208 | | |
| 6.300% 11/15/17 | | | 50,000 | | | | 48,651 | | |
| 6.950% 08/15/37 | | | 135,000 | | | | 125,714 | | |
| Rogers Cable, Inc. | |
| 6.250% 06/15/13 | | | 6,000 | | | | 6,037 | | |
| Time Warner Cable, Inc. | |
| 7.300% 07/01/38 | | | 175,000 | | | | 158,125 | | |
| Time Warner, Inc. | |
| 6.875% 05/01/12 | | | 360,000 | | | | 366,408 | | |
| Viacom, Inc. | |
| 5.750% 04/30/11 | | | 105,000 | | | | 102,287 | | |
| 6.875% 04/30/36 | | | 145,000 | | | | 105,793 | | |
| Media Total | | | 1,036,322 | | |
| Telecommunication Services – 5.3% | |
| AT&T, Inc. | |
| 5.625% 06/15/16 | | | 130,000 | | | | 130,285 | | |
| 6.550% 02/15/39 | | | 135,000 | | | | 122,443 | | |
Deutsche Telekom International
Finance BV | |
| 8.500% 06/15/10 | | | 30,000 | | | | 31,338 | | |
| Telefonica Emisiones SAU | |
| 6.221% 07/03/17 | | | 100,000 | | | | 102,481 | | |
| 6.421% 06/20/16 | | | 190,000 | | | | 196,447 | | |
| Verizon Wireless Capital LLC | |
| 5.550% 02/01/14 (a) | | | 310,000 | | | | 310,259 | | |
| 8.500% 11/15/18 (a) | | | 125,000 | | | | 142,790 | | |
| Telecommunication Services Total | | | 1,036,043 | | |
| Communications Total | | | 2,072,365 | | |
| | | Par ($) | | Value ($) | |
| Consumer Cyclical – 4.8% | |
| Airlines – 0.4% | |
| Continental Airlines, Inc. | |
| 7.461% 04/01/15 | | | 98,239 | | | | 68,767 | | |
| Airlines Total | | | 68,767 | | |
| Home Builders – 0.0% | |
| D.R. Horton, Inc. | |
| 5.625% 09/15/14 | | | 10,000 | | | | 7,850 | | |
| Home Builders Total | | | 7,850 | | |
| Restaurants – 1.0% | |
| McDonald's Corp. | |
| 5.000% 02/01/19 | | | 25,000 | | | | 26,002 | | |
| 5.700% 02/01/39 | | | 165,000 | | | | 159,922 | | |
| Restaurants Total | | | 185,924 | | |
| Retail – 3.4% | |
| Best Buy Co., Inc. | |
| 6.750% 07/15/13 | | | 240,000 | | | | 228,345 | | |
| CVS Pass-Through Trust | |
| 5.298% 01/11/27 (a) | | | 118,197 | | | | 85,787 | | |
| 6.036% 12/10/28 (a) | | | 217,910 | | | | 163,761 | | |
| Macy's Retail Holdings, Inc. | |
| 5.350% 03/15/12 | | | 30,000 | | | | 23,549 | | |
| Starbucks Corp. | |
| 6.250% 08/15/17 | | | 180,000 | | | | 167,874 | | |
| Retail Total | | | 669,316 | | |
| Consumer Cyclical Total | | | 931,857 | | |
| Consumer Non-Cyclical – 9.6% | |
| Beverages – 2.3% | |
| Anheuser-Busch InBev Worldwide, Inc. | |
| 7.750% 01/15/19 (a)(b) | | | 355,000 | | | | 353,971 | | |
| Bottling Group LLC | |
| 5.125% 01/15/19 | | | 85,000 | | | | 85,547 | | |
| PepsiCo, Inc. | |
| 7.900% 11/01/18 | | | 10,000 | | | | 12,286 | | |
| Beverages Total | | | 451,804 | | |
| Food – 1.7% | |
| Campbell Soup Co. | |
| 4.500% 02/15/19 | | | 125,000 | | | | 124,593 | | |
| ConAgra Foods, Inc. | |
| 7.000% 10/01/28 | | | 75,000 | | | | 72,528 | | |
| Kraft Foods, Inc. | |
| 6.500% 08/11/17 | | | 100,000 | | | | 102,974 | | |
| Kroger Co. | |
| 8.000% 09/15/29 | | | 25,000 | | | | 26,870 | | |
| Food Total | | | 326,965 | | |
See Accompanying Notes to Financial Statements.
13
Corporate Bond Portfolio
March 31, 2009
| Corporate Fixed-Income Bonds & Notes (continued) | |
| | | Par ($) | | Value ($) | |
| Healthcare Services – 0.5% | |
| WellPoint, Inc. | |
| 7.000% 02/15/19 | | | 90,000 | | | | 90,049 | | |
| Healthcare Services Total | | | 90,049 | | |
| Household Products/Wares – 0.8% | |
| Clorox Co. | |
| 5.950% 10/15/17 | | | 70,000 | | | | 69,125 | | |
| Fortune Brands, Inc. | |
| 5.125% 01/15/11 | | | 90,000 | | | | 88,328 | | |
| Household Products/Wares Total | | | 157,453 | | |
| Pharmaceuticals – 4.3% | |
| Abbott Laboratories | |
| 5.600% 05/15/11 | | | 395,000 | | | | 423,534 | | |
| Novartis Securities Investment Ltd. | |
| 5.125% 02/10/19 | | | 185,000 | | | | 187,835 | | |
| Wyeth | |
| 5.500% 02/01/14 | | | 225,000 | | | | 236,344 | | |
| Pharmaceuticals Total | | | 847,713 | | |
| Consumer Non-Cyclical Total | | | 1,873,984 | | |
| Energy – 11.7% | |
| Oil & Gas – 5.0% | |
| Canadian Natural Resources Ltd. | |
| 6.250% 03/15/38 | | | 240,000 | | | | 184,860 | | |
| Devon Energy Corp. | |
| 6.300% 01/15/19 | | | 70,000 | | | | 68,297 | | |
| Hess Corp. | |
| 7.300% 08/15/31 | | | 95,000 | | | | 82,641 | | |
| Marathon Oil Corp. | |
| 6.000% 07/01/12 | | | 25,000 | | | | 25,401 | | |
| 6.000% 10/01/17 | | | 160,000 | | | | 148,288 | | |
| 7.500% 02/15/19 | | | 60,000 | | | | 60,449 | | |
| Nexen, Inc. | |
| 5.875% 03/10/35 | | | 160,000 | | | | 105,859 | | |
| Qatar Petroleum | |
| 5.579% 05/30/11 (a) | | | 50,004 | | | | 49,804 | | |
| Talisman Energy, Inc. | |
| 5.850% 02/01/37 | | | 190,000 | | | | 128,234 | | |
| Valero Energy Corp. | |
| 6.625% 06/15/37 | | | 160,000 | | | | 113,101 | | |
| Oil & Gas Total | | | 966,934 | | |
| Oil & Gas Services – 2.2% | |
| Halliburton Co. | |
| 5.900% 09/15/18 (b) | | | 265,000 | | | | 272,918 | | |
| Smith International, Inc. | |
| 9.750% 03/15/19 | | | 95,000 | | | | 99,234 | | |
| Weatherford International Ltd. | |
| 5.150% 03/15/13 | | | 70,000 | | | | 65,130 | | |
| Oil & Gas Services Total | | | 437,282 | | |
| | | Par ($) | | Value ($) | |
| Pipelines – 4.5% | |
| Enbridge Energy Partners LP | |
| 7.500% 04/15/38 | | | 80,000 | | | | 63,774 | | |
| Kinder Morgan Energy Partners LP | |
| 6.950% 01/15/38 | | | 115,000 | | | | 98,406 | | |
| ONEOK Partners LP | |
| 6.850% 10/15/37 | | | 90,000 | | | | 68,989 | | |
| Plains All American Pipeline LP | |
| 6.500% 05/01/18 | | | 365,000 | | | | 315,478 | | |
| TEPPCO Partners LP | |
| 7.625% 02/15/12 | | | 136,000 | | | | 134,583 | | |
| TransCanada Pipelines Ltd. | |
| 6.350% 05/15/67 (c) | | | 345,000 | | | | 196,650 | | |
| Pipelines Total | | | 877,880 | | |
| Energy Total | | | 2,282,096 | | |
| Financials – 29.9% | |
| Banks – 18.6% | |
| Bank of New York Mellon Corp. | |
| 5.125% 08/27/13 | | | 125,000 | | | | 127,939 | | |
| Capital One Capital IV | |
| 6.745% 02/17/37 (c) | | | 225,000 | | | | 76,726 | | |
| Capital One Financial Corp. | |
| 5.700% 09/15/11 | | | 390,000 | | | | 351,150 | | |
| Chinatrust Commercial Bank | |
| 5.625% 12/29/49 (a)(c) | | | 45,000 | | | | 20,401 | | |
| Citicorp Lease Pass-Through Trust | |
| 8.040% 12/15/19 (a) | | | 250,000 | | | | 234,717 | | |
| Citigroup, Inc. | |
| 4.125% 02/22/10 | | | 240,000 | | | | 231,650 | | |
| Citigroup, Inc. | |
| 6.500% 08/19/13 | | | 480,000 | | | | 441,079 | | |
| Comerica Bank | |
| 5.200% 08/22/17 | | | 250,000 | | | | 173,379 | | |
| Goldman Sachs Capital II | |
| 5.793% 12/29/49 (c) | | | 60,000 | | | | 24,980 | | |
| Goldman Sachs Group, Inc. | |
| 6.750% 10/01/37 | | | 35,000 | | | | 23,672 | | |
| HSBC Holdings PLC | |
| 6.800% 06/01/38 | | | 290,000 | | | | 246,596 | | |
| 7.350% 11/27/32 | | | 53,000 | | | | 42,222 | | |
| JPMorgan Chase & Co. | |
| 6.000% 01/15/18 | | | 120,000 | | | | 121,210 | | |
| KeyBank NA | |
| 5.800% 07/01/14 | | | 250,000 | | | | 209,084 | | |
| Keycorp | |
| 6.500% 05/14/13 | | | 275,000 | | | | 268,355 | | |
| M&I Marshall & Ilsley Bank | |
| 5.300% 09/08/11 | | | 155,000 | | | | 143,235 | | |
See Accompanying Notes to Financial Statements.
14
Corporate Bond Portfolio
March 31, 2009
| Corporate Fixed-Income Bonds & Notes (continued) | |
| | | Par ($) | | Value ($) | |
| Merrill Lynch & Co., Inc. | |
| 6.050% 08/15/12 (d) | | | 35,000 | | | | 30,032 | | |
| National City Corp. | |
| 4.900% 01/15/15 | | | 15,000 | | | | 13,800 | | |
| 6.875% 05/15/19 | | | 175,000 | | | | 148,160 | | |
| Northern Trust Co. | |
| 6.500% 08/15/18 | | | 180,000 | | | | 189,124 | | |
| Northern Trust Corp. | |
| 5.500% 08/15/13 | | | 125,000 | | | | 130,825 | | |
| Regions Financial Corp. | |
| 7.750% 09/15/24 | | | 32,000 | | | | 24,274 | | |
| Regions Financing Trust II | |
| 6.625% 05/15/47 (c) | | | 75,000 | | | | 27,167 | | |
| Scotland International Finance No. 2 | |
| 4.250% 05/23/13 (a) | | | 127,000 | | | | 101,146 | | |
| Union Planters Corp. | |
| 4.375% 12/01/10 | | | 120,000 | | | | 114,696 | | |
| Wachovia Corp. | |
| 4.375% 06/01/10 | | | 135,000 | | | | 131,198 | | |
| Banks Total | | | 3,646,817 | | |
| Diversified Financial Services – 5.3% | |
| Eaton Vance Corp. | |
| 6.500% 10/02/17 | | | 390,000 | | | | 334,585 | | |
| Fund American Companies, Inc. | |
| 5.875% 05/15/13 | | | 110,000 | | | | 84,451 | | |
| General Electric Capital Corp. | |
| 5.450% 01/15/13 | | | 190,000 | | | | 182,972 | | |
| 6.875% 01/10/39 | | | 255,000 | | | | 207,975 | | |
| International Lease Finance Corp. | |
| 4.750% 07/01/09 | | | 40,000 | | | | 37,604 | | |
| 4.875% 09/01/10 | | | 175,000 | | | | 127,839 | | |
| Lehman Brothers Holdings, Inc. | |
| 5.625% 01/24/13 (e)(f) | | | 370,000 | | | | 47,175 | | |
| 6.875% 05/02/18 (e)(f) | | | 45,000 | | | | 5,737 | | |
| Diversified Financial Services Total | | | 1,028,338 | | |
| Insurance – 4.2% | |
| ING Groep NV | |
| 5.775% 12/29/49 (c) | | | 85,000 | | | | 23,375 | | |
| Liberty Mutual Group, Inc. | |
| 7.500% 08/15/36 (a) | | | 285,000 | | | | 160,107 | | |
| MetLife, Inc. | |
| 7.717% 02/15/19 | | | 190,000 | | | | 170,366 | | |
| New York Life Global Funding | |
| 4.650% 05/09/13 (a) | | | 140,000 | | | | 136,329 | | |
| Principal Life Income Funding Trusts | |
| 5.300% 04/24/13 | | | 350,000 | | | | 321,540 | | |
| Insurance Total | | | 811,717 | | |
| Real Estate Investment Trusts (REITs) – 1.8% | |
| Camden Property Trust | |
| 5.375% 12/15/13 | | | 199,000 | | | | 151,908 | | |
| | | Par ($) | | Value ($) | |
| Highwoods Properties, Inc. | |
| 5.850% 03/15/17 | | | 55,000 | | | | 34,010 | | |
| Hospitality Properties Trust | |
| 5.625% 03/15/17 | | | 140,000 | | | | 67,513 | | |
| Liberty Property LP | |
| 5.500% 12/15/16 | | | 160,000 | | | | 103,360 | | |
| Real Estate Investment Trusts (REITs) Total | | | 356,791 | | |
| Financials Total | | | 5,843,663 | | |
| Industrials – 9.2% | |
| Aerospace & Defense – 1.8% | |
| Boeing Co. | |
| 6.000% 03/15/19 | | | 100,000 | | | | 102,708 | | |
| Raytheon Co. | |
| 5.375% 04/01/13 | | | 245,000 | | | | 257,045 | | |
| Aerospace & Defense Total | | | 359,753 | | |
| Machinery – 2.1% | |
| Caterpillar Financial Services Corp. | |
| 4.250% 02/08/13 | | | 195,000 | | | | 183,471 | | |
| Caterpillar, Inc. | |
| 8.250% 12/15/38 | | | 115,000 | | | | 124,602 | | |
| John Deere Capital Corp. | |
| 4.950% 12/17/12 | | | 95,000 | | | | 95,355 | | |
| Machinery Total | | | 403,428 | | |
| Miscellaneous Manufacturing – 1.0% | |
| General Electric Co. | |
| 5.000% 02/01/13 | | | 198,000 | | | | 198,022 | | |
| Miscellaneous Manufacturing Total | | | 198,022 | | |
| Transportation – 4.3% | |
| BNSF Funding Trust I | |
| 6.613% 12/15/55 (c) | | | 130,000 | | | | 94,250 | | |
| Burlington Northern Santa Fe Corp. | |
| 6.200% 08/15/36 | | | 50,000 | | | | 45,601 | | |
| 7.950% 08/15/30 | | | 115,000 | | | | 125,786 | | |
| Union Pacific Corp. | |
| 4.698% 01/02/24 | | | 10,165 | | | | 9,163 | | |
| 5.700% 08/15/18 | | | 165,000 | | | | 157,053 | | |
| 6.650% 01/15/11 | | | 385,000 | | | | 401,298 | | |
| Transportation Total | | | 833,151 | | |
| Industrials Total | | | 1,794,354 | | |
| Technology – 2.5% | |
| Networking – 0.7% | |
| Cisco Systems, Inc. | |
| 5.900% 02/15/39 | | | 150,000 | | | | 137,823 | | |
| Networking Total | | | 137,823 | | |
See Accompanying Notes to Financial Statements.
15
Corporate Bond Portfolio
March 31, 2009
| Corporate Fixed-Income Bonds & Notes (continued) | |
| | | Par ($) | | Value ($) | |
| Software – 1.8% | |
| Oracle Corp. | |
| 5.000% 01/15/11 | | | 345,000 | | | | 361,695 | | |
| Software Total | | | 361,695 | | |
| Technology Total | | | 499,518 | | |
| Utilities – 13.8% | |
| Electric – 11.9% | |
| AEP Texas Central Co. | |
| 6.650% 02/15/33 | | | 160,000 | | | | 136,087 | | |
| Columbus Southern Power Co. | |
| 6.600% 03/01/33 | | | 41,000 | | | | 35,622 | | |
| Commonwealth Edison Co. | |
| 4.700% 04/15/15 | | | 50,000 | | | | 45,715 | | |
| 5.900% 03/15/36 | | | 95,000 | | | | 77,795 | | |
| 5.950% 08/15/16 | | | 80,000 | | | | 76,611 | | |
| 6.950% 07/15/18 | | | 95,000 | | | | 88,912 | | |
| Duke Energy Corp. | |
| 5.300% 10/01/15 | | | 285,000 | | | | 294,539 | | |
| Exelon Generation Co. LLC | |
| 6.200% 10/01/17 | | | 470,000 | | | | 420,265 | | |
| Kansas City Power & Light Co. | |
| 7.150% 04/01/19 | | | 250,000 | | | | 251,130 | | |
| MidAmerican Energy Holdings Co. | |
| 5.000% 02/15/14 | | | 197,000 | | | | 197,174 | | |
| 6.125% 04/01/36 | | | 70,000 | | | | 62,077 | | |
| Oncor Electric Delivery Co. | |
| 5.950% 09/01/13 (a) | | | 155,000 | | | | 150,165 | | |
| Pacific Gas & Electric Co. | |
| 4.200% 03/01/11 | | | 190,000 | | | | 192,933 | | |
| Progress Energy, Inc. | |
| 7.100% 03/01/11 | | | 120,000 | | | | 124,403 | | |
| Southern Power Co. | |
| 6.375% 11/15/36 | | | 45,000 | | | | 37,030 | | |
| Windsor Financing LLC | |
| 5.881% 07/15/17 (a) | | | 149,829 | | | | 132,474 | | |
| Electric Total | | | 2,322,932 | | |
| Gas – 1.9% | |
| Atmos Energy Corp. | |
| 6.350% 06/15/17 | | | 100,000 | | | | 89,724 | | |
| 8.500% 03/15/19 | | | 115,000 | | | | 117,417 | | |
| Nakilat, Inc. | |
| 6.067% 12/31/33 (a) | | | 260,000 | | | | 175,895 | | |
| Gas Total | | | 383,036 | | |
| Utilities Total | | | 2,705,968 | | |
Total Corporate Fixed-Income Bonds & Notes
(cost of $20,656,430) | | | 18,454,744 | | |
| Government & Agency Obligations – 4.6% | |
| | | Par ($) | | Value ($) | |
| Foreign Government Obligations – 4.6% | |
| International Bank for Reconstruction & Development | |
| 5.000% 04/01/16 | | | 535,000 | | | | 582,031 | | |
| Province of Ontario | |
| 3.375% 05/20/11 | | | 115,000 | | | | 117,294 | | |
| Province of Quebec | |
| 5.125% 11/14/16 | | | 200,000 | | | | 206,748 | | |
| Foreign Government Obligations Total | | | 906,073 | | |
Total Government & Agency Obligations
(cost of $897,576) | | | 906,073 | | |
| Securities Lending Collateral – 0.0% | |
State Street Navigator Securities
Lending Prime Portfolio (g)
(7 day yield of 0.943%) | | | 4,100 | | | | 4,100 | | |
Total Securities Lending Collateral
(cost of $4,100) | | | 4,100 | | |
Total Investments – 99.0%
(cost of $21,558,106) (h) | | | 19,364,917 | | |
Obligation to Return Collateral
for Securities Loaned – (0.0)% | | | (4,100 | ) | |
| Other Assets & Liabilities, Net – 1.0% | | | 193,795 | | |
| Net Assets – 100.0% | | | 19,554,612 | | |
Notes to Investment Portfolio:
On April 1, 2008, the Portfolio adopted Statement of Financial Accounting Standards No. 157, Fair Value Measurements ("SFAS 157"). SFAS 157 establishes a hierarchy that prioritizes the inputs to valuation techniques used to measure fair value giving the highest priority to unadjusted quoted prices in active markets for identical securities (level 1 measurements) and the lowest priority to unobservable inputs (level 3 measurements) when market prices are not readily available or reliable. The three levels of the fair value hierarchy under SFAS 157 are described below:
• Level 1 – quoted prices in active markets for identical securities
• Level 2 – prices determined using other significant observable inputs (including quoted prices for similar securities, interest rates, prepayment speeds, credit risk and others)
• Level 3 – prices determined using significant unobservable inputs. In situations where quoted prices or observable inputs are unavailable or less reliable, unobservable inputs may be used. Unobservable inputs may include management's own assumptions about the factors market participants would use in pricing an investment.
The inputs or methodology used for valuing securities are not necessarily an indication of the risk associated with investing in those securities.
See Accompanying Notes to Financial Statements.
16
Corporate Bond Portfolio
March 31, 2009
The following table summarizes the inputs used, as of March 31, 2009 in valuing the Portfolio's assets:
| Valuation Inputs | | Investments in
Securities | | Other Financial
Instruments* | |
| Level 1 – Quoted Prices | | $ | 4,100 | | | $ | – | | |
Level 2 – Other Significant
Observable Inputs | | | 19,292,050 | | | | (51,563 | ) | |
Level 3 – Significant
Unobservable Inputs | | | 68,767 | | | | – | | |
| Total | | $ | 19,364,917 | | | $ | (51,563 | ) | |
* Other financial instruments consist of credit default swap contracts which are not included in the investment portfolio.
The Portfolio's assets assigned to the Level 2 input category include certain foreign securities for which a third party statistical pricing service may be employed for purposes of fair market valuation.
The following table reconciles asset balances for the year ended March 31, 2009 in which significant unobservable inputs (Level 3) were used in determining value:
| | | Investments in
Securities | | Other Financial
Instruments | |
| Balance as of March 31, 2008 | | $ | 241,333 | | | $ | – | | |
Accretion of discount/
amortization of premium | | | 1,196 | | | | – | | |
| Realized loss | | | (11,970 | ) | | | – | | |
| Change in unrealized depreciation | | | (19,919 | ) | | | – | | |
| Net sales | | | (141,873 | ) | | | – | | |
| Transfers in to and/or out of Level 3 | | | – | | | | – | | |
| Balance as of March 31, 2009 | | $ | 68,767 | | | $ | – | | |
The change in unrealized losses attributable to securities owned at March 31, 2009 which were valued using significant unobservable inputs (Level 3) amounted to $19,919. This amount is included in net change in unrealized appreciation (depreciation) on the Statements of Changes in Net Assets.
The information in the above reconciliation represents fiscal year-to-date activity for any security identified as using Level 3 inputs at either the beginning or the end of the current fiscal period.
(a) Security exempt from registration pursuant to Rule 144A under the Securities Act of 1933. These securities may be resold in transactions exempt from registration, normally to qualified institutional buyers. At March 31, 2009, these securities, which are not illiquid, amounted to $2,217,606, which represents 11.3% of net assets.
(b) A portion of this security is pledged as collateral for credit default swaps. At March 31, 2009 the total market value of securities pledged amounted to $304,656.
(c) The interest rate shown on floating rate or variable rate securities reflects the rate at March 31, 2009.
(d) Investments in affiliates during the twelve months ended March 31, 2009: Security name: Merrill Lynch & Co., Inc., 6.050%, 08/15/12.
| Par as of 03/31/08: | | $ | 85,000 | | |
| Par purchased: | | $ | – | | |
| Par sold: | | $ | (50,000 | ) | |
| Par as of 03/31/09: | | $ | 35,000 | | |
| Net realized loss: | | $ | (2,695 | ) | |
| Interest income earned: | | $ | 3,628 | | |
| Value at end of period: | | $ | 30,032 | | |
As of 01/01/2009, Merrill Lynch & Co., Inc. is a wholly owned subsidiary of Bank of America Corporation and an affiliate of Columbia Management.
(e) The issuer has filed for bankruptcy protection under Chapter 11, and is in default of certain debt covenants. Income is not being accrued. At March 31, 2009, the value of these securities amounted to $52,912, which represents 0.3% of net assets.
(f) Represents fair value as determined in good faith under procedures approved by the Board of Trustees.
(g) Investment made with cash collateral from securities lending activity.
(h) Cost for federal income tax purposes is $21,601,598.
At March 31, 2009, the Portfolio had entered into the following credit default swap contracts:
Swap
Conterparty | | Referenced
Obligation | | Receive
Buy/Sell
Protection | | Fixed Rate | | Expiration
Date | | Notional
Amount | | Value of
Contracts | |
| Barclays Capital | | The Home Depot, Inc.
5.875% 12/16/36 | | Buy | | | (2.930 | )% | | 03/20/13 | | $ | 435,000 | | | $ | (21,070 | ) | |
| Barclays Capital | | Limited Brands, Inc.
6.125% 12/01/12 | | Buy | | | (6.150 | )% | | 03/20/14 | | | 500,000 | | | | (28,767 | ) | |
| Barclays Capital | | Time Warner, Inc.
5.875% 11/15/16 | | Buy | | | (1.200 | )% | | 03/20/14 | | | 315,000 | | | | (1,726 | ) | |
| | | | | | | | | | | | | | | | | $ | (51,563 | ) | |
At March 31, 2009, the Portfolio held investments in the following sectors:
| Sector (Unaudited) | | % of
Net Assets | |
| Financials | | | 29.9 | | |
| Utilities | | | 13.8 | | |
| Energy | | | 11.7 | | |
| Communications | | | 10.6 | | |
| Consumer Non-Cyclical | | | 9.6 | | |
| Industrials | | | 9.2 | | |
| Consumer Cyclical | | | 4.8 | | |
| Technology | | | 2.5 | | |
| Basic Materials | | | 2.3 | | |
| | | | 94.4 | | |
| Government & Agency Obligations | | | 4.6 | | |
| Other Assets & Liabilities, Net | | | 1.0 | | |
| | | | 100.0 | | |
See Accompanying Notes to Financial Statements.
17
Investment Portfolio – Mortgage- and Asset-Backed Portfolio
March 31, 2009
| Mortgage-Backed Securities – 62.7% | |
| | | Par ($) | | Value ($) | |
| Federal Home Loan Mortgage Corp. | |
| 5.000% 05/01/37 | | | 504,958 | | | | 521,365 | | |
| 5.000% 06/01/37 | | | 2,121,354 | | | | 2,190,282 | | |
| 5.500% 05/01/37 | | | 2,660,441 | | | | 2,763,513 | | |
| 5.883% 04/01/37 (a) | | | 247,511 | | | | 257,406 | | |
| 6.500% 11/01/32 | | | 9,852 | | | | 10,465 | | |
| 6.500% 10/01/37 | | | 3,286,616 | | | | 3,468,800 | | |
| 6.500% 01/01/39 | | | 1,796,917 | | | | 1,896,524 | | |
| 6.500% 02/01/39 | | | 1,110,064 | | | | 1,171,597 | | |
| Federal National Mortgage Association | |
| 4.000% 03/01/39 | | | 2,747,000 | | | | 2,762,023 | | |
| 4.500% 02/01/39 | | | 3,554,251 | | | | 3,636,062 | | |
| 5.500% 02/01/37 | | | 93,300 | | | | 96,952 | | |
| 5.500% 04/01/37 | | | 1,734,145 | | | | 1,801,689 | | |
| 5.500% 05/01/37 | | | 1,109,761 | | | | 1,152,962 | | |
| 5.500% 06/01/38 | | | 1,061,937 | | | | 1,103,276 | | |
| 6.000% 09/01/36 | | | 3,000,157 | | | | 3,139,061 | | |
| 6.000% 06/01/38 | | | 698,882 | | | | 730,763 | | |
| 6.500% 10/01/37 | | | 424,176 | | | | 447,345 | | |
| 6.500% 11/01/37 | | | 933,957 | | | | 984,971 | | |
| 7.000% 02/01/32 | | | 15,243 | | | | 16,457 | | |
TBA,
4.500% 04/01/39 (b) | | | 2,000,000 | | | | 2,043,750 | | |
| Government National Mortgage Association | |
| 7.000% 03/15/31 | | | 1,975 | | | | 2,124 | | |
Total Mortgage-Backed Securities
(cost of $29,430,417) | | | 30,197,387 | | |
| Government & Agency Obligations – 17.7% | |
| U.S. Government Obligations – 17.7% | |
| U.S. Treasury Bill | |
| 0.090% 04/09/09 | | | 8,500,000 | | | | 8,499,830 | | |
| Total U.S. Government Obligations | | | 8,499,830 | | |
Total Government & Agency Obligations
(cost of $8,499,830) | | | 8,499,830 | | |
| Commercial Mortgage-Backed Securities – 12.1% | |
| Bear Stearns Commercial Mortgage Securities | |
| 4.740% 03/13/40 | | | 95,848 | | | | 85,799 | | |
| 4.750% 02/13/46 (a) | | | 373,012 | | | | 287,098 | | |
| 4.830% 08/15/38 | | | 123,627 | | | | 115,382 | | |
| 4.933% 02/13/42 (a) | | | 140,679 | | | | 109,915 | | |
| 5.201% 12/11/38 | | | 564,847 | | | | 462,911 | | |
| 5.546% 09/11/38 (a) | | | 124,484 | | | | 124,207 | | |
| 5.742% 09/11/42 (a) | | | 145,000 | | | | 108,592 | | |
| Credit Suisse Mortgage Capital Certificates | |
| 4.991% 06/15/38 | | | 404,563 | | | | 403,878 | | |
| GE Capital Commercial Mortgage Corp. | |
| 4.170% 07/10/37 | | | 129,089 | | | | 126,524 | | |
| | | Par ($) | | Value ($) | |
| JPMorgan Chase Commercial Mortgage Securities Corp. | |
| 5.170% 05/15/47 | | | 408,817 | | | | 405,024 | | |
| 5.255% 07/12/37 | | | 30,000 | | | | 26,794 | | |
| 5.440% 06/12/47 | | | 120,000 | | | | 77,448 | | |
| 5.814% 06/12/43 (a) | | | 341,300 | | | | 241,414 | | |
| 5.833% 04/15/45 (a) | | | 130,617 | | | | 130,706 | | |
| LB-UBS Commercial Mortgage Trust | |
| 4.810% 01/15/36 (a) | | | 554,190 | | | | 338,248 | | |
| 4.853% 09/15/31 | | | 392,196 | | | | 370,714 | | |
| 5.611% 04/15/41 | | | 116,207 | | | | 109,879 | | |
| 6.462% 03/15/31 | | | 483,850 | | | | 483,302 | | |
| Merrill Lynch Mortgage Trust | |
| 5.829% 06/12/50 (a) | | | 445,483 | | | | 282,766 | | |
| Morgan Stanley Capital I | |
| 4.989% 08/13/42 | | | 135,000 | | | | 108,604 | | |
| 5.208% 11/14/42 (a) | | | 134,284 | | | | 104,872 | | |
| 5.332% 12/15/43 | | | 349,566 | | | | 256,524 | | |
| 5.447% 02/12/44 (a) | | | 130,021 | | | | 91,058 | | |
| Morgan Stanley Dean Witter Capital I | |
| 4.920% 03/12/35 | | | 400,722 | | | | 358,882 | | |
| Wachovia Bank Commercial Mortgage Trust | |
| 5.037% 03/15/42 | | | 50,000 | | | | 46,834 | | |
| 5.210% 10/15/44 (a) | | | 400,000 | | | | 317,648 | | |
| 5.726% 06/15/45 | | | 195,226 | | | | 195,049 | | |
| 5.997% 06/15/45 | | | 85,000 | | | | 72,610 | | |
Total Commercial Mortgage-Backed Securities
(cost of $6,648,606) | | | 5,842,682 | | |
| Asset-Backed Securities – 8.3% | |
| Capital One Multi-Asset Execution Trust | |
| 0.536% 08/15/12 (a) | | | 250,000 | | | | 245,841 | | |
| 4.850% 11/15/13 | | | 290,000 | | | | 288,407 | | |
| 5.300% 02/18/14 | | | 578,000 | | | | 577,201 | | |
| Chase Issuance Trust | |
| 4.260% 05/15/13 | | | 230,000 | | | | 229,169 | | |
| 5.400% 07/15/15 | | | 150,000 | | | | 148,991 | | |
| Ford Credit Auto Owner Trust | |
| 5.160% 04/15/13 | | | 389,000 | | | | 361,194 | | |
| 5.260% 10/15/10 | | | 213,125 | | | | 213,989 | | |
| Franklin Auto Trust | |
| 5.360% 05/20/16 | | | 100,000 | | | | 95,850 | | |
| Master Asset Backed Securities Trust | |
| 0.662% 02/25/36 (a) | | | 5,096 | | | | 5,037 | | |
| Morgan Stanley Mortgage Loan Trust | |
| 0.642% 10/25/36 (a) | | | 122,888 | | | | 111,869 | | |
| Residential Funding Mortgage Securities II, Inc. | |
| 0.622% 02/25/36 (a) | | | 80,243 | | | | 78,279 | | |
| SACO I, Inc. | |
| 0.722% 04/25/35 (a)(c) | | | 13,515 | | | | 4,319 | | |
See Accompanying Notes to Financial Statements.
18
Mortgage- and Asset-Backed Portfolio
March 31, 2009
| Asset-Backed Securities (continued) | |
| | | Par ($) | | Value ($) | |
| SLM Student Loan Trust | |
| 1.380% 03/15/17 (a) | | | 223,918 | | | | 205,926 | | |
| 1.400% 12/15/20 (a) | | | 649,000 | | | | 561,050 | | |
| Terwin Mortgage Trust | |
| 1.422% 07/25/34 (a) | | | 53,294 | | | | 20,343 | | |
| USAA Auto Owner Trust | |
| 4.280% 10/15/12 | | | 211,000 | | | | 213,122 | | |
| 5.070% 06/15/13 | | | 639,000 | | | | 653,888 | | |
Total Asset-Backed Securities
(cost of $4,172,752) | | | 4,014,475 | | |
| Corporate Fixed-Income Bonds & Notes – 3.1% | |
| Financials – 3.1% | |
| Citibank NA | |
| 1.625% 03/30/11 (e) | | | 1,500,000 | | | | 1,502,533 | | |
| Financials Total | | | 1,502,533 | | |
Total Corporate Fixed-Income Bonds & Notes
(cost of $1,499,626) | | | 1,502,533 | | |
| Collateralized Mortgage Obligations – 0.8% | |
| Non-Agency – 0.8% | |
| Bear Stearns Alt-A Trust | |
| 0.802% 01/25/35 (a) | | | 79,717 | | | | 37,458 | | |
| Countrywide Alternative Loan Trust | |
| 0.612% 03/25/36 (a) | | | 13,839 | | | | 13,685 | | |
| Morgan Stanley Mortgage Loan Trust | |
| 0.742% 02/25/47 (a) | | | 636,597 | | | | 312,201 | | |
| Non-Agency Total | | | 363,344 | | |
Total Collateralized Mortgage Obligations
(cost of $730,153) | | | 363,344 | | |
| Short-Term Obligation – 1.0% | |
Repurchase agreement with
Fixed Income Clearing Corp.,
dated 03/31/09, due 04/01/09
at 0.140%, collateralized by a
U.S. Government Agency
Obligation maturing
01/15/13, market value
$484,000 (repurchase
proc eeds $472,002) | | | 472,000 | | | | 472,000 | | |
Total Short-Term Obligation
(cost of $472,000) | | | 472,000 | | |
Total Investments – 105.7%
(cost of $51,453,384) (d) | | | 50,892,251 | | |
| Other Assets & Liabilities, Net – (5.7)% | | | (2,763,918 | ) | |
| Net Assets – 100.0% | | | 48,128,333 | | |
Notes to Investment Portfolio:
On April 1, 2008, the Portfolio adopted Statement of Financial Accounting Standards No. 157, Fair Value Measurements ("SFAS 157"). SFAS 157 establishes a hierarchy that prioritizes the inputs to valuation techniques used to measure fair value giving the highest priority to unadjusted quoted prices in active markets for identical securities (level 1 measurements) and the lowest priority to unobservable inputs (level 3 measurements) when market prices are not readily available or reliable. The three levels of the fair value hierarchy under SFAS 157 are described below:
• Level 1 – quoted prices in active markets for identical securities
• Level 2 – prices determined using other significant observable inputs (including quoted prices for similar securities, interest rates, prepayment speeds, credit risk and others)
• Level 3 – prices determined using significant unobservable inputs. In situations where quoted prices or observable inputs are unavailable or less reliable, unobservable inputs may be used. Unobservable inputs may include management's own assumptions about the factors market participants would use in pricing an investment.
The inputs or methodology used for valuing securities are not necessarily an indication of the risk associated with investing in those securities.
The following table summarizes the inputs used, as of March 31, 2009 in valuing the Portfolio's assets:
| Valuation Inputs | | Investments in
Securities | | Other Financial
Instruments | |
| Level 1 – Quoted Prices | | $ | 10,543,580 | | | $ | – | | |
Level 2 – Other Significant
Observable Inputs | | | 40,348,671 | | | | – | | |
Level 3 – Significant
Unobservable Inputs | | | – | | | | – | | |
| Total | | $ | 50,892,251 | | | $ | – | | |
(a) The interest rate shown on floating rate or variable rate securities reflects the rate at March 31, 2009.
(b) Security purchased on a delayed delivery basis.
(c) Security exempt from registration pursuant to Rule 144A under the Securities Act of 1933. This security may be resold in transactions exempt from registration, normally to qualified institutional buyers. At March 31, 2009, the value of this security, which is not illiquid, amounts to $4,319, which represents less than 0.01% of net assets.
(d) Cost for federal income tax purposes is $51,469,379.
(e) Security is guaranteed by the Federal Deposit Insurance Company.
At March 31, 2009, the asset allocation of the Portfolio is as follows:
| Asset Allocation (Unaudited) | | % of
Net Assets | |
| Mortgage-Backed Securities | | | 62.7 | | |
| Government & Agency Obligations | | | 17.7 | | |
| Commercial Mortgage-Backed Securities | | | 12.1 | | |
| Asset-Backed Securities | | | 8.3 | | |
| Corporate Fixed-Income Bonds & Notes | | | 3.1 | | |
| Collateralized Mortgage Obligations | | | 0.8 | | |
| | | | 104.7 | | |
| Short-Term Obligation | | | 1.0 | | |
| Other Assets & Liabilities, Net | | | (5.7 | ) | |
| | | | 100.0 | | |
| Acronym | | Name | |
| TBA | | To Be Announced | |
|
See Accompanying Notes to Financial Statements.
19
Statements of Assets and Liabilities – Fixed Income Sector Portfolios
March 31, 2009
| | | ($) | | ($) | |
| | | Corporate
Bond
Portfolio | | Mortgage- and
Asset-Backed
Portfolio | |
| Assets | |
| Unaffiliated investments, at identified cost | | | 21,523,141 | | | | 51,453,384 | | |
| Affiliated investments, at identified cost | | | 34,965 | | | | — | | |
| Total investments, at identified cost | | | 21,558,106 | | | | 51,453,384 | | |
| Unaffiliated investments, at value | | | 19,334,885 | | | | 50,892,251 | | |
| Affiliated investments, at value | | | 30,032 | | | | — | | |
| Total investments, at value | | | 19,364,917 | | | | 50,892,251 | | |
| Cash | | | — | | | | 815 | | |
| Cash held at broker | | | 16,000 | | | | — | | |
| Receivable for: | |
| Investments sold | | | 298,405 | | | | — | | |
| Interest | | | 327,385 | | | | 167,138 | | |
| Securities lending | | | 166 | | | | — | | |
| Other assets | | | 1,565 | | | | — | | |
| Total Assets | | | 20,008,438 | | | | 51,060,204 | | |
| Liabilities | |
| Payable to custodian bank | | | 241,276 | | | | — | | |
| Collateral on securities loaned | | | 4,100 | | | | — | | |
| Open credit default swap contracts | | | 51,563 | | | | — | | |
| Payable for: | |
| Investments purchased | | | 141,594 | | | | 231,190 | | |
| Investments purchased on a delayed delivery basis | | | — | | | | 2,016,125 | | |
| Portfolio shares repurchased | | | 15,293 | | | | 684,556 | | |
| Total Liabilities | | | 453,826 | | | | 2,931,871 | | |
| Net Assets | | | 19,554,612 | | | | 48,128,333 | | |
| Net Assets Consist of | |
| Paid-in capital | | | 25,926,050 | | | | 62,749,631 | | |
| Undistributed net investment income | | | 55,285 | | | | 64,597 | | |
| Accumulated net realized loss | | | (4,171,303 | ) | | | (14,124,762 | ) | |
| Net unrealized appreciation (depreciation) on: | |
| Investments | | | (2,193,189 | ) | | | (561,133 | ) | |
| Credit default swap contracts | | | (62,231 | ) | | | — | | |
| Net Assets | | | 19,554,612 | | | | 48,128,333 | | |
| Shares outstanding | | | 2,262,408 | | | | 5,422,664 | | |
| Net asset value per share | | | 8.64 | | | | 8.88 | | |
See Accompanying Notes to Financial Statements.
20
Statements of Operations – Fixed Income Sector Portfolios
For the Year Ended March 31, 2009
| | | ($) | | ($) | |
| | | Corporate
Bond
Portfolio | | Mortgage- and
Asset-Backed
Portfolio | |
| Investment Income | |
| Interest | | | 2,559,086 | | | | 4,460,548 | | |
| Interest from affiliate | | | 3,628 | | | | — | | |
| Securities lending | | | 9,124 | | | | — | | |
| Total Investment Income | | | 2,571,838 | | | | 4,460,548 | | |
Net Realized and Unrealized Gain (Loss) on Investments, Futures Contracts
and Credit Default Swap Contracts | |
| Net realized gain (loss) on: | |
| Investments | | | (5,901,977 | ) | | | (8,226,295 | ) | |
| Affiliated investment | | | (2,695 | ) | | | — | | |
| Futures contracts | | | 309,141 | | | | — | | |
| Credit default swap contracts | | | 131,754 | | | | — | | |
| Net realized loss | | | (5,463,777 | ) | | | (8,226,295 | ) | |
| Net change in unrealized appreciation (depreciation) on: | |
| Investments | | | (724,055 | ) | | | 2,656,222 | | |
| Futures contracts | | | (163,009 | ) | | | — | | |
| Credit default swap contracts | | | (108,854 | ) | | | — | | |
| Net change in unrealized appreciation (depreciation) | | | (995,918 | ) | | | 2,656,222 | | |
| Net Loss | | | (6,459,695 | ) | | | (5,570,073 | ) | |
| Net Decrease Resulting from Operations | | | (3,887,857 | ) | | | (1,109,525 | ) | |
See Accompanying Notes to Financial Statements.
21
Statements of Changes in Net Assets – Fixed Income Sector Portfolios
| Increase (Decrease) in Net Assets | | Corporate Bond Portfolio | | Mortgage- and Asset-Backed Portfolio | |
| | | Year Ended March 31, | | Year Ended March 31, | |
| | | 2009 ($) | | 2008 ($) | | 2009 ($) | | 2008 ($) | |
| Operations | |
| Net investment income | | | 2,571,838 | | | | 4,499,631 | | | | 4,460,548 | | | | 7,979,479 | | |
Net realized loss on investments,
futures contracts and credit default
swap contracts | | | (5,463,777 | ) | | | (1,736,875 | ) | | | (8,226,295 | ) | | | (6,891,723 | ) | |
Net change in unrealized appreciation
(depreciation) on investments,
futures contracts and credit default
swap contracts | | | (995,918 | ) | | | (1,291,465 | ) | | | 2,656,222 | | | | (2,949,101 | ) | |
| Net increase (decrease) resulting from operations | | | (3,887,857 | ) | | | 1,471,291 | | | | (1,109,525 | ) | | | (1,861,345 | ) | |
| Distributions to Shareholders | |
| From net investment income | | | (2,585,812 | ) | | | (4,501,832 | ) | | | (4,513,649 | ) | | | (7,957,916 | ) | |
| From realized gain | | | — | | | | — | | | | — | | | | (427,583 | ) | |
| Total distributions to shareholders | | | (2,585,812 | ) | | | (4,501,832 | ) | | | (4,513,649 | ) | | | (8,385,499 | ) | |
| Net Capital Stock Transactions | | | (47,774,916 | ) | | | (1,754,285 | ) | | | (84,444,399 | ) | | | 13,084,770 | | |
| Total increase (decrease) in net assets | | | (54,248,585 | ) | | | (4,784,826 | ) | | | (90,067,573 | ) | | | 2,837,926 | | |
| Net Assets | |
| Beginning of period | | | 73,803,197 | | | | 78,588,023 | | | | 138,195,906 | | | | 135,357,980 | | |
| End of period | | | 19,554,612 | | | | 73,803,197 | | | | 48,128,333 | | | | 138,195,906 | | |
| Undistributed net investment income at end of period | | | 55,285 | | | | 69,259 | | | | 64,597 | | | | 117,698 | | |
See Accompanying Notes to Financial Statements.
22
Statements of Changes in Net Assets (continued) – Capital Stock Activity
| | | Corporate Bond Portfolio | | Mortgage- and Asset-Backed Portfolio | |
| | | Year Ended
March 31, 2009 | | Year Ended
March 31, 2008 | | Year Ended
March 31, 2009 | | Year Ended
March 31, 2008 | |
| | | Shares | | Dollars ($) | | Shares | | Dollars ($) | | Shares | | Dollars ($) | | Shares | | Dollars ($) | |
| Subscriptions | | | 176,063 | | | | 1,580,494 | | | | 1,071,346 | | | | 10,523,592 | | | | 2,498,322 | | | | 22,601,096 | | | | 2,796,773 | | | | 27,383,420 | | |
| Distributions reinvested | | | 1,682 | | | | 14,980 | | | | 2,783 | | | | 27,323 | | | | 20,921 | | | | 185,920 | | | | 26,990 | | | | 261,887 | | |
| Redemptions | | | (5,554,673 | ) | | | (49,370,390 | ) | | | (1,249,107 | ) | | | (12,305,200 | ) | | | (11,926,680 | ) | | | (107,231,415 | ) | | | (1,512,783 | ) | | | (14,560,537 | ) | |
| Net increase (decrease) | | | (5,376,928 | ) | | | (47,774,916 | ) | | | (174,978 | ) | | | (1,754,285 | ) | | | (9,407,437 | ) | | | (84,444,399 | ) | | | 1,310,980 | | | | 13,084,770 | | |
See Accompanying Notes to Financial Statements.
23
Financial Highlights – Corporate Bond Portfolio
Selected data for a share outstanding throughout each period is as follows:
| | | Year Ended March 31, | |
| | | 2009 | | 2008 | | 2007 | | 2006 | | 2005 | |
| Net Asset Value, Beginning of Period | | $ | 9.66 | | | $ | 10.06 | | | $ | 9.93 | | | $ | 10.19 | | | $ | 10.58 | | |
| Income from Investment Operations: | |
| Net investment income (a) | | | 0.56 | | | | 0.58 | | | | 0.55 | | | | 0.49 | | | | 0.48 | | |
Net realized and unrealized gain (loss) on investments,
futures contracts and credit default swap contracts | | | (1.01 | ) | | | (0.40 | ) | | | 0.13 | | | | (0.25 | ) | | | (0.36 | ) | |
| Total from investment operations | | | (0.45 | ) | | | 0.18 | | | | 0.68 | | | | 0.24 | | | | 0.12 | | |
| Less Distributions to Shareholders: | |
| From net investment income | | | (0.57 | ) | | | (0.58 | ) | | | (0.55 | ) | | | (0.49 | ) | | | (0.48 | ) | |
| From net realized gains | | | — | | | | — | | | | — | | | | (0.01 | ) | | | (0.03 | ) | |
| Total distributions to shareholders | | | (0.57 | ) | | | (0.58 | ) | | | (0.55 | ) | | | (0.50 | ) | | | (0.51 | ) | |
| Net Asset Value, End of Period | | $ | 8.64 | | | $ | 9.66 | | | $ | 10.06 | | | $ | 9.93 | | | $ | 10.19 | | |
| Total return (b) | | | (4.65 | )% | | | 1.81 | %(c) | | | 7.01 | % | | | 2.34 | % | | | 1.25 | % | |
| Ratios to Average Net Assets/Supplemental Data: | |
| Net expenses (d) | | | — | | | | — | | | | — | | | | — | | | | — | | |
| Net investment income (d) | | | 6.10 | % | | | 5.84 | % | | | 5.55 | % | | | 4.83 | % | | | 4.69 | % | |
| Portfolio turnover rate | | | 137 | % | | | 189 | % | | | 114 | % | | | 62 | % | | | 39 | % | |
| Net assets, end of period (000's) | | $ | 19,555 | | | $ | 73,803 | | | $ | 78,588 | | | $ | 64,597 | | | $ | 52,698 | | |
(a) Per share data was calculated using the average shares outstanding during the period.
(b) Total return at net asset value assuming all distributions reinvested.
(c) Total return includes a voluntary reimbursement by the investment advisor for a realized investment loss due to a trading error. This reimbursement increased total return and net asset value per share by less than 0.01% and less than $0.01, respectively.
(d) The net investment income and expense ratios exclude expenses charged directly to shareholders.
See Accompanying Notes to Financial Statements.
24
Financial Highlights – Mortgage- and Asset-Backed Portfolio
Selected data for a share outstanding throughout each period is as follows:
| | | Year Ended March 31, | |
| | | 2009 | | 2008 | | 2007 | | 2006 | | 2005 | |
| Net Asset Value, Beginning of Period | | $ | 9.32 | | | $ | 10.01 | | | $ | 9.85 | | | $ | 10.01 | | | $ | 10.19 | | |
| Income from Investment Operations: | |
| Net investment income (a) | | | 0.44 | | | | 0.54 | | | | 0.54 | | | | 0.40 | | | | 0.26 | | |
| Net realized and unrealized gain (loss) on investments | | | (0.44 | ) | | | (0.67 | ) | | | 0.14 | | | | (0.12 | ) | | | (0.01 | ) | |
| Total from investment operations | | | — | | | | (0.13 | ) | | | 0.68 | | | | 0.28 | | | | 0.25 | | |
| Less Distributions to Shareholders: | |
| From net investment income | | | (0.44 | ) | | | (0.53 | ) | | | (0.52 | ) | | | (0.40 | ) | | | (0.26 | ) | |
| From net realized gains | | | — | | | | (0.03 | ) | | | — | | | | (0.04 | ) | | | (0.17 | ) | |
| Total distributions to shareholders | | | (0.44 | ) | | | (0.56 | ) | | | (0.52 | ) | | | (0.44 | ) | | | (0.43 | ) | |
| Net Asset Value, End of Period | | $ | 8.88 | | | $ | 9.32 | | | $ | 10.01 | | | $ | 9.85 | | | $ | 10.01 | | |
| Total return (b) | | | 0.10 | % | | | (1.34 | )% | | | 7.12 | % | | | 2.85 | % | | | 2.57 | % | |
| Ratios to Average Net Assets/Supplemental Data: | |
| Net expenses (c) | | | — | | | | — | | | | — | | | | — | | | | — | | |
| Net investment income (c) | | | 4.92 | % | | | 5.50 | % | | | 5.41 | % | | | 4.00 | % | | | 2.61 | % | |
| Portfolio turnover rate | | | 142 | % | | | 369 | % | | | 543 | % | | | 561 | % | | | 765 | % | |
| Net assets, end of period (000's) | | $ | 48,128 | | | $ | 138,196 | | | $ | 135,358 | | | $ | 89,569 | | | $ | 78,216 | | |
(a) Per share data was calculated using the average shares outstanding during the period.
(b) Total return at net asset value assuming all distributions reinvested.
(c) The net investment income and expense ratios exclude expenses charged directly to shareholders.
See Accompanying Notes to Financial Statements.
25
Notes to Financial Statements – Fixed Income Sector Portfolios
March 31, 2009
Note 1. Organization
Columbia Funds Series Trust (the "Trust") is registered under the Investment Company Act of 1940, as amended (the "1940 Act"), as an open-end management investment company. Information presented in these financial statements pertains to Corporate Bond Portfolio and Mortgage- and Asset-Backed Portfolio (each, a "Portfolio" and collectively, the "Portfolios"), each a series of the Trust.
Investment Objectives
Corporate Bond Portfolio and Mortgage- and Asset-Backed Portfolio each seek total return, consisting of current income and capital appreciation.
Portfolio Shares
The Portfolios are authorized to issue an unlimited number of shares without par value and are available only to certain eligible investors through certain wrap fee programs and certain other managed accounts, including those sponsored or managed by Bank of America Corporation ("BOA") and its affiliates.
Note 2. Significant Accounting Policies
The preparation of financial statements in accordance with accounting principles generally accepted in the United States of America ("GAAP") requires management to make certain estimates and assumptions that affect the reported amounts of assets and liabilities, the disclosure of contingent assets and liabilities at the date of the financial statements and the reported amounts of revenue and expenses during the reporting period. Actual results could differ from those estimates. The following is a summary of significant accounting policies consistently followed by the Portfolios in the preparation of their financial statements.
Security Valuation
Debt securities generally are valued by pricing services approved by the Trust's Board of Trustees, based upon market transactions for normal, institutional-size trading units of similar securities. The services may use various pricing techniques which take into account appropriate factors such as yield, quality, coupon rate, maturity, type of issue, trading characteristics and other data, as well as broker quotes. Debt securities for which quotations are readily available are valued at an over-the-counter or exchange bid quotation.
Certain debt securities, which tend to be more thinly traded and of lesser quality, are priced based on fundamental analysis of the financial condition of the issuer and the estimated value of any collateral. Valuations developed through pricing techniques may vary from the actual amounts realized upon sale of the securities, and the potential variation may be greater for those securities valued using fundamental analysis.
Short-term investments maturing in 60 days or less are valued at amortized cost, which approximates market value.
Futures contracts are valued at the settlement price established each day by the board of trade or exchange on which they are traded.
Credit default swap contracts are marked to market daily based upon quotations from market makers. Quotations obtained from independent pricing services use information provided by market makers.
Investments for which market quotations are not readily available, or that have quotations which management believes are not reliable, are valued at fair value as determined in good faith under consistently applied procedures established by and under the general supervision of the Board of Trustees. If a security is valued at fair value, such value is likely to be different from the last quoted market price for the security. The determination of fair value often requires significant judgment. To determine fair value, management may use assumptions including but not limited to future cash flows and estimated risk premiums. Multiple inputs from various sources may be used to determine value.
Security Transactions
Security transactions are accounted for on the trade date. Cost is determined and gains (losses) are based upon the specific identification method for both financial statement and federal income tax purposes.
In March 2008, Statement of Financial Accounting Standards No. 161, Disclosures about Derivative Instruments and Hedging Activities—an amendment of FASB Statement No. 133 ("SFAS 161"), was issued. SFAS 161 is effective for fiscal years and interim periods beginning after November 15, 2008. SFAS 161 requires additional discussion about the reporting entity's derivative instruments and hedging activities, by providing for qualitative disclosures about the objectives and strategies for using derivatives, quantitative data about the fair value of and gains and losses on derivative contracts, and details of credit-risk-related contingent features in their derivative contracts. Management is evaluating the impact the application of SFAS 161 will have on the Portfolios' financial st atement disclosures.
26
Fixed Income Sector Portfolios (continued)
March 31, 2009
Futures Contracts
The Portfolios may invest in futures contracts for both hedging and non-hedging purposes, including, for example, to seek to enhance returns or as a substitute for a position in an underlying asset.
The use of futures contracts involves certain risks, which include: (1) imperfect correlation between the price movement of the instruments and the underlying securities, (2) inability to close out positions due to differing trading hours, or the temporary absence of a liquid market, for either the instruments or the underlying securities, or (3) an inaccurate prediction of the future direction of interest rates by Columbia Management Advisors, LLC ("Columbia"), the Portfolios' investment advisor. Any of these risks may involve amounts exceeding the variation margin recorded in the Portfolios' Statements of Assets and Liabilities at any given time.
Upon entering into a futures contract, a Portfolio pledges cash or securities with the broker in an amount sufficient to meet the initial margin requirement. Subsequent payments are made or received by a Portfolio equal to the daily change in the contract value and are recorded as variation margin receivable or payable and offset in unrealized gains or losses. A Portfolio recognizes a realized gain or loss when the contract is closed or expires.
Repurchase Agreements
Each Portfolio may engage in repurchase agreement transactions with institutions that Columbia has determined are creditworthy. Each Portfolio, through its custodian, receives delivery of the underlying securities collateralizing a repurchase agreement. Columbia is responsible for determining that the collateral is at least equal, at all times, to the value of the repurchase obligation including interest. A repurchase agreement transaction involves certain risks in the event of default or insolvency of the counterparty. These risks include possible delays in or restrictions on each Portfolio's ability to dispose of the underlying securities and a possible decline in the value of the underlying securities during the period while the Portfolios seek to assert their rights.
Restricted Securities
Restricted securities are securities that may only be resold upon registration under federal securities laws or in transactions exempt from registration. In some cases, the issuer of restricted securities has agreed to register such securities for resale at the issuer's expense either upon demand by the Portfolios or in connection with another registered offering of the securities. Many restricted securities may be resold in the secondary market in transactions exempt from registration. Such restricted securities may be determined to be liquid under criteria established by the Board of Trustees. The Portfolios will not incur any registration costs upon such resale.
Delayed Delivery Securities
Each Portfolio may trade securities on other than normal settlement terms, including securities purchased or sold on a "when-issued" basis. This may increase the risk if the other party to the transaction fails to deliver and causes the Portfolios to subsequently invest at less advantageous prices. Each Portfolio holds until the settlement date, in a segregated account, cash or liquid securities in an amount equal to the delayed delivery commitment.
Credit Default Swaps
The Portfolios may engage in credit default swap transactions for hedging purposes or to seek to increase total return. Credit default swaps are agreements in which one party pays fixed periodic payments to a counterparty in consideration for a guarantee from the counterparty to make a specific payment should a negative credit event take place. The Portfolios may receive an upfront payment as the protection seller or make an upfront payment as the protection buyer.
If the Portfolio is a buyer of protection and a credit event occurs, as defined under the terms of that particular swap agreement, the Portfolio will either (i) receive from the seller of protection an amount equal to the notional amount of the swap and deliver the referenced obligation or underlying securities compromising the referenced index or (ii) receive a net settlement amount in the form of cash or securities equal to the notional amount of the swap less the recovery value of the referenced obligation or underlying securities compromising the referenced index.
If a Portfolio is a seller of protection and a credit event occurs, as defined under the terms of that particular swap agreement, the Portfolio will either (i) pay to the buyer of protection an amount equal to the notional amount of the swap and take delivery of the referenced obligation or underlying securities comprising the referenced index or (ii) pay a net settlement amount in the form of cash or securities equal to the notional amount of the swap less the recovery value of the referenced obligation or underlying securities comprising the referenced
27
Fixed Income Sector Portfolios (continued)
March 31, 2009
index. Recovery values are assumed by market makers considering either industry standard recovery rates or entity specific factors and considerations until a credit event occurs. If a credit event has occurred, the recovery value is determined by a facilitated auction whereby a minimum number of allowable broker bids, together with a specified valuation method, are used to calculate the settlement value.
Credit default swaps are marked to market daily based on quotations from market makers and any change is recorded as unrealized appreciation/depreciation on the Portfolios' Statements of Assets and Liabilities. Periodic payments received or made are recorded as a realized gain or loss and premiums received or made are amortized on the Statements of Operations.
Income Recognition
Interest income is recorded on the accrual basis. Premium and discount are amortized and accreted, respectively, on all debt securities, unless otherwise noted. Dividend income is recorded on the ex-date.
Federal Income Tax Status
Each Portfolio intends to qualify each year as a "regulated investment company" under Subchapter M of the Internal Revenue Code, as amended, and will distribute substantially all of its taxable income for its tax year, and as such will not be subject to federal income taxes. In addition, each Portfolio intends to distribute in each calendar year substantially all of its net investment income, capital gains and certain other amounts, if any, such that each Portfolio should not be subject to federal excise tax. Therefore, no federal income or excise tax provision is recorded.
Distributions to Shareholders
Distributions from net investment income are declared and paid monthly. Net realized capital gains, if any, are distributed at least annually. Income distributions and capital gain distributions are determined in accordance with federal income tax regulations which may differ from GAAP.
Indemnification
In the normal course of business, each Portfolio enters into contracts that contain a variety of representations and warranties and which provide general indemnities. A Portfolio's maximum exposure under these arrangements is unknown because this would involve future claims against a Portfolio. Also, under the Trust's organizational documents and by contract, the Trustees and officers of the Trust are indemnified against certain liabilities that may arise out of actions relating to their duties to the Trust. However, based on experience, the Portfolios expect the risk of loss due to these representations, warranties and indemnities to be minimal.
Note 3. Federal Tax Information
The timing and character of income and capital gain distributions are determined in accordance with income tax regulations, which may differ from GAAP. Reclassifications are made to the Portfolios' capital accounts for permanent tax differences to reflect income and gains available for distribution (or available capital loss carryforwards) under income tax regulations.
For the year ended March 31, 2009, permanent book and tax basis differences resulting primarily from differing treatments from the reversal of net capital losses on redemption-in-kind were identified and reclassified among the components of the Portfolios' net assets as follows:
| | | Undistributed
Net Investment
Income | | Accumulated
Net Realized
(Loss) | | Paid-In Capital | |
| Corporate Bond Portfolio | | $ | — | | | $ | 3,963,205 | | | $ | (3,963,205 | ) | |
| Mortgage- and Asset-Backed Portfolio | | | — | | | | 999,558 | | | | (999,558 | ) | |
Net investment income and net realized gains (losses), as disclosed on the Statements of Operations, and net assets were not affected by these reclassifications.
28
Fixed Income Sector Portfolios (continued)
March 31, 2009
The tax character of distributions paid during the years ended March 31, 2009 and March 31, 2008 was as follows:
| | | March 31, 2009 | |
| | | Ordinary
Income* | | Long-Term
Capital Gains | |
| Corporate Bond Portfolio | | $ | 2,585,812 | | | $ | — | | |
| Mortgage- and Asset-Backed Portfolio | | | 4,513,649 | | | | — | | |
| | | March 31, 2008 | |
| | | Ordinary
Income* | | Long-Term
Capital Gains | |
| Corporate Bond Portfolio | | $ | 4,501,832 | | | $ | — | | |
| Mortgage- and Asset-Backed Portfolio | | | 8,385,499 | | | | — | | |
* For tax purposes short-term capital gain distributions, if any, are considered ordinary income distributions.
As of March 31, 2009, the components of distributable earnings on a tax basis were as follows:
| | | Undistributed
Ordinary
Income | | Undistributed
Long-Term
Capital Gains | |
Net Unrealized
Depreciation* | |
| Corporate Bond Portfolio | | $ | 55,287 | | | $ | — | | | $ | (2,236,681 | ) | |
| Mortgage- and Asset-Backed Portfolio | | | 64,596 | | | | — | | | | (577,128 | ) | |
* The differences between book-basis and tax-basis net unrealized appreciation/depreciation are primarily due to deferral of losses from wash sales.
Unrealized appreciation and depreciation at March 31, 2009, based on cost of investments for federal income tax purposes, were:
| | | Unrealized
Appreciation | | Unrealized
Depreciation | | Net
Unrealized
Depreciation | |
| Corporate Bond Portfolio | | $ | 238,300 | | | $ | (2,474,981 | ) | | $ | (2,236,681 | ) | |
| Mortgage- and Asset-Backed Portfolio | | | 830,622 | | | | (1,407,750 | ) | | | (577,128 | ) | |
The following capital loss carryforwards, determined as of March 31, 2009, may be available to reduce taxable income arising from future net realized gains on investments, if any, to the extent permitted by the Internal Revenue Code:
| | | Expiring in | |
| | | 2014 | | 2015 | | 2016 | | 2017 | | Total | |
| Corporate Bond Portfolio | | $ | 190,899 | | | $ | 595,089 | | | $ | 576,674 | | | $ | 2,121,554 | | | $ | 3,484,216 | | |
| Mortgage- and Asset-Backed Portfolio | | | — | | | | — | | | | 976,265 | | | | 12,534,859 | | | | 13,511,124 | | |
29
Fixed Income Sector Portfolios (continued)
March 31, 2009
Under current tax rules, certain capital losses realized after October 31 may be deferred and treated as occurring on the first day of the following fiscal year. As of March 31, 2009, post-October capital losses of $643,597 and $613,638 attributed to security transactions were deferred to April 1, 2009 for Corporate Bond Portfolio and Mortgage- and Asset-Backed Portfolio, respectively.
Under Financial Accounting Standards Board ("FASB") Interpretation No. 48, Accounting for Uncertainty in Income Taxes—an Interpretation of FASB Statement No. 109 ("FIN 48"), management determines whether a tax position of the Portfolios is more likely than not to be sustained upon examination by the applicable taxing authority, including resolution of any related appeals or litigation processes, based on the technical merits of the position. The tax benefit to be recognized is measured as the largest amount of benefit that is greater than fifty percent likely of being realized upon ultimate settlement. Management has evaluated the known implications of FIN 48 on its computation of net assets for each Portfolio. As a result of this evaluation, management has concluded that FIN 48 did not have any effect on the Portfolios' financial statements. However, management's conclusions regarding FIN 48 may be subject to review and adjustment at a later date based on factors including, but not limited to, further implementation guidance from the FASB, new tax laws, regulations, and administrative interpretations (including relevant court decisions). The Portfolios' federal tax returns for the prior three fiscal years remain subject to examination by the Internal Revenue Service. The Portfolios are not aware of any tax positions for which it is reasonably possible that the total amounts of unrecognized tax benefits will significantly change in the next twelve months.
Note 4. Fees and Compensation Paid to Affiliates
Investment Advisory Fee
Columbia, an indirect, wholly owned subsidiary of BOA, provides investment advisory services to the Portfolios.
Columbia does not receive any fees for its investment advisory services. In addition, under its investment advisory agreement, Columbia has agreed to bear all fees and expenses of the Portfolios (exclusive of brokerage fees and commissions, taxes, interest expenses of borrowing money and extraordinary expenses, but including custodian charges relating to overdrafts, if any).
The Portfolios do not incur any fees or expenses except brokerage fees and commissions, taxes, interest expenses of borrowing money and extraordinary expenses. Participants in the wrap fee programs eligible to invest in the Portfolios are required to pay fees to the program sponsor pursuant to separate agreements and should review the wrap program disclosure document for fees and expenses charged.
Administration Fee
Columbia provides administrative and other services to the Portfolios. Under the administration agreement, Columbia does not receive any compensation from the Portfolios for its services.
Transfer Agent Fee
Columbia Management Services, Inc. (the "Transfer Agent"), an affiliate of Columbia and an indirect, wholly owned subsidiary of BOA, provides shareholder services to the Portfolios and has contracted with Boston Financial Data Services ("BFDS") to serve as sub-transfer agent. The Transfer Agent pays the fees of BFDS for services as sub-transfer agent and is not entitled to reimbursement for such fees from the Portfolios. The Transfer Agent does not receive any compensation directly from the Portfolios for its services.
Distribution and Service Fees
Columbia Management Distributors, Inc. (the "Distributor"), an affiliate of Columbia and an indirect, wholly owned subsidiary of BOA, is the principal underwriter of the Portfolios' shares. The Distributor does not receive a fee for its services as distributor.
30
Fixed Income Sector Portfolios (continued)
March 31, 2009
Note 5. Portfolio Information
For the year ended March 31, 2009, the cost of purchases and proceeds from sales of securities, excluding short-term obligations, for the Portfolios were as follows:
| | | U.S Government Securities | | Other Investment Securities | |
| | | Purchases | | Sales | | Purchases | | Sales | |
| Corporate Bond Portfolio | | $ | 19,353,902 | | | $ | 19,237,567 | | | $ | 36,046,450 | | | $ | 52,498,129 | | |
| Mortgage- and Asset-Backed Portfolio | | | 96,258,226 | | | | 128,558,373 | | | | 35,585,049 | | | | 18,352,507 | | |
Note 6. Redemption in-Kind
Sales of securities for the Portfolios include the value of securities delivered through an in-kind redemption of certain Portfolio shares on September 26, 2008. Any realized gain (loss) on securities delivered through an in-kind redemption of shares is not taxable to the Portfolios. The value of securities and realized gain (loss) on securities delivered through an in-kind redemption of Portfolio shares aggregated were:
| | | Market Value of
Securities | | Realized Loss on
Securities | |
| Corporate Bond Portfolio | | $ | 30,074,725 | | | $ | (3,947,101 | ) | |
Mortgage- and
Asset-Backed Portfolio | | | 65,071,373 | | | | (999,558 | ) | |
Prior to the in-kind redemption, the shareholders owned 61.5% and 58.7% of Corporate Bond Portfolio and Mortgage- and Asset-Backed Portfolio, respectively.
Note 7. Line of Credit
The Portfolios and other affiliated funds participate in a $280,000,000 committed, unsecured revolving line of credit provided by State Street. The maximum amount that may be borrowed by any portfolio is limited to the lesser of $200,000,000 and the Portfolios' borrowing limit set forth in the Portfolios' registration statements. Borrowings are available for short-term liquidity or temporary or emergency purposes.
Interest is charged to each participating fund based on the fund's borrowings at a rate per annum equal to the greater of the Federal Funds Rate plus 0.50% or the overnight LIBOR Rate plus 0.50%. In addition, an annual operations agency fee of $20,000, an amendment fee of 0.02% and a commitment fee of 0.12% per annum are accrued and apportioned among the participating funds pro rata based on their relative net assets. Prior to October 16, 2008, the Portfolios and other affiliated funds participated in a $350,000,000 committed, unsecured revolving line of credit and a $150,000,000 uncommitted, unsecured line of credit, both provided by State Street. Interest on the committed line of credit was charged to each participating fund based on the fund's borrowings at a rate per annum equal to the Federal Funds Rate plus 0.50%. In addition, a commitment fee of 0.10% per annum was accrued and apportioned among the participating funds pro rata based on their relative net assets. Interest on the uncommitted line of credit was charged to each participating fund based on the fund's borrowings at a rate per annum equal to the Federal Funds Rate plus 0.375%. State Street charged an annual operations agency fee of $40,000 for the committed line of credit and was able to charge an annual administration fee of $15,000 for the uncommitted line of credit. The commitment fee, the operations agency fee and the administration fee were accrued and apportioned among the participating funds pro rata based on their relative net assets. For the year ended March 31, 2009, the Portfolios did not borrow under these arrangements.
Note 8. Securities Lending
Each Portfolio may lend its securities to certain approved brokers, dealers and other financial institutions. Each loan is collateralized by cash, in an amount at least equal to the market value of the securities loaned plus accrued income from the investment of collateral. The market value of the loaned securities is determined at the close of business of the Portfolios and any additional required collateral is delivered to the Portfolios on the next business day. The collateral received is invested and the income generated by the investment of the collateral, net of any fees remitted to State Street as the lending agent and borrower rebates, is paid to the Portfolios. Generally, in the event of borrower default, the Portfolios have the right to use the collateral to offset any losses incurred. In
31
Fixed Income Sector Portfolios (continued)
March 31, 2009
the event the Portfolios are delayed or prevented from exercising their right to dispose of the collateral, there may be a potential loss to the Portfolios. The Portfolios bear the risk of loss with respect to the investment of collateral.
Note 9. Shares of Beneficial Interest
As of March 31, 2009, the Portfolios had shareholders whose shares were beneficially owned by participant accounts over which BOA and/or any of its affiliates had either sole or joint investment discretion. The percentages of shares of beneficial interest outstanding held therein are as follows:
| | | % of Shares
Outstanding
Held | |
| Corporate Bond Portfolio | | | 97.6 | | |
| Mortgage- and Asset-Backed Portfolio | | | 91.5 | | |
As of March 31, 2009, the Portfolios had shareholders that held greater than 5% of the shares outstanding of a Portfolio, over which BOA and/or any of its affiliates did not have investment discretion. The number of accounts and the percentages of shares of beneficial interest outstanding held therein are as follows:
| | | Number of
Shareholders | | % of Shares
Outstanding
Held | |
Mortgage- and
Asset-Backed Portfolio | | | 1 | | | | 6.3 | | |
An unlimited number of shares of beneficial interest without par value were authorized for the Trust. The Trust's Declaration of Trust authorizes the Board of Trustees to classify or reclassify any authorized but unissued shares into one or more additional classes or series of shares.
Subscription and redemption activity of these accounts may have a significant effect on the operations of the Portfolios.
Note 10. Significant Risks and Contingencies
Asset-Backed Securities Risk
The value of asset-backed securities may be affected by, among other factors, changes in interest rates, the market's assessment of the quality of underlying assets, the creditworthiness of the servicer for the underlying assets, factors concerning the interests in and structure of the issuer or the originator of the underlying assets, or the creditworthiness or rating of the entities that provide any supporting letters of credit, surety bonds, derivative instruments, or other credit enhancement. The value of asset-backed securities also will be affected by the exhaustion, termination or expiration of any credit enhancement. Most asset-backed securities are subject to prepayment risk, which is the possibility that the underlying debt may be refinanced or prepaid prior to maturity during periods of declining or low interest rates, causing the Fund to have to reinvest the money received in securities that have lower yields. In add ition, the impact of prepayments on the value of asset-backed securities may be difficult to predict and may result in greater volatility.
Foreign Securities Risk
There are certain additional risks involved when investing in foreign securities. These risks may involve foreign currency exchange rate fluctuations, adverse political and economic developments and the possible prevention of currency exchange or other foreign governmental laws or restrictions. In addition, the liquidity of foreign securities may be more limited than that of domestic securities.
Mortgage-Backed Securities Risk
The value of the mortgage-backed securities may be affected by, among other things, changes in interest rates, factors concerning the interests in and structure of the issuer or the originator of the mortgages, the creditworthiness of the entities that provide any supporting letters of credit, surety bonds or other credit enhancements or the quality of underlying assets or the market's assessment thereof. Mortgage-backed securities are subject to prepayment risk, which is the possibility that the underlying mortgage may be refinanced or prepaid prior to maturity during periods of declining or low interest rates, causing the Funds to have to reinvest the money received in securities that have lower yields. In addition, the impact of prepayments on the value of mortgage-backed securities may be difficult to predict and may result in greater volatility.
32
Fixed Income Sector Portfolios (continued)
March 31, 2009
Legal Proceedings
Columbia Management Advisors, LLC and Columbia Management Distributors, Inc. (collectively, the "Columbia Group") are subject to a settlement agreement with the New York Attorney General ("NYAG") (the "NYAG Settlement") and a settlement order with the SEC (the "SEC Order") on matters relating to mutual fund trading, each dated February 9, 2005. Under the terms of the SEC Order, the Columbia Group (or predecessor entities) agreed, among other things, to: pay disgorgement and civil money penalties collectively totaling $375 million; cease and desist from violations of the antifraud provisions and certain other provisions of the federal securities laws; maintain certain compliance and ethics oversight structures; and retain an independent consultant to review the Columbia Group's applicable supervisory, compliance, control and other policies and procedures. The NYAG Settlement, among other things, requires Columbia Management Advisors, LLC and its affiliates to reduce management fees for certain funds in the Columbia family of mutual funds in a projected total of $160 million over five years through November 30, 2009 and to make certain disclosures to investors relating to expenses. In connection with the Columbia Group providing services to the Columbia Funds, the Columbia Funds have voluntarily undertaken to implement certain governance measures designed to maintain the independence of their boards of trustees and certain special consulting and compliance measures.
Pursuant to the SEC Order and related procedures, the $375 million in settlement amounts described above, of which approximately $90 million has been earmarked for certain Columbia Funds and their shareholders, is being distributed in accordance with a distribution plan developed by an independent distribution consultant and approved by the SEC on December 27, 2007. Distributions under the distribution plan began in mid-June 2008.
Civil Litigation
In connection with the events that resulted in the NYAG Settlement and SEC Order, various parties filed suits against Bank of America Corporation and certain of its affiliates, including Banc of America Capital Management, LLC ("BACAP," now known as Columbia Management Advisors, LLC) and BACAP Distributors, LLC (now known as Columbia Management Distributors, Inc.) (collectively "BAC"), Nations Funds Trust (now known as Columbia Funds Series Trust) and its Board of Trustees. On February 20, 2004, the Judicial Panel on Multidistrict Litigation transferred these cases and cases against other mutual fund companies based on similar allegations to the United States District Court in Maryland for consolidated or coordinated pretrial proceedings (the "MDL"). Subsequently, additional related cases were transferred to the MDL. On September 29, 2004, the plaintiffs in the MDL filed amended and consolidated complaints. One of these amended complaints is a putative class action that includes claims under the federal securities laws and state common law, and that names Nations Funds Trust, the Trustees, BAC and others as defendants. Another of the amended complaints is a derivative action purportedly on behalf of the Nations Funds Trust against BAC and others that asserts claims under federal securities laws and state common law. Nations Funds Trust is a nominal defendant in this action.
On February 25, 2005, BAC and other defendants filed motions to dismiss the claims in the pending cases. On December 15, 2005, BAC and others entered into a Stipulation of Settlement of the direct and derivative claims brought on behalf of the Nations Funds shareholders. The settlement is subject to court approval. If the settlement is approved, BAC would pay settlement administration costs and fees to plaintiffs' counsel as approved by the court. The stipulation has not yet been presented to the court for approval.
33
Report of Independent Registered Public Accounting Firm
To the Trustees of Columbia Funds Series Trust and Shareholders of Corporate Bond Portfolio and Mortgage- and Asset-Backed Portfolio
In our opinion, the accompanying statements of assets and liabilities, including the investment portfolios, and the related statements of operations and of changes in net assets and the financial highlights present fairly, in all material respects, the financial position of Corporate Bond Portfolio and Mortgage- and Asset-Backed Portfolio (each a series of Columbia Funds Series Trust, hereafter referred to as the "Portfolios") at March 31, 2009, the results of each of their operations for the year then ended, the changes in each of their net assets for each of the two years in the period then ended and the financial highlights for each of the five years in the period then ended, in conformity with accounting principles generally accepted in the United States of America. These financial statements and financial highlights (hereafter referred to as "financial statements") are the responsibility of the Portfolios' management. Our r esponsibility is to express an opinion on these financial statements based on our audits. We conducted our audits of these financial statements in accordance with the standards of the Public Company Accounting Oversight Board (United States). Those standards require that we plan and perform the audit to obtain reasonable assurance about whether the financial statements are free of material misstatement. An audit includes examining, on a test basis, evidence supporting the amounts and disclosures in the financial statements, assessing the accounting principles used and significant estimates made by management, and evaluating the overall financial statement presentation. We believe that our audits, which included confirmation of securities at March 31, 2009 by correspondence with the custodian and brokers, provide a reasonable basis for our opinion.
PricewaterhouseCoopers LLP
Boston, Massachusetts
May 22, 2009
34
Fund Governance
The Trustees serve terms of indefinite duration. The names, addresses and ages of the Trustees and officers of the Funds in the Columbia Funds Complex, the year each was first elected or appointed to office, their principal business occupations during at least the last five years, the number of Funds overseen by each Trustee and other directorships they hold are shown below. Each officer listed below serves as an officer of each Fund in the Columbia Funds Complex.
Independent Trustees
Name, Address and Age,
Position with Funds, Year First
Elected or Appointed to Office | | Principal Occupation(s) During Past Five Years, Number of Funds in the Columbia
Funds Complex Overseen by Trustee, Other Directorships Held
| |
| Edward J. Boudreau (Born 1944) | |
|
c/o Columbia Management
Advisors, LLC
One Financial Center
Boston, MA 02111
Trustee (since 2005) | | Managing Director—E.J. Boudreau & Associates (consulting), from 2000 through current; oversees 66; no other directorships held. | |
|
| William P. Carmichael (Born 1943) | |
|
c/o Columbia Management
Advisors, LLC
One Financial Center
Boston, MA 02111
Trustee (since 1999) | | Retired. Oversees 66; Director—Cobra Electronics Corporation (electronic equipment manufacturer); Director—Spectrum Brands, Inc. (consumer products); Director—Simmons Company (bedding); Director—The Finish Line (sportswear). | |
|
| William A. Hawkins (Born 1942) | |
|
c/o Columbia Management Advisors, LLC
One Financial Center
Boston, MA 02111
Trustee (since 2005) | | President and Chief Executive Officer—California General Bank, N.A., from January 2008 through current; oversees 66; no other directorships held. | |
|
| R. Glenn Hilliard (Born 1943) | |
|
c/o Columbia Management Advisors, LLC
One Financial Center
Boston, MA 02111
Trustee (since 2005) | | Chairman and Chief Executive Officer—Hilliard Group LLC (investing and consulting), from April 2003 through current; Non-Executive Director & Chairman—Conseco, Inc. (insurance), September 2003 through current; Executive Chairman—Conseco, Inc. (insurance), August 2004 through September 2005; oversees 66. | |
|
| John J. Nagorniak (Born 1944) | |
|
c/o Columbia Management
Advisors, LLC
One Financial Center
Boston, MA 02111
Trustee (since 2008)` | | Retired. President and Director—Foxstone Financial, Inc. (consulting), 2000 through December 2007; Director—Mellon Financial Corporation affiliates (investing), 2000 through 2007; Chairman—Franklin Portfolio Associates (investing—Mellon affiliate), 1982 through 2007; oversees 66; Director—MIT Investment Company; Trustee—MIT 401k Plan; Trustee and Chairman—Research Foundation of CFA Institute. | |
|
35
Fund Governance (continued)
Independent Trustees (continued)
Name, Address and Age,
Position with Funds, Year First
Elected or Appointed to Office | | Principal Occupation(s) During Past Five Years, Number of Funds in the Columbia
Funds Complex Overseen by Trustee, Other Directorships Held
| |
| Anthony M. Santomero* (Born 1946) | |
|
c/o Columbia Management Advisors, LLC
One Financial Center
Boston, MA 02111
Trustee (since 2008) | | Richard K. Mellon Professor Emeritus of Finance, The Wharton School, University of Pennsylvania, from 1972 through current; Senior Advisor—McKinsey & Company (consulting), July 2006 through December 2007; President and Chief Executive Officer—Federal Reserve Bank of Philadelphia, 2000 through April 2006; Director—Renaissance Reinsurance Ltd.; Director—Penn Mutual Life Insurance Company; Director—Citigroup. | |
|
| Minor M. Shaw (Born 1947) | |
|
c/o Columbia Management Advisors, LLC
One Financial Center
Boston, MA 02111
Trustee (since 2003) | | President—Micco Corporation and Mickel Investment Group; oversees 66; Board Member—Piedmont Natural Gas. | |
|
* Mr. Santomero is currently deemed by the Columbia Funds to be an "interested person" (as defined in the 1940 Act) of the Funds because he serves as a Director of Citigroup, Inc. ("Citigroup"), a company that may through subsidiaries and affiliates engage from time-to-time in brokerage execution, principal transactions and lending relationships with the Columbia Funds or other funds or accounts advised/managed by the Advisor.
The Statement of Additional Information includes additional information about the Trustees of the Funds and is available, without charge, upon request by calling 800-345-6611.
36
Fund Governance (continued)
Officers
Name, Address and Year of Birth,
Position with Columbia Funds,
Year First Elected or
Appointed to Office | | Principal Occupation(s) During Past Five Years
| |
| J. Kevin Connaughton (Born 1964) | |
|
One Financial Center
Boston, MA 02111
President (since 2009) | | Managing Director of Columbia Management Advisors, LLC since December 2004; Senior Vice President and Chief Financial Officer—Columbia Funds, from June 2008 to January 2009; Treasurer—Columbia Funds, from October 2003 to May 2008; Treasurer—the Liberty Funds, Stein Roe Funds and Liberty All-Star Funds, December 2000—December 2006; Senior Vice President—Columbia Management Advisors, LLC, from April 2003 to December 2004; President—Columbia Funds, Liberty Funds and Stein Roe Funds, February 2004 to October 2004; Treasurer—Galaxy Funds, September 2002 to December 2005; Treasurer, December 2002 to December 2004, and President, February 2004 to December 2004—Columbia Management Multi-Strategy Hedge Fund, LLC; and a senior officer of various other Bank of America-affiliated entities, including other registered and unregistered funds | |
|
| James R. Bordewick, Jr. (Born 1959) | |
|
One Financial Center
Boston, MA 02111
Senior Vice President, Secretary and Chief Legal Officer (since 2006) | | Associate General Counsel, Bank of America since April 2005; Senior Vice President and Associate General Counsel, MFS Investment Management (investment management) prior to April 2005. | |
|
| Linda J. Wondrack (Born 1964) | |
|
One Financial Center
Boston, MA 02111
Senior Vice President and
Chief Compliance Officer (since 2007) | | Director (Columbia Management Group LLC and Investment Product Group Compliance), Bank of America since June 2005; Director of Corporate Compliance and Conflicts Officer, MFS Investment Management (investment management), August 2004 to May 2005; Managing Director, Deutsche Asset Management (investment management) prior to August 2004. | |
|
| Michael G. Clarke (Born 1969) | |
|
One Financial Center
Boston, MA 02111
Senior Vice President and
Chief Financial Officer (since 2009) | | Director of Fund Administration of the Advisor since January 2006; Managing Director of the Advisor September 2004 to December 2005; Vice President Fund Administration June 2002 to September 2004. | |
|
| Jeffrey R. Coleman (Born 1969) | |
|
One Financial Center
Boston, MA 02111
Treasurer (since 2008) | | Director of Fund Administration of the Advisor since January 2006; Fund Controller of the Advisor from October 2004 to January 2006; Vice President of CDC IXIS Asset Management Services, Inc. (investment management) from August 2000 to September 2004. | |
|
| Joseph F. DiMaria (Born 1968) | |
|
One Financial Center
Boston, MA 02111
Chief Accounting Officer (since 2008) | | Director of Fund Administration of the Advisor since January 2006; Head of Tax/Compliance and Assistant Treasurer of the Advisor from November 2004 to December 2005; Director of Trustee Administration (Sarbanes-Oxley) of the Advisor from May 2003 to October 2004. | |
|
37
Fund Governance (continued)
Officers (continued)
Name, Address and Year of Birth,
Position with Columbia Funds,
Year First Elected or
Appointed to Office | | Principal Occupation(s) During Past Five Years
| |
| Julian Quero (Born 1967) | |
|
One Financial Center
Boston, MA 02111
Deputy Treasurer (since 2008) | | Senior Tax Manager of the Advisor since August 2006; Senior Compliance Manager of the Advisor from April 2002 to August 2006. | |
|
| Barry S. Vallan (Born 1969) | |
|
One Financial Center
Boston, MA 02111
Controller (since 2006) | | Vice President—Fund Treasury of the Advisor since October 2004; Vice President—Trustee Reporting of the Advisor from April 2002 to October 2004. | |
|
38
Board Consideration and Re-Approval of Investment Advisory Agreement
The Board of Trustees of Columbia Funds Series Trust (the "Board"), including a majority of the Trustees who have no direct or indirect interest in the investment advisory agreement and are not "interested persons" of the Trusts, as defined in the 1940 Act (the "Independent Trustees"), are required annually to review and re-approve the existing investment advisory agreement and approve any newly proposed terms therein. In this regard, the Board reviewed and re-approved, during the most recent six months covered by this report, the investment advisory agreement with Columbia Management Advisors, LLC ("CMA") for Corporate Bond Portfolio and Mortgage- and Asset-Backed Portfolio. The investment advisory agreement with CMA is referred to as an "Advisory Agreement." The portfolios identified above are each referred to as a "Portfolio" and collectively referred to as the "Portfolios."
More specifically, at meetings held on November 10-11, 2008, the Board, including the Independent Trustees advised by their independent legal counsel, considered the factors and reached the conclusions described below relating to the selection of CMA and the re-approval of the Advisory Agreement. The Board also reviewed and considered a report prepared and provided by the Independent Fee Consultant (the "Consultant") appointed by the Independent Trustees pursuant to an assurance of discontinuance entered into with the New York Attorney General ("NYAG") to settle a civil complaint filed by the NYAG relating to trading in mutual fund shares (the "NYAG Settlement"). During the fee review process, the Consultant's role was to manage the review process to ensure that fees are negotiated in a manner that is at arms' length and reasonable. The Consultant found that the fee negotiation process was, to the extent practicable, at arms' le ngth and reasonable and consistent with the requirements of the NYAG Settlement. A summary of the Consultant's report is available at www.columbiafunds.com.
In preparation for the November meetings, the Board met in August for review and discussion of the materials described below. The Investment Committee of the Board also met in June to discuss each Portfolio's performance with its respective portfolio manager(s). In addition to these meetings, the Investment Committee receives and discusses performance reports at its quarterly meetings. The Contracts Review Committee also provided support in managing and coordinating the process by which the Board reviewed the Advisory Agreement. The Board's review and conclusions are based on comprehensive consideration of all information presented to them and are not the result of any single controlling factor.
Nature, Extent and Quality of Services. The Board received and considered various data and information regarding the nature, extent and quality of services provided to the Portfolios by CMA under the Advisory Agreement. The most recent investment adviser registration forms ("Forms ADV") for CMA were made available to the Board, as were CMA's responses to a detailed series of requests submitted by the Independent Trustees' independent legal counsel on behalf of such Trustees. The Board reviewed and analyzed those materials, which included, among other things, information about the background and experience of senior management and investment personnel of CMA.
In addition, the Board considered the investment and legal compliance programs of the Portfolios and CMA, including their compliance policies and procedures and reports of the Portfolios' Chief Compliance Officer.
The Board evaluated the ability of CMA, based on its resources, reputation and other attributes, to attract and retain qualified investment professionals, including research, advisory and supervisory personnel. In this regard, the Board considered information regarding CMA's compensation program for its personnel involved in the management of the Portfolios. The Board also considered CMA's investment in further developing its research and trading departments.
Based on the above factors, together with those referenced below, the Board concluded that they were satisfied with the nature, extent and quality of the investment advisory services provided to each of the Portfolios by CMA.
Portfolio Performance and Expenses. The Board considered the performance results for each of the Portfolios over multiple measurement periods. It also considered these results in comparison to the performance results of the group of funds that was determined by Lipper Inc. ("Lipper") to be the most similar to a given Portfolio (the "Peer Group") and to the performance of a broader universe of relevant funds as determined by Lipper (the "Universe"), as well as to each Portfolio's benchmark index. Lipper is an independent provider of investment company data. The Board was provided with a description of the methodology used by Lipper to select the mutual funds in each Portfolio's Peer Group and Universe
39
and considered potential imprecision resulting from the selection methodology. The Board also considered certain risk-adjusted performance data.
The Board noted that no fees or expenses are charged to the Portfolios.
The Board engaged in further review of Mortgage- and Asset-Backed Portfolio because its performance over some periods was appreciably below the median range of its Peer Group. However, the Board noted factors such as the positive performance of the Portfolio over some periods relative to its Peer Group, the on-going restructuring of the Portfolio, and the recent change in the portfolio management team, that outweighed the factor noted above.
Investment Advisory Fee Rates. The Board reviewed and considered the proposed contractual investment advisory fee rates together with the administration fee rates payable by the Portfolios to CMA for investment advisory services (the "Contractual Management Rates"). The Board noted that CMA does not charge the Portfolios an investment advisory fee, but that CMA does receive an advisory fee from the sponsors of wrap programs, who in turn charge the participants in the programs. The Board acknowledged the fees received by CMA from the sponsors in approving the Contractual Management Rates. The Board noted that, on a complex-wide basis, CMA had reduced annual management fees by at least $32 million per year pursuant to the NYAG Settlement. The Board also noted reductions in net advisory rates and/or total expenses of certain funds across the complex. Add itionally, the Board received and afforded specific attention to information comparing the Contractual Management Rates with those of the other funds in their respective Peer Groups.
The Board concluded that the factors noted above supported the Contractual Management Rates, and the approval of the Advisory Agreement for both of the Portfolios.
Profitability. The Board received and considered a detailed profitability analysis of CMA based on the Contractual Management Rates, as well as on other relationships between the Portfolios and other funds in the complex on the one hand and CMA affiliates on the other. The analysis included complex-wide and per-Portfolio information and a comparison of results using alternative allocation methodologies. The Board concluded that, in light of the costs of providing investment management and other services, the profits and other ancillary benefits that CMA and its affiliates received from providing these services were not unreasonable.
Economies of Scale. The Board received and considered information regarding whether there have been economies of scale with respect to the management of the Portfolios, whether the Portfolios have appropriately benefited from any economies of scale and whether there is potential for realization of any further economies of scale. Most particularly, CMA provided information showing that, as a percentage of fund assets, CMA's complex-wide revenues, expenses and profits declined over a four-year period during which fund assets increased by 39% and the shareholder benefit over a two-year period increased from 33% to 41% of the Adviser's total profits. The Board concluded that any potential economies of scale are shared fairly with Portfolio shareholders, most particularly through CMA's assumption of certain Portfolio expenses.
The Board acknowledged the inherent limitations of any analysis of an investment adviser's economies of scale, stemming largely from the Board's understanding that economies of scale are realized, if at all, by an investment adviser across a variety of products and services, not just with respect to a single fund.
Information About Services to Other Clients. The Board also received and considered information about the nature and extent of services and fee rates offered by CMA to its other clients, including separate accounts and institutional investors. In this regard, the Board concluded that, because the Contractual Management Rates are zero, no further analysis was required.
Other Benefits to CMA. The Board received and considered information regarding any "fall-out" or ancillary benefits received by CMA and its affiliates as a result of their relationship with the Portfolios. Such benefits could include, among others, benefits attributable to CMA's relationships with the Portfolios (such as soft-dollar credits) and benefits potentially derived from an increase in CMA's business as a result of their relationship with the Portfolios (such as the ability to market to shareholders other financial products offered by CMA and its affiliates).
The Board considered the effectiveness of the policies of the Portfolios in achieving the best execution of portfolio transactions, whether and to what extent soft dollar credits are
40
sought and how any such credits are utilized, any benefits that may be realized by using an affiliated broker, the extent to which efforts are made to recapture transaction costs, and the controls applicable to brokerage allocation procedures. The Board also reviewed CMA's methods for allocating portfolio investment opportunities among the Portfolios and other clients. The Board concluded that the benefits were not unreasonable.
Other Factors and Broader Review. As discussed above, the Board reviews materials received from CMA annually as part of the re-approval process under Section 15(c) of the 1940 Act. The Board also reviews and assesses the quality of the services the Portfolios receive throughout the year. In this regard, the Board and its Committees review reports of CMA at each of their quarterly meetings, which include, among other things, Portfolio performance reports. In addition, the Board and its Committees confer with portfolio managers at various times throughout the year including, most particularly, in the June Investment Committee meeting.
Conclusion. After considering the above-described factors based on their deliberations and their evaluation of the information provided, the Board concluded that the compensation payable to CMA under the Advisory Agreement is fair and equitable. Accordingly, the Board unanimously re-approved the Advisory Agreement.
41
Summary of Management Fee Evaluation by
Independent Fee Consultant
EXCERPTS FROM REPORT OF INDEPENDENT FEE CONSULTANT TO THE FUNDS SUPERVISED BY THE COLUMBIA NATIONS BOARD
Prepared pursuant to the February 9, 2005
Assurance of Discontinuance among the
Office of Attorney General of New York State,
Columbia Management Advisors, LLC and
Columbia Management Distributors, Inc.
November 12, 2008
I. Overview
On February 9, 2005, Columbia Management Advisors, LLC ("CMA") and Columbia Management Distributors, Inc.1 ("CMD") agreed to the New York Attorney General's Assurance of Discontinuance ("AOD"). Among other matters, the AOD stipulates that CMA may manage or advise a Columbia Fund ("Columbia Fund" and together with all such funds or a group of such funds as the "Columbia Funds") only if the Independent Members of the Columbia Fund's Board of Trustees appoint a Senior Officer or retain an Independent Fee Consultant ("IFC") who is to manage the process by which proposed management fees are negotiated. The AOD further stipulates that the Senior Officer or IFC is to prepare a written annual evaluation of the fee negotiation process.
With effect from January 1, 2007, the Independent Members of the Board of Trustees for certain Columbia Funds known collectively as the "Nations Funds" (the "Trustees") retained me as IFC for the Nations Funds.2 In this capacity, I have prepared the fourth annual written evaluation of the fee negotiation process. As was the case with last year's report (the "2007 Report") my immediate predecessor as IFC, John Rea, provided invaluable assistance in the preparation of this year's report.
A. Role of the Independent Fee Consultant
The AOD charges the IFC with "managing the process by which proposed management fees...to be charged the Columbia Fund are negotiated so that they are negotiated in a manner which is at arms' length and reasonable and consistent with this Assurance of Discontinuance." The AOD also provides that CMA "may manage or advise a Columbia Fund only if the reasonableness of the proposed management fees is determined by the Board of Trustees...using...an annual independent written evaluation prepared by or under the direction of...the Independent Fee Consultant." Therefore, the AOD makes clear that the IFC does not supplant the Trustees in negotiating management fees with CMA, nor does the IFC substitute his or her judgment for that of the Trustees with respect to the reasonableness of proposed fees or any other matter that is committed to the business judgment of the Trustees.
B. Elements Involved in Managing the Fee Negotiation Process
In preparing the report required by the AOD, the IFC must consider at least the following six factors set forth in the AOD:
1. The nature and quality of CMA's services, including the Fund's performance;
2. Management fees (including any components thereof) charged by other mutual fund companies for like services;
3. Possible economies of scale as the Fund grows larger;
4. Management fees (including any components thereof) charged to institutional and other clients of CMA for like services;
5. Costs to CMA and its affiliates of supplying services pursuant to the management fee agreements, excluding any intra-corporate profit; and
6. Profit margins of CMA and its affiliates from supplying such services.
C. Organization of the Annual Evaluation
This report, like last year's, focuses on the six factors and contains a section for each factor except that CMA's costs and profits from managing the Funds have been combined into a single section. In addition to a discussion of these factors, the report offers recommendations to improve the fee review process in future years. A review of the status of recommendations made in the 2007 Report is being provided separately with the materials for the November meeting.
1 CMA and CMD are subsidiaries of Columbia Management Group, LLC ("CMG"), and are the successors to the entities named in the AOD.
2 I have no material relationship with Bank of America, CMG or any of its affiliates, aside from serving as IFC, and I am aware of no material relationship with any of their affiliates. I retained John Rea, an independent economic consultant, to assist me with this report.
Unless otherwise stated or required by the context, this report covers only the Nations Funds, which are also referred as the "Funds."
42
II. Summary of Findings
A. General
1. Based upon my examination of the information supplied by CMG in the light of the six factors set forth in the AOD, I conclude that the Trustees have the relevant information necessary to evaluate the reasonableness of the proposed management fees for each Nations Fund.
2. In my view, the process by which the proposed management fees of the Funds have been negotiated in 2008 thus far has been, to the extent practicable, at arms' length and reasonable and consistent with the AOD.
B. Nature and Quality of Services, Including Performance
3. The performance of the Funds has been relatively good for the most recent 1-, 3- and 5-year periods. The strongest records were posted by the Funds in the Active Equity and Quantitative Strategies Groups and by the sub-advised Funds. The 5-year performance rankings of the subadvised Funds were particularly strong, with all such Funds in the top two performance quintiles.
4. The 1- and 3-year performance records of the Funds declined slightly from 2007 to 2008, while the 5-year performance records improved year-over-year. Most Funds changed their 1-year performance quintile year-over-year, while the 5-year rankings were, as expected, much more stable, with less than half the Funds moving to a different 5-year performance quintile.
5. The performance of the actively-managed equity and sub-advised Funds against their benchmarks was strong, especially for the 1- and 3-year performance periods. However, no fixed-income Fund with a reliable benchmark exceeded it on a net basis in any performance period. Money market Funds do not have such benchmarks and therefore were excluded from this analysis.
6. The Nations equity Funds' overall performance adjusted for risk was strong. The performance of 13 of the 19 actively-managed Funds included in the risk analysis bettered the median in 3-year performance adjusted and unadjusted for risk. No relationship between risk and return was detected for fixed-income Funds.
7. The industry-standard procedure used by third parties such as Lipper and Morningstar to construct the performance universe in which each Fund's performance is ranked relative to comparable funds tends to bias a Fund's ranking upward within that universe. The bias occurs because either no-12b-1-fee or A share classes of the Funds are compared to the performance universe that includes all share classes of competitive multi-class funds. Therefore, the procedure ranks shares with zero or 25 basis point 12b-1 fees against classes of competitive funds with 12b-1 fees of up to 100 basis points. Correcting this bias by limiting the performance universe to classes of competitive funds with comparable 12b-1 fees in most cases lowers the relative performance for the Funds but does not call into question the general finding that the Nations Funds' performance has been strong.
8. A small number of Funds have consistently underperformed their peers in each of the past four years, depending on the exact criteria used to measure long-term underperformance. For example, one Fund has had below-median 1- and 3-year performance in each of the past four years; one additional Fund had below-median 3-year performance for those years.
9. The services performed by CMG professionals beyond portfolio management, such as compliance, legal, information technology, risk management, finance and fund administration, are critical to the success of the Funds and appear to be of high quality.
C. Management Fees Charged by Other Mutual Fund Companies
10. The Funds' management fees and total expenses are generally low relative to those of their peers, with the exception of subadvised Funds. Almost two-third of the Funds ranked in the two least expensive quintiles for total expenses and just over half were in those quintiles for actual management fees. Funds with lower actual management fees tended to have lower relative total expenses. All fixed-income Funds had total expenses in the two least expensive quintiles.
11. Generally, the Nations Funds with the highest relative fees and expenses are sub-advised. All eight Nations Funds with fifth-quintile total expense rankings were sub-advised. The actual management fees of 11 of the 14 sub-advised
43
Funds were in the fourth and fifth quintile. The average management fees of the sub-advised Funds were typically 20 points higher than internally-managed equity Funds. CMA presented data suggesting that such differentials were consistent with industry practice.
12. The management fees of the internally-advised Nations Funds are generally in line with those of Columbia Funds overseen by the Atlantic and Acorn/Wanger Boards of Trustees.
D. Trustees' Fee and Performance Evaluation Process
13. The Trustees' evaluation process identified 20 Funds in 2008 for further review based upon their relative performance or expenses or both. When compared in filtered universes, three more Funds met the criteria for review.
E. Potential Economies of Scale
14. CMG has prepared a memo for the Trustees containing its views on the sources and sharing of potential economies of scale. CMG views economies of scale as arising at the complex level and would regard estimates of scale economies for individual funds as unreliable. In its analysis, CMG did not identify specific sources of economies of scale or provide any estimates of any economies of scale that might arise from future asset growth. CMG's analysis included measures taken by the Trustees and CMG that seek to share any potential economies of scale through breakpoints in management fee schedules, expense reimbursements, fee waivers, enhanced shareholder services, fund mergers, and operational consolidation.
15. An examination of the management fee schedules of a selected number of the Nations Funds suggests that, as a general matter, the breakpoint schedules of these Funds are not out of line with those of competitors. A similar examination of five other Nations Funds in 2007 led to the same conclusion.
F. Management Fees Charged to Institutional Clients
16. CMG has provided Trustees with comparisons of mutual fund management fees and institutional fees based upon standardized fee schedules and actual fees. The results show that, consistent with industry practice, institutional fees are generally lower than the Funds' management fees. However, because the services provided and risks borne by the manager are more extensive for mutual funds than for institutional accounts, the differences are of limited value in assisting the Trustees in their review of the reasonableness of the Funds' management fees.
G. Revenues, Expenses, and Profits
17. The activity-based cost allocation methodology ("ABC") employed by CMG to allocate costs for purposes of calculating Fund profitability, both direct and indirect, for purposes of calculating Fund profitability is thoughtful and detailed. For comparison, CMG proposed a change to the method by which indirect expenses were allocated. Under this "hybrid" method, such costs are allocated to Funds 50% by assets and 50% per fund. Allocating indirect expenses equally to each Fund has an intuitive logic, as each Fund regardless of size has certain expenses, such as preparing and printing prospectuses and financial statements.
18. The materials provided on CMG's revenues and expenses with respect to the Funds and the methodology underlying their construction generally form a sufficient basis for Trustees to evaluate CMG's expenses and profitability for each Fund.
19. In 2007, CMG's complex-wide pre-tax margins on the Nations Funds were close to the industry average before distribution and below average when distribution revenues and expenses were included, based on limited data available about publicly-held mutual fund managers. However, as is to be expected in a complex comprising 65 Funds, some Nations Funds have higher pre-tax profit margins, when calculated solely with respect to management revenues and expenses, while other Nations Funds operate at a loss. A pro forma analysis of the complex's profitability taking into account expenses incurred in 2008 associated with support of the money market funds sharply reduced the profitability of the Nations Funds. There is a positive relationship between fund size and profitability, with smaller Funds generally operating at a loss.
44
20. CMG shares a fixed percentage of its management fee revenues with an affiliate, U.S. Trust, Bank of America Private Wealth Management, to compensate that affiliate for services it performs with respect to Nations Fund assets held for the benefit of its customers. Based on our analysis of the services provided by the affiliate, we believe all such payments should be regarded as a distribution expense, except for any portion attributable to payments by CMG for performance of sub-transfer agency or sub-accounting functions.
III. Recommendations
1) Criteria for review. The Trustees may wish to consider modifying the criteria for classifying a fund as a "Review Fund" to include criteria that focus exclusively on performance without regard to expense or fee levels. For example, a Fund whose one-year or three-year performance was median or below for four consecutive years could be treated as a Review Fund. Applying such criteria would add two Funds to the list of Review Funds.
2) Profitability data. CMG should present to the Trustees each year the profitability of each Fund, each investment style, and each complex (of which Nations is one) calculated as follows:
Exhibit 1. Management-only profitability should be calculated without reference to any Private Bank expense.
Exhibit 2. Profitability excluding distribution (which essentially covers the management and transfer agency functions) should be adjusted by removing from the expense calculation any portion of the Private Bank payment not attributable to the performance by the Private Bank of sub-transfer agency or sub-accounting functions.
Exhibit 3. Total profitability, including distribution: No adjustment for Private Bank expenses should be made, because all such expenses represent legitimate fund expenses to be taken into account in calculating CMG's profit margin including distribution.
Exhibit 4. Distribution only: This should include all Private Bank expenses other than those attributable to sub-transfer agency services.
Therefore, the following data need not be provided:
1. Adjusting total profitability data for Private Bank expenses
2. Adjusting profitability excluding distribution by backing out all Private Bank expenses.
3) Economies of scale. CMG and the IFC should continue to work on methods for more precisely quantifying to the extent possible the sources and magnitude of any economies of scale as CMG's mutual fund assets under management increase, to the extent that the data allows for meaningful year-over-year comparisons. The framework suggested in Section IV.D.4 may prove to be a useful model for such an analysis.
4) Competitive breakpoint analysis. As part of the annual fee evaluation process, the breakpoints of a select group of Nations Funds (which would differ each year) should continue to be compared to those of industry rivals to ensure that the Funds' breakpoint schedules remain within industry norms. As breakpoint schedules change relatively little each year, performing such a comparison for all Funds each year would not be an efficient use of Trustee and CMG resources.
5) Cost allocation methodology. CMG's point that the current ABC system of allocating indirect expenses creates anomalous results in several cases, including sub-advised Funds, is well-taken. We would like to work with CMG over the forthcoming year on alternatives to the current system of allocating indirect expenses that (1) resolve the anomalies, (2) limit the amount of incremental effort on CMG's part and (3) remain faithful to the general principle that expenses should be allocated by time and effort to the extent reasonably possible.
6) Management fee disparities. CMG and the Nations Trustees, as part of any future study of management fees, should analyze any differences in management fee schedules between Funds managed in similar investment styles. As part of that analysis, CMG should provide an explanation for any significant fee differences among comparable funds
45
across fund families managed by CMA, such as differences in the management styles of different Funds included the same Lipper category. Finally, whenever CMG proposes a management fee change or an expense cap for any mutual fund managed by CMA that is comparable to any Nations Fund, CMG should provide the Trustees with sufficient information about the proposal to allow the Trustees to assess the applicability of the proposed change to the relevant Nations Fund or Funds.
7) Tax-exempt Fund expense data. The expense rankings of certain tax-exempt Funds were adversely affected by including certain investment-related interest expenses that Lipper excluded in calculating the expense ratios of competitors. We recommend that CMG follow the Lipper practice and exclude such interest expenses from data submitted to Lipper to avoid unfairly disadvantaging the tax-exempt Funds.
8) Reduction of volume of paper documents submitted. The effort to rationalize and simplify the data presented to the Trustees and the process by which that data was prepared and organized was regarded as a success by all parties. We should continue to look for opportunities to reduce and simplify the presentation of 15(c) data, especially in the area of Fund and manager profitability. The Fund "Dashboard" volume presents a large volume of Fund data on a single page. If it is continued, the Trustees may wish to consider receiving the underlying Lipper data on CD, rather than the current paper volumes.
* * *
Respectfully submitted,
Steven E. Asher
46
This page intentionally left blank.
This page intentionally left blank.
Important Information About This Report – Fixed Income Sector Portfolios
The portfolios mail one shareholder report to each shareholder address. If you would like more than one report, please call shareholder services at 1-800-345-6611 and additional reports will be sent to you. This report has been prepared for shareholders of Fixed Income Sector Portfolios.
A description of the policies and procedures that each portfolio uses to determine how to vote proxies and a copy of each portfolio's voting records are available (i) at www.columbiamanagement.com; (ii) on the Securities and Exchange Commission's website at www.sec.gov, and (iii) without charge, upon request, by calling 1-800-368-0346. Information regarding how each portfolio voted proxies relating to portfolio securities during the 12-month period ended June 30 is available from the SEC's website. Information regarding how each portfolio voted proxies relating to portfolio securities is also available from the portfolios' website, www.columbiamanagement.com.
Each portfolio files a complete schedule of portfolio holdings with the SEC for the first and third quarters of each fiscal year on Form N-Q. Each portfolio's Form N-Q is available on the SEC's website at www.sec.gov and may be reviewed and copied at the SEC's Public Reference Room in Washington, DC. Information on the operation of the Public Reference Room may be obtained by calling 1-800-SEC-0330.
Please read and consider the investment objectives, risks, charges and expenses for any fund carefully before investing. For a prospectus which contains this and other important information about a portfolio, contact your Columbia Management representative or financial advisor.
Columbia Management Group, LLC ("Columbia Management") is the investment management division of Bank of America Corporation. Columbia Management entities furnish investment management services and products for institutional and individual investors. Columbia Funds are distributed by Columbia Management Distributors, Inc., member of FINRA and SIPC, part of Columbia Management and an affiliate of Bank of America Corporation.
Transfer Agent
Columbia Management Services, Inc.
P.O. Box 8081
Boston, MA 02266-8081
1-800-345-6611
Distributor
Columbia Management
Distributors, Inc.
One Financial Center
Boston, MA 02111
Investment Advisor
Columbia Management Advisors, LLC
100 Federal Street
Boston, MA 02110
49
Columbia Management®
One Financial Center
Boston, MA 02111-2621
PRSRT STD
U.S. Postage
PAID
Holliston, MA
Permit NO. 20
Columbia Management®
Fixed Income Sector Portfolios
Annual Report, March 31, 2009
©2009 Columbia Management Distributors, Inc.
One Financial Center, Boston, MA 02111-2621
800-345-6611 www.columbiafunds.com
SHC-42/10747-0309 (05/09) 09/79010
Columbia Management®
Annual Report
March 31, 2009
Columbia LifeGoalTM Portfolios
g Columbia LifeGoalTM Growth Portfolio
g Columbia LifeGoalTM Balanced Growth Portfolio
g Columbia LifeGoalTM Income and Growth Portfolio
g Columbia LifeGoalTM Income Portfolio
| NOT FDIC INSURED | | May Lose Value | |
|
| NOT BANK ISSUED | | No Bank Guarantee | |
|
Table of Contents
| Economic Update | | | 1 | | |
|
| LifeGoalTM Growth Portfolio | | | 3 | | |
|
LifeGoalTM Balanced
Growth Portfolio | | | 8 | | |
|
LifeGoalTM Income and
Growth Portfolio | | | 13 | | |
|
| LifeGoalTM Income Portfolio | | | 18 | | |
|
| Investment Portfolios | | | 23 | | |
|
Statements of Assets and
Liabilities | | | 27 | | |
|
| Statements of Operations | | | 29 | | |
|
Statements of Changes in
Net Assets | | | 30 | | |
|
| Financial Highlights | | | 36 | | |
|
| Notes to Financial Statements | | | 55 | | |
|
Report of Independent Registered
Public Accounting Firm | | | 65 | | |
|
| Federal Income Tax Information | | | 66 | | |
|
| Fund Governance | | | 67 | | |
|
Board Consideration and
Re-Approval of Investment
Advisory Agreement | | | 71 | | |
|
Summary of Management Fee
Evaluation by Independent
Fee Consultant | | | 74 | | |
|
Important Information About
This Report | | | 81 | | |
|
The views expressed in this report reflect the current views of the respective parties. These views are not guarantees of future performance and involve certain risks, uncertainties and assumptions that are difficult to predict so actual outcomes and results may differ significantly from the views expressed. These views are subject to change at any time based upon economic, market or other conditions and the respective parties disclaim any responsibility to update such views. These views may not be relied on as investment advice and, because investment decisions for a Columbia Fund are based on numerous factors, may not be relied on as an indication of trading intent on behalf of any particular Columbia Fund. References to specific securities should not be construed as a recommendation or investment advice.
President's Message

Dear Shareholder:
Recent events have shown great volatility in the markets and uncertainty in the economy. During these challenging times, it becomes even more important to focus on long-term horizons and key investment tools that can help manage volatility. This may be the time to reflect on your investment goals and evaluate your portfolio to ensure you are positioned for any potential market rebound.
A long-term financial plan can serve as a road map and guide you through the necessary steps designed to meet your financial goals. Your financial plan should take into account your investment goals, time horizon, overall financial situation, risk tolerance and willingness to ride out market volatility. Your investment professional can be a key resource as you work through this process. The knowledge and experience of an investment professional can help as you create or reevaluate your investment strategy.
The importance of diversification
Although diversification does not ensure a profit or guarantee against loss, a diversified portfolio can be a strategy for successful long-term investing. Diversification refers to the mix of investments within a portfolio. A mutual fund can contribute to portfolio diversification given that a mutual fund's portfolio represents several investments. Additionally, the way you allocate your money among stocks, bonds and cash, and geographically between foreign and domestic investments, can help to reduce risks. Diversification can result in multiple investments where the positive performance of certain holdings can offset any negative performance from other holdings. Having a diversified portfolio doesn't mean that the value of the portfolio will never go down, but rather helps strike a balance between risk and reward.
Reevaluate your strategy
An annual review of your investments is a key opportunity to determine if your investment needs have changed or if you need minor adjustments to rebalance your portfolio. Life events like a birth, marriage, home improvement, or change in employment can have a major affect on your spending and goals. Ask yourself how your spending or goals have changed and factor this into your financial plan. Are you using automated investments or payroll deductions to help keep your savings on track? Are you able to set aside additional savings or increase your 401(k) plan contributions? If during your review you find that your investments in any one category (e.g., stocks, bonds or cash) have grown too large based on your diversification plan, you may want to consider redirecting future investments to get back on track.
History has shown that the U.S. stock market has been remarkably resilient over the long term.1 Volatility can lead to opportunity. Patience and a commitment to your long-term financial plan may position you to potentially benefit over your investment horizon. We appreciate your business and continued support of Columbia Funds.
Sincerely,

J. Kevin Connaughton
President, Columbia Funds
The board of trustees elected J. Kevin Connaughton president of Columbia Funds on January 16, 2009.
1The Dow Jones Industrial Average is the most widely used indicator of the overall condition of the stock market. The Dow Jones Industrial Average Index is a price-weighted average of 30 actively traded blue-chip stocks as selected by the editors of the Wall Street Journal. Indices are not investments, do not incur fees or expenses and are not professionally managed. It is not possible to invest directly in an index.
Economic Update – LifeGoal Portfolios
Economic growth ground to a halt during the 12-month period that began April 1, 2008 and ended March 31, 2009. The National Bureau of Economic Research reported that the U.S. economy had slipped into recession late in 2007 and the downturn was even sharper than anticipated.
A host of factors weighed on consumers and businesses alike. The most severe housing downturn in decades showed few signs of abating as inventories of homes for sale rose, home prices declined and tighter credit standards, the result of continued turmoil in the subprime mortgage market, made it more difficult for homebuyers to qualify for loans. The labor market has contracted for 15 consecutive months, driving the unemployment rate to 8.5%. More than five million jobs have been lost since the recession commenced late in 2007, with nearly two-thirds of the decrease occurring in the most recent five months. Manufacturing activity slowed and consumer spending declined, resulting in one of the weakest holiday seasons in decades.
However, in March there were a few signs that this severe recession is no longer intensifying. Weekly chain store sales and mortgage purchase applications gained some momentum near the end of the period. The trade deficit has narrowed more than expected, raising hopes that first quarter real GDP will contract at a rate well below the fourth quarter's negative 6.3%.
A weakening economy and turmoil in the financial markets took a toll on consumer confidence, which continued to set new all-time lows during the period. However, the monthly Conference Board gauge was nearly unchanged in March, another indication that the worst could be behind us.
In an effort to restore confidence in the capital markets, loosen the reins on credit and shore up economic growth, the Federal Reserve Board (the Fed) brought a key short-term rate—the federal funds rate—down from 2.25% to a target between zero and 0.25% during the 12-month period—a record low. However, the Fed's efforts went largely unrewarded. The one bright spot during this period of uncertainty was lower energy and commodity prices. With oil trading near $50 per barrel at the end of the period, gasoline prices have come down from $4 per gallon or more last summer to just over $2 per gallon in recent months.
Stocks retreat as economic outlook darkens
Against a weakening economic backdrop, the U.S. stock market lost 38.09% for the 12-month period, as measured by the S&P 500 Index.1 Losses affected the stocks of companies of all sizes and investment style categories, although growth stocks held up better than value stocks, as measured by their respective Russell indices.2 Stock markets outside the U.S. suffered even greater losses. The MSCI EAFE Index,3 a broad gauge of stock market performance in foreign developed markets, lost 46.51% (in U.S. dollars)
1The Standard & Poor's (S&P) 500 Index tracks the performance of 500 widely held, large-capitalization U.S. stocks.
2The Russell 1000® Index measures the performance of 1,000 of the largest U.S. companies, based on market capitalization. The Russell Midcap Index measures the performance of the 800 smallest companies in the Russell 1000 Index, as ranked by total market capitalization. The Russell 2000 Index measures the performance of the 2,000 smallest of the 3,000 largest U.S. companies, based on market capitalization.
3The Morgan Stanley Capital International (MSCI) Europe, Australasia, Far East (EAFE) Index is a free float-adjusted market capitalization index that is designed to measure developed market equity performance, excluding the U.S. and Canada.
Summary
For the 12-month period that ended March 31, 2009
g The broad U.S. stock market, as measured by the S&P 500 Index, returned negative 38.09%. Stock markets outside the United States returned negative 46.51%, as measured (in U.S. dollars) by the MSCI EAFE Index.
| S&P Index | | MSCI Index | |
|
 | |  | |
|
g Despite volatility in many segments of the bond market, the Barclays Capital U.S. Aggregate Bond Index delivered a modest gain. High-yield bonds lost ground, as measured by the Merrill Lynch High Yield U.S. Corporates, Cash Pay Index. Municipals recovered from an early setback, as measured by the Barclays Capital Municipal Bond Index.
Barclays Capital
Aggregate Index | | Merrill
Lynch Index | |
|
 | |  | |
|
Barclays Capital
Municipal Index | | | |
|
 | | | |
|
1
Economic Update (continued) – LifeGoal Portfolios
for the period. Emerging stock markets, which generally have had a strong run over the past several years, were also caught in the downdraft. As investors backed away from risk, the MSCI Emerging Markets Index4 returned negative 47.07% (in U.S. dollars).
Some bond market segments delivered positive returns
The U.S. bond market seesawed during the 12-month period, but several sectors managed to deliver modest gains as investors sought refuge from the volatile stock market. Treasury prices rose and yields declined as the economy faltered and stock market volatility increased. The benchmark 10-year U.S. Treasury yield ended the period at 2.70%. In this environment, the Barclays Capital U.S. Aggregate Bond Index5 (formerly the Lehman Brothers U.S. Aggregate Bond Index) returned 3.13%. High-yield bond prices fell sharply as economic prospects weakened and default fears rose. The Merrill Lynch High Yield U.S. Corporates, Cash Pay Index6 returned negative 19.95%. The municipal market suffered a setback early in 2008, then rebounded in the first quarter of 2009. The Barclays Capital Municipal Bond Index7 returned 2.27% for the 12-month period.
Past performance is no guarantee of future results.
4The Morgan Stanley Capital International (MSCI) Emerging Markets Index is a widely accepted index composed of a sample of companies from 25 countries representing the global emerging stock markets.
5The Barclays Capital U.S. Aggregate Bond Index is a market value-weighted index that tracks the daily price, coupon, pay-downs and total return performance of fixed-rate, publicly placed, dollar-denominated and nonconvertible investment grade debt issues with at least $250 million par amount outstanding and with at least one year to final maturity.
6The Merrill Lynch High Yield U.S. Corporates, Cash Pay Index tracks the performance of non-investment-grade corporate bonds. As of 01/01/2009, Merrill Lynch & Co., Inc. is a wholly-owned subsidiary of Bank of America Corporation and an affiliate of Columbia Management.
7The Barlcays Capital Municipal Bond Index is considered representative of the broad market for investment-grade, tax-exempt bonds with maturities of at least one year.
Indices are not available for investment, and do not reflect sales charges, fees, brokerage commissions, taxes or other expenses of investing. Securities in the fund may not match those in an index.
2
Portfolio Profile – Columbia LifeGoal Growth Portfolio
Summary
g For the 12-month period that ended March 31, 2009, the portfolio's Class A shares returned negative 37.62% without sales charge.
g In an environment of contracting economic growth and sharply falling stock prices, the portfolio held up slightly better than its benchmark, the S&P 500 Index, and performed in line with the average return of its peer group, the Lipper Large-Cap Core Funds Classification.1
g A decision to underweight international markets and increase exposure to small-cap stocks contributed favorably to returns. However, exposure to emerging markets detracted from performance.
Portfolio Management
Anwiti Bahuguna, PhD has co-managed the portfolio since February 2009 and has been with the advisor or its predecessors or affiliate organizations since 2002.
Colin Moore has co-managed the portfolio since February 2009 and has been with the advisor or its predecessors or affiliate organizations since 2002.
Kent M. Peterson, PhD has co-managed the portfolio since February 2009 and has been with the advisor or its predecessors or affiliate organizations since 2006.
Marie M. Schofield has co-managed the portfolio since February 2009 and has been with the advisor or its predecessors or affiliate organizations since 1990.
1Lipper Inc., a widely respected data provider in the industry, calculates an average total return (assuming reinvestment of distributions) for mutual funds with investment objectives similar to those of the fund. Lipper makes no adjustment for the effect of sales loads.
Performance data quoted represents past performance and current performance may be lower or higher. Past performance is no guarantee of future results. The investment return and principal value will fluctuate so that shares, when redeemed, may be worth more or less than the original cost. Please visit www.columbiafunds.com for daily and most recent month-end performance updates.
Summary
1-year return as of 03/31/09
| | | –37.62% | |
|
 | | Class A shares
(without sales charge) | |
|
| | | –38.09% | |
|
 | | S&P 500 Index | |
|
Morningstar Style BoxTM

The Morningstar Style BoxTM reveals a portfolio's investment strategy. For equity portfolios, the vertical axis shows the market capitalization of the stocks owned, and the horizontal axis shows a portfolio's investment style (value, blend or growth). Information shown is based on the most recent data provided by Morningstar.
3
Performance Information – Columbia LifeGoal Growth Portfolio
Performance data quoted represents past performance and current performance may be lower or higher. Past performance is no guarantee of future results. The investment return and principal value will fluctuate so that shares, when redeemed, may be worth more or less than the original cost. Please visit www.columbiafunds.com for daily and most recent month-end performance updates.
Annual operating expense ratio (%)*
| Class A | | | 1.47 | | |
| Class B | | | 2.22 | | |
| Class C | | | 2.22 | | |
| Class R | | | 1.72 | | |
| Class Z | | | 1.22 | | |
*The annual operating expense ratio is as stated in the portfolio's prospectus that is current as of the date of this report and includes the expenses incurred by the underlying funds in which the portfolio invests. Differences in expense ratios disclosed elsewhere in this report may result from including expenses incurred by the underlying funds, fee waivers and expense reimbursements as well as different time periods used in calculating the ratios.
Performance of a $10,000 investment 04/01/99 – 03/31/09
The chart above shows the change in value of a hypothetical $10,000 investment in Class A shares of Columbia LifeGoal Growth Portfolio during the stated time period and does not reflect the deduction of taxes that a shareholder may pay on portfolio distributions or on the redemption of portfolio shares. The Standard & Poor's (S&P) 500 Index tracks the performance of 500 widely held, large-capitalization U.S. stocks. Indices are not available for investment, and do not reflect sales charges, fees, brokerage commissions, taxes or other expenses of investing. Securities in the portfolio may not match those in an index.
Performance of a $10,000 investment 04/01/99 – 03/31/09 ($)
| Sales charge | | without | | with | |
| Class A | | | 10,435 | | | | 9,836 | | |
| Class B | | | 9,672 | | | | 9,672 | | |
| Class C | | | 9,672 | | | | 9,672 | | |
| Class R | | | 10,348 | | | | n/a | | |
| Class Z | | | 10,685 | | | | n/a | | |
Average annual total return as of 03/31/09 (%)
| Share class | | A | | B | | C | | R | | Z | |
| Inception | | 10/15/96 | | 08/12/97 | | 10/15/96 | | 01/23/06 | | 10/15/96 | |
| Sales charge | | without | | with | | without | | with | | without | | with | | without | | without | |
| 1-year | | | –37.62 | | | | –41.22 | | | | –37.99 | | | | –40.46 | | | | –37.99 | | | | –38.49 | | | | –37.76 | | | | –37.38 | | |
| 5-year | | | –2.91 | | | | –4.06 | | | | –3.61 | | | | –3.88 | | | | –3.61 | | | | –3.61 | | | | –3.07 | | | | –2.62 | | |
| 10-year | | | 0.43 | | | | –0.17 | | | | –0.33 | | | | –0.33 | | | | –0.33 | | | | –0.33 | | | | 0.34 | | | | 0.66 | | |
The "with sales charge" returns include the maximum initial sales charge of 5.75% for Class A shares, the applicable contingent deferred sales charge of 5.00% in the first year, declining to 1.00% in the sixth year and eliminated thereafter for Class B shares and 1.00% for Class C shares for the first year only. The "without sales charge" returns do not include the effect of sales charges. If they had, returns shown would be lower.
Performance results reflect any fee waivers or reimbursements of portfolio expenses by the investment advisor and/or any of its affiliates. Absent these fee waivers or expense reimbursement arrangements, performance results shown would have been lower.
All results shown assume reinvestment of distributions. Class Z shares are sold at net asset value with no distribution and service (Rule 12b-1) fees. Class R shares are sold at net asset value with distribution and service (Rule 12b-1) fees. Class R and Class Z shares have limited eligibility and the investment minimum requirements may vary. Please see the portfolio's prospectus for details. Performance for different share classes will vary based on differences in sales charges and fees associated with each class.
The tables do not reflect the deduction of taxes that a shareholder may pay on portfolio distributions or on the redemption of portfolio shares.
The inception date of the portfolio's Class R shares is January 23, 2006. Class R shares have no performance prior to their inception date. The performance shown for Class R shares prior to their inception date is that of Class A shares. If Class R shares fees and expenses were included, performance would be lower.
4
Understanding Your Expenses – Columbia LifeGoal Growth Portfolio
As a portfolio shareholder, you incur two types of costs. There are transaction costs, which generally include sales charges on purchases and may include redemption fees or exchange fees. There are also ongoing costs, which generally include investment advisory fees, distribution and service (Rule 12b-1) fees and other portfolio expenses. The information on this page is intended to help you understand the ongoing costs of investing in the portfolio and to compare these costs with the ongoing costs of investing in other mutual funds.
Analyzing your portfolio's expenses by share class
To illustrate these ongoing costs, we have provided an example and calculated the expenses paid by investors in each share class during the period. The information in the following table is based on an initial investment of $1,000, which is invested at the beginning of the period and held for the entire period. Expense information is calculated two ways and each method provides you with different information. The amount listed in the "Actual" column is calculated using the portfolio's actual operating expenses and total return for the period. The amount listed in the "Hypothetical" column for each share class assumes that the return each year is 5% before expenses and is calculated based on the portfolio's actual operating expenses. You should not use the hypothetical account values and expenses to estimate either your actual account balance at the end of the period or the expenses you paid during this period.
Compare with other funds
Since all mutual funds are required to include the same hypothetical calculations about expenses in shareholder reports, you can use this information to compare the ongoing cost of investing in the portfolio with other funds. To do so, compare the 5% hypothetical example with the 5% hypothetical examples that appear in the shareholder reports of other funds. As you compare hypothetical examples of other funds, it is important to note that hypothetical examples are meant to highlight the ongoing costs of investing in a fund and do not reflect any transaction costs, such as sales charges, redemption fees or exchange fees.
Estimating your actual expenses
To estimate the expenses that you paid over the period, first you will need your account balance at the end of the period:
g For shareholders who receive their account statements from Columbia Management Services, Inc., your account balance is available online at www.columbiafunds.com or by calling Shareholder Services at 800.345.6611.
g For shareholders who receive their account statements from their financial intermediary, contact your financial intermediary to obtain your account balance.
1. Divide your ending account balance by $1,000. For example, if an account balance was $8,600 at the end of the period, the result would be 8.6.
2. In the section of the table below titled "Expenses paid during the period," locate the amount for your share class. You will find this number in the column labeled "Actual." Multiply this number by the result from step 1. Your answer is an estimate of the expenses you paid on your account during the period.
If the value of your account falls below the minimum initial investment requirement applicable to you, your account generally will be subject to a $20 annual fee. This fee is not included in the accompanying table. If you are subject to the fee, keep it in mind when you are estimating the ongoing expenses of investing in the portfolio and when comparing the expenses of this portfolio with other funds.
10/01/08 – 03/31/09
| | | Account value at the
beginning of the period ($) | | Account value at the
end of the period ($) | | Expenses paid
during the period ($) | | Portfolio's annualized
expense ratio (%) | |
| | | Actual | | Hypothetical | | Actual | | Hypothetical | | Actual | | Hypothetical | | Actual | |
| Class A | | | 1,000.00 | | | | 1,000.00 | | | | 705.71 | | | | 1,022.44 | | | | 2.13 | | | | 2.52 | | | | 0.50 | | |
| Class B | | | 1,000.00 | | | | 1,000.00 | | | | 704.01 | | | | 1,018.70 | | | | 5.31 | | | | 6.29 | | | | 1.25 | | |
| Class C | | | 1,000.00 | | | | 1,000.00 | | | | 703.91 | | | | 1,018.70 | | | | 5.31 | | | | 6.29 | | | | 1.25 | | |
| Class R | | | 1,000.00 | | | | 1,000.00 | | | | 704.71 | | | | 1,021.19 | | | | 3.19 | | | | 3.78 | | | | 0.75 | | |
| Class Z | | | 1,000.00 | | | | 1,000.00 | | | | 707.70 | | | | 1,023.68 | | | | 1.06 | | | | 1.26 | | | | 0.25 | | |
Expenses paid during the period are equal to the annualized expense ratio for the share class, multiplied by the average account value over the period, then multiplied by the number of days in the portfolio's most recent fiscal half-year and divided by 365.
It is important to note that the expense amounts shown in the table are meant to highlight only ongoing costs of investing in the portfolio and do not reflect any transaction costs, such as sales charges, redemption fees or exchange fees. Therefore, the hypothetical examples provided may not help you determine the relative total costs of owning shares of different portfolios. If these transaction costs were included, your costs would have been higher.
As a shareholder of the underlying funds in which it invests, the portfolio will bear its allocable share of the costs and expenses of these underlying funds. These costs and expenses are not included in expense information in the table above.
5
Portfolio Managers' Report – Columbia LifeGoal Growth Portfolio
Performance data quoted represents past performance and current performance may be lower or higher. Past performance is no guarantee of future results. The investment return and principal value will fluctuate so that shares, when redeemed, may be worth more or less than the original cost. Please visit www.columbiafunds.com for daily and most recent month-end performance updates.
Net asset value per share
as of 03/31/09 ($)
| Class A | | | 6.68 | | |
| Class B | | | 6.17 | | |
| Class C | | | 6.12 | | |
| Class R | | | 6.64 | | |
| Class Z | | | 6.78 | | |
Distributions declared per share
04/01/08 – 03/31/09 ($)
| Class A | | | 2.50 | | |
| Class B | | | 2.48 | | |
| Class C | | | 2.48 | | |
| Class R | | | 2.49 | | |
| Class Z | | | 2.51 | | |
For the 12-month period that ended March 31, 2009, the portfolio's Class A shares returned negative 37.62% without sales charge. The portfolio's benchmark, the S&P 500 Index, returned negative 38.09% during the period. The average return of its peer group, the Lipper Large-Cap Core Funds Classification, was negative 37.32%. A decision to underweight international markets and increase exposure to small-cap stocks contributed favorably to returns. However, addition of emerging markets equities detracted from performance. Underlying funds in the portfolio delivered mixed results.
As of February 20, 2009, Anwiti Bahuguna, Colin Moore, Kent M. Peterson and Marie M. Schofield were named co-managers of the portfolio.
A challenging environment for stock markets everywhere
As a financial crisis deepened and the economy slumped into recession, stock prices came down sharply. In January, a new federal administration began to formulate plans to stimulate an ailing financial system, stabilize the auto industry and jumpstart the economy. However, the prospect of over a trillion dollars in new spending made investors cautious. After more than a year of precipitous losses, the U.S. stock market reversed course and moved higher in March. Yet, it is too soon to tell whether the equity markets have bottomed and whether the late-March rally in stock prices is sustainable.
In this environment, a decision to underweight developed international markets, which were subject to greater losses than the U.S. market, and to shift some assets into small-cap stocks, which performed somewhat better than mid-cap stocks and some areas of the large-cap market, contributed favorably to performance. However, with all major market indices down more than 35%, the good news was all relative. Several of the underlying Columbia Funds outperformed their respective benchmarks and added to the relative outperformance of the Columbia LifeGoal Growth Portfolio. Columbia Large Cap Core Fund, Columbia Contrarian Core Fund, Columbia Large Cap Value Fund, Columbia Marsico Focused Equities Fund, Columbia International Value Fund, Columbia Convertible Securities Fund, Columbia Acorn International, Columbia Mid Cap Growth Fund, Columbia Mid Cap Value Fund, and Columbia Disciplined Value Fund all performed better than their respec tive equity benchmarks. Columbia Value and Restructuring Fund, Columbia Small Cap Value Fund II, Columbia Marsico International Opportunities Fund, Columbia Acorn USA, Columbia Small Cap Growth Fund II, Columbia Large Cap Growth Fund, Columbia Select Large Cap Growth Fund, Columbia Small Cap Growth Fund I and Columbia Emerging Markets Fund all returned less than their respective equity benchmarks. A strategic decision to add exposure to emerging markets detracted from performance during this reporting period, but we believe that these markets have significant return potential from the lows they reached in 2008 and that this move could be rewarded going forward.
6
Portfolio Managers' Report (continued) – Columbia LifeGoal Growth Portfolio
Looking ahead
Despite the potential for market recovery, we remain cautious in our overall outlook for stocks in the year ahead. Recession has spread across the globe and market turbulence could continue for some time. Nevertheless, we are confident that the underlying funds in the portfolio have the potential to rebound over the long term. Investing in the stock market is a long-term endeavor. We do not believe that one year of weak returns weighed against the stock market's track record should undermine confidence in the stock market's potential over the long term.
Columbia LifeGoal Portfolios reserve the right to add or remove underlying funds at any time.
The portfolio is a "fund of funds." A fund of funds bears its allocable share of the costs and expenses of the underlying funds in which it invests. Such funds are thus subject to two levels of fees and a potentially higher expense ratio than would be associated with an investment in a fund that invests and trades directly in financial instruments under the direction of a single manager. Risks include, among others, stock market fluctuations due to business and economic developments.
Equity investments are affected by stock market fluctuations that occur in response to economic and business developments.
Stocks of small- and mid-cap companies pose special risks, including possible illiquidity and greater price volatility than stocks of larger, more established companies.
International investing may involve certain risks, including currency fluctuations, risks associated with possible differences in financial accounting standards and other monetary and political risks. Significant levels of foreign taxes, including potentially confiscatory levels of taxation and withholding taxes, may also apply to some foreign investments.
Investing in emerging markets may involve greater risks than investing in more developed countries. In addition, concentration of investments in a single region may result in greater volatility.
Portfolio Allocation
as of 03/31/09 (%)
Columbia Mid Cap Value
Fund | | | 11.1 | | |
Columbia Mid Cap Growth
Fund | | | 11.0 | | |
Columbia International
Value Fund | | | 8.6 | | |
Columbia Large Cap Core
Fund | | | 7.1 | | |
Columbia Contrarian Core
Fund | | | 7.1 | | |
Columbia Small Cap Value
Fund II | | | 6.2 | | |
Columbia Emerging Markets
Fund | | | 4.9 | | |
Columbia Marsico Focused
Equities Fund | | | 4.8 | | |
Columbia Value and
Restructuring Fund | | | 4.8 | | |
Columbia Large Cap Growth
Fund | | | 4.8 | | |
Columbia Large Cap Value
Fund | | | 4.7 | | |
Columbia Select Large Cap
Growth Fund | | | 4.7 | | |
Columbia Disciplined Value
Fund | | | 4.7 | | |
Columbia Acorn
International | | | 3.6 | | |
Columbia Marsico International
Opportunities Fund | | | 3.6 | | |
| Columbia Acorn USA | | | 3.0 | | |
Columbia Convertible
Securities Fund | | | 2.3 | | |
Columbia Small Cap Growth
Fund II | | | 1.5 | | |
Columbia Small Cap Growth
Fund I | | | 1.5 | | |
Portfolio allocation is calculated as a percentage of total investments.
7
Portfolio Profile – Columbia LifeGoal Balanced Growth Portfolio
Performance data quoted represents past performance and current performance may be lower or higher. Past performance is no guarantee of future results. The investment return and principal value will fluctuate so that shares, when redeemed, may be worth more or less than the original cost. Please visit www.columbiafunds.com for daily and most recent month-end performance updates.
Summary
1-year return as of 03/31/09
| | | –26.48% | |
|
 | | Class A shares
(without sales charge) | |
|
| | | +3.13% | |
|
 | | Barclays Capital
U.S. Aggregate Bond Index | |
|
| | | –38.09% | |
|
 | | S&P 500 Index | |
|
Morningstar Style BoxTM
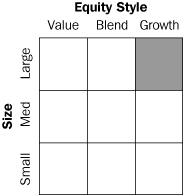

The Morningstar Style BoxTM reveals a portfolio's investment strategy. For equity portfolios, the vertical axis shows the market capitalization of the stocks owned, and the horizontal axis shows a portfolio's investment style (value, blend or growth). For fixed-income portfolios, the vertical axis shows the average credit quality of the bonds owned, and the horizontal axis shows interest rate sensitivity as measured by a bond's duration (short, intermediate or long). Information shown is based on the most recent data provided by Morningstar.
Summary
g For the 12-month period that ended March 31, 2009, the portfolio's Class A shares returned negative 26.48% without sales charge.
g The portfolio's equity benchmark, the S&P 500 Index, returned negative 38.09% while the portfolio's fixed income benchmark, the Barclays Capital U.S. Aggregate Bond Index (formerly Lehman Brothers U.S. Aggregate Bond Index), returned 3.13%.
g The portfolio performed slightly better than the average return of its peer group, the Lipper Mixed Asset Target Allocation Growth Funds Classification. A decision to underweight equities and increase exposure to small cap stocks contributed favorably to returns.
Portfolio Management
Anwiti Bahuguna, PhD has co-managed the portfolio since February 2009 and has been with the advisor or its predecessors or affiliate organizations since 2002.
Colin Moore has co-managed the portfolio since February 2009 and has been with the advisor or its predecessors or affiliate organizations since 2002.
Kent M. Peterson, PhD has co-managed the portfolio since February 2009 and has been with the advisor or its predecessors or affiliate organizations since 2006.
Marie M. Schofield has co-managed the portfolio since February 2009 and has been with the advisor or its predecessors or affiliate organizations since 1990.
8
Performance Information – Columbia LifeGoal Balanced Growth Portfolio
Performance of a $10,000 investment 04/01/99 – 03/31/09
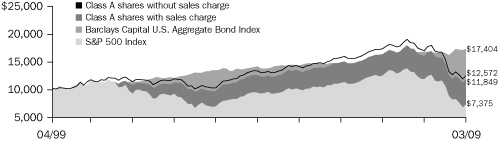 | |
|
The chart above shows the change in value of a hypothetical $10,000 investment in Class A shares of Columbia LifeGoal Balanced Growth Portfolio during the stated time period and does not reflect the deduction of taxes that a shareholder may pay on portfolio distributions or on the redemption of portfolio shares. The Barclays Capital U.S. Aggregate Bond Index is a market value-weighted index that tracks the daily price, coupon, pay-downs, and total return performance of fixed-rate, publicly placed, dollar-denominated, and non-convertible investment grade debt issues with at least $250 million par amount outstanding and with at least one year to final maturity. The Standard & Poor's (S&P) 500 Index tracks the performance of 500 widely held, large-capitalization U.S. stocks. Indices are not available for investment, and do not reflect sales charges, fees, brokerage commissions, taxes or other expenses of investing. Securiti es in the portfolio may not match those in an index.
Performance of a $10,000 investment 04/01/99 – 03/31/09 ($)
| Sales charge | | without | | with | |
| Class A | | | 12,572 | | | | 11,849 | | |
| Class B | | | 11,670 | | | | 11,670 | | |
| Class C | | | 11,656 | | | | 11,656 | | |
| Class R | | | 12,470 | | | | n/a | | |
| Class Z | | | 12,912 | | | | n/a | | |
Performance data quoted represents past performance and current performance may be lower or higher. Past performance is no guarantee of future results. The investment return and principal value will fluctuate so that shares, when redeemed, may be worth more or less than the original cost. Please visit www.columbiafunds.com for daily and most recent month-end performance updates.
Annual operating expense ratio (%)*
| Class A | | | 1.37 | | |
| Class B | | | 2.12 | | |
| Class C | | | 2.12 | | |
| Class R | | | 1.62 | | |
| Class Z | | | 1.12 | | |
*The annual operating expense ratio is as stated in the portfolio's prospectus that is current as of the date of this report and includes the expenses incurred by the underlying funds in which the portfolio invests. Differences in expense ratios disclosed elsewhere in this report may result from including expenses incurred by the underlying funds, fee waivers and expense reimbursements as well as different time periods used in calculating the ratios.
Average annual total return as of 03/31/09 (%)
| Share class | | A | | B | | C | | R | | Z | |
| Inception | | 10/15/96 | | 08/13/97 | | 10/15/96 | | 01/23/06 | | 10/15/96 | |
| Sales charge | | without | | with | | without | | with | | without | | with | | without | | without | |
| 1-year | | | –26.48 | | | | –30.69 | | | | –27.01 | | | | –30.23 | | | | –27.05 | | | | –27.70 | | | | –26.67 | | | | –26.28 | | |
| 5-year | | | –1.31 | | | | –2.47 | | | | –2.04 | | | | –2.33 | | | | –2.04 | | | | –2.04 | | | | –1.47 | | | | –1.01 | | |
| 10-year | | | 2.31 | | | | 1.71 | | | | 1.56 | | | | 1.56 | | | | 1.54 | | | | 1.54 | | | | 2.23 | | | | 2.59 | | |
The "with sales charge" returns include the maximum initial sales charge of 5.75% for Class A shares, the applicable contingent deferred sales charge of 5.00% in the first year, declining to 1.00% in the sixth year and eliminated thereafter for Class B shares and 1.00% for Class C shares for the first year only. The "without sales charge" returns do not include the effect of sales charges. If they had, returns shown would be lower.
Performance results reflect any fee waivers or reimbursements of portfolio expenses by the investment advisor and/or any of its affiliates. Absent these fee waivers or expense reimbursement arrangements, performance results shown would have been lower.
All results shown assume reinvestment of distributions. Class Z shares are sold at net asset value with no distribution and service (Rule 12b-1) fees. Class R shares are sold at net asset value with distribution and service (Rule 12b-1) fees. Class R and Class Z shares have limited eligibility and the investment minimum requirements may vary. Please see the portfolio's prospectus for details. Performance for different share classes will vary based on differences in sales charges and fees associated with each class.
The tables do not reflect the deduction of taxes that a shareholder may pay on portfolio distributions or on the redemption of portfolio shares.
The inception date of the portfolio's Class R shares is January 23, 2006. Class R shares have no performance prior to their inception date. The performance shown for Class R shares prior to their inception date is that of Class A shares. If Class R shares fees and expenses were included, performance would be lower.
9
Understanding Your Expenses – Columbia LifeGoal Balanced Growth Portfolio
Estimating your actual expenses
To estimate the expenses that you paid over the period, first you will need your account balance at the end of the period:
g For shareholders who receive their account statements from Columbia Management Services, Inc., your account balance is available online at www.columbiafunds.com or by calling Shareholder Services at 800.345.6611.
g For shareholders who receive their account statements from their financial intermediary, contact your financial intermediary to obtain your account balance.
1. Divide your ending account balance by $1,000. For example, if an account balance was $8,600 at the end of the period, the result would be 8.6.
2. In the section of the table below titled "Expenses paid during the period," locate the amount for your share class. You will find this number in the column labeled "Actual." Multiply this number by the result from step 1. Your answer is an estimate of the expenses you paid on your account during the period.
If the value of your account falls below the minimum initial investment requirement applicable to you, your account generally will be subject to a $20 annual fee. This fee is not included in the accompanying table. If you are subject to the fee, keep it in mind when you are estimating the ongoing expenses of investing in the portfolio and when comparing the expenses of this portfolio with other funds.
As a portfolio shareholder, you incur two types of costs. There are transaction costs, which generally include sales charges on purchases and may include redemption fees or exchange fees. There are also ongoing costs, which generally include investment advisory fees, distribution and service (Rule 12b-1) fees and other portfolio expenses. The information on this page is intended to help you understand the ongoing costs of investing in the portfolio and to compare these costs with the ongoing costs of investing in other mutual funds.
Analyzing your portfolio's expenses by share class
To illustrate these ongoing costs, we have provided an example and calculated the expenses paid by investors in each share class during the period. The information in the following table is based on an initial investment of $1,000, which is invested at the beginning of the period and held for the entire period. Expense information is calculated two ways and each method provides you with different information. The amount listed in the "Actual" column is calculated using the portfolio's actual operating expenses and total return for the period. The amount listed in the "Hypothetical" column for each share class assumes that the return each year is 5% before expenses and is calculated based on the portfolio's actual operating expenses. You should not use the hypothetical account values and expenses to estimate either your actual account balance at the end of the period or the expenses you paid during this period.
Compare with other funds
Since all mutual funds are required to include the same hypothetical calculations about expenses in shareholder reports, you can use this information to compare the ongoing cost of investing in the portfolio with other funds. To do so, compare the 5% hypothetical example with the 5% hypothetical examples that appear in the shareholder reports of other funds. As you compare hypothetical examples of other funds, it is important to note that hypothetical examples are meant to highlight the ongoing costs of investing in a fund and do not reflect any transaction costs, such as sales charges, redemption fees or exchange fees.
10/01/08 – 03/31/09
| | | Account value at the
beginning of the period ($) | | Account value at the
end of the period ($) | | Expenses paid
during the period ($) | | Portfolio's annualized
expense ratio (%) | |
| | | Actual | | Hypothetical | | Actual | | Hypothetical | | Actual | | Hypothetical | | Actual | |
| Class A | | | 1,000.00 | | | | 1,000.00 | | | | 812.02 | | | | 1,022.44 | | | | 2.26 | | | | 2.52 | | | | 0.50 | | |
| Class B | | | 1,000.00 | | | | 1,000.00 | | | | 809.02 | | | | 1,018.70 | | | | 5.64 | | | | 6.29 | | | | 1.25 | | |
| Class C | | | 1,000.00 | | | | 1,000.00 | | | | 809.12 | | | | 1,018.70 | | | | 5.64 | | | | 6.29 | | | | 1.25 | | |
| Class R | | | 1,000.00 | | | | 1,000.00 | | | | 811.02 | | | | 1,021.19 | | | | 3.39 | | | | 3.78 | | | | 0.75 | | |
| Class Z | | | 1,000.00 | | | | 1,000.00 | | | | 813.11 | | | | 1,023.68 | | | | 1.13 | | | | 1.26 | | | | 0.25 | | |
Expenses paid during the period are equal to the annualized expense ratio for the share class, multiplied by the average account value over the period, then multiplied by the number of days in the portfolio's most recent fiscal half-year and divided by 365.
It is important to note that the expense amounts shown in the table are meant to highlight only ongoing costs of investing in the portfolio and do not reflect any transaction costs, such as sales charges, redemption fees or exchange fees. Therefore, the hypothetical examples provided may not help you determine the relative total costs of owning shares of different portfolios. If these transaction costs were included, your costs would have been higher.
As a shareholder of the underlying funds in which it invests, the portfolio will bear its allocable share of the costs and expenses of these underlying funds. These costs and expenses are not included in expense information in the table above.
10
Portfolio Managers' Report – Columbia LifeGoal Balanced Growth Portfolio
For the 12-month period that ended March 31, 2009, the portfolio's Class A shares returned negative 26.48% without sales charge. The portfolio's equity benchmark, the broad-based S&P 500 Index, returned negative 38.09%. Its fixed income benchmark, the Barclays Capital U.S. Aggregate Bond Index, returned 3.13%. In an environment of contracting economic growth and sharply falling stock prices, the portfolio performed slightly better than the average return of its peer group, the Lipper Mixed-Asset Target Allocation Growth Funds Classification, which returned negative 29.69%. A decision to underweight equities and increase exposure to small cap stocks contributed favorably to returns. However, an increase in exposure to emerging markets detracted from performance as did an increase in exposure to investment-grade bonds. Underlying funds in the portfolio delivered mixed results.
As of February 20, 2009, Anwiti Bahuguna, Colin Moore, Kent M. Peterson and Marie M. Schofield were named co-managers of the portfolio.
A challenging environment for markets everywhere
As a financial crisis deepened and the economy slumped into recession, stock prices came down sharply and many sectors of the bond market came under pressure. In January, a new federal administration began to formulate plans to stimulate an ailing financial system, stabilize the auto industry and jumpstart the economy. However, the prospect of over a trillion dollars in new spending made investors cautious. After more than a year of precipitous losses, the U.S. stock market reversed course and moved higher in March and beaten-down segments of the bond market showed some signs of life. Yet, it is too soon to tell whether the markets have bottomed and whether the late-March rally in stock prices is sustainable.
In this environment, a decision to underweight equities, which fared far worse than fixed income securities, and to shift some assets into small cap stocks, which performed somewhat better than mid-cap stocks, and some areas of the large cap market, contributed favorably to performance. However, with all major stock market indices down more than 35% and only the highest quality bonds delivering positive returns, the good news was all relative. Several of the underlying Columbia Funds outperformed their respective benchmarks and added to the relative outperformance of the Columbia LifeGoal Balanced Growth Portfolio. Columbia Large Cap Core Fund, Columbia Contrarian Core Fund, Columbia Large Cap Value Fund, Columbia Marsico Focused Equities Fund, Columbia International Value Fund, Columbia Convertible Securities Fund, Columbia Acorn International, Columbia Mid Cap Growth Fund, Columbia Mid Cap Value Fund, Columbia High Income Fund and Columbia Disciplined Value Fund all performed better than their respective benchmarks. Columbia Value and Restructuring Fund, Columbia Small Cap Value Fund II, Columbia Marsico International Opportunities Fund, Columbia Acorn USA, Columbia Small Cap Growth Fund II, Columbia Large Cap Growth Fund, Columbia Select Large Cap Growth Fund, Columbia Small Cap Growth Fund I, Columbia Income Fund, Columbia Total Return Bond Fund and Columbia Emerging Markets Fund all returned less than their respective benchmarks.
Performance data quoted represents past performance and current performance may be lower or higher. Past performance is no guarantee of future results. The investment return and principal value will fluctuate so that shares, when redeemed, may be worth more or less than the original cost. Please visit www.columbiafunds.com for daily and most recent month-end performance updates.
Net asset value per share
as of 03/31/09 ($)
| Class A | | | 7.33 | | |
| Class B | | | 7.29 | | |
| Class C | | | 7.38 | | |
| Class R | | | 7.33 | | |
| Class Z | | | 7.33 | | |
Distributions declared per share
04/01/08 – 03/31/09 ($)
| Class A | | | 1.34 | | |
| Class B | | | 1.27 | | |
| Class C | | | 1.27 | | |
| Class R | | | 1.31 | | |
| Class Z | | | 1.36 | | |
11
Portfolio Managers' Report (continued) – Columbia LifeGoal Balanced Growth Portfolio
Portfolio Allocation
as of 03/31/09 (%)
Columbia Total Return
Bond Fund | | | 24.6 | | |
| Columbia Income Fund | | | 8.8 | | |
Columbia High Income
Fund | | | 6.5 | | |
Columbia International
Value Fund | | | 5.0 | | |
| Columbia Acorn International | | | 5.0 | | |
Columbia Marsico International
Opportunities Fund | | | 5.0 | | |
Columbia Mid Cap
Value Fund | | | 4.7 | | |
Columbia Mid Cap
Growth Fund | | | 4.6 | | |
Columbia Large Cap
Core Fund | | | 3.9 | | |
Columbia Contrarian
Core Fund | | | 3.9 | | |
Columbia Small Cap
Value Fund II | | | 3.9 | | |
Columbia Emerging
Markets Fund | | | 3.0 | | |
Columbia Marsico
Focused Equities Fund | | | 2.7 | | |
Columbia Large Cap
Growth Fund | | | 2.7 | | |
Columbia Select Large Cap
Growth Fund | | | 2.7 | | |
Columbia Value and
Restructuring Fund | | | 2.3 | | |
Columbia Large Cap
Value Fund | | | 2.3 | | |
Columbia Disciplined
Value Fund | | | 2.3 | | |
Columbia Convertible
Securities Fund | | | 2.1 | | |
| Columbia Acorn USA | | | 2.0 | | |
Columbia Small Cap
Growth Fund II | | | 1.0 | | |
Columbia Small Cap
Growth Fund I | | | 1.0 | | |
| Columbia Cash Reserves | | | 0.0 | | |
Portfolio allocation is calculated as a percentage of total investments.
During the period, we reduced the portfolio's cash position to increase exposure to investment grade bonds, which detracted from performance as only the highest quality bonds fared well during the period. A decision to increase exposure to emerging markets detracted from performance during this reporting period, but we believe that these markets have significant return potential from the lows they reached in 2008 and that this move could be rewarded going forward.
Looking ahead
Despite the potential for market recovery, we remain cautious in our overall outlook for the year ahead. Recession has spread across the globe and market turbulence could continue for some time. Nevertheless, we are confident that the funds in the portfolio have the potential to rebound over the long-term. Investing is a long-term endeavor. We do not believe that one year of weak returns weighed against the positive track record of stocks and bonds should undermine confidence in the market's potential over the long-term.
Columbia LifeGoal Portfolios reserve the right to add or remove underlying funds at any time.
The portfolio is a "fund of funds." A fund of funds bears its allocable share of the costs and expenses of the underlying funds in which it invests. Such funds are thus subject to two levels of fees and a potentially higher expense ratio than would be associated with an investment in an investment fund that invests and trades directly in financial instruments under the direction of a single manager. Risks include, among others, stock market fluctuations due to business and economic developments.
Equity investments are affected by stock market fluctuations that occur in response to economic and business developments.
Stocks of small- and mid-cap companies pose special risks, including possible illiquidity and greater price volatility than stocks of larger, more established companies.
International investing may involve certain risks, including currency fluctuations, risks associated with possible differences in financial accounting standards and other monetary and political risks. Significant levels of foreign taxes, including potentially confiscatory levels of taxation and withholding taxes, may also apply to some foreign investments.
Investing in emerging markets may involve greater risks than investing in more developed countries. In addition, concentration of investments in a single region may result in greater volatility.
Investing in fixed-income securities may involve certain risks, including the credit quality of individual issuers, possible prepayments, market or economic developments and yields and share price fluctuations due to changes in interest rates. When interest rates go up, bond prices typically drop, and vice versa.
Investments in high-yield securities (commonly known as "junk" bonds) offer the potential for high current income and attractive total return but involve certain risks. Changes in economic conditions or other circumstances may adversely affect a junk bond issuer's ability to make principal and interest payments. Rising interest rates tend to lower the value of all bonds. High-yield bonds issued by foreign entities have greater potential risks, including less regulation, currency fluctuations, economic instability and political developments.
12
Portfolio Profile – Columbia LifeGoal Income and Growth Portfolio
Summary
g For the 12-month period that ended March 31, 2009, the portfolio's Class A shares returned negative 16.58% without sales charge.
g The portfolio's equity benchmark, the S&P 500 Index, returned negative 38.09% while its fixed income benchmark, the Barclays Capital U.S. Aggregate Bond Index (formerly Lehman Brothers U.S. Aggregate Bond Index), returned 3.13%.
g The portfolio held up slightly better than the average return of its peer group, the Lipper Mixed Asset Target Allocation Conservative Funds Classification. A decision to underweight equities and increase exposure to small-cap stocks helped shore up returns.
Portfolio Management
Anwiti Bahuguna, PhD has co-managed the portfolio since February 2009 and has been with the advisor or its predecessors or affiliate organizations since 2002.
Colin Moore has co-managed the portfolio since February 2009 and has been with the advisor or its predecessors or affiliate organizations since 2002.
Kent M. Peterson, PhD has co-managed the portfolio since February 2009 and has been with the advisor or its predecessors or affiliate organizations since 2006.
Marie M. Schofield has co-managed the portfolio since February 2009 and has been with the advisor or its predecessors or affiliate organizations since 1990.
Performance data quoted represents past performance and current performance may be lower or higher. Past performance is no guarantee of future results. The investment return and principal value will fluctuate so that shares, when redeemed, may be worth more or less than the original cost. Please visit www.columbiafunds.com for daily and most recent month-end performance updates.
Summary
1-year return as of 03/31/09
| | | –16.58% | |
|
 | | Class A shares
(without sales charge) | |
|
| | | +3.13% | |
|
 | | Barclays Capital
U.S. Aggregate Bond Index | |
|
| | | –38.09% | |
|
 | | S&P 500 Index | |
|
Morningstar Style BoxTM

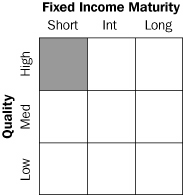
The Morningstar Style BoxTM reveals a portfolio's investment strategy. For equity portfolios, the vertical axis shows the market capitalization of the stocks owned, and the horizontal axis shows a portfolio's investment style (value, blend or growth). For fixed-income portfolios, the vertical axis shows the average credit quality of the bonds owned, and the horizontal axis shows interest rate sensitivity as measured by a bond's duration (short, intermediate or long). Information shown is based on the most recent data provided by Morningstar.
13
Performance Information – Columbia LifeGoal Income and Growth Portfolio
Performance data quoted represents past performance and current performance may be lower or higher. Past performance is no guarantee of future results. The investment return and principal value will fluctuate so that shares, when redeemed, may be worth more or less than the original cost. Please visit www.columbiafunds.com for daily and most recent month-end performance updates.
Annual operating expense ratio (%)*
| Class A | | | 1.24 | | |
| Class B | | | 1.99 | | |
| Class C | | | 1.99 | | |
| Class R | | | 1.49 | | |
| Class Z | | | 0.99 | | |
*The annual operating expense ratio is as stated in the portfolio's prospectus that is current as of the date of this report and includes the expenses incurred by the underlying funds in which the portfolio invests. Differences in expense ratios disclosed elsewhere in this report may result from including expenses incurred by the underlying funds, fee waivers and expense reimbursements as well as different time periods used in calculating the ratios.
Performance of a $10,000 investment 04/01/99 – 03/31/09
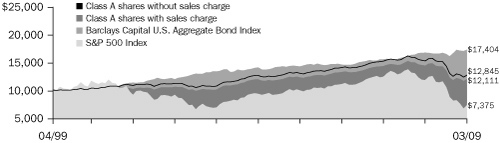 | |
|
The chart above shows the change in value of a hypothetical $10,000 investment in Class A shares of Columbia LifeGoal Income and Growth Portfolio during the stated time period and does not reflect the deduction of taxes that a shareholder may pay on portfolio distributions or on the redemption of portfolio shares. The Barclays Capital U.S. Aggregate Bond Index is a market value-weighted index that tracks the daily price, coupon, pay-downs, and total return performance of fixed-rate, publicly placed, dollar-denominated, and non-convertible investment-grade debt issues with at least $250 million par amount outstanding and with at least one year to final maturity. The Standard & Poor's (S&P) 500 Index tracks the performance of 500 widely held, large-capitalization U.S. stocks. Indices are not available for investment, and do not reflect sales charges, fees, brokerage commissions, taxes or other expenses of investing. Securi ties in the portfolio may not match those in an index.
Performance of a $10,000 investment 04/01/99 – 03/31/09 ($)
| Sales charge | | without | | with | |
| Class A | | | 12,845 | | | | 12,111 | | |
| Class B | | | 11,931 | | | | 11,931 | | |
| Class C | | | 11,905 | | | | 11,905 | | |
| Class R | | | 12,756 | | | | n/a | | |
| Class Z | | | 13,122 | | | | n/a | | |
Average annual total return as of 03/31/09 (%)
| Share class | | A | | B | | C | | R | | Z | |
| Inception | | 10/15/96 | | 08/07/97 | | 10/15/96 | | 01/23/06 | | 10/15/96 | |
| Sales charge | | without | | with | | without | | with | | without | | with | | without | | without | |
| 1-year | | | –16.58 | | | | –21.35 | | | | –17.09 | | | | –20.95 | | | | –17.09 | | | | –17.86 | | | | –16.69 | | | | –16.23 | | |
| 5-year | | | 0.12 | | | | –1.06 | | | | –0.61 | | | | –0.90 | | | | –0.61 | | | | –0.61 | | | | –0.02 | | | | 0.36 | | |
| 10-year | | | 2.54 | | | | 1.93 | | | | 1.78 | | | | 1.78 | | | | 1.76 | | | | 1.76 | | | | 2.46 | | | | 2.75 | | |
The "with sales charge" returns include the maximum initial sales charge of 5.75% for Class A shares, the applicable contingent deferred sales charge of 5.00% in the first year, declining to 1.00% in the sixth year and eliminated thereafter for Class B shares and 1.00% for Class C shares for the first year only. The "without sales charge" returns do not include the effect of sales charges. If they had, returns shown would be lower.
Performance results reflect any fee waivers or reimbursements of portfolio expenses by the investment advisor and/or any of its affiliates. Absent these fee waivers or expense reimbursement arrangements, performance results shown would have been lower.
All results shown assume reinvestment of distributions. Class Z shares are sold at net asset value with no distribution and service (Rule 12b-1) fees. Class R shares are sold at net asset value with distribution and service (Rule 12b-1) fees. Class R and Class Z shares have limited eligibility and the investment minimum requirements may vary. Please see the portfolio's prospectus for details. Performance for different share classes will vary based on differences in sales charges and fees associated with each class.
The tables do not reflect the deduction of taxes that a shareholder may pay on portfolio distributions or on the redemption of portfolio shares.
The inception date of the portfolio's Class R shares is January 23, 2006. Class R shares have no performance prior to their inception date. The performance shown for Class R shares prior to their inception date is that of Class A shares. If Class R shares fees and expenses were included, performance would be lower.
14
Understanding Your Expenses – Columbia LifeGoal Income and Growth Portfolio
As a portfolio shareholder, you incur two types of costs. There are transaction costs, which generally include sales charges on purchases and may include redemption fees or exchange fees. There are also ongoing costs, which generally include investment advisory fees, distribution and service (Rule 12b-1) fees and other portfolio expenses. The information on this page is intended to help you understand the ongoing costs of investing in the portfolio and to compare these costs with the ongoing costs of investing in other mutual funds.
Analyzing your portfolio's expenses by share class
To illustrate these ongoing costs, we have provided an example and calculated the expenses paid by investors in each share class during the period. The information in the following table is based on an initial investment of $1,000, which is invested at the beginning of the period and held for the entire period. Expense information is calculated two ways and each method provides you with different information. The amount listed in the "Actual" column is calculated using the portfolio's actual operating expenses and total return for the period. The amount listed in the "Hypothetical" column for each share class assumes that the return each year is 5% before expenses and is calculated based on the portfolio's actual operating expenses. You should not use the hypothetical account values and expenses to estimate either your actual account balance at the end of the period or the expenses you paid during this period.
Compare with other funds
Since all mutual funds are required to include the same hypothetical calculations about expenses in shareholder reports, you can use this information to compare the ongoing cost of investing in the portfolio with other funds. To do so, compare the 5% hypothetical example with the 5% hypothetical examples that appear in the shareholder reports of other funds. As you compare hypothetical examples of other funds, it is important to note that hypothetical examples are meant to highlight the ongoing costs of investing in a fund and do not reflect any transaction costs, such as sales charges, redemption fees or exchange fees.
Estimating your actual expenses
To estimate the expenses that you paid over the period, first you will need your account balance at the end of the period:
g For shareholders who receive their account statements from Columbia Management Services, Inc., your account balance is available online at www.columbiafunds.com or by calling Shareholder Services at 800.345.6611.
g For shareholders who receive their account statements from their financial intermediary, contact your financial intermediary to obtain your account balance.
1. Divide your ending account balance by $1,000. For example, if an account balance was $8,600 at the end of the period, the result would be 8.6.
2. In the section of the table below titled "Expenses paid during the period," locate the amount for your share class. You will find this number in the column labeled "Actual." Multiply this number by the result from step 1. Your answer is an estimate of the expenses you paid on your account during the period.
If the value of your account falls below the minimum initial investment requirement applicable to you, your account generally will be subject to a $20 annual fee. This fee is not included in the accompanying table. If you are subject to the fee, keep it in mind when you are estimating the ongoing expenses of investing in the portfolio and when comparing the expenses of this portfolio with other funds.
10/01/08 – 03/31/09
| | | Account value at the
beginning of the period ($) | | Account value at the
end of the period ($) | | Expenses paid
during the period ($) | | Portfolio's annualized
expense ratio (%) | |
| | | Actual | | Hypothetical | | Actual | | Hypothetical | | Actual | | Hypothetical | | Actual | |
| Class A | | | 1,000.00 | | | | 1,000.00 | | | | 887.81 | | | | 1,022.44 | | | | 2.35 | | | | 2.52 | | | | 0.50 | | |
| Class B | | | 1,000.00 | | | | 1,000.00 | | | | 885.22 | | | | 1,018.70 | | | | 5.88 | | | | 6.29 | | | | 1.25 | | |
| Class C | | | 1,000.00 | | | | 1,000.00 | | | | 885.51 | | | | 1,018.70 | | | | 5.88 | | | | 6.29 | | | | 1.25 | | |
| Class R | | | 1,000.00 | | | | 1,000.00 | | | | 887.81 | | | | 1,021.19 | | | | 3.53 | | | | 3.78 | | | | 0.75 | | |
| Class Z | | | 1,000.00 | | | | 1,000.00 | | | | 890.00 | | | | 1,023.68 | | | | 1.18 | | | | 1.26 | | | | 0.25 | | |
Expenses paid during the period are equal to the annualized expense ratio for the share class, multiplied by the average account value over the period, then multiplied by the number of days in the portfolio's most recent fiscal half-year and divided by 365.
It is important to note that the expense amounts shown in the table are meant to highlight only ongoing costs of investing in the portfolio and do not reflect any transaction costs, such as sales charges, redemption fees or exchange fees. Therefore, the hypothetical examples provided may not help you determine the relative total costs of owning shares of different portfolios. If these transaction costs were included, your costs would have been higher.
As a shareholder of the underlying funds in which it invests, the portfolio will bear its allocable share of the costs and expenses of these underlying funds. These costs and expenses are not included in expense information in the table above.
15
Portfolio Managers' Report – Columbia LifeGoal Income and Growth Portfolio
Performance data quoted represents past performance and current performance may be lower or higher. Past performance is no guarantee of future results. The investment return and principal value will fluctuate so that shares, when redeemed, may be worth more or less than the original cost. Please visit www.columbiafunds.com for daily and most recent month-end performance updates.
Net asset value per share
as of 03/31/09 ($)
| Class A | | | 8.03 | | |
| Class B | | | 8.01 | | |
| Class C | | | 7.96 | | |
| Class R | | | 8.04 | | |
| Class Z | | | 7.96 | | |
Distributions declared per share
04/01/08 – 03/31/09 ($)
| Class A | | | 0.73 | | |
| Class B | | | 0.66 | | |
| Class C | | | 0.66 | | |
| Class R | | | 0.71 | | |
| Class Z | | | 0.76 | | |
For the 12-month period that ended March 31, 2009, the portfolio's Class A shares returned negative 16.58% without sales charge. The portfolio's equity benchmark, the broad-based S&P 500 Index, returned negative 38.09% and its fixed-income benchmark, the Barclays Capital U.S. Aggregate Bond Index, returned 3.13%. In an environment of contracting economic growth and sharply falling stock prices, the portfolio performed slightly better than the average return of its peer group, the Lipper Mixed-Asset Target Allocation Conservative Funds Classification, which returned negative 17.38%. A decision to underweight equities and increase exposure to small cap stocks contributed favorably to returns. However, an increase in exposure to emerging markets detracted from performance as did increased exposure to Columbia Income Fund. Overall, the underlying funds in the portfolio delivered mixed results.
As of February 20, 2009, Anwiti Bahuguna, Colin Moore, Kent M. Peterson and Marie M. Schofield were named co-managers of the portfolio.
A challenging environment for markets everywhere
As a financial crisis deepened and the economy slumped into recession, stock prices came down sharply and many sectors of the bond market came under pressure. In January, a new federal administration began to formulate plans to stimulate an ailing financial system, stabilize the auto industry and jumpstart the economy. However, the prospect of over a trillion dollars in new spending made investors cautious. After more than a year of precipitous losses, the U.S. stock market reversed course and moved higher in March and beaten-down segments of the bond market showed some signs of life. Yet, it is too soon to tell whether the markets have bottomed and whether the late-March rally in stock prices is sustainable.
In this environment, a decision to underweight equities, which fared far worse than fixed income securities, and to shift some assets into small-cap stocks, which performed somewhat better than mid-cap stocks and some areas of the large-cap market, contributed favorably to performance. However, with all major stock market indices down more than 35% and only the highest quality bonds delivering positive returns, the good news was all relative. Several of the underlying Columbia Funds outperformed their respective benchmarks and added to the relative outpeformance of the Columbia LifeGoal Income and Growth Portfolio. Columbia Large Cap Core Fund, Columbia Contrarian Core Fund, Columbia Large Cap Value Fund, Columbia Marsico Focused Equities Fund, Columbia International Value Fund, Columbia Convertible Securities Fund, Columbia Acorn International, Columbia Mid Cap Growth Fund, Columbia Mid Cap Value Fund, Columbia High Income Fund and Columbia Disciplined Value Fund all performed better than their respective benchmarks. Columbia Value and Restructuring Fund, Columbia Small Cap Value Fund II, Columbia Marsico International Opportunities Fund, Columbia Acorn USA, Columbia Small Cap Growth Fund II, Columbia Large Cap Growth Fund, Columbia Select Large Cap Growth Fund, Columbia Small Cap Growth Fund I, Columbia Income Fund, Columbia Total Return Bond Fund, Columbia Short Term Bond Fund and Columbia Emerging Markets Fund all returned less than their respective benchmarks.
During the period, we reduced the portfolio's cash position to increase exposure to investment-grade bonds, which detracted from performance as only the highest quality bonds fared well during the period. However, the portfolio's remaining position in cash helped cushion results. A decision to increase exposure to emerging markets detracted from performance during this reporting period, but we believe that these markets have significant return potential from the lows they reached in 2008 and that this move could be rewarded going forward.
16
Portfolio Managers' Report (continued) – Columbia LifeGoal Income and Growth Portfolio
Looking ahead
Despite the potential for market recovery, we remain cautious in our overall outlook for the year ahead. Recession has spread across the globe and market turbulence could continue for some time. Nevertheless, we are confident that the funds in the portfolio have the potential to rebound over the long term. Investing is a long-term endeavor. We do not believe that one year of weak returns weighed against the positive track record of stocks and bonds should undermine confidence in the market's potential over the long term.
Columbia LifeGoal Portfolios reserve the right to add or remove underlying funds at any time.
The portfolio is a "fund of funds." A fund of funds bears its allocable share of the costs and expenses of the underlying funds in which it invests. Such funds are thus subject to two levels of fees and a potentially higher expense ratio than would be associated with an investment in an investment fund that invests and trades directly in financial instruments under the direction of a single manager. Risks include, among others, stock market fluctuations due to business and economic developments.
Equity investments are affected by stock market fluctuations that occur in response to economic and business developments.
Stocks of small- and mid-cap companies pose special risks, including possible illiquidity and greater price volatility than stocks of larger, more established companies.
International investing may involve certain risks, including currency fluctuations, risks associated with possible differences in financial accounting standards and other monetary and political risks. Significant levels of foreign taxes, including potentially confiscatory levels of taxation and withholding taxes, may also apply to some foreign investments.
Investing in emerging markets may involve greater risks than investing in more developed countries. In addition, concentration of investments in a single region may result in greater volatility.
Investing in fixed-income securities may involve certain risks, including the credit quality of individual issuers, possible prepayments, market or economic developments and yields and share price fluctuations due to changes in interest rates. When interest rates go up, bond prices typically drop, and vice versa.
Investments in high-yield securities (commonly known as "junk" bonds) offer the potential for high current income and attractive total return but involve certain risks. Changes in economic conditions or other circumstances may adversely affect a high yield bond issuer's ability to make principal and interest payments. Rising interest rates tend to lower the value of all bonds. High-yield bonds issued by foreign entities have greataer potential risks, including less regulation, currency fluctuation, economic instability and political developments.
Portfolio Allocation
as of 03/31/09 (%)
Columbia Short Term Bond
Fund | | | 27.0 | | |
Columbia Total Return
Bond Fund | | | 21.6 | | |
Columbia High Income
Fund | | | 10.5 | | |
| Columbia Income Fund | | | 7.9 | | |
Columbia Convertible
Securities Fund | | | 4.1 | | |
Columbia International Value
Fund | | | 2.6 | | |
| Columbia Acorn International | | | 2.1 | | |
Columbia Marsico International
Opportunities Fund | | | 2.1 | | |
Columbia Mid Cap Value
Fund | | | 2.0 | | |
Columbia Mid Cap Growth
Fund | | | 2.0 | | |
Columbia Emerging Markets
Fund | | | 2.0 | | |
Columbia Contrarian Core
Fund | | | 1.9 | | |
Columbia Large Cap Core
Fund | | | 1.9 | | |
| Columbia Cash Reserves | | | 1.6 | | |
Columbia Small Cap Value
Fund II | | | 1.5 | | |
Columbia Marsico Focused
Equities Fund | | | 1.3 | | |
Columbia Large Cap Growth
Fund | | | 1.3 | | |
Columbia Large Cap Value
Fund | | | 1.3 | | |
Columbia Value and
Restructuring Fund | | | 1.3 | | |
Columbia Select Large Cap
Growth Fund | | | 1.3 | | |
Columbia Disciplined Value
Fund | | | 1.3 | | |
| Columbia Acorn USA | | | 0.8 | | |
Columbia Small Cap Growth
Fund II | | | 0.4 | | |
Columbia Small Cap Growth
Fund I | | | 0.4 | | |
Portfolio allocation is calculated as a percentage of total investments.
17
Portfolio Profile – Columbia LifeGoal Income Portfolio
Performance data quoted represents past performance and current performance may be lower or higher. Past performance is no guarantee of future results. The investment return and principal value will fluctuate so that shares, when redeemed, may be worth more or less than the original cost. Please visit www.columbiafunds.com for daily and most recent month-end performance updates.
Summary
1-year return as of 03/31/09
| | | –8.37% | |
|
 | | Class A shares
(without sales charge) | |
|
| | | +3.42% | |
|
 | | Barclays Capital
U.S. Aggregate 1-3 Years
Index | |
|
| | | –1.13% | |
|
 | | Blended 80% Barclays Capital U.S. Aggregate 1-3 Years Index / 20% Barclays Capital U.S. Corporate High-Yield Bond Index | |
|
Morningstar Style BoxTM
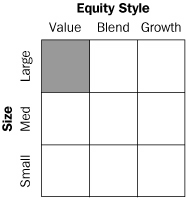
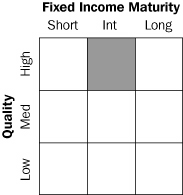
The Morningstar Style BoxTM reveals a portfolio's investment strategy. For equity portfolios, the vertical axis shows the market capitalization of the stocks owned, and the horizontal axis shows a portfolio's investment style (value, blend or growth). For fixed-income portfolios, the vertical axis shows the average credit quality of the bonds owned, and the horizontal axis shows interest rate sensitivity as measured by a bond's duration (short, intermediate or long). Information shown is based on the most recent data provided by Morningstar.
Summary
g For the 12-month period that ended March 31, 2009, the portfolio's Class A shares returned negative 8.37% without sales charge.
g The portfolio's fixed income benchmark, the Barclays Capital U.S. Aggregate 1-3 Years Index (formerly Lehman Brothers U.S. Aggregate 1-3 Years Index), returned 3.42%. A customized benchmark created by Columbia Management Advisors LLC, blending 80% Barclays Capital U.S. Aggregate 1-3 Years Index and 20% Barclays Capital U.S. Corporate High-Yield Bond Index (formerly the Blended 80% Lehman Brothers U.S. Aggregate 1-3 Years Index/20% Lehman Brothers U.S. High Yield Index), returned negative 1.13% for the period.1
g The portfolio held up significantly better than the average return of its peer group, the Lipper Mixed-Asset Target Allocation Conservative Funds Classification. A decision to cut exposure to equities by nearly half served as a significant cushion during a period of sharply declining stock prices.
Portfolio Management
Anwiti Bahuguna, PhD has co-managed the portfolio since February 2009 and has been with the advisor or its predecessors or affiliate organizations since 2002.
Colin Moore has co-managed the portfolio since February 2009 and has been with the advisor or its predecessors or affiliate organizations since 2002.
Kent M. Peterson, PhD has co-managed the portfolio since February 2009 and has been with the advisor or its predecessors or affiliate organizations since 2006.
Marie M. Schofield has co-managed the portfolio since February 2009 and has been with the advisor or its predecessors or affiliate organizations since 1990.
1The Barclays Capital U.S. Aggregate 1-3 Years Index is an index of publicly-issued investment-grade corporate, U.S. Treasury and government agency securities with remaining maturities of one to three years. This blend is 80% Barclays Capital U.S. Aggregate 1-3 Years Index and 20% Barclays Capital U.S. Corporate High-Yield Bond Index. Barclays Capital U.S. Corporate High-Yield Bond Index is an index of fixed-rate, non-investment-grade bonds with at least one year remaining to maturity.
Indices are not available for investment, and do not reflect sales charges, fees, brokerage commissions, taxes or other expenses of investing. Securities in the portfolio may not match those in an index.
18
Performance Information – Columbia LifeGoal Income Portfolio
Performance of a $10,000 investment 09/04/03 – 03/31/09
*Benchmark performance is as of 08/31/03
The chart above shows the change in value of a hypothetical $10,000 investment in Class A shares of Columbia LifeGoal Income Portfolio during the stated time period and does not reflect the deduction of taxes that a shareholder may pay on portfolio distributions or on the redemption of portfolio shares. The Barclays Capital U.S. Aggregate 1-3 Years Index is an index of publicly-issued investment-grade corporate, U.S. Treasury and government agency securities with remaining maturities of one to three years. The blended index is a blend of 80% Barclays Capital U.S. Aggregate 1-3 Years Index and 20% Barclays Capital U.S. Corporate High-Yield Bond Index. The Barclays Capital U.S. High Yield Index is an index of fixed-rate, non-investment-grade bonds with at least one year remaining to maturity. Indices are not available for investment, and do not reflect sales charges, fees, brokerage commissions, taxes or other expenses of investin g. Securities in the portfolio may not match those in an index.
Performance of a $10,000 investment 09/04/03 – 03/31/09 ($)
| Sales charge | | without | | with | |
| Class A | | | 10,926 | | | | 10,567 | | |
| Class B | | | 10,463 | | | | 10,463 | | |
| Class C | | | 10,454 | | | | 10,454 | | |
| Class Z | | | 11,063 | | | | n/a | | |
Average annual total return as of 03/31/09 (%)
| Share class | | A | | B | | C | | Z | |
| Inception | | 09/04/03 | | 09/04/03 | | 09/05/03 | | 09/04/03 | |
| Sales charge | | without | | with | | without | | with | | without | | with | | without | |
| 1-year | | | –8.37 | | | | –11.34 | | | | –9.17 | | | | –11.79 | | | | –9.18 | | | | –10.05 | | | | –8.25 | | |
| 5-year | | | 0.77 | | | | 0.09 | | | | –0.01 | | | | –0.01 | | | | 0.01 | | | | 0.01 | | | | 0.99 | | |
| Life | | | 1.60 | | | | 0.99 | | | | 0.81 | | | | 0.81 | | | | 0.80 | | | | 0.80 | | | | 1.83 | | |
The "with sales charge" returns include the maximum initial sales charge of 3.25% for Class A shares, the applicable contingent deferred sales charge of 3.00% in the first year, declining to 1.00% in the fourth year and eliminated thereafter for Class B shares and 1.00% for Class C shares for the first year only. The "without sales charge" returns shown do not include the effect of sales charges. If they had, returns would be lower.
Performance results reflect any fee waivers or reimbursements of portfolio expenses by the investment advisor and/or any of its affiliates. Absent these fee waivers or expense reimbursement arrangements, performance results shown would have been lower.
All results shown assume reinvestment of distributions. Class Z shares are sold at net asset value with no distribution and service (Rule 12b-1) fees. Class Z shares have limited eligibility and the investment minimum requirements may vary. Please see the portfolio's prospectus for details. Performance for different share classes will vary based on differences in sales charges and fees associated with each class.
The tables do not reflect the deduction of taxes that a shareholder may pay on portfolio distributions or on the redemption of portfolio shares.
Performance data quoted represents past performance and current performance may be lower or higher. Past performance is no guarantee of future results. The investment return and principal value will fluctuate so that shares, when redeemed, may be worth more or less than the original cost. Please visit www.columbiafunds.com for daily and most recent month-end performance updates.
Annual operating expense ratio (%)*
| Class A | | | 1.73 | | |
| Class B | | | 2.48 | | |
| Class C | | | 2.48 | | |
| Class Z | | | 1.48 | | |
Annual operating expense ratio
after contractual waivers (%)*
| Class A | | | 1.26 | | |
| Class B | | | 2.01 | | |
| Class C | | | 2.01 | | |
| Class Z | | | 1.01 | | |
*The annual operating expense ratio and annual operating expense ratio after contractual waivers are as stated in the portfolio's prospectus that is current as of the date of this report and include the expenses incurred by the underlying funds in which the portfolio invests. The contractual waiver expires 07/31/09. Differences in expense ratios disclosed elsewhere in this report may result from including expenses incurred by the underlying funds, fee waivers and expense reimbursements as well as different time periods used in calculating the ratios.
19
Understanding Your Expenses – Columbia LifeGoal Income Portfolio
Estimating your actual expenses
To estimate the expenses that you paid over the period, first you will need your account balance at the end of the period:
g For shareholders who receive their account statements from Columbia Management Services, Inc., your account balance is available online at www.columbiafunds.com or by calling Shareholder Services at 800.345.6611.
g For shareholders who receive their account statements from their financial intermediary, contact your financial intermediary to obtain your account balance.
1. Divide your ending account balance by $1,000. For example, if an account balance was $8,600 at the end of the period, the result would be 8.6.
2. In the section of the table below titled "Expenses paid during the period," locate the amount for your share class. You will find this number in the column labeled "Actual." Multiply this number by the result from step 1. Your answer is an estimate of the expenses you paid on your account during the period.
If the value of your account falls below the minimum initial investment requirement applicable to you, your account generally will be subject to a $20 annual fee. This fee is not included in the accompanying table. If you are subject to the fee, keep it in mind when you are estimating the ongoing expenses of investing in the portfolio and when comparing the expenses of this portfolio with other funds.
As a portfolio shareholder, you incur two types of costs. There are transaction costs, which generally include sales charges on purchases and may include redemption fees or exchange fees. There are also ongoing costs, which generally include investment advisory fees, distribution and service (Rule 12b-1) fees and other portfolio expenses. The information on this page is intended to help you understand the ongoing costs of investing in the portfolio and to compare these costs with the ongoing costs of investing in other mutual funds.
Analyzing your portfolio's expenses by share class
To illustrate these ongoing costs, we have provided an example and calculated the expenses paid by investors in each share class during the period. The information in the following table is based on an initial investment of $1,000, which is invested at the beginning of the period and held for the entire period. Expense information is calculated two ways and each method provides you with different information. The amount listed in the "Actual" column is calculated using the portfolio's actual operating expenses and total return for the period. The amount listed in the "Hypothetical" column for each share class assumes that the return each year is 5% before expenses and is calculated based on the portfolio's actual operating expenses. You should not use the hypothetical account values and expenses to estimate either your actual account balance at the end of the period or the expenses you paid during this period.
Compare with other funds
Since all mutual funds are required to include the same hypothetical calculations about expenses in shareholder reports, you can use this information to compare the ongoing cost of investing in the portfolio with other funds. To do so, compare the 5% hypothetical example with the 5% hypothetical examples that appear in the shareholder reports of other funds. As you compare hypothetical examples of other funds, it is important to note that hypothetical examples are meant to highlight the ongoing costs of investing in a fund and do not reflect any transaction costs, such as sales charges, redemption fees or exchange fees.
10/01/08 – 03/31/09
| | | Account value at the
beginning of the period ($) | | Account value at the
end of the period ($) | | Expenses paid
during the period ($) | | Portfolio's annualized
expense ratio (%) | |
| | | Actual | | Hypothetical | | Actual | | Hypothetical | | Actual | | Hypothetical | | Actual | |
| Class A | | | 1,000.00 | | | | 1,000.00 | | | | 950.98 | | | | 1,021.59 | | | | 3.26 | | | | 3.38 | | | | 0.67 | | |
| Class B | | | 1,000.00 | | | | 1,000.00 | | | | 946.30 | | | | 1,017.85 | | | | 6.89 | | | | 7.14 | | | | 1.42 | | |
| Class C | | | 1,000.00 | | | | 1,000.00 | | | | 946.20 | | | | 1,017.85 | | | | 6.89 | | | | 7.14 | | | | 1.42 | | |
| Class Z | | | 1,000.00 | | | | 1,000.00 | | | | 951.08 | | | | 1,022.84 | | | | 2.04 | | | | 2.12 | | | | 0.42 | | |
Expenses paid during the period are equal to the annualized expense ratio for the share class, multiplied by the average account value over the period, then multiplied by the number of days in the portfolio's most recent fiscal half-year and divided by 365.
Had the investment advisor and/or any of its affiliates not waived fees or reimbursed a portion of expenses, account value at the end of the period would have been reduced.
It is important to note that the expense amounts shown in the table are meant to highlight only ongoing costs of investing in the portfolio and do not reflect any transaction costs, such as sales charges, redemption fees or exchange fees. Therefore, the hypothetical examples provided may not help you determine the relative total costs of owning shares of different portfolios. If these transaction costs were included, your costs would have been higher.
As a shareholder of the underlying funds in which it invests, the portfolio will bear its allocable share of the costs and expenses of these underlying funds. These costs and expenses are not included in expense information in the table above.
20
Portfolio Managers' Report – Columbia LifeGoal Income Portfolio
For the 12-month period that ended March 31, 2009, the portfolio's Class A shares returned negative 8.37% without sales charge. The portfolio trailed its benchmark, the Barclays Capital U.S. Aggregate 1-3 Years Index, which returned 3.42%. The portfolio's return was also lower than the negative 1.13% blended return for the Barclays Capital U.S. Aggregate 1-3 Years Index and the Barclays Capital U.S. Corporate High-Yield Bond Index. In an environment of contracting economic growth and sharply falling stock prices, the portfolio held up significantly better than the average return of its peer group, the Lipper Mixed-Asset Target Allocation Conservative Funds Classification, which returned negative 17.38%. A decision to reduce the portfolio's equity exposure by nearly half made a positive contribution to returns. However, an increase in exposure to investment grade bonds through Columbia Income Fund at the expense of cash detracted from performance. Overall, underlying funds in the portfolio delivered mixed results.
As of February 20, 2009, Anwiti Bahuguna, Colin Moore, Kent M. Peterson and Marie M. Schofield were named co-managers of the portfolio.
A challenging environment for markets everywhere
As a financial crisis deepened and the economy slumped into recession, stock prices came down sharply and many sectors of the bond market came under pressure. In January, a new federal administration began to formulate plans to stimulate an ailing financial system, stabilize the auto industry and jumpstart the economy. However, the prospect of over a trillion dollars in new spending made investors cautious. After more than a year of precipitous losses, the U.S. stock market reversed course and moved higher in March and beaten-down segments of the bond market showed some signs of life. Yet, it is too soon to tell whether the markets have bottomed and whether the late-March rally in stock prices is sustainable.
In this environment, a decision to cut back on the portfolio's equity exposure contributed favorably to performance. However, with all major stock market indices down more than 35% and only the highest quality bonds delivering positive returns, the good news was mostly relative. Columbia Large Cap Value Fund, Columbia Convertible Securities Fund, Columbia Mid Cap Value Fund, Columbia High Income Fund and Columbia Disciplined Value Fund all held up much better than their respective benchmarks. Columbia Value and Restructuring Fund, Columbia Small Cap Value Fund II, Columbia Income Fund, Columbia Total Return Bond Fund, Columbia Short Term Bond Fund and Mortgage- and Asset-Backed Portfolio all returned less than their respective benchmarks.
During the period, we reduced the portfolio's cash position to increase exposure to investment grade bonds, which detracted from performance as only the highest quality bonds fared well during the period. However, the portfolio's remaining position in cash helped cushion results.
Performance data quoted represents past performance and current performance may be lower or higher. Past performance is no guarantee of future results. The investment return and principal value will fluctuate so that shares, when redeemed, may be worth more or less than the original cost. Please visit www.columbiafunds.com for daily and most recent month-end performance updates.
Net asset value per share
as of 03/31/09 ($)
| Class A | | | 8.58 | | |
| Class B | | | 8.56 | | |
| Class C | | | 8.55 | | |
| Class Z | | | 8.57 | | |
Distributions declared per share
04/01/08 – 03/31/09 ($)
| Class A | | | 0.44 | | |
| Class B | | | 0.37 | | |
| Class C | | | 0.37 | | |
| Class Z | | | 0.47 | | |
21
Portfolio Managers' Report (continued) – Columbia LifeGoal Income Portfolio
Portfolio Allocation
as of 03/31/09 (%)
Columbia Short Term Bond
Fund | | | 35.3 | | |
Columbia Total Return
Bond Fund | | | 18.2 | | |
Columbia High Income
Fund | | | 16.0 | | |
Mortgage- and Asset-Backed
Portfolio | | | 10.9 | | |
| Columbia Income Fund | | | 7.1 | | |
Columbia Convertible
Securities Fund | | | 5.1 | | |
| Columbia Cash Reserves | | | 3.5 | | |
Columbia Mid Cap Value
Fund | | | 1.2 | | |
Columbia Value and
Restructuring Fund | | | 0.8 | | |
Columbia Large Cap Value
Fund | | | 0.8 | | |
Columbia Disciplined Value
Fund | | | 0.7 | | |
Columbia Small Cap Value
Fund II | | | 0.7 | | |
Portfolio allocation is calculated as a percentage of total investments.
Looking ahead
Despite the potential for market recovery, we remain cautious in our overall outlook for the year ahead. Recession has spread across the globe and market turbulence could continue for some time. Nevertheless, we are confident that the funds in the portfolio have the potential to rebound over the long term. Investing is a long-term endeavor. We do not believe that one year of weak returns weighed against the positive track record of stocks and bonds should undermine confidence in the market's potential over the long term.
Columbia LifeGoal Portfolios reserve the right to add or remove underlying funds at any time.
The portfolio is a "fund of funds." A fund of funds bears its allocable share of the costs and expenses of the underlying funds in which it invests. Such funds are thus subject to two levels of fees and a potentially higher expense ratio than would be associated with an investment in a fund that invests and trades directly in financial instruments under the direction of a single manager. Risks include, among others, stock market fluctuations due to business and economic developments.
Equity investments are affected by stock market fluctuations that occur in response to economic and business developments.
Stocks of small- and mid-cap companies pose special risks, including possible illiquidity and greater price volatility than stocks of larger, more established companies.
International investing may involve certain risks, including currency fluctuations, risks associated with possible differences in financial accounting standards and other monetary and political risks. Significant levels of foreign taxes, including potentially confiscatory levels of taxation and withholding taxes, may also apply to some foreign investments.
Investing in fixed-income securities may involve certain risks, including the credit quality of individual issuers, possible prepayments, market or economic developments and yields and share price fluctuations due to changes in interest rates. When interest rates go up, bond prices typically drop, and vice versa.
Investments in high-yield securities (commonly known as "junk" bonds) offer the potential for high current income and attractive total return but involve certain risks. Changes in economic conditions or other circumstances may adversely affect a high yield bond issuer's ability to make principal and interest payments. Rising interest rates tend to lower the value of all bonds. High-yield bonds issued by foreign entities have greataer potential risks, including less regulation, currency fluctuation, economic instability and political developments.
22
Investment Portfolio – Columbia LifeGoal Growth Portfolio
March 31, 2009
| Investment Companies (a) – 100.2% | |
| | | Shares | | Value ($) | |
Columbia Acorn International,
Class Z | | | 462,092 | | | | 9,727,042 | | |
Columbia Acorn USA,
Class Z | | | 553,910 | | | | 8,214,490 | | |
Columbia Contrarian
Core Fund, Class Z | | | 2,268,862 | | | | 19,194,570 | | |
Columbia Convertible
Securities Fund, Class Z | | | 600,056 | | | | 6,192,581 | | |
Columbia Disciplined
Value Fund, Class Z | | | 1,824,778 | | | | 12,773,447 | | |
Columbia Emerging
Markets Fund, Class Z | | | 2,088,743 | | | | 13,409,732 | | |
Columbia International
Value Fund, Class Z | | | 2,324,924 | | | | 23,435,231 | | |
Columbia Large Cap
Core Fund, Class Z | | | 2,261,624 | | | | 19,314,266 | | |
Columbia Large Cap
Growth Fund, Class Z | | | 894,520 | | | | 12,961,594 | | |
Columbia Large Cap
Value Fund, Class Z | | | 1,707,172 | | | | 12,786,715 | | |
Columbia Marsico Focused
Equities Fund, Class Z | | | 944,457 | | | | 13,052,392 | | |
Columbia Marsico International
Opportunities Fund, Class Z | | | 1,320,451 | | | | 9,639,291 | | |
Columbia Mid Cap Growth Fund,
Class Z | | | 2,145,107 | | | | 29,902,798 | | |
Columbia Mid Cap Value Fund,
Class Z | | | 4,070,262 | | | | 30,242,046 | | |
Columbia Select Large Cap
Growth Fund, Class Z | | | 1,800,945 | | | | 12,750,694 | | |
Columbia Small Cap
Growth Fund I, Class Z | | | 244,603 | | | | 4,053,076 | | |
Columbia Small Cap
Growth Fund II, Class Z | | | 616,997 | | | | 4,140,050 | | |
Columbia Small Cap
Value Fund II, Class Z | | | 2,268,697 | | | | 16,742,981 | | |
Columbia Value and
Restructuring Fund, Class Z | | | 489,476 | | | | 12,966,224 | | |
Total Investment Companies
(cost of $407,426,298) | | | 271,499,220 | | |
Total Investments – 100.2%
(cost of $407,426,298) (b) | | | 271,499,220 | | |
| Other Assets & Liabilities, Net – (0.2)% | | | (491,652 | ) | |
| Net Assets – 100.0% | | | 271,007,568 | | |
Notes to Investment Portfolio:
(a) Mutual funds registered under the Investment Company Act of 1940, as amended, and advised by Columbia Management Advisors, LLC or one of its affiliates.
(b) Cost for federal income tax purposes is $414,429,658.
On April 1, 2008, the Portfolio adopted Statement of Financial Accounting Standards No. 157, Fair Value Measurements ("SFAS 157"). SFAS 157 establishes a hierarchy that prioritizes the inputs to valuation techniques used to measure fair value giving the highest priority to unadjusted quoted prices in active markets for identical securities (level 1 measurements) and the lowest priority to unobservable inputs (level 3 measurements) when market prices are not readily available or reliable. The three levels of the fair value hierarchy under SFAS 157 are described below:
• Level 1 – quoted prices in active markets for identical securities
• Level 2 – prices determined using other significant observable inputs (including quoted prices for similar securities, interest rates, prepayment speeds, credit risk and others)
• Level 3 – prices determined using significant unobservable inputs. In situations where quoted prices or observable inputs are unavailable or less reliable, unobservable inputs may be used. Unobservable inputs may include management's own assumptions about the factors market participants would use in pricing an investment.
The inputs or methodology used for valuing securities are not necessarily an indication of the risk associated with investing in those securities.
The following table summarizes the inputs used, as of March 31, 2009, in valuing the Portfolio's assets:
| Valuation Inputs | | Investments in
Underlying Funds | | Other Financial
Instruments | |
| Level 1 – Quoted Prices | | $ | 271,499,220 | | | $ | – | | |
Level 2 – Other Significant
Observable Inputs | | | – | | | | – | | |
Level 3 – Significant
Unobservable Inputs | | | – | | | | – | | |
| Total | | $ | 271,499,220 | | | $ | – | | |
See Accompanying Notes to Financial Statements.
23
Investment Portfolio – Columbia LifeGoal Balanced Growth Portfolio
March 31, 2009
| Investment Companies (a) – 100.1% | |
| | | Shares | | Value ($) | |
Columbia Acorn International,
Class Z | | | 1,036,686 | | | | 21,822,244 | | |
Columbia Acorn USA,
Class Z | | | 573,559 | | | | 8,505,887 | | |
Columbia Cash Reserves,
Capital Class Shares | | | 2 | | | | 2 | | |
Columbia Contrarian
Core Fund, Class Z | | | 2,038,332 | | | | 17,244,287 | | |
Columbia Convertible
Securities Fund, Class Z | | | 885,968 | | | | 9,143,187 | | |
Columbia Disciplined
Value Fund, Class Z | | | 1,434,860 | | | | 10,044,020 | | |
Columbia Emerging
Markets Fund, Class Z | | | 2,060,286 | | | | 13,227,037 | | |
Columbia High Income Fund,
Class Z | | | 4,769,127 | | | | 28,519,380 | | |
Columbia Income Fund,
Class Z | | | 5,043,017 | | | | 38,377,361 | | |
Columbia International
Value Fund, Class Z | | | 2,191,116 | | | | 22,086,445 | | |
Columbia Large Cap
Core Fund, Class Z | | | 2,021,903 | | | | 17,267,055 | | |
Columbia Large Cap
Growth Fund, Class Z | | | 822,313 | | | | 11,915,319 | | |
Columbia Large Cap
Value Fund, Class Z | | | 1,355,896 | | | | 10,155,664 | | |
Columbia Marsico Focused
Equities Fund, Class Z | | | 870,001 | | | | 12,023,414 | | |
Columbia Marsico International
Opportunities Fund, Class Z | | | 2,978,783 | | | | 21,745,115 | | |
Columbia Mid Cap Growth Fund,
Class Z | | | 1,458,420 | | | | 20,330,373 | | |
Columbia Mid Cap Value Fund,
Class Z | | | 2,759,215 | | | | 20,500,968 | | |
Columbia Select Large Cap
Growth Fund, Class Z | | | 1,672,248 | | | | 11,839,518 | | |
Columbia Small Cap
Growth Fund I, Class Z | | | 254,021 | | | | 4,209,121 | | |
Columbia Small Cap
Growth Fund II, Class Z | | | 634,056 | | | | 4,254,515 | | |
Columbia Small Cap
Value Fund II, Class Z | | | 2,320,952 | | | | 17,128,629 | | |
Columbia Total Return
Bond Fund, Class Z | | | 12,320,595 | | | | 107,435,586 | | |
| | | Shares | | Value ($) | |
Columbia Value and
Restructuring Fund, Class Z | | | 385,793 | | | | 10,219,669 | | |
Total Investment Companies
(cost of $574,521,421) | | | 437,994,796 | | |
Total Investments – 100.1%
(cost of $574,521,421) (b) | | | 437,994,796 | | |
| Other Assets & Liabilities, Net – (0.1)% | | | (535,869 | ) | |
| Net Assets – 100.0% | | | 437,458,927 | | |
Notes to Investment Portfolio:
(a) Mutual funds registered under the Investment Company Act of 1940, as amended, and advised by Columbia Management Advisors, LLC or one of its affiliates.
(b) Cost for federal income tax purposes is $586,389,111.
On April 1, 2008, the Portfolio adopted Statement of Financial Accounting Standards No. 157, Fair Value Measurements ("SFAS 157"). SFAS 157 establishes a hierarchy that prioritizes the inputs to valuation techniques used to measure fair value giving the highest priority to unadjusted quoted prices in active markets for identical securities (level 1 measurements) and the lowest priority to unobservable inputs (level 3 measurements) when market prices are not readily available or reliable. The three levels of the fair value hierarchy under SFAS 157 are described below:
• Level 1 – quoted prices in active markets for identical securities
• Level 2 – prices determined using other significant observable inputs (including quoted prices for similar securities, interest rates, prepayment speeds, credit risk and others)
• Level 3 – prices determined using significant unobservable inputs. In situations where quoted prices or observable inputs are unavailable or less reliable, unobservable inputs may be used. Unobservable inputs may include management's own assumptions about the factors market participants would use in pricing an investment.
The inputs or methodology used for valuing securities are not necessarily an indication of the risk associated with investing in those securities.
The following table summarizes the inputs used, as of March 31, 2009, in valuing the Portfolio's assets:
| Valuation Inputs | | Investments in
Underlying Funds | | Other Financial
Instruments | |
| Level 1 – Quoted Prices | | $ | 437,994,796 | | | $ | – | | |
Level 2 – Other Significant
Observable Inputs | | | – | | | | – | | |
Level 3 – Significant
Unobservable Inputs | | | – | | | | – | | |
| Total | | $ | 437,994,796 | | | $ | – | | |
See Accompanying Notes to Financial Statements.
24
Investment Portfolio – Columbia LifeGoal Income and Growth Portfolio
March 31, 2009
| Investment Companies (a) – 100.2% | |
| | | Shares | | Value ($) | |
Columbia Acorn International,
Class Z | | | 117,559 | | | | 2,474,608 | | |
Columbia Acorn USA,
Class Z | | | 61,184 | | | | 907,363 | | |
Columbia Cash Reserves,
Capital Class Shares | | | 1,908,321 | | | | 1,908,321 | | |
Columbia Contrarian
Core Fund, Class Z | | | 275,709 | | | | 2,332,501 | | |
Columbia Convertible
Securities Fund, Class Z | | | 477,585 | | | | 4,928,672 | | |
Columbia Disciplined
Value Fund, Class Z | | | 220,315 | | | | 1,542,208 | | |
Columbia Emerging
Markets Fund, Class Z | | | 371,986 | | | | 2,388,148 | | |
Columbia High Income Fund,
Class Z | | | 2,116,866 | | | | 12,658,858 | | |
Columbia Income Fund,
Class Z | | | 1,248,867 | | | | 9,503,875 | | |
Columbia International
Value Fund, Class Z | | | 312,975 | | | | 3,154,790 | | |
Columbia Large Cap
Core Fund, Class Z | | | 273,381 | | | | 2,334,678 | | |
Columbia Large Cap
Growth Fund, Class Z | | | 107,622 | | | | 1,559,438 | | |
Columbia Large Cap
Value Fund, Class Z | | | 206,859 | | | | 1,549,374 | | |
Columbia Marsico Focused
Equities Fund, Class Z | | | 113,096 | | | | 1,562,992 | | |
Columbia Marsico International
Opportunities Fund, Class Z | | | 338,123 | | | | 2,468,295 | | |
Columbia Mid Cap Growth Fund,
Class Z | | | 173,333 | | | | 2,416,258 | | |
Columbia Mid Cap Value Fund,
Class Z | | | 327,125 | | | | 2,430,536 | | |
Columbia Select Large Cap
Growth Fund, Class Z | | | 218,302 | | | | 1,545,582 | | |
Columbia Short Term
Bond Fund, Class Z | | | 3,429,997 | | | | 32,413,474 | | |
Columbia Small Cap
Growth Fund I, Class Z | | | 26,985 | | | | 447,138 | | |
Columbia Small Cap
Growth Fund II, Class Z | | | 68,566 | | | | 460,077 | | |
Columbia Small Cap
Value Fund II, Class Z | | | 248,547 | | | | 1,834,274 | | |
Columbia Total Return
Bond Fund, Class Z | | | 2,980,025 | | | | 25,985,817 | | |
| | | Shares | | Value ($) | |
Columbia Value and
Restructuring Fund, Class Z | | | 58,640 | | | | 1,553,364 | | |
Total Investment Companies
(cost of $140,255,704) | | | 120,360,641 | | |
Total Investments – 100.2%
(cost of $140,255,704) (b) | | | 120,360,641 | | |
| Other Assets & Liabilities, Net – (0.2)% | | | (262,898 | ) | |
| Net Assets – 100.0% | | | 120,097,743 | | |
Notes to Investment Portfolio:
(a) Mutual funds registered under the Investment Company Act of 1940, as amended, and advised by Columbia Management Advisors, LLC or one of its affiliates.
(b) Cost for federal income tax purposes is $148,184,245.
On April 1, 2008, the Portfolio adopted Statement of Financial Accounting Standards No. 157, Fair Value Measurements ("SFAS 157"). SFAS 157 establishes a hierarchy that prioritizes the inputs to valuation techniques used to measure fair value giving the highest priority to unadjusted quoted prices in active markets for identical securities (level 1 measurements) and the lowest priority to unobservable inputs (level 3 measurements) when market prices are not readily available or reliable. The three levels of the fair value hierarchy under SFAS 157 are described below:
• Level 1 – quoted prices in active markets for identical securities
• Level 2 – prices determined using other significant observable inputs (including quoted prices for similar securities, interest rates, prepayment speeds, credit risk and others)
• Level 3 – prices determined using significant unobservable inputs. In situations where quoted prices or observable inputs are unavailable or less reliable, unobservable inputs may be used. Unobservable inputs may include management's own assumptions about the factors market participants would use in pricing an investment.
The inputs or methodology used for valuing securities are not necessarily an indication of the risk associated with investing in those securities.
The following table summarizes the inputs used, as of March 31, 2009, in valuing the Portfolio's assets:
| Valuation Inputs | | Investments in
Underlying Funds | | Other Financial
Instruments | |
| Level 1 – Quoted Prices | | $ | 120,360,641 | | | $ | – | | |
Level 2 – Other Significant
Observable Inputs | | | – | | | | – | | |
Level 3 – Significant
Unobservable Inputs | | | – | | | | – | | |
| Total | | $ | 120,360,641 | | | $ | – | | |
See Accompanying Notes to Financial Statements.
25
Investment Portfolio – Columbia LifeGoal Income Portfolio
March 31, 2009
| Investment Companies (a) – 100.2% | |
| | | Shares | | Value ($) | |
Columbia Cash Reserves,
Capital Class Shares | | | 995,895 | | | | 995,895 | | |
Columbia Convertible
Securities Fund, Class Z | | | 139,000 | | | | 1,434,480 | | |
Columbia Disciplined
Value Fund, Class Z | | | 29,439 | | | | 206,072 | | |
Columbia High Income Fund,
Class Z | | | 759,271 | | | | 4,540,442 | | |
Columbia Income Fund,
Class Z | | | 263,020 | | | | 2,001,586 | | |
Columbia Large Cap
Value Fund, Class Z | | | 28,610 | | | | 214,290 | | |
Columbia Mid Cap Value Fund,
Class Z | | | 45,905 | | | | 341,077 | | |
Columbia Short Term
Bond Fund, Class Z | | | 1,059,254 | | | | 10,009,947 | | |
Columbia Small Cap
Value Fund II, Class Z | | | 24,963 | | | | 184,229 | | |
Columbia Total Return
Bond Fund, Class Z | | | 591,836 | | | | 5,160,812 | | |
Columbia Value and
Restructuring Fund, Class Z | | | 8,196 | | | | 217,118 | | |
Mortgage- and
Asset-Backed Portfolio | | | 347,803 | | | | 3,088,486 | | |
Total Investment Companies
(cost of $31,163,610) | | | 28,394,434 | | |
Total Investments – 100.2%
(cost of $31,163,610) (b) | | | 28,394,434 | | |
| Other Assets & Liabilities, Net – (0.2)% | | | (70,143 | ) | |
| Net Assets – 100.0% | | | 28,324,291 | | |
Notes to Investment Portfolio:
(a) Mutual funds registered under the Investment Company Act of 1940, as amended, and advised by Columbia Management Advisors, LLC or one of its affiliates.
(b) Cost for federal income tax purposes is $33,164,028.
On April 1, 2008, the Portfolio adopted Statement of Financial Accounting Standards No. 157, Fair Value Measurements ("SFAS 157"). SFAS 157 establishes a hierarchy that prioritizes the inputs to valuation techniques used to measure fair value giving the highest priority to unadjusted quoted prices in active markets for identical securities (level 1 measurements) and the lowest priority to unobservable inputs (level 3 measurements) when market prices are not readily available or reliable. The three levels of the fair value hierarchy under SFAS 157 are described below:
• Level 1 – quoted prices in active markets for identical securities
• Level 2 – prices determined using other significant observable inputs (including quoted prices for similar securities, interest rates, prepayment speeds, credit risk and others)
• Level 3 – prices determined using significant unobservable inputs. In situations where quoted prices or observable inputs are unavailable or less reliable, unobservable inputs may be used. Unobservable inputs may include management's own assumptions about the factors market participants would use in pricing an investment.
The inputs or methodology used for valuing securities are not necessarily an indication of the risk associated with investing in those securities.
The following table summarizes the inputs used, as of March 31, 2009, in valuing the Portfolio's assets:
| Valuation Inputs | | Investments in
Underlying Funds | | Other Financial
Instruments | |
| Level 1 – Quoted Prices | | $ | 28,394,434 | | | $ | – | | |
Level 2 – Other Significant
Observable Inputs | | | – | | | | – | | |
Level 3 – Significant
Unobservable Inputs | | | – | | | | – | | |
| Total | | $ | 28,394,434 | | | $ | – | | |
See Accompanying Notes to Financial Statements.
26
Statements of Assets and Liabilities – Columbia LifeGoal Portfolios
March 31, 2009
| | | Columbia
LifeGoal
Growth
Portfolio | | Columbia
LifeGoal
Balanced
Growth
Portfolio | | Columbia
LifeGoal
Income and
Growth
Portfolio | | Columbia
LifeGoal
Income
Portfolio | |
| Assets | |
| Affiliated investments, at identified cost | | $ | 407,426,298 | | | $ | 574,521,421 | | | $ | 140,255,704 | | | $ | 31,163,610 | | |
| Affiliated investments, at value | | | 271,499,220 | | | | 437,994,796 | | | | 120,360,641 | | | | 28,394,434 | | |
| Cash | | | 3,000 | | | | 1,321 | | | | — | | | | — | | |
| Receivable for: | |
| Investments sold | | | — | | | | 233,637 | | | | 208,387 | | | | 3,141 | | |
| Portfolio shares sold | | | 192,754 | | | | 520,181 | | | | 187,504 | | | | 88,785 | | |
| Other assets | | | — | | | | — | | | | — | | | | 315 | | |
| Total Assets | | | 271,694,974 | | | | 438,749,935 | | | | 120,756,532 | | | | 28,486,675 | | |
| Liabilities | |
| Expense reimbursement due to investment advisor | | | — | | | | — | | | | — | | | | 9,285 | | |
| Payable for: | |
| Investments purchased | | | 22,937 | | | | — | | | | — | | | | — | | |
| Portfolio shares repurchased | | | 483,893 | | | | 934,177 | | | | 574,734 | | | | 71,229 | | |
| Investment advisory fee | | | 55,279 | | | | 90,692 | | | | 25,021 | | | | 1,043 | | |
| Administration fee | | | — | | | | — | | | | — | | | | 785 | | |
| Transfer agent fee | | | — | | | | — | | | | — | | | | 3,595 | | |
| Pricing and bookkeeping fees | | | — | | | | — | | | | — | | | | 2,187 | | |
| Trustees' fees | | | — | | | | — | | | | — | | | | 26,989 | | |
| Audit fee | | | — | | | | — | | | | — | | | | 21,200 | | |
| Legal fees | | | — | | | | — | | | | — | | | | 10,540 | | |
| Custody fee | | | — | | | | — | | | | — | | | | 446 | | |
| Distribution and service fees | | | 125,297 | | | | 220,487 | | | | 59,034 | | | | 12,984 | | |
| Chief compliance officer expenses | | | — | | | | — | | | | — | | | | 150 | | |
| Other liabilities | | | — | | | | 45,652 | | | | — | | | | 1,951 | | |
| Total Liabilities | | | 687,406 | | | | 1,291,008 | | | | 658,789 | | | | 162,384 | | |
| Net Assets | | | 271,007,568 | | | | 437,458,927 | | | | 120,097,743 | | | | 28,324,291 | | |
| Net Assets Consist of | | | | | | | | | | | | | | | | | |
| Paid-in capital | | | 481,644,054 | | | | 648,236,442 | | | | 157,761,655 | | | | 34,033,678 | | |
| Undistributed net investment income | | | — | | | | 171,332 | | | | 17,944 | | | | 12,362 | | |
| Accumulated net realized loss | | | (74,709,408 | ) | | | (74,422,222 | ) | | | (17,786,793 | ) | | | (2,952,573 | ) | |
| Net unrealized appreciation (depreciation) on investments | | | (135,927,078 | ) | | | (136,526,625 | ) | | | (19,895,063 | ) | | | (2,769,176 | ) | |
| Net Assets | | | 271,007,568 | | | | 437,458,927 | | | | 120,097,743 | | | | 28,324,291 | | |
See Accompanying Notes to Financial Statements.
27
Statements of Assets and Liabilities (continued) – Columbia LifeGoal Portfolios
March 31, 2009
| | | Columbia
LifeGoal
Growth
Portfolio | | Columbia
LifeGoal
Balanced
Growth
Portfolio | | Columbia
LifeGoal
Income and
Growth
Portfolio | | Columbia
LifeGoal
Income
Portfolio | |
| Class A | |
| Net assets | | $ | 116,169,155 | | | $ | 170,155,156 | | | $ | 44,825,068 | | | $ | 11,281,245 | | |
| Shares outstanding | | | 17,382,529 | | | | 23,199,044 | | | | 5,579,757 | | | | 1,315,550 | | |
| Net asset value and redemption price per share (a) | | $ | 6.68 | | | $ | 7.33 | | | $ | 8.03 | | | $ | 8.58 | | |
| Maximum sales charge | | | 5.75 | % | | | 5.75 | % | | | 5.75 | % | | | 3.25 | % | |
| Maximum offering price per share | | $ | 7.09 | (b) | | $ | 7.78 | (b) | | $ | 8.52 | (b) | | $ | 8.87 | (c) | |
| Class B | |
| Net assets | | $ | 74,197,222 | | | $ | 156,678,643 | | | $ | 40,269,690 | | | $ | 7,467,418 | | |
| Shares outstanding | | | 12,031,174 | | | | 21,495,980 | | | | 5,029,237 | | | | 871,994 | | |
| Net asset value and offering price per share (a) | | $ | 6.17 | | | $ | 7.29 | | | $ | 8.01 | | | $ | 8.56 | | |
| Class C | |
| Net assets | | $ | 50,343,147 | | | $ | 64,939,627 | | | $ | 18,369,769 | | | $ | 5,103,815 | | |
| Shares outstanding | | | 8,231,412 | | | | 8,799,747 | | | | 2,308,196 | | | | 596,739 | | |
| Net asset value and offering price per share (a) | | $ | 6.12 | | | $ | 7.38 | | | $ | 7.96 | | | $ | 8.55 | | |
| Class R | |
| Net assets | | $ | 831,017 | | | $ | 1,665,816 | | | $ | 357,908 | | | | — | | |
| Shares outstanding | | | 125,077 | | | | 227,204 | | | | 44,535 | | | | — | | |
| Net asset value and offering price per share | | $ | 6.64 | | | $ | 7.33 | | | $ | 8.04 | | | | — | | |
| Class Z | |
| Net assets | | $ | 29,467,027 | | | $ | 44,019,685 | | | $ | 16,275,308 | | | $ | 4,471,813 | | |
| Shares outstanding | | | 4,349,041 | | | | 6,008,040 | | | | 2,045,260 | | | | 521,497 | | |
| Net asset value and offering price per share | | $ | 6.78 | | | $ | 7.33 | | | $ | 7.96 | | | $ | 8.57 | | |
(a) Redemption price per share is equal to net asset value less any applicable contingent deferred sales charge.
(b) On sales of $50,000 or more the offering price is reduced.
(c) On sales of $100,000 or more shares the offering price is reduced.
See Accompanying Notes to Financial Statements.
28
Statements of Operations – Columbia LifeGoal Portfolios
For the Year Ended March 31, 2009
| | | Columbia
LifeGoal
Growth
Portfolio | | Columbia
LifeGoal
Balanced
Growth
Portfolio | | Columbia
LifeGoal
Income and
Growth
Portfolio | | Columbia
LifeGoal
Income
Portfolio | |
| Investment Income | |
| Dividends from affiliates | | $ | 4,711,210 | | | $ | 17,395,515 | | | $ | 5,923,755 | | | $ | 1,533,560 | | |
| Expenses | |
| Investment advisory fee | | | 1,008,735 | | | | 1,479,159 | | | | 362,391 | | | | 16,419 | | |
| Administration fee | | | — | | | | — | | | | — | | | | 38,550 | | |
| Shareholder servicing and distribution fees: | |
| Class A | | | 422,179 | | | | 571,545 | | | | 123,146 | | | | 30,060 | | |
| Distribution fee: | |
| Class B | | | 861,988 | | | | 1,681,449 | | | | 407,317 | | | | 59,380 | | |
| Class C | | | 582,418 | | | | 681,326 | | | | 171,199 | | | | 35,955 | | |
| Class R | | | 4,954 | | | | 7,391 | | | | 2,034 | | | | — | | |
| Service fee: | |
| Class B | | | 287,272 | | | | 560,527 | | | | 135,794 | | | | 19,783 | | |
| Class C | | | 194,470 | | | | 227,100 | | | | 57,307 | | | | 11,985 | | |
| Transfer agent fee | | | — | | | | — | | | | — | | | | 26,374 | | |
| Pricing and bookkeeping fees | | | — | | | | — | | | | — | | | | 26,128 | | |
| Trustees' fees | | | — | | | | — | | | | — | | | | 375 | | |
| Custody fee | | | — | | | | — | | | | — | | | | 5,032 | | |
| Registration fees | | | — | | | | — | | | | — | | | | 43,455 | | |
| Audit fee | | | — | | | | — | | | | — | | | | 31,056 | | |
| Legal fees | | | — | | | | — | | | | — | | | | 47,011 | | |
| Chief compliance officer expenses | | | — | | | | — | | | | — | | | | 624 | | |
| Other expenses | | | — | | | | — | | | | — | | | | 10,686 | | |
| Expenses before interest expense | | | 3,362,016 | | | | 5,208,497 | | | | 1,259,188 | | | | 402,873 | | |
| Interest expense | | | — | | | | — | | | | 135 | | | | — | | |
| Total Expenses | | | 3,362,016 | | | | 5,208,497 | | | | 1,259,323 | | | | 402,873 | | |
Fees waived or expenses reimbursed by investment advisor
and/or administrator | | | — | | | | — | | | | — | | | | (118,659 | ) | |
| Expense reductions | | | (2,686 | ) | | | (1,667 | ) | | | (180 | ) | | | — | | |
| Net Expenses | | | 3,359,330 | | | | 5,206,830 | | | | 1,259,143 | | | | 284,214 | | |
| Net Investment Income | | | 1,351,880 | | | | 12,188,685 | | | | 4,664,612 | | | | 1,249,346 | | |
Net Realized and Unrealized Gain (Loss) on Investments and
Capital Gains Distributions Received | | | | | |
| Net realized gain (loss) on: | |
| Affiliated investments | | | (79,089,090 | ) | | | (77,756,809 | ) | | | (17,656,075 | ) | | | (2,412,015 | ) | |
| Capital gains distribution received | | | 7,446,981 | | | | 7,291,596 | | | | 1,079,984 | | | | 63,636 | | |
| Net realized gain (loss) | | | (71,642,109 | ) | | | (70,465,213 | ) | | | (16,576,091 | ) | | | (2,348,379 | ) | |
Net change in unrealized appreciation (depreciation)
on investments | | | (112,051,391 | ) | | | (125,990,158 | ) | | | (15,800,904 | ) | | | (1,700,679 | ) | |
| Net Loss | | | (183,693,500 | ) | | | (196,455,371 | ) | | | (32,376,995 | ) | | | (4,049,058 | ) | |
| Net Increase (Decrease) Resulting from Operations | | | (182,341,620 | ) | | | (184,266,686 | ) | | | (27,712,383 | ) | | | (2,799,712 | ) | |
See Accompanying Notes to Financial Statements.
29
Statements of Changes in Net Assets – Columbia LifeGoal Portfolios
| Increase (Decrease) in Net Assets | | Columbia
LifeGoal Growth Portfolio | | Columbia
LifeGoal Balanced Growth Portfolio | |
| | | Year Ended March 31, | | Year Ended March 31, | |
| | | 2009 ($) | | 2008 ($) | | 2009 ($) | | 2008 ($) | |
| Operations | |
| Net investment income | | | 1,351,880 | | | | 2,497,032 | | | | 12,188,685 | | | | 18,415,797 | | |
| Net realized gain (loss) on investments and capital gains distributions received | | | (71,642,109 | ) | | | 127,326,864 | | | | (70,465,213 | ) | | | 97,617,865 | | |
| Net change in unrealized appreciation (depreciation) on investments | | | (112,051,391 | ) | | | (141,048,927 | ) | | | (125,990,158 | ) | | | (118,182,854 | ) | |
| Net increase (decrease) resulting from operations | | | (182,341,620 | ) | | | (11,225,031 | ) | | | (184,266,686 | ) | | | (2,149,192 | ) | |
| Distributions to Shareholders | |
| From net investment income: | |
| Class A | | | (676,822 | ) | | | (911,247 | ) | | | (5,515,625 | ) | | | (5,829,073 | ) | |
| Class B | | | (278,679 | ) | | | — | | | | (3,736,680 | ) | | | (4,060,682 | ) | |
| Class C | | | (193,667 | ) | | | — | | | | (1,496,200 | ) | | | (1,538,028 | ) | |
| Class R | | | (3,186 | ) | | | (3,827 | ) | | | (39,486 | ) | | | (26,332 | ) | |
| Class Z | | | (199,526 | ) | | | (2,402,999 | ) | | | (1,365,743 | ) | | | (7,005,519 | ) | |
| From net realized gains: | |
| Class A | | | (39,083,644 | ) | | | (12,781,647 | ) | | | (26,940,878 | ) | | | (12,962,579 | ) | |
| Class B | | | (28,904,759 | ) | | | (10,391,949 | ) | | | (26,954,090 | ) | | | (14,700,935 | ) | |
| Class C | | | (19,597,408 | ) | | | (6,431,708 | ) | | | (10,746,472 | ) | | | (5,509,957 | ) | |
| Class R | | | (223,911 | ) | | | (70,656 | ) | | | (123,428 | ) | | | (73,872 | ) | |
| Class Z | | | (9,633,365 | ) | | | (15,523,786 | ) | | | (4,698,253 | ) | | | (14,069,047 | ) | |
| From return of capital: | |
| Class A | | | (119,590 | ) | | | — | | | | — | | | | — | | |
| Class B | | | (82,772 | ) | | | — | | | | — | | | | — | | |
| Class C | | | (56,631 | ) | | | — | | | | — | | | | — | | |
| Class R | | | (860 | ) | | | — | | | | — | | | | — | | |
| Class Z | | | (29,920 | ) | | | — | | | | — | | | | — | | |
| Total distributions to shareholders | | | (99,084,740 | ) | | | (48,517,819 | ) | | | (81,616,855 | ) | | | (65,776,024 | ) | |
| Net Capital Stock Transactions | | | 35,570,771 | | | | (151,343,707 | ) | | | (16,014,725 | ) | | | (218,016,106 | ) | |
| Total increase (decrease) in net assets | | | (245,855,589 | ) | | | (211,086,557 | ) | | | (281,898,266 | ) | | | (285,941,322 | ) | |
| Net Assets | |
| Beginning of period | | | 516,863,157 | | | | 727,949,714 | | | | 719,357,193 | | | | 1,005,298,515 | | |
| End of period | | | 271,007,568 | | | | 516,863,157 | | | | 437,458,927 | | | | 719,357,193 | | |
| Undistributed net investment income at end of period | | | — | | | | — | | | | 171,332 | | | | 218,294 | | |
See Accompanying Notes to Financial Statements.
30
| Increase (Decrease) in Net Assets | | Columbia
LifeGoal Income and Growth Portfolio | | Columbia
LifeGoal Income Portfolio | |
| | | Year Ended March 31, | | Year Ended March 31, | |
| | | 2009 ($) | | 2008 ($) | | 2009 ($) | | 2008 ($) | |
| Operations | |
| Net investment income | | | 4,664,612 | | | | 6,521,762 | | | | 1,249,346 | | | | 1,390,846 | | |
| Net realized gain (loss) on investments and capital gains distributions received | | | (16,576,091 | ) | | | 9,548,093 | | | | (2,348,379 | ) | | | 163,659 | | |
| Net change in unrealized appreciation (depreciation) on investments | | | (15,800,904 | ) | | | (13,399,227 | ) | | | (1,700,679 | ) | | | (1,428,147 | ) | |
| Net increase (decrease) resulting from operations | | | (27,712,383 | ) | | | 2,670,628 | | | | (2,799,712 | ) | | | 126,358 | | |
| Distributions to Shareholders | |
| From net investment income: | |
| Class A | | | (1,787,275 | ) | | | (1,726,795 | ) | | | (528,217 | ) | | | (633,502 | ) | |
| Class B | | | (1,496,820 | ) | | | (1,775,088 | ) | | | (289,485 | ) | | | (330,394 | ) | |
| Class C | | | (642,374 | ) | | | (647,302 | ) | | | (178,485 | ) | | | (184,872 | ) | |
| Class R | | | (13,665 | ) | | | (19,165 | ) | | | — | | | | — | | |
| Class Z | | | (728,571 | ) | | | (2,360,741 | ) | | | (252,288 | ) | | | (241,173 | ) | |
| From net realized gains: | |
| Class A | | | (2,138,677 | ) | | | (1,623,501 | ) | | | (52,628 | ) | | | (23,649 | ) | |
| Class B | | | (2,476,269 | ) | | | (2,211,120 | ) | | | (32,624 | ) | | | (14,927 | ) | |
| Class C | | | (1,034,082 | ) | | | (773,711 | ) | | | (19,422 | ) | | | (8,318 | ) | |
| Class R | | | (18,411 | ) | | | (21,726 | ) | | | — | | | | — | | |
| Class Z | | | (691,717 | ) | | | (2,280,354 | ) | | | (25,388 | ) | | | (8,469 | ) | |
| From return of capital: | |
| Class A | | | — | | | | — | | | | — | | | | — | | |
| Class B | | | — | | | | — | | | | — | | | | — | | |
| Class C | | | — | | | | — | | | | — | | | | — | | |
| Class R | | | — | | | | — | | | | — | | | | — | | |
| Class Z | | | — | | | | — | | | | — | | | | — | | |
| Total distributions to shareholders | | | (11,027,861 | ) | | | (13,439,503 | ) | | | (1,378,537 | ) | | | (1,445,304 | ) | |
| Net Capital Stock Transactions | | | (2,640,145 | ) | | | (47,713,990 | ) | | | (1,032,311 | ) | | | 1,558,369 | | |
| Total increase (decrease) in net assets | | | (41,380,389 | ) | | | (58,482,865 | ) | | | (5,210,560 | ) | | | 239,423 | | |
| Net Assets | |
| Beginning of period | | | 161,478,132 | | | | 219,960,997 | | | | 33,534,851 | | | | 33,295,428 | | |
| End of period | | | 120,097,743 | | | | 161,478,132 | | | | 28,324,291 | | | | 33,534,851 | | |
| Undistributed net investment income at end of period | | | 17,944 | | | | 71,699 | | | | 12,362 | | | | 16,430 | | |
See Accompanying Notes to Financial Statements.
31
Statements of Changes in Net Assets – Capital Stock Activity
| | | Columbia LifeGoal Growth Portfolio | |
| | | Year Ended
March 31, 2009 | | Year Ended
March 31, 2008 | |
| | | Shares | | Dollars ($) | | Shares | | Dollars ($) | |
| Class A | |
| Subscriptions | | | 3,454,524 | | | | 32,525,153 | | | | 4,204,675 | | | | 62,782,607 | | |
| Distributions reinvested | | | 3,505,856 | | | | 37,286,239 | | | | 844,269 | | | | 12,704,814 | | |
| Redemptions | | | (5,508,191 | ) | | | (48,589,833 | ) | | | (3,186,556 | ) | | | (47,317,753 | ) | |
| Net increase (decrease) | | | 1,452,189 | | | | 21,221,559 | | | | 1,862,388 | | | | 28,169,668 | | |
| Class B | |
| Subscriptions | | | 817,201 | | | | 7,608,028 | | | | 1,254,576 | | | | 17,739,132 | | |
| Distributions reinvested | | | 2,787,933 | | | | 27,567,429 | | | | 688,407 | | | | 9,794,335 | | |
| Redemptions | | | (3,664,323 | ) | | | (30,142,955 | ) | | | (2,122,141 | ) | | | (29,510,394 | ) | |
| Net increase (decrease) | | | (59,189 | ) | | | 5,032,502 | | | | (179,158 | ) | | | (1,976,927 | ) | |
| Class C | |
| Subscriptions | | | 1,747,721 | | | | 16,328,504 | | | | 2,261,729 | | | | 31,897,079 | | |
| Distributions reinvested | | | 1,567,012 | | | | 15,367,263 | | | | 348,359 | | | | 4,921,679 | | |
| Redemptions | | | (3,069,876 | ) | | | (24,575,462 | ) | | | (1,596,845 | ) | | | (22,037,337 | ) | |
| Net increase (decrease) | | | 244,857 | | | | 7,120,305 | | | | 1,013,243 | | | | 14,781,421 | | |
| Class R | |
| Subscriptions | | | 40,684 | | | | 338,883 | | | | 29,904 | | | | 450,565 | | |
| Distributions reinvested | | | 21,524 | | | | 227,957 | | | | 4,960 | | | | 74,482 | | |
| Redemptions | | | (28,559 | ) | | | (282,138 | ) | | | (23,145 | ) | | | (342,545 | ) | |
| Net increase (decrease) | | | 33,649 | | | | 284,702 | | | | 11,719 | | | | 182,502 | | |
| Class Z | |
| Subscriptions | | | 1,843,568 | | | | 14,777,449 | | | | 4,672,698 | | | | 72,128,483 | | |
| Distributions reinvested | | | 511,180 | | | | 5,503,378 | | | | 1,082,371 | | | | 16,422,213 | | |
| Redemptions | | | (2,134,711 | ) | | | (18,369,124 | ) | | | (18,689,832 | ) | | | (281,051,067 | ) | |
| Net increase (decrease) | | | 220,037 | | | | 1,911,703 | | | | (12,934,763 | ) | | | (192,500,371 | ) | |
See Accompanying Notes to Financial Statements.
32
| | | Columbia LifeGoal Balanced Growth Portfolio | |
| | | Year Ended
March 31, 2009 | | Year Ended
March 31, 2008 | |
| | | Shares | | Dollars ($) | | Shares | | Dollars ($) | |
| Class A | |
| Subscriptions | | | 4,291,111 | | | | 39,976,547 | | | | 6,062,333 | | | | 75,115,347 | | |
| Distributions reinvested | | | 3,112,699 | | | | 30,437,602 | | | | 1,424,931 | | | | 17,597,842 | | |
| Redemptions | | | (8,457,706 | ) | | | (73,707,271 | ) | | | (4,768,555 | ) | | | (58,846,249 | ) | |
| Net increase (decrease) | | | (1,053,896 | ) | | | (3,293,122 | ) | | | 2,718,709 | | | | 33,866,940 | | |
| Class B | |
| Subscriptions | | | 1,510,474 | | | | 14,118,684 | | | | 1,923,817 | | | | 23,625,502 | | |
| Distributions reinvested | | | 2,960,121 | | | | 29,013,590 | | | | 1,441,982 | | | | 17,746,731 | | |
| Redemptions | | | (8,006,306 | ) | | | (68,629,338 | ) | | | (4,742,176 | ) | | | (57,708,853 | ) | |
| Net increase (decrease) | | | (3,535,711 | ) | | | (25,497,064 | ) | | | (1,376,377 | ) | | | (16,336,620 | ) | |
| Class C | |
| Subscriptions | | | 1,758,967 | | | | 16,578,329 | | | | 2,366,640 | | | | 29,463,064 | | |
| Distributions reinvested | | | 961,892 | | | | 9,540,633 | | | | 428,619 | | | | 5,331,468 | | |
| Redemptions | | | (3,801,694 | ) | | | (33,379,383 | ) | | | (2,459,213 | ) | | | (30,423,627 | ) | |
| Net increase (decrease) | | | (1,080,835 | ) | | | (7,260,421 | ) | | | 336,046 | | | | 4,370,905 | | |
| Class R | |
| Subscriptions | | | 125,717 | | | | 1,150,078 | | | | 6,640 | | | | 81,392 | | |
| Distributions reinvested | | | 17,084 | | | | 162,914 | | | | 8,107 | | | | 100,204 | | |
| Redemptions | | | (26,244 | ) | | | (237,623 | ) | | | (58,970 | ) | | | (734,077 | ) | |
| Net increase (decrease) | | | 116,557 | | | | 1,075,369 | | | | (44,223 | ) | | | (552,481 | ) | |
| Class Z | |
| Subscriptions | | | 3,371,764 | | | | 31,627,836 | | | | 5,097,201 | | | | 63,916,826 | | |
| Distributions reinvested | | | 506,774 | | | | 4,879,824 | | | | 1,667,732 | | | | 20,636,110 | | |
| Redemptions | | | (1,983,230 | ) | | | (17,547,147 | ) | | | (26,366,502 | ) | | | (323,917,786 | ) | |
| Net increase (decrease) | | | 1,895,308 | | | | 18,960,513 | | | | (19,601,569 | ) | | | (239,364,850 | ) | |
See Accompanying Notes to Financial Statements.
33
Statements of Changes in Net Assets – Capital Stock Activity
| | | Columbia LifeGoal Income and Growth Portfolio | |
| | | Year Ended
March 31, 2009 | | Year Ended
March 31, 2008 | |
| | | Shares | | Dollars ($) | | Shares | | Dollars ($) | |
| Class A | |
| Subscriptions | | | 2,073,776 | | | | 18,288,125 | | | | 1,761,147 | | | | 19,237,434 | | |
| Distributions reinvested | | | 381,961 | | | | 3,562,465 | | | | 272,723 | | | | 2,970,907 | | |
| Redemptions | | | (2,105,575 | ) | | | (18,655,380 | ) | | | (1,409,889 | ) | | | (15,440,984 | ) | |
| Net increase (decrease) | | | 350,162 | | | | 3,195,210 | | | | 623,981 | | | | 6,767,357 | | |
| Class B | |
| Subscriptions | | | 770,389 | | | | 6,937,048 | | | | 589,007 | | | | 6,354,897 | | |
| Distributions reinvested | | | 388,937 | | | | 3,656,519 | | | | 334,069 | | | | 3,633,985 | | |
| Redemptions | | | (2,552,583 | ) | | | (22,444,006 | ) | | | (1,327,603 | ) | | | (14,475,847 | ) | |
| Net decrease | | | (1,393,257 | ) | | | (11,850,439 | ) | | | (404,527 | ) | | | (4,486,965 | ) | |
| Class C | |
| Subscriptions | | | 729,163 | | | | 6,566,710 | | | | 908,106 | | | | 9,852,630 | | |
| Distributions reinvested | | | 141,359 | | | | 1,316,982 | | | | 99,526 | | | | 1,075,956 | | |
| Redemptions | | | (1,134,246 | ) | | | (9,870,305 | ) | | | (662,486 | ) | | | (7,187,719 | ) | |
| Net increase (decrease) | | | (263,724 | ) | | | (1,986,613 | ) | | | 345,146 | | | | 3,740,867 | | |
| Class R | |
| Subscriptions | | | 15,285 | | | | 136,565 | | | | 604 | | | | 6,705 | | |
| Distributions reinvested | | | 3,424 | | | | 32,076 | | | | 3,740 | | | | 40,891 | | |
| Redemptions | | | (17,563 | ) | | | (157,356 | ) | | | (42,159 | ) | | | (467,416 | ) | |
| Net increase (decrease) | | | 1,146 | | | | 11,285 | | | | (37,815 | ) | | | (419,820 | ) | |
| Class Z | |
| Subscriptions | | | 2,090,216 | | | | 19,404,505 | | | | 1,837,024 | | | | 20,219,650 | | |
| Distributions reinvested | | | 105,495 | | | | 967,099 | | | | 415,342 | | | | 4,514,091 | | |
| Redemptions | | | (1,470,029 | ) | | | (12,381,192 | ) | | | (7,206,686 | ) | | | (78,049,170 | ) | |
| Net increase (decrease) | | | 725,682 | | | | 7,990,412 | | | | (4,954,320 | ) | | | (53,315,429 | ) | |
See Accompanying Notes to Financial Statements.
34
| | | Columbia LifeGoal Income Portfolio | |
| | | Year Ended
March 31, 2009 | | Year Ended
March 31, 2008 | |
| | | Shares | | Dollars ($) | | Shares | | Dollars ($) | |
| Class A | |
| Subscriptions | | | 483,618 | | | | 4,352,189 | | | | 421,941 | | | | 4,259,785 | | |
| Distributions reinvested | | | 52,394 | | | | 477,949 | | | | 52,185 | | | | 526,837 | | |
| Redemptions | | | (638,467 | ) | | | (5,860,303 | ) | | | (547,350 | ) | | | (5,526,935 | ) | |
| Net increase (decrease) | | | (102,455 | ) | | | (1,030,165 | ) | | | (73,224 | ) | | | (740,313 | ) | |
| Class B | |
| Subscriptions | | | 341,660 | | | | 3,079,717 | | | | 166,955 | | | | 1,681,130 | | |
| Distributions reinvested | | | 29,995 | | | | 272,820 | | | | 28,615 | | | | 288,614 | | |
| Redemptions | | | (400,796 | ) | | | (3,631,237 | ) | | | (233,916 | ) | | | (2,361,913 | ) | |
| Net decrease | | | (29,141 | ) | | | (278,700 | ) | | | (38,346 | ) | | | (392,169 | ) | |
| Class C | |
| Subscriptions | | | 258,374 | | | | 2,290,418 | | | | 151,927 | | | | 1,535,187 | | |
| Distributions reinvested | | | 17,439 | | | | 157,675 | | | | 15,069 | | | | 151,757 | | |
| Redemptions | | | (181,977 | ) | | | (1,630,292 | ) | | | (128,415 | ) | | | (1,292,635 | ) | |
| Net increase (decrease) | | | 93,836 | | | | 817,801 | | | | 38,581 | | | | 394,309 | | |
| Class R | |
| Subscriptions | | | — | | | | — | | | | — | | | | — | | |
| Distributions reinvested | | | — | | | | — | | | | — | | | | — | | |
| Redemptions | | | — | | | | — | | | | — | | | | — | | |
| Net increase (decrease) | | | — | | | | — | | | | — | | | | — | | |
| Class Z | |
| Subscriptions | | | 338,678 | | | | 3,057,723 | | | | 336,403 | | | | 3,414,611 | | |
| Distributions reinvested | | | 19,946 | | | | 183,722 | | | | 19,000 | | | | 191,459 | | |
| Redemptions | | | (428,497 | ) | | | (3,782,692 | ) | | | (129,102 | ) | | | (1,309,528 | ) | |
| Net increase (decrease) | | | (69,873 | ) | | | (541,247 | ) | | | 226,301 | | | | 2,296,542 | | |
See Accompanying Notes to Financial Statements.
35
Financial Highlights – Columbia LifeGoal Growth Portfolio
Selected data for a share outstanding throughout each period is as follows:
| | | Year Ended March 31, | |
| Class A Shares | | 2009 | | 2008 | | 2007 | | 2006 (a) | | 2005 | |
| Net Asset Value, Beginning of Period | | $ | 13.24 | | | $ | 14.69 | | | $ | 13.92 | | | $ | 12.19 | | | $ | 11.28 | | |
| Income from Investment Operations: | |
| Net investment income (b) | | | 0.06 | | | | 0.05 | | | | 0.07 | | | | 0.05 | | | | 0.04 | | |
Net realized and unrealized gain (loss) on investments
and capital gains distributions received | | | (4.12 | ) | | | (0.59 | ) | | | 1.38 | | | | 2.34 | | | | 0.95 | | |
| Total from investment operations | | | (4.06 | ) | | | (0.54 | ) | | | 1.45 | | | | 2.39 | | | | 0.99 | | |
| Less Distributions to Shareholders: | |
| From net investment income | | | (0.03 | ) | | | (0.05 | ) | | | (0.05 | ) | | | (0.09 | ) | | | (0.08 | ) | |
| From net realized gains | | | (2.46 | ) | | | (0.86 | ) | | | (0.63 | ) | | | (0.57 | ) | | | — | | |
| From return of capital | | | (0.01 | ) | | | — | | | | — | | | | — | | | | — | | |
| Total distributions to shareholders | | | (2.50 | ) | | | (0.91 | ) | | | (0.68 | ) | | | (0.66 | ) | | | (0.08 | ) | |
| Net Asset Value, End of Period | | $ | 6.68 | | | $ | 13.24 | | | $ | 14.69 | | | $ | 13.92 | | | $ | 12.19 | | |
| Total return (d) | | | (37.62 | )% | | | (4.31 | )% | | | 10.74 | % | | | 20.01 | % | | | 8.76 | % | |
| Ratios to Average Net Assets/Supplemental Data: | |
| Net expenses (e) | | | 0.50 | %(c) | | | 0.50 | %(c) | | | 0.50 | % | | | 0.50 | % | | | 0.50 | % | |
| Net investment income | | | 0.68 | %(c) | | | 0.31 | %(c) | | | 0.31 | % | | | 0.37 | % | | | 0.37 | % | |
| Portfolio turnover rate | | | 45 | % | | | 21 | % | | | 8 | % | | | 30 | % | | | 13 | % | |
| Net assets, end of period (000's) | | $ | 116,169 | | | $ | 210,861 | | | $ | 206,715 | | | $ | 142,967 | | | $ | 93,070 | | |
(a) On August 22, 2005, the Portfolio's Investor A shares were renamed Class A shares.
(b) Per share data was calculated using the average shares outstanding during the period.
(c) The benefits derived from expense reductions had an impact of less than 0.01%.
(d) Total return at net asset value assuming all distributions reinvested and no initial sales charge or contingent deferred sales charge.
(e) Does not include expenses of the underlying investment companies in which the Portfolio invests. If these expenses were included, the expense ratios would have been higher.
See Accompanying Notes to Financial Statements.
36
Financial Highlights – Columbia LifeGoal Growth Portfolio
Selected data for a share outstanding throughout each period is as follows:
| | | Year Ended March 31, | |
| Class B Shares | | 2009 | | 2008 | | 2007 | | 2006 (a) | | 2005 | |
| Net Asset Value, Beginning of Period | | $ | 12.46 | | | $ | 13.93 | | | $ | 13.28 | | | $ | 11.72 | | | $ | 10.91 | | |
| Income from Investment Operations: | |
| Net investment income (loss) (b) | | | (0.01 | ) | | | (0.06 | ) | | | (0.04 | ) | | | (0.05 | ) | | | (0.04 | ) | |
Net realized and unrealized gain (loss) on investments
and capital gains distributions received | | | (3.80 | ) | | | (0.55 | ) | | | 1.32 | | | | 2.25 | | | | 0.91 | | |
| Total from investment operations | | | (3.81 | ) | | | (0.61 | ) | | | 1.28 | | | | 2.20 | | | | 0.87 | | |
| Less Distributions to Shareholders: | |
| From net investment income | | | (0.01 | ) | | | — | | | | — | | | | (0.07 | ) | | | (0.06 | ) | |
| From net realized gains | | | (2.46 | ) | | | (0.86 | ) | | | (0.63 | ) | | | (0.57 | ) | | | — | | |
| From return of capital | | | (0.01 | ) | | | — | | | | — | | | | — | | | | — | | |
| Total distributions to shareholders | | | (2.48 | ) | | | (0.86 | ) | | | (0.63 | ) | | | (0.64 | ) | | | (0.06 | ) | |
| Net Asset Value, End of Period | | $ | 6.17 | | | $ | 12.46 | | | $ | 13.93 | | | $ | 13.28 | | | $ | 11.72 | | |
| Total return (d) | | | (37.99 | )% | | | (5.08 | )% | | | 9.90 | % | | | 19.13 | % | | | 7.95 | % | |
| Ratios to Average Net Assets/Supplemental Data: | |
| Net expenses (e) | | | 1.25 | %(c) | | | 1.25 | %(c) | | | 1.25 | % | | | 1.25 | % | | | 1.25 | % | |
| Net investment income (loss) | | | (0.09 | )%(c) | | | (0.46 | )%(c) | | | (0.45 | )% | | | (0.38 | )% | | | (0.38 | )% | |
| Portfolio turnover rate | | | 45 | % | | | 21 | % | | | 8 | % | | | 30 | % | | | 13 | % | |
| Net assets, end of period (000's) | | $ | 74,197 | | | $ | 150,705 | | | $ | 170,971 | | | $ | 153,920 | | | $ | 119,995 | | |
(a) On August 22, 2005, the Portfolio's Investor B shares were renamed Class B shares.
(b) Per share data was calculated using the average shares outstanding during the period.
(c) The benefits derived from expense reductions had an impact of less than 0.01%.
(d) Total return at net asset value assuming all distributions reinvested and no contingent deferred sales charge.
(e) Does not include expenses of the underlying investment companies in which the Portfolio invests. If these expenses were included, the expense ratios would have been higher.
See Accompanying Notes to Financial Statements.
37
Financial Highlights – Columbia LifeGoal Growth Portfolio
Selected data for a share outstanding throughout each period is as follows:
| | | Year Ended March 31, | |
| Class C Shares | | 2009 | | 2008 | | 2007 | | 2006 (a) | | 2005 | |
| Net Asset Value, Beginning of Period | | $ | 12.38 | | | $ | 13.85 | | | $ | 13.20 | | | $ | 11.66 | | | $ | 10.85 | | |
| Income from Investment Operations: | |
| Net investment income (loss) (b) | | | (0.01 | ) | | | (0.06 | ) | | | (0.04 | ) | | | (0.05 | ) | | | (0.04 | ) | |
Net realized and unrealized gain (loss) on investments
and capital gains distributions received | | | (3.77 | ) | | | (0.55 | ) | | | 1.32 | | | | 2.23 | | | | 0.91 | | |
| Total from investment operations | | | (3.78 | ) | | | (0.61 | ) | | | 1.28 | | | | 2.18 | | | | 0.87 | | |
| Less Distributions to Shareholders: | |
| From net investment income | | | (0.01 | ) | | | — | | | | — | | | | (0.07 | ) | | | (0.06 | ) | |
| From net realized gains | | | (2.46 | ) | | | (0.86 | ) | | | (0.63 | ) | | | (0.57 | ) | | | — | | |
| From return of capital | | | (0.01 | ) | | | — | | | | — | | | | — | | | | — | | |
| Total distributions to shareholders | | | (2.48 | ) | | | (0.86 | ) | | | (0.63 | ) | | | (0.64 | ) | | | (0.06 | ) | |
| Net Asset Value, End of Period | | $ | 6.12 | | | $ | 12.38 | | | $ | 13.85 | | | $ | 13.20 | | | $ | 11.66 | | |
| Total return (d) | | | (37.99 | )% | | | (5.11 | )% | | | 9.97 | % | | | 19.06 | % | | | 8.00 | % | |
| Ratios to Average Net Assets/Supplemental Data: | |
| Net expenses (e) | | | 1.25 | %(c) | | | 1.25 | %(c) | | | 1.25 | % | | | 1.25 | % | | | 1.25 | % | |
| Net investment income (loss) | | | (0.09 | )%(c) | | | (0.41 | )%(c) | | | (0.43 | )% | | | (0.38 | )% | | | (0.38 | )% | |
| Portfolio turnover rate | | | 45 | % | | | 21 | % | | | 8 | % | | | 30 | % | | | 13 | % | |
| Net assets, end of period (000's) | | $ | 50,343 | | | $ | 98,889 | | | $ | 96,558 | | | $ | 66,261 | | | $ | 36,008 | | |
(a) On August 22, 2005, the Portfolio's Investor C shares were renamed Class C shares.
(b) Per share data was calculated using the average shares outstanding during the period.
(c) The benefits derived from expense reductions had an impact of less than 0.01%.
(d) Total return at net asset value assuming all distributions reinvested and no contingent deferred sales charge.
(e) Does not include expenses of the underlying investment companies in which the Portfolio invests. If these expenses were included, the expense ratios would have been higher.
See Accompanying Notes to Financial Statements.
38
Financial Highlights – Columbia LifeGoal Growth Portfolio
Selected data for a share outstanding throughout each period is as follows:
| | | Year Ended March 31, | | Period Ended
March 31, | |
| Class R Shares | | 2009 | | 2008 | | 2007 | | 2006 (a) | |
| Net Asset Value, Beginning of Period | | $ | 13.19 | | | $ | 14.67 | | | $ | 13.92 | | | $ | 13.19 | | |
| Income from Investment Operations: | |
| Net investment income (loss) (b) | | | 0.04 | | | | 0.02 | | | | 0.14 | | | | (0.03 | ) | |
Net realized and unrealized gain (loss) on investments
and capital gains distributions received | | | (4.10 | ) | | | (0.60 | ) | | | 1.27 | | | | 0.76 | | |
| Total from investment operations | | | (4.06 | ) | | | (0.58 | ) | | | 1.41 | | | | 0.73 | | |
| Less Distributions to Shareholders: | |
| From net investment income | | | (0.02 | ) | | | (0.04 | ) | | | (0.03 | ) | | | — | | |
| From net realized gains | | | (2.46 | ) | | | (0.86 | ) | | | (0.63 | ) | | | — | | |
| From return of capital | | | (0.01 | ) | | | — | | | | — | | | | — | | |
| Total distributions to shareholders | | | (2.49 | ) | | | (0.90 | ) | | | (0.66 | ) | | | — | | |
| Net Asset Value, End of Period | | $ | 6.64 | | | $ | 13.19 | | | $ | 14.67 | | | $ | 13.92 | | |
| Total return (d) | | | (37.76 | )% | | | (4.65 | )% | | | 10.45 | % | | | 5.53 | %(e) | |
| Ratios to Average Net Assets/Supplemental Data: | |
| Net expenses (f) | | | 0.75 | %(g) | | | 0.75 | %(g) | | | 0.75 | % | | | 0.75 | %(c) | |
| Net investment income (loss) | | | 0.45 | %(g) | | | 0.12 | %(g) | | | 0.76 | % | | | (1.15 | )%(c) | |
| Portfolio turnover rate | | | 45 | % | | | 21 | % | | | 8 | % | | | 30 | %(e) | |
| Net assets, end of period (000's) | | $ | 831 | | | $ | 1,206 | | | $ | 1,169 | | | $ | 10 | | |
(a) The Portfolio's Class R shares commenced operations on January 23, 2006.
(b) Per share data was calculated using the average shares outstanding during the period.
(c) Annualized.
(d) Total return at net asset value assuming all distributions reinvested.
(e) Not annualized.
(f) Does not include expenses of the underlying investment companies in which the Portfolio invests. If these expenses were included, the expense ratios would have been higher.
(g) The benefits derived from expense reductions had an impact of less than 0.01%.
See Accompanying Notes to Financial Statements.
39
Financial Highlights – Columbia LifeGoal Growth Portfolio
Selected data for a share outstanding throughout each period is as follows:
| | | Year Ended March 31, | |
| Class Z Shares | | 2009 | | 2008 | | 2007 | | 2006 (a) | | 2005 | |
| Net Asset Value, Beginning of Period | | $ | 13.37 | | | $ | 14.80 | | | $ | 14.01 | | | $ | 12.24 | | | $ | 11.30 | | |
| Income from Investment Operations: | |
| Net investment income (b) | | | 0.09 | | | | 0.16 | | | | 0.10 | | | | 0.08 | | | | 0.07 | | |
Net realized and unrealized gain (loss) on investments
and capital gains distributions received | | | (4.17 | ) | | | (0.66 | ) | | | 1.40 | | | | 2.36 | | | | 0.96 | | |
| Total from investment operations | | | (4.08 | ) | | | (0.50 | ) | | | 1.50 | | | | 2.44 | | | | 1.03 | | |
| Less Distributions to Shareholders: | |
| From net investment income | | | (0.04 | ) | | | (0.07 | ) | | | (0.08 | ) | | | (0.10 | ) | | | (0.09 | ) | |
| From net realized gains | | | (2.46 | ) | | | (0.86 | ) | | | (0.63 | ) | | | (0.57 | ) | | | — | | |
| From return of capital | | | (0.01 | ) | | | — | | | | — | | | | — | | | | �� | | |
| Total distributions to shareholders | | | (2.51 | ) | | | (0.93 | ) | | | (0.71 | ) | | | (0.67 | ) | | | (0.09 | ) | |
| Net Asset Value, End of Period | | $ | 6.78 | | | $ | 13.37 | | | $ | 14.80 | | | $ | 14.01 | | | $ | 12.24 | | |
| Total return (d) | | | (37.38 | )% | | | (4.02 | )% | | | 11.01 | % | | | 20.33 | % | | | 9.07 | % | |
| Ratios to Average Net Assets/Supplemental Data: | |
| Net expenses (e) | | | 0.25 | %(c) | | | 0.25 | %(c) | | | 0.25 | % | | | 0.25 | % | | | 0.25 | % | |
| Net investment income | | | 0.90 | %(c) | | | 1.07 | %(c) | | | 0.55 | % | | | 0.62 | % | | | 0.62 | % | |
| Portfolio turnover rate | | | 45 | % | | | 21 | % | | | 8 | % | | | 30 | % | | | 13 | % | |
| Net assets, end of period (000's) | | $ | 29,467 | | | $ | 55,202 | | | $ | 252,536 | | | $ | 188,132 | | | $ | 132,748 | | |
(a) On August 22, 2005, the Portfolio's Primary A shares were renamed Class Z shares.
(b) Per share data was calculated using the average shares outstanding during the period.
(c) The benefits derived from expense reductions had an impact of less than 0.01%.
(d) Total return at net asset value assuming all distributions reinvested.
(e) Does not include expenses of the underlying investment companies in which the Portfolio invests. If these expenses were included, the expense ratios would have been higher.
See Accompanying Notes to Financial Statements.
40
Financial Highlights – Columbia LifeGoal Balanced Growth Portfolio
Selected data for a share outstanding throughout each period is as follows:
| | | Year Ended March 31, | |
| Class A Shares | | 2009 | | 2008 | | 2007 | | 2006 (a) | | 2005 | |
| Net Asset Value, Beginning of Period | | $ | 11.36 | | | $ | 12.38 | | | $ | 11.86 | | | $ | 11.50 | | | $ | 11.20 | | |
| Income from Investment Operations: | |
| Net investment income (b) | | | 0.22 | | | | 0.25 | | | | 0.26 | | | | 0.22 | | | | 0.16 | | |
Net realized and unrealized gain (loss) on investments
and capital gains distributions received | | | (2.91 | ) | | | (0.45 | ) | | | 0.88 | | | | 1.08 | | | | 0.47 | | |
| Total from investment operations | | | (2.69 | ) | | | (0.20 | ) | | | 1.14 | | | | 1.30 | | | | 0.63 | | |
| Less Distributions to Shareholders: | |
| From net investment income | | | (0.22 | ) | | | (0.25 | ) | | | (0.26 | ) | | | (0.27 | ) | | | (0.22 | ) | |
| From net realized gains | | | (1.12 | ) | | | (0.57 | ) | | | (0.36 | ) | | | (0.67 | ) | | | (0.11 | ) | |
| Total distributions to shareholders | | | (1.34 | ) | | | (0.82 | ) | | | (0.62 | ) | | | (0.94 | ) | | | (0.33 | ) | |
| Net Asset Value, End of Period | | $ | 7.33 | | | $ | 11.36 | | | $ | 12.38 | | | $ | 11.86 | | | $ | 11.50 | | |
| Total return (d) | | | (26.48 | )% | | | (1.99 | )% | | | 9.95 | % | | | 11.75 | % | | | 5.75 | % | |
| Ratios to Average Net Assets/Supplemental Data: | |
| Net expenses (e) | | | 0.50 | %(c) | | | 0.50 | %(c) | | | 0.50 | % | | | 0.50 | % | | | 0.50 | % | |
| Net investment income | | | 2.44 | %(c) | | | 2.05 | %(c) | | | 2.17 | % | | | 1.89 | % | | | 1.45 | % | |
| Portfolio turnover rate | | | 47 | % | | | 18 | % | | | 18 | % | | | 46 | % | | | 17 | % | |
| Net assets, end of period (000's) | | $ | 170,155 | | | $ | 275,576 | | | $ | 266,506 | | | $ | 219,302 | | | $ | 156,938 | | |
(a) On August 22, 2005, the Portfolio's Investor A shares were renamed Class A shares.
(b) Per share data was calculated using the average shares outstanding during the period.
(c) The benefits derived from expense reductions had an impact of less than 0.01%.
(d) Total return at net asset value assuming all distributions reinvested and no initial sales charge or contingent deferred sales charge.
(e) Does not include expenses of the underlying investment companies in which the Portfolio invests. If these expenses were included, the expense ratios would have been higher.
See Accompanying Notes to Financial Statements.
41
Financial Highlights – Columbia LifeGoal Balanced Growth Portfolio
Selected data for a share outstanding throughout each period is as follows:
| | | Year Ended March 31, | |
| Class B Shares | | 2009 | | 2008 | | 2007 | | 2006 (a) | | 2005 | |
| Net Asset Value, Beginning of Period | | $ | 11.30 | | | $ | 12.31 | | | $ | 11.81 | | | $ | 11.45 | | | $ | 11.16 | | |
| Income from Investment Operations: | |
| Net investment income (b) | | | 0.15 | | | | 0.16 | | | | 0.17 | | | | 0.13 | | | | 0.08 | | |
Net realized and unrealized gain (loss) on investments
and capital gains distributions received | | | (2.89 | ) | | | (0.44 | ) | | | 0.86 | | | | 1.08 | | | | 0.46 | | |
| Total from investment operations | | | (2.74 | ) | | | (0.28 | ) | | | 1.03 | | | | 1.21 | | | | 0.54 | | |
| Less Distributions to Shareholders: | |
| From net investment income | | | (0.15 | ) | | | (0.16 | ) | | | (0.17 | ) | | | (0.18 | ) | | | (0.14 | ) | |
| From net realized gains | | | (1.12 | ) | | | (0.57 | ) | | | (0.36 | ) | | | (0.67 | ) | | | (0.11 | ) | |
| Total distributions to shareholders | | | (1.27 | ) | | | (0.73 | ) | | | (0.53 | ) | | | (0.85 | ) | | | (0.25 | ) | |
| Net Asset Value, End of Period | | $ | 7.29 | | | $ | 11.30 | | | $ | 12.31 | | | $ | 11.81 | | | $ | 11.45 | | |
| Total return (d) | | | (27.01 | )% | | | (2.66 | )% | | | 9.00 | % | | | 10.99 | % | | | 4.94 | % | |
| Ratios to Average Net Assets/Supplemental Data: | |
| Net expenses (e) | | | 1.25 | %(c) | | | 1.25 | %(c) | | | 1.25 | % | | | 1.25 | % | | | 1.25 | % | |
| Net investment income | | | 1.67 | %(c) | | | 1.28 | %(c) | | | 1.42 | % | | | 1.14 | % | | | 0.70 | % | |
| Portfolio turnover rate | | | 47 | % | | | 18 | % | | | 18 | % | | | 46 | % | | | 17 | % | |
| Net assets, end of period (000's) | | $ | 156,679 | | | $ | 282,912 | | | $ | 325,190 | | | $ | 318,564 | | | $ | 271,691 | | |
(a) On August 22, 2005, the Portfolio's Investor B shares were renamed Class B shares.
(b) Per share data was calculated using the average shares outstanding during the period.
(c) The benefits derived from expense reductions had an impact of less than 0.01%.
(d) Total return at net asset value assuming all distributions reinvested and no contingent deferred sales charge.
(e) Does not include expenses of the underlying investment companies in which the Portfolio invests. If these expenses were included, the expense ratios would have been higher.
See Accompanying Notes to Financial Statements.
42
Financial Highlights – Columbia LifeGoal Balanced Growth Portfolio
Selected data for a share outstanding throughout each period is as follows:
| | | Year Ended March 31, | |
| Class C Shares | | 2009 | | 2008 | | 2007 | | 2006 (a) | | 2005 | |
| Net Asset Value, Beginning of Period | | $ | 11.43 | | | $ | 12.44 | | | $ | 11.92 | | | $ | 11.56 | | | $ | 11.26 | | |
| Income from Investment Operations: | |
| Net investment income (b) | | | 0.15 | | | | 0.16 | | | | 0.17 | | | | 0.14 | | | | 0.08 | | |
Net realized and unrealized gain (loss) on investments
and capital gains distributions received | | | (2.93 | ) | | | (0.44 | ) | | | 0.88 | | | | 1.07 | | | | 0.47 | | |
| Total from investment operations | | | (2.78 | ) | | | (0.28 | ) | | | 1.05 | | | | 1.21 | | | | 0.55 | | |
| Less Distributions to Shareholders: | |
| From net investment income | | | (0.15 | ) | | | (0.16 | ) | | | (0.17 | ) | | | (0.18 | ) | | | (0.14 | ) | |
| From net realized gains | | | (1.12 | ) | | | (0.57 | ) | | | (0.36 | ) | | | (0.67 | ) | | | (0.11 | ) | |
| Total distributions to shareholders | | | (1.27 | ) | | | (0.73 | ) | | | (0.53 | ) | | | (0.85 | ) | | | (0.25 | ) | |
| Net Asset Value, End of Period | | $ | 7.38 | | | $ | 11.43 | | | $ | 12.44 | | | $ | 11.92 | | | $ | 11.56 | | |
| Total return (d) | | | (27.05 | )% | | | (2.63 | )% | | | 9.09 | % | | | 10.88 | % | | | 4.99 | % | |
| Ratios to Average Net Assets/Supplemental Data: | |
| Net expenses (e) | | | 1.25 | %(c) | | | 1.25 | %(c) | | | 1.25 | % | | | 1.25 | % | | | 1.25 | % | |
| Net investment income | | | 1.67 | %(c) | | | 1.30 | %(c) | | | 1.42 | % | | | 1.14 | % | | | 0.70 | % | |
| Portfolio turnover rate | | | 47 | % | | | 18 | % | | | 18 | % | | | 46 | % | | | 17 | % | |
| Net assets, end of period (000's) | | $ | 64,940 | | | $ | 112,902 | | | $ | 118,747 | | | $ | 98,160 | | | $ | 62,615 | | |
(a) On August 22, 2005, the Portfolio's Investor C shares were renamed Class C shares.
(b) Per share data was calculated using the average shares outstanding during the period.
(c) The benefits derived from expense reductions had an impact of less than 0.01%.
(d) Total return at net asset value assuming all distributions reinvested and no contingent deferred sales charge.
(e) Does not include expenses of the underlying investment companies in which the Portfolio invests. If these expenses were included, the expense ratios would have been higher.
See Accompanying Notes to Financial Statements.
43
Financial Highlights – Columbia LifeGoal Balanced Growth Portfolio
Selected data for a share outstanding throughout each period is as follows:
| | | Year Ended March 31, | | Period Ended
March 31, | |
| Class R Shares | | 2009 | | 2008 | | 2007 | | 2006 (a) | |
| Net Asset Value, Beginning of Period | | $ | 11.36 | | | $ | 12.37 | | | $ | 11.86 | | | $ | 11.59 | | |
| Income from Investment Operations: | |
| Net investment income (b) | | | 0.22 | | | | 0.21 | | | | 0.29 | | | | 0.03 | | |
Net realized and unrealized gain (loss) on investments
and capital gains distributions received | | | (2.94 | ) | | | (0.43 | ) | | | 0.81 | | | | 0.28 | | |
| Total from investment operations | | | (2.72 | ) | | | (0.22 | ) | | | 1.10 | | | | 0.31 | | |
| Less Distributions to Shareholders: | |
| From net investment income | | | (0.19 | ) | | | (0.22 | ) | | | (0.23 | ) | | | (0.04 | ) | |
| From net realized gains | | | (1.12 | ) | | | (0.57 | ) | | | (0.36 | ) | | | — | | |
| Total distributions to shareholders | | | (1.31 | ) | | | (0.79 | ) | | | (0.59 | ) | | | (0.04 | ) | |
| Net Asset Value, End of Period | | $ | 7.33 | | | $ | 11.36 | | | $ | 12.37 | | | $ | 11.86 | | |
| Total return (d) | | | (26.67 | )% | | | (2.15 | )% | | | 9.59 | % | | | 2.68 | %(e) | |
| Ratios to Average Net Assets/Supplemental Data: | |
| Net expenses (f) | | | 0.75 | %(g) | | | 0.75 | %(g) | | | 0.75 | % | | | 0.75 | %(c) | |
| Net investment income | | | 2.48 | %(g) | | | 1.69 | %(g) | | | 2.34 | % | | | 1.13 | %(c) | |
| Portfolio turnover rate | | | 47 | % | | | 18 | % | | | 18 | % | | | 46 | %(e) | |
| Net assets, end of period (000's) | | $ | 1,666 | | | $ | 1,257 | | | $ | 1,916 | | | $ | 10 | | |
(a) The Portfolio's Class R shares commenced operations on January 23, 2006.
(b) Per share data was calculated using the average shares outstanding during the period.
(c) Annualized.
(d) Total return at net asset value assuming all distributions reinvested.
(e) Not annualized.
(f) Does not include expenses of the underlying investment companies in which the Portfolio invests. If these expenses were included, the expense ratios would have been higher.
(g) The benefits derived from expense reductions had an impact of less than 0.01%.
See Accompanying Notes to Financial Statements.
44
Financial Highlights – Columbia LifeGoal Balanced Growth Portfolio
Selected data for a share outstanding throughout each period is as follows:
| | | Year Ended March 31, | |
| Class Z Shares | | 2009 | | 2008 | | 2007 | | 2006 (a) | | 2005 | |
| Net Asset Value, Beginning of Period | | $ | 11.36 | | | $ | 12.35 | | | $ | 11.84 | | | $ | 11.48 | | | $ | 11.18 | | |
| Income from Investment Operations: | |
| Net investment income (b) | | | 0.25 | | | | 0.34 | | | | 0.29 | | | | 0.25 | | | | 0.19 | | |
Net realized and unrealized gain (loss) on investments
and capital gains distributions received | | | (2.92 | ) | | | (0.47 | ) | | | 0.87 | | | | 1.08 | | | | 0.47 | | |
| Total from investment operations | | | (2.67 | ) | | | (0.13 | ) | | | 1.16 | | | | 1.33 | | | | 0.66 | | |
| Less Distributions to Shareholders: | |
| From net investment income | | | (0.24 | ) | | | (0.29 | ) | | | (0.29 | ) | | | (0.30 | ) | | | (0.25 | ) | |
| From net realized gains | | | (1.12 | ) | | | (0.57 | ) | | | (0.36 | ) | | | (0.67 | ) | | | (0.11 | ) | |
| Total distributions to shareholders | | | (1.36 | ) | | | (0.86 | ) | | | (0.65 | ) | | | (0.97 | ) | | | (0.36 | ) | |
| Net Asset Value, End of Period | | $ | 7.33 | | | $ | 11.36 | | | $ | 12.35 | | | $ | 11.84 | | | $ | 11.48 | | |
| Total return (d) | | | (26.28 | )% | | | (1.49 | )% | | | 10.15 | % | | | 12.05 | % | | | 6.02 | % | |
| Ratios to Average Net Assets/Supplemental Data: | |
| Net expenses (e) | | | 0.25 | %(c) | | | 0.25 | %(c) | | | 0.25 | % | | | 0.25 | % | | | 0.25 | % | |
| Net investment income | | | 2.83 | %(c) | | | 2.68 | %(c) | | | 2.42 | % | | | 2.14 | % | | | 1.70 | % | |
| Portfolio turnover rate | | | 47 | % | | | 18 | % | | | 18 | % | | | 46 | % | | | 17 | % | |
| Net assets, end of period (000's) | | $ | 44,020 | | | $ | 46,711 | | | $ | 292,939 | | | $ | 251,980 | | | $ | 220,296 | | |
(a) On August 22, 2005, the Portfolio's Primary A shares were renamed Class Z shares.
(b) Per share data was calculated using the average shares outstanding during the period.
(c) The benefits derived from expense reductions had an impact of less than 0.01%.
(d) Total return at net asset value assuming all distributions reinvested.
(e) Does not include expenses of the underlying investment companies in which the Portfolio invests. If these expenses were included, the expense ratios would have been higher.
See Accompanying Notes to Financial Statements.
45
Financial Highlights – Columbia LifeGoal Income and Growth Portfolio
Selected data for a share outstanding throughout each period is as follows:
| | | Year Ended March 31, | |
| Class A Shares | | 2009 | | 2008 | | 2007 | | 2006 (a) | | 2005 | |
| Net Asset Value, Beginning of Period | | $ | 10.40 | | | $ | 11.04 | | | $ | 10.80 | | | $ | 11.04 | | | $ | 11.11 | | |
| Income from Investment Operations: | |
| Net investment income (b) | | | 0.33 | | | | 0.36 | | | | 0.34 | | | | 0.28 | | | | 0.23 | | |
Net realized and unrealized gain (loss) on investments
and capital gains distributions received | | | (1.97 | ) | | | (0.30 | ) | | | 0.50 | | | | 0.54 | | | | 0.10 | | |
| Total from investment operations | | | (1.64 | ) | | | 0.06 | | | | 0.84 | | | | 0.82 | | | | 0.33 | | |
| Less Distributions to Shareholders: | |
| From net investment income | | | (0.33 | ) | | | (0.36 | ) | | | (0.34 | ) | | | (0.32 | ) | | | (0.28 | ) | |
| From net realized gains | | | (0.40 | ) | | | (0.34 | ) | | | (0.26 | ) | | | (0.74 | ) | | | (0.12 | ) | |
| Total distributions to shareholders | | | (0.73 | ) | | | (0.70 | ) | | | (0.60 | ) | | | (1.06 | ) | | | (0.40 | ) | |
| Net Asset Value, End of Period | | $ | 8.03 | | | $ | 10.40 | | | $ | 11.04 | | | $ | 10.80 | | | $ | 11.04 | | |
| Total return (d) | | | (16.58 | )% | | | 0.34 | % | | | 8.07 | % | | | 7.91 | % | | | 3.05 | % | |
| Ratios to Average Net Assets/Supplemental Data: | |
| Net expenses before interest expense (e) | | | 0.50 | %(f) | | | 0.50 | %(f) | | | 0.50 | % | | | 0.50 | % | | | 0.50 | % | |
| Interest expense | | | — | %(c) | | | — | | | | — | | | | — | | | | — | | |
| Net expenses (e) | | | 0.50 | %(f) | | | 0.50 | %(f) | | | 0.50 | % | | | 0.50 | % | | | 0.50 | % | |
| Net investment income | | | 3.59 | %(f) | | | 3.29 | %(f) | | | 3.15 | % | | | 2.61 | % | | | 2.03 | % | |
| Portfolio turnover rate | | | 52 | % | | | 20 | % | | | 25 | % | | | 30 | % | | | 34 | % | |
| Net assets, end of period (000's) | | $ | 44,825 | | | $ | 54,370 | | | $ | 50,829 | | | $ | 48,112 | | | $ | 42,816 | | |
(a) On August 22, 2005, the Portfolio's Investor A shares were renamed Class A shares.
(b) Per share data was calculated using the average shares outstanding during the period.
(c) Rounds to less than 0.01%.
(d) Total return at net asset value assuming all distributions reinvested and no initial sales charge or contingent deferred sales charge.
(e) Does not include expenses of the underlying investment companies in which the Portfolio invests. If these expenses were included, the expense ratios would have been higher.
(f) The benefits derived from expense reductions had an impact of less than 0.01%.
See Accompanying Notes to Financial Statements.
46
Financial Highlights – Columbia LifeGoal Income and Growth Portfolio
Selected data for a share outstanding throughout each period is as follows:
| | | Year Ended March 31, | |
| Class B Shares | | 2009 | | 2008 | | 2007 | | 2006 (a) | | 2005 | |
| Net Asset Value, Beginning of Period | | $ | 10.36 | | | $ | 11.00 | | | $ | 10.77 | | | $ | 11.01 | | | $ | 11.08 | | |
| Income from Investment Operations: | |
| Net investment income (b) | | | 0.26 | | | | 0.28 | | | | 0.26 | | | | 0.20 | | | | 0.14 | | |
Net realized and unrealized gain (loss) on investments
and capital gains distributions received | | | (1.95 | ) | | | (0.31 | ) | | | 0.49 | | | | 0.54 | | | | 0.11 | | |
| Total from investment operations | | | (1.69 | ) | | | (0.03 | ) | | | 0.75 | | | | 0.74 | | | | 0.25 | | |
| Less Distributions to Shareholders: | |
| From net investment income | | | (0.26 | ) | | | (0.27 | ) | | | (0.26 | ) | | | (0.24 | ) | | | (0.20 | ) | |
| From net realized gains | | | (0.40 | ) | | | (0.34 | ) | | | (0.26 | ) | | | (0.74 | ) | | | (0.12 | ) | |
| Total distributions to shareholders | | | (0.66 | ) | | | (0.61 | ) | | | (0.52 | ) | | | (0.98 | ) | | | (0.32 | ) | |
| Net Asset Value, End of Period | | $ | 8.01 | | | $ | 10.36 | | | $ | 11.00 | | | $ | 10.77 | | | $ | 11.01 | | |
| Total return (d) | | | (17.09 | )% | | | (0.41 | )% | | | 7.20 | % | | | 7.12 | % | | | 2.30 | % | |
| Ratios to Average Net Assets/Supplemental Data: | |
| Net expenses before interest expense (e) | | | 1.25 | %(f) | | | 1.25 | %(f) | | | 1.25 | % | | | 1.25 | % | | | 1.25 | % | |
| Interest expense | | | — | %(c) | | | — | | | | — | | | | — | | | | — | | |
| Net expenses (e) | | | 1.25 | %(f) | | | 1.25 | %(f) | | | 1.25 | % | | | 1.25 | % | | | 1.25 | % | |
| Net investment income | | | 2.80 | %(f) | | | 2.53 | %(f) | | | 2.39 | % | | | 1.86 | % | | | 1.28 | % | |
| Portfolio turnover rate | | | 52 | % | | | 20 | % | | | 25 | % | | | 30 | % | | | 34 | % | |
| Net assets, end of period (000's) | | $ | 40,270 | | | $ | 66,558 | | | $ | 75,119 | | | $ | 82,098 | | | $ | 85,762 | | |
(a) On August 22, 2005, the Portfolio's Investor B shares were renamed Class B shares.
(b) Per share data was calculated using the average shares outstanding during the period.
(c) Rounds to less than 0.01%.
(d) Total return at net asset value assuming all distributions reinvested and no contingent deferred sales charge.
(e) Does not include expenses of the underlying investment companies in which the Portfolio invests. If these expenses were included, the expense ratios would have been higher.
(f) The benefits derived from expense reductions had an impact of less than 0.01%.
See Accompanying Notes to Financial Statements.
47
Financial Highlights – Columbia LifeGoal Income and Growth Portfolio
Selected data for a share outstanding throughout each period is as follows:
| | | Year Ended March 31, | |
| Class C Shares | | 2009 | | 2008 | | 2007 | | 2006 (a) | | 2005 | |
| Net Asset Value, Beginning of Period | | $ | 10.30 | | | $ | 10.94 | | | $ | 10.71 | | | $ | 10.96 | | | $ | 11.03 | | |
| Income from Investment Operations: | |
| Net investment income (b) | | | 0.26 | | | | 0.28 | | | | 0.26 | | | | 0.20 | | | | 0.14 | | |
Net realized and unrealized gain (loss) on investments
and capital gains distributions received | | | (1.94 | ) | | | (0.31 | ) | | | 0.49 | | | | 0.53 | | | | 0.11 | | |
| Total from investment operations | | | (1.68 | ) | | | (0.03 | ) | | | 0.75 | | | | 0.73 | | | | 0.25 | | |
| Less Distributions to Shareholders: | |
| From net investment income | | | (0.26 | ) | | | (0.27 | ) | | | (0.26 | ) | | | (0.24 | ) | | | (0.20 | ) | |
| From net realized gains | | | (0.40 | ) | | | (0.34 | ) | | | (0.26 | ) | | | (0.74 | ) | | | (0.12 | ) | |
| Total distributions to shareholders | | | (0.66 | ) | | | (0.61 | ) | | | (0.52 | ) | | | (0.98 | ) | | | (0.32 | ) | |
| Net Asset Value, End of Period | | $ | 7.96 | | | $ | 10.30 | | | $ | 10.94 | | | $ | 10.71 | | | $ | 10.96 | | |
| Total return (d) | | | (17.09 | )% | | | (0.41 | )% | | | 7.24 | % | | | 7.06 | % | | | 2.32 | % | |
| Ratios to Average Net Assets/Supplemental Data: | |
| Net expenses before interest expense (e) | | | 1.25 | %(f) | | | 1.25 | %(f) | | | 1.25 | % | | | 1.25 | % | | | 1.25 | % | |
| Interest expense | | | — | %(c) | | | — | | | | — | | | | — | | | | — | | |
| Net expenses (e) | | | 1.25 | %(f) | | | 1.25 | %(f) | | | 1.25 | % | | | 1.25 | % | | | 1.25 | % | |
| Net investment income | | | 2.81 | %(f) | | | 2.55 | %(f) | | | 2.41 | % | | | 1.86 | % | | | 1.28 | % | |
| Portfolio turnover rate | | | 52 | % | | | 20 | % | | | 25 | % | | | 30 | % | | | 34 | % | |
| Net assets, end of period (000's) | | $ | 18,370 | | | $ | 26,501 | | | $ | 24,367 | | | $ | 21,104 | | | $ | 17,708 | | |
(a) On August 22, 2005, the Portfolio's Investor C shares were renamed Class C shares.
(b) Per share data was calculated using the average shares outstanding during the period.
(c) Rounds to less than 0.01%.
(d) Total return at net asset value assuming all distributions reinvested and no contingent deferred sales charge.
(e) Does not include expenses of the underlying investment companies in which the Portfolio invests. If these expenses were included, the expense ratios would have been higher.
(f) The benefits derived from expense reductions had an impact of less than 0.01%.
See Accompanying Notes to Financial Statements.
48
Financial Highlights – Columbia LifeGoal Income and Growth Portfolio
Selected data for a share outstanding throughout each period is as follows:
| | | Year Ended March 31, | | Period Ended
March 31, | |
| Class R Shares | | 2009 | | 2008 | | 2007 | | 2006 (a) | |
| Net Asset Value, Beginning of Period | | $ | 10.40 | | | $ | 11.04 | | | $ | 10.80 | | | $ | 10.69 | | |
| Income from Investment Operations: | |
| Net investment income (b) | | | 0.31 | | | | 0.32 | | | | 0.36 | | | | 0.05 | | |
Net realized and unrealized gain (loss) on investments
and capital gains distributions received | | | (1.96 | ) | | | (0.29 | ) | | | 0.46 | | | | 0.12 | | |
| Total from investment operations | | | (1.65 | ) | | | 0.03 | | | | 0.82 | | | | 0.17 | | |
| Less Distributions to Shareholders: | |
| From net investment income | | | (0.31 | ) | | | (0.33 | ) | | | (0.32 | ) | | | (0.06 | ) | |
| From net realized gains | | | (0.40 | ) | | | (0.34 | ) | | | (0.26 | ) | | | — | | |
| Total distributions to shareholders | | | (0.71 | ) | | | (0.67 | ) | | | (0.58 | ) | | | (0.06 | ) | |
| Net Asset Value, End of Period | | $ | 8.04 | | | $ | 10.40 | | | $ | 11.04 | | | $ | 10.80 | | |
| Total return (d) | | | (16.69 | )% | | | 0.09 | % | | | 7.80 | % | | | 1.62 | %(e) | |
| Ratios to Average Net Assets/Supplemental Data: | |
| Net expenses before interest expense (f) | | | 0.75 | %(g) | | | 0.75 | %(g) | | | 0.75 | % | | | 0.75 | %(h) | |
| Interest expenses | | | — | %(c) | | | — | | | | — | | | | — | | |
| Net expenses (f) | | | 0.75 | %(g) | | | 0.75 | %(g) | | | 0.75 | % | | | 0.75 | %(h) | |
| Net investment income | | | 3.34 | %(g) | | | 2.93 | %(g) | | | 3.25 | % | | | 2.61 | %(h) | |
| Portfolio turnover rate | | | 52 | % | | | 20 | % | | | 25 | % | | | 30 | %(e) | |
| Net assets, end of period (000's) | | $ | 358 | | | $ | 451 | | | $ | 896 | | | $ | 10 | | |
(a) The Portfolio's Class R shares commenced operations on January 23, 2006.
(b) Per share data was calculated using the average shares outstanding during the period.
(c) Rounds to less than 0.01%.
(d) Total return at net asset value assuming all distributions reinvested.
(e) Not annualized.
(f) Does not include expenses of the underlying investment companies in which the Portfolio invests. If these expenses were included, the expense ratios would have been higher.
(g) The benefits derived from expense reductions had an impact of less than 0.01%.
(h) Annualized.
See Accompanying Notes to Financial Statements.
49
Financial Highlights – Columbia LifeGoal Income and Growth Portfolio
Selected data for a share outstanding throughout each period is as follows:
| | | Year Ended March 31, | |
| Class Z Shares | | 2009 | | 2008 | | 2007 | | 2006 (a) | | 2005 | |
| Net Asset Value, Beginning of Period | | $ | 10.30 | | | $ | 10.96 | | | $ | 10.73 | | | $ | 10.97 | | | $ | 11.04 | | |
| Income from Investment Operations: | |
| Net investment income (b) | | | 0.35 | | | | 0.42 | | | | 0.37 | | | | 0.31 | | | | 0.25 | | |
Net realized and unrealized gain (loss) on investments
and capital gains distributions received | | | (1.93 | ) | | | (0.36 | ) | | | 0.49 | | | | 0.54 | | | | 0.11 | | |
| Total from investment operations | | | (1.58 | ) | | | 0.06 | | | | 0.86 | | | | 0.85 | | | | 0.36 | | |
| Less Distributions to Shareholders: | |
| From net investment income | | | (0.36 | ) | | | (0.38 | ) | | | (0.37 | ) | | | (0.35 | ) | | | (0.31 | ) | |
| From net realized gains | | | (0.40 | ) | | | (0.34 | ) | | | (0.26 | ) | | | (0.74 | ) | | | (0.12 | ) | |
| Total distributions to shareholders | | | (0.76 | ) | | | (0.72 | ) | | | (0.63 | ) | | | (1.09 | ) | | | (0.43 | ) | |
| Net Asset Value, End of Period | | $ | 7.96 | | | $ | 10.30 | | | $ | 10.96 | | | $ | 10.73 | | | $ | 10.97 | | |
| Total return (d) | | | (16.23 | )% | | | 0.40 | % | | | 8.30 | % | | | 8.22 | % | | | 3.32 | % | |
| Ratios to Average Net Assets/Supplemental Data: | |
| Net expenses before interest expense (e) | | | 0.25 | %(f) | | | 0.25 | %(f) | | | 0.25 | % | | | 0.25 | % | | | 0.25 | % | |
| Interest expense | | | — | %(c) | | | — | | | | — | | | | — | | | | — | | |
| Net expenses (e) | | | 0.25 | %(f) | | | 0.25 | %(f) | | | 0.25 | % | | | 0.25 | % | | | 0.25 | % | |
| Net investment income | | | 3.98 | %(f) | | | 3.78 | %(f) | | | 3.42 | % | | | 2.86 | % | | | 2.28 | % | |
| Portfolio turnover rate | | | 52 | % | | | 20 | % | | | 25 | % | | | 30 | % | | | 34 | % | |
| Net assets, end of period (000's) | | $ | 16,275 | | | $ | 13,598 | | | $ | 68,749 | | | $ | 66,806 | | | $ | 56,897 | | |
(a) On August 22, 2005, the Portfolio's Primary A shares were renamed Class Z shares.
(b) Per share data was calculated using the average shares outstanding during the period.
(c) Rounds to less than 0.01%.
(d) Total return at net asset value assuming all distributions reinvested.
(e) Does not include expenses of the underlying investment companies in which the Portfolio invests. If these expenses were included, the expense ratios would have been higher.
(f) The benefits derived from expense reductions had an impact of less than 0.01%.
See Accompanying Notes to Financial Statements.
50
Financial Highlights – Columbia LifeGoal Income Portfolio
Selected data for a share outstanding throughout each period is as follows:
| | | Year Ended March 31, | |
| Class A Shares | | 2009 | | 2008 | | 2007 | | 2006 (a) | | 2005 | |
| Net Asset Value, Beginning of Period | | $ | 9.83 | | | $ | 10.22 | | | $ | 9.99 | | | $ | 10.07 | | | $ | 10.31 | | |
| Income from Investment Operations: | |
| Net investment income (b) | | | 0.38 | | | | 0.44 | | | | 0.42 | | | | 0.38 | | | | 0.31 | | |
Net realized and unrealized gain (loss) on investments
and capital gains distributions received | | | (1.19 | ) | | | (0.38 | ) | | | 0.25 | | | | (0.06 | ) | | | (0.09 | ) | |
| Total from investment operations | | | (0.81 | ) | | | 0.06 | | | | 0.67 | | | | 0.32 | | | | 0.22 | | |
| Less Distributions to Shareholders: | |
| From net investment income | | | (0.40 | ) | | | (0.43 | ) | | | (0.43 | ) | | | (0.38 | ) | | | (0.42 | ) | |
| From net realized gains | | | (0.04 | ) | | | (0.02 | ) | | | (0.01 | ) | | | (0.02 | ) | | | (0.04 | ) | |
| Total distributions to shareholders | | | (0.44 | ) | | | (0.45 | ) | | | (0.44 | ) | | | (0.40 | ) | | | (0.46 | ) | |
| Net Asset Value, End of Period | | $ | 8.58 | | | $ | 9.83 | | | $ | 10.22 | | | $ | 9.99 | | | $ | 10.07 | | |
| Total return (d)(e) | | | (8.37 | )% | | | 0.60 | % | | | 6.91 | % | | | 3.22 | % | | | 2.12 | % | |
| Ratios to Average Net Assets/Supplemental Data: | |
| Net expenses (f) | | | 0.67 | % | | | 0.67 | %(c) | | | 0.67 | % | | | 0.67 | % | | | 0.67 | % | |
| Waiver/Reimbursement | | | 0.39 | % | | | 0.47 | % | | | 0.54 | % | | | 0.37 | % | | | 0.45 | % | |
| Net investment income | | | 4.40 | % | | | 4.34 | %(c)(f) | | | 4.19 | % | | | 3.60 | % | | | 3.01 | % | |
| Portfolio turnover rate | | | 51 | % | | | 24 | % | | | 42 | % | | | 19 | % | | | 48 | % | |
| Net assets, end of period (000's) | | $ | 11,281 | | | $ | 13,941 | | | $ | 15,240 | | | $ | 15,687 | | | $ | 25,211 | | |
(a) On August 22, 2005, the Portfolio's Investor A shares were renamed Class A shares.
(b) Per share data was calculated using the average shares outstanding during the period.
(c) The benefits derived from expense reductions had an impact of less than 0.01%.
(d) Total return at net asset value assuming all distributions reinvested and no initial sales charge or contingent deferred sales charge.
(e) Had the investment advisor and/or any of its affiliates not waived fees or reimbursed a portion of expenses, total return would have been reduced.
(f) Does not include expenses of the underlying investment companies in which the Portfolio invests. If these expenses were included, the expense ratios would have been higher.
See Accompanying Notes to Financial Statements.
51
Financial Highlights – Columbia LifeGoal Income Portfolio
Selected data for a share outstanding throughout each period is as follows:
| | | Year Ended March 31, | |
| Class B Shares | | 2009 | | 2008 | | 2007 | | 2006 (a) | | 2005 | |
| Net Asset Value, Beginning of Period | | $ | 9.82 | | | $ | 10.21 | | | $ | 9.98 | | | $ | 10.06 | | | $ | 10.30 | | |
| Income from Investment Operations: | |
| Net investment income (b) | | | 0.31 | | | | 0.36 | | | | 0.35 | | | | 0.29 | | | | 0.24 | | |
Net realized and unrealized gain (loss) on investments
and capital gains distributions received | | | (1.20 | ) | | | (0.37 | ) | | | 0.25 | | | | (0.05 | ) | | | (0.10 | ) | |
| Total from investment operations | | | (0.89 | ) | | | (0.01 | ) | | | 0.60 | | | | 0.24 | | | | 0.14 | | |
| Less Distributions to Shareholders: | |
| From net investment income | | | (0.33 | ) | | | (0.36 | ) | | | (0.36 | ) | | | (0.30 | ) | | | (0.34 | ) | |
| From net realized gains | | | (0.04 | ) | | | (0.02 | ) | | | (0.01 | ) | | | (0.02 | ) | | | (0.04 | ) | |
| Total distributions to shareholders | | | (0.37 | ) | | | (0.38 | ) | | | (0.37 | ) | | | (0.32 | ) | | | (0.38 | ) | |
| Net Asset Value, End of Period | | $ | 8.56 | | | $ | 9.82 | | | $ | 10.21 | | | $ | 9.98 | | | $ | 10.06 | | |
| Total return (d)(e) | | | (9.17 | )% | | | (0.15 | )% | | | 6.13 | % | | | 2.44 | % | | | 1.35 | % | |
| Ratios to Average Net Assets/Supplemental Data: | |
| Net expenses (f) | | | 1.42 | % | | | 1.42 | %(c) | | | 1.42 | % | | | 1.42 | % | | | 1.42 | % | |
| Waiver/Reimbursement | | | 0.39 | % | | | 0.47 | % | | | 0.54 | % | | | 0.37 | % | | | 0.45 | % | |
| Net investment income | | | 3.66 | % | | | 3.58 | %(c) | | | 3.43 | % | | | 2.85 | % | | | 2.36 | % | |
| Portfolio turnover rate | | | 51 | % | | | 24 | % | | | 42 | % | | | 19 | % | | | 48 | % | |
| Net assets, end of period (000's) | | $ | 7,467 | | | $ | 8,849 | | | $ | 9,591 | | | $ | 10,946 | | | $ | 12,740 | | |
(a) On August 22, 2005, the Portfolio's Investor B shares were renamed Class B shares.
(b) Per share data was calculated using the average shares outstanding during the period.
(c) The benefits derived from expense reductions had an impact of less than 0.01%.
(d) Total return at net asset value assuming all distributions reinvested and no contingent deferred sales charge.
(e) Had the investment advisor and/or any of its affiliates not waived fees or reimbursed a portion of expenses, total return would have been reduced.
(f) Does not include expenses of the underlying investment companies in which the Portfolio invests. If these expenses were included, the expense ratios would have been higher.
See Accompanying Notes to Financial Statements.
52
Financial Highlights – Columbia LifeGoal Income Portfolio
Selected data for a share outstanding throughout each period is as follows:
| | | Year Ended March 31, | |
| Class C Shares | | 2009 | | 2008 | | 2007 | | 2006 (a) | | 2005 | |
| Net Asset Value, Beginning of Period | | $ | 9.81 | | | $ | 10.19 | | | $ | 9.97 | | | $ | 10.05 | | | $ | 10.28 | | |
| Income from Investment Operations: | |
| Net investment income (b) | | | 0.31 | | | | 0.36 | | | | 0.35 | | | | 0.30 | | | | 0.24 | | |
Net realized and unrealized gain (loss) on investments
and capital gains distributions received | | | (1.20 | ) | | | (0.36 | ) | | | 0.24 | | | | (0.06 | ) | | | (0.09 | ) | |
| Total from investment operations | | | (0.89 | ) | | | 0.00 | | | | 0.59 | | | | 0.24 | | | | 0.15 | | |
| Less Distributions to Shareholders: | |
| From net investment income | | | (0.33 | ) | | | (0.36 | ) | | | (0.36 | ) | | | (0.30 | ) | | | (0.34 | ) | |
| From net realized gains | | | (0.04 | ) | | | (0.02 | ) | | | (0.01 | ) | | | (0.02 | ) | | | (0.04 | ) | |
| Total distributions to shareholders | | | (0.37 | ) | | | (0.38 | ) | | | (0.37 | ) | | | (0.32 | ) | | | (0.38 | ) | |
| Net Asset Value, End of Period | | $ | 8.55 | | | $ | 9.81 | | | $ | 10.19 | | | $ | 9.97 | | | $ | 10.05 | | |
| Total return (d)(e) | | | (9.18 | )% | | | (0.05 | )% | | | 6.03 | % | | | 2.45 | % | | | 1.46 | % | |
| Ratios to Average Net Assets/Supplemental Data: | |
| Net expenses (f) | | | 1.42 | % | | | 1.42 | %(c) | | | 1.42 | % | | | 1.42 | % | | | 1.42 | % | |
| Waiver/Reimbursement | | | 0.39 | % | | | 0.47 | % | | | 0.54 | % | | | 0.37 | % | | | 0.45 | % | |
| Net investment income | | | 3.70 | % | | | 3.59 | %(c) | | | 3.44 | % | | | 2.85 | % | | | 2.36 | % | |
| Portfolio turnover rate | | | 51 | % | | | 24 | % | | | 42 | % | | | 19 | % | | | 48 | % | |
| Net assets, end of period (000's) | | $ | 5,104 | | | $ | 4,932 | | | $ | 4,734 | | | $ | 6,082 | | | $ | 9,881 | | |
(a) On August 22, 2005, the Portfolio's Investor C shares were renamed Class C shares.
(b) Per share data was calculated using the average shares outstanding during the period.
(c) The benefits derived from expense reductions had an impact of less than 0.01%.
(d) Total return at net asset value assuming all distributions reinvested and no contingent deferred sales charge.
(e) Had the investment advisor and/or any of its affiliates not waived fees or reimbursed a portion of expenses, total return would have been reduced.
(f) Does not include expenses of the underlying investment companies in which the Portfolio invests. If these expenses were included, the expense ratios would have been higher.
See Accompanying Notes to Financial Statements.
53
Financial Highlights – Columbia LifeGoal Income Portfolio
Selected data for a share outstanding throughout each period is as follows:
| | | Year Ended March 31, | |
| Class Z Shares | | 2009 | | 2008 | | 2007 | | 2006 (a) | | 2005 | |
| Net Asset Value, Beginning of Period | | $ | 9.83 | | | $ | 10.22 | | | $ | 10.00 | | | $ | 10.08 | | | $ | 10.31 | | |
| Income from Investment Operations: | |
| Net investment income (b) | | | 0.42 | | | | 0.46 | | | | 0.46 | | | | 0.38 | | | | 0.32 | | |
Net realized and unrealized gain (loss) on investments
and capital gains distributions received | | | (1.21 | ) | | | (0.37 | ) | | | 0.23 | | | | (0.04 | ) | | | (0.07 | ) | |
| Total from investment operations | | | (0.79 | ) | | | 0.09 | | | | 0.69 | | | | 0.34 | | | | 0.25 | | |
| Less Distributions to Shareholders: | |
| From net investment income | | | (0.43 | ) | | | (0.46 | ) | | | (0.46 | ) | | | (0.40 | ) | | | (0.44 | ) | |
| From net realized gains | | | (0.04 | ) | | | (0.02 | ) | | | (0.01 | ) | | | (0.02 | ) | | | (0.04 | ) | |
| Total distributions to shareholders | | | (0.47 | ) | | | (0.48 | ) | | | (0.47 | ) | | | (0.42 | ) | | | (0.48 | ) | |
| Net Asset Value, End of Period | | $ | 8.57 | | | $ | 9.83 | | | $ | 10.22 | | | $ | 10.00 | | | $ | 10.08 | | |
| Total return (d)(e) | | | (8.25 | )% | | | 0.85 | % | | | 7.07 | % | | | 3.47 | % | | | 2.47 | % | |
| Ratios to Average Net Assets/Supplemental Data: | |
| Net expenses (f) | | | 0.42 | % | | | 0.42 | %(c) | | | 0.42 | % | | | 0.42 | % | | | 0.42 | % | |
| Waiver/Reimbursement | | | 0.39 | % | | | 0.47 | % | | | 0.54 | % | | | 0.37 | % | | | 0.45 | % | |
| Net investment income | | | 4.60 | % | | | 4.57 | %(c) | | | 4.50 | % | | | 3.85 | % | | | 3.26 | % | |
| Portfolio turnover rate | | | 51 | % | | | 24 | % | | | 42 | % | | | 19 | % | | | 48 | % | |
| Net assets, end of period (000's) | | $ | 4,472 | | | $ | 5,813 | | | $ | 3,731 | | | $ | 403 | | | $ | 667 | | |
(a) On August 22, 2005, the Portfolio's Primary A shares were renamed Class Z shares.
(b) Per share data was calculated using the average shares outstanding during the period.
(c) The benefits derived from expense reductions had an impact of less than 0.01%.
(d) Total return at net asset value assuming all distributions reinvested.
(e) Had the investment advisor and/or any of its affiliates not waived fees or reimbursed a portion of expenses, total return would have been reduced.
(f) Does not include expenses of the underlying investment companies in which the Portfolio invests. If these expenses were included, the expense ratios would have been higher.
See Accompanying Notes to Financial Statements.
54
Notes to Financial Statements – Columbia LifeGoal Portfolios
March 31, 2009
Note 1. Organization
Columbia Funds Series Trust (the "Trust") is a Delaware business trust registered under the Investment Company Act of 1940, as amended (the "1940 Act"), as an open-end management investment company. Information presented in these financial statements pertains to the following series of the Trust (each, a "Portfolio" and collectively, the "Portfolios"):
Columbia LifeGoal Growth Portfolio
Columbia LifeGoal Balanced Growth Portfolio
Columbia LifeGoal Income and Growth Portfolio
Columbia LifeGoal Income Portfolio
Investment Objectives
Columbia LifeGoal Growth Portfolio seeks capital appreciation. Columbia LifeGoal Balanced Growth Portfolio seeks total return, consisting of capital appreciation and current income. Columbia LifeGoal Income and Growth Portfolio seeks total return, consisting of current income and modest capital appreciation. Columbia LifeGoal Income Portfolio seeks current income, consistent with relative stability of principal.
The Portfolios normally invest in the Mortgage- and Asset-Backed Portfolio of Columbia Funds Series Trust and Class Z shares and Capital Class shares of other Columbia Funds (the "Underlying Funds") advised by Columbia Management Advisors, LLC ("Columbia") and/or its affiliates.
The financial statements of the Underlying Funds in which the Portfolios invest should be read in conjunction with the Portfolios' financial statements.
Portfolio Shares
The Trust is authorized to issue an unlimited number of shares without par value. The Trust's Declaration of Trust authorizes the Board of Trustees to classify or reclassify any authorized but unissued shares into one or more additional classes or series of shares. Columbia LifeGoal Income Portfolio offers four classes of shares: Class A, Class B, Class C and Class Z shares. Columbia LifeGoal Growth Portfolio, Columbia LifeGoal Balanced Growth Portfolio and Columbia LifeGoal Income and Growth Portfolio each offer five classes of shares: Class A, Class B, Class C, Class R and Class Z shares. Each share class has its own expense structure and sales charges, as applicable. Beginning on or about June 22, 2009, the Portfolios will no longer accept investment in Class B shares from new or existing investors in the Portfolios' Class B shares, except in connection with the reinvestment of any dividend and/or capital gain distributions i n Class B shares of the Portfolios and exchanges by existing Class B shareholders of the other Columbia Funds.
Class A shares are subject to a maximum front-end sales charge of 5.75% for each Portfolio with the exception of Columbia LifeGoal Income Portfolio. Columbia LifeGoal Income Portfolio is subject to a maximum front-end sales charge of 3.25% based on the amount of initial investment. Class A shares purchased without an initial sales charge in accounts aggregating between $1 million to $50 million at the time of purchase are subject to a 1.00% contingent deferred sales charge ("CDSC") if the shares are sold within one year after purchase. Class B shares are subject to a maximum CDSC of 5.00% (3.00% for Columbia LifeGoal Income Portfolio) based upon the holding period after purchase. Class B shares will convert to Class A shares eight years after purchase. Class C shares are subject to a 1.00% CDSC on shares sold within one year after purchase. Class R and Class Z shares are offered continuously at net asset value. There are certain restrictions on the purchase of Class R and Class Z shares, as described in each Portfolio's prospectus.
Note 2. Significant Accounting Policies
The preparation of financial statements in accordance with accounting principles generally accepted in the United States of America ("GAAP") requires management to make certain estimates and assumptions that affect the reported amounts of assets and liabilities, the disclosure of contingent assets and liabilities at the date of the financial statements and the reported amounts of revenue and expenses during the reporting period. Actual results could differ from those estimates. For the years ended March 31, 2008 and 2007, certain amounts have been reclassified from net investment income to net realized gains and certain amounts have been reclassified from distributions from net investment income to distributions from net realized gains to conform to the current year financial statement presentation. The following is a summary of significant accounting policies consistently followed by the Portfolios in the preparation of their f inancial statements.
55
Columbia LifeGoal Portfolios, March 31, 2009 (continued)
Security Valuation
Investments in the Underlying Funds are valued at the net asset value of each class of the respective Underlying Fund determined as of the close of the New York Stock Exchange on the valuation date.
Security Transactions
Security transactions are accounted for on the trade date. Cost is determined and gains (losses) are based upon the specific identification method for both financial statement and federal income tax purposes.
Income Recognition
Distributions from the Underlying Funds are recorded on the ex-dividend date. Each Portfolio's investment income and realized and unrealized gains and losses are allocated among its share classes based upon the relative net assets of each class of shares.
Expenses
General expenses of the Trust are allocated to the Portfolios and other series of the Trust based upon relative net assets or other expense allocation methodologies determined by the nature of the expense. Expenses directly attributable to a Portfolio are charged to such Portfolio.
Determination of Class Net Asset Value
All income, expenses (other than class-specific expenses, as shown on the Statements of Operations) and realized and unrealized gains (losses) are allocated to each class of the Portfolios on a daily basis, based on the relative net assets of each class, for purposes of determining the net asset value of each class.
Distributions to Shareholders
Distributions for net investment income, if any, are declared and paid quarterly for each Portfolio, except Columbia LifeGoal Income Portfolio for which distributions from net investment income, if any, are declared and paid monthly. Net realized capital gains, if any, are distributed at least annually. Income distributions and capital gain distributions are determined in accordance with federal income tax regulations which differ from GAAP.
Federal Income Tax Status
Each Portfolio intends to qualify each year as a "regulated investment company" under Subchapter M of the Internal Revenue Code, as amended, and will distribute substantially all of its tax-exempt or taxable income, if any, for its tax year, and as such will not be subject to federal income taxes. In addition, each Portfolio intends to distribute in each calendar year substantially all of its net investment income, capital gains and certain other amounts, if any, such that each Portfolio should not be subject to federal excise tax. Therefore, no federal income or excise tax provision is recorded.
Indemnification
In the normal course of business, each Portfolio enters into contracts that contain a variety of representations and warranties and which provide general indemnities. A Portfolio's maximum exposure under these arrangements is unknown because this would involve future claims against a Portfolio. Also, under the Trust's organizational documents and by contract, the Trustees and officers of the Trust are indemnified against certain liabilities that may arise out of actions relating to their duties to the Trust. However, based on experience, the Portfolios expect the risk of loss due to these representations, warranties and indemnities to be minimal.
Note 3. Federal Tax Information
The timing and character of income and capital gain distributions are determined in accordance with income tax regulations, which may differ from GAAP. Reclassifications are made to each Portfolio's capital accounts for permanent tax differences to reflect income and gains available for distribution (or available capital loss carryforwards) under income tax regulations.
56
Columbia LifeGoal Portfolios, March 31, 2009 (continued)
For the year ended March 31, 2009, permanent book and tax basis differences resulting primarily from differing treatments for distribution reclassifications were identified and reclassified among the components of each Portfolios' net assets as follows:
| | | Undistributed or
(Overdistributed) or
(Accumulated)
Net Investment
Income (Loss) | | Accumulated
Net Realized
Gain/Loss | | Paid-In Capital | |
| Columbia LifeGoal Growth Portfolio | | $ | — | | | $ | — | | | $ | — | | |
| Columbia LifeGoal Balanced Growth Portfolio | | | (81,913 | ) | | | 81,914 | | | | (1 | ) | |
| Columbia LifeGoal Income and Growth Portfolio | | | (49,662 | ) | | | 49,662 | | | | — | | |
| Columbia LifeGoal Income Portfolio | | | (4,939 | ) | | | 4,941 | | | | (2 | ) | |
Net investment income and net realized gains (losses), as disclosed on the Statements of Operations, and net assets were not affected by these reclassifications.
The tax character of distributions paid during the years ended March 31, 2009 and March 31, 2008 was as follows:
| | | March 31, 2009 | |
| | | Ordinary
Income* | | Long-term
Capital Gains | | Tax Return
of Capital | |
| Columbia LifeGoal Growth Portfolio | | $ | 1,646,065 | | | $ | 97,148,901 | | | $ | 289,773 | | |
| Columbia LifeGoal Balanced Growth Portfolio | | | 12,535,145 | | | | 69,081,710 | | | | — | | |
| Columbia LifeGoal Income and Growth Portfolio | | | 4,759,661 | | | | 6,268,200 | | | | — | | |
| Columbia LifeGoal Income Portfolio | | | 1,253,743 | | | | 124,795 | | | | — | | |
| | | March 31, 2008 | |
| | | Ordinary
Income* | | Long-term
Capital Gains | |
| Columbia LifeGoal Growth Portfolio | | $ | 12,701,669 | | | $ | 35,816,150 | | |
| Columbia LifeGoal Balanced Growth Portfolio | | | 27,619,603 | | | | 38,156,421 | | |
| Columbia LifeGoal Income and Growth Portfolio | | | 7,504,273 | | | | 5,935,230 | | |
| Columbia LifeGoal Income Portfolio | | | 1,445,304 | | | | — | | |
* For tax purposes short-term capital gains distributions, if any, are considered ordinary income distributions.
57
Columbia LifeGoal Portfolios, March 31, 2009 (continued)
As of March 31, 2009, the components of distributable earnings on a tax basis were as follows:
| | | Undistributed
Ordinary
Income | | Undistributed
Long-term
Capital Gains | | Net Unrealized
Appreciation
(Depreciation)* | |
| Columbia LifeGoal Growth Portfolio | | $ | — | | | $ | — | | | $ | (142,930,438 | ) | |
| Columbia LifeGoal Balanced Growth Portfolio | | | 171,332 | | | | — | | | | (148,394,315 | ) | |
| Columbia LifeGoal Income and Growth Portfolio | | | 17,944 | | | | — | | | | (27,823,604 | ) | |
| Columbia LifeGoal Income Portfolio | | | 12,362 | | | | — | | | | (4,769,594 | ) | |
* The differences between book-basis and tax-basis net unrealized appreciation/depreciation are primarily due to deferral of losses from wash sales and distribution reclassifications.
Unrealized appreciation and depreciation at March 31, 2009, based on cost of investments for federal income tax purposes, were:
| | | Unrealized
Appreciation | | Unrealized
Depreciation | | Net
Unrealized
Depreciation | |
| Columbia LifeGoal Growth Portfolio | | $ | 3,033,349 | | | $ | (145,963,787 | ) | | $ | (142,930,438 | ) | |
| Columbia LifeGoal Balanced Growth Portfolio | | | 4,090,266 | | | | (152,484,581 | ) | | | (148,394,315 | ) | |
| Columbia LifeGoal Income and Growth Portfolio | | | 656,358 | | | | (28,479,962 | ) | | | (27,823,604 | ) | |
| Columbia LifeGoal Income Portfolio | | | 147,333 | | | | (4,916,927 | ) | | | (4,769,594 | ) | |
The following capital loss carryforwards, as determined as of March 31, 2009, may be available to reduce taxable income arising from future net realized gains on investments, if any, to the extent permitted by the Internal Revenue Code:
| | | Year of
Expiration | | Capital Loss
Carryforward | |
Columbia LifeGoal
Growth Portfolio | | | 2017 | | | $ | 40,958,553 | | |
Columbia LifeGoal
Balanced Growth | | | |
| Portfolio | | | 2017 | | | | 27,410,771 | | |
Columbia LifeGoal
Income and Growth | |
| Portfolio | | | 2017 | | | | 2,817,485 | | |
Columbia LifeGoal
Income Portfolio | | | 2017 | | | | 425,616 | | |
Under current tax rules, certain capital losses realized after October 31 may be deferred and treated as occurring on the first day of the following fiscal year. As of March 31, 2009, post-October capital losses attributed to security transactions and deferred to April 1, 2009 were as follows:
| Columbia LifeGoal Growth Portfolio | | $ | 26,747,494 | | |
| Columbia LifeGoal Balanced | |
| Growth Portfolio | | | 35,143,761 | | |
Columbia LifeGoal Income and
Growth Portfolio | | | 7,040,767 | | |
| Columbia LifeGoal Income Portfolio | | | 526,540 | | |
58
Columbia LifeGoal Portfolios, March 31, 2009 (continued)
Under Financial Accounting Standards Board ("FASB") Interpretation No. 48, Accounting for Uncertainty in Income Taxes—an Interpretation of FASB Statement No. 109 ("FIN 48"), management determines whether a tax position of a Portfolio is more likely than not to be sustained upon examination by the applicable taxing authority, including resolution of any related appeals or litigation processes, based on the technical merits of the position. The tax benefit to be recognized is measured as the largest amount of benefit that is greater than fifty percent likely of being realized upon ultimate settlement. Management has evaluated the known implications of FIN 48 on its computation of net assets for each Portfolio. As a result of this evaluation, management has concluded that FIN 48 did not have any effect on the Portfolios' financial statements. However, management's conclusions regarding FIN 48 may be subject to review and adjustment at a later date based on factors including, but not limited to, further implementation guidance from the FASB, new tax laws, regulations, and administrative interpretations (including relevant court decisions). The Portfolios' federal tax returns for the prior three fiscal years remain subject to examination by the Internal Revenue Service. The Portfolios are not aware of any tax positions for which it is reasonably possible that the total amounts of unrecognized tax benefits will significantly change in the next twelve months.
Note 4. Fees and Compensation Paid to Affiliates
Investment Advisory Fee
Columbia, an indirect, wholly owned subsidiary of Bank of America Corporation ("BOA"), provides investment advisory services to the Portfolios. In rendering investment advisory services to the Portfolios, Columbia may use the portfolio management and research resources of Columbia Management Pte. Ltd., an affiliate of Columbia. Columbia receives an investment advisory fee, calculated daily and payable monthly, based on the average daily net assets of each Portfolio at the following annual rates:
| | | Annual
Fee Rate | |
| Columbia LifeGoal Growth Portfolio | | | 0.25 | % | |
| Columbia LifeGoal Balanced Growth Portfolio | | | 0.25 | % | |
| Columbia LifeGoal Income and Growth Portfolio | | | 0.25 | % | |
| Columbia LifeGoal Income Portfolio | | | 0.50 | %* | |
* Columbia is entitled to receive an investment advisory fee based on Columbia LifeGoal Income Portfolio's assets that are invested in individual securities, Mortgage- and Asset-Backed Portfolio and Corporate Bond Portfolio of Columbia Funds Series Trust. Columbia LifeGoal Income Portfolio is not charged an advisory fee on its assets that are invested in other Columbia Funds (excluding Mortgage- and Asset-Backed Portfolio and Corporate Bond Portfolio. Actual management fees will be charged to Columbia LifeGoal Income Portfolio based on a weighted average of applicable underlying assets of the Portfolio.)
Columbia has contractually agreed to waive 0.10% of advisory fees payable by Columbia LifeGoal Income Portfolio on its assets that are invested in individual securities, Mortgage- and Asset-Backed Portfolio and Corporate Bond Portfolio until July 31, 2010. There is no guarantee that this arrangement will continue after July 31, 2010.
Under its investment advisory agreement, Columbia has agreed to bear all fees and expenses of the Portfolios, excluding Columbia LifeGoal Income Portfolio, (exclusive of investment advisory fees, brokerage fees and commissions, any distribution and shareholder servicing fees, taxes, interest expenses of borrowing money and extraordinary expenses, if any).
Administration Fee
Columbia provides administrative and other services to the Portfolios. Under the administration agreement, Columbia does not receive any compensation for its services from the Portfolios, excluding Columbia LifeGoal Income Portfolio.
With respect to Columbia LifeGoal Income Portfolio, Columbia is entitled to receive an administration fee, computed daily and paid monthly, at the annual rate of 0.23% of its average daily net assets less the custody and the pricing and bookkeeping fees payable by the Portfolio.
59
Columbia LifeGoal Portfolios, March 31, 2009 (continued)
Columbia has contractually agreed to waive 0.10% of administration fees on Columbia LifeGoal Income Portfolio's assets that are invested in Underlying Funds (excluding Mortgage- and Asset-Backed Portfolio and Corporate Bond Portfolio) until July 31, 2010. There is no guarantee that this arrangement will continue after July 31, 2010.
Pricing and Bookkeeping Fees
The Portfolios have entered into a Financial Reporting Services Agreement (the "Financial Reporting Services Agreement") with State Street Bank & Trust Company ("State Street") and Columbia pursuant to which State Street provides financial reporting services to the Portfolios. The Portfolios have also entered into an Accounting Services Agreement (collectively with the Financial Reporting Services Agreement, the "State Street Agreements") with State Street and Columbia pursuant to which State Street provides accounting services to the Portfolios. Under the State Street Agreements, Columbia LifeGoal Income Portfolio pays State Street an annual fee of $26,000 paid monthly. Columbia LifeGoal Income Portfolio also reimburses State Street for certain out-of-pocket expenses and charges.
The Portfolios have entered into a Pricing and Bookkeeping Oversight and Services Agreement (the "Services Agreement") with Columbia. Under the Services Agreement, Columbia provides services related to Portfolio expenses and the requirements of the Sarbanes-Oxley Act of 2002, and provides oversight of the accounting and financial reporting services provided by State Street. Under the Services Agreement, the Columbia LifeGoal Income Portfolio reimburses Columbia for out-of-pocket expenses.
Transfer Agent Fee
Columbia Management Services, Inc. (the "Transfer Agent"), an affiliate of Columbia and an indirect, wholly owned subsidiary of BOA, provides shareholder services to the Portfolios and has contracted with Boston Financial Data Services ("BFDS") to serve as sub-transfer agent. The Transfer Agent is entitled to receive a fee for its services, paid monthly, at the annual rate of $17.34 per open account for Columbia LifeGoal Income Portfolio plus reimbursement of certain sub-transfer agent fees paid by the Transfer Agent (exclusive of BFDS fees), calculated based on assets held in omnibus accounts and intended to recover the cost of payments to other parties (including affiliates of BOA) for services to those accounts. The Transfer Agent pays the fees of BFDS for services as sub-transfer agent and is not entitled to reimbursement for such fees from the Portfolios. The Transfer Agent may also retain, as additional compensation for it s services, fees for wire, telephone and redemption orders, Individual Retirement Account ("IRA") trustee agent fees and account transcript fees due to the Transfer Agent from shareholders of the Portfolios and credits (net of bank charges) earned with respect to balances in accounts the Transfer Agent maintains in connection with its services to the Portfolios. The Transfer Agent also receives reimbursement for certain out-of-pocket expenses.
An annual minimum account balance fee of $20 may apply to certain accounts with a value below each Portfolio's initial minimum investment requirements to reduce the impact of small accounts on transfer agent fees. These minimum account balance fees are recorded as a reduction of expenses on the Statements of Operations. For the year ended March 31, 2009, these minimum account balance fees reduced total expenses of the Portfolios as follows:
| | | Minimum
Account
Balance Fee | |
| Columbia LifeGoal Growth Portfolio | | $ | 2,686 | | |
| Columbia LifeGoal Balanced Growth Portfolio | | | 1,667 | | |
| Columbia LifeGoal Income and Growth Portfolio | | | 180 | | |
Underwriting Discounts, Service and Distribution Fees
Columbia Management Distributors, Inc. (the "Distributor"), an affiliate of Columbia and an indirect, wholly owned subsidiary of BOA, is the principal underwriter of the Portfolios' shares. For the year ended March 31, 2009, the Distributor has retained net
60
Columbia LifeGoal Portfolios, March 31, 2009 (continued)
underwriting discounts on the sale of Class A shares and received net CDSC fees on Class A, Class B and Class C share redemptions as follows:
| | | Front-End
Sales Charge | | Contingent Deferred Sales Charge | |
| | | Class A | | Class A | | Class B | | Class C | |
| Columbia LifeGoal Growth Portfolio | | $ | 98,641 | | | $ | 768 | | | $ | 230,340 | | | $ | 14,107 | | |
| Columbia LifeGoal Balanced Growth Portfolio | | | 131,431 | | | | 803 | | | | 479,481 | | | | 56,297 | | |
| Columbia LifeGoal Income and Growth Portfolio | | | 45,636 | | | | 38 | | | | 137,664 | | | | 9,112 | | |
| Columbia LifeGoal Income Portfolio | | | 1,709 | | | | 29 | | | | 5,919 | | | | 1,609 | | |
The Trust has adopted shareholder servicing plans and distribution plans for the Class B and Class C shares of each Portfolio and a combined distribution and shareholder servicing plan for the Class A shares of each Portfolio. The Trust has also adopted a distribution plan for the Class R shares of Columbia LifeGoal Growth Portfolio, Columbia LifeGoal Balanced Growth Portfolio and Columbia LifeGoal Income and Growth Portfolio. The shareholder servicing plans permit the Portfolios to compensate or reimburse servicing agents for the shareholder services they have provided. The distribution plans, adopted pursuant to Rule 12b-1 under the 1940 Act, permit the Portfolios to compensate or reimburse the Distributor and/or selling agents for activities or expenses primarily intended to result in the sale of the classes' shares. Payments are made at an annual rate and paid monthly, as a percentage of average daily net assets, set from ti me to time by the Board of Trustees, and are charged as expenses of each Portfolio directly to the applicable share class. A substantial portion of the expenses incurred pursuant to these plans is paid to affiliates of BOA and the Distributor.
The annual rates in effect and plan limits, as a percentage of average daily net assets are as follows:
| | | Current
Rate | | Plan
Limit | |
Class A Combined Distribution
and Shareholder Servicing Plan | | | 0.25 | % | | | 0.25 | % | |
Class B and Class C
Shareholder Servicing Plans | | | 0.25 | % | | | 0.25 | % | |
Class B and Class C
Distribution Plans | | | 0.75 | % | | | 0.75 | % | |
| Class R Distribution Plan | | | 0.50 | % | | | 0.50 | % | |
Fee Waivers and Expense Reimbursements
For Columbia LifeGoal Income Portfolio, Columbia has contractually agreed to waive fees and/or reimburse certain expenses through July 31, 2010, so that the Portfolio's ordinary operating expenses (excluding any distribution and service fees, brokerage commissions, interest, taxes, extraordinary expenses and expenses associated with the Portfolio's investments in other investment companies, but including custodial charges relating to overdrafts, if any), after giving effect to any balance credits from the Portfolio's custodian, do not exceed 0.42% annually of the Portfolio's average daily net assets. There is no guarantee that this expense limitation will continue after July 31, 2010.
Fees Paid to Officers and Trustees
All officers of the Portfolios are employees of Columbia or its affiliates and, with the exception of the Portfolios' Chief Compliance Officer, receive no compensation from the Portfolios. The Board of Trustees has appointed a Chief Compliance Officer to the Portfolios in accordance with federal securities regulations. The Columbia LifeGoal Income Portfolio, along with other affiliated funds, pay their pro-rata share of the expenses associated with the Chief Compliance Officer. Columbia LifeGoal Income Portfolio's expenses for the Chief Compliance Officer will not exceed $15,000 per year.
The Trust's eligible Trustees may participate in a non-qualified deferred compensation plan which may be terminated at any time. Any payments to plan participants are paid solely out of the Columbia LifeGoal Income Portfolio's assets. Income earned on the plan participant's deferral account is based on the rate of return of the eligible mutual funds selected by the participant or, if no funds are selected,
61
Columbia LifeGoal Portfolios, March 31, 2009 (continued)
on the rate of return of Columbia Treasury Reserves, another portfolio of the Trust. The expense for the deferred compensation plan, which includes trustees' fees deferred during the current period as well as any gains or losses on the trustees' deferred compensation balances as a result of market fluctuations, is included in "Trustees' fees" on the Statements of Operations. The liability for the deferred compensation plan is included in "Trustees' fees" on the Statements of Assets and Liabilities.
Note 5. Portfolio Information
For the year ended March 31, 2009, the cost of purchases and proceeds from sales of securities, excluding short-term obligations, for the Portfolios were as follows:
| | | Purchases | | Sales | |
Columbia LifeGoal
Growth Portfolio | | | $183,587,179 | | | | $245,751,053 | | |
Columbia LifeGoal
Balanced Growth
Portfolio | | | 279,624,565 | | | | 376,334,005 | | |
Columbia LifeGoal Income
and Growth Portfolio | | | 75,019,277 | | | | 88,441,027 | | |
Columbia LifeGoal
Income Portfolio | | | 15,459,951 | | | | 17,957,036 | | |
Note 6. Line of Credit
The Portfolios and other affiliated funds participate in a $280,000,000 committed, unsecured revolving line of credit provided by State Street. The maximum amount that may be borrowed by any Portfolio is limited to the lesser of $200,000,000 and the Portfolio's borrowing limit set forth in the Portfolio's registration statement. Borrowings are available for short-term liquidity or temporary or emergency purposes.
Interest is charged to each participating fund based on the fund's borrowings at a rate per annum equal to the greater of the Federal Funds Rate plus 0.50% or the overnight LIBOR Rate plus 0.50%. In addition, an annual operations agency fee of $20,000, an amendment fee of 0.02% and a commitment fee of 0.12% per annum are accrued and apportioned among the participating funds pro rata based on their relative net assets. Prior to October 16, 2008, the Portfolios and other affiliated funds participated in a $350,000,000 committed, unsecured revolving line of credit and a $150,000,000 uncommitted, unsecured line of credit, both provided by State Street. Interest on the committed line of credit was charged to each participating fund based on the fund's borrowings at a rate per annum equal to the Federal Funds Rate plus 0.50%. In addition, a commitment fee of 0.10% per annum was accrued and apportioned among the participating funds pro rata based on their relative net assets. Interest on the uncommitted line of credit was charged to each participating fund based on the fund's borrowings at a rate per annum equal to the Federal Funds Rate plus 0.375%. State Street charged an annual operations agency fee of $40,000 for the committed line of credit and was able to charge an annual administration fee of $15,000 for the uncommitted line of credit. For Columbia LifeGoal Income Portfolio the commitment fee, the operations agency fee and the administration fee were accrued and apportioned among the participating funds pro rata based on their relative net assets.
For the year ended March 31, 2009, Columbia LifeGoal Income and Growth Portfolio borrowed under these arrangements. The average daily loan balance outstanding on days where borrowing existed was $2,000,000 at a weighted average interest rate of 2.000%.
Note 7. Shares of Beneficial Interest
As of March 31, 2009, the Portfolios had shareholders whose shares were beneficially owned by participant accounts over which BOA and/or any of its affiliates had either sole or joint investment discretion. Subscription and redemption activity of these accounts may have a significant effect on the operations
62
Columbia LifeGoal Portfolios, March 31, 2009 (continued)
of the Portfolios. The percentages of shares of beneficial interest outstanding held therein are as follows:
| | | Number of
Shareholders | | % of Shares
Outstanding
Held | |
Columbia LifeGoal
Growth Portfolio | | | 2 | | | | 7.5 | | |
Columbia LifeGoal Balanced
Growth Portfolio | | | 2 | | | | 6.0 | | |
Columbia LifeGoal
Income & Growth Portfolio | | | 2 | | | | 7.4 | | |
Columbia LifeGoal
Income Portfolio | | | 2 | | | | 8.0 | | |
As of March 31, 2009, the Portfolios had shareholders that held greater than 5% of the shares outstanding of a Portfolio, over which BOA and/or any of its affiliates did not have investment discretion. The percentages of shares of beneficial interest outstanding held therein are as follows:
| | | Number of
Shareholders | | % of Shares
Outstanding
Held | |
Columbia LifeGoal
Income Portfolio | | | 1 | | | | 6.7 | | |
Subscription and redemption activity of these accounts may have a significant effect on the operations of the Portfolios.
Note 8. Significant Risks and Contingencies
Risk Factors of the Portfolios and the Underlying Funds
Investing in the Underlying Funds through the Portfolios involves certain additional expenses and possible risks that would not be present in a direct investment in the Underlying Funds. Under certain circumstances, an Underlying Fund may pay a redemption request by a Portfolio wholly or partly by a distribution in kind of securities from its portfolio, instead of cash, in accordance with the rules of the Securities and Exchange Commission. In such cases, the Portfolios may hold securities distributed by an Underlying Fund and incur custody and other costs until Columbia determines that it is appropriate to dispose of such securities.
The officers and certain Trustees of the Trust also serve as officers and Trustees of certain Underlying Funds. Conflicts may arise as these companies seek to fulfill their fiduciary responsibilities to both the Portfolios and the Underlying Funds.
From time to time, one or more of the Underlying Funds in which a Portfolio invests may experience relatively large investments or redemptions due to reallocations or rebalancing by the Portfolios as recommended by Columbia. In such event, the Underlying Funds that experience redemptions as a result of the reallocations or rebalancing may have to sell portfolio securities, and the Underlying Funds that receive additional cash will have to invest such cash. While it is impossible to predict the overall impact of these transactions over time, there could be adverse effects on each Portfolio's management to the extent that the Underlying Funds may be required to sell securities or invest cash at times when they would not otherwise have to do so.
These transactions could also have tax consequences if sales of securities resulted in gains, and could also increase transaction costs. Columbia, and other affiliated investment advisors, representing the interests of the Underlying Funds, is committed to minimizing the impact of Portfolio transactions on the Underlying Funds to the extent it is consistent with pursuing the investment objectives of the Portfolios. Columbia may, nevertheless, face conflicts of interest in fulfilling its responsibilities to both the Portfolios and the Underlying Funds.
Investing in the Underlying Funds also presents certain risks. Each of the Underlying Funds may invest in certain specified derivative securities, including but not limited to: interest rate and equity swaps, caps and floors for hedging purposes; exchange-traded options; over-the-counter options executed with primary dealers, including long calls and puts and covered calls and financial futures and options. Certain Underlying Funds may invest in restricted securities; instruments issued by trusts, partnerships or other issuers, including pass-through certificates representing
63
Columbia LifeGoal Portfolios, March 31, 2009 (continued)
participations in, or debt instruments backed by, the securities owned by such issuers. These securities may be affected by changes in interest rates, factors concerning the interests in and structure of the issuer or the originator of the mortgages, the creditworthiness of the entities that provide any supporting letters of credit, surety bonds or other credit enhancements or the market's assessment of the quality of underlying assets. These Underlying Funds may also engage in securities lending, reverse repurchase agreements and dollar roll transactions. Certain Underlying Funds may invest in debt obligations of foreign issuers and stocks of foreign corporations, securities in foreign investment funds or trusts and various other investment vehicles, each with inherent risks. These risks may involve foreign currency exchange rate fluctuations, adverse political and economic developments and the possible prevention of currency e xchange or other foreign governmental laws or restrictions. In addition, the liquidity of foreign securities may be more limited than that of domestic securities. In addition, certain Underlying Funds may invest in below investment grade debt.
Legal Proceedings
Columbia Management Advisors, LLC and Columbia Management Distributors, Inc. (collectively, the "Columbia Group") are subject to a settlement agreement with the New York Attorney General ("NYAG") (the "NYAG Settlement") and a settlement order with the SEC (the "SEC Order") on matters relating to mutual fund trading, each dated February 9, 2005. Under the terms of the SEC Order, the Columbia Group (or predecessor entities) agreed, among other things, to: pay disgorgement and civil money penalties collectively totaling $375 million; cease and desist from violations of the antifraud provisions and certain other provisions of the federal securities laws; maintain certain compliance and ethics oversight structures; and retain an independent consultant to review the Columbia Group's applicable supervisory, compliance, control and other policies and procedures. The NYAG Settlement, among other things, requires Columbia Management Advis ors, LLC and its affiliates to reduce management fees for certain funds in the Columbia family of mutual funds in a projected total of $160 million over five years through November 30, 2009 and to make certain disclosures to investors relating to expenses. In connection with the Columbia Group providing services to the Columbia Funds, the Columbia Funds have voluntarily undertaken to implement certain governance measures designed to maintain the independence of their boards of trustees and certain special consulting and compliance measures.
Pursuant to the SEC Order and related procedures, the $375 million in settlement amounts described above, of which approximately $90 million has been earmarked for certain Columbia Funds and their shareholders, is being distributed in accordance with a distribution plan developed by an independent distribution consultant and approved by the SEC on December 27, 2007. Distributions under the distribution plan began in mid-June 2008.
Civil Litigation
In connection with the events that resulted in the NYAG Settlement and SEC Order, various parties filed suits against Bank of America Corporation and certain of its affiliates, including Banc of America Capital Management, LLC ("BACAP," now known as Columbia Management Advisors, LLC) and BACAP Distributors, LLC (now known as Columbia Management Distributors, Inc.) (collectively "BAC"), Nations Funds Trust (now known as Columbia Funds Series Trust) and its Board of Trustees. On February 20, 2004, the Judicial Panel on Multidistrict Litigation transferred these cases and cases against other mutual fund companies based on similar allegations to the United States District Court in Maryland for consolidated or coordinated pretrial proceedings (the "MDL"). Subsequently, additional related cases were transferred to the MDL. On September 29, 2004, the plaintiffs in the MDL filed amended and consolidated complaints. One of these amended complaints is a putative class action that includes claims under the federal securities laws and state common law, and that names Nations Funds Trust, the Trustees, BAC and others as defendants. Another of the amended complaints is a derivative action purportedly on behalf of the Nations Funds Trust against BAC and others that asserts claims under federal securities laws and state common law. Nations Funds Trust is a nominal defendant in this action.
On February 25, 2005, BAC and other defendants filed motions to dismiss the claims in the pending cases. On December 15, 2005, BAC and others entered into a Stipulation of Settlement of the direct and derivative claims brought on behalf of the Nations Funds shareholders. The settlement is subject to court approval. If the settlement is approved, BAC would pay settlement administration costs and fees to plaintiffs' counsel as approved by the court. The stipulation has not yet been presented to the court for approval.
64
Report of Independent Registered Public Accounting Firm
To the Shareholders and Trustees of Columbia Funds Series Trust
In our opinion, the accompanying statements of assets and liabilities, including the investment portfolios, and the related statements of operations and of changes in net assets and the financial highlights present fairly, in all material respects, the financial position of Columbia LifeGoal Growth Portfolio, Columbia LifeGoal Balanced Growth Portfolio, Columbia LifeGoal Income and Growth Portfolio and Columbia LifeGoal Income Portfolio (constituting part of Columbia Funds Series Trust, hereafter referred to as the "Portfolios") at March 31, 2009, the results of each of their operations and the changes in each of their net assets and the financial highlights for the periods indicated, in conformity with accounting principles generally accepted in the United States of America. These finan cial statements and financial highlights (hereafter referred to as "financial statements") are the responsibility of the Portfolios' management. Our responsibility is to express an opinion on these financial statements based on our audits. We conducted our audits of these financial statements in accordance with the standards of the Public Company Accounting Oversight Board (United States). Those standards require that we plan and perform the audit to obtain reasonable assurance about whether the financial statements are free of material misstatement. An audit includes examining, on a test basis, evidence supporting the amounts and disclosures in the financial statements, assessing the accounting principles used and significant estimates made by management, and evaluating the overall financial statement presentation. We believe that our audits, which included confirmation of securities at March 31, 2009 by correspondence with the transfer agents of the underlying funds, provide a reasonable basis for our opin ion.
PricewaterhouseCoopers LLP
Boston, Massachusetts
May 27, 2009
65
Federal Income Tax Information (Unaudited)
Columbia LifeGoal Growth Portfolio
100% of the ordinary income distributed by the Portfolio, for the year ended March 31, 2009 qualifies for the corporate dividends received deduction.
For non-corporate shareholders 100%, or the maximum amount allowable under the Jobs and Growth Tax Relief Reconciliation Act of 2003, of income distributed by the Portfolio for the period April 1, 2008 to March 31, 2009 may represent qualified dividend income. Final information will be provided in your 2009 Form 1099-DIV.
Columbia LifeGoal Balanced Growth Portfolio
21.84% of the ordinary income distributed by the Portfolio, for the year ended March 31, 2009 qualifies for the corporate dividends received deduction.
For non-corporate shareholders 27.68%, or the maximum amount allowable under the Jobs and Growth Tax Relief Reconciliation Act of 2003, of income distributed by the Portfolio for the period April 1, 2008 to March 31, 2009 may represent qualified dividend income. Final information will be provided in your 2009 Form 1099-DIV.
Columbia LifeGoal Income and Growth Portfolio
8.36% of the ordinary income distributed by the Portfolio, for the year ended March 31, 2009 qualifies for the corporate dividends received deduction.
For non-corporate shareholders 11.54%, or the maximum amount allowable under the Jobs and Growth Tax Relief Reconciliation Act of 2003, of income distributed by the Portfolio for the period April 1, 2008 to March 31, 2009 may represent qualified dividend income. Final information will be provided in your 2009 Form 1099-DIV.
Columbia LifeGoal Income Portfolio
4.41% of the ordinary income distributed by the Portfolio for the year ended March 31, 2009 qualifies for the corporate dividends received deduction.
For non-corporate shareholders 4.36%, or the maximum amount allowable under the Jobs and Growth Tax Relief Reconciliation Act of 2003, of income distributed by the Portfolio for the period April 1, 2008 to March 31, 2009 may represent qualified dividend income. Final information will be provided in your 2009 Form 1099-DIV.
66
Fund Governance
The Trustees serve terms of indefinite duration. The names, addresses and ages of the Trustees and officers of the Funds in the Columbia Funds Series Trust, the year each was first elected or appointed to office, their principal business occupations during at least the last five years, the number of Funds overseen by each Trustee and other directorships they hold are shown below. Each officer listed below serves as an officer of each Fund in the Columbia Funds Complex.
Independent Trustees
Name, Address and Age,
Position with Funds, Year First
Elected or Appointed to Office | | Principal Occupation(s) During Past Five Years, Number of Funds in the Columbia
Funds Complex Overseen by Trustee, Other Directorships Held
| |
| Edward J. Boudreau (Born 1944) | |
|
c/o Columbia Management
Advisors, LLC
One Financial Center
Boston, MA 02111
Trustee (since 2005) | | Managing Director—E.J. Boudreau & Associates (consulting), from 2000 through current; oversees 66; no other directorships held. | |
|
| William P. Carmichael (Born 1943) | |
|
c/o Columbia Management
Advisors, LLC
One Financial Center
Boston, MA 02111
Trustee (since 1999) | | Retired. Oversees 66; Director—Cobra Electronics Corporation (electronic equipment manufacturer); Director—Spectrum Brands, Inc. (consumer products); Director—Simmons Company (bedding); Director—The Finish Line (sportswear). | |
|
| William A. Hawkins (Born 1942) | |
|
c/o Columbia Management Advisors, LLC
One Financial Center
Boston, MA 02111
Trustee (since 2005) | | President and Chief Executive Officer—California General Bank, N.A., from January 2008 through current; President, Retail Banking—IndyMac Bancorp, Inc., from September 1999 to August 2003; oversees 66; no other directorships held. | |
|
| R. Glenn Hilliard (Born 1943) | |
|
c/o Columbia Management Advisors, LLC
One Financial Center
Boston, MA 02111
Trustee (since 2005) | | Chairman and Chief Executive Officer—Hilliard Group LLC (investing and consulting), from April 2003 through current; Non-Executive Director & Chairman—Conseco, Inc. (insurance), September 2003 through current; Executive Chairman—Conseco, Inc. (insurance), August 2004 through September 2005; oversees 66; Director—Conseco, Inc. (insurance). | |
|
| John J. Nagorniak (Born 1944) | |
|
c/o Columbia Management
Advisors, LLC
One Financial Center
Boston, MA 02111
Trustee (since 2008)` | | Retired. President and Director—Foxstone Financial, Inc. (consulting), 2000 through December 2007; Director—Mellon Financial Corporation affiliates (investing), 2000 through 2007; Chairman—Franklin Portfolio Associates (investing—Mellon affiliate), 1982 through 2007; oversees 66; Director—MIT Investment Company; Trustee—MIT 401k Plan; Trustee and Chairman—Research Foundation of CFA Institute. | |
|
| Minor M. Shaw (Born 1947) | |
|
c/o Columbia Management Advisors, LLC
One Financial Center
Boston, MA 02111
Trustee (since 2003) | | President—Micco Corporation and Mickel Investment Group; oversees 66; Board Member—Piedmont Natural Gas. | |
|
67
Fund Governance (continued)
Interested Trustee
Name, Address and Age,
Position with Funds, Year First
Elected or Appointed to Office | | Principal Occupation(s) During Past Five Years, Number of Funds in the Columbia
Funds Complex Overseen by Trustee, Other Directorships Held
| |
| Anthony M. Santomero (Born 1946) | |
|
c/o Columbia Management Advisors, LLC
One Financial Center
Boston, MA 02111
Trustee1 (since 2008) | | Richard K. Mellon Professor Emeritus of Finance, The Wharton School, University of Pennsylvania, from 1972 through current; Senior Advisor—McKinsey & Company (consulting), July 2006 through December 2007; President and Chief Executive Officer—Federal Reserve Bank of Philadelphia, 2000 through April 2006; oversees 66; Director—Renaissance Reinsurance Ltd; Director—Penn Mutual Life Insurance Company; Director—Citigroup. | |
|
1 Mr. Santomero is currently deemed by the Columbia Funds to be an "interested person" (as defined in the 1940 Act) of the Funds because he serves as a Director of Citigroup, Inc. ("Citigroup"), a company that may through subsidiaries and affiliates engage from time-to-time in brokerage execution, principal transactions and lending relationships with the Columbia Funds or other funds or accounts advertised/managed by the Advisor.
The Statement of Additional Information includes additional information about the Trustees of the Funds and is available, without charge, upon request by calling 800-345-6611.
68
Fund Governance (continued)
Officers
Name, Address and Year of Birth,
Position with Columbia Funds,
Year First Elected or
Appointed to Office | | Principal Occupation(s) During Past Five Years
| |
| J. Kevin Connaughton (Born 1964) | |
|
One Financial Center
Boston, MA 02111
President (since 2009) | | Managing Director of Columbia Management Advisors, LLC since December 2004; Senior Vice President and Chief Financial Officer—Columbia Funds, from June 2008 to January 2009; Treasurer—Columbia Funds, from October 2003 to May 2008; Treasurer—the Liberty Funds, Stein Roe Funds and Liberty All-Star Funds, December 2000—December 2006; Senior Vice President—Columbia Management Advisors, LLC, from April 2003 to December 2004; President—Columbia Funds, Liberty Funds and Stein Roe Funds, February 2004 to October 2004; Treasurer—Galaxy Funds, September 2002 to December 2005; Treasurer, December 2002 to December 2004, and President, February 2004 to December 2004—Columbia Management Multi-Strategy Hedge Fund, LLC; and a senior officer of various other Bank of America-affiliated entities, including other registered and unregistered funds | |
|
| James R. Bordewick, Jr. (Born 1959) | |
|
One Financial Center
Boston, MA 02111
Senior Vice President, Secretary and Chief Legal Officer (since 2006) | | Associate General Counsel, Bank of America since April 2005; Senior Vice President and Associate General Counsel, MFS Investment Management (investment management) prior to April 2005. | |
|
| Linda J. Wondrack (Born 1964) | |
|
One Financial Center
Boston, MA 02111
Senior Vice President and
Chief Compliance Officer (since 2007) | | Director (Columbia Management Group LLC and Investment Product Group Compliance), Bank of America since June 2005; Director of Corporate Compliance and Conflicts Officer, MFS Investment Management (investment management), August 2004 to May 2005; Managing Director, Deutsche Asset Management (investment management) prior to August 2004. | |
|
| Michael G. Clarke (Born 1969) | |
|
One Financial Center
Boston, MA 02111
Senior Vice President and
Chief Financial Officer (since 2009) | | Director of Fund Administration of the Advisor since January 2006; Managing Director of the Advisor September 2004 to December 2005; Vice President Fund Administration June 2002 to September 2004. | |
|
| Jeffrey R. Coleman (Born 1969) | |
|
One Financial Center
Boston, MA 02111
Treasurer (since 2008) | | Director of Fund Administration of the Advisor since January 2006; Fund Controller of the Advisor from October 2004 to January 2006; Vice President of CDC IXIS Asset Management Services, Inc. (investment management) from August 2000 to September 2004. | |
|
| Joseph F. DiMaria (Born 1968) | |
|
One Financial Center
Boston, MA 02111
Chief Accounting Officer (since 2008) | | Director of Fund Administration of the Advisor since January 2006; Head of Tax/Compliance and Assistant Treasurer of the Advisor from November 2004 to December 2005; Director of Trustee Administration (Sarbanes-Oxley) of the Advisor from May 2003 to October 2004. | |
|
69
Fund Governance (continued)
Officers (continued)
Name, Address and Year of Birth,
Position with Columbia Funds,
Year First Elected or
Appointed to Office | | Principal Occupation(s) During Past Five Years
| |
| Julian Quero (Born 1967) | |
|
One Financial Center
Boston, MA 02111
Deputy Treasurer (since 2008) | | Senior Tax Manager of the Advisor since August 2006; Senior Compliance Manager of the Advisor from April 2002 to August 2006. | |
|
| Barry S. Vallan (Born 1969) | |
|
One Financial Center
Boston, MA 02111
Controller (since 2006) | | Vice President—Fund Treasury of the Advisor since October 2004; Vice President—Trustee Reporting of the Advisor from April 2002 to October 2004. | |
|
70
Board Consideration and Re-Approval of Investment Advisory and Sub-Advisory Agreements
The Board of Trustees of Columbia Funds Series Trust (the "Board"), including a majority of the Trustees who have no direct or indirect interest in the investment advisory agreement and are not "interested persons" of the Trust, as defined in the Investment Company Act of 1940 (the "1940 Act") (the "Independent Trustees"), are required annually to review and re-approve the existing investment advisory agreement and approve any newly proposed terms therein. In this regard, the Board reviewed and re-approved, during the most recent six months covered by this report, the investment advisory agreement with Columbia Management Advisors, LLC ("CMA") for the Columbia LifeGoal Growth Portfolio, Columbia LifeGoal Income Portfolio, Columbia LifeGoal Income and Growth Portfolio and Columbia LifeGoal Balanced Growth Portfolio. The investment advisory agreement with CMA is referred to as an "Advisory Agreement." The portfolios identified abo ve are each referred to as a "Portfolio" and collectively referred to as the "Portfolios."
More specifically, at meetings held on November 10-11, 2008, the Board, including the Independent Trustees advised by their independent legal counsel, considered the factors and reached the conclusions described below relating to the selection of CMA and the re-approval of the Advisory Agreement. The Board also reviewed and considered a report prepared and provided by the Independent Fee Consultant (the "Consultant") appointed by the Independent Trustees pursuant to an assurance of discontinuance entered into with the New York Attorney General ("NYAG") to settle a civil complaint filed by the NYAG relating to trading in mutual fund shares (the "NYAG Settlement"). During the fee review process, the Consultant's role was to manage the review process to ensure that fees are negotiated in a manner that is at arms' length and reasonable. The Consultant found that the fee negotiation process was, to the extent practicable, at arms' le ngth and reasonable and consistent with the requirements of the NYAG Settlement. A summary of the Consultant's report is available at www.columbiafunds.com.
In preparation for the November meetings, the Board met in August for review and discussion of the materials described below. The Investment Committee of the Board also met in June to discuss each Portfolio's performance with its respective portfolio manager(s). In addition to these meetings, the Investment Committee receives and discusses performance reports at its quarterly meetings. The Contracts Review Committee also provided support in managing and coordinating the process by which the Board reviewed the Advisory Agreement. The Board's review and conclusions are based on comprehensive consideration of all information presented to it and are not the result of any single controlling factor.
Nature, Extent and Quality of Services
The Board received and considered various data and information regarding the nature, extent and quality of services provided to the Portfolios by CMA under the Advisory Agreement. The most recent investment adviser registration form ("Form ADV") for CMA was made available to the Board, as were CMA's responses to a detailed series of requests submitted by the Independent Trustees' independent legal counsel on behalf of such Trustees. The Board reviewed and analyzed those materials, which included, among other things, information about the background and experience of senior management and investment personnel of CMA.
In addition, the Board considered the investment and legal compliance programs of the Portfolios and CMA, including their compliance policies and procedures and reports of the Portfolios' Chief Compliance Officer.
The Board evaluated the ability of CMA, based on its resources, reputation and other attributes, to attract and retain qualified investment professionals, including research, advisory and supervisory personnel. In this regard, the Board considered information regarding CMA's compensation program for its personnel involved in the management of the Portfolios. The Board also considered CMA's investment in further developing its research and trading departments.
Based on the above factors, together with those referenced below, the Board concluded that it was satisfied with the nature, extent and quality of the investment advisory services provided to each of the Portfolios by CMA.
71
Portfolio Performance and Expenses
The Board considered the performance results for each of the Portfolios over multiple measurement periods. It also considered these results in comparison to the performance results of the group of funds that was determined by Lipper Inc. ("Lipper") to be the most similar to a given Portfolio (the "Peer Group") and to the performance of a broader universe of relevant funds as determined by Lipper (the "Universe"), as well as to each Portfolio's benchmark index. Lipper is an independent provider of investment company data. The Board was provided with a description of the methodology used by Lipper to select the mutual funds in each Portfolio's Peer Group and Universe and considered potential imprecision resulting from the selection methodology. The Board also considered certain risk-adjusted performance data.
The Board received and considered statistical information regarding each Portfolio's total expense ratio and its various components, including contractual advisory fees, actual advisory fees, actual non-management fees, Rule 12b-1 and non-Rule 12b-1 service fees, fee waivers/caps and/or expense reimbursements. The Board also considered comparisons of these fees to the expense information for each Portfolio's Peer Group and Universe, which comparative data was provided by Lipper. For certain Portfolios, Lipper determined that the composition of the Peer Group and/or Universe for expenses would differ from the composition for performance to provide a more accurate basis of comparison. The Board also considered Lipper data that ranked each Portfolio based on: (i) each Portfolio's one-year performance compared to actual management fees; (ii) each Portfolio's one-year performance compared to total expenses; (iii) each Portfolio's thr ee-year performance compared to actual management fees; and (iv) each Portfolio's three-year performance compared to total expenses.
Investment Advisory Fee Rates
The Board reviewed and considered the proposed contractual investment advisory fee rates together with the administration fee rates payable by the Portfolios to CMA for investment advisory services (the "Contractual Management Rates"). In addition, the Board reviewed and considered the proposed fee waiver/cap arrangements applicable to the Contractual Management Rates and considered the Contractual Management Rates after taking the waivers/caps into account (the "Actual Management Rates"). The Board noted that, on a complex-wide basis, CMA had reduced annual management fees by at least $32 million per year pursuant to the NYAG Settlement. The Board also noted reductions in net advisory rates and/or total expenses of certain funds across the fund complex. Additionally, the Board received and afforded specific attention to information comparing the Contractual Management Rates and Actual Management Rates with those of the other funds in their respective Peer Groups.
For certain Portfolios highlighted as meeting agreed-upon criteria for warranting further review, the Board engaged in further analysis with regard to approval of the Portfolios' Advisory Agreement. The Board separately considered Columbia LifeGoal Income and Growth Portfolio because its Actual Management Rate was appreciably above the median range of its Peer Group and its performance over some periods was not appreciably above the median of its Peer Group. However, the Board noted other factors, such as total expenses that were below the median of its Peer Group and Universe and positive performance over other periods, that outweighed the factors noted above. The Board also separately considered Columbia LifeGoal Balanced Growth Portfolio because its Actual Management Rate was appreciably above the median range of its Peer Group and its performance over some periods was not appreciably above the median of its Peer Group. Howev er, the Board noted other factors, such as total expenses that were below the median of its Peer Group and Universe and positive performance over other periods, that outweighed the factors noted above.
The Board concluded that the factors noted above supported the Contractual Management Rates and the Actual Management Rates, and the approval of the Advisory Agreement for all of the Portfolios.
Profitability
The Board received and considered a detailed profitability analysis of CMA based on the Contractual Management Rates and the Actual Management Rates, as well as on other relationships between the Portfolios and other funds in the complex on the one hand and CMA affiliates on the other. The analysis included complex-wide and per-Portfolio information and a comparison of results using alternative allocation methodologies. The Board concluded that, in light of the costs of providing investment management and other services, the
72
profits and other ancillary benefits that CMA and its affiliates received from providing these services were not unreasonable.
Economies of Scale
The Board received and considered information regarding whether there have been economies of scale with respect to the management of the Portfolios, whether the Portfolios have appropriately benefited from any economies of scale and whether there is potential for realization of any further economies of scale. Most particularly, CMA provided information showing that, as a percentage of fund assets, CMA's complex-wide revenues, expenses and profits declined over a four-year period during which fund assets increased by 39% and the shareholder benefit over a two-year period increased from 33% to 41% of the Adviser's total profits. The Board concluded that any potential economies of scale are shared fairly with Portfolio shareholders, most particularly through CMA's assumption of certain Portfolio expenses.
The Board acknowledged the inherent limitations of any analysis of an investment adviser's economies of scale, stemming largely from the Board's understanding that economies of scale are realized, if at all, by an investment adviser across a variety of products and services, not just with respect to a single fund.
Information About Services to Other Clients
The Board also received and considered information about the nature and extent of services and fee rates offered by CMA to other clients, including separate accounts and institutional investors. In this regard, the Board concluded that, where the Contractual Management Rates and Actual Management Rates were appreciably above the range of the fee rates offered to other CMA clients, based on information provided by CMA, the costs associated with managing and operating a registered investment company provided a justification for the higher fee rates charged to the Portfolios.
Other Benefits to CMA
The Board received and considered information regarding any "fall-out" or ancillary benefits received by CMA and its affiliates as a result of their relationship with the Portfolios. Such benefits could include, among others, benefits attributable to CMA's relationships with the Portfolios (such as soft-dollar credits) and benefits potentially derived from an increase in CMA's business as a result of their relationship with the Portfolios (such as the ability to market to shareholders other financial products offered by CMA and its affiliates).
The Board considered the effectiveness of the policies of the Portfolios in achieving the best execution of portfolio transactions, whether and to what extent soft dollar credits are sought and how any such credits are utilized, any benefits that may be realized by using an affiliated broker, the extent to which efforts are made to recapture transaction costs, and the controls applicable to brokerage allocation procedures. The Board also reviewed CMA's methods for allocating portfolio investment opportunities among the Portfolios and other clients. The Board concluded that the benefits were not unreasonable.
Other Factors and Broader Review
As discussed above, the Board reviews materials received from CMA annually as part of the re-approval process under Section 15(c) of the 1940 Act. The Board also reviews and assesses the quality of the services the Portfolios receive throughout the year. In this regard, the Board and its Committees review a report of CMA at each of its quarterly meetings, which includes, among other things, Portfolio performance reports. In addition, the Board and its Committees confer with portfolio managers at various times throughout the year including, most particularly, in the June Investment Committee meeting.
Conclusion
After considering the above-described factors, based on their deliberations and their evaluation of the information provided, the Board concluded that the compensation payable to CMA under the Advisory Agreement is fair and equitable. Accordingly, the Board unanimously re-approved the Advisory Agreement.
73
Summary of Management Fee Evaluation by
Independent Fee Consultant
EXCERPTS FROM REPORT OF INDEPENDENT FEE CONSULTANT TO THE FUNDS SUPERVISED BY THE COLUMBIA NATIONS BOARD
Prepared pursuant to the February 9, 2005
Assurance of Discontinuance among the
Office of Attorney General of New York State,
Columbia Management Advisors, LLC and
Columbia Management Distributors, Inc.
November 12, 2008
I. Overview
On February 9, 2005, Columbia Management Advisors, LLC ("CMA") and Columbia Management Distributors, Inc.1 ("CMD") agreed to the New York Attorney General's Assurance of Discontinuance ("AOD"). Among other matters, the AOD stipulates that CMA may manage or advise a Columbia Fund ("Columbia Fund" and together with all such funds or a group of such funds as the "Columbia Funds") only if the Independent Members of the Columbia Fund's Board of Trustees appoint a Senior Officer or retain an Independent Fee Consultant ("IFC") who is to manage the process by which proposed management fees are negotiated. The AOD further stipulates that the Senior Officer or IFC is to prepare a written annual evaluation of the fee negotiation process.
With effect from January 1, 2007, the Independent Members of the Board of Trustees for certain Columbia Funds known collectively as the "Nations Funds" (the "Trustees") retained me as IFC for the Nations Funds.2 In this capacity, I have prepared the fourth annual written evaluation of the fee negotiation process. As was the case with last year's report (the "2007 Report") my immediate predecessor as IFC, John Rea, provided invaluable assistance in the preparation of this year's report.
A. Role of the Independent Fee Consultant
The AOD charges the IFC with "managing the process by which proposed management fees...to be charged the Columbia Fund are negotiated so that they are negotiated in a manner which is at arms' length and reasonable and consistent with this Assurance of Discontinuance." The AOD also provides that CMA "may manage or advise a Columbia Fund only if the reasonableness of the proposed management fees is determined by the Board of Trustees...using...an annual independent written evaluation prepared by or under the direction of...the Independent Fee Consultant." Therefore, the AOD makes clear that the IFC does not supplant the Trustees in negotiating management fees with CMA, nor does the IFC substitute his or her judgment for that of the Trustees with respect to the reasonableness of proposed fees or any other matter that is committed to the business judgment of the Trustees.
B. Elements Involved in Managing the Fee Negotiation Process
In preparing the report required by the AOD, the IFC must consider at least the following six factors set forth in the AOD:
1. The nature and quality of CMA's services, including the Fund's performance;
2. Management fees (including any components thereof) charged by other mutual fund companies for like services;
3. Possible economies of scale as the Fund grows larger;
4. Management fees (including any components thereof) charged to institutional and other clients of CMA for like services;
5. Costs to CMA and its affiliates of supplying services pursuant to the management fee agreements, excluding any intra-corporate profit; and
6. Profit margins of CMA and its affiliates from supplying such services.
C. Organization of the Annual Evaluation
This report, like last year's, focuses on the six factors and contains a section for each factor except that CMA's costs and profits from managing the Funds have been combined into a single section. In addition to a discussion of these factors, the report offers recommendations to improve the fee review process in future years. A review of the status of recommendations made in the 2007 Report is being provided separately with the materials for the November meeting.
1 CMA and CMD are subsidiaries of Columbia Management Group, LLC ("CMG"), and are the successors to the entities named in the AOD.
2 I have no material relationship with Bank of America, CMG or any of its affiliates, aside from serving as IFC, and I am aware of no material relationship with any of their affiliates. I retained John Rea, an independent economic consultant, to assist me with this report.
Unless otherwise stated or required by the context, this report covers only the Nations Funds, which are also referred as the "Funds."
74
II. Summary of Findings
A. General
1. Based upon my examination of the information supplied by CMG in the light of the six factors set forth in the AOD, I conclude that the Trustees have the relevant information necessary to evaluate the reasonableness of the proposed management fees for each Nations Fund.
2. In my view, the process by which the proposed management fees of the Funds have been negotiated in 2008 thus far has been, to the extent practicable, at arms' length and reasonable and consistent with the AOD.
B. Nature and Quality of Services, Including Performance
3. The performance of the Funds has been relatively good for the most recent 1-, 3- and 5-year periods. The strongest records were posted by the Funds in the Active Equity and Quantitative Strategies Groups and by the sub-advised Funds. The 5-year performance rankings of the subadvised Funds were particularly strong, with all such Funds in the top two performance quintiles.
4. The 1- and 3-year performance records of the Funds declined slightly from 2007 to 2008, while the 5-year performance records improved year-over-year. Most Funds changed their 1-year performance quintile year-over-year, while the 5-year rankings were, as expected, much more stable, with less than half the Funds moving to a different 5-year performance quintile.
5. The performance of the actively-managed equity and sub-advised Funds against their benchmarks was strong, especially for the 1- and 3-year performance periods. However, no fixed-income Fund with a reliable benchmark exceeded it on a net basis in any performance period. Money market Funds do not have such benchmarks and therefore were excluded from this analysis.
6. The Nations equity Funds' overall performance adjusted for risk was strong. The performance of 13 of the 19 actively-managed Funds included in the risk analysis bettered the median in 3-year performance adjusted and unadjusted for risk. No relationship between risk and return was detected for fixed-income Funds.
7. The industry-standard procedure used by third parties such as Lipper and Morningstar to construct the performance universe in which each Fund's performance is ranked relative to comparable funds tends to bias a Fund's ranking upward within that universe. The bias occurs because either no-12b-1-fee or A share classes of the Funds are compared to the performance universe that includes all share classes of competitive multi-class funds. Therefore, the procedure ranks shares with zero or 25 basis point 12b-1 fees against classes of competitive funds with 12b-1 fees of up to 100 basis points. Correcting this bias by limiting the performance universe to classes of competitive funds with comparable 12b-1 fees in most cases lowers the relative performance for the Funds but does not call into question the general finding that the Nations Funds' performance has been strong.
8. A small number of Funds have consistently underperformed their peers in each of the past four years, depending on the exact criteria used to measure long-term underperformance. For example, one Fund has had below-median 1- and 3-year performance in each of the past four years; one additional Fund had below-median 3-year performance for those years.
9. The services performed by CMG professionals beyond portfolio management, such as compliance, legal, information technology, risk management, finance and fund administration, are critical to the success of the Funds and appear to be of high quality.
C. Management Fees Charged by Other Mutual Fund Companies
10. The Funds' management fees and total expenses are generally low relative to those of their peers, with the exception of subadvised Funds. Almost two-third of the Funds ranked in the two least expensive quintiles for total expenses and just over half were in those quintiles for actual management fees. Funds with lower actual management fees tended to have lower relative total expenses. All fixed-income Funds had total expenses in the two least expensive quintiles.
11. Generally, the Nations Funds with the highest relative fees and expenses are sub-advised. All eight Nations Funds with fifth-quintile total expense rankings were sub-advised. The actual management fees of 11 of the 14 sub-advised
75
Funds were in the fourth and fifth quintile. The average management fees of the sub-advised Funds were typically 20 points higher than internally-managed equity Funds. CMA presented data suggesting that such differentials were consistent with industry practice.
12. The management fees of the internally-advised Nations Funds are generally in line with those of Columbia Funds overseen by the Atlantic and Acorn/Wanger Boards of Trustees.
D. Trustees' Fee and Performance Evaluation Process
13. The Trustees' evaluation process identified 20 Funds in 2008 for further review based upon their relative performance or expenses or both. When compared in filtered universes, three more Funds met the criteria for review.
E. Potential Economies of Scale
14. CMG has prepared a memo for the Trustees containing its views on the sources and sharing of potential economies of scale. CMG views economies of scale as arising at the complex level and would regard estimates of scale economies for individual funds as unreliable. In its analysis, CMG did not identify specific sources of economies of scale or provide any estimates of any economies of scale that might arise from future asset growth. CMG's analysis included measures taken by the Trustees and CMG that seek to share any potential economies of scale through breakpoints in management fee schedules, expense reimbursements, fee waivers, enhanced shareholder services, fund mergers, and operational consolidation.
15. An examination of the management fee schedules of a selected number of the Nations Funds suggests that, as a general matter, the breakpoint schedules of these Funds are not out of line with those of competitors. A similar examination of five other Nations Funds in 2007 led to the same conclusion.
F. Management Fees Charged to Institutional Clients
16. CMG has provided Trustees with comparisons of mutual fund management fees and institutional fees based upon standardized fee schedules and actual fees. The results show that, consistent with industry practice, institutional fees are generally lower than the Funds' management fees. However, because the services provided and risks borne by the manager are more extensive for mutual funds than for institutional accounts, the differences are of limited value in assisting the Trustees in their review of the reasonableness of the Funds' management fees.
G. Revenues, Expenses, and Profits
17. The activity-based cost allocation methodology ("ABC") employed by CMG to allocate costs for purposes of calculating Fund profitability, both direct and indirect, for purposes of calculating Fund profitability is thoughtful and detailed. For comparison, CMG proposed a change to the method by which indirect expenses were allocated. Under this "hybrid" method, such costs are allocated to Funds 50% by assets and 50% per fund. Allocating indirect expenses equally to each Fund has an intuitive logic, as each Fund regardless of size has certain expenses, such as preparing and printing prospectuses and financial statements.
18. The materials provided on CMG's revenues and expenses with respect to the Funds and the methodology underlying their construction generally form a sufficient basis for Trustees to evaluate CMG's expenses and profitability for each Fund.
19. In 2007, CMG's complex-wide pre-tax margins on the Nations Funds were close to the industry average before distribution and below average when distribution revenues and expenses were included, based on limited data available about publicly-held mutual fund managers. However, as is to be expected in a complex comprising 65 Funds, some Nations Funds have higher pre-tax profit margins, when calculated solely with respect to management revenues and expenses, while other Nations Funds operate at a loss. A pro forma analysis of the complex's profitability taking into account expenses incurred in 2008 associated with support of the money market funds sharply reduced the profitability of the Nations Funds. There is a positive relationship between fund size and profitability, with smaller Funds generally operating at a loss.
76
20. CMG shares a fixed percentage of its management fee revenues with an affiliate, U.S. Trust, Bank of America Private Wealth Management, to compensate that affiliate for services it performs with respect to Nations Fund assets held for the benefit of its customers. Based on our analysis of the services provided by the affiliate, we believe all such payments should be regarded as a distribution expense, except for any portion attributable to payments by CMG for performance of sub-transfer agency or sub-accounting functions.
III. Recommendations
1) Criteria for review. The Trustees may wish to consider modifying the criteria for classifying a fund as a "Review Fund" to include criteria that focus exclusively on performance without regard to expense or fee levels. For example, a Fund whose one-year or three-year performance was median or below for four consecutive years could be treated as a Review Fund. Applying such criteria would add two Funds to the list of Review Funds.
2) Profitability data. CMG should present to the Trustees each year the profitability of each Fund, each investment style, and each complex (of which Nations is one) calculated as follows:
Exhibit 1. Management-only profitability should be calculated without reference to any Private Bank expense.
Exhibit 2. Profitability excluding distribution (which essentially covers the management and transfer agency functions) should be adjusted by removing from the expense calculation any portion of the Private Bank payment not attributable to the performance by the Private Bank of sub-transfer agency or sub-accounting functions.
Exhibit 3. Total profitability, including distribution: No adjustment for Private Bank expenses should be made, because all such expenses represent legitimate fund expenses to be taken into account in calculating CMG's profit margin including distribution.
Exhibit 4. Distribution only: This should include all Private Bank expenses other than those attributable to sub-transfer agency services.
Therefore, the following data need not be provided:
1. Adjusting total profitability data for Private Bank expenses
2. Adjusting profitability excluding distribution by backing out all Private Bank expenses.
3) Economies of scale. CMG and the IFC should continue to work on methods for more precisely quantifying to the extent possible the sources and magnitude of any economies of scale as CMG's mutual fund assets under management increase, to the extent that the data allows for meaningful year-over-year comparisons. The framework suggested in Section IV.D.4 may prove to be a useful model for such an analysis.
4) Competitive breakpoint analysis. As part of the annual fee evaluation process, the breakpoints of a select group of Nations Funds (which would differ each year) should continue to be compared to those of industry rivals to ensure that the Funds' breakpoint schedules remain within industry norms. As breakpoint schedules change relatively little each year, performing such a comparison for all Funds each year would not be an efficient use of Trustee and CMG resources.
5) Cost allocation methodology. CMG's point that the current ABC system of allocating indirect expenses creates anomalous results in several cases, including sub-advised Funds, is well-taken. We would like to work with CMG over the forthcoming year on alternatives to the current system of allocating indirect expenses that (1) resolve the anomalies, (2) limit the amount of incremental effort on CMG's part and (3) remain faithful to the general principle that expenses should be allocated by time and effort to the extent reasonably possible.
6) Management fee disparities. CMG and the Nations Trustees, as part of any future study of management fees, should analyze any differences in management fee schedules between Funds managed in similar investment styles. As part of that analysis, CMG should provide an explanation for any significant fee differences among comparable funds
77
across fund families managed by CMA, such as differences in the management styles of different Funds included the same Lipper category. Finally, whenever CMG proposes a management fee change or an expense cap for any mutual fund managed by CMA that is comparable to any Nations Fund, CMG should provide the Trustees with sufficient information about the proposal to allow the Trustees to assess the applicability of the proposed change to the relevant Nations Fund or Funds.
7) Tax-exempt Fund expense data. The expense rankings of certain tax-exempt Funds were adversely affected by including certain investment-related interest expenses that Lipper excluded in calculating the expense ratios of competitors. We recommend that CMG follow the Lipper practice and exclude such interest expenses from data submitted to Lipper to avoid unfairly disadvantaging the tax-exempt Funds.
8) Reduction of volume of paper documents submitted. The effort to rationalize and simplify the data presented to the Trustees and the process by which that data was prepared and organized was regarded as a success by all parties. We should continue to look for opportunities to reduce and simplify the presentation of 15(c) data, especially in the area of Fund and manager profitability. The Fund "Dashboard" volume presents a large volume of Fund data on a single page. If it is continued, the Trustees may wish to consider receiving the underlying Lipper data on CD, rather than the current paper volumes.
* * *
Respectfully submitted,
Steven E. Asher
78
This page intentionally left blank.
This page intentionally left blank.
Important Information About This Report
The portfolios mail one shareholder report to each shareholder address. If you would like more than one report, please call shareholder services at 1-800-345-6611 and additional reports will be sent to you. This report has been prepared for shareholders of the Columbia LifeGoal Portfolios.
A description of the policies and procedures that each portfolio uses to determine how to vote proxies and a copy of each portfolio's voting records are available (i) at www.columbiamanagement.com; (ii) on the Securities and Exchange Commission's website at www.sec.gov, and (iii) without charge, upon request, by calling 1-800-368-0346. Information regarding how each portfolio voted proxies relating to portfolio securities during the 12-month period ended June 30 is available from the SEC's website. Information regarding how each portfolio voted proxies relating to portfolio securities is also available from the portfolios' website, columbiamanagement.com.
Each portfolio files a complete schedule of portfolio holdings with the SEC for the first and third quarters of each fiscal year on Form N-Q. Each portfolio's Form N-Q is available on the SEC's website at www.sec.gov and may be reviewed and copied at the SEC's Public Reference Room in Washington, DC. Information on the operation of the Public Reference Room may be obtained by calling 1-800-SEC-0330.
Please read and consider the investment objectives, risks, charges and expenses for any portfolio carefully before investing. For a prospectus which contains this and other important information about the portfolios, contact your Columbia Management representative or financial advisor or go to www.columbiamanagement.com.
Columbia Management Advisors, LLC (CMA) or one of its affiliates is the investment advisor to the portfolios and each underlying fund. As such, CMA is responsible for the overall management and supervision of the investment activities of each portfolio and each underlying fund.
Investment in affiliated funds—The advisor has the authority to select Underlying Funds. The advisor or one of its affiliates is the investment advisor to each of the Underlying Funds. The advisor may be subject to a conflict of interest in selecting Underlying Funds because the fees paid to it or its affiliates are higher than the fees paid to other Underlying Funds. However, as fiduciary to each portfolio, the advisor has a duty to act in the best interest of the portfolio in selecting Underlying Funds.
Columbia Management Group, LLC ("Columbia Management") is the investment management division of Bank of America Corporation. Columbia Management entities furnish investment management services and products for institutional and individual investors. Columbia Funds are distributed by Columbia Management Distributors, Inc., member of FINRA, SIPC, part of Columbia Management and an affiliate of Bank of America Corporation.
| Transfer Agent | |
|
Columbia Management Services, Inc.
P.O. Box 8081
Boston, MA 02266-8081
1-800-345-6611 | |
|
| Distributor | |
|
Columbia Management
Distributors, Inc.
One Financial Center
Boston, MA 02111 | |
|
| Investment Advisor | |
|
Columbia Management Advisors, LLC
100 Federal Street
Boston, MA 02110 | |
|
81
Columbia Management®
One Financial Center
Boston, MA 02111-2621
PRSRT STD
U.S. Postage
PAID
Holliston, MA
Permit NO. 20
Columbia Management®
Columbia LifeGoalTM Portfolios
Annual Report, March 31, 2009
©2009 Columbia Management Distributors, Inc.
One Financial Center, Boston, MA 02111-2621
800-345-6611 www.columbiafunds.com
SHC-42/10639-0309 (05/09) 09/78782
Columbia Management®
Annual Report
March 31, 2009
Municipal Bond Funds
g Columbia Short Term Municipal Bond Fund
g Columbia California Intermediate Municipal Bond Fund
g Columbia Georgia Intermediate Municipal Bond Fund
g Columbia Maryland Intermediate Municipal Bond Fund
g Columbia North Carolina Intermediate Municipal Bond Fund
g Columbia South Carolina Intermediate Municipal Bond Fund
g Columbia Virginia Intermediate Municipal Bond Fund
| NOT FDIC INSURED | | May Lose Value | |
|
| NOT BANK ISSUED | | No Bank Guarantee | |
|
Table of Contents
| Economic Update | | | 1 | | |
|
Columbia Short Term Municipal
Bond Fund | | | 3 | | |
|
Columbia California Intermediate
Municipal Bond Fund | | | 8 | | |
|
Columbia Georgia Intermediate
Municipal Bond Fund | | | 13 | | |
|
Columbia Maryland Intermediate
Municipal Bond Fund | | | 18 | | |
|
Columbia North Carolina Intermediate
Municipal Bond Fund | | | 23 | | |
|
Columbia South Carolina Intermediate
Municipal Bond Fund | | | 28 | | |
|
Columbia Virginia Intermediate
Municipal Bond Fund | | | 33 | | |
|
| Financial Statements | | | | | |
|
| Investment Portfolios | | | 38 | | |
|
Statements of Assets and
Liabilities | | | 86 | | |
|
| Statements of Operations | | | 90 | | |
|
Statements of Changes in
Net Assets | | | 92 | | |
|
| Financial Highlights | | | 101 | | |
|
| Notes to Financial Statements | | | 129 | | |
|
Report of Independent Registered
Public Accounting Firm | | | 143 | | |
|
| Federal Income Tax Information | | | 144 | | |
|
| Fund Governance | | | 145 | | |
|
Board Consideration and
Re-Approval of Investment
Advisory Agreement | | | 149 | | |
|
Summary of Management Fee
Evaluation by Independent Fee
Consultant | | | 152 | | |
|
Important Information About
This Report | | | 157 | | |
|
The views expressed in this report reflect the current views of the respective parties. These views are not guarantees of future performance and involve certain risks, uncertainties and assumptions that are difficult to predict, so actual outcomes and results may differ significantly from the views expressed. These views are subject to change at any time based upon economic, market or other conditions and the respective parties disclaim any responsibility to update such views. These views may not be relied on as investment advice and, because investment decisions for a Columbia Fund are based on numerous factors, may not be relied on as an indication of trading intent on behalf of any particular Columbia Fund. References to specific securities should not be construed as a recommendation or investment advice.
President's Message

Dear Shareholder:
Recent events have shown great volatility in the markets and uncertainty in the economy. During these challenging times, it becomes even more important to focus on long-term horizons and key investment tools that can help manage volatility. This may be the time to reflect on your investment goals and evaluate your portfolio to ensure you are positioned for any potential market rebound.
A long-term financial plan can serve as a road map and guide you through the necessary steps designed to meet your financial goals. Your financial plan should take into account your investment goals, time horizon, overall financial situation, risk tolerance and willingness to ride out market volatility. Your investment professional can be a key resource as you work through this process. The knowledge and experience of an investment professional can help as you create or reevaluate your investment strategy.
The importance of diversification
Although diversification does not ensure a profit or guarantee against loss, a diversified portfolio can be a strategy for successful long-term investing. Diversification refers to the mix of investments within a portfolio. A mutual fund can contribute to portfolio diversification given that a mutual fund's portfolio represents several investments. Additionally, the way you allocate your money among stocks, bonds and cash, and geographically between foreign and domestic investments, can help to reduce risks. Diversification can result in multiple investments where the positive performance of certain holdings can offset any negative performance from other holdings. Having a diversified portfolio doesn't mean that the value of the portfolio will never go down, but rather helps strike a balance between risk and reward.
Reevaluate your strategy
An annual review of your investments is a key opportunity to determine if your investment needs have changed or if you need minor adjustments to rebalance your portfolio. Life events like a birth, marriage, home improvement, or change in employment can have a major affect on your spending and goals. Ask yourself how your spending or goals have changed and factor this into your financial plan. Are you using automated investments or payroll deductions to help keep your savings on track? Are you able to set aside additional savings or increase your 401(k) plan contributions? If during your review you find that your investments in any one category (e.g., stocks, bonds or cash) have grown too large based on your diversification plan, you may want to consider redirecting future investments to get back on track.
History has shown that the U.S. stock market has been remarkably resilient1. Volatility can lead to opportunity. Patience and a commitment to your long-term financial plan may position you to potentially benefit over your investment horizon. We appreciate your business and continued support of Columbia Funds.
Sincerely,

J. Kevin Connaughton
President, Columbia Funds
The board of trustees elected J. Kevin Connaughton president of Columbia Funds on January 16, 2009.
1The Dow Jones Industrial Average is the most widely used indicator of the overall condition of the stock market. The Dow Jones Industrial Average Index is a price-weighted average of 30 actively traded blue-chip stocks as selected by the editors of the Wall Street Journal. Indices are not investments, do not incur fees or expenses and are not professionally managed. It is not possible to invest directly in an index.
Economic Update – Municipal Bond Funds
Economic growth ground to a halt during the 12-month period that began April 1, 2008 and ended March 31, 2009. The National Bureau of Economic Research reported that the U.S. economy had slipped into recession late in 2007 and the downturn was even sharper than anticipated.
A host of factors weighed on consumers and businesses alike. The most severe housing downturn in decades showed few signs of abating as inventories of homes for sale rose, home prices declined and tighter credit standards, the result of continued turmoil in the subprime mortgage market, made it more difficult for homebuyers to qualify for loans.
The labor market has contracted for 15 consecutive months, driving the unemployment rate to 8.5%. More than five million jobs have been lost since the recession commenced late in 2007, with nearly two-thirds of the decrease occurring in the most recent five months. Manufacturing activity slowed and consumer spending declined, resulting in one of the weakest holiday seasons in decades.
However, in March there were a few signs that this severe recession is no longer intensifying. Weekly chain store sales and mortgage purchase applications gained some momentum near the end of the period. The trade deficit has narrowed more than expected, raising hopes that first quarter real Gross Domestic Product (GDP) would contract at a rate well below the fourth quarter's negative 6.3%.
A weakening economy and turmoil in the financial markets took a toll on consumer confidence, which continued to set new all-time lows during the period. However, the monthly Conference Board gauge was nearly unchanged in March, another indication that the worst could be behind us. Consumer confidence is surveyed monthly by The Conference Board.
In an effort to restore confidence in the capital markets, loosen the reins on credit and stimulate economic growth, the Federal Reserve Board (the Fed) brought a key short-term rate—the federal funds rate—down from 2.25% to a target between zero and 0.25% during the 12-month period—a record low. However, the Fed's efforts went largely unrewarded. The one bright spot during this period of uncertainty was lower energy and commodity prices. With oil trading near $50 per barrel at the end of the period, gasoline prices have come down from $4 per gallon or more last summer to just over $2 per gallon in recent months.
Some bond market segments delivered positive returns
The U.S. bond market seesawed during the 12-month period, but several sectors managed to deliver modest gains as investors sought refuge from the volatile stock market. Treasury prices rose and yields declined as the economy faltered and stock
Summary
For the 12-month period that ended March 31, 2009
g Despite volatility in many segments of the bond market, the Barclays Capital U.S. Aggregate Bond Index delivered a modest gain. High-yield bonds lost ground, as measured by the Merrill Lynch U.S. High Yield, Cash Pay Index. Municipals recovered from an early setback, as measured by the Barclays Capital Municipal Bond Index.
Barclays
Aggregate Index | | Merrill
Lynch Index | |
|
 | |  | |
|
Barclays
Municipal Index | | | |
|
 | | | |
|
g The broad U.S. stock market, as measured by the S&P 500 Index, returned negative 38.09%. Developed stock markets outside the United States returned negative 46.51%, as measured (in U.S. dollars) by the MSCI EAFE Index.
| S&P Index | | MSCI Index | |
|
 | |  | |
|
The Standard & Poor's (S&P) 500 Index tracks the performance of 500 widely held, large-capitalization U.S. stocks.
The Morgan Stanley Capital International (MSCI) Europe, Australasia, Far East (EAFE) Index is a free float-adjusted market capitalization index that is designed to measure developed market equity performance excluding the U.S. and Canada.
Indices are not available for investment, and do not reflect sales charges, fees, brokerage commissions, taxes or other expenses of investing. Securities in the fund may not match those in an index.
1
Economic Update (continued) – Municipal Bond Funds
market volatility increased. The benchmark 10-year U.S. Treasury yield ended the period at 2.70%. In this environment, the Barclays Capital U.S. Aggregate Bond Index (formerly the Lehman Brothers U.S. Aggregate Bond Index)1 returned 3.13%. High-yield bond prices fell sharply as economic prospects weakened and default fears rose. The Merrill Lynch U.S. High Yield, Cash Pay Index2 returned negative 19.95%. The municipal market suffered a setback early in 2008, then rebounded in the first quarter of 2009. The Barclays Capital Municipal Bond Index (formerly the Lehman Brothers Municipal Bond Index)3 returned 2.27% for the 12-month period.
Stocks retreat as economic outlook darkens
Against a weakening economic backdrop, the U.S. stock market lost 38.09% for the 12-month period, as measured by the S&P 500 Index.4 Losses affected the stocks of companies of all sizes and investment style categories, although growth stocks held up better than value stocks, as measured by their respective Russell indices.5 Stock markets outside the U.S. suffered even greater losses. The MSCI EAFE Index,6 a broad gauge of stock market performance in foreign developed markets, lost 46.51% (in U.S. dollars) for the period. Emerging stock markets, which generally have had a strong run over the past several years, were also caught in the downdraft. As investors backed away from risk, the MSCI Emerging Markets Index7 returned negative 47.07% (in U.S. dollars).
Past performance is no guarantee of future results.
1The Barclays Capital U.S. Aggregate Bond Index is a market value-weighted index that tracks the daily price, coupon, pay-downs and total return performance of fixed-rate, publicly placed, dollar-denominated and non-convertible investment-grade debt issues with at least $250 million par amount outstanding and with at least one year to final maturity.
2The Merrill Lynch U.S. High Yield, Cash Pay Index tracks the performance of non-investment-grade corporate bonds. As of 01/01/2009, Merrill Lynch & Co., Inc. is a wholly owned subsidiary of Bank of America Corporation and an affiliate of Columbia Management.
3The Barclays Capital Municipal Bond Index is considered representative of the broad market for investment-grade, tax-exempt bonds with maturities of at least one year.
4The Standard & Poor's (S&P) 500 Index tracks the performance of 500 widely held, large-capitalization U.S. stocks.
5The Russell 1000 Growth Index measures the performance of those Russell 1000 Index companies with higher price-to-book ratios and higher forecasted growth values. The Russell 1000 Value Index measures the performance of those companies in the Russell 1000 Index with lower price-to-book ratios and lower forecasted growth values. The Russell 2000 Growth Index measures the performance of those Russell 2000 Index companies with higher price-to-book ratios and higher forecasted growth values. The Russell 2000 Value Index measures the performance of those Russell 2000 Index companies with lower price-to-book ratios and lower forecasted growth values. The Russell 3000 Growth Index measures the performance of those Russell 3000 Index companies with higher price-to-book ratios and higher forecasted growth values. The Russell 3000 Value Index measures the performance of those Russell 3000 Index companies with lower price-to-bo ok ratios and lower forecasted growth values. The Russell Midcap Growth Index measures the performance of those Russell Midcap companies with higher price-to-book ratios and higher forecasted growth values. The Russell Midcap Value Index measures the performance of those Russell Midcap Index companies with lower price-to-book ratios and lower forecasted growth values.
6The Morgan Stanley Capital International (MSCI) Europe, Australasia, Far East (EAFE) Index is a free float-adjusted market capitalization index that is designed to measure developed market equity performance excluding the U.S. and Canada.
7The MSCI Emerging Markets Index is a widely accepted index composed of a sample of companies from 25 countries representing the global emerging stock markets.
Indices are not available for investment, and do not reflect sales charges, fees, brokerage commissions, taxes or other expenses of investing. Securities in the fund may not match those in an index.
2
Fund Profile – Columbia Short Term Municipal Bond Fund
Summary
g For the 12-month period that ended March 31, 2009, the fund's Class A shares returned 4.14% without sales charge.
g The fund underperformed its benchmark, the Merrill Lynch 1-3 Year U.S. Municipal Index,1 which return 4.75%, but outperformed its peer group.
g The fund's interest rate calls, positioning and high credit quality aided its return relative to its peers. Fees accounted for much of the underperformance compared to the benchmark.
Portfolio Management
James M. D'Arcy has managed the fund since 2007 and has been with the advisor or its predecessors or affiliate organizations since 1999.
1The Merrill Lynch 1-3 Year U.S. Municipal Index tracks the performance of investment-grade U.S. tax-exempt bonds with remaining terms to final maturities of at least one year and less than three years.
Indices are not available for investment, and do not reflect sales charges, fees, brokerage commissions, taxes or other expenses of investing. Securities in the fund may not match those in an index.
Performance data quoted represents past performance and current performance may be lower or higher. Past performance is no guarantee of future results. The investment return and principal value will fluctuate so that shares, when redeemed, may be worth more or less than the original cost. Please visit www.columbiafunds.com for daily and most recent month-end performance updates.
Summary
1-year return as of 03/31/09
| | +4.14% | |
|
| |  | | | Class A shares
(without sales charge) | |
|
| | +4.75% | |
|
| |  | | | Merrill Lynch 1-3 Year
U.S. Municipal Index | |
|
Morningstar Style BoxTM
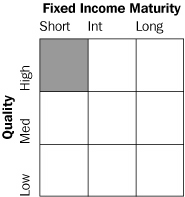
The Morningstar Style BoxTM reveals a fund's investment strategy. For fixed-income funds, the vertical axis shows the average credit quality of the bonds owned and the horizontal axis shows interest rate sensitivity as measured by a bond's duration (short, intermediate or long). Information shown is based on the most recent data provided by Morningstar.
3
Performance Information – Columbia Short Term Municipal Bond Fund
Performance data quoted represents past performance and current performance may be lower or higher. Past performance is no guarantee of future results. The investment return and principal value will fluctuate so that shares, when redeemed, may be worth more or less than the original cost. Please visit www.columbiafunds.com for daily and most recent month-end performance updates.
Annual operating expense ratio (%)*
| Class A | | | 0.76 | | |
| Class B | | | 1.51 | | |
| Class C | | | 1.51 | | |
| Class Z | | | 0.51 | | |
Annual operating expense ratio
after contractual waivers (%)*
| Class A | | | 0.65 | | |
| Class B | | | 1.40 | | |
| Class C | | | 1.40 | | |
| Class Z | | | 0.40 | | |
*The annual operating expense ratio and annual operating expense ratio after contractual waivers are as stated in the fund's prospectus that is current as of the date of this report and include the expenses incurred by the investment companies in which the fund invests. The contractual waiver expires 07/31/09. Differences in expense ratios disclosed elsewhere in this report may result from including expenses incurred by the investment companies, fee waivers and expense reimbursements as well as different time periods used in calculating the ratios.
Performance of a $10,000 investment 04/01/99 – 03/31/09 ($)
The chart above shows the change in value of a hypothetical $10,000 investment in Class A shares of Columbia Short Term Municipal Bond Fund during the stated time period, and does not reflect the deduction of taxes that a shareholder may pay on fund distributions or on the redemption of fund shares. The Merrill Lynch 1-3 Year U.S. Municipal Index tracks the performance of investment-grade U.S. tax-exempt bonds with remaining terms to final maturities of at least one year and less than three years. Indices are not available for investment, and do not reflect sales charges, fees, brokerage commissions, taxes or other expenses of investing. Securities in the fund may not match those in an index.
Performance of a $10,000 investment 04/01/99 – 03/31/09 ($)
| Sales charge | | without | | with | |
| Class A | | | 13,819 | | | | 13,683 | | |
| Class B | | | 12,878 | | | n/a | |
| Class C | | | 12,815 | | | | 12,815 | | |
| Class Z | | | 14,166 | | | n/a | |
Average annual total return as of 03/31/09 (%)
| Share class | | A | | B | | C | | Z | |
| Inception | | 11/02/93 | | 10/12/93 | | 05/19/94 | | 10/07/93 | |
| Sales charge | | without | | with | | without | | without | | with | | without | |
| 1-year | | | 4.14 | | | | 3.14 | | | | 3.37 | | | | 3.37 | | | | 2.37 | | | | 4.41 | | |
| 5-year | | | 2.78 | | | | 2.56 | | | | 2.01 | | | | 2.01 | | | | 2.01 | | | | 3.04 | | |
| 10-year | | | 3.29 | | | | 3.19 | | | | 2.56 | | | | 2.51 | | | | 2.51 | | | | 3.54 | | |
The "with sales charge" returns include the maximum initial sales charge of 1.00% for Class A shares and the applicable contingent deferred sales charge of 1.00% for Class C shares in the first year after purchase. The "without sales charge" returns do not include the effect of sales charges. If they had, returns would be lower.
Performance results reflect any fee waivers or reimbursements of fund expenses by the investment advisor and/or any of its affiliates. Absent these fee waivers or expense reimbursement arrangements, performance results would have been lower.
All results shown assume the reinvestment of distributions. Class Z shares are sold at net asset value with no distribution and service (Rule 12b-1) fees. Class Z shares have limited eligibility and the investment minimum requirements may vary. Please see the fund's prospectus for details. Performance for different share classes will vary based on differences in sales charges and fees associated with each class.
The table does not reflect the deduction of taxes that a shareholder may pay on fund distributions or on the redemption of fund shares.
4
Understanding Your Expenses – Columbia Short Term Municipal Bond Fund
As a fund shareholder, you incur two types of costs. There are transaction costs, which generally include sales charges on purchases and may include redemption fees or exchange fees. There are also ongoing costs, which generally include investment advisory fees, distribution and service (Rule 12b-1) fees and other fund expenses. The information on this page is intended to help you understand the ongoing costs of investing in the fund and to compare these costs with the ongoing costs of investing in other mutual funds.
Analyzing your fund's expenses by share class
To illustrate these ongoing costs, we have provided an example and calculated the expenses paid by investors in each share class during the period. The information in the following table is based on an initial investment of $1,000, which is invested at the beginning of the period and held for the entire period. Expense information is calculated two ways and each method provides you with different information. The amount listed in the "Actual" column is calculated using the fund's actual operating expenses and total return for the period. The amount listed in the "Hypothetical" column for each share class assumes that the return each year is 5% before expenses and is calculated based on the fund's actual operating expenses. You should not use the hypothetical account values and expenses to estimate either your actual account balance at the end of the period or the expenses you paid during this period.
Compare with other funds
Since all mutual funds are required to include the same hypothetical calculations about expenses in shareholder reports, you can use this information to compare the ongoing cost of investing in the fund with other funds. To do so, compare the 5% hypothetical example with the 5% hypothetical examples that appear in the shareholder reports of other funds. As you compare hypothetical examples of other funds, it is important to note that hypothetical examples are meant to highlight the ongoing costs of investing in a fund and do not reflect any transaction costs, such as sales charges, redemption fees or exchange fees.
Estimating your actual expenses
To estimate the expenses that you paid over the period, first you will need your account balance at the end of the period:
g For shareholders who receive their account statements from Columbia Management Services, Inc., your account balance is available online at www.columbiafunds.com or by calling Shareholder Services at 800.345.6611.
g For shareholders who receive their account statements from their financial intermediary, contact your financial intermediary to obtain your account balance.
1. Divide your ending account balance by $1,000. For example, if an account balance was $8,600 at the end of the period, the result would be 8.6.
2. In the section of the table below titled "Expenses paid during the period," locate the amount for your share class. You will find this number in the column labeled "Actual." Multiply this number by the result from step 1. Your answer is an estimate of the expenses you paid on your account during the period.
If the value of your account falls below the minimum initial investment requirement applicable to you, your account generally will be subject to a $20 annual fee. This fee is not included in the accompanying table. If you are subject to the fee, keep it in mind when you are estimating the ongoing expenses of investing in the fund and when comparing the expenses of this fund with other funds.
10/01/08 – 03/31/09
| | | Account value at the
beginning of the period ($) | | Account value at the
end of the period ($) | | Expenses paid
during the period ($) | | Fund's annualized
expense ratio (%) | |
| | | Actual | | Hypothetical | | Actual | | Hypothetical | | Actual | | Hypothetical | | Actual | |
| Class A | | | 1,000.00 | | | | 1,000.00 | | | | 1,036.00 | | | | 1,021.69 | | | | 3.30 | | | | 3.28 | | | | 0.65 | | |
| Class B | | | 1,000.00 | | | | 1,000.00 | | | | 1,032.11 | | | | 1,017.95 | | | | 7.09 | | | | 7.04 | | | | 1.40 | | |
| Class C | | | 1,000.00 | | | | 1,000.00 | | | | 1,032.11 | | | | 1,017.95 | | | | 7.09 | | | | 7.04 | | | | 1.40 | | |
| Class Z | | | 1,000.00 | | | | 1,000.00 | | | | 1,037.30 | | | | 1,022.94 | | | | 2.03 | | | | 2.02 | | | | 0.40 | | |
Expenses paid during the period are equal to the annualized expense ratio for the share class, multiplied by the average account value over the period, then multiplied by the number of days in the fund's most recent fiscal half-year and divided by 365.
Had the investment advisor and/or any of its affiliates not waived fees or reimbursed a portion of expenses, account value at the end of the period would have been reduced.
It is important to note that the expense amounts shown in the table are meant to highlight only ongoing costs of investing in the fund and do not reflect any transaction costs, such as sales charges, redemption fees or exchange fees. Therefore, the hypothetical examples provided may not help you determine the relative total costs of owning shares of different funds. If these transaction costs were included, your costs would have been higher.
5
Portfolio Manager's Report – Columbia Short Term Municipal Bond Fund
Performance data quoted represents past performance and current performance may be lower or higher. Past performance is no guarantee of future results. The investment return and principal value will fluctuate so that shares, when redeemed, may be worth more or less than the original cost. Please visit www.columbiafunds.com for daily and most recent month-end performance updates.
Net asset value per share
as of 03/31/09 ($)
| Class A | | | 10.46 | | |
| Class B | | | 10.46 | | |
| Class C | | | 10.46 | | |
| Class Z | | | 10.46 | | |
Distributions declared per share
04/01/08 – 03/31/09 ($)
| Class A | | | 0.28 | | |
| Class B | | | 0.20 | | |
| Class C | | | 0.20 | | |
| Class Z | | | 0.31 | | |
A portion of the fund's income may be subject to the alternative minimum tax. The fund may at times purchase tax-exempt securities at a discount. Some, or all, of this discount may be included in the fund's ordinary income, and is taxable when distributed.
30-day SEC yields
as of 03/31/09 (%)
| Class A | | | 1.38 | | |
| Class B | | | 0.67 | | |
| Class C | | | 0.65 | | |
| Class Z | | | 1.65 | | |
The 30-day SEC yields reflect the fund's earning power, net of expenses, expressed as an annualized percentage of the public offering price per share at the end of the period.
Taxable-equivalent SEC yields
as of 03/31/09 (%)
| Class A | | | 2.13 | | |
| Class B | | | 1.03 | | |
| Class C | | | 1.00 | | |
| Class Z | | | 2.55 | | |
Taxable-equivalent SEC yields are based on the combined maximum effective 35.0% federal income tax rate. This tax rate does not reflect the phase out of exemptions or the reduction of the otherwise allowable deductions that occur when adjusted gross income exceeds certain levels.
For the 12-month period that ended March 31, 2009, the fund's Class A shares returned 4.14% without sales charge. The fund's benchmark, the Merrill Lynch 1-3 Year U.S. Municipal Index,1 returned 4.75%. The average return of its peer group, the Lipper Short Municipal Debt Funds Classification,2 was 1.40%. The fund had less exposure than the benchmark to prerefunded bonds, which performed well during the period. Pre-refunded bonds put an amount equal to their principal and interest aside in escrow to ensure that future payments are made regardless of the revenue streams or tax collections of the original issuing municipality. Fees also contributed to the modest shortfall relative to the benchmark. The fund incurs fees which the index does not. Positioning and accurate interest rate calls over the period helped performance compared to both the benchmark and peer group. We also believe the fund had a higher quality portfolio than many of its peers, which aided performance.
High quality focus
During the period, the yield difference between bonds with different credit quality but similar maturities widened to historic levels, and interest rate volatility rose because stress in the financial markets reduced liquidity. Against this backdrop, the fund benefited relative to its benchmark because it had less exposure to single-A rated bonds, which struggled in this environment. The fund's focus on high credit quality also aided performance against competing funds that had more single A, BBB, and non-investment grade credits.
The fund's focus on high quality also extended to insured bonds, where we are no longer willing to pay extra (by way of a lower yield) for the insurance protection. We continue to examine the fundamental merits of insured bonds, which has become even more important in the aftermath of last year's crisis of confidence surrounding bond insurers. We are currently making our investment decisions without regard to whether or not a bond is insured.
Sector weights delivered mixed results
We did well to underweight both California and New York issues, both of which underperformed for the period. An underweight relative to its peers in health care also worked to the fund's advantage as yields rose and prices fell dramatically in this sector. However, the fund was overweight in health care compared to its benchmark, which hurt relative performance as did an overweight in Florida securities, as declining home prices and a slowing economy hampered their returns. However, we continue to believe that the fund's Florida holdings are strong credits.
1The Merrill Lynch 1-3 Year U.S. Municipal Index tracks the performance of investment-grade U.S. tax-exempt bonds with remaining terms to final maturities of at least one year and less than three years.
As of 01/01/09, Merrill Lynch & Co., Inc. is a wholly-owned subsidiary of Bank of America Corporation and an affiliate of Columbia Management.
Indices are not available for investment, and do not reflect sales charges, fees, brokerage commissions, taxes or other expenses of investing. Securities in the fund may not match those in an index.
2Lipper Inc., a widely respected data provider in the industry, calculates an average total return (assuming reinvestment of distributions) for mutual funds with investment objectives similar to those of the fund. Lipper makes no adjustment for the effect of sales loads.
6
Portfolio Manager's Report (continued) – Columbia Short Term Municipal Bond Fund
Positioned for rising interest rates, higher defaults
We have positioned the fund with the following goals in mind: 1) to keep volatility low while still providing a competitive return, 2) to take advantage of the current interest rate environment while being mindful that interest rates are likely to rise eventually and 3) to be defensive in the face of declining credit quality in the municipal sector—in light of a slowing economy—while seeking to take advantage of the historically wide difference in yields between bonds of differing credit quality. In this regard, we have focused on AA and single-A bonds, because they offer enhanced yields compared to pre-refunded bonds and AAA-rated bonds. We expect the default ratio to rise in the current environment, but mostly for credits with a rating of BBB or lower. The current environment offers the opportunity for our analysts to try to identify bonds whose ratings might be upgraded from stable to positive, which would lead to e nhanced returns, but to avoid taking risks on credits that might move downward, from stable to negative.
Portfolio holdings and characteristics are subject to change periodically and may not be representative of current holdings and characteristics. The outlook for the fund may differ from those presented for other Columbia Funds.
Tax-exempt investing offers current tax-exempt income, but it also involves certain risks. The value of the fund will be affected by interest rate changes and the creditworthiness of issues held in the fund. When interest rates go up, bond prices generally drop and vice versa.
Interest income from certain tax-exempt bonds may be subject to certain state and local taxes and, if applicable, the alternative minimum tax. Capital gains are not exempt from income taxes.
Top 5 sectors
as of 03/31/09 (%)
| Tax-Backed | | | 33.9 | | |
| Transportation | | | 13.6 | | |
| Other | | | 12.2 | | |
| Utilities | | | 10.5 | | |
| Health Care | | | 5.4 | | |
Quality breakdown
as of 03/31/09 (%)
| AAA | | | 24.1 | | |
| AA | | | 59.7 | | |
| A | | | 11.4 | | |
| BBB | | | 3.0 | | |
| Other | | | 1.6 | | |
| Cash and equivalents | | | 0.2 | | |
Effective Maturity breakdown
as of 03/31/09 (%)
| 0-1 year | | | 28.5 | | |
| 1-2 years | | | 30.6 | | |
| 2-3 years | | | 29.0 | | |
| 3-4 years | | | 9.5 | | |
| 4-5 years | | | 2.1 | | |
| 5-6 years | | | 0.3 | | |
Sector weightings are calculated as a percentage of net assets.
Quality and maturity breakdowns are calculated as a percentage of total investments.
Effective maturity takes into consideration principal payment assumptions, puts and adjustable coupons.
Ratings shown in the quality breakdown represent the rating assigned to a particular bond by one of the following nationally recognized rating agencies: Standard and Poor's, a division of The McGraw-Hill Companies, Inc., Moody's Investors Service, Inc. or Fitch Ratings Ltd. Ratings are relative and subjective and are not absolute standards of quality. The fund's credit quality does not remove market risk.
The fund is actively managed and the composition of its portfolio will change over time.
7
Fund Profile – Columbia California Intermediate Municipal Bond Fund
Performance data quoted represents past performance and current performance may be lower or higher. Past performance is no guarantee of future results. The investment return and principal value will fluctuate so that shares, when redeemed, may be worth more or less than the original cost. Please visit www.columbiafunds.com for daily and most recent month-end performance updates.
Summary
1-year return as of 03/31/09
| | +1.65% | |
|
| |  | | | Class A shares
(without sales charge) | |
|
| | +4.81% | |
|
| |  | | | Barclays Capital 3-15 Year
Blend Municipal Bond Index | |
|
| | +5.60% | |
|
| |  | | | Barclays Capital Municipal
Quality Intermediate Index4 | |
|
Morningstar Style BoxTM
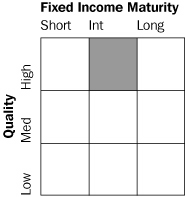
The Morningstar Style BoxTM reveals a fund's investment strategy. For fixed-income funds, the vertical axis shows the average credit quality of the bonds owned and the horizontal axis shows interest rate sensitivity as measured by a bond's duration (short, intermediate or long). Information shown is based on the most recent data provided by Morningstar.
Summary
g For the 12-month period that ended March 31, 2009, the fund's Class A shares returned 1.65% without sales charge.
g The fund's return was lower than the return of the Barclays Capital 3-15 Year Blend Municipal Bond Index1 but higher than the average return of funds in its peer group, the Lipper California Intermediate Municipal Debt Funds Classification.2
g Higher stakes in shorter-maturity bonds and AAA3 bonds helped performance relative to the fund's peer group. A lower weight in shorter-maturity bonds and a higher weight in lower rated investment grade issues relative to the index hampered that performance comparison. Fees also hampered the fund's return relative to the index. The fund incurs fees while the index does not.
Portfolio Management
Maureen G. Newman has managed the fund since 2009 and has been with the advisor or its predecessors or affiliate organizations since 1996.
1The Barclays Capital 3-15 Year Blend Municipal Bond Index tracks the performance of municipal bonds issued after December 31, 1990 with remaining maturities between 2 and 17 years and at least $7 million in principal amount outstanding.
2Lipper Inc., a widely respected data provider in the industry, calculates an average total return (assuming reinvestment of distributions) for mutual funds with investment objectives similar to those of the fund. Lipper makes no adjustment for the effect of sales loads. Funds in the Lipper California Intermediate Municipal Debt Funds Category invest in municipal debt issues with dollar-weighted average maturities of five to ten years and are exempt from taxation in California.
3The credit quality ratings represent those of Moody's Investors Service, Inc. ("Moody's") or Standard & Poor's Corporation ("S&P"). The ratings represent their opinions as to the quality of the securities they rate. Ratings are relative and subjective and are not absolute standards of quality. The security's credit quality does not eliminate risk.
4The Barclays Capital Municipal Quality Intermediate Index is an index of tax-free bonds with a minimum quality rating of A3 from Moody's Investors Service, Inc. and having a maturity range between two and eleven years.
Indices are not available for investment, and do not reflect sales charges, fees, brokerage commissions, taxes or other expenses of investing. Securities in the fund may not match those in an index.
8
Performance Information – Columbia California Intermediate Municipal Bond Fund
Performance of a $10,000 investment 09/09/02 – 03/31/09 ($)
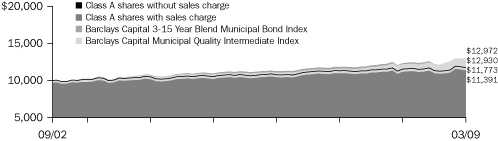 | |
|
The chart above shows the change in value of a hypothetical $10,000 investment in Class A shares of Columbia California Intermediate Municipal Bond Fund during the stated time period, and does not reflect the deduction of taxes that a shareholder may pay on fund distributions or on the redemption of fund shares. The Barclays Capital 3-15 Year Blend Municipal Bond Index tracks the performance of municipal bonds issued after December 31, 1990 with remaining maturities between 2 and 17 years and at least $7 million in principal amount outstanding. The Barclays Capital Municipal Quality Intermediate Index is an index of tax-free bonds with a minimum quality rating of A3 from Moody's Investors Service, Inc. and having a maturity range between two and eleven years. Indices are not available for investment, and do not reflect sales charges, fees, brokerage commissions, taxes or other expenses of investing. Securities in the fund may no t match those in an index.
Performance of a $10,000 investment 09/09/02 – 03/31/09 ($)
| Sales charge | | without | | with | |
| Class A | | | 11,773 | | | | 11,391 | | |
| Class B | | | 11,323 | | | | 11,323 | | |
| Class C | | | 11,217 | | | | 11,217 | | |
| Class Z | | | 12,143 | | | | n/a | | |
Performance data quoted represents past performance and current performance may be lower or higher. Past performance is no guarantee of future results. The investment return and principal value will fluctuate so that shares, when redeemed, may be worth more or less than the original cost. Please visit www.columbiafunds.com for daily and most recent month-end performance updates.
Annual operating expense ratio (%)*
| Class A | | | 0.92 | | |
| Class B | | | 1.67 | | |
| Class C | | | 1.67 | | |
| Class Z | | | 0.67 | | |
Annual operating expense ratio
after contractual waivers (%)*
| Class A | | | 0.76 | | |
| Class B | | | 1.51 | | |
| Class C | | | 1.51 | | |
| Class Z | | | 0.51 | | |
*The annual operating expense ratio and annual operating expense ratio after contractual waivers are as stated in the fund's prospectus that is current as of the date of this report and include the expenses incurred by the investment companies in which the fund invests. The contractual waiver expires 07/31/09. Differences in expense ratios disclosed elsewhere in this report may result from including expenses incurred by the investment companies, fee waivers and expense reimbursements as well as different time periods used in calculating the ratios.
Average annual total return as of 03/31/09 (%)
| Share class | | A | | B | | C | | Z | |
| Inception | | 09/09/02 | | 08/29/02 | | 09/11/02 | | 08/19/02 | |
| Sales charge | | without | | with | | without | | with | | without | | with | | without | |
| 1-year | | | 1.65 | | | | –1.66 | | | | 1.00 | | | | –1.95 | | | | 1.00 | | | | 0.02 | | | | 2.02 | | |
| 5-year | | | 2.28 | | | | 1.60 | | | | 1.54 | | | | 1.54 | | | | 1.54 | | | | 1.54 | | | | 2.55 | | |
| Life | | | 2.52 | | | | 2.00 | | | | 1.90 | | | | 1.90 | | | | 1.77 | | | | 1.77 | | | | 2.98 | | |
The "with sales charge" returns include the maximum initial sales charge of 3.25% for Class A shares and the applicable contingent deferred sales charge of 3.00% in the first year, declining to 1.00% in the fourth year and eliminated thereafter for Class B shares and 1.00% for Class C shares for the first year only. The "without sales charge" returns do not include the effect of sales charges. If they had, returns would be lower.
Performance results reflect any fee waivers or reimbursements of fund expenses by the investment advisor and/or any of its affiliates. Absent these fee waivers or expense reimbursement arrangements, performance results would have been lower.
All results shown assume the reinvestment of distributions. Class Z shares are sold at net asset value with no distribution and service (Rule 12b-1) fees. Class Z shares have limited eligibility and the investment minimum requirements may vary. Please see the fund's prospectus for details. Performance for different share classes will vary based on differences in sales charges and fees associated with each class.
The tables do not reflect the deduction of taxes that a shareholder may pay on fund distributions or on the redemption of fund shares.
9
Understanding Your Expenses – Columbia California Intermediate Municipal Bond Fund
Estimating your actual expenses
To estimate the expenses that you paid over the period, first you will need your account balance at the end of the period:
g For shareholders who receive their account statements from Columbia Management Services, Inc., your account balance is available online at www.columbiafunds.com or by calling Shareholder Services at 800.345.6611.
g For shareholders who receive their account statements from their financial intermediary, contact your financial intermediary to obtain your account balance.
1. Divide your ending account balance by $1,000. For example, if an account balance was $8,600 at the end of the period, the result would be 8.6.
2. In the section of the table below titled "Expenses paid during the period," locate the amount for your share class. You will find this number in the column labeled "Actual." Multiply this number by the result from step 1. Your answer is an estimate of the expenses you paid on your account during the period.
If the value of your account falls below the minimum initial investment requirement applicable to you, your account generally will be subject to a $20 annual fee. This fee is not included in the accompanying table. If you are subject to the fee, keep it in mind when you are estimating the ongoing expenses of investing in the fund and when comparing the expenses of this fund with other funds.
As a fund shareholder, you incur two types of costs. There are transaction costs, which generally include sales charges on purchases and may include redemption fees or exchange fees. There are also ongoing costs, which generally include investment advisory fees, distribution and service (Rule 12b-1) fees and other fund expenses. The information on this page is intended to help you understand the ongoing costs of investing in the fund and to compare these costs with the ongoing costs of investing in other mutual funds.
Analyzing your fund's expenses by share class
To illustrate these ongoing costs, we have provided an example and calculated the expenses paid by investors in each share class during the period. The information in the following table is based on an initial investment of $1,000, which is invested at the beginning of the period and held for the entire period. Expense information is calculated two ways and each method provides you with different information. The amount listed in the "Actual" column is calculated using the fund's actual operating expenses and total return for the period. The amount listed in the "Hypothetical" column for each share class assumes that the return each year is 5% before expenses and is calculated based on the fund's actual operating expenses. You should not use the hypothetical account values and expenses to estimate either your actual account balance at the end of the period or the expenses you paid during this period.
Compare with other funds
Since all mutual funds are required to include the same hypothetical calculations about expenses in shareholder reports, you can use this information to compare the ongoing cost of investing in the fund with other funds. To do so, compare the 5% hypothetical example with the 5% hypothetical examples that appear in the shareholder reports of other funds. As you compare hypothetical examples of other funds, it is important to note that hypothetical examples are meant to highlight the ongoing costs of investing in a fund and do not reflect any transaction costs, such as sales charges, redemption fees or exchange fees.
10/01/08 – 03/31/09
| | | Account value at the
beginning of the period ($) | | Account value at the
end of the period ($) | | Expenses paid
during the period ($) | | Fund's annualized
expense ratio (%) | |
| | | Actual | | Hypothetical | | Actual | | Hypothetical | | Actual | | Hypothetical | | Actual | |
| Class A | | | 1,000.00 | | | | 1,000.00 | | | | 1,036.10 | | | | 1,021.19 | | | | 3.81 | | | | 3.78 | | | | 0.75 | | |
| Class B | | | 1,000.00 | | | | 1,000.00 | | | | 1,033.41 | | | | 1,017.45 | | | | 7.60 | | | | 7.54 | | | | 1.50 | | |
| Class C | | | 1,000.00 | | | | 1,000.00 | | | | 1,033.41 | | | | 1,017.45 | | | | 7.60 | | | | 7.54 | | | | 1.50 | | |
| Class Z | | | 1,000.00 | | | | 1,000.00 | | | | 1,038.59 | | | | 1,022.44 | | | | 2.54 | | | | 2.52 | | | | 0.50 | | |
Expenses paid during the period are equal to the annualized expense ratio for the share class, multiplied by the average account value over the period, then multiplied by the number of days in the fund's most recent fiscal half-year and divided by 365.
Had the investment advisor and/or any of its affiliates not waived fees or reimbursed a portion of expenses, account value at the end of the period would have been reduced.
It is important to note that the expense amounts shown in the table are meant to highlight only ongoing costs of investing in the fund and do not reflect any transaction costs, such as sales charges, redemption fees or exchange fees. Therefore, the hypothetical examples provided may not help you determine the relative total costs of owning shares of different funds. If these transaction costs were included, your costs would have been higher.
10
Portfolio Manager's Report – Columbia California Intermediate Municipal Bond Fund
For the 12-month period that ended March 31, 2009, the fund's Class A shares returned 1.65% without sales charge. The fund's benchmark, the Barclays Capital 3-15 Year Blend Municipal Bond Index,1 returned 4.81% while the average fund in its peer group, the Lipper California Intermediate Municipal Debt Funds Classification2, returned 0.27%. The fund's exposure to shorter-maturity bonds was less than the index and its exposure to lower quality investment grade bonds was higher than the index, and both detracted from performance relative to the index. However, the fund had more exposure to shorter-maturity bonds and was overweighted in AAA-rated3 bonds versus the average fund in its peer group, which led to stronger relative performance.
On February 20, 2009, Maureen Newman became the portfolio manager for the fund.
Turmoil in economy and credit markets hit California hard
California municipalities suffered as a deteriorating housing market eroded revenues from property taxes, rising unemployment hampered sales and personal income tax receipts and recession reduced corporate tax revenues. New issuance became more difficult as credit markets froze, investor demand slowed, key broker/dealers disappeared from the municipal market and municipal bond insurers received credit ratings downgrades. The ratings agencies repeatedly downgraded the state's general obligation (GO) bonds, leaving California with some of the lowest state GO ratings in the country. However, concerns began to ease late in the period, as investors anticipated that the state would receive a sizable payout from the federal government's economic stimulus plan. A state bond deal in March drew strong interest from investors.
Yield exposure delivered mixed results
As the Federal Reserve Board cut a key overnight interest rate, short-term yields fell more than longer-term yields, causing short-term bonds with maturities of five or less years to outperform intermediate- and longer-term issues in the municipal market. Because the fund had less exposure to this segment of the market than the index, it gave up some relative performance. However, it had more exposure to short-term bonds than its peer group, which aided performance against that measure. As the difference between short and long-term yields widened, we sold short-term bonds and bought more bonds in the 10- to 15-year maturity range.
1The Barclays Capital 3-15 Year Blend Municipal Bond Index tracks the performance of municipal bonds issued after December 31, 1990 with remaining maturities between 2 and 17 years and at least $7 million in principal amount outstanding.
Indices are not available for investment, and do not reflect sales charges, fees, brokerage commissions, taxes or other expenses of investing. Securities in the fund may not match those in an index.
2Lipper Inc., a widely respected data provider in the industry, calculates an average total return (assuming reinvestment of distributions) for mutual funds with investment objectives similar to those of the fund. Lipper makes no adjustment for the effect of sales loads. Funds in the Lipper California Intermediate Municipal Debt Funds Category invest in municipal debt issues with dollar-weighted average maturities of five to ten years and are exempt from taxation in California.
3The credit quality ratings represent those of Moody's Investors Service, Inc. ("Moody's") or Standard & Poor's Corporation ("S&P"). The ratings represent their opinions as to the quality of the securities they rate. Ratings are relative and subjective and are not absolute standards of quality. The security's credit quality does not eliminate risk.
Performance data quoted represents past performance and current performance may be lower or higher. Past performance is no guarantee of future results. The investment return and principal value will fluctuate so that shares, when redeemed, may be worth more or less than the original cost. Please visit www.columbiafunds.com for daily and most recent month-end performance updates.
Net asset value per share
as of 03/31/09 ($)
| Class A | | | 9.34 | | |
| Class B | | | 9.34 | | |
| Class C | | | 9.35 | | |
| Class Z | | | 9.33 | | |
Distribution declared per share
04/01/08 – 03/31/09 ($)
| Class A | | | 0.31 | | |
| Class B | | | 0.24 | | |
| Class C | | | 0.24 | | |
| Class Z | | | 0.34 | | |
A portion of the fund's income may be subject to the alternative minimum tax. The fund may at times purchase tax-exempt securities at a discount. Some, or all, of this discount may be included in the fund's ordinary income, and is taxable when distributed.
30-day SEC yields
as of 03/31/09 (%)
| Class A | | | 3.14 | | |
| Class B | | | 2.50 | | |
| Class C | | | 2.50 | | |
| Class Z | | | 3.50 | | |
The 30-day SEC yields reflect the fund's earning power, net of expenses, expressed as an annualized percentage of the public offering price per share at the end of the period.
Taxable-equivalent SEC yields
as of 03/31/09 (%)
| Class A | | | 5.33 | | |
| Class B | | | 4.24 | | |
| Class C | | | 4.23 | | |
| Class Z | | | 5.93 | | |
Taxable-equivalent SEC yields are based on the combined maximum effective 35.0% federal income tax rate and applicable state income tax rate. This tax rate does not reflect the phase out of exemptions or the reduction of the otherwise allowable deductions that occur when adjusted gross income exceeds certain levels.
11
Portfolio Manager's Report (continued) – Columbia California Intermediate Municipal Bond Fund
Top 5 sectors
as of 03/31/09 (%)
| Tax-Backed | | | 46.4 | | |
| Utilities | | | 27.8 | | |
| Other | | | 6.8 | | |
| Health Care | | | 6.5 | | |
| Education | | | 5.5 | | |
Maturity breakdown
as of 03/31/09 (%)
| 0-1 year | | | 1.1 | | |
| 1-3 years | | | 6.1 | | |
| 3-5 years | | | 16.0 | | |
| 5-7 years | | | 12.0 | | |
| 7-10 years | | | 23.4 | | |
| 10-15 years | | | 29.6 | | |
| 15-20 years | | | 5.7 | | |
| 20-25 years | | | 0.3 | | |
| 25 years and over | | | 1.8 | | |
| Cash and Equivalents | | | 4.0 | | |
Quality breakdown
as of 03/31/09 (%)
| AAA | | | 28.8 | | |
| AA | | | 38.8 | | |
| A | | | 23.0 | | |
| BBB | | | 8.9 | | |
| Non Rated | | | 0.5 | | |
Sector weightings are calculated as a percentage of net assets.
Quality and maturity breakdowns are calculated as a percentage of total investments.
Ratings shown in the quality breakdown represent the rating assigned to a particular bond by one of the following nationally recognized rating agencies: Standard and Poor's, a division of The McGraw-Hill Companies, Inc., Moody's Investors Service, Inc. or Fitch Ratings Ltd. Ratings are relative and subjective and are not absolute standards of quality. The fund's credit quality does not remove market risk.
The fund is actively managed and the composition of its portfolio will change over time.
Gains from higher-quality bonds
In a volatile market, investors favored high quality issues. Among the portfolio's best performers were essential purpose bonds, used to fund water, sewer and electricity services. They accounted for about 25% of assets at period end. Local GO bonds with high credit ratings further aided returns. Other strong performers included refunded bonds, which benefited from having both short maturities and high credit quality. Refunding occurs when an issuer sells a new lower coupon bond and puts the proceeds into an escrow account to pay off the old "refunded" bond.
Some of these gains were offset by losses from municipal preferred shares issued by Munimae, a partnership that holds numerous multi-family housing bonds. The prices on the underlying bonds declined as housing values fell. Tobacco bonds, which are issued by the state and funded by payments from a financial settlement tied to the volume of cigarette consumption, also hurt performance. Prices on some of these bonds fell about 30% amid fears that states would raise cigarette taxes to help close budget gaps, thereby reducing demand for cigarettes.
Looking ahead
We believe that California municipal bonds will continue to draw investor attention, especially as the state benefits from fiscal stimulus funds and proves it can meet payments on its debt. However, we also expect the state to continue to struggle with its finances. It could face a battle to approve a budget for the upcoming fiscal year. Among the biggest concerns is the housing market where, in some areas, values have fallen 25% or more. We plan to keep the fund's local property tax-backed bonds, which are geographically diversified and issued primarily for school and community college districts. We also expect to maintain a sizable stake in essential purpose bonds.
Portfolio holdings and characteristics are subject to change periodically and may not be representative of current holdings and characteristics. The outlook for the fund may differ from those presented for other Columbia Funds.
Tax-exempt investing offers current tax-exempt income, but it also involves certain risks. The value of the fund will be affected by interest rate changes and the creditworthiness of issues held in the fund. When interest rates go up, bond prices generally drop and vice versa.
Interest income from certain tax-exempt bonds may be subject to certain state and local taxes and, if applicable, the alternative minimum tax. Capital gains are not exempt from income taxes.
Single-state municipal bond funds pose additional risks due to limited geographical diversification.
12
Fund Profile – Columbia Georgia Intermediate Municipal Bond Fund
Summary
g For the 12-month period that ended March 31, 2009, the fund's Class A shares returned 2.04% without sales charge.
g The fund underperformed its benchmark, the Barclays Capital 3-15 Year Blend Municipal Bond Index,1 and the average fund in its peer group, the Lipper Other States Intermediate Municipal Debt Funds Classification.2
g The fund had more exposure than the index to lower quality bonds and less exposure to shorter-maturity bonds, which accounted for a portion of its shortfall against its benchmark. Fees also hampered the fund's return relative to the index. The fund incurs fees while the index does not.
Portfolio Management
Maureen G. Newman has managed the fund since 2009 and has been with the advisor or its predecessors or affiliate organizations since 1996.
1The Barclays Capital 3-15 Year Blend Municipal Bond Index tracks the performance of municipal bonds issued after December 31, 1990 with remaining maturities between 2 and 17 years and at least $7 million in principal amount outstanding.
2Lipper Inc., a widely respected data provider in the industry, calculates an average total return (assuming reinvestment of distributions) for mutual funds with investment objectives similar to those of the fund. Lipper makes no adjustment for the effect of sales loads.
3The Barclays Capital Municipal Quality Intermediate Index is an index of tax-free bonds with a minimum quality rating of A3 from Moody's Investors Service, Inc. and having a maturity range between two and eleven years.
Indices are not available for investment, and do not reflect sales charges, fees, brokerage commissions, taxes or other expenses of investing. Securities in the fund may not match those in an index.
Performance data quoted represents past performance and current performance may be lower or higher. Past performance is no guarantee of future results. The investment return and principal value will fluctuate so that shares, when redeemed, may be worth more or less than the original cost. Please visit www.columbiafunds.com for daily and most recent month-end performance updates.
Summary
1-year return as of 03/31/09
| | +2.04% | |
|
| |  | | | Class A shares
(without sales charge) | |
|
| | +4.81% | |
|
| |  | | | Barclays Capital 3-15 Year
Blend Municipal Bond Index | |
|
| | +5.60% | |
|
| |  | | | Barclays Capital Municipal
Quality Intermediate Index3 | |
|
Morningstar Style BoxTM
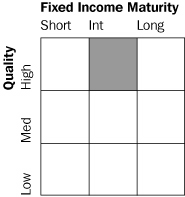
The Morningstar Style BoxTM reveals a fund's investment strategy. For fixed-income funds, the vertical axis shows the average credit quality of the bonds owned and the horizontal axis shows interest rate sensitivity as measured by a bond's duration (short, intermediate or long). Information shown is based on the most recent data provided by Morningstar.
13
Performance Information – Columbia Georgia Intermediate Municipal Bond Fund
Performance data quoted represents past performance and current performance may be lower or higher. Past performance is no guarantee of future results. The investment return and principal value will fluctuate so that shares, when redeemed, may be worth more or less than the original cost. Please visit www.columbiafunds.com for daily and most recent month-end performance updates.
Annual operating expense ratio (%)*
| Class A | | | 0.96 | | |
| Class B | | | 1.71 | | |
| Class C | | | 1.71 | | |
| Class Z | | | 0.71 | | |
Annual operating expense ratio
after contractual waivers (%)*
| Class A | | | 0.76 | | |
| Class B | | | 1.51 | | |
| Class C | | | 1.51 | | |
| Class Z | | | 0.51 | | |
*The annual operating expense ratio and annual operating expense ratio after contractual waivers are as stated in the fund's prospectus that is current as of the date of this report and include the expenses incurred by the investment companies in which the fund invests. The contractual waiver expires 07/31/09. Differences in expense ratios disclosed elsewhere in this report may result from including expenses incurred by the investment companies, fee waivers and expense reimbursements as well as different time periods used in calculating the ratios.
Performance of a $10,000 investment 04/01/99 – 03/31/09 ($)
 | |
|
The chart above shows the change in value of a hypothetical $10,000 investment in Class A shares of Columbia Georgia Intermediate Municipal Bond Fund during the stated time period, and does not reflect the deduction of taxes that a shareholder may pay on fund distributions or on the redemption of fund shares. The Barclays Capital 3-15 Year Blend Municipal Bond Index tracks the performance of municipal bonds issued after December 31, 1990 with remaining maturities between 2 and 17 years and at least $7 million in principal amount outstanding. The Barclays Capital Municipal Quality Intermediate Index is an index of tax-free bonds with a minimum quality rating of A3 from Moody's Investors Service, Inc. and having a maturity range between two and eleven years. Indices are not available for investment, and do not reflect sales charges, fees, brokerage commissions, taxes or other expenses of investing. Securities in the fund may not m atch those in an index.
Performance of a $10,000 investment 04/01/99 – 03/31/09 ($)
| Sales charge | | without | | with | |
| Class A | | | 13,938 | | | | 13,482 | | |
| Class B | | | 12,955 | | | | 12,955 | | |
| Class C | | | 12,928 | | | | 12,928 | | |
| Class Z | | | 14,290 | | | | n/a | | |
Average annual total return as of 03/31/09 (%)
| Share class | | A | | B | | C | | Z | |
| Inception | | 05/04/92 | | 06/07/93 | | 06/17/92 | | 03/01/92 | |
| Sales charge | | without | | with | | without | | with | | without | | with | | without | |
| 1-year | | | 2.04 | | | | –1.30 | | | | 1.38 | | | | –1.57 | | | | 1.28 | | | | 0.30 | | | | 2.30 | | |
| 5-year | | | 2.28 | | | | 1.60 | | | | 1.52 | | | | 1.52 | | | | 1.52 | | | | 1.52 | | | | 2.53 | | |
| 10-year | | | 3.38 | | | | 3.03 | | | | 2.62 | | | | 2.62 | | | | 2.60 | | | | 2.60 | | | | 3.63 | | |
The "with sales charge" returns include the maximum initial sales charge of 3.25% for Class A shares and the applicable contingent deferred sales charge of 3.00% in the first year, declining to 1.00% in the fourth year and eliminated thereafter for Class B shares and 1.00% for Class C shares for the first year only. The "without sales charge" returns do not include the effect of sales charges. If they had, returns would be lower.
Performance results reflect any fee waivers or reimbursements of fund expenses by the investment advisor and/or any of its affiliates. Absent these fee waivers or expense reimbursement arrangements, performance results would have been lower.
All results shown assume reinvestment of distributions. Class Z shares are sold at net asset value with no distribution and service (Rule 12b-1) fees. Class Z shares have limited eligibility and the investment minimum requirements may vary. Please see the fund's prospectus for details. Performance for different share classes will vary based on differences in sales charges and fees associated with each class.
The table does not reflect the deduction of taxes that a shareholder may pay on fund distributions or on the redemption of fund shares.
14
Understanding Your Expenses – Columbia Georgia Intermediate Municipal Bond Fund
As a fund shareholder, you incur two types of costs. There are transaction costs, which generally include sales charges on purchases and may include redemption fees or exchange fees. There are also ongoing costs, which generally include investment advisory fees, distribution and service (Rule 12b-1) fees and other fund expenses. The information on this page is intended to help you understand the ongoing costs of investing in the fund and to compare these costs with the ongoing costs of investing in other mutual funds.
Analyzing your fund's expenses by share class
To illustrate these ongoing costs, we have provided an example and calculated the expenses paid by investors in each share class during the period. The information in the following table is based on an initial investment of $1,000, which is invested at the beginning of the period and held for the entire period. Expense information is calculated two ways and each method provides you with different information. The amount listed in the "Actual" column is calculated using the fund's actual operating expenses and total return for the period. The amount listed in the "Hypothetical" column for each share class assumes that the return each year is 5% before expenses and is calculated based on the fund's actual operating expenses. You should not use the hypothetical account values and expenses to estimate either your actual account balance at the end of the period or the expenses you paid during this period.
Compare with other funds
Since all mutual funds are required to include the same hypothetical calculations about expenses in shareholder reports, you can use this information to compare the ongoing cost of investing in the fund with other funds. To do so, compare the 5% hypothetical example with the 5% hypothetical examples that appear in the shareholder reports of other funds. As you compare hypothetical examples of other funds, it is important to note that hypothetical examples are meant to highlight the ongoing costs of investing in a fund and do not reflect any transaction costs, such as sales charges, redemption fees or exchange fees.
Estimating your actual expenses
To estimate the expenses that you paid over the period, first you will need your account balance at the end of the period:
g For shareholders who receive their account statements from Columbia Management Services, Inc., your account balance is available online at www.columbiafunds.com or by calling Shareholder Services at 800.345.6611.
g For shareholders who receive their account statements from their financial intermediary, contact your financial intermediary to obtain your account balance.
1. Divide your ending account balance by $1,000. For example, if an account balance was $8,600 at the end of the period, the result would be 8.6.
2. In the section of the table below titled "Expenses paid during the period," locate the amount for your share class. You will find this number in the column labeled "Actual." Multiply this number by the result from step 1. Your answer is an estimate of the expenses you paid on your account during the period.
If the value of your account falls below the minimum initial investment requirement applicable to you, your account generally will be subject to a $20 annual fee. This fee is not included in the accompanying table. If you are subject to the fee, keep it in mind when you are estimating the ongoing expenses of investing in the fund and when comparing the expenses of this fund with other funds.
10/01/08 – 03/31/09
| | | Account value at the
beginning of the period ($) | | Account value at the
end of the period ($) | | Expenses paid
during the period ($) | | Fund's annualized
expense ratio (%) | |
| | | Actual | | Hypothetical | | Actual | | Hypothetical | | Actual | | Hypothetical | | Actual | |
| Class A | | | 1,000.00 | | | | 1,000.00 | | | | 1,047.32 | | | | 1,021.19 | | | | 3.83 | | | | 3.78 | | | | 0.75 | | |
| Class B | | | 1,000.00 | | | | 1,000.00 | | | | 1,044.38 | | | | 1,017.45 | | | | 7.65 | | | | 7.54 | | | | 1.50 | | |
| Class C | | | 1,000.00 | | | | 1,000.00 | | | | 1,043.38 | | | | 1,017.45 | | | | 7.64 | | | | 7.54 | | | | 1.50 | | |
| Class Z | | | 1,000.00 | | | | 1,000.00 | | | | 1,048.62 | | | | 1,022.44 | | | | 2.55 | | | | 2.52 | | | | 0.50 | | |
Expenses paid during the period are equal to the annualized expense ratio for the share class, multiplied by the average account value over the period, then multiplied by the number of days in the fund's most recent fiscal half-year and divided by 365.
Had the investment advisor and/or any of its affiliates not waived fees or reimbursed a portion of expenses, account value at the end of the period would have been reduced.
It is important to note that the expense amounts shown in the table are meant to highlight only ongoing costs of investing in the fund and do not reflect any transaction costs, such as sales charges, redemption fees or exchange fees. Therefore, the hypothetical examples provided may not help you determine the relative total costs of owning shares of different funds. If these transaction costs were included, your costs would have been higher.
15
Portfolio Manager's Report – Columbia Georgia Intermediate Municipal Bond Fund
Performance data quoted represents past performance and current performance may be lower or higher. Past performance is no guarantee of future results. The investment return and principal value will fluctuate so that shares, when redeemed, may be worth more or less than the original cost. Please visit www.columbiafunds.com for daily and most recent month-end performance updates.
Net asset value per share
as of 03/31/09 ($)
| Class A | | | 10.18 | | |
| Class B | | | 10.19 | | |
| Class C | | | 10.18 | | |
| Class Z | | | 10.18 | | |
Distributions declared per share
04/01/08 – 03/31/09 ($)
| Class A | | | 0.37 | | |
| Class B | | | 0.30 | | |
| Class C | | | 0.30 | | |
| Class Z | | | 0.40 | | |
A portion of the fund's income may be subject to the alternative minimum tax. The fund may at times purchase tax-exempt securities at a discount. Some, or all, of this discount may be included in the fund's ordinary income, and is taxable when distributed.
30-day SEC yields
as of 03/31/09 (%)
| Class A | | | 2.99 | | |
| Class B | | | 2.34 | | |
| Class C | | | 2.34 | | |
| Class Z | | | 3.34 | | |
The 30-day SEC yields reflect the fund's earning power, net of expenses, expressed as an annualized percentage of the public offering price per share at the end of the period.
Taxable-equivalent SEC yields
as of 03/31/09 (%)
| Class A | | | 4.89 | | |
| Class B | | | 3.83 | | |
| Class C | | | 3.83 | | |
| Class Z | | | 5.46 | | |
Taxable-equivalent SEC yields are based on the combined maximum effective 35.0% federal income tax rate and applicable state income tax rate. This tax rate does not reflect the phase out of exemptions or the reduction of the otherwise allowable deductions that occur when adjusted gross income exceeds certain levels.
For the 12-month period that ended March 31, 2009, the fund's Class A shares returned 2.04% without sales charge. The fund's benchmark, the Barclays Capital 3-15 Year Blend Municipal Bond Index,1 returned 4.81% for the period. The average return for the fund's peer group, the Lipper Other States Intermediate Municipal Debt Funds Classification,2 was 2.60%. The fund had a higher stake than the Barclays index in lower quality bonds and less exposure to short-term issues, which contributed to its underperformance.
On February 20, 2009, Maureen G. Newman became the portfolio manager for the fund.
Challenging year for municipal bonds and Georgia finances
Municipal bonds were not immune to the past year's financial market turmoil. The ratings of leading municipal bond insurers were downgraded, mergers of several key municipal bond broker/dealers resulted in fewer market participants, and credit markets froze. The ensuing investor flight to safety pushed high credit quality bonds ahead of lower quality, higher-yielding issues. Short-term bonds outperformed longer-term issues, buoyed by the Federal Reserve's moves that dropped a key overnight borrowing rate from 2.25% to a target between zero and 0.25%. Georgia's municipal market faced added challenges as personal income and corporate tax revenues declined amid slowing demand in the auto and textile industries and rising unemployment, which hit 9% during the period. At the same time, falling real estate values in areas such as Atlanta hurt property tax revenues. The state, however, kept its AAA credit rating,3 benefiting from a history of fiscal conservatism, ample financial reserves and a diverse economic base. In 2008, new municipal issuance in Georgia fell 15% relative to the previous year.
Gains from high quality essential purpose and GO bonds
Approximately 19% of the fund's assets were committed to essential purpose water and sewer bonds. Local general obligation (GO) bonds accounted for 14% of assets. Water and sewer bonds attracted growing interest because payments for utility services tend to be less sensitive to economic downturns. In the local GO sector, high quality county debt, including bonds issued by Gwinnett and Fulton Counties, benefited from the investor flight to quality.
Losses from longer-maturity and lower-quality issues
The fund lost ground by having less exposure than the Barclays index to short-term issues, which were the municipal market's strongest performers. As yields on
1The Barclays Capital 3-15 Year Blend Municipal Bond Index tracks the performance of municipal bonds issued after December 31, 1990 with remaining maturities between 2 and 17 years and at least $7 million in principal amount outstanding.
Indices are not available for investment, and do not reflect sales charges, fees, brokerage commissions, taxes or other expenses of investing. Securities in the fund may not match those in an index.
2Lipper Inc., a widely respected data provider in the industry, calculates an average total return (assuming reinvestment of distributions) for mutual funds with investment objectives similar to those of the fund. Lipper makes no adjustment for the effect of sales loads.
3The credit quality ratings represent those of Moody's Investors Service, Inc. ("Moody's") or Standard & Poor's Corporation ("S&P"). The ratings represent their opinions as to the quality of the securities they rate. Ratings are relative and subjective and are not absolute standards of quality. The security's credit quality does not eliminate risk.
16
Portfolio Manager's Report (continued) – Columbia Georgia Intermediate Municipal Bond Fund
short-term bonds fell and bond prices rose, we sold short-maturity holdings and bought higher-yielding issues with 8- to 12-year maturities. These intermediate-term issues, about 23% of assets at period end, coupled with about 11% in bonds with maturities of 15 or more years proved costly. The fund also was impacted negatively by investments in lower quality (A- or BBB-rated) bonds, particularly in the hospital and education sectors. These holdings underperformed higher-quality bonds as investors grew increasingly concerned about the impact of shrinking endowments. Other disappointments included BBB-rated bonds issued by International Paper, which suffered amid concerns that the economic downturn would hurt company profits.
Ability to weather the storm
Georgia faces high unemployment and declining revenues at the same time that demand for social services is rising and the value of the state's pension assets is falling. The state, however, remains one of the strongest credits in the nation, a reflection of its conservative debt levels, generous cash reserves and positive demographic trends. We believe that Georgia's low cost of doing business will continue to attract newcomers that can help build the state's revenue base. The state is already looking forward to a new Kia automobile plant, which is expected to open in late 2009. We plan to manage the fund for total return with sizable stakes in state GOs and essential purpose bonds, as well as broad diversification across sectors and issuers.
Portfolio holdings and characteristics are subject to change periodically and may not be representative of current holdings and characteristics. The outlook for the fund may differ from those presented for other Columbia Funds.
Tax-exempt investing offers current tax-exempt income, but it also involves certain risks. The value of the fund will be affected by interest rate changes and the creditworthiness of issues held in the fund. When interest rates go up, bond prices generally drop and vice versa.
Interest income from certain tax-exempt bonds may be subject to certain state and local taxes and, if applicable, the alternative minimum tax. Capital gains are not exempt from income taxes.
Single-state municipal bond funds pose additional risks due to limited geographical diversification.
Top 5 sectors
as of 03/31/09 (%)
| Utilities | | | 29.7 | | |
| Tax-Backed | | | 27.8 | | |
| Education | | | 9.8 | | |
| Other | | | 7.2 | | |
| Housing | | | 7.0 | | |
Quality breakdown
as of 03/31/09 (%)
| AAA | | | 43.6 | | |
| AA | | | 25.7 | | |
| A | | | 17.8 | | |
| BBB | | | 11.2 | | |
| Not Rated | | | 1.7 | | |
Maturity breakdown
as of 03/31/09 (%)
| 0-1 year | | | 5.0 | | |
| 1-3 years | | | 7.6 | | |
| 3-5 years | | | 6.4 | | |
| 5-7 years | | | 6.6 | | |
| 7-10 years | | | 19.8 | | |
| 10-15 years | | | 37.1 | | |
| 15-20 years | | | 10.9 | | |
| Cash and equivalents | | | 6.6 | | |
Sector weightings are calculated as a percentage of net assets.
Quality and maturity breakdowns are calculated as a percentage of total investments.
Ratings shown in the quality breakdown represent the rating assigned to a particular bond by one of the following nationally recognized rating agencies: Standard and Poor's, a division of The McGraw-Hill Companies, Inc., Moody's Investors Service, Inc. or Fitch Ratings Ltd. Ratings are relative and subjective and are not absolute standards of quality. The fund's credit quality does not remove market risk.
The fund is actively managed and the composition of its portfolio will change over time.
17
Fund Profile – Columbia Maryland Intermediate Municipal Bond Fund
Performance data quoted represents past performance and current performance may be lower or higher. Past performance is no guarantee of future results. The investment return and principal value will fluctuate so that shares, when redeemed, may be worth more or less than the original cost. Please visit www.columbiafunds.com for daily and most recent month-end performance updates.
Summary
1-year return as of 03/31/09
| | +0.26% | |
|
| |  | | | Class A shares
(without sales charge) | |
|
| | +4.81% | |
|
| |  | | | Barclays Capital 3-15 Year
Blend Municipal Bond Index | |
|
| | +5.60% | |
|
| |  | | | Barclays Capital Municipal
Quality Intermediate Index4 | |
|
Morningstar Style BoxTM

The Morningstar Style BoxTM reveals a fund's investment strategy. For fixed-income funds, the vertical axis shows the average credit quality of the bonds owned and the horizontal axis shows interest rate sensitivity as measured by a bond's duration (short, intermediate or long). Information shown is based on the most recent data provided by Morningstar.
Summary
g For the 12-month period that ended March 31, 2009, the fund's Class A shares returned 0.26% without sales charge.
g The fund underperformed its benchmark, the Barclays Capital 3-15 Year Blend Municipal Bond Index,1 as well as its peer group, the Lipper Other States Intermediate Municipal Debt Funds Classification.2
g The fund's overweight in higher-yielding, lower-quality bonds with BBB ratings3 detracted from performance, as the economy weakened and market volatility increased. Fees also hampered the fund's return relative to the index. The fund incurs fees while the index does not.
Portfolio Management
Maureen G. Newman has managed the fund since 2009 and has been with the advisor or its predecessors or affiliate organizations since 1996.
1The Barclays Capital 3-15 Year Blend Municipal Bond Index tracks the performance of municipal bonds issued after December 31, 1990 with remaining maturities between 2 and 17 years and at least $7 million in principal amount outstanding.
2Lipper Inc., a widely respected data provider in the industry, calculates an average total return (assuming reinvestment of distributions) for mutual funds with investment objectives similar to those of the fund. Lipper makes no adjustment for the effect of sales loads.
3The credit quality ratings represent those of Moody's Investors Service, Inc. ("Moody's") or Standard & Poor's Corporation ("S&P") credit ratings. The ratings represent their opinions as to the quality of the securities they rate. Ratings are relative and subjective and are not absolute standards of quality. The security's credit quality does not eliminate risk.
4The Barclays Capital Municipal Quality Intermediate Index is an index of tax-free bonds with a minimum quality rating of A3 from Moody's Investors Service, Inc. and having a maturity range between two and eleven years.
Indices are not available for investment, and do not reflect sales charges, fees, brokerage commissions, taxes or other expenses of investing. Securities in the fund may not match those in an index.
18
Performance Information – Columbia Maryland Intermediate Municipal Bond Fund
Performance of a $10,000 investment 04/01/99 – 03/31/09 ($)
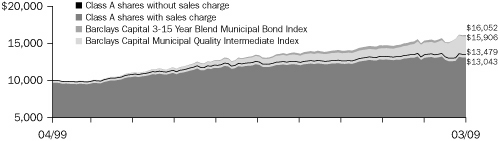 | |
|
The chart above shows the change in value of a hypothetical $10,000 investment in Class A shares of Columbia Maryland Intermediate Municipal Bond Fund during the stated time period, and does not reflect the deduction of taxes that a shareholder may pay on fund distributions or on the redemption of fund shares. The Barclays Capital 3-15 Year Blend Municipal Bond Index tracks the performance of municipal bonds issued after December 31, 1990 with remaining maturities between 2 and 17 years and at least $7 million in principal amount outstanding. The Barclays Capital Municipal Quality Intermediate Index is an index of tax-free bonds with a minimum quality rating of A3 from Moody's Investors Service, Inc. and having a maturity range between two and eleven years. Indices are not available for investment, and do not reflect sales charges, fees, brokerage commissions, taxes or other expenses of investing. Securities in the fund may not match those in an index.
Performance of a $10,000 investment 04/01/99 – 03/31/09 ($)
| Sales charge | | without | | with | |
| Class A | | | 13,479 | | | | 13,043 | | |
| Class B | | | 12,529 | | | | 12,529 | | |
| Class C | | | 12,504 | | | | 12,504 | | |
| Class Z | | | 13,830 | | | | n/a | | |
Performance data quoted represents past performance and current performance may be lower or higher. Past performance is no guarantee of future results. The investment return and principal value will fluctuate so that shares, when redeemed, may be worth more or less than the original cost. Please visit www.columbiafunds.com for daily and most recent month-end performance updates.
Annual operating expense ratio (%)*
| Class A | | | 0.92 | | |
| Class B | | | 1.67 | | |
| Class C | | | 1.67 | | |
| Class Z | | | 0.67 | | |
Annual operating expense ratio
after contractual waivers (%)*
| Class A | | | 0.76 | | |
| Class B | | | 1.51 | | |
| Class C | | | 1.51 | | |
| Class Z | | | 0.51 | | |
*The annual operating expense ratio and annual operating expense ratio after contractual waivers are as stated in the fund's prospectus that is current as of the date of this report and include the expenses incurred by the investment companies in which the fund invests. The contractual waiver expires 07/31/09. Differences in expense ratios disclosed elsewhere in this report may result from including expenses incurred by the investment companies, fee waivers and expense reimbursements as well as different time periods used in calculating the ratios.
Average annual total return as of 03/31/09 (%)
| Share class | | A | | B | | C | | Z | |
| Inception | | 09/01/90 | | 06/08/93 | | 06/17/92 | | 09/01/90 | |
| Sales charge | | without | | with | | without | | with | | without | | with | | without | |
| 1-year | | | 0.26 | | | | –2.99 | | | | –0.48 | | | | –3.38 | | | | –0.49 | | | | –1.46 | | | | 0.61 | | |
| 5-year | | | 1.55 | | | | 0.88 | | | | 0.80 | | | | 0.80 | | | | 0.78 | | | | 0.78 | | | | 1.81 | | |
| 10-year | | | 3.03 | | | | 2.69 | | | | 2.28 | | | | 2.28 | | | | 2.26 | | | | 2.26 | | | | 3.30 | | |
The "with sales charge" returns include the maximum initial sales charge of 3.25% for Class A shares and the applicable contingent deferred sales charge of 3.00% in the first year, declining to 1.00% in the fourth year and eliminated thereafter for Class B shares and 1.00% for Class C shares for the first year only. The "without sales charge" returns do not include the effect of sales charges. If they had, returns would be lower.
Performance results reflect any fee waivers or reimbursements of fund expenses by the investment advisor and/or any of its affiliates. Absent these fee waivers or expense reimbursement arrangements, performance results would have been lower.
All results shown assume reinvestment of distributions. Class Z shares are sold at net asset value with no distribution and service (Rule 12b-1) fees. Class Z shares have limited eligibility and the investment minimum requirements may vary. Please see the fund's prospectus for details. Performance for different share classes will vary based on differences in sales charges and fees associated with each class.
The table does not reflect the deduction of taxes that a shareholder may pay on fund distributions or on the redemption of fund shares.
19
Understanding Your Expenses – Columbia Maryland Intermediate Municipal Bond Fund
Estimating your actual expenses
To estimate the expenses that you paid over the period, first you will need your account balance at the end of the period:
g For shareholders who receive their account statements from Columbia Management Services, Inc., your account balance is available online at www.columbiafunds.com or by calling Shareholder Services at 800.345.6611.
g For shareholders who receive their account statements from their financial intermediary, contact your financial intermediary to obtain your account balance.
1. Divide your ending account balance by $1,000. For example, if an account balance was $8,600 at the end of the period, the result would be 8.6.
2. In the section of the table below titled "Expenses paid during the period," locate the amount for your share class. You will find this number in the column labeled "Actual." Multiply this number by the result from step 1. Your answer is an estimate of the expenses you paid on your account during the period.
If the value of your account falls below the minimum initial investment requirement applicable to you, your account generally will be subject to a $20 annual fee. This fee is not included in the accompanying table. If you are subject to the fee, keep it in mind when you are estimating the ongoing expenses of investing in the fund and when comparing the expenses of this fund with other funds.
As a fund shareholder, you incur two types of costs. There are transaction costs, which generally include sales charges on purchases and may include redemption fees or exchange fees. There are also ongoing costs, which generally include investment advisory fees, distribution and service (Rule 12b-1) fees and other fund expenses. The information on this page is intended to help you understand the ongoing costs of investing in the fund and to compare these costs with the ongoing costs of investing in other mutual funds.
Analyzing your fund's expenses by share class
To illustrate these ongoing costs, we have provided an example and calculated the expenses paid by investors in each share class during the period. The information in the following table is based on an initial investment of $1,000, which is invested at the beginning of the period and held for the entire period. Expense information is calculated two ways and each method provides you with different information. The amount listed in the "Actual" column is calculated using the fund's actual operating expenses and total return for the period. The amount listed in the "Hypothetical" column for each share class assumes that the return each year is 5% before expenses and is calculated based on the fund's actual operating expenses. You should not use the hypothetical account values and expenses to estimate either your actual account balance at the end of the period or the expenses you paid during this period.
Compare with other funds
Since all mutual funds are required to include the same hypothetical calculations about expenses in shareholder reports, you can use this information to compare the ongoing cost of investing in the fund with other funds. To do so, compare the 5% hypothetical example with the 5% hypothetical examples that appear in the shareholder reports of other funds. As you compare hypothetical examples of other funds, it is important to note that hypothetical examples are meant to highlight the ongoing costs of investing in a fund and do not reflect any transaction costs, such as sales charges, redemption fees or exchange fees.
10/01/08 – 03/31/09
| | | Account value at the
beginning of the period ($) | | Account value at the
end of the period ($) | | Expenses paid
during the period ($) | | Fund's annualized
expense ratio (%) | |
| | | Actual | | Hypothetical | | Actual | | Hypothetical | | Actual | | Hypothetical | | Actual | |
| Class A | | | 1,000.00 | | | | 1,000.00 | | | | 1,023.68 | | | | 1,021.19 | | | | 3.78 | | | | 3.78 | | | | 0.75 | | |
| Class B | | | 1,000.00 | | | | 1,000.00 | | | | 1,020.99 | | | | 1,017.45 | | | | 7.56 | | | | 7.54 | | | | 1.50 | | |
| Class C | | | 1,000.00 | | | | 1,000.00 | | | | 1,019.90 | | | | 1,017.45 | | | | 7.55 | | | | 7.54 | | | | 1.50 | | |
| Class Z | | | 1,000.00 | | | | 1,000.00 | | | | 1,025.98 | | | | 1,022.44 | | | | 2.53 | | | | 2.52 | | | | 0.50 | | |
Expenses paid during the period are equal to the annualized expense ratio for the share class, multiplied by the average account value over the period, then multiplied by the number of days in the fund's most recent fiscal half-year and divided by 365.
Had the investment advisor and/or any of its affiliates not waived fees or reimbursed a portion of expenses, account value at the end of the period would have been reduced.
It is important to note that the expense amounts shown in the table are meant to highlight only ongoing costs of investing in the fund and do not reflect any transaction costs, such as sales charges, redemption fees or exchange fees. Therefore, the hypothetical examples provided may not help you determine the relative total costs of owning shares of different funds. If these transaction costs were included, your costs would have been higher.
20
Portfolio Manager's Report – Columbia Maryland Intermediate Municipal Bond Fund
For the 12-month period that ended March 31, 2009, the fund's Class A shares returned 0.26% without sales charge. The fund's benchmark, the Barclays Capital 3-15 Year Blend Municipal Bond Index,1 returned 4.81% for the period. The average return of the fund's peer group, the Lipper Other States Intermediate Municipal Debt Funds Classification,2 was 2.60%. The fund underperformed the index, in part because it had more exposure to high-yielding, lower-quality (BBB-rated)3 bonds, which lagged higher-quality issues. An underweight in short-maturity bonds, which beat longer-term issues, also hurt relative performance. We also believe that these factors detracted from performance compared to the fund's peer group.
On February 20, 2009, Maureen G. Newman became the portfolio manager for the fund.
Maryland maintained high credit rating
During the past year, the municipal bond market was volatile as the economy headed into recession. Municipal bond insurers experienced credit ratings downgrades, which in turn hurt the ratings of bonds they had insured. Mergers of several key municipal bond broker/dealers resulted in fewer market participants, contributing to a credit market freeze. Many institutional buyers turned into net sellers. Despite this negative backdrop, Maryland's economy remained relatively strong, helping the state to maintain the highest possible (AAA or equivalent) credit rating. The state benefited from a strong military and government presence around the Washington D.C. and Annapolis areas as well as a health and education focus in Baltimore. Although these industries were less sensitive to the economic downturn, unemployment in the state reached 6.7% late in the period, but remained below the national rate of 8.1%.
Biggest disappointments from lower-quality securities
The fund had more exposure than its benchmark to BBB-rated bonds (roughly 11% of assets), which added yield to the portfolio. However, as investors became more risk-averse, lower-quality securities, including those that the fund owned in less economically sensitive sectors, such as elderly housing and health care, underperformed. In addition, bonds issued by the Baltimore Convention Center Hotel detracted from returns. These bonds are backed by a variety of revenues, including hotel occupancy taxes on that specific hotel as well as on hotels throughout the city. When issued, the bonds were rated AAA and insured by XLCA, whose name was later changed to Syncora Guarantee. The rating on the bonds fell below investment grade as the insurer was repeatedly downgraded by the ratings agencies because of concerns that it did not have adequate
1The Barclays Capital 3-15 Year Blend Municipal Bond Index tracks the performance of municipal bonds issued after December 31, 1990 with remaining maturities between 2 and 17 years and at least $7 million in principal amount outstanding.
Indices are not available for investment, and do not reflect sales charges, fees, brokerage commissions, taxes or other expenses of investing. Securities in the fund may not match those in an index.
2Lipper Inc., a widely respected data provider in the industry, calculates an average total return (assuming reinvestment of distributions) for mutual funds with investment objectives similar to those of the fund. Lipper makes no adjustment for the effect of sales loads.
3The credit quality ratings represent those of Moody's Investors Service, Inc. ("Moody's") or Standard & Poor's Corporation ("S&P"). The ratings represent their opinions as to the quality of the securities they rate. Ratings are relative and subjective and are not absolute standards of quality. The security's credit quality does not eliminate risk.
Performance data quoted represents past performance and current performance may be lower or higher. Past performance is no guarantee of future results. The investment return and principal value will fluctuate so that shares, when redeemed, may be worth more or less than the original cost. Please visit www.columbiafunds.com for daily and most recent month-end performance updates.
Net asset value per share
as of 03/31/09 ($)
| Class A | | | 10.08 | | |
| Class B | | | 10.09 | | |
| Class C | | | 10.08 | | |
| Class Z | | | 10.09 | | |
Distributions declared per share
04/01/08 – 03/31/09 ($)
| Class A | | | 0.38 | | |
| Class B | | | 0.31 | | |
| Class C | | | 0.31 | | |
| Class Z | | | 0.41 | | |
A portion of the fund's income may be subject to the alternative minimum tax. The fund may at times purchase tax-exempt securities at a discount. Some, or all, of this discount may be included in the fund's ordinary income, and is taxable when distributed.
30-day SEC yields
as of 03/31/09 (%)
| Class A | | | 2.88 | | |
| Class B | | | 2.29 | | |
| Class C | | | 2.22 | | |
| Class Z | | | 3.22 | | |
The 30-day SEC yields reflect the fund's earning power, net of expenses, expressed as an annualized percentage of the public offering price per share at the end of the period.
Taxable-equivalent SEC yields
as of 03/31/09 (%)
| Class A | | | 4.72 | | |
| Class B | | | 3.75 | | |
| Class C | | | 3.64 | | |
| Class Z | | | 5.28 | | |
Taxable-equivalent SEC yields are based on the combined maximum effective 35.0% federal income tax rate and applicable state income tax rate. This tax rate does not reflect the phase out of exemptions or the reduction of the otherwise allowable deductions that occur when adjusted gross income exceeds certain levels.
21
Portfolio Manager's Report (continued) – Columbia Maryland Intermediate Municipal Bond Fund
Top 5 sectors
as of 03/31/09 (%)
| Tax-Backed | | | 41.8 | | |
| Health Care | | | 12.3 | | |
| Other | | | 11.4 | | |
| Housing | | | 8.7 | | |
| Education | | | 7.7 | | |
Quality breakdown
as of 03/31/09 (%)
| AAA | | | 41.6 | | |
| AA | | | 27.1 | | |
| A | | | 16.9 | | |
| BBB | | | 11.2 | | |
| Non-rated | | | 3.2 | | |
Maturity breakdown
as of 03/31/09 (%)
| 0-1 year | | | 4.8 | | |
| 1-3 years | | | 16.2 | | |
| 3-5 years | | | 9.7 | | |
| 5-7 years | | | 13.0 | | |
| 7-10 years | | | 18.4 | | |
| 10-15 years | | | 17.5 | | |
| 15-20 years | | | 7.8 | | |
| 20-25 years | | | 3.3 | | |
| 25 years and over | | | 3.9 | | |
| Cash and equivalents | | | 5.4 | | |
Sector weightings are calculated as a percentage of net assets.
Quality and maturity breakdowns are calculated as a percentage of total investments.
Ratings shown in the quality breakdown represent the rating assigned to a particular bond by one of the following nationally recognized rating agencies: Standard and Poor's, a division of The McGraw-Hill Companies, Inc., Moody's Investors Service, Inc. or Fitch Ratings Ltd. Ratings are relative and subjective and are not absolute standards of quality. The fund's credit quality does not remove market risk.
The fund is actively managed and the composition of its portfolio will change over time.
capital to cover possible defaults. Lower hotel occupancy rates—a result of the economic downturn—further pressured the bonds' prices.
Short-maturity bonds outperformed
As short-term yields declined more than intermediate- or long-term yields, short-term municipal bonds led the market. Because we did not have as much exposure as the index to short-term bonds, we gave up some relative performance. However, we took profits on many of the fund's short-term bonds as prices on those bonds rose and took advantage of the higher yields offered by intermediate and long-term bonds because we believe they offer more return potential going forward. At the end of the period, bonds maturing in five to ten years represented about 30% of net assets, those maturing in ten to 15 years accounted for roughly 17% of assets and issues with maturities over 15 years accounted for another 15% of the portfolio.
Strategy going forward
Looking ahead, we plan to focus on intermediate-term, investment grade bonds. We are especially interested in state general obligation (GO) and state-appropriated bonds (about 10% of assets at the period's end) as well as local GOs (another 25% of assets), which tend to be high quality and relatively liquid. We expect the state-related bonds to benefit from Maryland's reputation as one of the best-managed states in the country, a tribute to its conservative debt structure and long-term fiscal planning. Maryland is likely to maintain its AAA credit rating even as it struggles to fund state services and pension obligations without raising taxes.
Portfolio holdings and characteristics are subject to change periodically and may not be representative of current holdings and characteristics. The outlook for the fund may differ from those presented for other Columbia Funds.
Tax-exempt investing offers current tax-exempt income, but it also involves certain risks. The value of the fund will be affected by interest rate changes and the creditworthiness of issues held in the fund. When interest rates go up, bond prices generally drop and vice versa.
Interest income from certain tax-exempt bonds may be subject to certain state and local taxes and, if applicable, the alternative minimum tax. Capital gains are not exempt from income taxes.
Non-diversified investments increase the risk that a change in the value of any one investment held by the fund could affect the overall value of the fund more than it would affect that of a diversified fund holding a greater number of investments. Accordingly, the fund's value will like be more volatile than the value of more diversified funds.
Single-state municipal bond funds pose additional risks due to limited geographical diversification.
22
Fund Profile – Columbia North Carolina Intermediate Municipal Bond Fund
Summary
g For the 12-month period that ended March 31, 2009, the fund's Class A shares returned 0.87% without sales charge.
g The fund's return was lower than the return of its benchmark, the Barclays Capital 3-15 Year Blend Municipal Bond Index,1 and the average return of its peer group, the Lipper Other States Intermediate Municipal Debt Funds Classification.2
g The fund had more exposure than the index to lower-quality BBB-rated3 bonds, which underperformed, and less exposure to shorter-maturity bonds, which outperformed during the period. We also believe that these factors accounted for the shortfall against the average fund in its peer group.
Portfolio Management
Maureen Newman has managed the fund since April 2007, and has been associated with the advisor or its predecessors or affiliate organizations since 1996.
1The Barclays Capital 3-15 Year Blend Municipal Bond Index tracks the performance of municipal bonds issued after December 31, 1990 with remaining maturities between 2 and 17 years and at least $7 million in principal amount outstanding.
2Lipper Inc., a widely respected data provider in the industry, calculates an average total return (assuming reinvestment of distributions) for mutual funds with investment objectives similar to those of the fund. Lipper makes no adjustment for the effect of sales loads.
3The credit quality ratings represent those of Moody's Investors Service, Inc. ("Moody's") or Standard & Poor's Corporation ("S&P") credit ratings. The ratings represent their opinions as to the quality of the securities they rate. Ratings are relative and subjective and are not absolute standards of quality. The security's credit quality does not eliminate risk.
4The Barclays Capital Municipal Quality Intermediate Index is an index of tax-free bonds with a minimum quality rating of A3 from Moody's Investors Service, Inc. and having a maturity range between two and eleven years.
Indices are not available for investment, and do not reflect sales charges, fees, brokerage commissions, taxes or other expenses of investing. Securities in the fund may not match those in an index.
Performance data quoted represents past performance and current performance may be lower or higher. Past performance is no guarantee of future results. The investment return and principal value will fluctuate so that shares, when redeemed, may be worth more or less than the original cost. Please visit www.columbiafunds.com for daily and most recent month-end performance updates.
Summary
1-year return as of 03/31/09
| | +0.87% | |
|
| |  | | | Class A shares
(without sales charge) | |
|
| | +4.81% | |
|
| |  | | | Barclays Capital 3-15 Year
Blend Municipal Bond Index | |
|
| | +5.60% | |
|
| |  | | | Barclays Capital Municipal
Quality Intermediate Index4 | |
|
Morningstar Style BoxTM
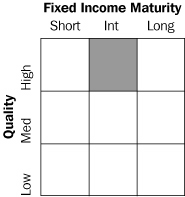
The Morningstar Style BoxTM reveals a fund's investment strategy. For fixed-income funds, the vertical axis shows the average credit quality of the bonds owned and the horizontal axis shows interest rate sensitivity as measured by a bond's duration (short, intermediate or long). Information shown is based on the most recent data provided by Morningstar.
23
Performance Information – Columbia North Carolina Intermediate Municipal Bond Fund
Performance data quoted represents past performance and current performance may be lower or higher. Past performance is no guarantee of future results. The investment return and principal value will fluctuate so that shares, when redeemed, may be worth more or less than the original cost. Please visit www.columbiafunds.com for daily and most recent month-end performance updates.
Annual operating expense ratio (%)*
| Class A | | | 0.92 | | |
| Class B | | | 1.67 | | |
| Class C | | | 1.67 | | |
| Class Z | | | 0.67 | | |
Annual operating expense ratio
after contractual waivers (%)*
| Class A | | | 0.76 | | |
| Class B | | | 1.51 | | |
| Class C | | | 1.51 | | |
| Class Z | | | 0.51 | | |
*The annual operating expense ratio and annual operating expense ratio after contractual waivers are as stated in the fund's prospectus that is current as of the date of this report and include the expenses incurred by the investment companies in which the fund invests. The contractual waiver expires 07/31/09. Differences in expense ratios disclosed elsewhere in this report may result from including expenses incurred by the investment companies, fee waivers and expense reimbursements as well as different time periods used in calculating the ratios.
Performance of a $10,000 investment 04/01/99 – 03/31/09 ($)
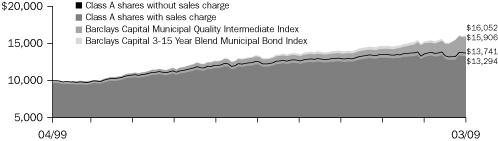 | |
|
The chart above shows the change in value of a hypothetical $10,000 investment in Class A shares of Columbia North Carolina Intermediate Municipal Bond Fund during the stated time period, and does not reflect the deduction of taxes that a shareholder may pay on fund distributions or on the redemption of fund shares. The Barclays Capital 3-15 Year Blend Municipal Bond Index tracks the performance of municipal bonds issued after December 31, 1990 with remaining maturities between 2 and 17 years and at least $7 million in principal amount outstanding. The Barclays Capital Municipal Quality Intermediate Index is an index of tax-free bonds with a minimum quality rating of A3 from Moody's Investors Service, Inc. and having a maturity range between two and eleven years. Indices are not available for investment, and do not reflect sales charges, fees, brokerage commissions, taxes or other expenses of investing. Securities in the fund ma y not match those in an index.
Performance of a $10,000 investment 04/01/99 – 03/31/09 ($)
| Sales charge | | without | | with | |
| Class A | | | 13,741 | | | | 13,294 | | |
| Class B | | | 12,761 | | | | 12,761 | | |
| Class C | | | 12,742 | | | | 12,742 | | |
| Class Z | | | 14,085 | | | | n/a | | |
Average annual total return as of 03/31/09 (%)
| Share class | | A | | B | | C | | Z | |
| Inception | | 12/14/92 | | 06/07/93 | | 12/16/92 | | 12/11/92 | |
| Sales charge | | without | | with | | without | | with | | without | | with | | without | |
| 1-year | | | 0.87 | | | | –2.42 | | | | 0.13 | | | | –2.79 | | | | 0.12 | | | | –0.85 | | | | 1.22 | | |
| 5-year | | | 1.84 | | | | 1.16 | | | | 1.08 | | | | 1.08 | | | | 1.08 | | | | 1.08 | | | | 2.10 | | |
| 10-year | | | 3.23 | | | | 2.89 | | | | 2.47 | | | | 2.47 | | | | 2.45 | | | | 2.45 | | | | 3.48 | | |
The "with sales charge" returns include the maximum initial sales charge of 3.25% for Class A shares and the applicable contingent deferred sales charge of 3.00% in the first year, declining to 1.00% in the fourth year and eliminated thereafter for Class B shares and 1.00% for Class C shares for the first year only. The "without sales charge" returns do not include the effect of sales charges. If they had, returns would be lower.
Performance results reflect any fee waivers or reimbursements of fund expenses by the investment advisor and/or any of its affiliates. Absent these fee waivers or expense reimbursement arrangements, performance results would have been lower.
All results shown assume reinvestment of distributions. Class Z shares are sold at net asset value with no distribution and service (Rule 12b-1) fees. Class Z shares have limited eligibility and the investment minimum requirements may vary. Please see the fund's prospectus for details. Performance for different share classes will vary based on differences in sales charges and fees associated with each class.
The tables do not reflect the deduction of taxes that a shareholder may pay on fund distributions or on the redemption of fund shares.
24
Understanding Your Expenses – Columbia North Carolina Intermediate Municipal Bond Fund
As a fund shareholder, you incur two types of costs. There are transaction costs, which generally include sales charges on purchases and may include redemption fees or exchange fees. There are also ongoing costs, which generally include investment advisory fees, distribution and service (Rule 12b-1) fees and other fund expenses. The information on this page is intended to help you understand the ongoing costs of investing in the fund and to compare these costs with the ongoing costs of investing in other mutual funds.
Analyzing your fund's expenses by share class
To illustrate these ongoing costs, we have provided an example and calculated the expenses paid by investors in each share class during the period. The information in the following table is based on an initial investment of $1,000, which is invested at the beginning of the period and held for the entire period. Expense information is calculated two ways and each method provides you with different information. The amount listed in the "Actual" column is calculated using the fund's actual operating expenses and total return for the period. The amount listed in the "Hypothetical" column for each share class assumes that the return each year is 5% before expenses and is calculated based on the fund's actual operating expenses. You should not use the hypothetical account values and expenses to estimate either your actual account balance at the end of the period or the expenses you paid during this period.
Compare with other funds
Since all mutual funds are required to include the same hypothetical calculations about expenses in shareholder reports, you can use this information to compare the ongoing cost of investing in the fund with other funds. To do so, compare the 5% hypothetical example with the 5% hypothetical examples that appear in the shareholder reports of other funds. As you compare hypothetical examples of other funds, it is important to note that hypothetical examples are meant to highlight the ongoing costs of investing in a fund and do not reflect any transaction costs, such as sales charges, redemption fees or exchange fees.
Estimating your actual expenses
To estimate the expenses that you paid over the period, first you will need your account balance at the end of the period:
g For shareholders who receive their account statements from Columbia Management Services, Inc., your account balance is available online at www.columbiafunds.com or by calling Shareholder Services at 800.345.6611.
g For shareholders who receive their account statements from their financial intermediary, contact your financial intermediary to obtain your account balance.
1. Divide your ending account balance by $1,000. For example, if an account balance was $8,600 at the end of the period, the result would be 8.6.
2. In the section of the table below titled "Expenses paid during the period," locate the amount for your share class. You will find this number in the column labeled "Actual." Multiply this number by the result from step 1. Your answer is an estimate of the expenses you paid on your account during the period.
If the value of your account falls below the minimum initial investment requirement applicable to you, your account generally will be subject to a $20 annual fee. This fee is not included in the accompanying table. If you are subject to the fee, keep it in mind when you are estimating the ongoing expenses of investing in the fund and when comparing the expenses of this fund with other funds.
10/01/08 – 03/31/09
| | | Account value at the
beginning of the period ($) | | Account value at the
end of the period ($) | | Expenses paid
during the period ($) | | Fund's annualized
expense ratio (%) | |
| | | Actual | | Hypothetical | | Actual | | Hypothetical | | Actual | | Hypothetical | | Actual | |
| Class A | | | 1,000.00 | | | | 1,000.00 | | | | 1,028.62 | | | | 1,021.19 | | | | 3.79 | | | | 3.78 | | | | 0.75 | | |
| Class B | | | 1,000.00 | | | | 1,000.00 | | | | 1,024.88 | | | | 1,017.45 | | | | 7.57 | | | | 7.54 | | | | 1.50 | | |
| Class C | | | 1,000.00 | | | | 1,000.00 | | | | 1,024.88 | | | | 1,017.45 | | | | 7.57 | | | | 7.54 | | | | 1.50 | | |
| Class Z | | | 1,000.00 | | | | 1,000.00 | | | | 1,031.01 | | | | 1,022.44 | | | | 2.53 | | | | 2.52 | | | | 0.50 | | |
Expenses paid during the period are equal to the annualized expense ratio for the share class, multiplied by the average account value over the period, then multiplied by the number of days in the fund's most recent fiscal half-year and divided by 365.
Had the investment advisor and/or any of its affiliates not waived fees or reimbursed a portion of expenses, account value at the end of the period would have been reduced.
It is important to note that the expense amounts shown in the table are meant to highlight only ongoing costs of investing in the fund and do not reflect any transaction costs, such as sales charges, redemption fees or exchange fees. Therefore, the hypothetical examples provided may not help you determine the relative total costs of owning shares of different funds. If these transaction costs were included, your costs would have been higher.
25
Portfolio Manager's Report – Columbia North Carolina Intermediate Municipal Bond Fund
Performance data quoted represents past performance and current performance may be lower or higher. Past performance is no guarantee of future results. The investment return and principal value will fluctuate so that shares, when redeemed, may be worth more or less than the original cost. Please visit www.columbiafunds.com for daily and most recent month-end performance updates.
Net asset value per share
as of 03/31/09 ($)
| Class A | | | 9.79 | | |
| Class B | | | 9.79 | | |
| Class C | | | 9.79 | | |
| Class Z | | | 9.79 | | |
Distributions declared per share
04/01/08 – 03/31/09 ($)
| Class A | | | 0.37 | | |
| Class B | | | 0.30 | | |
| Class C | | | 0.30 | | |
| Class Z | | | 0.40 | | |
A portion of the fund's income may be subject to the alternative minimum tax. The fund may at times purchase tax-exempt securities at a discount. Some, or all, of this discount may be included in the fund's ordinary income, and is taxable when distributed.
30-day SEC yields
as of 03/31/09 (%)
| Class A | | | 2.74 | | |
| Class B | | | 2.16 | | |
| Class C | | | 2.11 | | |
| Class Z | | | 3.08 | | |
The 30-day SEC yields reflect the fund's earning power, net of expenses, expressed as an annualized percentage of the public offering price per share at the end of the period.
Taxable-equivalent SEC yields
as of 03/31/09 (%)
| Class A | | | 4.57 | | |
| Class B | | | 3.60 | | |
| Class C | | | 3.52 | | |
| Class Z | | | 5.14 | | |
Taxable-equivalent SEC yields are based on the combined maximum effective 35.0% federal income tax rate and applicable state income tax rate. This tax rate does not reflect the phase out of exemptions or the reduction of the otherwise allowable deductions that occur when adjusted gross income exceeds certain levels.
For the 12-month period that ended March 31, 2009, the fund's Class A shares returned 0.87% without sales charge. The fund's benchmark, the Barclays Capital 3-15 Year Blend Municipal Bond Index,1 returned 4.81% for the period. The average return of the fund's peer group, the Lipper Other States Intermediate Municipal Debt Funds Classification,2 was 2.60%. The fund had more exposure than the index to lower quality BBB-rated3 bonds, which underperformed, and less exposure to shorter-maturity bonds, which outperformed during the period.
A challenging year for municipal bonds
Over the past year, many municipal bond insurers suffered multiple downgrades, which hurt the credit quality of the issues they insured and limited options for issuers coming to market. Mergers of several key municipal bond broker/dealers resulted in fewer market participants, and credit markets froze. Many institutional investors sold long-term municipals as the cost of funding their investments grew. Plus, the economy slid into a global recession, hurting the tax revenues that support state and local governments.
In this environment, North Carolina's economy also suffered, despite the stabilizing influence of hospitals and universities in the area known as the Research Triangle. The financial center of Charlotte took a hard hit due to the banking crisis, and the state's manufacturing sector, which includes auto suppliers and textile companies, experienced significant slowdowns. Unemployment jumped to 10.7% in February 2009, up from 5.2% a year earlier—the highest one-year increase of any state. Strong fiscal management and a diverse economic base, however, helped the state maintain its AAA credit rating.
Disappointing positioning in lower quality issues
The fund's overweight in higher-yielding, lower quality issues with BBB ratings—about 10% of assets—put the biggest dent in performance. As the economy weakened and financial market volatility increased, investors became more risk averse, favoring higher quality securities that were perceived to be less sensitive to an economic downturn. Among the biggest detractors were bonds issued by ARC, a system of group homes for developmentally disabled residents. As the market became concerned about property values and continued government funding for the disabled, the price of these bonds dropped. However, the properties are not highly leveraged and we believe that this and other factors may give these bonds better prospects than the market is currently pricing in. Bonds issued by International Paper also detracted from returns as concerns over the stability of the paper industry mounted.
1The Barclays Capital 3-15 Year Blend Municipal Bond Index tracks the performance of municipal bonds issued after December 31, 1990 with remaining maturities between 2 and 17 years and at least $7 million in principal amount outstanding.
Indices are not available for investment, and do not reflect sales charges, fees, brokerage commissions, taxes or other expenses of investing. Securities in the fund may not match those in an index.
2Lipper Inc., a widely respected data provider in the industry, calculates an average total return (assuming reinvestment of distributions) for mutual funds with investment objectives similar to those of the fund. Lipper makes no adjustment for the effect of sales loads.
3The credit quality ratings represent those of Moody's Investors Service, Inc. ("Moody's") or Standard & Poor's Corporation ("S&P"). The ratings represent their opinions as to the quality of the securities they rate. Ratings are relative and subjective and are not absolute standards of quality. The security's credit quality does not eliminate risk.
26
Portfolio Manager's Report (continued) – Columbia North Carolina Intermediate Municipal Bond Fund
Helping to offset some of these price declines were investments in water and sewer bonds as well as high quality local and state general obligation (GO) bonds. Demand for water and sewer bonds, about 10% of net assets, increased as investors recognized that people tend to pay for these basic utilities even in a recession. GOs, another 16% of assets, generally fared well because of their high quality and relative liquidity.
Capitalizing on falling yields
Over the course of the year, the Federal Reserve Board ratcheted down a key overnight lending rate, driving yields down and prices up across the maturity range. However, short-term yields declined more than long-term yields and the fund gave up some performance because it did not have as much exposure as the index to short-term bonds. We used the spike in short-term bond prices to sell some shorter-maturity bonds and to buy higher-yielding bonds with 10- to 15-year maturities, which accounted for more than one third of the fund's assets at period end. We believe that these longer-maturity holdings could benefit from continued low inflation, which should keep yields relatively stable.
Uncertain outlook for North Carolina
Questions still remain about how economic weakness will affect North Carolina over the next 12 months. Given these uncertainties, we plan to focus on stable, higher quality issues. At period end, the fund had about 25% of its assets in high-quality local GO and appropriated bonds, about 4% in state GO and lease obligation bonds and about 10% in essential purpose water and sewer revenue bonds.
Portfolio holdings and characteristics are subject to change periodically and may not be representative of current holdings and characteristics. The outlook for the fund may differ from those presented for other Columbia Funds.
Tax-exempt investing offers current tax-exempt income, but it also involves certain risks. The value of the fund will be affected by interest rate changes and the creditworthiness of issues held in the fund. When interest rates go up, bond prices generally drop and vice versa.
Interest income from certain tax-exempt bonds may be subject to certain state and local taxes and, if applicable, the alternative minimum tax. Capital gains are not exempt from income taxes.
Single-state municipal bond funds pose additional risks due to limited geographical diversification.
Top 5 sectors
as of 03/31/09 (%)
| Tax-Backed | | | 38.2 | | |
| Utilities | | | 17.7 | | |
| Refunded/Escrowed | | | 15.3 | | |
| Health Care | | | 8.0 | | |
| Education | | | 4.3 | | |
Quality breakdown
as of 03/31/09 (%)
| AAA | | | 46.9 | | |
| AA | | | 32.4 | | |
| A | | | 8.6 | | |
| BBB | | | 10.1 | | |
| BB | | | 0.3 | | |
| Not Rated | | | 1.7 | | |
Maturity breakdown
as of 03/31/09 (%)
| 0-1 year | | | 5.1 | | |
| 1-3 years | | | 7.5 | | |
| 3-5 years | | | 8.7 | | |
| 5-7 years | | | 6.9 | | |
| 7-10 years | | | 16.1 | | |
| 10-15 years | | | 35.7 | | |
| 15-20 years | | | 7.0 | | |
| 20-25 years | | | 0.4 | | |
| 25 years and over | | | 1.5 | | |
| Cash & Equivalents | | | 11.1 | | |
Sector weightings are calculated as a percentage of net assets.
Quality and maturity breakdowns are calculated as a percentage of total investments.
Ratings shown in the quality breakdown represent the rating assigned to a particular bond by one of the following nationally recognized rating agencies: Standard and Poor's, a division of The McGraw-Hill Companies, Inc., Moody's Investors Service, Inc. or Fitch Ratings Ltd. Ratings are relative and subjective and are not absolute standards of quality. The fund's credit quality does not remove market risk.
The fund is actively managed and the composition of its portfolio will change over time.
27
Fund Profile – Columbia South Carolina Intermediate Municipal Bond Fund
Performance data quoted represents past performance and current performance may be lower or higher. Past performance is no guarantee of future results. The investment return and principal value will fluctuate so that shares, when redeemed, may be worth more or less than the original cost. Please visit www.columbiafunds.com for daily and most recent month-end performance updates.
Summary
1-year return as of 03/31/09
| | | +2.09% | |
|
| |  | | | Class A shares
(without sales charge) | |
|
| | | +4.81% | |
|
| |  | | | Barclays Capital 3-15 Year
Blend Municipal Bond Index | |
|
| | | +5.60% | |
|
| |  | | | Barclays Capital Municipal
Quality Intermediate Index4 | |
|
Morningstar Style BoxTM

The Morningstar Style BoxTM reveals a fund's investment strategy. For fixed-income funds, the vertical axis shows the average credit quality of the bonds owned and the horizontal axis shows interest rate sensitivity as measured by a bond's duration (short, intermediate or long). Information shown is based on the most recent data provided by Morningstar.
Summary
g For the 12-month period that ended March 31, 2009, the fund's Class A shares returned 2.09% without sales charge.
g The fund underperformed its benchmark, the Barclays Capital 3-15 Year Blend Municipal Bond Index,1 as well as its peer group, the Lipper Other States Intermediate Municipal Debt Funds Classification.2
g The fund had more exposure than the index to lower-quality BBB-rated3 bonds, which underperformed, and less exposure to shorter-maturity bonds, which outperformed during the period.
Portfolio Management
Maureen G. Newman has managed the fund since 2007, and has been with the advisor or its predecessors or affiliate organizations since 1996.
1The Barclays Capital 3-15 Year Blend Municipal Bond Index tracks the performance of municipal bonds issued after December 31, 1990 with remaining maturities between 2 and 17 years and at least $7 million in principal amount outstanding.
2Lipper Inc., a widely respected data provider in the industry, calculates an average total return (assuming reinvestment of distributions) for mutual funds with investment objectives similar to those of the fund. Lipper makes no adjustment for the effect of sales loads.
3The credit quality ratings represent those of Moody's Investors Service, Inc. ("Moody's") or Standard & Poor's Corporation ("S&P") credit ratings. The ratings represent their opinions as to the quality of the securities they rate. Ratings are relative and subjective and are not absolute standards of quality. The security's credit quality does not eliminate risk.
4The Barclays Capital Municipal Quality Intermediate Index is an index of tax-free bonds with a minimum quality rating of A3 from Moody's Investors Service, Inc. and having a maturity range between two and eleven years.
Indices are not available for investment, and do not reflect sales charges, fees, brokerage commissions, taxes or other expenses of investing. Securities in the fund may not match those in an index.
28
Performance Information – Columbia South Carolina Intermediate Municipal Bond Fund
Performance of a $10,000 investment 04/01/99 – 03/31/09 ($)
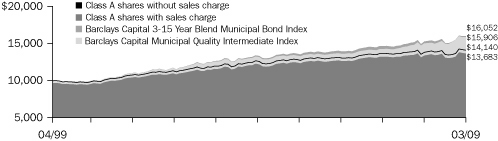 | |
|
The chart above shows the change in value of a hypothetical $10,000 investment in Class A shares of Columbia South Carolina Intermediate Municipal Bond Fund during the stated time period, and does not reflect the deduction of taxes that a shareholder may pay on fund distributions or on the redemption of fund shares. The Barclays Capital 3-15 Year Blend Municipal Bond Index tracks the performance of municipal bonds issued after December 31, 1990 with remaining maturities between 2 and 17 years and at least $7 million in principal amount outstanding. The Barclays Capital Municipal Quality Intermediate Index is an index of tax-free bonds with a minimum quality rating of A3 from Moody's Investors Service, Inc. and having a maturity range between two and eleven years. Indices are not available for investment, and do not reflect sales charges, fees, brokerage commissions, taxes or other expenses of investing. Securities in the fund ma y not match those in an index.
Performance of a $10,000 investment 04/01/99 – 03/31/09 ($)
| Sales charge | | without | | with | |
| Class A | | | 14,140 | | | | 13,683 | | |
| Class B | | | 13,143 | | | | 13,143 | | |
| Class C | | | 13,128 | | | | 13,128 | | |
| Class Z | | | 14,493 | | | | n/a | | |
Average annual total return as of 03/31/09 (%)
| Share class | | A | | B | | C | | Z | |
| Inception | | 05/05/92 | | 06/08/93 | | 06/17/92 | | 01/06/92 | |
| Sales charge | | without | | with | | without | | with | | without | | with | | without | |
| 1-year | | | 2.09 | | | | –1.27 | | | | 1.43 | | | | –1.52 | | | | 1.43 | | | | 0.45 | | | | 2.34 | | |
| 5-year | | | 2.30 | | | | 1.63 | | | | 1.56 | | | | 1.56 | | | | 1.54 | | | | 1.54 | | | | 2.56 | | |
| 10-year | | | 3.52 | | | | 3.19 | | | | 2.77 | | | | 2.77 | | | | 2.76 | | | | 2.76 | | | | 3.78 | | |
The "with sales charge" returns include the maximum initial sales charge of 3.25% for Class A shares and the applicable contingent deferred sales charge of 3.00% in the first year, declining to 1.00% in the fourth year and eliminated thereafter for Class B shares and 1.00% for Class C shares for the first year only. The "without sales charge" returns do not include the effect of sales charges. If they had, returns would be lower.
Performance results reflect any fee waivers or reimbursements of fund expenses by the investment advisor and/or any of its affiliates. Absent these fee waivers or expense reimbursement arrangements, performance results would have been lower.
All results shown assume the reinvestment of distributions. Class Z shares are sold at net asset value with no distribution and service (Rule 12b-1) fees. Class Z shares have limited eligibility and the investment minimum requirements may vary. Please see the fund's prospectus for details. Performance for different share classes will vary based on differences in sales charges and fees associated with each class.
The tables do not reflect the deduction of taxes that a shareholder may pay on fund distributions or on the redemption of fund shares.
Performance data quoted represents past performance and current performance may be lower or higher. Past performance is no guarantee of future results. The investment return and principal value will fluctuate so that shares, when redeemed, may be worth more or less than the original cost. Please visit www.columbiafunds.com for daily and most recent month-end performance updates.
Annual operating expense ratio (%)*
| Class A | | | 0.90 | | |
| Class B | | | 1.65 | | |
| Class C | | | 1.65 | | |
| Class Z | | | 0.65 | | |
Annual operating expense ratio
after contractual waivers (%)*
| Class A | | | 0.75 | | |
| Class B | | | 1.50 | | |
| Class C | | | 1.50 | | |
| Class Z | | | 0.50 | | |
*The annual operating expense ratio and annual operating expense ratio after contractual waivers are as stated in the fund's prospectus that is current as of the date of this report and include the expenses incurred by the investment companies in which the fund invests. The contractual waiver expires 07/31/09. Differences in expense ratios disclosed elsewhere in this report may result from including expenses incurred by the investment companies, fee waivers and expense reimbursements as well as different time periods used in calculating the ratios.
29
Understanding Your Expenses – Columbia South Carolina Intermediate Municipal Bond Fund
Estimating your actual expenses
To estimate the expenses that you paid over the period, first you will need your account balance at the end of the period:
g For shareholders who receive their account statements from Columbia Management Services, Inc., your account balance is available online at www.columbiafunds.com or by calling Shareholder Services at 800.345.6611.
g For shareholders who receive their account statements from their financial intermediary, contact your financial intermediary to obtain your account balance.
1. Divide your ending account balance by $1,000. For example, if an account balance was $8,600 at the end of the period, the result would be 8.6.
2. In the section of the table below titled "Expenses paid during the period," locate the amount for your share class. You will find this number in the column labeled "Actual." Multiply this number by the result from step 1. Your answer is an estimate of the expenses you paid on your account during the period.
If the value of your account falls below the minimum initial investment requirement applicable to you, your account generally will be subject to a $20 annual fee. This fee is not included in the accompanying table. If you are subject to the fee, keep it in mind when you are estimating the ongoing expenses of investing in the fund and when comparing the expenses of this fund with other funds.
As a fund shareholder, you incur two types of costs. There are transaction costs, which generally include sales charges on purchases and may include redemption fees or exchange fees. There are also ongoing costs, which generally include investment advisory fees, distribution and service (Rule 12b-1) fees and other fund expenses. The information on this page is intended to help you understand the ongoing costs of investing in the fund and to compare these costs with the ongoing costs of investing in other mutual funds.
Analyzing your fund's expenses by share class
To illustrate these ongoing costs, we have provided an example and calculated the expenses paid by investors in each share class during the period. The information in the following table is based on an initial investment of $1,000, which is invested at the beginning of the period and held for the entire period. Expense information is calculated two ways and each method provides you with different information. The amount listed in the "Actual" column is calculated using the fund's actual operating expenses and total return for the period. The amount listed in the "Hypothetical" column for each share class assumes that the return each year is 5% before expenses and is calculated based on the fund's actual operating expenses. You should not use the hypothetical account values and expenses to estimate either your actual account balance at the end of the period or the expenses you paid during this period.
Compare with other funds
Since all mutual funds are required to include the same hypothetical calculations about expenses in shareholder reports, you can use this information to compare the ongoing cost of investing in the fund with other funds. To do so, compare the 5% hypothetical example with the 5% hypothetical examples that appear in the shareholder reports of other funds. As you compare hypothetical examples of other funds, it is important to note that hypothetical examples are meant to highlight the ongoing costs of investing in a fund and do not reflect any transaction costs, such as sales charges, redemption fees or exchange fees.
10/01/08 – 03/31/09
| | | Account value at the
beginning of the period ($) | | Account value at the
end of the period ($) | | Expenses paid
during the period ($) | | Fund's annualized
expense ratio (%) | |
| | | Actual | | Hypothetical | | Actual | | Hypothetical | | Actual | | Hypothetical | | Actual | |
| Class A | | | 1,000.00 | | | | 1,000.00 | | | | 1,043.48 | | | | 1,021.19 | | | | 3.82 | | | | 3.78 | | | | 0.75 | | |
| Class B | | | 1,000.00 | | | | 1,000.00 | | | | 1,039.59 | | | | 1,017.45 | | | | 7.63 | | | | 7.54 | | | | 1.50 | | |
| Class C | | | 1,000.00 | | | | 1,000.00 | | | | 1,039.59 | | | | 1,017.45 | | | | 7.63 | | | | 7.54 | | | | 1.50 | | |
| Class Z | | | 1,000.00 | | | | 1,000.00 | | | | 1,044.78 | | | | 1,022.44 | | | | 2.55 | | | | 2.52 | | | | 0.50 | | |
Expenses paid during the period are equal to the annualized expense ratio for the share class, multiplied by the average account value over the period, then multiplied by the number of days in the fund's most recent fiscal half-year and divided by 365.
Had the investment advisor and/or any of its affiliates not waived fees or reimbursed a portion of expenses, account value at the end of the period would have been reduced.
It is important to note that the expense amounts shown in the table are meant to highlight only ongoing costs of investing in the fund and do not reflect any transaction costs, such as sales charges, redemption fees or exchange fees. Therefore, the hypothetical examples provided may not help you determine the relative total costs of owning shares of different funds. If these transaction costs were included, your costs would have been higher.
30
Portfolio Manager's Report – Columbia South Carolina Intermediate Municipal Bond Fund
For the 12-month period that ended March 31, 2009, the fund's Class A shares returned 2.09% without sales charge. The fund's benchmark, the Barclays Capital 3-15 Year Blend Municipal Bond Index,1 returned 4.81% for the period. The average return of the fund's peer group, the Lipper Other States Intermediate Municipal Debt Funds Classification,2 was 2.60%. The fund had more exposure than the index to lower-quality BBB-rated3 bonds, which underperformed higher quality issues, and less exposure to shorter-maturity bonds, which outperformed during the period. Both factors contributed to the fund's shortfall against its benchmark.
A trying year for South Carolina
The past year was a difficult one for the state of South Carolina and its municipal bond market. The recession hurt some of the state's largest industries, including textiles, manufacturing and tourism. Job losses mounted, pushing the state's unemployment rate to the second highest in the nation as of February 2009. Revenues from corporate and personal income taxes declined, while mortgage delinquencies rose. The state maintained its AAA credit rating largely because of its relatively conservative debt structure and fiscal management. Municipal bond insurers with AAA ratings were not so fortunate. Many insurers saw multiple downgrades, as the ratings agencies questioned their ability to cover losses on defaults. As the financial markets weakened, mergers of several major municipal bond broker/dealers resulted in fewer market participants, and credit markets froze. Heavy selling of long-term municipal bonds by institutional inves tors seeking to raise cash further pressured the sector, particularly towards the end of 2008, but that pressure eased somewhat during the first quarter of 2009.
Disappointing performance from lower quality issues
Market volatility sparked an investor flight to quality that caused higher-yielding, lower-quality municipal bonds to underperform. Among the fund's chief performance detractors were bonds issued by International Paper and Puerto Rico. The International Paper bonds, which carried a BBB rating, suffered as investors became concerned about the stability of the paper industry. The Puerto Rico bonds, which are insured but traded on their BBB underlying rating, performed poorly as the territory's economy contracted. Elsewhere, bonds secured by payments from investment bank Goldman Sachs were downgraded as a financial crisis unfolded and confidence in the guarantor deteriorated; we sold this position before period end.
1The Barclays Capital 3-15 Year Blend Municipal Bond Index tracks the performance of municipal bonds issued after December 31, 1990 with remaining maturities between 2 and 17 years and at least $7 million in principal amount outstanding.
Indices are not available for investment, and do not reflect sales charges, fees, brokerage commissions, taxes or other expenses of investing. Securities in the fund may not match those in an index.
2Lipper Inc., a widely respected data provider in the industry, calculates an average total return (assuming reinvestment of distributions) for mutual funds with investment objectives similar to those of the fund. Lipper makes no adjustment for the effect of sales loads.
3The credit quality ratings represent those of Moody's Investors Service, Inc. ("Moody's") or Standard & Poor's Corporation ("S&P"). The ratings represent their opinions as to the quality of the securities they rate. Ratings are relative and subjective and are not absolute standards of quality. The security's credit quality does not eliminate risk.
Performance data quoted represents past performance and current performance may be lower or higher. Past performance is no guarantee of future results. The investment return and principal value will fluctuate so that shares, when redeemed, may be worth more or less than the original cost. Please visit www.columbiafunds.com for daily and most recent month-end performance updates.
Net asset value per share
as of 03/31/09 ($)
| Class A | | | 9.84 | | |
| Class B | | | 9.85 | | |
| Class C | | | 9.85 | | |
| Class Z | | | 9.84 | | |
Distribution declared per share
04/01/08 – 03/31/09 ($)
| Class A | | | 0.37 | | |
| Class B | | | 0.30 | | |
| Class C | | | 0.30 | | |
| Class Z | | | 0.40 | | |
A portion of the fund's income may be subject to the alternative minimum tax. The fund may at times purchase tax-exempt securities at a discount. Some, or all, of this discount may be included in the fund's ordinary income, and is taxable when distributed.
30-day SEC yields
as of 03/31/09 (%)
| Class A | | | 3.04 | | |
| Class B | | | 2.41 | | |
| Class C | | | 2.40 | | |
| Class Z | | | 3.40 | | |
The 30-day SEC yields reflect the fund's earning power, net of expenses, expressed as an annualized percentage of the public offering price per share at the end of the period.
Taxable-equivalent SEC yields
as of 03/31/09 (%)
| Class A | | | 5.04 | | |
| Class B | | | 3.99 | | |
| Class C | | | 3.97 | | |
| Class Z | | | 5.62 | | |
Taxable-equivalent SEC yields are based on the combined maximum effective 35.0% federal income tax rate and applicable state income tax rate. This tax rate does not reflect the phase out of exemptions or the reduction of the otherwise allowable deductions that occur when adjusted gross income exceeds certain levels.
31
Portfolio Manager's Report (continued) – Columbia South Carolina Intermediate Municipal Bond Fund
Top 5 sectors
as of 03/31/09 (%)
| Tax-Backed | | | 33.3 | | |
| Utilities | | | 19.4 | | |
| Health Care | | | 18.9 | | |
| Other | | | 8.4 | | |
| Education | | | 2.8 | | |
Maturity breakdown
as of 03/31/09 (%)
| 0-1 year | | | 2.9 | | |
| 1-3 years | | | 9.2 | | |
| 3-5 years | | | 8.9 | | |
| 5-7 years | | | 11.0 | | |
| 7-10 years | | | 28.3 | | |
| 10-15 years | | | 26.1 | | |
| 15-20 years | | | 3.5 | | |
| 20-25 years | | | 0.9 | | |
| 25 years and over | | | 0.4 | | |
| Cash and Equivalents | | | 8.8 | | |
Quality breakdown
as of 03/31/09 (%)
| AAA | | | 39.6 | | |
| AA | | | 26.1 | | |
| A | | | 17.4 | | |
| BBB | | | 12.5 | | |
| Not Rated | | | 4.4 | | |
Sector weightings are calculated as a percentage of net assets.
Quality and maturity breakdowns are calculated as a percentage of total investments.
Ratings shown in the quality breakdown represent the rating assigned to a particular bond by one of the following nationally recognized rating agencies: Standard and Poor's, a division of The McGraw-Hill Companies, Inc., Moody's Investors Service, Inc. or Fitch Ratings Ltd. Ratings are relative and subjective and are not absolute standards of quality. The fund's credit quality does not remove market risk.
The fund is actively managed and the composition of its portfolio will change over time.
Upside from refunded and essential service bonds
Among the bonds that helped performance were refunded bonds, about 8% of assets at period end. Refunding occurs when an issuer takes advantage of lower interest rates by issuing new bonds and setting aside the proceeds, typically in federal government securities, to pay off or retire older bonds. The process of refunding shortens the bonds' maturities and boosts their credit quality. Water and sewer bonds also added to returns, as demand increased for bonds with relatively stable income streams. People tend to pay for these essential services even in a recession. The fund also benefited from owning some short Treasury market futures contracts during the period.
Additions to longer-term and higher quality holdings
Over the course of the year, the Federal Reserve Board ratcheted down a key overnight lending rate, driving high quality municipal yields down and prices up across all maturities. However, short-term yields declined more than long-term yields and the fund gave up some performance because it did not have as much exposure as the index to short-term bonds. We used the spike in short-term bond prices to sell some of those bonds and buy higher-yielding bonds with 10- to 15-year maturities, which accounted for more than one quarter of the fund's assets at period end. We believe that these longer-maturity holdings could benefit from continued low inflation, which should keep yields relatively stable. At period end, the fund had a 17% stake in hospital bonds and a sizable stake in higher quality local general obligation (GO), appropriation and refunded bonds. These higher quality bonds could provide a modest cushion against further dete riorations in the state's economy.
Portfolio holdings and characteristics are subject to change periodically and may not be representative of current holdings and characteristics. The outlook for the fund may differ from those presented for other Columbia Funds.
Tax-exempt investing offers current tax-exempt income, but it also involves certain risks. The value of the fund will be affected by interest rate changes and the creditworthiness of issues held in the fund. When interest rates go up, bond prices generally drop and vice versa.
Interest income from certain tax-exempt bonds may be subject to certain state and local taxes and, if applicable, the alternative minimum tax. Capital gains are not exempt from income taxes.
Single-state municipal bond funds pose additional risks due to limited geographical diversification.
32
Fund Profile – Columbia Virginia Intermediate Municipal Bond Fund
Summary
g For the 12-month period that ended March 31, 2009, the fund's Class A shares returned 2.83% without sales charge.
g The fund outperformed its peer group, the Lipper Other States Intermediate Municipal Debt Funds Classification1 but lagged its benchmark, the Barclays Capital 3-15 Year Blend Municipal Bond Index.2
g The fund had more exposure to lower quality bonds and less exposure to shorter-maturity bonds, which accounted for a portion of its shortfall relative to the index. Fees also hampered the fund's return relative to the index. The fund incurs fees while the index does not.
Portfolio Management
Maureen G. Newman has managed fund since 2009 and has been with the advisor or its predecessors or affiliate organizations since 1996.
1Lipper Inc., a widely respected data provider in the industry, calculates an average total return (assuming reinvestment of distributions) for mutual funds with investment objectives similar to those of the fund. Lipper makes no adjustment for the effect of sales loads.
2The Barclays Capital 3-15 Year Blend Municipal Bond Index tracks the performance of municipal bonds issued after December 31, 1990 with remaining maturities between 2 and 17 years and at least $7 million in principal amount outstanding.
3The Barclays Capital Municipal Quality Intermediate Index is an index of tax-free bonds with a minimum quality rating of A3 from Moody's Investors Service, Inc. and having a maturity range between two and eleven years.
Indices are not available for investment, and do not reflect sales charges, fees, brokerage commissions, taxes or other expenses of investing. Securities in the fund may not match those in an index.
Performance data quoted represents past performance and current performance may be lower or higher. Past performance is no guarantee of future results. The investment return and principal value will fluctuate so that shares, when redeemed, may be worth more or less than the original cost. Please visit www.columbiafunds.com for daily and most recent month-end performance updates.
Summary
1-year return as of 03/31/09
| | | +2.83% | |
|
| |  | | | Class A shares
(without sales charge) | |
|
| | | +4.81% | |
|
| |  | | | Barclays Capital 3-15 Year
Blend Municipal Bond Index | |
|
| | | +5.60% | |
|
| |  | | | Barclays Capital Municipal
Quality Intermediate Index3 | |
|
Morningstar Style BoxTM

The Morningstar Style BoxTM reveals a fund's investment strategy. For fixed-income funds, the vertical axis shows the average credit quality of the bonds owned and the horizontal axis shows interest rate sensitivity as measured by a bond's duration (short, intermediate or long). Information shown is based on the most recent data provided by Morningstar.
33
Performance Information – Columbia Virginia Intermediate Municipal Bond Fund
Performance data quoted represents past performance and current performance may be lower or higher. Past performance is no guarantee of future results. The investment return and principal value will fluctuate so that shares, when redeemed, may be worth more or less than the original cost. Please visit www.columbiafunds.com for daily and most recent month-end performance updates.
Annual operating expense ratio (%)*
| Class A | | | 0.87 | | |
| Class B | | | 1.62 | | |
| Class C | | | 1.62 | | |
| Class Z | | | 0.62 | | |
Annual operating expense ratio
after contractual waivers (%)*
| Class A | | | 0.75 | | |
| Class B | | | 1.50 | | |
| Class C | | | 1.50 | | |
| Class Z | | | 0.50 | | |
*The annual operating expense ratio and annual operating expense ratio after contractual waivers are as stated in the fund's prospectus that is current as of the date of this report and include the expenses incurred by the investment companies in which the fund invests. The contractual waiver expires 07/31/09. Differences in expense ratios disclosed elsewhere in this report may result from including expenses incurred by the investment companies, fee waivers and expense reimbursements as well as different time periods used in calculating the ratios.
Performance of a $10,000 investment 04/01/99 – 03/31/09 ($)
 | |
|
The chart above shows the growth in value of a hypothetical $10,000 investment in Class A shares of the Columbia Virginia Intermediate Municipal Bond Fund during the stated time period, and does not reflect the deduction of taxes that a shareholder may pay on fund distributions or on the redemption of fund shares. The Barclays Capital 3-15 Year Blend Municipal Bond Index tracks the performance of municipal bonds issued after December 31, 1990 with remaining maturities between 2 and 17 years and at least $7 million in principal amount outstanding. The Barclays Capital Municipal Quality Intermediate Index is an index of tax-free bonds with a minimum quality rating of A3 from Moody's Investors Service, Inc. and having a maturity range between two and eleven years. Indices are not available for investment, and do not reflect sales charges, fees, brokerage commissions, taxes or other expenses of investing. Securities in the fund may not match those in an index.
Performance of a $10,000 investment 04/01/99 – 03/31/09 ($)
| Sales charge | | without | | with | |
| Class A | | | 14,323 | | | | 13,856 | | |
| Class B | | | 13,298 | | | | 13,298 | | |
| Class C | | | 13,287 | | | | 13,287 | | |
| Class Z | | | 14,681 | | | | n/a | | |
Average annual total return as of 03/31/09 (%)
| Share class | | A | | B | | C | | Z | |
| Inception | | 12/05/89 | | 06/07/93 | | 06/17/92 | | 09/20/89 | |
| Sales charge | | without | | with | | without | | with | | without | | with | | without | |
| 1-year | | | 2.83 | | | | –0.53 | | | | 2.07 | | | | –0.91 | | | | 2.07 | | | | 1.07 | | | | 3.09 | | |
| 5-year | | | 2.57 | | | | 1.89 | | | | 1.79 | | | | 1.79 | | | | 1.80 | | | | 1.80 | | | | 2.82 | | |
| 10-year | | | 3.66 | | | | 3.31 | | | | 2.89 | | | | 2.89 | | | | 2.88 | | | | 2.88 | | | | 3.91 | | |
The "with sales charge" returns include the maximum initial sales charge of 3.25% for Class A shares and the applicable contingent deferred sales charge of 3.00% in the first year, declining to 1.00% in the fourth year and eliminated thereafter for Class B shares and 1.00% for Class C shares for the first year only. The "without sales charge" returns do not include the effect of sales charges. If they had, returns would be lower.
Performance results reflect any fee waivers or reimbursements of fund expenses by the investment advisor and/or any of its affiliates. Absent these fee waivers or expense reimbursement arrangements, performance results would have been lower.
All results shown assume reinvestment of distributions. Class Z shares are sold at net asset value with no distribution and service (Rule 12b-1) fees. Class Z shares have limited eligibility and the investment minimum requirements may vary. Please see the fund's prospectus for details. Performance for different share classes will vary based on differences in sales charges and fees associated with each class.
The table does not reflect the deduction of taxes that a shareholder may pay on fund distributions or on the redemption of fund shares.
34
Understanding Your Expenses – Columbia Virginia Intermediate Municipal Bond Fund
As a fund shareholder, you incur two types of costs. There are transaction costs, which generally include sales charges on purchases and may include redemption fees or exchange fees. There are also ongoing costs, which generally include investment advisory fees, distribution and service (Rule 12b-1) fees and other fund expenses. The information on this page is intended to help you understand the ongoing costs of investing in the fund and to compare these costs with the ongoing costs of investing in other mutual funds.
Analyzing your fund's expenses by share class
To illustrate these ongoing costs, we have provided an example and calculated the expenses paid by investors in each share class during the period. The information in the following table is based on an initial investment of $1,000, which is invested at the beginning of the period and held for the entire period. Expense information is calculated two ways and each method provides you with different information. The amount listed in the "Actual" column is calculated using the fund's actual operating expenses and total return for the period. The amount listed in the "Hypothetical" column for each share class assumes that the return each year is 5% before expenses and is calculated based on the fund's actual operating expenses. You should not use the hypothetical account values and expenses to estimate either your actual account balance at the end of the period or the expenses you paid during this period.
Compare with other funds
Since all mutual funds are required to include the same hypothetical calculations about expenses in shareholder reports, you can use this information to compare the ongoing cost of investing in the fund with other funds. To do so, compare the 5% hypothetical example with the 5% hypothetical examples that appear in the shareholder reports of other funds. As you compare hypothetical examples of other funds, it is important to note that hypothetical examples are meant to highlight the ongoing costs of investing in a fund and do not reflect any transaction costs, such as sales charges, redemption fees or exchange fees.
Estimating your actual expenses
To estimate the expenses that you paid over the period, first you will need your account balance at the end of the period:
g For shareholders who receive their account statements from Columbia Management Services, Inc., your account balance is available online at www.columbiafunds.com or by calling Shareholder Services at 800.345.6611.
g For shareholders who receive their account statements from their financial intermediary, contact your financial intermediary to obtain your account balance.
1. Divide your ending account balance by $1,000. For example, if an account balance was $8,600 at the end of the period, the result would be 8.6.
2. In the section of the table below titled "Expenses paid during the period," locate the amount for your share class. You will find this number in the column labeled "Actual." Multiply this number by the result from step 1. Your answer is an estimate of the expenses you paid on your account during the period.
If the value of your account falls below the minimum initial investment requirement applicable to you, your account generally will be subject to a $20 annual fee. This fee is not included in the accompanying table. If you are subject to the fee, keep it in mind when you are estimating the ongoing expenses of investing in the fund and when comparing the expenses of this fund with other funds.
10/01/08 – 03/31/09
| | | Account value at the
beginning of the period ($) | | Account value at the
end of the period ($) | | Expenses paid
during the period ($) | | Fund's annualized
expense ratio (%) | |
| | | Actual | | Hypothetical | | Actual | | Hypothetical | | Actual | | Hypothetical | | Actual | |
| Class A | | | 1,000.00 | | | | 1,000.00 | | | | 1,049.81 | | | | 1,021.19 | | | | 3.83 | | | | 3.78 | | | | 0.75 | | |
| Class B | | | 1,000.00 | | | | 1,000.00 | | | | 1,045.92 | | | | 1,017.45 | | | | 7.65 | | | | 7.54 | | | | 1.50 | | |
| Class C | | | 1,000.00 | | | | 1,000.00 | | | | 1,045.92 | | | | 1,017.45 | | | | 7.65 | | | | 7.54 | | | | 1.50 | | |
| Class Z | | | 1,000.00 | | | | 1,000.00 | | | | 1,051.11 | | | | 1,022.44 | | | | 2.56 | | | | 2.52 | | | | 0.50 | | |
Expenses paid during the period are equal to the annualized expense ratio for the share class, multiplied by the average account value over the period, then multiplied by the number of days in the fund's most recent fiscal half-year and divided by 365.
Had the investment advisor and/or any of its affiliates not waived fees or reimbursed a portion of expenses, account value at the end of the period would have been reduced.
It is important to note that the expense amounts shown in the table are meant to highlight only ongoing costs of investing in the fund and do not reflect any transaction costs, such as sales charges, redemption fees or exchange fees. Therefore, the hypothetical examples provided may not help you determine the relative total costs of owning shares of different funds. If these transaction costs were included, your costs would have been higher.
35
Portfolio Manager's Report – Columbia Virginia Intermediate Municipal Bond Fund
Performance data quoted represents past performance and current performance may be lower or higher. Past performance is no guarantee of future results. The investment return and principal value will fluctuate so that shares, when redeemed, may be worth more or less than the original cost. Please visit www.columbiafunds.com for daily and most recent month-end performance updates.
Net asset value per share
as of 03/31/09 ($)
| Class A | | | 10.57 | | |
| Class B | | | 10.57 | | |
| Class C | | | 10.57 | | |
| Class Z | | | 10.57 | | |
Distributions declared per share
04/01/08 – 03/31/09 ($)
| Class A | | | 0.37 | | |
| Class B | | | 0.29 | | |
| Class C | | | 0.29 | | |
| Class Z | | | 0.40 | | |
A portion of the fund's income may be subject to the alternative minimum tax. The fund may at times purchase tax-exempt securities at a discount. Some, or all, of this discount may be included in the fund's ordinary income, and is taxable when distributed.
30-day SEC yields
as of 03/31/09 (%)
| Class A | | | 2.90 | | |
| Class B | | | 2.27 | | |
| Class C | | | 2.25 | | |
| Class Z | | | 3.25 | | |
The 30-day SEC yields reflect the fund's earning power, net of expenses, expressed as an annualized percentage of the public offering price per share at the end of the period.
Taxable-equivalent SEC yields
as of 03/31/09 (%)
| Class A | | | 4.74 | | |
| Class B | | | 3.70 | | |
| Class C | | | 3.68 | | |
| Class Z | | | 5.30 | | |
Taxable-equivalent SEC yields are based on the combined maximum effective 35.0% federal income tax rate and applicable state income tax rate. This tax rate does not reflect the phase out of exemptions or the reduction of the otherwise allowable deductions that occur when adjusted gross income exceeds certain levels.
For the 12-month period that ended March 31, 2009, the fund's Class A shares returned 2.83% without sales charge. The fund's benchmark, the Barclays Capital 3-15 Year Blend Municipal Bond Index,1 returned 4.81% for the same period. The average return of the fund's peer group, the Lipper Other States Intermediate Municipal Debt Funds Classification,2 was 2.60%. The fund had more exposure to lower quality bonds and less exposure to shorter-maturity bonds, which accounted for its shortfall relative to the index. We believe the fund's focus on Virginia helped it outperform its broad Lipper peer group, as the Commonwealth weathered the past year's downturn better than most other states.
On February 20, 2009, Maureen G. Newman became the portfolio manager for the fund.
Attracted to Virginia's economic strength
In the midst of the recession, Virginia's economy benefited from strength in the Washington, D.C. area as well as in the Newport News area on the coast. Like most states, Virginia struggled with a budget shortfall, but took steps to close the gap and maintain its AAA credit rating.3 During the past year, investors nationwide became more risk averse as credit markets froze, municipal bond insurers' credit ratings dropped, and key broker/dealers disappeared from the municipal market. Yields rose and prices fell on lower-quality municipal bonds, but high-quality bonds, such as those issused by the Commonwealth of Virginia, held up well.
Gains from essential purpose bonds
Among the fund's better performers were bonds issued by the State Clean Water program, the City of Richmond and several counties close to Washington, D.C., including Loudoun, Fairfax and Arlington. The Clean Water bonds benefited from being high quality, essential purpose bonds. Essential purpose bonds are backed by payments for basic utility services, which people tend to pay for even in a recession. The high quality, relatively short maturity Richmond general obligation (GO) bonds also did well. The bonds issued by counties around D.C. attracted investor interest because these areas held up well as the economy slowed.
Some lower quality bonds, including bonds that rely on a local sales tax, detracted from the fund's performance. As the economy slowed and consumer spending stalled, sales tax receipts declined. Bonds issued by International Paper further hampered returns as investors worried about the impact of recession on profits in the paper industry.
1The Barclays Capital 3-15 Year Blend Municipal Bond Index tracks the performance of municipal bonds issued after December 31, 1990 with remaining maturities between 2 and 17 years and at least $7 million in principal amount outstanding.
Indices are not available for investment, and do not reflect sales charges, fees, brokerage commissions, taxes or other expenses of investing. Securities in the fund may not match those in an index.
2Lipper Inc., a widely respected data provider in the industry, calculates an average total return (assuming reinvestment of distributions) for mutual funds with investment objectives similar to those of the fund. Lipper makes no adjustment for the effect of sales loads.
3The credit quality ratings represent those of Moody's Investors Service, Inc. ("Moody's") or Standard & Poor's Corporation ("S&P"). The ratings represent their opinions as to the quality of the securities they rate. Ratings are relative and subjective and are not absolute standards of quality. The security's credit quality does not eliminate risk.
36
Portfolio Manager's Report (continued) – Columbia Virginia Intermediate Municipal Bond Fund
Move out on the yield curve
As short-term yields declined more than intermediate- or long-term yields, short-term municipal bonds led the market. Because we did not have as much exposure as the index to short-term bonds, we gave up some performance. However, we took profits on many of the fund's short-term bonds and took advantage of the higher yields offered by intermediate and long-term bonds because we believe they offer more potential going forward.
Steady outlook for state's muni issues
We expect Virginia to remain fiscally sound, as the Commonwealth's economy benefits from a focus on government services, the military, aerospace, health care and education as well as its educated workforce and high income levels. We believe that the fund is well positioned within the Virginia municipal market with a 19% stake in high-quality county and city general obligation (GO) bonds and approximately 8% in state obligations at the end of the period. We expect to maintain a higher percentage than either the Barclays index or Lipper peer group in bonds that mature in five to 15 years because we believe that these intermediate-term bonds may offer a yield advantage over short-term issues, solid total return potential and less risk than is commonly associated with longer-term securities. At period end, the fund had about 67% of its assets invested in five- to 15-year bonds.
Portfolio holdings and characteristics are subject to change periodically and may not be representative of current holdings and characteristics. The outlook for the fund may differ from those presented for other Columbia Funds.
Tax-exempt investing offers current tax-exempt income, but it also involves certain risks. The value of the fund will be affected by interest rate changes and the creditworthiness of issues held in the fund. When interest rates go up, bond prices generally drop and vice versa.
Interest income from certain tax-exempt bonds may be subject to certain state and local taxes and, if applicable, the alternative minimum tax. Capital gains are not exempt from income taxes.
Single-state municipal bond funds pose additional risks due to limited geographical diversification.
Top 5 sectors
as of 03/31/09 (%)
| Tax-Backed | | | 49.9 | | |
| Pool/Bond Bank | | | 9.8 | | |
| Refunded/Escrowed | | | 8.2 | | |
| Health Care | | | 8.0 | | |
| Utilities | | | 6.9 | | |
Quality breakdown
as of 03/31/09 (%)
| Aaa/AAA | | | 41.1 | | |
| Aa/AA | | | 40.3 | | |
| A | | | 6.2 | | |
| Baa/BBB | | | 8.9 | | |
| Not Rated | | | 3.5 | | |
Maturity breakdown
as of 03/31/09 (%)
| 0-1 year | | | 1.5 | | |
| 1-3 years | | | 9.2 | | |
| 3-5 years | | | 7.0 | | |
| 5-7 years | | | 17.8 | | |
| 7-10 years | | | 19.3 | | |
| 10-15 years | | | 30.3 | | |
| 15-20 years | | | 8.6 | | |
| 20-25 years | | | 1.9 | | |
| Cash and equivalents | | | 4.4 | | |
Sector weightings are calculated as a percentage of net assets.
Quality and maturity breakdowns are calculated as a percentage of total investments.
Ratings shown in the quality breakdown represent the rating assigned to a particular bond by one of the following nationally recognized rating agencies: Standard and Poor's, a division of The McGraw-Hill Companies, Inc., Moody's Investors Service, Inc. or Fitch Ratings Ltd. Ratings are relative and subjective and are not absolute standards of quality. The fund's credit quality does not remove market risk.
The fund is actively managed and the composition of its portfolio will change over time.
37
Investment Portfolio – Columbia Short Term Municipal Bond Fund
March 31, 2009
| Municipal Bonds – 84.6% | |
| | | Par ($) | | Value ($) | |
| Education – 4.8% | |
| Education – 4.8% | |
| AL Public School & College Authority | |
Series 2007,
5.000% 12/01/11 | | | 10,215,000 | | | | 11,178,887 | | |
| DE University of Delaware | |
Series 2009 A,
2.000% 11/01/37 (a) | | | 10,750,000 | | | | 10,756,128 | | |
| FL University Athletic Association, Inc. | |
Series 2006,
LOC: SunTrust Bank
3.800% 10/01/31 (a) | | | 3,510,000 | | | | 3,610,456 | | |
GA Private Colleges &
Universities Authority | |
Emory University,
Series 2008 B,
5.000% 09/01/11 | | | 7,400,000 | | | | 8,065,186 | | |
IN St. Joseph County
Educational Facilities Revenue | |
University Notre Dame Du Lac,
Series 2005,
3.875% 03/01/40 (a) | | | 6,700,000 | | | | 6,942,942 | | |
| NJ Educational Facilities Authority | |
Princeton University,
Series 2008 K,
5.000% 07/01/11 | | | 2,965,000 | | | | 3,227,492 | | |
NY Troy Industrial Development
Authority | |
Rensselaer Polytechnic Institute,
Series 2002 E,
4.050% 04/01/37 (a) | | | 2,500,000 | | | | 2,522,225 | | |
| PA University of Pittsburgh | |
Series 2007,
5.000% 08/01/10 | | | 10,125,000 | | | | 10,554,806 | | |
Series 2009 A,
4.000% 09/15/10 | | | 4,720,000 | | | | 4,898,038 | | |
| Education Total | | | 61,756,160 | | |
| Education Total | | | 61,756,160 | | |
| Health Care – 5.4% | |
| Hospitals – 5.3% | |
| AZ Health Facilities Authority | |
Banner Health System,
Series 2008 D,
5.000% 01/01/12 | | | 2,000,000 | | | | 2,056,720 | | |
| | | Par ($) | | Value ($) | |
| CO Health Facilities Authority | |
Catholic Health Initiatives:
Series 2008 C-4,
3.750% 10/01/41 (a) | | | 5,000,000 | | | | 5,046,200 | | |
Series 2008 C-6,
3.950% 09/01/36 (a) | | | 4,125,000 | | | | 4,156,061 | | |
Series 2008 D,
5.250% 10/01/38 | | | 2,500,000 | | | | 2,601,600 | | |
| IL Finance Authority | |
Advocate Healthcare Network,
Series 2008 A3,
3.875% 11/01/30 (a) | | | 2,250,000 | | | | 2,250,000 | | |
Northwestern Memorial Hospital,
Series 2009 A:
5.000% 08/15/11 | | | 2,450,000 | | | | 2,589,871 | | |
| 5.000% 08/15/12 | | | 5,130,000 | | | | 5,502,592 | | |
| 5.000% 08/15/13 | | | 3,500,000 | | | | 3,762,430 | | |
| IN Finance Authority | |
Ascension Health,
Series 2008 E-4,
3.500% 11/15/36 (a) | | | 5,350,000 | | | | 5,436,242 | | |
| IN Health Facility Financing Authority | |
Series 2001 A2,
3.750% 11/15/36 (a) | | | 9,675,000 | | | | 9,687,771 | | |
MA Health & Educational
Facilities Authority | |
Caregroup Inc.,
Series 2008 E-2,
5.000% 07/01/12 | | | 2,500,000 | | | | 2,505,750 | | |
| MA Industrial Finance Agency | |
Massachusetts Biomedical
Research Corp.,
Series 1989 A-2,
(b) 08/01/10 | | | 5,750,000 | | | | 5,629,537 | | |
MD Health & Higher Educational
Facilities Authority | |
Johns Hopkins Hospital,
Series 2008,
5.000% 05/15/42 (a) | | | 4,450,000 | | | | 4,696,664 | | |
| MI Kent Hospital Financial Authority | |
Series 2008 A,
5.000% 01/15/47 (a) | | | 1,300,000 | | | | 1,326,676 | | |
See Accompanying Notes to Financial Statements.
38
Columbia Short Term Municipal Bond Fund
March 31, 2009
| Municipal Bonds (continued) | |
| | | Par ($) | | Value ($) | |
| NV Reno Hospital | |
Renown Regional Medical
Center Project,
Series 2007 A:
5.000% 06/01/11 | | | 650,000 | | | | 654,141 | | |
| 5.000% 06/01/12 | | | 815,000 | | | | 813,484 | | |
| 5.000% 06/01/13 | | | 500,000 | | | | 497,130 | | |
| OK Development Finance Authority | |
Integris Baptist Medical Center,
Series 2008 B,
5.000% 08/15/11 | | | 4,590,000 | | | | 4,879,445 | | |
PA Allegheny County Hospital
Development Authority | |
University of Pittsburgh
Medical Center,
Series 2008 A,
5.000% 09/01/11 | | | 2,600,000 | | | | 2,698,228 | | |
TX Tarrant County Cultural
Education Facilities Finance Corp. | |
Scott and White Memorial Hospital,
Series 2008,
5.000% 08/15/11 | | | 1,275,000 | | | | 1,320,951 | | |
| Hospitals Total | | | 68,111,493 | | |
| Nursing Homes – 0.1% | |
| CO Health Facilities Authority | |
Evangelical Lutheran Foundation,
Series 2004 B,
3.750% 06/01/34 (a) | | | 1,500,000 | | | | 1,502,145 | | |
| Nursing Homes Total | | | 1,502,145 | | |
| Health Care Total | | | 69,613,638 | | |
| Housing – 3.1% | |
| Multi-Family – 1.8% | |
| CO Housing Finance Authority | |
Series 2008 D,
4.750% 05/15/18 | | | 7,000,000 | | | | 7,260,960 | | |
| GA Clayton County Housing Authority | |
GCC Ventures LLC,
Series 2001,
Guarantor: FNMA
4.350% 12/01/31 (a) | | | 3,095,000 | | | | 3,255,909 | | |
| IL State Housing Development Authority | |
Series 2006 G,
3.900% 01/01/10 | | | 1,595,000 | | | | 1,612,513 | | |
| | | Par ($) | | Value ($) | |
| KY Housing Corp. | |
Clarksdale Rental III Limited,
Series 2007, AMT,
LOC: JPMorgan Chase Bank
4.000% 09/01/09 | | | 4,400,000 | | | | 4,434,100 | | |
| MA Housing Finance Agency | |
Series 2004 A, AMT,
Insured: FSA
4.250% 07/01/10 | | | 6,630,000 | | | | 6,738,865 | | |
| Multi-Family Total | | | 23,302,347 | | |
| Single-Family – 1.3% | |
| DE Housing Authority | |
Single Family Mortgage,
Series 2008 B,
4.250% 07/01/33 | | | 6,000,000 | | | | 6,001,440 | | |
VA Housing Development
Authority Commonwealth Mortgage | |
Series 2004 A Subser A-2, AMT,
3.450% 07/01/09 | | | 2,580,000 | | | | 2,589,133 | | |
Series 2004 A Subser A-3, AMT,
3.850% 04/01/10 | | | 2,400,000 | | | | 2,424,432 | | |
| VA Housing Development Authority | |
Series 2004 A, AMT:
3.700% 10/01/09 | | | 2,960,000 | | | | 2,983,739 | | |
| 3.900% 10/01/10 | | | 2,740,000 | | | | 2,781,155 | | |
| Single-Family Total | | | 16,779,899 | | |
| Housing Total | | | 40,082,246 | | |
| Other – 12.2% | |
| Other – 0.8% | |
| OH American Municipal Power, Inc. | |
Series 2007 A,
GTY AGMT: Goldman Sachs
Group, Inc.
5.000% 02/01/10 | | | 3,000,000 | | | | 2,991,630 | | |
| TN Energy Acquisition Corporation | |
Series 2006 A,
5.000% 09/01/09 | | | 3,750,000 | | | | 3,716,212 | | |
TX Municipal Gas Acquisition &
Supply Corp. Il | |
Series 2007,
1.284% 09/15/10 (a) | | | 2,505,000 | | | | 2,238,844 | | |
See Accompanying Notes to Financial Statements.
39
Columbia Short Term Municipal Bond Fund
March 31, 2009
| Municipal Bonds (continued) | |
| | | Par ($) | | Value ($) | |
TX Municipal Gas Acquisition &
Supply Corp. | |
Series 2006 A,
5.000% 12/15/10 | | | 1,500,000 | | | | 1,404,390 | | |
| Other Total | | | 10,351,076 | | |
| Pool/Bond Bank – 0.7% | |
| MI Municipal Bond Authority | |
Series 2002,
5.250% 06/01/09 | | | 7,500,000 | | | | 7,551,675 | | |
Series 2003 A,
5.250% 06/01/10 | | | 1,900,000 | | | | 1,987,020 | | |
| Pool/Bond Bank Total | | | 9,538,695 | | |
| Recreation – 2.1% | |
CA Infrastructure & Economic
Development Bank | |
J. Paul Getty Trust:
Series 2007 A3,
1.000% 10/01/47 (a) | | | 5,175,000 | | | | 5,170,239 | | |
Series 2007 A4,
1.000% 10/01/47 (a) | | | 2,325,000 | | | | 2,326,813 | | |
OR Department of
Administrative Services | |
Series 2002 B:
Insured: FSA
5.250% 05/01/15 | | | 6,020,000 | | | | 6,348,090 | | |
Insured: MBIA
5.250% 05/01/16 | | | 6,085,000 | | | | 6,369,900 | | |
Series 2004 A,
Insured: FSA
5.000% 04/01/11 | | | 5,010,000 | | | | 5,367,564 | | |
Series 2009 A,
3.000% 04/01/11 | | | 2,000,000 | | | | 2,064,100 | | |
| Recreation Total | | | 27,646,706 | | |
| Refunded/Escrowed (c) – 8.4% | |
CA Statewide Communities
Development Authority | |
Corporate Fund for Housing,
Series 1999 A,
Pre-refunded 12/01/09,
6.500% 12/01/29 | | | 11,475,000 | | | | 12,186,679 | | |
| GA Atlanta Airport Facilities | |
Series 2000 A,
Pre-refunded 01/01/10,
Insured: FGIC
5.600% 01/01/30 | | | 6,955,000 | | | | 7,287,240 | | |
| | | Par ($) | | Value ($) | |
| IL Chicago Water Revenue | |
Series 2000,
Pre-refunded 11/01/10,
5.875% 11/01/30 | | | 4,000,000 | | | | 4,353,960 | | |
| IL Health Facilities Authority | |
Riverside Health Systems,
Series 2000,
Pre-refunded 11/15/10,
6.850% 11/15/29 | | | 4,000,000 | | | | 4,396,440 | | |
| LA State | |
Series 2000 A,
Pre-refunded 11/15/10,
Insured: FGIC
5.250% 11/15/17 | | | 5,005,000 | | | | 5,356,902 | | |
MI Plymouth Canton Community
School District | |
Series 1999,
Pre-refunded 05/01/09,
4.750% 05/01/14 | | | 2,475,000 | | | | 2,483,984 | | |
MO State Health & Educational
Facilities Authority | |
SSM Healthcare System,
Series 2001 A,
Pre-refunded 06/01/11,
5.250% 06/01/28 | | | 2,000,000 | | | | 2,179,520 | | |
| MS State | |
Capital Improvements,
Series 2002,
Pre-refunded 11/01/12,
Insured: FGIC
5.250% 11/01/13 | | | 7,925,000 | | | | 8,897,715 | | |
NJ Tobacco Settlement
Financing Corp. | |
Series 2002,
Pre-refunded 12/01/12,
6.125% 06/01/42 | | | 6,425,000 | | | | 7,368,447 | | |
| OH County of Hamilton | |
Series 2000 B,
Pre-refunded 12/01/10,
5.250% 12/01/32 | | | 8,845,000 | | | | 9,468,219 | | |
| OK Development Finance Authority | |
Hillcrest Health Medical Center,
Series 1999,
Pre-refunded 08/15/09,
5.625% 08/15/29 | | | 15,500,000 | | | | 15,924,545 | | |
See Accompanying Notes to Financial Statements.
40
Columbia Short Term Municipal Bond Fund
March 31, 2009
| Municipal Bonds (continued) | |
| | | Par ($) | | Value ($) | |
| PA Philadelphia | |
Series 2001,
Pre-refunded 03/15/11,
Insured: FSA
5.000% 09/15/31 | | | 8,000,000 | | | | 8,619,600 | | |
| SC Greenville County School District | |
Series 2002,
Pre-refunded 12/01/12,
5.875% 12/01/16 | | | 5,475,000 | | | | 6,419,657 | | |
| TX City of Wichita Falls | |
Series 2001,
Pre-refunded 08/01/11,
5.375% 08/01/20 | | | 1,500,000 | | | | 1,647,765 | | |
| TX County of Bexar | |
Series 2000,
Pre-refunded 08/15/10,
Insured: MBIA
5.750% 08/15/22 | | | 9,915,000 | | | | 10,566,019 | | |
VA Tobacco Settlement
Financing Corp. | |
Series 2005,
Refunded to Various Dates,
4.000% 06/01/13 | | | 731,000 | | | | 734,501 | | |
| Refunded/Escrowed Total | | | 107,891,193 | | |
| Tobacco – 0.2% | |
NJ Tobacco Settlement Financing
Corporation | |
Series 2007 1-A,
4.125% 06/01/10 | | | 2,000,000 | | | | 1,969,840 | | |
| Tobacco Total | | | 1,969,840 | | |
| Other Total | | | 157,397,510 | | |
| Other Industrial Development Bonds – 0.2% | |
| Water & Sewer – 0.2% | |
| MS Business Finance Corp. | |
Waste Management, Inc.,
Series 2002, AMT,
4.400% 03/01/27 (a) | | | 2,375,000 | | | | 2,236,989 | | |
| Water & Sewer Total | | | 2,236,989 | | |
| Total Other Industrial Development Bonds | | | 2,236,989 | | |
| | | Par ($) | | Value ($) | |
| Resource Recovery – 0.9% | |
| Disposal – 0.7% | |
MD Northeast Waste Disposal
Authority | |
Series 2003, AMT,
Insured: AMBAC
5.500% 04/01/11 | | | 8,425,000 | | | | 8,676,402 | | |
| Disposal Total | | | 8,676,402 | | |
| Resource Recovery – 0.2% | |
VA Southeastern Public
Services Authority | |
Series 1993 A,
Insured: MBIA
5.250% 07/01/10 | | | 3,000,000 | | | | 3,131,760 | | |
| Resource Recovery Total | | | 3,131,760 | | |
| Resource Recovery Total | | | 11,808,162 | | |
| Tax-Backed – 33.9% | |
| Local Appropriated – 0.7% | |
| FL Palm Beach County School Board | |
Series 2002 E,
Insured: AMBAC
5.250% 08/01/12 | | | 7,625,000 | | | | 8,220,360 | | |
| SC Town of Newberry | |
Series 2005,
5.000% 12/01/09 | | | 600,000 | | | | 606,516 | | |
| Local Appropriated Total | | | 8,826,876 | | |
| Local General Obligations – 10.8% | |
| AK North Slope Borough | |
Series 2000 B,
Insured: MBIA
(b) 06/30/11 | | | 11,850,000 | | | | 11,263,188 | | |
Series 2008 A,
4.000% 06/30/10 | | | 3,695,000 | | | | 3,820,445 | | |
| CA Los Angeles Unified School District | |
Series 2007,
5.000% 07/01/10 | | | 5,015,000 | | | | 5,252,561 | | |
| FL Miami Dade County School District | |
Series 1996,
Insured: MBIA
5.000% 07/15/11 | | | 5,895,000 | | | | 6,273,813 | | |
| GA Lowndes County School District | |
Series 2007,
5.000% 02/01/11 | | | 2,700,000 | | | | 2,888,811 | | |
See Accompanying Notes to Financial Statements.
41
Columbia Short Term Municipal Bond Fund
March 31, 2009
| Municipal Bonds (continued) | |
| | | Par ($) | | Value ($) | |
GA Richmond County Board of
Education | |
Series 2007,
5.000% 10/01/10 | | | 2,000,000 | | | | 2,120,040 | | |
| GA Whitfield County School District | |
Series 2009,
5.000% 04/01/11 | | | 3,250,000 | | | | 3,481,953 | | |
| HI City & County of Honolulu | |
Series 1993 B,
8.000% 10/01/10 | | | 7,140,000 | | | | 7,862,996 | | |
| IL Chicago Board Education | |
Series 1999 A,
Insured: FGIC
(b) 12/01/11 | | | 4,500,000 | | | | 4,192,695 | | |
| IL City of Chicago | |
Series 2001,
Insured: FGIC
5.500% 01/01/31 | | | 2,000,000 | | | | 2,160,820 | | |
KA Sedgwick County Unified
School District Number 259 | |
Series 2001,
Insured: FSA
5.500% 09/01/11 | | | 5,100,000 | | | | 5,618,976 | | |
| MA City of Cambridge | |
Series 2009,
2.000% 03/15/11 | | | 2,715,000 | | | | 2,772,558 | | |
| MD County of Prince Georges | |
Series 2006,
5.000% 09/15/10 | | | 4,900,000 | | | | 5,198,165 | | |
MI Kent County Refuse
Disposal Systems | |
Series 2006 A,
5.000% 11/01/10 | | | 7,605,000 | | | | 8,091,948 | | |
MO St. Louis County Rockwood
School District Number R-6 | |
Series 2001,
5.250% 02/01/11 | | | 3,500,000 | | | | 3,773,245 | | |
NM Albuquerque Municipal
School District Number 12 | |
Series 2008,
4.000% 08/01/10 | | | 6,300,000 | | | | 6,567,309 | | |
| NV Clark County School District | |
Series 2003 D,
Insured: MBIA
5.250% 06/15/10 | | | 4,000,000 | | | | 4,156,160 | | |
| | | Par ($) | | Value ($) | |
| NY New York | |
Series 2007 E,
5.000% 08/01/10 | | | 7,045,000 | | | | 7,381,328 | | |
| SC Beaufort County School District | |
Series 2009 A,
3.000% 03/01/10 | | | 5,100,000 | | | | 5,213,118 | | |
TN Sevier County Public
Building Authority | |
Series 2009,
4.000% 06/01/11 | | | 7,500,000 | | | | 7,800,825 | | |
| TN Shelby County | |
Public Improvement,
Series 2001 A,
5.000% 04/01/11 | | | 6,250,000 | | | | 6,723,125 | | |
TX Denver City Independent
School District | |
Series 2009,
2.500% 02/15/11 | | | 3,785,000 | | | | 3,860,246 | | |
| TX Montgomery County | |
Series 2006 B,
SPA: DEPFA Bank, PLC
5.000% 03/01/29 (a) | | | 2,500,000 | | | | 2,600,675 | | |
| TX Plano Independent School District | |
Series 2002,
5.000% 02/15/12 | | | 3,335,000 | | | | 3,667,633 | | |
Series 2004,
5.000% 02/15/12 | | | 7,000,000 | | | | 7,702,310 | | |
| WA City of Seattle | |
Series 2009,
4.000% 05/01/11 | | | 8,655,000 | | | | 9,155,172 | | |
| Local General Obligations Total | | | 139,600,115 | | |
| Special Non-Property Tax – 7.0% | |
| AR Fayetteville | |
Series 2005 B,
Insured: MBIA
4.000% 12/01/11 | | | 6,830,000 | | | | 7,277,775 | | |
| CT State | |
Series 1991 B,
6.500% 10/01/10 | | | 3,905,000 | | | | 4,211,777 | | |
Series 2001 B,
5.375% 10/01/14 | | | 15,780,000 | | | | 17,035,457 | | |
FL Department of Environmental
Protection | |
Series 2008 A,
5.000% 07/01/11 | | | 4,865,000 | | | | 5,140,359 | | |
See Accompanying Notes to Financial Statements.
42
Columbia Short Term Municipal Bond Fund
March 31, 2009
| Municipal Bonds (continued) | |
| | | Par ($) | | Value ($) | |
| FL Hurricane Catastrophe Fund | |
Series 2006 A,
5.000% 07/01/10 | | | 18,450,000 | | | | 18,828,040 | | |
FL Pasco County School District
Sales Tax Revenue | |
Series 2007,
Insured: FSA
5.000% 10/01/10 | | | 4,500,000 | | | | 4,755,825 | | |
FL St. Lucie County School District
Sales Tax Revenue | |
Series 2006,
Insured: FGIC
5.000% 10/01/09 | | | 1,000,000 | | | | 1,013,260 | | |
FL St. Petersburg Public
Improvement Revenue | |
Series 2001,
Insured: MBIA
5.000% 02/01/10 | | | 3,035,000 | | | | 3,108,690 | | |
| LA Facilities Authority Revenue | |
Hurricane Recovery Program,
Series 2007,
Insured: AMBAC
5.000% 06/01/11 | | | 3,000,000 | | | | 3,128,040 | | |
| MA School Building Authority | |
Series 2005 A,
Insured: FSA
5.000% 08/15/12 | | | 6,100,000 | | | | 6,770,268 | | |
| NM State | |
Series 2006 A,
4.000% 07/01/13 | | | 3,000,000 | | | | 3,116,490 | | |
| NY Local Government Assistance Corp. | |
Series 2001 A-1,
5.000% 04/01/11 | | | 9,300,000 | | | | 9,990,525 | | |
NY New York City Transitional
Finance Authority | |
Series 2009 A,
5.000% 11/01/11 | | | 4,830,000 | | | | 5,246,346 | | |
| Special Non-Property Tax Total | | | 89,622,852 | | |
| Special Property Tax – 0.1% | |
| PR Convention Center District Authority | |
Hotel Occupancy,
Series 2006 A,
5.000% 07/01/11 | | | 1,250,000 | | | | 1,228,563 | | |
| Special Property Tax Total | | | 1,228,563 | | |
| | | Par ($) | | Value ($) | |
| State Appropriated – 4.9% | |
| AZ School Facilities Board | |
Series 2008,
5.500% 09/01/13 | | | 8,000,000 | | | | 8,675,520 | | |
| KS Development Finance Authority | |
Series 2004 F,
Insured: AMBAC
5.250% 10/01/11 | | | 2,250,000 | | | | 2,417,467 | | |
| KY Property & Buildings Commission | |
Series 2008,
5.000% 11/01/10 | | | 4,560,000 | | | | 4,812,670 | | |
| NJ Economic Development Authority | |
Series 2008 W,
5.000% 09/01/11 | | | 4,705,000 | | | | 5,015,953 | | |
| NY State Dormitory Authority | |
Mental Health Services Facilities:
Series 2008 B,
4.000% 02/15/10 | | | 2,330,000 | | | | 2,387,388 | | |
Series 2008 E,
5.000% 02/15/11 | | | 2,170,000 | | | | 2,287,267 | | |
Series 2009,
5.000% 02/15/13 | | | 13,505,000 | | | | 14,290,316 | | |
| NY Thruway Authority | |
Series 2008,
5.000% 04/01/12 | | | 5,245,000 | | | | 5,683,429 | | |
| NY Urban Development Corp. | |
Series 2002 A,
5.500% 01/01/17 (a) | | | 4,535,000 | | | | 4,700,709 | | |
| OH Major New State Infrastructure | |
Series 2008-1,
5.000% 06/15/12 | | | 2,200,000 | | | | 2,425,280 | | |
| VA Public Building Authority | |
Series 2008,
5.000% 08/01/11 | | | 9,000,000 | | | | 9,796,050 | | |
| State Appropriated Total | | | 62,492,049 | | |
| State General Obligations – 10.4% | |
| CA Economic Recovery | |
Series 2004 A,
Insured: MBIA
5.000% 07/01/10 | | | 9,445,000 | | | | 9,858,691 | | |
Series 2008 B,
5.000% 07/01/23 (a) | | | 7,650,000 | | | | 7,972,862 | | |
| CA State | |
Series 2004,
5.000% 04/01/11 | | | 1,850,000 | | | | 1,943,018 | | |
See Accompanying Notes to Financial Statements.
43
Columbia Short Term Municipal Bond Fund
March 31, 2009
| Municipal Bonds (continued) | |
| | | Par ($) | | Value ($) | |
| CT State | |
Series 2004 C,
Insured: FGIC
5.000% 04/01/11 | | | 5,000,000 | | | | 5,385,750 | | |
Series 2007,
5.000% 03/15/11 | | | 3,600,000 | | | | 3,873,492 | | |
| DC District of Columbia | |
Series 2007 C,
4.000% 06/01/10 | | | 4,025,000 | | | | 4,156,014 | | |
| DE State | |
Series 2009,
3.500% 01/01/11 | | | 9,450,000 | | | | 9,875,533 | | |
| FL Board of Education | |
Series 2003 I,
5.000% 06/01/10 | | | 9,420,000 | | | | 9,877,718 | | |
Series 2005 A,
5.000% 06/01/11 | | | 4,090,000 | | | | 4,396,505 | | |
| GA State | |
Series 1994 D,
6.800% 08/01/11 | | | 3,000,000 | | | | 3,386,850 | | |
| LA State | |
Series 2005 A,
Insured: MBIA
5.000% 08/01/12 | | | 10,000,000 | | | | 10,804,500 | | |
| MD State | |
Series 2004,
5.000% 02/01/11 | | | 4,750,000 | | | | 5,099,647 | | |
| MI State | |
Series 2008 A,
5.000% 05/01/12 | | | 3,670,000 | | | | 3,922,533 | | |
| NC State | |
Series 2007 A,
5.000% 03/01/11 | | | 7,500,000 | | | | 8,075,475 | | |
| NJ State | |
Series 1992 D,
6.000% 02/15/11 | | | 7,770,000 | | | | 8,443,581 | | |
| PA State | |
Series 2002,
Insured: FSA
5.000% 05/01/10 | | | 10,000,000 | | | | 10,483,300 | | |
| TX State | |
Series 2008,
5.000% 10/01/10 | | | 4,275,000 | | | | 4,528,935 | | |
| | | Par ($) | | Value ($) | |
| WA State | |
Series 2007 C,
5.000% 01/01/10 | | | 8,455,000 | | | | 8,736,129 | | |
Series 2007 D,
4.500% 01/01/10 | | | 7,400,000 | | | | 7,618,448 | | |
| WV State | |
Series 2005,
Insured: FGIC
5.000% 06/01/11 | | | 5,700,000 | | | | 6,132,516 | | |
| State General Obligations Total | | | 134,571,497 | | |
| Tax-Backed Total | | | 436,341,952 | | |
| Transportation – 13.6% | |
| Air Transportation – 0.8% | |
| OH Dayton Special Facilities | |
United Parcel Service, Inc.
Series 1996 D, AMT,
6.200% 10/01/09 | | | 2,575,000 | | | | 2,604,432 | | |
Series 1996 E,
6.050% 10/01/09 | | | 2,000,000 | | | | 2,042,520 | | |
Series 1996 F,
6.050% 10/01/09 | | | 3,000,000 | | | | 3,063,780 | | |
TN Memphis Shelby County
Airport Authority | |
FedEx Corp.,
Series 2001,
5.000% 09/01/09 | | | 2,310,000 | | | | 2,310,093 | | |
| Air Transportation Total | | | 10,020,825 | | |
| Airports – 5.2% | |
| AZ Phoenix Civic Improvement Corp. | |
Series 2005 B,
Insured: MBIA
5.000% 07/01/11 | | | 4,500,000 | | | | 4,857,480 | | |
Series 2008 D, AMT,
5.250% 07/01/11 | | | 2,600,000 | | | | 2,670,850 | | |
| CO Denver City & County Airport | |
Series 2008 A1, AMT,
5.000% 11/15/11 | | | 5,000,000 | | | | 5,129,100 | | |
DC Metropolitan Washington
Airports Authority | |
Series 2007 B, AMT,
Insured: AMBAC:
5.000% 10/01/10 | | | 7,000,000 | | | | 7,186,760 | | |
| 5.000% 10/01/11 | | | 5,000,000 | | | | 5,205,400 | | |
See Accompanying Notes to Financial Statements.
44
Columbia Short Term Municipal Bond Fund
March 31, 2009
| Municipal Bonds (continued) | |
| | | Par ($) | | Value ($) | |
FL Broward County Airport
Systems Revenue | |
Series 1998 G, AMT,
Insured: AMBAC
4.500% 10/01/11 | | | 3,300,000 | | | | 3,322,605 | | |
| FL Greater Orlando Aviation Authority | |
Series 2008 A, AMT,
Insured: FSA
5.000% 10/01/10 | | | 5,625,000 | | | | 5,765,681 | | |
| FL Miami Dade County Aviation | |
Miami International Airport,
Series 2007 D,
Insured: FSA
5.000% 10/01/10 | | | 1,745,000 | | | | 1,821,641 | | |
KY Louisville Regional
Airport Authority | |
Series 2008 A, AMT,
Insured: FSA
5.000% 07/01/12 | | | 2,935,000 | | | | 3,009,490 | | |
MN Minneapolis - St. Paul
Metropolitan Airports Commission | |
Series 2008 A, AMT,
5.000% 01/01/11 | | | 1,805,000 | | | | 1,857,923 | | |
| NV Clark County Airport | |
Series 2006 A,
Insured: AMBAC
5.000% 07/01/10 | | | 6,750,000 | | | | 6,995,565 | | |
PA Philadelphia Industrial
Development Authority | |
Series 1998 A, AMT,
Insured: FGIC:
5.250% 07/01/09 | | | 3,410,000 | | | | 3,435,677 | | |
| 5.250% 07/01/12 | | | 5,000,000 | | | | 5,053,800 | | |
Series 2001 A, AMT,
Insured: FGIC
5.250% 07/01/09 | | | 4,085,000 | | | | 4,115,760 | | |
| WA Port of Seattle | |
Series 2007 B,
Insured: AMBAC
5.000% 10/01/11 | | | 5,580,000 | | | | 5,847,561 | | |
| Airports Total | | | 66,275,293 | | |
| Ports – 0.7% | |
NY Port Authority of New York &
New Jersey | |
Series 2002, AMT,
5.500% 12/15/16 | | | 3,630,000 | | | | 3,780,827 | | |
| | | Par ($) | | Value ($) | |
Series 2005, AMT,
3.750% 10/01/09 | | | 4,505,000 | | | | 4,552,122 | | |
| Ports Total | | | 8,332,949 | | |
| Toll Facilities – 2.8% | |
| KY Turnpike Authority | |
Series 2004 A,
Insured: FGIC
5.000% 07/01/10 | | | 5,000,000 | | | | 5,252,900 | | |
| LA Transportation Authority | |
Series 2005,
5.000% 09/01/09 | | | 5,000,000 | | | | 5,082,900 | | |
NY State Thruway Authority
Service Contract | |
Local Highway & Bridge,
Series 2002,
5.500% 04/01/11 | | | 3,000,000 | | | | 3,231,870 | | |
NY Triborough Bridge & Tunnel
Authority | |
Series 1990,
Insured: MBIA
6.000% 01/01/11 | | | 5,000,000 | | | | 5,397,900 | | |
Series 2002,
5.250% 11/15/16 | | | 10,000,000 | | | | 10,844,500 | | |
| PA Turnpike Commission | |
Series 2007 A,
Insured: AMBAC
4.000% 10/15/09 | | | 1,000,000 | | | | 1,002,520 | | |
| TX Transportation Commission | |
Series 2006,
5.000% 04/01/10 | | | 5,500,000 | | | | 5,741,505 | | |
| Toll Facilities Total | | | 36,554,095 | | |
| Transportation – 4.1% | |
DE Transportation Authority
Motor Fuel Tax | |
Series 2008 A,
5.000% 07/01/11 | | | 3,385,000 | | | | 3,669,645 | | |
| IL Chicago Transit Authority | |
Series 2006 A,
5.000% 06/01/12 | | | 3,650,000 | | | | 3,938,751 | | |
Series 2006,
Insured: AMBAC
4.000% 06/01/10 | | | 6,075,000 | | | | 6,241,637 | | |
| IL Regional Transportation Authority | |
Series 1999,
5.750% 06/01/11 | | | 8,125,000 | | | | 8,867,381 | | |
See Accompanying Notes to Financial Statements.
45
Columbia Short Term Municipal Bond Fund
March 31, 2009
| Municipal Bonds (continued) | |
| | | Par ($) | | Value ($) | |
| KS Department of Transportation | |
Series 2003 A,
5.000% 09/01/12 | | | 8,000,000 | | | | 8,962,000 | | |
NY Metropolitan Transportation
Authority | |
Series 2005 H,
5.250% 11/15/10 | | | 6,000,000 | | | | 6,267,480 | | |
Series 2008,
5.000% 11/15/16 (a) | | | 7,350,000 | | | | 7,672,077 | | |
| SC Transportation Infrastructure | |
Series 2005 A,
Insured: AMBAC
5.000% 10/01/09 | | | 3,995,000 | | | | 4,061,357 | | |
| TX Transportation Commission | |
Series 2006 A,
5.000% 04/01/12 | | | 3,000,000 | | | | 3,305,490 | | |
| Transportation Total | | | 52,985,818 | | |
| Transportation Total | | | 174,168,980 | | |
| Utilities – 10.5% | |
| Investor Owned – 2.3% | |
AL Chatom Industrial Development
Board | |
Series 2007 A,
4.250% 08/01/37 (a) | | | 6,950,000 | | | | 6,944,857 | | |
GA Burke County Development
Authority | |
Georgia Power Company:
Series 1994,
3.750% 10/01/32 (a) | | | 3,600,000 | | | | 3,606,048 | | |
Series 1995,
4.375% 10/01/32 (a) | | | 2,760,000 | | | | 2,791,133 | | |
| LA Public Facilities Authority | |
Cleco Power LLC,
Series 2008,
7.000% 12/01/38 (a) | | | 4,000,000 | | | | 4,007,440 | | |
| NH Business Finance Authority | |
United Illuminating Co.:
Series 2009 A,
6.875% 12/01/29 (a) | | | 2,000,000 | | | | 2,015,160 | | |
Series 2009,
7.125% 07/01/27 (a) | | | 4,000,000 | | | | 4,006,520 | | |
| OH Hamilton County Local District | |
Cinergy Corp.,
Series 1998, AMT,
4.600% 06/01/23 (a) | | | 5,000,000 | | | | 5,010,800 | | |
| | | Par ($) | | Value ($) | |
TX Titus County Fresh Water
Supply District | |
Southwestern Electric Power Co.,
Series 2008,
4.500% 07/01/11 | | | 1,000,000 | | | | 990,040 | | |
| Investor Owned Total | | | 29,371,998 | | |
| Joint Power – 1.6% | |
| GA Municipal Electric Authority | |
Series 2008 A,
5.000% 01/01/12 | | | 2,000,000 | | | | 2,128,160 | | |
| UT Intermountain Power Agency | |
Series 2008 A,
5.250% 07/01/11 | | | 7,000,000 | | | | 7,442,260 | | |
Series 2009 A,
5.000% 07/01/13 | | | 10,000,000 | | | | 10,752,700 | | |
| Joint Power Total | | | 20,323,120 | | |
| Municipal Electric – 3.4% | |
| FL City of Palm Bay | |
Series 2002,
Insured: FSA
5.250% 10/01/09 | | | 320,000 | | | | 326,848 | | |
| FL Kissimmee Utility Authority | |
Series 2001 B,
Insured: AMBAC
5.000% 10/01/14 | | | 7,195,000 | | | | 7,649,508 | | |
| NY Long Island Power Authority | |
Series 2003 B,
5.250% 06/01/13 | | | 4,250,000 | | | | 4,524,635 | | |
| TX San Antonio Electric & Gas Systems | |
Series 2006 A,
5.000% 02/01/10 | | | 5,000,000 | | | | 5,178,400 | | |
WA City of Seattle Municipal
Light and Power | |
Series 2004,
5.000% 08/01/15 | | | 6,000,000 | | | | 6,614,520 | | |
| WA Energy Northwest | |
Series 1992 A,
6.300% 07/01/12 | | | 9,000,000 | | | | 10,266,480 | | |
Series 2001,
5.500% 07/01/17 | | | 8,800,000 | | | | 9,407,816 | | |
| Municipal Electric Total | | | 43,968,207 | | |
| Water & Sewer – 3.2% | |
| CA City of Los Angeles | |
Series 2009 A,
5.000% 06/01/12 | | | 6,040,000 | | | | 6,613,256 | | |
See Accompanying Notes to Financial Statements.
46
Columbia Short Term Municipal Bond Fund
March 31, 2009
| Municipal Bonds (continued) | |
| | | Par ($) | | Value ($) | |
FL Orlando Utilities Commission
Water & Electric | |
Series 2008,
3.500% 10/01/25 (a) | | | 8,000,000 | | | | 8,228,320 | | |
FL Reedy Creek Improvement
District Utilities | |
Series 2004 2,
5.250% 10/01/10 | | | 3,000,000 | | | | 3,125,400 | | |
Series 2005 2,
Insured: AMBAC
5.000% 10/01/10 | | | 2,500,000 | | | | 2,588,200 | | |
NM Albuquerque Bernalillo County
Water Utility Authority | |
Series 2009 A1,
5.000% 07/01/13 | | | 2,000,000 | | | | 2,223,380 | | |
TX Dallas Waterworks &
Sewer Systems Revenue | |
Series 2007,
Insured: AMBAC
5.000% 10/01/12 | | | 5,000,000 | | | | 5,580,950 | | |
| TX Houston Water & Sewer System | |
Series 1991 C,
Insured: AMBAC
(b) 12/01/11 | | | 5,000,000 | | | | 4,745,350 | | |
| TX Trinity River Wastewater Authority | |
Series 2008,
5.000% 08/01/10 | | | 6,150,000 | | | | 6,479,886 | | |
| WA King County Sewer Revenue | |
Series 2002 B,
Insured: FSA
5.500% 01/01/14 | | | 2,000,000 | | | | 2,170,080 | | |
| Water & Sewer Total | | | 41,754,822 | | |
| Utilities Total | | | 135,418,147 | | |
Total Municipal Bonds
(cost of $1,068,668,862) | | | 1,088,823,784 | | |
| | | Shares | | | |
| Investment Company – 4.8% | |
Columbia Tax-Exempt Reserves,
Capital Class
(7 day yield of 0.704%) (d)(e) | | | 61,213,000 | | | | 61,213,000 | | |
Total Investment Company
(cost of $61,213,000) | | | 61,213,000 | | |
| Short-Term Obligations – 13.9% | |
| | | Par ($) | | Value ($) | |
| Variable Rate Demand Notes (f) – 13.9% | |
CA San Francisco City & County
Public Utilities Commission | |
Series 2003,
SPA: Wachovia Bank N.A.
2.030% 10/01/22 | | | 10,000,000 | | | | 10,000,000 | | |
GA Cobb County Kennestone
Hospital Authority | |
Wellstar Health System,
Series 2005,
LOC: SunTrust Bank
0.540% 04/01/40 | | | 11,000,000 | | | | 11,000,000 | | |
IL Central Lake County Joint Action
Water Agency | |
Series 2003,
SPA: Wachovia Bank N.A.
1.050% 05/01/20 (g) | | | 15,960,000 | | | | 15,960,000 | | |
| IL Chicago Board of Education | |
Series 2008,
LIQ FAC: JPMorgan Chase Bank
0.760% 06/01/16 | | | 8,890,000 | | | | 8,890,000 | | |
IN Indianapolis Local Public
Improvement Bond Bank | |
Series 2008 C-1, AMT,
SPA: Dexia
2.500% 01/01/37 | | | 10,000,000 | | | | 10,000,000 | | |
| MS State | |
Series 2003 E,
SPA: Dexia Credit Local
2.000% 11/01/23 | | | 18,925,000 | | | | 18,925,000 | | |
NC Charlotte Mecklenburg
Hospital Authority | |
Mercy Hospital,
Series 2007 G,
Insured: FSA ,
LOC: Dexia Credit Local
2.650% 01/15/41 | | | 15,000,000 | | | | 15,000,000 | | |
| NJ Building Authority | |
Putters,
Series 1999,
LIQ FAC: JPMorgan & Co.
0.840% 06/15/13 | | | 13,000,000 | | | | 13,000,000 | | |
| NY State Thruway Authority | |
Series 2007,
LIQ FAC: Citigroup Financial
Products
1.000% 01/01/32 | | | 25,000,000 | | | | 25,000,000 | | |
See Accompanying Notes to Financial Statements.
47
Columbia Short Term Municipal Bond Fund
March 31, 2009
| Short-Term Obligations (continued) | |
| | | Par ($) | | Value ($) | |
| NY State | |
Series 2000 B,
LOC: Dexia Credit Local
3.100% 03/15/30 | | | 14,815,000 | | | | 14,815,000 | | |
| PA Public School Building Authority | |
PUTTERS,
Series 2007,
LOC: JPMorgan Chase Bank, N.A.
0.840% 12/01/14 | | | 11,980,000 | | | | 11,980,000 | | |
| PA Turnpike Commission | |
Series 2006 B,
SPA: Wachovia Bank N.A.
1.050% 07/15/23 | | | 9,900,000 | | | | 9,900,000 | | |
| WA City of Tacoma | |
Series 2003,
SPA: Wachovia Bank N.A.
2.050% 12/01/24 | | | 15,000,000 | | | | 15,000,000 | | |
| Total Variable Rate Demand Notes | | | 179,470,000 | | |
Total Short-Term Obligations
(cost of $179,470,000) | | | 179,470,000 | | |
Total Investments – 103.3%
(cost of $1,309,351,862) (h) | | | 1,329,506,784 | | |
| Other Assets & Liabilities, Net – (3.3)% | | | (41,971,142 | ) | |
| Net Assets – 100.0% | | | 1,287,535,642 | | |
Notes to Investment Portfolio:
On April 1, 2008, the Fund adopted Statement of Financial Accounting Standards No. 157, Fair Value Measurements ("SFAS 157"). SFAS 157 establishes a hierarchy that prioritizes the inputs to valuation techniques used to measure fair value giving the highest priority to unadjusted quoted prices in active markets for identical securities (level 1 measurements) and the lowest priority to unobservable inputs (level 3 measurements) when market prices are not readily available or reliable. The three levels of the fair value hierarchy under SFAS 157 are described below:
• Level 1 – quoted prices in active markets for identical securities
• Level 2 – prices determined using other significant observable inputs (including quoted prices for similar securities, interest rates, prepayment speeds, credit risk and others)
• Level 3 – prices determined using significant unobservable inputs. In situations where quoted prices or observable inputs are unavailable or less reliable, unobservable inputs may be used. Unobservable inputs may include management's own assumptions about the factors market participants would use in pricing an investment.
The inputs or methodology used for valuing securities are not necessarily an indication of the risk associated with investing in those securities.
The following table summarizes the inputs used, as of March 31, 2009 in valuing the Fund's assets:
| Valuation Inputs | | Investments in
Securities | | Other Financial
Instruments | |
| Level 1 – Quoted Prices | | $ | 61,213,000 | | | $ | – | | |
Level 2 – Other Significant
Observable Inputs | | | 1,268,293,784 | | | | – | | |
Level 3 – Significant
Unobservable Inputs | | | – | | | | – | | |
| Total | | $ | 1,329,506,784 | | | $ | – | | |
(a) The interest rate shown on floating rate or variable rate securities reflects the rate at March 31, 2009.
(b) Zero coupon bond.
(c) The Fund has been informed that each issuer has placed direct obligations of the U.S. Government in an irrevocable trust, solely for the payment of principal and interest.
(d) Investments in affiliates during the year ended March 31, 2009:
Security name: Columbia Tax-Exempt Reserves, Capital Class (7 day yield of 0.704%)
| Shares as of 03/31/08: | | | 9,000 | | |
| Shares purchased: | | | 884,370,308 | | |
| Shares sold: | | | (823,166,308 | ) | |
| Shares as of 03/31/09: | | | 61,213,000 | | |
| Net realized gain/loss: | | $ | – | | |
| Dividend income earned: | | $ | 463,525 | | |
| Value at end of period: | | $ | 61,213,000 | | |
(e) Money market mutual fund registered under the Investment Company Act of 1940, as amended, and advised by Columbia Management Advisors, LLC.
(f) Variable rate demand notes. These securities are payable upon demand and are secured by letters of credit or other credit support agreements from banks. The interest rates changes periodically and the interest rates shown reflect the rates as of March 31, 2009.
(g) Security exempt from registration pursuant to Rule 144A under the Securities Act of 1933. This security may be resold in transactions exempt from registration, normally to qualified institutional buyers. At March 31, 2009, this security, which is not illiquid, amounted to $15,960,000, which represents 1.2% of net assets.
(h) Cost for federal income tax purposes is $1,309,339,150.
At March 31, 2009, the composition of the Fund by revenue source is as follows:
| Holdings by Revenue Source (Unaudited) | | % of
Net Assets | |
| Tax-Backed | | | 33.9 | | |
| Transportation | | | 13.6 | | |
| Other | | | 12.2 | | |
| Utilities | | | 10.5 | | |
| Health Care | | | 5.4 | | |
| Education | | | 4.8 | | |
| Housing | | | 3.1 | | |
| Resource Recovery | | | 0.9 | | |
| Other Industrial Development Bonds | | | 0.2 | | |
| | | | 84.6 | | |
| Investment Company | | | 4.8 | | |
| Short Term Obligations | | | 13.9 | | |
| Other Assets & Liabilities, Net | | | (3.3 | ) | |
| | | | 100.0 | | |
| Acronym | | Name | |
| AMBAC | | Ambac Assurance Corp. | |
|
| AMT | | Alternative Minimum Tax | |
|
| FGIC | | Financial Guaranty Insurance Co. | |
|
| FNMA | | Federal National Mortgage Association | |
|
| FSA | | Financial Security Assurance, Inc. | |
|
| GTY AGMT | | Guaranty Agreement | |
|
| LOC | | Letter of Credit | |
|
| MBIA | | MBIA Insurance Corp. | |
|
| PUTTERS | | Puttable Tax Exempt Receipts | |
|
| SPA | | Stand-by Purchase Agreement | |
|
See Accompanying Notes to Financial Statements.
48
Investment Portfolio – Columbia California Intermediate Municipal Bond Fund
March 31, 2009
| Municipal Bonds – 96.9% | |
| | | Par ($) | | Value ($) | |
| Education – 5.5% | |
| Education – 5.5% | |
| CA Educational Facilities Authority | |
Pitzer College,
Series 2005 A:
5.000% 04/01/25 | | | 1,270,000 | | | | 1,172,477 | | |
University of Redlands,
5.000% 10/01/25 | | | 1,250,000 | | | | 1,152,187 | | |
Pomona College,
Series 2009 A,
5.000% 01/01/24 (a) | | | 1,175,000 | | | | 1,236,041 | | |
| CA Public Works Board | |
University of California,
Series 2005 C,
5.000% 04/01/16 | | | 1,000,000 | | | | 1,091,000 | | |
Series 2005 D,
5.000% 05/01/15 | | | 1,000,000 | | | | 1,107,320 | | |
California State University,
Series 2006 A,
Insured: FGIC
5.000% 10/01/16 | | | 1,000,000 | | | | 1,016,690 | | |
| CA University of California | |
Series 2009 A,
5.250% 11/01/22 | | | 2,500,000 | | | | 2,589,000 | | |
Series 2009 O,
5.000% 05/15/20 | | | 1,000,000 | | | | 1,075,620 | | |
| PR University of Puerto Rico | |
Commonwealth of Puerto Rico,
Series 2006 Q,
5.000% 06/01/12 | | | 1,000,000 | | | | 977,920 | | |
| Education Total | | | 11,418,255 | | |
| Education Total | | | 11,418,255 | | |
| Health Care – 6.5% | |
| Continuing Care Retirement – 0.4% | |
| CA Health Facilities Financing Authority | |
Nevada Methodist Homes,
Series 2006,
5.000% 07/01/26 | | | 1,000,000 | | | | 875,790 | | |
| Continuing Care Retirement Total | | | 875,790 | | |
| Hospitals – 6.1% | |
| CA Loma Linda | |
Loma Linda, University Medical Center,
Series 2005:
5.000% 12/01/16 | | | 2,000,000 | | | | 1,750,440 | | |
| 5.000% 12/01/18 | | | 2,000,000 | | | | 1,699,620 | | |
| 5.000% 12/01/22 | | | 1,000,000 | | | | 766,380 | | |
| | | Par ($) | | Value ($) | |
| CA Municipal Finance Authority | |
Community Hospitals of Central California,
Series 2013,
5.000% 02/01/13 | | | 1,150,000 | | | | 1,107,623 | | |
CA Rancho Mirage Joint Powers
Financing Authority | |
Eisenhower Medical Center,
Series 1997 B,
Insured: MBIA
4.875% 07/01/22 | | | 1,500,000 | | | | 1,306,065 | | |
CA Statewide Communities
Development Authority | |
Adventist Health System/West,
Series 2005 A,
5.000% 03/01/17 | | | 1,000,000 | | | | 992,230 | | |
John Muir Health,
Series 2006 A,
5.000% 08/15/17 | | | 3,000,000 | | | | 3,042,300 | | |
Kaiser Foundation Health Plan,
Series 2004 E,
3.875% 04/01/32 (b) | | | 2,000,000 | | | | 2,022,040 | | |
| Hospitals Total | | | 12,686,698 | | |
| Health Care Total | | | 13,562,488 | | |
| Housing – 0.4% | |
| Single-Family – 0.4% | |
| CA Department of Veteran Affairs | |
Series 2006,
4.500% 12/01/23 | | | 1,000,000 | | | | 926,110 | | |
| Single-Family Total | | | 926,110 | | |
| Housing Total | | | 926,110 | | |
| Industrials – 0.2% | |
| Oil & Gas – 0.2% | |
CA Roseville Natural Gas
Financing Authority | |
Series 2007,
5.000% 02/15/11 | | | 500,000 | | | | 472,475 | | |
| Oil & Gas Total | | | 472,475 | | |
| Industrials Total | | | 472,475 | | |
See Accompanying Notes to Financial Statements.
49
Columbia California Intermediate Municipal Bond Fund
March 31, 2009
| Municipal Bonds (continued) | |
| | | Par ($) | | Value ($) | |
| Other – 6.8% | |
| Other – 3.6% | |
CA Infrastructure & Economic
Development Bank | |
California Science Center,
Series 2006 B,
Insured: FGIC:
5.000% 05/01/22 | | | 1,360,000 | | | | 1,316,806 | | |
| 5.000% 05/01/23 | | | 1,240,000 | | | | 1,189,098 | | |
J. Paul Getty Trust,
Series 2007 A-1,
2.500% 10/01/47 (b) | | | 1,950,000 | | | | 1,954,427 | | |
CA Statewide Communities
Development Authority | |
Series 2003,
5.000% 07/01/13 | | | 1,000,000 | | | | 1,121,180 | | |
PR Commonwealth of Puerto Rico
Government Development Bank | |
Series 2006 B,
5.000% 12/01/16 | | | 2,000,000 | | | | 1,823,740 | | |
| Other Total | | | 7,405,251 | | |
| Refunded/Escrowed (c) – 1.7% | |
| CA Health Facilities Finance Authority | |
Cedars-Sinai Medical Center,
Series 1999 A,
Pre-refunded 12/01/09,
6.125% 12/01/19 | | | 1,000,000 | | | | 1,045,870 | | |
| CA Lucia Mar Unified School District | |
Series 2004 A,
Pre-refunded 08/01/14,
Insured: FGIC
5.250% 08/01/20 | | | 1,230,000 | | | | 1,430,896 | | |
| CA Orange County Water District | |
Series 2003 B,
Pre-refunded 08/15/13,
Insured: MBIA
5.375% 08/15/17 | | | 650,000 | | | | 751,718 | | |
| CA Department of Water Resources | |
Series 2001,
Escrowed to Maturity,
Insured: AMBAC
5.500% 12/01/09 | | | 5,000 | | | | 5,170 | | |
Series 2003 Y,
Escrowed to Maturity,
Insured: FGIC
5.000% 12/01/10 | | | 15,000 | | | | 16,050 | | |
| | | Par ($) | | Value ($) | |
CA Statewide Communities
Development Authority | |
Series 1999,
Escrowed to Maturity,
6.000% 07/01/09 | | | 330,000 | | | | 334,581 | | |
| Refunded/Escrowed Total | | | 3,584,285 | | |
| Tobacco – 1.5% | |
| CA County Tobacco Securitization Agency | |
Los Angeles County,
Series 2006,
(d) 06/01/21
(5.250% 12/01/10) | | | 1,000,000 | | | | 641,430 | | |
CA Golden State Tobacco
Securitization Corp. | |
Series 2005 A,
Insured: AMBAC
5.000% 06/01/14 | | | 1,250,000 | | | | 1,264,263 | | |
Series 2007 A-1,
5.000% 06/01/33 | | | 1,000,000 | | | | 576,460 | | |
CA Tobacco Securitization Authority
of Southern California | |
San Diego County Tobacco,
Series 2006 A1,
5.000% 06/01/37 | | | 1,000,000 | | | | 515,700 | | |
| Tobacco Total | | | 2,997,853 | | |
| Other Total | | | 13,987,389 | | |
| Resource Recovery – 0.5% | |
| Resource Recovery – 0.5% | |
| CA Los Angeles Sanitation Equipment | |
Series 2005,
Insured: FGIC
5.000% 02/01/13 | | | 1,000,000 | | | | 1,098,500 | | |
| Resource Recovery Total | | | 1,098,500 | | |
| Resource Recovery Total | | | 1,098,500 | | |
| Tax-Backed – 46.4% | |
| Local Appropriated – 6.8% | |
| CA Anaheim Public Financing Authority | |
Series 1997 C,
Insured: FSA
6.000% 09/01/11 | | | 1,000,000 | | | | 1,096,630 | | |
See Accompanying Notes to Financial Statements.
50
Columbia California Intermediate Municipal Bond Fund
March 31, 2009
| Municipal Bonds (continued) | |
| | | Par ($) | | Value ($) | |
CA County of Riverside
Certificates of Participation | |
Series 2005 A,
Insured: FGIC
5.000% 11/01/17 | | | 1,465,000 | | | | 1,536,565 | | |
CA County of San Diego
Certificates of Participation | |
Series 2001,
Insured: AMBAC
5.000% 11/01/11 | | | 1,000,000 | | | | 1,053,310 | | |
| CA Kings River Conservation District | |
Series 2004,
5.000% 05/01/14 | | | 3,135,000 | | | | 2,930,127 | | |
CA Los Angeles Community
Redevelopment Agency | |
Series 2005,
Insured: AMBAC
5.000% 09/01/15 | | | 1,095,000 | | | | 1,142,972 | | |
CA Los Angeles County Capital Asset
Leasing Corp. | |
Series 2002 B,
Insured: AMBAC
6.000% 12/01/12 | | | 1,000,000 | | | | 1,110,360 | | |
CA Oakland Joint Powers
Financing Authority | |
Series 2008 B,
Insured: AGO
5.000% 08/01/22 | | | 2,000,000 | | | | 2,050,100 | | |
| CA Sacramento City Financing Authority | |
Series 2006,
Insured: AMBAC
5.250% 12/01/22 | | | 1,000,000 | | | | 1,058,460 | | |
CA San Mateo County Joint Powers
Financing Authority | |
Series 2008 A,
5.000% 07/15/20 | | | 435,000 | | | | 461,374 | | |
CA Santa Clara County
Financing Authority | |
Series 1998 A,
Insured: AMBAC
4.500% 05/15/12 | | | 1,075,000 | | | | 1,087,911 | | |
| CA Vista Certificates of Participation | |
Series 2007,
Insured: MBIA
4.750% 05/01/21 | | | 750,000 | | | | 713,760 | | |
| Local Appropriated Total | | | 14,241,569 | | |
| | | Par ($) | | Value ($) | |
| Local General Obligations – 23.6% | |
CA Antelope Valley Community
College District | |
Series 2007,
Insured: MBIA
5.250% 08/01/20 | | | 500,000 | | | | 534,135 | | |
| CA Beverly Hills Unified School District | |
Series 2009,
(e) 08/01/24 | | | 3,500,000 | | | | 1,563,275 | | |
| CA Center Community College District | |
Series 2004 A,
Insured: MBIA
5.250% 08/01/22 | | | 965,000 | | | | 1,030,967 | | |
CA Central Valley School District
Financing Authority | |
Series 1998 A,
Insured: MBIA
6.150% 08/01/09 | | | 1,000,000 | | | | 1,012,250 | | |
| CA Compton Community College District | |
Series 2004 A,
Insured: MBIA
5.250% 07/01/17 | | | 1,330,000 | | | | 1,356,148 | | |
CA Culver City School Facilities
Financing Authority | |
Series 2005,
5.500% 08/01/23 | | | 1,490,000 | | | | 1,638,255 | | |
| CA Desert Sands Unified School District | |
Series 2006,
Insured: AMBAC
(e) 06/01/16 | | | 1,000,000 | | | | 737,400 | | |
| CA East Bay Municipal Utility District | |
Series 2003 F,
Insured: AMBAC
5.000% 04/01/15 | | | 1,000,000 | | | | 1,085,470 | | |
CA East Side Union High School District
Santa Clara County | |
Series 2006,
Insured: FSA
5.250% 09/01/20 | | | 1,280,000 | | | | 1,380,710 | | |
See Accompanying Notes to Financial Statements.
51
Columbia California Intermediate Municipal Bond Fund
March 31, 2009
| Municipal Bonds (continued) | |
| | | Par ($) | | Value ($) | |
CA Foothill-De Anza Community
College District | |
Series 2002,
Insured: FGIC
5.000% 08/01/14 | | | 975,000 | | | | 1,055,974 | | |
Series 2005,
Insured: FGIC:
5.250% 08/01/18 | | | 1,000,000 | | | | 1,109,840 | | |
| 5.250% 08/01/21 | | | 1,000,000 | | | | 1,076,330 | | |
| CA Los Angeles Unified School District | |
Series 2006 G,
Insured: AMBAC
5.000% 07/01/20 | | | 1,000,000 | | | | 1,033,070 | | |
| CA Los Angeles | |
Series 2004 A,
Insured: MBIA
4.000% 09/01/13 | | | 1,000,000 | | | | 1,078,410 | | |
CA Los Gatos Joint Union
High School District | |
Series 2005,
Insured: FSA
5.000% 12/01/17 | | | 2,000,000 | | | | 2,150,880 | | |
| CA Pajaro Valley Unified School District | |
Series 2005,
Insured: FSA
5.250% 08/01/18 | | | 1,535,000 | | | | 1,678,139 | | |
| CA Palomar Pomerado Health | |
San Diego County,
Series 2007 A,
Insured: MBIA
(e) 08/01/19 | | | 2,500,000 | | | | 1,396,150 | | |
CA Pasadena Area Community
College District | |
Series 2006 C,
Insured: AMBAC
(e) 08/01/11 | | | 2,000,000 | | | | 1,909,820 | | |
CA Rancho Santiago Community
College District | |
Series 2005,
Insured: FSA
5.250% 09/01/19 | | | 1,000,000 | | | | 1,106,500 | | |
| CA Rescue Unified School District | |
Series 2005,
Insured: MBIA
(e) 09/01/26 | | | 1,100,000 | | | | 377,234 | | |
| | | Par ($) | | Value ($) | |
CA San Bernardino Community
College District | |
Series 2005,
Insured: FSA
5.000% 08/01/17 | | | 3,000,000 | | | | 3,310,290 | | |
CA San Diego Community
College District | |
Series 2005,
Insured: FSA
(e) 05/01/15 | | | 1,000,000 | | | | 827,350 | | |
CA San Mateo County Community
College District | |
Series 2006 A,
Insured: MBIA
(e) 09/01/15 | | | 1,000,000 | | | | 799,900 | | |
CA San Mateo Foster City School
Facilities Financing Authority | |
Series 2005,
Insured: FSA:
4.000% 08/15/12 | | | 1,000,000 | | | | 1,074,030 | | |
| 5.500% 08/15/19 | | | 2,000,000 | | | | 2,278,820 | | |
CA San Ramon Valley
Unified School District | |
Series 2004,
Insured: FSA
5.250% 08/01/16 | | | 1,800,000 | | | | 1,971,396 | | |
| CA Santa Ana Unified School District | |
Series 2008 A,
(e) 08/01/20 | | | 3,250,000 | | | | 1,799,817 | | |
| CA Saugus Union School District | |
Series 2006,
Insured: MBIA
5.250% 08/01/21 | | | 1,000,000 | | | | 1,045,530 | | |
| CA Simi Valley School Financing Authority | |
Series 2007,
Insured: FSA:
5.000% 08/01/18 | | | 1,045,000 | | | | 1,150,650 | | |
| 5.000% 08/01/23 | | | 2,405,000 | | | | 2,483,860 | | |
| CA South San Francisco School District | |
Series 2006,
Insured: MBIA
5.250% 09/15/20 | | | 1,000,000 | | | | 1,083,600 | | |
CA Southwestern Community
College District | |
Series 2005,
Insured: FGIC
5.250% 08/01/17 | | | 1,230,000 | | | | 1,377,194 | | |
See Accompanying Notes to Financial Statements.
52
Columbia California Intermediate Municipal Bond Fund
March 31, 2009
| Municipal Bonds (continued) | |
| | | Par ($) | | Value ($) | |
CA Ventura County Community
College District | |
Series 2005 B,
Insured: MBIA
5.000% 08/01/18 | | | 1,000,000 | | | | 1,086,950 | | |
CA West Contra Costa
Unified School District | |
Series 2005,
Insured: FGIC
(e) 08/01/17 | | | 1,000,000 | | | | 684,890 | | |
CA William S. Hart Union
High School District | |
Series 2005 B,
Insured: FSA
(e) 09/01/22 | | | 2,000,000 | | | | 935,160 | | |
| CA Yosemite Community College District | |
Series 2005 A,
Insured: FGIC
5.000% 08/01/16 | | | 2,505,000 | | | | 2,742,299 | | |
| Local General Obligations Total | | | 48,962,693 | | |
| Special Non-Property Tax – 1.1% | |
CA Napa County Flood Protection &
Watershed Improvement Authority | |
Series 2005,
Insured: AMBAC
4.500% 06/15/12 | | | 1,000,000 | | | | 1,072,940 | | |
CA Orange County Local Transportation
Authority | |
Series 1992,
Insured: AMBAC
6.200% 02/14/11 | | | 1,150,000 | | | | 1,163,432 | | |
| Special Non-Property Tax Total | | | 2,236,372 | | |
| Special Property Tax – 4.5% | |
CA Culver City Redevelopment
Finance Authority | |
Series 1993,
Insured: AMBAC
5.500% 11/01/14 | | | 2,025,000 | | | | 2,079,108 | | |
| CA Indian Wells Redevelopment Agency | |
Series 2003 A,
Insured: AMBAC
5.000% 09/01/14 | | | 450,000 | | | | 459,499 | | |
| CA Long Beach Bond Finance Authority | |
Series 2002 B,
Insured: AMBAC
5.500% 11/01/19 | | | 1,070,000 | | | | 1,066,555 | | |
| | | Par ($) | | Value ($) | |
CA Los Angeles Municipal
Improvement Corp. | |
Series 2002 G,
Insured: MBIA
5.250% 09/01/13 | | | 1,500,000 | | | | 1,658,865 | | |
| CA Oakland Redevelopment Agency | |
Series 1992,
Insured: AMBAC
5.500% 02/01/14 | | | 3,060,000 | | | | 3,109,817 | | |
| CA Redwood City Redevelopment Agency | |
Series 2003 A,
Insured: AMBAC
5.250% 07/15/13 | | | 1,000,000 | | | | 1,046,390 | | |
| Special Property Tax Total | | | 9,420,234 | | |
| State Appropriated – 3.5% | |
| CA Bay Area Infrastructure Financing Authority | |
Series 2006,
Insured: FGIC
5.000% 08/01/17 | | | 2,000,000 | | | | 2,064,240 | | |
| CA Public Works Board | |
Series 2005 A,
5.000% 06/01/15 | | | 1,200,000 | | | | 1,237,596 | | |
Series 2006 A,
5.000% 04/01/28 | | | 1,000,000 | | | | 888,580 | | |
| CA San Francisco Building Authority | |
Series 2005 A,
5.000% 12/01/12 | | | 3,000,000 | | | | 3,175,170 | | |
| State Appropriated Total | | | 7,365,586 | | |
| State General Obligations – 6.9% | |
| CA State | |
Series 2004 A,
Insured: FGIC
5.250% 07/01/14 | | | 1,000,000 | | | | 1,086,710 | | |
Series 2005,
5.000% 06/01/11 | | | 2,000,000 | | | | 2,107,480 | | |
Series 2007:
4.500% 08/01/26 | | | 1,000,000 | | | | 865,100 | | |
| 5.000% 08/01/18 | | | 3,750,000 | | | | 3,833,625 | | |
Series 2009,
5.625% 04/01/26 (a) | | | 2,000,000 | | | | 2,002,280 | | |
| PR Commonwealth of Puerto Rico | |
Series 2002 A,
Insured: FGIC
5.500% 07/01/17 | | | 1,000,000 | | | | 931,070 | | |
Series 2004 A,
5.250% 07/01/19 | | | 1,000,000 | | | | 882,750 | | |
See Accompanying Notes to Financial Statements.
53
Columbia California Intermediate Municipal Bond Fund
March 31, 2009
| Municipal Bonds (continued) | |
| | | Par ($) | | Value ($) | |
Series 2007 A,
Insured: FGIC
5.500% 07/01/21 | | | 1,500,000 | | | | 1,320,135 | | |
PR Commonwealth of Puerto Rico
Public Buildings Authority | |
Series 2004 J,
Insured: AMBAC
5.000% 07/01/36 (b) | | | 1,255,000 | | | | 1,209,381 | | |
| State General Obligations Total | | | 14,238,531 | | |
| Tax-Backed Total | | | 96,464,985 | | |
| Transportation – 2.8% | |
| Airports – 2.3% | |
| CA Sacramento County Airport Systems | |
Series 2008 A,
Insured: FSA
5.000% 07/01/23 | | | 1,000,000 | | | | 1,016,590 | | |
CA San Francisco City & County
Airports Commission | |
Series 2003 B,
Insured: FGIC
5.250% 05/01/13 | | | 2,000,000 | | | | 2,140,220 | | |
Series 2008 34-D,
Insured: AGO
5.000% 05/01/18 | | | 500,000 | | | | 538,935 | | |
| CA San Jose Airport | |
Series 2007,
Insured: AMBAC
5.000% 03/01/22 | | | 1,000,000 | | | | 969,420 | | |
| Airports Total | | | 4,665,165 | | |
| Transportation – 0.5% | |
| CA Department of Transportation | |
Series 2004 A,
Insured: FGIC,
4.500% 02/01/13 | | | 1,000,000 | | | | 1,073,020 | | |
| Transportation Total | | | 1,073,020 | | |
| Transportation Total | | | 5,738,185 | | |
| Utilities – 27.8% | |
| Independent Power Producers – 1.5% | |
| CA Sacramento Power Authority | |
Series 2005,
Insured: AMBAC
5.250% 07/01/15 | | | 3,000,000 | | | | 3,198,540 | | |
| Independent Power Producers Total | | | 3,198,540 | | |
| | | Par ($) | | Value ($) | |
| Joint Power Authority – 6.0% | |
| CA M S R Public Power Agency | |
Series 2008 L,
Insured: FSA
5.000% 07/01/21 | | | 3,500,000 | | | | 3,681,020 | | |
CA Southern California Public
Power Authority | |
Series 1989,
6.750% 07/01/13 | | | 3,000,000 | | | | 3,526,800 | | |
Series 2005 A,
Insured: FSA
5.000% 01/01/18 | | | 2,000,000 | | | | 2,138,700 | | |
Series 2008 A,
5.000% 07/01/22 | | | 2,000,000 | | | | 2,037,680 | | |
Series 2008 B,
6.000% 07/01/27 | | | 1,000,000 | | | | 1,043,880 | | |
| Joint Power Authority Total | | | 12,428,080 | | |
| Municipal Electric – 12.9% | |
| CA Anaheim Public Financing Authority | |
Series 1999,
Insured: AMBAC
5.000% 10/01/13 | | | 1,500,000 | | | | 1,637,820 | | |
| CA Department of Water Resources | |
Series 2002 A,
6.000% 05/01/13 | | | 2,375,000 | | | | 2,615,516 | | |
Series 2002 G 11,
5.000% 05/01/18 | | | 2,000,000 | | | | 2,125,460 | | |
Series 2008,
5.000% 05/01/17 | | | 1,000,000 | | | | 1,072,520 | | |
| CA Imperial Irrigation District | |
Series 2008,
5.250% 11/01/21 | | | 2,500,000 | | | | 2,636,200 | | |
CA Los Angeles Department of
Water & Power | |
Series 2001 A,
Insured: MBIA
5.250% 07/01/15 | | | 1,300,000 | | | | 1,390,233 | | |
Series 2003 A Sub-Series A-1,
Insured: MBIA
5.000% 07/01/14 | | | 1,000,000 | | | | 1,097,200 | | |
Series 2007 A Sub-Series A-1,
Insured: AMBAC
5.000% 07/01/19 | | | 1,000,000 | | | | 1,081,670 | | |
| CA Modesto Irrigation District | |
Series 2001 A,
Insured: FSA
5.250% 07/01/18 | | | 1,185,000 | | | | 1,245,850 | | |
See Accompanying Notes to Financial Statements.
54
Columbia California Intermediate Municipal Bond Fund
March 31, 2009
| Municipal Bonds (continued) | |
| | | Par ($) | | Value ($) | |
| CA Northern California Power Agency | |
Series 2008 1C,
Insured: AGO
5.000% 07/01/22 | | | 3,000,000 | | | | 3,088,230 | | |
| CA Riverside Electric Revenue | |
Series 2008 D,
Insured: FSA
5.000% 10/01/23 | | | 1,000,000 | | | | 1,030,350 | | |
| CA Sacramento Municipal Utility District | |
Series 2008 U,
Insured: FSA
5.000% 08/15/21 | | | 2,500,000 | | | | 2,582,800 | | |
Series 2006,
Insured: MBIA
5.000% 07/01/15 | | | 1,000,000 | | | | 977,900 | | |
| CA Walnut Energy Center Authority | |
Series 2004 A,
Insured: AMBAC
5.000% 01/01/16 | | | 2,055,000 | | | | 2,179,471 | | |
PR Commonwealth of Puerto Rico
Electric Power Authority | |
Series 1997 AA,
Insured: MBIA
6.250% 07/01/10 | | | 2,000,000 | | | | 2,051,500 | | |
| Municipal Electric Total | | | 26,812,720 | | |
| Water & Sewer – 7.4% | |
| CA Clovis Public Financing Authority | |
Series 2007,
Insured: AMBAC
5.000% 08/01/21 | | | 1,000,000 | | | | 985,730 | | |
| CA Fresno | |
Series 2008 A,
Insured: AGO
5.000% 09/01/23 | | | 1,000,000 | | | | 1,030,250 | | |
CA Kern County Water Agency
Improvement District No. 004 | |
Series 2008 A,
Insured: AGO
5.000% 05/01/22 | | | 2,020,000 | | | | 2,070,904 | | |
CA Los Angeles Waste Water
System Authority | |
Series 2009 A,
5.750% 06/01/25 | | | 2,000,000 | | | | 2,134,700 | | |
| | | Par ($) | | Value ($) | |
CA Metropolitan Water District of
Southern California | |
Series 2008 B,
5.000% 07/01/22 | | | 2,500,000 | | | | 2,682,550 | | |
CA Rancho Water District
Financing Authority | |
Series 2001 A,
Insured: FSA
5.500% 08/01/10 | | | 1,000,000 | | | | 1,055,650 | | |
| CA Sacramento County Sanitation District | |
Series 2006,
Insured: FGIC
5.000% 12/01/17 | | | 1,000,000 | | | | 1,090,400 | | |
CA Sacramento County Water
Financing Authority | |
Series 2007 A,
Insured: FGIC
5.000% 06/01/18 | | | 2,000,000 | | | | 2,127,020 | | |
CA San Diego Public Facilities
Financing Authority | |
Series 1995,
Insured: FGIC
5.200% 05/15/13 | | | 1,000,000 | | | | 1,001,960 | | |
CA San Francisco City & County Public
Utilities Commission | |
Series 2003 A,
Insured: MBIA
5.000% 10/01/13 | | | 1,000,000 | | | | 1,082,230 | | |
| Water & Sewer Total | | | 15,261,394 | | |
| Utilities Total | | | 57,700,734 | | |
Total Municipal Bonds
(cost of $204,913,858) | | | 201,369,121 | | |
See Accompanying Notes to Financial Statements.
55
Columbia California Intermediate Municipal Bond Fund
March 31, 2009
| Municipal Preferred Stock – 0.7% | |
| | | Shares | | Value ($) | |
| Housing – 0.7% | |
| Multi-Family – 0.7% | |
| Munimae TE Bond Subsidiary LLC | |
Series 2004 A-2,
4.900% 06/30/49 (f) | | | 2,000,000 | | | | 1,403,500 | | |
| Multi-Family Total | | | 1,403,500 | | |
| Housing Total | | | 1,403,500 | | |
Total Municipal Preferred Stock
(cost of $2,000,000) | | | 1,403,500 | | |
| Investment Company – 3.5% | |
| | | Shares | | | |
Columbia California Tax-Exempt
Reserves, Trust Class
(7 day yield of 0.390%) (g)(h) | | | 7,259,000 | | | | 7,259,000 | | |
Total Investment Company
(cost of $7,259,000) | | | 7,259,000 | | |
| Short-Term Obligation – 0.5% | |
| | | Par ($) | | | |
| Variable Rate Demand Note (i) – 0.5% | |
| CA Department of Water Resources | |
Power Supply Revenue,
Series 2002 B-1,
LOC: Bank of New York,
LOC: California State
Teachers' Retirement System
0.250% 05/01/22 | | | 1,100,000 | | | | 1,100,000 | | |
| Variable Rate Demand Note Total | | | 1,100,000 | | |
Total Short-Term Obligation
(cost of $1,100,000) | | | 1,100,000 | | |
Total Investments – 101.6%
(cost of $215,272,858) (j) | | | 211,131,621 | | |
| Other Assets & Liabilities, Net – (1.6)% | | | (3,415,586 | ) | |
| Net Assets – 100.0% | | | 207,716,035 | | |
Notes to Investment Portfolio:
On April 1, 2008, the Fund adopted Statement of Financial Accounting Standards No. 157, Fair Value Measurements ("SFAS 157"). SFAS 157 establishes a hierarchy that prioritizes the inputs to valuation techniques used to measure fair value giving the highest priority to unadjusted quoted prices in active markets for identical securities (level 1 measurements) and the lowest priority to unobservable inputs (level 3 measurements) when market prices are not readily available or reliable. The three levels of the fair value hierarchy under SFAS 157 are described below:
• Level 1 – quoted prices in active markets for identical securities
• Level 2 – prices determined using other significant observable inputs (including quoted prices for similar securities, interest rates, prepayment speeds, credit risk and others)
• Level 3 – prices determined using significant unobservable inputs. In situations where quoted prices or observable inputs are unavailable or less reliable, unobservable inputs may be used. Unobservable inputs may include management's own assumptions about the factors market participants would use in pricing an investment.
The inputs or methodology used for valuing securities are not necessarily an indication of the risk associated with investing in those securities.
The following table summarizes the inputs used, as of March 31, 2009 in valuing the Fund's assets:
| Valuation Inputs | | Investments in
Securities | | Other Financial
Instruments | |
| Level 1 – Quoted Prices | | $ | 7,259,000 | | | $ | – | | |
Level 2 – Other Significant
Observable Inputs | | | 203,872,621 | | | | – | | |
Level 3 – Significant
Unobservable Inputs | | | – | | | | – | | |
| Total | | $ | 211,131,621 | | | $ | – | | |
(a) Security purchased on a delayed delivery basis.
(b) The interest rate shown on floating rate or variable rate securities reflects the rate at March 31, 2009.
(c) The Fund has been informed that each issuer has placed direct obligations of the U.S. Government in an irrevocable trust, solely for the payment of principal and interest.
(d) Step bond. This security is currently not paying coupon. Shown parenthetically is the next interest rate to be paid and the date the Fund will begin accruing at this rate.
(e) Zero coupon bond.
(f) Security exempt from registration pursuant to Rule 144A under the Securities Act of 1933. This security may be resold in transactions exempt from registration, normally to qualified institutional buyers. At March 31, 2009, this security, which is not illiquid, amounted to $1,403,500, which represents 0.7% of net assets.
(g) Money market mutual fund registered under the Investment Company Act of 1940, as amended, and advised by Columbia Management Advisors, LLC.
(h) Investments in affiliates during the year ended March 31, 2009:
Security name: Columbia California Tax-Exempt Reserves, Trust Class (7 day yield of 0.390%)
| Shares as of 03/31/08: | | | – | | |
| Shares purchased: | | | 27,345,037 | | |
| Shares sold: | | | (20,086,037 | ) | |
| Shares as of 03/31/09: | | | 7,259,000 | | |
| Net realized gain (loss): | | $ | – | | |
| Dividend income earned: | | $ | 6,217 | | |
| Value at end of period: | | $ | 7,259,000 | | |
(i) Variable rate demand note. This security is payable upon demand and is secured by letters of credit or other credit support agreements from banks. The interest rate changes periodically and the interest rate shown reflects the rates as of March 31, 2009.
(j) Cost for federal income tax purposes is $215,234,943.
See Accompanying Notes to Financial Statements.
56
Columbia California Intermediate Municipal Bond Fund
March 31, 2009
At March 31, 2009, the composition of the Fund by revenue source is as follows:
| Holdings by Revenue Source (Unaudited) | | % of
Net Assets | |
| Tax-Backed | | | 46.4 | | |
| Utilities | | | 27.8 | | |
| Other | | | 6.8 | | |
| Health Care | | | 6.5 | | |
| Education | | | 5.5 | | |
| Transportation | | | 2.8 | | |
| Housing | | | 1.1 | | |
| Resource Recovery | | | 0.5 | | |
| Industrials | | | 0.2 | | |
| | | | 97.6 | | |
| Investment Company | | | 3.5 | | |
| Short-Term Obligation | | | 0.5 | | |
| Other Assets & Liabilities, Net | | | (1.6 | ) | |
| | | | 100.0 | | |
| Acronym | | Name | |
| AGO | | Assured Guaranty Corp. | |
|
| AMBAC | | Ambac Assurance Corp. | |
|
| FGIC | | Financial Guaranty Insurance Co. | |
|
| FSA | | Financial Security Assurance, Inc. | |
|
| LOC | | Letter of Credit | |
|
| MBIA | | MBIA Insurance Corp. | |
|
See Accompanying Notes to Financial Statements.
57
Investment Portfolio – Columbia Georgia Intermediate Municipal Bond Fund
March 31, 2009
| Municipal Bonds – 93.5% | |
| | | Par ($) | | Value ($) | |
| Education – 9.8% | |
| Education – 9.7% | |
| GA Athens Housing Authority | |
University of Georgia – East
Campus Housing,
Series 2002,
Insured: AMBAC
5.250% 12/01/19 | | | 1,150,000 | | | | 1,202,785 | | |
| GA Bleckley & Dodge | |
Middle Georgia College,
Series 2008,
5.000% 07/01/21 | | | 1,260,000 | | | | 1,230,592 | | |
GA Bulloch County Development
Authority | |
Georgia Southern University
Student Housing,
Series 2008,
Insured: AGO
5.250% 07/01/20 | | | 1,000,000 | | | | 1,095,790 | | |
| GA Cobb County Development Authority | |
Kennesaw State University Foundation,
Series 2004,
Insured: MBIA
5.000% 07/15/19 | | | 1,870,000 | | | | 1,982,013 | | |
GA DeKalb Newton & Gwinnett
Counties Joint Development Authority | |
GGC Foundation LLC,
Series 2009,
5.500% 07/01/24 | | | 2,500,000 | | | | 2,454,250 | | |
GA Private Colleges & Universities
Authority | |
Spelman College,
Series 2003,
5.250% 06/01/19 | | | 2,250,000 | | | | 2,376,562 | | |
GA South Regional Joint Development
Authority | |
Valdosta State University
Auxiliary Services,
Series 2008,
Insured: AGO
5.000% 08/01/23 | | | 1,125,000 | | | | 1,134,360 | | |
PR Commonwealth of Puerto Rico
University of Puerto Rico | |
Series 2006 Q,
5.000% 06/01/12 | | | 1,000,000 | | | | 977,920 | | |
| Education Total | | | 12,454,272 | | |
| | | Par ($) | | Value ($) | |
| Prep School – 0.1% | |
| GA Gainesville Redevelopment Authority | |
Riverside Military Academy Project,
Series 2007,
5.125% 03/01/27 | | | 250,000 | | | | 153,228 | | |
| Prep School Total | | | 153,228 | | |
| Education Total | | | 12,607,500 | | |
| Health Care – 5.0% | |
| Hospitals – 5.0% | |
| GA Chatham County Hospital Authority | |
Memorial Health University
Medical Center,
Series 2004 A,
5.375% 01/01/26 | | | 1,000,000 | | | | 722,680 | | |
Memorial Medical Center,
Series 2001 A,
6.125% 01/01/24 | | | 2,500,000 | | | | 2,034,600 | | |
| GA Clayton County Hospital Authority | |
Good Samaritan Community,
Series 1998 A,
Insured: MBIA
5.250% 08/01/09 | | | 1,060,000 | | | | 1,064,441 | | |
| GA Savannah Hospital Authority | |
St. Joseph's Candler Health Systems,
Series 1998 A,
Insured: FSA:
5.250% 07/01/11 | | | 1,225,000 | | | | 1,239,149 | | |
| 5.250% 07/01/12 | | | 1,310,000 | | | | 1,324,554 | | |
| Hospitals Total | | | 6,385,424 | | |
| Health Care Total | | | 6,385,424 | | |
| Housing – 7.0% | |
| Multi-Family – 6.9% | |
| GA Clayton County Housing Authority | |
GCC Ventures LLC,
Series 2001,
Guarantor: FNMA
4.350% 12/01/31 (a) | | | 3,550,000 | | | | 3,734,564 | | |
| GA Cobb County Development Authority | |
Kennesaw State University Foundation,
Series 2004 A,
Insured: MBIA
5.250% 07/15/19 | | | 2,000,000 | | | | 2,146,180 | | |
See Accompanying Notes to Financial Statements.
58
Columbia Georgia Intermediate Municipal Bond Fund
March 31, 2009
| Municipal Bonds (continued) | |
| | | Par ($) | | Value ($) | |
Kennesaw State University Foundation,
Series 2007 A,
Insured: AMBAC
5.250% 07/15/27 | | | 3,000,000 | | | | 2,500,650 | | |
| GA Lawrenceville Housing Authority | |
Knollwood Park LP,
Series 1997, AMT,
Guarantor: FNMA
6.250% 12/01/29 (a) | | | 490,000 | | | | 493,401 | | |
| Multi-Family Total | | | 8,874,795 | | |
| Single-Family – 0.1% | |
| GA Housing & Finance Authority | |
Series 1998 B-3,
Insured: FHA
4.400% 06/01/17 | | | 145,000 | | | | 146,180 | | |
| Single-Family Total | | | 146,180 | | |
| Housing Total | | | 9,020,975 | | |
| Industrials – 3.2% | |
| Forest Products & Paper – 2.0% | |
GA Richmond County Development
Authority | |
International Paper Co.,
Series 2001 A,
5.150% 03/01/15 | | | 3,000,000 | | | | 2,528,310 | | |
| Forest Products & Paper Total | | | 2,528,310 | | |
| Oil & Gas – 1.2% | |
| GA Main Street Natural Gas, Inc. | |
Series 2007 A:
5.250% 09/15/18 | | | 1,000,000 | | | | 713,590 | | |
| 5.250% 09/15/19 | | | 1,250,000 | | | | 870,488 | | |
| Oil & Gas Total | | | 1,584,078 | | |
| Industrials Total | | | 4,112,388 | | |
| Other – 7.2% | |
| Refunded/Escrowed (b) – 7.2% | |
| GA Atlanta Airport Facilities | |
Series 2000 A,
Pre-refunded 01/01/10,
Insured: FGIC
5.600% 01/01/30 | | | 3,000,000 | | | | 3,143,310 | | |
| GA Forsyth County School District | |
Series 1999,
Pre-refunded 02/01/10,
6.000% 02/01/15 | | | 2,000,000 | | | | 2,128,480 | | |
| | | Par ($) | | Value ($) | |
GA Gainesville & Hall County
Hospital Authority | |
Northeast Georgia Health System, Inc.,
Series 2001,
Pre-refunded 05/15/11,
5.000% 05/15/15 | | | 1,000,000 | | | | 1,080,050 | | |
GA Gwinnett County Development
Authority | |
Series 2004,
Pre-refunded 01/01/14,
Insured: MBIA
5.250% 01/01/15 | | | 2,000,000 | | | | 2,293,080 | | |
GA Metropolitan Atlanta Rapid Transit
Authority | |
Series 1983 D,
Escrowed to Maturity,
7.000% 07/01/11 | | | 540,000 | | | | 611,507 | | |
| Refunded/Escrowed Total | | | 9,256,427 | | |
| Other Total | | | 9,256,427 | | |
| Tax-Backed – 27.8% | |
| Local Appropriated – 2.4% | |
GA Atlanta Public Safety & Judicial
Facilities Authority | |
Series 2006,
Insured: FSA
5.000% 12/01/17 | | | 1,310,000 | | | | 1,452,030 | | |
| GA East Point Building Authority | |
| Series 2000, | |
Insured: FSA
(c) 02/01/18 | | | 2,490,000 | | | | 1,564,716 | | |
| Local Appropriated Total | | | 3,016,746 | | |
| Local General Obligations – 15.9% | |
GA Atlanta Solid Waste Management
Authority | |
Series 2008,
Insured: FSA
5.000% 12/01/17 | | | 795,000 | | | | 890,893 | | |
| GA Barrow County School District | |
Series 2006,
5.000% 02/01/14 | | | 1,000,000 | | | | 1,129,210 | | |
| GA Chatham County School District | |
Series 2002,
Insured: FSA
5.250% 08/01/14 | | | 1,000,000 | | | | 1,152,770 | | |
See Accompanying Notes to Financial Statements.
59
Columbia Georgia Intermediate Municipal Bond Fund
March 31, 2009
| Municipal Bonds (continued) | |
| | | Par ($) | | Value ($) | |
Series 2004,
Insured: FSA
5.250% 08/01/19 | | | 2,000,000 | | | | 2,334,840 | | |
GA College Park Business &
Industrial Development Authority | |
Series 2005,
Insured: AMBAC
5.250% 09/01/19 | | | 3,230,000 | | | | 3,507,748 | | |
| GA Douglas County School District | |
Series 2007,
Insured: FSA
5.000% 04/01/18 | | | 1,500,000 | | | | 1,700,895 | | |
| 5.000% 04/01/21 | | | 2,000,000 | | | | 2,188,040 | | |
| 5.000% 04/01/23 | | | 1,500,000 | | | | 1,606,395 | | |
| GA Fulton County School District | |
Series 1998,
5.375% 01/01/17 | | | 1,390,000 | | | | 1,614,624 | | |
| GA Gwinnett County School District | |
Series 2008:
5.000% 02/01/17 | | | 1,000,000 | | | | 1,157,550 | | |
| 5.000% 02/01/22 | | | 1,000,000 | | | | 1,098,330 | | |
| GA Lowndes County | |
Series 2008,
Insured: FSA
5.000% 04/01/14 | | | 1,000,000 | | | | 1,127,600 | | |
| MI Detroit | |
Series 2001 B,
Insured: MBIA
5.375% 04/01/14 | | | 1,000,000 | | | | 965,260 | | |
| Local General Obligations Total | | | 20,474,155 | | |
| Special Non-Property Tax – 5.1% | |
GA Cobb-Marietta County
Coliseum & Exhibit Hall Authority | |
Series 2005,
Insured: MBIA
5.250% 10/01/19 | | | 2,430,000 | | | | 2,610,014 | | |
GA Metropolitan Atlanta Rapid
Transit Authority | |
Series 1992 N,
Insured: MBIA
6.250% 07/01/18 | | | 2,000,000 | | | | 2,294,000 | | |
PR Commonwealth of Puerto Rico
Infrastructure Financing Authority | |
Series 2006 B,
5.000% 07/01/20 | | | 2,000,000 | | | | 1,700,920 | | |
| Special Non-Property Tax Total | | | 6,604,934 | | |
| | | Par ($) | | Value ($) | |
| Special Property Tax – 1.2% | |
| GA Atlanta Tax Allocation | |
Atlantic Station Project,
Series 2007,
Insured: AGO
5.250% 12/01/20 | | | 1,545,000 | | | | 1,574,726 | | |
| Special Property Tax Total | | | 1,574,726 | | |
| State General Obligations – 3.2% | |
| GA Georgia State | |
Series 2007 G,
5.000% 12/01/20 | | | 2,000,000 | | | | 2,233,120 | | |
PR Commonwealth of Puerto Rico
Public Buildings Authority | |
Series 2007,
6.250% 07/01/23 | | | 1,825,000 | | | | 1,829,909 | | |
| State General Obligations Total | | | 4,063,029 | | |
| Tax-Backed Total | | | 35,733,590 | | |
| Transportation – 3.8% | |
| Toll Facilities – 3.8% | |
| GA State Road & Tollway Authority | |
Series 2006,
Insured: MBIA
5.000% 06/01/16 | | | 3,405,000 | | | | 3,868,829 | | |
Series 2009 A,
5.000% 06/01/21 | | | 1,000,000 | | | | 1,057,190 | | |
| Toll Facilities Total | | | 4,926,019 | | |
| Transportation Total | | | 4,926,019 | | |
| Utilities – 29.7% | |
| Investor Owned – 3.1% | |
GA Appling County Development
Authority | |
Georgia Power Company,
Series 2006,
Insured: AMBAC
4.400% 07/01/16 | | | 1,000,000 | | | | 1,008,430 | | |
GA Monroe County Development
Authority | |
Georgia Power Company,
Series 1995,
4.500% 07/01/25 (a) | | | 2,000,000 | | | | 2,007,020 | | |
See Accompanying Notes to Financial Statements.
60
Columbia Georgia Intermediate Municipal Bond Fund
March 31, 2009
| Municipal Bonds (continued) | |
| | | Par ($) | | Value ($) | |
| IN Jasper County Indiana | |
Northern Indiana Public
Service Company,
Series 1988 A,
Insured: MBIA
5.600% 11/01/16 | | | 1,000,000 | | | | 980,920 | | |
| Investor Owned Total | | | 3,996,370 | | |
| Joint Power Authority – 6.9% | |
GA Monroe County Development
Authority | |
Oglethorpe Power Corp.,
Series 1992,
6.800% 01/01/12 | | | 1,000,000 | | | | 1,094,760 | | |
| GA Municipal Electric Authority | |
Series 1998 A,
Insured: MBIA
5.250% 01/01/13 | | | 1,000,000 | | | | 1,079,190 | | |
Series 2008 A,
5.250% 01/01/21 | | | 1,395,000 | | | | 1,459,714 | | |
Series 2008 D,
6.000% 01/01/23 | | | 1,000,000 | | | | 1,068,660 | | |
Power Revenue Bonds,
Series 1992 B,
Insured: MBIA
6.375% 01/01/16 | | | 2,000,000 | | | | 2,280,940 | | |
TX Sam Rayburn Municipal
Power Agency | |
Series 2002,
6.000% 10/01/16 | | | 2,000,000 | | | | 1,918,520 | | |
| Joint Power Authority Total | | | 8,901,784 | | |
| Water & Sewer – 19.7% | |
| GA Augusta Water & Sewer | |
Series 2007,
Insured: FSA:
5.000% 10/01/21 | | | 1,000,000 | | | | 1,068,680 | | |
| 5.000% 10/01/22 | | | 2,000,000 | | | | 2,114,920 | | |
GA Cherokee County Water & Sewer
Authority | |
Series 1993,
Insured: MBIA
5.300% 08/01/09 | | | 95,000 | | | | 95,412 | | |
| GA Columbus County Water & Sewer | |
Series 2003,
Insured: FSA
5.250% 05/01/13 | | | 1,220,000 | | | | 1,380,491 | | |
| | | Par ($) | | Value ($) | |
Series 2007,
Insured: FSA
5.000% 05/01/26 | | | 1,000,000 | | | | 1,017,250 | | |
GA Coweta County Water & Sewage
Authority | |
Series 2005,
Insured: FSA
5.000% 06/01/25 | | | 2,505,000 | | | | 2,592,149 | | |
| GA Dekalb County Water & Sewer | |
Series 2006 B:
5.250% 10/01/21 | | | 2,000,000 | | | | 2,287,520 | | |
| 5.250% 10/01/24 | | | 2,750,000 | | | | 3,043,370 | | |
| GA Gainesville Water & Sewer | |
Series 2006,
Insured: FSA
5.000% 11/15/16 | | | 1,000,000 | | | | 1,078,240 | | |
| GA Griffin Combined Public Utility | |
Series 2002,
Insured: AMBAC
5.125% 01/01/19 | | | 2,585,000 | | | | 2,727,873 | | |
| GA Jackson County Water & Sewer | |
Series 2006 A,
Insured: XLCA
5.000% 09/01/16 | | | 1,030,000 | | | | 1,101,595 | | |
GA Rockdale County Water & Sewer
Authority | |
Series 2005,
Insured: FSA
5.000% 07/01/21 | | | 2,000,000 | | | | 2,133,440 | | |
GA Upper Oconee Basin Water
Authority | |
Series 2005,
Insured: MBIA:
5.000% 07/01/17 | | | 1,140,000 | | | | 1,216,061 | | |
| 5.000% 07/01/22 | | | 1,855,000 | | | | 1,918,200 | | |
GA Walton County Water & Sewer
Authority | |
Walton Hard Labor Creek
Reservoir Project,
Series 2008,
Insured: FSA
5.000% 02/01/25 | | | 1,495,000 | | | | 1,520,430 | | |
| Water & Sewer Total | | | 25,295,631 | | |
| Utilities Total | | | 38,193,785 | | |
Total Municipal Bonds
(cost of $121,664,794) | | | 120,236,108 | | |
See Accompanying Notes to Financial Statements.
61
Columbia Georgia Intermediate Municipal Bond Fund
March 31, 2009
| Investment Companies – 5.5% | |
| | | Shares | | Value ($) | |
Columbia Tax-Exempt Reserves,
Capital Class
(7 day yield of 0.704%) (d)(e) | | | 3,072,376 | | | | 3,072,376 | | |
Dreyfus Tax-Exempt Cash
Management Fund
(7 day yield of 0.780%) | | | 4,000,000 | | | | 4,000,000 | | |
Total Investment Companies
(cost of $7,072,376) | | | 7,072,376 | | |
Total Investments – 99.0%
(cost of $128,737,170) (f) | | | 127,308,484 | | |
| Other Assets & Liabilities, Net – 1.0% | | | 1,265,476 | | |
| Net Assets – 100.0% | | | 128,573,960 | | |
Notes to Investment Portfolio:
On April 1, 2008, the Fund adopted Statement of Financial Accounting Standards No. 157, Fair Value Measurements ("SFAS 157"). SFAS 157 establishes a hierarchy that prioritizes the inputs to valuation techniques used to measure fair value giving the highest priority to unadjusted quoted prices in active markets for identical securities (level 1 measurements) and the lowest priority to unobservable inputs (level 3 measurements) when market prices are not readily available or reliable. The three levels of the fair value hierarchy under SFAS 157 are described below:
• Level 1 – quoted prices in active markets for identical securities
• Level 2 – prices determined using other significant observable inputs (including quoted prices for similar securities, interest rates, prepayment speeds, credit risk and others)
• Level 3 – prices determined using significant unobservable inputs. In situations where quoted prices or observable inputs are unavailable or less reliable, unobservable inputs may be used. Unobservable inputs may include management's own assumptions about the factors market participants would use in pricing an investment.
The inputs or methodology used for valuing securities are not necessarily an indication of the risk associated with investing in those securities.
The following table summarizes the inputs used, as of March 31, 2009 in valuing the Fund's assets:
| Valuation Inputs | | Investments in
Securities | | Other Financial
Instruments | |
| Level 1 – Quoted Prices | | $ | 7,072,376 | | | $ | – | | |
Level 2 – Other Significant
Observable Inputs | | | 120,236,108 | | | | – | | |
Level 3 – Significant
Unobservable Inputs | | | – | | | | – | | |
| Total | | $ | 127,308,484 | | | $ | – | | |
(a) The interest rate shown on floating rate or variable rate securities reflects the rate at March 31, 2009.
(b) The Fund has been informed that each issuer has placed direct obligations of the U.S. Government in an irrevocable trust, solely for the payment of principal and interest.
(c) Zero coupon bond.
(d) Investments in affiliates during the year ended March 31, 2009:
Security name: Columbia Tax-Exempt Reserves, Capital Class (7 day yield of 0.704%)
| Shares as of 03/31/08: | | | 1,725,000 | | |
| Shares purchased: | | | 53,476,620 | | |
| Shares sold: | | | (52,129,244 | ) | |
| Shares as of 03/31/09: | | | 3,072,376 | | |
| Net realized gain/loss: | | $ | – | | |
| Dividend income earned: | | $ | 79,794 | | |
| Value at end of period: | | $ | 3,072,376 | | |
(e) Money market mutual fund registered under the Investment Company Act of 1940, as amended, and advised by Columbia Management Advisors, LLC.
(f) Cost for federal income tax purposes is $128,735,670.
At March 31, 2009, the composition of the Fund by revenue source is as follows:
| Holdings by Revenue Source (Unaudited) | | % of
Net Assets | |
| Utilities | | | 29.7 | | |
| Tax-Backed | | | 27.8 | | |
| Education | | | 9.8 | | |
| Other | | | 7.2 | | |
| Housing | | | 7.0 | | |
| Health Care | | | 5.0 | | |
| Transportation | | | 3.8 | | |
| Industrials | | | 3.2 | | |
| | | | 93.5 | | |
| Investment Companies | | | 5.5 | | |
| Other Assets & Liabilities, Net | | | 1.0 | | |
| | | | 100.0 | | |
| Acronym | | Name | |
| AGO | | Assured Guaranty Corp. | |
|
| AMBAC | | Ambac Assurance Corp. | |
|
| AMT | | Alternative Minimum Tax | |
|
| FGIC | | Financial Guaranty Insurance Co. | |
|
| FHA | | Federal Housing Administration | |
|
| FNMA | | Federal National Mortgage Association | |
|
| FSA | | Financial Security Assurance, Inc. | |
|
| MBIA | | MBIA Insurance Corp. | |
|
| XLCA | | XL Capital Assurance, Inc. | |
|
See Accompanying Notes to Financial Statements.
62
Investment Portfolio – Columbia Maryland Intermediate Municipal Bond Fund
March 31, 2009
| Municipal Bonds – 93.4% | |
| | | Par ($) | | Value ($) | |
| Education – 7.7% | |
| Education – 7.7% | |
MD Health & Higher Educational
Facilities Authority | |
College of Notre Dame,
Series 1998,
Insured: MBIA
4.600% 10/01/14 | | | 510,000 | | | | 545,828 | | |
Johns Hopkins University,
Series 2008,
5.000% 07/01/18 | | | 1,250,000 | | | | 1,438,037 | | |
Loyola College,
Series 2006 A,
5.125% 10/01/45 | | | 5,000,000 | | | | 4,322,350 | | |
MD Industrial Development Financing
Authority | |
American Center for Physics,
Series 2001,
GTY AGMT: American Institute of
Physics
5.250% 12/15/15 | | | 1,000,000 | | | | 1,077,270 | | |
| MD University System of Maryland | |
Series 2006,
5.000% 10/01/15 | | | 3,545,000 | | | | 4,079,409 | | |
| MD Westminster Educational Facilities | |
McDaniel College, Inc.,
Series 2006,
5.000% 11/01/17 | | | 500,000 | | | | 502,485 | | |
| Education Total | | | 11,965,379 | | |
| Education Total | | | 11,965,379 | | |
| Health Care – 12.3% | |
| Continuing Care Retirement – 3.5% | |
| MD Baltimore County | |
Oak Crest Village, Inc.,
Series 2007 A:
5.000% 01/01/22 | | | 1,175,000 | | | | 1,000,924 | | |
| 5.000% 01/01/27 | | | 2,000,000 | | | | 1,557,760 | | |
MD Health & Higher Educational
Facilities Authority | |
King Farm Presbyterian Community,
Series 2007 A,
5.250% 01/01/27 | | | 2,000,000 | | | | 1,169,900 | | |
| | | Par ($) | | Value ($) | |
MD Howard County Retirement
Authority | |
Columbia Vantage House Corp.,
Series 2007 A,
5.250% 04/01/27 | | | 2,500,000 | | | | 1,606,050 | | |
| Continuing Care Retirement Total | | | 5,334,634 | | |
| Hospitals – 8.8% | |
| MD Baltimore County | |
Catholic Health Initiatives,
Series 2006 A,
5.000% 09/01/16 | | | 1,000,000 | | | | 1,049,190 | | |
MD Health & Higher Educational
Facilities Authority | |
Carrol Hospital Center Foundation,
Series 2006,
4.500% 07/01/26 | | | 1,000,000 | | | | 760,850 | | |
| Johns Hopkins Hospital, | |
Series 1998,
Insured: MBIA
5.000% 07/01/29 | | | 1,000,000 | | | | 797,020 | | |
Series 2008,
5.000% 05/15/48 | | | 2,000,000 | | | | 2,124,980 | | |
Peninsula Regional Medical Center,
Series 2006:
5.000% 07/01/26 | | | 4,000,000 | | | | 3,585,320 | | |
| 5.000% 07/01/36 | | | 2,000,000 | | | | 1,636,500 | | |
University of Maryland Medical System,
Series 2006 A,
5.000% 07/01/31 | | | 1,000,000 | | | | 821,680 | | |
Western Maryland Health System,
Series 2006 A,
Insured: MBIA:
5.000% 07/01/13 | | | 1,320,000 | | | | 1,383,927 | | |
| 5.000% 01/01/20 | | | 1,500,000 | | | | 1,468,170 | | |
| Hospitals Total | | | 13,627,637 | | |
| Health Care Total | | | 18,962,271 | | |
| Housing – 8.7% | |
| Multi-Family – 5.1% | |
| MD Economic Development Corp. | |
Salisbury State University Project,
Series 1999 A:
5.600% 06/01/10 | | | 270,000 | | | | 269,819 | | |
| 6.000% 06/01/19 | | | 815,000 | | | | 707,021 | | |
| 6.000% 06/01/30 | | | 1,850,000 | | | | 1,347,873 | | |
Series 1999 A,
5.700% 06/01/12 | | | 1,000,000 | | | | 984,490 | | |
See Accompanying Notes to Financial Statements.
63
Columbia Maryland Intermediate Municipal Bond Fund
March 31, 2009
| Municipal Bonds (continued) | |
| | | Par ($) | | Value ($) | |
Towson University Project,
Series 2007 A,
5.250% 07/01/24 | | | 1,185,000 | | | | 872,906 | | |
University of Maryland –
Baltimore Project,
Series 2006
Insured: XLCA
5.000% 07/01/20 | | | 600,000 | | | | 432,348 | | |
Series 2006:
University of Maryland –
College Park Project,
Insured: CIFG:
5.000% 06/01/17 | | | 1,000,000 | | | | 851,450 | | |
| 5.000% 06/01/19 | | | 1,000,000 | | | | 814,970 | | |
MD Montgomery County Housing
Opportunities Commission Housing
Revenue | |
Series 2000 A,
6.100% 07/01/30 | | | 1,500,000 | | | | 1,510,215 | | |
| Multi-Family Total | | | 7,791,092 | | |
| Single-Family – 3.6% | |
MD Community Development
Administration Department of
Housing & Community Development | |
Series 1998-3, AMT,
4.700% 04/01/10 | | | 1,685,000 | | | | 1,704,260 | | |
Series 1999 D, AMT,
5.375% 09/01/24 | | | 2,410,000 | | | | 2,410,843 | | |
Series 2003,
Insured: FSA
4.400% 07/01/21 | | | 1,500,000 | | | | 1,472,055 | | |
MD Prince Georges County Housing
Authority | |
Series 2000 A, AMT,
Guarantor: GNMA
6.150% 08/01/19 | | | 5,000 | | | | 5,077 | | |
| Single-Family Total | | | 5,592,235 | | |
| Housing Total | | | 13,383,327 | | |
| Other – 11.4% | |
| Other – 2.0% | |
| MD Transportation Authority | |
Baltimore/Washington International
Airport Parking Project,
Series 2002 A,
Insured: AMBAC
4.500% 03/01/15 | | | 3,000,000 | | | | 3,122,430 | | |
| Other Total | | | 3,122,430 | | |
| | | Par ($) | | Value ($) | |
| Pool/Bond Bank – 0.7% | |
MD Water Quality Financing
Administration Revolving
Loan Fund | |
| Series 2008 A, | |
| 5.000% 03/01/23 | | | 1,000,000 | | | | 1,087,250 | | |
| Pool/Bond Bank Total | | | 1,087,250 | | |
| Refunded/Escrowed (a) – 8.7% | |
| MD Economic Development Corp. | |
Collegiate Housing Foundation,
Series 1999 A,
Pre-refunded 06/01/09,
5.600% 06/01/11 | | | 575,000 | | | | 591,393 | | |
MD Health & Higher Educational
Facilities Authority Revenue | |
Johns Hopkins University,
Series 1999,
Pre-refunded 07/01/09,
6.000% 07/01/39 | | | 2,000,000 | | | | 2,047,980 | | |
| MD Prince Georges County | |
Series 1999,
Pre-refunded 10/01/09,
Insured: FSA
5.125% 10/01/16 | | | 3,300,000 | | | | 3,411,408 | | |
| MD Queen Anne's County | |
Series 2000,
Pre-refunded 01/15/10,
Insured: FGIC
5.250% 01/15/14 | | | 1,200,000 | | | | 1,257,492 | | |
| MD Transportation Authority | |
Series 1978,
Escrowed to Maturity,
6.800% 07/01/16 | | | 540,000 | | | | 631,811 | | |
MD Washington Suburban Sanitation
District | |
Series 2000,
Pre-refunded 06/01/10,
5.250% 06/01/22 | | | 1,000,000 | | | | 1,054,850 | | |
| MO St. Louis County | |
Series 1989 A, AMT,
Escrowed to Maturity,
Guarantor: GNMA
7.950% 08/01/09 | | | 25,000 | | | | 25,504 | | |
See Accompanying Notes to Financial Statements.
64
Columbia Maryland Intermediate Municipal Bond Fund
March 31, 2009
| Municipal Bonds (continued) | |
| | | Par ($) | | Value ($) | |
MS Hospital Facilities & Equipment
Authority | |
Forrest County General Hospital,
Series 2000,
Pre-refunded 01/01/11,
Insured: FSA:
5.500% 01/01/24 | | | 3,100,000 | | | | 3,363,872 | | |
| 5.625% 01/01/20 | | | 1,000,000 | | | | 1,087,270 | | |
| Refunded/Escrowed Total | | | 13,471,580 | | |
| Other Total | | | 17,681,260 | | |
| Other Revenue – 2.4% | |
| Hotels – 2.4% | |
| MD Baltimore | |
Baltimore Hotel Corp.,
Series 2006 A,
Insured: XLCA:
5.000% 09/01/32 | | | 1,000,000 | | | | 498,910 | | |
| 5.250% 09/01/17 | | | 1,835,000 | | | | 1,374,250 | | |
| 5.250% 09/01/20 | | | 1,615,000 | | | | 1,075,542 | | |
| 5.250% 09/01/21 | | | 1,095,000 | | | | 704,479 | | |
| Hotels Total | | | 3,653,181 | | |
| Other Revenue Total | | | 3,653,181 | | |
| Resource Recovery – 1.7% | |
| Resource Recovery – 1.7% | |
MD Northeast Waste Disposal
Authority | |
Series 2003, AMT,
Insured: AMBAC
5.500% 04/01/10 | | | 2,500,000 | | | | 2,552,675 | | |
| Resource Recovery Total | | | 2,552,675 | | |
| Resource Recovery Total | | | 2,552,675 | | |
| Tax-Backed – 41.8% | |
| Local General Obligations – 24.4% | |
| MD Anne Arundel County | |
Series 1995,
5.300% 04/01/10 | | | 500,000 | | | | 501,825 | | |
Series 2006:
5.000% 03/01/15 | | | 2,000,000 | | | | 2,289,580 | | |
| 5.000% 03/01/18 | | | 3,300,000 | | | | 3,708,078 | | |
| | | Par ($) | | Value ($) | |
| MD Baltimore County | |
Series 2006,
5.000% 09/01/15 | | | 1,120,000 | | | | 1,294,361 | | |
Series 2008,
5.000% 02/01/18 | | | 1,000,000 | | | | 1,157,590 | | |
| MD Baltimore | |
Series 2008 A,
Insured: FSA
5.000% 10/15/22 | | | 2,000,000 | | | | 2,160,740 | | |
| MD Frederick County | |
Series 2005,
5.000% 08/01/14 | | | 3,000,000 | | | | 3,422,400 | | |
Series 2006:
5.250% 11/01/18 | | | 2,005,000 | | | | 2,350,542 | | |
| 5.250% 11/01/21 | | | 2,500,000 | | | | 2,897,875 | | |
| MD Howard County | |
Series 2002 A,
5.250% 08/15/15 | | | 795,000 | | | | 857,384 | | |
| MD Laurel | |
Series 1996 A,
Insured: FGIC
5.000% 10/01/11 | | | 1,530,000 | | | | 1,534,253 | | |
| MD Montgomery County | |
Series 2001,
5.250% 10/01/14 | | | 1,000,000 | | | | 1,089,100 | | |
Series 2005 A,
5.000% 07/01/16 | | | 1,500,000 | | | | 1,736,415 | | |
| MD Prince Georges County | |
Series 1999,
Insured: FSA
5.000% 10/01/12 | | | 65,000 | | | | 66,758 | | |
Series 2000,
5.125% 10/01/10 | | | 1,000,000 | | | | 1,063,890 | | |
Series 2001,
Insured: FGIC:
5.250% 12/01/11 | | | 4,825,000 | | | | 5,343,784 | | |
| 5.250% 12/01/12 | | | 2,000,000 | | | | 2,193,580 | | |
| MD Wicomico County | |
Series 1997,
Insured: MBIA:
4.800% 12/01/10 | | | 1,290,000 | | | | 1,300,088 | | |
| 4.900% 12/01/11 | | | 1,355,000 | | | | 1,365,339 | | |
| 5.000% 12/01/12 | | | 1,425,000 | | | | 1,435,915 | | |
| Local General Obligations Total | | | 37,769,497 | | |
See Accompanying Notes to Financial Statements.
65
Columbia Maryland Intermediate Municipal Bond Fund
March 31, 2009
| Municipal Bonds (continued) | |
| | | Par ($) | | Value ($) | |
| Special Non-Property Tax – 8.0% | |
| MD Baltimore | |
Series 1996 A,
Insured: FGIC
5.900% 07/01/10 | | | 1,725,000 | | | | 1,806,075 | | |
| MD Department of Transportation | |
Series 2002:
5.500% 02/01/11 | | | 1,265,000 | | | | 1,366,592 | | |
| 5.500% 02/01/14 | | | 5,000,000 | | | | 5,735,400 | | |
PR Commonwealth of Puerto Rico
Infrastructure Financing Authority | |
Series 2005 C,
Insured: FGIC
5.500% 07/01/22 | | | 4,000,000 | | | | 3,468,160 | | |
| Special Non-Property Tax Total | | | 12,376,227 | | |
| State Appropriated – 0.7% | |
| MD Stadium Authority Lease Revenue | |
Series 1995,
5.375% 12/15/13 | | | 500,000 | | | | 501,555 | | |
| NJ Transportation Trust Fund Authority | |
Series 2006 A,
5.250% 12/15/19 | | | 500,000 | | | | 525,685 | | |
| State Appropriated Total | | | 1,027,240 | | |
| State General Obligations – 8.7% | |
| MD State | |
Series 2002 A,
5.500% 03/01/13 | | | 2,245,000 | | | | 2,569,380 | | |
Series 2003,
5.250% 03/01/17 | | | 4,000,000 | | | | 4,691,760 | | |
PR Commonwealth of Puerto Rico
Public Buildings Authority | |
Series 2003 H,
Insured: AMBAC
5.500% 07/01/18 | | | 3,000,000 | | | | 2,883,090 | | |
| PR Commonwealth of Puerto Rico | |
Series 2002 A,
Insured: FGIC
5.500% 07/01/17 | | | 2,520,000 | | | | 2,346,296 | | |
Series 2006 A,
5.250% 07/01/22 | | | 1,150,000 | | | | 972,613 | | |
| State General Obligations Total | | | 13,463,139 | | |
| Tax-Backed Total | | | 64,636,103 | | |
| | | Par ($) | | Value ($) | |
| Transportation – 0.2% | |
| Transportation – 0.2% | |
DC Washington Metropolitan Area
Transit Authority | |
Series 1993,
Insured: FGIC
6.000% 07/01/10 | | | 350,000 | | | | 366,376 | | |
| Transportation Total | | | 366,376 | | |
| Transportation Total | | | 366,376 | | |
| Utilities – 7.2% | |
| Investor Owned – 1.7% | |
| MD Economic Development Corp. | |
Potomac Electic Power Co.
Series 2009,
6.200% 09/01/22 | | | 2,500,000 | | | | 2,555,550 | | |
| Investor Owned Total | | | 2,555,550 | | |
| Joint Power Authority – 1.2% | |
TX Sam Rayburn Municipal Power
Agency | |
Series 2002,
6.000% 10/01/16 | | | 2,000,000 | | | | 1,918,520 | | |
| Joint Power Authority Total | | | 1,918,520 | | |
| Water & Sewer – 4.3% | |
| MD Baltimore | |
Series 2006 C,
Insured: AMBAC
5.000% 07/01/18 | | | 1,125,000 | | | | 1,214,966 | | |
Series 2007 DC,
Insured: AMBAC
5.000% 07/01/19 | | | 1,250,000 | | | | 1,343,850 | | |
Series 2008 A,
5.000% 07/01/21 | | | 1,250,000 | | | | 1,368,038 | | |
MD Water Quality Financing
Administration Bay Restoration Fund | |
Series 2008,
5.000% 03/01/21 | | | 2,500,000 | | | | 2,699,300 | | |
| Water & Sewer Total | | | 6,626,154 | | |
| Utilities Total | | | 11,100,224 | | |
Total Municipal Bonds
(cost of $148,995,945) | | | 144,300,796 | | |
See Accompanying Notes to Financial Statements.
66
Columbia Maryland Intermediate Municipal Bond Fund
March 31, 2009
| | | Shares | | Value ($) | |
| Investment Companies – 5.3% | |
Columbia Tax-Exempt Reserves,
Capital Class
(7 day yield of 0.704%) (b)(c) | | | 3,983,131 | | | | 3,983,131 | | |
Dreyfus Tax-Exempt
Cash Management Fund
(7 day yield of 0.780%) | | | 4,300,000 | | | | 4,300,000 | | |
Total Investment Companies
(cost of $8,283,131) | | | 8,283,131 | | |
Total Investments – 98.7%
(cost of $157,279,076) (d) | | | 152,583,927 | | |
| Other Assets & Liabilities, Net – 1.3% | | | 1,970,793 | | |
| Net Assets – 100.0% | | | 154,554,720 | | |
Notes to Investment Portfolio:
On April 1, 2008, the Fund adopted Statement of Financial Accounting Standards No. 157, Fair Value Measurements ("SFAS 157"). SFAS 157 establishes a hierarchy that prioritizes the inputs to valuation techniques used to measure fair value giving the highest priority to unadjusted quoted prices in active markets for identical securities (level 1 measurements) and the lowest priority to unobservable inputs (level 3 measurements) when market prices are not readily available or reliable. The three levels of the fair value hierarchy under SFAS 157 are described below:
• Level 1 – quoted prices in active markets for identical securities
• Level 2 – prices determined using other significant observable inputs (including quoted prices for similar securities, interest rates, prepayment speeds, credit risk and others)
• Level 3 – prices determined using significant unobservable inputs. In situations where quoted prices or observable inputs are unavailable or less reliable, unobservable inputs may be used. Unobservable inputs may include management's own assumptions about the factors market participants would use in pricing an investment.
The inputs or methodology used for valuing securities are not necessarily an indication of the risk associated with investing in those securities.
The following table summarizes the inputs used, as of March 31, 2009 in valuing the Fund's assets:
| Valuation Inputs | | Investments in
Securities | | Other Financial
Instruments | |
| Level 1 – Quoted Prices | | $ | 8,283,131 | | | $ | – | | |
Level 2 – Other Significant
Observable Inputs | | | 144,300,796 | | | | – | | |
Level 3 – Significant
Unobservable Inputs | | | – | | | | – | | |
| Total | | $ | 152,583,927 | | | $ | – | | |
(a) The Fund has been informed that each issuer has placed direct obligations of the U.S. Government in an irrevocable trust, solely for the payment of principal and interest.
(b) Investments in affiliates during the year end March 31, 2009:
Security name: Columbia Tax-Exempt Reserves, Capital Class (7 day yield of 0.704%)
| Shares as of 03/31/08: | | | 9,345,660 | | |
| Shares purchased: | | | 45,518,836 | | |
| Shares sold: | | | (50,881,365 | ) | |
| Shares as of 03/31/09: | | | 3,983,131 | | |
| Net realized gain/loss: | | $ | – | | |
| Dividend income earned: | | $ | 123,834 | | |
| Value at end of period: | | $ | 3,983,131 | | |
(c) Money market mutual fund registered under the Investment Company Act of 1940, as amended, and advised by Columbia Management Advisors, LLC.
(d) Cost for federal income tax purposes is $157,529,025.
At March 31, 2009, the composition of the Fund by revenue source is as follows:
| Holdings by Revenue Source (Unaudited) | | % of
Net Assets | |
| Tax-Backed | | | 41.8 | | |
| Health Care | | | 12.3 | | |
| Other | | | 11.4 | | |
| Housing | | | 8.7 | | |
| Education | | | 7.7 | | |
| Utilities | | | 7.2 | | |
| Other Revenue | | | 2.4 | | |
| Resource Recovery | | | 1.7 | | |
| Transportation | | | 0.2 | | |
| | | | 93.4 | | |
| Investment Companies | | | 5.3 | | |
| Other Assets & Liabilities, Net | | | 1.3 | | |
| | | | 100.0 | | |
| Acronym | | Name | |
| AMBAC | | Ambac Assurance Corp. | |
|
| AMT | | Alternative Minimum Tax | |
|
| CIFG | | CIFG Assurance North America, Inc. | |
|
| FGIC | | Financial Guaranty Insurance Co. | |
|
| FSA | | Financial Security Assurance, Inc. | |
|
| GNMA | | Government National Mortgage Association | |
|
| GTY AGMT | | Guaranty Agreement | |
|
| MBIA | | MBIA Insurance Corp. | |
|
| XLCA | | XL Capital Assurance, Inc. | |
|
See Accompanying Notes to Financial Statements.
67
Investment Portfolio – Columbia North Carolina Intermediate Municipal Bond Fund
March 31, 2009
| Municipal Bonds – 90.7% | |
| | | Par ($) | | Value ($) | |
| Education – 4.3% | |
| Education – 4.3% | |
| NC Appalachian State University | |
Series 1998,
Insured: MBIA
5.000% 05/15/12 | | | 1,000,000 | | | | 1,082,470 | | |
Series 2005,
Insured: MBIA
5.000% 07/15/21 | | | 1,485,000 | | | | 1,513,126 | | |
| NC Capital Facilities Finance Agency | |
Brevard College Corp.,
Series 2007,
5.000% 10/01/26 | | | 1,000,000 | | | | 691,880 | | |
Johnson & Wales University,
Series 2003 A,
Insured: SYNC
5.250% 04/01/21 | | | 1,000,000 | | | | 1,018,720 | | |
Meredith College,
Series 2008,
6.000% 06/01/31 | | | 1,000,000 | | | | 884,030 | | |
| NC University of North Carolina | |
Series 2008 A,
Insured: AGO
5.000% 10/01/22 | | | 2,000,000 | | | | 2,115,440 | | |
| PR University of Puerto Rico | |
Series 2006,
5.000% 06/01/15 | | | 1,000,000 | | | | 917,070 | | |
| Education Total | | | 8,222,736 | | |
| Education Total | | | 8,222,736 | | |
| Health Care – 8.0% | |
| Continuing Care Retirement – 0.5% | |
| NC Medical Care Commission | |
Givens Estate, Inc.,
Series 2007,
5.000% 07/01/16 | | | 1,000,000 | | | | 927,920 | | |
| Continuing Care Retirement Total | | | 927,920 | | |
| Hospitals – 7.5% | |
| AZ University Medical Center Corp. | |
Series 2004,
5.250% 07/01/13 | | | 1,000,000 | | | | 999,540 | | |
| NC Albemarle Hospital Authority | |
Series 2007:
5.250% 10/01/21 | | | 2,000,000 | | | | 1,639,120 | | |
| 5.250% 10/01/27 | | | 1,000,000 | | | | 762,100 | | |
| | | Par ($) | | Value ($) | |
NC Charlotte Mecklenburg
Hospital Authority | |
Carolinas Healthcare
Series 2008,
5.250% 01/15/24 | | | 2,000,000 | | | | 2,026,400 | | |
| NC Medical Care Commission | |
Novant Health,
Series 2003 A:
5.000% 11/01/13 | | | 3,000,000 | | | | 3,161,250 | | |
| 5.000% 11/01/17 | | | 2,000,000 | | | | 2,033,640 | | |
Wilson Medical Center,
Series 2007,
5.000% 11/01/19 | | | 3,385,000 | | | | 3,072,971 | | |
NC Northern Hospital District of
Surry County | |
| 5.750% 10/01/24 | | | 1,000,000 | | | | 830,800 | | |
| Hospitals Total | | | 14,525,821 | | |
| Health Care Total | | | 15,453,741 | | |
| Housing – 4.0% | |
| Multi-Family – 1.5% | |
| NC Medical Care Commission | |
ARC Project,
Series 2004 A,
5.800% 10/01/34 | | | 4,000,000 | | | | 2,976,720 | | |
| Multi-Family Total | | | 2,976,720 | | |
| Single-Family – 2.5% | |
| NC Housing Finance Agency | |
Series 1996 A-5, AMT,
5.550% 01/01/19 | | | 1,480,000 | | | | 1,496,591 | | |
Series 1998 A-2, AMT,
5.200% 01/01/20 | | | 600,000 | | | | 600,096 | | |
Series 1999 A-3, AMT,
5.150% 01/01/19 | | | 845,000 | | | | 846,166 | | |
Series 1999 A-6, AMT,
6.000% 01/01/16 | | | 390,000 | | | | 391,314 | | |
Series 2000 A-8, AMT:
5.950% 07/01/10 | | | 280,000 | | | | 284,696 | | |
| 6.050% 07/01/12 | | | 210,000 | | | | 212,497 | | |
Series 2007 A-30, AMT,
5.000% 07/01/23 | | | 1,000,000 | | | | 962,430 | | |
| Single-Family Total | | | 4,793,790 | | |
| Housing Total | | | 7,770,510 | | |
See Accompanying Notes to Financial Statements.
68
Columbia North Carolina Intermediate Municipal Bond Fund
March 31, 2009
| Municipal Bonds (continued) | |
| | | Par ($) | | Value ($) | |
| Industrials – 0.7% | |
| Forest Products & Paper – 0.5% | |
NC Haywood County Industrial
Facilities & Pollution Control
Financing Authority | |
International Paper Co.,
Series 1999, AMT,
6.400% 11/01/24 | | | 1,500,000 | | | | 1,086,060 | | |
| Forest Products & Paper Total | | | 1,086,060 | | |
| Other Industrial Development Bonds – 0.2% | |
NC Mecklenberg County Industrial
Facilities & Pollution Control
Financing Authority | |
Fluor Corp.,
Series 1993,
5.250% 12/01/09 | | | 340,000 | | | | 341,013 | | |
| Other Industrial Development Bonds Total | | | 341,013 | | |
| Industrials Total | | | 1,427,073 | | |
| Other – 17.3% | |
| Other – 1.0% | |
PR Commonwealth of Puerto Rico
Government Development Bank | |
Series 2006 B,
5.000% 12/01/12 | | | 2,000,000 | | | | 1,937,680 | | |
| Other Total | | | 1,937,680 | | |
| Refunded/Escrowed (a) – 15.3% | |
| NC Brunswick County | |
Series 2000,
Insured: FSA,
Pre-refunded 06/01/10,
5.500% 06/01/20 | | | 1,000,000 | | | | 1,067,170 | | |
| NC Charlotte | |
Series 2000,
Pre-refunded 06/01/10,
5.500% 06/01/12 | | | 1,000,000 | | | | 1,067,170 | | |
Water & Sewer System,
Series 1999,
Pre-refunded 06/01/09,
5.375% 06/01/19 | | | 2,545,000 | | | | 2,591,624 | | |
| NC Durham Water & Sewer Utility System | |
Series 2001,
Pre-refunded 06/01/11,
5.250% 06/01/16 | | | 1,000,000 | | | | 1,100,870 | | |
| | | Par ($) | | Value ($) | |
| NC Eastern Municipal Power Agency | |
Series 1986 A,
Escrowed to Maturity,
5.000% 01/01/17 | | | 2,165,000 | | | | 2,457,556 | | |
Series 1988 A,
Pre-refunded 01/01/22,
6.000% 01/01/26 | | | 1,000,000 | | | | 1,213,830 | | |
| NC Iredell County Public Facilities Corp. | |
Series 2000,
Insured: AMBAC,
Pre-refunded 06/01/10,
5.125% 06/01/18 | | | 2,180,000 | | | | 2,316,948 | | |
| NC Johnston County | |
Series 2000,
Insured: FGIC,
Pre-refunded 03/01/10:
5.500% 03/01/15 | | | 1,925,000 | | | | 2,051,569 | | |
| 5.500% 03/01/16 | | | 2,700,000 | | | | 2,877,525 | | |
| NC Orange County | |
Series 2000,
Pre-refunded 04/01/10:
5.300% 04/01/17 | | | 1,000,000 | | | | 1,067,300 | | |
| 5.300% 04/01/18 | | | 3,445,000 | | | | 3,676,848 | | |
| NC Pitt County | |
Series 2000 B,
Insured: FSA,
Pre-refunded 04/01/10:
5.500% 04/01/25 | | | 1,000,000 | | | | 1,059,350 | | |
| 5.750% 04/01/16 | | | 1,390,000 | | | | 1,475,958 | | |
| NC Randolph County | |
Series 2000,
Insured: FSA,
Pre-refunded 06/01/09:
5.500% 06/01/14 | | | 1,115,000 | | | | 1,135,661 | | |
| 5.500% 06/01/15 | | | 1,000,000 | | | | 1,018,530 | | |
| NC Wake County | |
Series 1993,
Insured: MBIA,
Escrowed to Maturity,
5.125% 10/01/26 | | | 3,065,000 | | | | 3,285,496 | | |
| Refunded/Escrowed Total | | | 29,463,405 | | |
See Accompanying Notes to Financial Statements.
69
Columbia North Carolina Intermediate Municipal Bond Fund
March 31, 2009
| Municipal Bonds (continued) | |
| | | Par ($) | | Value ($) | |
| Tobacco – 1.0% | |
NJ Tobacco Settlement
Financing Corp. | |
Series 2007 1A,
4.250% 06/01/12 | | | 2,000,000 | | | | 1,875,080 | | |
| Tobacco Total | | | 1,875,080 | | |
| Other Total | | | 33,276,165 | | |
| Tax-Backed – 38.2% | |
| Local Appropriated – 14.8% | |
| NC Burke County | |
Series 2006 B,
Insured: AMBAC
5.000% 04/01/18 | | | 1,425,000 | | | | 1,467,807 | | |
| NC Cabarrus County | |
Series 2001,
5.500% 04/01/13 | | | 2,000,000 | | | | 2,160,960 | | |
Series 2007,
Insured: AMBAC
5.000% 02/01/13 | | | 400,000 | | | | 439,136 | | |
Series 2008,
5.000% 06/01/22 | | | 1,545,000 | | | | 1,614,803 | | |
| NC Chapel Hill | |
Series 2005,
5.250% 06/01/21 | | | 1,360,000 | | | | 1,395,822 | | |
| NC Chatham County | |
Series 2006,
Insured: AMBAC
5.000% 06/01/20 | | | 1,065,000 | | | | 1,085,352 | | |
| NC Concord | |
Series 2001 A,
Insured: MBIA
5.000% 06/01/17 | | | 1,490,000 | | | | 1,586,761 | | |
| NC Craven County | |
Series 2007,
Insured: MBIA:
5.000% 06/01/18 | | | 2,825,000 | | | | 2,996,364 | | |
| 5.000% 06/01/19 | | | 1,825,000 | | | | 1,911,323 | | |
| NC Dare County | |
Series 2005,
Insured: FGIC
5.000% 06/01/20 | | | 3,005,000 | | | | 3,055,484 | | |
| NC Gaston County | |
Series 2005,
Insured: MBIA
5.000% 12/01/15 | | | 1,350,000 | | | | 1,468,490 | | |
| | | Par ($) | | Value ($) | |
| NC Greenville | |
Series 2004,
Insured: AMBAC
5.250% 06/01/22 | | | 2,180,000 | | | | 2,272,345 | | |
| NC Harnett County | |
Series 2009,
Insured: AGO
5.000% 06/01/22 | | | 1,880,000 | | | | 1,927,338 | | |
| NC Henderson County | |
Series 2006 A,
Insured: AMBAC
5.000% 06/01/16 | | | 1,060,000 | | | | 1,093,273 | | |
| NC Randolph County | |
Series 2004,
Insured: FSA
5.000% 06/01/14 | | | 1,640,000 | | | | 1,805,492 | | |
| NC Sampson County | |
Series 2006,
Insured: FSA
5.000% 06/01/16 | | | 1,000,000 | | | | 1,097,630 | | |
| NC Wilmington | |
Series 2006 A,
5.000% 06/01/17 | | | 1,005,000 | | | | 1,110,435 | | |
| Local Appropriated Total | | | 28,488,815 | | |
| Local General Obligations – 13.6% | |
| NC Cabarrus County | |
Series 2006:
5.000% 03/01/15 | | | 1,000,000 | | | | 1,143,010 | | |
| 5.000% 03/01/16 | | | 1,000,000 | | | | 1,149,240 | | |
| NC Charlotte | |
Series 2002 C:
5.000% 07/01/20 | | | 1,570,000 | | | | 1,647,338 | | |
| 5.000% 07/01/22 | | | 1,265,000 | | | | 1,314,854 | | |
| NC Craven County | |
Series 2002,
Insured: AMBAC
5.000% 05/01/19 | | | 1,000,000 | | | | 1,036,530 | | |
| NC Cumberland County | |
Series 1998,
Insured: FGIC
5.000% 03/01/17 | | | 1,000,000 | | | | 1,022,820 | | |
| NC Gaston County | |
Series 2002,
Insured: AMBAC
5.250% 06/01/20 | | | 1,500,000 | | | | 1,568,265 | | |
See Accompanying Notes to Financial Statements.
70
Columbia North Carolina Intermediate Municipal Bond Fund
March 31, 2009
| Municipal Bonds (continued) | |
| | | Par ($) | | Value ($) | |
| NC High Point | |
Series 2002,
Insured: MBIA
4.500% 06/01/14 | | | 1,275,000 | | | | 1,380,047 | | |
| NC Iredell County | |
Series 2006,
5.000% 02/01/19 | | | 2,420,000 | | | | 2,659,169 | | |
| NC Mecklenburg County | |
Series 1993,
6.000% 04/01/11 | | | 1,000,000 | | | | 1,097,710 | | |
Series 2009 A,
5.000% 08/01/19 | | | 1,000,000 | | | | 1,157,080 | | |
Series 2009 A,
5.000% 02/01/23 | | | 1,000,000 | | | | 1,047,170 | | |
| NC New Hanover County | |
Series 2001,
4.600% 06/01/14 | | | 1,750,000 | | | | 1,866,742 | | |
| NC Orange County | |
Series 2005 A,
5.000% 04/01/22 | | | 2,000,000 | | | | 2,146,580 | | |
| NC Wake County | |
Series 2009,
5.000% 03/01/20 (b) | | | 5,000,000 | | | | 5,688,850 | | |
| NC Wilmington | |
Series 1997 A,
Insured: FGIC
5.000% 04/01/11 | | | 460,000 | | | | 465,888 | | |
| Local General Obligations Total | | | 26,391,293 | | |
| Special Non-Property Tax – 4.7% | |
| NC Charlotte | |
Storm Water Fee,
Series 2006,
5.000% 06/01/17 | | | 1,120,000 | | | | 1,270,080 | | |
PR Commonwealth of Puerto Rico
Highway & Transportation Authority | |
Series 2003 AA,
Insured: MBIA
5.500% 07/01/18 | | | 3,500,000 | | | | 3,363,605 | | |
PR Commonwealth of Puerto Rico
Infrastructure Financing Authority | |
Series 2005 C,
Insured: FGIC:
5.500% 07/01/20 | | | 1,200,000 | | | | 1,066,872 | | |
| 5.500% 07/01/21 | | | 1,785,000 | | | | 1,570,961 | | |
| 5.500% 07/01/22 | | | 2,000,000 | | | | 1,734,080 | | |
| Special Non-Property Tax Total | | | 9,005,598 | | |
| | | Par ($) | | Value ($) | |
| State Appropriated – 1.4% | |
| NC Infrastructure Finance Corp. | |
Capital Improvement
Series A
Insured: FSA
5.000% 05/01/24 | | | 2,570,000 | | | | 2,607,959 | | |
| State Appropriated Total | | | 2,607,959 | | |
| State General Obligations – 3.7% | |
| NC State | |
Series 2001 A,
4.750% 03/01/14 | | | 5,000,000 | | | | 5,324,200 | | |
| PR Commonwealth of Puerto Rico | |
Series 2001 A,
Insured: MBIA
5.500% 07/01/14 | | | 1,725,000 | | | | 1,718,635 | | |
| State General Obligations Total | | | 7,042,835 | | |
| Tax-Backed Total | | | 73,536,500 | | |
| Transportation – 0.5% | |
| Airports – 0.5% | |
| NC Charlotte | |
Charlotte/Douglas International Airport,
Series 1999 B, AMT,
Insured: MBIA
6.000% 07/01/24 | | | 1,000,000 | | | | 1,003,220 | | |
| Airports Total | | | 1,003,220 | | |
| Transportation Total | | | 1,003,220 | | |
| Utilities – 17.7% | |
| Joint Power Authority – 5.7% | |
| NC Eastern Municipal Power Agency | |
Series 1993 B,
Insured: FGIC
6.000% 01/01/22 | | | 3,000,000 | | | | 3,034,350 | | |
Series 1993,
Insured: AGO
6.000% 01/01/22 | | | 1,000,000 | | | | 1,065,140 | | |
Series 2005,
Insured: AMBAC
5.250% 01/01/20 | | | 2,000,000 | | | | 1,934,460 | | |
Series 2008 A,
Insured: AGO
5.250% 01/01/19 | | | 1,500,000 | | | | 1,559,610 | | |
See Accompanying Notes to Financial Statements.
71
Columbia North Carolina Intermediate Municipal Bond Fund
March 31, 2009
| Municipal Bonds (continued) | |
| | | Par ($) | | Value ($) | |
| NC Municipal Power Agency No. 1 | |
Series 2008 A:
5.250% 01/01/17 | | | 1,185,000 | | | | 1,243,314 | | |
| 5.250% 01/01/20 | | | 2,000,000 | | | | 2,036,340 | | |
| Joint Power Authority Total | | | 10,873,214 | | |
| Municipal Electric – 1.8% | |
| NC Greenville Utilities Commission | |
Series 2008 A,
Insured: FSA
5.000% 11/01/18 | | | 1,040,000 | | | | 1,150,521 | | |
PR Commonwealth of Puerto Rico
Electric Power Authority | |
Series 2007 TT,
5.000% 07/01/22 | | | 1,000,000 | | | | 872,840 | | |
Series 2007 V V,
Insured: MBIA
5.250% 07/01/25 | | | 1,690,000 | | | | 1,476,688 | | |
| Municipal Electric Total | | | 3,500,049 | | |
| Water & Sewer – 10.2% | |
| NC Brunswick County | |
Enterprise Systems,
Series 2008 A,
Insured: FSA:
5.000% 04/01/20 | | | 1,915,000 | | | | 2,027,372 | | |
| 5.000% 04/01/22 | | | 1,390,000 | | | | 1,439,414 | | |
| NC Cape Fear Public Utility Authority | |
Series 2008,
5.000% 08/01/20 | | | 1,000,000 | | | | 1,092,110 | | |
| NC Charlotte | |
Water and Sewer Systems,
Series 2008, | | | |
| 5.000% 07/01/23 | | | 3,000,000 | | | | 3,235,890 | | |
| NC Greensboro City | |
Enterprise Systems,
Series 2006:
5.250% 06/01/17 | | | 2,000,000 | | | | 2,310,560 | | |
| 5.250% 06/01/22 | | | 1,200,000 | | | | 1,341,732 | | |
| NC High Point | |
Combined Enterprise,
Series 2008,
Insured: FSA:
5.000% 11/01/24 | | | 1,000,000 | | | | 1,040,360 | | |
| 5.000% 11/01/25 | | | 1,000,000 | | | | 1,030,840 | | |
| | | Par ($) | | Value ($) | |
| NC Raleigh | |
Combined Enterprise System,
Series 2006 A,
5.000% 03/01/16 | | | 1,500,000 | | | | 1,723,860 | | |
| NC Winston Salem | |
Water and Sewer System:
Series 2007 A, | | | |
| 5.000% 06/01/19 | | | 3,000,000 | | | | 3,363,060 | | |
Series 2009,
5.000% 06/01/23 | | | 1,000,000 | | | | 1,087,870 | | |
| Water & Sewer Total | | | 19,693,068 | | |
| Utilities Total | | | 34,066,331 | | |
Total Municipal Bonds
(cost of $177,166,974) | | | 174,756,276 | | |
| Investment Companies – 11.3% | |
| | | Shares | | | |
Columbia Tax-Exempt
Reserves, Capital Class
(7 day yield of 0.704%) (c)(d) | | | 12,037,443 | | | | 12,037,443 | | |
Dreyfus Tax-Exempt Cash
Management Fund
(7 day yield of 0.780%) | | | 9,800,000 | | | | 9,800,000 | | |
Total Investment Companies
(cost of $21,837,443) | | | 21,837,443 | | |
Total Investments – 102.0%
(cost of $199,004,417) (e) | | | 196,593,719 | | |
| Other Assets & Liabilities, Net – (2.0)% | | | (3,880,489 | ) | |
| Net Assets – 100.0% | | | 192,713,230 | | |
Notes to Investment Portfolio:
On April 1, 2008, the Fund adopted Statement of Financial Accounting Standards No. 157, Fair Value Measurements ("SFAS 157"). SFAS 157 establishes a hierarchy that prioritizes the inputs to valuation techniques used to measure fair value giving the highest priority to unadjusted quoted prices in active markets for identical securities (level 1 measurements) and the lowest priority to unobservable inputs (level 3 measurements) when market prices are not readily available or reliable. The three levels of the fair value hierarchy under SFAS 157 are described below:
• Level 1 – quoted prices in active markets for identical securities
• Level 2 – prices determined using other significant observable inputs (including quoted prices for similar securities, interest rates, prepayment speeds, credit risk and others)
• Level 3 – prices determined using significant unobservable inputs. In situations where quoted prices or observable inputs are unavailable or less reliable, unobservable inputs may be used. Unobservable inputs may include management's own assumptions about the factors market participants would use in pricing an investment.
See Accompanying Notes to Financial Statements.
72
Columbia North Carolina Intermediate Municipal Bond Fund
March 31, 2009
The inputs or methodology used for valuing securities are not necessarily an indication of the risk associated with investing in those securities.
The following table summarizes the inputs used, as of March 31, 2009, in valuing the Fund's assets:
| Valuation Inputs | | Investments in
Securities | | Other Financial
Instruments | |
| Level 1 – Quoted Prices | | $ | 21,837,443 | | | $ | – | | |
Level 2 – Other Significant
Observable Inputs | | | 174,756,276 | | | | – | | |
Level 3 – Significant
Unobservable Inputs | | | – | | | | – | | |
| Total | | $ | 196,593,719 | | | $ | – | | |
(a) The Fund has been informed that each issuer has placed direct obligations of the U.S. Government in an irrevocable trust, solely for the payment of principal and interest.
(b) Security purchased on a delayed delivery basis.
(c) Investments in affiliates during the year ended March 31, 2009:
Security name: Columbia Tax-Exempt Reserves, Capital Class (7 day yield of 0.704%)
| Shares as of 03/31/08: | | | 9,890,000 | | |
| Shares purchased: | | | 86,782,319 | | |
| Shares sold: | | | (84,634,876 | ) | |
| Shares as of 03/31/09: | | | 12,037,443 | | |
| Net realized gain/loss: | | $ | – | | |
| Dividend income earned: | | $ | 146,442 | | |
| Value at end of period: | | $ | 12,037,443 | | |
(d) Money market mutual fund registered under the Investment Company Act of 1940, as amended, and advised by Columbia Management Advisors, LLC.
(e) Cost for federal income tax purposes is $198,877,987.
At March 31, 2009, the composition of the Fund by revenue source is as follows:
| Holdings by Revenue Source (Unaudited) | | % of
Net Assets | |
| Tax-Backed | | | 38.2 | | |
| Utilities | | | 17.7 | | |
| Refunded/Escrowed | | | 15.3 | | |
| Health Care | | | 8.0 | | |
| Education | | | 4.3 | | |
| Housing | | | 4.0 | | |
| Other | | | 2.0 | | |
| Industrials | | | 0.7 | | |
| Transportation | | | 0.5 | | |
| | | | 90.7 | | |
| Investment Companies | | | 11.3 | | |
| Other Assets & Liabilities, Net | | | (2.0 | ) | |
| | | | 100.0 | | |
| Acronym | | Name | |
| AGO | | Assured Guaranty Corp. | |
|
| AMBAC | | Ambac Assurance Corp. | |
|
| AMT | | Alternative Minimum Tax | |
|
| FGIC | | Financial Guaranty Insurance Co. | |
|
| FSA | | Financial Security Assurance, Inc. | |
|
| MBIA | | MBIA Insurance Corp. | |
|
| SYNC | | Syncora Guarantee, Inc. | |
|
See Accompanying Notes to Financial Statements.
73
Investment Portfolio – Columbia South Carolina Intermediate Municipal Bond Fund
March 31, 2009
| Municipal Bonds – 90.4% | |
| | | Par ($) | | Value ($) | |
| Education – 2.8% | |
| Education – 2.8% | |
| SC Educational Facilities Authority | |
Wofford College,
Series 2007 A,
5.000% 04/01/36 | | | 1,000,000 | | | | 824,490 | | |
SC Florence Darlington Commission
for Technical Education | |
Series 2005 A,
Insurer: MBIA:
5.000% 03/01/18 | | | 1,725,000 | | | | 1,839,350 | | |
| 5.000% 03/01/20 | | | 1,905,000 | | | | 1,992,173 | | |
| SC University of South Carolina | |
Series 2008 A,
Insured: FSA
5.000% 06/01/21 | | | 1,060,000 | | | | 1,133,988 | | |
| Education Total | | | 5,790,001 | | |
| Education Total | | | 5,790,001 | | |
| Health Care – 18.9% | |
| Continuing Care Retirement – 1.9% | |
| SC Jobs Economic Development Authority | |
Episcopal Church Home,
Series 2007:
5.000% 04/01/15 | | | 525,000 | | | | 495,212 | | |
| 5.000% 04/01/16 | | | 600,000 | | | | 555,114 | | |
Lutheran Homes of South Carolina, Inc.,
Series 2007: | | | |
| 5.000% 05/01/16 | | | 1,245,000 | | | | 1,018,410 | | |
| 5.375% 05/01/21 | | | 1,650,000 | | | | 1,232,632 | | |
Wesley Commons,
Series 2006, | | | |
| 5.125% 10/01/26 | | | 1,000,000 | | | | 638,240 | | |
| Continuing Care Retirement Total | | | 3,939,608 | | |
| Hospitals – 17.0% | |
| SC Charleston County | |
Care Alliance Health Services,
Series 1999 A,
Insured: FSA:
5.000% 08/15/12 | | | 1,000,000 | | | | 1,017,640 | | |
| 5.125% 08/15/15 | | | 6,370,000 | | | | 6,796,217 | | |
| SC Greenville Hospital System | |
Series 2008 A,
5.250% 05/01/21 | | | 2,750,000 | | | | 2,757,150 | | |
| | | Par ($) | | Value ($) | |
| SC Horry County | |
Conway Hospital,
Series 1998,
Insured: AMBAC:
4.750% 07/01/10 | | | 1,100,000 | | | | 1,103,311 | | |
| 4.875% 07/01/11 | | | 1,200,000 | | | | 1,201,212 | | |
| SC Jobs Economic Development Authority | |
Anderson Area Medical Center,
Series 1999,
Insured: FSA
5.300% 02/01/14 | | | 4,375,000 | | | | 4,424,437 | | |
Bon Secours Health System, Inc.,
Series 2002 B,
5.500% 11/15/23 | | | 2,235,000 | | | | 2,071,644 | | |
Georgetown Memorial Hospital,
Series 2001,
Insured: RAD
5.250% 02/01/21 | | | 1,250,000 | | | | 1,132,825 | | |
Kershaw County Medical Center,
Series 2008,
5.500% 09/15/25 | | | 1,925,000 | | | | 1,591,320 | | |
Palmetto Health Alliance,
Series 2005 A,
Insured: FSA
5.250% 08/01/21 | | | 4,000,000 | | | | 4,029,000 | | |
SC Lexington County Health
Services District | |
Lexmed, Inc.:
Series 1997,
Insured: FSA
5.125% 11/01/21 | | | 3,000,000 | | | | 3,007,230 | | |
Series 2007:
5.000% 11/01/17 | | | 2,230,000 | | | | 2,242,265 | | |
| 5.000% 11/01/18 | | | 1,000,000 | | | | 994,690 | | |
SC Spartanburg County Health
Services District | |
Series 2008 A,
Insured: AGO:
5.000% 04/15/18 | | | 1,000,000 | | | | 1,039,340 | | |
| 5.000% 04/15/19 | | | 1,225,000 | | | | 1,253,959 | | |
| Hospitals Total | | | 34,662,240 | | |
| Health Care Total | | | 38,601,848 | | |
See Accompanying Notes to Financial Statements.
74
Columbia South Carolina Intermediate Municipal Bond Fund
March 31, 2009
| Municipal Bonds (continued) | |
| | | Par ($) | | Value ($) | |
| Industrials – 2.5% | |
| Forest Products & Paper – 2.5% | |
| SC Georgetown County | |
International Paper Co.:
Series 1997 A, AMT,
5.700% 10/01/21 | | | 500,000 | | | | 348,490 | | |
Series 1999 A,
5.125% 02/01/12 | | | 5,000,000 | | | | 4,638,400 | | |
| Forest Products & Paper Total | | | 4,986,890 | | |
| Industrials Total | | | 4,986,890 | | |
| Other – 8.4% | |
| Refunded/Escrowed (a) – 8.4% | |
| SC Berkeley County Water & Sewer | |
Series 2003,
Pre-refunded 06/01/13,
Insured: MBIA
5.250% 06/01/19 | | | 845,000 | | | �� | 963,579 | | |
| SC Charleston County | |
Medical Society Health Systems, Inc.,
Series 1992,
Escrowed to Maturity,
Insured: MBIA
6.000% 10/01/09 | | | 270,000 | | | | 271,220 | | |
| SC Jobs-Economic Development Authority | |
Palmetto Health Alliance,
Series 2000 A,
Pre-refunded 12/15/10,
7.125% 12/15/15 | | | 5,500,000 | | | | 6,124,415 | | |
SC Lexington County Health
Services District | |
Lexington Medical Center,
Series 2003,
Pre-refunded 11/01/13,
5.500% 11/01/23 | | | 2,000,000 | | | | 2,312,960 | | |
| SC Lexington Water & Sewer Authority | |
Series 1997,
Pre-refunded 10/01/14,
Insured: RAD
5.450% 04/01/19 | | | 2,000,000 | | | | 2,073,440 | | |
| SC Medical University of South Carolina | |
Series 1999,
Escrowed to Maturity,
5.500% 07/01/09 | | | 1,575,000 | | | | 1,594,955 | | |
| | | Par ($) | | Value ($) | |
SC Tobacco Settlement Revenue
Management Authority | |
Series 2001 B,
Pre-refunded 05/15/11,
6.375% 05/15/28 | | | 3,500,000 | | | | 3,893,225 | | |
| Refunded/Escrowed Total | | | 17,233,794 | | |
| Other Total | | | 17,233,794 | | |
| Resource Recovery – 2.6% | |
| Disposal – 2.6% | |
| SC Charleston County | |
Foster Wheeler Charleston,
Series 1997, AMT,
Insured: AMBAC
5.250% 01/01/10 | | | 4,000,000 | | | | 4,061,880 | | |
| SC Three Rivers Solid Waste Authority | |
Series 2007:
(b) 10/01/24 | | | 1,835,000 | | | | 671,904 | | |
| (b) 10/01/25 | | | 1,835,000 | | | | 616,890 | | |
| Disposal Total | | | 5,350,674 | | |
| Resource Recovery Total | | | 5,350,674 | | |
| Tax-Backed – 33.3% | |
| Local Appropriated – 20.3% | |
| SC Berkeley County School District | |
Securing Assets for Education,
Series 2006:
5.000% 12/01/20 | | | 1,000,000 | | | | 1,035,200 | | |
| 5.000% 12/01/21 | | | 2,000,000 | | | | 2,057,180 | | |
| 5.000% 12/01/22 | | | 3,545,000 | | | | 3,616,006 | | |
| SC Charleston County | |
Certificates of Participation,
Series 2005,
Insured: MBIA
5.125% 06/01/17 | | | 2,470,000 | | | | 2,652,212 | | |
SC Charleston Educational
Excellence Financing Corp. | |
Series 2006,
5.000% 12/01/19 | | | 2,000,000 | | | | 2,051,980 | | |
SC Dorchester County School
District No. 002 | |
Series 2004,
5.250% 12/01/29 | | | 1,000,000 | | | | 969,280 | | |
Series 2006,
5.000% 12/01/30 | | | 1,000,000 | | | | 929,900 | | |
See Accompanying Notes to Financial Statements.
75
Columbia South Carolina Intermediate Municipal Bond Fund
March 31, 2009
| Municipal Bonds (continued) | |
| | | Par ($) | | Value ($) | |
| SC Fort Mill School Facilities Corp. | |
Series 2006:
5.000% 12/01/17 | | | 2,900,000 | | | | 2,982,911 | | |
| 5.250% 12/01/19 | | | 3,105,000 | | | | 3,170,174 | | |
| SC Greenville County School District I | |
Series 2003,
5.250% 12/01/16 | | | 4,625,000 | | | | 4,816,244 | | |
Series 2006:
5.000% 12/01/15 | | | 2,290,000 | | | | 2,422,591 | | |
Insured: FSA
5.000% 12/01/15 | | | 500,000 | | | | 556,515 | | |
SC Hilton Head Island Public
Facilities Corp. | |
Series 2006,
Insured: MBIA
5.000% 08/01/14 | | | 1,600,000 | | | | 1,785,136 | | |
SC Newberry Investing in
Children's Education | |
Series 2005,
5.250% 12/01/15 | | | 1,265,000 | | | | 1,298,510 | | |
| SC SCAGO Educational Facilities Corp. | |
Colleton School District,
Series 2006,
Insured: AGO
5.000% 12/01/14 | | | 1,325,000 | | | | 1,406,620 | | |
Pickens School District,
Series 2006,
Insured: FSA:
5.000% 12/01/11 | | | 1,500,000 | | | | 1,608,840 | | |
| 5.000% 12/01/23 | | | 5,000,000 | | | | 4,990,400 | | |
| 5.000% 12/01/24 | | | 2,000,000 | | | | 1,989,560 | | |
| SC Sumter Two School Facilities, Inc. | |
| Series 2007, | |
Insured: AGO
5.000% 12/01/17 | | | 1,000,000 | | | | 1,095,430 | | |
| Local Appropriated Total | | | 41,434,689 | | |
| Local General Obligations – 8.3% | |
SC Anderson County School
District No. 004 | |
Series 2005,
Insured: FSA
5.250% 03/01/19 | | | 1,115,000 | | | | 1,234,271 | | |
SC Clover School District No. 002
York County | |
Series 2007 A
Insured: FSA
5.000% 03/01/16 | | | 2,320,000 | | | | 2,630,138 | | |
| | | Par ($) | | Value ($) | |
SC Hilton Head Island Public
Facilities Corp. | |
Series 2005 A,
Insured: AMBAC
5.000% 12/01/17 | | | 1,960,000 | | | | 2,168,113 | | |
SC Richland County School
District No. 001 | |
Series 2001 A,
5.250% 03/01/19 | | | 3,570,000 | | | | 3,778,274 | | |
SC Richland County School
District No. 002 | |
Series 2009 A,
5.000% 02/01/18 | | | 2,500,000 | | | | 2,868,850 | | |
SC Spartanburg County School
District No. 007 | |
Series 2001:
5.000% 03/01/18 | | | 2,000,000 | | | | 2,266,700 | | |
| 5.000% 03/01/21 | | | 1,940,000 | | | | 2,121,390 | | |
| Local General Obligations Total | | | 17,067,736 | | |
| Special Non-Property Tax – 3.9% | |
KY Economic Development
Finance Authority | |
Louisville Arena Authority Inc.,
Series 2008,
Insured: AGO
5.750% 12/01/28 | | | 1,500,000 | | | | 1,515,825 | | |
PR Commonwealth of Puerto Rico
Infrastructure Financing Authority | |
Series 2005 C,
Insured: FGIC:
5.500% 07/01/20 | | | 1,200,000 | | | | 1,066,872 | | |
| 5.500% 07/01/21 | | | 1,785,000 | | | | 1,570,961 | | |
| 5.500% 07/01/22 | | | 2,505,000 | | | | 2,171,935 | | |
SC Hilton Head Island Public
Facilities Corp. | |
Series 2002,
Insured: MBIA
5.250% 12/01/16 | | | 1,440,000 | | | | 1,565,841 | | |
| Special Non-Property Tax Total | | | 7,891,434 | | |
| State General Obligations – 0.8% | |
| PR Commonwealth of Puerto Rico | |
Series 2001 A,
Insured: MBIA
5.500% 07/01/14 | | | 1,725,000 | | | | 1,718,635 | | |
| State General Obligations Total | | | 1,718,635 | | |
| Tax-Backed Total | | | 68,112,494 | | |
See Accompanying Notes to Financial Statements.
76
Columbia South Carolina Intermediate Municipal Bond Fund
March 31, 2009
| Municipal Bonds (continued) | |
| | | Par ($) | | Value ($) | |
| Transportation – 2.5% | |
| Transportation – 2.5% | |
| SC Transportation Infrastructure Bank | |
Series 2005 A,
Insured: AMBAC
5.250% 10/01/20 | | | 4,880,000 | | | | 5,176,509 | | |
| Transportation Total | | | 5,176,509 | | |
| Transportation Total | | | 5,176,509 | | |
| Utilities – 19.4% | |
| Investor Owned – 1.8% | |
| SC Jobs-Economic Development Authority | |
South Carolina Electric &
Gas Co.,
Series 2002, AMT,
Insured: AMBAC
4.200% 11/01/12 | | | 3,615,000 | | | | 3,575,958 | | |
| Investor Owned Total | | | 3,575,958 | | |
| Joint Power Authority – 8.7% | |
| SC Piedmont Municipal Power Agency | |
Series 2008 A-3,
Insured: AGO:
5.000% 01/01/17 | | | 3,000,000 | | | | 3,224,940 | | |
| 5.000% 01/01/18 | | | 3,050,000 | | | | 3,254,564 | | |
| SC Public Service Authority | |
Series 1999 A,
Insured: MBIA
5.625% 01/01/13 | | | 2,000,000 | | | | 2,074,420 | | |
Series 2001 A,
Insured: FSA
5.250% 01/01/18 | | | 1,615,000 | | | | 1,717,536 | | |
Series 2005 B,
Insured: MBIA
5.000% 01/01/18 | | | 3,200,000 | | | | 3,484,160 | | |
Series 2006 C,
Insured: FSA
5.000% 01/01/15 | | | 1,000,000 | | | | 1,114,930 | | |
| TX Sam Rayburn Municipal Power Agency | |
Series 2002,
6.000% 10/01/16 | | | 3,000,000 | | | | 2,877,780 | | |
| Joint Power Authority Total | | | 17,748,330 | | |
| | | Par ($) | | Value ($) | |
| Municipal Electric – 2.6% | |
| SC Rock Hill Utility System | |
Series 2003 A,
Insured: FSA:
5.250% 01/01/13 | | | 2,350,000 | | | | 2,586,058 | | |
| 5.375% 01/01/19 | | | 1,500,000 | | | | 1,620,405 | | |
| SC Winnsboro Utility | |
Series 1999,
Insured: MBIA
5.250% 08/15/13 | | | 1,020,000 | | | | 1,106,465 | | |
| Municipal Electric Total | | | 5,312,928 | | |
| Water & Sewer – 6.3% | |
SC Beaufort Jasper Water &
Sewer Authority | |
Series 2006,
Insured: FSA
5.000% 03/01/23 | | | 1,500,000 | | | | 1,573,065 | | |
| SC Berkeley County Water & Sewer | |
Series 2003,
Insured: MBIA
5.250% 06/01/19 | | | 155,000 | | | | 162,842 | | |
Series 2008 A,
Insured: FSA
5.000% 06/01/21 | | | 1,000,000 | | | | 1,069,800 | | |
| SC Camden | |
Combined Public Utility System,
Series 1997,
Insured: MBIA
5.500% 03/01/17 | | | 50,000 | | | | 50,157 | | |
| SC Columbia | |
Waterworks & Sewer System,
Series 2005,
Insured: FSA
5.000% 02/01/23 | | | 2,000,000 | | | | 2,097,400 | | |
| SC Mount Pleasant | |
Waterworks & Sewer System,
Series 2002,
Insured: FGIC:
5.250% 12/01/16 | | | 1,980,000 | | | | 2,153,032 | | |
| 5.250% 12/01/18 | | | 1,270,000 | | | | 1,346,695 | | |
| SC North Charleston Sewer District | |
Series 2002,
Insured: FSA
5.500% 07/01/17 | | | 3,040,000 | | | | 3,365,006 | | |
See Accompanying Notes to Financial Statements.
77
Columbia South Carolina Intermediate Municipal Bond Fund
March 31, 2009
| Municipal Bonds (continued) | |
| | | Par ($) | | Value ($) | |
SC Western Carolina Regional
Sewer Authority | |
Series 2005 B,
Insured: FSA
5.250% 03/01/19 | | | 1,000,000 | | | | 1,128,980 | | |
| Water & Sewer Total | | | 12,946,977 | | |
| Utilities Total | | | 39,584,193 | | |
Total Municipal Bonds
(cost of $185,700,386) | | | 184,836,403 | | |
| Investment Companies – 8.7% | |
| | | Shares | | | |
Columbia Tax-Exempt
Reserves, Capital Class
(7 day yield of 0.704%) (c)(d) | | | 9,664,779 | | | | 9,664,779 | | |
Dreyfus Tax-Exempt
Cash Management Fund
(7 day yield of 0.780%) | | | 8,200,000 | | | | 8,200,000 | | |
Total Investment Companies
(cost of $17,864,779) | | | 17,864,779 | | |
Total Investments – 99.1%
(cost of $203,565,165) (e) | | | 202,701,182 | | |
| Other Assets & Liabilities, Net – 0.9% | | | 1,892,304 | | |
| Net Assets – 100.0% | | | 204,593,486 | | |
Notes to Investment Portfolio:
On April 1, 2008, the Fund adopted Statement of Financial Accounting Standards No. 157, Fair Value Measurements ("SFAS 157"). SFAS 157 establishes a hierarchy that prioritizes the inputs to valuation techniques used to measure fair value giving the highest priority to unadjusted quoted prices in active markets for identical securities (level 1 measurements) and the lowest priority to unobservable inputs (level 3 measurements) when market prices are not readily available or reliable. The three levels of the fair value hierarchy under SFAS 157 are described below:
• Level 1 – quoted prices in active markets for identical securities
• Level 2 – prices determined using other significant observable inputs (including quoted prices for similar securities, interest rates, prepayment speeds, credit risk and others)
• Level 3 – prices determined using significant unobservable inputs. In situations where quoted prices or observable inputs are unavailable or less reliable, unobservable inputs may be used. Unobservable inputs may include management's own assumptions about the factors market participants would use in pricing an investment.
The inputs or methodology used for valuing securities are not necessarily an indication of the risk associated with investing in those securities.
The following table summarizes the inputs used, as of March 31, 2009 in valuing the Fund's assets:
| Valuation Inputs | | Investments in
Securities | | Other Financial
Instruments | |
| Level 1 – Quoted Prices | | $ | 17,864,779 | | | $ | – | | |
Level 2 – Other Significant
Observable Inputs | | | 184,836,403 | | | | – | | |
Level 3 – Significant
Unobservable Inputs | | | – | | | | – | | |
| Total | | $ | 202,701,182 | | | $ | – | | |
(a) The Fund has been informed that each issuer has placed direct obligations of the U.S. Government in an irrevocable trust, solely for the payment of principal and interest.
(b) Zero coupon bond.
(c) Investments in affiliates during the year ended March 31, 2009:
Security name: Columbia Tax-Exempt Reserves, Capital Class (7 day yield of 0.704%)
| Shares as of 03/31/08: | | | 10,231,000 | | |
| Shares purchased: | | | 91,752,948 | | |
| Shares sold: | | | (92,319,169 | ) | |
| Shares as of 03/31/09: | | | 9,664,779 | | |
| Net realized gain/loss: | | $ | – | | |
| Dividend income earned: | | $ | 155,458 | | |
| Value at end of period: | | $ | 9,664,779 | | |
(d) Money market mutual fund registered under the Investment Company Act of 1940, as amended, and advised by Columbia Management Advisors, LLC.
(e) Cost for federal income tax purposes is $203,359,901.
At March 31, 2009, the composition of the Fund by revenue source is as follows:
| Holdings by Revenue Source (Unaudited) | | % of
Net Assets | |
| Tax-Backed | | | 33.3 | | |
| Utilities | | | 19.4 | | |
| Health Care | | | 18.9 | | |
| Other | | | 8.4 | | |
| Education | | | 2.8 | | |
| Resource Recovery | | | 2.6 | | |
| Transportation | | | 2.5 | | |
| Industrials | | | 2.5 | | |
| | | | 90.4 | | |
| Investment Companies | | | 8.7 | | |
| Other Assets & Liabilities, Net | | | 0.9 | | |
| | | | 100.0 | | |
| Acronym | | Name | |
| AGO | | Assured Guaranty Corp. | |
|
| AMBAC | | Ambac Assurance Corp. | |
|
| AMT | | Alternative Minimum Tax | |
|
| FGIC | | Financial Guaranty Insurance Co. | |
|
| FSA | | Financial Security Assurance, Inc. | |
|
| MBIA | | MBIA Insurance Corp. | |
|
| RAD | | Radian Asset Assurance, Inc. | |
|
See Accompanying Notes to Financial Statements.
78
Investment Portfolio – Columbia Virginia Intermediate Municipal Bond Fund
March 31, 2009
| Municipal Bonds – 96.2% | |
| | | Par ($) | | Value ($) | |
| Education – 1.9% | |
| Education – 1.9% | |
VA Amherst Industrial
Development Authority | |
Sweet Briar Institute,
Series 2006,
5.000% 09/01/26 | | | 1,000,000 | | | | 782,690 | | |
| VA College Building Authority | |
Regent University,
Series 2006,
5.000% 06/01/21 | | | 1,100,000 | | | | 1,004,102 | | |
Roanoke College,
Series 2007,
5.000% 04/01/23 | | | 1,000,000 | | | | 962,960 | | |
Washington & Lee University,
Series 1998,
Insured: MBIA
5.250% 01/01/26 | | | 3,115,000 | | | | 3,341,897 | | |
| Education Total | | | 6,091,649 | | |
| Education Total | | | 6,091,649 | | |
| Health Care – 8.0% | |
| Continuing Care Retirement – 1.6% | |
VA Fairfax County Economic
Development Authority | |
Goodwin House, Inc.,
Series 2007,
5.000% 10/01/22 | | | 2,500,000 | | | | 1,962,525 | | |
Greenspring Village, Inc.,
Series 2006 A,
4.750% 10/01/26 | | | 2,000,000 | | | | 1,465,720 | | |
VA Henrico County Economic
Development Authority | |
Westminster-Canterbury,
Series 2006:
5.000% 10/01/21 | | | 1,000,000 | | | | 832,250 | | |
| 5.000% 10/01/22 | | | 1,000,000 | | | | 814,280 | | |
| Continuing Care Retirement Total | | | 5,074,775 | | |
| Hospitals – 6.4% | |
AZ University Medical Center Corp.
Hospital | |
Series 2004,
5.250% 07/01/14 | | | 1,000,000 | | | | 988,640 | | |
| | | Par ($) | | Value ($) | |
VA Fairfax County Industrial
Development Authority | |
Inova Health Systems,
Series 1993,
Insured: MBIA
5.250% 08/15/19 | | | 1,000,000 | | | | 1,033,890 | | |
VA Fredericksburg Economic
Development Authority | |
Medicorp Health Systems,
Series 2007:
5.250% 06/15/18 | | | 3,000,000 | | | | 3,056,790 | | |
| 5.250% 06/15/20 | | | 6,495,000 | | | | 6,456,419 | | |
| VA Medical College Hospital Authority | |
University Health Services,
Series 1998,
Insured: MBIA
4.800% 07/01/11 | | | 1,000,000 | | | | 1,006,500 | | |
VA Roanoke Industrial
Development Authority | |
Carilion Health Center,
Series 2002 A,
Insured: MBIA
5.250% 07/01/12 | | | 4,000,000 | | | | 4,218,080 | | |
| VA Small Business Financing Authority | |
Wellmont Health Systems,
Series 2007 A,
5.125% 09/01/22 | | | 710,000 | | | | 501,111 | | |
VA Stafford County Economic
Development Authority | |
MediCorp Health Systems,
Series 2006,
5.250% 06/15/24 | | | 1,000,000 | | | | 946,770 | | |
VA Winchester Industrial
Development Authority | |
Valley Health System,
Series 2007,
5.000% 01/01/26 | | | 1,250,000 | | | | 1,248,500 | | |
WI Health & Educational
Facilities Authority | |
Agnesian Healthcare, Inc.,
Series 2001,
6.000% 07/01/21 | | | 1,000,000 | | | | 1,005,310 | | |
| Hospitals Total | | | 20,462,010 | | |
| Health Care Total | | | 25,536,785 | | |
See Accompanying Notes to Financial Statements.
79
Columbia Virginia Intermediate Municipal Bond Fund
March 31, 2009
| Municipal Bonds (continued) | |
| | | Par ($) | | Value ($) | |
| Housing – 3.0% | |
| Multi-Family – 3.0% | |
| VA Housing Development Authority | |
Series 2000 B, AMT,
5.875% 08/01/15 | | | 2,655,000 | | | | 2,700,401 | | |
VA Prince William County
Industrial Development Authority | |
CRS Triangle Housing Corp.,
Series 1998 C,
7.000% 07/01/29 | | | 1,085,000 | | | | 868,998 | | |
VA Suffolk Redevelopment &
Housing Authority | |
Windsor Fieldstone LP,
Series 2001,
4.850% 07/01/31 | | | 5,800,000 | | | | 6,093,306 | | |
| Multi-Family Total | | | 9,662,705 | | |
| Housing Total | | | 9,662,705 | | |
| Industrials – 1.5% | |
| Forest Products & Paper – 1.2% | |
AL Mobile Industrial Development
Board Pollution Control Authority | |
International Paper Co.,
Series 1998 B,
4.750% 04/01/10 | | | 2,250,000 | | | | 2,203,807 | | |
GA Richmond County
Development Authority | |
International Paper Co.,
Series 2001 A,
5.150% 03/01/15 | | | 1,450,000 | | | | 1,222,017 | | |
| MS Warren County | |
International Paper Co.,
Series 2000 A, AMT,
6.700% 08/01/18 | | | 500,000 | | | | 407,565 | | |
| Forest Products & Paper Total | | | 3,833,389 | | |
| Other Industrial Development Bonds – 0.3% | |
| VA Peninsula Ports Authority | |
Dominion Resources, Inc.,
Series 2003,
GTY AGMT: Dominion Energy
5.000% 10/01/33 (a) | | | 1,000,000 | | | | 1,004,780 | | |
| Other Industrial Development Bonds Total | | | 1,004,780 | | |
| Total Industrials | | | 4,838,169 | | |
| | | Par ($) | | Value ($) | |
| Other – 21.9% | |
| Other – 3.9% | |
PR Commonwealth of Puerto Rico
Government Development Bank | |
Series 2006 B,
5.000% 12/01/12 | | | 3,000,000 | | | | 2,906,520 | | |
| VA Norfolk Parking Systems | |
Series 2005 A,
Insured: MBIA
5.000% 02/01/21 | | | 5,170,000 | | | | 5,293,046 | | |
| VA Virginia Beach Development Authority | |
Series 2005 A,
5.000% 05/01/21 | | | 4,000,000 | | | | 4,200,080 | | |
| Other Total | | | 12,399,646 | | |
| Pool/Bond Bank – 9.8% | |
| VA Resources Authority | |
Airports Revolving Fund,
Series 2001 A,
5.250% 08/01/18 | | | 1,205,000 | | | | 1,252,742 | | |
| VA Resources Authority | |
Clean Water State Revolving Fund,
Series 2005:
5.500% 10/01/19 | | | 5,180,000 | | | | 6,139,854 | | |
| 5.500% 10/01/20 | | | 3,500,000 | | | | 4,136,195 | | |
| 5.500% 10/01/21 | | | 6,475,000 | | | | 7,629,493 | | |
Series 2008,
5.000% 10/01/29 | | | 5,000,000 | | | | 5,133,150 | | |
| VA Resources Authority | |
Virginia Pooled Financing Program:
Series 2002 B,
5.000% 11/01/13 | | | 1,175,000 | | | | 1,330,276 | | |
Series 2003:
5.000% 11/01/18 | | | 1,075,000 | | | | 1,151,884 | | |
| 5.000% 11/01/19 | | | 1,125,000 | | | | 1,193,321 | | |
| 5.000% 11/01/21 | | | 1,185,000 | | | | 1,235,647 | | |
| 5.000% 11/01/22 | | | 1,100,000 | | | | 1,152,657 | | |
Series 2005 B,
5.000% 11/01/18 | | | 1,030,000 | | | | 1,138,933 | | |
| Pool/Bond Bank Total | | | 31,494,152 | | |
| Refunded/Escrowed (b) – 8.2% | |
| AZ School Facilities Board | |
Series 2002,
Pre-refunded 07/01/12,
5.250% 07/01/14 | | | 2,030,000 | | | | 2,286,389 | | |
See Accompanying Notes to Financial Statements.
80
Columbia Virginia Intermediate Municipal Bond Fund
March 31, 2009
| Municipal Bonds (continued) | |
| | | Par ($) | | Value ($) | |
MS Hospital Facilities &
Equipment Authority | |
Forrest County General
Hospital,
Series 2000,
Pre-refunded 01/01/11,
Insured: FSA
5.625% 01/01/20 | | | 1,285,000 | | | | 1,397,142 | | |
| TX Trinity River Authority | |
Series 2003,
Pre-refunded 02/01/13,
Insured: MBIA
5.500% 02/01/14 | | | 2,795,000 | | | | 3,184,120 | | |
VA Montgomery County Industrial
Development Authority | |
Series 2000 B,
Pre-refunded 01/15/11,
Insured: AMBAC
5.500% 01/15/22 | | | 2,000,000 | | | | 2,179,980 | | |
VA Resources Authority
Infrastructure Authority | |
Pooled Financing Program,
Series 2000 A,
Pre-refunded 05/01/11,
Insured: MBIA
5.500% 05/01/21 | | | 1,070,000 | | | | 1,177,150 | | |
| VA Richmond | |
Series 1999 A,
Pre-refunded 01/15/10,
Insured: FSA
5.000% 01/15/19 | | | 2,855,000 | | | | 2,985,473 | | |
| VA Tobacco Settlement Financing Corp. | |
Series 2005:
Refunded to various dates/prices,
5.250% 06/01/19 | | | 4,000,000 | | | | 4,207,160 | | |
| 5.500% 06/01/26 | | | 4,250,000 | | | | 4,750,650 | | |
VA Virginia Beach Water & Sewer
Authority | |
Series 2000,
Pre-refunded 08/01/10:
5.250% 08/01/17 | | | 1,790,000 | | | | 1,898,027 | | |
| 5.250% 08/01/19 | | | 2,035,000 | | | | 2,157,812 | | |
| Refunded/Escrowed Total | | | 26,223,903 | | |
| Other Total | | | 70,117,701 | | |
| | | Par ($) | | Value ($) | |
| Resource Recovery – 0.6% | |
| Disposal – 0.6% | |
VA Arlington County Industrial
Development Authority | |
Ogden Martin Systems of Union,
Series 1998 B, AMT,
Insured: FSA
5.250% 01/01/10 | | | 1,855,000 | | | | 1,893,714 | | |
| Disposal Total | | | 1,893,714 | | |
| Resource Recovery Total | | | 1,893,714 | | |
| Tax-Backed – 49.9% | |
| Local Appropriated – 9.6% | |
VA Arlington County Industrial
Development Authority | |
Series 2004:
5.000% 08/01/17 | | | 1,205,000 | | | | 1,309,787 | | |
| 5.000% 08/01/18 | | | 1,205,000 | | | | 1,293,399 | | |
VA Bedford County Economic
Development Authority | |
Series 2006,
Insured: MBIA
5.000% 05/01/15 | | | 1,230,000 | | | | 1,334,058 | | |
VA Fairfax County Economic
Development Authority | |
Series 2003,
5.000% 05/15/15 | | | 6,260,000 | | | | 7,012,139 | | |
Series 2005 A,
5.000% 04/01/19 | | | 1,380,000 | | | | 1,489,282 | | |
Series 2005,
5.000% 01/15/24 | | | 2,315,000 | | | | 2,404,220 | | |
| VA Hampton Roads Regional Jail Authority | |
Series 2004,
Insured: MBIA:
5.000% 07/01/14 | | | 1,750,000 | | | | 1,846,022 | | |
| 5.000% 07/01/15 | | | 1,685,000 | | | | 1,758,702 | | |
| 5.000% 07/01/16 | | | 1,930,000 | | | | 1,993,671 | | |
VA James City County Economic
Development Authority | |
Series 2006,
Insured: FSA
5.000% 06/15/23 | | | 2,000,000 | | | | 2,091,020 | | |
VA Montgomery County Industrial
Development Authority | |
Series 2008,
5.000% 02/01/29 | | | 1,000,000 | | | | 962,190 | | |
See Accompanying Notes to Financial Statements.
81
Columbia Virginia Intermediate Municipal Bond Fund
March 31, 2009
| Municipal Bonds (continued) | |
| | | Par ($) | | Value ($) | |
VA New Kent County Economic
Development Authority | |
Series 2006,
Insured: FSA:
5.000% 02/01/15 | | | 1,000,000 | | | | 1,106,320 | | |
| 5.000% 02/01/21 | | | 2,075,000 | | | | 2,182,443 | | |
VA Prince William County
Industrial Development Authority | |
Series 2005,
5.250% 02/01/17 | | | 1,115,000 | | | | 1,262,392 | | |
Series 2006 A,
Insured: AMBAC:
5.000% 09/01/17 | | | 800,000 | | | | 854,216 | | |
| 5.000% 09/01/21 | | | 1,625,000 | | | | 1,672,288 | | |
| Local Appropriated Total | | | 30,572,149 | | |
| Local General Obligations – 19.8% | |
| VA Arlington County | |
Series 1993,
6.000% 06/01/12 | | | 3,285,000 | | | | 3,752,258 | | |
Series 2006,
5.000% 08/01/17 | | | 4,000,000 | | | | 4,582,440 | | |
| VA Hampton | |
Series 2004,
5.000% 02/01/15 | | | 1,275,000 | | | | 1,426,075 | | |
Series 2005 A,
Insured: FGIC
5.000% 04/01/18 | | | 1,500,000 | | | | 1,622,505 | | |
| VA Henrico County | |
Series 2008 A,
5.000% 12/01/21 | | | 1,000,000 | | | | 1,117,380 | | |
| VA Leesburg | |
Series 2006 B,
Insured: MBIA
5.000% 09/15/17 | | | 1,145,000 | | | | 1,326,471 | | |
| VA Loudoun County | |
Series 1998 B,
5.250% 12/01/15 | | | 1,000,000 | | | | 1,172,560 | | |
Series 2005 A,
5.000% 07/01/14 | | | 4,000,000 | | | | 4,577,920 | | |
Series 2009 A,
5.000% 07/01/20 (c) | | | 1,660,000 | | | | 1,892,018 | | |
| VA Manassas Park | |
Series 2008,
Insured: FSA
5.000% 01/01/22 | | | 1,205,000 | | | | 1,305,184 | | |
| | | Par ($) | | Value ($) | |
| VA Newport News | |
Series 2005 A,
5.250% 01/15/23 | | | 1,510,000 | | | | 1,590,770 | | |
Series 2006 B,
5.250% 02/01/18 | | | 3,030,000 | | | | 3,512,376 | | |
Series 2007 B,
5.250% 07/01/20 | | | 2,000,000 | | | | 2,296,960 | | |
| VA Norfolk | |
Series 2002 B,
Insured: FSA
5.250% 07/01/11 | | | 2,000,000 | | | | 2,180,180 | | |
Series 2005,
Insured: MBIA
5.000% 03/01/15 | | | 5,070,000 | | | | 5,666,536 | | |
| VA Pittsylvania County | |
Series 2008 B,
5.500% 02/01/23 | | | 1,030,000 | | | | 1,093,386 | | |
| VA Portsmouth | |
Series 2001 A,
Insured: FGIC
5.500% 06/01/17 | | | 1,030,000 | | | | 1,033,368 | | |
Series 2003,
Insured: FSA:
5.000% 07/01/17 | | | 4,385,000 | | | | 4,828,017 | | |
| 5.000% 07/01/19 | | | 2,060,000 | | | | 2,190,645 | | |
Series 2006 A,
Insured: MBIA
5.000% 07/01/16 | | | 1,000,000 | | | | 1,121,100 | | |
| VA Richmond | |
Series 2002,
Insured: FSA
5.250% 07/15/11 | | | 2,150,000 | | | | 2,353,046 | | |
Series 2005 A,
Insured: FSA
5.000% 07/15/15 | | | 8,840,000 | | | | 10,137,800 | | |
| VA Virginia Beach | |
Series 2004 B:
5.000% 05/01/13 | | | 1,305,000 | | | | 1,474,337 | | |
| 5.000% 05/01/17 | | | 1,000,000 | | | | 1,156,870 | | |
| Local General Obligations Total | | | 63,410,202 | | |
| Special Non-Property Tax – 10.2% | |
IL Metropolitan Pier & Exposition
Authority | |
Series 2002 B,
Insured: MBIA
5.250% 06/15/11 | | | 4,500,000 | | | | 4,865,175 | | |
See Accompanying Notes to Financial Statements.
82
Columbia Virginia Intermediate Municipal Bond Fund
March 31, 2009
| Municipal Bonds (continued) | |
| | | Par ($) | | Value ($) | |
PR Commonwealth of Puerto Rico
Infrastructure Financing Authority | |
Series 2005 C,
Insured: FGIC:
5.500% 07/01/19 | | | 4,000,000 | | | | 3,603,760 | | |
| 5.500% 07/01/22 | | | 5,000,000 | | | | 4,335,200 | | |
VA Greater Richmond Convention
Center Authority | |
Series 2005,
Insured: MBIA:
5.000% 06/15/15 | | | 2,480,000 | | | | 2,592,766 | | |
| 5.000% 06/15/18 | | | 3,800,000 | | | | 3,856,202 | | |
| 5.000% 06/15/25 | | | 3,000,000 | | | | 2,834,070 | | |
VA Marquis Community
Development Authority | |
Series 2007,
5.625% 09/01/18 | | | 3,000,000 | | | | 2,343,540 | | |
VA Peninsula Town Center
Community Development Authority | |
Series 2007,
6.250% 09/01/24 | | | 2,000,000 | | | | 1,452,420 | | |
VA Reynolds Crossing Community
Development Authority | |
Series 2007,
5.100% 03/01/21 | | | 2,150,000 | | | | 1,755,883 | | |
VA Watkins Centre Community
Development Authority | |
Series 2007,
5.400% 03/01/20 | | | 2,250,000 | | | | 1,658,700 | | |
VA White Oak Village Shops Virginia
Community Development Authority | |
Series 2007,
5.300% 03/01/17 | | | 3,900,000 | | | | 3,142,932 | | |
| Special Non-Property Tax Total | | | 32,440,648 | | |
| Special Property Tax – 0.9% | |
VA Fairfax County Economic
Development Authority | |
Series 2004,
Insured: MBIA
5.000% 04/01/24 | | | 2,865,000 | | | | 2,970,661 | | |
| Special Property Tax Total | | | 2,970,661 | | |
| State Appropriated – 7.9% | |
VA Biotechnology Research Park
Authority | |
Series 2001,
5.125% 09/01/16 | | | 1,100,000 | | | | 1,173,777 | | |
| | | Par ($) | | Value ($) | |
| VA College Building Authority | |
Series 2006 A:
5.000% 09/01/13 | | | 2,000,000 | | | | 2,257,820 | | |
| 5.000% 09/01/14 | | | 2,925,000 | | | | 3,317,506 | | |
| VA Public Building Authority | |
Series 2005 C,
5.000% 08/01/14 | | | 2,000,000 | | | | 2,271,880 | | |
Series 2006 A,
5.000% 08/01/15 | | | 4,775,000 | | | | 5,457,443 | | |
| VA Public School Authority | |
Series 2004 C,
5.000% 08/01/16 | | | 7,425,000 | | | | 8,544,913 | | |
Series 2009,
5.000% 08/01/17 | | | 2,000,000 | | | | 2,295,140 | | |
| State Appropriated Total | | | 25,318,479 | | |
| State General Obligations – 1.5% | |
| PR Commonwealth of Puerto Rico | |
Series 2002 A,
Insured: FGIC
5.500% 07/01/17 | | | 2,000,000 | | | | 1,862,140 | | |
PR Commonwealth of Puerto Rico
Public Buildings Authority | |
Series 2007,
5.500% 07/01/24 | | | 3,425,000 | | | | 2,910,599 | | |
| State General Obligations Total | | | 4,772,739 | | |
| Tax-Backed Total | | | 159,484,878 | | |
| Transportation – 2.5% | |
| Airports – 1.3% | |
| DC Metropolitan Airports Authority | |
Series 1998 B, AMT,
Insured: MBIA
5.250% 10/01/10 | | | 1,000,000 | | | | 1,011,650 | | |
Series 2009,
5.000% 10/01/21 (c) | | | 3,000,000 | | | | 3,129,540 | | |
| Airports Total | | | 4,141,190 | | |
| Ports – 0.9% | |
| VA Port Authority | |
Series 2003, AMT,
Insured: MBIA:
5.125% 07/01/14 | | | 1,360,000 | | | | 1,397,332 | | |
| 5.125% 07/01/15 | | | 1,430,000 | | | | 1,450,106 | | |
| Ports Total | | | 2,847,438 | | |
See Accompanying Notes to Financial Statements.
83
Columbia Virginia Intermediate Municipal Bond Fund
March 31, 2009
| Municipal Bonds (continued) | |
| | | Par ($) | | Value ($) | |
| Toll Facilities – 0.3% | |
| VA Richmond Metropolitan Authority | |
Series 1998,
Insured: FGIC
5.250% 07/15/17 | | | 1,000,000 | | | | 1,088,870 | | |
| Toll Facilities Total | | | 1,088,870 | | |
| Transportation Total | | | 8,077,498 | | |
| Utilities – 6.9% | |
| Investor Owned – 1.0% | |
IN Jasper County Indiana Pollution
Control Authority | |
Northern Indiana Public Service,
Series 1988 A,
Insured: MBIA
5.600% 11/01/16 | | | 2,000,000 | | | | 1,961,840 | | |
VA Louisa Industrial Development
Authority | |
Virginia Electric and Power Co.,
Series 2008,
5.375% 11/01/35 (a) | | | 1,000,000 | | | | 1,036,970 | | |
| Investor Owned Total | | | 2,998,810 | | |
| Joint Power Authority – 0.9% | |
| TX Sam Rayburn Municipal Power Agency | |
Series 2002,
6.000% 10/01/16 | | | 2,000,000 | | | | 1,918,520 | | |
| WA Energy Northwest Electric | |
Series 2002 A,
Insured: MBIA
5.750% 07/01/18 | | | 1,000,000 | | | | 1,079,670 | | |
| Joint Power Authority Total | | | 2,998,190 | | |
| Municipal Electric – 0.3% | |
PR Commonwealth of Puerto Rico
Electric Power Authority | |
Series 2007 V,
Insured: FGIC
5.250% 07/01/24 | | | 1,000,000 | | | | 880,090 | | |
| Municipal Electric Total | | | 880,090 | | |
| Water & Sewer – 4.7% | |
| VA Fairfax County Water Authority | |
Series 2005 B,
5.250% 04/01/19 | | | 1,835,000 | | | | 2,133,940 | | |
| | | Par ($) | | Value ($) | |
| VA Hampton Roads Sanitation District | |
Series 2007,
5.000% 04/01/22 | | | 1,000,000 | | | | 1,078,720 | | |
Series 2008,
5.000% 04/01/24 | | | 3,000,000 | | | | 3,167,970 | | |
| VA Henrico County Authority | |
Series 2009,
5.000% 05/01/22 | | | 1,000,000 | | | | 1,105,000 | | |
| VA Newport News Water Authority | |
Series 2007,
Insured: FSA
5.000% 06/01/19 | | | 1,035,000 | | | | 1,126,225 | | |
| VA Richmond Public Utility Authority | |
Series 2007,
Insured: FSA
4.500% 01/15/21 | | | 1,000,000 | | | | 1,049,380 | | |
| VA Spotsylvania County | |
Series 2007,
Insured: FSA
5.000% 06/01/19 | | | 1,030,000 | | | | 1,120,784 | | |
| VA Upper Occoquan Sewage Authority | |
Series 1995 A,
Insured: MBIA
5.150% 07/01/20 | | | 1,295,000 | | | | 1,474,513 | | |
Series 2005,
Insured: FSA
5.000% 07/01/21 | | | 2,640,000 | | | | 2,817,645 | | |
| Water & Sewer Total | | | 15,074,177 | | |
| Utilities Total | | | 21,951,267 | | |
Total Municipal Bonds
(cost of $307,918,007) | | | 307,654,366 | | |
| Investment Companies – 4.5% | |
| | | Shares | | | |
Columbia Tax-Exempt
Reserves, Capital Class
(7 day yield of 0.704%) (d)(e) | | | 7,223,000 | | | | 7,223,000 | | |
Dreyfus Tax-Exempt
Cash Management Fund
(7 day yield of 0.780%) | | | 7,000,000 | | | | 7,000,000 | | |
Total Investment Companies
(cost of $14,223,000) | | | 14,223,000 | | |
See Accompanying Notes to Financial Statements.
84
Columbia Virginia Intermediate Municipal Bond Fund
March 31, 2009
| Short-Term Obligation – 0.0% | |
| | | Par ($) | | Value ($) | |
| Variable Rate Demand Note (f) – 0.0% | |
| WA Housing Finance Commission | |
Local 82 JATC Educational
Development Trust,
Series 2000,
LOC: U.S. Bank N.A.
0.650% 11/01/25 | | | 100,000 | | | | 100,000 | | |
| Variable Rate Demand Note Total | | | 100,000 | | |
Total Short-Term Obligation
(cost of $100,000) | | | 100,000 | | |
Total Investments – 100.7%
(cost of $322,241,007) (g) | | | 321,977,366 | | |
| Other Assets & Liabilities, Net – (0.7)% | | | (2,313,132 | ) | |
| Net Assets – 100.0% | | | 319,664,234 | | |
Notes to Investment Portfolio:
On April 1, 2008, the Fund adopted Statement of Financial Accounting Standards No. 157, Fair Value Measurements ("SFAS 157"). SFAS 157 establishes a hierarchy that prioritizes the inputs to valuation techniques used to measure fair value giving the highest priority to unadjusted quoted prices in active markets for identical securities (level 1 measurements) and the lowest priority to unobservable inputs (level 3 measurements) when market prices are not readily available or reliable. The three levels of the fair value hierarchy under SFAS 157 are described below:
• Level 1 – quoted prices in active markets for identical securities
• Level 2 – prices determined using other significant observable inputs (including quoted prices for similar securities, interest rates, prepayment speeds, credit risk and others)
• Level 3 – prices determined using significant unobservable inputs. In situations where quoted prices or observable inputs are unavailable or less reliable, unobservable inputs may be used. Unobservable inputs may include management's own assumptions about the factors market participants would use in pricing an investment.
The inputs or methodology used for valuing securities are not necessarily an indication of the risk associated with investing in those securities.
The following table summarizes the inputs used, as of March 31, 2009 in valuing the Fund's assets:
| Valuation Inputs | | Investments in
Securities | | Other Financial
Instruments | |
| Level 1 – Quoted Prices | | $ | 14,223,000 | | | $ | – | | |
Level 2 – Other Significant
Observable Inputs | | $ | 307,754,366 | | | | – | | |
Level 3 – Significant
Unobservable Inputs | | | – | | | | – | | |
| Total | | $ | 321,977,366 | | | $ | – | | |
(a) The interest rate shown on floating rate or variable rate securities reflects the rate at March 31, 2009.
(b) The Fund has been informed that each issuer has placed direct obligations of the U.S. Government in an irrevocable trust, solely for the payment of principal and interest.
(c) Security purchased on a delayed delivery basis.
(d) Investments in affiliates during the year ended March 31, 2009:
Security name: Columbia Tax-Exempt Reserves, Capital Class (7 day yield of 0.704%)
| Shares as of 03/31/08: | | | 14,706,573 | | |
| Shares purchased: | | | 77,355,847 | | |
| Shares sold: | | | (84,839,420 | ) | |
| Shares as of 03/31/09: | | | 7,223,000 | | |
| Net realized gain (loss): | | $ | – | | |
| Dividend income earned: | | $ | 162,602 | | |
| Value at end of period: | | $ | 7,223,000 | | |
(e) Money market mutual fund registered under the Investment Company Act of 1940, as amended, and advised by Columbia Management Advisors, LLC.
(f) Variable rate demand note. This security is payable upon demand and is secured by letters of credit or other credit support agreements from banks. The interest rate changes periodically and the interest rate shown reflects the rate as of March 31, 2009.
(g) Cost for federal income tax purposes is $322,139,984.
At March 31, 2009, the composition of the Fund by revenue source is as follows:
| Holdings by Revenue Source (Unaudited) | | % of
Net Assets | |
| Tax-Backed | | | 49.9 | | |
| Pool/Bond Bank | | | 9.8 | | |
| Refunded/Escrowed | | | 8.2 | | |
| Health Care | | | 8.0 | | |
| Utilities | | | 6.9 | | |
| Other | | | 3.9 | | |
| Housing | | | 3.0 | | |
| Transportation | | | 2.5 | | |
| Education | | | 1.9 | | |
| Industrials | | | 1.5 | | |
| Resource Recovery | | | 0.6 | | |
| | | | 96.2 | | |
| Investment Companies | | | 4.5 | | |
| Short-Term Obligation | | | 0.0 | | |
| Other Assets & Liabilities, Net | | | (0.7 | ) | |
| | | | 100.0 | | |
| Acronym | | Name | |
| AMBAC | | Ambac Assurance Corp. | |
|
| AMT | | Alternative Minimum Tax | |
|
| FGIC | | Financial Guaranty Insurance Co. | |
|
| FSA | | Financial Security Assurance, Inc. | |
|
| GTY AGMT | | Guaranty Agreement | |
|
| MBIA | | MBIA Insurance Corp. | |
|
See Accompanying Notes to Financial Statements.
85
Statements of Assets and Liabilities – Municipal Bond Funds
March 31, 2009
| | | ($) | | ($) | | ($) | | ($) | |
| | | Columbia
Short Term
Municipal
Bond Fund | | Columbia
California
Intermediate
Municipal
Bond Fund | | Columbia
Georgia
Intermediate
Municipal
Bond Fund | | Columbia
Maryland
Intermediate
Municipal
Bond Fund | |
| Assets: | |
| Unaffiliated investments, at identified cost | | | 1,248,138,862 | | | | 208,013,858 | | | | 125,664,794 | | | | 153,295,945 | | |
| Affiliated investments, at identified cost | | | 61,213,000 | | | | 7,259,000 | | | | 3,072,376 | | | | 3,983,131 | | |
| Total investments, at identified cost | | | 1,309,351,862 | | | | 215,272,858 | | | | 128,737,170 | | | | 157,279,076 | | |
| Unaffiliated investments, at value | | | 1,268,293,784 | | | | 203,872,621 | | | | 124,236,108 | | | | 148,600,796 | | |
| Affiliated investments, at value | | | 61,213,000 | | | | 7,259,000 | | | | 3,072,376 | | | | 3,983,131 | | |
| Total investments, at value | | | 1,329,506,784 | | | | 211,131,621 | | | | 127,308,484 | | | | 152,583,927 | | |
| Cash | | | 1,076,065 | | | | 647 | | | | 454 | | | | 569 | | |
| Receivable for: | |
| Investments sold | | | — | | | | — | | | | 247,162 | | | | 494,325 | | |
| Fund shares sold | | | 6,626,994 | | | | 268,870 | | | | 3,738 | | | | 41,902 | | |
| Interest | | | 14,181,730 | | | | 2,398,123 | | | | 1,696,707 | | | | 2,068,449 | | |
| Expense reimbursement due from investment advisor | | | 100,617 | | | | 13,400 | | | | 2,004 | | | | 4,672 | | |
| Other assets | | | 11,353 | | | | 3,186 | | | | 1,255 | | | | 1,671 | | |
| Total Assets | | | 1,351,503,543 | | | | 213,815,847 | | | | 129,259,804 | | | | 155,195,515 | | |
| Liabilities | |
| Payable for: | |
| Investments purchased | | | 24,560,943 | | | | 1,950,000 | | | | — | | | | — | | |
| Investments purchased on a delayed delivery basis | | | 35,047,433 | | | | 3,218,227 | | | | — | | | | — | | |
| Fund shares repurchased | | | 1,754,474 | | | | 175,538 | | | | 161,739 | | | | 13,107 | | |
| Distributions | | | 1,982,780 | | | | 549,584 | | | | 348,004 | | | | 433,317 | | |
| Investment advisory fee | | | 275,982 | | | | 70,400 | | | | 43,404 | | | | 52,345 | | |
| Administration fee | | | 141,183 | | | | 20,432 | | | | 11,479 | | | | 14,500 | | |
| Transfer agent fee | | | 22,827 | | | | 4,941 | | | | 2,416 | | | | 3,047 | | |
| Pricing and bookkeeping fees | | | 17,029 | | | | 11,078 | | | | 7,179 | | | | 7,999 | | |
| Trustees' fees | | | 43,794 | | | | 27,316 | | | | 59,220 | | | | 59,317 | | |
| Audit fee | | | 28,793 | | | | 30,507 | | | | 26,681 | | | | 26,793 | | |
| Custody fee | | | 2,413 | | | | 2,920 | | | | 1,665 | | | | 1,984 | | |
| Distribution and service fees | | | 65,834 | | | | 5,182 | | | | 6,186 | | | | 8,755 | | |
| Chief compliance officer expenses | | | 221 | | | | 207 | | | | 160 | | | | 173 | | |
| Other liabilities | | | 24,195 | | | | 33,480 | | | | 17,711 | | | | 19,458 | | |
| Total Liabilities | | | 63,967,901 | | | | 6,099,812 | | | | 685,844 | | | | 640,795 | | |
| Net Assets | | | 1,287,535,642 | | | | 207,716,035 | | | | 128,573,960 | | | | 154,554,720 | | |
| Net Assets Consist of | |
| Paid-in capital | | | 1,278,111,362 | | | | 211,717,488 | | | | 130,921,096 | | | | 161,464,855 | | |
| Undistributed (overdistributed) net investment income | | | 85,971 | | | | (14,480 | ) | | | 172,663 | | | | 208,629 | | |
| Accumulated net realized gain (loss) | | | (10,816,613 | ) | | | 154,264 | | | | (1,091,113 | ) | | | (2,423,615 | ) | |
| Net unrealized appreciation (depreciation) on investments | | | 20,154,922 | | | | (4,141,237 | ) | | | (1,428,686 | ) | | | (4,695,149 | ) | |
| Net Assets | | | 1,287,535,642 | | | | 207,716,035 | | | | 128,573,960 | | | | 154,554,720 | | |
See Accompanying Notes to Financial Statements.
86
| | | ($) | | ($) | | ($) | |
| | | Columbia
North Carolina
Intermediate
Municipal
Bond Fund | | Columbia
South Carolina
Intermediate
Municipal
Bond Fund | | Columbia
Virginia
Intermediate
Municipal
Bond Fund | |
| Assets: | |
| Unaffiliated investments, at identified cost | | | 186,966,974 | | | | 193,900,386 | | | | 315,018,007 | | |
| Affiliated investments, at identified cost | | | 12,037,443 | | | | 9,664,779 | | | | 7,223,000 | | |
| Total investments, at identified cost | | | 199,004,417 | | | | 203,565,165 | | | | 322,241,007 | | |
| Unaffiliated investments, at value | | | 184,556,276 | | | | 193,036,403 | | | | 314,754,366 | | |
| Affiliated investments, at value | | | 12,037,443 | | | | 9,664,779 | | | | 7,223,000 | | |
| Total investments, at value | | | 196,593,719 | | | | 202,701,182 | | | | 321,977,366 | | |
| Cash | | | 48 | | | | 213 | | | | 120 | | |
| Receivable for: | |
| Investments sold | | | 247,162 | | | | 247,162 | | | | — | | |
| Fund shares sold | | | 113,263 | | | | 19,598 | | | | 134,370 | | |
| Interest | | | 2,766,729 | | | | 2,667,467 | | | | 4,195,403 | | |
| Expense reimbursement due from investment advisor | | | 12,368 | | | | 1,616 | | | | 8,937 | | |
| Other assets | | | 1,945 | | | | 2,236 | | | | 3,406 | | |
| Total Assets | | | 199,735,234 | | | | 205,639,474 | | | | 326,319,602 | | |
| Liabilities | |
| Payable for: | |
| Investments purchased | | | — | | | | — | | | | — | | |
| Investments purchased on a delayed delivery basis | | | 5,659,500 | | | | — | | | | 4,984,452 | | |
| Fund shares repurchased | | | 642,504 | | | | 252,718 | | | | 515,129 | | |
| Distributions | | | 506,204 | | | | 571,988 | | | | 864,594 | | |
| Investment advisory fee | | | 64,558 | | | | 69,177 | | | | 108,757 | | |
| Administration fee | | | 18,721 | | | | 20,180 | | | | 33,541 | | |
| Transfer agent fee | | | 3,928 | | | | 2,823 | | | | 4,428 | | |
| Pricing and bookkeeping fees | | | 9,026 | | | | 8,697 | | | | 11,637 | | |
| Trustees' fees | | | 57,747 | | | | 60,583 | | | | 63,845 | | |
| Audit fee | | | 26,792 | | | | 29,650 | | | | 29,650 | | |
| Custody fee | | | 1,381 | | | | 1,605 | | | | 2,100 | | |
| Distribution and service fees | | | 9,666 | | | | 12,074 | | | | 13,648 | | |
| Chief compliance officer expenses | | | 238 | | | | 165 | | | | 177 | | |
| Other liabilities | | | 21,739 | | | | 16,328 | | | | 23,410 | | |
| Total Liabilities | | | 7,022,004 | | | | 1,045,988 | | | | 6,655,368 | | |
| Net Assets | | | 192,713,230 | | | | 204,593,486 | | | | 319,664,234 | | |
| Net Assets Consist of | |
| Paid-in capital | | | 197,851,910 | | | | 207,148,374 | | | | 319,519,917 | | |
| Undistributed (overdistributed) net investment income | | | 717,222 | | | | 1,124,937 | | | | 820,990 | | |
| Accumulated net realized gain (loss) | | | (3,445,204 | ) | | | (2,815,842 | ) | | | (413,032 | ) | |
| Net unrealized appreciation (depreciation) on investments | | | (2,410,698 | ) | | | (863,983 | ) | | | (263,641 | ) | |
| Net Assets | | | 192,713,230 | | | | 204,593,486 | | | | 319,664,234 | | |
See Accompanying Notes to Financial Statements.
87
Statements of Assets and Liabilities (continued) – Municipal Bond Funds
March 31, 2009
| | | Columbia
Short Term
Municipal
Bond Fund | | Columbia
California
Intermediate
Municipal
Bond Fund | | Columbia
Georgia
Intermediate
Municipal
Bond Fund | | Columbia
Maryland
Intermediate
Municipal
Bond Fund | |
| Class A | |
| Net assets | | $ | 209,539,464 | | | $ | 18,463,007 | | | $ | 14,800,699 | | | $ | 23,529,814 | | |
| Shares outstanding | | | 20,037,456 | | | | 1,975,980 | | | | 1,453,649 | | | | 2,333,495 | | |
| Net asset value per share (a) | | $ | 10.46 | | | $ | 9.34 | | | $ | 10.18 | | | $ | 10.08 | | |
| Maximum sales charge | | | 1.00 | % | | | 3.25 | % | | | 3.25 | % | | | 3.25 | % | |
| Maximum offering price per share (b) | | $ | 10.57 | | | $ | 9.65 | | | $ | 10.52 | | | $ | 10.42 | | |
| Class B | |
| Net assets | | $ | 458,292 | | | $ | 348,462 | | | $ | 1,265,642 | | | $ | 2,220,191 | | |
| Shares outstanding | | | 43,828 | | | | 37,323 | | | | 124,214 | | | | 220,037 | | |
| Net asset value and offering price per share (a) | | $ | 10.46 | | | $ | 9.34 | | | $ | 10.19 | | | $ | 10.09 | | |
| Class C | |
| Net assets | | $ | 32,749,684 | | | $ | 1,060,560 | | | $ | 2,100,080 | | | $ | 2,143,336 | | |
| Shares outstanding | | | 3,131,553 | | | | 113,475 | | | | 206,231 | | | | 212,574 | | |
| Net asset value and offering price per share (a) | | $ | 10.46 | | | $ | 9.35 | | | $ | 10.18 | | | $ | 10.08 | | |
| Class Z | |
| Net assets | | $ | 1,044,788,202 | | | $ | 187,844,006 | | | $ | 110,407,539 | | | $ | 126,661,379 | | |
| Shares outstanding | | | 99,905,669 | | | | 20,135,461 | | | | 10,843,784 | | | | 12,558,916 | | |
| Net asset value, offering and redemption price per share | | $ | 10.46 | | | $ | 9.33 | | | $ | 10.18 | | | $ | 10.09 | | |
(a) Redemption price per share is equal to net asset value less any applicable contingent deferred sales charge.
(b) On sales of $100,000 or more the offering price is reduced.
See Accompanying Notes to Financial Statements.
88
| | | Columbia
North Carolina
Intermediate
Municipal
Bond Fund | | Columbia
South Carolina
Intermediate
Municipal
Bond Fund | | Columbia
Virginia
Intermediate
Municipal
Bond Fund | |
| Class A | |
| Net assets | | $ | 23,235,952 | | | $ | 23,865,447 | | | $ | 47,969,835 | | |
| Shares outstanding | | | 2,372,732 | | | | 2,424,951 | | | | 4,538,063 | | |
| Net asset value per share (a) | | $ | 9.79 | | | $ | 9.84 | | | $ | 10.57 | | |
| Maximum sales charge | | | 3.25 | % | | | 3.25 | % | | | 3.25 | % | |
| Maximum offering price per share (b) | | $ | 10.12 | | | $ | 10.17 | | | $ | 10.93 | | |
| Class B | |
| Net assets | | $ | 1,920,146 | | | $ | 1,978,171 | | | $ | 2,220,457 | | |
| Shares outstanding | | | 196,073 | | | | 200,906 | | | | 209,973 | | |
| Net asset value and offering price per share (a) | | $ | 9.79 | | | $ | 9.85 | | | $ | 10.57 | | |
| Class C | |
| Net assets | | $ | 3,672,310 | | | $ | 6,146,212 | | | $ | 1,898,159 | | |
| Shares outstanding | | | 375,004 | | | | 624,117 | | | | 179,603 | | |
| Net asset value and offering price per share (a) | | $ | 9.79 | | | $ | 9.85 | | | $ | 10.57 | | |
| Class Z | |
| Net assets | | $ | 163,884,822 | | | $ | 172,603,656 | | | $ | 267,575,783 | | |
| Shares outstanding | | | 16,743,199 | | | | 17,532,408 | | | | 25,315,813 | | |
| Net asset value, offering and redemption price per share | | $ | 9.79 | | | $ | 9.84 | | | $ | 10.57 | | |
See Accompanying Notes to Financial Statements.
89
Statements of Operations – Municipal Bond Funds
For the Year Ended March 31, 2009
| | | ($) | | ($) | | ($) | | ($) | |
| | | Columbia
Short Term
Municipal
Bond Fund | | Columbia
California
Intermediate
Municipal
Bond Fund | | Columbia
Georgia
Intermediate
Municipal
Bond Fund | | Columbia
Maryland
Intermediate
Municipal
Bond Fund | |
| Investment Income | |
| Interest | | | 26,403,920 | | | | 8,954,424 | | | | 5,544,925 | | | | 7,068,542 | | |
| Dividends from affiliates | | | 463,525 | | | | 193,001 | | | | 79,794 | | | | 123,834 | | |
| Total Investment Income | | | 26,867,445 | | | | 9,147,425 | | | | 5,624,719 | | | | 7,192,376 | | |
| Expenses | |
| Investment advisory fee | | | 2,263,618 | | | | 895,804 | | | | 508,291 | | | | 637,768 | | |
| Administration fee | | | 1,071,138 | | | | 264,344 | | | | 133,545 | | | | 177,259 | | |
| Shareholder servicing and distribution fee – Class A | | | 205,638 | | | | 41,881 | | | | 37,561 | | | | 60,288 | | |
| Distribution fee: | |
| Class B | | | 4,069 | | | | 3,019 | | | | 9,454 | | | | 18,140 | | |
| Class C | | | 149,322 | | | | 8,744 | | | | 14,558 | | | | 13,204 | | |
| Service fee: | |
| Class B | | | 1,356 | | | | 1,007 | | | | 3,151 | | | | 6,007 | | |
| Class C | | | 49,668 | | | | 2,914 | | | | 4,853 | | | | 4,401 | | |
| Transfer agent fee | | | 62,904 | | | | 12,544 | | | | 10,036 | | | | 14,173 | | |
| Pricing and bookkeeping fees | | | 159,109 | | | | 93,328 | | | | 66,874 | | | | 73,866 | | |
| Trustees' fees | | | (1,665 | ) | | | 12,468 | | | | 5,146 | | | | (1,846 | ) | |
| Custody fee | | | 22,427 | | | | 14,668 | | | | 7,602 | | | | 10,199 | | |
| Legal fees | | | 44,827 | | | | 50,341 | | | | 49,570 | | | | 44,527 | | |
| Chief compliance officer expenses | | | 869 | | | | 733 | | | | 657 | | | | 614 | | |
| Other expenses | | | 198,988 | | | | 74,756 | | | | 66,441 | | | | 80,740 | | |
| Expenses before interest expense | | | 4,232,268 | | | | 1,476,551 | | | | 917,739 | | | | 1,139,340 | | |
| Interest expense | | | 1,383 | | | | — | | | | — | | | | — | | |
| Total Expenses | | | 4,233,651 | | | | 1,476,551 | | | | 917,739 | | | | 1,139,340 | | |
| Fees waived or expenses reimbursed by investment advisor | | | (602,386 | ) | | | (299,298 | ) | | | (212,433 | ) | | | (239,429 | ) | |
| Expense reductions | | | (4,747 | ) | | | (76 | ) | | | (2 | ) | | | (72 | ) | |
| Net Expenses | | | 3,626,518 | | | | 1,177,177 | | | | 705,304 | | | | 899,839 | | |
| Net Investment Income | | | 23,240,927 | | | | 7,970,248 | | | | 4,919,415 | | | | 6,292,537 | | |
Net Realized and Unrealized Gain (Loss) on Investments
and Futures Contracts | | | | | |
| Net realized gain (loss) on: | |
| Investments | | | 542,351 | | | | 447,144 | | | | (219,569 | ) | | | 44,137 | | |
| Futures contracts | | | — | | | | (80,363 | ) | | | 33,736 | | | | (54,452 | ) | |
| Net realized gain (loss) | | | 542,351 | | | | 366,781 | | | | (185,833 | ) | | | (10,315 | ) | |
| Change in net unrealized appreciation (depreciation) on: | |
| Investments | | | 12,405,544 | | | | (4,987,636 | ) | | | (2,296,945 | ) | | | (5,834,627 | ) | |
| Futures contracts | | | — | | | | 9,812 | | | | (2,711 | ) | | | 9,523 | | |
| Net change in unrealized appreciation (depreciation) | | | 12,405,544 | | | | (4,977,824 | ) | | | (2,299,656 | ) | | | (5,825,104 | ) | |
| Net Gain (Loss) | | | 12,947,895 | | | | (4,611,043 | ) | | | (2,485,489 | ) | | | (5,835,419 | ) | |
| Net Increase Resulting from Operations | | | 36,188,822 | | | | 3,359,205 | | | | 2,433,926 | | | | 457,118 | | |
See Accompanying Notes to Financial Statements.
90
| | | ($) | | ($) | | ($) | |
| | | Columbia
North Carolina
Intermediate
Municipal
Bond Fund | | Columbia
South Carolina
Intermediate
Municipal
Bond Fund | | Columbia
Virginia
Intermediate
Municipal
Bond Fund | |
| Investment Income | |
| Interest | | | 8,278,502 | | | | 9,254,038 | | | | 14,024,973 | | |
| Dividends from affiliates | | | 146,442 | | | | 155,458 | | | | 162,602 | | |
| Total Investment Income | | | 8,424,944 | | | | 9,409,496 | | | | 14,187,575 | | |
| Expenses | |
| Investment advisory fee | | | 743,468 | | | | 831,600 | | | | 1,321,628 | | |
| Administration fee | | | 212,808 | | | | 242,696 | | | | 408,177 | | |
| Shareholder servicing and distribution fee – Class A | | | 56,041 | | | | 46,609 | | | | 118,797 | | |
| Distribution fee: | |
| Class B | | | 17,612 | | | | 15,751 | | | | 16,598 | | |
| Class C | | | 25,362 | | | | 42,479 | | | | 10,506 | | |
| Service fee: | |
| Class B | | | 5,841 | | | | 5,257 | | | | 5,539 | | |
| Class C | | | 8,451 | | | | 14,160 | | | | 3,502 | | |
| Transfer agent fee | | | 16,229 | | | | 11,155 | | | | 20,962 | | |
| Pricing and bookkeeping fees | | | 77,582 | | | | 81,703 | | | | 105,618 | | |
| Trustees' fees | | | (2,200 | ) | | | 4,982 | | | | 9,070 | | |
| Custody fee | | | 11,259 | | | | 11,518 | | | | 13,133 | | |
| Legal fees | | | 45,553 | | | | 41,670 | | | | 42,421 | | |
| Chief compliance officer expenses | | | 744 | | | | 500 | | | | 553 | | |
| Other expenses | | | 82,760 | | | | 80,398 | | | | 97,348 | | |
| Expenses before interest expense | | | 1,301,510 | | | | 1,430,478 | | | | 2,173,852 | | |
| Interest expense | | | — | | | | — | | | | — | | |
| Total Expenses | | | 1,301,510 | | | | 1,430,478 | | | | 2,173,852 | | |
| Fees waived or expenses reimbursed by investment advisor | | | (259,156 | ) | | | (267,234 | ) | | | (367,033 | ) | |
| Expense reductions | | | (97 | ) | | | (205 | ) | | | (187 | ) | |
| Net Expenses | | | 1,042,257 | | | | 1,163,039 | | | | 1,806,632 | | |
| Net Investment Income | | | 7,382,687 | | | | 8,246,457 | | | | 12,380,943 | | |
Net Realized and Unrealized Gain (Loss) on Investments
and Futures Contracts | |
| Net realized gain (loss) on: | |
| Investments | | | (2,382,626 | ) | | | (1,410,416 | ) | | | (499,014 | ) | |
| Futures contracts | | | (22,410 | ) | | | 43,090 | | | | 91,935 | | |
| Net realized gain (loss) | | | (2,405,036 | ) | | | (1,367,326 | ) | | | (407,079 | ) | |
| Change in net unrealized appreciation (depreciation) on: | |
| Investments | | | (3,622,547 | ) | | | (3,221,010 | ) | | | (2,846,976 | ) | |
| Futures contracts | | | 357,189 | | | | 349,072 | | | | (7,374 | ) | |
| Net change in unrealized appreciation (depreciation) | | | (3,265,358 | ) | | | (2,871,938 | ) | | | (2,854,350 | ) | |
| Net Gain (Loss) | | | (5,670,394 | ) | | | (4,239,264 | ) | | | (3,261,429 | ) | |
| Net Increase Resulting from Operations | | | 1,712,293 | | | | 4,007,193 | | | | 9,119,514 | | |
See Accompanying Notes to Financial Statements.
91
Statements of Changes in Net Assets – Municipal Bond Funds
| Increase (Decrease) in Net Assets | | Columbia Short Term
Municipal Bond Fund | | Columbia California Intermediate
Municipal Bond Fund | |
| | | Year Ended March 31, | | Year Ended March 31, | |
| | | 2009 ($) | | 2008 ($) | | 2009 ($) | | 2008 ($) | |
| Operations | |
| Net investment income | | | 23,240,927 | | | | 13,621,347 | | | | 7,970,248 | | | | 5,706,457 | | |
| Net realized gain (loss) on investments and futures contracts | | | 542,351 | | | | (324,280 | ) | | | 366,781 | | | | (109,806 | ) | |
Net change in unrealized appreciation (depreciation)
on investments and futures contracts | | | 12,405,544 | | | | 6,215,554 | | | | (4,977,824 | ) | | | (1,763,745 | ) | |
| Net increase resulting from operations | | | 36,188,822 | | | | 19,512,621 | | | | 3,359,205 | | | | 3,832,906 | | |
| Distributions to Shareholders | |
| From net investment income: | |
| Class A | | | (2,152,022 | ) | | | (953,775 | ) | | | (559,349 | ) | | | (338,673 | ) | |
| Class B | | | (10,741 | ) | | | (15,791 | ) | | | (10,395 | ) | | | (19,290 | ) | |
| Class C | | | (383,425 | ) | | | (343,429 | ) | | | (30,096 | ) | | | (31,931 | ) | |
| Class Z | | | (20,694,739 | ) | | | (12,309,140 | ) | | | (7,370,408 | ) | | | (5,317,416 | ) | |
| Total distributions to shareholders | | | (23,240,927 | ) | | | (13,622,135 | ) | | | (7,970,248 | ) | | | (5,707,310 | ) | |
| Net Capital Stock Transactions | | | 707,418,602 | | | | 130,603,918 | | | | (6,324,395 | ) | | | 76,348,654 | | |
| Total increase (decrease) in net assets | | | 720,366,497 | | | | 136,494,404 | | | | (10,935,438 | ) | | | 74,474,250 | | |
| Net Assets | |
| Beginning of period | | | 567,169,145 | | | | 430,674,741 | | | | 218,651,473 | | | | 144,177,223 | | |
| End of period | | | 1,287,535,642 | | | | 567,169,145 | | | | 207,716,035 | | | | 218,651,473 | | |
| Undistributed (overdistributed) net investment income at the end of period | | | 85,971 | | | | 86,512 | | | | (14,480 | ) | | | (14,480 | ) | |
See Accompanying Notes to Financial Statements.
92
| Increase (Decrease) in Net Assets | | Columbia Georgia Intermediate
Municipal Bond Fund | | Columbia Maryland Intermediate
Municipal Bond Fund | |
| | | Year Ended March 31, | | Year Ended March 31, | |
| | | 2009 ($) | | 2008 ($) | | 2009 ($) | | 2008 ($) | |
| Operations | |
| Net investment income | | | 4,919,415 | | | | 4,828,251 | | | | 6,292,537 | | | | 6,526,844 | | |
| Net realized gain (loss) on investments and futures contracts | | | (185,833 | ) | | | 207,952 | | | | (10,315 | ) | | | 278,858 | | |
Net change in unrealized appreciation (depreciation)
on investments and futures contracts | | | (2,299,656 | ) | | | (2,423,309 | ) | | | (5,825,104 | ) | | | (3,317,147 | ) | |
| Net increase resulting from operations | | | 2,433,926 | | | | 2,612,894 | | | | 457,118 | | | | 3,488,555 | | |
| Distributions to Shareholders | |
| From net investment income: | |
| Class A | | | (552,000 | ) | | | (554,942 | ) | | | (908,786 | ) | | | (906,104 | ) | |
| Class B | | | (36,818 | ) | | | (49,747 | ) | | | (72,909 | ) | | | (93,676 | ) | |
| Class C | | | (56,719 | ) | | | (58,390 | ) | | | (53,194 | ) | | | (49,971 | ) | |
| Class Z | | | (4,273,877 | ) | | | (4,164,874 | ) | | | (5,257,636 | ) | | | (5,477,093 | ) | |
| Total distributions to shareholders | | | (4,919,414 | ) | | | (4,827,953 | ) | | | (6,292,525 | ) | | | (6,526,844 | ) | |
| Net Capital Stock Transactions | | | 7,195,864 | | | | 6,127,054 | | | | (3,806,532 | ) | | | (4,514,702 | ) | |
| Total increase (decrease) in net assets | | | 4,710,376 | | | | 3,911,995 | | | | (9,641,939 | ) | | | (7,552,991 | ) | |
| Net Assets | |
| Beginning of period | | | 123,863,584 | | | | 119,951,589 | | | | 164,196,659 | | | | 171,749,650 | | |
| End of period | | | 128,573,960 | | | | 123,863,584 | | | | 154,554,720 | | | | 164,196,659 | | |
| Undistributed (overdistributed) net investment income at the end of period | | | 172,663 | | | | 224,819 | | | | 208,629 | | | | 208,898 | | |
See Accompanying Notes to Financial Statements.
93
Statements of Changes in Net Assets – Municipal Bond Funds
| Increase (Decrease) in Net Assets | | Columbia North Carolina Intermediate
Municipal Bond Fund | | Columbia South Carolina Intermediate
Municipal Bond Fund | |
| | | Year Ended March 31, | | Year Ended March 31, | |
| | | 2009 ($) | | 2008 ($) | | 2009 ($) | | 2008 ($) | |
| Operations | |
| Net investment income | | | 7,382,687 | | | | 7,028,228 | | | | 8,246,457 | | | | 7,275,100 | | |
| Net realized gain (loss) on investments and futures contracts | | | (2,405,036 | ) | | | (1,025,762 | ) | | | (1,367,326 | ) | | | (1,457,853 | ) | |
Net change in unrealized appreciation (depreciation)
on investments and futures contracts | | | (3,265,358 | ) | | | (4,333,229 | ) | | | (2,871,938 | ) | | | (2,941,906 | ) | |
| Net increase resulting from operations | | | 1,712,293 | | | | 1,669,237 | | | | 4,007,193 | | | | 2,875,341 | | |
| Distributions to Shareholders | |
| From net investment income: | |
| Class A | | | (847,988 | ) | | | (705,245 | ) | | | (700,511 | ) | | | (633,664 | ) | |
| Class B | | | (71,614 | ) | | | (91,660 | ) | | | (63,665 | ) | | | (74,758 | ) | |
| Class C | | | (102,774 | ) | | | (97,453 | ) | | | (171,277 | ) | | | (177,872 | ) | |
| Class Z | | | (6,360,311 | ) | | | (6,134,131 | ) | | | (7,311,004 | ) | | | (6,388,210 | ) | |
| From net realized gains: | |
| Class A | | | — | | | | (5,438 | ) | | | — | | | | (28,635 | ) | |
| Class B | | | — | | | | (797 | ) | | | — | | | | (4,321 | ) | |
| Class C | | | — | | | | (900 | ) | | | — | | | | (10,308 | ) | |
| Class Z | | | — | | | | (42,641 | ) | | | — | | | | (266,009 | ) | |
| Total distributions to shareholders | | | (7,382,687 | ) | | | (7,078,265 | ) | | | (8,246,457 | ) | | | (7,583,777 | ) | |
| Net Capital Stock Transactions | | | 15,694,418 | | | | 6,424,355 | | | | 13,874,047 | | | | 15,635,365 | | |
| Total increase (decrease) in net assets | | | 10,024,024 | | | | 1,015,327 | | | | 9,634,783 | | | | 10,926,929 | | |
| Net Assets | |
| Beginning of period | | | 182,689,206 | | | | 181,673,879 | | | | 194,958,703 | | | | 184,031,774 | | |
| End of period | | | 192,713,230 | | | | 182,689,206 | | | | 204,593,486 | | | | 194,958,703 | | |
| Undistributed (overdistributed) net investment income at the end of period | | | 717,222 | | | | 678,492 | | | | 1,124,937 | | | | 1,125,877 | | |
See Accompanying Notes to Financial Statements.
94
| Increase (Decrease) in Net Assets | | Columbia Virginia Intermediate
Municipal Bond Fund | |
| | | Year Ended March 31, | |
| | | 2009 ($) | | 2008 ($) | |
| Operations | |
| Net investment income | | | 12,380,943 | | | | 12,204,925 | | |
| Net realized gain (loss) on investments and futures contracts | | | (407,079 | ) | | | 316,597 | | |
Net change in unrealized appreciation (depreciation)
on investments and futures contracts | | | (2,854,350 | ) | | | (2,761,003 | ) | |
| Net increase resulting from operations | | | 9,119,514 | | | | 9,760,519 | | |
| Distributions to Shareholders | |
| From net investment income: | |
| Class A | | | (1,683,739 | ) | | | (1,683,745 | ) | |
| Class B | | | (62,062 | ) | | | (75,974 | ) | |
| Class C | | | (39,200 | ) | | | (32,471 | ) | |
| Class Z | | | (10,595,942 | ) | | | (10,414,826 | ) | |
| From net realized gains: | |
| Class A | | | — | | | | (20,401 | ) | |
| Class B | | | — | | | | (1,128 | ) | |
| Class C | | | — | | | | (452 | ) | |
| Class Z | | | — | | | | (120,368 | ) | |
| Total distributions to shareholders | | | (12,380,943 | ) | | | (12,349,365 | ) | |
| Net Capital Stock Transactions | | | (16,895,867 | ) | | | 15,300,662 | | |
| Total increase (decrease) in net assets | | | (20,157,296 | ) | | | 12,711,816 | | |
| Net Assets | |
| Beginning of period | | | 339,821,530 | | | | 327,109,714 | | |
| End of period | | | 319,664,234 | | | | 339,821,530 | | |
| Undistributed (overdistributed) net investment income at the end of period | | | 820,990 | | | | 822,411 | | |
See Accompanying Notes to Financial Statements.
95
Statements of Changes in Net Assets – Capital Stock Activity
| | | Columbia Short Term Municipal Bond Fund | | Columbia California Intermediate Municipal Bond Fund | |
| | | Year Ended
March 31, 2009 | | Year Ended
March 31, 2008 | | Year Ended
March 31, 2009 | | Year Ended
March 31, 2008 | |
| | | Shares | | Dollars ($) | | Shares | | Dollars ($) | | Shares | | Dollars ($) | | Shares | | Dollars ($) | |
| Class A | |
| Subscriptions | | | 19,930,004 | | | | 206,796,669 | | | | 782,648 | | | | 8,033,820 | | | | 1,844,715 | | | | 17,378,739 | | | | 986,015 | | | | 9,402,372 | | |
| Distributions reinvested | | | 139,273 | | | | 1,443,595 | | | | 62,539 | | | | 638,396 | | | | 41,642 | | | | 388,888 | | | | 24,726 | | | | 235,748 | | |
| Redemptions | | | (3,127,041 | ) | | | (32,395,580 | ) | | | (979,492 | ) | | | (9,995,991 | ) | | | (1,330,553 | ) | | | (12,378,073 | ) | | | (536,613 | ) | | | (5,162,455 | ) | |
| Net increase (decrease) | | | 16,942,236 | | | | 175,844,684 | | | | (134,305 | ) | | | (1,323,775 | ) | | | 555,804 | | | | 5,389,554 | | | | 474,128 | | | | 4,475,665 | | |
| Class B | |
| Subscriptions | | | — | | | | — | | | | — | | | | — | | | | 3,512 | | | | 33,480 | | | | 2,117 | | | | 20,000 | | |
| Distributions reinvested | | | 936 | | | | 9,663 | | | | 1,271 | | | | 12,967 | | | | 539 | | | | 5,038 | | | | 1,127 | | | | 10,731 | | |
| Redemptions | | | (16,703 | ) | | | (172,440 | ) | | | (14,359 | ) | | | (147,534 | ) | | | (16,738 | ) | | | (155,294 | ) | | | (44,129 | ) | | | (422,520 | ) | |
| Net decrease | | | (15,767 | ) | | | (162,777 | ) | | | (13,088 | ) | | | (134,567 | ) | | | (12,687 | ) | | | (116,776 | ) | | | (40,885 | ) | | | (391,789 | ) | |
| Class C | |
| Subscriptions | | | 2,022,611 | | | | 20,989,551 | | | | 177,587 | | | | 1,826,426 | | | | 33,822 | | | | 318,212 | | | | 21,297 | | | | 202,568 | | |
| Distributions reinvested | | | 21,223 | | | | 219,383 | | | | 19,882 | | | | 202,939 | | | | 845 | | | | 7,921 | | | | 1,284 | | | | 12,239 | | |
| Redemptions | | | (347,568 | ) | | | (3,587,558 | ) | | | (388,870 | ) | | | (3,955,404 | ) | | | (54,128 | ) | | | (486,780 | ) | | | (21,981 | ) | | | (206,033 | ) | |
| Net increase (decrease) | | | 1,696,266 | | | | 17,621,376 | | | | (191,401 | ) | | | (1,926,039 | ) | | | (19,461 | ) | | | (160,647 | ) | | | 600 | | | | 8,774 | | |
| Class Z | |
| Subscriptions | | | 72,691,805 | | | | 753,481,395 | | | | 12,794,324 | | | | 131,348,478 | | | | 7,156,774 | | | | 67,054,696 | | | | 5,575,460 | | | | 53,037,581 | | |
| Proceeds received in connection with merger | | | — | | | | — | | | | 9,476,089 | | | | 97,847,055 | | | | — | | | | — | | | | 5,066,126 | | | | 48,045,319 | | |
| Distributions reinvested | | | 129,294 | | | | 1,337,745 | | | | 28,907 | | | | 295,206 | | | | 50,850 | | | | 474,057 | | | | 10,118 | | | | 96,269 | | |
| Redemptions | | | (23,269,675 | ) | | | (240,703,821 | ) | | | (9,354,113 | ) | | | (95,502,440 | ) | | | (8,525,283 | ) | | | (78,965,279 | ) | | | (3,031,306 | ) | | | (28,923,165 | ) | |
| Net increase (decrease) | | | 49,551,424 | | | | 514,115,319 | | | | 12,945,207 | | | | 133,988,299 | | | | (1,317,659 | ) | | | (11,436,526 | ) | | | 7,620,398 | | | | 72,256,004 | | |
See Accompanying Notes to Financial Statements.
96
| | | Columbia Georgia Intermediate Municipal Bond Fund | |
| | | Year Ended
March 31, 2009 | | Year Ended
March 31, 2008 | |
| | | Shares | | Dollars ($) | | Shares | | Dollars ($) | |
| Class A | |
| Subscriptions | | | 291,847 | | | | 3,010,289 | | | | 127,503 | | | | 1,338,245 | | |
| Distributions reinvested | | | 36,138 | | | | 366,790 | | | | 35,519 | | | | 370,689 | | |
| Redemptions | | | (202,462 | ) | | | (2,037,721 | ) | | | (311,911 | ) | | | (3,277,398 | ) | |
| Net increase (decrease) | | | 125,523 | | | | 1,339,358 | | | | (148,889 | ) | | | (1,568,464 | ) | |
| Class B | |
| Subscriptions | | | 12,081 | | | | 121,592 | | | | 6,882 | | | | 71,633 | | |
| Distributions reinvested | | | 2,909 | | | | 29,563 | | | | 3,902 | | | | 40,741 | | |
| Redemptions | | | (22,528 | ) | | | (232,314 | ) | | | (64,784 | ) | | | (678,102 | ) | |
| Net decrease | | | (7,538 | ) | | | (81,159 | ) | | | (54,000 | ) | | | (565,728 | ) | |
| Class C | |
| Subscriptions | | | 81,961 | | | | 829,370 | | | | 21,938 | | | | 230,256 | | |
| Distributions reinvested | | | 2,825 | | | | 28,680 | | | | 2,724 | | | | 28,431 | | |
| Redemptions | | | (55,413 | ) | | | (557,602 | ) | | | (25,761 | ) | | | (269,972 | ) | |
| Net increase (decrease) | | | 29,373 | | | | 300,448 | | | | (1,099 | ) | | | (11,285 | ) | |
| Class Z | |
| Subscriptions | | | 2,894,844 | | | | 29,493,066 | | | | 2,637,503 | | | | 27,477,538 | | |
| Proceeds received in connection with merger | | | — | | | | — | | | | — | | | | — | | |
| Distributions reinvested | | | 10,022 | | | | 101,598 | | | | 8,891 | | | | 92,793 | | |
| Redemptions | | | (2,395,061 | ) | | | (23,957,447 | ) | | | (1,847,120 | ) | | | (19,297,800 | ) | |
| Net increase (decrease) | | | 509,805 | | | | 5,637,217 | | | | 799,274 | | | | 8,272,531 | | |
See Accompanying Notes to Financial Statements.
97
Statements of Changes in Net Assets – Capital Stock Activity
| | | Columbia Maryland Intermediate Municipal Bond Fund | | Columbia North Carolina Intermediate Municipal Bond Fund | |
| | | Year Ended
March 31, 2009 | | Year Ended
March 31, 2008 | | Year Ended
March 31, 2009 | | Year Ended
March 31, 2008 | |
| | | Shares | | Dollars ($) | | Shares | | Dollars ($) | | Shares | | Dollars ($) | | Shares | | Dollars ($) | |
| Class A | |
| Subscriptions | | | 447,987 | | | | 4,569,177 | | | | 254,321 | | | | 2,675,243 | | | | 653,910 | | | | 6,368,006 | | | | 725,063 | | | | 7,433,696 | | |
| Distributions reinvested | | | 70,001 | | | | 711,465 | | | | 69,495 | | | | 730,698 | | | | 66,237 | | | | 652,634 | | | | 48,855 | | | | 499,354 | | |
| Redemptions | | | (522,116 | ) | | | (5,210,398 | ) | | | (312,326 | ) | | | (3,289,064 | ) | | | (570,354 | ) | | | (5,586,411 | ) | | | (352,278 | ) | | | (3,624,361 | ) | |
| Net increase (decrease) | | | (4,128 | ) | | | 70,244 | | | | 11,490 | | | | 116,877 | | | | 149,793 | | | | 1,434,229 | | | | 421,640 | | | | 4,308,689 | | |
| Class B | |
| Subscriptions | | | 16,836 | | | | 170,835 | | | | — | | | | — | | | | 10,159 | | | | 100,795 | | | | 17,162 | | | | 174,567 | | |
| Distributions reinvested | | | 4,686 | | | | 47,664 | | | | 5,767 | | | | 60,698 | | | | 5,152 | | | | 50,834 | | | | 6,095 | | | | 62,384 | | |
| Redemptions | | | (58,877 | ) | | | (606,577 | ) | | | (139,390 | ) | | | (1,470,529 | ) | | | (83,999 | ) | | | (829,111 | ) | | | (122,231 | ) | | | (1,255,627 | ) | |
| Net decrease | | | (37,355 | ) | | | (388,078 | ) | | | (133,623 | ) | | | (1,409,831 | ) | | | (68,688 | ) | | | (677,482 | ) | | | (98,974 | ) | | | (1,018,676 | ) | |
| Class C | |
| Subscriptions | | | 65,252 | | | | 659,486 | | | | 2,093 | | | | 22,160 | | | | 145,478 | | | | 1,456,451 | | | | 28,515 | | | | 289,168 | | |
| Distributions reinvested | | | 4,575 | | | | 46,405 | | | | 4,195 | | | | 44,109 | | | | 3,739 | | | | 36,665 | | | | 2,029 | | | | 20,755 | | |
| Redemptions | | | (10,253 | ) | | | (102,092 | ) | | | (19,481 | ) | | | (203,519 | ) | | | (82,611 | ) | | | (812,301 | ) | | | (84,234 | ) | | | (865,730 | ) | |
| Net increase (decrease) | | | 59,574 | | | | 603,799 | | | | (13,193 | ) | | | (137,250 | ) | | | 66,606 | | | | 680,815 | | | | (53,690 | ) | | | (555,807 | ) | |
| Class Z | |
| Subscriptions | | | 2,549,180 | | | | 25,976,912 | | | | 2,121,681 | | | | 22,342,218 | | | | 6,316,700 | | | | 62,728,062 | | | | 4,905,348 | | | | 50,260,605 | | |
| Distributions reinvested | | | 13,986 | | | | 142,261 | | | | 9,879 | | | | 103,832 | | | | 30,046 | | | | 295,549 | | | | 19,023 | | | | 194,351 | | |
| Redemptions | | | (2,981,733 | ) | | | (30,211,670 | ) | | | (2,423,891 | ) | | | (25,530,548 | ) | | | (4,944,550 | ) | | | (48,766,755 | ) | | | (4,557,849 | ) | | | (46,764,807 | ) | |
| Net increase (decrease) | | | (418,567 | ) | | | (4,092,497 | ) | | | (292,331 | ) | | | (3,084,498 | ) | | | 1,402,196 | | | | 14,256,856 | | | | 366,522 | | | | 3,690,149 | | |
See Accompanying Notes to Financial Statements.
98
| | | Columbia South Carolina Intermediate Municipal Bond Fund | |
| | | Year Ended
March 31, 2009 | | Year Ended
March 31, 2008 | |
| | | Shares | | Dollars ($) | | Shares | | Dollars ($) | |
| Class A | |
| Subscriptions | | | 1,100,014 | | | | 10,742,158 | | | | 121,836 | | | | 1,233,227 | | |
| Distributions reinvested | | | 45,293 | | | | 445,346 | | | | 40,981 | | | | 415,322 | | |
| Redemptions | | | (319,914 | ) | | | (3,155,774 | ) | | | (261,413 | ) | | | (2,655,412 | ) | |
| Net increase (decrease) | | | 825,393 | | | | 8,031,730 | | | | (98,596 | ) | | | (1,006,863 | ) | |
| Class B | |
| Subscriptions | | | 11,137 | | | | 109,262 | | | | 9,594 | | | | 96,314 | | |
| Distributions reinvested | | | 4,452 | | | | 43,840 | | | | 5,328 | | | | 54,011 | | |
| Redemptions | | | (41,202 | ) | | | (403,247 | ) | | | (67,375 | ) | | | (684,399 | ) | |
| Net decrease | | | (25,613 | ) | | | (250,145 | ) | | | (52,453 | ) | | | (534,074 | ) | |
| Class C | |
| Subscriptions | | | 148,653 | | | | 1,452,415 | | | | 66,448 | | | | 677,264 | | |
| Distributions reinvested | | | 8,543 | | | | 84,044 | | | | 8,848 | | | | 89,680 | | |
| Redemptions | | | (102,115 | ) | | | (1,009,857 | ) | | | (121,572 | ) | | | (1,241,157 | ) | |
| Net increase (decrease) | | | 55,081 | | | | 526,602 | | | | (46,276 | ) | | | (474,213 | ) | |
| Class Z | |
| Subscriptions | | | 5,686,633 | | | | 56,567,951 | | | | 3,510,755 | | | | 35,395,599 | | |
| Distributions reinvested | | | 30,814 | | | | 302,797 | | | | 21,409 | | | | 217,206 | | |
| Redemptions | | | (5,267,849 | ) | | | (51,304,888 | ) | | | (1,769,589 | ) | | | (17,962,290 | ) | |
| Net increase (decrease) | | | 449,598 | | | | 5,565,860 | | | | 1,762,575 | | | | 17,650,515 | | |
See Accompanying Notes to Financial Statements.
99
Statements of Changes in Net Assets – Capital Stock Activity
| | | Columbia Virginia Intermediate Municipal Bond Fund | |
| | | Year Ended
March 31, 2009 | | Year Ended
March 31, 2008 | |
| | | Shares | | Dollars ($) | | Shares | | Dollars ($) | |
| Class A | |
| Subscriptions | | | 842,605 | | | | 8,854,922 | | | | 333,356 | | | | 3,576,102 | | |
| Distributions reinvested | | | 106,894 | | | | 1,121,887 | | | | 110,906 | | | | 1,182,697 | | |
| Redemptions | | | (933,362 | ) | | | (9,649,914 | ) | | | (480,637 | ) | | | (5,120,656 | ) | |
| Net increase (decrease) | | | 16,137 | | | | 326,895 | | | | (36,375 | ) | | | (361,857 | ) | |
| Class B | |
| Subscriptions | | | 17,167 | | | | 179,600 | | | | 8,744 | | | | 93,685 | | |
| Distributions reinvested | | | 3,436 | | | | 36,058 | | | | 3,770 | | | | 40,210 | | |
| Redemptions | | | (39,099 | ) | | | (417,198 | ) | | | (74,602 | ) | | | (795,493 | ) | |
| Net decrease | | | (18,496 | ) | | | (201,540 | ) | | | (62,088 | ) | | | (661,598 | ) | |
| Class C | |
| Subscriptions | | | 91,631 | | | | 966,909 | | | | 10,030 | | | | 107,841 | | |
| Distributions reinvested | | | 2,998 | | | | 31,438 | | | | 2,469 | | | | 26,321 | | |
| Redemptions | | | (5,864 | ) | | | (62,068 | ) | | | (46,494 | ) | | | (496,482 | ) | |
| Net increase (decrease) | | | 88,765 | | | | 936,279 | | | | (33,995 | ) | | | (362,320 | ) | |
| Class Z | |
| Subscriptions | | | 4,972,861 | | | | 52,309,597 | | | | 5,391,242 | | | | 57,482,310 | | |
| Distributions reinvested | | | 17,929 | | | | 188,069 | | | | 13,093 | | | | 139,657 | | |
| Redemptions | | | (6,745,293 | ) | | | (70,455,167 | ) | | | (3,840,689 | ) | | | (40,935,530 | ) | |
| Net increase (decrease) | | | (1,754,503 | ) | | | (17,957,501 | ) | | | 1,563,646 | | | | 16,686,437 | | |
See Accompanying Notes to Financial Statements.
100
Financial Highlights – Columbia Short Term Municipal Bond Fund
Selected data for a share outstanding throughout each period is as follows:
| | | Year Ended March 31, | |
| Class A Shares | | 2009 | | 2008 | | 2007 | | 2006 (a) | | 2005 | |
| Net Asset Value, Beginning of Period | | $ | 10.32 | | | $ | 10.17 | | | $ | 10.14 | | | $ | 10.21 | | | $ | 10.42 | | |
| Income from Investment Operations: | |
| Net investment income (b) | | | 0.27 | | | | 0.32 | | | | 0.30 | | | | 0.22 | | | | 0.22 | | |
| Net realized and unrealized gain (loss) on investments | | | 0.15 | | | | 0.15 | | | | 0.03 | | | | (0.04 | ) | | | (0.21 | ) | |
| Total from investment operations | | | 0.42 | | | | 0.47 | | | | 0.33 | | | | 0.18 | | | | 0.01 | | |
| Less Distributions to Shareholders: | |
| From net investment income | | | (0.28 | ) | | | (0.32 | ) | | | (0.30 | ) | | | (0.25 | ) | | | (0.22 | ) | |
| Net Asset Value, End of Period | | $ | 10.46 | | | $ | 10.32 | | | $ | 10.17 | | | $ | 10.14 | | | $ | 10.21 | | |
| Total return (c)(d) | | | 4.14 | % | | | 4.66 | % | | | 3.30 | % | | | 1.80 | % | | | 0.07 | % | |
| Ratios to Average Net Assets/Supplemental Data: | |
| Net expenses before interest expense | | | 0.65 | %(e) | | | 0.65 | %(e) | | | 0.65 | %(e) | | | 0.65 | %(e) | | | 0.65 | % | |
| Interest expense (f) | | | — | % | | | — | % | | | — | % | | | — | % | | | — | % | |
| Net expenses | | | 0.65 | %(e) | | | 0.65 | %(e) | | | 0.65 | %(e) | | | 0.65 | %(e) | | | 0.65 | % | |
| Waiver/Reimbursement | | | 0.07 | % | | | 0.11 | % | | | 0.11 | % | | | 0.08 | % | | | 0.15 | % | |
| Net investment income | | | 2.60 | %(e) | | | 3.09 | %(e) | | | 2.95 | %(e) | | | 2.47 | %(e) | | | 2.10 | % | |
| Portfolio turnover rate | | | 94 | % | | | 73 | % | | | 98 | % | | | 13 | % | | | 17 | % | |
| Net assets, end of period (000's) | | $ | 209,539 | | | $ | 31,952 | | | $ | 32,855 | | | $ | 52,003 | | | $ | 88,601 | | |
(a) On August 22, 2005, the Fund's Investor A shares were renamed Class A shares.
(b) Per share data was calculated using the average shares outstanding during the period.
(c) Total return at net asset value assuming all distributions reinvested and no initial sales charge or contingent deferred sales charge.
(d) Had the investment advisor and/or any of its affiliates not waived fees or reimbursed a portion of expenses, total return would have been reduced.
(e) The benefits derived from expense reductions had an impact of less than 0.01%.
(f) Rounds to less than 0.01%.
See Accompanying Notes to Financial Statements.
101
Financial Highlights – Columbia Short Term Municipal Bond Fund
Selected data for a share outstanding throughout each period is as follows:
| | | Year Ended March 31, | |
| Class B Shares | | 2009 | | 2008 | | 2007 | | 2006 (a) | | 2005 | |
| Net Asset Value, Beginning of Period | | $ | 10.32 | | | $ | 10.17 | | | $ | 10.14 | | | $ | 10.21 | | | $ | 10.42 | | |
| Income from Investment Operations: | |
| Net investment income (b) | | | 0.20 | | | | 0.24 | | | | 0.22 | | | | 0.16 | | | | 0.14 | | |
| Net realized and unrealized gain (loss) on investments | | | 0.14 | | | | 0.15 | | | | 0.03 | | | | (0.05 | ) | | | (0.21 | ) | |
| Total from investment operations | | | 0.34 | | | | 0.39 | | | | 0.25 | | | | 0.11 | | | | (0.07 | ) | |
| Less Distributions to Shareholders: | |
| From net investment income | | | (0.20 | ) | | | (0.24 | ) | | | (0.22 | ) | | | (0.18 | ) | | | (0.14 | ) | |
| Net Asset Value, End of Period | | $ | 10.46 | | | $ | 10.32 | | | $ | 10.17 | | | $ | 10.14 | | | $ | 10.21 | | |
| Total return (c)(d) | | | 3.37 | % | | | 3.88 | % | | | 2.54 | % | | | 1.04 | % | | | (0.68 | )% | |
| Ratios to Average Net Assets/Supplemental Data: | |
| Net expenses before interest expense | | | 1.40 | %(e) | | | 1.40 | %(e) | | | 1.40 | %(e) | | | 1.40 | %(e) | | | 1.40 | % | |
| Interest expense (f) | | | — | % | | | — | % | | | — | % | | | — | % | | | — | % | |
| Net expenses | | | 1.40 | %(e) | | | 1.40 | %(e) | | | 1.40 | %(e) | | | 1.40 | %(e) | | | 1.40 | % | |
| Waiver/Reimbursement | | | 0.07 | % | | | 0.11 | % | | | 0.11 | % | | | 0.08 | % | | | 0.15 | % | |
| Net investment income | | | 1.98 | %(e) | | | 2.35 | %(e) | | | 2.20 | %(e) | | | 1.72 | %(e) | | | 1.35 | % | |
| Portfolio turnover rate | | | 94 | % | | | 73 | % | | | 98 | % | | | 13 | % | | | 17 | % | |
| Net assets, end of period (000's) | | $ | 458 | | | $ | 615 | | | $ | 739 | | | $ | 904 | | | $ | 1,186 | | |
(a) On August 22, 2005, the Fund's Investor B shares were renamed Class B shares.
(b) Per share data was calculated using the average shares outstanding during the period.
(c) Total return at net asset value assuming all distributions reinvested.
(d) Had the investment advisor and/or any of its affiliates not waived fees or reimbursed a portion of expenses, total return would have been reduced.
(e) The benefits derived from expense reductions had an impact of less than 0.01%.
(f) Rounds to less than 0.01%.
See Accompanying Notes to Financial Statements.
102
Financial Highlights – Columbia Short Term Municipal Bond Fund
Selected data for a share outstanding throughout each period is as follows:
| | | Year Ended March 31, | |
| Class C Shares | | 2009 | | 2008 | | 2007 | | 2006 (a) | | 2005 | |
| Net Asset Value, Beginning of Period | | $ | 10.32 | | | $ | 10.17 | | | $ | 10.14 | | | $ | 10.21 | | | $ | 10.42 | | |
| Income from Investment Operations: | |
| Net investment income (b) | | | 0.20 | | | | 0.24 | | | | 0.22 | | | | 0.16 | | | | 0.14 | | |
| Net realized and unrealized gain (loss) on investments | | | 0.14 | | | | 0.15 | | | | 0.03 | | | | (0.05 | ) | | | (0.21 | ) | |
| Total from investment operations | | | 0.34 | | | | 0.39 | | | | 0.25 | | | | 0.11 | | | | (0.07 | ) | |
| Less Distributions to Shareholders: | |
| From net investment income | | | (0.20 | ) | | | (0.24 | ) | | | (0.22 | ) | | | (0.18 | ) | | | (0.14 | ) | |
| Net Asset Value, End of Period | | $ | 10.46 | | | $ | 10.32 | | | $ | 10.17 | | | $ | 10.14 | | | $ | 10.21 | | |
| Total return (c)(d) | | | 3.37 | % | | | 3.88 | % | | | 2.53 | % | | | 1.04 | % | | | (0.68 | )% | |
| Ratios to Average Net Assets/Supplemental Data: | |
| Net expenses before interest expense | | | 1.40 | %(e) | | | 1.40 | %(e) | | | 1.40 | %(e) | | | 1.40 | %(e) | | | 1.40 | % | |
| Interest expense (f) | | | — | % | | | — | % | | | — | % | | | — | % | | | — | % | |
| Net expenses | | | 1.40 | %(e) | | | 1.40 | %(e) | | | 1.40 | %(e) | | | 1.40 | %(e) | | | 1.40 | % | |
| Waiver/Reimbursement | | | 0.07 | % | | | 0.11 | % | | | 0.11 | % | | | 0.08 | % | | | 0.15 | % | |
| Net investment income | | | 1.92 | %(e) | | | 2.35 | %(e) | | | 2.20 | %(e) | | | 1.72 | %(e) | | | 1.34 | % | |
| Portfolio turnover rate | | | 94 | % | | | 73 | % | | | 98 | % | | | 13 | % | | | 17 | % | |
| Net assets, end of period (000's) | | $ | 32,750 | | | $ | 14,816 | | | $ | 16,549 | | | $ | 22,848 | | | $ | 32,123 | | |
(a) On August 22, 2005, the Fund's Investor C shares were renamed Class C shares.
(b) Per share data was calculated using the average shares outstanding during the period.
(c) Total return at net asset value assuming all distributions reinvested and no contingent deferred sales charge.
(d) Had the investment advisor and/or any of its affiliates not waived fees or reimbursed a portion of expenses, total return would have been reduced.
(e) The benefits derived from expense reductions had an impact of less than 0.01%.
(f) Rounds to less than 0.01%.
See Accompanying Notes to Financial Statements.
103
Financial Highlights – Columbia Short Term Municipal Bond Fund
Selected data for a share outstanding throughout each period is as follows:
| | | Year Ended March 31, | |
| Class Z Shares | | 2009 | | 2008 | | 2007 | | 2006 (a) | | 2005 | |
| Net Asset Value, Beginning of Period | | $ | 10.32 | | | $ | 10.17 | | | $ | 10.14 | | | $ | 10.21 | | | $ | 10.42 | | |
| Income from Investment Operations: | |
| Net investment income (b) | | | 0.30 | | | | 0.34 | | | | 0.32 | | | | 0.25 | | | | 0.24 | | |
| Net realized and unrealized gain (loss) on investments | | | 0.15 | | | | 0.15 | | | | 0.04 | | | | (0.04 | ) | | | (0.21 | ) | |
| Total from investment operations | | | 0.45 | | | | 0.49 | | | | 0.36 | | | | 0.21 | | | | 0.03 | | |
| Less Distributions to Shareholders: | |
| From net investment income | | | (0.31 | ) | | | (0.34 | ) | | | (0.33 | ) | | | (0.28 | ) | | | (0.24 | ) | |
| Net Asset Value, End of Period | | $ | 10.46 | | | $ | 10.32 | | | $ | 10.17 | | | $ | 10.14 | | | $ | 10.21 | | |
| Total return (c)(d) | | | 4.41 | % | | | 4.92 | % | | | 3.56 | % | | | 2.05 | % | | | 0.31 | % | |
| Ratios to Average Net Assets/Supplemental Data: | |
| Net expenses before interest expense | | | 0.40 | %(e) | | | 0.40 | %(e) | | | 0.40 | %(e) | | | 0.40 | %(e) | | | 0.40 | % | |
| Interest expense (f) | | | — | % | | | — | % | | | — | % | | | — | % | | | — | % | |
| Net expenses | | | 0.40 | %(e) | | | 0.40 | %(e) | | | 0.40 | %(e) | | | 0.40 | %(e) | | | 0.40 | % | |
| Waiver/Reimbursement | | | 0.07 | % | | | 0.11 | % | | | 0.11 | % | | | 0.08 | % | | | 0.15 | % | |
| Net investment income | | | 2.94 | %(e) | | | 3.34 | %(e) | | | 3.20 | %(e) | | | 2.72 | %(e) | | | 2.35 | % | |
| Portfolio turnover rate | | | 94 | % | | | 73 | % | | | 98 | % | | | 13 | % | | | 17 | % | |
| Net assets, end of period (000's) | | $ | 1,044,788 | | | $ | 519,786 | | | $ | 380,532 | | | $ | 529,770 | | | $ | 840,910 | | |
(a) On August 22, 2005, the Fund's Primary A shares were renamed Class Z shares.
(b) Per share data was calculated using the average shares outstanding during the period.
(c) Total return at net asset value assuming all distributions reinvested.
(d) Had the investment advisor and/or any of its affiliates not waived fees or reimbursed a portion of expenses, total return would have been reduced.
(e) The benefits derived from expense reductions had an impact of less than 0.01%.
(f) Rounds to less than 0.01%.
See Accompanying Notes to Financial Statements.
104
Financial Highlights – Columbia California Intermediate Municipal Bond Fund
Selected data for a share outstanding throughout each period is as follows:
| | | Year Ended March 31, | |
| Class A Shares | | 2009 | | 2008 | | 2007 | | 2006 (a) | | 2005 | |
| Net Asset Value, Beginning of Period | | $ | 9.50 | | | $ | 9.63 | | | $ | 9.49 | | | $ | 9.63 | | | $ | 10.01 | | |
| Income from Investment Operations: | |
| Net investment income (b) | | | 0.31 | | | | 0.33 | | | | 0.33 | | | | 0.31 | | | | 0.30 | | |
Net realized and unrealized gain (loss) on investments
and futures contracts | | | (0.16 | ) | | | (0.13 | ) | | | 0.14 | | | | (0.08 | ) | | | (0.27 | ) | |
| Total from investment operations | | | 0.15 | | | | 0.20 | | | | 0.47 | | | | 0.23 | | | | 0.03 | | |
| Less Distributions to Shareholders: | |
| From net investment income | | | (0.31 | ) | | | (0.33 | ) | | | (0.33 | ) | | | (0.32 | ) | | | (0.30 | ) | |
| From net realized gains | | | — | | | | — | | | | — | | | | (0.05 | ) | | | (0.11 | ) | |
| Total distributions to shareholders | | | (0.31 | ) | | | (0.33 | ) | | | (0.33 | ) | | | (0.37 | ) | | | (0.41 | ) | |
| Net Asset Value, End of Period | | $ | 9.34 | | | $ | 9.50 | | | $ | 9.63 | | | $ | 9.49 | | | $ | 9.63 | | |
| Total return (c)(d) | | | 1.65 | % | | | 2.08 | % | | | 5.00 | % | | | 2.37 | % | | | 0.34 | % | |
| Ratios to Average Net Assets/Supplemental Data: | |
| Net expenses before interest expense | | | 0.75 | %(e) | | | 0.75 | %(e) | | | 0.75 | %(e) | | | 0.75 | %(e) | | | 0.75 | % | |
| Interest expense | | | — | | | | — | %(f) | | | — | | | | — | %(f) | | | — | %(f) | |
| Net expenses | | | 0.75 | %(e) | | | 0.75 | %(e) | | | 0.75 | %(e) | | | 0.75 | %(e) | | | 0.75 | % | |
| Waiver/Reimbursement | | | 0.13 | % | | | 0.16 | % | | | 0.20 | % | | | 0.18 | % | | | 0.28 | % | |
| Net investment income | | | 3.33 | %(e) | | | 3.40 | %(e) | | | 3.41 | %(e) | | | 3.30 | %(e) | | | 3.10 | % | |
| Portfolio turnover rate | | | 19 | % | | | 5 | % | | | 13 | % | | | 35 | % | | | 26 | % | |
| Net assets, end of period (000's) | | $ | 18,463 | | | $ | 13,488 | | | $ | 9,108 | | | $ | 7,145 | | | $ | 5,427 | | |
(a) On August 22, 2005, the Fund's Investor A shares were renamed Class A shares.
(b) Per share data was calculated using the average shares outstanding during the period.
(c) Total return at net asset value assuming all distributions reinvested and no initial sales charge or contingent deferred sales charge.
(d) Had the investment advisor and/or any of its affiliates not waived fees or reimbursed a portion of expenses, total return would have been reduced.
(e) The benefits derived from expense reductions had an impact of less than 0.01%.
(f) Rounds to less than 0.01%.
See Accompanying Notes to Financial Statements.
105
Financial Highlights – Columbia California Intermediate Municipal Bond Fund
Selected data for a share outstanding throughout each period is as follows:
| | | Year Ended March 31, | |
| Class B Shares | | 2009 | | 2008 | | 2007 | | 2006 (a) | | 2005 | |
| Net Asset Value, Beginning of Period | | $ | 9.49 | | | $ | 9.62 | | | $ | 9.48 | | | $ | 9.62 | | | $ | 10.00 | | |
| Income from Investment Operations: | |
| Net investment income (b) | | | 0.24 | | | | 0.26 | | | | 0.26 | | | | 0.24 | | | | 0.23 | | |
Net realized and unrealized gain (loss) on investments
and futures contracts | | | (0.15 | ) | | | (0.14 | ) | | | 0.14 | | | | (0.08 | ) | | | (0.27 | ) | |
| Total from investment operations | | | 0.09 | | | | 0.12 | | | | 0.40 | | | | 0.16 | | | | (0.04 | ) | |
| Less Distributions to Shareholders: | |
| From net investment income | | | (0.24 | ) | | | (0.25 | ) | | | (0.26 | ) | | | (0.25 | ) | | | (0.23 | ) | |
| From net realized gains | | | — | | | | — | | | | — | | | | (0.05 | ) | | | (0.11 | ) | |
| Total distributions to shareholders | | | (0.24 | ) | | | (0.25 | ) | | | (0.26 | ) | | | (0.30 | ) | | | (0.34 | ) | |
| Net Asset Value, End of Period | | $ | 9.34 | | | $ | 9.49 | | | $ | 9.62 | | | $ | 9.48 | | | $ | 9.62 | | |
| Total return (c)(d) | | | 1.00 | % | | | 1.32 | % | | | 4.22 | % | | | 1.61 | % | | | (0.41 | )% | |
| Ratios to Average Net Assets/Supplemental Data: | |
| Net expenses before interest expense | | | 1.50 | %(e) | | | 1.50 | %(e) | | | 1.50 | %(e) | | | 1.50 | %(e) | | | 1.50 | % | |
| Interest expense | | | — | | | | — | %(f) | | | — | | | | — | %(f) | | | — | %(f) | |
| Net expenses | | | 1.50 | %(e) | | | 1.50 | %(e) | | | 1.50 | %(e) | | | 1.50 | %(e) | | | 1.50 | % | |
| Waiver/Reimbursement | | | 0.13 | % | | | 0.16 | % | | | 0.20 | % | | | 0.18 | % | | | 0.28 | % | |
| Net investment income | | | 2.58 | %(e) | | | 2.69 | %(e) | | | 2.67 | %(e) | | | 2.55 | %(e) | | | 2.33 | % | |
| Portfolio turnover rate | | | 19 | % | | | 5 | % | | | 13 | % | | | 35 | % | | | 26 | % | |
| Net assets, end of period (000's) | | $ | 348 | | | $ | 475 | | | $ | 874 | | | $ | 1,258 | | | $ | 1,163 | | |
(a) On August 22, 2005, the Fund's Investor B shares were renamed Class B shares.
(b) Per share data was calculated using the average shares outstanding during the period.
(c) Total return at net asset value assuming all distributions reinvested and no contingent deferred sales charge.
(d) Had the investment advisor and/or any of its affiliates not waived fees or reimbursed a portion of expenses, total return would have been reduced.
(e) The benefits derived from expense reductions had an impact of less than 0.01%.
(f) Rounds to less than 0.01%.
See Accompanying Notes to Financial Statements.
106
Financial Highlights – Columbia California Intermediate Municipal Bond Fund
Selected data for a share outstanding throughout each period is as follows:
| | | Year Ended March 31, | |
| Class C Shares | | 2009 | | 2008 | | 2007 | | 2006 (a) | | 2005 | |
| Net Asset Value, Beginning of Period | | $ | 9.50 | | | $ | 9.63 | | | $ | 9.49 | | | $ | 9.63 | | | $ | 10.01 | | |
| Income from Investment Operations: | |
| Net investment income (b) | | | 0.24 | | | | 0.26 | | | | 0.26 | | | | 0.25 | | | | 0.23 | | |
Net realized and unrealized gain (loss) on investments
and futures contracts | �� | | (0.15 | ) | | | (0.14 | ) | | | 0.14 | | | | (0.09 | ) | | | (0.27 | ) | |
| Total from investment operations | | | 0.09 | | | | 0.12 | | | | 0.40 | | | | 0.16 | | | | (0.04 | ) | |
| Less Distributions to Shareholders: | |
| From net investment income | | | (0.24 | ) | | | (0.25 | ) | | | (0.26 | ) | | | (0.25 | ) | | | (0.23 | ) | |
| From net realized gains | | | — | | | | — | | | | — | | | | (0.05 | ) | | | (0.11 | ) | |
| Total distributions to shareholders | | | (0.24 | ) | | | (0.25 | ) | | | (0.26 | ) | | | (0.30 | ) | | | (0.34 | ) | |
| Net Asset Value, End of Period | | $ | 9.35 | | | $ | 9.50 | | | $ | 9.63 | | | $ | 9.49 | | | $ | 9.63 | | |
| Total return (c)(d) | | | 1.00 | % | | | 1.31 | % | | | 4.22 | % | | | 1.61 | % | | | (0.40 | )% | |
| Ratios to Average Net Assets/Supplemental Data: | |
| Net expenses before interest expense | | | 1.50 | %(e) | | | 1.50 | %(e) | | | 1.50 | %(e) | | | 1.50 | %(e) | | | 1.50 | % | |
| Interest expense | | | — | | | | — | %(f) | | | — | | | | — | %(f) | | | — | %(f) | |
| Net expenses | | | 1.50 | %(e) | | | 1.50 | %(e) | | | 1.50 | %(e) | | | 1.50 | %(e) | | | 1.50 | % | |
| Waiver/Reimbursement | | | 0.13 | % | | | 0.16 | % | | | 0.20 | % | | | 0.18 | % | | | 0.28 | % | |
| Net investment income | | | 2.58 | %(e) | | | 2.67 | %(e) | | | 2.67 | %(e) | | | 2.55 | %(e) | | | 2.33 | % | |
| Portfolio turnover rate | | | 19 | % | | | 5 | % | | | 13 | % | | | 35 | % | | | 26 | % | |
| Net assets, end of period (000's) | | $ | 1,061 | | | $ | 1,263 | | | $ | 1,274 | | | $ | 1,339 | | | $ | 2,797 | | |
(a) On August 22, 2005, the Fund's Investor C shares were renamed Class C shares.
(b) Per share data was calculated using the average shares outstanding during the period.
(c) Total return at net asset value assuming all distributions reinvested and no contingent deferred sales charge.
(d) Had the investment advisor and/or any of its affiliates not waived fees or reimbursed a portion of expenses, total return would have been reduced.
(e) The benefits derived from expense reductions had an impact of less than 0.01%.
(f) Rounds to less than 0.01%.
See Accompanying Notes to Financial Statements.
107
Financial Highlights – Columbia California Intermediate Municipal Bond Fund
Selected data for a share outstanding throughout each period is as follows:
| | | Year Ended March 31, | |
| Class Z Shares | | 2009 | | 2008 | | 2007 | | 2006 (a) | | 2005 | |
| Net Asset Value, Beginning of Period | | $ | 9.48 | | | $ | 9.61 | | | $ | 9.47 | | | $ | 9.61 | | | $ | 9.99 | | |
| Income from Investment Operations: | |
| Net investment income (b) | | | 0.34 | | | | 0.35 | | | | 0.35 | | | | 0.34 | | | | 0.33 | | |
Net realized and unrealized gain (loss) on investments
and futures contracts | | | (0.15 | ) | | | (0.13 | ) | | | 0.14 | | | | (0.09 | ) | | | (0.27 | ) | |
| Total from investment operations | | | 0.19 | | | | 0.22 | | | | 0.49 | | | | 0.25 | | | | 0.06 | | |
| Less Distributions to Shareholders: | |
| From net investment income | | | (0.34 | ) | | | (0.35 | ) | | | (0.35 | ) | | | (0.34 | ) | | | (0.33 | ) | |
| From net realized gains | | | — | | | | — | | | | — | | | | (0.05 | ) | | | (0.11 | ) | |
| Total distributions to shareholders | | | (0.34 | ) | | | (0.35 | ) | | | (0.35 | ) | | | (0.39 | ) | | | (0.44 | ) | |
| Net Asset Value, End of Period | | $ | 9.33 | | | $ | 9.48 | | | $ | 9.61 | | | $ | 9.47 | | | $ | 9.61 | | |
| Total return (c)(d) | | | 2.02 | % | | | 2.33 | % | | | 5.27 | % | | | 2.63 | % | | | 0.59 | % | |
| Ratios to Average Net Assets/Supplemental Data: | |
| Net expenses before interest expense | | | 0.50 | %(e) | | | 0.50 | %(e) | | | 0.50 | %(e) | | | 0.50 | %(e) | | | 0.50 | % | |
| Interest expense | | | — | | | | — | %(f) | | | — | | | | — | %(f) | | | — | %(f) | |
| Net expenses | | | 0.50 | %(e) | | | 0.50 | %(e) | | | 0.50 | %(e) | | | 0.50 | %(e) | | | 0.50 | % | |
| Waiver/Reimbursement | | | 0.13 | % | | | 0.16 | % | | | 0.20 | % | | | 0.18 | % | | | 0.28 | % | |
| Net investment income | | | 3.58 | %(e) | | | 3.66 | %(e) | | | 3.67 | %(e) | | | 3.55 | %(e) | | | 3.32 | % | |
| Portfolio turnover rate | | | 19 | % | | | 5 | % | | | 13 | % | | | 35 | % | | | 26 | % | |
| Net assets, end of period (000's) | | $ | 187,844 | | | $ | 203,426 | | | $ | 132,921 | | | $ | 122,286 | | | $ | 116,533 | | |
(a) On August 22, 2005, the Fund's Primary A shares were renamed Class Z shares.
(b) Per share data was calculated using the average shares outstanding during the period.
(c) Total return at net asset value assuming all distributions reinvested.
(d) Had the investment advisor and/or any of its affiliates not waived fees or reimbursed a portion of expenses, total return would have been reduced.
(e) The benefits derived from expense reductions had an impact of less than 0.01%.
(f) Rounds to less than 0.01%.
See Accompanying Notes to Financial Statements.
108
Financial Highlights – Columbia Georgia Intermediate Municipal Bond Fund
Selected data for a share outstanding throughout each period is as follows:
| | | Year Ended March 31, | |
| Class A Shares | | 2009 | | 2008 | | 2007 | | 2006 (a) | | 2005 | |
| Net Asset Value, Beginning of Period | | $ | 10.35 | | | $ | 10.54 | | | $ | 10.51 | | | $ | 10.66 | | | $ | 10.98 | | |
| Income from Investment Operations: | |
| Net investment income (b) | | | 0.37 | | | | 0.40 | | | | 0.40 | | | | 0.40 | | | | 0.41 | | |
Net realized and unrealized gain (loss) on investments
and futures contracts | | | (0.17 | ) | | | (0.19 | ) | | | 0.03 | | | | (0.15 | ) | | | (0.32 | ) | |
| Total from investment operations | | | 0.20 | | | | 0.21 | | | | 0.43 | | | | 0.25 | | | | 0.09 | | |
| Less Distributions to Shareholders: | |
| From net investment income | | | (0.37 | ) | | | (0.40 | ) | | | (0.40 | ) | | | (0.40 | ) | | | (0.41 | ) | |
| Net Asset Value, End of Period | | $ | 10.18 | | | $ | 10.35 | | | $ | 10.54 | | | $ | 10.51 | | | $ | 10.66 | | |
| Total return (c)(d) | | | 2.04 | % | | | 2.00 | % | | | 4.20 | % | | | 2.38 | % | | | 0.80 | % | |
| Ratios to Average Net Assets/Supplemental Data: | |
| Net expenses before interest expense | | | 0.75 | %(e) | | | 0.75 | %(e) | | | 0.75 | %(e) | | | 0.75 | %(e) | | | 0.75 | % | |
| Interest expense | | | — | | | | — | %(f) | | | — | | | | — | %(f) | | | — | %(f) | |
| Net expenses | | | 0.75 | %(e) | | | 0.75 | %(e) | | | 0.75 | %(e) | | | 0.75 | %(e) | | | 0.75 | % | |
| Waiver/Reimbursement | | | 0.17 | % | | | 0.20 | % | | | 0.21 | % | | | 0.19 | % | | | 0.25 | % | |
| Net investment income | | | 3.67 | %(e) | | | 3.80 | %(e) | | | 3.84 | %(e) | | | 3.79 | %(e) | | | 3.76 | % | |
| Portfolio turnover rate | | | 22 | % | | | 28 | % | | | 26 | % | | | 12 | % | | | 8 | % | |
| Net assets, end of period (000's) | | $ | 14,801 | | | $ | 13,742 | | | $ | 15,574 | | | $ | 17,913 | | | $ | 21,415 | | |
(a) On August 22, 2005, the Fund's Investor A shares were renamed Class A shares.
(b) Per share data was calculated using the average shares outstanding during the period.
(c) Total return at net asset value assuming all distributions reinvested and no initial sales charge or contingent deferred sales charge.
(d) Had the investment advisor and/or any of its affiliates not waived fees or reimbursed a portion of expenses, total return would have been reduced.
(e) The benefits derived from expense reductions had an impact of less than 0.01%.
(f) Rounds to less than 0.01%.
See Accompanying Notes to Financial Statements.
109
Financial Highlights – Columbia Georgia Intermediate Municipal Bond Fund
Selected data for a share outstanding throughout each period is as follows:
| | | Year Ended March 31, | |
| Class B Shares | | 2009 | | 2008 | | 2007 | | 2006 (a) | | 2005 | |
| Net Asset Value, Beginning of Period | | $ | 10.35 | | | $ | 10.55 | | | $ | 10.52 | | | $ | 10.67 | | | $ | 10.99 | | |
| Income from Investment Operations: | |
| Net investment income (b) | | | 0.30 | | | | 0.32 | | | | 0.33 | | | | 0.32 | | | | 0.32 | | |
Net realized and unrealized gain (loss) on investments
and futures contracts | | | (0.16 | ) | | | (0.20 | ) | | | 0.03 | | | | (0.15 | ) | | | (0.32 | ) | |
| Total from investment operations | | | 0.14 | | | | 0.12 | | | | 0.36 | | | | 0.17 | | | | — | | |
| Less Distributions to Shareholders: | |
| From net investment income | | | (0.30 | ) | | | (0.32 | ) | | | (0.33 | ) | | | (0.32 | ) | | | (0.32 | ) | |
| Net Asset Value, End of Period | | $ | 10.19 | | | $ | 10.35 | | | $ | 10.55 | | | $ | 10.52 | | | $ | 10.67 | | |
| Total return (c)(d) | | | 1.38 | % | | | 1.15 | % | | | 3.43 | % | | | 1.62 | % | | | 0.05 | % | |
| Ratios to Average Net Assets/Supplemental Data: | |
| Net expenses before interest expense | | | 1.50 | %(e) | | | 1.50 | %(e) | | | 1.50 | %(e) | | | 1.50 | %(e) | | | 1.50 | % | |
| Interest expense | | | — | | | | — | %(f) | | | — | | | | — | %(f) | | | — | %(f) | |
| Net expenses | | | 1.50 | %(e) | | | 1.50 | %(e) | | | 1.50 | %(e) | | | 1.50 | %(e) | | | 1.50 | % | |
| Waiver/Reimbursement | | | 0.17 | % | | | 0.20 | % | | | 0.21 | % | | | 0.19 | % | | | 0.25 | % | |
| Net investment income | | | 2.92 | %(e) | | | 3.05 | %(e) | | | 3.09 | %(e) | | | 3.04 | %(e) | | | 3.01 | % | |
| Portfolio turnover rate | | | 22 | % | | | 28 | % | | | 26 | % | | | 12 | % | | | 8 | % | |
| Net assets, end of period (000's) | | $ | 1,266 | | | $ | 1,364 | | | $ | 1,960 | | | $ | 2,581 | | | $ | 6,662 | | |
(a) On August 22, 2005, the Fund's Investor B shares were renamed Class B shares.
(b) Per share data was calculated using the average shares outstanding during the period.
(c) Total return at net asset value assuming all distributions reinvested and no contingent deferred sales charge.
(d) Had the investment advisor and/or any of its affiliates not waived fees or reimbursed a portion of expenses, total return would have been reduced.
(e) The benefits derived from expense reductions had an impact of less than 0.01%.
(f) Rounds to less than 0.01%.
See Accompanying Notes to Financial Statements.
110
Financial Highlights – Columbia Georgia Intermediate Municipal Bond Fund
Selected data for a share outstanding throughout each period is as follows:
| | | Year Ended March 31, | |
| Class C Shares | | 2009 | | 2008 | | 2007 | | 2006 (a) | | 2005 | |
| Net Asset Value, Beginning of Period | | $ | 10.35 | | | $ | 10.55 | | | $ | 10.51 | | | $ | 10.66 | | | $ | 10.98 | | |
| Income from Investment Operations: | |
| Net investment income (b) | | | 0.30 | | | | 0.32 | | | | 0.33 | | | | 0.32 | | | | 0.33 | | |
Net realized and unrealized gain (loss) on investments
and futures contracts | | | (0.17 | ) | | | (0.20 | ) | | | 0.04 | | | | (0.15 | ) | | | (0.33 | ) | |
| Total from investment operations | | | 0.13 | | | | 0.12 | | | | 0.37 | | | | 0.17 | | | | — | | |
| Less Distributions to Shareholders: | |
| From net investment income | | | (0.30 | ) | | | (0.32 | ) | | | (0.33 | ) | | | (0.32 | ) | | | (0.32 | ) | |
| Net Asset Value, End of Period | | $ | 10.18 | | | $ | 10.35 | | | $ | 10.55 | | | $ | 10.51 | | | $ | 10.66 | | |
| Total return (c)(d) | | | 1.28 | % | | | 1.14 | % | | | 3.52 | % | | | 1.62 | % | | | 0.05 | % | |
| Ratios to Average Net Assets/Supplemental Data: | |
| Net expenses before interest expense | | | 1.50 | %(e) | | | 1.50 | %(e) | | | 1.50 | %(e) | | | 1.50 | %(e) | | | 1.50 | % | |
| Interest expense | | | — | | | | — | %(f) | | | — | | | | — | %(f) | | | — | %(f) | |
| Net expenses | | | 1.50 | %(e) | | | 1.50 | %(e) | | | 1.50 | %(e) | | | 1.50 | %(e) | | | 1.50 | % | |
| Waiver/Reimbursement | | | 0.17 | % | | | 0.20 | % | | | 0.21 | % | | | 0.19 | % | | | 0.25 | % | |
| Net investment income | | | 2.92 | %(e) | | | 3.05 | %(e) | | | 3.09 | %(e) | | | 3.04 | %(e) | | | 3.01 | % | |
| Portfolio turnover rate | | | 22 | % | | | 28 | % | | | 26 | % | | | 12 | % | | | 8 | % | |
| Net assets, end of period (000's) | | $ | 2,100 | | | $ | 1,830 | | | $ | 1,877 | | | $ | 2,189 | | | $ | 3,254 | | |
(a) On August 22, 2005, the Fund's Investor C shares were renamed Class C shares.
(b) Per share data was calculated using the average shares outstanding during the period.
(c) Total return at net asset value assuming all distributions reinvested and no contingent deferred sales charge.
(d) Had the investment advisor and/or any of its affiliates not waived fees or reimbursed a portion of expenses, total return would have been reduced.
(e) The benefits derived from expense reductions had an impact of less than 0.01%.
(f) Rounds to less than 0.01%.
See Accompanying Notes to Financial Statements.
111
Financial Highlights – Columbia Georgia Intermediate Municipal Bond Fund
Selected data for a share outstanding throughout each period is as follows:
| | | Year Ended March 31, | |
| Class Z Shares | | 2009 | | 2008 | | 2007 | | 2006 (a) | | 2005 | |
| Net Asset Value, Beginning of Period | | $ | 10.35 | | | $ | 10.54 | | | $ | 10.51 | | | $ | 10.66 | | | $ | 10.98 | | |
| Income from Investment Operations: | |
| Net investment income (b) | | | 0.40 | | | | 0.42 | | | | 0.43 | | | | 0.43 | | | | 0.43 | | |
Net realized and unrealized gain (loss) on investments
and futures contracts | | | (0.17 | ) | | | (0.19 | ) | | | 0.03 | | | | (0.15 | ) | | | (0.32 | ) | |
| Total from investment operations | | | 0.23 | | | | 0.23 | | | | 0.46 | | | | 0.28 | | | | 0.11 | | |
| Less Distributions to Shareholders: | |
| From net investment income | | | (0.40 | ) | | | (0.42 | ) | | | (0.43 | ) | | | (0.43 | ) | | | (0.43 | ) | |
| Net Asset Value, End of Period | | $ | 10.18 | | | $ | 10.35 | | | $ | 10.54 | | | $ | 10.51 | | | $ | 10.66 | | |
| Total return (c)(d) | | | 2.30 | % | | | 2.26 | % | | | 4.46 | % | | | 2.63 | % | | | 1.05 | % | |
| Ratios to Average Net Assets/Supplemental Data: | |
| Net expenses before interest expense | | | 0.50 | %(e) | | | 0.50 | %(e) | | | 0.50 | %(e) | | | 0.50 | %(e) | | | 0.50 | % | |
| Interest expense | | | — | | | | — | %(f) | | | — | | | | — | %(f) | | | — | %(f) | |
| Net expenses | | | 0.50 | %(e) | | | 0.50 | %(e) | | | 0.50 | %(e) | | | 0.50 | %(e) | | | 0.50 | % | |
| Waiver/Reimbursement | | | 0.17 | % | | | 0.20 | % | | | 0.21 | % | | | 0.19 | % | | | 0.25 | % | |
| Net investment income | | | 3.92 | %(e) | | | 4.05 | %(e) | | | 4.09 | %(e) | | | 4.04 | %(e) | | | 4.01 | % | |
| Portfolio turnover rate | | | 22 | % | | | 28 | % | | | 26 | % | | | 12 | % | | | 8 | % | |
| Net assets, end of period (000's) | | $ | 110,408 | | | $ | 106,927 | | | $ | 100,541 | | | $ | 102,259 | | | $ | 114,652 | | |
(a) On August 22, 2005, the Fund's Primary A shares were renamed Class Z shares.
(b) Per share data was calculated using the average shares outstanding during the period.
(c) Total return at net asset value assuming all distributions reinvested.
(d) Had the investment advisor and/or any of its affiliates not waived fees or reimbursed a portion of expenses, total return would have been reduced.
(e) The benefits derived from expense reductions had an impact of less than 0.01%.
(f) Rounds to less than 0.01%.
See Accompanying Notes to Financial Statements.
112
Financial Highlights – Columbia Maryland Intermediate Municipal Bond Fund
Selected data for a share outstanding throughout each period is as follows:
| | | Year Ended March 31, | |
| Class A Shares | | 2009 | | 2008 | | 2007 | | 2006 (a) | | 2005 | |
| Net Asset Value, Beginning of Period | | $ | 10.44 | | | $ | 10.63 | | | $ | 10.57 | | | $ | 10.78 | | | $ | 11.22 | | |
| Income from Investment Operations: | |
| Net investment income (b) | | | 0.38 | | | | 0.39 | | | | 0.40 | | | | 0.39 | | | | 0.39 | | |
Net realized and unrealized gain (loss) on investments
and futures contracts | | | (0.36 | ) | | | (0.19 | ) | | | 0.06 | | | | (0.22 | ) | | | (0.44 | ) | |
| Total from investment operations | | | 0.02 | | | | 0.20 | | | | 0.46 | | | | 0.17 | | | | (0.05 | ) | |
| Less Distributions to Shareholders: | |
| From net investment income | | | (0.38 | ) | | | (0.39 | ) | | | (0.40 | ) | | | (0.38 | ) | | | (0.39 | ) | |
| Net Asset Value, End of Period | | $ | 10.08 | | | $ | 10.44 | | | $ | 10.63 | | | $ | 10.57 | | | $ | 10.78 | | |
| Total return (c)(d) | | | 0.26 | % | | | 1.96 | % | | | 4.46 | % | | | 1.59 | % | | | (0.43 | )% | |
| Ratios to Average Net Assets/Supplemental Data: | |
| Net expenses before interest expense | | | 0.75 | %(e) | | | 0.75 | %(e) | | | 0.75 | %(e) | | | 0.75 | %(e) | | | 0.75 | % | |
| Interest expense | | | — | | | | — | | | | — | %(f) | | | — | %(f) | | | — | %(f) | |
| Net expenses | | | 0.75 | %(e) | | | 0.75 | %(e) | | | 0.75 | %(e) | | | 0.75 | %(e) | | | 0.75 | % | |
| Waiver/Reimbursement | | | 0.15 | % | | | 0.16 | % | | | 0.17 | % | | | 0.16 | % | | | 0.23 | % | |
| Net investment income | | | 3.76 | %(e) | | | 3.74 | %(e) | | | 3.81 | %(e) | | | 3.59 | %(e) | | | 3.54 | % | |
| Portfolio turnover rate | | | 11 | % | | | 8 | % | | | 20 | % | | | 24 | % | | | 2 | % | |
| Net assets, end of period (000's) | | $ | 23,530 | | | $ | 24,405 | | | $ | 24,730 | | | $ | 28,877 | | | $ | 30,400 | | |
(a) On August 22, 2005, the Fund's Investor A shares were renamed Class A shares.
(b) Per share data was calculated using the average shares outstanding during the period.
(c) Total return at net asset value assuming all distributions reinvested and no initial sales charge or contingent deferred sales charge.
(d) Had the investment advisor and/or any of its affiliates not waived fees or reimbursed a portion of expenses, total return would have been reduced.
(e) The benefits derived from expense reductions had an impact of less than 0.01%.
(f) Rounds to less than 0.01%.
See Accompanying Notes to Financial Statements.
113
Financial Highlights – Columbia Maryland Intermediate Municipal Bond Fund
Selected data for a share outstanding throughout each period is as follows:
| | | Year Ended March 31, | |
| Class B Shares | | 2009 | | 2008 | | 2007 | | 2006 (a) | | 2005 | |
| Net Asset Value, Beginning of Period | | $ | 10.45 | | | $ | 10.64 | | | $ | 10.57 | | | $ | 10.78 | | | $ | 11.23 | | |
| Income from Investment Operations: | |
| Net investment income (b) | | | 0.31 | | | | 0.32 | | | | 0.33 | | | | 0.30 | | | | 0.31 | | |
Net realized and unrealized gain (loss) on investments
and futures contracts | | | (0.36 | ) | | | (0.19 | ) | | | 0.06 | | | | (0.21 | ) | | | (0.45 | ) | |
| Total from investment operations | | | (0.05 | ) | | | 0.13 | | | | 0.39 | | | | 0.09 | | | | (0.14 | ) | |
| Less Distributions to Shareholders: | |
| From net investment income | | | (0.31 | ) | | | (0.32 | ) | | | (0.32 | ) | | | (0.30 | ) | | | (0.31 | ) | |
| Net Asset Value, End of Period | | $ | 10.09 | | | $ | 10.45 | | | $ | 10.64 | | | $ | 10.57 | | | $ | 10.78 | | |
| Total return (c)(d) | | | (0.48 | )% | | | 1.20 | % | | | 3.78 | % | | | 0.83 | % | | | (1.26 | )% | |
| Ratios to Average Net Assets/Supplemental Data: | |
| Net expenses before interest expense | | | 1.50 | %(e) | | | 1.50 | %(e) | | | 1.50 | %(e) | | | 1.50 | %(e) | | | 1.50 | % | |
| Interest expense | | | — | | | | — | | | | — | %(f) | | | — | %(f) | | | — | %(f) | |
| Net expenses | | | 1.50 | %(e) | | | 1.50 | %(e) | | | 1.50 | %(e) | | | 1.50 | %(e) | | | 1.50 | % | |
| Waiver/Reimbursement | | | 0.15 | % | | | 0.16 | % | | | 0.17 | % | | | 0.16 | % | | | 0.23 | % | |
| Net investment income | | | 3.01 | %(e) | | | 3.00 | %(e) | | | 3.07 | %(e) | | | 2.84 | %(e) | | | 2.79 | % | |
| Portfolio turnover rate | | | 11 | % | | | 8 | % | | | 20 | % | | | 24 | % | | | 2 | % | |
| Net assets, end of period (000's) | | $ | 2,220 | | | $ | 2,689 | | | $ | 4,159 | | | $ | 7,825 | | | $ | 13,119 | | |
(a) On August 22, 2005, the Fund's Investor B shares were renamed Class B shares.
(b) Per share data was calculated using the average shares outstanding during the period.
(c) Total return at net asset value assuming all distributions reinvested and no contingent deferred sales charge.
(d) Had the investment advisor and/or any of its affiliates not waived fees or reimbursed a portion of expenses, total return would have been reduced.
(e) The benefits derived from expense reductions had an impact of less than 0.01%.
(f) Rounds to less than 0.01%.
See Accompanying Notes to Financial Statements.
114
Financial Highlights – Columbia Maryland Intermediate Municipal Bond Fund
Selected data for a share outstanding throughout each period is as follows:
| | | Year Ended March 31, | |
| Class C Shares | | 2009 | | 2008 | | 2007 | | 2006 (a) | | 2005 | |
| Net Asset Value, Beginning of Period | | $ | 10.44 | | | $ | 10.63 | | | $ | 10.57 | | | $ | 10.78 | | | $ | 11.23 | | |
| Income from Investment Operations: | |
| Net investment income (b) | | | 0.31 | | | | 0.32 | | | | 0.32 | | | | 0.30 | | | | 0.31 | | |
Net realized and unrealized gain (loss) on investments
and futures contracts | | | (0.36 | ) | | | (0.19 | ) | | | 0.06 | | | | (0.21 | ) | | | (0.45 | ) | |
| Total from investment operations | | | (0.05 | ) | | | 0.13 | | | | 0.38 | | | | 0.09 | | | | (0.14 | ) | |
| Less Distributions to Shareholders: | |
| From net investment income | | | (0.31 | ) | | | (0.32 | ) | | | (0.32 | ) | | | (0.30 | ) | | | (0.31 | ) | |
| Net Asset Value, End of Period | | $ | 10.08 | | | $ | 10.44 | | | $ | 10.63 | | | $ | 10.57 | | | $ | 10.78 | | |
| Total return (c)(d) | | | (0.49 | )% | | | 1.20 | % | | | 3.68 | % | | | 0.83 | % | | | (1.26 | )% | |
| Ratios to Average Net Assets/Supplemental Data: | |
| Net expenses before interest expense | | | 1.50 | %(e) | | | 1.50 | %(e) | | | 1.50 | %(e) | | | 1.50 | %(e) | | | 1.50 | % | |
| Interest expense | | | — | | | | — | | | | — | %(f) | | | — | %(f) | | | — | %(f) | |
| Net expenses | | | 1.50 | %(e) | | | 1.50 | %(e) | | | 1.50 | %(e) | | | 1.50 | %(e) | | | 1.50 | % | |
| Waiver/Reimbursement | | | 0.15 | % | | | 0.16 | % | | | 0.17 | % | | | 0.16 | % | | | 0.23 | % | |
| Net investment income | | | 3.02 | %(e) | | | 2.99 | %(e) | | | 3.06 | %(e) | | | 2.84 | %(e) | | | 2.79 | % | |
| Portfolio turnover rate | | | 11 | % | | | 8 | % | | | 20 | % | | | 24 | % | | | 2 | % | |
| Net assets, end of period (000's) | | $ | 2,143 | | | $ | 1,597 | | | $ | 1,767 | | | $ | 1,979 | | | $ | 2,628 | | |
(a) On August 22, 2005, the Fund's Investor C shares were renamed Class C shares.
(b) Per share data was calculated using the average shares outstanding during the period.
(c) Total return at net asset value assuming all distributions reinvested and no contingent deferred sales charge.
(d) Had the investment advisor and/or any of its affiliates not waived fees or reimbursed a portion of expenses, total return would have been reduced.
(e) The benefits derived from expense reductions had an impact of less than 0.01%.
(f) Rounds to less than 0.01%.
See Accompanying Notes to Financial Statements.
115
Financial Highlights – Columbia Maryland Intermediate Municipal Bond Fund
Selected data for a share outstanding throughout each period is as follows:
| | | Year Ended March 31, | |
| Class Z Shares | | 2009 | | 2008 | | 2007 | | 2006 (a) | | 2005 | |
| Net Asset Value, Beginning of Period | | $ | 10.44 | | | $ | 10.63 | | | $ | 10.57 | | | $ | 10.78 | | | $ | 11.23 | | |
| Income from Investment Operations: | |
| Net investment income (b) | | | 0.41 | | | | 0.42 | | | | 0.43 | | | | 0.41 | | | | 0.41 | | |
Net realized and unrealized gain (loss) on investments
and futures contracts | | | (0.35 | ) | | | (0.19 | ) | | | 0.06 | | | | (0.21 | ) | | | (0.44 | ) | |
| Total from investment operations | | | 0.06 | | | | 0.23 | | | | 0.49 | | | | 0.20 | | | | (0.03 | ) | |
| Less Distributions to Shareholders: | |
| From net investment income | | | (0.41 | ) | | | (0.42 | ) | | | (0.43 | ) | | | (0.41 | ) | | | (0.42 | ) | |
| Net Asset Value, End of Period | | $ | 10.09 | | | $ | 10.44 | | | $ | 10.63 | | | $ | 10.57 | | | $ | 10.78 | | |
| Total return (c)(d) | | | 0.61 | % | | | 2.21 | % | | | 4.72 | % | | | 1.84 | % | | | (0.27 | )% | |
| Ratios to Average Net Assets/Supplemental Data: | |
| Net expenses before interest expense | | | 0.50 | %(e) | | | 0.50 | %(e) | | | 0.50 | %(e) | | | 0.50 | %(e) | | | 0.50 | % | |
| Interest expense | | | — | | | | — | | | | — | %(f) | | | — | %(f) | | | — | %(f) | |
| Net expenses | | | 0.50 | %(e) | | | 0.50 | %(e) | | | 0.50 | %(e) | | | 0.50 | %(e) | | | 0.50 | % | |
| Waiver/Reimbursement | | | 0.15 | % | | | 0.16 | % | | | 0.17 | % | | | 0.16 | % | | | 0.23 | % | |
| Net investment income | | | 4.01 | %(e) | | | 3.99 | %(e) | | | 4.06 | %(e) | | | 3.84 | %(e) | | | 3.79 | % | |
| Portfolio turnover rate | | | 11 | % | | | 8 | % | | | 20 | % | | | 24 | % | | | 2 | % | |
| Net assets, end of period (000's) | | $ | 126,661 | | | $ | 135,506 | | | $ | 141,094 | | | $ | 148,553 | | | $ | 153,653 | | |
(a) On August 22, 2005, the Fund's Primary A shares were renamed Class Z shares.
(b) Per share data was calculated using the average shares outstanding during the period.
(c) Total return at net asset value assuming all distributions reinvested.
(d) Had the investment advisor and/or any of its affiliates not waived fees or reimbursed a portion of expenses, total return would have been reduced.
(e) The benefits derived from expense reductions had an impact of less than 0.01%.
(f) Rounds to less than 0.01%.
See Accompanying Notes to Financial Statements.
116
Financial Highlights – Columbia North Carolina Intermediate Municipal Bond Fund
Selected data for a share outstanding throughout each period is as follows:
| | | Year Ended March 31, | |
| Class A Shares | | 2009 | | 2008 | | 2007 | | 2006 (a) | | 2005 | |
| Net Asset Value, Beginning of Period | | $ | 10.08 | | | $ | 10.38 | | | $ | 10.40 | | | $ | 10.56 | | | $ | 10.87 | | |
| Income from Investment Operations: | |
| Net investment income (b) | | | 0.37 | | | | 0.39 | | | | 0.40 | | | | 0.41 | | | | 0.41 | | |
Net realized and unrealized gain (loss) on investments
and futures contracts | | | (0.29 | ) | | | (0.30 | ) | | | 0.03 | | | | (0.16 | ) | | | (0.31 | ) | |
| Total from investment operations | | | 0.08 | | | | 0.09 | | | | 0.43 | | | | 0.25 | | | | 0.10 | | |
| Less Distributions to Shareholders: | |
| From net investment income | | | (0.37 | ) | | | (0.39 | ) | | | (0.39 | ) | | | (0.41 | ) | | | (0.41 | ) | |
| From net realized gains | | | — | | | | — | (c) | | | (0.06 | ) | | | — | | | | — | | |
| Total distributions to shareholders | | | (0.37 | ) | | | (0.39 | ) | | | (0.45 | ) | | | (0.41 | ) | | | (0.41 | ) | |
| Net Asset Value, End of Period | | $ | 9.79 | | | $ | 10.08 | | | $ | 10.38 | | | $ | 10.40 | | | $ | 10.56 | | |
| Total return (d)(e) | | | 0.87 | % | | | 0.84 | % | | | 4.23 | % | | | 2.37 | % | | | 0.93 | % | |
| Ratios to Average Net Assets/Supplemental Data: | |
| Net expenses before interest expense | | | 0.75 | %(f) | | | 0.75 | %(f) | | | 0.75 | %(f) | | | 0.75 | %(f) | | | 0.75 | % | |
| Interest expense | | | — | | | | — | | | | — | | | | — | | | | — | %(g) | |
| Net expenses | | | 0.75 | %(f) | | | 0.75 | %(f) | | | 0.75 | %(f) | | | 0.75 | %(f) | | | 0.75 | % | |
| Waiver/Reimbursement | | | 0.14 | % | | | 0.16 | % | | | 0.18 | % | | | 0.17 | % | | | 0.23 | % | |
| Net investment income | | | 3.79 | %(f) | | | 3.73 | %(f) | | | 3.80 | %(f) | | | 3.89 | %(f) | | | 3.83 | % | |
| Portfolio turnover rate | | | 20 | % | | | 25 | % | | | 17 | % | | | 16 | % | | | 6 | % | |
| Net assets, end of period (000's) | | $ | 23,236 | | | $ | 22,399 | | | $ | 18,705 | | | $ | 19,155 | | | $ | 19,082 | | |
(a) On August 22, 2005, the Fund's Investor A shares were renamed Class A shares.
(b) Per share data was calculated using the average shares outstanding during the period.
(c) Rounds to less than $0.01 per share.
(d) Total return at net asset value assuming all distributions reinvested and no initial sales charge or contingent deferred sales charge.
(e) Had the investment advisor and/or any of its affiliates not waived fees or reimbursed a portion of expenses, total return would have been reduced.
(f) The benefits derived from expense reductions had an impact of less than 0.01%.
(g) Rounds to less than 0.01%.
See Accompanying Notes to Financial Statements.
117
Financial Highlights – Columbia North Carolina Intermediate Municipal Bond Fund
Selected data for a share outstanding throughout each period is as follows:
| | | Year Ended March 31, | |
| Class B Shares | | 2009 | | 2008 | | 2007 | | 2006 (a) | | 2005 | |
| Net Asset Value, Beginning of Period | | $ | 10.08 | | | $ | 10.38 | | | $ | 10.39 | | | $ | 10.56 | | | $ | 10.87 | | |
| Income from Investment Operations: | |
| Net investment income (b) | | | 0.30 | | | | 0.31 | | | | 0.32 | | | | 0.33 | | | | 0.33 | | |
Net realized and unrealized gain (loss) on investments
and futures contracts | | | (0.29 | ) | | | (0.30 | ) | | | 0.04 | | | | (0.17 | ) | | | (0.31 | ) | |
| Total from investment operations | | | 0.01 | | | | 0.01 | | | | 0.36 | | | | 0.16 | | | | 0.02 | | |
| Less Distributions to Shareholders: | |
| From net investment income | | | (0.30 | ) | | | (0.31 | ) | | | (0.31 | ) | | | (0.33 | ) | | | (0.33 | ) | |
| From net realized gains | | | — | | | | — | (c) | | | (0.06 | ) | | | — | | | | — | | |
| Total distributions to shareholders | | | (0.30 | ) | | | (0.31 | ) | | | (0.37 | ) | | | (0.33 | ) | | | (0.33 | ) | |
| Net Asset Value, End of Period | | $ | 9.79 | | | $ | 10.08 | | | $ | 10.38 | | | $ | 10.39 | | | $ | 10.56 | | |
| Total return (d)(e) | | | 0.13 | % | | | 0.09 | % | | | 3.55 | % | | | 1.51 | % | | | 0.18 | % | |
| Ratios to Average Net Assets/Supplemental Data: | |
| Net expenses before interest expense | | | 1.50 | %(f) | | | 1.50 | %(f) | | | 1.50 | %(f) | | | 1.50 | %(f) | | | 1.50 | % | |
| Interest expense | | | — | | | | — | | | | — | | | | — | | | | — | %(g) | |
| Net expenses | | | 1.50 | %(f) | | | 1.50 | %(f) | | | 1.50 | %(f) | | | 1.50 | %(f) | | | 1.50 | % | |
| Waiver/Reimbursement | | | 0.14 | % | | | 0.16 | % | | | 0.18 | % | | | 0.17 | % | | | 0.23 | % | |
| Net investment income | | | 3.04 | %(f) | | | 2.99 | %(f) | | | 3.05 | %(f) | | | 3.14 | %(f) | | | 3.08 | % | |
| Portfolio turnover rate | | | 20 | % | | | 25 | % | | | 17 | % | | | 16 | % | | | 6 | % | |
| Net assets, end of period (000's) | | $ | 1,920 | | | $ | 2,668 | | | $ | 3,776 | | | $ | 4,478 | | | $ | 13,403 | | |
(a) On August 22, 2005, the Fund's Investor B shares were renamed Class B shares.
(b) Per share data was calculated using the average shares outstanding during the period.
(c) Rounds to less than $0.01 per share.
(d) Total return at net asset value assuming all distributions reinvested and no contingent deferred sales charge.
(e) Had the investment advisor and/or any of its affiliates not waived fees or reimbursed a portion of expenses, total return would have been reduced.
(f) The benefits derived from expense reductions had an impact of less than 0.01%.
(g) Rounds to less than 0.01%.
See Accompanying Notes to Financial Statements.
118
Financial Highlights – Columbia North Carolina Intermediate Municipal Bond Fund
Selected data for a share outstanding throughout each period is as follows:
| | | Year Ended March 31, | |
| Class C Shares | | 2009 | | 2008 | | 2007 | | 2006 (a) | | 2005 | |
| Net Asset Value, Beginning of Period | | $ | 10.08 | | | $ | 10.38 | | | $ | 10.40 | | | $ | 10.56 | | | $ | 10.87 | | |
| Income from Investment Operations: | |
| Net investment income (b) | | | 0.30 | | | | 0.31 | | | | 0.32 | | | | 0.33 | | | | 0.33 | | |
Net realized and unrealized gain (loss) on investments
and futures contracts | | | (0.29 | ) | | | (0.30 | ) | | | 0.03 | | | | (0.16 | ) | | | (0.31 | ) | |
| Total from investment operations | | | 0.01 | | | | 0.01 | | | | 0.35 | | | | 0.17 | | | | 0.02 | | |
| Less Distributions to Shareholders: | |
| From net investment income | | | (0.30 | ) | | | (0.31 | ) | | | (0.31 | ) | | | (0.33 | ) | | | (0.33 | ) | |
| From net realized gains | | | — | | | | — | (c) | | | (0.06 | ) | | | — | | | | — | | |
| Total distributions to shareholders | | | (0.30 | ) | | | (0.31 | ) | | | (0.37 | ) | | | (0.33 | ) | | | (0.33 | ) | |
| Net Asset Value, End of Period | | $ | 9.79 | | | $ | 10.08 | | | $ | 10.38 | | | $ | 10.40 | | | $ | 10.56 | | |
| Total return (d)(e) | | | 0.12 | % | | | 0.09 | % | | | 3.45 | % | | | 1.60 | % | | | 0.17 | % | |
| Ratios to Average Net Assets/Supplemental Data: | |
| Net expenses before interest expense | | | 1.50 | %(f) | | | 1.50 | %(f) | | | 1.50 | %(f) | | | 1.50 | %(f) | | | 1.50 | % | |
| Interest expense | | | — | | | | — | | | | — | | | | — | | | | — | %(g) | |
| Net expenses | | | 1.50 | %(f) | | | 1.50 | %(f) | | | 1.50 | %(f) | | | 1.50 | %(f) | | | 1.50 | % | |
| Waiver/Reimbursement | | | 0.14 | % | | | 0.16 | % | | | 0.18 | % | | | 0.17 | % | | | 0.23 | % | |
| Net investment income | | | 3.04 | %(f) | | | 2.99 | %(f) | | | 3.05 | %(f) | | | 3.14 | %(f) | | | 3.08 | % | |
| Portfolio turnover rate | | | 20 | % | | | 25 | % | | | 17 | % | | | 16 | % | | | 6 | % | |
| Net assets, end of period (000's) | | $ | 3,672 | | | $ | 3,108 | | | $ | 3,760 | | | $ | 4,650 | | | $ | 4,037 | | |
(a) On August 22, 2005, the Fund's Investor C shares were renamed Class C shares.
(b) Per share data was calculated using the average shares outstanding during the period.
(c) Rounds to less than $0.01 per share.
(d) Total return at net asset value assuming all distributions reinvested and no contingent deferred sales charge.
(e) Had the investment advisor and/or any of its affiliates not waived fees or reimbursed a portion of expenses, total return would have been reduced.
(f) The benefits derived from expense reductions had an impact of less than 0.01%.
(g) Rounds to less than 0.01%.
See Accompanying Notes to Financial Statements.
119
Financial Highlights – Columbia North Carolina Intermediate Municipal Bond Fund
Selected data for a share outstanding throughout each period is as follows:
| | | Year Ended March 31, | |
| Class Z Shares | | 2009 | | 2008 | | 2007 | | 2006 (a) | | 2005 | |
| Net Asset Value, Beginning of Period | | $ | 10.07 | | | $ | 10.38 | | | $ | 10.39 | | | $ | 10.56 | | | $ | 10.87 | | |
| Income from Investment Operations: | |
| Net investment income (b) | | | 0.40 | | | | 0.41 | | | | 0.42 | | | | 0.43 | | | | 0.43 | | |
Net realized and unrealized gain (loss) on investments
and futures contracts | | | (0.28 | ) | | | (0.31 | ) | | | 0.05 | | | | (0.16 | ) | | | (0.30 | ) | |
| Total from investment operations | | | 0.12 | | | | 0.10 | | | | 0.47 | | | | 0.27 | | | | 0.13 | | |
| Less Distributions to Shareholders: | |
| From net investment income | | | (0.40 | ) | | | (0.41 | ) | | | (0.42 | ) | | | (0.44 | ) | | | (0.44 | ) | |
| From net realized gains | | | — | | | | — | (c) | | | (0.06 | ) | | | — | | | | — | | |
| Total distributions to shareholders | | | (0.40 | ) | | | (0.41 | ) | | | (0.48 | ) | | | (0.44 | ) | | | (0.44 | ) | |
| Net Asset Value, End of Period | | $ | 9.79 | | | $ | 10.07 | | | $ | 10.38 | | | $ | 10.39 | | | $ | 10.56 | | |
| Total return (d)(e) | | | 1.22 | % | | | 0.99 | % | | | 4.59 | % | | | 2.53 | % | | | 1.19 | % | |
| Ratios to Average Net Assets/Supplemental Data: | |
| Net expenses before interest expense | | | 0.50 | %(f) | | | 0.50 | %(f) | | | 0.50 | %(f) | | | 0.50 | %(f) | | | 0.50 | % | |
| Interest expense | | | — | | | | — | | | | — | | | | — | | | | — | %(g) | |
| Net expenses | | | 0.50 | %(f) | | | 0.50 | %(f) | | | 0.50 | %(f) | | | 0.50 | %(f) | | | 0.50 | % | |
| Waiver/Reimbursement | | | 0.14 | % | | | 0.16 | % | | | 0.18 | % | | | 0.17 | % | | | 0.23 | % | |
| Net investment income | | | 4.03 | %(f) | | | 3.99 | %(f) | | | 4.05 | %(f) | | | 4.14 | %(f) | | | 4.08 | % | |
| Portfolio turnover rate | | | 20 | % | | | 25 | % | | | 17 | % | | | 16 | % | | | 6 | % | |
| Net assets, end of period (000's) | | $ | 163,885 | | | $ | 154,515 | | | $ | 155,432 | | | $ | 138,854 | | | $ | 150,588 | | |
(a) On August 22, 2005, the Fund's Primary A shares were renamed Class Z shares.
(b) Per share data was calculated using the average shares outstanding during the period.
(c) Rounds to less than $0.01 per share.
(d) Total return at net asset value assuming all distributions reinvested.
(e) Had the investment advisor and/or any of its affiliates not waived fees or reimbursed a portion of expenses, total return would have been reduced.
(f) The benefits derived from expense reductions had an impact of less than 0.01%.
(g) Rounds to less than 0.01%.
See Accompanying Notes to Financial Statements.
120
Financial Highlights – Columbia South Carolina Intermediate Municipal Bond Fund
Selected data for a share outstanding throughout each period is as follows:
| | | Year Ended March 31, | |
| Class A Shares | | 2009 | | 2008 | | 2007 | | 2006 (a) | | 2005 | |
| Net Asset Value, Beginning of Period | | $ | 10.01 | | | $ | 10.27 | | | $ | 10.25 | | | $ | 10.46 | | | $ | 10.79 | | |
| Income from Investment Operations: | |
| Net investment income (b) | | | 0.37 | | | | 0.39 | | | | 0.39 | | | | 0.43 | | | | 0.41 | | |
Net realized and unrealized gain (loss) on investments
and futures contracts | | | (0.17 | ) | | | (0.25 | ) | | | 0.06 | | | | (0.17 | ) | | | (0.29 | ) | |
| Total from investment operations | | | 0.20 | | | | 0.14 | | | | 0.45 | | | | 0.26 | | | | 0.12 | | |
| Less Distributions to Shareholders: | |
| From net investment income | | | (0.37 | ) | | | (0.38 | ) | | | (0.38 | ) | | | (0.40 | ) | | | (0.41 | ) | |
| From net realized gains | | | — | | | | (0.02 | ) | | | (0.05 | ) | | | (0.07 | ) | | | (0.04 | ) | |
| Total distributions to shareholders | | | (0.37 | ) | | | (0.40 | ) | | | (0.43 | ) | | | (0.47 | ) | | | (0.45 | ) | |
| Net Asset Value, End of Period | | $ | 9.84 | | | $ | 10.01 | | | $ | 10.27 | | | $ | 10.25 | | | $ | 10.46 | | |
| Total return (c)(d) | | | 2.09 | % | | | 1.39 | % | | | 4.50 | % | | | 2.46 | % | | | 1.11 | % | |
| Ratios to Average Net Assets/Supplemental Data: | |
| Net expenses before interest expense | | | 0.75 | %(e) | | | 0.75 | %(e) | | | 0.75 | %(e) | | | 0.75 | %(e) | | | 0.75 | % | |
| Interest expense | | | — | | | | — | | | | — | %(f) | | | — | %(f) | | | — | %(f) | |
| Net expenses | | | 0.75 | %(e) | | | 0.75 | %(e) | | | 0.75 | %(e) | | | 0.75 | %(e) | | | 0.75 | % | |
| Waiver/Reimbursement | | | 0.13 | % | | | 0.15 | % | | | 0.17 | % | | | 0.14 | % | | | 0.21 | % | |
| Net investment income | | | 3.76 | %(e) | | | 3.78 | %(e) | | | 3.77 | %(e) | | | 3.78 | %(e) | | | 3.80 | % | |
| Portfolio turnover rate | | | 21 | % | | | 13 | % | | | 15 | % | | | 11 | % | | | 9 | % | |
| Net assets, end of period (000's) | | $ | 23,865 | | | $ | 16,007 | | | $ | 17,443 | | | $ | 18,855 | | | $ | 23,303 | | |
(a) On August 22, 2005, the Fund's Investor A shares were renamed Class A shares.
(b) Per share data was calculated using the average shares outstanding during the period.
(c) Total return at net asset value assuming all distributions reinvested and no initial sales charge or contingent deferred sales charge.
(d) Had the investment advisor and/or any of its affiliates not waived fees or reimbursed a portion of expenses, total return would have been reduced.
(e) The benefits derived from expense reductions had an impact of less than 0.01%.
(f) Rounds to less than 0.01%.
See Accompanying Notes to Financial Statements.
121
Financial Highlights – Columbia South Carolina Intermediate Municipal Bond Fund
Selected data for a share outstanding throughout each period is as follows:
| | | Year Ended March 31, | |
| Class B Shares | | 2009 | | 2008 | | 2007 | | 2006 (a) | | 2005 | |
| Net Asset Value, Beginning of Period | | $ | 10.01 | | | $ | 10.27 | | | $ | 10.25 | | | $ | 10.46 | | | $ | 10.79 | | |
| Income from Investment Operations: | |
| Net investment income (b) | | | 0.30 | | | | 0.31 | | | | 0.31 | | | | 0.34 | | | | 0.33 | | |
Net realized and unrealized gain (loss) on investments
and futures contracts | | | (0.16 | ) | | | (0.24 | ) | | | 0.07 | | | | (0.16 | ) | | | (0.29 | ) | |
| Total from investment operations | | | 0.14 | | | | 0.07 | | | | 0.38 | | | | 0.18 | | | | 0.04 | | |
| Less Distributions to Shareholders: | |
| From net investment income | | | (0.30 | ) | | | (0.31 | ) | | | (0.31 | ) | | | (0.32 | ) | | | (0.33 | ) | |
| From net realized gains | | | — | | | | (0.02 | ) | | | (0.05 | ) | | | (0.07 | ) | | | (0.04 | ) | |
| Total distributions to shareholders | | | (0.30 | ) | | | (0.33 | ) | | | (0.36 | ) | | | (0.39 | ) | | | (0.37 | ) | |
| Net Asset Value, End of Period | | $ | 9.85 | | | $ | 10.01 | | | $ | 10.27 | | | $ | 10.25 | | | $ | 10.46 | | |
| Total return (c)(d) | | | 1.43 | % | | | 0.64 | % | | | 3.72 | % | | | 1.70 | % | | | 0.35 | % | |
| Ratios to Average Net Assets/Supplemental Data: | |
| Net expenses before interest expense | | | 1.50 | %(e) | | | 1.50 | %(e) | | | 1.50 | %(e) | | | 1.50 | %(e) | | | 1.50 | % | |
| Interest expense | | | — | | | | — | | | | — | %(f) | | | — | %(f) | | | — | %(f) | |
| Net expenses | | | 1.50 | %(e) | | | 1.50 | %(e) | | | 1.50 | %(e) | | | 1.50 | %(e) | | | 1.50 | % | |
| Waiver/Reimbursement | | | 0.13 | % | | | 0.15 | % | | | 0.17 | % | | | 0.14 | % | | | 0.22 | % | |
| Net investment income | | | 3.03 | %(e) | | | 3.03 | %(e) | | | 3.02 | %(e) | | | 3.03 | %(e) | | | 3.06 | % | |
| Portfolio turnover rate | | | 21 | % | | | 13 | % | | | 15 | % | | | 11 | % | | | 9 | % | |
| Net assets, end of period (000's) | | $ | 1,978 | | | $ | 2,268 | | | $ | 2,866 | | | $ | 4,135 | | | $ | 8,170 | | |
(a) On August 22, 2005, the Fund's Investor B shares were renamed Class B shares.
(b) Per share data was calculated using the average shares outstanding during the period.
(c) Total return at net asset value assuming all distributions reinvested and no contingent deferred sales charge.
(d) Had the investment advisor and/or any of its affiliates not waived fees or reimbursed a portion of expenses, total return would have been reduced.
(e) The benefits derived from expense reductions had an impact of less than 0.01%.
(f) Rounds to less than 0.01%.
See Accompanying Notes to Financial Statements.
122
Financial Highlights – Columbia South Carolina Intermediate Municipal Bond Fund
Selected data for a share outstanding throughout each period is as follows:
| | | Year Ended March 31, | |
| Class C Shares | | 2009 | | 2008 | | 2007 | | 2006 (a) | | 2005 | |
| Net Asset Value, Beginning of Period | | $ | 10.01 | | | $ | 10.28 | | | $ | 10.26 | | | $ | 10.47 | | | $ | 10.80 | | |
| Income from Investment Operations: | |
| Net investment income (b) | | | 0.30 | | | | 0.31 | | | | 0.31 | | | | 0.34 | | | | 0.33 | | |
Net realized and unrealized gain (loss) on investments
and futures contracts | | | (0.16 | ) | | | (0.26 | ) | | | 0.07 | | | | (0.16 | ) | | | (0.29 | ) | |
| Total from investment operations | | | 0.14 | | | | 0.05 | | | | 0.38 | | | | 0.18 | | | | 0.04 | | |
| Less Distributions to Shareholders: | |
| From net investment income | | | (0.30 | ) | | | (0.30 | ) | | | (0.31 | ) | | | (0.32 | ) | | | (0.33 | ) | |
| From net realized gains | | | — | | | | (0.02 | ) | | | (0.05 | ) | | | (0.07 | ) | | | (0.04 | ) | |
| Total distributions to shareholders | | | (0.30 | ) | | | (0.32 | ) | | | (0.36 | ) | | | (0.39 | ) | | | (0.37 | ) | |
| Net Asset Value, End of Period | | $ | 9.85 | | | $ | 10.01 | | | $ | 10.28 | | | $ | 10.26 | | | $ | 10.47 | | |
| Total return (c)(d) | | | 1.43 | % | | | 0.54 | % | | | 3.72 | % | | | 1.70 | % | | | 0.36 | % | |
| Ratios to Average Net Assets/Supplemental Data: | |
| Net expenses before interest expense | | | 1.50 | %(e) | | | 1.50 | %(e) | | | 1.50 | %(e) | | | 1.50 | %(e) | | | 1.50 | % | |
| Interest expense | | | — | | | | — | | | | — | %(f) | | | — | %(f) | | | — | %(f) | |
| Net expenses | | | 1.50 | %(e) | | | 1.50 | %(e) | | | 1.50 | %(e) | | | 1.50 | %(e) | | | 1.50 | % | |
| Waiver/Reimbursement | | | 0.13 | % | | | 0.15 | % | | | 0.17 | % | | | 0.14 | % | | | 0.22 | % | |
| Net investment income | | | 3.02 | %(e) | | | 3.03 | %(e) | | | 3.02 | %(e) | | | 3.03 | %(e) | | | 3.06 | % | |
| Portfolio turnover rate | | | 21 | % | | | 13 | % | | | 15 | % | | | 11 | % | | | 9 | % | |
| Net assets, end of period (000's) | | $ | 6,146 | | | $ | 5,697 | | | $ | 6,324 | | | $ | 7,060 | | | $ | 7,944 | | |
(a) On August 22, 2005, the Fund's Investor C shares were renamed Class C shares.
(b) Per share data was calculated using the average shares outstanding during the period.
(c) Total return at net asset value assuming all distributions reinvested and no contingent deferred sales charge.
(d) Had the investment advisor and/or any of its affiliates not waived fees or reimbursed a portion of expenses, total return would have been reduced.
(e) The benefits derived from expense reductions had an impact of less than 0.01%.
(f) Rounds to less than 0.01%.
See Accompanying Notes to Financial Statements.
123
Financial Highlights – Columbia South Carolina Intermediate Municipal Bond Fund
Selected data for a share outstanding throughout each period is as follows:
| | | Year Ended March 31, | |
| Class Z Shares | | 2009 | | 2008 | | 2007 | | 2006 (a) | | 2005 | |
| Net Asset Value, Beginning of Period | | $ | 10.01 | | | $ | 10.27 | | | $ | 10.25 | | | $ | 10.46 | | | $ | 10.79 | | |
| Income from Investment Operations: | |
| Net investment income (b) | | | 0.40 | | | | 0.41 | | | | 0.41 | | | | 0.46 | | | | 0.43 | | |
Net realized and unrealized gain (loss) on investments
and futures contracts | | | (0.17 | ) | | | (0.24 | ) | | | 0.07 | | | | (0.18 | ) | | | (0.29 | ) | |
| Total from investment operations | | | 0.23 | | | | 0.17 | | | | 0.48 | | | | 0.28 | | | | 0.14 | | |
| Less Distributions to Shareholders: | |
| From net investment income | | | (0.40 | ) | | | (0.41 | ) | | | (0.41 | ) | | | (0.42 | ) | | | (0.43 | ) | |
| From net realized gains | | | — | | | | (0.02 | ) | | | (0.05 | ) | | | (0.07 | ) | | | (0.04 | ) | |
| Total distributions to shareholders | | | (0.40 | ) | | | (0.43 | ) | | | (0.46 | ) | | | (0.49 | ) | | | (0.47 | ) | |
| Net Asset Value, End of Period | | $ | 9.84 | | | $ | 10.01 | | | $ | 10.27 | | | $ | 10.25 | | | $ | 10.46 | | |
| Total return (c)(d) | | | 2.34 | % | | | 1.65 | % | | | 4.76 | % | | | 2.71 | % | | | 1.36 | % | |
| Ratios to Average Net Assets/Supplemental Data: | |
| Net expenses before interest expense | | | 0.50 | %(e) | | | 0.50 | %(e) | | | 0.50 | %(e) | | | 0.50 | %(e) | | | 0.50 | % | |
| Interest expense | | | — | | | | — | | | | — | %(f) | | | — | %(f) | | | — | %(f) | |
| Net expenses | | | 0.50 | %(e) | | | 0.50 | %(e) | | | 0.50 | %(e) | | | 0.50 | %(e) | | | 0.50 | % | |
| Waiver/Reimbursement | | | 0.13 | % | | | 0.15 | % | | | 0.17 | % | | | 0.14 | % | | | 0.22 | % | |
| Net investment income | | | 4.03 | %(e) | | | 4.03 | %(e) | | | 4.01 | %(e) | | | 4.03 | %(e) | | | 4.05 | % | |
| Portfolio turnover rate | | | 21 | % | | | 13 | % | | | 15 | % | | | 11 | % | | | 9 | % | |
| Net assets, end of period (000's) | | $ | 172,604 | | | $ | 170,987 | | | $ | 157,399 | | | $ | 160,021 | | | $ | 178,468 | | |
(a) On August 22, 2005, the Fund's Primary A shares were renamed Class Z shares.
(b) Per share data was calculated using the average shares outstanding during the period.
(c) Total return at net asset value assuming all distributions reinvested.
(d) Had the investment advisor and/or any of its affiliates not waived fees or reimbursed a portion of expenses, total return would have been reduced.
(e) The benefits derived from expense reductions had an impact of less than 0.01%.
(f) Rounds to less than 0.01%.
See Accompanying Notes to Financial Statements.
124
Financial Highlights – Columbia Virginia Intermediate Municipal Bond Fund
Selected data for a share outstanding throughout each period is as follows:
| | | Year Ended March 31, | |
| Class A Shares | | 2009 | | 2008 | | 2007 | | 2006 (a) | | 2005 | |
| Net Asset Value, Beginning of Period | | $ | 10.65 | | | $ | 10.73 | | | $ | 10.67 | | | $ | 10.86 | | | $ | 11.21 | | |
| Income from Investment Operations: | |
| Net investment income (b) | | | 0.37 | | | | 0.38 | | | | 0.38 | | | | 0.38 | | | | 0.40 | | |
Net realized and unrealized gain (loss) on investments
and futures contracts | | | (0.08 | ) | | | (0.08 | ) | | | 0.11 | | | | (0.18 | ) | | | (0.33 | ) | |
| Total from investment operations | | | 0.29 | | | | 0.30 | | | | 0.49 | | | | 0.20 | | | | 0.07 | | |
| Less Distributions to Shareholders: | |
| From net investment income | | | (0.37 | ) | | | (0.38 | ) | | | (0.38 | ) | | | (0.38 | ) | | | (0.40 | ) | |
| From net realized gains | | | — | | | | — | (c) | | | (0.05 | ) | | | (0.01 | ) | | | (0.02 | ) | |
| Total distributions to shareholders | | | (0.37 | ) | | | (0.38 | ) | | | (0.43 | ) | | | (0.39 | ) | | | (0.42 | ) | |
| Net Asset Value, End of Period | | $ | 10.57 | | | $ | 10.65 | | | $ | 10.73 | | | $ | 10.67 | | | $ | 10.86 | | |
| Total return (d)(e) | | | 2.83 | % | | | 2.85 | % | | | 4.64 | % | | | 1.88 | % | | | 0.69 | % | |
| Ratios to Average Net Assets/Supplemental Data: | |
| Net expenses before interest expense | | | 0.75 | %(f) | | | 0.75 | %(f) | | | 0.75 | %(f) | | | 0.75 | %(f) | | | 0.75 | % | |
| Interest expense | | | — | | | | — | | | | — | %(g) | | | — | %(g) | | | — | %(g) | |
| Net expenses | | | 0.75 | %(f) | | | 0.75 | %(f) | | | 0.75 | %(f) | | | 0.75 | %(f) | | | 0.75 | % | |
| Waiver/Reimbursement | | | 0.11 | % | | | 0.12 | % | | | 0.13 | % | | | 0.12 | % | | | 0.19 | % | |
| Net investment income | | | 3.54 | %(f) | | | 3.51 | %(f) | | | 3.55 | %(f) | | | 3.54 | %(f) | | | 3.70 | % | |
| Portfolio turnover rate | | | 12 | % | | | 12 | % | | | 22 | % | | | 30 | % | | | 14 | % | |
| Net assets, end of period (000's) | | $ | 47,970 | | | $ | 48,158 | | | $ | 48,924 | | | $ | 53,054 | | | $ | 48,476 | | |
(a) On August 22, 2005, the Fund's Investor A shares were renamed Class A shares.
(b) Per share data was calculated using the average shares outstanding during the period.
(c) Rounds to less than $0.01 per share.
(d) Total return at net asset value assuming all distributions reinvested and no initial sales charge or contingent deferred sales charge.
(e) Had the investment advisor and/or any of its affiliates not waived fees or reimbursed a portion of expenses, total return would have been reduced.
(f) The benefits derived from expense reductions had an impact of less than 0.01%.
(g) Rounds to less than 0.01%.
See Accompanying Notes to Financial Statements.
125
Financial Highlights – Columbia Virginia Intermediate Municipal Bond Fund
Selected data for a share outstanding throughout each period is as follows:
| | | Year Ended March 31, | |
| Class B Shares | | 2009 | | 2008 | | 2007 | | 2006 (a) | | 2005 | |
| Net Asset Value, Beginning of Period | | $ | 10.65 | | | $ | 10.73 | | | $ | 10.67 | | | $ | 10.86 | | | $ | 11.22 | | |
| Income from Investment Operations: | |
| Net investment income (b) | | | 0.29 | | | | 0.30 | | | | 0.30 | | | | 0.30 | | | | 0.32 | | |
Net realized and unrealized gain (loss) on investments
and futures contracts | | | (0.08 | ) | | | (0.08 | ) | | | 0.11 | | | | (0.18 | ) | | | (0.34 | ) | |
| Total from investment operations | | | 0.21 | | | | 0.22 | | | | 0.41 | | | | 0.12 | | | | (0.02 | ) | |
| Less Distributions to Shareholders: | |
| From net investment income | | | (0.29 | ) | | | (0.30 | ) | | | (0.30 | ) | | | (0.30 | ) | | | (0.32 | ) | |
| From net realized gains | | | — | | | | — | (c) | | | (0.05 | ) | | | (0.01 | ) | | | (0.02 | ) | |
| Total distributions to shareholders | | | (0.29 | ) | | | (0.30 | ) | | | (0.35 | ) | | | (0.31 | ) | | | (0.34 | ) | |
| Net Asset Value, End of Period | | $ | 10.57 | | | $ | 10.65 | | | $ | 10.73 | | | $ | 10.67 | | | $ | 10.86 | | |
| Total return (d)(e) | | | 2.07 | % | | | 2.08 | % | | | 3.86 | % | | | 1.12 | % | | | (0.15 | )% | |
| Ratios to Average Net Assets/Supplemental Data: | |
| Net expenses before interest expense | | | 1.50 | %(f) | | | 1.50 | %(f) | | | 1.50 | %(f) | | | 1.50 | %(f) | | | 1.50 | % | |
| Interest expense | | | — | | | | — | | | | — | %(g) | | | — | %(g) | | | — | %(g) | |
| Net expenses | | | 1.50 | %(f) | | | 1.50 | %(f) | | | 1.50 | %(f) | | | 1.50 | %(f) | | | 1.50 | % | |
| Waiver/Reimbursement | | | 0.11 | % | | | 0.12 | % | | | 0.13 | % | | | 0.12 | % | | | 0.19 | % | |
| Net investment income | | | 2.80 | %(f) | | | 2.77 | %(f) | | | 2.80 | %(f) | | | 2.79 | %(f) | | | 2.95 | % | |
| Portfolio turnover rate | | | 12 | % | | | 12 | % | | | 22 | % | | | 30 | % | | | 14 | % | |
| Net assets, end of period (000's) | | $ | 2,220 | | | $ | 2,434 | | | $ | 3,119 | | | $ | 4,360 | | | $ | 13,563 | | |
(a) On August 22, 2005, the Fund's Investor B shares were renamed Class B shares.
(b) Per share data was calculated using the average shares outstanding during the period.
(c) Rounds to less than $0.01 per share.
(d) Total return at net asset value assuming all distributions reinvested and no contingent deferred sales charge.
(e) Had the investment advisor and/or any of its affiliates not waived fees or reimbursed a portion of expenses, total return would have been reduced.
(f) The benefits derived from expense reductions had an impact of less than 0.01%.
(g) Rounds to less than 0.01%.
See Accompanying Notes to Financial Statements.
126
Financial Highlights – Columbia Virginia Intermediate Municipal Bond Fund
Selected data for a share outstanding throughout each period is as follows:
| | | Year Ended March 31, | |
| Class C Shares | | 2009 | | 2008 | | 2007 | | 2006 (a) | | 2005 | |
| Net Asset Value, Beginning of Period | | $ | 10.65 | | | $ | 10.73 | | | $ | 10.67 | | | $ | 10.86 | | | $ | 11.21 | | |
| Income from Investment Operations: | |
| Net investment income (b) | | | 0.29 | | | | 0.30 | | | | 0.30 | | | | 0.30 | | | | 0.32 | | |
Net realized and unrealized gain (loss) on investments
and futures contracts | | | (0.08 | ) | | | (0.08 | ) | | | 0.11 | | | | (0.18 | ) | | | (0.33 | ) | |
| Total from investment operations | | | 0.21 | | | | 0.22 | | | | 0.41 | | | | 0.12 | | | | (0.01 | ) | |
| Less Distributions to Shareholders: | |
| From net investment income | | | (0.29 | ) | | | (0.30 | ) | | | (0.30 | ) | | | (0.30 | ) | | | (0.32 | ) | |
| From net realized gains | | | — | | | | — | (c) | | | (0.05 | ) | | | (0.01 | ) | | | (0.02 | ) | |
| Total distributions to shareholders | | | (0.29 | ) | | | (0.30 | ) | | | (0.35 | ) | | | (0.31 | ) | | | (0.34 | ) | |
| Net Asset Value, End of Period | | $ | 10.57 | | | $ | 10.65 | | | $ | 10.73 | | | $ | 10.67 | | | $ | 10.86 | | |
| Total return (d)(e) | | | 2.07 | % | | | 2.08 | % | | | 3.86 | % | | | 1.12 | % | | | (0.06 | )% | |
| Ratios to Average Net Assets/Supplemental Data: | |
| Net expenses before interest expense | | | 1.50 | %(f) | | | 1.50 | %(f) | | | 1.50 | %(f) | | | 1.50 | %(f) | | | 1.50 | % | |
| Interest expense | | | — | | | | — | | | | — | %(g) | | | — | %(g) | | | — | %(g) | |
| Net expenses | | | 1.50 | %(f) | | | 1.50 | %(f) | | | 1.50 | %(f) | | | 1.50 | %(f) | | | 1.50 | % | |
| Waiver/Reimbursement | | | 0.11 | % | | | 0.12 | % | | | 0.13 | % | | | 0.12 | % | | | 0.19 | % | |
| Net investment income | | | 2.79 | %(f) | | | 2.77 | %(f) | | | 2.80 | %(f) | | | 2.79 | %(f) | | | 2.95 | % | |
| Portfolio turnover rate | | | 12 | % | | | 12 | % | | | 22 | % | | | 30 | % | | | 14 | % | |
| Net assets, end of period (000's) | | $ | 1,898 | | | $ | 967 | | | $ | 1,340 | | | $ | 1,450 | | | $ | 1,860 | | |
(a) On August 22, 2005, the Fund's Investor C shares were renamed Class C shares.
(b) Per share data was calculated using the average shares outstanding during the period.
(c) Rounds to less than $0.01 per share.
(d) Total return at net asset value assuming all distributions reinvested and no contingent deferred sales charge.
(e) Had the investment advisor and/or any of its affiliates not waived fees or reimbursed a portion of expenses, total return would have been reduced.
(f) The benefits derived from expense reductions had an impact of less than 0.01%.
(g) Rounds to less than 0.01%.
See Accompanying Notes to Financial Statements.
127
Financial Highlights – Columbia Virginia Intermediate Municipal Bond Fund
Selected data for a share outstanding throughout each period is as follows:
| | | Year Ended March 31, | |
| Class Z Shares | | 2009 | | 2008 | | 2007 | | 2006 (a) | | 2005 | |
| Net Asset Value, Beginning of Period | | $ | 10.65 | | | $ | 10.73 | | | $ | 10.67 | | | $ | 10.86 | | | $ | 11.21 | | |
| Income from Investment Operations: | |
| Net investment income (b) | | | 0.40 | | | | 0.40 | | | | 0.41 | | | | 0.44 | | | | 0.43 | | |
Net realized and unrealized gain (loss) on investments
and futures contracts | | | (0.08 | ) | | | (0.07 | ) | | | 0.10 | | | | (0.21 | ) | | | (0.33 | ) | |
| Total from investment operations | | | 0.32 | | | | 0.33 | | | | 0.51 | | | | 0.23 | | | | 0.10 | | |
| Less Distributions to Shareholders: | |
| From net investment income | | | (0.40 | ) | | | (0.41 | ) | | | (0.40 | ) | | | (0.41 | ) | | | (0.43 | ) | |
| From net realized gains | | | — | | | | — | (c) | | | (0.05 | ) | | | (0.01 | ) | | | (0.02 | ) | |
| Total distributions to shareholders | | | (0.40 | ) | | | (0.41 | ) | | | (0.45 | ) | | | (0.42 | ) | | | (0.45 | ) | |
| Net Asset Value, End of Period | | $ | 10.57 | | | $ | 10.65 | | | $ | 10.73 | | | $ | 10.67 | | | $ | 10.86 | | |
| Total return (d)(e) | | | 3.09 | % | | | 3.10 | % | | | 4.90 | % | | | 2.13 | % | | | 0.94 | % | |
| Ratios to Average Net Assets/Supplemental Data: | |
| Net expenses before interest expense | | | 0.50 | %(f) | | | 0.50 | %(f) | | | 0.50 | %(f) | | | 0.50 | %(f) | | | 0.50 | % | |
| Interest expense | | | — | | | | — | | | | — | %(g) | | | — | %(g) | | | — | %(g) | |
| Net expenses | | | 0.50 | %(f) | | | 0.50 | %(f) | | | 0.50 | %(f) | | | 0.50 | %(f) | | | 0.50 | % | |
| Waiver/Reimbursement | | | 0.11 | % | | | 0.12 | % | | | 0.13 | % | | | 0.12 | % | | | 0.19 | % | |
| Net investment income | | | 3.80 | %(f) | | | 3.76 | %(f) | | | 3.80 | %(f) | | | 3.79 | %(f) | | | 3.94 | % | |
| Portfolio turnover rate | | | 12 | % | | | 12 | % | | | 22 | % | | | 30 | % | | | 14 | % | |
| Net assets, end of period (000's) | | $ | 267,576 | | | $ | 288,262 | | | $ | 273,728 | | | $ | 266,292 | | | $ | 282,024 | | |
(a) On August 22, 2005, the Fund's Primary A shares were renamed Class Z shares.
(b) Per share data was calculated using the average shares outstanding during the period.
(c) Rounds to less than $0.01 per share.
(d) Total return at net asset value assuming all distributions reinvested.
(e) Had the investment advisor and/or any of its affiliates not waived fees or reimbursed a portion of expenses, total return would have been reduced.
(f) The benefits derived from expense reductions had an impact of less than 0.01%.
(g) Rounds to less than 0.01%.
See Accompanying Notes to Financial Statements.
128
Notes to Financial Statements – Municipal Bond Funds
March 31, 2009
Note 1. Organization
Columbia Funds Series Trust (the "Trust") is a Delaware statutory trust registered under the Investment Company Act of 1940, as amended (the "1940 Act"), as an open-end management investment company. Information presented in these financial statements pertains to the following series of the Trust (each, a "Fund" and collectively, the "Funds"):
Columbia Short Term Municipal Bond Fund
Columbia California Intermediate Municipal Bond Fund
Columbia Georgia Intermediate Municipal Bond Fund
Columbia Maryland Intermediate Municipal Bond Fund
Columbia North Carolina Intermediate Municipal Bond Fund
Columbia South Carolina Intermediate Municipal Bond Fund
Columbia Virginia Intermediate Municipal Bond Fund
Columbia Maryland Intermediate Municipal Bond Fund is a non-diversified fund. Each of the remaining Funds operates as a diversified fund.
Investment Objectives
Columbia Short Term Municipal Bond Fund seeks current income exempt from federal income tax, consistent with minimal fluctuation of principal. Each of the Intermediate Municipal Bond Funds seeks current income exempt from federal income tax and the respective state individual income tax, consistent with moderate fluctuation of principal.
Fund Shares
The Trust may issue an unlimited number of shares, and each Fund offers four classes of shares: Class A, Class B, Class C and Class Z shares. Each share class has its own expense structure and sales charges, as applicable. Beginning on or about June 22, 2009, the Funds will no longer accept investment in Class B shares from new or existing investors in the Funds' Class B shares, except in connection with the reinvestment of any dividend and/or capital gain distributions in Class B shares of the Funds and exchanges by existing Class B shareholders of the other Columbia Funds.
Class A shares are subject to a maximum front-end sales charge of 1.00% for Columbia Short Term Municipal Bond Fund and 3.25% for the Intermediate Municipal Bond Funds, based on the amount of initial investment. Class A shares purchased without an initial sales charge in accounts aggregating between $1 million to $50 million at the time of purchase are subject to a 1.00% contingent deferred sales charge ("CDSC") if the shares are sold within one year after purchase. Class B shares of the Intermediate Municipal Bond Funds are subject to a maximum CDSC of 3.00% based upon the holding period after purchase. Class B shares of the Intermediate Municipal Bond Funds will convert to Class A shares eight years after purchase. Class C shares are subject to a 1.00% CDSC on shares sold within one year after purchase. Class Z shares are offered continuously at net asset value. There are certain restrictions on the purchase of Class Z shares, as described in each Fund's prospectus.
Note 2. Significant Accounting Policies
The preparation of financial statements in accordance with accounting principles generally accepted in the United States of America ("GAAP") requires management to make certain estimates and assumptions that affect the reported amounts of assets and liabilities, the disclosure of contingent assets and liabilities at the date of the financial statements and the reported amounts of revenue and expenses during the reporting period. Actual results could differ from those estimates. The following is a summary of significant accounting policies consistently followed by the Funds in the preparation of their financial statements.
Security Valuation
Debt securities generally are valued by pricing services approved by the Trust's Board of Trustees, based upon market transactions for normal, institutional-size trading units of similar securities. The services may use various pricing techniques which take into account appropriate factors such as yield, quality, coupon rate, maturity, type of issue, trading characteristics and other data, as well as broker quotes. Debt securities for which quotations are readily available are valued at an over-the-counter or exchange bid quotation.
Short-term investments maturing in 60 days or less are valued at amortized cost, which approximates market value.
Investments in other open-end investment companies are valued at net asset value.
Futures contracts are valued at the settlement price established each day by the board of trade or exchange on which they are traded.
Investments for which market quotations are not readily available, or that have quotations which management believes are not reliable, are valued at fair value as determined in good faith under consistently applied procedures established by and
129
Municipal Bond Funds, March 31, 2009 (continued)
under the general supervision of the Board of Trustees. If a security is valued at fair value, such value is likely to be different from the last quoted market price for the security. The determination of fair value often requires significant judgment. To determine fair value, management may use assumptions including but not limited to future cash flows and estimated risk premiums. Multiple inputs from various sources may be used to determine value.
Security Transactions
Security transactions are accounted for on the trade date. Cost is determined and gains (losses) are based upon the specific identification method for both financial statement and federal income tax purposes.
In March 2008, Statement of Financial Accounting Standards No. 161, Disclosures about Derivative Instruments and Hedging Activities—an amendment of FASB Statement No. 133 ("SFAS 161"), was issued. SFAS 161 is effective for fiscal years and interim periods beginning after November 15, 2008. SFAS 161 requires additional discussion about the reporting entity's derivative instruments and hedging activities, by providing for qualitative disclosures about the objectives and strategies for using derivatives, quantitative data about the fair value of and gains and losses on derivative contracts, and details of credit-risk-related contingent features in their derivative contracts. Management is evaluating the impact the application of SFAS 161 will have on the Funds' financial stateme nt disclosures.
Futures Contracts
The Funds may invest in futures contracts for both hedging and non-hedging purposes, including, for example, to seek to enhance returns or as a substitute for a position in an underlying asset.
The use of futures contracts involves certain risks, which include: (1) imperfect correlation between the price movement of the instruments and the underlying securities, (2) inability to close out positions due to differing trading hours, or the temporary absence of a liquid market, for either the instruments or the underlying securities, or (3) an inaccurate prediction of the future direction of interest rates by Columbia Management Advisors, LLC ("Columbia"), the Funds' investment advisor. Any of these risks may involve amounts exceeding the variation margin recorded in the Funds' Statements of Assets and Liabilities at any given time.
Upon entering into a futures contract, a Fund pledges cash or securities with the broker in an amount sufficient to meet the initial margin requirement. Subsequent payments are made or received by a Fund equal to the daily change in the contract value and are recorded as variation margin receivable or payable and offset in unrealized gains or losses. A Fund recognizes a realized gain or loss when the contract is closed or expires.
Delayed Delivery Securities
Each Fund may trade securities on other than normal settlement terms, including securities purchased or sold on a "when-issued" basis. This may increase the risk if the other party to the transaction fails to deliver and causes the Funds to subsequently invest at less advantageous prices. Each Fund holds until the settlement date, in a segregated account, cash or liquid securities in an amount equal to the delayed delivery commitment.
Income Recognition
Interest income is recorded on the accrual basis. Premium and discount are amortized and accreted, respectively, on all debt securities, unless otherwise noted. Dividend income is recorded on the ex-date.
Expenses
General expenses of the Trust are allocated to the Funds and other series of the Trust based upon relative net assets or other expense allocation methodologies determined by the nature of the expense. Expenses directly attributable to a Fund are charged to such Fund.
Determination of Class Net Asset Value
All income, expenses (other than class-specific expenses, as shown on the Statements of Operations) and realized and unrealized gains (losses) are allocated to each class of a Fund on a daily basis for purposes of determining the net asset value of each class. Income and expenses are allocated to each class based on the settled shares method, while realized and unrealized gains (losses) are allocated based on the relative net assets of each class.
Federal Income Tax Status
Each Fund intends to qualify each year as a "regulated investment company" under Subchapter M of the Internal Revenue Code, as amended, and will distribute substantially all of its tax-exempt or taxable income, if any, for its tax year,
130
Municipal Bond Funds, March 31, 2009 (continued)
and as such will not be subject to federal income taxes. In addition, each Fund intends to distribute in each calendar year substantially all of its net investment income, capital gains and certain other amounts, if any, such that each Fund should not be subject to federal excise tax. Therefore, no federal income or excise tax provision is recorded.
Distributions to Shareholders
Distributions from net investment income are declared daily and paid monthly. Net realized capital gains, if any, are distributed at least annually. Income distributions and capital gain distributions are determined in accordance with federal income tax regulations which may differ from GAAP.
Indemnification
In the normal course of business, each Fund enters into contracts that contain a variety of representations and warranties and which provide general indemnities. A Fund's maximum exposure under these arrangements is unknown because this would involve future claims against a Fund. Also, under the Trust's organizational documents and by contract, the Trustees and officers of the Trust are indemnified against certain liabilities that may arise out of actions relating to their duties to the Trust. However, based on experience, the Funds expect the risk of loss due to these representations, warranties and indemnities to be minimal.
Note 3. Federal Tax Information
The timing and character of income and capital gain distributions are determined in accordance with income tax regulations, which may differ from GAAP. Reclassifications are made to each Fund's capital accounts for permanent tax differences to reflect income and gains available for distribution (or available capital loss carryforwards) under income tax regulations.
For the year ended March 31, 2009, permanent book and tax differences resulting primarily from differing treatments for market discount reclassifications were identified and reclassified among the components of the Funds' net assets as follows:
| | | Undistributed/
(Overdistributed)
Net Investment
Income | | Accumulated
Net Realized
Gain/(Loss) | | Paid-In Capital | |
| Columbia Short Term Municipal Bond Fund | | $ | (541 | ) | | $ | 540 | | | $ | 1 | | |
| Columbia California Intermediate Municipal Bond Fund | | | — | | | | — | | | | — | | |
| Columbia Georgia Intermediate Municipal Bond Fund | | | (52,157 | ) | | | 52,157 | | | | — | | |
| Columbia Maryland Intermediate Municipal Bond Fund | | | (281 | ) | | | 279 | | | | 2 | | |
| Columbia North Carolina Intermediate Municipal Bond Fund | | | 38,730 | | | | (38,729 | ) | | | (1 | ) | |
| Columbia South Carolina Intermediate Municipal Bond Fund | | | (940 | ) | | | 942 | | | | (2 | ) | |
| Columbia Virginia Intermediate Municipal Bond Fund | | | (1,421 | ) | | | 1,422 | | | | (1 | ) | |
Net investment income and net realized gains (losses), as disclosed on the Statements of Operations, and net assets were not affected by these reclassifications.
131
Municipal Bond Funds, March 31, 2009 (continued)
The tax character of distributions paid during the years ended March 31, 2009 and March 31, 2008 was as follows:
| | | March 31, 2009 | |
| | | Tax-Exempt
Income | | Ordinary
Income* | |
| Columbia Short Term Municipal Bond Fund | | $ | 23,172,325 | | | $ | 68,602 | | |
| Columbia California Intermediate Municipal Bond Fund | | | 7,949,291 | | | | 20,957 | | |
| Columbia Georgia Intermediate Municipal Bond Fund | | | 4,874,897 | | | | 44,517 | | |
| Columbia Maryland Intermediate Municipal Bond Fund | | | 6,225,289 | | | | 67,236 | | |
| Columbia North Carolina Intermediate Municipal Bond Fund | | | 7,317,552 | | | | 65,135 | | |
| Columbia South Carolina Intermediate Municipal Bond Fund | | | 7,942,017 | | | | 304,440 | | |
| Columbia Virginia Intermediate Municipal Bond Fund | | | 12,368,344 | | | | 12,599 | | |
| | | March 31, 2008 | |
| | | Tax-Exempt
Income | | Ordinary
Income* | | Long-Term
Capital Gains | |
| Columbia Short Term Municipal Bond Fund | | $ | 13,555,974 | | | $ | 66,161 | | | $ | — | | |
| Columbia California Intermediate Municipal Bond Fund | | | 5,685,805 | | | | 21,505 | | | | — | | |
| Columbia Georgia Intermediate Municipal Bond Fund | | | 4,802,493 | | | | 25,460 | | | | — | | |
| Columbia Maryland Intermediate Municipal Bond Fund | | | 6,403,998 | | | | 122,846 | | | | — | | |
| Columbia North Carolina Intermediate Municipal Bond Fund | | | 7,017,718 | | | | 18,590 | | | | 41,957 | | |
| Columbia South Carolina Intermediate Municipal Bond Fund | | | 7,260,050 | | | | 32,909 | | | | 290,817 | | |
| Columbia Virginia Intermediate Municipal Bond Fund | | | 11,999,834 | | | | 212,734 | | | | 136,797 | | |
* For tax purposes short-term capital gain distributions, if any, are considered ordinary income distributions.
As of March 31, 2009, the components of distributable earnings on a tax basis were as follows:
| | | Undistributed
Tax-Exempt
Income | | Undistributed
Ordinary
Income | | Undistributed
Long-Term
Capital Gains | | Net Unrealized
Appreciation
(Depreciation)* | |
| Columbia Short Term Municipal Bond Fund | | $ | 2,056,039 | | | $ | — | | | $ | — | | | $ | 20,167,634 | | |
| Columbia California Intermediate Municipal Bond Fund | | | 509,930 | | | | — | | | | 141,523 | | | | (4,103,322 | ) | |
| Columbia Georgia Intermediate Municipal Bond Fund | | | 519,166 | | | | — | | | | — | | | | (1,427,186 | ) | |
| Columbia Maryland Intermediate Municipal Bond Fund | | | 391,997 | | | | — | | | | — | | | | (4,945,098 | ) | |
| Columbia North Carolina Intermediate Municipal Bond Fund | | | 1,096,996 | | | | — | | | | — | | | | (2,284,268 | ) | |
| Columbia South Carolina Intermediate Municipal Bond Fund | | | 1,491,659 | | | | — | | | | — | | | | (658,719 | ) | |
| Columbia Virginia Intermediate Municipal Bond Fund | | | 1,584,560 | | | | — | | | | — | | | | (162,618 | ) | |
* The differences between book-basis and tax-basis net unrealized appreciation/depreciation are primarily due to market discount accretion on debt securities.
132
Municipal Bond Funds, March 31, 2009 (continued)
Unrealized appreciation and depreciation at March 31, 2009, based on cost of investments for federal income tax purposes,
| | | Unrealized
Appreciation | | Unrealized
Depreciation | | Net
Unrealized
Appreciation
(Depreciation) | |
| Columbia Short Term Municipal Bond Fund | | $ | 21,224,307 | | | $ | (1,056,673 | ) | | $ | 20,167,634 | | |
| Columbia California Intermediate Municipal Bond Fund | | | 3,207,301 | | | | (7,310,623 | ) | | | (4,103,322 | ) | |
| Columbia Georgia Intermediate Municipal Bond Fund | | | 2,699,554 | | | | (4,126,740 | ) | | | (1,427,186 | ) | |
| Columbia Maryland Intermediate Municipal Bond Fund | | | 5,505,479 | | | | (10,450,577 | ) | | | (4,945,098 | ) | |
| Columbia North Carolina Intermediate Municipal Bond Fund | | | 5,022,246 | | | | (7,306,514 | ) | | | (2,284,268 | ) | |
| Columbia South Carolina Intermediate Municipal Bond Fund | | | 4,372,719 | | | | (5,031,438 | ) | | | (658,719 | ) | |
| Columbia Virginia Intermediate Municipal Bond Fund | | | 10,672,338 | | | | (10,834,956 | ) | | | (162,618 | ) | |
The following capital loss carryforwards, determined as of March 31, 2009, may be available to reduce taxable income arising from future net realized gains on investments, if any, to the extent permitted by the Internal Revenue Code:
| | | Year of Expiration | |
| | | 2011 | | 2012 | | 2013 | | 2014 | | 2015 | | 2016 | | 2017 | | Total | |
Columbia Short Term Municipal
Bond Fund | | $ | 190,655 | | | $ | 397,238 | | | $ | 2,170,497 | | | $ | 3,786,208 | | | $ | 3,090,745 | | | $ | 1,181,270 | | | $ | — | | | $ | 10,816,613 | | |
Columbia Georgia Intermediate
Municipal Bond Fund | | | 728,393 | | | | — | | | | — | | | | — | | | | — | | | | — | | | | — | | | | 728,393 | | |
Columbia Maryland Intermediate
Municipal Bond Fund | | | 421,787 | | | | — | | | | 828,332 | | | | 901,428 | | | | 271,557 | | | | — | | | | 511 | | | | 2,423,615 | | |
Columbia North Carolina Intermediate
Municipal Bond Fund | | | — | | | | — | | | | — | | | | — | | | | — | | | | — | | | | 1,059,085 | | | | 1,059,085 | | |
Columbia South Carolina Intermediate
Municipal Bond Fund | | | — | | | | — | | | | — | | | | — | | | | — | | | | 317,772 | | | | 952,549 | | | | 1,270,321 | | |
Columbia Virginia Intermediate
Municipal Bond Fund | | | — | | | | — | | | | — | | | | — | | | | — | | | | — | | | | 72,197 | | | | 72,197 | | |
Capital loss carryforwards utilized during the year ended March 31, 2009 were as follows:
| | | Capital Losses
Utilized | |
Columbia Short Term
Municipal Bond Fund | | |
$520,636 | | |
Columbia California Intermediate
Municipal Bond Fund | | | 222,639 | | |
Columbia Georgia Intermediate
Municipal Bond Fund | | |
226,333 | | |
Under current tax rules, certain capital losses realized after October 31 may be deferred and treated as occurring on the first day of the following fiscal year. As of March 31, 2009, post-October capital losses attributed to security transactions and deferred to April 1, 2009 were as follows:
| | | Capital Losses
Deferred | |
Columbia Georgia Intermediate
Municipal Bond Fund | | | $362,720 | | |
133
Municipal Bond Funds, March 31, 2009 (continued)
| | | Capital Losses
Deferred | |
Columbia North Carolina Intermediate
Municipal Bond Fund | | | 2,368,896 | | |
Columbia South Carolina Intermediate
Municipal Bond Fund | | | 1,545,520 | | |
Columbia Virginia Intermediate
Municipal Bond Fund | | | 340,835 | | |
Under Financial Accounting Standards Board ("FASB") Interpretation No. 48, Accounting for Uncertainty in Income Taxes—an Interpretation of FASB Statement No. 109 ("FIN 48"), management determines whether a tax position of the Funds is more likely than not to be sustained upon examination by the applicable taxing authority, including resolution of any related appeals or litigation processes, based on the technical merits of the position. The tax benefit to be recognized is measured as the largest amount of benefit that is greater than fifty percent likely of being realized upon ultimate settlement. Management has evaluated the known implications of FIN 48 on its computation of net assets for each Fund. As a result of this evaluation, management has concluded that FIN 48 did no t have any effect on the Funds' financial statements. However, management's conclusions regarding FIN 48 may be subject to review and adjustment at a later date based on factors including, but not limited to, further implementation guidance from the FASB, new tax laws, regulations, and administrative interpretations (including relevant court decisions). The Funds' federal tax returns for the prior three fiscal years remain subject to examination by the Internal Revenue Service. The Funds are not aware of any tax positions for which it is reasonably possible that the total amounts of unrecognized tax benefits will significantly change in the next twelve months.
Note 4. Fees and Compensation Paid to Affiliates
Investment Advisory Fee
Columbia, an indirect, wholly owned subsidiary of Bank of America Corporation ("BOA"), provides investment advisory services to the Funds. Columbia receives a monthly investment advisory fee, based on each Fund's average daily net assets at the following annual rates:
| | | Fees on Average Net Assets | |
| | | First
$500
Million | | $500 Million
to $1
Billion | | $1 Billion
to $1.5
Billion | | $1.5 Billion
to $3
Billion | | $3 Billion
to $6
Billion | | Over
$6 Billion | |
All Funds (except Columbia Short Term
Municipal Bond Fund) | | | 0.40 | % | | | 0.35 | % | | | 0.32 | % | | | 0.29 | % | | | 0.28 | % | | | 0.27 | % | |
Columbia Short Term Municipal
Bond Fund | | | 0.30 | % | | | 0.25 | % | | | 0.25 | % | | | 0.25 | % | | | 0.25 | % | | | 0.25 | % | |
For the year ended March 31, 2009, the effective investment advisory fee rates for the Funds, as a percentage of each Fund's average daily net assets, were as follows:
| | | Effective
Fee Rate | |
| Columbia Short Term Municipal Bond Fund | | | 0.28 | % | |
Columbia California Intermediate Municipal
Bond Fund | | | 0.40 | % | |
Columbia Georgia Intermediate Municipal
Bond Fund | | | 0.40 | % | |
| | | Effective
Fee Rate | |
Columbia Maryland Intermediate Municipal
Bond Fund | | | 0.40 | % | |
Columbia North Carolina Intermediate
Municipal Bond Fund | | | 0.40 | % | |
Columbia South Carolina Intermediate
Municipal Bond Fund | | | 0.40 | % | |
Columbia Virginia Intermediate Municipal
Bond Fund | | | 0.40 | % | |
134
Municipal Bond Funds, March 31, 2009 (continued)
Administration Fee
Columbia provides administrative and other services to the Funds. Under the administration agreement, Columbia is entitled to receive an administration fee from each Fund, computed daily and paid monthly, at the annual rate of 0.15% of each Fund's average daily net assets less the fees payable by the Funds as described under the Pricing and Bookkeeping Fees note below.
Pricing and Bookkeeping Fees
The Funds have entered into a Financial Reporting Services Agreement (the "Financial Reporting Services Agreement") with State Street Bank & Trust Company ("State Street") and Columbia pursuant to which State Street provides financial reporting services to the Funds. The Funds have also entered into an Accounting Services Agreement (collectively with the Financial Reporting Services Agreement, the "State Street Agreements") with State Street and Columbia pursuant to which State Street provides accounting services to the Funds. Under the State Street Agreements, each Fund pays State Street an annual fee of $38,000 paid monthly plus an additional monthly fee based on an annualized percentage rate of average daily net assets of each Fund for the month. The aggregate fee per Fund will not exceed $140,000 per year (exclusive of out-of-pocket expenses and charges). The Funds also reimburse State Street for certain out-of-pocket ex penses and charges.
The Funds have entered into a Pricing and Bookkeeping Oversight and Services Agreement (the "Services Agreement") with Columbia. Under the Services Agreement, Columbia provides services related to Fund expenses and the requirements of the Sarbanes-Oxley Act of 2002, and provides oversight of the accounting and financial reporting services provided by State Street. Under the Services Agreement, the Funds reimburse Columbia for out-of-pocket expenses.
Transfer Agent Fee
Columbia Management Services, Inc. (the "Transfer Agent"), an affiliate of Columbia and an indirect, wholly owned subsidiary of BOA, provides shareholder services to the Funds and has contracted with Boston Financial Data Services ("BFDS") to serve as sub-transfer agent. The Transfer Agent is entitled to receive a fee for its services, paid monthly, at the annual rate of $17.34 per open account plus reimbursement of certain sub-transfer agent fees paid by the Transfer Agent (exclusive of BFDS fees), calculated based on assets held in omnibus accounts and intended to recover the cost of payments to other parties (including affiliates of BOA) for services to those accounts. The Transfer Agent pays the fees of BFDS for services as sub-transfer agent and is not entitled to reimbursement for such fees from the Funds.
The Transfer Agent may also retain, as additional compensation for its services, fees for wire, telephone and redemption orders, Individual Retirement Account ("IRA") trustee agent fees and account transcript fees due to the Transfer Agent from shareholders of the Funds and credits (net of bank charges) earned with respect to balances in accounts the Transfer Agent maintains in connection with its services to the Funds. The Transfer Agent also receives reimbursement for certain out-of-pocket expenses.
An annual minimum account balance fee of $20 may apply to certain accounts with a value below each Fund's initial minimum investment requirements to reduce the impact of small accounts on transfer agent fees. These minimum account balance fees are recorded as part of expense reductions on the Statements of Operations. For the year ended March 31, 2009, these minimum account balance fees reduced total expenses of the Funds as follows:
| | | Account
Balance
Fee
Reductions | |
| Columbia Short Term Municipal Bond Fund | | $ | 100 | | |
Columbia California Intermediate Municipal
Bond Fund | | | 60 | | |
Columbia Georgia Intermediate Municipal
Bond Fund | | | — | | |
Columbia Maryland Intermediate Municipal
Bond Fund | | | 60 | | |
Columbia North Carolina Intermediate
Municipal Bond Fund | | | 80 | | |
Columbia South Carolina Intermediate
Municipal Bond Fund | | | 60 | | |
Columbia Virginia Intermediate Municipal
Bond Fund | | | 111 | | |
135
Municipal Bond Funds, March 31, 2009 (continued)
Underwriting Discounts, Service and Distribution Fees
Columbia Management Distributors, Inc. (the "Distributor"), an affiliate of Columbia and an indirect, wholly owned subsidiary of BOA, is the principal underwriter of the Funds' shares. For the year ended March 31, 2009, the Distributor has retained net underwriting discounts on the sale of Class A shares and received net CDSC fees on Class A, Class B and Class C share redemptions as follows:
| | | Front End Sales Charge | | CDSC | |
| | | Class A | | Class A | | Class B | | Class C | |
| Columbia Short Term Municipal Bond Fund | | $ | 39,571 | | | $ | 16,749 | | | $ | — | | | $ | 4,996 | | |
| Columbia California Intermediate Municipal Bond Fund | | | 1,671 | | | | 19,645 | | | | 1,377 | | | | 406 | | |
| Columbia Georgia Intermediate Municipal Bond Fund | | | 454 | | | | — | | | | — | | | | — | | |
| Columbia Maryland Intermediate Municipal Bond Fund | | | 3,179 | | | | — | | | | 283 | | | | — | | |
| Columbia North Carolina Intermediate Municipal Bond Fund | | | 2,397 | | | | 140 | | | | 229 | | | | — | | |
| Columbia South Carolina Intermediate Municipal Bond Fund | | | 7,258 | | | | — | | | | — | | | | 141 | | |
| Columbia Virginia Intermediate Municipal Bond Fund | | | 2,300 | | | | — | | | | 97 | | | | 947 | | |
The Trust has adopted shareholder servicing plans and distribution plans for the Class B and Class C shares of each Fund and a combined distribution and shareholder servicing plan for Class A shares of each Fund. The shareholder servicing plans permit the Funds to compensate or reimburse servicing agents for the shareholder services they have provided. The distribution plans, adopted pursuant to Rule 12b-1 under the 1940 Act, permit the Funds to compensate or reimburse the Distributor and/or selling agents for activities or expenses primarily intended to result in the sale of the classes' shares. Payments are made at an annual rate and paid monthly, as a percentage of average daily net assets, set from time to time by the Board of Trustees, and are charged as expenses of each Fund directly to the applicable share class. A substantial portion of the expenses incurred pursuant to these plans is paid to affiliates of BOA and the Di stributor.
The annual rates in effect and plan limits, as a percentage of average daily net assets are as follows:
| | | Current
Rate | | Plan
Limit | |
Class A Combined Distribution
and Shareholder Servicing Plans | | | 0.25 | % | | | 0.25 | % | |
Class B and Class C
Shareholder Servicing Plans | | | 0.25 | % | | | 0.25 | % | |
Class B and Class C
Distribution Plans | | | 0.75 | % | | | 0.75 | % | |
Fee Waivers and Expense Reimbursements
Columbia has contractually agreed to bear a portion of the Funds' expenses through July 31, 2009, so that ordinary operating expenses (excluding any distribution and service fees, brokerage commissions, interest, taxes and extraordinary expenses, but including custodial charges relating to overdrafts, if any), after giving effect to any balance credits from the Funds' custodian, do not exceed the following annual rates, based on each Fund's average daily net assets:
| | | Annual Rate | |
Columbia Short Term Municipal
Bond Fund | | | 0.40 | % | |
Columbia California Intermediate
Municipal Bond Fund | | | 0.50 | % | |
Columbia Georgia Intermediate
Municipal Bond Fund | | | 0.50 | % | |
Columbia Maryland Intermediate
Municipal Bond Fund | | | 0.50 | % | |
Columbia North Carolina Intermediate
Municipal Bond Fund | | | 0.50 | % | |
Columbia South Carolina Intermediate
Municipal Bond Fund | | | 0.50 | % | |
Columbia Virginia Intermediate
Municipal Bond Fund | | | 0.50 | % | |
136
Municipal Bond Funds, March 31, 2009 (continued)
There is no guarantee that these expense limitations will continue after July 31, 2009. Columbia and/or the Distributor are entitled to recover from the Funds any fees waived and/or expenses reimbursed for a three year period following the date of such fee waiver and/or reimbursement under this arrangement if such recovery does not cause the Funds' expenses to exceed the expense limitations in effect at the time of recovery.
At March 31, 2009, the amounts potentially recoverable pursuant to this arrangement are as follows:
| | | Amount of potential recovery expiring
March 31, | | Total
potential | | Amount
recovered
during the
year ended | |
| | | 2012 | | 2011 | | 2010 | | recovery | | 3/31/09 | |
Columbia Short Term
Municipal Bond Fund | | | $602,386 | | | | $470,889 | | | | $554,470 | | | | $1,627,745 | | | | $— | | |
Columbia California Intermediate
Municipal Bond Fund | | | 299,298 | | | | 245,824 | | | | 269,630 | | | | 814,752 | | | | — | | |
Columbia Georgia Intermediate
Municipal Bond Fund | | | 212,433 | | | | 246,888 | | | | 251,480 | | | | 710,801 | | | | — | | |
Columbia Maryland Intermediate
Municipal Bond Fund | | | 239,429 | | | | 267,402 | | | | 292,639 | | | | 799,470 | | | | — | | |
Columbia North Carolina Intermediate
Municipal Bond Fund | | | 259,156 | | | | 293,196 | | | | 305,301 | | | | 857,653 | | | | — | | |
Columbia South Carolina Intermediate
Municipal Bond Fund | | | 267,234 | | | | 273,304 | | | | 316,287 | | | | 856,825 | | | | — | | |
Columbia Virginia Intermediate
Municipal Bond Fund | | | 367,033 | | | | 386,045 | | | | 429,520 | | | | 1,182,598 | | | | — | | |
Fees Paid to Officers and Trustees
All officers of the Funds are employees of Columbia or its affiliates and, with the exception of the Funds' Chief Compliance Officer, receive no compensation from the Funds. The Board of Trustees has appointed a Chief Compliance Officer to the Funds in accordance with federal securities regulations. The Funds, along with other affiliated funds, pay their pro-rata share of the expenses associated with the Chief Compliance Officer. Each Fund's expenses for the Chief Compliance Officer will not exceed $15,000 per year.
The Trust's eligible Trustees may participate in a non-qualified deferred compensation plan which may be terminated at any time. Any payments to plan participants are paid solely out of the Funds' assets. Income earned on the plan participant's deferral account is based on the rate of return of the eligible mutual funds selected by the participant or, if no funds are selected, on the rate of return of Columbia Treasury Reserves, another portfolio of the Trust. The expense for the deferred compensation plan, which includes trustees' fees deferred during the current period as well as any gains or losses on the trustees' deferred compensation balances as a result of market fluctuations, is included in "Trustees' fees" on the Statements of Operations. The liability for the deferred compensation plan is included in "Trustees' fees" on the Statements of Assets and Liabilities.
Other
Certain Funds have made investments of cash balances in Columbia Tax-Exempt Reserves and/or Columbia California Tax-Exempt Reserves, other portfolios of the Trust, pursuant to an exemptive order received from, and to a rule adopted by, the Securities and Exchange Commission. The income earned by each Fund from such investments is included as "Dividends from affiliates" on the Statements of Operations. Columbia earned advisory and administration fees on the investments made in Columbia Tax-Exempt Reserves and Columbia California Tax-Exempt Reserves, in addition to the advisory
137
Municipal Bond Funds, March 31, 2009 (continued)
and administration fees earned by Columbia from the Funds. For the year ended March 31, 2009, Columbia earned the following fees related to investments in affiliated funds:
| | | Advisory
Fees (earned
by Columbia) | | Administration
Fees (earned
by Columbia) | |
Columbia Short Term
Municipal Bond Fund | | | $46,457 | | | | $12,021 | | |
Columbia California
Intermediate Municipal
Bond Fund | | | 15,405 | | | | 4,022 | | |
Columbia Georgia
Intermediate Municipal
Bond Fund | | | 8,535 | | | | 2,208 | | |
Columbia Maryland
Intermediate Municipal
Bond Fund | | | 10,989 | | | | 2,925 | | |
Columbia North Carolina
Intermediate Municipal
Bond Fund | | | 14,406 | | | | 3,754 | | |
Columbia South Carolina
Intermediate Municipal
Bond Fund | | | 14,216 | | | | 3,742 | | |
Columbia Virginia
Intermediate Municipal
Bond Fund | | | 15,307 | | | | 4,001 | | |
Note 5. Custody Credits
Each Fund has an agreement with its custodian bank under which custody fees may be reduced by balance credits. These credits are recorded as part of expense reductions on the Statements of Operations. The Funds could have invested a portion of the assets utilized in connection with the expense offset arrangement in an income-producing asset if they had not entered into such an agreement.
For the year ended March 31, 2009, these custody credits reduced total expenses for the Funds as follows:
| | | Custody
Credits | |
| Columbia Short Term Municipal Bond Fund | | $ | 4,647 | | |
Columbia California Intermediate Municipal
Bond Fund | | | 16 | | |
Columbia Georgia Intermediate Municipal
Bond Fund | | | 2 | | |
Columbia Maryland Intermediate Municipal
Bond Fund | | | 12 | | |
Columbia North Carolina Intermediate
Municipal Bond Fund | | | 17 | | |
Columbia South Carolina Intermediate
Municipal Bond Fund | | | 145 | | |
Columbia Virginia Intermediate Municipal
Bond Fund | | | 76 | | |
Note 6. Portfolio Information
For the year ended March 31, 2009, the aggregate cost of purchases and proceeds from sales of securities, excluding short-term obligations, for the Funds were as follows:
| | | Purchases | | Sales | |
Columbia Short Term
Municipal Bond Fund | | | $1,445,677,421 | | | $ | 747,375,806 | | |
Columbia California
Intermediate Municipal
Bond Fund | | | 46,358,147 | | | | 41,374,490 | | |
Columbia Georgia
Intermediate Municipal
Bond Fund | | | 27,849,631 | | | | 26,118,087 | | |
Columbia Maryland
Intermediate Municipal
Bond Fund | | | 17,260,263 | | | | 19,890,709 | | |
Columbia North Carolina
Intermediate Municipal
Bond Fund | | | 39,759,854 | | | | 34,239,156 | | |
138
Municipal Bond Funds, March 31, 2009 (continued)
| | | Purchases | | Sales | |
Columbia South Carolina
Intermediate Municipal
Bond Fund | | $ | 49,422,339 | | | $ | 41,680,543 | | |
Columbia Virginia
Intermediate Municipal
Bond Fund | | |
38,543,339 | | | |
47,483,215 | | |
Note 7. Line of Credit
The Trust and other affiliated funds participate in a $280,000,000 committed, unsecured revolving line of credit provided by State Street. The maximum amount that may be borrowed by any fund is limited to the lesser of $200,000,000 and the Fund's borrowing limit set forth in the Fund's registration statement. Borrowings are available for short-term liquidity or temporary or emergency purposes.
Interest is charged to each participating fund based on the fund's borrowings at a rate per annum equal to the greater of the Federal Funds Rate plus 0.50% or the overnight LIBOR Rate plus 0.50%. In addition, an annual operations agency fee of $20,000, an amendment fee of 0.02% and a commitment fee of 0.12% per annum are accrued and apportioned among the participating funds pro rata based on their relative net assets. Prior to October 16, 2008, the Funds and other affiliated funds participated in a $350,000,000 committed, unsecured revolving line of credit and a $150,000,000 uncommitted, unsecured line of credit, both provided by State Street. Interest on the committed line of credit was charged to each participating fund based on the fund's borrowings at a rate per annum equal to the Federal Funds Rate plus 0.50%. In addition, a commitment fee of 0.10% per annum was accrued and apportioned among the participating funds pro rata based on their relative net assets. Interest on the uncommitted line of credit was charged to each participating fund based on the fund's borrowings at a rate per annum equal to the Federal Funds Rate plus 0.375%. State Street charged an annual operations agency fee of $40,000 for the committed line of credit and was able to charge an annual administration fee of $15,000 for the uncommitted line of credit. The commitment fee, the operations agency fee and the administration fee were accrued and apportioned among the participating funds pro rata based on their relative net assets.
For the year ended March 31, 2009, Columbia Short Term Municipal Bond Fund borrowed under these arrangements. The average daily loan balance outstanding on days where borrowing existed was $15,333,333 at a weighted average interest rate of 1.55%, respectively.
Note 8. Shares of Beneficial Interest
As of March 31, 2009, the Funds had shareholders whose shares were beneficially owned by participant accounts over which BOA and/or any of its affiliates had either sole or joint investment discretion. The percentages of shares of beneficial interest outstanding held therein are as follows:
| | | % of Shares
Outstanding | |
Columbia Short Term
Municipal Bond Fund | | | 73.5 | | |
Columbia California Intermediate
Municipal Bond Fund | | | 84.3 | | |
Columbia Georgia Intermediate
Municipal Bond Fund | | | 83.9 | | |
Columbia Maryland Intermediate
Municipal Bond Fund | | | 79.4 | | |
Columbia North Carolina
Intermediate Municipal Bond Fund | | | 81.2 | | |
Columbia South Carolina
Intermediate Municipal Bond Fund | | | 81.7 | | |
Columbia Virginia Intermediate
Municipal Bond Fund | | | 81.9 | | |
As of March 31, 2009, the Funds had shareholders that held greater than 5% of the shares outstanding of a Fund, over which BOA and/or any of its affiliates did not have investment discretion. The number of accounts and the percentages of shares of beneficial interest outstanding held therein are as follows:
| | | Number of
Shareholders | | % of Shares
Outstanding | |
Columbia California Intermediate
Municipal Bond Fund | | | 1 | | | | 5.2 | | |
139
Municipal Bond Funds, March 31, 2009 (continued)
Subscription and redemption activity of this account may have a significant effect on the operations of the Fund.
Note 9. Significant Risks and Contingencies
Concentration of Credit Risk
Each of the Funds holds investments that are insured by private insurers who guarantee the payment of principal and interest in the event of default or that are supported by a letter of credit. At March 31, 2009, private insurers who insured greater than 5% of the total net assets of the Funds were as follows:
Columbia Short Term Municipal Bond Fund
| Insurer | | % of Total
Net Assets | |
| MBIA Insurance Corp. | | | 6.5 | | |
| Ambac Assurance Corp. | | | 6.4 | | |
| Financial Security Assurance, Inc. | | | 6.4 | | |
Columbia California Intermediate Municipal Bond Fund
| Insurer | | % of Total
Net Assets | |
| Financial Security Assurance, Inc. | | | 16.5 | | |
| Ambac Assurance Corp. | | | 15.8 | | |
| Financial Guaranty Insurance Co. | | | 13.7 | | |
| MBIA Insurance Corp. | | | 10.5 | | |
Columbia Georgia Intermediate Municipal Bond Fund
| Insurer | | % of Total
Net Assets | |
| Financial Security Assurance, Inc. | | | 23.0 | | |
| MBIA Insurance Corp. | | | 19.3 | | |
| Ambac Assurance Corp. | | | 8.5 | | |
Columbia Maryland Intermediate Municipal Bond Fund
| Insurer | | % of Total
Net Assets | |
| Financial Guaranty Insurance Co. | | | 11.9 | | |
| Financial Security Assurance, Inc. | | | 7.5 | | |
| Ambac Assurance Corp. | | | 7.2 | | |
| MBIA Insurance Corp. | | | 5.4 | | |
Columbia South Carolina Intermediate Municipal Bond Fund
| Insurer | | % of Total
Net Assets | |
| Financial Security Assurance, Inc. | | | 24.3 | | |
| MBIA Insurance Corp. | | | 9.6 | | |
| Ambac Assurance Corp. | | | 8.5 | | |
| Assured Guaranty Corp. | | | 6.3 | | |
Columbia Virginia Intermediate Municipal Bond Fund
| Insurer | | % of Total
Net Assets | |
| MBIA Insurance Corp. | | | 18.7 | | |
| Financial Security Assurance, Inc. | | | 12.8 | | |
At May 5, 2009, MBIA Insurance Corp., Financial Guaranty Insurance Co., Ambac Assurance Corp., Financial Security Assurance, Inc. and Assured Guaranty Corp. were rated by Standard & Poors AA-, Non Rated, A, AAA and AAA, respectively.
Sector Focus Risk
Certain Funds may focus their investments in certain sectors, subjecting them to greater risk than a fund that is less focused.
Non-Diversified Risk
Columbia Maryland Intermediate Municipal Bond Fund is a non-diversified fund, which generally means that it may invest a greater percentage of its total assets in the securities of fewer issuers than a "diversified" fund. This increases the risk that a change in the value of any one investment held by the Fund could affect the overall value of the Fund more than it would affect that of a diversified fund holding a greater
140
Municipal Bond Funds, March 31, 2009 (continued)
number of investments. Accordingly, the Fund's value will likely be more volatile than the value of more diversified funds. The Fund may not operate as a non-diversified fund at all times.
Geographic Concentration Risk
A Fund's municipal holdings may include obligations of issuers that rely in whole or in part for payment of interest and principal on state specific revenues, real property taxes, revenues from particular institutions, such as healthcare institutions, or obligations secured by mortgages on real property. Consequently, the impact of changes in state law or regulations or the economic conditions in a particular state should be considered. The ability of issuers of debt securities held by the Funds to meet their obligations may be affected by economic developments in a specific industry or region.
Tax Development Risk
Each Fund purchases municipal securities whose interest, in the opinion of bond counsel, is free from federal income tax. There is no assurance that the Internal Revenue Service (IRS) will agree with this opinion. In the event the IRS determines that an issuer does not comply with relevant tax requirements, interest payments from a security could become federally taxable, possibly retroactively to the date the security was issued. As a shareholder of the Fund, you may be required to file an amended tax return as a result.
Legal Proceedings
Columbia Management Advisors, LLC and Columbia Management Distributors, Inc. (collectively, the "Columbia Group") are subject to a settlement agreement with the New York Attorney General ("NYAG") (the "NYAG Settlement") and a settlement order with the SEC (the "SEC Order") on matters relating to mutual fund trading, each dated February 9, 2005. Under the terms of the SEC Order, the Columbia Group (or predecessor entities) agreed, among other things, to: pay disgorgement and civil money penalties collectively totaling $375 million; cease and desist from violations of the antifraud provisions and certain other provisions of the federal securities laws; maintain certain compliance and ethics oversight structures; and retain an independent consultant to review the Columbia Group's applicable supervisory, compliance, control and other policies and procedures. The NYAG Settlement, among other things, requires Columbia Management Advis ors, LLC and its affiliates to reduce management fees for certain funds in the Columbia family of mutual funds in a projected total of $160 million over five years through November 30, 2009 and to make certain disclosures to investors relating to expenses. In connection with the Columbia Group providing services to the Columbia Funds, the Columbia Funds have voluntarily undertaken to implement certain governance measures designed to maintain the independence of their boards of trustees and certain special consulting and compliance measures.
Pursuant to the SEC Order and related procedures, the $375 million in settlement amounts described above, of which approximately $90 million has been earmarked for certain Columbia Funds and their shareholders, is being distributed in accordance with a distribution plan developed by an independent distribution consultant and approved by the SEC on December 27, 2007. Distributions under the distribution plan began in mid-June 2008.
Civil Litigation
In connection with the events that resulted in the NYAG Settlement and SEC Order, various parties filed suits against Bank of America Corporation and certain of its affiliates, including Banc of America Capital Management, LLC ("BACAP," now known as Columbia Management Advisors, LLC) and BACAP Distributors, LLC (now known as Columbia Management Distributors, Inc.) (collectively "BAC"), Nations Funds Trust (now known as Columbia Funds Series Trust) and its Board of Trustees. On February 20, 2004, the Judicial Panel on Multidistrict Litigation transferred these cases and cases against other mutual fund companies based on similar allegations to the United States District Court in Maryland for consolidated or coordinated pretrial proceedings (the "MDL"). Subsequently, additional related cases were transferred to the MDL. On September 29, 2004, the plaintiffs in the MDL filed amended and consolidated complaints. One of these amended complaints is a putative class action that includes claims under the federal securities laws and state common law, and that names Nations Funds Trust, the Trustees, BAC and others as defendants. Another of the amended complaints is a derivative action purportedly on behalf of the Nations Funds Trust against BAC and others that asserts claims under federal securities laws and state common law. Nations Funds Trust is a nominal defendant in this action.
141
Municipal Bond Funds, March 31, 2009 (continued)
On February 25, 2005, BAC and other defendants filed motions to dismiss the claims in the pending cases. On December 15, 2005, BAC and others entered into a Stipulation of Settlement of the direct and derivative claims brought on behalf of the Nations Funds shareholders. The settlement is subject to court approval. If the settlement is approved, BAC would pay settlement administration costs and fees to plaintiffs' counsel as approved by the court. The stipulation has not yet been presented to the court for approval.
Note 10. Business Combinations and Mergers
On March 28, 2008, Short-Term Tax-Exempt Securities Fund, a series of Excelsior Tax-Exempt Funds Inc., merged into Columbia Short Term Municipal Bond Fund. Columbia Short Term Municipal Bond Fund received a tax-free transfer of assets from Short-Term Tax-Exempt Securities Fund as follows:
Shares
Issued | | Net Assets
Received | | Unrealized
Appreciation1 | |
| | 9,476,089 | | | $ | 97,847,055 | | | $ | 1,177,841 | | |
Net Assets
of Columbia
Short Term
Municipal
Bond Fund
Prior to
Combination | | Net Assets
of Short-Term
Tax-Exempt
Securities Fund
Immediately
Prior to Combination | | Net Assets
of Columbia
Short Term
Municipal
Bond Fund
Immediately
After Combination | |
| $ | 466,423,839 | | | $ | 97,847,055 | | | $ | 564,270,894 | | |
1 Unrealized appreciation is included in the Net Assets Received.
On March 28, 2008, California Short-Intermediate Term Tax-Exempt Income Fund, a series of Excelsior Tax-Exempt Funds Inc., merged into Columbia California Intermediate Municipal Bond Fund. Columbia California Intermediate Municipal Bond Fund received a tax-free transfer of assets from California Short-Intermediate Term Tax-Exempt Income Fund as follows:
Shares
Issued | | Net Assets
Received | | Unrealized
Appreciation1 | |
| | 5,066,126 | | | $ | 48,045,319 | | | $ | 290,869 | | |
Net Assets
of Columbia
California
Intermediate
Municipal
Bond Fund
Prior to
Combination | | Net Assets
of California
Short-Intermediate
Term Tax-Exempt
Income Fund
Immediately
Prior to Combination | | Net Assets
of Columbia
California
Intermediate
Municipal
Bond Fund
Immediately
After Combination | |
| $ | 170,156,721 | | | $ | 48,045,319 | | | $ | 218,202,040 | | |
1 Unrealized appreciation is included in the Net Assets Received.
Note 11. Subsequent Event
Columbia has voluntarily agreed to waive fees and/or reimburse expenses effective August 1, 2009, for each Fund so that the expenses incurred by each Fund (exclusive of any distribution and service fees, brokerage commissions, interest, taxes and extraordinary expenses, but inclusive of custodial charges relating to overdrafts, if any) after giving effect to any balance credits from the Funds' custodian, do not exceed the following annual rates, based on each Fund's average daily net assets:
Columbia Short Term Municipal
Bond Fund | | | 0.50 | % | |
Columbia California Intermediate
Municipal Bond Fund | | | 0.55 | % | |
Columbia Georgia Intermediate
Municipal Bond Fund | | | 0.55 | % | |
Columbia Maryland Intermediate
Municipal Bond Fund | | | 0.55 | % | |
Columbia North Carolina Intermediate
Municipal Bond Fund | | | 0.55 | % | |
Columbia South Carolina Intermediate
Municipal Bond Fund | | | 0.55 | % | |
Columbia Virginia Intermediate
Municipal Bond Fund | | | 0.55 | % | |
142
Report of Independent Registered Public Accounting Firm
To the Shareholders and Trustees of Columbia Funds Series Trust
In our opinion, the accompanying statements of assets and liabilities, including the investment portfolios, and the related statements of operations and of changes in net assets and the financial highlights present fairly, in all material respects, the financial position of Columbia Short Term Municipal Bond Fund, Columbia California Intermediate Municipal Bond Fund, Columbia Georgia Intermediate Municipal Bond Fund, Columbia Maryland Intermediate Municipal Bond Fund, Columbia North Carolina Intermediate Municipal Bond Fund, Columbia South Carolina Intermediate Municipal Bond Fund and Columbia Virginia Intermediate Municipal Bond Fund (constituting part of Columbia Funds Series Trust, hereafter referred to as the "Funds") at March 31, 2009, the results of each of their operations for the year then ended, and the changes in each of their net assets and the financial highlights for each of the periods indicated, in conformity with accounting principles generally accepted in the United States of America. These financial statements and financial highlights (hereafter referred to as "financial statements") are the responsibility of the Funds' management. Our responsibility is to express an opinion on these financial statements based on our audits. We conducted our audits of these financial statements in accordance with the standards of the Public Company Accounting Oversight Board (United States). Those standards require that we plan and perform the audit to obtain reasonable assurance about whether the financial statements are free of material misstatement. An audit includes examining, on a test basis, evidence supporting the amounts and disclosures in the financial statements, assessing the accounting principles used and significant estimates made by management, and evaluating the overall financial statement presentation. We believe that our audits, which included confirmation of securities at March 31, 2009 by correspondence with the custodian and brokers, provide a reasonable basis for our opinion.
PricewaterhouseCoopers LLP
Boston, Massachusetts
May 22, 2009
143
Federal Income Tax Information (Unaudited) — Municipal Bond Funds
For the fiscal year ended March 31, 2009, the following percentage of distributions made from net investment income of the Columbia Municipal Bond Funds are exempt for Federal income tax purposes. A portion of the income may also be subject to Federal Alternative Minimum Tax.
| Fund | | Federal Exempt
Percentage | |
| Columbia Short Term Municipal Bond Fund | | | 99.7 | % | |
| Columbia California Intermediate Municipal Bond Fund | | | 99.7 | | |
| Columbia Georgia Intermediate Municipal Bond Fund | | | 99.1 | | |
| Columbia Maryland Intermediate Municipal Bond Fund | | | 98.9 | | |
| Columbia North Carolina Intermediate Municipal Bond Fund | | | 99.1 | | |
| Columbia South Carolina Intermediate Municipal Bond Fund | | | 96.3 | | |
| Columbia Virginia Intermediate Municipal Bond Fund | | | 99.9 | | |
Columbia California Intermediate Municipal Bond Fund hereby designates as a capital gain dividend with respect to the taxable year ended March 31, 2009, $148,599, or if subsequently determined to be different, the net capital gain of such year.
144
Fund Governance
The Trustees serve terms of indefinite duration. The names, addresses and ages of the Trustees and officers of the Funds in the Columbia Funds Complex, the year each was first elected or appointed to office, their principal business occupations during at least the last five years, the number of Funds overseen by each Trustee and other directorships they hold are shown below. Each officer listed below serves as an officer of each Funds in the Columbia Funds Complex.
Independent Trustees
Name, Address and Year of Birth,
Position with Funds, Year First
Elected or Appointed to Office | | Principal Occupation(s) During Past Five Years, Number of Portfolios in Columbia
Funds Complex Overseen by Trustee, Other Directorships Held
| |
| Edward J. Boudreau (Born 1944) | |
|
c/o Columbia Management
Advisors, LLC
One Financial Center
Boston, MA 02111
Trustee (since 2005) | | Managing Director—E.J. Boudreau & Associates (consulting), from 2000 through current; oversees 66; no other directorships held. | |
|
| William P. Carmichael (Born 1943) | |
|
c/o Columbia Management
Advisors, LLC
One Financial Center
Boston, MA 02111
Trustee (since 1999) | | Retired. Oversees 66; Director—Cobra Electronics Corporation (electronic equipment manufacturer); Director—Spectrum Brands, Inc. (consumer products); Director—Simmons Company (bedding); Director—The Finish Line (sportswear). | |
|
| William A. Hawkins (Born 1942) | |
|
c/o Columbia Management Advisors, LLC
One Financial Center
Boston, MA 02111
Trustee (since 2005) | | President and Chief Executive Officer—California General Bank, N.A., from January 2008 through current; President, Retail Banking—IndyMac Bancorp, Inc., from September 1999 to August 2003; oversees 66; no other directorships held. | |
|
| R. Glenn Hilliard (Born 1943) | |
|
c/o Columbia Management Advisors, LLC
One Financial Center
Boston, MA 02111
Trustee (since 2005) | | Chairman and Chief Executive Officer—Hilliard Group LLC (investing and consulting), from April 2003 through current; Non-Executive Director & Chairman—Conseco, Inc. (insurance), September 2003 through current; Executive Chairman—Conseco, Inc. (insurance), August 2004 through September 2005, Chairman and Chief Executive Officer—ING Americas, from 1999 through April 2003; oversees 66; Director—Conseco, Inc. (insurance). | |
|
| John J. Nagorniak (Born 1944) | |
|
c/o Columbia Management
Advisors, LLC
One Financial Center
Boston, MA 02111
Trustee (since 2008)` | | Retired. President and Director—Foxstone Financial, Inc. (consulting), 2000 through December 2007; Director—Mellon Financial Corporation affiliates (investing), 2000 through 2007; Chairman—Franklin Portfolio Associates (investing—Mellon affiliate), 1982 through 2007; oversees 66; Director—MIT Investment Company; Trustee—MIT 401k Plan; Trustee and Chairman—Research Foundation of CFA Institute. | |
|
145
Fund Governance (continued)
Independent Trustees (continued)
Name, Address and Year of Birth,
Position with Funds, Year First
Elected or Appointed to Office | | Principal Occupation(s) During Past Five Years, Number of Portfolios in the Columbia
Funds Complex Overseen by Trustee, Other Directorships Held
| |
| Anthony M. Santomero (Born 1946) | |
|
c/o Columbia Management Advisors, LLC
One Financial Center
Boston, MA 02111
Trustee (since 2008) | | Richard K. Mellon Professor Emeritus of Finance, The Wharton School, University of Pennsylvania, from 1972 through current; Senior Advisor—McKinsey & Company (consulting), July 2006 through December 2007; President and Chief Executive Officer—Federal Reserve Bank of Philadelphia, 2000 through April 2006; oversees 66; Director—Renaissance Reinsurance Ltd.; Director—Penn Mutual Life Insurance Company; Director—Citigroup. | |
|
| Minor M. Shaw (Born 1947) | |
|
c/o Columbia Management Advisors, LLC
One Financial Center
Boston, MA 02111
Trustee (since 2003) | | President—Micco Corporation, Chairman—The Daniel-Mickel Foundation; oversees 66; Board Member—Piedmont Natural Gas. | |
|
The Statement of Additional Information includes additional information about the Trustees of the Funds and is available, without charge, upon request by calling 800-345-6611.
146
Fund Governance (continued)
Officers
Name, Address and Year of Birth,
Position with Columbia Funds,
Year First Elected or
Appointed to Office | | Principal Occupation(s) During Past Five Years
| |
| J. Kevin Connaughton (Born 1964) | |
|
One Financial Center
Boston, MA 02111
President (since 2009) | | Managing Director of Columbia Management Advisors, LLC since December 2004; Senior Vice President and Chief Financial Officer—Columbia Funds, from June 2008 to January 2009; Treasurer—Columbia Funds, from October 2003 to May 2008; Treasurer—the Liberty Funds, Stein Roe Funds and Liberty All-Star Funds, December 2000—December 2006; Senior Vice President—Columbia Management Advisors, LLC, from April 2003 to December 2004; President—Columbia Funds, Liberty Funds and Stein Roe Funds, February 2004 to October 2004; Treasurer—Galaxy Funds, September 2002 to December 2005; Treasurer, December 2002 to December 2004, and President, February 2004 to December 2004—Columbia Management Multi-Strategy Hedge Fund, LLC; and a senior officer of various other Bank of America-affiliated entities, including other registered and unregistered funds | |
|
| James R. Bordewick, Jr. (Born 1959) | |
|
One Financial Center
Boston, MA 02111
Senior Vice President, Secretary and Chief Legal Officer (since 2006) | | Associate General Counsel, Bank of America since April 2005; Senior Vice President and Associate General Counsel, MFS Investment Management (investment management) prior to April 2005. | |
|
| Linda J. Wondrack (Born 1964) | |
|
One Financial Center
Boston, MA 02111
Senior Vice President and
Chief Compliance Officer (since 2007) | | Director (Columbia Management Group LLC and Investment Product Group Compliance), Bank of America since June 2005; Director of Corporate Compliance and Conflicts Officer, MFS Investment Management (investment management), August 2004 to May 2005; Managing Director, Deutsche Asset Management (investment management) prior to August 2004. | |
|
| Michael G. Clarke (Born 1969) | |
|
One Financial Center
Boston, MA 02111
Senior Vice President and
Chief Financial Officer (since 2009) | | Director of Fund Administration of the Advisor since January 2006; Managing Director of the Advisor September 2004 to December 2005; Vice President Fund Administration June 2002 to September 2004. | |
|
| Jeffrey R. Coleman (Born 1969) | |
|
One Financial Center
Boston, MA 02111
Treasurer (since 2008) | | Director of Fund Administration of the Advisor since January 2006; Fund Controller of the Advisor from October 2004 to January 2006; Vice President of CDC IXIS Asset Management Services, Inc. (investment management) from August 2000 to September 2004. | |
|
| Joseph F. DiMaria (Born 1968) | |
|
One Financial Center
Boston, MA 02111
Chief Accounting Officer (since 2008) | | Director of Fund Administration of the Advisor since January 2006; Head of Tax/Compliance and Assistant Treasurer of the Advisor from November 2004 to December 2005; Director of Trustee Administration (Sarbanes-Oxley) of the Advisor from May 2003 to October 2004. | |
|
147
Fund Governance (continued)
Officers (continued)
Name, Address and Year of Birth,
Position with Columbia Funds,
Year First Elected or
Appointed to Office | | Principal Occupation(s) During Past Five Years
| |
| Julian Quero (Born 1967) | |
|
One Financial Center
Boston, MA 02111
Deputy Treasurer (since 2008) | | Senior Tax Manager of the Advisor since August 2006; Senior Compliance Manager of the Advisor from April 2002 to August 2006. | |
|
| Barry S. Vallan (Born 1969) | |
|
One Financial Center
Boston, MA 02111
Controller (since 2006) | | Vice President—Fund Treasury of the Advisor since October 2004; Vice President—Trustee Reporting of the Advisor from April 2002 to October 2004. | |
|
148
Board Consideration and Re-Approval of Investment Advisory Agreement
The Board of Trustees of Columbia Funds Series Trust (the "Board"), including a majority of the Trustees who have no direct or indirect interest in the investment advisory agreement and are not "interested persons" of the Trust, as defined in the Investment Company Act of 1940 (the "1940 Act") (the "Independent Trustees"), are required annually to review and re-approve the existing investment advisory agreement and approve any newly proposed terms therein. In this regard, the Board reviewed and re-approved, during the most recent six months covered by this report, the investment advisory agreement with Columbia Management Advisors, LLC ("CMA") for Columbia Short Term Municipal Bond Fund, Columbia California Intermediate Municipal Bond Fund, Columbia Georgia Intermediate Municipal Bond Fund, Columbia Maryland Intermediate Municipal Bond Fund, Columbia North Carolina Intermediate Municipal Bond Fund, Columbia South Carolina Interm ediate Municipal Bond Fund and Columbia Virginia Intermediate Municipal Bond Fund. The investment advisory agreement with CMA is referred to as an "Advisory Agreement." The funds identified above are each referred to as a "Fund" and collectively referred to as the "Funds."
More specifically, at meetings held on November 10-11, 2008, the Board, including the Independent Trustees advised by their independent legal counsel, considered the factors and reached the conclusions described below relating to the selection of CMA and the re-approval of the Advisory Agreement. The Board also reviewed and considered a report prepared and provided by the Independent Fee Consultant (the "Consultant") appointed by the Independent Trustees pursuant to an assurance of discontinuance entered into with the New York Attorney General ("NYAG") to settle a civil complaint filed by the NYAG relating to trading in mutual fund shares (the "NYAG Settlement"). During the fee review process, the Consultant's role was to manage the review process to ensure that fees are negotiated in a manner that is at arms' length and reasonable. The Consultant found that the fee negotiation process was, to the extent practicable, at arms' le ngth and reasonable and consistent with the requirements of the NYAG Settlement. A summary of the Consultant's report is available at www.columbiafunds.com.
In preparation for the November meetings, the Board met in August for review and discussion of the materials described below. The Investment Committee of the Board also met in June to discuss each Fund's performance with its respective portfolio manager(s). In addition to these meetings, the Investment Committee receives and discusses performance reports at its quarterly meetings. The Contracts Review Committee also provided support in managing and coordinating the process by which the Board reviewed the Advisory Agreement. The Board's review and conclusions are based on comprehensive consideration of all information presented to them and are not the result of any single controlling factor.
Nature, Extent and Quality of Services
The Board received and considered various data and information regarding the nature, extent and quality of services provided to the Funds by CMA under the Advisory Agreement. The most recent investment adviser registration form ("Form ADV") for CMA was made available to the Board, as were CMA's responses to a detailed series of requests submitted by the Independent Trustees' independent legal counsel on behalf of such Trustees. The Board reviewed and analyzed those materials, which included, among other things, information about the background and experience of senior management and investment personnel of CMA.
In addition, the Board considered the investment and legal compliance programs of the Funds and CMA, including their compliance policies and procedures and reports of the Funds' Chief Compliance Officer.
The Board evaluated the ability of CMA, based on its resources, reputation and other attributes, to attract and retain qualified investment professionals, including research, advisory and supervisory personnel. In this regard, the Board considered information regarding CMA's compensation program for its personnel involved in the management of the Funds. The Board also considered CMA's investment in further developing its research and trading departments.
Based on the above factors, together with those referenced below, the Board concluded that it was satisfied with the nature, extent and quality of the investment advisory services provided to each of the Funds by CMA.
Fund Performance and Expenses
The Board considered the performance results for each of the Funds over multiple measurement periods. It also considered these results in comparison to the performance results of the group of funds that was determined by Lipper Inc. ("Lipper") to be the most similar to a given Fund (the "Peer Group") and
149
to the performance of a broader universe of relevant funds as determined by Lipper (the "Universe"), as well as to each Fund's benchmark index. Lipper is an independent provider of investment company data. The Board was provided with a description of the methodology used by Lipper to select the mutual funds in each Fund's Peer Group and Universe and considered potential imprecision resulting from the selection methodology. The Board also considered certain risk-adjusted performance data.
The Board received and considered statistical information regarding each Fund's total expense ratio and its various components, including contractual advisory fees, actual advisory fees, actual non-management fees, Rule 12b-1 and non-Rule 12b-1 service fees, fee waivers/caps and/or expense reimbursements. The Board also considered comparisons of these fees to the expense information for each Fund's Peer Group and Universe, which comparative data was provided by Lipper. For certain funds, Lipper determined that the composition of the Peer Group and/or Universe for expenses would differ from that the composition for performance to provide a more accurate basis of comparison. The Board also considered Lipper data that ranked each Fund based on: (i) each Fund's one-year performance compared to actual management fees; (ii) each Fund's one-year performance compared to total expenses; (iii) each Fund's three-year performance compared t o actual management fees; and (iv) each Fund's three-year performance compared to total expenses.
Investment Advisory Fee Rates
The Board reviewed and considered the proposed contractual investment advisory fee rates together with the administration fee rates payable by the Funds to CMA for investment advisory services (the "Contractual Management Rates"). In addition, the Board reviewed and considered the proposed fee waiver/cap arrangements applicable to the Contractual Management Rates and considered the Contractual Management Rates after taking the waivers/caps into account (the "Actual Management Rates"). The Board noted that, on a complex-wide basis, CMA had reduced annual management fees by at least $32 million per year pursuant to the NYAG Settlement. The Board also noted reductions in net advisory rates and/or total expenses of certain funds across the fund complex. Additionally, the Board received and afforded specific attention to information comparing the Contractual Mana gement Rates and Actual Management Rates with those of the other funds in their respective Peer Groups.
The Board concluded that the factors noted above supported the Contractual Management Rates and the Actual Management Rates, and the approval of the Advisory Agreement for all of the Funds.
Profitability
The Board received and considered a detailed profitability analysis of CMA based on the Contractual Management Rates and the Actual Management Rates, as well as on other relationships between the Funds and other funds in the complex on the one hand and CMA affiliates on the other. The analysis included complex-wide and per-Fund information and a comparison of results using alternative allocation methodologies. The Board concluded that, in light of the costs of providing investment management and other services, the profits and other ancillary benefits that CMA and its affiliates received from providing these services were not unreasonable.
Economies of Scale
The Board received and considered information regarding whether there have been economies of scale with respect to the management of the Funds, whether the Funds have appropriately benefited from any economies of scale and whether there is potential for realization of any further economies of scale. Most particularly, CMA provided information showing that, as a percentage of fund assets, CMA's complex-wide revenues, expenses and profits declined over a four-year period during which fund assets increased by 39% and the shareholder benefit over a two-year period increased from 33% to 41% of the Adviser's total profits. The Board concluded that any potential economies of scale are shared fairly with Fund shareholders, most particularly through breakpoints and fee waiver arrangements.
The Board acknowledged the inherent limitations of any analysis of an investment adviser's economies of scale, stemming largely from the Board's understanding that economies of scale are realized, if at all, by an investment adviser across a variety of products and services, not just with respect to a single fund.
150
Information About Services to Other Clients
The Board also received and considered information about the nature and extent of services and fee rates offered by CMA to other clients, including separate accounts and institutional investors. In this regard, the Board concluded that, where the Contractual Management Rates and Actual Management Rates were appreciably above the range of the fee rates offered to other CMA clients, based on information provided by CMA, the costs associated with managing and operating a registered investment company provided a justification for the higher fee rates charged to the Funds.
Other Benefits to CMA
The Board received and considered information regarding any "fall-out" or ancillary benefits received by CMA and its affiliates as a result of their relationships with the Funds. Such benefits could include, among others, benefits attributable to CMA's relationship with the Funds (such as soft-dollar credits) and benefits potentially derived from an increase in CMA's business as a result of its relationship with the Funds (such as the ability to market to shareholders other financial products offered by CMA and its affiliates).
The Board considered the effectiveness of the policies of the Funds in achieving the best execution of portfolio transactions, whether and to what extent soft dollar credits are sought and how any such credits are utilized, any benefits that may be realized by using an affiliated broker, the extent to which efforts are made to recapture transaction costs, and the controls applicable to brokerage allocation procedures. The Board also reviewed CMA's methods for allocating portfolio investment opportunities among the Funds and other clients. The Board concluded that the benefits were not unreasonable.
Other Factors and Broader Review
As discussed above, the Board reviews materials received from CMA annually as part of the re-approval process under Section 15(c) of the 1940 Act. The Board also reviews and assesses the quality of the services the Funds receive throughout the year. In this regard, the Board and its Committees review a report of CMA at each of its quarterly meetings, which includes, among other things, Fund performance reports. In addition, the Board and its Committees confer with portfolio managers at various times throughout the year including, most particularly, in the June Investment Committee meeting.
Conclusion
After considering the above-described factors, based on their deliberations and their evaluation of the information provided, the Board concluded that the compensation payable to CMA under the Advisory Agreement is fair and equitable. Accordingly, the Board unanimously re-approved the Advisory Agreement.
151
Summary of Management Fee Evaluation by
Independent Fee Consultant
EXCERPTS FROM REPORT OF INDEPENDENT FEE CONSULTANT TO THE FUNDS SUPERVISED BY THE COLUMBIA NATIONS BOARD
Prepared pursuant to the February 9, 2005
Assurance of Discontinuance among the
Office of Attorney General of New York State,
Columbia Management Advisors, LLC and
Columbia Management Distributors, Inc.
November 12, 2008
I. Overview
On February 9, 2005, Columbia Management Advisors, LLC ("CMA") and Columbia Management Distributors, Inc.1 ("CMD") agreed to the New York Attorney General's Assurance of Discontinuance ("AOD"). Among other matters, the AOD stipulates that CMA may manage or advise a Columbia Fund ("Columbia Fund" and together with all such funds or a group of such funds as the "Columbia Funds") only if the Independent Members of the Columbia Fund's Board of Trustees appoint a Senior Officer or retain an Independent Fee Consultant ("IFC") who is to manage the process by which proposed management fees are negotiated. The AOD further stipulates that the Senior Officer or IFC is to prepare a written annual evaluation of the fee negotiation process.
With effect from January 1, 2007, the Independent Members of the Board of Trustees for certain Columbia Funds known collectively as the "Nations Funds" (the "Trustees") retained me as IFC for the Nations Funds.2 In this capacity, I have prepared the fourth annual written evaluation of the fee negotiation process. As was the case with last year's report (the "2007 Report") my immediate predecessor as IFC, John Rea, provided invaluable assistance in the preparation of this year's report.
A. Role of the Independent Fee Consultant
The AOD charges the IFC with "managing the process by which proposed management fees...to be charged the Columbia Fund are negotiated so that they are negotiated in a manner which is at arms' length and reasonable and consistent with this Assurance of Discontinuance." The AOD also provides that CMA "may manage or advise a Columbia Fund only if the reasonableness of the proposed management fees is determined by the Board of Trustees...using...an annual independent written evaluation prepared by or under the direction of...the Independent Fee Consultant." Therefore, the AOD makes clear that the IFC does not supplant the Trustees in negotiating management fees with CMA, nor does the IFC substitute his or her judgment for that of the Trustees with respect to the reasonableness of proposed fees or any other matter that is committed to the business judgment of the Trustees.
B. Elements Involved in Managing the Fee Negotiation Process
In preparing the report required by the AOD, the IFC must consider at least the following six factors set forth in the AOD:
1. The nature and quality of CMA's services, including the Fund's performance;
2. Management fees (including any components thereof) charged by other mutual fund companies for like services;
3. Possible economies of scale as the Fund grows larger;
4. Management fees (including any components thereof) charged to institutional and other clients of CMA for like services;
5. Costs to CMA and its affiliates of supplying services pursuant to the management fee agreements, excluding any intra-corporate profit; and
6. Profit margins of CMA and its affiliates from supplying such services.
C. Organization of the Annual Evaluation
This report, like last year's, focuses on the six factors and contains a section for each factor except that CMA's costs and profits from managing the Funds have been combined into a single section. In addition to a discussion of these factors, the report offers recommendations to improve the fee review process in future years. A review of the status of recommendations made in the 2007 Report is being provided separately with the materials for the November meeting.
1 CMA and CMD are subsidiaries of Columbia Management Group, LLC ("CMG"), and are the successors to the entities named in the AOD.
2 I have no material relationship with Bank of America, CMG or any of its affiliates, aside from serving as IFC, and I am aware of no material relationship with any of their affiliates. I retained John Rea, an independent economic consultant, to assist me with this report.
Unless otherwise stated or required by the context, this report covers only the Nations Funds, which are also referred as the "Funds."
152
II. Summary of Findings
A. General
1. Based upon my examination of the information supplied by CMG in the light of the six factors set forth in the AOD, I conclude that the Trustees have the relevant information necessary to evaluate the reasonableness of the proposed management fees for each Nations Fund.
2. In my view, the process by which the proposed management fees of the Funds have been negotiated in 2008 thus far has been, to the extent practicable, at arms' length and reasonable and consistent with the AOD.
B. Nature and Quality of Services, Including Performance
3. The performance of the Funds has been relatively good for the most recent 1-, 3- and 5-year periods. The strongest records were posted by the Funds in the Active Equity and Quantitative Strategies Groups and by the sub-advised Funds. The 5-year performance rankings of the subadvised Funds were particularly strong, with all such Funds in the top two performance quintiles.
4. The 1- and 3-year performance records of the Funds declined slightly from 2007 to 2008, while the 5-year performance records improved year-over-year. Most Funds changed their 1-year performance quintile year-over-year, while the 5-year rankings were, as expected, much more stable, with less than half the Funds moving to a different 5-year performance quintile.
5. The performance of the actively-managed equity and sub-advised Funds against their benchmarks was strong, especially for the 1- and 3-year performance periods. However, no fixed-income Fund with a reliable benchmark exceeded it on a net basis in any performance period. Money market Funds do not have such benchmarks and therefore were excluded from this analysis.
6. The Nations equity Funds' overall performance adjusted for risk was strong. The performance of 13 of the 19 actively-managed Funds included in the risk analysis bettered the median in 3-year performance adjusted and unadjusted for risk. No relationship between risk and return was detected for fixed-income Funds.
7. The industry-standard procedure used by third parties such as Lipper and Morningstar to construct the performance universe in which each Fund's performance is ranked relative to comparable funds tends to bias a Fund's ranking upward within that universe. The bias occurs because either no-12b-1-fee or A share classes of the Funds are compared to the performance universe that includes all share classes of competitive multi-class funds. Therefore, the procedure ranks shares with zero or 25 basis point 12b-1 fees against classes of competitive funds with 12b-1 fees of up to 100 basis points. Correcting this bias by limiting the performance universe to classes of competitive funds with comparable 12b-1 fees in most cases lowers the relative performance for the Funds but does not call into question the general finding that the Nations Funds' performance has been strong.
8. A small number of Funds have consistently underperformed their peers in each of the past four years, depending on the exact criteria used to measure long-term underperformance. For example, one Fund has had below-median 1- and 3-year performance in each of the past four years; one additional Fund had below-median 3-year performance for those years.
9. The services performed by CMG professionals beyond portfolio management, such as compliance, legal, information technology, risk management, finance and fund administration, are critical to the success of the Funds and appear to be of high quality.
C. Management Fees Charged by Other Mutual Fund Companies
10. The Funds' management fees and total expenses are generally low relative to those of their peers, with the exception of subadvised Funds. Almost two-third of the Funds ranked in the two least expensive quintiles for total expenses and just over half were in those quintiles for actual management fees. Funds with lower actual management fees tended to have lower relative total expenses. All fixed-income Funds had total expenses in the two least expensive quintiles.
11. Generally, the Nations Funds with the highest relative fees and expenses are sub-advised. All eight Nations Funds with fifth-quintile total expense rankings were sub-advised. The actual management fees of 11 of the 14 sub-advised
153
Funds were in the fourth and fifth quintile. The average management fees of the sub-advised Funds were typically 20 points higher than internally-managed equity Funds. CMA presented data suggesting that such differentials were consistent with industry practice.
12. The management fees of the internally-advised Nations Funds are generally in line with those of Columbia Funds overseen by the Atlantic and Acorn/Wanger Boards of Trustees.
D. Trustees' Fee and Performance Evaluation Process
13. The Trustees' evaluation process identified 20 Funds in 2008 for further review based upon their relative performance or expenses or both. When compared in filtered universes, three more Funds met the criteria for review.
E. Potential Economies of Scale
14. CMG has prepared a memo for the Trustees containing its views on the sources and sharing of potential economies of scale. CMG views economies of scale as arising at the complex level and would regard estimates of scale economies for individual funds as unreliable. In its analysis, CMG did not identify specific sources of economies of scale or provide any estimates of any economies of scale that might arise from future asset growth. CMG's analysis included measures taken by the Trustees and CMG that seek to share any potential economies of scale through breakpoints in management fee schedules, expense reimbursements, fee waivers, enhanced shareholder services, fund mergers, and operational consolidation.
15. An examination of the management fee schedules of a selected number of the Nations Funds suggests that, as a general matter, the breakpoint schedules of these Funds are not out of line with those of competitors. A similar examination of five other Nations Funds in 2007 led to the same conclusion.
F. Management Fees Charged to Institutional Clients
16. CMG has provided Trustees with comparisons of mutual fund management fees and institutional fees based upon standardized fee schedules and actual fees. The results show that, consistent with industry practice, institutional fees are generally lower than the Funds' management fees. However, because the services provided and risks borne by the manager are more extensive for mutual funds than for institutional accounts, the differences are of limited value in assisting the Trustees in their review of the reasonableness of the Funds' management fees.
G. Revenues, Expenses, and Profits
17. The activity-based cost allocation methodology ("ABC") employed by CMG to allocate costs for purposes of calculating Fund profitability, both direct and indirect, for purposes of calculating Fund profitability is thoughtful and detailed. For comparison, CMG proposed a change to the method by which indirect expenses were allocated. Under this "hybrid" method, such costs are allocated to Funds 50% by assets and 50% per fund. Allocating indirect expenses equally to each Fund has an intuitive logic, as each Fund regardless of size has certain expenses, such as preparing and printing prospectuses and financial statements.
18. The materials provided on CMG's revenues and expenses with respect to the Funds and the methodology underlying their construction generally form a sufficient basis for Trustees to evaluate CMG's expenses and profitability for each Fund.
19. In 2007, CMG's complex-wide pre-tax margins on the Nations Funds were close to the industry average before distribution and below average when distribution revenues and expenses were included, based on limited data available about publicly-held mutual fund managers. However, as is to be expected in a complex comprising 65 Funds, some Nations Funds have higher pre-tax profit margins, when calculated solely with respect to management revenues and expenses, while other Nations Funds operate at a loss. A pro forma analysis of the complex's profitability taking into account expenses incurred in 2008 associated with support of the money market funds sharply reduced the profitability of the Nations Funds. There is a positive relationship between fund size and profitability, with smaller Funds generally operating at a loss.
154
20. CMG shares a fixed percentage of its management fee revenues with an affiliate, U.S. Trust, Bank of America Private Wealth Management, to compensate that affiliate for services it performs with respect to Nations Fund assets held for the benefit of its customers. Based on our analysis of the services provided by the affiliate, we believe all such payments should be regarded as a distribution expense, except for any portion attributable to payments by CMG for performance of sub-transfer agency or sub-accounting functions.
III. Recommendations
1) Criteria for review. The Trustees may wish to consider modifying the criteria for classifying a fund as a "Review Fund" to include criteria that focus exclusively on performance without regard to expense or fee levels. For example, a Fund whose one-year or three-year performance was median or below for four consecutive years could be treated as a Review Fund. Applying such criteria would add two Funds to the list of Review Funds.
2) Profitability data. CMG should present to the Trustees each year the profitability of each Fund, each investment style, and each complex (of which Nations is one) calculated as follows:
Exhibit 1. Management-only profitability should be calculated without reference to any Private Bank expense.
Exhibit 2. Profitability excluding distribution (which essentially covers the management and transfer agency functions) should be adjusted by removing from the expense calculation any portion of the Private Bank payment not attributable to the performance by the Private Bank of sub-transfer agency or sub-accounting functions.
Exhibit 3. Total profitability, including distribution: No adjustment for Private Bank expenses should be made, because all such expenses represent legitimate fund expenses to be taken into account in calculating CMG's profit margin including distribution.
Exhibit 4. Distribution only: This should include all Private Bank expenses other than those attributable to sub-transfer agency services.
Therefore, the following data need not be provided:
1. Adjusting total profitability data for Private Bank expenses
2. Adjusting profitability excluding distribution by backing out all Private Bank expenses.
3) Economies of scale. CMG and the IFC should continue to work on methods for more precisely quantifying to the extent possible the sources and magnitude of any economies of scale as CMG's mutual fund assets under management increase, to the extent that the data allows for meaningful year-over-year comparisons. The framework suggested in Section IV.D.4 may prove to be a useful model for such an analysis.
4) Competitive breakpoint analysis. As part of the annual fee evaluation process, the breakpoints of a select group of Nations Funds (which would differ each year) should continue to be compared to those of industry rivals to ensure that the Funds' breakpoint schedules remain within industry norms. As breakpoint schedules change relatively little each year, performing such a comparison for all Funds each year would not be an efficient use of Trustee and CMG resources.
5) Cost allocation methodology. CMG's point that the current ABC system of allocating indirect expenses creates anomalous results in several cases, including sub-advised Funds, is well-taken. We would like to work with CMG over the forthcoming year on alternatives to the current system of allocating indirect expenses that (1) resolve the anomalies, (2) limit the amount of incremental effort on CMG's part and (3) remain faithful to the general principle that expenses should be allocated by time and effort to the extent reasonably possible.
6) Management fee disparities. CMG and the Nations Trustees, as part of any future study of management fees, should analyze any differences in management fee schedules between Funds managed in similar investment styles. As part of that analysis, CMG should provide an explanation for any significant fee differences among comparable funds
155
across fund families managed by CMA, such as differences in the management styles of different Funds included the same Lipper category. Finally, whenever CMG proposes a management fee change or an expense cap for any mutual fund managed by CMA that is comparable to any Nations Fund, CMG should provide the Trustees with sufficient information about the proposal to allow the Trustees to assess the applicability of the proposed change to the relevant Nations Fund or Funds.
7) Tax-exempt Fund expense data. The expense rankings of certain tax-exempt Funds were adversely affected by including certain investment-related interest expenses that Lipper excluded in calculating the expense ratios of competitors. We recommend that CMG follow the Lipper practice and exclude such interest expenses from data submitted to Lipper to avoid unfairly disadvantaging the tax-exempt Funds.
8) Reduction of volume of paper documents submitted. The effort to rationalize and simplify the data presented to the Trustees and the process by which that data was prepared and organized was regarded as a success by all parties. We should continue to look for opportunities to reduce and simplify the presentation of 15(c) data, especially in the area of Fund and manager profitability. The Fund "Dashboard" volume presents a large volume of Fund data on a single page. If it is continued, the Trustees may wish to consider receiving the underlying Lipper data on CD, rather than the current paper volumes.
* * *
Respectfully submitted,
Steven E. Asher
156
Important Information About This Report – Municipal Bond Funds
The funds mail one shareholder report to each shareholder address. If you would like more than one report, please call shareholder services at 1-800-345-6611 and additional reports will be sent to you. This report has been prepared for shareholders of the Municipal Bond Funds listed on the front cover.
A description of the policies and procedures that each fund uses to determine how to vote proxies and a copy of each fund's voting records are available (i) at www.columbiamanagement.com; (ii) on the Securities and Exchange Commission's website at www.sec.gov, and (iii) without charge, upon request, by calling 1-800-368-0346. Information regarding how each fund voted proxies relating to portfolio securities during the 12-month period ended June 30 is available from the SEC's website. Information regarding how each fund voted proxies relating to portfolio securities is also available from the funds' website, www.columbiamanagement.com.
Each fund files a complete schedule of portfolio holdings with the SEC for the first and third quarters of each fiscal year on Form N-Q. Each fund's Form N-Q is available on the SEC's website at www.sec.gov and may be reviewed and copied at the SEC's Public Reference Room in Washington, DC. Information on the operation of the Public Reference Room may be obtained by calling 1-800-SEC-0330.
Please read and consider the investment objectives, risks, charges and expenses for any fund carefully before investing. For a prospectus which contains this and other important information about the fund, contact your Columbia Management representative or financial advisor or go to www.columbiamanagement.com.
Columbia Management Group, LLC ("Columbia Management") is the investment management division of Bank of America Corporation. Columbia Management entities furnish investment management services and products for institutional and individual investors. Columbia Funds are distributed by Columbia Management Distributors, Inc., member of FINRA, SIPC, part of Columbia Management and an affiliate of Bank of America Corporation.
Transfer Agent
Columbia Management Services, Inc.
P.O. Box 8081
Boston, MA 02266-8081
1-800-345-6611 | |
|
| Distributor | |
|
Columbia Management
Distributors, Inc.
One Financial Center
Boston, MA 02111 | |
|
| Investment Advisor | |
|
Columbia Management Advisors, LLC
100 Federal Street
Boston, MA 02110 | |
|
157
Columbia Management®
One Financial Center
Boston, MA 02111-2621
PRSRT STD
U.S. Postage
PAID
Holliston, MA
Permit NO. 20
Columbia Management®
Columbia Municipal Bond Funds
Annual Report, March 31, 2009
©2009 Columbia Management Distributors, Inc.
One Financial Center, Boston, MA 02111-2621
800-345-6611 www.columbiafunds.com
SHC-42/10812-0309 (05/09) 09/78879

Annual Report
March 31, 2009
Columbia Masters Portfolios
| n | | Columbia Masters Global Equity Portfolio |
| n | | Columbia Masters Heritage Portfolio |
| n | | Columbia Masters International Equity Portfolio |
| | |
| NOT FDIC INSURED | | May Lose Value |
| NOT BANK ISSUED | | No Bank Guarantee |
Table of contents
The views expressed in this report reflect the current views of the respective parties. These views are not guarantees of future performance and involve certain risks, uncertainties and assumptions that are difficult to predict so actual outcomes and results may differ significantly from the views expressed. These views are subject to change at any time based upon economic, market or other conditions and the respective parties disclaim any responsibility to update such views. These views may not be relied on as investment advice and, because investment decisions for a Columbia Fund are based on numerous factors, may not be relied on as an indication of trading intent on behalf of any particular Columbia Fund. References to specific securities should not be construed as a recommendation or investment advice.
President’s Message

Dear Shareholder:
Recent events have shown great volatility in the markets and uncertainty in the economy. During these challenging times, it becomes even more important to focus on long-term horizons and key investment tools that can help manage volatility. This may be the time to reflect on your investment goals and evaluate your portfolio to ensure you are positioned for any potential market rebound.
A long-term financial plan can serve as a road map and guide you through the necessary steps designed to meet your financial goals. Your financial plan should take into account your investment goals, time horizon, overall financial situation, risk tolerance and willingness to ride out market volatility. Your investment professional can be a key resource as you work through this process. The knowledge and experience of an investment professional can help as you create or reevaluate your investment strategy.
The importance of diversification
Although diversification does not ensure a profit or guarantee against loss, a diversified portfolio can be a strategy for successful long-term investing. Diversification refers to the mix of investments within a portfolio. A mutual fund can contribute to portfolio diversification given that a mutual fund’s portfolio represents several investments. Additionally, the way you allocate your money among stocks, bonds and cash, and geographically between foreign and domestic investments, can help to reduce risks. Diversification can result in multiple investments where the positive performance of certain holdings can offset any negative performance from other holdings. Having a diversified portfolio doesn’t mean that the value of the portfolio will never go down, but rather helps strike a balance between risk and reward.
Reevaluate your strategy
An annual review of your investments is a key opportunity to determine if your investment needs have changed or if you need minor adjustments to rebalance your portfolio. Life events like a birth, marriage, home improvement, or change in employment can have a major affect on your spending and goals. Ask yourself how your spending or goals have changed and factor this into your financial plan. Are you using automated investments or payroll deductions to help keep your savings on track? Are you able to set aside additional savings or increase your 401(k) plan contributions? If during your review you find that your investments in any one category (e.g., stocks, bonds or cash) have grown too large based on your diversification plan, you may want to consider redirecting future investments to get back on track.
History has shown that the U.S. stock market has been remarkably resilient¹. Volatility can lead to opportunity. Patience and a commitment to your long-term financial plan may position you to potentially benefit over your investment horizon. We appreciate your business and continued support of Columbia Funds.
Sincerely,

J. Kevin Connaughton
President, Columbia Funds
The board of trustees elected J. Kevin Connaughton president of Columbia Funds on January 16, 2009.
1 | The Dow Jones Industrial Average is the most widely used indicator of the overall condition of the stock market. The Dow Jones Industrial Average Index is a price-weighted average of 30 actively traded blue-chip stocks as selected by the editors of the Wall Street Journal. Indices are not available for investment, and do not reflect sales charges, fees, brokerage commissions, taxes or other expenses of investing. |
Economic Update – Columbia Masters Portfolios
Summary
For the 12-month period that ended March 31, 2009
| | n | | Stock markets across the world fell sharply, as measured in U.S. dollars by the MSCI World Index and the MSCI EAFE Index. A rising dollar further depressed losses in foreign markets. | |
| | |
| MSCI World Index | | MSCI EAFE Index |
| |

| |
|
–42.58% | | –46.51% |
The Morgan Stanley Capital International (MSCI) World Index tracks the performance of global stocks.
The Morgan Stanley Capital International (MSCI) Europe, Australasia, Far East (EAFE) Index is a free float-adjusted market capitalization index that is designed to measure developed market equity performance, excluding the US and Canada.
Indices are not available for investment, and do not reflect sales charges, fees, brokerage commissions, taxes or other expenses of investing. Securities in the portfolio may not match those in an index.
Economic growth slowed around the world during the 12-month period that began April 1, 2008 and ended March 31, 2009. Most major developed economies slipped into recession in 2008, with little relief in sight for the first half of 2009. In the United States, the downturn was even sharper than anticipated. Fourth quarter 2008 growth was reported at negative 6.3% — the worst quarter on record for the U.S. economy since 1982. The United Kingdom, Germany, Japan, South Korea and Singapore are also in recession. Although the economies of emerging market countries have largely avoided recession, the global slowdown has taken the steam out of their economic growth as exports to developed markets fell off sharply.
Trouble in global financial system
Troubles that began in the U.S. subprime mortgage market spread across Europe and entangled the world’s financial systems during the 12-month period. A meltdown within the U.S. financial sector claimed several major institutions and led others to seek bailouts, restructuring or both. Central banks around the world stepped in to infuse liquidity as credit dried up in 2008. Conditions have since eased, but more rigorous lending standards have severely limited access to credit in both developed and emerging markets, further hampering economic growth.
In the United States, unemployment has risen sharply over the past year, putting pressure on consumer spending. Western Europe and Japan, which rely heavily on exports, have experienced sharp declines in export trade. A weak housing market prevails in the United States and the United Kingdom. Even China’s economy has exhibited signs of weakness. In the last quarter of 2008, annualized gross domestic product fell to 6.8%, compared to more than 13% in 2007.1 An estimated 20 million jobs have been lost in China, according to Moody’s Investors Service. India reported a loss of 3 million jobs due to shrinking exports.
Many central banks have reduced short-term borrowing rates while governments have increased spending in an effort to stimulate economic growth. However, these efforts may not be rewarded until later this year or next. The only other spark in this otherwise dark outlook is that commodity prices have fallen, easing one heavy burden on consumer budgets.
Stock markets experience sharp declines
Against this weak economic backdrop, the U.S. stock market lost 38.09% for the 12-month period, as measured by the S&P 500 Index.2 Losses extended across all market caps and both growth and value, although growth stocks held up slightly better
1 | UBS Investment Research, Asian Economic Monitor, March 2009. |
2 | The Standard & Poor’s (S&P) 500 Index tracks the performance of 500 widely held, large capitalization US stocks. |
1
Economic Update (continued) – Columbia Masters Portfolios
than value stocks, as measured by their respective Russell indices.3 Stock markets outside the United States suffered even greater losses. The MSCI World Index, which includes the U.S. market, returned negative 42.58%. The MSCI EAFE Index, a broad gauge of stock market performance in foreign developed markets, lost 46.51% (in U.S. dollars) for the period. Emerging stock markets, which have generally had a strong run over the past several years, were also caught in the downdraft. As investors backed away from risk, the MSCI Emerging Markets Index4 returned negative 47.07% (in U.S. dollars). However, foreign stock market performance showed some improvement in the final months of the period, outperforming U.S. stocks for the first time in a year. Emerging market indices generally experienced larger gains in March than the major market indices.
Past performance is no guarantee of future results.
3 | The Russell 1000 Growth Index measures the performance of those Russell 1000 Index companies with higher price-to-book ratios and higher forecasted growth values. The Russell 1000 Value Index measures the performance of those companies in the Russell 1000 Index with lower price-to-book ratios and lower forecasted growth values. The Russell 2000 Growth Index measures the performance of those Russell 2000 companies with higher price-to-book ratios and higher forecasted growth values. The Russell 2000 Value Index measures the performance of those Russell 2000 companies with lower price-to-book ratios and lower forecasted growth values. The Russell 3000 Growth Index measures the performance of those Russell 3000 Index companies with higher price-to-book ratios and higher forecasted growth values. The Russell 3000 Value Index measures the performance of those Russell 3000 Index companies with lower price-to-book ratios and lower forecasted growth values. The Russell Midcap Growth Index measures the performance of those Russell Midcap companies with higher price-to-book ratios and higher forecasted growth values. The Russell Midcap Value Index measures the performance of those Russell Midcap companies with lower price-to-book ratios and lower forecasted growth values. |
4 | The MSCI Emerging Markets Index is a widely accepted index composed of a sample of companies from 25 countries representing the global emerging stock markets. |
Indices are not available for investment, and do not reflect sales charges, fees, brokerage commissions, taxes or other expenses of investing. Securities in the portfolio may not match those in an index.
2
Portfolio Profile – Columbia Masters Global Equity Portfolio
Performance data quoted represents past performance and current performance may be lower or higher. Past performance is no guarantee of future results. The investment return and principal value will fluctuate so that shares, when redeemed, may be worth more or less than the original cost. Please visit www.columbiafunds.com for daily and most recent month-end performance updates.
Summary
1-year return as of 03/31/09
| | |
| |
 | | –45.32% Class A shares (without sales charge) |
| |
| | –42.58% MSCI World Index |
Morningstar Style Box™
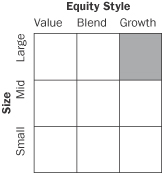
The Morningstar Style Box™ reveals a fund’s investment strategy. For equity funds, the vertical axis shows the market capitalization of the stocks owned, and the horizontal axis shows investment style (value, blend or growth). Information shown is based on the most recent data provided by Morningstar.
Summary
| n | | For the 12-month period that ended March 31, 2009, the portfolio’s Class A shares returned negative 45.32% without sales charge. |
n | | In a period of contracting economic growth and sharply falling stock prices, the portfolio, its benchmark, the MSCI World Index,1 and the average return of its peer group, the Lipper Global Multi-Cap Core Funds Classification,2 all lost more than 40%. |
| n | | Three of the four underlying funds lagged their respective benchmarks. |
Portfolio Management
Anwiti Bahuguna, PhD has co-managed the portfolio since February 2009 and has been associated with the advisor or its predecessors or affiliate organizations since 2002.
Colin Moore has co-managed the portfolio since February 2009 and has been associated with the advisor or its predecessors or affiliate organizations since 2002.
Kent M. Peterson, PhD has co-managed the portfolio since February 2009 and has been associated with the advisor or its predecessors or affiliate organizations since 2006.
Marie M. Schofield has co-managed the portfolio since February 2009 and has been associated with the advisor or its predecessors or affiliate organizations since 1990.
1 | The Morgan Stanley Capital International (MSCI) World Index tracks the performance of global stocks. Indices are not available for investment, and do not reflect sales charges, fees, brokerage commissions, taxes or other expenses of investing. Securities in the portfolio may not match those in an index. |
2 | Lipper Inc., a widely respected data provider in the industry, calculates an average total return (assuming reinvestment of distributions) for mutual funds with investment objectives similar to those of the portfolio. Lipper makes no adjustment for the effect of sales loads. |
3
Performance Information – Columbia Masters Global Equity Portfolio
Performance data quoted represents past performance and current performance may be lower or higher. Past performance is no guarantee of future results. The investment return and principal value will fluctuate so that shares, when redeemed, may be worth more or less than the original cost. Please visit www.columbiafunds.com for daily and most recent month-end performance updates.
| | |
| Annual operating expense ratio (%)* |
| |
Class A | | 1.96 |
Class B | | 2.71 |
Class C | | 2.71 |
Class Z | | 1.71 |
| | |
Annual operating expense ratio
after contractual waivers (%)* |
| |
Class A | | 1.20 |
Class B | | 1.95 |
Class C | | 1.95 |
Class Z | | 0.95 |
| * | The annual operating expense ratio and annual operating expense ratio after contractual waivers are as stated in the portfolio’s prospectus that is current as of the date of this report and include the expenses incurred by the underlying funds in which the portfolio invests. The contractual waiver expires 07/31/09. Differences in expense ratios disclosed elsewhere in this report may result from including expenses incurred by the underlying fund, fee waivers and expense reimbursements as well as different time periods used in calculating the ratios. |
|
| Performance of a $10,000 investment 02/15/06 – 03/31/09 |
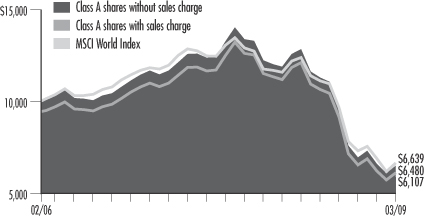
The chart above shows the change in value of a hypothetical $10,000 investment in Class A shares of Columbia Masters Global Equity Portfolio during the stated time period, and does not reflect the deduction of taxes that a shareholder may pay on portfolio distributions or on the redemption of portfolio shares. The Morgan Stanley Capital International (MSCI) World Index tracks the performance of global stocks. Indices are not available for investment, and do not reflect sales charges, fees, brokerage commissions, taxes or other expenses of investing. Securities in the portfolio may not match those in an index.
| | | | |
| Performance of a $10,000 investment 02/15/06 – 03/31/09 ($) |
| | |
| Sales charge | | without | | with |
Class A | | 6,480 | | 6,107 |
Class B | | 6,335 | | 6,170 |
Class C | | 6,334 | | 6,334 |
Class Z | | 6,546 | | n/a |
| | | | | | | | | | | | | | |
| Average annual total return as of 03/31/09 (%) |
| | | | |
| Share class | | A | | B | | C | | Z |
| Inception | | 02/15/06 | | 02/15/06 | | 02/15/06 | | 02/15/06 |
| Sales charge | | without | | with | | without | | with | | without | | with | | without |
1-year | | –45.32 | | –48.48 | | –45.68 | | –48.25 | | –45.74 | | –46.25 | | –45.09 |
Life | | –12.97 | | –14.61 | | –13.60 | | –14.32 | | –13.60 | | –13.60 | | –12.69 |
The “with sales charge” returns include the maximum initial sales charge of 5.75% for Class A shares and the applicable contingent deferred sales charge of 5.00% in the first year, declining to 1.00% in the sixth year and eliminated thereafter for Class B shares and 1.00% for Class C shares for the first year only. The “without sales charge” returns do not include the effect of sales charges. If they had, returns would be lower.
Performance results reflect any fee waivers or reimbursements of portfolio expenses by the investment advisor and/or any of its affiliates. Absent these fee waivers or expense reimbursement arrangements, performance results would have been lower.
All results shown assume reinvestment of distributions. Class Z shares are sold at net asset value with no distribution and service (Rule 12b-1) fees. Class Z shares have limited eligibility and the investment minimum requirements may vary. Please see the portfolio’s prospectus for details. Performance for different share classes will vary based on differences in sales charges and fees associated with each class.
The tables do not reflect the deduction of taxes that a shareholder may pay on portfolio distributions or on the redemption of portfolio shares.
4
Understanding Your Expenses – Columbia Masters Global Equity Portfolio
Estimating your actual expenses
To estimate the expenses that you paid over the period, first you will need your account balance at the end of the period:
| | n | | For shareholders who receive their account statements from Columbia Management Services, Inc., your account balance is available online at www.columbiafunds.com or by calling Shareholder Services at 800.345.6611. | |
| | n | | For shareholders who receive their account statements from their financial intermediary, contact your financial intermediary to obtain your account balance. | |
| | 1. | Divide your ending account balance by $1,000. For example, if an account balance was $8,600 at the end of the period, the result would be 8.6. | |
| | 2. | In the section of the table below titled “Expenses paid during the period,” locate the amount for your share class. You will find this number in the column labeled “Actual.” Multiply this number by the result from step 1. Your answer is an estimate of the expenses you paid on your account during the period. | |
If the value of your account falls below the minimum initial investment requirement applicable to you, your account generally will be subject to a $20 annual fee. This fee is not included in the accompanying table. If you are subject to the fee, keep it in mind when you are estimating the ongoing expenses of investing in the portfolio and when comparing the expenses of this portfolio with other funds.
As a portfolio shareholder, you incur two types of costs. There are transaction costs, which generally include sales charges on purchases and may include redemption fees or exchange fees. There are also ongoing costs, which generally include investment advisory fees, distribution and service (Rule 12b-1) fees and other portfolio expenses. The information on this page is intended to help you understand the ongoing costs of investing in the portfolio and to compare these costs with the ongoing costs of investing in other mutual funds.
Analyzing your portfolio’s expenses by share class
To illustrate these ongoing costs, we have provided an example and calculated the expenses paid by investors in each share class during the period. The information in the following table is based on an initial investment of $1,000, which is invested at the beginning of the period and held for the entire period. Expense information is calculated two ways and each method provides you with different information. The amount listed in the “Actual” column is calculated using the portfolio’s actual operating expenses and total return for the period. The amount listed in the “Hypothetical” column for each share class assumes that the return each year is 5% before expenses and is calculated based on the portfolio’s actual operating expenses. You should not use the hypothetical account values and expenses to estimate either your actual account balance at the end of the period or the expenses you paid during this period.
Compare with other funds
Since all mutual funds are required to include the same hypothetical calculations about expenses in shareholder reports, you can use this information to compare the ongoing costs of investing in the portfolio with other funds. To do so, compare the 5% hypothetical example with the 5% hypothetical examples that appear in the shareholder reports of other funds. As you compare hypothetical examples of other funds, it is important to note that hypothetical examples are meant to highlight the ongoing costs of investing in a fund and do not reflect any transaction costs, such as sales charges, redemption fees or exchange fees.
As a shareholder of the underlying funds in which it invests, the portfolio will bear its allocable share of the costs and expenses of these underlying funds. These costs and expenses are not included in the portfolio’s annualized expense ratios used to calculate the expense information below.
| | | | | | | | | | | | | | |
| 10/01/08 – 03/31/09 |
| | | | |
| | | Account value at the
beginning of the period ($) | | Account value at the
end of the period ($) | | Expenses paid
during the period ($) | | Portfolio’s annualized
expense ratio (%)* |
| | | Actual | | Hypothetical | | Actual | | Hypothetical | | Actual | | Hypothetical | | Actual |
Class A | | 1,000.00 | | 1,000.00 | | 669.51 | | 1,023.68 | | 1.04 | | 1.26 | | 0.25 |
Class B | | 1,000.00 | | 1,000.00 | | 667.51 | | 1,019.95 | | 4.16 | | 5.04 | | 1.00 |
Class C | | 1,000.00 | | 1,000.00 | | 666.72 | | 1,019.95 | | 4.16 | | 5.04 | | 1.00 |
Class Z | | 1,000.00 | | 1,000.00 | | 671.10 | | 1,024.93 | | — | | — | | — |
Expenses paid during the period are equal to the annualized expense ratio for the share class, multiplied by the average account value over the period, then multiplied by the number of days in the portfolio’s most recent fiscal half-year and divided by 365.
Had the investment advisor and/or any of its affiliates not waived fees or reimbursed a portion of expenses, account value at the end of the period would have been reduced.
It is important to note that the expense amounts shown in the table are meant to highlight only ongoing costs of investing in the portfolio and do not reflect any transaction costs, such as sales charges, redemption fees or exchange fees. Therefore, the hypothetical examples provided may not help you determine the relative total costs of owning shares of different funds. If these transaction costs were included, your costs would have been higher.
| * | Columbia Masters Global Equity Portfolio’s expense ratios do not include fees and expenses incurred by the underlying funds. |
5
Portfolio Managers’ Report – Columbia Masters Global Equity Portfolio
Performance data quoted represents past performance and current performance may be lower or higher. Past performance is no guarantee of future results. The investment return and principal value will fluctuate so that shares, when redeemed, may be worth more or less than the original cost. Please visit www.columbiafunds.com for daily and most recent month-end performance updates.
| | |
| Net asset value per share |
| |
as of 03/31/09 ($) | | |
Class A | | 5.57 |
Class B | | 5.50 |
Class C | | 5.50 |
Class Z | | 5.61 |
| | |
| Distributions declared per share |
|
04/01/08 – 03/31/09 ($) |
Class A | | 0.57 |
Class B | | 0.57 |
Class C | | 0.57 |
Class Z | | 0.57 |
For the 12-month period that ended March 31, 2009, the portfolio’s Class A shares returned negative 45.32% without sales charge. This compares with a negative 42.58% return for the portfolio’s benchmark, the MSCI World Index,1 over the same period. The average return for the portfolio’s peer group, the Lipper Global Multi-Cap Core Funds Classification,2 was negative 40.10%. The portfolio invests in shares of four Columbia Funds (the underlying funds), dividing its assets as follows: Columbia Strategic Investor Fund—25%; Columbia Marsico 21st Century Fund—25%; Columbia Multi-Advisor International Equity Fund—40%; and Columbia Acorn International—10%. Three of the four underlying funds lagged their respective benchmarks.
On February 20, 2009, the portfolio’s management team changed. Anwiti Bahuguna, Colin Moore, Kent M. Peterson and Marie M. Schofield took over as co-managers of the portfolio.
A challenging environment for the financial markets
Global stock markets continued to fall as a credit crisis rooted in the U.S. subprime market spread uncertainty around the world. Returns in all major foreign stock markets were negative over the past year as slowing economic activity and continued instability within the financial markets kept pressure on earnings and stock prices. In this environment, the underlying funds in the portfolio and their respective benchmarks experienced significant losses during the period. Columbia Marsico 21st Century Fund underperformed the Russell 3000 Index,3 returning negative 46.20% compared to the negative 38.20% return for the index. Columbia Strategic Investor Fund underperformed the Russell 1000 Index4 by a small margin, returning negative 38.38% compared to negative 38.27% for the index. Columbia Multi-Advisor International Equity Fund underperformed the MSCI EAFE Index,5 returning negative 48.06% compared to the index return of negative 46.51%. Columbia Acorn International performed slightly better than the S&P Global ex-U.S. Between $500 Million to $5 Billion Index,6 returning negative 46.99% versus the index return of negative 47.39%.
Looking ahead
As governments around the world aggressively implement stimulus packages, small pockets of economic data suggest that these measures may already be helping to stem
1 | The Morgan Stanley Capital International (MSCI) World Index tracks the performance of global stocks. |
2 | Lipper Inc., a widely respected data provider in the industry, calculates an average total return (assuming reinvestment of distributions) for mutual funds with investment objectives similar to those of the portfolio. Lipper makes no adjustment for the effect of sales loads. |
3 | The Russell 3000 Index measures the performance of 3,000 of the largest US companies, based on market capitalization. |
4 | The Russell 1000 Index measures the performance of 1,000 of the largest US companies, based on market capitalization. |
5 | The Morgan Stanley Capital International (MSCI) Europe, Australasia, Far East (EAFE) Index is a free float-adjusted market capitalization index that is designed to measure developed market equity performance, excluding the U.S. and Canada. |
6 | The S&P Global ex-U.S. Between $500 Million to $5 Billion Index is a subset of the broad market selected by the index sponsor representing the mid- and small-cap developed and emerging markets, excluding the United States. |
Indices are not available for investment, and do not reflect sales charges, fees, brokerage commissions, taxes or other expenses of investing. Securities in the portfolio may not match those in an index.
6
Portfolio Managers’ Report (continued) – Columbia Masters Global Equity Portfolio
the economic decline. The recent market downturn is the worst in more than 30 years, but it is not unprecedented. History shows that despite sharp declines that serve to restore balance at market extremes, stocks have been strong performers over the long term. However, investors who move in and out of the markets, trying to avoid downturns and catch upturns, often lose out on positive returns because they make their moves at exactly the wrong time. In today’s environment, as always, we believe that investors who stay focused on their goals have the potential to benefit over the long term from the broad equity diversification offered by Columbia Masters Global Equity Portfolio, even though diversification does not ensure a profit or guarantee against a loss.
Portfolio holdings and characteristics are subject to change periodically and may not be representative of current holdings and characteristics. The outlook for this portfolio may differ from that presented for other Columbia Funds.
Columbia Masters Portfolios reserve the right to add or remove underlying funds at any time.
Asset allocation cannot eliminate the risk of fluctuating prices and uncertain returns.
The portfolio is a “fund of funds.”
A fund of funds bears its allocable share of the costs and expenses of the underlying funds in which it invests. Such funds are thus subject to two levels of fees and a potentially higher expense ratio than would be associated with an investment in a fund that invests and trades directly in financial instruments under the direction of a single manager. Risks include stock market fluctuations due to business and economic developments.
Investments in small- and mid-cap companies may be subject to greater volatility and price fluctuations because they may be thinly traded and less liquid.
Value stocks may be subject to specific business risks that have caused the stocks to be out of favor.
International investing may involve certain risks, including currency fluctuations, risks associated with possible differences in financial accounting standards and other monetary and political risks. Significant levels of foreign taxes, including potentially confiscatory levels of taxation and withholding taxes, may also apply to some foreign investments.
Some of the countries in which the portfolio invests are considered emerging economies, which means there may be greater risks associated with investing there than in more developed countries. In addition, concentration of investments in a single region may result in greater volatility.
7
Portfolio Profile – Columbia Masters Heritage Portfolio
Performance data quoted represents past performance and current performance may be lower or higher. Past performance is no guarantee of future results. The investment return and principal value will fluctuate so that shares, when redeemed, may be worth more or less than the original cost. Please visit www.columbiafunds.com for daily and most recent month-end performance updates.
Summary
1-year return as of 03/31/09
| | |
| |
| | –31.84% Class A shares
(without sales charge) |
| |
| | –38.09% S&P 500 Index |
| |
 | | +1.96% Barclays Capital U.S. Intermediate Government/Credit Bond Index |
Morningstar Style Box™
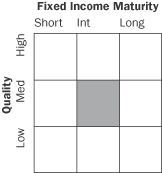
The Morningstar Style Box™ reveals a fund’s investment strategy. For equity funds, the vertical axis shows the market capitalization of the stocks owned, and the horizontal axis shows investment style (value, blend or growth). For fixed-income funds, the vertical axis shows the average credit quality of the bonds owned, and the horizontal axis shows interest rate sensitivity as measured by a bond’s duration (short, intermediate or long). Information shown is based on the most recent data provided by Morningstar.
Summary
| n | | For the 12-month period that ended March 31, 2009, the portfolio’s Class A shares returned negative 31.84% without sales charge. |
n | | In a period of contracting economic growth and sharply falling stock prices, the portfolio, its equity benchmark, the S&P 500 Index,1 and the average return of its peer group, the Lipper Global Flexible Portfolio Funds Classification,2 all lost more than 30%. The portfolio’s fixed income benchmark, the Barclays Capital U.S. Intermediate Government/Credit Bond Index,3 returned 1.96%. |
| n | | All three underlying funds in the portfolio underperformed their respective benchmarks. |
Portfolio Management
Anwiti Bahuguna, PhD has co-managed the portfolio since February 2009 and has been associated with the advisor or its predecessors or affiliate organizations since 2002.
Colin Moore has co-managed the portfolio since February 2009 and has been associated with the advisor or its predecessors or affiliate organizations since 2002.
Kent M. Peterson, PhD has co-managed the portfolio since February 2009 and has been associated with the advisor or its predecessors or affiliate organizations since 2006.
Marie M. Schofield has co-managed the portfolio since February 2009 and has been associated with the advisor or its predecessors or affiliate organizations since 1990.
1 | The Standard & Poor’s (S&P) 500 Index tracks the performance of 500 widely held, large capitalization US stocks. |
2 | Lipper Inc., a widely respected data provider in the industry, calculates an average total return (assuming reinvestment of distributions) for mutual funds with investment objectives similar to those of the portfolio. Lipper makes no adjustment for the effect of sales loads. |
3 | The Barclays Capital U.S. Intermediate Government/Credit Bond Index (formerly Lehman Brothers U.S. Intermediate Government/Credit Bond Index) tracks the performance of intermediate term U.S. government and corporate bonds. |
Indices are not available for investment, and do not reflect sales charges, fees, brokerage commissions, taxes or other expenses of investing. Securities in the portfolio may not match those in an index.
8
Performance Information – Columbia Masters Heritage Portfolio
Performance data quoted represents past performance and current performance may be lower or higher. Past performance is no guarantee of future results. The investment return and principal value will fluctuate so that shares, when redeemed, may be worth more or less than the original cost. Please visit www.columbiafunds.com for daily and most recent month-end performance updates.
| | |
| Annual operating expense ratio (%)* |
| |
Class A | | 1.46 |
Class B | | 2.21 |
Class C | | 2.21 |
Class Z | | 1.21 |
| | |
| | |
Annual operating expense ratio
after contractual waivers (%)* |
| |
Class A | | 1.12 |
Class B | | 1.87 |
Class C | | 1.87 |
Class Z | | 0.87 |
| * | The annual operating expense ratio and annual operating expense ratio after contractual waivers are as stated in the portfolio’s prospectus that is current as of the date of this report and include the expenses incurred by the underlying funds in which the portfolio invests. The contractual waiver expires 07/31/09. Differences in expense ratios disclosed elsewhere in this report may result from including expenses incurred by the underlying fund, fee waivers and expense reimbursements as well as different time periods used in calculating the ratios. |
|
| Performance of a $10,000 investment 02/15/06 – 03/31/09 |
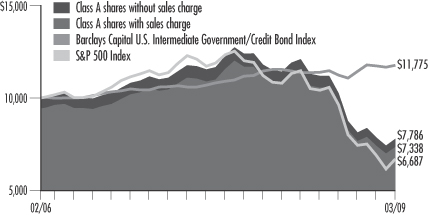
The chart above shows the change in value of a hypothetical $10,000 investment in Class A shares of Columbia Masters Heritage Portfolio during the stated time period, and does not reflect the deduction of taxes that a shareholder may pay on portfolio distributions or on the redemption of portfolio shares. The Standard & Poor’s (S&P) 500 Index tracks the performance of 500 widely held, large-capitalization US Stocks. The Barclays Capital U.S. Intermediate Government/Credit Bond Index tracks the performance of intermediate term US government and corporate bonds. Indices are not available for investment, and do not reflect sales charges, fees, brokerage commissions, taxes or other expenses of investing. Securities in the portfolio may not match those in an index.
| | | | |
| Performance of a $10,000 investment 02/15/06 – 03/31/09 ($) |
| | |
| Sales charge | | without | | with |
Class A | | 7,786 | | 7,338 |
Class B | | 7,609 | | 7,408 |
Class C | | 7,609 | | 7,609 |
Class Z | | 7,835 | | n/a |
| | | | | | | | | | | | | | |
| Average annual total return as of 03/31/09 (%) |
| | | | |
| Share class | | A | | B | | C | | Z |
| Inception | | 02/15/06 | | 02/15/06 | | 02/15/06 | | 02/15/06 |
| Sales charge | | without | | with | | without | | with | | without | | with | | without |
1-year | | –31.84 | | –35.74 | | –32.34 | | –35.55 | | –32.34 | | –32.99 | | –31.66 |
Life | | –7.70 | | –9.43 | | –8.38 | | –9.16 | | –8.38 | | –8.38 | | –7.51 |
The “with sales charge” returns include the maximum initial sales charge of 5.75% for Class A shares and the applicable contingent deferred sales charge of 5.00% in the first year, declining to 1.00% in the sixth year and eliminated thereafter for Class B shares and 1.00% for Class C shares for the first year only. The “without sales charge” returns do not include the effect of sales charges. If they had, returns would be lower.
Performance results reflect any fee waivers or reimbursements of portfolio expenses by the investment advisor and/or any of its affiliates. Absent these fee waivers or expense reimbursement arrangements, performance results would have been lower.
All results shown assume reinvestment of distributions. Class Z shares are sold at net asset value with no distribution and service (Rule 12b-1) fees. Class Z shares have limited eligibility and the investment minimum requirements may vary. Please see the portfolio’s prospectus for details. Performance for different share classes will vary based on differences in sales charges and fees associated with each class.
The tables do not reflect the deduction of taxes that a shareholder may pay on portfolio distributions or on the redemption of portfolio shares.
9
Understanding Your Expenses – Columbia Masters Heritage Portfolio
Estimating your actual expenses
To estimate the expenses that you paid over the period, first you will need your account balance at the end of the period:
| | n | | For shareholders who receive their account statements from Columbia Management Services, Inc., your account balance is available online at www.columbiafunds.com or by calling Shareholder Services at 800.345.6611. | |
| | n | | For shareholders who receive their account statements from their financial intermediary, contact your financial intermediary to obtain your account balance. | |
| | 1. | Divide your ending account balance by $1,000. For example, if an account balance was $8,600 at the end of the period, the result would be 8.6. | |
| | 2. | In the section of the table below titled “Expenses paid during the period,” locate the amount for your share class. You will find this number in the column labeled “Actual.” Multiply this number by the result from step 1. Your answer is an estimate of the expenses you paid on your account during the period. | |
If the value of your account falls below the minimum initial investment requirement applicable to you, your account generally will be subject to a $20 annual fee. This fee is not included in the accompanying table. If you are subject to the fee, keep it in mind when you are estimating the ongoing expenses of investing in the portfolio and when comparing the expenses of this portfolio with other funds.
As a portfolio shareholder, you incur two types of costs. There are transaction costs, which generally include sales charges on purchases and may include redemption fees or exchange fees. There are also ongoing costs, which generally include investment advisory fees, distribution and service (Rule 12b-1) fees and other portfolio expenses. The information on this page is intended to help you understand the ongoing costs of investing in the portfolio and to compare these costs with the ongoing costs of investing in other mutual funds.
Analyzing your portfolio’s expenses by share class
To illustrate these ongoing costs, we have provided an example and calculated the expenses paid by investors in each share class during the period. The information in the following table is based on an initial investment of $1,000, which is invested at the beginning of the period and held for the entire period. Expense information is calculated two ways and each method provides you with different information. The amount listed in the “Actual” column is calculated using the portfolio’s actual operating expenses and total return for the period. The amount listed in the “Hypothetical” column for each share class assumes that the return each year is 5% before expenses and is calculated based on the portfolio’s actual operating expenses. You should not use the hypothetical account values and expenses to estimate either your actual account balance at the end of the period or the expenses you paid during this period.
Compare with other funds
Since all mutual funds are required to include the same hypothetical calculations about expenses in shareholder reports, you can use this information to compare the ongoing costs of investing in the portfolio with other funds. To do so, compare the 5% hypothetical example with the 5% hypothetical examples that appear in the shareholder reports of other funds. As you compare hypothetical examples of other funds, it is important to note that hypothetical examples are meant to highlight the ongoing costs of investing in a fund and do not reflect any transaction costs, such as sales charges, redemption fees or exchange fees.
As a shareholder of the underlying funds in which it invests, the portfolio will bear its allocable share of the costs and expenses of these underlying funds. These costs and expenses are not included in the portfolio’s annualized expense ratios used to calculate the expense information below.
| | | | | | | | | | | | | | |
| 10/01/08 – 03/31/09 | | | | | | |
| | | | |
| | | Account value at the
beginning of the period ($) | | Account value at the end of the period ($) | | Expenses paid
during the period ($) | | Portfolio’s annualized
expense ratio (%)* |
| | | Actual | | Hypothetical | | Actual | | Hypothetical | | Actual | | Hypothetical | | Actual |
Class A | | 1,000.00 | | 1,000.00 | | 760.11 | | 1,023.68 | | 1.10 | | 1.26 | | 0.25 |
Class B | | 1,000.00 | | 1,000.00 | | 757.22 | | 1,019.95 | | 4.38 | | 5.04 | | 1.00 |
Class C | | 1,000.00 | | 1,000.00 | | 757.22 | | 1,019.95 | | 4.38 | | 5.04 | | 1.00 |
Class Z | | 1,000.00 | | 1,000.00 | | 760.51 | | 1,024.93 | | — | | — | | — |
Expenses paid during the period are equal to the annualized expense ratio for the share class, multiplied by the average account value over the period, then multiplied by the number of days in the portfolio’s most recent fiscal half-year and divided by 365.
Had the investment advisor and/or any of its affiliates not waived fees or reimbursed a portion of expenses, account value at the end of the period would have been reduced.
It is important to note that the expense amounts shown in the table are meant to highlight only ongoing costs of investing in the portfolio and do not reflect any transaction costs, such as sales charges, redemption fees or exchange fees. Therefore, the hypothetical examples provided may not help you determine the relative total costs of owning shares of different funds. If these transaction costs were included, your costs would have been higher.
| * | Columbia Masters Heritage Portfolio’s expense ratios do not include fees and expenses incurred by the underlying funds. |
10
Portfolio Managers’ Report – Columbia Masters Heritage Portfolio
Performance data quoted represents past performance and current performance may be lower or higher. Past performance is no guarantee of future results. The investment return and principal value will fluctuate so that shares, when redeemed, may be worth more or less than the original cost. Please visit www.columbiafunds.com for daily and most recent month-end performance updates.
| | |
| Net asset value per share |
| |
as of 03/31/09 ($) | | |
Class A | | 6.66 |
Class B | | 6.69 |
Class C | | 6.69 |
Class Z | | 6.64 |
| | |
| Distributions declared per share |
|
04/01/08 – 03/31/09 ($) |
Class A | | 0.56 |
Class B | | 0.50 |
Class C | | 0.50 |
Class Z | | 0.58 |
For the 12-month period that ended March 31, 2009, the portfolio’s Class A shares returned negative 31.84% without sales charge. The portfolio’s equity benchmark, the S&P 500 Index, returned negative 38.09% and the portfolio’s fixed income benchmark, the Barclays Capital U.S. Intermediate Government/Credit Bond Index, returned 1.96%.1 The portfolio’s return was slightly lower than the negative 31.36% average return of its peer group, the Lipper Global Flexible Portfolio Funds Classification.2 The portfolio generally divides its assets equally among Columbia Strategic Investor Fund, Columbia Marsico 21st Century Fund and Columbia Strategic Income Fund (the underlying funds). All three underlying funds underperformed their respective benchmarks for the period.
On February 20, 2009, the portfolio’s management team changed. Anwiti Bahuguna, Colin Moore, Kent M. Peterson and Marie M. Schofield took over as co-managers of the portfolio.
A challenging environment for the financial markets
Stock prices continued to fall and many bond market sectors remained under pressure as a credit crisis rooted in the U.S. subprime market continued to spread uncertainty around the world. Returns in all major U.S. stock market segments were negative over the past year as slowing economic activity and continued instability weighed on earnings and stock prices. In this environment, the underlying funds in the portfolio and two out of three of their respective benchmarks experienced losses during the period. Columbia Marsico 21st Century Fund underperformed the Russell 3000 Index,3 returning negative 46.20% compared to the negative 38.20% return for the index. Columbia Strategic Investor Fund fell just short of the Russell 1000 Index, 4 returning negative 38.38% compared to negative 38.27% for the index. Columbia Strategic Income Fund underperformed Barclays Capital U.S. Government/Credit Bond Index,5 returning negative 6.73% compared to a gain of 1.78% for the index.
Looking ahead
As the U.S. government, the Federal Reserve Board and the U.S. Treasury have taken active steps to stabilize the financial system and stimulate economic growth, small pockets of data suggest that these measures may already be helping to stem the economic decline. The recent market downturn is the worst in more than 30 years, but it is not unprecedented. History shows that despite sharp declines that serve to restore balance at market extremes, the stock market has been a strong performer over the long term. However, investors who move in and out of the markets, trying to avoid
1 | The Standard & Poor’s (S&P) 500 Index tracks the performance of 500 widely held, large capitalization US stocks. The Barclays Capital U.S. Intermediate Government/Credit Bond Index tracks the performance of intermediate term US government and corporate bonds. |
2 | Lipper Inc., a widely respected data provider in the industry, calculates an average total return (assuming reinvestment of distributions) for mutual funds with investment objectives similar to those of the portfolio. Lipper makes no adjustment for the effect of sales loads. |
3 | The Russell 3000 Index measures the performance of 3,000 of the largest US companies, based on market capitalization. |
4 | The Russell 1000 Index measures the performance of 1,000 of the largest US companies, based on market capitalization. |
5 | The Barclays Capital U.S. Government/Credit Bond Index (formerly Lehman Brothers U.S. Government/Credit Bond Index) tracks the performance of US government and corporate bonds rated investment grade or better, with maturities of at least one year. |
Indices are not available for investment, and do not reflect sales charges, fees, brokerage commissions, taxes or other expenses of investing. Securities in the portfolio may not match those in an index.
11
Portfolio Managers’ Report (continued) – Columbia Masters Heritage Portfolio
downturns and catch upturns, often lose out on positive returns because they make their moves at exactly the wrong time. In today’s environment, as always, we believe that investors who stay focused on their goals have the potential to benefit over the long term from the broad diversification offered by Columbia Masters Heritage Portfolio, even though diversification does not ensure a profit or guarantee against a loss.
Portfolio holdings and characteristics are subject to change periodically and may not be representative of current holdings and characteristics. The outlook for this portfolio may differ from that presented for other Columbia Funds.
Columbia Masters Portfolios reserve the right to add or remove underlying funds at any time.
Asset allocation cannot eliminate the risk of fluctuating prices and uncertain returns.
The portfolio is a “fund of funds.”
A fund of funds bears its allocable share of the costs and expenses of the underlying funds in which it invests. Such funds are thus subject to two levels of fees and a potentially higher expense ratio than would be associated with an investment in a fund that invests and trades directly in financial instruments under the direction of a single manager. Risks include stock market fluctuations due to business and economic developments.
Investments in small- and mid-cap companies may be subject to greater volatility and price fluctuations because they may be thinly traded and less liquid.
Value stocks may be subject to specific business risks that have caused the stocks to be out of favor.
International investing may involve certain risks, including currency fluctuations, risks associated with possible differences in financial accounting standards and other monetary and political risks. Significant levels of foreign taxes, including potentially confiscatory levels of taxation and withholding taxes, may also apply to some foreign investments.
Investing in emerging markets may involve greater risks than investing in more developed countries. In addition, concentration of investments in a single region may result in greater volatility.
Investing in fixed-income securities may involve certain risks, including the credit quality of individual issuers, possible prepayments, market or economic developments and yields and share price fluctuations due to changes in interest rates. When interest rates go up, bond prices typically drop, and vice versa. Lower quality debt securities involve greater risk of default or price volatility from changes in credit quality of individual issuers.
Investing in high-yield or “junk” bonds offers the potential for higher income than investments in investment-grade bonds, but also involves a higher degree of risk. Changes in economic conditions or other circumstances may adversely affect a high-yield bond issuer’s ability to make timely principal and interest payments. High-yield bonds issued by foreign entities have greater potential risks, including foreign taxation, currency fluctuations, risks associated with possible differences in financial standards and other monetary and political risks.
12
Portfolio Profile – Columbia Masters International Equity Portfolio
Performance data quoted represents past performance and current performance may be lower or higher. Past performance is no guarantee of future results. The investment return and principal value will fluctuate so that shares, when redeemed, may be worth more or less than the original cost. Please visit www.columbiafunds.com for daily and most recent month-end performance updates.
Summary
1-year return as of 03/31/09
| | |
| |
| | –48.03% Class A shares |
| | (without sales charge) |
| |
| | –46.51% MSCI EAFE Index |
Morningstar Style Box™
Equity Style
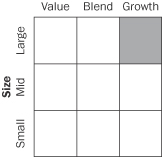
The Morningstar Style Box™ reveals a fund’s investment strategy. For equity funds, the vertical axis shows the market capitalization of the stocks owned, and the horizontal axis shows investment style (value, blend or growth.) Information shown is based on the most recent data provided by Morningstar.
Summary
| n | | For the 12-month period that ended March 31, 2009, the portfolio’s Class A shares returned negative 48.03% without sales charge. |
n | | In a period of contracting economic growth and sharply falling stock prices, the portfolio, its benchmark, the MSCI EAFE Index,1 and the average return of its peer group, the Lipper International Multi-Cap Core Funds Classification,2 all lost more than 45%. |
| n | | One of the portfolio’s underlying funds underperformed its benchmark while the other held up slightly better than its benchmark during this challenging period. |
Portfolio Management
Anwiti Bahuguna, PhD has co-managed the portfolio since February 2009 and has been associated with the advisor or its predecessors or affiliate organizations since 2002.
Colin Moore has co-managed the portfolio since February 2009 and has been associated with the advisor or its predecessors or affiliate organizations since 2002.
Kent M. Peterson, PhD has co-managed the portfolio since February 2009 and has been associated with the advisor or its predecessors or affiliate organizations since 2006.
Marie M. Schofield has co-managed the portfolio since February 2009 and has been associated with the advisor or its predecessors or affiliate organizations since 1990.
‘1 | The Morgan Stanley Capital International (MSCI) Europe, Australasia, Far East (EAFE) Index is a free float-adjusted market capitalization index that is designed to measure developed market equity performance, excluding the US and Canada. Indices are not available for investment, and do not reflect sales charges, fees, brokerage commissions, taxes or other expenses of investing. Securities in the portfolio may not match those in an index. |
2 | Lipper Inc., a widely respected data provider in the industry, calculates an average total return (assuming reinvestment of distributions) for mutual funds with investment objectives similar to those of the portfolio. Lipper makes no adjustment for the effect of sales loads. |
13
Performance Information – Columbia Masters International Equity Portfolio
Performance data quoted represents past performance and current performance may be lower or higher. Past performance is no guarantee of future results. The investment return and principal value will fluctuate so that shares, when redeemed, may be worth more or less than the original cost. Please visit www.columbiafunds.com for daily and most recent month-end performance updates.
| | |
| Annual operating expense ratio (%)* |
| |
Class A | | 1.41 |
Class B | | 2.16 |
Class C | | 2.16 |
Class R | | 1.66 |
Class Z | | 1.16 |
Annual operating expense ratio
after contractual waivers (%)* |
| |
Class A | | 1.18 |
Class B | | 1.93 |
Class C | | 1.93 |
Class R | | 1.43 |
Class Z | | 0.93 |
| * | The annual operating expense ratio and annual operating expense ratio after contractual waivers are as stated in the portfolio’s prospectus that is current as of the date of this report and include the expenses incurred by the underlying funds in which the portfolio invests. The contractual waiver expires 07/31/09. Differences in expense ratios disclosed elsewhere in this report may result from including expenses incurred by the underlying fund, fee waivers and expense reimbursements as well as different time periods used in calculating the ratios. |
|
| Performance of a $10,000 investment 02/15/06 – 03/31/09 |
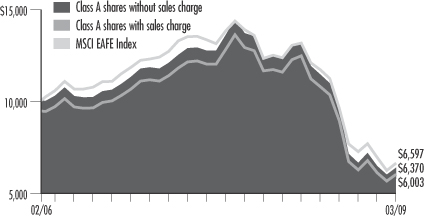
The chart above shows the change in value of a hypothetical $10,000 investment in Class A shares of Columbia Masters International Equity Portfolio during the stated time period, and does not reflect the deduction of taxes that a shareholder may pay on portfolio distributions or on the redemption of portfolio shares. The Morgan Stanley Capital International (MSCI) Europe, Australasia, Far East (EAFE) Index is a free float-adjusted market capitalization index that is designed to measure developed market equity performance, excluding the US and Canada. Indices are not available for investment, and do not reflect sales charges, fees, brokerage commissions, taxes or other expenses of investing. Securities in the portfolio may not match those in an index.
| | | | |
| Performance of a $10,000 investment 02/15/06 – 03/31/09 ($) |
| | |
| Sales charge | | without | | with |
Class A | | 6,370 | | 6,003 |
Class B | | 6,237 | | 6,074 |
Class C | | 6,226 | | 6,226 |
Class R | | 6,326 | | n/a |
Class Z | | 6,426 | | n/a |
| | | | | | | | | | | | | | | | |
| Average annual total return as of 03/31/09 (%) |
| | | | | |
| Share class | | A | | B | | C | | R | | Z |
| Inception | | 02/15/06 | | 02/15/06 | | 02/15/06 | | 02/15/06 | | 02/15/06 |
| Sales charge | | without | | with | | without | | with | | without | | with | | without | | without |
1-year | | –48.03 | | –51.02 | | –48.35 | | –50.79 | | –48.39 | | –48.88 | | –48.12 | | –47.84 |
Life | | –13.45 | | –15.07 | | –14.03 | | –14.75 | | –14.08 | | –14.08 | | –13.64 | | –13.20 |
The “with sales charge” returns include the maximum initial sales charge of 5.75% for Class A shares and the applicable contingent deferred sales charge of 5.00% in the first year, declining to 1.00% in the sixth year and eliminated thereafter for Class B shares and 1.00% for Class C shares for the first year only. The “without sales charge” returns do not include the effect of sales charges. If they had, returns would be lower.
Performance results reflect any fee waivers or reimbursements of portfolio expenses by the investment advisor and/or any of its affiliates. Absent these fee waivers or expense reimbursement arrangements, performance results would have been lower.
All results shown assume reinvestment of distributions. Class Z shares are sold at net asset value with no distribution and service (Rule 12b-1) fees. Class R and Class Z shares have limited eligibility and the investment minimum requirements may vary. Please see the portfolio’s prospectus for details. Performance for different share classes will vary based on differences in sales charges and fees associated with each class.
The tables do not reflect the deduction of taxes that a shareholder may pay on portfolio distributions or on the redemption of portfolio shares.
14
Understanding Your Expenses – Columbia Masters International Equity Portfolio
Estimating your actual expenses
To estimate the expenses that you paid over the period, first you will need your account balance at the end of the period:
| | n | | For shareholders who receive their account statements from Columbia Management Services, Inc., your account balance is available online at www.columbiafunds.com or by calling Shareholder Services at 800.345.6611. | |
| | n | | For shareholders who receive their account statements from their financial intermediary, contact your financial intermediary to obtain your account balance. | |
| | 1. | Divide your ending account balance by $1,000. For example, if an account balance was $8,600 at the end of the period, the result would be 8.6. | |
| | 2. | In the section of the table below titled “Expenses paid during the period,” locate the amount for your share class. You will find this number in the column labeled “Actual.” Multiply this number by the result from step 1. Your answer is an estimate of the expenses you paid on your account during the period. | |
If the value of your account falls below the minimum initial investment requirement applicable to you, your account generally will be subject to a $20 annual fee. This fee is not included in the accompanying table. If you are subject to the fee, keep it in mind when you are estimating the ongoing expenses of investing in the portfolio and when comparing the expenses of this portfolio with other funds.
As a portfolio shareholder, you incur two types of costs. There are transaction costs, which generally include sales charges on purchases and may include redemption fees or exchange fees. There are also ongoing costs, which generally include investment advisory fees, distribution and service (Rule 12b-1) fees and other portfolio expenses. The information on this page is intended to help you understand the ongoing costs of investing in the portfolio and to compare these costs with the ongoing costs of investing in other mutual funds.
Analyzing your portfolio’s expenses by share class
To illustrate these ongoing costs, we have provided an example and calculated the expenses paid by investors in each share class during the period. The information in the following table is based on an initial investment of $1,000, which is invested at the beginning of the period and held for the entire period. Expense information is calculated two ways and each method provides you with different information. The amount listed in the “Actual” column is calculated using the portfolio’s actual operating expenses and total return for the period. The amount listed in the “Hypothetical” column for each share class assumes that the return each year is 5% before expenses and is calculated based on the portfolio’s actual operating expenses. You should not use the hypothetical account values and expenses to estimate either your actual account balance at the end of the period or the expenses you paid during this period.
Compare with other funds
Since all mutual funds are required to include the same hypothetical calculations about expenses in shareholder reports, you can use this information to compare the ongoing costs of investing in the portfolio with other funds. To do so, compare the 5% hypothetical example with the 5% hypothetical examples that appear in the shareholder reports of other funds. As you compare hypothetical examples of other funds, it is important to note that hypothetical examples are meant to highlight the ongoing costs of investing in a fund and do not reflect any transaction costs, such as sales charges, redemption fees or exchange fees.
As a shareholder of the underlying funds in which it invests, the portfolio will bear its allocable share of the costs and expenses of these underlying funds. These costs and expenses are not included in the portfolio’s annualized expense ratios used to calculate the expense information below.
| | | | | | | | | | | | | | |
| | | | |
| | | Account value at the
beginning of the period ($) | | Account value at the
end of the period ($) | | Expenses paid
during the period ($) | | Portfolio’s annualized
expense ratio (%)* |
| | | Actual | | Hypothetical | | Actual | | Hypothetical | | Actual | | Hypothetical | | Actual |
Class A | | 1,000.00 | | 1,000.00 | | 675.29 | | 1,023.68 | | 1.04 | | 1.26 | | 0.25 |
Class B | | 1,000.00 | | 1,000.00 | | 673.70 | | 1,019.95 | | 4.17 | | 5.04 | | 1.00 |
Class C | | 1,000.00 | | 1,000.00 | | 673.30 | | 1,019.95 | | 4.17 | | 5.04 | | 1.00 |
Class R | | 1,000.00 | | 1,000.00 | | 675.29 | | 1,022.44 | | 2.09 | | 2.52 | | 0.50 |
Class Z | | 1,000.00 | | 1,000.00 | | 677.29 | | 1,024.93 | | — | | — | | — |
Expenses paid during the period are equal to the annualized expense ratio for the share class, multiplied by the average account value over the period, then multiplied by the number of days in the portfolio’s most recent fiscal half-year and divided by 365.
Had the investment advisor and/or any of its affiliates not waived fees or reimbursed a portion of expenses, account value at the end of the period would have been reduced.
It is important to note that the expense amounts shown in the table are meant to highlight only ongoing costs of investing in the portfolio and do not reflect any transaction costs, such as sales charges, redemption fees or exchange fees. Therefore, the hypothetical examples provided may not help you determine the relative total costs of owning shares of different funds. If these transaction costs were included, your costs would have been higher.
* Columbia Masters International Equity Portfolio’s expense ratios do not include fees and expenses incurred by the underlying funds.
15
Portfolio Managers’ Report – Columbia Masters International Equity Portfolio
Performance data quoted represents past performance and current performance may be lower or higher. Past performance is no guarantee of future results. The investment return and principal value will fluctuate so that shares, when redeemed, may be worth more or less than the original cost. Please visit www.columbiafunds.com for daily and most recent month-end performance updates.
| | |
| Net asset value per share |
| |
as of 03/31/09 ($) | | |
Class A | | 5.49 |
Class B | | 5.43 |
Class C | | 5.42 |
Class R | | 5.47 |
Class Z | | 5.52 |
| | |
| | |
| Distributions declared per share |
| |
04/01/08 – 03/31/09 ($) | | |
Class A | | 0.56 |
Class B | | 0.56 |
Class C | | 0.56 |
Class R | | 0.56 |
Class Z | | 0.56 |
For the 12-month period that ended March 31, 2009, the portfolio’s Class A shares returned negative 48.03% without sales charge. The fund’s benchmark, the MSCI EAFE Index,1 returned negative 46.51% over the same period. The average return for the portfolio’s peer group, the Lipper International Multi-Cap Core Funds Classification,2 was negative 45.80%. The portfolio invests in shares of two Columbia Funds (the underlying funds), generally dividing its assets as follows: Columbia Multi-Advisor International Equity Fund—80%; and Columbia Acorn International—20%. These underlying funds generated mixed results against their individual benchmarks.
On February 20, 2009, the portfolio’s management team changed. Anwiti Bahuguna, Colin Moore, Kent M. Peterson and Marie M. Schofield took over as co-managers of the portfolio.
A challenging environment for the financial markets
Global stock markets continued to fall as a credit crisis rooted in the U.S. subprime market spread uncertainty around the world. Returns in all major foreign stock markets were negative over the past year as slowing economic activity and continued instability within the financial markets kept pressure on earnings and stock prices. In this environment, the underlying funds in the portfolio and their respective benchmarks experienced significant losses during the period. Columbia Multi-Advisor International Equity Fund’s performance was below that of the MSCI EAFE Index, returning negative 48.06% compared to the index return of negative 46.51%. Columbia Acorn International Fund held up better than the S&P Global ex-U.S. Between $500 Million to $5 Billion Index,3 returning negative 46.99% versus the index return of negative 47.39%.
Looking ahead
As foreign governments join the U.S. government in aggressively implementing stimulus packages, small pockets of economic data suggest that these measures may already be helping to stem the economic decline. The recent market downturn is the worst in more than 30 years, but it is not unprecedented. History shows that despite sharp declines that serve to restore balance at market extremes, the stock market has been a strong performer over the long term. However, investors who move in and out of the markets, trying to avoid downturns and catch upturns, often lose out on positive returns because they make their moves at exactly the wrong time. In today’s environment, as always, we believe that investors who stay focused on their goals have the potential to benefit over the long term from the broad equity diversification offered by Columbia Masters International Equity Portfolio, even though diversification does not ensure a profit or guarantee against a loss.
1 | The Morgan Stanley Capital International (MSCI) Europe, Australasia, Far East (EAFE) Index is a free float-adjusted market capitalization index that is designed to measure developed market equity performance, excluding the US and Canada. |
2 | Lipper Inc., a widely respected data provider in the industry, calculates an average total return (assuming reinvestment of distributions) for mutual funds with investment objectives similar to those of the portfolio. Lipper makes no adjustment for the effect of sales loads. |
3 | The S&P Global ex-U.S. Between $500 Million to $5 Billion Index is a subset of the broad market selected by the index sponsor representing the mid- and small-cap developed and emerging markets, excluding the United States. |
Indices are not available for investment, and do not reflect sales charges, fees, brokerage commissions, taxes or other expenses of investing. Securities in the portfolio may not match those in an index.
16
Portfolio Managers’ Report (continued) – Columbia Masters International Equity Portfolio
Portfolio holdings and characteristics are subject to change periodically and may not be representative of current holdings and characteristics. The outlook for this portfolio may differ from that presented for other Columbia Funds.
Columbia Masters Portfolios reserves the right to add or remove underlying funds at any time.
Asset allocation cannot eliminate the risk of fluctuating prices and uncertain returns.
The portfolio is a “fund of funds.”
A fund of funds bears its allocable share of the costs and expenses of the underlying funds in which it invests. Such funds are thus subject to two levels of fees and a potentially higher expense ratio than would be associated with an investment in a fund that invests and trades directly in financial instruments under the direction of a single manager. Risks include stock market fluctuations due to business and economic developments.
Investments in small- and mid-cap companies may be subject to greater volatility and price fluctuations because they may be thinly traded and less liquid.
Value stocks may be subject to specific business risks that have caused the stocks to be out of favor.
International investing may involve certain risks, including currency fluctuations, risks associated with possible differences in financial accounting standards and other monetary and political risks. Significant levels of foreign taxes, including potentially confiscatory levels of taxation and withholding taxes, may also apply to some foreign investments.
Some of the countries in which the portfolio invests are considered emerging economies, which means there may be greater risks associated with investing there than in more developed countries. In addition, concentration of investments in a single region may result in greater volatility.
17
Investment Portfolio – Columbia Masters Global Equity Portfolio
March 31, 2009
| | | | | | | |
| | | | | Shares | | Value ($) | |
| Investment Companies(a) – 100.7% | | | |
| | Columbia Acorn International, Class Z | | 83,646 | | 1,760,740 | |
| | Columbia Marsico 21st Century Fund, Class Z | | 568,442 | | 4,428,162 | |
| | Columbia Multi-Advisor International Equity Fund, Class Z | | 877,108 | | 7,025,638 | |
| | Columbia Strategic Investor Fund, Class Z | | 395,886 | | 4,429,967 | |
| | | | | | | |
| | Total Investment Companies (cost of $33,050,050) | | | | 17,644,507 | |
| | | |
| | | | | | | |
| | Total Investments – 100.7% (cost of $33,050,050)(b) | | | | 17,644,507 | |
| | | |
| | | | | | | |
| | Other Assets & Liabilities, Net – (0.7)% | | | | (116,491 | ) |
| | | |
| | | | | | | |
| | Net Assets – 100.0% | | | | 17,528,016 | |
Notes to Investment Portfolio:
On April 1, 2008, the Portfolio adopted Statement of Financial Accounting Standards No. 157, Fair Value Measurements (“SFAS 157”). SFAS 157 establishes a hierarchy that prioritizes the inputs to valuation techniques used to measure fair value giving the highest priority to unadjusted quoted prices in active markets for identical securities (level 1 measurements) and the lowest priority to unobservable inputs (level 3 measurements) when market prices are not readily available or reliable. The three levels of the fair value hierarchy under SFAS 157 are described below:
| | • | | Level 1 – quoted prices in active markets for identical securities |
| | • | | Level 2 – prices determined using other significant observable inputs (including quoted prices for similar securities, interest rates, prepayment speeds, credit risk and others) |
| | • | | Level 3 – prices determined using significant unobservable inputs. In situations where quoted prices or observable inputs are unavailable or less reliable, unobservable inputs may be used. Unobservable inputs may include management’s own assumptions about the factors market participants would use in pricing an investment. |
The inputs or methodology used for valuing securities are not necessarily an indication of the risk associated with investing in those securities.
The following table summarizes the inputs used, as of March 31, 2009, in valuing the Portfolio’s assets:
| | | | | | |
Valuation Inputs | | Investments in
Securities | | Other Financial
Instruments |
Level 1 – Quoted Prices | | $ | 17,644,507 | | $ | — |
Level 2 – Other Significant Observable Inputs | | | — | | | — |
Level 3 – Significant Unobservable Inputs | | | — | | | — |
| | | | | | |
Total | | $ | 17,644,507 | | $ | — |
| | (a) | Mutual funds registered under the Investment Company Act of 1940, as amended, and advised by Columbia Management Advisors, LLC or its affiliates. |
| | (b) | Cost for federal income tax purposes is $34,054,666. |
See Accompanying Notes to Financial Statements.
18
Investment Portfolio – Columbia Masters Heritage Portfolio
March 31, 2009
| | | | | | | |
| | | | | Shares | | Value ($) | |
| Investment Companies(a) – 100.3% | | | | | | | |
| | Columbia Marsico 21st Century Fund, Class Z | | 2,701,083 | | 21,041,435 | |
| | Columbia Strategic Income Fund, Class Z | | 4,224,151 | | 21,543,168 | |
| | Columbia Strategic Investor Fund, Class Z | | 2,018,867 | | 22,591,120 | |
| | | | | | | |
| | Total Investment Companies (cost of $101,571,227) | | | | 65,175,723 | |
| | | |
| | | | | | | |
| | Total Investments – 100.3% (cost of $101,571,227)(b) | | | | 65,175,723 | |
| | | |
| | | | | | | |
| | Other Assets & Liabilities, Net – (0.3)% | | | | (216,926 | ) |
| | | |
| | | | | | | |
| | Net Assets – 100.0% | | | | 64,958,797 | |
Notes to Investment Portfolio:
On April 1, 2008, the Portfolio adopted Statement of Financial Accounting Standards No. 157, Fair Value Measurements (“SFAS 157”). SFAS 157 establishes a hierarchy that prioritizes the inputs to valuation techniques used to measure fair value giving the highest priority to unadjusted quoted prices in active markets for identical securities (level 1 measurements) and the lowest priority to unobservable inputs (level 3 measurements) when market prices are not readily available or reliable. The three levels of the fair value hierarchy under SFAS 157 are described below:
| | • | | Level 1 – quoted prices in active markets for identical securities |
| | • | | Level 2 – prices determined using other significant observable inputs (including quoted prices for similar securities, interest rates, prepayment speeds, credit risk and others) |
| | • | | Level 3 – prices determined using significant unobservable inputs. In situations where quoted prices or observable inputs are unavailable or less reliable, unobservable inputs may be used. Unobservable inputs may include management’s own assumptions about the factors market participants would use in pricing an investment. |
The inputs or methodology used for valuing securities are not necessarily an indication of the risk associated with investing in those securities.
The following table summarizes the inputs used, as of March 31, 2009, in valuing the Portfolio’s assets:
| | | | | | |
Valuation Inputs | | Investments in
Securities | | Other Financial
Instruments |
Level 1 – Quoted Prices | | $ | 65,175,723 | | $ | — |
Level 2 – Other Significant Observable Inputs | | | — | | | — |
Level 3 – Significant Unobservable Inputs | | | — | | | — |
| | | | | | |
Total | | $ | 65,175,723 | | $ | — |
| | (a) | Mutual funds registered under the Investment Company Act of 1940, as amended, and advised by Columbia Management Advisors, LLC or its affiliates. |
| | (b) | Cost for federal income tax purposes is $102,603,646. |
See Accompanying Notes to Financial Statements.
19
Investment Portfolio – Columbia Masters International Equity Portfolio
March 31, 2009
| | | | | | | |
| | | | | Shares | | Value ($) | |
| Investment Companies(a) – 100.1% | | | |
| | Columbia Acorn International, Class Z | | 1,077,326 | | 22,677,717 | |
| | Columbia Multi-Advisor International Equity Fund,
Class Z | | 11,541,252 | | 92,445,429 | |
| | | | | | | |
| | Total Investment Companies (cost of $227,876,446) | | | | 115,123,146 | |
| | | |
| | | | | | | |
| | Total Investments – 100.1% (cost of $227,876,446)(b) | | 115,123,146 | |
| | | |
| | | | | | | |
| | Other Assets & Liabilities, Net – (0.1)% | | | | (150,422 | ) |
| | | |
| | | | | | | |
| | Net Assets – 100.0% | | | | 114,972,724 | |
Notes to Investment Portfolio:
On April 1, 2008, the Portfolio adopted Statement of Financial Accounting Standards No. 157, Fair Value Measurements (“SFAS 157”). SFAS 157 establishes a hierarchy that prioritizes the inputs to valuation techniques used to measure fair value giving the highest priority to unadjusted quoted prices in active markets for identical securities (level 1 measurements) and the lowest priority to unobservable inputs (level 3 measurements) when market prices are not readily available or reliable. The three levels of the fair value hierarchy under SFAS 157 are described below:
| | • | | Level 1 – quoted prices in active markets for identical securities |
| | • | | Level 2 – prices determined using other significant observable inputs (including quoted prices for similar securities, interest rates, prepayment speeds, credit risk and others) |
| | • | | Level 3 – prices determined using significant unobservable inputs. In situations where quoted prices or observable inputs are unavailable or less reliable, unobservable inputs may be used. Unobservable inputs may include management’s own assumptions about the factors market participants would use in pricing an investment. |
The inputs or methodology used for valuing securities are not necessarily an indication of the risk associated with investing in those securities.
The following table summarizes the inputs used, as of March 31, 2009, in valuing the Portfolio’s assets:
| | | | | | |
Valuation Inputs | | Investments in
Securities | | Other Financial
Instruments |
Level 1 – Quoted Prices | | $ | 115,123,146 | | $ | — |
Level 2 – Other Significant Observable Inputs | | | — | | | — |
Level 3 – Significant Unobservable Inputs | | | — | | | — |
| | | | | | |
Total | | $ | 115,123,146 | | $ | — |
| | (a) | Mutual funds registered under the Investment Company Act of 1940, as amended, and advised by Columbia Management Advisors, LLC or its affiliates. |
| | (b) | Cost for federal income tax purposes is $242,136,325. |
See Accompanying Notes to Financial Statements.
20
Statements of Assets and Liabilities – Columbia Masters Portfolios
March 31, 2009
| | | | | | | | | |
| | | Columbia
Masters Global
Equity Portfolio
($) | | | Columbia
Masters
Heritage
Portfolio
($) | | | Columbia
Masters
International
Equity Portfolio
($) | |
Assets | | | | | | | | | |
Affiliated investments, at identified cost | | 33,050,050 | | | 101,571,227 | | | 227,876,446 | |
| | | | | | | | | |
Affiliated investments, at value | | 17,644,507 | | | 65,175,723 | | | 115,123,146 | |
Receivable for: | | | | | | | | | |
Investments sold | | 23,521 | | | 75,304 | | | 154,427 | |
Portfolio shares sold | | 9,705 | | | 37,720 | | | 63,657 | |
Expense reimbursement due from investment advisor | | 14,311 | | | 23,207 | | | 39,911 | |
Other assets | | 331 | | | 1,039 | | | 2,088 | |
| | | | | | | | | | |
Total Assets | | 17,692,375 | | | 65,312,993 | | | 115,383,229 | |
| | | |
| Liabilities | | | | | | | | | |
Payable for: | | | | | | | | | |
Portfolio shares repurchased | | 85,240 | | | 243,229 | | | 281,739 | |
Transfer agent fee | | 9,191 | | | 19,002 | | | 46,689 | |
Trustees’ fees | | 14,627 | | | 14,602 | | | 14,253 | |
Audit fee | | 17,292 | | | 17,292 | | | 17,292 | |
Legal fees | | 12,001 | | | 12,149 | | | 12,355 | |
Pricing and bookkeeping fees | | 2,174 | | | 2,194 | | | 2,194 | |
Custody fee | | 835 | | | 835 | | | 835 | |
Distribution and service fees | | 7,718 | | | 29,317 | | | 19,575 | |
Reports to shareholders | | 14,042 | | | 14,337 | | | 14,224 | |
Chief compliance officer expenses | | 163 | | | 171 | | | 160 | |
Other liabilities | | 1,076 | | | 1,068 | | | 1,189 | |
| | | | | | | | | | |
Total Liabilities | | 164,359 | | | 354,196 | | | 410,505 | |
| | | | | | | | | | |
Net Assets | | 17,528,016 | | | 64,958,797 | | | 114,972,724 | |
| | | |
| Net Assets Consist of | | | | | | | | | |
Paid-in capital | | 37,788,129 | | | 104,820,544 | | | 262,253,254 | |
Undistributed net investment income | | 37,039 | | | — | | | 1,574,766 | |
Accumulated net realized loss | | (4,891,609 | ) | | (3,466,243 | ) | | (36,101,996 | ) |
Net unrealized depreciation on investments | | (15,405,543 | ) | | (36,395,504 | ) | | (112,753,300 | ) |
| | | | | | | | | | |
Net Assets | | 17,528,016 | | | 64,958,797 | | | 114,972,724 | |
See Accompanying Notes to Financial Statements.
21
Statements of Assets and Liabilities (continued) – Columbia Masters Portfolios
March 31, 2009
| | | | | | | | | | | | |
| | | Columbia
Masters Global
Equity Portfolio | | | Columbia
Masters
Heritage
Portfolio | | | Columbia
Masters
International
Equity Portfolio | |
Class A | | | | | | | | | | | | |
Net assets | | $ | 10,348,118 | | | $ | 38,188,427 | | | $ | 44,547,987 | |
Shares outstanding | | | 1,857,463 | | | | 5,732,413 | | | | 8,109,206 | |
Net asset value per share(a) | | $ | 5.57 | | | $ | 6.66 | | | $ | 5.49 | |
Maximum sales charge | | | 5.75 | % | | | 5.75 | % | | | 5.75 | % |
Maximum offering price per share(b) | | $ | 5.91 | | | $ | 7.07 | | | $ | 5.82 | |
| | | |
| Class B | | | | | | | | | | | | |
Net assets | | $ | 3,778,260 | | | $ | 14,152,227 | | | $ | 3,042,765 | |
Shares outstanding | | | 687,303 | | | | 2,115,366 | | | | 560,664 | |
Net asset value and offering price per share(a) | | $ | 5.50 | | | $ | 6.69 | | | $ | 5.43 | |
| | | |
| Class C | | | | | | | | | | | | |
Net assets | | $ | 2,942,222 | | | $ | 11,576,209 | | | $ | 9,087,363 | |
Shares outstanding | | | 534,647 | | | | 1,730,258 | | | | 1,675,674 | |
Net asset value and offering price per share(a) | | $ | 5.50 | | | $ | 6.69 | | | $ | 5.42 | |
| | | |
| Class R | | | | | | | | | | | | |
Net assets | | $ | — | | | $ | — | | | $ | 26,450 | |
Shares outstanding | | | — | | | | — | | | | 4,839 | |
Net asset value and offering price per share | | $ | — | | | $ | — | | | $ | 5.47 | (c) |
| | | |
| Class Z | | | | | | | | | | | | |
Net assets | | $ | 459,416 | | | $ | 1,041,934 | | | $ | 58,268,159 | |
Shares outstanding | | | 81,961 | | | | 156,834 | | | | 10,559,004 | |
Net asset value, offering and redemption price per share | | $ | 5.61 | (c) | | $ | 6.64 | | | $ | 5.52 | (c) |
| (a) | Redemption price per share is equal to net asset value less any applicable contingent deferred sales charge and for, Columbia Masters Global Equity Portfolio and Columbia Masters International Equity Portfolio, any applicable redemption fees. |
| (b) | On sales of $50,000 or more the offering price is reduced. |
| (c) | Redemption price per share is equal to net asset value less any applicable redemption fees. |
See Accompanying Notes to Financial Statements.
22
Statements of Operations – Columbia Masters Portfolios
For the Year Ended March 31, 2009
| | | | | | | | | |
| | | Columbia
Masters Global
Equity Portfolio
($) | | | Columbia
Masters
Heritage
Portfolio ($) | | | Columbia
Masters
International
Equity Portfolio
($) | |
| Investment Income | | | | | | | | | |
Dividends from affiliates | | 167,657 | | | 2,520,130 | | | 1,543,568 | |
| | | | | | | | | | |
Total Investment Income | | 167,657 | | | 2,520,130 | | | 1,543,568 | |
| | | |
| Expenses | | | | | | | | | |
Distribution fee: | | | | | | | | | |
Class B | | 47,064 | | | 144,500 | | | 41,003 | |
Class C | | 38,968 | | | 131,489 | | | 143,378 | |
Class R | | — | | | — | | | 151 | |
Service fee: | | | | | | | | | |
Class A | | 44,387 | | | 136,180 | | | 217,115 | |
Class B | | 15,688 | | | 48,167 | | | 13,668 | |
Class C | | 12,989 | | | 43,830 | | | 47,815 | |
Transfer agent fee | | 63,301 | | | 130,136 | | | 228,566 | |
Pricing and bookkeeping fees | | 26,152 | | | 26,163 | | | 26,151 | |
Trustees’ fees | | (301 | ) | | (301 | ) | | (427 | ) |
Custody fee | | 5,030 | | | 5,024 | | | 5,043 | |
Registration fees | | 40,969 | | | 40,204 | | | 62,213 | |
Audit fee | | 27,453 | | | 27,453 | | | 27,454 | |
Legal fees | | 48,049 | | | 45,853 | | | 47,477 | |
Reports to shareholders | | 42,448 | | | 48,308 | | | 76,582 | |
Chief compliance officer expenses | | 639 | | | 657 | | | 699 | |
Other expenses | | 6,015 | | | 7,040 | | | 10,061 | |
| | | | | | | | | | |
Total Expenses | | 418,851 | | | 834,703 | | | 946,949 | |
| | | |
Fees waived or expenses reimbursed by investment advisor | | (259,594 | ) | | (330,397 | ) | | (483,770 | ) |
Expense reductions | | (161 | ) | | (140 | ) | | (49 | ) |
| | | | | | | | | | |
Net Expenses | | 159,096 | | | 504,166 | | | 463,130 | |
| | | |
| | | | | | | | | | |
Net Investment Income | | 8,561 | | | 2,015,964 | | | 1,080,438 | |
| | | |
| Net Realized and Unrealized Gain (Loss) on Investments and Capital Gains Distributions Received | | | | | | | | | |
Net realized gain (loss) on: | | | | | | | | | |
Capital gains distributions received | | 260,604 | | | — | | | 3,260,052 | |
Affiliated investments | | (4,731,705 | ) | | (3,245,691 | ) | | (37,989,416 | ) |
| | | | | | | | | | |
Net realized loss | | (4,471,101 | ) | | (3,245,691 | ) | | (34,729,364 | ) |
Net change in unrealized appreciation (depreciation) on investments | | (13,170,699 | ) | | (34,085,146 | ) | | (91,142,049 | ) |
| | | | | | | | | | |
Net Loss | | (17,641,800 | ) | | (37,330,837 | ) | | (125,871,413 | ) |
| | | |
| | | | | | | | | | |
Net Decrease Resulting from Operations | | (17,633,239 | ) | | (35,314,873 | ) | | (124,790,975 | ) |
See Accompanying Notes to Financial Statements.
23
Statements of Changes in Net Assets – Columbia Masters Portfolios
| | | | | | | | | | | | | | | | | | |
Increase (Decrease) in
Net Assets | | Columbia Masters
Global Equity Portfolio | | | Columbia Masters
Heritage Portfolio | | | Columbia Masters
International Equity
Portfolio | |
| | | Year Ended
March 31,
2009 ($) | | | Year Ended
March 31,
2008 ($) | | | Year Ended
March 31,
2009 ($) | | | Year Ended
March 31,
2008 ($) | | | Year Ended
March 31,
2009 ($) | | | Year Ended
March 31,
2008 ($) | |
Operations | | | | | | | | | | | | | | | | | | |
Net investment income | | 8,561 | | | 178,849 | | | 2,015,964 | | | 1,912,841 | | | 1,080,438 | | | 2,890,235 | |
Net realized gain (loss) on investments and capital gains distributions received | | (4,471,101 | ) | | 3,148,795 | | | (3,245,691 | ) | | 4,779,105 | | | (34,729,364 | ) | | 21,956,755 | |
Net change in unrealized appreciation (depreciation) on investments | | (13,170,699 | ) | | (3,694,340 | ) | | (34,085,146 | ) | | (4,794,451 | ) | | (91,142,049 | ) | | (27,908,281 | ) |
| | | | | | | | | | | | | | | | | | |
Net increase (decrease) resulting from operations | | (17,633,239 | ) | | (366,696 | ) | | (35,314,873 | ) | | 1,897,495 | | | (124,790,975 | ) | | (3,061,291 | ) |
| | | | | | |
Distributions to Shareholders | | | | | | | | | | | | | | | | | | |
From net investment income: | | | | | | | | | | | | | | | | | | |
Class A | | — | | | (194,763 | ) | | (1,342,663 | ) | | (1,385,734 | ) | | — | | | (1,466,193 | ) |
Class B | | — | | | (10,653 | ) | | (333,837 | ) | | (242,397 | ) | | — | | | (50,977 | ) |
Class C | | — | | | (12,802 | ) | | (296,733 | ) | | (222,371 | ) | | — | | | (200,355 | ) |
Class R | | — | | | — | | | — | | | — | | | — | | | (480 | ) |
Class Z | | — | | | (14,100 | ) | | (44,065 | ) | | (66,412 | ) | | — | | | (1,358,042 | ) |
From net realized gains: | | | | | | | | | | | | | | | | | | |
Class A | | (1,289,385 | ) | | (963,268 | ) | | (2,240,360 | ) | | (691,008 | ) | | (6,297,110 | ) | | (5,937,125 | ) |
Class B | | (451,990 | ) | | (343,924 | ) | | (765,491 | ) | | (250,398 | ) | | (384,037 | ) | | (431,500 | ) |
Class C | | (383,130 | ) | | (262,548 | ) | | (715,834 | ) | | (230,214 | ) | | (1,386,698 | ) | | (1,540,585 | ) |
Class R | | — | | | — | | | — | | | — | | | (2,274 | ) | | (1,549 | ) |
Class Z | | (56,069 | ) | | (35,746 | ) | | (71,619 | ) | | (27,455 | ) | | (5,017,621 | ) | | (3,788,037 | ) |
| | | | | | | | | | | | | | | | | | |
Total distributions to shareholders | | (2,180,574 | ) | | (1,837,804 | ) | | (5,810,602 | ) | | (3,115,989 | ) | | (13,087,740 | ) | | (14,774,843 | ) |
| | | | | | |
Net Capital Stock Transactions | | (2,406,028 | ) | | 10,945,057 | | | (6,373,148 | ) | | 21,011,509 | | | 8,384,453 | | | 128,740,257 | |
| | | | | | | | | | | | | | | | | | |
Redemption fees | | 1,330 | | | 5,556 | | | — | | | — | | | 39,630 | | | 22,974 | |
Total increase (decrease) in net assets | | (22,218,511 | ) | | 8,746,113 | | | (47,498,623 | ) | | 19,793,015 | | | (129,454,632 | ) | | 110,927,097 | |
| | | | | | |
Net Assets | | | | | | | | | | | | | | | | | | |
Beginning of period | | 39,746,527 | | | 31,000,414 | | | 112,457,420 | | | 92,664,405 | | | 244,427,356 | | | 133,500,259 | |
End of period | | 17,528,016 | | | 39,746,527 | | | 64,958,797 | | | 112,457,420 | | | 114,972,724 | | | 244,427,356 | |
Undistributed net investment income at end of period | | 37,039 | | | — | | | — | | | 25,553 | | | 1,574,766 | | | — | |
See Accompanying Notes to Financial Statements.
24
Statements of Changes in Net Assets – Capital Stock Activity
| | | | | | | | | | | | |
| | | Columbia Masters Global Equity Portfolio | |
| | | Year Ended
March 31, 2009 | | | Year Ended
March 31, 2008 | |
| | | Shares | | | Dollars ($) | | | Shares | | | Dollars ($) | |
Class A | | | | | | | | | | | | |
Subscriptions | | 364,603 | | | 3,216,282 | | | 873,756 | | | 10,384,718 | |
Distributions reinvested | | 125,441 | | | 1,250,651 | | | 92,325 | | | 1,113,954 | |
Redemptions | | (830,720 | ) | | (6,177,754 | ) | | (446,313 | ) | | (5,118,492 | ) |
| | | | | | | | | | | | |
Net increase (decrease) | | (340,676 | ) | | (1,710,821 | ) | | 519,768 | | | 6,380,180 | |
| | | | |
Class B | | | | | | | | | | | | |
Subscriptions | | 113,773 | | | 986,704 | | | 221,912 | | | 2,621,766 | |
Distributions reinvested | | 42,059 | | | 416,387 | | | 27,155 | | | 325,847 | |
Redemptions | | (249,376 | ) | | (1,824,945 | ) | | (96,254 | ) | | (1,102,919 | ) |
| | | | | | | | | | | | |
Net increase (decrease) | | (93,544 | ) | | (421,854 | ) | | 152,813 | | | 1,844,694 | |
| | | | |
Class C | | | | | | | | | | | | |
Subscriptions | | 109,875 | | | 1,107,279 | | | 260,034 | | | 3,070,200 | |
Distributions reinvested | | 36,510 | | | 361,812 | | | 21,677 | | | 260,590 | |
Redemptions | | (238,858 | ) | | (1,727,670 | ) | | (100,170 | ) | | (1,142,858 | ) |
| | | | | | | | | | | | |
Net increase (decrease) | | (92,473 | ) | | (258,579 | ) | | 181,541 | | | 2,187,932 | |
| | | | |
Class Z | | | | | | | | | | | | |
Subscriptions | | 22,398 | | | 234,190 | | | 67,618 | | | 816,061 | |
Distributions reinvested | | 5,492 | | | 55,032 | | | 4,021 | | | 48,703 | |
Redemptions | | (37,940 | ) | | (303,996 | ) | | (29,779 | ) | | (332,513 | ) |
| | | | | | | | | | | | |
Net increase (decrease) | | (10,050 | ) | | (14,774 | ) | | 41,860 | | | 532,251 | |
See Accompanying Notes to Financial Statements.
25
Statements of Changes in Net Assets – Capital Stock Activity
| | | | | | | | | | | | |
| | | Columbia Masters Heritage Portfolio | |
| | | Year Ended
March 31, 2009 | | | Year Ended
March 31, 2008 | |
| | | Shares | | | Dollars ($) | | | Shares | | | Dollars ($) | |
Class A | | | | | | | | | | | | |
Subscriptions | | 1,284,842 | | | 11,752,750 | | | 2,413,403 | | | 26,288,366 | |
Distributions reinvested | | 378,552 | | | 3,429,077 | | | 177,485 | | | 1,978,008 | |
Redemptions | | (2,267,607 | ) | | (18,682,923 | ) | | (1,408,116 | ) | | (15,412,330 | ) |
| | | | | | | | | | | | |
Net increase (decrease) | | (604,213 | ) | | (3,501,096 | ) | | 1,182,772 | | | 12,854,044 | |
| | | | |
Class B | | | | | | | | | | | | |
Subscriptions | | 362,815 | | | 3,179,621 | | | 566,259 | | | 6,199,054 | |
Distributions reinvested | | 116,023 | | | 1,064,451 | | | 42,502 | | | 475,788 | |
Redemptions | | (570,964 | ) | | (4,660,444 | ) | | (261,460 | ) | | (2,837,472 | ) |
| | | | | | | | | | | | |
Net increase (decrease) | | (92,126 | ) | | (416,372 | ) | | 347,301 | | | 3,837,370 | |
| | | | |
Class C | | | | | | | | | | | | |
Subscriptions | | 289,348 | | | 2,806,470 | | | 722,950 | | | 7,915,244 | |
Distributions reinvested | | 98,331 | | | 907,165 | | | 36,283 | | | 406,103 | |
Redemptions | | (690,974 | ) | | (5,540,203 | ) | | (425,252 | ) | | (4,625,721 | ) |
| | | | | | | | | | | | |
Net increase (decrease) | | (303,295 | ) | | (1,826,568 | ) | | 333,981 | | | 3,695,626 | |
| | | | |
Class Z | | | | | | | | | | | | |
Subscriptions | | 30,221 | | | 293,466 | | | 199,498 | | | 2,224,238 | |
Distributions reinvested | | 12,286 | | | 111,497 | | | 8,164 | | | 90,989 | |
Redemptions | | (116,622 | ) | | (1,034,075 | ) | | (154,506 | ) | | (1,690,758 | ) |
| | | | | | | | | | | | |
Net increase (decrease) | | (74,115 | ) | | (629,112 | ) | | 53,156 | | | 624,469 | |
See Accompanying Notes to Financial Statements.
26
Statements of Changes in Net Assets – Capital Stock Activity
| | | | | | | | | | | | |
| | | Columbia Masters International Equity Portfolio | |
| | | Year Ended
March 31, 2009 | | | Year Ended
March 31, 2008 | |
| | | Shares | | | Dollars ($) | | | Shares | | | Dollars ($) | |
Class A | | | | | | | | | | | | |
Subscriptions | | 2,685,954 | | | 24,339,954 | | | 5,292,856 | | | 64,449,595 | |
Distributions reinvested | | 563,267 | | | 5,750,958 | | | 550,705 | | | 6,778,684 | |
Redemptions | | (5,884,264 | ) | | (42,227,592 | ) | | (1,540,632 | ) | | (18,544,383 | ) |
| | | | | | | | | | | | |
Net increase (decrease) | | (2,635,043 | ) | | (12,136,680 | ) | | 4,302,929 | | | 52,683,896 | |
| | | | |
Class B | | | | | | | | | | | | |
Subscriptions | | 89,353 | | | 861,178 | | | 248,649 | | | 3,023,315 | |
Distributions reinvested | | 31,797 | | | 322,424 | | | 32,836 | | | 403,004 | |
Redemptions | | (235,827 | ) | | (1,650,406 | ) | | (117,134 | ) | | (1,365,606 | ) |
| | | | | | | | | | | | |
Net increase (decrease) | | (114,677 | ) | | (466,804 | ) | | 164,351 | | | 2,060,713 | |
| | | | |
Class C | | | | | | | | | | | | |
Subscriptions | | 265,181 | | | 2,505,523 | | | 946,767 | | | 11,612,262 | |
Distributions reinvested | | 78,976 | | | 800,030 | | | 79,831 | | | 979,626 | |
Redemptions | | (1,163,807 | ) | | (7,928,955 | ) | | (350,939 | ) | | (4,152,260 | ) |
| | | | | | | | | | | | |
Net increase (decrease) | | (819,650 | ) | | (4,623,402 | ) | | 675,659 | | | 8,439,628 | |
| | | | |
Class R | | | | | | | | | | | | |
Subscriptions | | 3,013 | | | 19,323 | | | 3,938 | | | 46,259 | |
Distributions reinvested | | 223 | | | 2,274 | | | 165 | | | 2,029 | |
Redemptions | | (2,343 | ) | | (20,920 | ) | | (1,186 | ) | | (14,309 | ) |
| | | | | | | | | | | | |
Net increase | | 893 | | | 677 | | | 2,917 | | | 33,979 | |
| | | | |
Class Z | | | | | | | | | | | | |
Subscriptions | | 7,293,400 | | | 58,505,335 | | | 5,950,760 | | | 72,338,240 | |
Distributions reinvested | | 39,207 | | | 401,086 | | | 35,653 | | | 439,585 | |
Redemptions | | (4,800,394 | ) | | (33,295,759 | ) | | (611,667 | ) | | (7,255,784 | ) |
| | | | | | | | | | | | |
Net increase | | 2,532,213 | | | 25,610,662 | | | 5,374,746 | | | 65,522,041 | |
See Accompanying Notes to Financial Statements.
27
Financial Highlights – Columbia Masters Global Equity Portfolio
Selected data for a share outstanding throughout each period is as follows:
| | | | | | | | | | | | | | | | |
| | | Year Ended March 31, | | | Period Ended
March 31,
2006 (a) | |
| Class A Shares | | 2009 | | | 2008 | | | 2007 | | |
Net Asset Value, Beginning of Period | | $ | 10.77 | | | $ | 11.07 | | | $ | 10.29 | | | $ | 10.00 | |
| | | | |
Income from Investment Operations: | | | | | | | | | | | | | | | | |
Net investment income (b) | | | 0.03 | | | | 0.09 | | | | 0.10 | | | | — | (d) |
Net realized and unrealized gain (loss) on investments
and capital gains distributions received | | | (4.66 | ) | | | 0.16 | | | | 1.25 | | | | 0.29 | |
| | | | | | | | | | | | | | | | |
Total from investment operations | | | (4.63 | ) | | | 0.25 | | | | 1.35 | | | | 0.29 | |
| | | | |
Less Distributions to Shareholders: | | | | | | | | | | | | | | | | |
From net investment income | | | — | | | | (0.07 | ) | | | (0.09 | ) | | | — | |
From net realized gains | | | (0.57 | ) | | | (0.48 | ) | | | (0.48 | ) | | | — | |
| | | | | | | | | | | | | | | | |
Total distributions to shareholders | | | (0.57 | ) | | | (0.55 | ) | | | (0.57 | ) | | | — | |
| | | | |
Redemption Fees: | | | | | | | | | | | | | | | | |
Redemption fees added to paid-in-capital (b)(d) | | | — | | | | — | | | | — | | | | — | |
| | | | |
Net Asset Value, End of Period | | $ | 5.57 | | | $ | 10.77 | | | $ | 11.07 | | | $ | 10.29 | |
Total return(e)(f) | | | (45.32 | )% | | | 1.76 | % | | | 13.17 | % | | | 2.90 | %(g) |
| | | | |
Ratios to Average Net Assets/Supplemental Data: | | | | | | | | | | | | | | | | |
Net expenses(h)(i) | | | 0.25 | % | | | 0.25 | % | | | 0.25 | % | | | 0.25 | %(c) |
Waiver/Reimbursement | | | 0.87 | % | | | 0.76 | % | | | 1.40 | % | | | 21.19 | %(c) |
Net investment income (loss) (i) | | | 0.31 | % | | | 0.75 | % | | | 0.92 | % | | | (0.25 | )%(c) |
Portfolio turnover rate | | | 9 | % | | | 9 | % | | | 2 | % | | | — | |
Net assets, end of period (000’s) | | $ | 10,348 | | | $ | 23,668 | | | $ | 18,588 | | | $ | 3,902 | |
| (a) | Class A shares commenced operations on February 15, 2006. Per share data and total return reflect activity from that date. |
| (b) | Per share data was calculated using the average shares outstanding during the period. |
| (d) | Rounds to less than $0.01 per share. |
| (e) | Total return at net asset value assuming all distributions reinvested and no initial sales charge or contingent deferred sales charge. |
| (f) | Had the investment advisor and/or any of its affiliates not waived fees or reimbursed a portion of expenses, total return would have been reduced. |
| (h) | Does not include expenses of the investment companies in which the Portfolio invests, if these expenses were included, the expense ratios would have been higher. |
| (i) | The benefits derived from expense reductions had an impact of less than 0.01%. |
See Accompanying Notes to Financial Statements.
28
Financial Highlights – Columbia Masters Global Equity Portfolio
Selected data for a share outstanding throughout each period is as follows:
| | | | | | | | | | | | | | | | |
| | | Year Ended March 31, | | | Period Ended
March 31,
2006 (a) | |
| Class B Shares | | 2009 | | | 2008 | | | 2007 | | |
Net Asset Value, Beginning of Period | | $ | 10.71 | | | $ | 11.04 | | | $ | 10.28 | | | $ | 10.00 | |
| | | | |
Income from Investment Operations: | | | | | | | | | | | | | | | | |
Net investment income (loss) (b) | | | (0.04 | ) | | | (0.01 | ) | | | 0.03 | | | | (0.01 | ) |
Net realized and unrealized gain (loss) on investments
and capital gains distributions received | | | (4.60 | ) | | | 0.16 | | | | 1.24 | | | | 0.29 | |
| | | | | | | | | | | | | | | | |
Total from investment operations | | | (4.64 | ) | | | 0.15 | | | | 1.27 | | | | 0.28 | |
| | | | |
Less Distributions to Shareholders: | | | | | | | | | | | | | | | | |
From net investment income | | | — | | | | — | (d) | | | (0.03 | ) | | | — | |
From net realized gains | | | (0.57 | ) | | | (0.48 | ) | | | (0.48 | ) | | | — | |
| | | | | | | | | | | | | | | | |
Total distributions to shareholders | | | (0.57 | ) | | | (0.48 | ) | | | (0.51 | ) | | | — | |
| | | | |
Redemption Fees: | | | | | | | | | | | | | | | | |
Redemption fees added to paid-in-capital (b)(d) | | | — | | | | — | | | | — | | | | — | |
| | | | |
Net Asset Value, End of Period | | $ | 5.50 | | | $ | 10.71 | | | $ | 11.04 | | | $ | 10.28 | |
Total return (e)(f) | | | (45.68 | )% | | | 0.94 | % | | | 12.40 | % | | | 2.80 | %(g) |
| | | | |
Ratios to Average Net Assets/Supplemental Data: | | | | | | | | | | | | | | | | |
Net expenses (h)(i) | | | 1.00 | % | | | 1.00 | % | | | 1.00 | % | | | 1.00 | %(c) |
Waiver/Reimbursement | | | 0.87 | % | | | 0.76 | % | | | 1.40 | % | | | 21.19 | %(c) |
Net investment income (loss) (i) | | | (0.44 | )% | | | (0.08 | )% | | | 0.25 | % | | | (1.00 | )%(c) |
Portfolio turnover rate | | | 9 | % | | | 9 | % | | | 2 | % | | | — | |
Net assets, end of period (000’s) | | $ | 3,778 | | | $ | 8,362 | | | $ | 6,933 | | | $ | 1,488 | |
| (a) | Class B shares commenced operations on February 15, 2006. Per share data and total return reflect activity from that date. |
| (b) | Per share data was calculated using the average shares outstanding during the period. |
| (d) | Rounds to less than $0.01 per share. |
| (e) | Total return at net asset value assuming all distributions reinvested and no contingent deferred sales charge. |
| (f) | Had the investment advisor and/or any of its affiliates not waived fees or reimbursed a portion of expenses, total return would have been reduced. |
| (h) | Does not include expenses of the investment companies in which the Portfolio invests, if these expenses were included, the expense ratios would have been higher. |
| (i) | The benefits derived from expense reductions had an impact of less than 0.01%. |
See Accompanying Notes to Financial Statements.
29
Financial Highlights – Columbia Masters Global Equity Portfolio
Selected data for a share outstanding throughout each period is as follows:
| | | | | | | | | | | | | | | | |
| | | Year Ended March 31, | | | Period Ended
March 31,
2006 (a) | |
| Class C Shares | | 2009 | | | 2008 | | | 2007 | | |
Net Asset Value, Beginning of Period | | $ | 10.72 | | | $ | 11.05 | | | $ | 10.29 | | | $ | 10.00 | |
| | | | |
Income from Investment Operations: | | | | | | | | | | | | | | | | |
Net investment income (loss) (b) | | | (0.04 | ) | | | — | | | | 0.03 | | | | (0.01 | ) |
Net realized and unrealized gain (loss) on investments
and capital gains distributions received | | | (4.61 | ) | | | 0.15 | | | | 1.24 | | | | 0.30 | |
| | | | | | | | | | | | | | | | |
Total from investment operations | | | (4.65 | ) | | | 0.15 | | | | 1.27 | | | | 0.29 | |
| | | | |
Less Distributions to Shareholders: | | | | | | | | | | | | | | | | |
From net investment income | | | — | | | | — | | | | (0.03 | ) | | | — | |
From net realized gains | | | (0.57 | ) | | | (0.48 | ) | | | (0.48 | ) | | | — | |
| | | | | | | | | | | | | | | | |
Total distributions to shareholders | | | (0.57 | ) | | | (0.48 | ) | | | (0.51 | ) | | | — | |
| | | | |
Redemption Fees: | | | | | | | | | | | | | | | | |
Redemption fees added to paid-in-capital (b)(d) | | | — | | | | — | | | | — | | | | — | |
| | | | |
Net Asset Value, End of Period | | $ | 5.50 | | | $ | 10.72 | | | $ | 11.05 | | | $ | 10.29 | |
Total return (e)(f) | | | (45.74 | )% | | | 0.93 | % | | | 12.38 | % | | | 2.90 | %(g) |
| | | | |
Ratios to Average Net Assets/Supplemental Data: | | | | | | | | | | | | | | | | |
Net expenses (h)(i) | | | 1.00 | % | | | 1.00 | % | | | 1.00 | % | | | 1.00 | %(c) |
Waiver/Reimbursement | | | 0.87 | % | | | 0.76 | % | | | 1.40 | % | | | 21.19 | %(c) |
Net investment income (loss) (i) | | | (0.44 | )% | | | (0.03 | )% | | | 0.29 | % | | | (1.00 | )%(c) |
Portfolio turnover rate | | | 9 | % | | | 9 | % | | | 2 | % | | | — | |
Net assets, end of period (000’s) | | $ | 2,942 | | | $ | 6,722 | | | $ | 4,923 | | | $ | 929 | |
| (a) | Class C shares commenced operations on February 15, 2006. Per share data and total return reflect activity from that date. |
| (b) | Per share data was calculated using the average shares outstanding during the period. |
| (d) | Rounds to less than $0.01 per share. |
| (e) | Total return at net asset value assuming all distributions reinvested and no contingent deferred sales charge. |
| (f) | Had the investment advisor and/or any of its affiliates not waived fees or reimbursed a portion of expenses, total return would have been reduced. |
| (h) | Does not include expenses of the investment companies in which the Portfolio invests, if these expenses were included, the expense ratios would have been higher. |
| (i) | The benefits derived from expense reductions had an impact of less than 0.01%. |
See Accompanying Notes to Financial Statements.
30
Financial Highlights – Columbia Masters Global Equity Portfolio
Selected data for a share outstanding throughout each period is as follows:
| | | | | | | | | | | | | | | | |
| | | Year Ended March 31, | | | Period Ended
March 31,
2006 (a) | |
| Class Z Shares | | 2009 | | | 2008 | | | 2007 | | |
Net Asset Value, Beginning of Period | | $ | 10.80 | | | $ | 11.09 | | | $ | 10.29 | | | $ | 10.00 | |
| | | | |
Income from Investment Operations: | | | | | | | | | | | | | | | | |
Net investment income (b) | | | 0.05 | | | | 0.16 | | | | 0.12 | | | | — | (d) |
Net realized and unrealized gain (loss) on investments
and capital gains distributions received | | | (4.67 | ) | | | 0.12 | | | | 1.26 | | | | 0.29 | |
| | | | | | | | | | | | | | | | |
Total from investment operations | | | (4.62 | ) | | | 0.28 | | | | 1.38 | | | | 0.29 | |
| | | | |
Less Distributions to Shareholders: | | | | | | | | | | | | | | | | |
From net investment income | | | — | | | | (0.09 | ) | | | (0.10 | ) | | | — | |
From net realized gains | | | (0.57 | ) | | | (0.48 | ) | | | (0.48 | ) | | | — | |
| | | | | | | | | | | | | | | | |
Total distributions to shareholders | | | (0.57 | ) | | | (0.57 | ) | | | (0.58 | ) | | | — | |
| | | | |
Redemption Fees: | | | | | | | | | | | | | | | | |
Redemption fees added to paid-in-capital (b)(d) | | | — | | | | — | | | | — | | | | — | |
| | | | |
Net Asset Value, End of Period | | $ | 5.61 | | | $ | 10.80 | | | $ | 11.09 | | | $ | 10.29 | |
Total return (e)(f) | | | (45.09 | )% | | | 2.03 | % | | | 13.56 | % | | | 2.90 | %(g) |
| | | | |
Ratios to Average Net Assets/Supplemental Data: | | | | | | | | | | | | | | | | |
Net expenses (h)(i) | | | — | | | | — | | | | — | | | | — | |
Waiver/Reimbursement | | | 0.87 | % | | | 0.76 | % | | | 1.40 | % | | | 21.19 | %(j) |
Net investment income (i) | | | 0.58 | % | | | 1.37 | % | | | 1.15 | % | | | — | %(j)(c) |
Portfolio turnover rate | | | 9 | % | | | 9 | % | | | 2 | % | | | — | |
Net assets, end of period (000’s) | | $ | 459 | | | $ | 994 | | | $ | 556 | | | $ | 28 | |
| (a) | Class Z shares commenced operations on February 15, 2006. Per share data and total return reflect activity from that date. |
| (b) | Per share data was calculated using the average shares outstanding during the period. |
| (c) | Rounds to less than 0.01%. |
| (d) | Rounds to less than $0.01 per share. |
| (e) | Total return at net asset value assuming all distributions reinvested. |
| (f) | Had the investment advisor and/or any of its affiliates not waived fees or reimbursed a portion of expenses, total return would have been reduced. |
| (h) | Does not include expenses of the investment companies in which the Portfolio invests, if these expenses were included, the expense ratios would have been higher. |
| (i) | The benefits derived from expense reductions had an impact of less than 0.01%. |
See Accompanying Notes to Financial Statements.
31
Financial Highlights – Columbia Masters Heritage Portfolio
Selected data for a share outstanding throughout each period is as follows:
| | | | | | | | | | | | | | | | |
| | | Year Ended March 31, | | | Period Ended
March 31,
2006 (a) | |
| Class A Shares | | 2009 | | | 2008 | | | 2007 | | |
Net Asset Value, Beginning of Period | | $ | 10.39 | | | $ | 10.42 | | | $ | 10.19 | | | $ | 10.00 | |
| | | | |
Income from Investment Operations: | | | | | | | | | | | | | | | | |
Net investment income (b) | | | 0.21 | | | | 0.21 | | | | 0.26 | | | | 0.03 | |
Net realized and unrealized gain (loss) on investments
and capital gains distributions received | | | (3.38 | ) | | | 0.12 | | | | 0.61 | | | | 0.17 | |
| | | | | | | | | | | | | | | | |
Total from investment operations | | | (3.17 | ) | | | 0.33 | | | | 0.87 | | | | 0.20 | |
| | | | |
Less Distributions to Shareholders: | | | | | | | | | | | | | | | | |
From net investment income | | | (0.22 | ) | | | (0.24 | ) | | | (0.23 | ) | | | (0.01 | ) |
From net realized gains | | | (0.34 | ) | | | (0.12 | ) | | | (0.41 | ) | | | — | |
| | | | | | | | | | | | | | | | |
Total distributions to shareholders | | | (0.56 | ) | | | (0.36 | ) | | | (0.64 | ) | | | (0.01 | ) |
| | | | |
Net Asset Value, End of Period | | $ | 6.66 | | | $ | 10.39 | | | $ | 10.42 | | | $ | 10.19 | |
Total return (d)(e) | | | (31.84 | )% | | | 2.96 | % | | | 8.77 | % | | | 2.01 | %(f) |
| | | | |
Ratios to Average Net Assets/Supplemental Data: | | | | | | | | | | | | | | | | |
Net expenses (g)(h) | | | 0.25 | % | | | 0.25 | % | | | 0.25 | % | | | 0.25 | %(c) |
Waiver/Reimbursement | | | 0.36 | % | | | 0.34 | % | | | 0.48 | % | | | 6.51 | %(c) |
Net investment income (h) | | | 2.46 | % | | | 2.05 | % | | | 2.49 | % | | | 2.04 | %(c) |
Portfolio turnover rate | | | 10 | % | | | 8 | % | | | 2 | % | | | — | |
Net assets, end of period (000’s) | | $ | 38,188 | | | $ | 65,837 | | | $ | 53,710 | | | $ | 13,131 | |
| (a) | Class A shares commenced operations on February 15, 2006. Per share data and total return reflect activity from that date. |
| (b) | Per share data was calculated using the average shares outstanding during the period. |
| (d) | Total return at net asset value assuming all distributions reinvested and no initial sales charge or contingent deferred sales charge. |
| (e) | Had the investment advisor and/or any of its affiliates not waived fees or reimbursed a portion of expenses, total return would have been reduced. |
| (g) | Does not include expenses of the investment companies in which the Portfolio invests, if these expenses were included, the expense ratios would have been higher. |
| (h) | The benefits derived from expense reductions had an impact of less than 0.01%. |
See Accompanying Notes to Financial Statements.
32
Financial Highlights – Columbia Masters Heritage Portfolio
Selected data for a share outstanding throughout each period is as follows:
| | | | | | | | | | | | | | | | |
| | | Year Ended March 31, | | | Period Ended
March 31,
2006 (a) | |
| Class B Shares | | 2009 | | | 2008 | | | 2007 | | |
Net Asset Value, Beginning of Period | | $ | 10.43 | | | $ | 10.42 | | | $ | 10.19 | | | $ | 10.00 | |
| | | | |
Income from Investment Operations: | | | | | | | | | | | | | | | | |
Net investment income (b) | | | 0.15 | | | | 0.14 | | | | 0.18 | | | | 0.01 | |
Net realized and unrealized gain (loss) on investments
and capital gains distributions received | | | (3.39 | ) | | | 0.11 | | | | 0.62 | | | | 0.18 | |
| | | | | | | | | | | | | | | | |
Total from investment operations | | | (3.24 | ) | | | 0.25 | | | | 0.80 | | | | 0.19 | |
| | | | |
Less Distributions to Shareholders: | | | | | | | | | | | | | | | | |
From net investment income | | | (0.16 | ) | | | (0.12 | ) | | | (0.16 | ) | | | — | (d) |
From net realized gains | | | (0.34 | ) | | | (0.12 | ) | | | (0.41 | ) | | | — | |
| | | | | | | | | | | | | | | | |
Total distributions to shareholders | | | (0.50 | ) | | | (0.24 | ) | | | (0.57 | ) | | | — | (d) |
| | | | |
Net Asset Value, End of Period | | $ | 6.69 | | | $ | 10.43 | | | $ | 10.42 | | | $ | 10.19 | |
Total return (e)(f) | | | (32.34 | )% | | | 2.22 | % | | | 7.96 | % | | | 1.91 | %(g) |
| | | | |
Ratios to Average Net Assets/Supplemental Data: | | | | | | | | | | | | | | | | |
Net expenses (h)(i) | | | 1.00 | % | | | 1.00 | % | | | 1.00 | % | | | 1.00 | %(c) |
Waiver/Reimbursement | | | 0.36 | % | | | 0.34 | % | | | 0.48 | % | | | 6.51 | %(c) |
Net investment income (i) | | | 1.73 | % | | | 1.32 | % | | | 1.75 | % | | | 0.90 | %(c) |
Portfolio turnover rate | | | 10 | % | | | 8 | % | | | 2 | % | | | — | |
Net assets, end of period (000’s) | | $ | 14,152 | | | $ | 23,020 | | | $ | 19,388 | | | $ | 4,700 | |
| (a) | Class B shares commenced operations on February 15, 2006. Per share data and total return reflect activity from that date. |
| (b) | Per share data was calculated using the average shares outstanding during the period. |
| (d) | Rounds to less than $0.01 per share. |
| (e) | Total return at net asset value assuming all distributions reinvested and no contingent deferred sales charge. |
| (f) | Had the investment advisor and/or any of its affiliates not waived fees or reimbursed a portion of expenses, total return would have been reduced. |
| (h) | Does not include expenses of the investment companies in which the Portfolio invests, if these expenses were included, the expense ratios would have been higher. |
| (i) | The benefits derived from expense reductions had an impact of less than 0.01%. |
See Accompanying Notes to Financial Statements.
33
Financial Highlights – Columbia Masters Heritage Portfolio
Selected data for a share outstanding throughout each period is as follows:
| | | | | | | | | | | | | | | | |
| | | Year Ended March 31, | | | Period Ended
March 31,
2006 (a) | |
| Class C Shares | | 2009 | | | 2008 | | | 2007 | | |
Net Asset Value, Beginning of Period | | $ | 10.43 | | | $ | 10.42 | | | $ | 10.19 | | | $ | 10.00 | |
| | | | |
Income from Investment Operations: | | | | | | | | | | | | | | | | |
Net investment income (b) | | | 0.15 | | | | 0.14 | | | | 0.18 | | | | 0.01 | |
Net realized and unrealized gain (loss) on investments
and capital gains distributions received | | | (3.39 | ) | | | 0.11 | | | | 0.62 | | | | 0.18 | |
| | | | | | | | | | | | | | | | |
Total from investment operations | | | (3.24 | ) | | | 0.25 | | | | 0.80 | | | | 0.19 | |
| | | | |
Less Distributions to Shareholders: | | | | | | | | | | | | | | | | |
From net investment income | | | (0.16 | ) | | | (0.12 | ) | | | (0.16 | ) | | | — | (d) |
From net realized gains | | | (0.34 | ) | | | (0.12 | ) | | | (0.41 | ) | | | — | |
| | | | | | | | | | | | | | | | |
Total distributions to shareholders | | | (0.50 | ) | | | (0.24 | ) | | | (0.57 | ) | | | — | (d) |
| | | | |
Net Asset Value, End of Period | | $ | 6.69 | | | $ | 10.43 | | | $ | 10.42 | | | $ | 10.19 | |
Total return (e)(f) | | | (32.34 | )% | | | 2.22 | % | | | 7.96 | % | | | 1.91 | %(g) |
| | | | |
Ratios to Average Net Assets/Supplemental Data: | | | | | | | | | | | | | | | | |
Net expenses (h)(i) | | | 1.00 | % | | | 1.00 | % | | | 1.00 | % | | | 1.00 | %(c) |
Waiver/Reimbursement | | | 0.36 | % | | | 0.34 | % | | | 0.48 | % | | | 6.51 | %(c) |
Net investment income (i) | | | 1.71 | % | | | 1.32 | % | | | 1.74 | % | | | 0.80 | %(c) |
Portfolio turnover rate | | | 10 | % | | | 8 | % | | | 2 | % | | | — | |
Net assets, end of period (000’s) | | $ | 11,576 | | | $ | 21,207 | | | $ | 17,715 | | | $ | 2,958 | |
| (a) | Class C shares commenced operations on February 15, 2006. Per share data and total return reflect activity from that date. |
| (b) | Per share data was calculated using the average shares outstanding during the period. |
| (d) | Rounds to less than $0.01 per share. |
| (e) | Total return at net asset value assuming all distributions reinvested and no contingent deferred sales charge. |
| (f) | Had the investment advisor and/or any of its affiliates not waived fees or reimbursed a portion of expenses, total return would have been reduced. |
| (h) | Does not include expenses of the investment companies in which the Portfolio invests, if these expenses were included, the expense ratios would have been higher. |
| (i) | The benefits derived from expense reductions had an impact of less than 0.01%. |
See Accompanying Notes to Financial Statements.
34
Financial Highlights – Columbia Masters Heritage Portfolio
Selected data for a share outstanding throughout each period is as follows:
| | | | | | | | | | | | | | | | |
| | | Year Ended March 31, | | | Period Ended
March 31,
2006 (a) | |
| Class Z Shares | | 2009 | | | 2008 | | | 2007 | | |
Net Asset Value, Beginning of Period | | $ | 10.36 | | | $ | 10.41 | | | $ | 10.18 | | | $ | 10.00 | |
| | | | |
Income from Investment Operations: | | | | | | | | | | | | | | | | |
Net investment income (b) | | | 0.23 | | | | 0.26 | | | | 0.30 | | | | 0.02 | |
Net realized and unrealized gain (loss) on investments
and capital gains distributions received | | | (3.37 | ) | | | 0.09 | | | | 0.60 | | | | 0.17 | |
| | | | | | | | | | | | | | | | |
Total from investment operations | | | (3.14 | ) | | | 0.35 | | | | 0.90 | | | | 0.19 | |
| | | | |
Less Distributions to Shareholders: | | | | | | | | | | | | | | | | |
From net investment income | | | (0.24 | ) | | | (0.28 | ) | | | (0.26 | ) | | | (0.01 | ) |
From net realized gains | | | (0.34 | ) | | | (0.12 | ) | | | (0.41 | ) | | | — | |
| | | | | | | | | | | | | | | | |
Total distributions to shareholders | | | (0.58 | ) | | | (0.40 | ) | | | (0.67 | ) | | | (0.01 | ) |
| | | | |
Net Asset Value, End of Period | | $ | 6.64 | | | $ | 10.36 | | | $ | 10.41 | | | $ | 10.18 | |
Total return (d)(e) | | | (31.66 | )% | | | 3.14 | % | | | 9.04 | % | | | 1.94 | %(f) |
| | | | |
Ratios to Average Net Assets/Supplemental Data: | | | | | | | | | | | | | | | | |
Net expenses (g)(h) | | | — | | | | — | | | | — | | | | — | |
Waiver/Reimbursement | | | 0.36 | % | | | 0.34 | % | | | 0.48 | % | | | 6.51 | %(c) |
Net investment income (h) | | | 2.65 | % | | | 2.53 | % | | | 2.96 | % | | | 1.48 | %(c) |
Portfolio turnover rate | | | 10 | % | | | 8 | % | | | 2 | % | | | — | |
Net assets, end of period (000’s) | | $ | 1,042 | | | $ | 2,393 | | | $ | 1,851 | | | $ | 92 | |
| (a) | Class Z shares commenced operations on February 15, 2006. Per share data and total return reflect activity from that date. |
| (b) | Per share data was calculated using the average shares outstanding during the period. |
| (d) | Total return at net asset value assuming all distributions reinvested. |
| (e) | Had the investment advisor and/or any of its affiliates not waived fees or reimbursed a portion of expenses, total return would have been reduced. |
| (g) | Does not include expenses of the investment companies in which the Portfolio invests, if these expenses were included, the expense ratios would have been higher. |
| (h) | The benefits derived from expense reductions had an impact of less than 0.01%. |
See Accompanying Notes to Financial Statements.
35
Financial Highlights – Columbia Masters International Equity Portfolio
Selected data for a share outstanding throughout each period is as follows:
| | | | | | | | | | | | | | | | |
| | | Year Ended March 31, | | | Period Ended
March 31,
2006 (a) | |
| Class A Shares | | 2009 | | | 2008 | | | 2007 | | |
Net Asset Value, Beginning of Period | | $ | 11.14 | | | $ | 11.69 | | | $ | 10.26 | | | $ | 10.00 | |
| | | | |
Income from Investment Operations: | | | | | | | | | | | | | | | | |
Net investment income (b) | | | 0.05 | | | | 0.17 | | | | 0.15 | | | | — | (d) |
Net realized and unrealized gain (loss) on investments
and capital gains distributions received | | | (5.14 | ) | | | 0.11 | | | | 1.63 | | | | 0.26 | |
| | | | | | | | | | | | | | | | |
Total from investment operations | | | (5.09 | ) | | | 0.28 | | | | 1.78 | | | | 0.26 | |
| | | | |
Less Distributions to Shareholders: | | | | | | | | | | | | | | | | |
From net investment income | | | — | | | | (0.13 | ) | | | (0.07 | ) | | | — | |
From net realized gains | | | (0.56 | ) | | | (0.70 | ) | | | (0.28 | ) | | | — | |
| | | | | | | | | | | | | | | | |
Total distributions to shareholders | | | (0.56 | ) | | | (0.83 | ) | | | (0.35 | ) | | | — | |
| | | | |
Redemption Fees: | | | | | | | | | | | | | | | | |
Redemption fees added to paid-in-capital (b)(d) | | | — | | | | — | | | | — | | | | — | |
| | | | |
Net Asset Value, End of Period | | $ | 5.49 | | | $ | 11.14 | | | $ | 11.69 | | | $ | 10.26 | |
Total return (e)(f) | | | (48.03 | )% | | | 1.76 | % | | | 17.39 | % | | | 2.60 | %(g) |
| | | | |
Ratios to Average Net Assets/Supplemental Data: | | | | | | | | | | | | | | | | |
Net expenses (h)(i) | | | 0.25 | % | | | 0.25 | % | | | 0.25 | % | | | 0.25 | %(c) |
Waiver/Reimbursement | | | 0.26 | % | | | 0.22 | % | | | 0.59 | % | | | 13.23 | %(c) |
Net investment income (loss) (i) | | | 0.56 | % | | | 1.39 | % | | | 1.31 | % | | | (0.25 | )%(c) |
Portfolio turnover rate | | | 20 | % | | | 3 | % | | | 1 | % | | | — | |
Net assets, end of period (000’s) | | $ | 44,548 | | | $ | 119,670 | | | $ | 75,289 | | | $ | 5,846 | |
| (a) | Class A shares commenced operations on February 15, 2006. Per share data and total return reflect activity from that date. |
| (b) | Per share data was calculated using the average shares outstanding during the period. |
| (d) | Rounds to less than $0.01. |
| (e) | Total return at net asset value assuming all distributions reinvested and no initial sales charge or contingent deferred sales charge. |
| (f) | Had the investment advisor and/or any of its affiliates not waived fees or reimbursed a portion of expenses, total return would have been reduced. |
| (h) | Does not include expenses of the investment companies in which the Portfolio invests, if these expenses were included, the expense ratios would have been higher. |
| (i) | The benefits derived from expense reductions had an impact of less than 0.01%. |
See Accompanying Notes to Financial Statements.
36
Financial Highlights – Columbia Masters International Equity Portfolio
Selected data for a share outstanding throughout each period is as follows:
| | | | | | | | | | | | | | | | |
| | | Year Ended March 31, | | | Period Ended
March 31,
2006 (a) | |
| Class B Shares | | 2009 | | | 2008 | | | 2007 | | |
Net Asset Value, Beginning of Period | | $ | 11.09 | | | $ | 11.66 | | | $ | 10.26 | | | $ | 10.00 | |
| | | | |
Income from Investment Operations: | | | | | | | | | | | | | | | | |
Net investment income (loss) (b) | | | (0.01 | ) | | | 0.07 | | | | 0.10 | | | | (0.01 | ) |
Net realized and unrealized gain (loss) on investments
and capital gains distributions received | | | (5.09 | ) | | | 0.12 | | | | 1.59 | | | | 0.27 | |
| | | | | | | | | | | | | | | | |
Total from investment operations | | | (5.10 | ) | | | 0.19 | | | | 1.69 | | | | 0.26 | |
| | | | |
Less Distributions to Shareholders: | | | | | | | | | | | | | | | | |
From net investment income | | | — | | | | (0.06 | ) | | | (0.01 | ) | | | — | |
From net realized gains | | | (0.56 | ) | | | (0.70 | ) | | | (0.28 | ) | | | — | |
| | | | | | | | | | | | | | | | |
Total distributions to shareholders | | | (0.56 | ) | | | (0.76 | ) | | | (0.29 | ) | | | — | |
| | | | |
Redemption Fees: | | | | | | | | | | | | | | | | |
Redemption fees added to paid-in-capital (b)(d) | | | — | | | | — | | | | — | | | | — | |
| | | | |
Net Asset Value, End of Period | | $ | 5.43 | | | $ | 11.09 | | | $ | 11.66 | | | $ | 10.26 | |
Total return (e)(f) | | | (48.35 | )% | | | 1.03 | % | | | 16.50 | % | | | 2.60 | %(g) |
| | | | |
Ratios to Average Net Assets/Supplemental Data: | | | | | | | | | | | | | | | | |
Net expenses (h)(i) | | | 1.00 | % | | | 1.00 | % | | | 1.00 | % | | | 1.00 | %(c) |
Waiver/Reimbursement | | | 0.26 | % | | | 0.22 | % | | | 0.59 | % | | | 13.23 | %(c) |
Net investment income (loss) (i) | | | (0.18 | )% | | | 0.55 | % | | | 0.93 | % | | | (1.00 | )%(c) |
Portfolio turnover rate | | | 20 | % | | | 3 | % | | | 1 | % | | | — | |
Net assets, end of period (000’s) | | $ | 3,043 | | | $ | 7,490 | | | $ | 5,960 | | | $ | 1,176 | |
| (a) | Class B shares commenced operations on February 15, 2006. Per share data and total return reflect activity from that date. |
| (b) | Per share data was calculated using the average shares outstanding during the period. |
| (d) | Rounds to less than $0.01 per share. |
| (e) | Total return at net asset value assuming all distributions reinvested and no contingent deferred sales charge. |
| (f) | Had the investment advisor and/or any of its affiliates not waived fees or reimbursed a portion of expenses, total return would have been reduced. |
| (h) | Does not include expenses of the investment companies in which the Portfolio invests, if these expenses were included, the expense ratios would have been higher. |
| (i) | The benefits derived from expense reductions had an impact of less than 0.01%. |
See Accompanying Notes to Financial Statements.
37
Financial Highlights – Columbia Masters International Equity Portfolio
Selected data for a share outstanding throughout each period is as follows:
| | | | | | | | | | | | | | | | |
| | | Year Ended March 31, | | | Period Ended
March 31,
2006 (a) | |
| Class C Shares | | 2009 | | | 2008 | | | 2007 | | |
Net Asset Value, Beginning of Period | | $ | 11.08 | | | $ | 11.66 | | | $ | 10.25 | | | $ | 10.00 | |
| | | | |
Income from Investment Operations: | | | | | | | | | | | | | | | | |
Net investment income (loss) (b) | | | (0.02 | ) | | | 0.07 | | | | 0.10 | | | | (0.01 | ) |
Net realized and unrealized gain (loss) on investments
and capital gains distributions received | | | (5.08 | ) | | | 0.11 | | | | 1.60 | | | | 0.26 | |
| | | | | | | | | | | | | | | | |
Total from investment operations | | | (5.10 | ) | | | 0.18 | | | | 1.70 | | | | 0.25 | |
| | | | |
Less Distributions to Shareholders: | | | | | | | | | | | | | | | | |
From net investment income | | | — | | | | (0.06 | ) | | | (0.01 | ) | | | — | |
From net realized gains | | | (0.56 | ) | | | (0.70 | ) | | | (0.28 | ) | | | — | |
| | | | | | | | | | | | | | | | |
Total distributions to shareholders | | | (0.56 | ) | | | (0.76 | ) | | | (0.29 | ) | | | — | |
| | | | |
Redemption Fees: | | | | | | | | | | | | | | | | |
Redemption fees added to paid-in-capital (b)(d) | | | — | | | | — | | | | — �� | | | | — | |
| | | | |
Net Asset Value, End of Period | | $ | 5.42 | | | $ | 11.08 | | | $ | 11.66 | | | $ | 10.25 | |
Total return (e)(f) | | | (48.39 | )% | | | 0.94 | % | | | 16.61 | % | | | 2.50 | %(g) |
| | | | |
Ratios to Average Net Assets/Supplemental Data: | | | | | | | | | | | | | | | | |
Net expenses (h)(i) | | | 1.00 | % | | | 1.00 | % | | | 1.00 | % | | | 1.00 | %(c) |
Waiver/Reimbursement | | | 0.26 | % | | | 0.22 | % | | | 0.59 | % | | | 13.23 | %(c) |
Net investment income (loss) (i) | | | (0.19 | )% | | | 0.60 | % | | | 0.88 | % | | | (1.00 | )%(c) |
Portfolio turnover rate | | | 20 | % | | | 3 | % | | | 1 | % | | | — | |
Net assets, end of period (000’s) | | $ | 9,087 | | | $ | 27,656 | | | $ | 21,210 | | | $ | 3,140 | |
| (a) | Class C shares commenced operations on February 15, 2006. Per share data and total return reflect activity from that date. |
| (b) | Per share data was calculated using the average shares outstanding during the period. |
| (d) | Rounds to less than $0.01 per share. |
| (e) | Total return at net asset value assuming all distributions reinvested and no contingent deferred sales charge. |
| (f) | Had the investment advisor and/or any of its affiliates not waived fees or reimbursed a portion of expenses, total return would have been reduced. |
| (h) | Does not include expenses of the investment companies in which the Portfolio invests, if these expenses were included, the expense ratios would have been higher. |
| (i) | The benefits derived from expense reductions had an impact of less than 0.01%. |
See Accompanying Notes to Financial Statements.
38
Financial Highlights – Columbia Masters International Equity Portfolio
Selected data for a share outstanding throughout each period is as follows:
| | | | | | | | | | | | | | | | |
| | | Year Ended March 31, | | | Period Ended
March 31,
2006 (a) | |
| Class R Shares | | 2009 | | | 2008 | | | 2007 | | |
| | | | |
Net Asset Value, Beginning of Period | | $ | 11.12 | | | $ | 11.68 | | | $ | 10.26 | | | $ | 10.00 | |
| | | | |
Income from Investment Operations: | | | | | | | | | | | | | | | | |
Net investment income (loss) (b) | | | 0.02 | | | | 0.15 | | | | 0.16 | | | | (0.01 | ) |
Net realized and unrealized gain (loss) on investments
and capital gains distributions received | | | (5.11 | ) | | | 0.09 | | | | 1.59 | | | | 0.27 | |
| | | | | | | | | | | | | | | | |
Total from investment operations | | | (5.09 | ) | | | 0.24 | | | | 1.75 | | | | 0.26 | |
| | | | |
Less Distributions to Shareholders: | | | | | | | | | | | | | | | | |
From net investment income | | | — | | | | (0.10 | ) | | | (0.05 | ) | | | — | |
From net realized gains | | | (0.56 | ) | | | (0.70 | ) | | | (0.28 | ) | | | — | |
| | | | | | | | | | | | | | | | |
Total distributions to shareholders | | | (0.56 | ) | | | (0.80 | ) | | | (0.33 | ) | | | — | |
| | | | |
Redemption Fees: | | | | | | | | | | | | | | | | |
Redemption fees added to paid-in-capital (b)(d) | | | — | | | | — | | | | — | | | | — | |
| | | | |
Net Asset Value, End of Period | | $ | 5.47 | | | $ | 11.12 | | | $ | 11.68 | | | $ | 10.26 | |
Total return (e)(f) | | | (48.12 | )% | | | 1.48 | % | | | 17.09 | % | | | 2.60 | %(g) |
| | | | |
Ratios to Average Net Assets/Supplemental Data: | | | | | | | | | | | | | | | | |
Net expenses (h)(i) | | | 0.50 | % | | | 0.50 | % | | | 0.50 | % | | | 0.50 | %(c) |
Waiver/Reimbursement | | | 0.26 | % | | | 0.22 | % | | | 0.59 | % | | | 13.23 | %(c) |
Net investment income (loss) (i) | | | 0.26 | % | | | 1.22 | % | | | 1.46 | % | | | (0.50 | )%(c) |
Portfolio turnover rate | | | 20 | % | | | 3 | % | | | 1 | % | | | — | |
Net assets, end of period (000’s) | | $ | 26 | | | $ | 44 | | | $ | 12 | | | $ | 10 | |
| (a) | Class R shares commenced operations on February 15, 2006. Per share data and total return reflect activity from that date. |
| (b) | Per share data was calculated using the average shares outstanding during the period. |
| (d) | Rounds to less than $0.01 per share. |
| (e) | Total return at net asset value assuming all distributions reinvested. |
| (f) | Had the investment advisor and/or any of its affiliates not waived fees or reimbursed a portion of expenses, total return would have been reduced. |
| (h) | Does not include expenses of the investment companies in which the Portfolio invests, if these expenses were included, the expense ratios would have been higher. |
| (i) | The benefits derived from expense reductions had an impact of less than 0.01%. |
See Accompanying Notes to Financial Statements.
39
Financial Highlights – Columbia Masters International Equity Portfolio
Selected data for a share outstanding throughout each period is as follows:
| | | | | | | | | | | | | | | | |
| | | Year Ended March 31, | | | Period Ended
March 31,
2006 (a) | |
| Class Z Shares | | 2009 | | | 2008 | | | 2007 | | |
Net Asset Value, Beginning of Period | | $ | 11.16 | | | $ | 11.70 | | | $ | 10.26 | | | $ | 10.00 | |
| | | | |
Income from Investment Operations: | | | | | | | | | | | | | | | | |
Net investment income (b) | | | 0.07 | | | | 0.23 | | | | 0.12 | | | | — | (d) |
Net realized and unrealized gain (loss) on investments
and capital gains distributions received | | | (5.15 | ) | | | 0.08 | | | | 1.69 | | | | 0.26 | |
| | | | | | | | | | | | | | | | |
Total from investment operations | | | (5.08 | ) | | | 0.31 | | | | 1.81 | | | | 0.26 | |
| | | | |
Less Distributions to Shareholders: | | | | | | | | | | | | | | | | |
From net investment income | | | — | | | | (0.15 | ) | | | (0.09 | ) | | | — | |
From net realized gains | | | (0.56 | ) | | | (0.70 | ) | | | (0.28 | ) | | | — | |
| | | | | | | | | | | | | | | | |
Total distributions to shareholders | | | (0.56 | ) | | | (0.85 | ) | | | (0.37 | ) | | | — | |
| | | | |
Redemption Fees: | | | | | | | | | | | | | | | | |
Redemption fees added to paid-in-capital (b)(d) | | | — | | | | — | | | | — | | | | — | |
| | | | |
Net Asset Value, End of Period | | $ | 5.52 | | | $ | 11.16 | | | $ | 11.70 | | | $ | 10.26 | |
Total return (e)(f) | | | (47.84 | )% | | | 2.03 | % | | | 17.69 | % | | | 2.60 | %(g) |
| | | | |
Ratios to Average Net Assets/Supplemental Data: | | | | | | | | | | | | | | | | |
Net expenses (h)(i) | | | — | | | | — | | | | — | | | | — | |
Waiver/Reimbursement | | | 0.26 | % | | | 0.22 | % | | | 0.59 | % | | | 13.23 | %(j) |
Net investment income (i) | | | 0.83 | % | | | 1.89 | % | | | 0.93 | % | | | — | %(j)(c) |
Portfolio turnover rate | | | 20 | % | | | 3 | % | | | 1 | % | | | — | |
Net assets, end of period (000’s) | | $ | 58,268 | | | $ | 89,568 | | | $ | 31,029 | | | $ | 316 | |
| (a) | Class Z shares commenced operations on February 15, 2006. Per share data and total return reflect activity from that date. |
| (b) | Per share data was calculated using the average shares outstanding during the period. |
| (c) | Rounds to less than 0.01%. |
| (d) | Rounds to less than $0.01 per share. |
| (e) | Total return at net asset value assuming all distributions reinvested. |
| (f) | Had the investment advisor and/or any of its affiliates not waived fees or reimbursed a portion of expenses, total return would have been reduced. |
| (h) | Does not include expenses of the investment companies in which the Portfolio invests, if these expenses were included, the expense ratios would have been higher. |
| (i) | The benefits derived from expense reductions had an impact of less than 0.01%. |
See Accompanying Notes to Financial Statements.
40
Notes to Financial Statements – Columbia Masters Portfolios
March 31, 2009
Note 1. Organization
Columbia Funds Series Trust (the “Trust”) is a Delaware statutory trust registered under the Investment Company Act of 1940, as amended, (the “1940 Act”), as an open-end management investment company. Information presented in these financial statements pertains to the following diversified portfolios (each, a “Portfolio” and collectively, the “Portfolios”), each a series of the Trust:
Columbia Masters Global Equity Portfolio
Columbia Masters Heritage Portfolio
Columbia Masters International Equity Portfolio
Investment Objective
Each Portfolio seeks capital appreciation. The Portfolios generally invest in the Class Z shares of the specific funds (the “Underlying Funds”) advised by Columbia Management Advisors, LLC (“Columbia”) or its affiliates. Columbia Masters Global Equity Portfolio generally invests in Columbia Multi-Advisor International Equity Fund, Columbia Strategic Investor Fund, Columbia Marsico 21st Century Fund and Columbia Acorn International. Columbia Masters Heritage Portfolio generally invests in Columbia Strategic Investor Fund, Columbia Marsico 21st Century Fund and Columbia Strategic Income Fund. Columbia Masters International Equity Portfolio generally invests in Columbia Multi-Advisor International Equity Fund and Columbia Acorn International.
The financial statements of the Underlying Funds in which the Portfolios invest should be read in conjunction with the Portfolios’ financial statements and are available at www.columbiafunds.com.
Portfolio Shares
The Trust is authorized to issue an unlimited number of shares. Columbia Masters Global Equity Portfolio and Columbia Masters Heritage Portfolio each offer four classes of shares: Class A, Class B, Class C and Class Z. Columbia Masters International Equity Portfolio offers five classes of shares: Class A, Class B, Class C, Class R and Class Z. Each share class has its own expense structure and sales charges, as applicable. Beginning on or about June 22, 2009 each Portfolio will no longer accept investments in Class B shares from new or existing investors in each Portfolio’s Class B shares except in connection with the reinvestment of any dividend and/or capital gain distributions in each Portfolio’s Class B shares and exchanges by existing Class B shareholders of the other Columbia Funds.
Class A shares are subject to a maximum front-end sales charge of 5.75% based on the amount of initial investment. Class A shares purchased without an initial sales charge in accounts aggregating $1 million to $50 million at the time of purchase are subject to a 1.00% contingent deferred sales charge (“CDSC”) if the shares are sold within one year after purchase. Class B shares are subject to a maximum CDSC of 5.00% based upon the holding period after purchase. Class B shares will generally convert to Class A shares eight years after purchase. Class C shares are subject to a 1.00% CDSC on shares sold within one year after purchase. Class R and Class Z shares are offered continuously at net asset value. There are certain restrictions on the purchase of Class R and Class Z shares, as described in each Portfolio’s prospectus.
Note 2. Significant Accounting Policies
The preparation of financial statements in accordance with accounting principles generally accepted in the United States of America (“GAAP”) requires management to make certain estimates and assumptions that affect the reported amounts of assets and liabilities, the disclosure of contingent assets and liabilities at the date of the financial statements and the reported amounts of revenue and expenses during the reporting period. Actual results could differ from those estimates. For the years ended March 31, 2008 and 2007, certain amounts have been reclassified from net investment income to net realized gains and certain amounts have been reclassified from distributions from net investment income to distributions from net realized gains to conform to the current year financial statement presentation. The following is a summary of significant accounting policies consistently followed by the Portfolios in the preparation of their financial statements.
Security Valuation
Investments in the Underlying Funds are valued at the net asset value of the Class Z shares of the respective Underlying Fund determined as of the close of the New York Stock Exchange on the valuation date.
Security Transactions
Security transactions are accounted for on the trade date. Cost is determined and gains (losses) are based upon the specific identification method for both financial statement and federal income tax purposes.
41
Columbia Masters Portfolios
March 31, 2009
Income Recognition
Distributions from the Underlying Funds are recorded on the ex-dividend date.
Expenses
General expenses of the Trust are allocated to the Portfolios and other series of the Trust based upon relative net assets or other expense allocation methodologies determined by the nature of the expense. Expenses directly attributable to a Portfolio are charged to such Portfolio.
Determination of Class Net Asset Value
All income, expenses (other than class-specific expenses, as shown on the Statements of Operations) and realized and unrealized gains (losses) are allocated to each class of the Portfolios on a daily basis, based on the relative net assets of each class, for purposes of determining the net asset value of each class.
Federal Income Tax Status
Each Portfolio intends to qualify each year as a “regulated investment company” under Subchapter M of the Internal Revenue Code, as amended, and will distribute substantially all of its taxable income, if any, for its tax year, and as such will not be subject to federal income taxes. In addition, each Portfolio intends to distribute in each calendar year substantially all of its net investment income, capital gains and certain other amounts, if any, such that each Portfolio should not be subject to federal excise tax. Therefore, no federal income or excise tax provision is recorded.
Distributions to Shareholders
Distributions from net investment income, if any, are declared and paid semi-annually for each Portfolio, except Columbia Masters Heritage Portfolio for which distributions from net investment income, if any, are declared and paid quarterly. Net realized capital gains, if any, are distributed at least annually. Income distributions and capital gain distributions are determined in accordance with federal income tax regulations which differ from GAAP.
Indemnification
In the normal course of business, each Portfolio enters into contracts that contain a variety of representations and warranties and which provide general indemnities. A Portfolio’s maximum exposure under these arrangements is unknown because this would involve future claims against a Portfolio. Also, under the Trust’s organizational documents and by contract, the Trustees and officers of the Trust are indemnified against certain liabilities that may arise out of actions relating to their duties to the Trust. However, based on experience, the Portfolios expect the risk of loss due to these representations, warranties and indemnities to be minimal.
Note 3. Federal Tax Information
The timing and character of income and capital gain distributions are determined in accordance with income tax regulations, which may differ from GAAP. Reclassifications are made to each Portfolio’s capital accounts for permanent tax differences to reflect income and gains available for distribution (or available capital loss carryforwards) under income tax regulations.
For the year ended March 31, 2009, permanent book and tax basis differences resulting primarily from differing treatments for distribution reclassifications, short-term capital gain distributions received by the Fund and distributions paid were identified and reclassified among the components of the Portfolios’ net assets as follows:
| | | | | | | | | | | | |
| | | | | | | | | | |
| | | Undistributed/
(Overdistributed) Net Investment
Income | | | Accumulated Net Realized
Gain/Loss | | | Paid-In
Capital | |
Columbia Masters Global Equity Portfolio | | $ | 28,478 | | | $ | (28,478 | ) | | $ | — | |
Columbia Masters Heritage Portfolio | | | (24,219 | ) | | | 25,042 | | | | (823 | ) |
Columbia Masters International Equity Portfolio | | | 494,328 | | | | (494,328 | ) | | | — | |
Net investment income and net realized gains (losses), as disclosed on the Statements of Operations, and net assets were not affected by these reclassifications.
42
Columbia Masters Portfolios
March 31, 2009
The tax character of distributions paid during the years ended March 31, 2009 and March 31, 2008 was as follows:
| | | | | | |
| | | March 31, 2009 |
| | | Ordinary
Income* | | Long-Term Capital Gains |
Columbia Masters Global Equity Portfolio | | $ | 15,018 | | $ | 2,165,556 |
Columbia Masters Heritage Portfolio | | | 2,111,775 | | | 3,698,827 |
Columbia Masters International Equity Portfolio | | | 49,988 | | | 13,037,752 |
| | | | | | |
| | | March 31, 2008 |
| | | Ordinary
Income* | | Long-Term Capital Gains |
Columbia Masters Global Equity Portfolio | | $ | 1,006,541 | | $ | 831,263 |
Columbia Masters Heritage Portfolio | | | 2,824,281 | | | 291,708 |
Columbia Masters International Equity Portfolio | | | 8,889,478 | | | 5,885,365 |
| * | For tax purposes short-term capital gain distributions, if any, are considered ordinary income distributions. |
As of March 31, 2009, the components of distributable earnings on a tax basis were as follows:
| | | | | | | | | | |
| | | | | | | | |
| | | Undistributed
Ordinary
Income | | Undistributed
Long-Term
Capital Gains | | Net
Unrealized
Depreciation* | |
Columbia Masters Global Equity Portfolio | | $ | 37,039 | | $ | — | | $ | (16,410,159 | ) |
Columbia Masters Heritage Portfolio | | | — | | | — | | | (37,427,923 | ) |
Columbia Masters International Equity Portfolio | | | 1,574,766 | | | — | | | (127,013,179 | ) |
| * | The differences between book-basis and tax-basis net unrealized appreciation/depreciation are primarily due to deferral of losses from wash sales. |
Unrealized appreciation and depreciation at March 31, 2009, based on cost of investments for federal income tax purposes, were:
| | | | | | | | | | | |
| | | | | | | | | |
| | | Unrealized
Appreciation | | Unrealized
Depreciation | | | Net
Unrealized
Depreciation | |
Columbia Masters Global Equity Portfolio | | $ | 3,737 | | $ | (16,413,896 | ) | | $ | (16,410,159 | ) |
Columbia Masters Heritage Portfolio | | | 11,841 | | | (37,439,764 | ) | | | (37,427,923 | ) |
Columbia Masters International Equity Portfolio | | | 20,632 | | | (127,033,811 | ) | | | (127,013,179 | ) |
The following capital loss carryforwards, determined as of March 31, 2009, may be available to reduce taxable income arising from future net realized gains on investments, if any, to the extent permitted by the Internal Revenue Code:
| | | |
| | | |
| | | Expiring
March 31, 2017 |
Columbia Masters Global Equity Portfolio | | $ | 1,169,906 |
Columbia Masters Heritage Portfolio | | | 769,240 |
Columbia Masters International Equity Portfolio | | | 4,980,942 |
Under current tax rules, certain capital losses realized after October 31 may be deferred and treated as occurring on the first day of the following fiscal year. As of March 31, 2009, post-October capital losses attributed to security transactions were deferred to April 1, 2009, as follows:
| | | |
| | | |
Columbia Masters Global Equity Portfolio | | $ | 2,717,087 |
Columbia Masters Heritage Portfolio | | | 1,664,584 |
Columbia Masters International Equity Portfolio | | | 16,861,175 |
43
Columbia Masters Portfolios
March 31, 2009
Under Financial Accounting Standards Board (“FASB”) Interpretation No. 48, Accounting for Uncertainty in Income Taxes—an Interpretation of FASB Statement No. 109 (“FIN 48”), management determines whether a tax position of the Portfolios is more likely than not to be sustained upon examination by the applicable taxing authority, including resolution of any related appeals or litigation processes, based on the technical merits of the position. The tax benefit to be recognized is measured as the largest amount of benefit that is greater than fifty percent likely of being realized upon ultimate settlement. Management has evaluated the known implications of FIN 48 on its computation of net assets for each Portfolio. As a result of this evaluation, management has concluded that FIN 48 did not have any effect on the Portfolios’ financial statements. However, management’s conclusions regarding FIN 48 may be subject to review and adjustment at a later date based on factors including, but not limited to, further implementation guidance from the FASB, new tax laws, regulations, and administrative interpretations (including relevant court decisions). The Portfolios’ federal tax returns for the prior three fiscal years remain subject to examination by the Internal Revenue Service. The Portfolios are not aware of any tax positions for which it is reasonably possible that the total amounts of unrecognized tax benefits will significantly change in the next twelve months.
Note 4. Fees and Compensation Paid to Affiliates
Investment Advisory Fee
Columbia, an indirect, wholly owned subsidiary of Bank of America Corporation (“BOA”), provides investment advisory services to the Portfolios. In rendering investment advisory services to the Portfolios, Columbia may use the portfolio management and research resources of Columbia Management Pte. Ltd., an affiliate of Columbia. The Portfolios do not pay any fee to Columbia for its investment advisory services.
Administration Fee
Columbia provides administrative and other services to the Portfolios. Under the Administration Agreement, Columbia does not receive any compensation from the Portfolios for its administrative services.
Pricing and Bookkeeping Fees
The Portfolios have entered into a Financial Reporting Services Agreement (the “Financial Reporting Services Agreement”) with State Street Bank & Trust Company (“State Street”) and Columbia pursuant to which State Street provides financial reporting services to the Portfolios. The Portfolios have also entered into an Accounting Services Agreement (collectively with the Financial Reporting Services Agreement, the “State Street Agreements”) with State Street and Columbia pursuant to which State Street provides accounting services to the Portfolios. Under the State Street Agreements, each Portfolio pays State Street an annual fee of $26,000 paid monthly. The Portfolios also reimburse State Street for certain out-of-pocket expenses and charges.
The Portfolios have entered into a Pricing and Bookkeeping Oversight and Services Agreement (the “Services Agreement”) with Columbia. Under the Services Agreement, Columbia provides services related to Portfolio expenses and the requirements of the Sarbanes-Oxley Act of 2002, and provides oversight of the accounting and financial reporting services provided by State Street. Under the Services Agreement, the Portfolios reimburse Columbia for out-of-pocket expenses.
Transfer Agent Fee
Columbia Management Services, Inc. (the “Transfer Agent”), an affiliate of Columbia and an indirect, wholly owned subsidiary of BOA, provides shareholder services to the Portfolios and has contracted with Boston Financial Data Services (“BFDS”) to serve as sub-transfer agent. The Transfer Agent is entitled to receive a fee for its services, paid monthly, at the annual rate of $17.34 per open account plus reimbursement of certain sub-transfer agent fees paid by the Transfer Agent (exclusive of BFDS fees), calculated based on assets held in omnibus accounts and intended to recover the cost of payments to other parties (including affiliates of BOA) for services to those accounts. The Transfer Agent pays the fees of BFDS for services as sub-transfer agent and is not entitled to reimbursement for such fees from the Portfolios.
The Transfer Agent may also retain, as additional compensation for its services, fees for wire, telephone and redemption orders, Individual Retirement Account (“IRA”) trustee agent fees and account transcript fees due to the Transfer Agent from shareholders of the Portfolios and credits (net of bank charges) earned with respect to balances in accounts the Transfer Agent maintains in connection with its services to the Portfolios. The Transfer Agent also receives reimbursement for certain out-of-pocket expenses.
44
Columbia Masters Portfolios
March 31, 2009
An annual minimum account balance fee of $20 may apply to certain accounts with a value below each Portfolio’s initial minimum investment requirements to reduce the impact of small accounts on transfer agent fees. These minimum account balance fees are recorded as part of expense reductions on the Statements of Operations. For the year ended March 31, 2009, these minimum account balance fees reduced total expenses of the Portfolios as follows:
| | | |
| | | |
| | | Minimum Account
Balance Fee |
Columbia Masters Global Equity Portfolio | | $ | 160 |
Columbia Masters Heritage Portfolio | | | 140 |
Columbia Masters International Equity Portfolio | | | 40 |
Underwriting Discounts, Service and Distribution Fees
Columbia Management Distributors, Inc. (the “Distributor”), an affiliate of Columbia and an indirect, wholly owned subsidiary of BOA, is the principal underwriter of the Portfolios’ shares. For the year ended March 31, 2009, the Distributor has retained net underwriting discounts on the sale of Class A shares and received net CDSC fees on Class A, Class B and Class C share redemptions as follows:
| | | | | | | | | | | | |
| | | Front-End Sales Charge | | CDSC |
| | | Class A | | Class A | | Class B | | Class C |
Columbia Masters Global Equity Portfolio | | $ | 8,819 | | $ | — | | $ | 18,719 | | $ | 1,367 |
Columbia Masters Heritage Portfolio | | | 45,971 | | | — | | | 76,659 | | | 2,583 |
Columbia Masters International Equity Portfolio | | | 21,241 | | | 9 | | | 19,308 | | | 6,443 |
The Trust has adopted shareholder servicing plans and distribution plans for the Class B and Class C shares of each Portfolio, a distribution plan for the Class R shares of Columbia Masters International Equity Portfolio and a combined distribution and shareholder servicing plan for the Class A shares of each Portfolio. The shareholder servicing plans permit the Portfolios to compensate or reimburse servicing agents for the shareholder services they have provided. The distribution plans, adopted pursuant to Rule 12b-1 under the 1940 Act, permit the Portfolios to compensate or reimburse the Distributor and/or selling agents for activities or expenses primarily intended to result in the sale of the classes’ shares. Payments for the shareholder servicing plans are made at an annual rate of 0.25% of the average daily net assets attributable to Class B and Class C shares of each Portfolio. Payments for the distribution plans are made at an annual rate of 0.75% of the average daily net assets attributable to Class B and Class C shares of each Portfolio and 0.50% annually of the average daily net assets attributable to the Class R shares of Columbia Masters International Equity Portfolio. The Portfolios’ Class A shares pay a combined distribution and service fee at an annual rate of 0.25% pursuant to each Portfolio’s combined servicing and distribution plan for Class A shares. Payments under the plans are charged as expenses directly to the applicable share class.
Fee Waivers and Expense Reimbursements
Columbia has contractually agreed to bear a portion of the Portfolios’ expenses through July 31, 2010, so that ordinary operating expenses (excluding any distribution and service fees, brokerage commissions, interest, taxes, extraordinary expenses and expenses associated with the Portfolios’ investments in other investment companies, but including custodial charges relating to overdrafts, if any), after giving effect to any balance credits from the Portfolios’ custodian, do not exceed 0.00% of each Portfolio’s average net assets. There is no guarantee that these expense limitations will continue after July 31, 2010.
Fees Paid to Officers and Trustees
All officers of the Portfolios are employees of Columbia or its affiliates and, with the exception of the Portfolios’ Chief Compliance Officer, receive no compensation from the Portfolios. The Board of Trustees has appointed a Chief Compliance Officer to the Portfolios in accordance with federal securities regulations. The Portfolios, along with other affiliated funds, pay their pro-rata share of the
45
Columbia Masters Portfolios
March 31, 2009
expenses associated with the Chief Compliance Officer. Each Portfolio’s expenses for the Chief Compliance Officer will not exceed $15,000 per year.
The Trust’s eligible Trustees may participate in a non-qualified deferred compensation plan which may be terminated at any time. Any payments to plan participants are paid solely out of the Portfolios’ assets. Income earned on the plan participant’s deferral account is based on the rate of return of the eligible mutual funds selected by the participant or, if no funds are selected, on the rate of return of Columbia Treasury Reserves, another portfolio of the Trust. The expense for the deferred compensation plan, which includes trustees’ fees deferred during the current period as well as any gains or losses on the trustees’ deferred compensation balances as a result of market fluctuations, is included in “Trustees’ fees” on the Statements of Operations. The liability for the deferred compensation plan is included in “Trustees’ fees” on the Statements of Assets and Liabilities.
Note 5. Custody Credits
Each Portfolio has an agreement with its custodian bank under which custody fees may be reduced by balance credits. These credits are recorded as part of expense reductions on the Statements of Operations. The Portfolios could have invested a portion of the assets utilized in connection with the expense offset arrangement in an income-producing asset if they had not entered into such an agreement.
For the year ended March 31, 2009, these custody credits reduced total expenses for the Portfolios as follows:
| | | |
| | | |
| | | Custody
Credits |
Columbia Masters Global Equity Portfolio | | $ | 1 |
Columbia Masters International Equity Portfolio | | | 9 |
Note 6. Portfolio Information
For the year ended March 31, 2009, the cost of purchases and proceeds from sales of securities, excluding short-term obligations, for the Portfolios were as follows:
| | | | | | |
| | | | | |
| | | Purchases | | Sales |
Columbia Masters Global Equity Portfolio | | $ | 2,794,668 | | $ | 7,390,261 |
Columbia Masters Heritage Portfolio | | | 9,045,306 | | | 18,807,203 |
Columbia Masters International Equity Portfolio | | | 38,807,937 | | | 42,706,168 |
Note 7. Redemption Fees
Columbia Masters Global Equity Portfolio and Columbia Masters International Equity Portfolio each may impose a 2.00% redemption fee on the proceeds of portfolio shares that are redeemed within 60 days of purchase. The redemption fee is designed to offset brokerage commissions and other costs associated with short term trading of the Portfolio shares. The redemption fees, which are retained by the Portfolios, are accounted for as an addition to paid-in capital and are allocated to each class based on the relative net assets at the time of the redemption. For the year ended March 31, 2009, the Portfolios assessed redemption fees as follows:
| | | | | | | | | | | | | | | |
| | | | | | | | | | | |
| | | Class A | | Class B | | Class C | | Class R | | Class Z |
Columbia Masters Global Equity Portfolio | | $ | 785 | | $ | 280 | | $ | 230 | | $ | — | | $ | 35 |
Columbia Masters International Equity Portfolio | | | 17,775 | | | 1,139 | | | 3,914 | | | 6 | | | 16,796 |
Note 8. Line of Credit
The Portfolios and other affiliated funds participate in a $280,000,000 committed, unsecured revolving line of credit provided by State Street. The maximum amount that may be borrowed by any Portfolio is limited to the lesser of $200,000,000 and the Portfolio’s borrowing limit set forth in
46
Columbia Masters Portfolios
March 31, 2009
the Portfolio’s registration statement. Borrowings are available for short-term liquidity or temporary or emergency purposes.
Interest is charged to each participating fund based on the fund’s borrowings at a rate per annum equal to the greater of the Federal Funds Rate plus 0.50% or the overnight LIBOR Rate plus 0.50%. In addition, an annual operations agency fee of $20,000, an amendment fee of 0.02% and a commitment fee of 0.12% per annum are accrued and apportioned among the participating funds pro rata based on their relative net assets. Prior to October 16, 2008, the Portfolios and other affiliated funds participated in a $350,000,000 committed, unsecured revolving line of credit and a $150,000,000 uncommitted, unsecured line of credit, both provided by State Street. Interest on the committed line of credit was charged to each participating fund based on the fund’s borrowings at a rate per annum equal to the Federal Funds Rate plus 0.50%. In addition, a commitment fee of 0.10% per annum was accrued and apportioned among the participating funds pro rata based on their relative net assets. Interest on the uncommitted line of credit was charged to each participating fund based on the fund’s borrowings at a rate per annum equal to the Federal Funds Rate plus 0.375%. State Street charged an annual operations agency fee of $40,000 for the committed line of credit and was able to charge an annual administration fee of $15,000 for the uncommitted line of credit. The commitment fee, the operations agency fee and the administration fee were accrued and apportioned among the participating funds pro rata based on their relative net assets.
For the year ended March 31, 2009, the Portfolios did not borrow under these arrangements.
Note 9. Shares of Beneficial Interest
As of March 31, 2009, 47.7% of Columbia Masters International Equity Portfolio shares outstanding were beneficially owned by two participant accounts over which BOA and/or any affiliates had either sole or joint investment discretion.
As of March 31, 2009, the Portfolios had one shareholder that held greater than 5% of the shares outstanding of a Portfolio, over which BOA and/or any of its affiliates did not have investment discretion. The percentages of shares of beneficial interest outstanding held therein are as follows:
| | |
| | | |
| | | % of Shares
Outstanding Held |
Columbia Masters Global Equity Portfolio | | 12.2 |
Columbia Masters Heritage Portfolio | | 7.1 |
Columbia Masters International Equity Portfolio | | 23.7 |
Subscription and redemption activity of these accounts may have a significant effect on the operations of the Portfolios.
Note 10. Significant Risks and Contingencies
Allocation Risk
Each Portfolio uses an asset allocation strategy in pursuing its investment objective. There is a risk that a Portfolio’s allocation among asset classes or investments will cause the Portfolio to under-perform other funds with similar investment objectives, or that the investments themselves will not produce the returns expected.
Investing in Other Funds Risk
The performance of the Underlying Funds in which the Portfolios invest could be adversely affected if other entities investing in the same Underlying Funds make relatively large investments or redemptions in the Underlying Funds. Because the expenses and costs of the Underlying Funds are shared by the Portfolios, redemptions by other investors in the Underlying Funds could result in decreased economies of scale and increased operating expenses for the Portfolios. In addition, the Advisor has the authority to change the Underlying Funds in which the Portfolios invest or to change the percentage of each Portfolio’s investments allocated to each Underlying Fund. If an Underlying Fund pays fees to the Advisor, such fees could result in the Advisor having a potential conflict of interest in selecting the Underlying Funds in which the Portfolios invest or in determining the percentage of the Portfolios’ investments allocated to each Underlying Fund.
Smaller Company Securities Risk
Securities of small- or mid-capitalization companies (“smaller companies”) may have a higher potential for gains
47
Columbia Masters Portfolios
March 31, 2009
than securities of large-capitalization companies but also may involve more risk. Smaller companies may be more vulnerable to market downturns and adverse economic events than larger, more established companies because smaller companies may have more limited financial resources and business operations. Their securities may trade less frequently and in smaller volumes and may be less liquid and fluctuate more sharply in value than securities of larger companies.
Value Securities Risk
Certain Underlying Funds invest in value securities, which are securities of companies that may have experienced adverse business, industry or other developments that have caused the securities to be potentially undervalued. There is the risk that the market value of a portfolio security may not meet the Advisor’s future value assessment of that security. There is also a risk that it may take longer than expected for the value of these investments to rise to the believed value. In addition, value securities at times may not perform as well as growth securities or the stock market in general.
Interest Rate Risk
Certain Underlying Funds invest in debt securities, which are subject to interest rate risk. In general, if prevailing interest rates rise, the values of debt securities will tend to fall, and if interest rates fall, the values of debt securities will tend to rise. Changes in the value of a debt security may affect the value of the Underlying Fund’s shares. Interest rate risk is generally greater for debt securities with longer maturities/durations.
Credit Risk
Certain Underlying Funds are subject to credit risk, which applies to most debt securities, but is generally not a factor for obligations backed by the “full faith and credit” of the U.S. Government. The Underlying Fund could lose money if the issuer of a debt security is unable or perceived to be unable to pay interest or principal when it becomes due. Various factors could affect the issuer’s actual or perceived ability to make timely interest or principal payments, including changes in the issuer’s financial condition or in general economic conditions. Debt securities backed by an issuer’s taxing authority may be subject to legal limits on the issuer’s ability to increase taxes or otherwise to raise revenue. Certain debt securities are backed only by revenues derived from a particular project, and thus may have a greater risk of default.
Low and Below Investment Grade Securities Risk
Certain Underlying Funds invest in debt securities with the lowest investment grade rating or that are below investment grade. These securities are more speculative than securities with higher ratings, and tend to be more sensitive to credit risk particularly during a downturn in the economy. These securities typically pay a premium in the form of a higher interest rate or yield because of the increased risk of loss, including default. These securities also are generally less liquid than higher-rated securities.
Foreign Securities Risk
Certain Underlying Funds invest in foreign securities which involves certain additional risks. These risks may involve foreign currency exchange rate fluctuations, adverse political and economic developments or foreign governmental laws or restrictions. In addition, the liquidity of foreign securities may be more limited than that of domestic securities. Investments in emerging market countries are subject to additional risk as these countries are more likely to experience high levels of inflation, deflation or currency devaluation which could hurt their economies and securities markets.
High-Yield Securities Risk
Certain Underlying Funds invest in high-yield securities may involve greater credit risk and considerations not typically associated with investing in U.S. Government bonds and other higher quality fixed income securities. These non-investment grade securities are often referred to as “junk” bonds. Economic downturns may impair the issuers’ ability to repay principal and interest. Also, an increase in interest rates would likely have an adverse impact on the value of such obligations. High-yield securities may also be less liquid to the extent that there is no established secondary market.
Legal Proceedings
Columbia Masters Global Equity Portfolio, Columbia Masters Heritage Portfolio and the Columbia Masters International Equity Portfolio did not commence operations until after the
48
Columbia Masters Portfolios
March 31, 2009
events that resulted in the regulatory proceedings and litigation described below.
Columbia Management Advisors, LLC and Columbia Management Distributors, Inc. (collectively, the “Columbia Group”) are subject to a settlement agreement with the New York Attorney General (“NYAG”) (the “NYAG Settlement”) and a settlement order with the SEC (the “SEC Order”) on matters relating to mutual fund trading, each dated February 9, 2005. Under the terms of the SEC Order, the Columbia Group (or predecessor entities) agreed, among other things, to: pay disgorgement and civil money penalties collectively totaling $375 million; cease and desist from violations of the antifraud provisions and certain other provisions of the federal securities laws; maintain certain compliance and ethics oversight structures; and retain an independent consultant to review the Columbia Group’s applicable supervisory, compliance, control and other policies and procedures. The NYAG Settlement, among other things, requires Columbia Management Advisors, LLC and its affiliates to reduce management fees for certain funds in the Columbia family of mutual funds in a projected total of $160 million over five years through November 30, 2009 and to make certain disclosures to investors relating to expenses. In connection with the Columbia Group providing services to the Columbia Funds, the Columbia Funds have voluntarily undertaken to implement certain governance measures designed to maintain the independence of their boards of trustees and certain special consulting and compliance measures.
Pursuant to the SEC Order and related procedures, the $375 million in settlement amounts described above, of which approximately $90 million has been earmarked for certain Columbia Funds and their shareholders, is being distributed in accordance with a distribution plan developed by an independent distribution consultant and approved by the SEC on December 27, 2007. Distributions under the distribution plan began in mid-June 2008.
Civil Litigation
In connection with the events that resulted in the NYAG Settlement and SEC Order, various parties filed suits against Bank of America Corporation and certain of its affiliates, including Banc of America Capital Management, LLC (“BACAP,” now known as Columbia Management Advisors, LLC) and BACAP Distributors, LLC (now known as Columbia Management Distributors, Inc.) (collectively “BAC”), Nations Funds Trust (now known as Columbia Funds Series Trust) and its Board of Trustees. On February 20, 2004, the Judicial Panel on Multidistrict Litigation transferred these cases and cases against other mutual fund companies based on similar allegations to the United States District Court in Maryland for consolidated or coordinated pretrial proceedings (the “MDL”). Subsequently, additional related cases were transferred to the MDL. On September 29, 2004, the plaintiffs in the MDL filed amended and consolidated complaints. One of these amended complaints is a putative class action that includes claims under the federal securities laws and state common law, and that names Nations Funds Trust, the Trustees, BAC and others as defendants. Another of the amended complaints is a derivative action purportedly on behalf of the Nations Funds Trust against BAC and others that asserts claims under federal securities laws and state common law. Nations Funds Trust is a nominal defendant in this action.
On February 25, 2005, BAC and other defendants filed motions to dismiss the claims in the pending cases. On December 15, 2005, BAC and others entered into a Stipulation of Settlement of the direct and derivative claims brought on behalf of the Nations Funds shareholders. The settlement is subject to court approval. If the settlement is approved, BAC would pay settlement administration costs and fees to plaintiffs’ counsel as approved by the court. The stipulation has not yet been presented to the court for approval.
Note 11. Subsequent Event
The Board of Trustees of Columbia Funds Series Trust has approved a proposal to liquidate Columbia Masters Global Equity Portfolio and Columbia Masters Heritage Portfolio. The liquidations are expected to take place during the third quarter of 2009.
49
Report of Independent Registered Public Accounting Firm
To the Trustees of Columbia Funds Series Trust and the Shareholders of Columbia Masters Global Equity Portfolio, Columbia Masters Heritage Portfolio and Columbia International Equity Portfolio
In our opinion, the accompanying statements of assets and liabilities, including the investment portfolios, and the related statements of operations and of changes in net assets and the financial highlights present fairly, in all material respects, the financial position of Columbia Masters Global Equity Portfolio, Columbia Masters Heritage Portfolio and Columbia Masters International Equity Portfolio (the “Portfolios”) (constituting part of Columbia Funds Series Trust) at March 31, 2009, the results of each of their operations, the changes in each of their net assets and the financial highlights for the periods indicated, in conformity with accounting principles generally accepted in the United States of America. These financial statements and financial highlights (hereafter referred to as “financial statements”) are the responsibility of the Portfolios’ management. Our responsibility is to express an opinion on these financial statements based on our audits. We conducted our audits of these financial statements in accordance with the standards of the Public Company Accounting Oversight Board (United States). Those standards require that we plan and perform the audit to obtain reasonable assurance about whether the financial statements are free of material misstatement. An audit includes examining, on a test basis, evidence supporting the amounts and disclosures in the financial statements, assessing the accounting principles used and significant estimates made by management, and evaluating the overall financial statement presentation. We believe that our audits, which included confirmation of securities at March 31, 2009 by correspondence with the transfer agents of the underlying funds, provide a reasonable basis for our opinion.
PricewaterhouseCoopers LLP
Boston, Massachusetts
May 27, 2009
50
Federal Income Tax Information (Unaudited) – Columbia Masters Portfolios
Columbia Masters Global Equity Portfolio
For non-corporate shareholders, 100.00%, or the maximum amount allowable under the Jobs and Growth Tax Relief Reconciliation Act of 2003, on income earned by the Portfolio for the period April 1, 2008 to March 31, 2009 may represent qualified dividend income. Final information will be provided in your 2009 Form 1099-DIV.
100.00% of the ordinary income distributed by the Portfolio, for the year ended March 31, 2009, qualifies for the corporate dividends received deduction.
Columbia Masters Heritage Portfolio
For non-corporate shareholders, 9.97%, or the maximum amount allowable under the Jobs and Growth Tax Relief Reconciliation Act of 2003, on income earned by the Portfolio for the period April 1, 2008 to March 31, 2009 may represent qualified dividend income. Final information will be provided in your 2009 Form 1099-DIV.
9.94% of the ordinary income distributed by the Portfolio, for the year ended March 31, 2009, qualifies for the corporate dividends received deduction.
51
Fund Governance
The Trustees serve terms of indefinite duration. The names, addresses and ages of the Trustees and officers of the Funds in the Columbia Funds Complex, the year each was first elected or appointed to office, their principal business occupations during at least the last five years, the number of Funds overseen by each Trustee and other directorships they hold are shown below. Each officer listed below serves as an officer of each Fund in the Columbia Funds Complex.
Independent Trustees
| | |
Name, address and age, Position with funds, Year first elected or appointed to office | | Principal occupation(s) during past five years, Number of Funds in the Columbia
Funds Complex overseen by Trustee, Other directorships Held |
|
| Edward J. Boudreau (Born 1944) |
c/o Columbia Management Advisors, LLC One Financial Center Boston, MA 02111 Trustee (since 2005) | | Managing Director–E.J. Boudreau & Associates (consulting), from 2000 through current; oversees 66; no other directorships held. |
| |
| William P. Carmichael (Born 1943) | | |
c/o Columbia Management Advisors, LLC One Financial Center Boston, MA 02111 Trustee (since 1999) | | Retired. Oversees 66; Director–Cobra Electronics Corporation (electronic equipment manufacturer); Director–Spectrum Brands, Inc. (consumer products); Director–Simmons Company (bedding); Director–The Finish Line (sportswear). |
| |
| William A. Hawkins (Born 1942) | | |
c/o Columbia Management Advisors, LLC One Financial Center Boston, MA 02111 Trustee (since 2005) | | President and Chief Executive Officer–California General Bank, N.A., from January 2008 through current; oversees 66; no other directorships held. |
| |
| R. Glenn Hilliard (Born 1943) | | |
c/o Columbia Management Advisors, LLC One Financial Center Boston, MA 02111 Trustee (since 2005) | | Chairman and Chief Executive Officer–Hilliard Group LLC (investing and consulting), from April 2003 through current; Non-Executive Director & Chairman–Conseco, Inc. (insurance), September 2003 through current; Executive Chairman–Conseco, Inc. (insurance), August 2004 through September 2005; oversees 66. |
| |
| John J. Nagorniak (Born 1944) | | |
c/o Columbia Management Advisors, LLC One Financial Center Boston, MA 02111 Trustee (since 2008) | | Retired. President and Director–Foxstone Financial, Inc. (consulting), 2000 through December 2007; Director–Mellon Financial Corporation affiliates (investing), 2000 through 2007; Chairman–Franklin Portfolio Associates (investing–Mellon affiliate), 1982 through 2007; oversees 66; Director–MIT Investment Company; Trustee–MIT 401k Plan; Trustee and Chairman–Research Foundation of CFA Institute. |
|
| Anthony M. Santomero* (Born 1946) |
c/o Columbia Management Advisors, LLC One Financial Center Boston, MA 02111 Trustee (since 2008) | | Richard K. Mellon Professor Emeritus of Finance, The Wharton School, University of Pennsylvania, from 1972 through current; Senior Advisor–McKinsey & Company (consulting), July 2006 through December 2007; President and Chief Executive Officer–Federal Reserve Bank of Philadelphia, 2000 through April 2006; oversees 66; Director–Renaissance Reinsurance Ltd.; Director–Penn Mutual Life Insurance Company; Director–Citigroup. |
52
Fund Governance (continued)
Independent Trustees (continued)
| | |
Name, address and age, Position with funds, Year first elected or appointed to office | | Principal occupation(s) during past five years, Number of Funds in the Columbia
Funds Complex overseen by Trustee, Other directorships Held |
| |
| Minor M. Shaw (Born 1947) | | |
c/o Columbia Management Advisors, LLC One Financial Center Boston, MA 02111 Trustee (since 2003) | | President–Micco Corporation and Mickel Investment Group; oversees 66; Board Member–Piedmont Natural Gas. |
| * | Mr. Santomero is currently deemed by the Columbia Funds to be an “interested person” (as defined in the 1940 Act) of the Funds because he serves as a Director of Citigroup, Inc. (“Citigroup”), a company that may through subsidiaries and affiliates engage from time-to-time in brokerage execution, principal transactions and lending relationships with the Columbia Funds or other funds or accounts advised/managed by the Advisor. |
The Statement of Additional Information includes additional information about the Trustees of the Funds and is available, without charge, upon request by calling 800-345-6611.
53
Fund Governance (continued)
Officers
| | |
Name, address and year of birth, Position with Columbia Funds, Year first elected or appointed to office | | Principal occupation(s) during past five years |
|
| J. Kevin Connaughton (Born 1964) |
One Financial Center Boston, MA 02111 President (since 2009) | | Managing Director of Columbia Management Advisors, LLC since December 2004; Senior Vice President and Chief Financial Officer–Columbia Funds, from June 2008 to January 2009; Treasurer–Columbia Funds, from October 2003 to May 2008; Treasurer–the Liberty Funds, Stein Roe Funds and Liberty All-Star Funds, December 2000–December 2006; Senior Vice President–Columbia Management Advisors, LLC, from April 2003 to December 2004; President–Columbia Funds, Liberty Funds and Stein Roe Funds, February 2004 to October 2004; Treasurer–Galaxy Funds, September 2002 to December 2005; Treasurer, December 2002 to December 2004, and President, February 2004 to December 2004–Columbia Management Multi-Strategy Hedge Fund, LLC; and a senior officer of various other Bank of America-affiliated entities, including other registered and unregistered funds |
|
| James R. Bordewick, Jr. (Born 1959) |
One Financial Center Boston, MA 02111 Senior Vice President, Secretary and Chief Legal Officer (since 2006) | | Associate General Counsel, Bank of America since April 2005; Senior Vice President and Associate General Counsel, MFS Investment Management (investment management) prior to April 2005. |
| |
| Linda J. Wondrack (Born 1964) | | |
One Financial Center Boston, MA 02111 Senior Vice President and Chief Compliance Officer (since 2007) | | Director (Columbia Management Group LLC and Investment Product Group Compliance), Bank of America since June 2005; Director of Corporate Compliance and Conflicts Officer, MFS Investment Management (investment management), August 2004 to May 2005; Managing Director, Deutsche Asset Management (investment management) prior to August 2004. |
| |
| Michael G. Clarke (Born 1969) | | |
One Financial Center Boston, MA 02111 Senior Vice President and Chief Financial Officer (since 2009) | | Director of Fund Administration of the Advisor since January 2006; Managing Director of the Advisor September 2004 to December 2005; Vice President Fund Administration June 2002 to September 2004. |
| |
| Jeffrey R. Coleman (Born 1969) | | |
One Financial Center Boston, MA 02111 Treasurer (since 2008) | | Director of Fund Administration of the Advisor since January 2006; Fund Controller of the Advisor from October 2004 to January 2006; Vice President of CDC IXIS Asset Management Services, Inc. (investment management) from August 2000 to September 2004. |
| |
| Joseph F. DiMaria (Born 1968) | | |
One Financial Center Boston, MA 02111 Chief Accounting Officer (since 2008) | | Director of Fund Administration of the Advisor since January 2006; Head of Tax/Compliance and Assistant Treasurer of the Advisor from November 2004 to December 2005; Director of Trustee Administration (Sarbanes-Oxley) of the Advisor from May 2003 to October 2004. |
54
Fund Governance (continued)
Officers (continued)
| | |
Name, address and year of birth, Position with Columbia Funds, Year first elected or appointed to office | | Principal occupation(s) during past five years |
|
| Julian Quero (Born 1967) |
One Financial Center Boston, MA 02111 Deputy Treasurer (since 2008) | | Senior Tax Manager of the Advisor since August 2006; Senior Compliance Manager of the Advisor from April 2002 to August 2006. |
| |
| Barry S. Vallan (Born 1969) | | |
One Financial Center Boston, MA 02111 Controller (since 2006) | | Vice President–Fund Treasury of the Advisor since October 2004; Vice President–Trustee Reporting of the Advisor from April 2002 to October 2004. |
55
Board Consideration and Re-Approval of Investment Advisory Agreement
The Board of Trustees of Columbia Funds Series Trust (the “Board”), including a majority of the Trustees who have no direct or indirect interest in the investment advisory agreement and are not “interested persons” of the Trust, as defined in the Investment Company Act of 1940 (the “1940 Act”) (the “Independent Trustees”), are required annually to review and re-approve the existing investment advisory agreement and approve any newly proposed terms therein. In this regard, the Board reviewed and re-approved, during the most recent six months covered by this report, the investment advisory agreement with Columbia Management Advisors, LLC (“CMA”) for Columbia Masters Global Equity Portfolio, Columbia Masters Heritage Portfolio and Columbia Masters International Equity Portfolio. The investment advisory agreement with CMA is referred to as the “Advisory Agreement.” The portfolios identified above are referred to as the “Portfolios.”
More specifically, at meetings held on November 10-11, 2008, the Board, including the Independent Trustees advised by their independent legal counsel, considered the factors and reached the conclusions described below relating to the selection of CMA and the re-approval of the Advisory Agreement. The Board also reviewed and considered a report prepared and provided by the Independent Fee Consultant (the “Consultant”) appointed by the Independent Trustees pursuant to an assurance of discontinuance entered into with the New York Attorney General (“NYAG”) to settle a civil complaint filed by the NYAG relating to trading in mutual fund shares (the “NYAG Settlement”). During the fee review process, the Consultant’s role was to manage the review process to ensure that fees are negotiated in a manner that is at arms’ length and reasonable. The Consultant found that the fee negotiation process was, to the extent practicable, at arms’ length and reasonable and consistent with the requirements of the NYAG Settlement. A summary of the Consultant’s report is available at www.columbiafunds.com.
In preparation for the November meetings, the Board met in August for review and discussion of the materials described below. The Investment Committee of the Board also met in June to discuss each Portfolio’s performance with its respective portfolio manager(s). In addition to these meetings, the Investment Committee receives and discusses performance reports at its quarterly meetings. The Contracts Review Committee also provided support in managing and coordinating the process by which the Board reviewed the Advisory Agreement. The Board’s review and conclusions are based on comprehensive consideration of all information presented to it and are not the result of any single controlling factor.
Nature, Extent and Quality of Services
The Board received and considered various data and information regarding the nature, extent and quality of services provided to the Portfolios by CMA under the Advisory Agreement. The most recent investment adviser registration form (“Form ADV”) for CMA was made available to the Board, as were CMA’s responses to a detailed series of requests submitted by the Independent Trustees’ independent legal counsel on behalf of such Trustees. The Board reviewed and analyzed those materials, which included, among other things, information about the background and experience of senior management and investment personnel of CMA.
In addition, the Board considered the investment and legal compliance programs of the Portfolios and CMA including their compliance policies and procedures and reports of the Portfolios’ Chief Compliance Officer.
The Board evaluated the ability of CMA, based on its resources, reputation and other attributes, to attract and retain qualified investment professionals, including research, advisory and supervisory personnel. In this regard, the Board considered information regarding CMA’s compensation program for its personnel involved in the management of the Portfolios. The Board also considered CMA’s investment in further developing its research and trading departments.
Based on the above factors, together with those referenced below, the Board concluded that it was satisfied with the nature, extent and quality of the investment advisory services provided to the Portfolios by CMA.
Portfolio Performance and Expenses
The Board considered the one-year performance results for each of the Portfolios and the performance of each Portfolio since its inception. It also considered these results in comparison to the performance results of the group of funds that was determined by Lipper Inc. (“Lipper”) to be the most similar to a given Portfolio (the “Peer Group”) and to the performance of a broader universe of relevant funds as determined by Lipper (the “Universe”), as well as to each Portfolio’s benchmark index. Lipper is an independent
56
provider of investment company data. The Board was provided with a description of the methodology used by Lipper to select the mutual funds in each Portfolio’s Peer Group and Universe and considered potential imprecision resulting from the selection methodology. The Board also considered certain risk-adjusted performance data.
The Board received and considered statistical information regarding each Portfolio’s total expense ratio and its various components, including contractual advisory fees, actual advisory fees, actual non-management fees, Rule 12b-1 and non-Rule 12b-1 service fees, fee waivers/caps and/or expense reimbursements. The Board also considered comparisons of these fees to the expense information for each Portfolio’s Peer Group and Universe, which comparative data was provided by Lipper. For certain Portfolios, Lipper determined that the composition of the Peer Group and/or Universe for expenses would differ from the composition for performance to provide a more accurate basis of comparison. The Board also considered Lipper data that ranked each Portfolio based on: (i) each Portfolio’s one-year performance compared to actual management fees; and (ii) each Portfolio’s one-year performance compared to total expenses.
Investment Advisory Fee Rates
The Board reviewed and considered the proposed contractual investment advisory fee rates together with the administration fee rates payable by the Portfolios to CMA for investment advisory services (the “Contractual Management Rates”). In addition, the Board reviewed and considered the proposed fee waiver/cap arrangements applicable to the Contractual Management Rates and considered the Contractual Management Rates after taking the waivers/caps into account (the “Actual Management Rates”). The Board noted that, on a complex-wide basis, CMA had reduced annual management fees by at least $32 million per year pursuant to the NYAG Settlement. The Board also noted reductions in Actual Management Rates and/or total expenses of certain funds across the fund complex. Additionally, the Board received and afforded specific attention to information comparing the Actual Management Rates with those of the other funds in their respective Peer Groups.
The Board concluded that the factors noted above supported the Contractual Management Rates and the Actual Management Rates, and the approval of the Advisory Agreement for all of the Portfolios.
Profitability
The Board received and considered a detailed profitability analysis of CMA based on the Contractual Management Rates and the Actual Management Rates, as well as on other relationships between the Portfolios on the one hand and CMA affiliates on the other. The analysis included complex-wide and per-Portfolio information and a comparison of results using alternative allocation methodologies. The Board concluded that, in light of the costs of providing investment management and other services, the profits and other ancillary benefits that CMA and its affiliates received from providing these services were not unreasonable.
Economies of Scale
The Board received and considered information regarding whether there have been economies of scale with respect to the management of the Portfolios, whether the Portfolios have appropriately benefited from any economies of scale and whether there is potential for realization of any further economies of scale. Most particularly, CMA provided information showing that, as a percentage of fund assets, CMA’s complex-wide revenues, expenses and profits declined over a two-year period during which fund assets increased by 39% and the shareholder benefit over a two-year period increased from 33% to 41% of the Adviser’s total profits. The Board concluded that any potential economies of scale are shared fairly with Portfolio shareholders, most particularly through fee waiver arrangements.
The Board acknowledged the inherent limitations of any analysis of an investment adviser’s economies of scale, stemming largely from the Board’s understanding that economies of scale are realized, if at all, by an investment adviser across a variety of products and services, not just with respect to a single fund.
Information About Services to Other Clients
The Board also received and considered information about the nature and extent of services and fee rates offered by CMA to its other clients, including separate accounts and institutional investors. In this regard, the Board concluded that, because each Portfolio’s Contractual Management Rate is zero, no further analysis was required.
57
Other Benefits to CMA
The Board received and considered information regarding any “fall-out” or ancillary benefits received by CMA and its affiliates as a result of their relationship with the Portfolios. Such benefits could include, among others, benefits attributable to CMA’s relationship with the Portfolios (such as soft-dollar credits) and benefits potentially derived from an increase in CMA’s business as a result of its relationship with the Portfolios (such as the ability to market to shareholders other financial products offered by CMA and its affiliates).
The Board considered the effectiveness of the policies of the Portfolios in achieving the best execution of portfolio transactions, whether and to what extent soft dollar credits are sought and how any such credits are utilized, any benefits that may be realized by using an affiliated broker, the extent to which efforts are made to recapture transaction costs, and the controls applicable to brokerage allocation procedures. The Board also reviewed CMA’s methods for allocating portfolio investment opportunities among the Portfolios and other clients. The Board concluded that the benefits were not unreasonable.
Other Factors and Broader Review
As discussed above, the Board reviews materials received from CMA annually as part of the re-approval process under Section 15(c) of the 1940 Act. The Board also reviews and assesses the quality of the services the Portfolios receive throughout the year. In this regard, the Board and its Committees review a report of CMA at each of its quarterly meetings, which includes, among other things, Portfolio performance reports. In addition, the Board and its Committees confer with portfolio managers at various times throughout the year including, most particularly, in the June Investment Committee meeting.
Conclusion
After considering the above-described factors, based on their deliberations and their evaluation of the information provided, the Board concluded that the compensation payable to CMA under the Advisory Agreement is fair and equitable. Accordingly, the Board unanimously re-approved the Advisory Agreement.
58
Summary of Management Fee Evaluation by Independent Fee Consultant
REPORT OF INDEPENDENT FEE CONSULTANT TO THE FUNDS SUPERVISED BY THE COLUMBIA NATIONS BOARD
Prepared Pursuant to the February 9, 2005 Assurance of Discontinuance among the Office of Attorney General of New York State, Columbia Management Advisors, LLC and Columbia Management Distributors, Inc. November 12, 2008
I. Overview
On February 9, 2005, Columbia Management Advisors, LLC (“CMA”) and Columbia Management Distributors, Inc.1 (“CMD”) agreed to the New York Attorney General’s Assurance of Discontinuance (“AOD”). Among other matters, the AOD stipulates that CMA may manage or advise a Columbia Fund (“Columbia Fund” and together with all such funds or a group of such funds as the “Columbia Funds”) only if the Independent Members of the Columbia Fund’s Board of Trustees appoint a Senior Officer or retain an Independent Fee Consultant (“IFC”) who is to manage the process by which proposed management fees are negotiated. The AOD further stipulates that the Senior Officer or IFC is to prepare a written annual evaluation of the fee negotiation process.
With effect from January 1, 2007, the Independent Members of the Board of Trustees for certain Columbia Funds known collectively as the “Nations Funds” (the “Trustees”) retained me as IFC for the Nations Funds.2 In this capacity, I have prepared the fourth annual written evaluation of the fee negotiation process. As was the case with last year’s report (the “2007 Report”) my immediate predecessor as IFC, John Rea, provided invaluable assistance in the preparation of this year’s report.
A. Role of the Independent Fee Consultant
The AOD charges the IFC with “managing the process by which proposed management fees… to be charged the Columbia Fund are negotiated so that they are negotiated in a manner which is at arms’ length and reasonable and consistent with this Assurance of Discontinuance.” The AOD also provides that CMA “may manage or advise a Columbia Fund only if the reasonableness of the proposed management fees is determined by the Board of Trustees… using… an annual independent written evaluation prepared by or under the direction of… the Independent Fee Consultant.” Therefore, the AOD makes clear that the IFC does not supplant the Trustees in negotiating management fees with CMA, nor does the IFC substitute his or her judgment for that of the Trustees with respect to the reasonableness of proposed fees or any other matter that is committed to the business judgment of the Trustees.
B. Elements Involved in Managing the Fee Negotiation Process
In preparing the report required by the AOD, the IFC must consider at least the following six factors set forth in the AOD:
| 1. | The nature and quality of CMA’s services, including the Fund’s performance; |
| 2. | Management fees (including any components thereof) charged by other mutual fund companies for like services; |
| 3. | Possible economies of scale as the Fund grows larger; |
| 4. | Management fees (including any components thereof) charged to institutional and other clients of CMA for like services; |
| 5. | Costs to CMA and its affiliates of supplying services pursuant to the management fee agreements, excluding any intra-corporate profit; and |
| 6. | Profit margins of CMA and its affiliates from supplying such services. |
C. Organization of the Annual Evaluation
This report, like last year’s, focuses on the six factors and contains a section for each factor except that CMA’s costs and profits from managing the Funds have been combined into a single section. In addition to a discussion of these factors, the report offers recommendations to improve the fee review process in future years. A review of the status of
1 | CMA and CMD are subsidiaries of Columbia Management Group, LLC (“CMG”), and are the successors to the entities named in the AOD. |
2 | I have no material relationship with Bank of America, CMG or any of its affiliates, aside from serving as IFC, and I am aware of no material relationship with any of their affiliates. I retained John Rea, an independent economic consultant, to assist me with this report. |
| | Unless otherwise stated or required by the context, this report covers only the Nations Funds, which are also referred as the “Funds.” |
59
recommendations made in the 2007 Report is being provided separately with the materials for the November meeting.
II. Summary of Findings
A. General
| 1. | Based upon my examination of the information supplied by CMG in the light of the six factors set forth in the AOD, I conclude that the Trustees have the relevant information necessary to evaluate the reasonableness of the proposed management fees for each Nations Fund. |
| 2. | In my view, the process by which the proposed management fees of the Funds have been negotiated in 2008 thus far has been, to the extent practicable, at arms’ length and reasonable and consistent with the AOD. |
B. Nature and Quality of Services, Including Performance
| 3. | The performance of the Funds has been relatively good for the most recent 1-, 3- and 5-year periods. The strongest records were posted by the Funds in the Active Equity and Quantitative Strategies Groups and by the sub-advised Funds. The 5-year performance rankings of the subadvised Funds were particularly strong, with all such Funds in the top two performance quintiles. |
| 4. | The 1- and 3-year performance records of the Funds declined slightly from 2007 to 2008, while the 5-year performance records improved year-over-year. Most Funds changed their 1-year performance quintile year-over-year, while the 5-year rankings were, as expected, much more stable, with less than half the Funds moving to a different 5-year performance quintile. |
| 5. | The performance of the actively-managed equity and sub-advised Funds against their benchmarks was strong, especially for the 1- and 3-year performance periods. However, no fixed-income Fund with a reliable benchmark exceeded it on a net basis in any performance period. Money market Funds do not have such benchmarks and therefore were excluded from this analysis. |
| 6. | The Nations equity Funds’ overall performance adjusted for risk was strong. The performance of 13 of the 19 actively-managed Funds included in the risk analysis bettered the median in 3-year performance adjusted and unadjusted for risk. No relationship between risk and return was detected for fixed-income Funds. |
| 7. | The industry-standard procedure used by third parties such as Lipper and Morningstar to construct the performance universe in which each Fund’s performance is ranked relative to comparable funds tends to bias a Fund’s ranking upward within that universe. The bias occurs because either no-12b-1-fee or A share classes of the Funds are compared to the performance universe that includes all share classes of competitive multi-class funds. Therefore, the procedure ranks shares with zero or 25 basis point 12b-1 fees against classes of competitive funds with 12b-1 fees of up to 100 basis points. Correcting this bias by limiting the performance universe to classes of competitive funds with comparable 12b-1 fees in most cases lowers the relative performance for the Funds but does not call into question the general finding that the Nations Funds’ performance has been strong. |
| 8. | A small number of Funds have consistently underperformed their peers in each of the past four years, depending on the exact criteria used to measure long-term underperformance. For example, one Fund has had below-median 1- and 3-year performance in each of the past four years; one additional Fund had below-median 3-year performance for those years. |
| 9. | The services performed by CMG professionals beyond portfolio management, such as compliance, legal, information technology, risk management, finance and fund administration, are critical to the success of the Funds and appear to be of high quality. |
C. Management Fees Charged by Other Mutual Fund Companies
| 10. | The Funds’ management fees and total expenses are generally low relative to those of their peers, with the exception of subadvised Funds. Almost two-third of the Funds ranked in the two least expensive quintiles for total expenses and just over half were in those quintiles for actual management fees. Funds with lower actual management fees tended to have lower relative total expenses. All fixed-income Funds had total expenses in the two least expensive quintiles. |
| 11. | Generally, the Nations Funds with the highest relative fees and expenses are sub-advised. All eight Nations Funds with fifth-quintile total expense rankings were sub-advised. The actual management fees of 11 of the 14 |
60
| | sub-advised Funds were in the fourth and fifth quintile. The average management fees of the sub-advised Funds were typically 20 points higher than internally-managed equity Funds. CMA presented data suggesting that such differentials were consistent with industry practice. |
| 12. | The management fees of the internally-advised Nations Funds are generally in line with those of Columbia Funds overseen by the Atlantic and Acorn/Wanger Boards of Trustees. |
D. Trustees’ Fee and Performance Evaluation Process
| 13. | The Trustees’ evaluation process identified 20 Funds in 2008 for further review based upon their relative performance or expenses or both. When compared in filtered universes, three more Funds met the criteria for review. |
E. Potential Economies of Scale
| 14. | CMG has prepared a memo for the Trustees containing its views on the sources and sharing of potential economies of scale. CMG views economies of scale as arising at the complex level and would regard estimates of scale economies for individual funds as unreliable. In its analysis, CMG did not identify specific sources of economies of scale or provide any estimates of any economies of scale that might arise from future asset growth. CMG’s analysis included measures taken by the Trustees and CMG that seek to share any potential economies of scale through breakpoints in management fee schedules, expense reimbursements, fee waivers, enhanced shareholder services, fund mergers, and operational consolidation. |
| 15. | An examination of the management fee schedules of a selected number of the Nations Funds suggests that, as a general matter, the breakpoint schedules of these Funds are not out of line with those of competitors. A similar examination of five other Nations Funds in 2007 led to the same conclusion. |
F. Management Fees Charged to Institutional Clients
| 16. | CMG has provided Trustees with comparisons of mutual fund management fees and institutional fees based upon standardized fee schedules and actual fees. The results show that, consistent with industry practice, institutional fees are generally lower than the Funds’ management fees. However, because the services provided and risks borne by the manager are more extensive for mutual funds than for institutional accounts, the differences are of limited value in assisting the Trustees in their review of the reasonableness of the Funds’ management fees. |
G. Revenues, Expenses, and Profits
| 17. | The activity-based cost allocation methodology (“ABC”) employed by CMG to allocate costs for purposes of calculating Fund profitability, both direct and indirect, for purposes of calculating Fund profitability is thoughtful and detailed. For comparison, CMG proposed a change to the method by which indirect expenses were allocated. Under this “hybrid” method, such costs are allocated to Funds 50% by assets and 50% per fund. Allocating indirect expenses equally to each Fund has an intuitive logic, as each Fund regardless of size has certain expenses, such as preparing and printing prospectuses and financial statements. |
| 18. | The materials provided on CMG’s revenues and expenses with respect to the Funds and the methodology underlying their construction generally form a sufficient basis for Trustees to evaluate CMG’s expenses and profitability for each Fund. |
| 19. | In 2007, CMG’s complex-wide pre-tax margins on the Nations Funds were close to the industry average before distribution and below average when distribution revenues and expenses were included, based on limited data available about publicly-held mutual fund managers. However, as is to be expected in a complex comprising 65 Funds, some Nations Funds have higher pre-tax profit margins, when calculated solely with respect to management revenues and expenses, while other Nations Funds operate at a loss. A pro forma analysis of the complex’s profitability taking into account expenses incurred in 2008 associated with support of the money market funds sharply reduced the profitability of the Nations Funds. There is a positive relationship between fund size and profitability, with smaller Funds generally operating at a loss. |
61
| 20. | CMG shares a fixed percentage of its management fee revenues with an affiliate, U.S. Trust, Bank of America Private Wealth Management, to compensate that affiliate for services it performs with respect to Nations Fund assets held for the benefit of its customers. Based on our analysis of the services provided by the affiliate, we believe all such payments should be regarded as a distribution expense, except for any portion attributable to payments by CMG for performance of sub-transfer agency or sub-accounting functions. |
III. Recommendations
| 1) | Criteria for review. The Trustees may wish to consider modifying the criteria for classifying a fund as a “Review Fund” to include criteria that focus exclusively on performance without regard to expense or fee levels. For example, a Fund whose one-year or three-year performance was median or below for four consecutive years could be treated as a Review Fund. Applying such criteria would add two Funds to the list of Review Funds. |
| 2) | Profitability data. CMG should present to the Trustees each year the profitability of each Fund, each investment style, and each complex (of which Nations is one) calculated as follows: |
| | Exhibit 1. Management-only profitability should be calculated without reference to any Private Bank expense. |
| | Exhibit 2. Profitability excluding distribution (which essentially covers the management and transfer agency functions) should be adjusted by removing from the expense calculation any portion of the Private Bank payment not attributable to the performance by the Private Bank of sub-transfer agency or sub-accounting functions. |
| | Exhibit 3. Total profitability, including distribution: |
| | No adjustment for Private Bank expenses should be made, because all such expenses represent legitimate fund expenses to be taken into account in calculating CMG’s profit margin including distribution. |
| | Exhibit 4. Distribution only: This should include all Private Bank expenses other than those attributable to sub-transfer agency services. |
| | Therefore, | the following data need not be provided: |
| | 1. | Adjusting total profitability data for Private Bank expenses |
| | 2. | Adjusting profitability excluding distribution by backing out all Private Bank expenses. |
| 3) | Economies of scale. CMG and the IFC should continue to work on methods for more precisely quantifying to the extent possible the sources and magnitude of any economies of scale as CMG’s mutual fund assets under management increase, to the extent that the data allows for meaningful year-over-year comparisons. The framework suggested in Section IV.D.4 may prove to be a useful model for such an analysis. |
| 4) | Competitive breakpoint analysis. As part of the annual fee evaluation process, the breakpoints of a select group of Nations Funds (which would differ each year) should continue to be compared to those of industry rivals to ensure that the Funds’ breakpoint schedules remain within industry norms. As breakpoint schedules change relatively little each year, performing such a comparison for all Funds each year would not be an efficient use of Trustee and CMG resources. |
| 5) | Cost allocation methodology. CMG’s point that the current ABC system of allocating indirect expenses creates anomalous results in several cases, including sub-advised Funds, is well-taken. We would like to work with CMG over the forthcoming year on alternatives to the current system of allocating indirect expenses that (1) resolve the anomalies, (2) limit the amount of incremental effort on CMG’s part and (3) remain faithful to the general principle that expenses should be allocated by time and effort to the extent reasonably possible. |
| 6) | Management fee disparities. CMG and the Nations Trustees, as part of any future study of management fees, should analyze any differences in management fee schedules between Funds managed in similar investment styles. As part of that analysis, CMG should provide an explanation for any significant fee differences among comparable funds across fund families managed by CMA, such as differences in the management styles of different Funds included the same Lipper category. Finally, whenever CMG proposes a management fee change or an expense cap for any mutual fund managed by CMA that is comparable to |
62
| | any Nations Fund, CMG should provide the Trustees with sufficient information about the proposal to allow the Trustees to assess the applicability of the proposed change to the relevant Nations Fund or Funds. |
| 7) | Tax-exempt Fund expense data. The expense rankings of certain tax-exempt Funds were adversely affected by including certain investment-related interest expenses that Lipper excluded in calculating the expense ratios of competitors. We recommend that CMG follow the Lipper practice and exclude such interest expenses from data submitted to Lipper to avoid unfairly disadvantaging the tax-exempt Funds. |
| 8) | Reduction of volume of paper documents submitted. The effort to rationalize and simplify the data presented to the Trustees and the process by which that data was prepared and organized was regarded as a success by all parties. We should continue to look for opportunities to reduce and simplify the presentation of 15(c) data, especially in the area of Fund and manager profitability. The Fund “Dashboard” volume presents a large volume of Fund data on a single page. If it is continued, the Trustees may wish to consider receiving the underlying Lipper data on CD, rather than the current paper volumes. |
Respectfully submitted,
Steven E. Asher
63
[THIS PAGE INTENTIONALLY LEFT BLANK]
64
Important Information About This Report – Columbia Masters Portfolios
Transfer Agent
Columbia Management Services, Inc.
P.O. Box 8081
Boston, MA 02266-8081
1-800-345-6611
Distributor
Columbia Management
Distributors, Inc.
One Financial Center
Boston, MA 02111
Investment Advisor
Columbia Management Advisors, LLC
100 Federal Street
Boston, MA 02110
The portfolios mail one shareholder report to each shareholder address. If you would like more than one report, please call shareholder services at 1-800-345-6611 and additional reports will be sent to you. This report has been prepared for shareholders of Columbia Masters Portfolios.
A description of the policies and procedures that each portfolio uses to determine how to vote proxies and a copy of each portfolio’s voting records are available (i) at www.columbiamanagement.com; (ii) on the Securities and Exchange Commission’s website at www.sec.gov, and (iii) without charge, upon request, by calling 1-800-368-0346. Information regarding how each portfolio voted proxies relating to portfolio securities during the 12-month period ended June 30 is available from the SEC’s website. Information regarding how each portfolio voted proxies relating to portfolio securities is also available from the portfolio’s website, www.columbiamanagement.com.
Each portfolio files a complete schedule of portfolio holdings with the SEC for the first and third quarters of each fiscal year on Form N-Q. Each portfolio’s Form N-Q is available on the SEC’s website at www.sec.gov and may be reviewed and copied at the SEC’s Public Reference Room in Washington, D.C. Information on the operation of the Public Reference Room may be obtained by calling 1-800-SEC-0330.
Please read and consider the investment objectives, risks, charges and expenses for any fund carefully before investing. For a prospectus which contains this and other important information about a portfolio, contact your Columbia Management representative or financial advisor or go to www.columbiamanagement.com.
Columbia Management Group, LLC (“Columbia Management”) is the investment management division of Bank of America Corporation. Columbia Management entities furnish investment management services and products for institutional and individual investors. Columbia Funds are distributed by Columbia Management Distributors, Inc., member of FINRA, SIPC, part of Columbia Management and an affiliate of Bank of America Corporation.
65

One Financial Center
Boston, MA 02111-2621
Columbia Masters Portfolios
Annual Report, March 31, 2009
©2009 Columbia Management Distributors, Inc.
One Financial Center, Boston, MA 02111-2621
800.345.6611 www.columbiafunds.com
SHC-42/10753-0309 (05/09) 09/78784

Annual Report
March 31, 2009
Columbia Daily Cash Reserves
| | |
| NOT FDIC INSURED | | May Lose Value |
| NOT BANK ISSUED | | No Bank Guarantee |
Table of Contents
An investment in money market mutual funds is not a bank deposit, and is not insured or guaranteed by Bank of America, N.A. or any of its affiliates or by the Federal Deposit Insurance Corporation or any other government agency. Although money market mutual funds seek to preserve the value of your investment at $1.00 per share, it is possible to lose money by investing in money market mutual funds. Please see the prospectuses for a complete discussion of the risks of investing in money market mutual funds.
The views expressed in the President’s Message reflect the current views of Columbia Funds’ President. These views are not guarantees of future performance and involve certain risks, uncertainties and assumptions that are difficult to predict, so actual outcomes and results may differ significantly from the views expressed. These views are subject to change at any time based upon economic, market or other conditions and the respective parties disclaim any responsibility to update such views. These views may not be relied on as investment advice and, because investment decisions for a Columbia Fund are based on numerous factors, may not be relied on as an indication of trading intent on behalf of any particular Columbia Fund. References to specific securities should not be construed as a recommendation or investment advice.
President’s Message

Dear Shareholder:
Recent events have shown great volatility in the markets and uncertainty in the economy. During these challenging times, it becomes even more important to focus on long-term horizons and key investment tools that can help manage volatility. This may be the time to reflect on your investment goals and evaluate your portfolio to ensure you are positioned for any potential market rebound.
A long-term financial plan can serve as a road map and guide you through the necessary steps designed to meet your financial goals. Your financial plan should take into account your investment goals, time horizon, overall financial situation, risk tolerance and willingness to ride out market volatility. Your investment professional can be a key resource as you work through this process. The knowledge and experience of an investment professional can help as you create or reevaluate your investment strategy.
The importance of diversification
Although diversification does not ensure a profit or guarantee against loss, a diversified portfolio can be a strategy for successful long-term investing. Diversification refers to the mix of investments within a portfolio. A mutual fund can contribute to portfolio diversification given that a mutual fund’s portfolio represents several investments. Additionally, the way you allocate your money among stocks, bonds and cash, and geographically between foreign and domestic investments, can help to reduce risks. Diversification can result in multiple investments where the positive performance of certain holdings can offset any negative performance from other holdings. Having a diversified portfolio doesn’t mean that the value of the portfolio will never go down, but rather helps strike a balance between risk and reward.
Reevaluate your strategy
An annual review of your investments is a key opportunity to determine if your investment needs have changed or if you need minor adjustments to rebalance your portfolio. Life events like a birth, marriage, home improvement, or change in employment can have a major affect on your spending and goals. Ask yourself how your spending or goals have changed and factor this into your financial plan. Are you using automated investments or payroll deductions to help keep your savings on track? Are you able to set aside additional savings or increase your 401(k) plan contributions? If during your review you find that your investments in any one category (e.g., stocks, bonds or cash) have grown too large based on your diversification plan, you may want to consider redirecting future investments to get back on track.
History has shown that the U.S. stock market has been remarkably resilient.¹ Volatility can lead to opportunity. Patience and a commitment to your long-term financial plan may position you to potentially benefit over your investment horizon. We appreciate your business and continued support of Columbia Funds.
Sincerely,

J. Kevin Connaughton
President, Columbia Funds
The board of trustees elected J. Kevin Connaughton president of Columbia Funds on January 16, 2009.
| ¹ | The Dow Jones Industrial Average is the most widely used indicator of the overall condition of the stock market. The Dow Jones Industrial Average Index is a price-weighted average of 30 actively traded blue-chip stocks as selected by the editors of the Wall Street Journal. Indices are not investments, do not incur fees or expenses and are not professionally managed. It is not possible to invest directly in an index. |
Understanding Your Expenses – Columbia Daily Cash Reserves
Estimating your actual expenses
To estimate the expenses that you paid over the period, first you will need your account balance at the end of the period:
| | n | | For shareholders who receive their account statements from Columbia Management Services, Inc., your account balance is available online at www.columbiafunds.com or by calling Shareholder Services at 800.345.6611. | |
| | n | | For shareholders who receive their account statements from their financial intermediary, contact your financial intermediary to obtain your account balance. | |
| | 1. | Divide your ending account balance by $1,000. For example, if an account balance was $8,600 at the end of the period, the result would be 8.6. | |
| | 2. | In the section of the table below titled “Expenses paid during the period,” locate the amount for your share class. You will find this number in the column labeled “Actual.” Multiply this number by the result from step 1. Your answer is an estimate of the expenses you paid on your account during the period. | |
If the value of your account falls below $1,000, your account generally will be subject to a $10 annual fee. This fee is not included in the accompanying table. If you are subject to the fee, keep it in mind when you are estimating the ongoing expenses of investing in the fund and when comparing the expenses of this fund with other funds.
As a fund shareholder, you incur ongoing costs, which generally include investment advisory fees, shareholder administration fee and other fund expenses. The information on this page is intended to help you understand the ongoing costs of investing in the fund and to compare these costs with the ongoing costs of investing in other mutual funds.
Analyzing your fund’s expenses by share class
To illustrate these ongoing costs, we have provided an example and calculated the expenses paid by investors in each share class during the period. The information in the following table is based on an initial investment of $1,000, which is invested at the beginning of the period and held for the entire period. Expense information is calculated two ways and each method provides you with different information. The amount listed in the “Actual” column is calculated using the fund’s actual operating expenses and total return for the period. The amount listed in the “Hypothetical” column for each share class assumes that the return each year is 5% before expenses and is calculated based on the fund’s actual operating expenses. You should not use the hypothetical account values and expenses to estimate either your actual account balance at the end of the period or the expenses you paid during this period.
Compare with other funds
Since all mutual funds are required to include the same hypothetical calculations about expenses in shareholder reports, you can use this information to compare the ongoing costs of investing in the fund with other funds. To do so, compare the 5% hypothetical example with the 5% hypothetical examples that appear in the shareholder reports of other funds. As you compare hypothetical examples of other funds, it is important to note that hypothetical examples are meant to highlight the ongoing costs of investing in a fund and do not reflect any transaction costs, such as sales charges, redemption fees or exchange fees.
| | | | | | | | | | | | | | |
| 10/01/08 – 03/31/09 | | | | | | | | | | |
| | | | |
| | | Account value at the
beginning of the period ($) | | Account value at the
end of the period ($) | | Expenses paid
during the period ($) | | Fund’s annualized
expense ratio (%) |
| | | Actual | | Hypothetical | | Actual | | Hypothetical | | Actual | | Hypothetical | | Actual |
Trust Class | | 1,000.00 | | 1,000.00 | | 1,007.08 | | 1,023.19 | | 1.75 | | 1.77 | | 0.35 |
Expenses paid during the period are equal to the annualized expense ratio for the share class, multiplied by the average account value over the period, then multiplied by the number of days in the fund’s most recent fiscal half-year and divided by 365.
Had the investment advisor and/or any of its affiliates not waived fees or reimbursed a portion of expenses, account value at the end of the period would have been reduced.
It is important to note that the expense amounts shown in the table are meant to highlight only ongoing costs of investing in the fund. Therefore, the hypothetical examples provided may not help you determine the relative total costs of owning shares of different funds.
1
Investment Portfolio – Columbia Daily Cash Reserves
March 31, 2009
| | | | | | |
| | | | | Par ($) | | Value ($) |
| Commercial Paper (a) – 52.4% | | | | |
| Barton Capital Corp. | | 0.35% 04/07/09 | | 5,522,000 | | 5,521,678 |
| | 0.47% 04/06/09 | | 15,000,000 | | 14,999,021 |
| | 0.52% 05/12/09 | | 7,000,000 | | 6,995,854 |
| | | |
| Cancara Asset Securitization LLC | | 1.05% 05/07/09 | | 2,000,000 | | 1,997,900 |
| | | |
| CBA Delaware Finance, Inc. | | 0.70% 04/17/09 | | 15,000,000 | | 14,995,333 |
| | | |
| Fairway Finance Corp. | | 0.68% 05/05/09 | | 6,000,000 | | 5,996,147 |
| | | |
| Falcon Asset Securitization Co. LLC | | 0.45% 05/27/09 | | 24,500,000 | | 24,482,850 |
| | 0.50% 04/09/09 | | 6,000,000 | | 5,999,333 |
| | | |
| Gemini Securitization Corp. LLC | | 0.55% 04/20/09 | | 26,000,000 | | 25,992,453 |
| | | |
| General Electric Capital Corp. | | 0.70% 06/26/09 | | 10,000,000 | | 9,983,278 |
| | | |
| Gotham Funding Corp. | | 0.70% 05/05/09 | | 6,000,000 | | 5,996,033 |
| | | |
| Liberty Street Funding LLC | | 0.50% 05/01/09 | | 15,000,000 | | 14,993,750 |
| | 0.60% 06/26/09 | | 2,000,000 | | 1,997,133 |
| | 0.63% 06/18/09 | | 11,000,000 | | 10,984,985 |
| | | |
| Lloyds TSB Bank PLC | | 1.17% 06/25/09 | | 10,000,000 | | 9,972,375 |
| | | |
| Nordea North America, Inc. | | 0.83% 05/15/09 | | 2,000,000 | | 1,997,971 |
| | 0.90% 05/05/09 | | 10,000,000 | | 9,991,500 |
| | | |
| Old Line Funding LLC | | 0.55% 04/13/09 | | 6,000,000 | | 5,998,900 |
| | 0.65% 05/01/09 | | 2,000,000 | | 1,998,917 |
| | 0.65% 06/08/09 | | 18,000,000 | | 17,977,900 |
| | | |
| Santander Central Hispano Finance Delaware, Inc. | | 1.38% 04/07/09 | | 30,000,000 | | 29,993,125 |
| | | |
| Sheffield Receivables Corp. | | 0.60% 04/16/09 | | 5,000,000 | | 4,998,750 |
| | 0.60% 06/19/09 | | 15,000,000 | | 14,980,250 |
| | | |
| Societe Generale North America, Inc. | | 0.93% 06/05/09 | | 15,000,000 | | 14,974,813 |
| | | |
| Thames Asset Global Securitization, Inc. | | 0.53% 04/23/09 | | 1,000,000 | | 999,676 |
| | 0.65% 04/15/09 | | 8,000,000 | | 7,997,978 |
| | | |
| Toyota Motor Credit Corp. | | 0.85% 05/13/09 | | 5,000,000 | | 4,995,042 |
| | 1.90% 08/04/09 | | 23,000,000 | | 22,848,264 |
| | | |
| Variable Funding Capital Co. LLC | | 0.48% 05/19/09 | | 25,000,000 | | 24,984,000 |
| | | |
| Victory Receivables Corp. | | 0.50% 04/20/09 | | 3,000,000 | | 2,999,208 |
| | 0.50% 04/21/09 | | 1,000,000 | | 999,722 |
| | | |
| Windmill Funding I Corp. | | 0.56% 05/04/09 | | 2,000,000 | | 1,998,973 |
| | |
| | Total Commercial Paper
(Cost of $331,643,112) | | | | 331,643,112 |
See Accompanying Notes to Financial Statements.
2
Columbia Daily Cash Reserves
March 31, 2009
| | | | | | |
| | | | | Par ($) | | Value ($) |
| Certificates of Deposit – 34.9% | | | | |
| Australia & New Zealand Banking Group | | 0.65% 04/16/09 | | 10,000,000 | | 10,000,000 |
| | | |
| Banco Bilbao Vizcaya Argentaria/NY | | 0.88% 05/15/09 | | 13,000,000 | | 13,000,000 |
| | | |
| Bank of Tokyo-Mitsubishi UFJ Ltd. | | 1.05% 05/05/09 | | 19,000,000 | | 19,000,000 |
| | | |
| Barclays Bank PLC | | 1.38% 05/26/09 | | 8,000,000 | | 8,000,000 |
| | 1.38% 06/09/09 | | 6,000,000 | | 6,000,000 |
| | | |
| BNP Paribas/Chicago IL | | 1.00% 05/06/09 | | 5,000,000 | | 5,000,000 |
| | 1.02% 05/18/09 | | 10,000,000 | | 10,000,000 |
| | 1.12% 07/20/09 | | 11,000,000 | | 11,000,000 |
| | | |
| Chase Bank USA NA | | 0.50% 04/09/09 | | 5,000,000 | | 5,000,000 |
| | | |
| Credit Agricole SA | | 0.72% 04/15/09 | | 2,000,000 | | 2,000,000 |
| | 1.00% 06/04/09 | | 10,000,000 | | 10,000,000 |
| | 1.26% 05/28/09 (b) | | 5,000,000 | | 5,000,546 |
| | | |
| HSBC Bank PLC | | 0.85% 04/30/09 | | 10,000,000 | | 10,000,000 |
| | 0.90% 05/19/09 | | 10,000,000 | | 10,000,000 |
| | | |
| Royal Bank of Scotland PLC/New York NY | | 1.40% 04/06/09 | | 20,000,000 | | 20,000,000 |
| | | |
| Societe Generale NY | | 0.75% 04/08/09 | | 12,000,000 | | 11,999,417 |
| | | |
| Sumitomo Mitsui Banking Corp. | | 1.15% 05/22/09 | | 6,000,000 | | 6,000,000 |
| | 1.17% 05/12/09 | | 11,000,000 | | 11,000,000 |
| | | |
| Toronto Dominion Bank/NY | | 2.00% 04/07/09 | | 3,000,000 | | 3,000,000 |
| | | |
| U.S. Bank N.A. | | 0.70% 06/03/09 | | 29,000,000 | | 29,000,000 |
| | | |
| UBS AG/Stamford Branch | | 0.65% 04/23/09 | | 16,000,000 | | 16,000,000 |
| | |
| | Total Certificates of Deposit
(Cost of $220,999,963) | | | | 220,999,963 |
| | | | | | |
| U.S. Government Agencies (c) – 4.2% | | | | |
| Federal Home Loan Bank | | 0.57% 07/20/09 | | 6,000,000 | | 5,989,550 |
| | 2.80% 04/13/09 | | 6,000,000 | | 5,994,400 |
| | | |
| Federal Home Loan Mortgage Corp. | | 0.58% 08/24/09 | | 2,000,000 | | 1,995,312 |
| | 2.75% 04/07/09 | | 10,000,000 | | 9,995,416 |
| | | |
| Federal National Mortgage Association | | 0.58% 08/26/09 | | 2,550,000 | | 2,543,961 |
| | |
| | Total U.S. Government Agencies
(Cost of $26,518,639) | | | | 26,518,639 |
See Accompanying Notes to Financial Statements.
3
Columbia Daily Cash Reserves
March 31, 2009
| | | | | | | |
| | | | | Par ($) | | Value ($) | |
| Repurchase Agreements – 8.6% | | | | | |
| | Repurchase agreement with Barclays Capital, dated 03/31/09, due 04/01/09 at 0.563%, collateralized by a U.S. Government Agency Obligation maturing 03/01/39, market value $12,240,000 (repurchase proceeds $12,000,188) | | 12,000,000 | | 12,000,000 | |
| | | |
| | Repurchase agreement with Goldman Sachs, dated 03/31/09, due 04/01/09 at 0.170%, collateralized by U.S. Government Agency Obligations with various maturities to 12/01/38, market value $43,600,920 (repurchase proceeds $42,746,202) | | 42,746,000 | | 42,746,000 | |
| | | |
| | Total Repurchase Agreements (cost of $54,746,000) | | 54,746,000 | |
| |
| | | |
| | Total Investments – 100.1% (cost of $633,907,714) (d) | | 633,907,714 | |
| |
| | | |
| | Other Assets & Liabilities, Net – (0.1)% | | (388,964 | ) |
| |
| | | |
| | Net Assets – 100.0% | | | | 633,518,750 | |
Notes to Investment Portfolio:
On April 1, 2008, the Fund adopted Statement of Financial Accounting Standards No. 157, Fair Value Measurements (“SFAS 157”). SFAS 157 establishes a hierarchy that prioritizes the inputs to valuation techniques used to measure fair value giving the highest priority to unadjusted quoted prices in active markets for identical securities (level 1 measurements) and the lowest priority to unobservable inputs (level 3 measurements) when market prices are not readily available or reliable. The three levels of the fair value hierarchy under SFAS 157 are described below:
| | • | | Level 1 – quoted prices in active markets for identical securities |
| | • | | Level 2 – prices determined using other significant observable inputs (including quoted prices for similar securities, interest rates, prepayment speeds, credit risk and others) |
| | • | | Level 3 – prices determined using significant unobservable inputs. In situations where quoted prices or observable inputs are unavailable or less reliable, unobservable inputs may be used. Unobservable inputs may include management’s own assumptions about the factors market participants would use in pricing an investment. |
The inputs or methodology used for valuing securities are not necessarily an indication or risk associated with investing in those securities.
The following table summarizes the inputs used as of March 31, 2009 in valuing the Fund’s assets:
| | | | | | |
Valuation Inputs | | Investments in
Securities | | Other Financial
Instruments |
Level 1 – Quoted Prices | | $ | — | | $ | — |
Level 2 – Other Significant Observable Inputs | | | 633,907,714 | | | — |
Level 3 – Significant Unobservable Inputs | | | — | | | — |
| | | | | | |
Total | | $ | 633,907,714 | | $ | — |
| | | | | | |
| | (a) | The rate shown represents the discount rate at the date of purchase. |
| | (b) | Security exempt from registration pursuant to Rule 144A under the Securities Act of 1933. This security may be resold in transactions exempt from registration, normally to qualified institutional buyers. At March 31, 2009, the value of this security, which is not illiquid, with a value of $5,000,546, represents 0.8% of net assets. |
| | (c) | The rate shown represents the annualized yield at the date of purchase. |
| | (d) | Cost for federal income tax purposes is $633,907,714. |
See Accompanying Notes to Financial Statements.
4
Statement of Assets and Liabilities – Columbia Daily Cash Reserves
March 31, 2009
| | | | | |
| | | | | ($) | |
| Assets | | Investments, at amortized cost approximating value | | 633,907,714 | |
| | Cash | | 140 | |
| | Receivable for: | | | |
| | Fund shares sold | | 2,433 | |
| | Interest | | 319,425 | |
| | Expense reimbursement due from investment advisor | | 83,470 | |
| | Prepaid expenses | | 83,807 | |
| | | |
| | Total Assets | | 634,396,989 | |
| | |
| Liabilities | | Payable for: | | | |
| | Fund shares repurchased | | 306,880 | |
| | Distributions | | 270,314 | |
| | Investment advisory fee | | 128,422 | |
| | Administration fee | | 40,497 | |
| | Transfer agent fee | | 3,618 | |
| | Trustees’ fees | | 2,586 | |
| | Audit fee | | 29,850 | |
| | Pricing and bookkeeping fees | | 12,867 | |
| | Custody fee | | 4,051 | |
| | Shareholder administration fees | | 51,390 | |
| | Chief compliance officer expenses | | 208 | |
| | Other liabilities | | 27,556 | |
| | | |
| | Total Liabilities | | 878,239 | |
| |
| | | |
| | Net Assets | | 633,518,750 | |
| | |
| Net Assets Consist of | | Paid-in capital | | 633,921,254 | |
| | Overdistributed net investment income | | (14 | ) |
| | Accumulated net realized loss | | (402,490 | ) |
| | | |
| | Net Assets | | 633,518,750 | |
| | |
| | Shares outstanding | | 634,125,816 | |
| | Net asset value per share | | $1.00 | |
See Accompanying Notes to Financial Statements.
5
Statement of Operations – Columbia Daily Cash Reserves
For the Year Ended March 31, 2009
| | | | | |
| | | | | ($) | |
| Investment Income | | Interest | | 20,008,788 | |
| | Dividends | | 9,466 | |
| | | | | |
| | Total Investment Income | | 20,018,254 | |
| | |
| Expenses | | Investment advisory fee | | 2,155,418 | |
| | Administration fee | | 1,158,815 | |
| | Shareholder servicing fee | | 83,397 | |
| | Shareholder administration fee | | 760,260 | |
| | Transfer agent fee | | 29,457 | |
| | Pricing and bookkeeping fees | | 143,953 | |
| | Trustees’ fees | | 44,518 | |
| | Custody fee | | 9,562 | |
| | Chief compliance officer expenses | | 869 | |
| | Treasury temporary guarantee program fee | | 157,196 | |
| | Other expenses | | 93,053 | |
| | | |
| | Total Expenses | | 4,636,498 | |
| | |
| | Fees waived or expenses reimbursed by investment
advisor and/or its affiliates | | (1,804,072 | ) |
| | Expense reductions | | (5,275 | ) |
| | | |
| | Net Expenses | | 2,827,151 | |
| |
| | | |
| | Net Investment Income | | 17,191,103 | |
| | |
| Net Realized Loss on Investments | | Net realized loss | | (344,552 | ) |
| | | |
| | Net Increase Resulting from Operations | | 16,846,551 | |
See Accompanying Notes to Financial Statements.
6
Statement of Changes in Net Assets – Columbia Daily Cash Reserves
| | | | | | | | |
| | | | | Year Ended March 31, | |
| Increase (Decrease) in Net Assets | | | | 2009 ($) (a)(b) | | | 2008 ($) | |
| Operations | | Net investment income | | 17,191,103 | | | 52,413,889 | |
| | Net realized loss on investments | | (344,552 | ) | | (14,500 | ) |
| | | |
| | Net increase resulting from operations | | 16,846,551 | | | 52,399,389 | |
| | | |
| Distributions to Shareholders | | From net investment income: | | | | | | |
| | Trust Class | | (16,098,389 | ) | | (25,628,357 | ) |
| | Institutional Class | | (1,092,715 | ) | | (26,813,103 | ) |
| | | |
| | Total distributions to shareholders | | (17,191,104 | ) | | (52,441,460 | ) |
| | | |
| | Net Capital Stock Transactions | | (494,017,351 | ) | | (129,153,862 | ) |
| | | |
| | Total decrease in net assets | | (494,361,904 | ) | | (129,195,933 | ) |
| | | |
| Net Assets | | Beginning of period | | 1,127,880,654 | | | 1,257,076,587 | |
| | End of period | | 633,518,750 | | | 1,127,880,654 | |
| | Overdistibuted net investment income at end of period | | (14 | ) | | (13 | ) |
| (a) | On May 5, 2008, the Predecessor Fund’s Shares Class reorganized into the Fund’s Trust Class. The financial information of the Trust Class shares includes the financial information of the Predecessor Fund’s Shares Class. |
| (b) | On May 5, 2008, the Predecessor Fund’s Institutional Shares Class was reorganized into the Fund’s Trust Class. |
See Accompanying Notes to Financial Statements.
7
Statement of Changes in Net Assets – Capital Stock Activity
| | | | | | | | | | | | |
| | | Columbia Daily Cash Reserves | |
| | | Year Ended
March 31, 2009 (a)(b) | | | Year Ended
March 31, 2008 | |
| | | Shares | | | Dollars ($) | | | Shares | | | Dollars ($) | |
Trust Shares | | | | | | | | | | | | |
Subscriptions | | 1,701,865,519 | | | 1,701,865,519 | | | 1,886,171,528 | | | 1,886,171,528 | |
Exchanged in connection with reorganization | | 528,950,624 | | | 528,945,890 | | | — | | | — | |
Distributions reinvested | | 2,839,164 | | | 2,839,164 | | | 2,948,909 | | | 2,948,918 | |
Redemptions | | (2,188,015,447 | ) | | (2,188,015,447 | ) | | (1,945,378,466 | ) | | (1,945,378,468 | ) |
| | | | | | | | | | | | |
Net increase (decrease) | | 45,639,860 | | | 45,635,126 | | | (56,258,029 | ) | | (56,258,022 | ) |
| | | | |
Institutional Shares | | | | | | | | | | | | |
Subscriptions | | 338,495,765 | | | 338,495,765 | | | 4,472,414,579 | | | 4,472,414,579 | |
Exchanged in connection with reorganization | | (528,950,624 | ) | | (528,945,890 | ) | | — | | | — | |
Distributions reinvested | | 311,005 | | | 311,005 | | | 10,828,953 | | | 10,828,953 | |
Redemptions | | (349,513,357 | ) | | (349,513,357 | ) | | (4,556,139,372 | ) | | (4,556,139,372 | ) |
| | | | | | | | | | | | |
Net decrease | | (539,657,211 | ) | | (539,652,477 | ) | | (72,895,840 | ) | | (72,895,840 | ) |
| (a) | On May 5, 2008, the Predecessor Fund’s Shares Class reorganized into the Fund’s Trust Class. The financial information of the Trust Class shares includes the financial information of the Predecessor Fund’s Shares Class. |
| (b) | On May 5, 2008, the Predecessor Fund’s Institutional Shares Class was reorganized into the Fund’s Trust Class. |
See Accompanying Notes to Financial Statements.
8
Financial Highlights – Columbia Daily Cash Reserves
Selected data for a share outstanding throughout each period is as follows:
| | | | | | | | | | | | | | | | | | | | |
| | | Year Ended March 31, | |
| Trust Class (a) | | 2009 | | | 2008 | | | 2007 | | | 2006 (g) | | | 2005 (g) | |
Net Asset Value, Beginning of Period | | $ | 1.00 | | | $ | 1.00 | | | $ | 1.00 | | | $ | 1.00 | | | $ | 1.00 | |
| | | | | |
Income from Investment Operations: | | | | | | | | | | | | | | | | | | | | |
Net investment income (b) | | | 0.02 | | | | 0.04 | | | | 0.05 | | | | 0.03 | | | | 0.01 | |
Net realized and unrealized gain (loss) on investments (c) | | | — | | | | — | | | | — | | | | — | | | | — | |
| | | | | | | | | | | | | | | | | | | | |
Total from investment operations | | | 0.02 | | | | 0.04 | | | | 0.05 | | | | 0.03 | | | | 0.01 | |
| | | | | |
Less Distributions to Shareholders: | | | | | | | | | | | | | | | | | | | | |
From net investment income | | | (0.02 | ) | | | (0.04 | ) | | | (0.05 | ) | | | (0.03 | ) | | | (0.01 | ) |
| | | | | |
Net Asset Value, End of Period | | $ | 1.00 | | | $ | 1.00 | | | $ | 1.00 | | | $ | 1.00 | | | $ | 1.00 | |
Total return (d)(e) | | | 1.88 | % | | | 4.38 | % | | | 4.81 | % | | | 3.27 | % | | | 1.29 | % |
| | | | | |
Ratios to Average Net Assets/Supplemental Data: | | | | | | | | | | | | | | | | | | | | |
Net expenses (f) | | | 0.33 | % | | | 0.54 | % | | | 0.55 | % | | | 0.53 | % | | | 0.46 | % |
Waiver/Reimbursement | | | 0.21 | % | | | 0.12 | % | | | 0.13 | % | | | 0.16 | % | | | 0.24 | % |
Net investment income (f) | | | 1.98 | % | | | 4.29 | % | | | 4.69 | % | | | 3.21 | % | | | 1.28 | % |
Net assets, end of period (000’s) | | $ | 633,519 | | | $ | 588,234 | | | $ | 644,514 | | | $ | 1,032,384 | | | $ | 1,105,053 | |
| (a) | On May 5, 2008, the Shares Class shares of Money Fund, a series of Excelsior Funds, Inc., were exchanged for Trust Class shares in connection with the reorganization of Money Fund into the Fund. |
| (b) | Per share data was calculated using the average shares outstanding during the period. |
| (c) | Rounds to less than $0.01 per share. |
| (d) | Had the investment advisor and/or any of its affiliates not waived fees or reimbursed a portion of expenses, total return would have been reduced. |
| (e) | Total return at net asset value assuming all distributions reinvested. |
| (f) | The benefits derived from expense reductions had an impact of less than 0.01%. |
| (g) | Per share data for the years ended March 31, 2006 and 2005 were audited by other auditors. |
See Accompanying Notes to Financial Statements.
9
Notes to Financial Statements – Columbia Daily Cash Reserves
March 31, 2009
Note 1. Organization
Columbia Daily Cash Reserves (the “Fund”), a series of Columbia Funds Series Trust (the “Trust”), is a diversified portfolio. The Trust is a Delaware statutory trust registered under the Investment Company Act of 1940, as amended (the “1940 Act”), as an open-end management investment company.
On May 5, 2008, the Fund acquired all of the assets and liabilities of Money Fund (the “Predecessor Fund”), a series of Excelsior Funds, Inc. (“Excelsior Fund”), pursuant to a reorganization. The reorganization qualified as a tax-free exchange for federal income tax purposes.
The Predecessor Fund offered two classes of shares: Shares and Institutional Shares. Each class of shares was offered continuously at net asset value. As part of the reorganization, Shares Class and Institutional Shares Class shares of the Predecessor Fund were exchanged for Trust Class shares of the Fund. After the reorganization, the financial information of the Trust Class shares includes the financial information of the Shares Class shares of the Predecessor Fund. Excelsior Fund was organized as a Maryland Corporation and was registered under the 1940 Act as an open-end management investment company. The Fund is continuing the business, including carrying forward the financial and performance history, of the Predecessor Fund.
Investment Objective
The Fund seeks current income, consistent with capital preservation and maintenance of a high degree of liquidity.
Fund Shares
The Fund offers one class of shares: Trust Class shares. Trust Class shares are offered continuously at net asset value. The Trust may issue an unlimited number of Trust Class shares.
Note 2. Significant Accounting Policies
The preparation of financial statements in accordance with accounting principles generally accepted in the United States of America (“GAAP”) requires management to make certain estimates and assumptions that affect the reported amounts of assets and liabilities, the disclosure of contingent assets and liabilities at the date of the financial statements and the reported amounts of revenue and expenses during the reporting period. Actual results could differ from those estimates. The changes have no effect on the ratios. The following is a summary of significant accounting policies consistently followed by the Fund in the preparation of its financial statements.
Security Valuation
Securities in the Fund are valued utilizing the amortized cost valuation method permitted in accordance with Rule 2a-7 under the 1940 Act provided certain conditions are met, including that the Fund’s Board of Trustees continues to believe that the amortized cost valuation method fairly reflects the market-based net asset value per share of the Fund. This method involves valuing a portfolio security initially at its cost and thereafter assuming a constant accretion or amortization to maturity of any discount or premium, respectively. The Fund’s Board of Trustees has established procedures intended to stabilize the Fund’s net asset value for purposes of sales and redemptions at $1.00 per share. These procedures include determinations, at such intervals as the Board of Trustees deems appropriate and reasonable in light of current market conditions, of the extent, if any, to which the Fund’s market-based net asset value deviates from $1.00 per share. In the event such deviation exceeds 1/2 of 1%, the Board of Trustees will promptly consider what action, if any, should be initiated.
Security Transactions
Security transactions are accounted for on the trade date. Cost is determined and gains (losses) are based upon the specific identification method for both financial statement and federal income tax purposes.
Repurchase Agreements
The Fund may engage in repurchase agreement transactions with institutions that Columbia Management Advisors, LLC (“Columbia”), the Fund’s investment advisor, has determined are creditworthy. The Fund, through its custodian, receives delivery of the underlying securities collateralizing a repurchase agreement. Columbia is responsible for determining that the collateral is at least equal, at all times, to the value of the repurchase obligation including interest. A repurchase agreement transaction involves certain risks in the event of default or insolvency of the counterparty. These risks include possible delays in or restrictions on the Fund’s ability to dispose of the underlying securities and a possible decline in the value of the underlying securities during the period while the Fund seeks to assert its rights.
10
Columbia Daily Cash Reserves
March 31, 2009
Income Recognition
Interest income is recorded on the accrual basis. Premium and discount are amortized and accreted, respectively, on all debt securities, unless otherwise noted.
Dividend income is recorded on the ex-date.
Expenses
General expenses of the Trust are allocated to the Fund and other series of the Trust based upon relative net assets or other expense allocation methodologies determined by the nature of the expense. Expenses directly attributable to the Fund are charged to the Fund.
Determination of Class Net Asset Value
The Fund currently offers one class of shares. Prior to May 5, 2008, all income, expenses (other than class-specific expenses, as shown on the Statement of Operations) and realized and unrealized gains (losses) were allocated to each class of the Predecessor Fund on a daily basis for purposes of determining the net asset value of each class. Income and expenses were allocated to each class based on the settled shares method, while realized and unrealized gains (losses) are allocated based on the relative net assets of each class.
Federal Income Tax Status
The Fund intends to qualify each year as a “regulated investment company” under Subchapter M of the Internal Revenue Code, as amended, and will distribute substantially all of its taxable income, if any, for its tax year, and as such will not be subject to federal income taxes. In addition, the Fund intends to distribute in each calendar year substantially all of its net investment income, capital gains and certain other amounts, if any, such that the Fund should not be subject to federal excise tax. Therefore, no federal income or excise tax provision is recorded.
Distributions to Shareholders
Distributions from net investment income are declared daily and paid monthly. Net realized capital gains, if any, are distributed at least annually after the fiscal year in which the capital gains were earned or more frequently to seek to maintain a net asset value of $1.00 per share, unless offset by any available capital loss carryforward. Income distributions and capital gain distributions are determined in accordance with federal income tax regulations which may differ from GAAP.
Indemnification
In the normal course of business, the Fund enters into contracts that contain a variety of representations and warranties and which provide general indemnities. The Fund’s maximum exposure under these arrangements is unknown because this would involve future claims against the Fund. Also, under the Trust’s organizational documents and by contract, the Trustees and officers of the Trust are indemnified against certain liabilities that may arise out of actions relating to their duties to the Trust. However, based on experience, the Fund expects the risk of loss due to these representations, warranties and indemnities to be minimal.
Note 3. Federal Tax Information
The tax character of distributions paid during the years ended March 31, 2009 and March 31, 2008 was as follows:
| | | | | | |
| | | 2009 | | 2008 |
| Distributions paid from: | | | | |
Ordinary Income* | | $ | 17,191,104 | | $ | 52,441,460 |
| * | For tax purposes short-term capital gains distributions, if any, are considered ordinary income distributions. |
As of March 31, 2009, the components of distributable earnings on a tax basis were as follows:
|
| |
| Undistributed Ordinary Income |
| $270,301 |
The following capital loss carryforwards determined as of March 31, 2009, may be available to reduce taxable income arising from future net realized gains on investments, if any, to the extent permitted by the Internal Revenue Code:
| | |
| | | |
| Year of Expiration | | Capital Loss Carryforward |
| 2011 | | $ 8,823 |
| 2012 | | 23,975 |
| 2014 | | 4,889 |
| 2015 | | 2,912 |
| 2017 | | 361,891 |
| | |
| Total | | $402,490 |
Under Financial Accounting Standards Board (“FASB”) Interpretation No. 48, Accounting for Uncertainty in Income Taxes — an Interpretation of FASB Statement No. 109 (“FIN 48”), management determines whether a tax position of the
11
Columbia Daily Cash Reserves
March 31, 2009
Fund is more likely than not to be sustained upon examination by the applicable taxing authority, including resolution of any related appeals or litigation processes, based on the technical merits of the position. The tax benefit to be recognized is measured as the largest amount of benefit that is greater than fifty percent likely of being realized upon ultimate settlement. Management has evaluated the known implications of FIN 48 on its computation of net assets for the Fund. As a result of this evaluation, management has concluded that FIN 48 did not have any effect on the Fund’s financial statements. However, management’s conclusions regarding FIN 48 may be subject to review and adjustment at a later date based on factors including, but not limited to, further implementation guidance from the FASB, new tax laws, regulations, and administrative interpretations (including relevant court decisions). The Fund’s federal tax returns for the prior three fiscal years remain subject to examination by the Internal Revenue Service. The Fund is not aware of any tax positions for which it is reasonably possible that the total amounts of unrecognized tax benefits will significantly change in the next twelve months.
Note 4. Fees and Compensation Paid to Affiliates
Investment Advisory Fee
Columbia, an indirect, wholly owned subsidiary of Bank of America Corporation (“BOA”), provides investment advisory services to the Fund. Columbia receives a monthly investment advisory fee at the annual rate of 0.25% of the Fund’s average daily net assets.
UST Advisers, Inc. (“USTA”), a wholly owned subsidiary of BOA, was the investment advisor to the Predecessor Fund prior to May 5, 2008. For its services, USTA received a monthly investment advisory fee at the annual rate of 0.25% of the Predecessor Fund’s average daily net assets.
Administration Fee
Columbia provides administrative and other services to the Fund for a monthly administration fee at the annual rate of 0.15% of the Fund’s average daily net assets less the fees payable by the Fund as described under the Pricing and Bookkeeping Fees note below.
Columbia has voluntarily agreed to waive administration fees payable by the Fund at the annual rate of 0.05% of the Fund’s average daily net assets. Columbia, at its discretion, may revise or discontinue this arrangement at any time.
Prior to May 5, 2008, Columbia served as the administrator of the Predecessor Fund and was entitled to receive an administration fee based on the combined aggregate average daily net assets of the Predecessor Fund and certain other affiliated funds at the annual rates listed below, less the fees payable by the Predecessor Fund as described under the Pricing and Bookkeeping Fees note below:
| | |
| | | |
| Average Daily Net Assets | | Annual Fee Rate |
First $200 million | | 0.200% |
Next $200 million | | 0.175% |
In excess of $400 million | | 0.150% |
Columbia voluntarily agreed to waive administration fees for the Predecessor Fund at the annual rate of 0.05% of average daily net assets.
Pricing and Bookkeeping Fees
The Fund has entered into a Financial Reporting Services Agreement (the “Financial Reporting Services Agreement”) with State Street Bank & Trust Company (“State Street”) and Columbia pursuant to which State Street provides financial reporting services to the Fund. The Fund has also entered into an Accounting Services Agreement (collectively with the Financial Reporting Services Agreement, the “State Street Agreements”) with State Street and Columbia pursuant to which State Street provides accounting services to the Fund. Under the State Street Agreements, the Fund pays State Street an annual fee of $38,000 paid monthly plus an additional monthly fee based on an annualized percentage rate of average daily net assets of the Fund for the month. The aggregate fee will not exceed $140,000 per year (exclusive of out-of-pocket expenses and charges). The Fund also reimburses State Street for certain out-of-pocket expenses and charges. Prior to May 5, 2008, the Predecessor Fund was party to the State Street Agreements, under the same terms as discussed above.
The Fund has entered into a Pricing and Bookkeeping Oversight and Services Agreement (the “Services Agreement”) with Columbia. Under the Services Agreement, Columbia provides services related to Fund expenses and the requirements of the Sarbanes-Oxley Act of 2002, and provides oversight of the accounting and financial reporting services
12
Columbia Daily Cash Reserves
March 31, 2009
provided by State Street. Under the Services Agreement, the Fund reimburses Columbia for out-of-pocket expenses. Prior to May 5, 2008, the Predecessor Fund was party to the Services Agreement, under the same terms as discussed above.
Transfer Agent Fee
Columbia Management Services, Inc. (the “Transfer Agent”), an affiliate of Columbia and an indirect, wholly owned subsidiary of BOA, provides shareholder services to the Fund and has contracted with Boston Financial Data Services (“BFDS”) to serve as sub-transfer agent. The Transfer Agent is entitled to receive a fee for its services, paid monthly, at the annual rate of $17.34 per open account plus reimbursement of certain sub-transfer agent fees paid by the Transfer Agent (exclusive of BFDS fees), calculated based on assets held in omnibus accounts and intended to recover the cost of payments to other parties (including affiliates of BOA) for services to those accounts. The Transfer Agent pays the fees of BFDS for services as sub-transfer agent and is not entitled to reimbursement for such fees from the Fund.
The Transfer Agent may also retain, as additional compensation for its services, fees for wire, telephone and redemption orders, Individual Retirement Account (“IRA”) trustee agent fees and account transcript fees due to the Transfer Agent from shareholders of the Fund and credits (net of bank charges) earned with respect to balances in accounts the Transfer Agent maintains in connection with its services to the Fund. The Transfer Agent also receives reimbursement for certain out-of-pocket expenses. Prior to May 5, 2008, the Transfer Agent served in the same capacity for the Predecessor Fund and received a fee for its services, paid monthly, at the annual rate of $17.00 per open account.
An annual minimum account balance fee of up to $10 may apply to certain accounts with a value below $1,000 to reduce the impact of small accounts on transfer agent fees. These minimum account balance fees are recorded as part of expense reductions on the Statement of Operations. For the year ended March 31, 2009, no minimum account balance fees were charged by the Fund.
Shareholder Administration Fees
Columbia Management Distributors, Inc. (the “Distributor”), an affiliate of Columbia and an indirect, wholly-owned subsidiary of BOA, is the principal underwriter of the Fund’s shares. Prior to May 5, 2008, the Distributor served in the same capacity for the Predecessor Fund.
Effective May 5, 2008, the Fund has adopted a shareholder administration plan (“Administration Plan”) for the Trust Class shares. Under the Administration Plan, the Fund pays a monthly shareholder administration fee at the annual rate of 0.10% of the average daily net assets attributable to the Fund’s Trust Class shares. These fees are intended to compensate the Advisor, the Distributor and/or eligible selling and/or servicing agents for the shareholder administration services they provide.
Shareholder Servicing Fees
Prior to May 5, 2008, the Predecessor Fund entered into shareholder servicing agreements with various service organizations which included USTA. The Predecessor Fund was permitted to pay a fee of up to 0.25% and 0.15% of the average daily net assets of the Predecessor Fund’s Shares class and Institutional Shares class, respectively, held by each service organization’s customers to such organizations for providing shareholder and administrative services to their customers who held shares of the Predecessor Fund.
Fee Waivers and Expense Reimbursements
Effective March 1, 2009, Columbia has voluntarily agreed to bear a portion of the Fund’s expenses so that the Fund’s ordinary operating expenses (excluding any distribution, shareholder servicing and/or shareholder administration fees, brokerage commissions, interest, taxes and extraordinary expenses, but including custodial charges relating to overdrafts, if any), after giving effect to any balance credits from the Fund’s custodian, do not exceed 0.20% annually of the Fund’s average daily net assets. Columbia, in its discretion, may revise or discontinue this arrangement at any time. Prior to March 1, 2009, Columbia reimbursed a portion of the Fund’s expenses at the same fee rate on a contractual basis.
Also, effective December 15, 2008, the Distributor has voluntarily undertaken to reimburse certain class-specific Fund expenses (consisting of shareholder servicing, distribution and shareholder administration fees, as applicable) to the extent necessary in order to maintain a minimum annualized net yield of 0.00% for all classes of the Fund. In addition, Columbia has voluntarily undertaken to
13
Columbia Daily Cash Reserves
March 31, 2009
reimburse certain Fund expenses (consisting of advisory and/or administration fees) to the extent necessary to maintain such yield in the event the Distributor’s reimbursement of class-specific Fund expenses is fully utilized. These reimbursements are voluntary and may be modified or discontinued by Columbia or the Distributor at any time.
Columbia and/or the Distributor are entitled to recover from the Fund any fees waived and/or expenses reimbursed, including administration fees waived, for a three year period following the date of such fee waiver and/or reimbursement under this arrangement if such recovery does not cause the Fund’s expenses to exceed the expense limitations in effect at the time of recovery.
At March 31, 2009, the amounts potentially recoverable by Columbia pursuant to this arrangement are as follows:
| | | | |
| | | | | |
Amount of Potential
Recovery Expiring
March 31, 2012 | | Total Potential
Recovery | | Amount Recovered
During the Year
Ended 3/31/09 |
| $1,726,118 | | $1,726,118 | | $— |
Prior to May 5, 2008, USTA contractually agreed to waive fees or reimburse expenses of the Predecessor Fund through July 31, 2008, so that the expenses incurred by the Predecessor Fund (exclusive of interest, taxes and certain non-routine expenses), would not exceed the annual rates of 0.55% and 0.30% for Shares class and Institutional Shares class, respectively.
Fees Paid to Officers and Trustees
All officers of the Fund are employees of Columbia or its affiliates and, with the exception of the Fund’s Chief Compliance Officer, receive no compensation from the Fund. The Board of Trustees has appointed a Chief Compliance Officer to the Fund in accordance with federal securities regulations. The Fund, along with other affiliated funds, pays its pro-rata share of the expenses associated with the Chief Compliance Officer. The Fund’s expenses for the Chief Compliance Officer will not exceed $15,000 per year.
The Trust’s eligible Trustees may participate in a nonqualified deferred compensation plan which may be terminated at any time. Any payments to plan participants are paid solely out of the Fund’s assets. Income earned on the plan participant’s deferral account is based on the rate of return of the eligible mutual funds selected by the participant or, if no funds are selected, on the rate of return of Columbia Treasury Reserves, another portfolio of the Trust. The expense for the deferred compensation plan, which includes trustees’ fees deferred during the current period as well as any gains or losses on the trustees’ deferred compensation balances as a result of market fluctuations, is included in “Trustees’ fees” on the Statement of Operations. The liability for the deferred compensation plan is included in “Trustees’ fees” on the Statement of Assets and Liabilities.
Note 5. Custody Credits
The Fund has an agreement with its custodian bank under which custody fees may be reduced by balance credits. These credits are recorded as part of expense reductions on the Statement of Operations. The Fund could have invested a portion of the assets utilized in connection with the expense offset arrangement in an income-producing asset if it had not entered into such an agreement.
For the year ended March 31, 2009, these custody credits reduced total expenses by $5,275 for the Fund.
Note 6. Line of Credit
The Fund and other affiliated funds participate in a $200,000,000 uncommitted, unsecured line of credit, provided by State Street. Borrowings are available for short-term liquidity or temporary or emergency purposes.
Interest is charged to each participating fund based on the fund’s borrowings at a rate per annum equal to the greater of the Federal Funds Rate plus 0.75% or the overnight LIBOR Rate plus 0.75%. A one-time structuring fee of $10,000 is also accrued and apportioned to each fund participating in the line of credit based on the average net assets of the participating funds. In addition, if the line of credit is extended for an additional period after the expiration date, an annual administration fee of $10,000 may be charged and apportioned among the participating funds. Prior to December 18, 2008, the Fund and other affiliated funds participated in a $200,000,000 uncommitted, unsecured line of credit provided by State Street under similar terms. Interest was charged to each participating fund based on the fund’s borrowings at a rate per annum equal to the Federal Funds Rate plus 0.375%.
14
Columbia Daily Cash Reserves
March 31, 2009
For the year ended March 31, 2009, the Fund did not borrow under these arrangements.
Note 7. Shares of Beneficial Interest
As of March 31, 2009, the Fund had one shareholder that held 92.5% of the shares outstanding, over which BOA and/or any of its affiliates did not have investment discretion.
Subscription and redemption activity of this account may have a significant effect on the operations of the Fund.
Note 8. Significant Risks and Contingencies
United States Department of the Treasury Temporary Guarantee Program for Money Market Funds
The United States Department of the Treasury (the “Treasury”) has created a temporary guarantee program (the “Program”) for money market funds registered with the Securities and Exchange Commission under the 1940 Act for the period September 19, 2008 through December 18, 2008. On November 24, 2008, the Treasury announced the extension of the Program from December 19, 2008 through April 30, 2009. The Board of Trustees of the Fund, which participated in the initial phase of the Program, approved the Fund’s continued participation in the extended Program.
Similar to the initial phase of the Program, and subject to certain conditions and limitations, share amounts held by investors in the Fund as of the close of business on September 19, 2008 are guaranteed against loss under the extended Program in the event the market-based net asset value per share is less than $0.995 (i.e., does not round to $1.00, a “guarantee event”) and the Fund subsequently liquidates. The extended Program only covers the amount a shareholder held in the Fund as of the close of business on September 19, 2008, or the amount a shareholder holds if and when a guarantee event occurs, whichever is less. Accordingly, additional Fund shares acquired by investors after September 19, 2008 generally are not eligible for protection under the extended Program. A shareholder who has continuously maintained an account with the Fund since September 19, 2008 would receive a payment for each protected share equal to the shortfall between the amount received in the liquidation and $1.00 per share in the case of a guarantee event. The Program is subject to an overall limit of approximately $50 billion for all money market funds participating in the Program. The extended Program is in effect through April 30, 2009.
The Fund has paid $178,962 to participate in the Program and the extended Program. This Program participation payment is being expensed over the period from September 19, 2008 to April 30, 2009 and is an extraordinary item for calculating fee waivers and expense reimbursements as discussed in Note 4.
On March 31, 2009, the Treasury announced the second extension of the Program from May 1, 2009 through September 18, 2009. The Board of Trustees of the Fund has approved the Fund’s continued participation in the second extension of the Program.
Legal Proceedings
Columbia Management Advisors, LLC and Columbia Management Distributors, Inc. (collectively, the “Columbia Group”) are subject to a settlement agreement with the New York Attorney General (“NYAG”) (the “NYAG Settlement”) and a settlement order with the SEC (the “SEC Order”) on matters relating to mutual fund trading, each dated February 9, 2005. Under the terms of the SEC Order, the Columbia Group (or predecessor entities) agreed, among other things, to: pay disgorgement and civil money penalties collectively totaling $375 million; cease and desist from violations of the antifraud provisions and certain other provisions of the federal securities laws; maintain certain compliance and ethics oversight structures; and retain an independent consultant to review the Columbia Group’s applicable supervisory, compliance, control and other policies and procedures. The NYAG Settlement, among other things, requires Columbia Management Advisors, LLC and its affiliates to reduce management fees for certain funds in the Columbia family of mutual funds in a projected total of $160 million over five years through November 30, 2009 and to make certain disclosures to investors relating to expenses. In connection with the Columbia Group providing services to the Columbia Funds, the Columbia Funds have voluntarily undertaken to implement certain governance measures designed to maintain the independence of their boards of trustees and certain special consulting and compliance measures.
Pursuant to the SEC Order and related procedures, the $375 million in settlement amounts described above, of which approximately $90 million has been earmarked for certain
15
Columbia Daily Cash Reserves
March 31, 2009
Columbia Funds and their shareholders, is being distributed in accordance with a distribution plan developed by an independent distribution consultant and approved by the SEC on December 27, 2007. Distributions under the distribution plan began in mid-June 2008.
Civil Litigation
In connection with the events that resulted in the NYAG Settlement and SEC Order, various parties filed suits against Bank of America Corporation and certain of its affiliates, including Banc of America Capital Management, LLC (“BACAP,” now known as Columbia Management Advisors, LLC) and BACAP Distributors, LLC (now known as Columbia Management Distributors, Inc.) (collectively “BAC”), Nations Funds Trust (now known as Columbia Funds Series Trust) and its Board of Trustees. On February 20, 2004, the Judicial Panel on Multidistrict Litigation transferred these cases and cases against other mutual fund companies based on similar allegations to the United States District Court in Maryland for consolidated or coordinated pretrial proceedings (the “MDL”). Subsequently, additional related cases were transferred to the MDL. On September 29, 2004, the plaintiffs in the MDL filed amended and consolidated complaints. One of these amended complaints is a putative class action that includes claims under the federal securities laws and state common law, and that names Nations Funds Trust, the Trustees, BAC and others as defendants. Another of the amended complaints is a derivative action purportedly on behalf of the Nations Funds Trust against BAC and others that asserts claims under federal securities laws and state common law. Nations Funds Trust is a nominal defendant in this action.
On February 25, 2005, BAC and other defendants filed motions to dismiss the claims in the pending cases. On December 15, 2005, BAC and others entered into a Stipulation of Settlement of the direct and derivative claims brought on behalf of the Nations Funds shareholders. The settlement is subject to court approval. If the settlement is approved, BAC would pay settlement administration costs and fees to plaintiffs’ counsel as approved by the court. The stipulation has not yet been presented to the court for approval.
16
Report of Independent Registered Public Accounting Firm
To the Trustees of Columbia Funds Series Trust and Shareholders of Columbia Daily Cash Reserves
In our opinion, the accompanying statement of assets and liabilities, including the investment portfolio, and the related statements of operations and of changes in net assets and the financial highlights present fairly, in all material respects, the financial position of Columbia Daily Cash Reserves (the “Fund”) (a series of Columbia Funds Series Trust) at March 31, 2009, the results of its operations for the year then ended, the changes in its net assets for each of the two years in the period then ended and the financial highlights for each of the three years in the period then ended, in conformity with accounting principles generally accepted in the United States of America. These financial statements and financial highlights (hereafter referred to as “financial statements”) are the responsibility of the Fund’s management. Our responsibility is to express an opinion on these financial statements based on our audits. We conducted our audits of these financial statements in accordance with the standards of the Public Company Accounting Oversight Board (United States). Those standards require that we plan and perform the audit to obtain reasonable assurance about whether the financial statements are free of material misstatement. An audit includes examining, on a test basis, evidence supporting the amounts and disclosures in the financial statements, assessing the accounting principles used and significant estimates made by management, and evaluating the overall financial statement presentation. We believe that our audits, which included confirmation of securities at March 31, 2009 by correspondence with the custodian and brokers, provide a reasonable basis for our opinion. The financial highlights of the Fund for each of the two years in the period ended March 31, 2006 were audited by other auditors whose report dated May 22, 2006, expressed an unqualified opinion on those highlights.
PricewaterhouseCoopers LLP
Boston, Massachusetts
May 22, 2009
17
Fund Governance
The Trustees serve terms of indefinite duration. The names, addresses and ages of the Trustees and officers of the Funds in the Columbia Funds Complex, the year each was first elected or appointed to office, their principal business occupations during at least the last five years, the number of Funds overseen by each Trustee and other directorships they hold are shown below. Each officer listed below serves as an officer of each Fund in the Columbia Funds Complex.
Independent Trustees
| | |
Name, Address and Year of Birth,
Position with Funds, Year First
Elected or Appointed to Office | | Principal Occupation(s) During Past Five Years, Number of Funds in the Columbia
Funds Complex Overseen by Trustee, Other Directorships Held |
|
| Edward J. Boudreau (Born 1944) |
c/o Columbia Management Advisors, LLC One Financial Center Boston, MA 02111 Trustee (since 2005) | | Managing Director–E.J. Boudreau & Associates (consulting), from 2000 through current; oversees 66; no other directorships held. |
| |
| William P. Carmichael (Born 1943) | | |
c/o Columbia Management Advisors, LLC One Financial Center Boston, MA 02111 Trustee (since 1999) | | Retired. Oversees 66; Director–Cobra Electronics Corporation (electronic equipment manufacturer); Director–Spectrum Brands, Inc. (consumer products); Director–Simmons Company (bedding); Director–The Finish Line (sportswear). |
| |
| William A. Hawkins (Born 1942) | | |
c/o Columbia Management Advisors, LLC One Financial Center Boston, MA 02111 Trustee (since 2005) | | President and Chief Executive Officer–California General Bank, N.A., from January 2008 through current; President, Retail Banking–IndyMac Bancorp, Inc., from September 1999 to August 2003; oversees 66; no other directorships held. |
| |
| R. Glenn Hilliard (Born 1943) | | |
c/o Columbia Management Advisors, LLC One Financial Center Boston, MA 02111 Trustee (since 2005) | | Chairman and Chief Executive Officer–Hilliard Group LLC (investing and consulting), from April 2003 through current; Non-Executive Director & Chairman–Conseco, Inc. (insurance), September 2003 through current; Executive Chairman–Conseco, Inc. (insurance), August 2004 through September 2005, Chairman and Chief Executive Officer–ING Americas, from 1999 through April 2003; oversees 66; Director–Conseco, Inc. (insurance). |
| |
| John J. Nagorniak (Born 1944) | | |
c/o Columbia Management Advisors, LLC One Financial Center Boston, MA 02111 Trustee (since 2008) | | Retired. President and Director–Foxstone Financial, Inc. (consulting), 2000 through December 2007; Director–Mellon Financial Corporation affiliates (investing), 2000 through 2007; Chairman–Franklin Portfolio Associates (investing–Mellon affiliate), 1982 through 2007; oversees 66; Director–MIT Investment Company; Trustee–MIT 401k Plan; Trustee and Chairman–Research Foundation of CFA Institute. |
|
| Anthony M. Santomero (Born 1946) |
c/o Columbia Management Advisors, LLC One Financial Center Boston, MA 02111 Trustee (since 2008) | | Richard K. Mellon Professor Emeritus of Finance, The Wharton School, University of Pennsylvania, from 1972 through current; Senior Advisor–McKinsey & Company (consulting), July 2006 through December 2007; President and Chief Executive Officer–Federal Reserve Bank of Philadelphia, 2000 through April 2006; oversees 66; Director–Renaissance Reinsurance Ltd.; Director–Penn Mutual Life Insurance Company; Director–Citigroup. |
18
Fund Governance (continued)
Independent Trustees (continued)
| | |
Name, Address and Year of Birth,
Position with Funds, Year First
Elected or Appointed to Office | | Principal Occupation(s) During Past Five Years, Number of Funds in the Columbia
Funds Complex Overseen by Trustee, Other Directorships Held |
| |
| Minor M. Shaw (Born 1947) | | |
c/o Columbia Management Advisors, LLC One Financial Center Boston, MA 02111 Trustee (since 2003) | | President–Micco Corporation, Chairman–The Daniel-Mickel Foundation; oversees 66; Board Member–Piedmont Natural Gas. |
The Statement of Additional Information includes additional information about the Trustees of the Funds and is available, without charge, upon request by calling 800-345-6611.
19
Fund Governance (continued)
Officers
| | |
Name, Address and Year of Birth, Position with Columbia Funds, Year First Elected or Appointed to Office | | Principal Occupation(s) During Past Five Years |
|
| J. Kevin Connaughton (Born 1964) |
One Financial Center Boston, MA 02111 President (since 2009) | | Managing Director of Columbia Management Advisors, LLC since December 2004; Senior Vice President and Chief Financial Officer–Columbia Funds, from June 2008 to January 2009; Treasurer–Columbia Funds, from October 2003 to May 2008; Treasurer–the Liberty Funds, Stein Roe Funds and Liberty All-Star Funds, December 2000–December 2006; Senior Vice President–Columbia Management Advisors, LLC, from April 2003 to December 2004; President–Columbia Funds, Liberty Funds and Stein Roe Funds, February 2004 to October 2004; Treasurer–Galaxy Funds, September 2002 to December 2005; Treasurer, December 2002 to December 2004, and President, February 2004 to December 2004–Columbia Management Multi-Strategy Hedge Fund, LLC; and a senior officer of various other Bank of America-affiliated entities, including other registered and unregistered funds |
|
| James R. Bordewick, Jr. (Born 1959) |
One Financial Center Boston, MA 02111 Senior Vice President, Secretary and Chief Legal Officer (since 2006) | | Associate General Counsel, Bank of America since April 2005; Senior Vice President and Associate General Counsel, MFS Investment Management (investment management) prior to April 2005. |
| |
| Linda J. Wondrack (Born 1964) | | |
One Financial Center Boston, MA 02111 Senior Vice President and Chief Compliance Officer (since 2007) | | Director (Columbia Management Group LLC and Investment Product Group Compliance), Bank of America since June 2005; Director of Corporate Compliance and Conflicts Officer, MFS Investment Management (investment management), August 2004 to May 2005; Managing Director, Deutsche Asset Management (investment management) prior to August 2004. |
| |
| Michael G. Clarke (Born 1969) | | |
One Financial Center Boston, MA 02111 Senior Vice President and Chief Financial Officer (since 2009) | | Director of Fund Administration of the Advisor since January 2006; Managing Director of the Advisor September 2004 to December 2005; Vice President Fund Administration June 2002 to September 2004. |
| |
| Jeffrey R. Coleman (Born 1969) | | |
One Financial Center Boston, MA 02111 Treasurer (since 2008) | | Director of Fund Administration of the Advisor since January 2006; Fund Controller of the Advisor from October 2004 to January 2006; Vice President of CDC IXIS Asset Management Services, Inc. (investment management) from August 2000 to September 2004. |
| |
| Joseph F. DiMaria (Born 1968) | | |
One Financial Center Boston, MA 02111 Chief Accounting Officer (since 2008) | | Director of Fund Administration of the Advisor since January 2006; Head of Tax/Compliance and Assistant Treasurer of the Advisor from November 2004 to December 2005; Director of Trustee Administration (Sarbanes-Oxley) of the Advisor from May 2003 to October 2004. |
20
Fund Governance (continued)
Officers (continued)
| | |
Name, Address and Year of Birth, Position with Columbia Funds, Year First Elected or Appointed to Office | | Principal Occupation(s) During Past Five Years |
|
| Julian Quero (Born 1967) |
One Financial Center Boston, MA 02111 Deputy Treasurer (since 2008) | | Senior Tax Manager of the Advisor since August 2006; Senior Compliance Manager of the Advisor from April 2002 to August 2006. |
| |
| Barry S. Vallan (Born 1969) | | |
One Financial Center Boston, MA 02111 Controller (since 2006) | | Vice President–Fund Treasury of the Advisor since October 2004; Vice President–Trustee Reporting of the Advisor from April 2002 to October 2004. |
21
Board Consideration and Re-Approval of Investment Advisory Agreement
The Board of Trustees of Columbia Funds Series Trust (the “Board”), including a majority of the Trustees who have no direct or indirect interest in the investment advisory agreement and are not “interested persons” of the Trust, as defined in the Investment Company Act of 1940 (the “1940 Act”) (the “Independent Trustees”), are required annually to review and re-approve the existing investment advisory agreement and approve any newly proposed terms therein. In this regard, the Board reviewed and re-approved, during the most recent six months covered by this report, the investment advisory agreement with Columbia Management Advisors, LLC (“CMA”) for Columbia Daily Cash Reserves1 (the “Fund”). The investment advisory agreement with CMA is referred to as an “Advisory Agreement.”
More specifically, at meetings held on November 10-11, 2008, the Board, including the Independent Trustees advised by their independent legal counsel, considered the factors and reached the conclusions described below relating to the selection of CMA and the re-approval of the Advisory Agreement. The Board also reviewed and considered a report prepared and provided by the Independent Fee Consultant (the “Consultant”) appointed by the Independent Trustees pursuant to an assurance of discontinuance entered into with the New York Attorney General (“NYAG”) to settle a civil complaint filed by the NYAG relating to trading in mutual fund shares (the “NYAG Settlement”). During the fee review process, the Consultant’s role was to manage the review process to ensure that fees are negotiated in a manner that is at arms’ length and reasonable. The Consultant found that the fee negotiation process was, to the extent practicable, at arms’ length and reasonable and consistent with the requirements of the NYAG Settlement. A summary of the Consultant’s report is available at http://www.columbiafunds.com.
In preparation for the November meetings, the Board met in August for review and discussion of the materials described below. The Investment Committee of the Board also met in June to discuss each Fund’s performance with its respective portfolio manager(s). In addition to these meetings, the Investment Committee receives and discusses performance reports at its quarterly meetings. The Contracts Review Committee also provided support in managing and coordinating the process by which the Board reviewed the Advisory Agreement. The Board’s review and conclusions are based on comprehensive consideration of all information presented to them and are not the result of any single controlling factor.
Nature, Extent and Quality of Services
The Board received and considered various data and information regarding the nature, extent and quality of services provided to the Fund by CMA under the Advisory Agreement. The most recent investment adviser registration form (“Form ADV”) for CMA was made available to the Board, as were CMA’s responses to a detailed series of requests submitted by the Independent Trustees’ independent legal counsel on behalf of such Trustees. The Board reviewed and analyzed those materials, which included, among other things, information about the background and experience of senior management and investment personnel of CMA.
In addition, the Board considered the investment and legal compliance programs of the Fund and CMA, including their compliance policies and procedures and reports of the Fund’s Chief Compliance Officer.
The Board evaluated the ability of CMA, based on its resources, reputation and other attributes, to attract and retain qualified investment professionals, including research, advisory and supervisory personnel. In this regard, the Board considered information regarding CMA’s compensation program for its personnel involved in the management of the Fund. The Board also considered CMA’s investment in further developing its research and trading departments.
Based on the above factors, together with those referenced below, the Board concluded that it was satisfied with the nature, extent and quality of the investment advisory services provided to the Fund by CMA.
Fund Performance and Expenses
The Board considered the performance results for the Fund over multiple measurement periods. It also considered these results in comparison to the performance results of the group of funds that was determined by Lipper Inc. (“Lipper”) to be the most similar to the Fund (the “Peer Group”) and to the performance of a broader universe of relevant funds as determined by Lipper (the “Universe”), as well as to the
1 | On March 5, 2008, Columbia Daily Cash Reserves acquired all of the assets and liabilities of Money Fund, a series of Excelsior Funds, Inc., pursuant to a reorganization. |
22
Fund’s benchmark index. Lipper is an independent provider of investment company data. The Board was provided with a description of the methodology used by Lipper to select the mutual funds in the Fund’s Peer Group and Universe and considered potential imprecision resulting from the selection methodology. The selection methodology used by Lipper was based on sub-categories of money market funds grouped and tracked by iMoneyNet, an independent expense and performance ranking service for money market mutual funds.
The Board received and considered statistical information regarding the Fund’s total expense ratio and its various components, including contractual advisory fees, actual advisory fees, actual non-management fees, Rule 12b-1 and non-Rule 12b-1 service fees, fee waivers/caps and/or expense reimbursements. The Board also considered comparisons of these fees to the expense information for the Fund’s Peer Group and Universe, which comparative data was provided by Lipper. Lipper determined that the composition of the Peer Group and/or Universe for performance would differ from the composition for performance to provide a more accurate basis of comparison. The Board focused primarily on Lipper and iMoneyNet data that ranked the Fund based on: (i) the Fund’s one-year performance compared to actual management fees; and (ii) the Fund’s one-year performance compared to total expenses.
Investment Advisory Fee Rates
The Board reviewed and considered the proposed contractual investment advisory fee rates together with the administration fee rates payable by the Fund to CMA for investment advisory services (the “Contractual Management Rate”). In addition, the Board reviewed and considered the proposed fee waiver/cap arrangements applicable to the Contractual Management Rate and considered the Contractual Management Rate after taking the waivers/caps into account (the “Actual Management Rate”). The Board noted that, on a complex-wide basis, CMA had reduced annual management fees by at least $32 million per year pursuant to the NYAG Settlement. The Board also noted reductions in net advisory rates and/or total expenses of certain funds across the fund complex. Additionally, the Board received and afforded specific attention to information comparing the Contractual Management Rate and Actual Management Rate with those of the other funds in their respective Peer Groups.
The Board concluded that the factors noted above supported the Contractual Management Rate and the Actual Management Rate, and the approval of the Advisory Agreement for the Fund.
Profitability
The Board received and considered a detailed profitability analysis of CMA based on the Contractual Management Rate and the Actual Management Rate, as well as on other relationships between the Fund and other funds in the complex on the one hand and CMA affiliates on the other. The analysis included complex-wide and per-Fund information and a comparison of results using alternative allocation methodologies. The Board concluded that, in light of the costs of providing investment management and other services, the profits and other ancillary benefits that CMA and its affiliates received from providing these services were not unreasonable.
Economies of Scale
The Board received and considered information regarding whether there have been economies of scale with respect to the management of the Fund, whether the Fund has appropriately benefited from any economies of scale and whether there is potential for realization of any further economies of scale. Most particularly, CMA provided information showing that, as a percentage of fund assets, CMA’s complex-wide revenues, expenses and profits declined over a four-year period during which fund assets increased by 39% and the shareholder benefit over a two-year period increased from 33% to 41% of the Adviser’s total profits. The Board concluded that any potential economies of scale are shared fairly with Fund shareholders, most particularly through fee waiver arrangements and, the group-wide breakpoint fee schedule.
The Board acknowledged the inherent limitations of any analysis of an investment adviser’s economies of scale, stemming largely from the Board’s understanding that economies of scale are realized, if at all, by an investment adviser across a variety of products and services, not just with respect to a single fund.
Information About Services to Other Clients
The Board also received and considered information about the nature and extent of services and fee rates offered by
23
CMA to other clients, including separate accounts and institutional investors. In this regard, the Board concluded that, where the Contractual Management Rate and Actual Management Rate were appreciably above the range of the fee rates offered to other CMA clients, based on information provided by CMA, the costs associated with managing and operating a registered investment company provided a justification for the higher fee rates charged to the Fund.
Other Benefits to CMA
The Board received and considered information regarding any “fall-out” or ancillary benefits received by CMA and its affiliates as a result of their relationships with the Fund. Such benefits could include, among others, benefits attributable to CMA’s relationship with the Fund (such as soft-dollar credits) and benefits potentially derived from an increase in CMA’s business as a result of its relationship with the Fund (such as the ability to market to shareholders other financial products offered by CMA and its affiliates).
The Board considered the effectiveness of the policies of the Fund in achieving the best execution of portfolio transactions, whether and to what extent soft dollar credits are sought and how any such credits are utilized, any benefits that may be realized by using an affiliated broker, the extent to which efforts are made to recapture transaction costs, and the controls applicable to brokerage allocation procedures. The Board also reviewed CMA’s methods for allocating portfolio investment opportunities among the Fund and other clients. The Board concluded that the benefits were not unreasonable.
Other Factors and Broader Review
As discussed above, the Board reviews materials received from CMA annually as part of the re-approval process under Section 15(c) of the 1940 Act. The Board also reviews and assesses the quality of the services the Fund receives throughout the year. In this regard, the Board and its Committees review a report of CMA at each of its quarterly meetings, which includes, among other things, Fund performance reports. In addition, the Board and its Committees confer with portfolio managers at various times throughout the year including, most particularly, in the June Investment Committee meeting.
Conclusion
After considering the above-described factors, based on their deliberations and their evaluation of the information provided, the Board concluded that the compensation payable to CMA under the Advisory Agreement is fair and equitable. Accordingly, the Board unanimously re-approved the Advisory Agreement.
24
Summary of Management Fee Evaluation by Independent Fee Consultant
REPORT OF INDEPENDENT FEE CONSULTANT TO THE FUNDS SUPERVISED BY THE COLUMBIA NATIONS BOARD
Prepared Pursuant to the February 9, 2005 Assurance of Discontinuance among the Office of Attorney General of New York State, Columbia Management Advisors, LLC and Columbia Management Distributors, Inc. November 12, 2008
I. Overview
On February 9, 2005, Columbia Management Advisors, LLC (“CMA”) and Columbia Management Distributors, Inc.1 (“CMD”) agreed to the New York Attorney General’s Assurance of Discontinuance (“AOD”). Among other matters, the AOD stipulates that CMA may manage or advise a Columbia Fund (“Columbia Fund” and together with all such funds or a group of such funds as the “Columbia Funds”) only if the Independent Members of the Columbia Fund’s Board of Trustees appoint a Senior Officer or retain an Independent Fee Consultant (“IFC”) who is to manage the process by which proposed management fees are negotiated. The AOD further stipulates that the Senior Officer or IFC is to prepare a written annual evaluation of the fee negotiation process.
With effect from January 1, 2007, the Independent Members of the Board of Trustees for certain Columbia Funds known collectively as the “Nations Funds” (the “Trustees”) retained me as IFC for the Nations Funds.2 In this capacity, I have prepared the fourth annual written evaluation of the fee negotiation process. As was the case with last year’s report (the “2007 Report”) my immediate predecessor as IFC, John Rea, provided invaluable assistance in the preparation of this year’s report.
A. Role of the Independent Fee Consultant
The AOD charges the IFC with “managing the process by which proposed management fees… to be charged the Columbia Fund are negotiated so that they are negotiated in a manner which is at arms’ length and reasonable and consistent with this Assurance of Discontinuance.” The AOD also provides that CMA “may manage or advise a Columbia Fund only if the reasonableness of the proposed management fees is determined by the Board of Trustees… using… an annual independent written evaluation prepared by or under the direction of… the Independent Fee Consultant.” Therefore, the AOD makes clear that the IFC does not supplant the Trustees in negotiating management fees with CMA, nor does the IFC substitute his or her judgment for that of the Trustees with respect to the reasonableness of proposed fees or any other matter that is committed to the business judgment of the Trustees.
B. Elements Involved in Managing the Fee Negotiation Process
In preparing the report required by the AOD, the IFC must consider at least the following six factors set forth in the AOD:
| 1. | The nature and quality of CMA’s services, including the Fund’s performance; |
| 2. | Management fees (including any components thereof) charged by other mutual fund companies for like services; |
| 3. | Possible economies of scale as the Fund grows larger; |
| 4. | Management fees (including any components thereof) charged to institutional and other clients of CMA for like services; |
| 5. | Costs to CMA and its affiliates of supplying services pursuant to the management fee agreements, excluding any intra-corporate profit; and |
| 6. | Profit margins of CMA and its affiliates from supplying such services. |
C. Organization of the Annual Evaluation
This report, like last year’s, focuses on the six factors and contains a section for each factor except that CMA’s costs and profits from managing the Funds have been combined into a single section. In addition to a discussion of these factors, the report offers recommendations to improve the fee review process in future years. A review of the status of
1 | CMA and CMD are subsidiaries of Columbia Management Group, LLC (“CMG”), and are the successors to the entities named in the AOD. |
2 | I have no material relationship with Bank of America, CMG or any of its affiliates, aside from serving as IFC, and I am aware of no material relationship with any of their affiliates. I retained John Rea, an independent economic consultant, to assist me with this report. |
| | Unless otherwise stated or required by the context, this report covers only the Nations Funds, which are also referred as the “Funds.” |
25
recommendations made in the 2007 Report is being provided separately with the materials for the November meeting.
II. Summary of Findings
A. General
| 1. | Based upon my examination of the information supplied by CMG in the light of the six factors set forth in the AOD, I conclude that the Trustees have the relevant information necessary to evaluate the reasonableness of the proposed management fees for each Nations Fund. |
| 2. | In my view, the process by which the proposed management fees of the Funds have been negotiated in 2008 thus far has been, to the extent practicable, at arms’ length and reasonable and consistent with the AOD. |
B. Nature and Quality of Services, Including Performance
| 3. | The performance of the Funds has been relatively good for the most recent 1-, 3- and 5-year periods. The strongest records were posted by the Funds in the Active Equity and Quantitative Strategies Groups and by the sub-advised Funds. The 5-year performance rankings of the subadvised Funds were particularly strong, with all such Funds in the top two performance quintiles. |
| 4. | The 1- and 3-year performance records of the Funds declined slightly from 2007 to 2008, while the 5-year performance records improved year-over-year. Most Funds changed their 1-year performance quintile year-over-year, while the 5-year rankings were, as expected, much more stable, with less than half the Funds moving to a different 5-year performance quintile. |
| 5. | The performance of the actively-managed equity and sub-advised Funds against their benchmarks was strong, especially for the 1- and 3-year performance periods. However, no fixed-income Fund with a reliable benchmark exceeded it on a net basis in any performance period. Money market Funds do not have such benchmarks and therefore were excluded from this analysis. |
| 6. | The Nations equity Funds’ overall performance adjusted for risk was strong. The performance of 13 of the 19 actively-managed Funds included in the risk analysis bettered the median in 3-year performance adjusted and unadjusted for risk. No relationship between risk and return was detected for fixed-income Funds. |
| 7. | The industry-standard procedure used by third parties such as Lipper and Morningstar to construct the performance universe in which each Fund’s performance is ranked relative to comparable funds tends to bias a Fund’s ranking upward within that universe. The bias occurs because either no-12b-1-fee or A share classes of the Funds are compared to the performance universe that includes all share classes of competitive multi-class funds. Therefore, the procedure ranks shares with zero or 25 basis point 12b-1 fees against classes of competitive funds with 12b-1 fees of up to 100 basis points. Correcting this bias by limiting the performance universe to classes of competitive funds with comparable 12b-1 fees in most cases lowers the relative performance for the Funds but does not call into question the general finding that the Nations Funds’ performance has been strong. |
| 8. | A small number of Funds have consistently underperformed their peers in each of the past four years, depending on the exact criteria used to measure long-term underperformance. For example, one Fund has had below-median 1- and 3-year performance in each of the past four years; one additional Fund had below-median 3-year performance for those years. |
| 9. | The services performed by CMG professionals beyond portfolio management, such as compliance, legal, information technology, risk management, finance and fund administration, are critical to the success of the Funds and appear to be of high quality. |
C. Management Fees Charged by Other Mutual Fund Companies
| 10. | The Funds’ management fees and total expenses are generally low relative to those of their peers, with the exception of subadvised Funds. Almost two-third of the Funds ranked in the two least expensive quintiles for total expenses and just over half were in those quintiles for actual management fees. Funds with lower actual management fees tended to have lower relative total expenses. All fixed-income Funds had total expenses in the two least expensive quintiles. |
| 11. | Generally, the Nations Funds with the highest relative fees and expenses are sub-advised. All eight Nations Funds with fifth-quintile total expense rankings were sub-advised. The actual management fees of 11 of the 14 |
26
| | sub-advised Funds were in the fourth and fifth quintile. The average management fees of the sub-advised Funds were typically 20 points higher than internally-managed equity Funds. CMA presented data suggesting that such differentials were consistent with industry practice. |
| 12. | The management fees of the internally-advised Nations Funds are generally in line with those of Columbia Funds overseen by the Atlantic and Acorn/Wanger Boards of Trustees. |
D. Trustees’ Fee and Performance Evaluation Process
| 13. | The Trustees’ evaluation process identified 20 Funds in 2008 for further review based upon their relative performance or expenses or both. When compared in filtered universes, three more Funds met the criteria for review. |
E. Potential Economies of Scale
| 14. | CMG has prepared a memo for the Trustees containing its views on the sources and sharing of potential economies of scale. CMG views economies of scale as arising at the complex level and would regard estimates of scale economies for individual funds as unreliable. In its analysis, CMG did not identify specific sources of economies of scale or provide any estimates of any economies of scale that might arise from future asset growth. CMG’s analysis included measures taken by the Trustees and CMG that seek to share any potential economies of scale through breakpoints in management fee schedules, expense reimbursements, fee waivers, enhanced shareholder services, fund mergers, and operational consolidation. |
| 15. | An examination of the management fee schedules of a selected number of the Nations Funds suggests that, as a general matter, the breakpoint schedules of these Funds are not out of line with those of competitors. A similar examination of five other Nations Funds in 2007 led to the same conclusion. |
F. Management Fees Charged to Institutional Clients
| 16. | CMG has provided Trustees with comparisons of mutual fund management fees and institutional fees based upon standardized fee schedules and actual fees. The results show that, consistent with industry practice, institutional fees are generally lower than the Funds’ management fees. However, because the services provided and risks borne by the manager are more extensive for mutual funds than for institutional accounts, the differences are of limited value in assisting the Trustees in their review of the reasonableness of the Funds’ management fees. |
G. Revenues, Expenses, and Profits
| 17. | The activity-based cost allocation methodology (“ABC”) employed by CMG to allocate costs for purposes of calculating Fund profitability, both direct and indirect, for purposes of calculating Fund profitability is thoughtful and detailed. For comparison, CMG proposed a change to the method by which indirect expenses were allocated. Under this “hybrid” method, such costs are allocated to Funds 50% by assets and 50% per fund. Allocating indirect expenses equally to each Fund has an intuitive logic, as each Fund regardless of size has certain expenses, such as preparing and printing prospectuses and financial statements. |
| 18. | The materials provided on CMG’s revenues and expenses with respect to the Funds and the methodology underlying their construction generally form a sufficient basis for Trustees to evaluate CMG’s expenses and profitability for each Fund. |
| 19. | In 2007, CMG’s complex-wide pre-tax margins on the Nations Funds were close to the industry average before distribution and below average when distribution revenues and expenses were included, based on limited data available about publicly-held mutual fund managers. However, as is to be expected in a complex comprising 65 Funds, some Nations Funds have higher pre-tax profit margins, when calculated solely with respect to management revenues and expenses, while other Nations Funds operate at a loss. A pro forma analysis of the complex’s profitability taking into account expenses incurred in 2008 associated with support of the money market funds sharply reduced the profitability of the Nations Funds. There is a positive relationship between fund size and profitability, with smaller Funds generally operating at a loss. |
27
| 20. | CMG shares a fixed percentage of its management fee revenues with an affiliate, U.S. Trust, Bank of America Private Wealth Management, to compensate that affiliate for services it performs with respect to Nations Fund assets held for the benefit of its customers. Based on our analysis of the services provided by the affiliate, we believe all such payments should be regarded as a distribution expense, except for any portion attributable to payments by CMG for performance of sub-transfer agency or sub-accounting functions. |
III. Recommendations
| 1) | Criteria for review. The Trustees may wish to consider modifying the criteria for classifying a fund as a “Review Fund” to include criteria that focus exclusively on performance without regard to expense or fee levels. For example, a Fund whose one-year or three-year performance was median or below for four consecutive years could be treated as a Review Fund. Applying such criteria would add two Funds to the list of Review Funds. |
| 2) | Profitability data. CMG should present to the Trustees each year the profitability of each Fund, each investment style, and each complex (of which Nations is one) calculated as follows: |
| | Exhibit 1. Management-only profitability should be calculated without reference to any Private Bank expense. |
| | Exhibit 2. Profitability excluding distribution (which essentially covers the management and transfer agency functions) should be adjusted by removing from the expense calculation any portion of the Private Bank payment not attributable to the performance by the Private Bank of sub-transfer agency or sub-accounting functions. |
| | Exhibit 3. Total profitability, including distribution: |
| | No adjustment for Private Bank expenses should be made, because all such expenses represent legitimate fund expenses to be taken into account in calculating CMG’s profit margin including distribution. |
| | Exhibit 4. Distribution only: This should include all Private Bank expenses other than those attributable to sub-transfer agency services. |
| | Therefore, | the following data need not be provided: |
| | 1. | Adjusting total profitability data for Private Bank expenses |
| | 2. | Adjusting profitability excluding distribution by backing out all Private Bank expenses. |
| 3) | Economies of scale. CMG and the IFC should continue to work on methods for more precisely quantifying to the extent possible the sources and magnitude of any economies of scale as CMG’s mutual fund assets under management increase, to the extent that the data allows for meaningful year-over-year comparisons. The framework suggested in Section IV.D.4 may prove to be a useful model for such an analysis. |
| 4) | Competitive breakpoint analysis. As part of the annual fee evaluation process, the breakpoints of a select group of Nations Funds (which would differ each year) should continue to be compared to those of industry rivals to ensure that the Funds’ breakpoint schedules remain within industry norms. As breakpoint schedules change relatively little each year, performing such a comparison for all Funds each year would not be an efficient use of Trustee and CMG resources. |
| 5) | Cost allocation methodology. CMG’s point that the current ABC system of allocating indirect expenses creates anomalous results in several cases, including sub-advised Funds, is well-taken. We would like to work with CMG over the forthcoming year on alternatives to the current system of allocating indirect expenses that (1) resolve the anomalies, (2) limit the amount of incremental effort on CMG’s part and (3) remain faithful to the general principle that expenses should be allocated by time and effort to the extent reasonably possible. |
| 6) | Management fee disparities. CMG and the Nations Trustees, as part of any future study of management fees, should analyze any differences in management fee schedules between Funds managed in similar investment styles. As part of that analysis, CMG should provide an explanation for any significant fee differences among comparable funds across fund families managed by CMA, such as differences in the management styles of different Funds included the same Lipper category. Finally, whenever CMG proposes a management fee change or an expense cap for any mutual fund managed by CMA that is comparable to |
28
| | any Nations Fund, CMG should provide the Trustees with sufficient information about the proposal to allow the Trustees to assess the applicability of the proposed change to the relevant Nations Fund or Funds. |
| 7) | Tax-exempt Fund expense data. The expense rankings of certain tax-exempt Funds were adversely affected by including certain investment-related interest expenses that Lipper excluded in calculating the expense ratios of competitors. We recommend that CMG follow the Lipper practice and exclude such interest expenses from data submitted to Lipper to avoid unfairly disadvantaging the tax-exempt Funds. |
| 8) | Reduction of volume of paper documents submitted. The effort to rationalize and simplify the data presented to the Trustees and the process by which that data was prepared and organized was regarded as a success by all parties. We should continue to look for opportunities to reduce and simplify the presentation of 15(c) data, especially in the area of Fund and manager profitability. The Fund “Dashboard” volume presents a large volume of Fund data on a single page. If it is continued, the Trustees may wish to consider receiving the underlying Lipper data on CD, rather than the current paper volumes. |
Respectfully submitted,
Steven E. Asher
29
[THIS PAGE INTENTIONALLY LEFT BLANK]
30
[THIS PAGE INTENTIONALLY LEFT BLANK]
31
[THIS PAGE INTENTIONALLY LEFT BLANK]
32
Important Information About This Report
Transfer Agent
Columbia Management Services, Inc.
P.O. Box 8081
Boston, MA 02266-8081
1-800-345-6611
Distributor
Columbia Management
Distributors, Inc.
One Financial Center
Boston, MA 02111
Investment Advisor
Columbia Management Advisors, LLC
100 Federal Street
Boston, MA 02110
The fund mails one shareholder report to each shareholder address. If you would like more than one report, please call shareholder services at 1-800-345-6611 and additional reports will be sent to you. This report has been prepared for shareholders of Columbia Daily Cash Reserves.
A description of the policies and procedures that the fund uses to determine how to vote proxies and a copy of the fund’s voting records are available (i) at www.columbiamanagement.com; (ii) on the Securities and Exchange Commission’s website at www.sec.gov; and (iii) without charge, upon request, by calling 1-800-368-0346. Information regarding how the fund voted proxies relating to portfolio securities during the 12-month period ended June 30 is available from the SEC’s website. Information regarding how the fund voted proxies relating to portfolio securities is also available from the fund’s website, www.columbiamanagement.com.
The fund files a complete schedule of portfolio holdings with the SEC for the first and third quarters of each fiscal year on Form N-Q. The fund’s Form N-Q is available on the SEC’s website at www.sec.gov and may be reviewed and copied at the SEC’s Public Reference Room in Washington, DC. Information on the operation of the Public Reference Room may be obtained by calling 1-800-SEC-0330.
Please read and consider the investment objectives, risks, charges and expenses for any fund carefully before investing. For a prospectus which contains this and other important information about the fund, contact your Columbia Management representative or financial advisor or go to www.columbiamanagement.com.
Columbia Management Group, LLC (“Columbia Management”) is the investment management division of Bank of America Corporation. Columbia Management entities furnish investment management services and products for institutional and individual investors. Columbia Funds are distributed by Columbia Management Distributors, Inc., member of FINRA, SIPC, part of Columbia Management and an affiliate of Bank of America Corporation.
33

One Financial Center
Boston, MA 02111-2621
Columbia Daily Cash Reserves
Annual Report, March 31, 2009
©2009 Columbia Management Distributors, Inc.
One Financial Center, Boston, MA 02111-2621
800.345.6611 www.columbiafunds.com
SHC-42/10645-0309 (05/09) 09/79163
Item 2. Code of Ethics.
(a) The registrant has, as of the end of the period covered by this report, adopted a code of ethics that applies to the registrant’s principal executive officer, principal financial officer, principal accounting officer or controller, or persons performing similar functions, regardless of whether these individuals are employed by the registrant or a third party.
(b) During the period covered by this report, there were not any amendments to a provision of the code of ethics adopted in 2(a) above.
(c) During the period covered by this report, there were no waivers, including any implicit waivers, from a provision of the code of ethics described in 2(a) above that relates to one or more of the items set forth in paragraph (b) of this item’s instructions.
Item 3. Audit Committee Financial Expert.
The registrant’s Board of Trustees has determined that William P. Carmichael qualifies as an audit committee financial expert, as defined in Item 3 of Form N-CSR and is “independent” (as defined in Item 3 of Form N-CSR).
Item 4. Principal Accountant Fees and Services.
Fee information below for fiscal year ended March 31, 2009 is disclosed for twenty-one series (which includes fees for one series that was re-domiciled into the registrant on May 2, 2008) of the registrant whose reports to stockholders are included in this annual filing. Fee information for fiscal year ended March 31, 2008 also includes fees for three series that merged into the registrant during the period.
(a) Audit Fees. Aggregate Audit Fees billed by the principal accountant for professional services rendered during the fiscal years ended March 31, 2009 and March 31, 2008 are approximately as follows:
2009 | | 2008 | |
$ | 547,400 | | $ | 521,700 | |
| | | | | |
Audit Fees include amounts related to the audit of the registrant’s annual financial statements or services that are normally provided by the accountant in connection with statutory and regulatory filings or engagements for those fiscal years. Audit fees in fiscal year 2009 also include fees for the review of and provision of consent in connection with filing Form N-1A for one fund.
(b) Audit-Related Fees. Aggregate Audit-Related Fees billed to the registrant by the principal accountant for professional services rendered during the fiscal years ended March 31, 2009 and March 31, 2008 are approximately as follows:
2009 | | 2008 | |
$ | 96,600 | | $ | 136,600 | |
| | | | | |
Audit-Related Fees include amounts for assurance and related services by the principal accountant that are reasonably related to the performance of the audit of the registrant’s financial statements and are not reported in Audit Fees above. In both fiscal years 2009 and 2008, Audit-Related Fees consist of agreed-upon procedures performed for semi-annual shareholder reports. Fiscal year 2008 also includes Audit-Related Fees for agreed-upon procedures related to fund mergers and fund accounting and custody conversions.
During the fiscal years ended March 31, 2009 and March 31, 2008, there were no Audit-Related Fees billed by the registrant’s principal accountant to the registrant’s investment adviser (not including any sub-adviser whose role is primarily portfolio management and is subcontracted with or overseen by another investment adviser) and any entity controlling, controlled by, or under common control with the adviser that provides ongoing services to the registrant for an engagement that related directly to the operations and financial reporting of the registrant.
(c) Tax Fees. Aggregate Tax Fees billed by the principal accountant to the registrant for professional services rendered during the fiscal years ended March 31, 2009 and March 31, 2008 are approximately as follows:
2009 | | 2008 | |
$ | 102,400 | | $ | 106,000 | |
| | | | | |
Tax Fees include amounts for the review of annual tax returns, the review of required shareholder distribution calculations and typically include amounts for professional services by the principal accountant for tax compliance, tax advice and tax planning.
During the fiscal years ended March 31, 2009 and March 31, 2008, there were no Tax Fees billed by the registrant’s principal accountant to the registrant’s investment adviser (not including any sub-adviser whose role is primarily portfolio management and is subcontracted with or overseen by another investment adviser) and any entity controlling, controlled by, or under common control with the adviser that provides ongoing services to the registrant for an engagement that related directly to the operations and financial reporting of the registrant.
(d) All Other Fees. Aggregate All Other Fees billed by the principal accountant to the registrant for professional services rendered during the fiscal years ended March 31, 2009 and March 31, 2008 are approximately as follows:
All Other Fees include amounts for products and services provided by the principal accountant, other than the services reported in paragraphs (a) through (c) above.
Aggregate All Other Fees billed by the registrant’s principal accountant to the registrant’s investment adviser (not including any sub-adviser whose role is primarily portfolio management and is subcontracted with or overseen by another investment adviser) and any entity controlling, controlled by, or under common control with the adviser that provides ongoing services to the registrant for an engagement that related directly to the operations and financial reporting of the registrant during the fiscal years ended March 31, 2009 and March 31, 2008 are approximately as follows:
2009 | | 2008 | |
$ | 886,800 | | $ | 960,800 | |
| | | | | |
In both fiscal years 2009 and 2008, All Other Fees consist of fees billed for internal control examinations of the registrant’s transfer agent and investment advisor.
(e)(1) Audit Committee Pre-Approval Policies and Procedures
The registrant’s Audit Committee is required to pre-approve the engagement of the registrant’s independent accountants to provide audit and non-audit services to the registrant and non-audit services to its investment adviser (not including any sub-adviser whose role is primarily portfolio management and is subcontracted with or overseen by another investment adviser) or any entity controlling, controlled by or under common control with such investment adviser that provides ongoing services to the registrant (“Adviser Affiliates”), if the engagement relates directly to the operations and financial reporting of the registrant.
The Audit Committee has adop ted a Policy for Engagement of Independent Accountants for Audit and Non-Audit Services (“Policy”). The Policy sets forth the understanding of the Audit Committee regarding the engagement of the registrant’s independent accountants to provide (i) audit and permissible audit-related, tax and other services to the registrant (collectively “Fund Services”); (ii) non-audit services to the registrant’s investment adviser (not including any sub-adviser whose role is primarily portfolio management and is subcontracted with or overseen by another investment adviser) and Adviser Affiliates, if the engagement relates directly to the operations or financial reporting of a Fund (collectively “Fund-related Adviser Services”); and (iii) certain other audit and non-audit services to the registrant’s investment adviser (not including any sub-adviser whose role is primarily portfolio management and is
subcontracted with or overseen by another investment adviser) and Adviser Affiliates. Unless a type of service receives general pre-approval under the Policy, it requires specific pre-approval by the Audit Committee if it is to be provided by the independent accountants. Pre-approval of non-audit services to the registrant, the registrant’s investment adviser (not including any sub-adviser whose role is primarily portfolio management and is subcontracted with or overseen by another investment adviser) and Adviser Affiliates may be waived provided that the “de minimis” requirements set forth under paragraph (c)(7)(i)(C) of Rule 2-01 of Regulation S-X are met.
& #160; Under the Policy, the Audit Committee may delegate pre-approval authority to any pre-designated member or members who are Independent Trustees/Directors. The member(s) to whom such authority is delegated must report, for informational purposes only, any pre-approval decisions to the Audit Committee at its next regular meeting. The Audit Committee’s responsibilities with respect to the pre-approval of services performed by the independent accountants may not be delegated to management.
The Policy requires the Fund Treasurer and/or Director of Board Administration to submit to the Audit Committee, on an annual basis, a schedule of the types of services that are subject to general pre-approval. The schedule(s) provide a description of each type of service that is subject to general pre-approval and, where possible, will provide estimated fee caps for each instance of providing each service. The Audit Committees will review and approve the types of services and review the projected fees for the next fiscal year and may add to, or subtract from, the list of general pre-approved services from time to time based on subsequent determinations. That approval acknowledges that the Audit Committee is in agreement with the specific types of services that the independent accountants will be permitted to perform.
The Fund Treasurer and/or Director of Board Administration shall report to the Audit Committee at each of its regular meetings regarding all Fund Services or Fund-related Adviser Services initiated since the last such report was rendered, including a general description of the services, actual billed and projected fees, and the means by which such Fund Services or Fund-related Adviser Services were pre-approved by the Audit Committee.
*****
(e)(2) The percentage of services described in paragraphs (b) through (d) of this Item approved pursuant to the “de minimis” exception under paragraph (c)(7)(i)(C) of Rule 2-01 of Regulation S-X during both fiscal years ended March 31, 2009 and March 31, 2008 was zero.
(f) Not applicable.
(g) The aggregate non-audit fees billed by the registrant’s accountant for services rendered to the registrant, and rendered to the registrant’s investment adviser (not including any sub-adviser whose role is primarily portfolio management and is
subcontracted with or overseen by another investment adviser), and any entity controlling, controlled by, or under common control with the adviser that provides ongoing services to the registrant for the fiscal years ended March 31, 2009 and March 31, 2008 are approximately as follows:
2009 | | 2008 | |
$ | 1,085,800 | | $ | 1,203,400 | |
| | | | | |
(h) The registrant’s Audit Committee of the Board of Directors has considered whether the provision of non-audit services that were rendered to the registrant’s adviser (not including any sub-adviser whose role is primarily portfolio management and is subcontracted with or overseen by another investment adviser), and any entity controlling, controlled by, or under common control with the investment adviser that provides ongoing services to the registrant that were not pre-approved pursuant to paragraph (c)(7)(ii) of Rule 2-01 of Regulation S-X, is compatible with maintaining the principal accountant’s independence.
Item 5. Audit Committee of Listed Registrants.
Not applicable.
Item 6. Investments
(a) The registrant’s “Schedule I — Investments in securities of unaffiliated issuers” (as set forth in 17 CFR 210.12-12) is included in Item 1 of this Form N-CSR.
(b) Not applicable.
Item 7. Disclosure of Proxy Voting Policies and Procedures for Closed-End Management Investment Companies.
Not applicable.
Item 8. Portfolio Managers of Closed-End Management Investment Companies.
Not applicable.
Item 9. Purchases of Equity Securities by Closed-End Management Investment Company and Affiliated Purchasers.
Not applicable.
Item 10. Submission of Matters to a Vote of Security Holders.
There have not been any material changes to the procedures by which shareholders may recommend nominees to the registrant’s board of directors, since those procedures were
last disclosed in response to requirements of Item 407(c)(2)(iv) of Regulation S-K (as required by Item 22(b)(15) of Schedule 14A) or this Item.
Item 11. Controls and Procedures.
(a) The registrant’s principal executive officer and principal financial officers, based on their evaluation of the registrant’s disclosure controls and procedures as of a date within 90 days of the filing of this report, have concluded that such controls and procedures are adequately designed to ensure that information required to be disclosed by the registrant in Form N-CSR is accumulated and communicated to the registrant’s management, including the principal executive officer and principal financial officer, or persons performing similar functions, as appropriate to allow timely decisions regarding required disclosure.
(b) There was no change in the registrant’s internal control over financial reporting that occurred during the registrant’s second fiscal quarter of the period covered by this report that has materially affected, or is reasonably likely to materially affect, the registrant’s internal control over financial reporting.
Item 12. Exhibits.
(a)(1) Code of ethics required to be disclosed under Item 2 of Form N-CSR attached hereto as Exhibit 99.CODE ETH.
(a)(2) Certifications pursuant to Rule 30a-2(a) under the Investment Company Act of 1940 (17 CFR 270.30a-2(a)) attached hereto as Exhibit 99.CERT.
(a)(3) Not applicable.
(b) Certification pursuant to Rule 30a-2(b) under the Investment Company Act of 1940 (17 CFR 270.30a-2(b)) attached hereto as Exhibit 99.906CERT.
SIGNATURES
Pursuant to the requirements of the Securities Exchange Act of 1934 and the Investment Company Act of 1940, the registrant has duly caused this report to be signed on its behalf by the undersigned, thereunto duly authorized.
(registrant) | | Columbia Funds Series Trust | |
|
|
By (Signature and Title) | | /s/ J. Kevin Connaughton | |
| J. Kevin Connaughton, President | |
|
| | |
Date | | May 27, 2009 | |
| | | | | |
Pursuant to the requirements of the Securities Exchange Act of 1934 and the Investment Company Act of 1940, this report has been signed below by the following persons on behalf of the registrant and in the capacities and on the dates indicated.
By (Signature and Title) | | /s/ J. Kevin Connaughton | |
| J. Kevin Connaughton, President | |
|
|
Date | | May 27, 2009 | |
| | |
| | | | |
By (Signature and Title) | | /s/ Michael G. Clarke | |
| Michael G. Clarke, Chief Financial Officer | |
|
|
Date | | May 27, 2009 | |
| | | | | | | |