UNITED STATES
SECURITIES AND EXCHANGE COMMISSION
Washington, D.C. 20549
FORM N-CSR
CERTIFIED SHAREHOLDER REPORT OF REGISTERED
MANAGEMENT INVESTMENT COMPANIES
Investment Company Act file number | 811-09645 |
|
Columbia Funds Series Trust |
(Exact name of registrant as specified in charter) |
|
225 Franklin Street, Boston, Massachusetts | | 02110 |
(Address of principal executive offices) | | (Zip code) |
|
Scott R. Plummer
5228 Ameriprise Financial Center
Minneapolis, MN 55474 |
(Name and address of agent for service) |
|
Registrant’s telephone number, including area code: | 1-612-671-1947 | |
|
Date of fiscal year end: | February 28 | |
|
Date of reporting period: | February 28, 2011 | |
| | | | | | | | |
Form N-CSR is to be used by management investment companies to file reports with the Commission not later than 10 days after the transmission to stockholders of any report that is required to be transmitted to stockholders under Rule 30e-1 under the Investment Company Act of 1940 (17 CFR 270.30e-1). The Commission may use the information provided on Form N-CSR in its regulatory, disclosure review, inspection, and policymaking roles.
A registrant is required to disclose the information specified by Form N-CSR, and the Commission will make this information public. A registrant is not required to respond to the collection of information contained in Form N-CSR unless the Form displays a currently valid Office of Management and Budget (“OMB”) control number. Please direct comments concerning the accuracy of the information collection burden estimate and any suggestions for reducing the burden to Secretary, Securities and Exchange Commission, 450 Fifth Street, NW, Washington, DC 20549-0609. The OMB has reviewed this collection of information under the clearance requirements of 44 U.S.C. § 3507.
Item 1. Reports to Stockholders.

Columbia Overseas Value Fund
Annual Report for the Period Ended February 28, 2011
Not FDIC insured • No bank guarantee • May lose value
Table of Contents
| Fund Profile | | | 1 | | |
|
| Economic Update | | | 2 | | |
|
| Performance Information | | | 4 | | |
|
| Understanding Your Expenses | | | 5 | | |
|
| Portfolio Manager's Report | | | 6 | | |
|
| Investment Portfolio | | | 8 | | |
|
Statement of Assets and
Liabilities | | | 13 | | |
|
| Statement of Operations | | | 14 | | |
|
Statement of Changes in
Net Assets | | | 15 | | |
|
| Financial Highlights | | | 17 | | |
|
| Notes to Financial Statements | | | 18 | | |
|
Report of Independent Registered
Public Accounting Firm | | | 27 | | |
|
| Federal Income Tax Information | | | 28 | | |
|
| Fund Governance | | | 29 | | |
|
| Shareholder Meeting Results | | | 33 | | |
|
Important Information About
This Report | | | 37 | | |
|
The views expressed in this report reflect the current views of the respective parties. These views are not guarantees of future performance and involve certain risks, uncertainties and assumptions that are difficult to predict, so actual outcomes and results may differ significantly from the views expressed. These views are subject to change at any time based upon economic, market or other conditions and the respective parties disclaim any responsibility to update such views. These views may not be relied on as investment advice and, because investment decisions for a Columbia Fund are based on numerous factors, may not be relied on as an indication of trading intent on behalf of any particular Columbia Fund. References to specific securities should not be construed as a recommendation or investment advice.
President's Message

Dear Shareholder:
The Columbia Management story began over 100 years ago, and today, we are one of the nation's largest dedicated asset managers. The recent acquisition by Ameriprise Financial, Inc. brings together the talents, resources and capabilities of Columbia Management with those of RiverSource Investments, Threadneedle (acquired by Ameriprise in 2003) and Seligman Investments (acquired by Ameriprise in 2008) to build a best-in-class asset management business that we believe is truly greater than its parts.
RiverSource Investments traces its roots to 1894 when its then newly-founded predecessor, Investors Syndicate, offered a face-amount savings certificate that gave small investors the opportunity to build a safe and secure fund for retirement, education or other special needs. A mutual fund pioneer, Investors Syndicate launched Investors Mutual Fund in 1940. In the decades that followed, its mutual fund products and services lineup grew to include a full spectrum of styles and specialties. More than 110 years later, RiverSource continues to be a trusted financial products leader.
Threadneedle, a leader in global asset management and one of Europe's largest asset managers, offers sophisticated international experience from a dedicated U.K. management team. Headquartered in London, it is named for Threadneedle Street in the heart of the city's financial district, where British investors pioneered international and global investing. Threadneedle was acquired in 2003 and today operates as an affiliate of Columbia Management.
Seligman Investments' beginnings date back to the establishment of the investment firm J. & W. Seligman & Co. in 1864. In the years that followed, Seligman played a major role in the geographical expansion and industrial development of the United States. In 1874, President Ulysses S. Grant named Seligman as fiscal agent for the U.S. Navy—an appointment that would last through World War I. Seligman helped finance the westward path of the railroads and the building of the Panama Canal. The firm organized its first investment company in 1929 and began managing its first mutual fund in 1930. In 2008, J. & W. Seligman & Co. Incorporated was acquired and Seligman Investments became an offering brand of RiverSource Investments, LLC.
We are proud of the rich and distinctive history of these firms, the strength and breadth of products and services they offer, and the combined cultures of pioneering spirit and forward thinking. Together we are committed to providing more for our shareholders than ever before.
> A singular focus on our shareholders
Our business is asset management, so investors are our first priority. We dedicate our resources to identifying timely investment opportunities and provide a comprehensive choice of equity, fixed-income and alternative investments to help meet your individual needs.
> First-class research and thought leadership
We are dedicated to helping you take advantage of today's opportunities and anticipate tomorrow's. We stay abreast of the latest investment trends and ideas, using our collective insight to evaluate events and transform them into solutions you can use.
> A disciplined investment approach
We aren't distracted by passing fads. Our teams adhere to a rigorous investment process that helps ensure the integrity of our products and enables you and your financial advisor to match our solutions to your objectives with confidence.
When you choose Columbia Management, you can be confident that we will take the time to understand your needs and help you and your financial advisor identify the solutions that are right for you. Because at Columbia Management, we don't consider ourselves successful unless you are.
Sincerely,

J. Kevin Connaughton
President, Columbia Funds
Investors should consider the investment objectives, risks, charges and expenses of a mutual fund carefully before investing. For a free prospectus, which contains this and other important information about the funds, visit www.columbiamanagement.com. The prospectus should be read carefully before investing.
Columbia Funds are distributed by Columbia Management Investment Distributors, Inc., member FINRA, and managed by Columbia Management Investment Advisers, LLC.
© 2011 Columbia Management Investment Advisers, LLC. All rights reserved.
Fund Profile – Columbia Overseas Value Fund
Summary
g For the 12-month period that ended February 28, 2011, the fund's Class Z shares returned 17.06%.
g The fund trailed its benchmark, the MSCI EAFE Value Index (Net)1, which returned 18.55%. Its return also lagged the 21.24% average return of the funds in its peer group, the Lipper International Multi-Cap Value Funds Classification.2
g Stock selection, especially a focus on more defensive companies in the consumer discretionary sector, held back performance despite strong results from holdings in the financials sector.
Portfolio Management
Fred Copper has managed the fund since 2010. From 2008 until joining Columbia Management Investment Advisers, LLC in May 2010, Mr. Copper was associated with the fund's previous investment adviser as an investment professional.
1The Morgan Stanley Capital International Europe, Australasia, Far East (MSCI EAFE) Value Index (Net) is a subset of the MSCI EAFE Index, and constituents of the index include securities from Europe, Australasia and the Far East. The index generally represents approximately 50% of the free float-adjusted market capitalization of the underlying MSCI EAFE Index, and consists of those securities classified by Morgan Stanley Capital International, Inc. (MSCI) as most representing the value style, such as higher book value-to-price ratios, higher forward earnings-to-price ratios, higher dividend yields and lower forecasted growth rates than securities representing the growth style.
2Lipper Inc., a widely respected data provider in the industry, calculates an average total return (assuming reinvestment of distributions) for mutual funds with investment objectives similar to those of the fund. Lipper makes no adjustment for the effect of sales loads.
Indices are not available for investment, are not professionally managed and do not reflect sales charges, fees, brokerage commissions, taxes or other expenses of investing. Securities in the fund may not match those in an index.
Performance data quoted represents past performance and current performance may be lower or higher. Past performance is no guarantee of future results. The investment return and principal value will fluctuate so that shares, when redeemed, may be worth more or less than the original cost. Please visit www.columbiamanagement.com for daily and most recent month-end performance updates.
Summary
1-year return as of 02/28/11
| | | | +17.06% | |
|
|  | | | Class Z shares
(without sales charge) | |
|
| | | | +18.55% | |
|
|  | | | MSCI EAFE Value Index (Net) | |
|
Morningstar Style BoxTM

The Morningstar Style BoxTM is based on the fund's portfolio holdings. For equity funds, the vertical axis shows the market capitalization of the stocks owned, and the horizontal axis shows investment style (value, blend or growth). Information shown is based on the most recent data provided by Morningstar.
© 2011 Morningstar, Inc. All rights reserved. The Morningstar information contained herein: (1) is proprietary to Morningstar and/or its content providers; (2) may not be copied or distributed; and (3) is not warranted to be accurate, complete or timely. Neither Morningstar nor its content providers are responsible for any damages or losses arising from any use of this information.
1
Economic Update – Columbia Overseas Value Fund
Summary
For the 12-month period that ended February 28, 2011
g Despite intermittent volatility, stock markets around the world gained ground, as measured by the S&P 500 Index, the MSCI EAFE Index (Net) and the MSCI Emerging Markets Index (Net).
| S&P Index | | MSCI EAFE
Index | |
|
 | |  | |
|
MSCI EM
Index | | | | | |
|
 | | | |
|
As the world shed concerns that key economies might lapse back into recession, the World Bank reported that global gross domestic product (GDP) rose 3.9% in 2010. The improvement over 2009 was more notable in high-income developed economies than in emerging-market countries, which had less ground to make up. Emerging market countries expanded by an estimated 7%, contributing nearly half of all global growth in 2010. This two-speed global recovery is likely to result in slower growth in 2011, but global growth should remain solid at 3.3% to 3.6%1—higher in emerging market economies, led by China and India.
Robust expansion in the Asia Pacific region
Asian Pacific economies led the global economy in 2010 and are poised to continue in that role. Exports from markets such as Singapore and South Korea have been solid and domestic demand continues to strengthen. Labor markets are healthy, income is rising and confidence runs high across the region. Higher oil prices pose a downside risk to the current expansion, because it could erode demand for Asian exports and increase the risk of inflation. However, if growth exceeds expectations in the United States or Europe, the picture gets even better for Asia.
Austerity measures weigh on Europe
Growth in the developed world was hampered by a debt crisis in Europe's weakest nations. However, the European Union took steps to manage debt restructuring in an orderly fashion and fear subsided—at least for now. In addition, austerity measures were introduced in Greece, Ireland, Portugal and Spain. Public employment and government spending were cut back sharply. Layoffs and pay cuts have been met with resistance, but their necessity is hard to dispute.
Inflation a growing worry
As demand picked up and commodity prices began to rise across the globe, inflation has become a growing worry in both fast-growing emerging markets and slower-growth developed countries. In developed market economies, inflation is generally an external force, resulting from higher commodity prices, especially for food and energy. In emerging markets, excess demand is driving inflation concerns and policymakers have begun to shift their focus from stimulating growth to taming inflation. However, rising food prices are also a problem in Asia since food accounts for a greater percentage of household budgets than it does in more developed areas of the world.
Stocks stall, then pick up steam
Despite a period of volatility in the summer of 2010, as the world sought to digest a mounting debt crisis within euro-zone countries, it was a good year for stock markets around the world. The U.S. stock market returned 22.57% for the 12-month period, as measured by the S&P 500 Index.2 Outside the U.S., stock market returns were also strong. The MSCI EAFE Index (Net),3 a broad gauge of stock market performance in foreign developed markets, gained 20.00% (in U.S.
1World Bank estimate, January 12, 2011.
2The Standard & Poor's (S&P) 500 Index tracks the performance of 500 widely held, large-capitalization U.S. stocks.
3The Morgan Stanley Capital International Europe, Australasia, Far East (MSCI EAFE) Index (Net) is a free float-adjusted market capitalization index that is designed to measure the equity market performance of developed markets, excluding the U.S. & Canada. As of May 27, 2010, the MSCI EAFE Index (Net) consisted of the following 22 developed market country indices: Australia, Austria, Belgium, Denmark, Finland, France, Germany, Greece, Hong Kong, Ireland, Israel, Italy, Japan, the Netherlands, New Zealand, Norway, Portugal, Singapore, Spain, Sweden, Switzerland and the United Kingdom.
2
Economic Update (continued) – Columbia Overseas Value Fund
dollars) for the period. The MSCI Emerging Markets Index (Net)4 returned 20.91% (in U.S. dollars), led by strong performances from European and Eastern European markets. Rising inflation pressures and tighter monetary policy late in the 12-month period tempered returns.
Past performance is no guarantee of future results.
4The Morgan Stanley Capital International Emerging Markets (MSCI EM) Index (Net) is a free float-adjusted market capitalization index that is designed to measure equity market performance of emerging markets. As of May 27, 2010, the MSCI EM Index (Net) consisted of the following 21 emerging market country indices: Brazil, Chile, China, Colombia, Czech Republic, Egypt, Hungary, India, Indonesia, Korea, Malaysia, Mexico, Morocco, Peru, Philippines, Poland, Russia, South Africa, Taiwan, Thailand and Turkey.
Indices are not available for investment, are not professionally managed and do not reflect sales charges, fees, brokerage commissions, taxes or other expenses of investing. Securities in the fund may not match those in an index.
3
Performance Information – Columbia Overseas Value Fund
Performance data quoted represents past performance and current performance may be lower or higher. Past performance is no guarantee of future results. The investment return and principal value will fluctuate so that shares, when redeemed, may be worth more or less than the original cost. Please visit www.columbiamanagement.com for daily and most recent month-end performance updates.
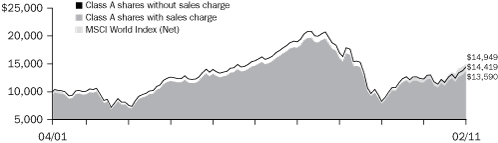
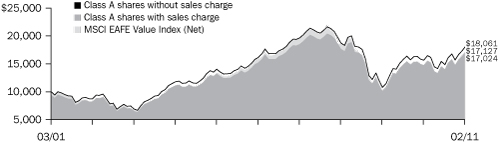
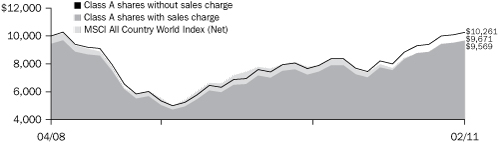
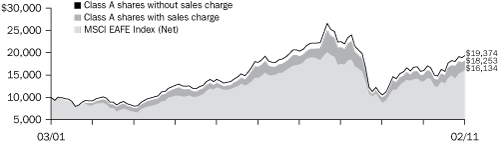
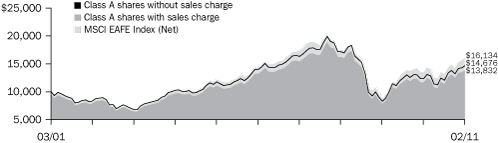
Performance of a $10,000 investment 03/31/08 – 02/28/11
The chart above shows the change in value of a hypothetical $10,000 investment in Class Z shares of Columbia Overseas Value Fund during the stated time period, and does not reflect the deduction of taxes that a shareholder may pay on fund distributions or on the redemption of fund shares.
Performance of a $10,000 investment 03/31/08 – 02/28/11 ($)
| Sales charge | | without | | with | |
| Class Z | | | 8,868 | | | | n/a | | |
Average annual total return as of 02/28/11 (%)
| Share class | | Z | |
| Inception | | 03/31/08 | |
| Sales charge | | without | |
| 1-year | | | 17.06 | | |
| Life | | | –4.04 | | |
The Fund commenced operations on March 31, 2008. The returns shown do not reflect any sales charges and have not been adjusted to reflect differences in expenses. if differences in expenses were reflected, the return shown would have been lower.
All results shown assume reinvestment of distributions. Class Z shares are sold at net asset value with no distribution and service (Rule 12b-1) fees. Class Z shares have limited eligibility and the investment minimum requirements may vary. Please see the fund's prospectus for details. Performance for different share classes will vary based on differences in sales charges and fees associated with each class.
Performance results reflect any fee waivers or reimbursements of fund expenses by the Investment Manager and/or any of its affiliates. Absent these fee waivers or expense reimbursement arrangements, performance results would have been lower.
The tables do not reflect the deduction of taxes that a shareholder may pay on fund distributions or on the redemption of fund shares.
4
Understanding Your Expenses – Columbia Overseas Value Fund
As a fund shareholder, you incur two types of costs. There are transaction costs, which generally include sales charges on purchases and may include redemption fees or exchange fees. There are also ongoing costs, which generally include investment advisory fees, distribution and service (Rule 12b-1) fees and other fund expenses. The information on this page is intended to help you understand the ongoing costs of investing in the fund and to compare these costs with the ongoing costs of investing in other mutual funds.
Analyzing your fund's expenses by share class
To illustrate these ongoing costs, we have provided an example and calculated the expenses paid by investors in each share class during the period. The information in the following table is based on an initial investment of $1,000, which is invested at the beginning of the period and held for the entire period. Expense information is calculated two ways and each method provides you with different information. The amount listed in the "Actual" column is calculated using the fund's actual operating expenses and total return for the period. The amount listed in the "Hypothetical" column for each share class assumes that the return each year is 5% before expenses and is calculated based on the fund's actual operating expenses. You should not use the hypothetical account values and expenses to estimate either your actual account balance at the end of the period or the expenses you paid during this period.
Compare with other funds
Since all mutual funds are required to include the same hypothetical calculations about expenses in shareholder reports, you can use this information to compare the ongoing cost of investing in the fund with other funds. To do so, compare the 5% hypothetical example with the 5% hypothetical examples that appear in the shareholder reports of other funds. As you compare hypothetical examples of other funds, it is important to note that hypothetical examples are meant to highlight the ongoing costs of investing in a fund and do not reflect any transaction costs, such as sales charges, redemption fees or exchange fees.
Estimating your actual expenses
To estimate the expenses that you paid over the period, first you will need your account balance at the end of the period:
g For shareholders who receive their account statements from Columbia Management Investment Services Corp., your account balance is available online at www.columbiamanagement.com or by calling Shareholder Services at 800.345.6611.
g For shareholders who receive their account statements from their financial intermediary, contact your financial intermediary to obtain your account balance.
1. Divide your ending account balance by $1,000. For example, if an account balance was $8,600 at the end of the period, the result would be 8.6.
2. In the section of the table below titled "Expenses paid during the period," locate the amount for your share class. You will find this number in the column labeled "Actual." Multiply this number by the result from step 1. Your answer is an estimate of the expenses you paid on your account during the period.
If the value of your account falls below the minimum initial investment requirement applicable to you, your account may be subject to a $20 annual fee. This fee is not included in the accompanying table. If you are subject to the fee, keep it in mind when you are estimating the ongoing expenses of investing in the fund and when comparing the expenses of this fund with other funds.
09/01/10 – 02/28/11
| | | Account value at the
beginning of the period ($) | | Account value at the
end of the period ($) | | Expenses paid
during the period ($) | | Fund's annualized
expense ratio (%) | |
| | | Actual | | Hypothetical | | Actual | | Hypothetical | | Actual | | Hypothetical | | Actual | |
| Class Z | | | 1,000.00 | | | | 1,000.00 | | | | 1,216.10 | | | | 1,019.09 | | | | 6.32 | | | | 5.76 | | | | 1.15 | | |
Expenses paid during the period are equal to the annualized expense ratio for the share class, multiplied by the average account value over the period, then multiplied by the number of days in the fund's most recent fiscal half-year and divided by 365.
Had the Investment Manager and/or any of its affiliates not waived fees or reimbursed a portion of expenses, account value at the end of the period would have been reduced.
It is important to note that the expense amounts shown in the table are meant to highlight only ongoing costs of investing in the fund and do not reflect any transaction costs, such as sales charges, redemption fees or exchange fees. Therefore, the hypothetical examples provided may not help you determine the relative total costs of owning shares of different funds. If these transaction costs were included, your costs would have been higher.
5
Portfolio Manager's Report – Columbia Overseas Value Fund
Performance data quoted represents past performance and current performance may be lower or higher. Past performance is no guarantee of future results. The investment return and principal value will fluctuate so that shares, when redeemed, may be worth more or less than the original cost. Please visit www.columbiamanagement.com for daily and most recent month-end performance updates.
Net asset value per share
as of 02/28/11 ($)
Distributions declared per share
03/01/10 – 02/28/11 ($)
For the 12-month period that ended February 28, 2011, the fund's Class Z shares returned 17.06%. The fund's results trailed the MSCI EAFE Value Index (Net), which returned 18.55% over the same period. The average return for funds in its peer group, the Lipper International Multi-Cap Value Funds Classification, was 21.24%. Stock selection, especially in the consumer discretionary sector, generally accounted for the fund's shortfall against its benchmark and competing funds. Disappointing results from defensive consumer stocks offset strong returns from financials and from the fund's holdings in Japan.
Global recovery lifted cyclical stocks in foreign markets
We positioned the fund to take advantage of a continued rebound in the world economy, and a strong rally in international equity markets over most of the period contributed to healthy returns. However, the fund's emphasis on defensive consumer discretionary stocks held back performance relative to the index. The fund had less exposure than the index to consumer companies that were closely tied to the economy, which were strong performers as the global economy recovered and consumer demand improved. Some of the fund's consumer holdings also experienced company-specific problems. Game Group of the United Kingdom and Altek of Taiwan (0.5% and 0.6% of net assets, respectively) were two examples. A retailer of video game software, Game Group felt the effects of competition from increased on-line downloading of video games. The absence of new game hardware platforms, which typically drive software sales for video games, also hurt. Meanwhile, Altek, a camera manufacturer, was hurt by higher lens prices, which cut into profit margins. Outside the consumer group, a notable disappointment was AWE (0.5% of net assets). This Australian oil exploration and production company experienced a setback in its oil exploration program.
Financials holdings supported results
Two British financials selections posted standout results. Intermediate Capital (1.0% of net assets), a non-bank corporate lending firm, benefited from the reluctance of many banks with their own balance sheet problems to make new commercial loans. Intermediate Capital was able to provide loans on favorable terms to corporations with good credit. Brit Insurance Holdings, a property-and-casualty insurer, was acquired by a private equity firm at a premium stock price. Another takeover target that supported performance was Demag Cranes, a German industrial crane manufacturer that already did well because of increased shipping activity at the world's major ports. Demag Cranes' share price was lifted further by its acquisition. Good stock selection in Japan also helped lift results. Two strong performers were Miraca Holdings and Daiichikosho (0.8% and 1.3% of net assets, respectively). Miraca provides diagnostic testing services for the health care industry, while Daiichikosho produces a popular line of karaoke equipment.
Despite challenges, foreign equity outlook remains good
We believe the global economy should continue to recover and provide good investment opportunities in foreign equity markets, especially in developed economies where short-term interest rates remain low. We think stocks offer attractive value relative to other asset classes, especially low-yielding fixed-income investments.
6
Portfolio Manager's Report (continued) – Columbia Overseas Value Fund
Notwithstanding this optimism, there are concerns that can unsettle the markets. Political unrest in the Middle East already has had a direct impact on world markets by pushing up the price of oil. If popular unrest spreads beyond the Middle East, it could create even more uncertainty in the capital markets. On a separate note, equity investors remain unpersuaded that peripheral European nations, such as Greece, are on track to resolve their debt problems, even after receiving assistance from the European Union and the International Monetary Fund. Another European debt crisis remains a possibility.
Despite these uncertainties, we believe the current global economic recovery is sustainable, providing the potential backdrop for further gains both in corporate profits and stock prices. Given this view, we would consider any market weakness caused by Middle Eastern political unrest or European credit problems as an opportunity to buy attractive stocks at favorable prices.
Portfolio characteristics and holdings are subject to change periodically and may not be representative of current characteristics and holdings. The outlook for the fund may differ from those presented for other Columbia Funds.
Equity securities are affected by stock market fluctuations that occur in response to economic and business developments.
International investing may involve certain risks, including currency fluctuations, risks associated with possible differences in financial accounting standards and other monetary and political risks. Significant levels of foreign taxes, including potentially confiscatory levels of taxation and withholding taxes, may also apply to some foreign investments.
Investing in emerging markets may involve greater risks than investing in more developed countries. In addition, concentration of investments in a single region may result in greater volatility.
Value stocks are securities of companies that may have experienced adverse business or industry developments or may be subject to special risks that have caused the stocks to be out of favor. If the manager's assessment of a company's prospects is wrong, the price of the company's stock may not approach the value the manager has placed on it.
Top 5 sectors
as of 02/28/11 (%)
| Financials | | | 32.4 | | |
| Energy | | | 13.1 | | |
| Health Care | | | 9.6 | | |
| Consumer Discretionary | | | 9.3 | | |
| Telecommunication Services | | | 9.2 | | |
Top 10 holdings
as of 02/28/11 (%)
| Total | | | 3.4 | | |
| Royal Dutch Shell | | | 3.3 | | |
| Banco Santander | | | 2.7 | | |
Australia & New Zealand
Banking Group | | | 2.0 | | |
| Vodafone Group | | | 2.0 | | |
Sumitomo Mitsui Financial
Group | | | 2.0 | | |
| BP | | | 2.0 | | |
| Zurich Financial Services AG | | | 2.0 | | |
| Sanofi-Aventis | | | 1.9 | | |
| Enel | | | 1.7 | | |
The fund is actively managed and the composition of its portfolio will change over time. Information provided is calculated as a percentage of net assets.
7
Investment Portfolio – Columbia Overseas Value Fund
February 28, 2011
| Common Stocks – 100.6% | |
| | | Shares | | Value ($) | |
| Consumer Discretionary – 9.3% | |
| Auto Components – 1.1% | |
| Exedy Corp. | | | 1,300 | | | | 43,087 | | |
| Kongsberg Automotive Holding ASA (a) | | | 66,318 | | | | 51,513 | | |
| Auto Components Total | | | 94,600 | | |
| Automobiles – 3.4% | |
| Fuji Heavy Industries Ltd. | | | 9,000 | | | | 77,554 | | |
| Nissan Motor Co., Ltd. | | | 6,300 | | | | 64,733 | | |
| Proton Holdings Bhd | | | 28,100 | | | | 35,642 | | |
| Toyota Motor Corp. | | | 2,600 | | | | 121,491 | | |
| Automobiles Total | | | 299,420 | | |
| Household Durables – 0.5% | |
| Arnest One Corp. | | | 3,300 | | | | 41,732 | | |
| Household Durables Total | | | 41,732 | | |
| Internet & Catalog Retail – 0.9% | |
| Hyundai Home Shopping Network Corp. | | | 952 | | | | 78,888 | | |
| Internet & Catalog Retail Total | | | 78,888 | | |
| Leisure Equipment & Products – 0.6% | |
| Altek Corp. | | | 38,767 | | | | 52,958 | | |
| Leisure Equipment & Products Total | | | 52,958 | | |
| Media – 1.3% | |
| Daiichikosho Co., Ltd. | | | 5,800 | | | | 113,152 | | |
| Media Total | | | 113,152 | | |
| Specialty Retail – 1.0% | |
| Game Group PLC | | | 45,453 | | | | 45,073 | | |
| Halfords Group PLC | | | 6,584 | | | | 41,475 | | |
| Specialty Retail Total | | | 86,548 | | |
| Textiles, Apparel & Luxury Goods – 0.5% | |
| LG Fashion Corp. | | | 1,610 | | | | 40,222 | | |
| Textiles, Apparel & Luxury Goods Total | | | 40,222 | | |
| Consumer Discretionary Total | | | 807,520 | | |
| Consumer Staples – 2.6% | |
| Beverages – 0.8% | |
| Cott Corp. (a) | | | 8,794 | | | | 73,518 | | |
| Beverages Total | | | 73,518 | | |
| Food & Staples Retailing – 1.3% | |
| Koninklijke Ahold NV | | | 4,977 | | | | 66,812 | | |
| Matsumotokiyoshi Holdings Co., Ltd. | | | 1,900 | | | | 42,656 | | |
| Food & Staples Retailing Total | | | 109,468 | | |
| | | Shares | | Value ($) | |
| Food Products – 0.5% | |
| Balrampur Chini Mills Ltd. (a) | | | 26,485 | | | | 38,892 | | |
| Food Products Total | | | 38,892 | | |
| Consumer Staples Total | | | 221,878 | | |
| Energy – 13.1% | |
| Energy Equipment & Services – 1.5% | |
| Electromagnetic GeoServices AS (a) | | | 30,033 | | | | 59,527 | | |
| Shinko Plantech Co., Ltd. | | | 6,300 | | | | 67,646 | | |
| Energy Equipment & Services Total | | | 127,173 | | |
| Oil, Gas & Consumable Fuels – 11.6% | |
| AWE Ltd. (a) | | | 23,520 | | | | 39,771 | | |
| BP PLC | | | 21,266 | | | | 171,023 | | |
| ENI SpA | | | 3,814 | | | | 92,999 | | |
| Rosneft Oil Co., GDR | | | 9,416 | | | | 88,887 | | |
| Royal Dutch Shell PLC, Class B | | | 8,031 | | | | 287,027 | | |
| Total SA | | | 4,745 | | | | 290,791 | | |
| Yanzhou Coal Mining Co., Ltd., Class H | | | 13,400 | | | | 40,257 | | |
| Oil, Gas & Consumable Fuels Total | | | 1,010,755 | | |
| Energy Total | | | 1,137,928 | | |
| Financials – 32.4% | |
| Capital Markets – 4.6% | |
Credit Suisse Group AG,
Registered Shares | | | 2,047 | | | | 94,694 | | |
| Deutsche Bank AG, Registered Shares | | | 1,666 | | | | 107,087 | | |
| ICAP PLC | | | 9,188 | | | | 77,744 | | |
| Intermediate Capital Group PLC | | | 15,937 | | | | 83,268 | | |
| Tokai Tokyo Financial Holdings, Inc. | | | 11,000 | | | | 40,799 | | |
| Capital Markets Total | | | 403,592 | | |
| Commercial Banks – 13.3% | |
Australia & New Zealand Banking
Group Ltd. | | | 7,065 | | | | 174,614 | | |
| Banco Bilbao Vizcaya Argentaria SA | | | 6,651 | | | | 82,107 | | |
| Banco Santander SA | | | 18,752 | | | | 231,209 | | |
Bangkok Bank PCL, Foreign
Registered Shares | | | 10,400 | | | | 54,661 | | |
| BNP Paribas | | | 1,914 | | | | 149,440 | | |
| Commonwealth Bank of Australia | | | 1,781 | | | | 96,811 | | |
| Mitsubishi UFJ Financial Group, Inc. | | | 11,500 | | | | 63,882 | | |
| National Bank of Canada | | | 768 | | | | 59,176 | | |
| Sumitomo Mitsui Financial Group, Inc. | | | 4,600 | | | | 174,072 | | |
| Turkiye Is Bankasi, Class C | | | 12,068 | | | | 37,591 | | |
| UCO Bank | | | 15,506 | | | | 33,753 | | |
| Commercial Banks Total | | | 1,157,316 | | |
See Accompanying Notes to Financial Statements.
8
Columbia Overseas Value Fund
February 28, 2011
| Common Stocks (continued) | |
| | | Shares | | Value ($) | |
| Diversified Financial Services – 2.4% | |
| Fuyo General Lease Co., Ltd. | | | 2,200 | | | | 82,034 | | |
| ING Groep NV (a) | | | 9,747 | | | | 122,224 | | |
| Diversified Financial Services Total | | | 204,258 | | |
| Insurance – 7.8% | |
| Allianz SE, Registered Shares | | | 818 | | | | 117,847 | | |
| Baloise Holding AG, Registered Shares | | | 910 | | | | 98,336 | | |
| Hartford Financial Services Group, Inc. | | | 1,994 | | | | 59,022 | | |
| Lancashire Holdings Ltd. | | | 4,658 | | | | 45,471 | | |
Muenchener Rueckversicherungs-
Gesellschaft AG, Registered Shares | | | 565 | | | | 94,301 | | |
| Sampo Oyj, Class A | | | 3,149 | | | | 97,469 | | |
Zurich Financial Services AG,
Registered Shares | | | 583 | | | | 169,234 | | |
| Insurance Total | | | 681,680 | | |
| Real Estate Investment Trusts (REITs) – 1.6% | |
| Japan Retail Fund Investment Corp. | | | 52 | | | | 89,502 | | |
| Wereldhave NV | | | 461 | | | | 46,815 | | |
| Real Estate Investment Trusts (REITs) Total | | | 136,317 | | |
| Real Estate Management & Development – 2.7% | |
| Cheung Kong Holdings Ltd. | | | 5,500 | | | | 86,065 | | |
| Hongkong Land Holdings Ltd. | | | 11,000 | | | | 75,652 | | |
| Huaku Development Co., Ltd. | | | 11,000 | | | | 32,782 | | |
| Sinolink Worldwide Holdings Ltd. | | | 344,000 | | | | 42,125 | | |
| Real Estate Management & Development Total | | | 236,624 | | |
| Financials Total | | | 2,819,787 | | |
| Health Care – 9.6% | |
| Biotechnology – 0.7% | |
| Celgene Corp. (a) | | | 1,178 | | | | 62,552 | | |
| Biotechnology Total | | | 62,552 | | |
| Health Care Providers & Services – 0.8% | |
| Miraca Holdings, Inc. | | | 1,800 | | | | 69,640 | | |
| Health Care Providers & Services Total | | | 69,640 | | |
| Pharmaceuticals – 8.1% | |
| AstraZeneca PLC | | | 2,936 | | | | 142,996 | | |
| GlaxoSmithKline PLC | | | 6,016 | | | | 115,501 | | |
| Jazz Pharmaceuticals, Inc. (a) | | | 1,507 | | | | 37,117 | | |
| Novartis AG, Registered Shares | | | 1,777 | | | | 99,647 | | |
| Recordati SpA | | | 8,298 | | | | 77,579 | | |
| Sanofi-Aventis SA | | | 2,345 | | | | 161,799 | | |
| Santen Pharmaceutical Co., Ltd. | | | 1,700 | | | | 66,500 | | |
| Pharmaceuticals Total | | | 701,139 | | |
| Health Care Total | | | 833,331 | | |
| | | Shares | | Value ($) | |
| Industrials – 7.9% | |
| Airlines – 0.3% | |
| Turk Hava Yollari A.O. (a) | | | 9,119 | | | | 25,553 | | |
| Airlines Total | | | 25,553 | | |
| Commercial Services & Supplies – 0.8% | |
| Aeon Delight Co., Ltd. | | | 3,800 | | | | 70,147 | | |
| Commercial Services & Supplies Total | | | 70,147 | | |
| Construction & Engineering – 1.3% | |
| KHD Humboldt Wedag International AG | | | 3,458 | | | | 37,893 | | |
| Macmahon Holdings Ltd. | | | 125,790 | | | | 74,383 | | |
| Construction & Engineering Total | | | 112,276 | | |
| Industrial Conglomerates – 1.7% | |
| DCC PLC | | | 2,831 | | | | 90,829 | | |
| Tyco International Ltd. | | | 1,155 | | | | 52,368 | | |
| Industrial Conglomerates Total | | | 143,197 | | |
| Professional Services – 0.7% | |
| Teleperformance | | | 1,642 | | | | 62,357 | | |
| Professional Services Total | | | 62,357 | | |
| Trading Companies & Distributors – 3.1% | |
| ITOCHU Corp. | | | 7,300 | | | | 75,913 | | |
| Kloeckner & Co., SE (a) | | | 2,535 | | | | 82,382 | | |
| Mitsui & Co., Ltd. | | | 6,200 | | | | 113,336 | | |
| Trading Companies & Distributors Total | | | 271,631 | | |
| Industrials Total | | | 685,161 | | |
| Information Technology – 4.9% | |
| Electronic Equipment, Instruments & Components – 2.1% | |
| FUJIFILM Holdings Corp. | | | 1,400 | | | | 49,291 | | |
| Hitachi Ltd. | | | 13,000 | | | | 79,123 | | |
| Venture Corp., Ltd. | | | 8,000 | | | | 59,509 | | |
Electronic Equipment, Instruments &
Components Total | | | 187,923 | | |
| IT Services – 0.7% | |
| Groupe Steria SCA | | | 1,935 | | | | 61,041 | | |
| IT Services Total | | | 61,041 | | |
| Office Electronics – 0.8% | |
| Canon, Inc. | | | 1,400 | | | | 67,703 | | |
| Office Electronics Total | | | 67,703 | | |
See Accompanying Notes to Financial Statements.
9
Columbia Overseas Value Fund
February 28, 2011
| Common Stocks (continued) | |
| | | Shares | | Value ($) | |
| Semiconductors & Semiconductor Equipment – 1.3% | |
| Hanwha SolarOne Co., Ltd., ADR (a) | | | 4,564 | | | | 39,022 | | |
| Macronix International | | | 100,267 | | | | 73,285 | | |
Semiconductors & Semiconductor
Equipment Total | | | 112,307 | | |
| Information Technology Total | | | 428,974 | | |
| Materials – 5.4% | |
| Chemicals – 2.2% | |
| BASF SE | | | 895 | | | | 74,424 | | |
| Clariant AG, Registered Shares (a) | | | 2,595 | | | | 42,789 | | |
| Kansai Paint Co., Ltd. | | | 8,000 | | | | 76,208 | | |
| Chemicals Total | | | 193,421 | | |
| Containers & Packaging – 0.8% | |
| Smurfit Kappa Group PLC (a) | | | 5,596 | | | | 69,500 | | |
| Containers & Packaging Total | | | 69,500 | | |
| Metals & Mining – 1.5% | |
| Eastern Platinum Ltd. (a) | | | 24,000 | | | | 38,042 | | |
| First Quantum Minerals Ltd. | | | 482 | | | | 62,759 | | |
| Kobe Steel Ltd. | | | 11,000 | | | | 30,107 | | |
| Metals & Mining Total | | | 130,908 | | |
| Paper & Forest Products – 0.9% | |
| Svenska Cellulosa AB, Class B | | | 4,621 | | | | 76,389 | | |
| Paper & Forest Products Total | | | 76,389 | | |
| Materials Total | | | 470,218 | | |
| Telecommunication Services – 9.2% | |
| Diversified Telecommunication Services – 4.4% | |
| BCE, Inc. | | | 2,438 | | | | 90,389 | | |
| Tele2 AB, Class B | | | 4,184 | | | | 95,457 | | |
| Telefonica SA | | | 4,194 | | | | 106,490 | | |
| Telenor ASA | | | 5,632 | | | | 93,377 | | |
| Diversified Telecommunication Services Total | | | 385,713 | | |
| Wireless Telecommunication Services – 4.8% | |
Advanced Info Service PCL, Foreign
Registered Shares | | | 15,000 | | | | 39,002 | | |
| Freenet AG | | | 7,353 | | | | 84,827 | | |
| Softbank Corp. | | | 1,300 | | | | 53,448 | | |
| Vivo Participacoes SA, ADR | | | 1,687 | | | | 62,099 | | |
| Vodafone Group PLC | | | 61,548 | | | | 174,397 | | |
| Wireless Telecommunication Services Total | | | 413,773 | | |
| Telecommunication Services Total | | | 799,486 | | |
| | | Shares | | Value ($) | |
| Utilities – 6.2% | |
| Electric Utilities – 2.9% | |
| Enel SpA | | | 25,316 | | | | 150,848 | | |
| Fortum Oyj | | | 3,090 | | | | 95,728 | | |
| Electric Utilities Total | | | 246,576 | | |
| Independent Power Producers & Energy Traders – 0.4% | |
| Energy Development Corp. | | | 276,000 | | | | 35,627 | | |
Independent Power Producers &
Energy Traders Total | | | 35,627 | | |
| Multi-Utilities – 2.4% | |
| AGL Energy Ltd. | | | 3,570 | | | | 52,962 | | |
| Centrica PLC | | | 14,977 | | | | 82,806 | | |
| RWE AG | | | 1,091 | | | | 73,635 | | |
| Multi-Utilities Total | | | 209,403 | | |
| Water Utilities – 0.5% | |
Cia de Saneamento Basico do Estado
de Sao Paulo | | | 1,800 | | | | 44,108 | | |
| Water Utilities Total | | | 44,108 | | |
| Utilities Total | | | 535,714 | | |
Total Common Stocks
(cost of $7,884,520) | | | 8,739,997 | | |
Total Investments – 100.6%
(cost of $7,884,520) (b) | | | 8,739,997 | | |
| Other Assets & Liabilities, Net – (0.6)% | | | (49,850 | ) | |
| Net Assets – 100.0% | | | 8,690,147 | | |
Notes to Investment Portfolio:
(a) Non-income producing security.
(b) Cost for federal income tax purposes is $7,995,076.
Generally accepted accounting principles (GAAP) require disclosure regarding the inputs and valuation techniques used to measure fair value and any changes in valuation inputs or techniques. In addition, investments shall be disclosed by major category.
The Fund categorizes its fair value measurements according to a three-level hierarchy that maximizes the use of observable inputs and minimizes the use of unobservable inputs by prioritizing that the most observable input be used when available. Observable inputs are those that market participants would use in pricing an investment based on market data obtained from sources independent of the reporting entity. Unobservable inputs are those that reflect the Fund's assumptions about the information market participants would use in pricing an investment. An investment's level within the fair value hierarchy is based on the lowest level of any input that is deemed significant to the asset or liability's fair value measurement. The input levels are not necessarily an indication of the risk or liquidity associated with investments at that level. For example, certain U.S. government securities are generally high quality and liquid, however, they are reflected as Level 2 because the inputs used to determine fair value may not always be quoted prices in an active market.
See Accompanying Notes to Financial Statements.
10
Columbia Overseas Value Fund
February 28, 2011
Fair value inputs are summarized in the three broad levels listed below:
• Level 1—Valuations based on quoted prices for investments in active markets that the Fund has the ability to access at the measurement date (including NAV for open-end mutual funds). Valuation adjustments are not applied to Level 1 investments.
• Level 2—Valuations based on other significant observable inputs (including quoted prices for similar securities, interest rates, prepayment speeds, credit risks, etc.).
• Level 3—Valuations based on significant unobservable inputs (including the Fund's own assumptions and judgment in determining the fair value of investments).
Inputs that are used in determining fair value of an investment may include price information, credit data, volatility statistics, and other factors. These inputs can be either observable or unobservable. The availability of observable inputs can vary between investments, and is affected by various factors such as the type of investment, and the volume and level of activity for that investment or similar investments in the marketplace. The inputs will be considered by the Investment Manager, along with any other relevant factors in the calculation of an investment's fair value. The Fund uses prices and inputs that are current as of the measurement date, which may include periods of market dislocations. During these periods, the availability of prices and inputs may be reduced for many investments. This condition could cause an investment to be reclassified between the various levels within the hierarchy. Non-U.S. equity securities actively traded in foreign markets may be reflected in Level 2 despite the availability of closing prices, because the Fund evaluates and determines whether those closing prices reflect fair value at the close of the New York Stock Exchange (NYSE) or require adjustment, as described in Note 2 to the financial statements—Security Valuation.
Investments falling into the Level 3 category are primarily supported by quoted prices from brokers and dealers participating in the market for those investments. However, these may be classified as Level 3 investments due to lack of market transparency and corroboration to support these quoted prices. Additionally, valuation models may be used as the pricing source for any remaining investments classified as Level 3. These models rely on one or more significant unobservable inputs and/or significant assumptions by the Investment Manager. Inputs used in valuations may include, but are not limited to, financial statement analysis, capital account balances, discount rates and estimated cash flows, and comparable company data.
The following table is a summary of the inputs used to value the Fund's investments as of February 28, 2011:
| Description | | Quoted
Prices
(Level 1) | | Other
Significant
Observable
Inputs
(Level 2) | | Significant
Unobservable
Inputs
(Level 3) | | Total | |
| Common Stocks | |
| Consumer Discretionary | | $ | — | | | $ | 807,520 | | | $ | — | | | $ | 807,520 | | |
| Consumer Staples | | | 73,518 | | | | 148,360 | | | | — | | | | 221,878 | | |
| Energy | | | 88,887 | | | | 1,049,041 | | | | — | | | | 1,137,928 | | |
| Financials | | | 118,198 | | | | 2,701,589 | | | | — | | | | 2,819,787 | | |
| Health Care | | | 99,669 | | | | 733,662 | | | | — | | | | 833,331 | | |
| Industrials | | | 52,368 | | | | 632,793 | | | | — | | | | 685,161 | | |
| Information Technology | | | 39,022 | | | | 389,952 | | | | — | | | | 428,974 | | |
| Materials | | | 100,801 | | | | 369,417 | | | | — | | | | 470,218 | | |
| Telecommunication Services | | | 152,488 | | | | 646,998 | | | | — | | | | 799,486 | | |
| Utilities | | | 44,108 | | | | 491,606 | | | | — | | | | 535,714 | | |
| Total Common Stocks | | | 769,059 | | | | 7,970,938 | | | | — | | | | 8,739,997 | | |
| Total Investments | | | 769,059 | | | | 7,970,938 | | | | — | | | | 8,739,997 | | |
Unrealized Appreciation on
Forward Foreign Currency
Exchange Contracts | | | — | | | | 18,815 | | | | — | | | | 18,815 | | |
Unrealized Depreciation on
Forward Foreign Currency
Exchange Contracts | | | — | | | | (11,771 | ) | | | — | | | | (11,771 | ) | |
| Total | | $ | 769,059 | | | $ | 7,977,982 | | | $ | — | | | $ | 8,747,041 | | |
The Fund's assets assigned to the Level 2 input category are generally valued using the market approach, in which a security's value is determined through reference to prices and information from market transactions for similar or identical assets. These assets include certain foreign securities for which a third party statistical pricing service may be employed for purposes of fair market valuation. The models utilized by the third party statistical pricing service take into account a security's correlation to available market data including, but not limited to, intraday index, ADR, and ETF movements.
The following table shows transfers between Level 1 and Level 2 of the fair value hierarchy:
| | | Transfers In | | Transfers Out | |
| | | Level 1 | | Level 2 | | Level 1 | | Level 2 | |
| | | | | $ | — | | | $ | 64,400 | | | $ | 64,400 | | | $ | — | | |
Financial assets were transferred from Level 1 to Level 2 as it was determined that the application of factors received from third party statistical services resulted in a price which was more representative of fair value for these securities as of period end.
For the year ended February 28, 2011, transactions in written option contracts were as follows:
| | | Number of
contracts | | Premium
received | |
| Options outstanding at February 28, 2010 | | | 3 | | | $ | 192 | | |
| Options written | | | 284 | | | | 10,230 | | |
Options terminated in closing purchase
transactions | | | (101 | ) | | | (5,940 | ) | |
| Options exercised | | | (60 | ) | | | (240 | ) | |
| Options expired | | | (126 | ) | | | (4,242 | ) | |
| Options outstanding at February 28, 2011 | | | — | | | $ | — | | |
Forward foreign currency exchange contracts outstanding on February 28, 2011, are:
Foreign Exchange Rate Risk
| Counterparty | | Forward
Foreign
Currency
Exchange
Contracts
to Buy | | Value | | Aggregate
Face Value | | Settlement
Date | | Unrealized
Appreciation | |
| Morgan Stanley | | | | | | | | | |
| |
| Capital | | | | | | | | | |
| |
| Services, Inc. | | AUD | | | | $ | 292,175 | | | $ | 289,318 | | | 04/28/11 | | $ | 2,857 | | |
Morgan Stanley
Capital
Services, Inc. | | EUR | | | | | 445,415 | | | | 440,294 | | | 04/28/11 | | | 5,121 | | |
Morgan Stanley
Capital
Services, Inc. | | GBP | | | | | 302,215 | | | | 300,325 | | | 04/28/11 | | | 1,890 | | |
Morgan Stanley
Capital
Services, Inc. | | JPY | | | | | 125,749 | | | | 125,584 | | | 04/28/11 | | | 165 | | |
Morgan Stanley
Capital
Services, Inc. | | SEK | | | | | 36,214 | | | | 35,355 | | | 04/28/11 | | | 859 | | |
Morgan Stanley
Capital
Services, Inc. | | SGD | | | | | 87,306 | | | | 87,120 | | | 04/28/11 | | | 186 | | |
| | | $ | 11,078 | | |
See Accompanying Notes to Financial Statements.
11
Columbia Overseas Value Fund
February 28, 2011
| Counterparty | | Forward
Foreign
Currency
Exchange
Contracts
to Sell | | Value | | Aggregate
Face Value | | Settlement
Date | | Unrealized
Appreciation
(Depreciation) | |
| Morgan Stanley | | | | | | | | | |
| |
| Capital | | | | | | | | | |
| |
| Services, Inc. | | CAD | | | | $ | 299,146 | | | $ | 293,760 | | | 04/28/11 | | $ | (5,386 | ) | |
Morgan Stanley
Capital
Services, Inc. | | CHF | | | | | 142,144 | | | | 138,915 | | | 04/28/11 | | | (3,229 | ) | |
Morgan Stanley
Capital
Services, Inc. | | KRW | | | | | 109,046 | | | | 111,046 | | | 04/28/11 | | | 2,000 | | |
Morgan Stanley
Capital
Services, Inc. | | MYR | | | | | 42,778 | | | | 43,049 | | | 04/28/11 | | | 271 | | |
Morgan Stanley
Capital
Services, Inc. | | NOK | | | | | 79,935 | | | | 77,807 | | | 04/28/11 | | | (2,128 | ) | |
Morgan Stanley
Capital
Services, Inc. | | PHP | | | | | 35,248 | | | | 34,929 | | | 04/28/11 | | | (319 | ) | |
Morgan Stanley
Capital
Services, Inc. | | THB | | | | | 66,203 | | | | 65,494 | | | 04/28/11 | | | (709 | ) | |
Morgan Stanley
Capital
Services, Inc. | | TWD | | | | | 149,671 | | | | 155,137 | | | 04/28/11 | | | 5,466 | | |
| | | $ | (4,034 | ) | |
The Fund was invested in the following countries at February 28, 2011:
Summary of Securities
by Country | | Value | | % of Total
Investments | |
| Japan | | $ | 1,773,755 | | | | 20.3 | | |
| United Kingdom | | | 1,266,781 | | | | 14.5 | | |
| France | | | 725,428 | | | | 8.3 | | |
| Germany | | | 672,397 | | | | 7.7 | | |
| Switzerland | | | 504,699 | | | | 5.8 | | |
| Australia | | | 438,541 | | | | 5.0 | | |
| Spain | | | 419,806 | | | | 4.8 | | |
| Canada | | | 323,883 | | | | 3.7 | | |
| Italy | | | 321,427 | | | | 3.7 | | |
| Netherlands | | | 235,850 | | | | 2.7 | | |
| United States | | | 211,060 | | | | 2.5 | | |
| Norway | | | 204,418 | | | | 2.3 | | |
| Hong Kong | | | 203,842 | | | | 2.3 | | |
| Finland | | | 193,197 | | | | 2.2 | | |
| Sweden | | | 171,846 | | | | 2.0 | | |
| Ireland | | | 160,329 | | | | 1.8 | | |
| Taiwan | | | 159,026 | | | | 1.8 | | |
| South Korea | | | 119,110 | | | | 1.4 | | |
| Brazil | | | 106,206 | | | | 1.2 | | |
| Thailand | | | 93,664 | | | | 1.1 | | |
| Russia | | | 88,887 | | | | 1.0 | | |
| China | | | 79,279 | | | | 0.9 | | |
| India | | | 72,645 | | | | 0.8 | | |
| Turkey | | | 63,144 | | | | 0.7 | | |
| Singapore | | | 59,508 | | | | 0.7 | | |
| Malaysia | | | 35,642 | | | | 0.4 | | |
| Philippines | | | 35,627 | | | | 0.4 | | |
| | | $ | 8,739,997 | | | | 100.0 | | |
Certain securities are listed by country of underlying exposure but may trade predominantly on another exchange.
| Acronym | | Name | |
| ADR | | American Depositary Receipt | |
|
| AUD | | Australian Dollar | |
|
| CAD | | Canadian Dollar | |
|
| CHF | | Swiss Franc | |
|
| EUR | | Euro | |
|
| GBP | | Pound Sterling | |
|
| GDR | | Global Depository Receipt | |
|
| JPY | | Japanese Yen | |
|
| KRW | | South Korean Won | |
|
| MYR | | Malaysian Ringgit | |
|
| NOK | | Norwegian Krone | |
|
| PHP | | Philippine Peso | |
|
| SEK | | Swedish Krona | |
|
| SGD | | Singapore Dollar | |
|
| THB | | Thailand Baht | |
|
| TWD | | New Taiwan Dollar | |
|
See Accompanying Notes to Financial Statements.
12
Statement of Assets and Liabilities – Columbia Overseas Value Fund
February 28, 2011
| | | | | ($) | |
| Assets | | Investments, at cost | | | 7,884,520 | | |
| | | Investments, at value | | | 8,739,997 | | |
| | | Cash | | | 13,088 | | |
| | | Foreign currency (cost of $1,452) | | | 1,412 | | |
| | | Unrealized appreciation on forward foreign currency exchange contracts | | | 18,815 | | |
| | | Receivable for: | | | |
| | | Dividends | | | 25,285 | | |
| | | Foreign tax reclaims | | | 7,243 | | |
| | | Expense reimbursement due from Investment Manager | | | 14,689 | | |
| | | Prepaid expenses | | | 25 | | |
| | | Total Assets | | | 8,820,554 | | |
| Liabilities | | Unrealized depreciation on forward foreign currency exchange contracts | | | 11,771 | | |
| | | Payable for: | | | |
| | | Investments purchased | | | 4,261 | | |
| | | Foreign capital gains taxes withheld | | | 1,059 | | |
| | | Investment advisory fee | | | 5,673 | | |
| | | Pricing and bookkeeping fees | | | 5,441 | | |
| | | Transfer agent fee | | | 83 | | |
| | | Trustees' fees | | | 18,599 | | |
| | | Audit fee | | | 34,648 | | |
| | | Legal fee | | | 20,047 | | |
| | | Custody fee | | | 8,560 | | |
| | | Reports to shareholders | | | 19,114 | | |
| | | Chief compliance officer expenses | | | 131 | | |
| | | Other liabilities | | | 1,020 | | |
| | | Total Liabilities | | | 130,407 | | |
| | | Net Assets | | | 8,690,147 | | |
| Net Assets Consist of | | Paid-in capital | | | 10,527,110 | | |
| | | Overdistributed net investment income | | | (88,280 | ) | |
| | | Accumulated net realized loss | | | (2,610,526 | ) | |
| | | Net unrealized appreciation (depreciation) on: | | | |
| | | Investments | | | 855,477 | | |
| | | Foreign currency translations and forward foreign currency exchange contracts | | | 7,425 | | |
| | | Foreign capital gains tax | | | (1,059 | ) | |
| | | Net Assets | | | 8,690,147 | | |
| Class Z | | Net assets | | $ | 8,690,147 | | |
| | | Shares outstanding | | | 1,086,879 | | |
| | | Net asset value, offering and redemption price per share | | $ | 8.00 | | |
See Accompanying Notes to Financial Statements.
13
Statement of Operations – Columbia Overseas Value Fund
For the Year Ended February 28, 2011
| | | | | ($) | |
| Investment Income | | Dividends | | | 285,405 | | |
| | | Interest | | | 3 | | |
| | | Foreign taxes withheld | | | (24,594 | ) | |
| | | Total Investment Income | | | 260,814 | | |
| Expenses | | Investment advisory fee | | | 64,261 | | |
| | | Transfer agent fee | | | 69 | | |
| | | Pricing and bookkeeping fees | | | 51,388 | | |
| | | Trustees' fees | | | 28,774 | | |
| | | Custody fee | | | 34,447 | | |
| | | Audit fee | | | 47,894 | | |
| | | Legal fees | | | 25,000 | | |
| | | Reports to shareholders | | | 30,000 | | |
| | | Chief compliance officer expenses | | | 975 | | |
| | | Other expenses | | | 3,022 | | |
| | | Total Expenses | | | 285,830 | | |
| | | Fees waived or expenses reimbursed by Investment Manager | | | (195,697 | ) | |
| | | Expense reductions | | | (10 | ) | |
| | | Net Expenses | | | 90,123 | | |
| | | Net Investment Income | | | 170,691 | | |
| Net Realized and Unrealized Gain (Loss) on Investments, Foreign Currency, Written Options and Foreign Capital Gains Tax | | Net realized gain (loss) on: | | | |
| | | Investments | | | 70,199 | | |
| | | Foreign currency transactions and forward foreign currency
exchange contracts | | | (53,057 | ) | |
| | | Written options | | | 3,241 | | |
| | | Net realized gain | | | 20,383 | | |
| | | Net change in unrealized appreciation (depreciation) on: | | | |
| | | Investments | | | 1,039,139 | | |
| | | Foreign currency translations and forward foreign currency
exchange contracts | | | 52,830 | | |
| | | Written options | | | (111 | ) | |
| | | Foreign capital gains tax | | | (1,047 | ) | |
| | | Net change in unrealized appreciation (depreciation) | | | 1,090,811 | | |
| | | Net Gain | | | 1,111,194 | | |
| | | Net Increase Resulting from Operations | | | 1,281,885 | | |
See Accompanying Notes to Financial Statements.
14
Statement of Changes in Net Assets – Columbia Overseas Value Fund
| | | | | Year Ended February 28, | |
| Increase (Decrease) in Net Assets | | | | 2011 ($) | | 2010 ($) | |
| Operations | | Net investment income | | | 170,691 | | | | 174,290 | | |
| | | Net realized gain (loss) on investments, futures contracts,
written options, foreign currency transactions and
forward foreign currency exchange contracts | | | 20,383 | | | | (354,737) | | |
| | | Net change in unrealized appreciation (depreciation)
on investments, written options, foreign capital gains tax,
foreign currency translations and forward foreign currency
exchange contracts | | | 1,090,811 | | | | 3,087,630 | | |
| | | Net increase resulting from operations | | | 1,281,885 | | | | 2,907,183 | | |
| Distributions to Shareholders | | From net investment income | | | (165,101 | ) | | | (293,672 | ) | |
| | | Net Capital Stock Transactions | | | 1,838 | | | | 293,672 | | |
| | | Total increase in net assets | | | 1,118,622 | | | | 2,907,183 | | |
| Net Assets | | Beginning of period | | | 7,571,525 | | | | 4,664,342 | | |
| | | End of period | | | 8,690,147 | | | | 7,571,525 | | |
| | | Overdistributed net investment income at end of period | | | (88,280 | ) | | | (51,714 | ) | |
See Accompanying Notes to Financial Statements.
15
Statement of Changes in Net Assets (continued) – Columbia Overseas Value Fund
| | | Capital Stock Activity | |
| | | Year Ended
February 28, 2011 | | Year Ended
February 28, 2010 | |
| | | Shares | | Dollars ($) | | Shares | | Dollars ($) | |
| Class Z | |
| Subscriptions | | | 1,067,133 | | | | 8,184,910 | | | | — | | | | — | | |
| Distributions reinvested | | | 22,767 | | | | 165,101 | | | | 40,674 | | | | 293,672 | | |
| Redemptions | | | (1,088,418 | ) | | | (8,348,173 | ) | | | — | | | | — | | |
| Net increase | | | 1,482 | | | | 1,838 | | | | 40,674 | | | | 293,672 | | |
See Accompanying Notes to Financial Statements.
16
Financial Highlights – Columbia Overseas Value Fund
Selected data for a share outstanding throughout each period is as follows:
| | | Year Ended February 28, | | Period Ended
February 28, | |
| Class Z Shares | | 2011 | | 2010 | | 2009 (a) | |
| Net Asset Value, Beginning of Period | | $ | 6.98 | | | $ | 4.46 | | | $ | 10.00 | | |
| Income from Investment Operations: | |
| Net investment income (b) | | | 0.16 | | | | 0.17 | | | | 0.27 | | |
Net realized and unrealized gain (loss) on investments, futures contracts,
written options, foreign capital gains tax and foreign currency | | | 1.01 | | | | 2.63 | | | | (5.56 | ) | |
| Total from investment operations | | | 1.17 | | | | 2.80 | | | | (5.29 | ) | |
| Less Distributions to Shareholders: | |
| From net investment income | | | (0.15 | ) | | | (0.28 | ) | | | (0.23 | ) | |
| Return of capital | | | — | | | | — | | | | (0.02 | ) | |
| Total distributions to shareholders | | | (0.15 | ) | | | (0.28 | ) | | | (0.25 | ) | |
| Net Asset Value, End of Period | | $ | 8.00 | | | $ | 6.98 | | | $ | 4.46 | | |
| Total return (c)(d) | | | 17.06 | % | | | 62.60 | % | | | (53.41 | )%(e) | |
| Ratios to Average Net Assets/Supplemental Data: | |
| Net expenses (f) | | | 1.15 | % | | | 1.14 | % | | | 1.10 | %(g) | |
| Waiver/Reimbursement | | | 2.50 | % | | | 1.88 | % | | | 2.89 | %(g) | |
| Net investment income (f) | | | 2.18 | % | | | 2.46 | % | | | 3.72 | %(g) | |
| Portfolio turnover rate | | | 48 | % | | | 62 | % | | | 66 | %(e) | |
| Net assets, end of period (000s) | | $ | 8,690 | | | $ | 7,572 | | | $ | 4,664 | | |
(a) The Fund commenced operations on March 31, 2008. Per share data and total return reflect activity from that date.
(b) Per share data was calculated using the average shares outstanding during the period.
(c) Total return at net asset value assuming all distributions reinvested.
(d) Had the Investment Manager and/or any of its affiliates not waived fees or reimbursed a portion of expenses, total return would have been reduced.
(e) Not annualized.
(f) The benefits derived from expense reductions had an impact of less than 0.01%.
(g) Annualized.
See Accompanying Notes to Financial Statements.
17
Notes to Financial Statements – Columbia Overseas Value Fund
February 28, 2011
Note 1. Organization
Columbia Overseas Value Fund (the Fund), a series of Columbia Funds Series Trust (the Trust), is a diversified fund. The Trust is registered under the Investment Company Act of 1940, as amended (the 1940 Act), as an open-end management investment company organized as a Delaware statutory trust.
After the close of business on April 30, 2010, Ameriprise Financial, Inc. (Ameriprise Financial) acquired a portion of the asset management business of Columbia Management Group, LLC (the Transaction), including the business of managing the Fund. In connection with the closing of the Transaction (the Closing), RiverSource Investments, LLC, a wholly owned subsidiary of Ameriprise Financial, became the investment manager of the Fund and changed its name to Columbia Management Investment Advisers, LLC (the Investment Manager).
Investment Objective
The Fund seeks long-term capital appreciation.
Fund Shares
The Trust has unlimited authorized shares of beneficial interest. The Fund offers Class Z shares, however at February 28, 2011, Class Z shares of the Fund were not publicly offered.
The Fund is authorized to issue Class A, Class C shares, which would be subject to sales charges and Class R shares, which would not be subject to sales charges, however these share classes are not currently offered for sale and have not commenced operations.
Class Z shares are not subject to sales charges and are available only to certain investors, as described in the Fund's prospectus.
Note 2. Summary of Significant Accounting Policies
The preparation of financial statements in accordance with U.S. generally accepted accounting principles (GAAP) requires the Investment Manager to make certain estimates and assumptions that affect the reported amounts of assets and liabilities, the disclosure of contingent assets and liabilities at the date of the financial statements and the reported amounts of revenue and expenses during the reporting period. Actual results could differ from those estimates.
The following is a summary of significant accounting policies consistently followed by the Fund in the preparation of its financial statements.
Security Valuation
Equity securities are valued at the last sale price on the principal exchange on which they trade, except for securities traded on the NASDAQ, which are valued at the NASDAQ official close price. Unlisted securities or listed securities for which there were no sales during the day are valued at the closing bid price on such exchanges or over-the-counter markets.
Short-term investments maturing in 60 days or less are valued at amortized cost, which approximates market value.
Purchased options are valued at the last reported sale price, or in the absence of a sale, at the last quoted bid price. Written options are valued at the last reported sale price, or in the absence of a sale, at the last quoted ask price.
Forward foreign currency exchange contracts are valued at the prevailing forward exchange rate of the underlying currencies.
Foreign securities are generally valued at the last sale price on the foreign exchange or market on which they trade. If any foreign share prices are not readily available as a result of limited share activity, the securities are valued at the last sale price of the local shares in the principal market in which such securities are normally traded.
Generally, trading in foreign securities is substantially completed each day at various times prior to the close of the New York Stock Exchange (NYSE). The values of such securities used in computing the net asset value of the Fund's shares are determined as of such times. Foreign currency exchange rates are generally determined at 4:00 p.m. Eastern (U.S.) time. Occasionally, events affecting the values of such foreign securities may occur between the times at which they are determined and the close of the customary trading session of the NYSE, which would not be reflected in the computation of the Fund's net asset value. If events materially affecting the values of such foreign securities occur and it is determined that market quotations are not reliable, then these foreign securities will be valued at their fair value using procedures approved by the Board of Trustees.
The Fund may use a systematic fair valuation model provided by an independent third party to value securities principally traded in foreign markets in order to adjust for possible stale pricing that may occur between the close of the foreign exchanges and the time for valuation.
Investments for which market quotations are not readily available, or that have quotations which the Investment Manager believes are not reliable, are valued at fair value as determined in good faith under
18
Columbia Overseas Value Fund, February 28, 2011
consistently applied procedures established by and under the general supervision of the Board of Trustees. If a security is valued at fair value, such value is likely to be different from the last quoted market price for the security. The determination of fair value often requires significant judgment. To determine fair value, the Investment Manager may use assumptions including but not limited to future cash flows and estimated risk premiums. Multiple inputs from various sources may be used to determine value.
Foreign Currency Transactions and Translations
The values of all assets and liabilities quoted in foreign currencies are translated into U.S. dollars at that day's exchange rates. Net realized and unrealized gains (losses) on foreign currency transactions and translations include gains (losses) arising from the fluctuation in exchange rates between trade and settlement dates on securities transactions, gains (losses) arising from the disposition of foreign currency and currency gains (losses) between the accrual and payment dates on dividends, interest income and foreign withholding taxes.
For financial statement purposes, the Fund does not distinguish that portion of gains (losses) on investments which is due to changes in foreign exchange rates from that which is due to changes in market prices of the investments. Such fluctuations are included with the net realized and unrealized gains (losses) on investments on the Statement of Operations.
Derivative Instruments
The Fund may use derivative instruments including options and forward foreign currency exchange contracts in order to meet its investment objectives. The Fund employs strategies in differing combinations to permit it to increase, decrease or change the level of exposure to market risk factors. The achievement of any strategy relating to derivatives depends on an analysis of various risk factors, and if the strategies for the use of derivatives do not work as intended, the Fund may not achieve its investment objectives.
In pursuit of its investment objectives, the Fund is exposed to the following market risks, among others:
Equity Risk: Equity risk relates to change in value of equity securities such as common stocks due to general market conditions such as real or perceived adverse economic conditions, changes in the general outlook for corporate earnings, or adverse investor sentiment. Equity securities generally have greater price volatility than fixed income securities.
Foreign Exchange Rate Risk: Foreign exchange rate risk relates to the change in the U.S. dollar value of a security held that is denominated in a foreign currency. The U.S. dollar value of a foreign-currency-denominated security will decrease as the dollar appreciates against the currency, while the U.S. dollar value will increase as the dollar depreciates against the currency.
The following provides more detailed information about each derivative type held by the Fund:
Forward Foreign Currency Exchange Contracts—The Fund entered into forward foreign currency exchange contracts to shift its investment exposure from one currency to another.
The Fund used forward contracts to shift its U.S. dollar exposure in order to achieve a representative weighted mix of major currencies in its benchmark and/or to recover an underweight country exposure in its portfolio.
Forward foreign currency exchange contracts are agreements to exchange one currency for another at a future date at a specified price. These contracts are used to minimize the exposure to foreign exchange rate fluctuations during the period between the trade and settlement dates of the contract. Contracts to buy generally are used to acquire exposure to foreign currencies, while contracts to sell are generally used to reduce the exposure to foreign exchange rate fluctuations. Forward foreign currency exchange contracts are valued daily at the current exchange rate of the underlying currency, resulting in unrealized gains (losses) which become realized at the time the forward foreign currency exchange contracts are closed or mature. Realized and unrealized gains (losses) arising from such transactions are included in net realized and unrealized gains (losses) on foreign currency transactions. The use of forward foreign currency exchange contracts does not eliminate fluctuations in the prices of the Fund's portfolio securities. While the maximum potential loss from such contracts is the aggregate face value in U.S. dollars at the time the contract was opened, exposure is typically limited to the change in value of the contract (in U.S. dollars) over the period it remains open. The Fund could also be exposed to risk that counterparties of the contracts may be unable to fulfill the terms of the contracts.
During the year ended February 28, 2011, the Fund entered into 272 forward foreign currency exchange contracts.
Options—The Fund had written covered call and purchased put options to decrease the Fund's exposure to equity risk and to increase return on instruments. Written covered call and purchased put options become more valuable as the price of the underlying instruments depreciates relative to the strike price.
19
Columbia Overseas Value Fund, February 28, 2011
Writing put options tends to increase the Fund's exposure to the underlying instrument. When the Fund writes a call or put option, an amount equal to the premium received is recorded as a liability and subsequently marked-to-market to reflect the current value of the option written. Premiums received from writing options which expire are treated as realized gains. Premiums received from writing options which are exercised or closed are added to the proceeds or offset against the amounts paid on the underlying security transaction to determine the realized gain or loss. The Fund, as a writer of an option, has no control over whether the underlying security may be sold (call) or purchased (put) and as a result bears the market risk of an unfavorable change in the price of the security underlying the written option. There is the risk that the Fund may not be able to enter into a closing transaction because of an illiquid market. The Fund identifies within its portfolio of investments cash or liquid portfolio securities equal to the amount of the written options contract commitment.
The Fund may also purchase put and call options. Purchasing call options tends to increase the Fund's exposure to the underlying instrument. Purchasing put options tends to decrease the Fund's exposure to the underlying instrument. The Fund may pay a premium, which is included in the Fund's Statement of Assets and Liabilities as an investment and subsequently marked-to-market to reflect the current value of the option. The risk associated with purchasing put and call options is limited to the premium paid. Premiums paid for purchasing options which expire are treated as realized losses. Premiums paid for purchasing options which are exercised are added to the amounts paid (call) or offset against the proceeds (put) on the underlying security to determine the realized gain or loss. If the Fund enters into a closing transaction, the Fund will realize a gain or loss, depending on whether the proceeds from the closing transaction are greater or less than the cost of the option.
During the year ended February 28, 2011, the Fund entered into 284 written call options contracts and 46 purchased put options contracts.
Effects of Derivative Transactions in the Financial Statements
The following table is a summary of the value of the Fund's derivative instruments as of February 28, 2011:
| Fair Value of Derivative Instruments | |
| Statement of Assets and Liabilities | |
| Assets | | Fair Value | | Liabilities | | Fair Value | |
Unrealized Appreciation on Forward Foreign
Currency Exchange Contracts | | $ | 18,815 | | | Unrealized Depreciation on Forward Foreign
Currency Exchange Contracts | | $ | 11,771 | | |
The effect of derivative instruments on the Fund's Statement of Operations for the year ended February 28, 2011:
| | | Amount of Realized Gain or (Loss)
and Change in Unrealized Appreciation
(Depreciation) on Derivatives Recognized in Income | |
| | | Risk Exposure | | Net Realized
Gain (Loss) | | Change in
Unrealized
Appreciation
(Depreciation) | |
| Forward Foreign Currency Exchange Contracts | | Foreign Exchange Rate Risk | | $ | (51,242 | ) | | $ | 51,736 | | |
| Written Options | | Equity Risk | | | 3,241 | | | | (111 | ) | |
| Purchased Put Options | | Equity Risk | | | (11,939 | ) | | | — | | |
20
Columbia Overseas Value Fund, February 28, 2011
Repurchase Agreements
The Fund may engage in repurchase agreement transactions with institutions that the Investment Manager has determined are creditworthy. The Fund, through the custodian, receives delivery of the underlying securities collateralizing a repurchase agreement. The Investment Manager is responsible for determining that the collateral is at least equal, at all times, to the value of the repurchase obligation including interest. A repurchase agreement transaction involves certain risks in the event of default or insolvency of the counterparty. These risks include possible delays in or restrictions on the Fund's ability to dispose of the underlying securities and a possible decline in the value of the underlying securities during the period while the Fund seeks to assert its rights.
Security Transactions
Security transactions are accounted for on the trade date. Cost is determined and gains (losses) are based upon the specific identification method for both financial statement and federal income tax purposes.
Income Recognition
Interest income is recorded on the accrual basis.
Corporate actions and dividend income are recorded net of any non-reclaimable tax withholdings, on the ex-dividend date or upon receipt of ex-dividend notification in the case of certain foreign securities.
Expenses
General expenses of the Trust are allocated to the Fund and other series of the Trust based upon relative net assets or other expense allocation methodologies determined by the nature of the expense. Expenses directly attributable to the Fund are charged to the Fund.
Federal Income Tax Status
The Fund intends to qualify each year as a regulated investment company under Subchapter M of the Internal Revenue Code, as amended, and will distribute substantially all of its taxable income, if any, for its tax year, and as such will not be subject to federal income taxes. In addition, the Fund intends to distribute in each calendar year substantially all of its net investment income, capital gains and certain other amounts, if any, such that the Fund should not be subject to federal excise tax. Therefore, no federal income or excise tax provision is recorded.
Foreign Taxes
The Fund may be subject to foreign taxes on income, gains on investments or currency repatriation, a portion of which may be recoverable. The Fund will accrue such taxes and recoveries as applicable, based upon its current interpretation of tax rules and regulations that exist in the markets in which it invests.
Realized gains in certain countries may be subject to foreign taxes at the Fund level, at rates ranging from approximately 10% to 15%. The Fund accrues for such foreign taxes on net realized and unrealized gains at the appropriate rate for each jurisdiction.
Distributions to Shareholders
Distributions from net investment income, if any, are declared and paid annually. The Fund may, however, declare and pay distributions from net investment income more frequently. The Fund will distribute net realized capital gains (including net short-term capital gains) at least annually after the fiscal year in which the capital gains were earned, unless offset by any available capital loss carryforward. Income distributions and capital gain distributions are determined in accordance with federal income tax regulations which may differ from GAAP.
Indemnification
In the normal course of business, the Fund enters into contracts that contain a variety of representations and warranties and which provide general indemnities. The Fund's maximum exposure under these arrangements is unknown because this would involve future claims against the Fund. Also, under the Trust's organizational documents and by contract, the Trustees and officers of the Trust are indemnified against certain liabilities that may arise out of actions relating to their duties to the Trust. However, based on experience, the Fund expects the risk of loss due to these representations, warranties and indemnities to be minimal.
Note 3. Fees and Compensation Paid to Affiliates
Investment Management Services Fee
The Investment Manager determines which securities will be purchased, held or sold. The management fee is based on the annual rate of 0.82% of the Fund's average daily net assets.
Prior to the Closing, Columbia Management Advisors, LLC (Columbia), an indirect, wholly owned subsidiary of Bank of America Corporation (BOA), provided investment management services to the Fund under the same fee structure.
21
Columbia Overseas Value Fund, February 28, 2011
Administration Fee
Effective upon the Closing, the Investment Manager became the administrator of the Fund and provides administrative and other services to the Fund, including services previously performed under the Pricing and Bookkeeping Oversight and Services Agreement discussed below. The administration fee is based on the annual rate of 0.05% of the Fund's average daily net assets, less the fees payable by the Fund as described under the Pricing and Bookkeeping Fees note below (Pricing and Bookkeeping fees). In the event the administration fee paid to the Investment Manager is not sufficient to cover the Pricing and Bookkeeping fees, the Investment Manager pays the additional Pricing and Bookkeeping fees on behalf of the Fund. Prior to the Closing, Columbia provided administrative services to the Fund at the same fee rate.
Pricing and Bookkeeping Fees
Prior to the Closing, the Fund entered into a Financial Reporting Services Agreement (the Financial Reporting Services Agreement) with State Street Bank and Trust Company (State Street) and Columbia pursuant to which State Street provides financial reporting services to the Fund. The Fund also entered into an Accounting Services Agreement (collectively with the Financial Reporting Services Agreement, the State Street Agreements) with State Street and Columbia pursuant to which State Street provides accounting services to the Fund. Upon the Closing, Columbia assigned and delegated its rights and obligations under the State Street Agreements to the Investment Manager. Under the State Street Agreements, the Fund pays State Street an annual fee of $38,000 paid monthly plus an additional monthly fee based on an annualized percentage rate of average daily net assets of the Fund for the month. The aggregate fee will not exceed $140,000 per year (exclusive of out-of-pocket expenses and charges). The Fund also reimburses State Street for certain out-of-pocket expenses and charges.
Also prior to the Closing, the Fund entered into a Pricing and Bookkeeping Oversight and Services Agreement (the Services Agreement) with Columbia. Under the Services Agreement, Columbia provided services related to Fund expenses and the requirements of the Sarbanes-Oxley Act of 2002, and provided oversight of the accounting and financial reporting services provided by State Street. Under the Services Agreement, the Fund reimbursed Columbia for out-of-pocket expenses and charges, including fees payable to third parties, such as for pricing the Fund's portfolio securities, incurred by Columbia in the performance of services under the Services Agreement. The Services Agreement was terminated upon the Closing. These services are now provided under the Administration Fee note discussed above.
Transfer Agent Fee
In connection with the Closing, RiverSource Service Corporation, a wholly owned subsidiary of Ameriprise Financial, became the transfer agent of the Fund and changed its name to Columbia Management Investment Services Corp. (the New Transfer Agent). The New Transfer Agent has contracted with Boston Financial Data Services (BFDS) to serve as sub-transfer agent. The New Transfer Agent receives monthly account-based service fees based on the number of open accounts and asset-based fees, calculated based on assets held in omnibus accounts, which are intended to reimburse the New Transfer Agent for certain sub-transfer agent fees (exclusive of BFDS fees). The New Transfer Agent pays the fees of BFDS for services as sub-transfer agent and is not entitled to reimbursement for such fees from the Fund.
The New Transfer Agent receives reimbursement for certain out-of-pocket expenses and may also receive compensation for various shareholder services.
Prior to the Closing, Columbia Management Services, Inc., an affiliate of Columbia and an indirect, wholly owned subsidiary of BOA, provided shareholder services to the Fund and contracted with BFDS to serve as sub-transfer agent, under the same fee structure.
For the year ended February 28, 2011, the Fund's effective transfer agent fee rate for was less than 0.01% of the Fund's average daily net assets.
An annual minimum account balance fee of $20 may apply to certain accounts with a value below the Fund's initial minimum investment requirements to reduce the impact of small accounts on transfer agent fees. These minimum account balance fees are recorded as part of expense reductions on the Statement of Operations. For the year ended February 28, 2011, no minimum account balance fees were charged by the Fund.
Underwriting Discounts, Service and Distribution Fees
In connection with the Closing, RiverSource Fund Distributors, Inc., an indirect wholly owned subsidiary of Ameriprise Financial, became the distributor of the Fund and changed its name to Columbia Management Investment Distributors, Inc. (the New Distributor).
22
Columbia Overseas Value Fund, February 28, 2011
Prior to the Closing, Columbia Management Distributors, Inc., an affiliate of Columbia and an indirect, wholly owned subsidiary of BOA, was the principal underwriter of the Fund's shares. There were no changes to the underwriting discount structure of the Fund or the service or distribution fee rates paid by the Fund as a result of the Transaction.
Expense Limits and Fee Waivers
Effective May 1, 2010, the Investment Manager has voluntarily agreed to reimburse a portion of the Fund's expenses so that the Fund's ordinary operating expenses (excluding any distribution and service fees, brokerage commissions, interest, taxes and extraordinary expenses, but including custodian charges relating to overdrafts, if any), after giving effect to any balance credits from the Fund's custodian, do not exceed 1.15% annually of the Fund's average daily net assets. This arrangement may be modified or terminated by the Investment Manager at any time. Prior to May 1, 2010, Columbia voluntarily reimbursed a portion of the Fund's expenses in the same manner.
Fees Paid to Officers and Trustees
In connection with the Closing, all officers of the Fund are employees of the Investment Manager or its affiliates and, with the exception of the Fund's Chief Compliance Officer, receive no compensation from the Fund. The Board of Trustees has appointed a Chief Compliance Officer to the Fund in accordance with federal securities regulations. The Fund, along with other affiliated funds, pays its pro-rata share of the expenses associated with the Chief Compliance Officer. The Fund's expenses for the Chief Compliance Officer will not exceed $15,000 per year. Prior to the Closing, all officers of the Fund were employees of Columbia or its affiliates and the Fund paid its pro-rata share of the expenses for the Chief Compliance Officer under the same fee structure.
Trustees are compensated for their services to the Fund, as set forth on the Statement of Operations. The Trust's eligible Trustees may participate in a non-qualified deferred compensation plan which may be terminated at any time. Any payments to plan participants are paid solely out of the Fund's assets. Income earned on the plan participant's deferral account is based on the rate of return of the eligible mutual funds selected by the participant or, if no funds are selected, on the rate of return of Columbia Money Market Fund (formerly known as RiverSource Cash Management Fund). Prior to the Closing, if no funds were selected, income earned on the plan participant's deferral account was based on the rate of return of BofA Treasury Reserves. Trustees' fees deferred during the current period as well as any gains or losses on the trustees' deferred compensation balances as a result of market fluctuations are included in "Trustees' fees" on the Statement of Operations. Liabilities under the deferred compensation plan are included in "Trustees' fees" on the Statement of Assets and Liabilities.
Note 4. Custody Credits
The Fund has an agreement with its custodian bank under which custody fees may be reduced by balance credits. These credits are recorded as part of expense reductions on the Statement of Operations. The Fund could have invested a portion of the assets utilized in connection with the expense offset arrangement in an income-producing asset if it had not entered into such an agreement. For the year ended February 28, 2011, these custody credits reduced total expenses by $10 for the Fund.
Note 5. Portfolio Information
The cost of purchases and proceeds from sales of securities, excluding short-term obligations, aggregated $3,743,390 and $3,772,908, respectively, for the year ended February 28, 2011.
Note 6. Redemption Fees
Effective March 1, 2010, the Fund no longer assesses a 2.00% redemption fee on the proceeds from Fund shares that are redeemed within 60 days of purchase. The redemption fee was designed to offset brokerage commissions and other costs associated with short term trading of fund shares. The redemption fees, which were retained by the Fund, were accounted for as an addition to paid-in capital and were allocated to each class based on the relative net assets at the time of the redemption.
Note 7. Shareholder Concentration
As of February 28, 2011, one shareholder account owned 100.0% of the outstanding shares of the Fund. Purchase and redemption activity of this account may have a significant effect on the operations of the Fund.
Note 8. Line of Credit
The Fund and other affiliated funds participate in a $280,000,000 committed, unsecured revolving line of credit provided by State Street. The maximum amount that may be borrowed by any fund is limited to the lesser of $200,000,000 and the Fund's borrowing limit set forth in the Fund's registration statement. Borrowings are available for short-term liquidity or temporary or emergency purposes.
23
Columbia Overseas Value Fund, February 28, 2011
Effective October 14, 2010, interest is charged to each participating fund based on the fund's borrowings at a rate per annum equal to the greater of the Federal Funds Rate plus 1.25% or the overnight LIBOR Rate plus 1.25%. In addition, a commitment fee of 0.125% per annum is accrued and apportioned among the participating funds pro rata based on their relative net assets.
Prior to October 14, 2010, interest was charged to each participating fund at the same rates. In addition, a commitment fee of 0.15% per annum was accrued and apportioned among the participating funds pro rata based on their relative net assets.
For the year ended February 28, 2011, the Fund did not borrow under these arrangements.
Note 9. Federal Tax Information
The timing and character of income and capital gain distributions are determined in accordance with income tax regulations, which may differ from GAAP. Reclassifications are made to the Fund's capital accounts for permanent tax differences to reflect income and gains available for distribution (or available capital loss carryforwards) under income tax regulations.
For the year ended February 28, 2011, permanent book and tax basis differences resulting primarily from differing treatments for foreign currency transactions and passive foreign investment companies (PFIC) adjustments were identified and reclassified among the components of the Fund's net assets as follows:
Overdistributed
Net Investment
Income | | Accumulated
Net Realized
Loss | | Paid-In Capital | |
| $ | (42,156 | ) | | $ | 46,189 | | | $ | (4,033 | ) | |
Net investment income and net realized gains (losses), as disclosed on the Statement of Operations, and net assets were not affected by this reclassification.
The tax character of distributions paid during the years ended February 28, 2011 and February 28, 2010 was as follows:
| | | February 28, | |
| Distributions paid from | | 2011 | | 2010 | |
| Ordinary Income* | | $ | 165,101 | | | $ | 293,672 | | |
* For tax purposes short-term capital gain distributions, if any, are considered ordinary income distributions.
As of February 28, 2011, the components of distributable earnings on a tax basis were as follows:
Undistributed
Ordinary
Income | | Undistributed
Long-Term
Capital Gains | | Net
Unrealized
Appreciation* | |
| $ | — | | | $ | — | | | $ | 744,921 | | |
* The differences between book-basis and tax-basis net unrealized appreciation are primarily due to deferral of losses from wash sales.
Unrealized appreciation and depreciation at February 28, 2011, based on cost of investments for federal income tax purposes and excluding any unrealized appreciation and depreciation from changes in the value of other assets and liabilities resulting from changes in exchange rates, were:
| Unrealized appreciation | | $ | 1,331,604 | | |
| Unrealized depreciation | | | (586,683 | ) | |
| Net unrealized appreciation | | $ | 744,921 | | |
The following capital loss carryforwards may be available to reduce taxable income arising from future net realized gains on investments, if any, to the extent permitted by the Internal Revenue Code:
| Year of Expiration | | Capital Loss
Carryforwards | |
| 2017 | | $ | 365,313 | | |
| 2018 | | | 2,028,503 | | |
| | | $ | 2,393,816 | | |
Capital loss carryforwards of $218,748 were utilized during the year ended February 28, 2011.
Under current tax rules, certain currency and capital losses realized after October 31 may be deferred and treated as occurring on the first day of the following fiscal year. As of February 28, 2011, post-October currency losses of $11,359 and capital losses of $181,219 attributed to security transactions were deferred to March 1, 2011.
Management is required to determine whether a tax position of the Fund is more likely than not to be sustained upon examination by the applicable taxing authority, including resolution of any related appeals or litigation processes, based on the technical merits of the position. The tax benefit to be recognized by the Fund is measured
24
Columbia Overseas Value Fund, February 28, 2011
as the largest amount of benefit that is greater than fifty percent likely of being realized upon ultimate settlement. Management is not aware of any tax positions for which it is reasonably possible that the total amounts of unrecognized tax benefits will significantly change in the next twelve months. However, management's conclusions may be subject to review and adjustment at a later date based on factors including, but not limited to, new tax laws, regulations, and administrative interpretations (including relevant court decisions). The Fund's federal tax returns for the prior three fiscal years remain subject to examination by the Internal Revenue Service.
Note 10. Significant Risks and Contingencies
Foreign Securities Risk
Investing in foreign securities may include certain risks and considerations not typically associated with investing in U.S. securities, such as fluctuating currency values and changing local and regional economic, political and social conditions, which may result in greater market volatility. In addition, certain foreign securities may not be as liquid as U.S. securities. Investing in emerging markets may accentuate these risks.
Investments in emerging market countries are subject to additional risk. The risk of foreign investments is typically increased in less developed countries. These countries are also more likely to experience high levels of inflation, deflation or currency devaluation which could hurt their economies and securities markets.
Note 11. Subsequent Events
Management has evaluated the events and transactions that have occurred through the date the financial statements were issued and noted no items requiring adjustment of the financial statements or additional disclosure.
Note 12. Information Regarding Pending and Settled Legal Proceedings
In June 2004, an action captioned John E. Gallus et al. v. American Express Financial Corp. and American Express Financial Advisors Inc. was filed in the United States District Court for the District of Arizona. The plaintiffs allege that they are investors in several American Express Company (now known as RiverSource) mutual funds and they purport to bring the action derivatively on behalf of those funds under the Investment Company Act of 1940. The plaintiffs allege that fees allegedly paid to the defendants by the funds for investment advisory and administrative services are excessive. The plaintiffs seek remedies including restitution and rescission of investment advisory and distribution agreements. The plaintiffs voluntarily agreed to transfer this case to the United States District Court for the District of Minnesota (the District Court). In response to defendants' motion to dismiss the complaint, the District Court dismissed one of plaintiffs' four claims and granted plaintiffs limited discovery. Defendants moved for summary judgment in April 2007. Summary judgment was granted in the defendants' favor on July 9, 2007. The plaintiffs filed a notice of appeal with the Eighth Circuit Court of Appeals (the Eighth Circuit) on August 8, 2007. On April 8, 2009, the Eighth Circuit reversed summary judgment and remanded to the District Court for further proceedings. On August 6, 2009, defendants filed a writ of certiorari with the U.S. Supreme Court (the Supreme Court), asking the Supreme Court to stay the District Court proceedings while the Supreme Court considers and rules in a case captioned Jones v. Harris Associates, which involves issues of law similar to those presented in the Gallus case. On March 30, 2010, the Supreme Court issued its ruling in Jones v. Harris Associates, and on April 5, 2010, the Supreme Court vacated the Eighth Circuit's decision in the Gallus case and remanded the case to the Eighth Circuit for further consideration in light of the Supreme Court's decision in Jones v. Harris Associates. On June 4, 2010, the Eighth Circuit remanded the Gallus case to the District Court for further consideration in light of the Supreme Court's decision in Jones v. Harris Associates. On December 9, 2010, the District Court reinstated its July 9, 2007 summary judgment order in favor of the defendants. On January 10, 2011, plaintiffs filed a notice of appeal with the Eighth Circuit.
In December 2005, without admitting or denying the allegations, American Express Financial Corporation (AEFC, which is now known as Ameriprise Financial, Inc. (Ameriprise Financial)), entered into settlement agreements with the Securities and Exchange Commission (SEC) and Minnesota Department of Commerce (MDOC) related to market timing activities. As a result, AEFC was censured and ordered to cease and desist from committing or causing any violations of certain provisions of the Investment Advisers Act of 1940, the Investment Company Act of 1940, and various Minnesota laws. AEFC agreed to pay disgorgement of $10 million and civil money penalties of $7 million. AEFC also agreed to retain an independent distribution consultant to assist in developing a plan for distribution of all disgorgement and civil penalties ordered by the SEC in accordance with various undertakings detailed at http://www.sec.gov/litigation/admin/ia-2451.pdf. Ameriprise Financial and its affiliates have cooperated with the SEC and the
25
Columbia Overseas Value Fund, February 28, 2011
MDOC in these legal proceedings, and have made regular reports to the funds' Boards of Directors/Trustees.
Ameriprise Financial and certain of its affiliates have historically been involved in a number of legal, arbitration and regulatory proceedings, including routine litigation, class actions, and governmental actions, concerning matters arising in connection with the conduct of their business activities. Ameriprise Financial believes that the Funds are not currently the subject of, and that neither Ameriprise Financial nor any of its affiliates are the subject of, any pending legal, arbitration or regulatory proceedings that are likely to have a material adverse effect on the Funds or the ability of Ameriprise Financial or its affiliates to perform under their contracts with the Funds. Ameriprise Financial is required to make 10-Q, 10-K and, as necessary, 8-K filings with the Securities and Exchange Commission on legal and regulatory matters that relate to Ameriprise Financial and its affiliates. Copies of these filings may be obtained by accessing the SEC website at www.sec.gov.
There can be no assurance that these matters, or the adverse publicity associated with them, will not result in increased fund redemptions, reduced sale of fund shares or other adverse consequences to the Funds. Further, although we believe proceedings are not likely to have a material adverse effect on the Funds or the ability of Ameriprise Financial or its affiliates to perform under their contracts with the Funds, these proceedings are subject to uncertainties and, as such, we are unable to estimate the possible loss or range of loss that may result. An adverse outcome in one or more of these proceedings could result in adverse judgments, settlements, fines, penalties or other relief that could have a material adverse effect on the consolidated financial condition or results of operations of Ameriprise Financial.
26
Report of Independent Registered Public Accounting Firm
To the Trustees of Columbia Funds Series Trust and the Shareholders of Columbia Overseas Value Fund
In our opinion, the accompanying statement of assets and liabilities, including the investment portfolio, and the related statements of operations and of changes in net assets and the financial highlights present fairly, in all material respects, the financial position of Columbia Overseas Value Fund (the "Fund") (a series of Columbia Funds Series Trust) at February 28, 2011, and the results of its operations, the changes in its net assets, and the financial highlights for the periods indicated, in conformity with accounting principles generally accepted in the United States of America. These financial statements and financial highlights (hereafter referred to as "financial statements") are the responsibility of the Fund's management. Our responsibility is to express an opinion on these financial statements based on our audits. We conducted our audits of these financial statements in accordance with the standards of the Public Company Accounting Oversight Board (United States). Those standards require that we plan and perform the audit to obtain reasonable assurance about whether the financial statements are free of material misstatement. An audit includes examining, on a test basis, evidence supporting the amounts and disclosures in the financial statements, assessing the accounting principles used and significant estimates made by management, and evaluating the overall financial statement presentation. We believe that our audits, which included confirmation of securities at February 28, 2011 by correspondence with the custodian and brokers, provide a reasonable basis for our opinion.
PricewaterhouseCoopers LLP
Boston, Massachusetts
April 21, 2011
27
Federal Income Tax Information (Unaudited) – Columbia Overseas Value Fund
Foreign taxes paid during the fiscal year ended February 28, 2011, of $24,610 are being passed through to shareholders. This represents $0.02 per share. Eligible shareholders may claim this amount as a foreign tax credit.
Gross income derived from sources within foreign countries was $285,012 ($0.26 per share) for the fiscal year ended February 28, 2011.
For non-corporate shareholders 100.00% or the maximum amount allowable under the Jobs and Growth Tax Relief Reconciliation Act of 2003, of the ordinary income distributed by the Fund for the fiscal year February 28, 2011 may represent qualified dividend income.
The Fund will notify shareholders in January 2012 of amounts for use in preparing 2011 income tax returns.
28
Fund Governance
The Trustees serve terms of indefinite duration. The names, addresses and birth years of the Trustees and Officers of the Funds in the Columbia Funds Series Trust, the year each was first elected or appointed to office, their principal business occupations during at least the last five years, the number of Funds overseen by each Trustee and other directorships they hold are shown below. Each officer listed below serves as an officer of each Fund in the Columbia Funds Series Trust.
Independent Trustees
Name, Address and Year of Birth,
Position with Funds, Year First
Elected or Appointed to Office | | Principal Occupation(s) During Past Five Years, Number of Funds in the Columbia
Funds Complex Overseen by Trustee, Other Directorships Held
| |
| Edward J. Boudreau, Jr. (Born 1944) | |
|
c/o Columbia Management
Investment Advisers, LLC
225 Franklin Street
Boston, MA 02110
Trustee (since 2005) | | Managing Director—E.J. Boudreau & Associates (consulting), from 2000 through current; oversees 44; Trustee—BofA Funds Series Trust. | |
|
| William P. Carmichael (Born 1943) | |
|
c/o Columbia Management
Investment Advisers, LLC
225 Franklin Street
Boston, MA 02110
Trustee (since 1999) | | Retired; Oversees 44; Director—Cobra Electronics Corporation (electronic equipment manufacturer); Director—McMoRan Exploration Company (oil and gas exploration and development); Director—The Finish Line (athletic shoes and apparel); Trustee—BofA Funds Series Trust; Former Director—Simmons Company (bedding). | |
|
| William A. Hawkins (Born 1942) | |
|
c/o Columbia Management
Investment Advisers, LLC
225 Franklin Street
Boston, MA 02110
Trustee (since 2005) | | Managing Director—Overton Partners (financial consulting), August 2010 to present; President and Chief Executive Officer—California General Bank, N.A., from January 2008 through August 2010; oversees 44; Trustee—BofA Funds Series Trust. | |
|
| R. Glenn Hilliard (Born 1943) | |
|
c/o Columbia Management
Investment Advisers, LLC
225 Franklin Street
Boston, MA 02110
Trustee (since 2005) | | Chairman and Chief Executive Officer—Hilliard Group LLC (investing and consulting), from April 2003 through current; Non-Executive Director & Chairman—CNO Financial, Inc. (formerly Conseco, Inc.) (insurance), September 2003 through current; Executive Chairman—Conseco, Inc. (insurance), August 2004 through September 2005; oversees 44; Trustee—BofA Funds Series Trust. | |
|
| John J. Nagorniak (Born 1944) | |
|
c/o Columbia Management
Investment Advisers, LLC
225 Franklin Street
Boston, MA 02110
Trustee (since 2008) | | Retired; President and Director—Foxstone Financial, Inc. (consulting), 2000 through December 2007; Director—Mellon Financial Corporation affiliates (investing), 2000 through 2007; Chairman—Franklin Portfolio Associates (investing—Mellon affiliate), 1982 through 2007; oversees 44; Director—MIT Investment Company; Trustee—MIT 401k Plan. | |
|
29
Fund Governance (continued)
Independent Trustees (continued)
Name, Address and Year of Birth,
Position with Funds, Year First
Elected or Appointed to Office | | Principal Occupation(s) During Past Five Years, Number of Funds in the Columbia
Funds Complex Overseen by Trustee, Other Directorships Held
| |
| Minor M. Shaw (Born 1947) | |
|
c/o Columbia Management
Investment Advisers, LLC
225 Franklin Street
Boston, MA 02110
Trustee (since 2003) | | President—Micco Corporation and Mickel Investment Group; oversees 44; Board Member—Piedmont Natural Gas; Trustee—BofA Funds Series Trust. | |
|
Interested Trustee
| Anthony M. Santomero1 (Born 1946) | |
|
c/o Columbia Management
Investment Advisers, LLC
225 Franklin Street
Boston, MA 02110
Trustee (since 2008) | | Richard K. Mellon Professor Emeritus of Finance, The Wharton School, University of Pennsylvania, from 2002 through current; Senior Advisor—McKinsey & Company (consulting), July 2006 through January 2008; President and Chief Executive Officer—Federal Reserve Bank of Philadelphia, July 2000 through April 2006; oversees 44; Director—Renaissance Reinsurance Ltd; Trustee—Penn Mutual Life Insurance Company; Director—Citigroup, Inc.; Citibank, N.A.; Trustee—BofA Funds Series Trust. | |
|
1 Dr. Santomero is currently deemed by the Columbia Funds to be an "interested person" (as defined in the 1940 Act) of the Funds because he serves as a Director of Citigroup, Inc. and Citibank N.A., companies that may directly or through subsidiaries and affiliates engage from time-to-time in brokerage execution, principal transactions and lending relationships with the Columbia Funds or other funds or accounts advised/managed by the Adviser.
The Statement of Additional Information includes additional information about the Trustees of the Funds and is available, without charge, upon request by calling 800-345-6611.
Officers
| Name, Year of Birth and Address | | Principal Occupation(s) During the Past Five Years | |
| J. Kevin Connaughton (Born 1964) | |
|
225 Franklin Street
Boston, MA 02110
President (since 2009) | | Senior Vice President and General Manager—Mutual Fund Products, Columbia Management Investment Advisers, LLC since May 2010; President, Columbia Funds, since 2009, and RiverSource Funds, since May 2010 (previously Senior Vice President and Chief Financial Officer, Columbia Funds, from June 2008 to January 2009, Treasurer, Columbia Funds, from October 2003 to May 2008, and senior officer of various other affiliated funds since 2000); Managing Director, Columbia Management Advisors, LLC from December 2004 to April 2010. | |
|
| Michael G. Clarke (Born 1969) | |
|
225 Franklin Street
Boston, MA 02110
Senior Vice President and
Chief Financial Officer (since 2009) | | Vice President, Columbia Management Investment Advisers, LLC since May 2010; Managing Director of Fund Administration, Columbia Management Advisors, LLC, from September 2004 to April 2010; senior officer of Columbia Funds and affiliated funds since 2002. | |
|
30
Fund Governance (continued)
Officers (continued)
| Name, Year of Birth and Address | | Principal Occupation(s) During the Past Five Years | |
| Scott R. Plummer (Born 1959) | |
|
5228 Ameriprise Financial Center
Minneapolis, MN 55474
Senior Vice President, Secretary and Chief Legal Officer (since 2010) | | Chief Legal Officer and Assistant Secretary, Columbia Management Investment Advisers, LLC since June 2005; Vice President and Lead Chief Counsel—Asset Management, Ameriprise Financial, Inc. since May 2010 (previously Vice President and Chief Counsel—Asset Management, from 2005 to April 2010, and Vice President—Asset Management Compliance from 2004 to 2005); Vice President, Chief Counsel and Assistant Secretary, Columbia Management Investment Distributors, Inc. since 2008; Vice President, General Counsel and Secretary, Ameriprise Certificate Company since 2005; Chief Counsel, RiverSource Distributors, Inc. since 2006; Vice President, General Counsel and Secretary, RiverSource Funds, since December 2006; Senior Vice President, Secretary and Chief Legal Officer, Columbia Funds, since May 2010. | |
|
| Linda J. Wondrack (Born 1964) | |
|
225 Franklin Street
Boston, MA 02110
Senior Vice President and
Chief Compliance Officer (since 2007) | | Vice President and Chief Compliance Officer, Columbia Management Investment Advisers, LLC since May 2010; Chief Compliance Officer, Columbia Funds, since 2007, and RiverSource Funds, since May 2010; Director (Columbia Management Group, LLC and Investment Product Group Compliance), Bank of America, from June 2005 to April 2010. | |
|
| William F. Truscott (Born 1960) | |
|
53600 Ameriprise Financial Center
Minneapolis, MN 55474
Senior Vice President (since 2010) | | Chairman of the Board, Columbia Management Investment Advisers, LLC since May 2010 (previously President, Chairman of the Board and Chief Investment Officer, from 2001 to April 2010); Chief Executive Officer, U.S. Asset Management & President, Annuities, Ameriprise Financial, Inc. since May 2010 (previously President—U.S. Asset Management and Chief Investment Officer from 2005 to April 2010, and Senior Vice President—Chief Investment Officer, from 2001 to 2005); Director, President and Chief Executive Officer, Ameriprise Certificate Company since 2006; Director, Columbia Management Investment Distributors, Inc. since May 2010 (previously Chairman of the Board and Chief Executive Officer from 2008 to April 2010); Chairman of the Board and Chief Executive Officer, RiverSource Distributors, Inc. since 2006. | |
|
| Colin Moore (Born 1958) | |
|
225 Franklin Street
Boston, MA 02110
Senior Vice President (since 2010) | | Director and Chief Investment Officer, Columbia Management Investment Advisers, LLC since May 2010; Manager, Managing Director and Chief Investment Officer of Columbia Management Advisors, LLC from 2007 to April 2010; Head of Equities, Columbia Management Advisors, LLC from 2002 to 2007. | |
|
| Michael A. Jones (Born 1959) | |
|
225 Franklin Street
Boston, MA 02110
Senior Vice President (since 2010) | | President and Director, Columbia Management Investment Advisers, LLC since May 2010; President and Director, Columbia Management Investment Distributors, Inc. since May 2010; Manager, Chairman, Chief Executive Officer and President, Columbia Management Advisors, LLC from 2007 to April 2010; Chief Executive Officer, President and Director, Columbia Management Distributors, Inc. from November 2006 to April 2010; previously, co-president and senior managing director at Robeco Investment Management. | |
|
31
Fund Governance (continued)
Officers (continued)
| Name, Year of Birth and Address | | Principal Occupation(s) During the Past Five Years | |
| Amy Johnson (Born 1965) | |
|
5228 Ameriprise Financial Center
Minneapolis, MN 55474
Senior Vice President (since 2010) | | Senior Vice President and Chief Operating Officer, Columbia Management Investment Advisers, LLC since May 2010 (previously Chief Administrative Officer, from 2009 until April 2010, Vice President—Asset Management and Trust Company Services, from 2006 to 2009, and Vice President—Operations and Compliance from 2004 to 2006). | |
|
| Joseph F. DiMaria (Born 1968) | |
|
225 Franklin Street
Boston, MA 02110
Treasurer (since 2010) and
Chief Accounting Officer (since 2008) | | Vice President, Mutual Fund Administration, Columbia Management Investment Advisers, LLC, since May 2010; Director of Fund Administration, Columbia Management Advisors, LLC from January 2006 to April 2010; Head of Tax/Compliance and Assistant Treasurer, Columbia Management Advisors, LLC, from November 2004 to December 2005. | |
|
| Marybeth Pilat (Born 1968) | |
|
225 Franklin Street
Boston, MA 02110
Deputy Treasurer (since 2010) | | Vice President, Mutual Fund Administration, Columbia Management Investment Advisers, LLC, since May 2010; Vice President, Investment Operations, Bank of America, from October 2008 to April 2010; Finance Manager, Boston Children's Hospital from August 2008 to October 2008; Director, Mutual Fund Administration, Columbia Management Advisors, LLC, from May 2007 to July 2008; Vice President, Mutual Fund Valuation, Columbia Management Advisors, LLC, from January 2006 to May 2007; Vice President, Mutual Fund Accounting Oversight, Columbia Management Advisors, LLC from January 2005 to January 2006. | |
|
| Julian Quero (Born 1967) | |
|
225 Franklin Street
Boston, MA 02110
Deputy Treasurer (since 2008) | | Vice President, Mutual Fund Administration, Columbia Management Investment Advisers, LLC since May 2010; Director of Fund Administration, Columbia Management Advisors, LLC, from August 2008 to April 2010; Senior Tax Manager, Columbia Management Advisors, LLC from August 2006 to July 2008; Senior Compliance Manager, Columbia Management Advisors, LLC from April 2002 to August 2006. | |
|
| Stephen T. Welsh (Born 1957) | |
|
225 Franklin Street
Boston, MA 02110
Vice President (since 2006) | | President and Director, Columbia Management Investment Services Corp. since May 2010; President and Director, Columbia Management Services, Inc. from July 2004 to April 2010; Managing Director, Columbia Management Distributors, Inc. from August 2007 to April 2010. | |
|
32
Shareholder Meeting Results
At a Joint Special Meeting of Shareholders held on February 15, 2011, shareholders of the series of Columbia Funds Series Trust, including the Fund, elected each of the nominees for trustees to the Board of Trustees of Columbia Funds Series Trust, each to hold office for an indefinite term, as follows:
| Trustee | | Votes For | | Votes Withheld | | Abstentions | |
| Kathleen Blatz | | | 2,145,636,122 | | | | 248,012,438 | | | | 0 | | |
| Edward J. Boudreau, Jr. | | | 2,145,430,114 | | | | 248,218,446 | | | | 0 | | |
| Pamela G. Carlton | | | 2,145,515,949 | | | | 248,132,612 | | | | 0 | | |
| William P. Carmichael | | | 2,145,038,695 | | | | 248,609,866 | | | | 0 | | |
| Patricia M. Flynn | | | 2,145,843,563 | | | | 247,804,997 | | | | 0 | | |
| William A. Hawkins | | | 2,145,359,401 | | | | 248,289,160 | | | | 0 | | |
| R. Glenn Hilliard | | | 2,145,079,400 | | | | 248,569,161 | | | | 0 | | |
| Stephen R. Lewis, Jr. | | | 2,145,092,209 | | | | 248,556,351 | | | | 0 | | |
| John F. Maher | | | 2,145,621,338 | | | | 248,027,223 | | | | 0 | | |
| John J. Nagorniak | | | 2,145,337,494 | | | | 248,311,067 | | | | 0 | | |
| Catherine James Paglia | | | 2,145,615,254 | | | | 248,033,306 | | | | 0 | | |
| Leroy C. Richie | | | 2,145,042,120 | | | | 248,606,441 | | | | 0 | | |
| Anthony M. Santomero | | | 2,145,088,174 | | | | 248,560,386 | | | | 0 | | |
| Minor M. Shaw | | | 2,145,430,762 | | | | 248,217,798 | | | | 0 | | |
| Alison Taunton-Rigby | | | 2,145,393,384 | | | | 248,255,177 | | | | 0 | | |
| William F. Truscott | | | 2,144,907,223 | | | | 248,741,338 | | | | 0 | | |
33
This page intentionally left blank.
This page intentionally left blank.
This page intentionally left blank.
Important Information About This Report
The fund mails one shareholder report to each shareholder address. If you would like more than one report, please call shareholder services at 1-800-345-6611 and additional reports will be sent to you. This report has been prepared for shareholders of Columbia Overseas Value Fund.
A description of the policies and procedures that the fund uses to determine how to vote proxies and a copy of the fund's voting records are available (i) at www.columbiamanagement.com, (ii) on the Securities and Exchange Commission's website at www.sec.gov, and (iii) without charge, upon request, by calling 1-800-368-0346. Information regarding how the fund voted proxies relating to portfolio securities during the 12-month period ended June 30 is available from the SEC's website. Information regarding how the fund voted proxies relating to portfolio securities is also available from the fund's website, www.columbiamanagement.com.
The fund files a complete schedule of portfolio holdings with the SEC for the first and third quarters of each fiscal year on Form N-Q. The fund's Form N-Q is available on the SEC's website at www.sec.gov and may be reviewed and copied at the SEC's Public Reference Room in Washington, D.C. Information on the operation of the Public Reference Room may be obtained by calling 1-800-SEC-0330.
Transfer Agent
Columbia Management Investment
Services Corp.
P.O. Box 8081
Boston, MA 02266-8081
1-800-345-6611
Distributor
Columbia Management Investment
Distributors, Inc.
225 Franklin Street
Boston, MA 02110
Investment Manager
Columbia Management Investment
Advisers, LLC
225 Franklin Street
Boston, MA 02110
37

PRSRT STD
U.S. Postage
PAID
Holliston, MA
Permit NO. 20
Columbia Overseas Value Fund
P. O. Box 8081
Boston, MA 02266-8081
columbiamanagement.com
This information is for use with concurrent or prior delivery of a fund prospectus. Investors should consider the investment objectives, risks, charges and expenses of a mutual fund carefully before investing. For a free prospectus, which contains this and other important information about the funds, visit columbiamanagement.com. Read the prospectus carefully before investing. The Fund is distributed by Columbia Management Investment Distributors, Inc., member FINRA, and managed by Columbia Management Investment Advisers, LLC.
© 2011 Columbia Management Investment Advisers, LLC. All rights reserved.
C-1256 A (04/11)

Columbia Convertible Securities Fund
Annual Report for the Period Ended February 28, 2011
Not FDIC insured • No bank guarantee • May lose value
Table of Contents
| Fund Profile | | | 1 | | |
|
| Economic Update | | | 2 | | |
|
| Performance Information | | | 4 | | |
|
| Understanding Your Expenses | | | 5 | | |
|
| Portfolio Managers' Report | | | 6 | | |
|
| Investment Portfolio | | | 8 | | |
|
Statement of Assets and
Liabilities | | | 15 | | |
|
| Statement of Operations | | | 17 | | |
|
Statement of Changes in
Net Assets | | | 18 | | |
|
| Financial Highlights | | | 20 | | |
|
| Notes to Financial Statements | | | 25 | | |
|
Report of Independent Registered
Public Accounting Firm | | | 32 | | |
|
| Federal Income Tax Information | | | 33 | | |
|
| Fund Governance | | | 34 | | |
|
Board Consideration and Approval
of Amendment to Investment
Management Services Agreement | | | 38 | | |
|
Summary of Management Fee
Evaluation by Independent
Fee Consultant | | | 42 | | |
|
| Shareholder Meeting Results | | | 45 | | |
|
Important Information About
This Report | | | 49 | | |
|
The views expressed in this report reflect the current views of the respective parties. These views are not guarantees of future performance and involve certain risks, uncertainties and assumptions that are difficult to predict, so actual outcomes and results may differ significantly from the views expressed. These views are subject to change at any time based upon economic, market or other conditions and the respective parties disclaim any responsibility to update such views. These views may not be relied on as investment advice and, because investment decisions for a Columbia Fund are based on numerous factors, may not be relied on as an indication of trading intent on behalf of any particular Columbia Fund. References to specific securities should not be construed as a recommendation or investment advice.
President's Message

Dear Shareholder:
The Columbia Management story began over 100 years ago, and today, we are one of the nation's largest dedicated asset managers. The recent acquisition by Ameriprise Financial, Inc. brings together the talents, resources and capabilities of Columbia Management with those of RiverSource Investments, Threadneedle (acquired by Ameriprise in 2003) and Seligman Investments (acquired by Ameriprise in 2008) to build a best-in-class asset management business that we believe is truly greater than its parts.
RiverSource Investments traces its roots to 1894 when its then newly-founded predecessor, Investors Syndicate, offered a face-amount savings certificate that gave small investors the opportunity to build a safe and secure fund for retirement, education or other special needs. A mutual fund pioneer, Investors Syndicate launched Investors Mutual Fund in 1940. In the decades that followed, its mutual fund products and services lineup grew to include a full spectrum of styles and specialties. More than 110 years later, RiverSource continues to be a trusted financial products leader.
Threadneedle, a leader in global asset management and one of Europe's largest asset managers, offers sophisticated international experience from a dedicated U.K. management team. Headquartered in London, it is named for Threadneedle Street in the heart of the city's financial district, where British investors pioneered international and global investing. Threadneedle was acquired in 2003 and today operates as an affiliate of Columbia Management.
Seligman Investments' beginnings date back to the establishment of the investment firm J. & W. Seligman & Co. in 1864. In the years that followed, Seligman played a major role in the geographical expansion and industrial development of the United States. In 1874, President Ulysses S. Grant named Seligman as fiscal agent for the U.S. Navy—an appointment that would last through World War I. Seligman helped finance the westward path of the railroads and the building of the Panama Canal. The firm organized its first investment company in 1929 and began managing its first mutual fund in 1930. In 2008, J. & W. Seligman & Co. Incorporated was acquired and Seligman Investments became an offering brand of RiverSource Investments, LLC.
We are proud of the rich and distinctive history of these firms, the strength and breadth of products and services they offer, and the combined cultures of pioneering spirit and forward thinking. Together we are committed to providing more for our shareholders than ever before.
> A singular focus on our shareholders
Our business is asset management, so investors are our first priority. We dedicate our resources to identifying timely investment opportunities and provide a comprehensive choice of equity, fixed-income and alternative investments to help meet your individual needs.
> First-class research and thought leadership
We are dedicated to helping you take advantage of today's opportunities and anticipate tomorrow's. We stay abreast of the latest investment trends and ideas, using our collective insight to evaluate events and transform them into solutions you can use.
> A disciplined investment approach
We aren't distracted by passing fads. Our teams adhere to a rigorous investment process that helps ensure the integrity of our products and enables you and your financial advisor to match our solutions to your objectives with confidence.
When you choose Columbia Management, you can be confident that we will take the time to understand your needs and help you and your financial advisor identify the solutions that are right for you. Because at Columbia Management, we don't consider ourselves successful unless you are.
Sincerely,

J. Kevin Connaughton
President, Columbia Funds
Investors should consider the investment objectives, risks, charges and expenses of a mutual fund carefully before investing. For a free prospectus, which contains this and other important information about the funds, visit www.columbiamanagement.com. The prospectus should be read carefully before investing.
Columbia Funds are distributed by Columbia Management Investment Distributors, Inc., member FINRA, and managed by Columbia Management Investment Advisers, LLC.
© 2011 Columbia Management Investment Advisers, LLC. All rights reserved.
Fund Profile – Columbia Convertible Securities Fund
Summary
g For the 12-month period that ended February 28, 2011, the fund's Class A shares returned 24.72% without sales charge.
g The fund's return exceeded that of its benchmark, the BofAML All Convertibles All Qualities Index1 and the average return of its peer group, the Lipper Convertible Securities Funds Classification.2
g Solid security selection across a range of sectors and a focus on equity-sensitive convertibles at a time of rising stock prices fueled the period's impressive results.
Portfolio Management
David L. King, lead manager, has co-managed the fund since 2010. From March 2010 until joining Columbia Management Investment Advisers, LLC (the Investment Manager) in May 2010, Mr. King was associated with the fund's previous investment adviser as an investment professional.
Yan Jin has co-managed the fund since 2010. From 2006 until joining the Investment Manager in May 2010, Mr. Jin was associated with the fund's previous investment adviser as an investment professional.
1The BofAML All Convertibles All Qualities Index is a widely used index that measures convertible securities performance. It measures the performance of U.S. dollar-denominated convertible securities not currently in bankruptcy with a total market value greater than $50 million at issuance.
2Lipper Inc., a widely respected data provider in the industry, calculates an average total return (assuming reinvestment of distributions) for mutual funds with investment objectives similar to those of the fund. Lipper makes no adjustment for the effect of sales loads.
Indices are not available for investment, are not professionally managed and do not reflect sales charges, fees, brokerage commissions, taxes or other expenses of investing. Securities in the fund may not match those in an index.
Performance data quoted represents past performance and current performance may be lower or higher. Past performance is no guarantee of future results. The investment return and principal value will fluctuate so that shares, when redeemed, may be worth more or less than the original cost. Please visit www.columbiamanagement.com for daily and most recent month-end performance updates.
Summary
1-year return as of 02/28/11
| | | | +24.72% | |
|
|  | | | Class A shares
(without sales charge) | |
|
| | | | +20.90% | |
|
|  | | | BofAML All Convertibles
All Qualities Index | |
|
1
Economic Update – Columbia Convertible Securities Fund
Summary
For the 12-month period that ended February 28, 2011
g The U.S. stock market, as measured by the S&P 500 Index, delivered solid returns, despite a summer 2010 correction. Foreign stock market returns were generally in line with the U.S. market, as measured by the MSCI EAFE Index (Net).
| S&P Index | | MSCI Index | |
|
 | |  | |
|
g Strengthening economic growth and rising interest rates kept a lid on most bond market sectors. The Barclays Capital Aggregate Bond Index delivered modest results. However, high-yield bonds were strong performers, as measured by the JPMorgan Developed BB High Yield Index.
Barclays
Aggregate Index | | JPMorgan
Index | |
|
 | |  | |
|
The U.S. economy continued to expand at a modest pace over the past 12 months, as measured by gross domestic product (GDP). After a strong first quarter in 2010, GDP growth dropped to 1.7% in the second quarter and fear spread that the economy would lapse into recession. However, the pace picked up in the third quarter, and growth was strong enough to inspire confidence among consumers, businesses and investors. GDP expanded by 2.6% in the third quarter and 2.8% in the fourth quarter. With the Federal Reserve Board (the Fed) providing additional monetary stimulus to shore up economic growth and the extension of key tax cuts for the next two years, 2011 expectations are for continued growth. Consumer confidence is on the mend, even though job growth has not met expectations. Business spending also tracked higher over the period.
Consumer spending on cars, clothing and other goods generally trended higher throughout the year. Holiday spending rose 5.5% between November 5, 2010 and December 24, 2010, in all retail categories, excluding automobiles, compared with the same period in 2009, according to MasterCard Advisors' SpendingPulse, which tracks spending on all transactions including cash. Analysts say that an increase in personal savings and a decline in consumer debt gave consumers confidence to spend a little more on the 2010 holidays. The personal savings rate edged higher, ending January 2011, the last month for which data was available, at 5.8%. Personal income also increased during the year, surging in January 2011, as payroll tax cuts kicked in.
News on the job front was mostly positive over the 12-month period. A good portion of the jobs added in March, April and May of 2010 were temporary, government-sponsored census positions, which began to unwind in June 2010, July 2010, and August 2010. However, private sector payroll employment began to trend higher in the third quarter, massive layoffs declined and job growth turned solidly positive, with the addition of 255,000 new jobs in the first two months of 2011.
Despite some glimmers of improvement early in 2010, the housing market remained troublesome throughout the period. Both new and existing home sales fell after a federal tax credit for new and repeat homebuyers expired. Distressed properties pressured prices and foreclosures continued—another drag on prices. The inventory of unsold homes ended the period just about where it started, at 7.6 months for both new and existing homes, according to the National Association of Realtors and a joint release from the U.S. Census Bureau and the U.S. Department of Housing and Urban Development. The new year brought a bit of good news: Existing home sales increased in January 2011, raising the level of sales above where it was one year ago. According to the National Association of Realtors, it was the first time in seven months that year-over-year sales activity compared favorably.
Reports from the business side of the economy were generally positive. A key measure of the nation's manufacturing situation—the Institute for Supply Management's Index—took a somewhat surprising turn higher in the final months of the period. Technology spending rose 12% in 2010, according to the NPD Group, a national marketing research firm. Purchases of computers, networking and software returned to prerecession levels. Industrial production was disappointingly flat at year end, per the report issued by the Fed, and it slipped further in January 2011. The amount of manufacturing capacity utilized, per the report issued by the Fed—a key measure of the health of the manufacturing sector—continued to inch higher.
2
Economic Update (continued) – Columbia Convertible Securities Fund
Stocks moved higher despite summer 2010 setback
Against a strengthening economic backdrop, a stock market rally that began early in 2009 continued into 2010 despite a summer setback linked to a debt crisis brewing in Europe, which raised concerns among U.S. investors. These fears were short-lived and stocks regained their footing in September 2010, moving higher through the end of the period. The S&P 500 Index1 returned 22.57% for the 12 months through February 28, 2011. Outside the United States, stock market returns seesawed but ended just short of U.S. market returns. The MSCI EAFE Index (Net),2 a broad gauge of stock market performance in foreign developed markets, returned 20.00% (in U.S. dollars) for the 12-month period, as concerns about the impact of a bailout for weak euro zone economies abated. Emerging stock markets were similarly strong. The MSCI Emerging Markets Index (Net)3 returned 20.91% (in U.S. dollars) for the 12-month period.
Bonds delivered modest returns
As the economy strengthened and interest rates edged higher, most bond sectors delivered modest returns. The Barclays Capital Aggregate Bond Index4 returned 4.93%. High-yield bonds led the fixed-income markets. For the 12 months covered by this report, the JPMorgan Developed BB High Yield Index5 returned 14.74%. Despite rising yields in the second half of the period, the Treasury market was also positive. The Barclays Capital U.S. Treasury Index6 returned 3.71%. However, municipal bonds struggled in the final months of the period, as interest rates inched higher and issue supply surged ahead of the expiration of the Build America Bonds program. The Barclays Capital Municipal Bond Index7 gained 1.72% for the period. Despite positive economic activity, the Fed kept a key short-term interest rate—the federal funds rate—close to zero.
Past performance is no guarantee of future results.
1The Standard & Poor's (S&P) 500 Index tracks the performance of 500 widely held, large-capitalization U.S. stocks.
2The Morgan Stanley Capital International Europe, Australasia, Far East (MSCI EAFE) Index (Net) is a free float-adjusted market capitalization index that is designed to measure the equity market performance of developed markets, excluding the U.S. & Canada. As of May 27, 2010, the MSCI EAFE Index (Net) consisted of the following 22 developed market country indices: Australia, Austria, Belgium, Denmark, Finland, France, Germany, Greece, Hong Kong, Ireland, Israel, Italy, Japan, the Netherlands, New Zealand, Norway, Portugal, Singapore, Spain, Sweden, Switzerland and the United Kingdom.
3The Morgan Stanley Capital International Emerging Markets (MSCI EM) Index (Net) is a free float-adjusted market capitalization index that is designed to measure equity market performance of emerging markets. As of May 27, 2010, the MSCI EM Index (Net) consisted of the following 21 emerging market country indices: Brazil, Chile, China, Colombia, Czech Republic, Egypt, Hungary, India, Indonesia, Korea, Malaysia, Mexico, Morocco, Peru, Philippines, Poland, Russia, South Africa, Taiwan, Thailand and Turkey.
4The Barclays Capital Aggregate Bond Index is a market value-weighted index that tracks the daily price, coupon, pay-downs and total return performance of fixed-rate, publicly placed, dollar-denominated and non-convertible investment grade debt issues with at least $250 million par amount outstanding and with at least one year to final maturity.
5The JPMorgan Developed BB High Yield Index is an unmanaged index designed to mirror the investable universe of the U.S. dollar developed, BB-rated, high yield corporate debt market.
6The Barclays Capital U.S. Treasury Index includes public obligations of the U.S. Treasury. Treasury bills are excluded by the maturity constraint. In addition, certain special issues, such as state and local government series bonds (SLGs), as well as U.S. Treasury TIPS, are excluded. STRIPS are excluded from the index because their inclusion would result in double-counting.
7The Barclays Capital Municipal Bond Index is considered representative of the broad market for investment-grade, tax-exempt bonds with a maturity of at least one year.
Indices are not available for investment, are not professionally managed and do not reflect sales charges, fees, brokerage commissions, taxes or other expenses of investing. Securities in the fund may not match those in an index.
3
Performance Information – Columbia Convertible Securities Fund
Performance data quoted represents past performance and current performance may be lower or higher. Past performance is no guarantee of future results. The investment return and principal value will fluctuate so that shares, when redeemed, may be worth more or less than the original cost. Please visit www.columbiamanagement.com for daily and most recent month-end performance updates.
Performance of a $10,000 investment 03/01/01 – 02/28/11
The chart above shows the change in value of a hypothetical $10,000 investment in Class A shares of Columbia Convertible Securities Fund during the stated time period, and does not reflect the deduction of taxes that a shareholder may pay on fund distributions or on the redemption of fund shares.
Performance of a $10,000 investment 03/01/01 – 02/28/11 ($)
| Sales charge | | without | | with | |
| Class A | | | 16,480 | | | | 15,530 | | |
| Class B | | | 15,287 | | | | 15,287 | | |
| Class C | | | 15,283 | | | | 15,283 | | |
| Class I | | | n/a | | | | n/a | | |
| Class Z | | | 16,912 | | | | n/a | | |
Average annual total return as of 02/28/11 (%)
| Share class | | A | | B | | C | | I | | Z | |
| Inception | | 09/25/87 | | 07/15/98 | | 10/21/96 | | 09/27/10 | | 05/21/99 | |
| Sales charge | | without | | with | | without | | with | | without | | with | | without | | without | |
| 1-year | | | 24.72 | | | | 17.54 | | | | 23.83 | | | | 18.83 | | | | 23.88 | | | | 22.88 | | | | n/a | | | | 25.17 | | |
| 5-year | | | 4.69 | | | | 3.45 | | | | 3.90 | | | | 3.59 | | | | 3.90 | | | | 3.90 | | | | n/a | | | | 4.97 | | |
| 10-year/Life | | | 5.12 | | | | 4.50 | | | | 4.34 | | | | 4.34 | | | | 4.33 | | | | 4.33 | | | | 14.92 | | | | 5.39 | | |
The "with sales charge" returns include the maximum initial sales charge of 5.75% for Class A shares and the applicable contingent deferred sales charge of 5.00% in the first year, declining to 1.00% in the sixth year, and eliminated thereafter for Class B shares and 1.00% for Class C shares for the first year only. The "without sales charge" returns do not include the effect of sales charges. If they had, returns would be lower.
Performance results reflect any fee waivers or reimbursements of fund expenses by the Investment Manager and/or any of its affiliates. Absent these fee waivers or expense reimbursement arrangements, performance results would have been lower.
All results shown assume the reinvestment of distributions. Class I and Class Z shares are sold at net asset value with no distribution and service (Rule 12b-1) fees. Class I and Class Z shares have limited eligibility and the investment minimum requirements may vary. Please see the fund's prospectus for details.
Performance for different share classes will vary based on differences in sales charges and fees associated with each class.
Class I shares were initially offered on September 27, 2010.
The tables do not reflect the deduction of taxes that a shareholder may pay on fund distributions or on the redemption of fund shares.
4
Understanding Your Expenses – Columbia Convertible Securities Fund
As a fund shareholder, you incur two types of costs. There are transaction costs, which generally include sales charges on purchases and may include redemption fees or exchange fees. There are also ongoing costs, which generally include investment advisory fees, distribution and service (Rule 12b-1) fees and other fund expenses. The information on this page is intended to help you understand the ongoing costs of investing in the fund and to compare these costs with the ongoing costs of investing in other mutual funds.
Analyzing your fund's expenses by share class
To illustrate these ongoing costs, we have provided an example and calculated the expenses paid by investors in each share class during the period. The information in the following table is based on an initial investment of $1,000, which is invested at the beginning of the period and held for the entire period. Expense information is calculated two ways and each method provides you with different information. The amount listed in the "Actual" column is calculated using the fund's actual operating expenses and total return for the period. The amount listed in the "Hypothetical" column for each share class assumes that the return each year is 5% before expenses and is calculated based on the fund's actual operating expenses. You should not use the hypothetical account values and expenses to estimate either your actual account balance at the end of the period or the expenses you paid during this period.
Compare with other funds
Since all mutual funds are required to include the same hypothetical calculations about expenses in shareholder reports, you can use this information to compare the ongoing cost of investing in the fund with other funds. To do so, compare the 5% hypothetical example with the 5% hypothetical examples that appear in the shareholder reports of other funds. As you compare hypothetical examples of other funds, it is important to note that hypothetical examples are meant to highlight the ongoing costs of investing in a fund and do not reflect any transaction costs, such as sales charges, redemption fees or exchange fees.
Estimating your actual expenses
To estimate the expenses that you paid over the period, first you will need your account balance at the end of the period:
g For shareholders who receive their account statements from Columbia Management Investment Services Corp., your account balance is available online at www.columbiamanagement.com or by calling Shareholder Services at 800.345.6611.
g For shareholders who receive their account statements from their financial intermediary, contact your financial intermediary to obtain your account balance.
1. Divide your ending account balance by $1,000. For example, if an account balance was $8,600 at the end of the period, the result would be 8.6.
2. In the section of the table below titled "Expenses paid during the period," locate the amount for your share class. You will find this number in the column labeled "Actual." Multiply this number by the result from step 1. Your answer is an estimate of the expenses you paid on your account during the period.
If the value of your account falls below the minimum initial investment requirement applicable to you, your account may be subject to a $20 annual fee. This fee is not included in the accompanying table. If you are subject to the fee, keep it in mind when you are estimating the ongoing expenses of investing in the fund and when comparing the expenses of this fund with other funds.
09/01/10 – 02/28/11
| | | Account value at the
beginning of the period ($) | | Account value at the
end of the period ($) | | Expenses paid
during the period ($) | | Fund's annualized
expense ratio (%) | |
| | | Actual | | Hypothetical | | Actual | | Hypothetical | | Actual | | Hypothetical | | Actual | |
| Class A | | | 1,000.00 | | | | 1,000.00 | | | | 1,217.50 | | | | 1,018.99 | | | | 6.43 | | | | 5.86 | | | | 1.17 | | |
| Class B | | | 1,000.00 | | | | 1,000.00 | | | | 1,212.80 | | | | 1,015.22 | | | | 10.59 | | | | 9.64 | | | | 1.93 | | |
| Class C | | | 1,000.00 | | | | 1,000.00 | | | | 1,213.70 | | | | 1,015.27 | | | | 10.54 | | | | 9.59 | | | | 1.92 | | |
| Class I | | | 1,000.00 | | | | 1,000.00 | | | | 1,049.20 | * | | | 1,020.63 | | | | 3.63 | * | | | 4.21 | | | | 0.84 | | |
| Class Z | | | 1,000.00 | | | | 1,000.00 | | | | 1,219.40 | | | | 1,020.23 | | | | 5.06 | | | | 4.61 | | | | 0.92 | | |
Expenses paid during the period are equal to the annualized expense ratio for the share class, multiplied by the average account value over the period, then multiplied by the number of days in the fund's most recent fiscal half-year and divided by 365.
Had the Investment Manager and/or any of its affiliates not waived fees or reimbursed a portion of expenses, account value at the end of the period would have been reduced.
It is important to note that the expense amounts shown in the table are meant to highlight only ongoing costs of investing in the fund and do not reflect any transaction costs, such as sales charges, redemption fees or exchange fees. Therefore, the hypothetical examples provided may not help you determine the relative total costs of owning shares of different funds. If these transaction costs were included, your costs would have been higher.
*For the period September 27, 2010 through February 28, 2011. Class I shares commenced operations on September 27, 2010.
5
Portfolio Managers' Report – Columbia Convertible Securities Fund
Performance data quoted represents past performance and current performance may be lower or higher. Past performance is no guarantee of future results. The investment return and principal value will fluctuate so that shares, when redeemed, may be worth more or less than the original cost. Please visit www.columbiamanagement.com for daily and most recent month-end performance updates.
Net asset value per share
as of 02/28/11 ($)
| Class A | | | 15.55 | | |
| Class B | | | 15.28 | | |
| Class C | | | 15.51 | | |
| Class I | | | 15.58 | | |
| Class Z | | | 15.58 | | |
Distributions declared per share
03/01/10 – 02/28/11 ($)
| Class A | | | 0.49 | | |
| Class B | | | 0.39 | | |
| Class C | | | 0.39 | | |
| Class I | | | 0.14 | | |
| Class Z | | | 0.52 | | |
Top 10 holdings
as of 02/28/11 (%)
| EMC Corp | | | 3.0 | | |
| Gilead Sciences | | | 2.5 | | |
| General Motors | | | 2.3 | | |
| Citigroup | | | 2.0 | | |
| Invitrogen | | | 1.9 | | |
| Apache Corp | | | 1.7 | | |
| DST Systems | | | 1.5 | | |
| Dollar Financial Corporation | | | 1.5 | | |
| Alexandria Real Estate Equities | | | 1.5 | | |
| MGM Mirage | | | 1.5 | | |
The fund is actively managed and the composition of its portfolio will change over time. Information provided is calculated as a percentage of net assets.
For the 12-month period that ended February 28, 2011, the fund's Class A shares returned 24.72% without sales charge. Its benchmark, the BofAML All Convertibles All Qualities Index, returned 20.90%. The average return of funds in its peer group, the Lipper Convertible Securities Funds Classification, was 22.02%. Solid security selection across a range of sectors and a focus on equity-sensitive preferreds at a time of rising stock prices fueled the period's impressive results.
Better economic conditions favored consumer and tech issues
Easing credit conditions and rising equity markets combined to fuel gains for convertible securities over the past 12 months. Autos and other consumer discretionary sectors rebounded with the recovering economy, boosting the value of several fund holdings. Ford's convertible preferred, (1.0% of net assets) at times the fund's largest holding, rewarded our commitment with the payment of more than $5 per share of accumulated dividends and a sharp price rise. We cut back on automobile parts makers TRW Automotive and BorgWarner (0.8% and 0.5% of net assets, respectively), booking profits as valuations rose. Similarly, we continue to hold a reduced position in truck maker Navistar International (1.0% of net assets) after reducing exposure when prices moved higher. We purchased trucking operator Swift Transportation's (1.0% of net assets) convertible preferred as a new issue and were rewarded when it rose in value. In technology, we took profits in Salesforce.com, whose applications aid companies in sales and customer service, and in data management specialist Informatica. We also cut back on storage giant EMC (3.0% of net assets) as valuations expanded. Sybase's acquisition by a leading business management software company also boosted fund returns. During the period, Coinstar rose strongly as the company built on its expertise in change-making machines to launch Redbox, which offers DVD rentals through vending machines. We sold the fund's convertible bond position at a significant profit. We reduced exposure to the health care sector, a move that proved timely as the sector lagged. Instead, we focused on areas we judged to be more likely to prosper in an improving economic climate, such as the technology and consumer discretionary sectors, which contributed solidly to returns.
Negative influences were few
There were very few disappointments during the period. Our decision to underweight industrial issues compared to the benchmark was a slight drag on performance as companies in this segment turned in strong results and their securities rose. We sold biotech company Biovail following its merger, but price momentum plus synergies realized from the merger moved the issue sharply higher. To seal in some gains we cut back exposure to equity-sensitive preferreds while remaining open to attractive new opportunities. Among new additions were the convertible bonds of Ares Capital (1.0% of net assets), a private investment company.
Looking ahead
Our longstanding investment process is bottom-up and research centered. We look for attractively valued issues and let sector weights emerge from our selections. That process has led us to invest in equity- and credit-sensitive issues where we see good potential. The market appears fairly valued at this juncture, with future performance unlikely to match the strong results of the past two years. Nevertheless, we are optimistic about the fund's potential to reward shareholders over the upcoming period.
6
Portfolio Managers' Report (continued) – Columbia Convertible Securities Fund
Portfolio characteristics and holdings are subject to change periodically and may not be representative of current characteristics and holdings. The outlook for the fund may differ from those presented for other Columbia Funds.
Most convertible securities are not investment grade and are therefore more speculative in nature than securities with higher ratings.
7
Investment Portfolio – Columbia Convertible Securities Fund
February 28, 2011
| Convertible Bonds – 71.6% | |
| | | Par ($) | | Value ($) | |
| Consumer Discretionary – 9.6% | |
| Apparel – 1.0% | |
Iconix Brand Group, Inc.
1.875% 06/30/12 | | | 4,810,000 | | | | 4,930,250 | | |
| Apparel Total | | | 4,930,250 | | |
| Auto Components – 1.3% | |
BorgWarner, Inc.
3.500% 04/15/12 | | | 1,120,000 | | | | 2,674,000 | | |
TRW Automotive, Inc.
3.500% 12/01/15 (a) | | | 1,900,000 | | | | 3,921,125 | | |
| Auto Components Total | | | 6,595,125 | | |
| Automobiles – 1.0% | |
Ford Motor Co.
4.250% 11/15/16 | | | 2,650,000 | | | | 4,842,875 | | |
| Automobile Total | | | 4,842,875 | | |
| Hotels, Restaurants & Leisure – 2.0% | |
Home Inns & Hotels Management, Inc.
2.000% 12/15/15 (a) | | | 3,020,000 | | | | 2,884,979 | | |
MGM Mirage
4.250% 04/15/15 (a) | | | 6,830,000 | | | | 7,478,850 | | |
| Hotels, Restaurants & Leisure Total | | | 10,363,829 | | |
| Internet & Catalog Retail – 0.5% | |
priceline.com, Inc.
1.250% 03/15/15 (a) | | | 1,650,000 | | | | 2,668,875 | | |
| Internet & Catalog Retail Total | | | 2,668,875 | | |
| Media – 3.1% | |
Interpublic Group of Companies, Inc.
4.250% 03/15/23 | | | 4,210,000 | | | | 5,009,900 | | |
Liberty Global, Inc.
4.500% 11/15/16 | | | 1,750,000 | | | | 2,999,027 | | |
Liberty Media Corp.
3.250% 03/15/31 | | | 6,500,000 | | | | 5,118,750 | | |
Nielsen Holdings NV
6.250% 02/01/13 | | | 5,000,000 | | | | 2,759,375 | | |
| Media Total | | | 15,887,052 | | |
| Specialty Retail – 0.7% | |
Charming Shoppes, Inc.
1.125% 05/01/14 | | | 4,180,000 | | | | 3,553,000 | | |
| Specialty Retail Total | | | 3,553,000 | | |
| Consumer Discretionary Total | | | 48,841,006 | | |
| | | Par ($) | | Value ($) | |
| Consumer Staples – 1.5% | |
| Food Products – 0.8% | |
Smithfield Foods, Inc.
4.000% 06/30/13 | | | 3,280,000 | | | | 4,046,700 | | |
| Food Products Total | | | 4,046,700 | | |
| Tobacco – 0.7% | |
Vector Group Ltd.
3.875% 06/15/26 (b) | | | 3,170,000 | | | | 3,677,200 | | |
| Tobacco Total | | | 3,677,200 | | |
| Consumer Staples Total | | | 7,723,900 | | |
| Energy – 4.5% | |
| Energy Equipment & Services – 1.4% | |
Hornbeck Offshore Services, Inc.
1.625% 11/15/26
(1.375% 11/15/13) (a)(c) | | | 5,000,000 | | | | 4,762,500 | | |
1.625% 11/15/26
(1.375% 11/15/13) (c) | | | 2,770,000 | | | | 2,638,425 | | |
| Energy Equipment & Services Total | | | 7,400,925 | | |
| Oil, Gas & Consumable Fuels – 3.1% | |
Chesapeake Energy Corp.
2.750% 11/15/35 | | | 4,420,000 | | | | 5,348,200 | | |
International Coal Group, Inc.
4.000% 04/01/17 | | | 1,990,000 | | | | 3,743,688 | | |
Newpark Resources, Inc.
4.000% 10/01/17 | | | 2,650,000 | | | | 2,663,250 | | |
SM Energy Co.
3.500% 04/01/27 | | | 2,720,000 | | | | 3,808,000 | | |
| Oil, Gas & Consumable Fuels Total | | | 15,563,138 | | |
| Energy Total | | | 22,964,063 | | |
| Financials – 9.1% | |
| Capital Markets – 2.0% | |
Ares Capital Corp.
5.750% 02/01/16 (a) | | | 4,970,000 | | | | 5,305,475 | | |
Knight Capital Group, Inc.
3.500% 03/15/15 (a) | | | 5,000,000 | | | | 4,940,625 | | |
| Capital Markets Total | | | 10,246,100 | | |
| Consumer Finance – 1.5% | |
Dollar Financial Corp.
3.000% 04/01/28 | | | 5,987,000 | | | | 7,790,584 | | |
| Consumer Finance Total | | | 7,790,584 | | |
See Accompanying Notes to Financial Statements.
8
Columbia Convertible Securities Fund
February 28, 2011
| Convertible Bonds (continued) | |
| | | Par ($) | | Value ($) | |
| Diversified Financial Services – 0.7% | |
Affiliated Managers Group, Inc.
3.950% 08/15/38 | | | 3,170,000 | | | | 3,677,200 | | |
| Diversified Financial Services Total | | | 3,677,200 | | |
| Insurance – 1.2% | |
National Financial Partners Corp.
4.000% 06/15/17 (a) | | | 2,000,000 | | | | 2,580,000 | | |
Radian Group, Inc.
3.000% 11/15/17 | | | 3,510,000 | | | | 3,316,950 | | |
| Insurance Total | | | 5,896,950 | | |
| Real Estate Investment Trusts (REITs) – 2.1% | |
Digital Realty Trust LP
5.500% 04/15/29 (a) | | | 3,660,000 | | | | 5,377,912 | | |
Vornado Realty LP
3.875% 04/15/25 | | | 4,370,000 | | | | 5,036,425 | | |
| Real Estate Investment Trusts (REITs) Total | | | 10,414,337 | | |
| Real Estate Management & Development – 0.6% | |
Forest City Enterprises, Inc.
3.625% 10/15/14 | | | 2,335,000 | | | | 3,257,325 | | |
| Real Estate Management & Development Total | | | 3,257,325 | | |
| Thrifts & Mortgage Finance – 1.0% | |
MGIC Investment Corp.
5.000% 05/01/17 | | | 4,600,000 | | | | 5,007,100 | | |
| Thrifts & Mortgage Finance Total | | | 5,007,100 | | |
| Financials Total | | | 46,289,596 | | |
| Health Care – 13.0% | |
| Biotechnology – 6.5% | |
Cubist Pharmaceuticals, Inc.
2.500% 11/01/17 | | | 3,610,000 | | | | 3,608,329 | | |
Dendreon Corp.
2.875% 01/15/16 | | | 4,950,000 | | | | 4,914,360 | | |
Gilead Sciences, Inc.
1.625% 05/01/16 (a) | | | 11,690,000 | | | | 12,630,811 | | |
Human Genome Sciences, Inc.
2.250% 08/15/12 | | | 1,540,000 | | | | 2,412,025 | | |
Invitrogen Corp.
3.250% 06/15/25 | | | 8,436,000 | | | | 9,585,405 | | |
| Biotechnology Total | | | 33,150,930 | | |
| Health Care Equipment & Supplies – 1.7% | |
Alere, Inc.
3.000% 05/15/16 | | | 5,500,000 | | | | 6,139,375 | | |
Fisher Scientific International, Inc.
3.250% 03/01/24 | | | 1,797,000 | | | | 2,493,337 | | |
| Health Care Equipment & Supplies Total | | | 8,632,712 | | |
| | | Par ($) | | Value ($) | |
| Health Care Providers & Services – 0.8% | |
Lincare Holdings, Inc.
2.750% 11/01/37 | | | 3,230,000 | | | | 3,811,400 | | |
| Health Care Providers & Services Total | | | 3,811,400 | | |
| Healthcare Products – 1.0% | |
Insulet Corp.
5.375% 06/15/13 | | | 2,320,000 | | | | 2,624,500 | | |
Volcano Corp.
2.875% 09/01/15 | | | 2,020,000 | | | | 2,285,024 | | |
| Healthcare Products Total | | | 4,909,524 | | |
| Pharmaceuticals – 3.0% | |
Allergan, Inc.
1.500% 04/01/26 (a) | | | 1,030,000 | | | | 1,220,550 | | |
| 1.500% 04/01/26 | | | 1,775,000 | | | | 2,103,375 | | |
Mylan, Inc.
1.250% 03/15/12 | | | 3,110,000 | | | | 3,498,750 | | |
| 3.750% 09/15/15 | | | 2,020,000 | | | | 3,752,150 | | |
Omnicare, Inc.
3.750% 12/15/25 | | | 2,100,000 | | | | 2,614,500 | | |
Salix Pharmaceuticals Ltd.
2.750% 05/15/15 | | | 2,000,000 | | | | 2,137,500 | | |
| Pharmaceuticals Total | | | 15,326,825 | | |
| Health Care Total | | | 65,831,391 | | |
| Industrials – 9.6% | |
| Aerospace & Defense – 0.9% | |
Alliant Techsystems, Inc.
3.000% 08/15/24 | | | 4,080,000 | | | | 4,641,000 | | |
| Aerospace & Defense Total | | | 4,641,000 | | |
| Airlines – 1.0% | |
UAL Corp.
4.500% 06/30/21 | | | 4,710,000 | | | | 4,845,648 | | |
| Airlines Total | | | 4,845,648 | | |
| Building Products – 1.0% | |
Lennar Corp.
2.750% 12/15/20 (a) | | | 4,560,000 | | | | 5,251,570 | | |
| Building Products Total | | | 5,251,570 | | |
| Commercial Services & Supplies – 0.7% | |
Covanta Holding Corp.
3.250% 06/01/14 | | | 2,950,000 | | | | 3,477,312 | | |
| Commercial Services & Supplies Total | | | 3,477,312 | | |
| Conglomerates – 0.5% | |
Textron, Inc.
4.500% 05/01/13 | | | 1,250,000 | | | | 2,670,313 | | |
| Conglomerates Total | | | 2,670,313 | | |
See Accompanying Notes to Financial Statements.
9
Columbia Convertible Securities Fund
February 28, 2011
| Convertible Bonds (continued) | |
| | | Par ($) | | Value ($) | |
| Construction Materials – 0.9% | |
Cemex SAB de CV
4.875% 03/15/15 (a) | | | 4,460,000 | | | | 4,543,625 | | |
| Construction Materials Total | | | 4,543,625 | | |
| Containers & Packaging – 0.9% | |
Owens-Brockway Glass Container, Inc.
3.000% 06/01/15 (a) | | | 4,670,000 | | | | 4,769,237 | | |
| Containers & Packaging Total | | | 4,769,237 | | |
| Electrical Equipment – 1.1% | |
General Cable Corp.
0.875% 11/15/13 | | | 3,640,000 | | | | 4,013,100 | | |
4.500% 11/15/29 (c)
(2.250% 11/15/19) | | | 1,000,000 | | | | 1,406,250 | | |
| Electrical Equipment Total | | | 5,419,350 | | |
| Machinery – 1.4% | |
Ingersoll-Rand Global Holding Co. Ltd.
4.500% 04/15/12 | | | 880,000 | | | | 2,245,100 | | |
Navistar International Corp.
3.000% 10/15/14 | | | 3,560,000 | | | | 4,975,100 | | |
| Machinery Total | | | 7,220,200 | | |
| Marine – 1.2% | |
DryShips, Inc.
5.000% 12/01/14 | | | 5,970,000 | | | | 5,940,150 | | |
| Marine Total | | | 5,940,150 | | |
| Industrials Total | | | 48,778,405 | | |
| Information Technology – 18.0% | |
| Communications Equipment – 0.8% | |
Arris Group, Inc.
2.000% 11/15/26 | | | 3,585,000 | | | | 3,869,545 | | |
| Communications Equipment Total | | | 3,869,545 | | |
| Computers & Peripherals – 3.5% | |
EMC Corp.
1.750% 12/01/11 | | | 3,280,000 | | | | 5,576,000 | | |
| 1.750% 12/01/13 | | | 5,470,000 | | | | 9,558,825 | | |
SanDisk Corp.
1.500% 08/15/17 | | | 2,410,000 | | | | 2,804,638 | | |
| Computers & Peripherals Total | | | 17,939,463 | | |
| Internet Software & Services – 3.5% | |
Digital River, Inc.
1.250% 01/01/24 | | | 1,900,000 | | | | 1,923,750 | | |
| 2.000% 11/01/30 (a) | | | 4,480,000 | | | | 4,432,615 | | |
Equinix, Inc.
3.000% 10/15/14 | | | 4,770,000 | | | | 5,050,237 | | |
| | | Par ($) | | Value ($) | |
Telvent GIT SA
5.500% 04/15/15 (a) | | | 3,250,000 | | | | 3,749,688 | | |
WebMD Health Corp.
2.500% 01/31/18 (a) | | | 2,400,000 | | | | 2,564,280 | | |
| Internet Software & Services Total | | | 17,720,570 | | |
| IT Services – 2.3% | |
CACI International, Inc.
2.125% 05/01/14 | | | 3,130,000 | | | | 3,861,638 | | |
DST Systems, Inc.
4.125% 08/15/23
(08/15/13) (b) | | | 6,620,000 | | | | 7,861,250 | | |
| IT Services Total | | | 11,722,888 | | |
| Semiconductors & Semiconductor Equipment – 3.2% | |
Advanced Micro Devices, Inc.
6.000% 05/01/15 | | | 7,043,000 | | | | 7,210,271 | | |
Micron Technology, Inc.
1.875% 06/01/14 | | | 3,580,000 | | | | 3,830,600 | | |
ON Semiconductor Corp.
2.625% 12/15/26 | | | 4,100,000 | | | | 5,171,125 | | |
Semiconductors & Semiconductor
Equipment Total | | | 16,211,996 | | |
| Software – 4.7% | |
Cadence Design Systems, Inc.
2.625% 06/01/15 (a) | | | 2,570,000 | | | | 3,742,563 | | |
Concur Technologies, Inc.
2.500% 04/15/15 (a) | | | 3,980,000 | | | | 4,761,075 | | |
Nuance Communications, Inc.
2.750% 08/15/27 | | | 4,045,000 | | | | 4,970,294 | | |
RightNow Technologies, Inc.
2.500% 11/15/30 (a) | | | 3,525,000 | | | | 3,859,240 | | |
Rovi Corp.
2.625% 02/15/40 (a) | | | 2,870,000 | | | | 3,878,087 | | |
Take-Two Interactive Software, Inc.
4.375% 06/01/14 | | | 1,700,000 | | | | 2,792,250 | | |
| Software Total | | | 24,003,509 | | |
| Information Technology Total | | | 91,467,971 | | |
| Materials – 2.9% | |
| Chemicals – 0.5% | |
ShengdaTech, Inc.
6.500% 12/15/15 (a) | | | 2,430,000 | | | | 2,378,363 | | |
| Chemicals Total | | | 2,378,363 | | |
See Accompanying Notes to Financial Statements.
10
Columbia Convertible Securities Fund
February 28, 2011
| Convertible Bonds (continued) | |
| | | Par ($) | | Value ($) | |
| Metals & Mining – 2.4% | |
Jaguar Mining, Inc.
5.500% 03/31/16 (a) | | | 2,330,000 | | | | 2,373,687 | | |
Steel Dynamics, Inc.
5.125% 06/15/14 | | | 3,720,000 | | | | 4,733,700 | | |
Sterlite Industries India Ltd.
4.000% 10/30/14 | | | 4,920,000 | | | | 4,975,350 | | |
| Metals & Mining Total | | | 12,082,737 | | |
| Materials Total | | | 14,461,100 | | |
| Telecommunication Services – 2.5% | |
| Wireless Telecommunication Services – 2.5% | |
Ciena Corp.
3.750% 10/15/18 (a) | | | 3,470,000 | | | | 5,422,743 | | |
Comtech Telecommunications Corp.
3.000% 05/01/29 | | | 2,250,000 | | | | 2,321,145 | | |
Ixia
3.000% 12/15/15 (a) | | | 2,180,000 | | | | 2,527,710 | | |
Leap Wireless International, Inc.
4.500% 07/15/14 | | | 2,620,000 | | | | 2,436,600 | | |
| Wireless Telecommunication Services Total | | | 12,708,198 | | |
| Telecommunication Services Total | | | 12,708,198 | | |
| Utilities – 0.9% | |
| Multi-Utilities – 0.9% | |
CMS Energy Corp.
5.500% 06/15/29 | | | 3,320,000 | | | | 4,768,350 | | |
| Multi-Utilities Total | | | 4,768,350 | | |
| Utilities Total | | | 4,768,350 | | |
Total Convertible Bonds
(cost of $316,467,744) | | | 363,833,980 | | |
| Convertible Preferred Stocks – 24.0% | |
| | | Shares | | | |
| Consumer Discretionary – 3.4% | |
| Automobiles – 2.3% | |
| General Motors Co., 4.750% | | | 232,500 | | | | 11,829,600 | | |
| Automobiles Total | | | 11,829,600 | | |
| Household Durables – 1.1% | |
Stanley Black & Decker,
Inc., 4.750% | | | 44,800 | | | | 5,268,032 | | |
| Household Durables Total | | | 5,268,032 | | |
| Consumer Discretionary Total | | | 17,097,632 | | |
| | | Shares | | Value ($) | |
| Consumer Staples – 2.0% | |
| Food Products – 2.0% | |
| Deutsche Bank AG (a)(d) | | | 90,000 | | | | 4,146,300 | | |
Dole Food Automatic Common
Exchange Security Trust,
7.000% (a) | | | 428,000 | | | | 5,798,073 | | |
| Food Products Total | | | 9,944,373 | | |
| Consumer Staples Total | | | 9,944,373 | | |
| Energy – 4.3% | |
| Oil, Gas & Consumable Fuels – 4.3% | |
| Apache Corp., 6.000% | | | 124,500 | | | | 8,480,940 | | |
| Chesapeake Energy Corp., 5.000% | | | 50,000 | | | | 5,505,000 | | |
| El Paso Corp., 4.990% | | | 320 | | | | 456,173 | | |
| El Paso Corp., 4.990% (a) | | | 3,500 | | | | 5,026,875 | | |
| Whiting Petroleum Corp., 6.250% | | | 8,480 | | | | 2,604,038 | | |
| Oil, Gas & Consumable Fuels Total | | | 22,073,026 | | |
| Energy Total | | | 22,073,026 | | |
| Financials – 9.4% | |
| Commercial Banks – 1.9% | |
| Fifth Third Bancorp., 8.500% | | | 49,000 | | | | 7,423,500 | | |
| UBS AG, 6.750% | | | 72,500 | | | | 2,428,025 | | |
| Commercial Banks Total | | | 9,851,525 | | |
| Diversified Financial Services – 5.0% | |
| Bank of America Corp., 7.250% | | | 7,300 | | | | 7,329,200 | | |
| Citigroup, Inc., 7.500% | | | 74,100 | | | | 9,966,450 | | |
Goldman Sachs
Group, Inc., 0.75% (a) | | | 183,921 | | | | 3,998,994 | | |
| Omnicare Capital Trust II, 4.000% | | | 92,700 | | | | 4,083,435 | | |
| Diversified Financial Services Total | | | 25,378,079 | | |
| Insurance – 1.0% | |
Hartford Financial Services
Group, Inc., 7.250% | | | 180,000 | | | | 4,980,600 | | |
| Insurance Total | | | 4,980,600 | | |
| Real Estate Investment Trusts (REITs) – 1.5% | |
Alexandria Real Estate Equities,
Inc., Series D, 7.000% | | | 288,000 | | | | 7,588,800 | | |
| Real Estate Investment Trusts (REITs) Total | | | 7,588,800 | | |
| Financials Total | | | 47,799,004 | | |
See Accompanying Notes to Financial Statements.
11
Columbia Convertible Securities Fund
February 28, 2011
| Convertible Preferred Stocks (continued) | |
| | | Shares | | Value ($) | |
| Industrials – 2.0% | |
| Airlines – 0.4% | |
Continental Airlines Finance
Trust II, 6.000% | | | 60,500 | | | | 2,280,094 | | |
| Airlines Total | | | 2,280,094 | | |
| Electrical Equipment – 0.6% | |
Energy XXI Bermuda
Ltd., 5.625% | | | 8,000 | | | | 3,047,500 | | |
| Electrical Equipment Total | | | 3,047,500 | | |
| Road & Rail – 1.0% | |
2010 Swift Mandatory Common
Exchange Security Trust,
6.000% (a) | | | 358,800 | | | | 4,913,766 | | |
| Road & Rail Total | | | 4,913,766 | | |
| Industrials Total | | | 10,241,360 | | |
| Materials – 1.3% | |
| Metals & Mining – 1.3% | |
| Molycorp, Inc., 5.500% | | | 37,200 | | | | 3,601,332 | | |
| UBS AG, 9.375% | | | 100,600 | | | | 2,969,712 | | |
| Metals & Mining Total | | | 6,571,044 | | |
| Materials Total | | | 6,571,044 | | |
| Utilities – 1.6% | |
| Electric Utilities – 1.6% | |
| Great Plains Energy, Inc., 12.000% | | | 56,300 | | | | 3,527,195 | | |
| PPL Corp., CPN | | | 86,100 | | | | 4,589,991 | | |
| Electric Utilities Total | | | 8,117,186 | | |
| Utilities Total | | | 8,117,186 | | |
Total Convertible Preferred Stocks
(cost of $110,934,217) | | | 121,843,625 | | |
| Common Stocks – 1.0% | |
| Health Care – 0.5% | |
| Biotechnology – 0.5% | |
| Amgen, Inc. (e) | | | 48,500 | | | | 2,489,505 | | |
| Biotechnology Total | | | 2,489,505 | | |
| Health Care Total | | | 2,489,505 | | |
| | | Shares | | Value ($) | |
| Information Technology – 0.5% | |
| Semiconductors & Semiconductor Equipment – 0.5% | |
| Intel Corp. | | | 109,400 | | | | 2,348,818 | | |
Semiconductors & Semiconductor
Equipment Total | | | 2,348,818 | | |
| Information Technology Total | | | 2,348,818 | | |
Total Common Stocks
(cost of $4,880,045) | | | 4,838,323 | | |
| Short-Term Obligation – 2.5% | |
| | | Par ($) | | | |
Repurchase agreement with
Fixed Income Clearing Corp.,
dated 02/28/11, due 03/01/11
at 0.090%, collateralized by a
U.S. Government Agency
obligation maturing 04/15/14,
market value $12,891,900
(repurchase proceeds
$12,638,032) | | | 12,638,000 | | | | 12,638,000 | | |
Total Short-Term Obligation
(cost of $12,638,000) | | | 12,638,000 | | |
Total Investments – 99.1%
(cost of $444,920,006) (f) | | | 503,153,928 | | |
| Other Assets & Liabilities, Net – 0.9% | | | 4,731,849 | | |
| Net Assets – 100.0% | | | 507,885,777 | | |
Notes to Investment Portfolio:
(a) Security exempt from registration pursuant to Rule 144A under the Securities Act of 1933. These securities may be resold in transactions exempt from registration, normally to qualified institutional buyers. At February 28, 2011, these securities, which are not illiquid, amounted to $131,910,193, which represents 26.0% of net assets.
(b) The interest rate shown on floating rate or variable rate securities reflects the rate at February 28, 2011.
(c) Step bond. Shown parenthetically is the next interest rate to be paid and the date the security will begin accruing at this rate.
(d) Zero coupon bond.
(e) Non-income producing security.
(f) Cost for federal income tax purposes is $445,189,385.
Generally accepted accounting principles (GAAP) require disclosure regarding the inputs and valuation techniques used to measure fair value and any changes in valuation inputs or techniques. In addition, investments shall be disclosed by major category.
The Fund categorizes its fair value measurements according to a three-level hierarchy that maximizes the use of observable inputs and minimizes the use of unobservable inputs by prioritizing that the most observable input be used when available. Observable inputs are those that market participants would use in pricing an investment based on market data obtained from sources
See Accompanying Notes to Financial Statements.
12
Columbia Convertible Securities Fund
February 28, 2011
independent of the reporting entity. Unobservable inputs are those that reflect the Fund's assumptions about the information market participants would use in pricing an investment. An investment's level within the fair value hierarchy is based on the lowest level of any input that is deemed significant to the asset or liability's fair value measurement. The input levels are not necessarily an indication of the risk or liquidity associated with investments at that level. For example, certain U.S. government securities are generally high quality and liquid, however, they are reflected as Level 2 because the inputs used to determine fair value may not always be quoted prices in an active market.
Fair value inputs are summarized in the three broad levels listed below:
• Level 1—Valuations based on quoted prices for investments in active markets that the Fund has the ability to access at the measurement date (including NAV for open-end mutual funds). Valuation adjustments are not applied to Level 1 investments.
• Level 2—Valuations based on other significant observable inputs (including quoted prices for similar securities, interest rates, prepayment speeds, credit risks, etc.).
• Level 3—Valuations based on significant unobservable inputs (including the Fund's own assumptions and judgment in determining the fair value of investments).
Inputs that are used in determining fair value of an investment may include price information, credit data, volatility statistics, and other factors. These inputs can be either observable or unobservable. The availability of observable inputs can vary between investments, and is affected by various factors such as the type of investment, and the volume and level of activity for that investment or similar investments in the marketplace. The inputs will be considered by the Investment Manager, along with any other relevant factors in the calculation of an investment's fair value. The Fund uses prices and inputs that are current as of the measurement date, which may include periods of market dislocations. During these periods, the availability of prices and inputs may be reduced for many investments. This condition could cause an investment to be reclassified between the various levels within the hierarchy. Non-U.S. equity securities actively traded in foreign markets may be reflected in Level 2 despite the availability of closing prices, because the Fund evaluates and determines whether those closing prices reflect fair value at the close of the New York Stock Exchange (NYSE) or require adjustment, as described in Note 2 to the financial statements—Security Valuation.
Investments falling into the Level 3 category are primarily supported by quoted prices from brokers and dealers participating in the market for those investments. However, these may be classified as Level 3 investments due to lack of market transparency and corroboration to support these quoted prices. Additionally, valuation models may be used as the pricing source for any remaining investments classified as Level 3. These models rely on one or more significant unobservable inputs and/or significant assumptions by the Investment Manager. Inputs used in valuations may include, but are not limited to, financial statement analysis, capital account balances, discount rates and estimated cash flows, and comparable company data.
The following table summarizes the inputs used, as of February 28, 2011, in valuing the Fund's assets:
| Description | | Quoted
Prices
(Level 1) | | Other
Significant
Observable
Inputs
(Level 2) | | Significant
Unobservable
Inputs
(Level 3) | | Total | |
| Total Convertible Bonds | | $ | — | | | $ | 363,833,980 | | | $ | — | | | $ | 363,833,980 | | |
Convertible Preferred
Stocks | | | | | | | | | | | | | | | | | |
| Consumer Discretionary | | | 17,097,632 | | | | — | | | | — | | | | 17,097,632 | | |
| Consumer Staples | | | — | | | | 9,944,373 | | | | — | | | | 9,944,373 | | |
| Energy | | | 17,046,151 | | | | 5,026,875 | | | | — | | | | 22,073,026 | | |
| Financials | | | 33,948,485 | | | | 13,850,519 | | | | — | | | | 47,799,004 | | |
| Industrials | | | 2,280,094 | | | | 7,961,266 | | | | — | | | | 10,241,360 | | |
| Materials | | | 3,601,332 | | | | 2,969,712 | | | | — | | | | 6,571,044 | | |
| Utilities | | | 3,527,195 | | | | 4,589,991 | | | | — | | | | 8,117,186 | | |
Total Convertible
Preferred Stocks | | | 77,500,889 | | | | 44,342,736 | | | | — | | | | 121,843,625 | | |
| Total Common Stocks | | | 4,838,323 | | | | — | | | | — | | | | 4,838,323 | | |
| Total Short-Term Obligation | | | — | | | | 12,638,000 | | | | — | | | | 12,638,000 | | |
| Total Investments | | $ | 82,339,212 | | | $ | 420,814,716 | | | $ | — | | | $ | 503,153,928 | | |
The Fund's assets assigned to the Level 2 input category are generally valued using the market approach, in which a security's value is determined through reference to prices and information from market transactions for similar or identical assets.
Certain short-term obligations may be valued using amortized cost, an income approach which converts future cash flows to a present value based upon the discount or premium at purchase.
The following table reconciles asset balances for the year ending February 28, 2011, in which significant unobservable inputs (Level 3) were used in determining value:
Investments
in Securities | | Balance as of
February 28,
2010 | | Accrued
Discounts
(Premiums) | | Realized
Gain
(Loss) | | Change in
Unrealized
Appreciation
(Depreciation) | | Purchases | | (Sales) | | Transfers
into
Level 3 | | Transfers
out of
Level 3 | | Balance as of
February 28,
2011 | |
| Convertible Bonds | | $ | 4,789,500 | | | $ | — | | | $ | (184,995 | ) | | $ | 210,500 | | | $ | — | | | $ | (4,815,005 | ) | | $ | — | | | $ | — | | | $ | — | | |
Convertible
Preferred Stocks | | | 4,440,770 | | | | — | | | | (1,045,198 | ) | | | 559,278 | | | | — | | | | (3,954,850 | ) | | | — | | | | — | | | | — | | |
| Total | | $ | 9,230,270 | | | $ | — | | | $ | (1,230,193 | ) | | $ | 769,778 | | | $ | — | | | $ | (8,769,855 | ) | | $ | — | | | $ | — | | | $ | — | | |
The information in the above reconciliation represents fiscal year to date activity for any securities identified as using Level 3 inputs at either the beginning or the end of the current fiscal period.
See Accompanying Notes to Financial Statements.
13
Columbia Convertible Securities Fund
February 28, 2011
There were no significant transfers of financial assets between Levels 1 and 2 during the period.
At February 28, 2011, the asset allocation of the Fund was as follows:
| Asset Allocation (Unaudited) | | % of
Net Assets | |
| Convertible Bonds | | | 71.6 | | |
| Convertible Preferred Stocks | | | 24.0 | | |
| Common Stocks | | | 1.0 | | |
| | | | 96.6 | | |
| Short-Term Obligation | | | 2.5 | | |
| Other Assets & Liabilities, Net | | | 0.9 | | |
| | | | 100.0 | | |
See Accompanying Notes to Financial Statements.
14
Statement of Assets and Liabilities – Columbia Convertible Securities Fund
February 28, 2011
| | | | | ($) | |
| Assets | | Investments, at identified cost | | | 444,920,006 | | |
| | | Investments, at value | | | 503,153,928 | | |
| | | Cash | | | 945 | | |
| | | Receivable for: | | | |
| | | Investments sold | | | 10,046,424 | | |
| | | Fund shares sold | | | 519,343 | | |
| | | Dividends | | | 267,841 | | |
| | | Interest | | | 2,858,024 | | |
| | | Expense reimbursement due from Investment Manager | | | 243,453 | | |
| | | Prepaid expenses | | | 1,371 | | |
| | | Total Assets | | | 517,091,329 | | |
| Liabilities | | Payable for: | | | |
| | | Investments purchased | | | 5,233,452 | | |
| | | Fund shares repurchased | | | 3,009,677 | | |
| | | Investment advisory fee | | | 250,917 | | |
| | | Administration fee | | | 56,738 | | |
| | | Pricing and bookkeeping fees | | | 10,918 | | |
| | | Transfer agent fee | | | 235,592 | | |
| | | Trustees' fees | | | 74,218 | | |
| | | Custody fee | | | 3,298 | | |
| | | Distribution and service fees | | | 76,318 | | |
| | | Chief compliance officer expenses | | | 196 | | |
| | | Reports to shareholders | | | 180,336 | | |
| | | Other liabilities | | | 73,892 | | |
| | | Total Liabilities | | | 9,205,552 | | |
| | | Net Assets | | | 507,885,777 | | |
| Net Assets Consist of | | Paid-in capital | | | 523,013,307 | | |
| | | Undistributed net investment income | | | 1,966,224 | | |
| | | Accumulated net realized loss | | | (75,327,676 | ) | |
| | | Net unrealized appreciation on investments | | | 58,233,922 | | |
| | | Net Assets | | | 507,885,777 | | |
See Accompanying Notes to Financial Statements.
15
Statement of Assets and Liabilities (continued) – Columbia Convertible Securities Fund
February 28, 2011
| Class A | | Net assets | | $ | 224,608,180 | | |
| | | Shares outstanding | | | 14,441,489 | | |
| | | Net asset value per share | | $ | 15.55 | (a) | |
| | | Maximum sales charge | | | 5.75 | % | |
| | | Maximum offering price per share ($15.55/0.9425) | | $ | 16.50 | (b) | |
| Class B | | Net assets | | $ | 12,088,531 | | |
| | | Shares outstanding | | | 791,122 | | |
| | | Net asset value and offering price per share | | $ | 15.28 | (a) | |
| Class C | | Net assets | | $ | 21,716,694 | | |
| | | Shares outstanding | | | 1,400,559 | | |
| | | Net asset value and offering price per share | | $ | 15.51 | (a) | |
| Class I (c) | | Net assets | | $ | 82,875,003 | | |
| | | Shares outstanding | | | 5,318,778 | | |
| | | Net asset value, offering and redemption price per share | | $ | 15.58 | | |
| Class Z | | Net assets | | $ | 166,597,369 | | |
| | | Shares outstanding | | | 10,696,459 | | |
| | | Net asset value, offering and redemption price per share | | $ | 15.58 | | |
(a) Redemption price per share is equal to net asset value less any applicable contingent deferred sales charge.
(b) On sales of $50,000 or more the offering price is reduced.
(c) Class I shares commenced operations on September 27, 2010.
See Accompanying Notes to Financial Statements.
16
Statement of Operations – Columbia Convertible Securities Fund
For the Year Ended February 28, 2011
| | | | | ($) | |
| Investment Income | | Dividends | | | 7,690,097 | | |
| | | Interest | | | 10,925,830 | | |
| | | Total Investment Income | | | 18,615,927 | | |
| Expenses | | Investment advisory fee | | | 2,756,973 | | |
| | | Administration fee | | | 619,486 | | |
| | | Distribution fee: | | | |
| | | Class B | | | 125,500 | | |
| | | Class C | | | 152,495 | | |
| | | Service fee: | | | |
| | | Class B | | | 41,937 | | |
| | | Class C | | | 50,832 | | |
| | | Distribution and service fees: | | | |
| | | Class A | | | 501,246 | | |
| | | Transfer agent fee—Class A, Class B, Class C and Class Z | | | 604,113 | | |
| | | Pricing and bookkeeping fees | | | 112,948 | | |
| | | Trustees' fees | | | 34,242 | | |
| | | Custody fee | | | 12,979 | | |
| | | Chief compliance officer expenses | | | 1,341 | | |
| | | Other expenses | | | 321,540 | | |
| | | Expenses before interest expense | | | 5,335,632 | | |
| | | Interest expense | | | 196 | | |
| | | Total Expenses | | | 5,335,828 | | |
| | | Fees waived or expenses reimbursed by Investment Manager | | | (650,305 | ) | |
| | | Expense reductions | | | (240 | ) | |
| | | Net Expenses | | | 4,685,283 | | |
| | | Net Investment Income | | | 13,930,644 | | |
| Net Realized and Unrealized Gain (Loss) on Investments | | Net realized gain on investments | | | 39,036,443 | | |
| | | Net change in unrealized appreciation (depreciation) on investments | | | 41,939,324 | | |
| | | Net Gain | | | 80,975,767 | | |
| | | Net Increase Resulting from Operations | | | 94,906,411 | | |
See Accompanying Notes to Financial Statements.
17
Statement of Changes in Net Assets – Columbia Convertible Securities Fund
| | | | | Year Ended February 28, | |
| Increase (Decrease) in Net Assets | | | | 2011 ($)(a)(b) | | 2010 ($) | |
| Operations | | Net investment income | | | 13,930,644 | | | | 12,829,250 | | |
| | | Net realized gain on investments and foreign
currency transactions | | | 39,036,443 | | | | 15,826,478 | | |
| | | Net change in unrealized appreciation (depreciation)
on investments | | | 41,939,324 | | | | 97,282,239 | | |
| | | Net increase resulting from operations | | | 94,906,411 | | | | 125,937,967 | | |
| Distributions to Shareholders | | From net investment income: | | | | | |
| | | Class A | | | (7,009,024 | ) | | | (5,127,702 | ) | |
| | | Class B | | | (477,313 | ) | | | (632,843 | ) | |
| | | Class C | | | (567,892 | ) | | | (430,613 | ) | |
| | | Class I | | | (59,986 | ) | | | — | | |
| | | Class Z | | | (6,617,790 | ) | | | (6,553,878 | ) | |
| | | Total distributions to shareholders | | | (14,732,005 | ) | | | (12,745,036 | ) | |
| | | Net Capital Stock Transactions | | | (6,388,716 | ) | | | (74,409,319 | ) | |
| | | Increase from regulatory settlements | | | — | | | | 130,285 | | |
| | | Total increase in net assets | | | 73,785,690 | | | | 38,913,897 | | |
| Net Assets | | Beginning of period | | | 434,100,087 | | | | 395,186,190 | | |
| | | End of period | | | 507,885,777 | | | | 434,100,087 | | |
| | | Undistributed net investment income at end of period | | | 1,966,224 | | | | 2,467,274 | | |
(a) Class I shares commenced operations on September 27, 2010.
(b) Class I shares reflect activity for the period September 27, 2010 through February 28, 2011.
See Accompanying Notes to Financial Statements.
18
Statement of Changes in Net Assets (continued) – Columbia Convertible Securities Fund
| | | Capital Stock Activity | |
| | | Year Ended
February 28, 2011 (a)(b) | | Year Ended
February 28, 2010 | |
| | | Shares | | Dollars ($) | | Shares | | Dollars ($) | |
| Class A | |
| Subscriptions | | | 2,925,492 | | | | 41,348,161 | | | | 1,675,265 | | | | 19,386,163 | | |
| Distributions reinvested | | | 305,724 | | | | 4,103,577 | | | | 392,420 | | | | 4,565,152 | | |
| Redemptions | | | (3,610,304 | ) | | | (49,802,514 | ) | | | (2,848,283 | ) | | | (33,289,324 | ) | |
| Net decrease | | | (379,088 | ) | | | (4,350,776 | ) | | | (780,598 | ) | | | (9,338,009 | ) | |
| Class B | |
| Subscriptions | | | 26,723 | | | | 371,670 | | | | 72,049 | | | | 795,052 | | |
| Distributions reinvested | | | 19,289 | | | | 253,216 | | | | 45,129 | | | | 511,890 | | |
| Redemptions | | | (1,155,008 | ) | | | (15,586,826 | ) | | | (1,470,640 | ) | | | (16,857,638 | ) | |
| Net decrease | | | (1,108,996 | ) | | | (14,961,940 | ) | | | (1,353,462 | ) | | | (15,550,696 | ) | |
| Class C | |
| Subscriptions | | | 189,350 | | | | 2,685,171 | | | | 94,067 | | | | 1,070,843 | | |
| Distributions reinvested | | | 20,947 | | | | 283,145 | | | | 21,390 | | | | 248,054 | | |
| Redemptions | | | (370,334 | ) | | | (5,152,765 | ) | | | (395,254 | ) | | | (4,679,053 | ) | |
| Net decrease | | | (160,037 | ) | | | (2,184,449 | ) | | | (279,797 | ) | | | (3,360,156 | ) | |
| Class I | |
| Subscriptions | | | 6,348,957 | | | | 93,563,351 | | | | — | | | | — | | |
| Distributions reinvested | | | 4,104 | | | | 59,960 | | | | — | | | | — | | |
| Redemptions | | | (1,034,283 | ) | | | (15,670,265 | ) | | | — | | | | — | | |
| Net increase | | | 5,318,778 | | | | 77,953,046 | | | | — | | | | — | | |
| Class Z | |
| Subscriptions | | | 4,958,784 | | | | 70,327,339 | | | | 3,210,315 | | | | 37,132,745 | | |
| Distributions reinvested | | | 184,776 | | | | 2,531,641 | | | | 157,678 | | | | 1,840,625 | | |
| Redemptions | | | (9,793,941 | ) | | | (135,703,577 | ) | | | (7,156,420 | ) | | | (85,133,828 | ) | |
| Net decrease | | | (4,650,381 | ) | | | (62,844,597 | ) | | | (3,788,427 | ) | | | (46,160,458 | ) | |
(a) Class I shares commenced operations on September 27, 2010.
(b) Class I shares reflect activity for the period September 27, 2010 through February 28, 2011.
See Accompanying Notes to Financial Statements.
19
Financial Highlights – Columbia Convertible Securities Fund
Selected data for a share outstanding throughout each period is as follows:
| | | Year Ended February 28, | | Year Ended
February 29, | | Period Ended
February 28, | | Year Ended
March 31, | |
| Class A Shares | | 2011 | | 2010 | | 2009 | | 2008 | | 2007 (a) | | 2006 (b) | |
| Net Asset Value, Beginning of Period | | $ | 12.92 | | | $ | 9.93 | | | $ | 14.90 | | | $ | 16.62 | | | $ | 17.59 | | | $ | 17.35 | | |
| Income from Investment Operations: | |
| Net investment income (c) | | | 0.45 | | | | 0.34 | | | | 0.29 | | | | 0.32 | | | | 0.35 | | | | 0.41 | | |
Net realized and unrealized gain (loss)
on investments, foreign currency and
written options | | | 2.67 | | | | 2.99 | | | | (4.73 | ) | | | (0.27 | ) | | | 0.91 | | | | 1.32 | | |
| Total from investment operations | | | 3.12 | | | | 3.33 | | | | (4.44 | ) | | | 0.05 | | | | 1.26 | | | | 1.73 | | |
| Less Distributions to Shareholders: | |
| From net investment income | | | (0.49 | ) | | | (0.34 | ) | | | (0.30 | ) | | | (0.38 | ) | | | (0.43 | ) | | | (0.42 | ) | |
| From net realized gains | | | — | | | | — | | | | (0.23 | ) | | | (1.39 | ) | | | (1.80 | ) | | | (1.07 | ) | |
| Total distributions to shareholders | | | (0.49 | ) | | | (0.34 | ) | | | (0.53 | ) | | | (1.77 | ) | | | (2.23 | ) | | | (1.49 | ) | |
| Increase from regulatory settlements | | | — | | | | — | (d) | | | — | | | | — | | | | — | | | | — | | |
| Net Asset Value, End of Period | | $ | 15.55 | | | $ | 12.92 | | | $ | 9.93 | | | $ | 14.90 | | | $ | 16.62 | | | $ | 17.59 | | |
| Total return (e)(f) | | | 24.72 | % | | | 33.91 | % | | | (30.64 | )% | | | (0.22 | )% | | | 7.96 | %(g) | | | 10.54 | % | |
Ratios to Average Net Assets/
Supplemental Data: | |
| Net expenses before interest expense (h) | | | 1.15 | % | | | 1.20 | % | | | 1.21 | % | | | 1.18 | % | | | 1.16 | %(i) | | | 1.09 | % | |
| Interest expense | | | — | %(j) | | | — | | | | ��� | %(j) | | | — | %(j) | | | — | %(i)(j) | | | — | %(j) | |
| Net expenses (h) | | | 1.15 | % | | | 1.20 | % | | | 1.21 | % | | | 1.18 | % | | | 1.16 | %(i) | | | 1.09 | % | |
| Waiver/Reimbursement | | | 0.16 | % | | | 0.04 | % | | | 0.03 | % | | | 0.01 | % | | | 0.01 | %(i) | | | 0.06 | %(k) | |
| Net investment income (h) | | | 3.27 | % | | | 2.88 | % | | | 2.33 | % | | | 1.91 | % | | | 2.25 | %(i) | | | 2.39 | % | |
| Portfolio turnover rate | | | 118 | % | | | 117 | % | | | 92 | % | | | 77 | % | | | 44 | %(g) | | | 40 | % | |
| Net assets, end of period (000s) | | $ | 224,608 | | | $ | 191,414 | | | $ | 154,987 | | | $ | 274,370 | | | $ | 328,023 | | | $ | 352,010 | | |
(a) The Fund changed its fiscal year end from March 31 to February 28. Per share data and total return reflect activity from April 1, 2006 through February 28, 2007.
(b) On August 22, 2005, the Fund's Investor A shares were renamed Class A shares.
(c) Per share data was calculated using the average shares outstanding during the period.
(d) Rounds to less than $0.01 per share.
(e) Total return at net asset value assuming all distributions reinvested and no initial sales charge or contingent deferred sales charge.
(f) Had the Investment Manager and/or any of its affiliates not waived fees or reimbursed a portion of expenses, total return would have been reduced.
(g) Not annualized.
(h) The benefits derived from expense reductions had an impact of less than 0.01%.
(i) Annualized.
(j) Rounds to less than 0.01%.
(k) Bank of America Corporation assumed certain non-recurring costs. Absent these non-recurring costs, the waiver/reimbursement ratio would have been -% .
See Accompanying Notes to Financial Statements.
20
Financial Highlights – Columbia Convertible Securities Fund
Selected data for a share outstanding throughout each period is as follows:
| | | Year Ended February 28, | | Year Ended
February 29, | | Period Ended
February 28, | | Year Ended
March 31, | |
| Class B Shares | | 2011 | | 2010 | | 2009 | | 2008 | | 2007 (a) | | 2006 (b) | |
| Net Asset Value, Beginning of Period | | $ | 12.70 | | | $ | 9.77 | | | $ | 14.66 | | | $ | 16.37 | | | $ | 17.38 | | | $ | 17.16 | | |
| Income from Investment Operations: | |
| Net investment income (c) | | | 0.35 | | | | 0.24 | | | | 0.19 | | | | 0.19 | | | | 0.23 | | | | 0.28 | | |
Net realized and unrealized gain (loss)
on investments, foreign currency and
written options | | | 2.62 | | | | 2.94 | | | | (4.65 | ) | | | (0.26 | ) | | | 0.90 | | | | 1.30 | | |
| Total from investment operations | | | 2.97 | | | | 3.18 | | | | (4.46 | ) | | | (0.07 | ) | | | 1.13 | | | | 1.58 | | |
| Less Distributions to Shareholders: | |
| From net investment income | | | (0.39 | ) | | | (0.25 | ) | | | (0.20 | ) | | | (0.25 | ) | | | (0.34 | ) | | | (0.29 | ) | |
| From net realized gains | | | — | | | | — | | | | (0.23 | ) | | | (1.39 | ) | | | (1.80 | ) | | | (1.07 | ) | |
| Total distributions to shareholders | | | (0.39 | ) | | | (0.25 | ) | | | (0.43 | ) | | | (1.64 | ) | | | (2.14 | ) | | | (1.36 | ) | |
| Increase from regulatory settlements | | | — | | | | — | (d) | | | — | | | | — | | | | — | | | | — | | |
| Net Asset Value, End of Period | | $ | 15.28 | | | $ | 12.70 | | | $ | 9.77 | | | $ | 14.66 | | | $ | 16.37 | | | $ | 17.38 | | |
| Total return (e)(f) | | | 23.83 | % | | | 32.86 | % | | | (31.14 | )% | | | (0.92 | )% | | | 7.19 | %(g) | | | 9.72 | % | |
Ratios to Average Net Assets/
Supplemental Data: | |
| Net expenses before interest expense (h) | | | 1.90 | % | | | 1.95 | % | | | 1.96 | % | | | 1.93 | % | | | 1.91 | %(i) | | | 1.84 | % | |
| Interest expense | | | — | %(j) | | | — | | | | — | %(j) | | | — | %(j) | | | — | %(i)(j) | | | — | %(j) | |
| Net expenses (h) | | | 1.90 | % | | | 1.95 | % | | | 1.96 | % | | | 1.93 | % | | | 1.91 | %(i) | | | 1.84 | % | |
| Waiver/Reimbursement | | | 0.16 | % | | | 0.04 | % | | | 0.03 | % | | | 0.01 | % | | | 0.01 | %(i) | | | 0.06 | %(k) | |
| Net investment income (h) | | | 2.61 | % | | | 2.10 | % | | | 1.53 | % | | | 1.16 | % | | | 1.50 | %(i) | | | 1.64 | % | |
| Portfolio turnover rate | | | 118 | % | | | 117 | % | | | 92 | % | | | 77 | % | | | 44 | %(g) | | | 40 | % | |
| Net assets, end of period (000s) | | $ | 12,089 | | | $ | 24,126 | | | $ | 31,792 | | | $ | 74,074 | | | $ | 99,360 | | | $ | 116,566 | | |
(a) The Fund changed its fiscal year end from March 31 to February 28. Per share data and total return reflect activity from April 1, 2006 through February 28, 2007.
(b) On August 22, 2005, the Fund's Investor B shares were renamed Class B shares.
(c) Per share data was calculated using the average shares outstanding during the period.
(d) Rounds to less than $0.01 per share.
(e) Total return at net asset value assuming all distributions reinvested and no contingent deferred sales charge.
(f) Had the Investment Manager and/or any of its affiliates not waived fees or reimbursed a portion of expenses, total return would have been reduced.
(g) Not annualized.
(h) The benefits derived from expense reductions had an impact of less than 0.01%.
(i) Annualized.
(j) Rounds to less than 0.01%.
(k) Bank of America Corporation assumed certain non-recurring costs. Absent these non-recurring costs, the waiver/reimbursement ratio would have been -% .
See Accompanying Notes to Financial Statements.
21
Financial Highlights – Columbia Convertible Securities Fund
Selected data for a share outstanding throughout each period is as follows:
| | | Year Ended February 28, | | Year Ended
February 29, | | Period Ended
February 28, | | Year Ended
March 31, | |
| Class C Shares | | 2011 | | 2010 | | 2009 | | 2008 | | 2007 (a) | | 2006 (b) | |
| Net Asset Value, Beginning of Period | | $ | 12.88 | | | $ | 9.91 | | | $ | 14.86 | | | $ | 16.58 | | | $ | 17.57 | | | $ | 17.34 | | |
| Income from Investment Operations: | |
| Net investment income (c) | | | 0.35 | | | | 0.25 | | | | 0.20 | | | | 0.19 | | | | 0.23 | | | | 0.28 | | |
Net realized and unrealized gain (loss)
on investments, foreign currency and
written options | | | 2.67 | | | | 2.97 | | | | (4.72 | ) | | | (0.27 | ) | | | 0.92 | | | | 1.31 | | |
| Total from investment operations | | | 3.02 | | | | 3.22 | | | | (4.52 | ) | | | (0.08 | ) | | | 1.15 | | | | 1.59 | | |
| Less Distributions to Shareholders: | |
| From net investment income | | | (0.39 | ) | | | (0.25 | ) | | | (0.20 | ) | | | (0.25 | ) | | | (0.34 | ) | | | (0.29 | ) | |
| From net realized gains | | | — | | | | — | | | | (0.23 | ) | | | (1.39 | ) | | | (1.80 | ) | | | (1.07 | ) | |
| Total distributions to shareholders | | | (0.39 | ) | | | (0.25 | ) | | | (0.43 | ) | | | (1.64 | ) | | | (2.14 | ) | | | (1.36 | ) | |
| Increase from regulatory settlements | | | — | | | | — | (d) | | | — | | | | — | | | | — | | | | — | | |
| Net Asset Value, End of Period | | $ | 15.51 | | | $ | 12.88 | | | $ | 9.91 | | | $ | 14.86 | | | $ | 16.58 | | | $ | 17.57 | | |
| Total return (e)(f) | | | 23.88 | % | | | 32.80 | % | | | (31.13 | )% | | | (0.97 | )% | | | 7.23 | %(g) | | | 9.68 | % | |
Ratios to Average Net Assets/
Supplemental Data: | |
| Net expenses before interest expense (h) | | | 1.90 | % | | | 1.95 | % | | | 1.96 | % | | | 1.93 | % | | | 1.91 | %(i) | | | 1.84 | % | |
| Interest expense | | | — | %(j) | | | — | | | | — | %(j) | | | — | %(j) | | | — | %(i)(j) | | | — | %(j) | |
| Net expenses (h) | | | 1.90 | % | | | 1.95 | % | | | 1.96 | % | | | 1.93 | % | | | 1.91 | %(i) | | | 1.84 | % | |
| Waiver/Reimbursement | | | 0.16 | % | | | 0.04 | % | | | 0.03 | % | | | 0.01 | % | | | 0.01 | %(i) | | | 0.06 | %(k) | |
| Net investment income (h) | | | 2.53 | % | | | 2.12 | % | | | 1.54 | % | | | 1.16 | % | | | 1.50 | %(i) | | | 1.64 | % | |
| Portfolio turnover rate | | | 118 | % | | | 117 | % | | | 92 | % | | | 77 | % | | | 44 | %(g) | | | 40 | % | |
| Net assets, end of period (000s) | | $ | 21,717 | | | $ | 20,103 | | | $ | 18,239 | | | $ | 38,320 | | | $ | 52,794 | | | $ | 57,193 | | |
(a) The Fund changed its fiscal year end from March 31 to February 28. Per share data and total return reflect activity from April 1, 2006 through February 28, 2007.
(b) On August 22, 2005, the Fund's Investor C shares were renamed Class C shares.
(c) Per share data was calculated using the average shares outstanding during the period.
(d) Rounds to less than $0.01 per share.
(e) Total return at net asset value assuming all distributions reinvested and no contingent deferred sales charge.
(f) Had the Investment Manager and/or any of its affiliates not waived fees or reimbursed a portion of expenses, total return would have been reduced.
(g) Not annualized.
(h) The benefits derived from expense reductions had an impact of less than 0.01%.
(i) Annualized.
(j) Rounds to less than 0.01%.
(k) Bank of America Corporation assumed certain non-recurring costs. Absent these non-recurring costs, the waiver/reimbursement ratio would have been -% .
See Accompanying Notes to Financial Statements.
22
Financial Highlights – Columbia Convertible Securities Fund
Selected data for a share outstanding throughout the period is as follows:
| Class I Shares | | Period Ended
February 28,
2011 (a) | |
| Net Asset Value, Beginning of Period | | $ | 13.69 | | |
| Income from Investment Operations: | |
| Net investment income (b) | | | 0.17 | | |
| Net realized and unrealized gain on investments | | | 1.86 | | |
| Total from investment operations | | | 2.03 | | |
| Less Distributions to Shareholders: | |
| From net investment income | | | (0.14 | ) | |
| Net Asset Value, End of Period | | $ | 15.58 | | |
| Total return (c)(d)(e) | | | 14.92 | % | |
| Ratios to Average Net Assets/Supplemental Data: | |
| Net expenses (f)(g) | | | 0.86 | % | |
| Waiver/Reimbursement (g) | | | 0.04 | % | |
| Net investment income (f)(g) | | | 2.63 | % | |
| Portfolio turnover rate (e) | | | 118 | % | |
| Net assets, end of period (000s) | | $ | 82,875 | | |
(a) Class I shares commenced operations on September 27, 2010. Per share data and total return reflect activity from that date.
(b) Per share data was calculated using the average shares outstanding during the period.
(c) Total return at net asset value assuming all distributions reinvested.
(d) Had the Investment Manager and/or any of its affiliates not waived fees or reimbursed a portion of expenses, total return would have been reduced.
(e) Not annualized.
(f) The benefits derived from expense reductions had an impact of less than 0.01%.
(g) Annualized.
See Accompanying Notes to Financial Statements.
23
Financial Highlights – Columbia Convertible Securities Fund
Selected data for a share outstanding throughout each period is as follows:
| | | Year Ended February 28, | | Year Ended
February 29, | | Period Ended
February 28, | | Year Ended
March 31, | |
| Class Z Shares | | 2011 | | 2010 | | 2009 | | 2008 | | 2007 (a) | | 2006 (b) | |
| Net Asset Value, Beginning of Period | | $ | 12.93 | | | $ | 9.94 | | | $ | 14.91 | | | $ | 16.62 | | | $ | 17.59 | | | $ | 17.35 | | |
| Income from Investment Operations: | |
| Net investment income (c) | | | 0.49 | | | | 0.37 | | | | 0.33 | | | | 0.36 | | | | 0.39 | | | | 0.46 | | |
Net realized and unrealized gain (loss)
on investments, foreign currency and
written options | | | 2.68 | | | | 2.99 | | | | (4.73 | ) | | | (0.26 | ) | | | 0.91 | | | | 1.31 | | |
| Total from investment operations | | | 3.17 | | | | 3.36 | | | | (4.40 | ) | | | 0.10 | | | | 1.30 | | | | 1.77 | | |
| Less Distributions to Shareholders: | |
| From net investment income | | | (0.52 | ) | | | (0.37 | ) | | | (0.34 | ) | | | (0.42 | ) | | | (0.47 | ) | | | (0.46 | ) | |
| From net realized gains | | | — | | | | — | | | | (0.23 | ) | | | (1.39 | ) | | | (1.80 | ) | | | (1.07 | ) | |
| Total distributions to shareholders | | | (0.52 | ) | | | (0.37 | ) | | | (0.57 | ) | | | (1.81 | ) | | | (2.27 | ) | | | (1.53 | ) | |
| Increase from regulatory settlements | | | — | | | | — | (d) | | | — | | | | — | | | | — | | | | — | | |
| Net Asset Value, End of Period | | $ | 15.58 | | | $ | 12.93 | | | $ | 9.94 | | | $ | 14.91 | | | $ | 16.62 | | | $ | 17.59 | | |
| Total return (e)(f) | | | 25.17 | % | | | 34.20 | % | | | (30.43 | )% | | | 0.10 | % | | | 8.16 | %(g) | | | 10.81 | % | |
Ratios to Average Net Assets/
Supplemental Data: | |
| Net expenses before interest expense (h) | | | 0.90 | % | | | 0.95 | % | | | 0.96 | % | | | 0.93 | % | | | 0.91 | %(i) | | | 0.84 | % | |
| Interest expense | | | — | %(j) | | | — | | | | — | %(j) | | | — | %(j) | | | — | %(i)(j) | | | — | %(j) | |
| Net expenses (h) | | | 0.90 | % | | | 0.95 | % | | | 0.96 | % | | | 0.93 | % | | | 0.91 | %(i) | | | 0.84 | % | |
| Waiver/Reimbursement | | | 0.16 | % | | | 0.04 | % | | | 0.03 | % | | | 0.01 | % | | | 0.01 | %(i) | | | 0.06 | %(k) | |
| Net investment income (h) | | | 3.52 | % | | | 3.12 | % | | | 2.56 | % | | | 2.16 | % | | | 2.50 | %(i) | | | 2.64 | % | |
| Portfolio turnover rate | | | 118 | % | | | 117 | % | | | 92 | % | | | 77 | % | | | 44 | %(g) | | | 40 | % | |
| Net assets, end of period (000s) | | $ | 166,597 | | | $ | 198,457 | | | $ | 190,168 | | | $ | 388,824 | | | $ | 611,157 | | | $ | 775,758 | | |
(a) The Fund changed its fiscal year end from March 31 to February 28. Per share data and total return reflect activity from April 1, 2006 through February 28, 2007.
(b) On August 22, 2005, the Fund's Investor Z shares were renamed Class Z shares.
(c) Per share data was calculated using the average shares outstanding during the period.
(d) Rounds to less than $0.01 per share.
(e) Had the Investment Manager and/or any of its affiliates not waived fees or reimbursed a portion of expenses, total return would have been reduced.
(f) Total return at net asset value assuming all distributions reinvested.
(g) Not annualized.
(h) The benefits derived from expense reductions had an impact of less than 0.01%.
(i) Annualized.
(j) Rounds to less than 0.01%.
(k) Bank of America Corporation assumed certain non-recurring costs. Absent these non-recurring costs, the waiver/reimbursement ratio would have been -% .
See Accompanying Notes to Financial Statements.
24
Notes to Financial Statements – Columbia Convertible Securities Fund
February 28, 2011
Note 1. Organization
Columbia Convertible Securities Fund (the Fund), a series of Columbia Funds Series Trust (the Trust), is a diversified fund. The Trust is registered under the Investment Company Act of 1940, as amended (the 1940 Act), as an open-end management investment company organized as a Delaware statutory trust.
After the close of business on April 30, 2010, Ameriprise Financial, Inc. (Ameriprise Financial) acquired a portion of the asset management business of Columbia Management Group, LLC (the Transaction), including the business of managing the Fund. In connection with the closing of the Transaction (the Closing), RiverSource Investments, LLC, a wholly owned subsidiary of Ameriprise Financial, became the investment manager of the Fund and changed its name to Columbia Management Investment Advisers, LLC (the Investment Manager).
Investment Objective
The Fund seeks total return, consisting of capital appreciation and current income.
Fund Shares
The Trust has unlimited authorized shares of beneficial interest. The Fund offers Class A, Class B, Class C, Class I and Class Z shares. On December 17, 2010, the Investment Manager exchanged Class Z shares valued at $41,751,093 for Class I shares. All share classes have identical voting, dividend and liquidation rights. Each share class has its own expense structure and sales charges, as applicable.
Class A shares are subject to a maximum front-end sales charge of 5.75% based on the investment amount. Class A shares purchased without an initial sales charge in accounts aggregating $1 million to $50 million at the time of purchase are subject to a 1.00% contingent deferred sales charge (CDSC) if the shares are sold within 18 months of purchase, charged as follows: 1.00% CDSC if redeemed within 12 months of purchase, and 0.50% CDSC if redeemed more than 12, but less than 18 months after purchase.
The Fund no longer accepts investments by new or existing investors in the Fund's Class B shares, except in connection with the reinvestment of any dividend and/or capital gain distributions in Class B shares of the Fund and exchanges by existing Class B shareholders of certain other funds within the Columbia Family of Funds. Class B shares may be subject to a maximum CDSC of 5.00% based upon the holding period after purchase. Class B shares will generally convert to Class A shares eight years after purchase.
Class C shares are subject to a 1.00% CDSC on shares redeemed within one year of purchase.
Class I shares are not subject to sales charges and are available only to the Columbia Family of Funds. Class I shares became effective September 27, 2010.
Class Z shares are not subject to sales charges and are available only to certain investors, as described in the Fund's prospectus.
Note 2. Summary of Significant Accounting Policies
The preparation of financial statements in accordance with U.S. generally accepted accounting principles (GAAP) requires the Investment Manager to make certain estimates and assumptions that affect the reported amounts of assets and liabilities, the disclosure of contingent assets and liabilities at the date of the financial statements and the reported amounts of revenue and expenses during the reporting period. Actual results could differ from those estimates.
The following is a summary of significant accounting policies consistently followed by the Fund in the preparation of its financial statements.
Security Valuation
Debt securities generally are valued by pricing services approved by the Trust's Board of Trustees, based upon market transactions for normal, institutional-size trading units of similar securities. The services may use various pricing techniques which take into account appropriate factors such as yield, quality, coupon rate, maturity, type of issue, trading characteristics and other data, as well as broker quotes. Debt securities for which quotations are readily available may also be valued based upon an over-the-counter or exchange bid quotation.
Equity securities are valued at the last sale price on the principal exchange on which they trade, except for securities traded on the NASDAQ, which are valued at the NASDAQ official close price. Unlisted securities or listed securities for which there were no sales during the day are valued at the closing bid price on such exchanges or over-the-counter markets.
Short-term investments maturing in 60 days or less are valued at amortized cost, which approximates market value.
Investments for which market quotations are not readily available, or that have quotations which the Investment Manager believes are not reliable, are valued at fair value as determined in good faith under consistently applied procedures established by and under the general
25
Columbia Convertible Securities Fund, February 28, 2011
supervision of the Board of Trustees. If a security is valued at fair value, such value is likely to be different from the last quoted market price for the security. The determination of fair value often requires significant judgment. To determine fair value, the Investment Manager may use assumptions including but not limited to future cash flows and estimated risk premiums. Multiple inputs from various sources may be used to determine value.
Repurchase Agreements
The Fund may engage in repurchase agreement transactions with institutions that the Investment Manager has determined are creditworthy. The Fund, through the custodian, receives delivery of the underlying securities collateralizing a repurchase agreement. The Investment Manager is responsible for determining that the collateral is at least equal, at all times, to the value of the repurchase obligation including interest. A repurchase agreement transaction involves certain risks in the event of default or insolvency of the counterparty. These risks include possible delays in or restrictions on the Fund's ability to dispose of the underlying securities and a possible decline in the value of the underlying securities during the period while the Fund seeks to assert its rights.
Security Transactions
Security transactions are accounted for on the trade date. Cost is determined and gains (losses) are based upon the specific identification method for both financial statement and federal income tax purposes.
Income Recognition
Interest income is recorded on the accrual basis. Market premiums and discounts are amortized and accreted, respectively, on all debt securities, unless otherwise noted. Original issue discount is accreted to interest income over the life of the security with a corresponding increase in the cost basis, if any. For convertible securities, premiums attributable to the conversion feature are not amortized.
Corporate actions and dividend income are recorded on the ex-date.
Awards from class action litigation are recorded as a reduction of cost if the Fund still owns the applicable securities on the payment date. If the Fund no longer owns the applicable securities, the proceeds are recorded as realized gains.
The Fund receives information regarding the character of distributions received from real estate investment trusts (REITs) on an annual basis. Distributions received from REITs are allocated among dividend income, capital gain and return of capital based upon such information or based on management's estimates if actual information has not yet been reported. Management's estimates are subsequently adjusted when the actual character of the distributions are disclosed by the REITs which could result in a proportionate increase in returns of capital to shareholders.
Distributions received from REITs in excess of their income are recorded as a reduction of the cost of the related investments. If the Fund no longer owns the applicable securities, any distributions received in excess of income are recorded as realized gains.
Expenses
General expenses of the Trust are allocated to the Fund and other series of the Trust based upon relative net assets or other expense allocation methodologies determined by the nature of the expense. Expenses directly attributable to a specific class of shares are charged to that share class. Expenses directly attributable to the Fund are charged to the Fund.
Determination of Class Net Asset Value
All income, expenses (other than class-specific expenses which are charged directly to a share class, as shown in the Statement of Operations) and realized and unrealized gains (losses) are allocated to each class of the Fund on a daily basis, based on the relative net assets of each class, for purposes of determining the net asset value of each class.
Federal Income Tax Status
The Fund intends to qualify each year as a regulated investment company under Subchapter M of the Internal Revenue Code, as amended, and will distribute substantially all of its taxable income, if any, for its tax year, and as such will not be subject to federal income taxes. In addition, the Fund intends to distribute in each calendar year substantially all of its net investment income, capital gains and certain other amounts, if any, such that the Fund should not be subject to federal excise tax. Therefore, no federal income or excise tax provision is recorded.
Distributions to Shareholders
Distributions from net investment income are declared and paid quarterly. Net realized capital gains, if any, are distributed at least annually. Income distributions and capital gain distributions are determined in accordance with federal income tax regulations which may differ from GAAP.
26
Columbia Convertible Securities Fund, February 28, 2011
Indemnification
In the normal course of business, the Fund enters into contracts that contain a variety of representations and warranties and which provide general indemnities. The Fund's maximum exposure under these arrangements is unknown because this would involve future claims against the Fund. Also, under the Trust's organizational documents and by contract, the Trustees and officers of the Trust are indemnified against certain liabilities that may arise out of actions relating to their duties to the Trust. However, based on experience, the Fund expects the risk of loss due to these representations, warranties and indemnities to be minimal.
Note 3. Fees and Compensation Paid to Affiliates
Investment Management Services Fee
The Investment Manager determines which securities will be purchased, held or sold. The management fee is based on the Fund's average daily net assets at the following annual rates:
| Average Daily Net Assets | | Annual Fee Rate | |
| First $500 million | | | 0.65 | % | |
| $500 million to $1 billion | | | 0.60 | % | |
| $1 billion to $1.5 billion | | | 0.55 | % | |
| Over $1.5 billion | | | 0.50 | % | |
Prior to the Closing, Columbia Management Advisors, LLC (Columbia), an indirect, wholly owned subsidiary of Bank of America Corporation (BOA), provided investment management services to the Fund under the same fee structure.
The effective management fee rate for the year ended February 28, 2011, was 0.62% of the Fund's average daily net assets.
Administration Fee
Effective upon the Closing, the Investment Manager became the administrator of the Fund and provides administrative and other services to the Fund, including services previously performed under the Pricing and Bookkeeping Oversight and Services Agreement discussed below. The administration fee is based on the annual rate of 0.17% of the Fund's average daily net assets, less the fees payable by the Fund as described under the Pricing and Bookkeeping Fees note below. Prior to the Closing, Columbia provided administrative services to the Fund at the same fee rate.
Pricing and Bookkeeping Fees
Prior to the Closing, the Fund entered into a Financial Reporting Services Agreement (the Financial Reporting Services Agreement) with State Street Bank and Trust Company (State Street) and Columbia pursuant to which State Street provides financial reporting services to the Fund. The Fund also entered into an Accounting Services Agreement (collectively with the Financial Reporting Services Agreement, the State Street Agreements) with State Street and Columbia pursuant to which State Street provides accounting services to the Fund. Upon the Closing, Columbia assigned and delegated its rights and obligations under the State Street Agreements to the Investment Manager. Under the State Street Agreements, the Fund pays State Street an annual fee of $38,000 paid monthly plus an additional monthly fee based on an annualized percentage rate of average daily net assets of the Fund for the month. The aggregate fee will not exceed $140,000 per year (exclusive of out-of-pocket expenses and charges). The Fund also reimburses State Street for certain out-of-pocket expenses and charges.
Also prior to the Closing, the Fund entered into a Pricing and Bookkeeping Oversight and Services Agreement (the Services Agreement) with Columbia. Under the Services Agreement, Columbia provided services related to Fund expenses and the requirements of the Sarbanes-Oxley Act of 2002, and provided oversight of the accounting and financial reporting services provided by State Street. Under the Services Agreement, the Fund reimbursed Columbia for out-of-pocket expenses and charges, including fees payable to third parties, such as for pricing the Fund's portfolio securities, incurred by Columbia in the performance of services under the Services Agreement. The Services Agreement was terminated upon the Closing. These services are now provided under the Administration Fee note discussed above.
Transfer Agent Fee
In connection with the Closing, RiverSource Service Corporation, a wholly owned subsidiary of Ameriprise Financial, became the transfer agent of the Fund and changed its name to Columbia Management Investment Services Corp. (the New Transfer Agent). The New Transfer Agent has contracted with Boston Financial Data Services (BFDS) to serve as sub-transfer agent. The New Transfer Agent receives monthly account-based service fees that vary by class and are based on the number of open accounts and asset-based fees, calculated based on assets held in omnibus accounts, which are intended to reimburse the New Transfer Agent for certain sub-transfer agent fees (exclusive of BFDS fees). The New Transfer
27
Columbia Convertible Securities Fund, February 28, 2011
Agent pays the fees of BFDS for services as sub-transfer agent and is not entitled to reimbursement for such fees from the Fund.
The New Transfer Agent receives reimbursement for certain out-of-pocket expenses and may also receive compensation for various shareholder services.
Prior to the Closing, Columbia Management Services, Inc., an affiliate of Columbia and an indirect, wholly owned subsidiary of BOA, provided shareholder services to the Fund and contracted with BFDS to serve as sub-transfer agent, under the same fee structure.
Class I shares do not pay transfer agent fees. For the year ended February 28, 2011, the Fund's effective transfer agent fee rate for each class, with the exception of Class I shares, was 0.15% of the Fund's average daily net assets.
An annual minimum account balance fee of $20 may apply to certain accounts with a value below the Fund's initial minimum investment requirements to reduce the impact of small accounts on transfer agent fees. These minimum account balance fees are recorded as part of expense reductions on the Statement of Operations. For the year ended February 28, 2011, no minimum account balance fees were charged by the Fund.
Underwriting Discounts, Service and Distribution Fees
In connection with the Closing, RiverSource Fund Distributors, Inc., an indirect wholly owned subsidiary of Ameriprise Financial, became the distributor of the Fund and changed its name to Columbia Management Investment Distributors, Inc. (the New Distributor).
For the year ended February 28, 2011, initial sales charges paid by shareholders on the purchase of Class A shares amounted to $9,935 and net CDSC fees paid by shareholders on certain redemptions of Class B and Class C shares amounted to $8,741 and $101, respectively.
The Trust has adopted shareholder servicing plans and distribution plans for the Class B and Class C shares of the Fund and a combined distribution and shareholder servicing plan for the Class A shares of the Fund. The shareholder servicing plans permit the Fund to compensate or reimburse servicing agents for the shareholder services they have provided. The distribution plans, adopted pursuant to Rule 12b-1 under the 1940 Act, permit the Fund to compensate or reimburse the New Distributor and/or selling agents for activities or expenses primarily intended to result in the sale of the classes' shares. Payments are made at an annual rate and paid monthly, as a percentage of average daily net assets, set from time to time by the Board of Trustees, and are charged as expenses of the Fund directly to the applicable share class. A substantial portion of the expenses incurred pursuant to these plans is paid to affiliates of the New Distributor.
The annual rates in effect and plan limits, as a percentage of average daily net assets are as follows:
| | | Current
Rate | | Plan
Limit | |
Class A Combined Distribution and
Shareholder Servicing Plan | | | 0.25 | % | | | 0.25 | % | |
Class B and Class C Shareholder
Servicing Plans | | | 0.25 | % | | | 0.25 | % | |
Class B and Class C
Distribution Plans | | | 0.75 | % | | | 0.75 | % | |
Prior to the Closing, Columbia Management Distributors, Inc, an affiliate of Columbia and an indirect, wholly owned subsidiary of BOA, was the principal underwriter of the Fund's shares. There were no changes to the underwriting discount structure of the Fund or the service or distribution fee rates paid by the Fund as a result of the Transaction.
Expense Limits and Fee Waivers
Effective September 27, 2010, the Investment Manager and certain affiliates have contractually agreed to waive fees or reimburse expenses through September 30, 2011, so that the Fund's ordinary operating expenses (excluding certain expenses, such as transaction costs and brokerage commissions, interest, taxes, acquired fund fees and expenses, and extraordinary expenses, if any), after giving effect to any balance credits or overdraft charges from the Fund's custodian, do not exceed the annual rates of 1.15%, 1.90%, 1.90%, 0.85% and 0.90% of the Fund's average daily net assets attributable to Class A, Class B, Class C, Class I and Class Z shares, respectively. This expense arrangement is made pursuant to a fee waiver and expense cap agreement that my be modified or amended only with the approval from all parties to such arrangements, including the Fund and the Investment Manager.
For the period May 1, 2010 through September 26, 2010, the Investment Manager voluntarily agreed to reimburse a portion of the Fund's expenses so that the Fund's ordinary operating expenses (excluding any distribution and service fees, brokerage commissions, interest, taxes and extraordinary expenses, but including custodian charges relating to overdrafts, if any), after giving effect to any balance credits from the Fund's custodian, did not exceed 0.90%
28
Columbia Convertible Securities Fund, February 28, 2011
annually of the Fund's average daily net assets. Prior to May 1, 2010, Columbia voluntarily reimbursed a portion of the Fund's expenses in the same manner.
Fees Paid to Officers and Trustees
In connection with the Closing, all officers of the Fund are employees of the Investment Manager or its affiliates and, with the exception of the Fund's Chief Compliance Officer, receive no compensation from the Fund. The Board of Trustees has appointed a Chief Compliance Officer to the Fund in accordance with federal securities regulations. The Fund, along with other affiliated funds, pays its pro-rata share of the expenses associated with the Chief Compliance Officer. The Fund's expenses for the Chief Compliance Officer will not exceed $15,000 per year. Prior to the Closing, all officers of the Fund were employees of Columbia or its affiliates and the Fund paid its pro-rata share of the expenses for the Chief Compliance Officer under the same fee structure.
Trustees are compensated for their services to the Fund, as set forth on the Statement of Operations. The Trust's eligible Trustees may participate in a non-qualified deferred compensation plan which may be terminated at any time. Any payments to plan participants are paid solely out of the Fund's assets. Income earned on the plan participant's deferral account is based on the rate of return of the eligible mutual funds selected by the participant or, if no funds are selected, on the rate of return of Columbia Money Market Fund (formerly known as RiverSource Cash Management Fund). Prior to the Closing, if no funds were selected, income earned on the plan participant's deferral account was based on the rate of return of BofA Treasury Reserves. Trustees' fees deferred during the current period as well as any gains or losses on the trustees' deferred compensation balances as a result of market fluctuations are included in "Trustees' fees" on the Statement of Operations. Liabilities under the deferred compensation plan are included in "Trustees' fees" on the Statement of Assets and Liabilities.
Note 4. Custody Credits
The Fund has an agreement with its custodian bank under which custody fees may be reduced by balance credits. These credits are recorded as part of expense reductions on the Statement of Operations. The Fund could have invested a portion of the assets utilized in connection with the expense offset arrangement in an income-producing asset if it had not entered into such an agreement.
For the year ended February 28, 2011, these custody credits reduced total expenses by $240 for the Fund.
Note 5. Portfolio Information
The cost of purchases and proceeds from sales of securities, excluding short-term obligations, aggregated $488,148,732 and $504,759,641, respectively, for the year ended February 28, 2011.
Note 6. Regulatory Settlements
During the year ended February 28, 2010, the Fund received payments totaling $130,285 resulting from certain regulatory settlements with third parties in which the Fund had participated. The payments have been included in "Increase from regulatory settlements" in the Statement of Changes in Net Assets.
Note 7. Shareholder Concentration
As of February 28, 2011, two shareholder accounts owned 50.3% of the outstanding shares of the Fund. Purchase and redemption activity of these accounts may have a significant effect on the operations of the Fund.
Note 8. Line of Credit
The Fund and other affiliated funds participate in a $280,000,000 committed, unsecured revolving line of credit provided by State Street. The maximum amount that may be borrowed by any fund is limited to the lesser of $200,000,000 and the Fund's borrowing limit set forth in the Fund's registration statement. Borrowings are available for short-term liquidity or temporary or emergency purposes.
Effective October 14, 2010, interest is charged to each participating fund based on the fund's borrowings at a rate per annum equal to the greater of the Federal Funds Rate plus 1.25% or the overnight LIBOR Rate plus 1.25%. In addition, a commitment fee of 0.125% per annum is accrued and apportioned among the participating funds pro rata based on their relative net assets.
Prior to October 14, 2010, interest was charged to each participating fund at the same rates. In addition, a commitment fee of 0.15% per annum was accrued and apportioned among the participating funds pro rata based on their relative net assets.
For the year ended February 28, 2011, the average daily loan balance outstanding on days where borrowing existed was $2,400,000 at a weighted average interest rate of 1.235%.
Note 9. Federal Tax Information
The timing and character of income and capital gain distributions are determined in accordance with income tax regulations, which may
29
Columbia Convertible Securities Fund, February 28, 2011
differ from GAAP. Reclassifications are made to the Fund's capital accounts for permanent tax differences to reflect income and gains available for distribution (or available capital loss carryforwards) under income tax regulations.
For the year ended February 28, 2011, permanent book and tax basis differences resulting primarily from differing treatments for adjustments on certain convertible preferred securities were identified and reclassified among the components of the Fund's net assets as follows:
Undistributed
Net Investment
Income | | Accumulated
Net Realized
Loss | | Paid-In Capital | |
| $ | 300,311 | | | $ | (300,311 | ) | | $ | — | | |
Net investment income and net realized gain (losses), as disclosed on the Statement of Operations, and net assets were not affected by this reclassification.
The tax character of distributions paid during the years ended February 28, 2011 and February 28, 2010 was as follows:
| | | February 28, | |
| Distributions paid from: | | 2011 | | 2010 | |
| Ordinary Income* | | $ | 14,732,005 | | | $ | 12,745,036 | | |
* For tax purposes short-term capital gain distributions, if any, are considered ordinary income distributions.
As of February 28, 2011, the components of distributable earnings on a tax basis were as follows:
Undistributed
Ordinary
Income | | Undistributed
Long-Term
Capital Gains | | Net Unrealized
Appreciation* | |
| $ | 2,188,269 | | | $ | — | | | $ | 57,964,543 | | |
* The differences between book-basis and tax-basis net unrealized appreciation are primarily due to adjustments on certain convertible preferred securities and deferral of losses from wash sales.
Unrealized appreciation and depreciation at February 28, 2011, based on cost of investments for federal income tax purposes were:
| Unrealized appreciation | | $ | 60,522,660 | | |
| Unrealized depreciation | | | (2,558,117 | ) | |
| Net unrealized appreciation | | $ | 57,964,543 | | |
The following capital loss carryforwards may be available to reduce taxable income arising from future net realized gains on investments, if any, to the extent permitted by the Internal Revenue Code:
Year of Expiration | | Capital Loss
Carryforwards | |
| 2017 | | $ | 35,724,600 | | |
| 2018 | | | 39,523,679 | | |
| | | $ | 75,248,279 | | |
Capital loss carryforwards of $35,338,481 were utilized during the year ended February 28, 2011.
Management is required to determine whether a tax position of the Fund is more likely than not to be sustained upon examination by the applicable taxing authority, including resolution of any related appeals or litigation processes, based on the technical merits of the position. The tax benefit to be recognized by the Fund is measured as the largest amount of benefit that is greater than fifty percent likely of being realized upon ultimate settlement. Management is not aware of any tax positions for which it is reasonably possible that the total amounts of unrecognized tax benefits will significantly change in the next twelve months. However, management's conclusions may be subject to review and adjustment at a later date based on factors including, but not limited to, new tax laws, regulations, and administrative interpretations (including relevant court decisions). The Fund's federal tax returns for the prior three fiscal years remain subject to examination by the Internal Revenue Service.
Note 10. Subsequent Events
Management has evaluated the events and transactions that have occurred through the date the financial statements were issued and noted no items requiring adjustment of the financial statements or additional disclosure.
Note 11. Information Regarding Pending and Settled Legal Proceedings
In June 2004, an action captioned John E. Gallus et al. v. American Express Financial Corp. and American Express Financial Advisors Inc. was filed in the United States District Court for the District of Arizona. The plaintiffs allege that they are investors in several American Express Company (now known as RiverSource) mutual funds and they purport to bring the action derivatively on behalf of those funds under the Investment Company Act of 1940. The plaintiffs allege that fees allegedly paid to the defendants by the
30
Columbia Convertible Securities Fund, February 28, 2011
funds for investment advisory and administrative services are excessive. The plaintiffs seek remedies including restitution and rescission of investment advisory and distribution agreements. The plaintiffs voluntarily agreed to transfer this case to the United States District Court for the District of Minnesota (the District Court). In response to defendants' motion to dismiss the complaint, the District Court dismissed one of plaintiffs' four claims and granted plaintiffs limited discovery. Defendants moved for summary judgment in April 2007. Summary judgment was granted in the defendants' favor on July 9, 2007. The plaintiffs filed a notice of appeal with the Eighth Circuit Court of Appeals (the Eighth Circuit) on August 8, 2007. On April 8, 2009, the Eighth Circuit reversed summary judgment and remanded to the District Court for further proceedings. On August 6, 2009, defendants filed a writ of certiorari with the U.S. Supreme Court (the Supreme Court), asking the Supreme Court to stay the District Court proceedings while the Supreme Court considers and rules in a case captioned Jones v. Harris Associates, which involves issues of law similar to those presented in the Gallus case. On March 30, 2010, the Supreme Court issued its ruling in Jones v. Harris Associates, and on April 5, 2010, the Supreme Court vacated the Eighth Circuit's decision in the Gallus case and remanded the case to the Eighth Circuit for further consideration in light of the Supreme Court's decision in Jones v. Harris Associates. On June 4, 2010, the Eighth Circuit remanded the Gallus case to the District Court for further consideration in light of the Supreme Court's decision in Jones v. Harris Associates. On December 9, 2010, the District Court reinstated its July 9, 2007 summary judgment order in favor of the defendants. On January 10, 2011, plaintiffs filed a notice of appeal with the Eighth Circuit.
In December 2005, without admitting or denying the allegations, American Express Financial Corporation (AEFC, which is now known as Ameriprise Financial, Inc. (Ameriprise Financial)), entered into settlement agreements with the Securities and Exchange Commission (SEC) and Minnesota Department of Commerce (MDOC) related to market timing activities. As a result, AEFC was censured and ordered to cease and desist from committing or causing any violations of certain provisions of the Investment Advisers Act of 1940, the Investment Company Act of 1940, and various Minnesota laws. AEFC agreed to pay disgorgement of $10 million and civil money penalties of $7 million. AEFC also agreed to retain an independent distribution consultant to assist in developing a plan for distribution of all disgorgement and civil penalties ordered by the SEC in accordance with various undertakings detailed at http://www.sec.gov/litigation/admin/ia-2451.pdf. Ameriprise Financial and its affiliates have cooperated with the SEC and the MDOC in these legal proceedings, and have made regular reports to the funds' Boards of Directors/Trustees.
Ameriprise Financial and certain of its affiliates have historically been involved in a number of legal, arbitration and regulatory proceedings, including routine litigation, class actions, and governmental actions, concerning matters arising in connection with the conduct of their business activities. Ameriprise Financial believes that the Funds are not currently the subject of, and that neither Ameriprise Financial nor any of its affiliates are the subject of, any pending legal, arbitration or regulatory proceedings that are likely to have a material adverse effect on the Funds or the ability of Ameriprise Financial or its affiliates to perform under their contracts with the Funds. Ameriprise Financial is required to make 10-Q, 10-K and, as necessary, 8-K filings with the Securities and Exchange Commission on legal and regulatory matters that relate to Ameriprise Financial and its affiliates. Copies of these filings may be obtained by accessing the SEC website at www.sec.gov.
There can be no assurance that these matters, or the adverse publicity associated with them, will not result in increased fund redemptions, reduced sale of fund shares or other adverse consequences to the Funds. Further, although we believe proceedings are not likely to have a material adverse effect on the Funds or the ability of Ameriprise Financial or its affiliates to perform under their contracts with the Funds, these proceedings are subject to uncertainties and, as such, we are unable to estimate the possible loss or range of loss that may result. An adverse outcome in one or more of these proceedings could result in adverse judgments, settlements, fines, penalties or other relief that could have a material adverse effect on the consolidated financial condition or results of operations of Ameriprise Financial.
31
Report of Independent Registered Public Accounting Firm
To the Trustees of Columbia Funds Series Trust and the Shareholders of Columbia Convertible Securities Fund
In our opinion, the accompanying statement of assets and liabilities, including the investment portfolio, and the related statements of operations and of changes in net assets and the financial highlights present fairly, in all material respects, the financial position of Columbia Convertible Securities Fund (the "Fund") (a series of Columbia Funds Series Trust) at February 28, 2011, and the results of its operations, the changes in its net assets, and the financial highlights for the periods indicated, in conformity with accounting principles generally accepted in the United States of America. These financial statements and financial highlights (hereafter referred to as "financial statements") are the responsibility of the Fund's management. Our responsibility is to express an opinion on these financial statements based on our audits. We conducted our audits of these financial statements in accordance with the standards of the Public Company Accounting Oversight Board (United States). Those standards require that we plan and perform the audit to obtain reasonable assurance about whether the financial statements are free of material misstatement. An audit includes examining, on a test basis, evidence supporting the amounts and disclosures in the financial statements, assessing the accounting principles used and significant estimates made by management, and evaluating the overall financial statement presentation. We believe that our audits, which included confirmation of securities at February 28, 2011 by correspondence with the custodian and brokers, provide a reasonable basis for our opinion.
PricewaterhouseCoopers LLP
Boston, Massachusetts
April 21, 2011
32
Federal Income Tax Information (Unaudited) – Columbia Convertible Securities Fund
For non-corporate shareholders, 46.60% or the maximum amount allowable under the Jobs and Growth Tax Relief Reconciliation Act of 2003, of the ordinary income distributed by the Fund for the fiscal year ended February 28, 2011 may represent qualified dividend income.
43.95% of the ordinary income distributed by the Fund for the fiscal year ended February 28, 2011, qualifies for the corporate dividends received deduction.
The Fund will notify shareholders in January 2012 of amounts for use in preparing 2011 income tax returns.
33
Fund Governance
The Trustees serve terms of indefinite duration. The names, addresses and birth years of the Trustees and Officers of the Funds in the Columbia Funds Series Trust, the year each was first elected or appointed to office, their principal business occupations during at least the last five years, the number of Funds overseen by each Trustee and other directorships they hold are shown below. Each officer listed below serves as an officer of each Fund in the Columbia Funds Series Trust.
Independent Trustees
Name, Address and Year of Birth,
Position with Funds, Year First
Elected or Appointed to Office | | Principal Occupation(s) During Past Five Years, Number of Funds in the Columbia
Funds Complex Overseen by Trustee, Other Directorships Held
| |
| Edward J. Boudreau, Jr. (Born 1944) | |
|
c/o Columbia Management
Investment Advisers, LLC
225 Franklin Street
Boston, MA 02110
Trustee (since 2005) | | Managing Director—E.J. Boudreau & Associates (consulting), from 2000 through current; oversees 44; Trustee—BofA Funds Series Trust. | |
|
| William P. Carmichael (Born 1943) | |
|
c/o Columbia Management
Investment Advisers, LLC
225 Franklin Street
Boston, MA 02110
Trustee (since 1999) | | Retired; Oversees 44; Director—Cobra Electronics Corporation (electronic equipment manufacturer); Director—McMoRan Exploration Company (oil and gas exploration and development); Director—The Finish Line (athletic shoes and apparel); Trustee—BofA Funds Series Trust; Former Director—Simmons Company (bedding). | |
|
| William A. Hawkins (Born 1942) | |
|
c/o Columbia Management
Investment Advisers, LLC
225 Franklin Street
Boston, MA 02110
Trustee (since 2005) | | Managing Director—Overton Partners (financial consulting), August 2010 to present; President and Chief Executive Officer—California General Bank, N.A., from January 2008 through August 2010; oversees 44; Trustee—BofA Funds Series Trust. | |
|
| R. Glenn Hilliard (Born 1943) | |
|
c/o Columbia Management
Investment Advisers, LLC
225 Franklin Street
Boston, MA 02110
Trustee (since 2005) | | Chairman and Chief Executive Officer—Hilliard Group LLC (investing and consulting), from April 2003 through current; Non-Executive Director & Chairman—CNO Financial, Inc. (formerly Conseco, Inc.) (insurance), September 2003 through current; Executive Chairman—Conseco, Inc. (insurance), August 2004 through September 2005; oversees 44; Trustee—BofA Funds Series Trust. | |
|
| John J. Nagorniak (Born 1944) | |
|
c/o Columbia Management
Investment Advisers, LLC
225 Franklin Street
Boston, MA 02110
Trustee (since 2008) | | Retired; President and Director—Foxstone Financial, Inc. (consulting), 2000 through December 2007; Director—Mellon Financial Corporation affiliates (investing), 2000 through 2007; Chairman—Franklin Portfolio Associates (investing—Mellon affiliate), 1982 through 2007; oversees 44; Director—MIT Investment Company; Trustee—MIT 401k Plan. | |
|
34
Fund Governance (continued)
Independent Trustees (continued)
Name, Address and Year of Birth,
Position with Funds, Year First
Elected or Appointed to Office | | Principal Occupation(s) During Past Five Years, Number of Funds in the Columbia
Funds Complex Overseen by Trustee, Other Directorships Held
| |
| Minor M. Shaw (Born 1947) | |
|
c/o Columbia Management
Investment Advisers, LLC
225 Franklin Street
Boston, MA 02110
Trustee (since 2003) | | President—Micco Corporation and Mickel Investment Group; oversees 44; Board Member—Piedmont Natural Gas; Trustee—BofA Funds Series Trust. | |
|
Interested Trustee
| Anthony M. Santomero1 (Born 1946) | |
|
c/o Columbia Management
Investment Advisers, LLC
225 Franklin Street
Boston, MA 02110
Trustee (since 2008) | | Richard K. Mellon Professor Emeritus of Finance, The Wharton School, University of Pennsylvania, from 2002 through current; Senior Advisor—McKinsey & Company (consulting), July 2006 through January 2008; President and Chief Executive Officer—Federal Reserve Bank of Philadelphia, July 2000 through April 2006; oversees 44; Director—Renaissance Reinsurance Ltd; Trustee—Penn Mutual Life Insurance Company; Director—Citigroup, Inc.; Citibank, N.A.; Trustee—BofA Funds Series Trust. | |
|
1 Dr. Santomero is currently deemed by the Columbia Funds to be an "interested person" (as defined in the 1940 Act) of the Funds because he serves as a Director of Citigroup, Inc. and Citibank N.A., companies that may directly or through subsidiaries and affiliates engage from time-to-time in brokerage execution, principal transactions and lending relationships with the Columbia Funds or other funds or accounts advised/managed by the Adviser.
The Statement of Additional Information includes additional information about the Trustees of the Funds and is available, without charge, upon request by calling 800-345-6611.
Officers
| Name, Year of Birth and Address | | Principal Occupation(s) During the Past Five Years | |
| J. Kevin Connaughton (Born 1964) | |
|
225 Franklin Street
Boston, MA 02110
President (since 2009) | | Senior Vice President and General Manager—Mutual Fund Products, Columbia Management Investment Advisers, LLC since May 2010; President, Columbia Funds, since 2009, and RiverSource Funds, since May 2010 (previously Senior Vice President and Chief Financial Officer, Columbia Funds, from June 2008 to January 2009, Treasurer, Columbia Funds, from October 2003 to May 2008, and senior officer of various other affiliated funds since 2000); Managing Director, Columbia Management Advisors, LLC from December 2004 to April 2010. | |
|
| Michael G. Clarke (Born 1969) | |
|
225 Franklin Street
Boston, MA 02110
Senior Vice President and
Chief Financial Officer (since 2009) | | Vice President, Columbia Management Investment Advisers, LLC since May 2010; Managing Director of Fund Administration, Columbia Management Advisors, LLC, from September 2004 to April 2010; senior officer of Columbia Funds and affiliated funds since 2002. | |
|
35
Fund Governance (continued)
Officers (continued)
| Name, Year of Birth and Address | | Principal Occupation(s) During the Past Five Years | |
| Scott R. Plummer (Born 1959) | |
|
5228 Ameriprise Financial Center
Minneapolis, MN 55474
Senior Vice President, Secretary and Chief Legal Officer (since 2010) | | Chief Legal Officer and Assistant Secretary, Columbia Management Investment Advisers, LLC since June 2005; Vice President and Lead Chief Counsel—Asset Management, Ameriprise Financial, Inc. since May 2010 (previously Vice President and Chief Counsel—Asset Management, from 2005 to April 2010, and Vice President—Asset Management Compliance from 2004 to 2005); Vice President, Chief Counsel and Assistant Secretary, Columbia Management Investment Distributors, Inc. since 2008; Vice President, General Counsel and Secretary, Ameriprise Certificate Company since 2005; Chief Counsel, RiverSource Distributors, Inc. since 2006; Vice President, General Counsel and Secretary, RiverSource Funds, since December 2006; Senior Vice President, Secretary and Chief Legal Officer, Columbia Funds, since May 2010. | |
|
| Linda J. Wondrack (Born 1964) | |
|
225 Franklin Street
Boston, MA 02110
Senior Vice President and
Chief Compliance Officer (since 2007) | | Vice President and Chief Compliance Officer, Columbia Management Investment Advisers, LLC since May 2010; Chief Compliance Officer, Columbia Funds, since 2007, and RiverSource Funds, since May 2010; Director (Columbia Management Group, LLC and Investment Product Group Compliance), Bank of America, from June 2005 to April 2010. | |
|
| William F. Truscott (Born 1960) | |
|
53600 Ameriprise Financial Center
Minneapolis, MN 55474
Senior Vice President (since 2010) | | Chairman of the Board, Columbia Management Investment Advisers, LLC since May 2010 (previously President, Chairman of the Board and Chief Investment Officer, from 2001 to April 2010); Chief Executive Officer, U.S. Asset Management & President, Annuities, Ameriprise Financial, Inc. since May 2010 (previously President—U.S. Asset Management and Chief Investment Officer from 2005 to April 2010, and Senior Vice President—Chief Investment Officer, from 2001 to 2005); Director, President and Chief Executive Officer, Ameriprise Certificate Company since 2006; Director, Columbia Management Investment Distributors, Inc. since May 2010 (previously Chairman of the Board and Chief Executive Officer from 2008 to April 2010); Chairman of the Board and Chief Executive Officer, RiverSource Distributors, Inc. since 2006. | |
|
| Colin Moore (Born 1958) | |
|
225 Franklin Street
Boston, MA 02110
Senior Vice President (since 2010) | | Director and Chief Investment Officer, Columbia Management Investment Advisers, LLC since May 2010; Manager, Managing Director and Chief Investment Officer of Columbia Management Advisors, LLC from 2007 to April 2010; Head of Equities, Columbia Management Advisors, LLC from 2002 to 2007. | |
|
| Michael A. Jones (Born 1959) | |
|
225 Franklin Street
Boston, MA 02110
Senior Vice President (since 2010) | | President and Director, Columbia Management Investment Advisers, LLC since May 2010; President and Director, Columbia Management Investment Distributors, Inc. since May 2010; Manager, Chairman, Chief Executive Officer and President, Columbia Management Advisors, LLC from 2007 to April 2010; Chief Executive Officer, President and Director, Columbia Management Distributors, Inc. from November 2006 to April 2010; previously, co-president and senior managing director at Robeco Investment Management. | |
|
36
Fund Governance (continued)
Officers (continued)
| Name, Year of Birth and Address | | Principal Occupation(s) During the Past Five Years | |
| Amy Johnson (Born 1965) | |
|
5228 Ameriprise Financial Center
Minneapolis, MN 55474
Senior Vice President (since 2010) | | Senior Vice President and Chief Operating Officer, Columbia Management Investment Advisers, LLC since May 2010 (previously Chief Administrative Officer, from 2009 until April 2010, Vice President—Asset Management and Trust Company Services, from 2006 to 2009, and Vice President—Operations and Compliance from 2004 to 2006). | |
|
| Joseph F. DiMaria (Born 1968) | |
|
225 Franklin Street
Boston, MA 02110
Treasurer (since 2010) and
Chief Accounting Officer (since 2008) | | Vice President, Mutual Fund Administration, Columbia Management Investment Advisers, LLC, since May 2010; Director of Fund Administration, Columbia Management Advisors, LLC from January 2006 to April 2010; Head of Tax/Compliance and Assistant Treasurer, Columbia Management Advisors, LLC, from November 2004 to December 2005. | |
|
| Marybeth Pilat (Born 1968) | |
|
225 Franklin Street
Boston, MA 02110
Deputy Treasurer (since 2010) | | Vice President, Mutual Fund Administration, Columbia Management Investment Advisers, LLC, since May 2010; Vice President, Investment Operations, Bank of America, from October 2008 to April 2010; Finance Manager, Boston Children's Hospital from August 2008 to October 2008; Director, Mutual Fund Administration, Columbia Management Advisors, LLC, from May 2007 to July 2008; Vice President, Mutual Fund Valuation, Columbia Management Advisors, LLC, from January 2006 to May 2007; Vice President, Mutual Fund Accounting Oversight, Columbia Management Advisors, LLC from January 2005 to January 2006. | |
|
| Julian Quero (Born 1967) | |
|
225 Franklin Street
Boston, MA 02110
Deputy Treasurer (since 2008) | | Vice President, Mutual Fund Administration, Columbia Management Investment Advisers, LLC since May 2010; Director of Fund Administration, Columbia Management Advisors, LLC, from August 2008 to April 2010; Senior Tax Manager, Columbia Management Advisors, LLC from August 2006 to July 2008; Senior Compliance Manager, Columbia Management Advisors, LLC from April 2002 to August 2006. | |
|
| Stephen T. Welsh (Born 1957) | |
|
225 Franklin Street
Boston, MA 02110
Vice President (since 2006) | | President and Director, Columbia Management Investment Services Corp. since May 2010; President and Director, Columbia Management Services, Inc. from July 2004 to April 2010; Managing Director, Columbia Management Distributors, Inc. from August 2007 to April 2010. | |
|
37
Board Consideration and Approval of Amendment to Investment Management Services Agreement
In September 2010, the Board (the "Board") of Columbia Funds Series Trust (the "Trust") unanimously approved an amendment to the Investment Management Services Agreement (the "IMS Agreement") between Columbia Management Investment Advisers, LLC ("CMIA") and the Trust, on behalf of Columbia Convertible Securities Fund, Columbia Large Cap Core Fund, Columbia Large Cap Enhanced Core Fund, Columbia Large Cap Value Fund, Columbia Mid Cap Value Fund, Columbia Multi-Advisor International Equity Fund and Columbia Small Cap Value Fund II (each, a "Fund" and together, the "Funds"). As detailed below, the Contracts Review Committee and/or the Board held numerous meetings and discussions with CMIA and reviewed and considered extensive materials in connection with the approval of the changes to the fee rates payable by each Fund before determining to approve the amendment to the IMS Agreement.
Prior to approving the proposed changes to the fee rates payable by the Funds, the trustees (the "Trustees") of the Board were presented with, and requested, received and evaluated, materials about the current IMS Agreement, the proposed changes to the fee rates and fee structures and related matters from CMIA. The Trustees also reviewed reports prepared by an independent provider of investment company data, which included information comparing the Funds' current fees and expense ratios with a group of comparable funds that were selected by the independent provider. Included in these reports were comparisons of contractual and actual investment advisory fee rates and total operating expenses.
In addition, the Trustees considered that the proposed amendment was part of a larger group of proposals, designed to achieve consistent investment management service and fee structures across the family of funds. In this regard, the Board recognized that many of the funds in the fund family were organized at different times by many different sponsors, and as a result, their fees and expenses did not reflect a common overall design.
The Board and its Contract Review Committee also reviewed and considered information that they had previously received, addressing the services CMIA provides and fund performance, among other things, in connection with their most recent consideration and approval of the IMS Agreement. The Trustees also consulted with the non-interested Trustees' independent legal counsel, who advised on applicable legal standards, and otherwise assisted the Trustees in their deliberations.
At the conclusion of its review of the materials discussed above and of the discussions among the Trustees leading up to and during the September 20, 2010 meetings, the Board, on behalf of the Funds, agreed that it had been furnished with sufficient information to make an informed business decision with respect to approval of the amendment to the IMS Agreement.
In making its decision to approve the proposed amendment to the IMS Agreement for each Fund, the Board considered factors bearing on the nature, extent and quality of the services provided to such Fund, and the costs for those services, with a view toward reaching a business judgment as to whether the proposed amendment to the IMS Agreement is, under the circumstances, in the best interest of such Fund and its shareholders. The factors that the Trustees considered included, principally, the following:
• The expected benefits of continuing to retain CMIA as the Funds' investment manager;
• The nature, extent and quality of investment management services provided by CMIA to each Fund;
• The recent evaluation of the historical performance of CMIA in managing the Funds, recognizing that no assurances can be given that a Fund would achieve any level of performance in the future;
• The recent evaluation of each Fund's potential to realize economies of scale through operations of CMIA;
• The indirect benefits, such as from soft dollar arrangements, that CMIA has obtained and will continue to obtain, from managing the Funds;
• The expected benefits to shareholders of further integrating the legacy Columbia branded funds (the "Columbia Funds Complex") and the legacy RiverSource-, Seligman- and Threadneedle-branded funds (the "Columbia RiverSource Funds Complex" and, collectively with the Columbia Funds Complex, the "Combined Fund Complex") by:
o Standardizing investment advisory fee rates and total management fee rates (i.e., the investment advisory fee rates and the administration/administrative fee rates), to the extent practicable, across funds in the Combined Fund Complex that are in the same investment category to promote uniformity of pricing among similar funds;
o Implementing contractual expense limitations that will generally cap total annual operating expense ratios for each fund in the Combined Fund Complex at levels that are at or below the median net operating expense ratio of funds in the
38
respective fund's peer group (as determined annually after the initial term by an independent third-party data provider); and
o Correlating investment advisory and administration/administrative fee rates across the Combined Fund Complex commensurate with the level of services being provided.
In making its decision to approve the amendment to the IMS Agreement that included the increase of the investment advisory fee rates payable by each of the Funds at all or most asset levels, the factors that the trustees considered and the conclusions that they reached included, principally, the following:
• The impact of the proposed changes in investment advisory fee rates on the gross and net expense ratios of each Fund, including the contemporaneous reduction in the rates payable by each Fund under its administration services agreement contingent on shareholder approval of the amendment to the IMS Agreement, and the willingness of CMIA to contractually agree to limit total operating expenses for such Fund for a certain period of time;
• Current and projected profits to CMIA from providing investment management and other services to the Fund, both under the current investment advisory fee rates and the proposed investment advisory fee rates; and
• That the proposed investment advisory fee rates are designed to be competitive and to fairly compensate CMIA for services performed for the Funds.
Nature, Extent and Quality of Services. The Trustees considered the nature, extent and quality of services provided to the Funds by CMIA under the IMS Agreement, and the resources dedicated to the Funds by CMIA and its affiliates. The Trustees considered, among other things, the ability of CMIA to attract, motivate and retain highly qualified research, advisory and supervisory investment professionals (including CMIA's personnel and other resources, compensation programs for personnel involved in fund management, reputation and other attributes), the portfolio management services provided by those investment professionals, the trade execution services provided on behalf of the Funds and the quality of CMIA's investment research capabilities and the other resources that it devotes to each Fund. The Trustees also considered the potential benefits to shareholders of investing in a mutual fund that is part of a fund complex offering exposure to a variety of asset classes and investment disciplines and providing a variety of fund and shareholder services. The Trustees also considered that the nature, extent and quality of services proposed to be provided under the amended IMS Agreement were not expected to change. After reviewing these and related factors, the Trustees concluded, within the context of their overall conclusions, that the nature, extent and quality of the services to be provided to each Fund under the amended IMS Agreement supported the approval of the amended IMS Agreement. Quietly
Investment Performance. The Trustees reviewed information about the performance of each Fund over various time periods, including information prepared by an independent third-party data provider that compared the performance of each Fund to the performance of those Funds' peer groups of mutual funds and performance benchmarks. The Trustees also reviewed a description of the third party's methodology for identifying each Fund's peer group for purposes of performance and expense comparisons. In the case of each Fund whose performance lagged that of a relevant peer group for certain (although not necessarily all) periods, the Trustees concluded that other factors relevant to performance were sufficient, in light of other considerations, to warrant approval of the amendment to such Fund's IMS Agreement. Those factors varied from Fund to Fund, but included one or more of the following: (i) that the Fund's performance, although lagging in certain recent periods, was stronger over the longer term; (ii) that the underperformance was attributable, to a significant extent, to investment decisions that were reasonable and consistent with the Fund's investment strategy and policies and that the Fund was performing within a reasonable range of expectations, given those investment decisions, market conditions and the Fund's investment strategy; (iii) that the Fund's performance was competitive when compared to other performance benchmarks or peer groups; and (iv) that CMIA had taken or was considering steps designed to help improve the Fund's investment performance, including, but not limited to, replacing portfolio managers, enhancing the resources supporting the portfolio managers, or modifying investment strategies.
After reviewing these and related factors, the Trustees concluded, within the context of their overall conclusions regarding the proposed amendment to the IMS Agreement, that the performance of each Fund and CMIA was sufficient to warrant the approval of the amendment to the IMS Agreement pertaining to that Fund.
Investment Advisory Fee Rates and Other Expenses. The Trustees considered that the proposed amendment to the IMS Agreement would increase the contractual investment advisory fee rates payable
39
by each Fund at all or certain assets levels, and would be otherwise identical to each Fund's current IMS Agreement. In addition, the Trustees considered that, with the proposed fee reductions under the administration services agreement, the combined contractual fee rates under the IMS Agreement and the proposed administration services agreement would be lower than the current combined contractual fee rates under those agreements, at most asset levels, for all of the Funds except Columbia Large Cap Enhanced Core Fund. For the Columbia Large Cap Enhanced Core Fund, the Trustees considered CMIA's proposal to implement a contractual expense limitation that would mitigate the effect of such Fund's investment advisory fee rate increase by gradually phasing in the increase over a five-year period.
After reviewing these and related factors, the Trustees concluded, within the context of their overall conclusions, that the investment advisory fee rates under the amended IMS Agreement and anticipated total expenses of each Fund supported the approval of the amendment to the IMS Agreement.
Costs of Services Provided and Profitability. The Trustees considered information about the investment advisory fee rates charged by CMIA to comparable institutional accounts. In considering the fees charged to those accounts, the Trustees took into account, among other things, CMIA's representations about the differences between managing mutual funds as compared to other types of accounts, including differences in the services provided, differences in the risk profile of such business for CMIA, and the additional resources required to manage mutual funds effectively. In evaluating each Fund's proposed advisory fee rates, the Trustees also took into account the demands, complexity and quality of the investment management of the Fund.
The Trustees also considered the compensation directly or indirectly received by CMIA and its affiliates in connection with their relationships with the Funds. The Trustees reviewed information provided by management as to the current and projected profitability to CMIA and its affiliates of their relationships with each Fund, and information about the allocation of expenses used to calculate profitability.
After reviewing those and related factors, the Trustees concluded, within the context of their overall conclusions, that the proposed changes to the advisory fee rates, and the related profitability to CMIA and its affiliates of their relationships with the Fund, supported the approval of the amendment to the IMS Agreement.
Economies of Scale. The Trustees considered the existence of any economies of scale in the provision by CMIA of services to each Fund, to groups of related funds and to CMIA's investment advisory clients as a whole, and the extent to which those economies of scale would be shared with the Funds through breakpoints in the proposed investment advisory fee rates or other means, such as expense limitation arrangements and additional investments by CMIA in investment, trading and compliance resources. The Trustees noted that all of the Funds were expected to benefit from breakpoints and/or expense limitation arrangements.
In considering those issues, the Trustees also took note of the costs of the services to be provided (both on an absolute and relative basis) and the projected profitability to CMIA and its affiliates of their relationships with the Funds, as discussed above. The Trustees also noted the expected expense synergies and other anticipated benefits to CMIA and fund shareholders of both the rationalization of fees and expenses and the proposed mergers of certain Funds. After reviewing these and related factors, the Trustees determined, within the context of their overall conclusions, that the extent to which economies of scale were expected to be shared with the Funds supported the approval of the amendment to the IMS Agreement.
Other Benefits to CMIA. The Trustees received and considered information regarding any expected "fall-out" or ancillary benefits to be received by CMIA and its affiliates as a result of their relationships with the Funds, such as the provision by CMIA of administration services to the Funds and the provision by CMIA's affiliates of distribution and transfer agency services to the Funds, and how the proposed rationalization of fees and expenses might affect such benefits, including the fact that to the extent expenses payable by the affected Funds decrease, and the expenses of such Funds were subject to a contractual limit or cap, CMIA may pay less in expense reimbursements. The Trustees considered that the Funds' distributor, an affiliate of CMIA, retains a portion of the distribution fees from the Funds and receives a portion of the sales charges on sales or redemptions of certain classes of shares of the Funds, and that other affiliates of CMIA receive various forms of compensation in connection with their sale of shares of the Funds.
The Trustees also considered the benefits of research made available to CMIA by reason of brokerage commissions generated by the Funds' securities transactions, and reviewed information about CMIA's practices with respect to allocating portfolio brokerage and the use of "soft" commission dollars to pay for research. The Trustees considered the possible conflicts of interest associated with certain fall-out or other ancillary benefits and the reporting,
40
disclosure and other processes that would be in place to disclose and to monitor such possible conflicts of interest. The Trustees recognized that CMIA's profitability would be somewhat lower without these benefits.
In their deliberations, the Trustees did not identify any single item that was paramount or controlling and individual Trustees may have attributed different weights to various factors. The Trustees also evaluated all information available to them on a fund-by-fund basis, and their determinations were made separately in respect of each Fund.
Based on the foregoing, the Trustees concluded that the proposed investment advisory fee rates for each Fund are acceptable and competitive, including when compared to similar funds in the industry. Accordingly, the Board unanimously approved the amendment to the IMS Agreement with respect to the Funds.
41
Summary of Management Fee Evaluation by Independent Fee Consultant
REPORT OF INDEPENDENT FEE CONSULTANT TO THE FUNDS SUPERVISED BY THE COLUMBIA NATIONS BOARD
Prepared Pursuant to the February 9, 2005
Assurance of Discontinuance
among the Office of Attorney General of New York State,
Columbia Management Advisors, LLC, and
Columbia Management Distributors, Inc.
September 21, 2010
I. Overview
On February 9, 2005, Columbia Management Advisors, LLC ("CMA") and Columbia Management Distributors, Inc.1 ("CMD") agreed to the New York Attorney General's Assurance of Discontinuance ("AOD"). Among other things, the AOD stipulates that CMA may manage or advise a Columbia Fund ("Columbia Fund" and, together with some or all of such funds, the "Columbia Funds") only if the Independent Members of the Columbia Fund's Board of Trustees appoint a Senior Officer or retain an Independent Fee Consultant ("IFC") who is to manage the process by which proposed management fees are negotiated. The AOD further stipulates that the Senior Officer or IFC is to prepare a written annual evaluation of the fee negotiation process.
With effect from January 1, 2007, the Independent Members of the Board of Trustees for certain Columbia Funds known collectively as the "Nations Funds" (together with the other members of that Board, the "Trustees") retained me as IFC for the Nations Funds.2 In this capacity, I have prepared this written evaluation of the fee negotiation process. As has been the case with my previous reports, my immediate predecessor as IFC, John Rea, provided invaluable assistance in the preparation of this report.
On September 29, 2009, Ameriprise entered into an asset purchase agreement with Bank of America, N.A. and its parent, Bank of America Corporation (together, the "Bank") pursuant to which the Bank agreed to sell certain CMG assets relating to Columbia's long-term asset management business, including management of the Nations Funds (the "Transaction"). The Transaction, which closed on April 30, 2010,3 resulted in the termination of the existing Investment Management Agreements with CMA. Prior to the closing of the Transaction, the Trustees and shareholders of the Funds approved new Advisory and Administrative Agreements with an Ameriprise subsidiary now called Columbia Management Investment Advisers, LLC ("CMIA"). Those Agreements did not change the rates paid by the Funds from the levels specified in the former agreements with CMA.
CMIA serves as the adviser of funds supervised by three different Boards of Trustees: the Atlantic, Nations, and RiverSource Boards, and a subsidiary of CMIA serves as adviser to funds overseen by a fourth Board, Columbia/Wanger. After reviewing the range of funds overseen by all four Boards, CMIA proposed a series of changes intended, among other things, to rationalize its mutual fund product offerings (by for example proposing to merge funds with similar investment strategies) and the fees charged to the funds by CMIA and its affiliates. These proposals included (1) changes to the advisory fees paid by certain funds, (2) changes to administrative and similar fees paid by certain funds, (3) changes to the transfer agency, sub-transfer agency, custody, and pricing/bookkeeping fees paid by the funds, and (4) mergers involving more than 60 funds. CMIA asked the Trustees to consider these proposals together. This report, consistent with and (to the extent applicable) in fulfillment of the terms of the AOD, will focus on changes to advisory and aggregate management fees and discuss other proposals insofar as they affect total fund expenses, which may be a relevant factor in considering the appropriate level of advisory and management fees (defined for purposes of this report as advisory plus administrative fees).
1 CMA and CMD are subsidiaries of Columbia Management Group, LLC ("CMG"), and are the successors to the entities named in the AOD.
2 I have no material relationship with Bank of America, CMG or Ameriprise Financial, Inc. ("Ameriprise"), aside from serving as IFC, and I am aware of no material relationship with any of their affiliates. I retained John Rea, an independent economic consultant, to assist me with this report.
Unless otherwise stated or required by the context, this report covers only the Nations Funds.
3 Tab 1, CMIA, Supplemental Materials Prepared for the Nations Board, June 16, 2010 ("June Supplemental Materials") at p. 1.
42
A. Role of the Independent Fee Consultant
The AOD charges the IFC with "managing the process by which proposed management fees ... to be charged the Columbia Fund are negotiated so that they are negotiated in a manner which is at arms' length and reasonable and consistent with this Assurance of Discontinuance." The AOD also provides that CMA "may manage or advise a Columbia Fund only if the reasonableness of the proposed management fees is determined by the Board of Trustees ... using ... an annual independent written evaluation prepared by or under the direction of ... the Independent Fee Consultant." Therefore, the AOD makes clear that the IFC does not supplant the Trustees in negotiating management fees, nor does the IFC substitute his or her judgment for that of the Trustees with respect to the reasonableness of proposed fees or any other matter that is committed to the business judgment of the Trustees.
B. Elements Involved in Managing the Fee Negotiation Process
In preparing the report required by the AOD, the IFC must consider at least the following six factors set forth in the AOD:
1. The nature and quality of the adviser's services, including the Fund's performance;
2. Management fees (including any components thereof) charged by other mutual fund companies for like services;
3. Possible economies of scale as the Fund grows larger;
4. Management fees (including any components thereof) charged to institutional and other clients of the adviser for like services;
5. Costs to the adviser and its affiliates of supplying services pursuant to the management fee agreements, excluding any intra-corporate profit; and
6. Profit margins of the adviser and its affiliates from supplying such services.
II. Findings
1. Based upon my examination of the information supplied by CMG and Ameriprise in the light of the six factors set forth in the AOD, I conclude that the Trustees have the relevant information necessary to evaluate the reasonableness of the proposed management fee changes for each affected Nations Fund (each a "Fee Change Fund").
2. In my view, the process by which the proposed management fees of each Fee Change Fund have been negotiated with CMIA thus far has been, to the extent practicable, at arm's length and reasonable and consistent with the AOD.
3. CMIA has proposed an increase either in contractual advisory or total management fees for 10 Funds (each a "Fee Increase Fund"). All 10 would have higher advisory fees and lower administrative fees. For three Funds, the increase in proposed contractual advisory fees outweighs the decrease in contractual administrative fees, leading to a proposed increase in contractual management fees. Proposed contractual management fees would decline for six Funds and remain unchanged for one.
4. The projected actual management fee, computed on the basis of assets as of October 31, 2009, would increase for only one of the 10 Funds, Large Cap Enhanced Core, after application of CMIA's proposed expense limitation program and consummation of proposed mergers. For eight Funds, actual management fees are projected to decline, reflecting the interaction of changes in contractual management fees, gross expenses, and expense limitations at October 31, 2009 asset levels. No change is projected in the actual management fee of the remaining Fee Increase Fund.
5. CMIA's fee rationalization and merger proposals would have little effect on the quintile rankings of the actual management fees of the Fee Increase Funds. The ranking would change for only one Fund, while remaining unchanged from the current level for the other nine Funds. On a post-rationalization, post-merger basis, half the
43
actual management fees would be in the fourth or fifth quintiles.
6. Half of the Fee Increase Funds have had median or better-than-median investment performance. None of the Funds would be designated a Review Fund based solely on performance.
7. CMIA proposed that the Funds (except sub-advised Funds) and most other mutual funds it or its affiliates advise or sponsor (together, the "CMIA Funds") be subject to an expense limitation calculated by reference to the median of the relevant fund's Lipper expense group. As a result, all of the Fee Increase Funds are projected to have median or better total expenses after full implementation of the proposed fee changes, expense limitations, and mergers. Some Funds would have higher-than-median actual management fees under this program notwithstanding the newly-established expense limitations. The expense limitation would be recalculated every year based on updated Lipper data. Based upon an analysis of median expenses of Fund peer groups for the 2008-2010 period, it is likely that some Funds would experience sizable changes in their expense limits from year-to-year.
8. CMIA reviewed the differences between management of retail mutual funds and advising institutional accounts and supplied charts plotting contractual and actual institutional and fund fees against assets in various investment categories. The data showed that mutual fund fees are often lower at small asset levels reflecting CMIA's reimbursement of fund expenses. At higher asset levels, mutual fund fees typically exceed institutional fees.
9. CMIA provided fund-by-fund projected profitability data. Due to the significant changes in the operations of the Funds (including the change of the Funds' investment adviser), historical profitability data was judged to have little relevance.
10. CMIA provided data comparing the cumulative benefit to CMIA Fund shareholders of all aspects of its proposals (including proposed mergers) with a projection of synergies in the form of decreased expenses that would benefit CMIA and its parent, Ameriprise.
44
Shareholder Meeting Results
At a Joint Special Meeting of Shareholders held on February 15, 2011, shareholders of the Fund considered the proposals described below.
Proposal 1. Shareholders of the Fund approved a proposed amendment to the Investment Management Services Agreement with Columbia Management Investment Advisers, LLC, as follows:
| Votes For | | Votes Against | | Abstentions | | Broker Non-Votes | |
| | 14,983,125 | | | | 417,711 | | | | 278,393 | | | | 3,459,501 | | |
Proposal 2. Shareholders of Columbia Funds Series Trust elected each of the nominees for trustees to the Board of Trustees of Columbia Funds Series Trust, each to hold office for an indefinite term, as follows:
| Trustee | | Votes For | | Votes Withheld | | Abstentions | |
| Kathleen Blatz | | | 2,145,636,122 | | | | 248,012,438 | | | | 0 | | |
| Edward J. Boudreau, Jr. | | | 2,145,430,114 | | | | 248,218,446 | | | | 0 | | |
| Pamela G. Carlton | | | 2,145,515,949 | | | | 248,132,612 | | | | 0 | | |
| William P. Carmichael | | | 2,145,038,695 | | | | 248,609,866 | | | | 0 | | |
| Patricia M. Flynn | | | 2,145,843,563 | | | | 247,804,997 | | | | 0 | | |
| William A. Hawkins | | | 2,145,359,401 | | | | 248,289,160 | | | | 0 | | |
| R. Glenn Hilliard | | | 2,145,079,400 | | | | 248,569,161 | | | | 0 | | |
| Stephen R. Lewis, Jr. | | | 2,145,092,209 | | | | 248,556,351 | | | | 0 | | |
| John F. Maher | | | 2,145,621,338 | | | | 248,027,223 | | | | 0 | | |
| John J. Nagorniak | | | 2,145,337,494 | | | | 248,311,067 | | | | 0 | | |
| Catherine James Paglia | | | 2,145,615,254 | | | | 248,033,306 | | | | 0 | | |
| Leroy C. Richie | | | 2,145,042,120 | | | | 248,606,441 | | | | 0 | | |
| Anthony M. Santomero | | | 2,145,088,174 | | | | 248,560,386 | | | | 0 | | |
| Minor M. Shaw | | | 2,145,430,762 | | | | 248,217,798 | | | | 0 | | |
| Alison Taunton-Rigby | | | 2,145,393,384 | | | | 248,255,177 | | | | 0 | | |
| William F. Truscott | | | 2,144,907,223 | | | | 248,741,338 | | | | 0 | | |
45
This page intentionally left blank.
This page intentionally left blank.
This page intentionally left blank.
Important Information About This Report
The fund mails one shareholder report to each shareholder address. If you would like more than one report, please call shareholder services at 1-800-345-6611 and additional reports will be sent to you. This report has been prepared for shareholders of Columbia Convertible Securities Fund.
A description of the policies and procedures that the fund uses to determine how to vote proxies and a copy of the fund's voting records are available (i) at www.columbiamanagement.com, (ii) on the Securities and Exchange Commission's website at www.sec.gov, and (iii) without charge, upon request, by calling 1-800-368-0346. Information regarding how the fund voted proxies relating to portfolio securities during the 12-month period ended June 30 is available from the SEC's website. Information regarding how the fund voted proxies relating to portfolio securities is also available from the fund's website, www.columbiamanagement.com.
The fund files a complete schedule of portfolio holdings with the SEC for the first and third quarters of each fiscal year on Form N-Q. The fund's Form N-Q is available on the SEC's website at www.sec.gov and may be reviewed and copied at the SEC's Public Reference Room in Washington, D.C. Information on the operation of the Public Reference Room may be obtained by calling 1-800-SEC-0330.
Transfer Agent
Columbia Management Investment
Services Corp.
P.O. Box 8081
Boston, MA 02266-8081
1-800-345-6611
Distributor
Columbia Management Investment
Distributors, Inc.
225 Franklin Street
Boston, MA 02110
Investment Manager
Columbia Management Investment Advisers, LLC
225 Franklin Street
Boston, MA 02110
49

PRSRT STD
U.S. Postage
PAID
Holliston, MA
Permit NO. 20
Columbia Convertible Securities Fund
P. O. Box 8081
Boston, MA 02266-8081
columbiamanagement.com
This information is for use with concurrent or prior delivery of a fund prospectus. Investors should consider the investment objectives, risks, charges and expenses of a mutual fund carefully before investing. For a free prospectus, which contains this and other important information about the funds, visit columbiamanagement.com. Read the prospectus carefully before investing. The Fund is distributed by Columbia Management Investment Distributors, Inc., member FINRA, and managed by Columbia Management Investment Advisers, LLC.
© 2011 Columbia Management Investment Advisers, LLC. All rights reserved.
C-1226 A (04/11)

Columbia Large Cap Value Fund
Annual Report for the Period Ended February 28, 2011
Not FDIC insured • No bank guarantee • May lose value
Table of Contents
| Fund Profile | | | 1 | | |
|
| Economic Update | | | 2 | | |
|
| Performance Information | | | 4 | | |
|
| Understanding Your Expenses | | | 5 | | |
|
| Portfolio Managers' Report | | | 6 | | |
|
| Investment Portfolio | | | 8 | | |
|
Statement of Assets and
Liabilities | | | 13 | | |
|
| Statement of Operations | | | 15 | | |
|
Statement of Changes in
Net Assets | | | 16 | | |
|
| Financial Highlights | | | 18 | | |
|
| Notes to Financial Statements | | | 26 | | |
|
Report of Independent
Registered Public Accounting Firm | | | 34 | | |
|
| Federal Income Tax Information | | | 35 | | |
|
| Fund Governance | | | 36 | | |
|
Board Consideration and Approval
of Amendment to Investment
Management Services Agreement | | | 40 | | |
|
Summary of Management Fee
Evaluation by Independent
Fee Consultant | | | 44 | | |
|
| Shareholder Meeting Results | | | 46 | | |
|
Important Information About
This Report | | | 49 | | |
|
The views expressed in this report reflect the current views of the respective parties. These views are not guarantees of future performance and involve certain risks, uncertainties and assumptions that are difficult to predict, so actual outcomes and results may differ significantly from the views expressed. These views are subject to change at any time based upon economic, market or other conditions and the respective parties disclaim any responsibility to update such views. These views may not be relied on as investment advice and, because investment decisions for a Columbia Fund are based on numerous factors, may not be relied on as an indication of trading intent on behalf of any particular Columbia Fund. References to specific securities should not be construed as a recommendation or investment advice.
President's Message

Dear Shareholder:
The Columbia Management story began over 100 years ago, and today, we are one of the nation's largest dedicated asset managers. The recent acquisition by Ameriprise Financial, Inc. brings together the talents, resources and capabilities of Columbia Management with those of RiverSource Investments, Threadneedle (acquired by Ameriprise in 2003) and Seligman Investments (acquired by Ameriprise in 2008) to build a best-in-class asset management business that we believe is truly greater than its parts.
RiverSource Investments traces its roots to 1894 when its then newly-founded predecessor, Investors Syndicate, offered a face-amount savings certificate that gave small investors the opportunity to build a safe and secure fund for retirement, education or other special needs. A mutual fund pioneer, Investors Syndicate launched Investors Mutual Fund in 1940. In the decades that followed, its mutual fund products and services lineup grew to include a full spectrum of styles and specialties. More than 110 years later, RiverSource continues to be a trusted financial products leader.
Threadneedle, a leader in global asset management and one of Europe's largest asset managers, offers sophisticated international experience from a dedicated U.K. management team. Headquartered in London, it is named for Threadneedle Street in the heart of the city's financial district, where British investors pioneered international and global investing. Threadneedle was acquired in 2003 and today operates as an affiliate of Columbia Management.
Seligman Investments' beginnings date back to the establishment of the investment firm J. & W. Seligman & Co. in 1864. In the years that followed, Seligman played a major role in the geographical expansion and industrial development of the United States. In 1874, President Ulysses S. Grant named Seligman as fiscal agent for the U.S. Navy—an appointment that would last through World War I. Seligman helped finance the westward path of the railroads and the building of the Panama Canal. The firm organized its first investment company in 1929 and began managing its first mutual fund in 1930. In 2008, J. & W. Seligman & Co. Incorporated was acquired and Seligman Investments became an offering brand of RiverSource Investments, LLC.
We are proud of the rich and distinctive history of these firms, the strength and breadth of products and services they offer, and the combined cultures of pioneering spirit and forward thinking. Together we are committed to providing more for our shareholders than ever before.
> A singular focus on our shareholders
Our business is asset management, so investors are our first priority. We dedicate our resources to identifying timely investment opportunities and provide a comprehensive choice of equity, fixed-income and alternative investments to help meet your individual needs.
> First-class research and thought leadership
We are dedicated to helping you take advantage of today's opportunities and anticipate tomorrow's. We stay abreast of the latest investment trends and ideas, using our collective insight to evaluate events and transform them into solutions you can use.
> A disciplined investment approach
We aren't distracted by passing fads. Our teams adhere to a rigorous investment process that helps ensure the integrity of our products and enables you and your financial advisor to match our solutions to your objectives with confidence.
When you choose Columbia Management, you can be confident that we will take the time to understand your needs and help you and your financial advisor identify the solutions that are right for you. Because at Columbia Management, we don't consider ourselves successful unless you are.
Sincerely,

J. Kevin Connaughton
President, Columbia Funds
Investors should consider the investment objectives, risks, charges and expenses of a mutual fund carefully before investing. For a free prospectus, which contains this and other important information about the funds, visit www.columbiamanagement.com. The prospectus should be read carefully before investing.
Columbia Funds are distributed by Columbia Management Investment Distributors, Inc., member FINRA, and managed by Columbia Management Investment Advisers, LLC.
© 2011 Columbia Management Investment Advisers, LLC. All rights reserved.
Fund Profile – Columbia Large Cap Value Fund
Summary
g For the 12-month period that ended February 28, 2011, the fund's Class A shares returned 20.45% without sales charge.
g The fund trailed its benchmark, the Russell 1000 Value Index1, but slightly outperformed the average return of its peer group, the Lipper Large-Cap Value Funds Classification.2
g Despite strong gains across all sectors, stock selection in energy and consumer discretionary generally accounted for the fund's shortfall against the Russell index.
Portfolio Management
Lori J. Ensinger has co-managed the fund since 2010. From 2001 until joining Columbia Management Investment Advisers, LLC (the Investment Manager) in May 2010, Ms. Ensinger was associated with the fund's previous investment adviser as an investment professional.
Diane L. Sobin has co-managed the fund since 2010. From 2001 until joining the Investment Manager in May 2010, Ms. Sobin was associated with the fund's previous investment adviser as an investment professional.
David I. Hoffman has co-managed the fund since 2010. From 2004 until joining the Investment Manager in May 2010, Mr. Hoffman was associated with the fund's previous investment adviser as an investment professional.
Noah J. Petrucci has co-managed the fund since 2010. From 2002 until joining the Investment Manager in May 2010, Mr. Petrucci was associated with the fund's previous investment adviser as an investment professional.
1The Russell 1000 Value Index measures the performance of those Russell 1000 Index companies with lower price-to-book ratios and lower forecasted growth values.
2Lipper Inc., a widely respected data provider in the industry, calculates an average total return (assuming reinvestment of distributions) for mutual funds with investment objectives similar to those of the fund. Lipper makes no adjustment for the effect of sales loads.
Indices are not available for investment, are not professionally managed and do not reflect sales charges, fees, brokerage commissions, taxes or other expenses of investing. Securities in the fund may not match those in an index.
Performance data quoted represents past performance and current performance may be lower or higher. Past performance is no guarantee of future results. The investment return and principal value will fluctuate so that shares, when redeemed, may be worth more or less than the original cost. Please visit www.columbiamanagement.com for daily and most recent month-end performance updates.
Summary
1-year return as of 02/28/11
| | +20.45% | |
|
|  | | | Class A shares
(without sales charge) | |
|
| | +22.16% | |
|
|  | | | Russell 1000 Value Index | |
|
Morningstar Style BoxTM

The Morningstar Style BoxTM is based on the fund's portfolio holdings. For equity funds, the vertical axis shows the market capitalization of the stocks owned, and the horizontal axis shows investment style (value, blend or growth). Information shown is based on the most recent data provided by Morningstar.
© 2011 Morningstar, Inc. All rights reserved. The Morningstar information contained herein: (1) is proprietary to Morningstar and/or its content providers; (2) may not be copied or distributed; and (3) is not warranted to be accurate, complete or timely. Neither Morningstar nor its content providers are responsible for any damages or losses arising from any use of this information.
1
Economic Update – Columbia Large Cap Value Fund
Summary
For the 12-month period that ended February 28, 2011
g The U.S. stock market, as measured by the S&P 500 Index, delivered solid returns, despite a summer 2010 correction. Foreign stock market returns were generally in line with the U.S. market, as measured by the MSCI EAFE Index (Net).
| S&P Index | | MSCI Index | |
|
 | |  | |
|
g Strengthening economic growth and rising interest rates kept a lid on most bond market sectors. The Barclays Capital Aggregate Bond Index delivered modest results. However, high-yield bonds were strong performers, as measured by the JPMorgan Developed BB High Yield Index.
Barclays
Aggregate Index | | JPMorgan
Index | |
|
 | |  | |
|
The U.S. economy continued to expand at a modest pace over the past 12 months, as measured by gross domestic product (GDP). After a strong first quarter in 2010, GDP growth dropped to 1.7% in the second quarter and fear spread that the economy would lapse into recession. However, the pace picked up in the third quarter, and growth was strong enough to inspire confidence among consumers, businesses and investors. GDP expanded by 2.6% in the third quarter and 2.8% in the fourth quarter. With the Federal Reserve Board (the Fed) providing additional monetary stimulus to shore up economic growth and the extension of key tax cuts for the next two years, 2011 expectations are for continued growth. Consumer confidence is on the mend, even though job growth has not met expectations. Business spending also tracked higher over the period.
Consumer spending on cars, clothing and other goods generally trended higher throughout the year. Holiday spending rose 5.5% between November 5, 2010 and December 24, 2010, in all retail categories, excluding automobiles, compared with the same period in 2009, according to MasterCard Advisors' SpendingPulse, which tracks spending on all transactions including cash. Analysts say that an increase in personal savings and a decline in consumer debt gave consumers confidence to spend a little more on the 2010 holidays. The personal savings rate edged higher, ending January 2011, the last month for which data was available, at 5.8%. Personal income also increased during the year, surging in January 2011, as payroll tax cuts kicked in.
News on the job front was mostly positive over the 12-month period. A good portion of the jobs added in March, April and May of 2010 were temporary, government-sponsored census positions, which began to unwind in June 2010, July 2010 and August 2010. However, private sector payroll employment began to trend higher in the third quarter, massive layoffs declined and job growth turned solidly positive, with the addition of 255,000 new jobs in the first two months of 2011.
Despite some glimmers of improvement early in 2010, the housing market remained troublesome throughout the period. Both new and existing home sales fell after a federal tax credit for new and repeat homebuyers expired. Distressed properties pressured prices and foreclosures continued—another drag on prices. The inventory of unsold homes ended the period just about where it started, at 7.6 months for both new and existing homes, according to the National Association of Realtors and a joint release from the U.S. Census Bureau and the U.S. Department of Housing and Urban Development. The new year brought a bit of good news: Existing home sales increased in January 2011, raising the level of sales above where it was one year ago. According to the National Association of Realtors, it was the first time in seven months that year-over-year sales activity compared favorably.
Reports from the business side of the economy were generally positive. A key measure of the nation's manufacturing situation—the Institute for Supply Management's Index—took a somewhat surprising turn higher in the final months of the period. Technology spending rose 12% in 2010, according to the NPD Group, a national marketing research firm. Purchases of computers, networking and software returned to prerecession levels. Industrial production was disappointingly flat at year end, per the report issued by the Fed, and it slipped further in January 2011. The amount of manufacturing capacity utilized, per the report issued by the Fed—a key measure of the health of the manufacturing sector—continued to inch higher.
2
Economic Update (continued) – Columbia Large Cap Value Fund
Stocks moved higher despite summer 2010 setback
Against a strengthening economic backdrop, a stock market rally that began early in 2009 continued into 2010 despite a summer setback linked to a debt crisis brewing in Europe, which raised concerns among U.S. investors. These fears were short-lived and stocks regained their footing in September 2010, moving higher through the end of the period. The S&P 500 Index1 returned 22.57% for the 12 months through February 28, 2011. Outside the United States, stock market returns seesawed but ended just short of U.S. market returns. The MSCI EAFE Index (Net),2 a broad gauge of stock market performance in foreign developed markets, returned 20.00% (in U.S. dollars) for the 12-month period, as concerns about the impact of a bailout for weak euro zone economies abated. Emerging stock markets were similarly strong. The MSCI Emerging Markets Index (Net)3 returned 20.91% (in U.S. dollars) for the 12-month period.
Bonds delivered modest returns
As the economy strengthened and interest rates edged higher, most bond sectors delivered modest returns. The Barclays Capital Aggregate Bond Index4 returned 4.93%. High-yield bonds led the fixed-income markets. For the 12 months covered by this report, the JPMorgan Developed BB High Yield Index5 returned 14.74%. Despite rising yields in the second half of the period, the Treasury market was also positive. The Barclays Capital U.S. Treasury Index6 returned 3.71%. However, municipal bonds struggled in the final months of the period, as interest rates inched higher and issue supply surged ahead of the expiration of the Build America Bonds program. The Barclays Capital Municipal Bond Index7 gained 1.72% for the period. Despite positive economic activity, the Fed kept a key short-term interest rate—the federal funds rate—close to zero.
Past performance is no guarantee of future results.
1The Standard & Poor's (S&P) 500 Index tracks the performance of 500 widely held, large-capitalization U.S. stocks.
2The Morgan Stanley Capital International Europe, Australasia, Far East (MSCI EAFE) Index (Net) is a free float-adjusted market capitalization index that is designed to measure the equity market performance of developed markets, excluding the U.S. & Canada. As of May 27, 2010, the MSCI EAFE Index (Net) consisted of the following 22 developed market country indices: Australia, Austria, Belgium, Denmark, Finland, France, Germany, Greece, Hong Kong, Ireland, Israel, Italy, Japan, the Netherlands, New Zealand, Norway, Portugal, Singapore, Spain, Sweden, Switzerland and the United Kingdom.
3The Morgan Stanley Capital International Emerging Markets (MSCI EM) Index (Net) is a free float-adjusted market capitalization index that is designed to measure equity market performance of emerging markets. As of May 27, 2010, the MSCI EM Index (Net) consisted of the following 21 emerging market country indices: Brazil, Chile, China, Colombia, Czech Republic, Egypt, Hungary, India, Indonesia, Korea, Malaysia, Mexico, Morocco, Peru, Philippines, Poland, Russia, South Africa, Taiwan, Thailand and Turkey.
4The Barclays Capital Aggregate Bond Index is a market value-weighted index that tracks the daily price, coupon, pay-downs and total return performance of fixed-rate, publicly placed, dollar-denominated and non-convertible investment grade debt issues with at least $250 million par amount outstanding and with at least one year to final maturity.
5The JPMorgan Developed BB High Yield Index is an unmanaged index designed to mirror the investable universe of the U.S. dollar developed, BB-rated, high yield corporate debt market.
6The Barclays Capital U.S. Treasury Index includes public obligations of the U.S. Treasury. Treasury bills are excluded by the maturity constraint. In addition, certain special issues, such as state and local government series bonds (SLGs), as well as U.S. Treasury TIPS, are excluded. STRIPS are excluded from the index because their inclusion would result in double-counting.
7The Barclays Capital Municipal Bond Index is considered representative of the broad market for investment-grade, tax-exempt bonds with a maturity of at least one year.
Indices are not available for investment, are not professionally managed and do not reflect sales charges, fees, brokerage commissions, taxes or other expenses of investing. Securities in the fund may not match those in an index.
3
Performance Information – Columbia Large Cap Value Fund
Performance data quoted represents past performance and current performance may be lower or higher. Past performance is no guarantee of future results. The investment return and principal value will fluctuate so that shares, when redeemed, may be worth more or less than the original cost. Please visit www.columbiamanagement.com for daily and most recent month-end performance updates.
Performance of a $10,000 investment 03/01/01 – 02/28/11
The chart above shows the change in value of a hypothetical $10,000 investment in Class A shares of Columbia Large Cap Value Fund during the stated time period, and does not reflect the deduction of taxes that a shareholder may pay on fund distributions or on the redemption of fund shares.
Performance of a $10,000 investment 03/01/01 – 02/28/11 ($)
| Sales charge | | without | | with | |
| Class A | | | 13,951 | | | | 13,150 | | |
| Class B | | | 12,924 | | | | 12,924 | | |
| Class C | | | 12,924 | | | | 12,924 | | |
| Class I | | | n/a | | | | n/a | | |
| Class R | | | 13,781 | | | | n/a | | |
| Class W | | | n/a | | | | n/a | | |
| Class Y | | | 14,350 | | | | n/a | | |
| Class Z | | | 14,303 | | | | n/a | | |
Average annual total return as of 02/28/11 (%)
| Share class | | A | | B | | C | | I | | R | | W | | Y | | Z | |
| Inception | | 12/06/89 | | 06/07/93 | | 06/17/92 | | 09/27/10 | | 01/23/06 | | 09/27/10 | | 07/15/09 | | 09/19/89 | |
| Sales charge | | without | | with | | without | | with | | without | | with | | without | | without | | without | | without | | without | |
| 1-year | | | 20.45 | | | | 13.57 | | | | 19.48 | | | | 14.48 | | | | 19.48 | | | | 18.48 | | | | n/a | | | | 20.16 | | | | n/a | | | | 20.98 | | | | 20.81 | | |
| 5-year | | | 1.17 | | | | –0.02 | | | | 0.42 | | | | 0.09 | | | | 0.41 | | | | 0.41 | | | | n/a | | | | 0.94 | | | | n/a | | | | 1.50 | | | | 1.43 | | |
| 10-year/Life | | | 3.39 | | | | 2.78 | | | | 2.60 | | | | 2.60 | | | | 2.60 | | | | 2.60 | | | | 18.07 | | | | 3.26 | | | | 17.79 | | | | 3.68 | | | | 3.64 | | |
The "with sales charge" returns include the maximum initial sales charge of 5.75% for Class A shares and the applicable contingent deferred sales charge of 5.00% in the first year, declining to 1.00% in the sixth year and eliminated thereafter for Class B shares and 1.00% for Class C shares in the first year only. The "without sales charge" returns do not include the effect of sales charges. If they had, returns would be lower.
Performance results reflect any fee waivers or reimbursements of fund expenses by the Investment Manager and/or any of its affiliates. Absent these fee waivers or expense reimbursement arrangements, performance results would have been lower.
All results shown assume reinvestment of distributions. Class I, Class Y and Class Z shares are sold at net asset value with no distribution and service (Rule 12b-1) fees. Class R and Class W shares are sold at net asset value with distribution and/or service (Rule 12b-1) fees. Class I, Class R, Class W, Class Y and Class Z shares have limited eligibility and the investment minimum requirements may vary. Please see the fund's prospectus for details. Performance for different share classes will vary based on differences in sales charges and fees associated with each class.
The tables do not reflect the deduction of taxes that a shareholder may pay on fund distributions or on the redemption of fund shares.
The returns for Class R shares include the returns for Class A shares prior to January 23, 2006, the date on which Class R shares were initially offered by the fund. If differences in expenses had been reflected, the returns would have been lower, since Class R shares are subject to a higher Rule 12b-1 fee.
The returns for Class Y shares include the returns for Class Z shares prior to July 15, 2009, the date on which Class Y shares were initially offered by the fund. The returns shown have not been adjusted to reflect any differences in expenses between Class Y and Class Z shares.
Class I and Class W shares were initially offered on September 27, 2010.
4
Understanding Your Expenses – Columbia Large Cap Value Fund
As a fund shareholder, you incur two types of costs. There are transaction costs, which generally include sales charges on purchases and may include redemption fees or exchange fees. There are also ongoing costs, which generally include investment advisory fees, distribution and service (Rule 12b-1) fees and other fund expenses. The information on this page is intended to help you understand the ongoing costs of investing in the fund and to compare these costs with the ongoing costs of investing in other mutual funds.
Analyzing your fund's expenses by share class
To illustrate these ongoing costs, we have provided an example and calculated the expenses paid by investors in each share class during the period. The information in the following table is based on an initial investment of $1,000, which is invested at the beginning of the period and held for the entire period. Expense information is calculated two ways and each method provides you with different information. The amount listed in the "Actual" column is calculated using the fund's actual operating expenses and total return for the period. The amount listed in the "Hypothetical" column for each share class assumes that the return each year is 5% before expenses and is calculated based on the fund's actual operating expenses. You should not use the hypothetical account values and expenses to estimate either your actual account balance at the end of the period or the expenses you paid during this period.
Compare with other funds
Since all mutual funds are required to include the same hypothetical calculations about expenses in shareholder reports, you can use this information to compare the ongoing cost of investing in the fund with other funds. To do so, compare the 5% hypothetical example with the 5% hypothetical examples that appear in the shareholder reports of other funds. As you compare hypothetical examples of other funds, it is important to note that hypothetical examples are meant to highlight the ongoing costs of investing in a fund and do not reflect any transaction costs, such as sales charges, redemption fees or exchange fees.
Estimating your actual expenses
To estimate the expenses that you paid over the period, first you will need your account balance at the end of the period:
g For shareholders who receive their account statements from Columbia Management Investment Services Corp., your account balance is available online at www.columbiamanagement.com or by calling Shareholder Services at 800.345.6611.
g For shareholders who receive their account statements from their financial intermediary, contact your financial intermediary to obtain your account balance.
1. Divide your ending account balance by $1,000. For example, if an account balance was $8,600 at the end of the period, the result would be 8.6.
2. In the section of the table below titled "Expenses paid during the period," locate the amount for your share class. You will find this number in the column labeled "Actual." Multiply this number by the result from step 1. Your answer is an estimate of the expenses you paid on your account during the period.
If the value of your account falls below the minimum initial investment requirement applicable to you, your account may be subject to a $20 annual fee. This fee is not included in the accompanying table. If you are subject to the fee, keep it in mind when you are estimating the ongoing expenses of investing in the fund and when comparing the expenses of this fund with other funds.
09/01/10 – 02/28/11
| | | Account value at the
beginning of the period ($) | | Account value at the
end of the period ($) | | Expenses paid
during the period ($) | | Fund's annualized
expense ratio (%) | |
| | | Actual | | Hypothetical | | Actual | | Hypothetical | | Actual | | Hypothetical | | Actual | |
| Class A | | | 1,000.00 | | | | 1,000.00 | | | | 1,269.30 | | | | 1,018.74 | | | | 6.86 | | | | 6.11 | | | | 1.22 | | |
| Class B | | | 1,000.00 | | | | 1,000.00 | | | | 1,265.00 | | | | 1,015.03 | | | | 11.06 | | | | 9.84 | | | | 1.97 | | |
| Class C | | | 1,000.00 | | | | 1,000.00 | | | | 1,265.00 | | | | 1,015.03 | | | | 11.06 | | | | 9.84 | | | | 1.97 | | |
| Class I | | | 1,000.00 | | | | 1,000.00 | | | | 1,042.50 | * | | | 1,021.32 | | | | 3.02 | * | | | 3.51 | | | | 0.70 | | |
| Class R | | | 1,000.00 | | | | 1,000.00 | | | | 1,267.80 | | | | 1,017.50 | | | | 8.27 | | | | 7.35 | | | | 1.47 | | |
| Class W | | | 1,000.00 | | | | 1,000.00 | | | | 1,041.70 | * | | | 1,018.74 | | | | 5.25 | * | | | 6.11 | | | | 1.22 | | |
| Class Y | | | 1,000.00 | | | | 1,000.00 | | | | 1,272.10 | | | | 1,021.27 | | | | 4.00 | | | | 3.56 | | | | 0.71 | | |
| Class Z | | | 1,000.00 | | | | 1,000.00 | | | | 1,271.30 | | | | 1,019.98 | | | | 5.46 | | | | 4.86 | | | | 0.97 | | |
Expenses paid during the period are equal to the annualized expense ratio for the share class, multiplied by the average account value over the period, then multiplied by the number of days in the fund's most recent fiscal half-year and divided by 365.
It is important to note that the expense amounts shown in the table are meant to highlight only ongoing costs of investing in the fund and do not reflect any transaction costs, such as sales charges, redemption fees or exchange fees. Therefore, the hypothetical examples provided may not help you determine the relative total costs of owning shares of different funds. If these transaction costs were included, your costs would have been higher.
*For the period September 27, 2010 through February 28, 2011. Class I and Class W shares commenced operations on September 27, 2010.
5
Portfolio Managers' Report – Columbia Large Cap Value Fund
Performance data quoted represents past performance and current performance may be lower or higher. Past performance is no guarantee of future results. The investment return and principal value will fluctuate so that shares, when redeemed, may be worth more or less than the original cost. Please visit www.columbiamanagement.com for daily and most recent month-end performance updates.
Net asset value per share
as of 02/28/11 ($)
| Class A | | | 11.98 | | |
| Class B | | | 11.54 | | |
| Class C | | | 11.54 | | |
| Class I | | | 12.03 | | |
| Class R | | | 11.98 | | |
| Class W | | | 11.99 | | |
| Class Y | | | 12.02 | | |
| Class Z | | | 12.01 | | |
Distributions declared per share
03/01/10 – 02/28/11 ($)
| Class A | | | 0.13 | | |
| Class B | | | 0.06 | | |
| Class C | | | 0.06 | | |
| Class I | | | 0.05 | | |
| Class R | | | 0.10 | | |
| Class W | | | 0.03 | | |
| Class Y | | | 0.17 | | |
| Class Z | | | 0.16 | | |
For the 12-month period that ended February 28, 2011, the fund's Class A shares returned 20.45% without sales charge. This result was behind the 22.16% gain of the fund's benchmark, the Russell 1000 Value Index, and ahead of the 19.63% average return of the Lipper Large-Cap Value Funds Classification peer group. The fund posted strong double-digit gains in nearly all sectors, but it lost some ground versus the index in energy and consumer discretionary. Returns were highly correlated across sectors and disciplines, which made it more difficult for managers who focus on stock selection, as we do, to outperform the market average.
Strong run for the market
U.S. equities ended the 12-month period with handsome gains, most of which came in the second half. Stocks were beset in the first half of the period by a myriad of concerns, including the sustainability of the global economic recovery, the impact of the European sovereign debt crisis and the outcome of U.S. financial regulatory reform. A September announcement by the Federal Reserve that it would undertake an additional Treasury buyback program to help revive the economy lifted stock prices. Large-cap stocks rallied nicely, but not as much as smaller-cap stocks, which had taken a beating in the recent market downturn. Throughout the year, the fund remained focused on attractively valued large-cap stocks that we believe have the potential to improve profitability from operations.
Contributions from financials, health care and industrials
The fund picked up the most ground versus the index in financials, health care and industrials. An underweight in financials helped performance because the sector lagged more economically-sensitive parts of the market. We also avoided a major index component that performed poorly, which benefited results. The fund was rewarded for focusing on higher-quality diversified financial services names, such as JPMorgan Chase (3.7% of net assets), which rallied nicely. Real estate investment trusts (REITs) ProLogis and Rayonier (0.3% and 0.9% of net assets, respectively) further aided performance, as an improving economy boosted prospects for the industry. An underweight in heath care, which produced the weakest returns in the index, as well as an overweight and positive stock selection in the industrials sector, also helped results. Within industrials, security selection was particularly strong among construction and engineering companies, notably infrastructure companies Fluor and Foster Wheeler (0.9% and 0.7% of net assets, respectively). Both companies benefited from a pick-up in the global economy. In addition, Navistar International (0.5% of net assets), which makes truck engines, rallied nicely, as an improving economic outlook bolstered demand for its products.
Lost ground from consumer discretionary and energy
The fund generated strong gains from energy and consumer discretionary holdings, but not as strong as the gains from the same sectors within the index. In energy, the fund did not own certain oil, gas and consumable fuel names that did well within the index and some of the names it held that were not in the index were disappointing performers. Anadarko Petroleum (0.9% of net assets), an oil service company, took a hard hit in the wake of the Gulf of Mexico oil disaster, and Petrobras Petroleo Brasil, a Brazilian company that is not in the index disappointed. We sold Petrobras before period end. Within consumer discretionary, a sizable underweight in media names also hindered results, as an improving economic outlook aided returns in the industry. Investments in the multi-line and specialty retail segments cost the fund additional ground versus the index.
6
Portfolio Managers' Report (continued) – Columbia Large Cap Value Fund
Encouraging outlook for stocks
We believe the stock market has many factors working in its favor. To start, many large companies have record levels of cash on their balance sheets, which they can use to buy other firms to fuel their own growth. Stocks also stand to benefit as companies use excess cash to undertake shareholder-friendly initiatives, such as the reinstatement of dividends and the start of share repurchase programs. Moreover, we're optimistic about the corporate earnings outlook, given recent cost cutting initiatives and the possibility of increased revenues. Finally, we think stocks will gain as money flows back into equities, which we think will happen as interest rates start to rise and bond prices begin to fall.
Portfolio characteristics and holdings are subject to change periodically and may not be representative of current characteristics and holdings. The outlook for this fund may differ from those presented for other Columbia Funds.
Equity securities are affected by stock market fluctuations that occur in response to economic and business developments.
Value stocks are securities of companies that may have experienced adverse business or industry developments or may be subject to special risks that have caused the stocks to be out of favor. If the managers' assessment of a company's prospects is wrong, the price of the company's stock may not approach the value the manager has placed on it.
Top 5 sectors
as of 02/28/11 (%)
| Financials | | | 27.5 | | |
| Industrials | | | 14.7 | | |
| Energy | | | 13.6 | | |
| Health Care | | | 9.5 | | |
| Consumer Discretionary | | | 9.1 | | |
Top 10 holdings
as of 02/28/11 (%)
| Chevron | | | 4.0 | | |
| JPMorgan Chase | | | 3.7 | | |
| Wells Fargo | | | 3.2 | | |
| Goldman Sachs Group | | | 2.2 | | |
| Occidental Petroleum | | | 2.1 | | |
| Prudential Financial | | | 2.0 | | |
| U.S. Bancorp | | | 1.9 | | |
| AT&T | | | 1.9 | | |
| MetLife | | | 1.7 | | |
| ACE Limited | | | 1.7 | | |
The fund is actively managed and the composition of its portfolio will change over time. Information provided is calculated as a percentage of net assets.
7
Investment Portfolio – Columbia Large Cap Value Fund
February 28, 2011
| Common Stocks – 94.5% | |
| | | Shares | | Value ($) | |
| Consumer Discretionary – 9.0% | |
| Auto Components – 0.5% | |
| Dana Holding Corp. (a) | | | 588,400 | | | | 11,108,992 | | |
| Auto Components Total | | | 11,108,992 | | |
| Automobiles – 2.6% | |
| Ford Motor Co. (a) | | | 1,879,110 | | | | 28,280,605 | | |
| General Motors Co. (a) | | | 793,103 | | | | 26,592,744 | | |
| Automobiles Total | | | 54,873,349 | | |
| Distributors – 1.1% | |
| Genuine Parts Co. | | | 437,000 | | | | 23,025,530 | | |
| Distributors Total | | | 23,025,530 | | |
| Hotels, Restaurants & Leisure – 1.4% | |
| Carnival Corp. | | | 446,800 | | | | 19,064,956 | | |
Starwood Hotels & Resorts
Worldwide, Inc. | | | 147,193 | | | | 8,993,492 | | |
| Hotels, Restaurants & Leisure Total | | | 28,058,448 | | |
| Media – 0.8% | |
| Viacom, Inc., Class B | | | 382,200 | | | | 17,069,052 | | |
| Media Total | | | 17,069,052 | | |
| Multiline Retail – 2.2% | |
| Macy's, Inc. | | | 218,600 | | | | 5,224,540 | | |
| Nordstrom, Inc. | | | 364,700 | | | | 16,506,322 | | |
| Target Corp. | | | 475,600 | | | | 24,992,780 | | |
| Multiline Retail Total | | | 46,723,642 | | |
| Specialty Retail – 0.4% | |
| Limited Brands, Inc. | | | 251,800 | | | | 8,062,636 | | |
| Specialty Retail Total | | | 8,062,636 | | |
| Consumer Discretionary Total | | | 188,921,649 | | |
| Consumer Staples – 5.7% | |
| Beverages – 1.9% | |
| Diageo PLC, ADR | | | 288,283 | | | | 22,561,027 | | |
Molson Coors Brewing Co.,
Class B | | | 405,900 | | | | 18,561,807 | | |
| Beverages Total | | | 41,122,834 | | |
| Food Products – 1.8% | |
| General Mills, Inc. | | | 451,500 | | | | 16,768,710 | | |
| H.J. Heinz Co. | | | 409,300 | | | | 20,555,046 | | |
| Food Products Total | | | 37,323,756 | | |
| Household Products – 0.8% | |
| Procter & Gamble Co. | | | 264,800 | | | | 16,695,640 | | |
| Household Products Total | | | 16,695,640 | | |
| | | Shares | | Value ($) | |
| Tobacco – 1.2% | |
| Philip Morris International, Inc. | | | 400,496 | | | | 25,143,139 | | |
| Tobacco Total | | | 25,143,139 | | |
| Consumer Staples Total | | | 120,285,369 | | |
| Energy – 12.9% | |
| Energy Equipment & Services – 1.2% | |
| Cameron International Corp. (a) | | | 322,700 | | | | 19,081,251 | | |
| Halliburton Co. | | | 116,086 | | | | 5,449,077 | | |
| Energy Equipment & Services Total | | | 24,530,328 | | |
| Oil, Gas & Consumable Fuels – 11.7% | |
| Anadarko Petroleum Corp. | | | 226,200 | | | | 18,509,946 | | |
| Apache Corp. | | | 227,900 | | | | 28,400,898 | | |
| Chevron Corp. | | | 798,400 | | | | 82,834,000 | | |
| El Paso Corp. | | | 1,635,800 | | | | 30,425,880 | | |
| Kinder Morgan, Inc. (a) | | | 315,450 | | | | 9,621,225 | | |
| Murphy Oil Corp. | | | 138,900 | | | | 10,213,317 | | |
| Occidental Petroleum Corp. | | | 430,800 | | | | 43,928,676 | | |
| Williams Companies, Inc. | | | 685,400 | | | | 20,808,744 | | |
| Oil, Gas & Consumable Fuels Total | | | 244,742,686 | | |
| Energy Total | | | 269,273,014 | | |
| Financials – 26.6% | |
| Capital Markets – 2.2% | |
| Goldman Sachs Group, Inc. | | | 278,000 | | | | 45,530,840 | | |
| Capital Markets Total | | | 45,530,840 | | |
| Commercial Banks – 10.7% | |
| BB&T Corp. | | | 783,500 | | | | 21,624,600 | | |
| CIT Group, Inc. (a) | | | 354,800 | | | | 15,369,936 | | |
| Fifth Third Bancorp. | | | 1,353,622 | | | | 19,762,881 | | |
| Huntington Bancshares, Inc. | | | 3,240,502 | | | | 22,165,034 | | |
PNC Financial Services
Group, Inc. | | | 483,119 | | | | 29,808,442 | | |
| SVB Financial Group (a) | | | 48,300 | | | | 2,616,894 | | |
| U.S. Bancorp | | | 1,466,527 | | | | 40,666,794 | | |
| Wells Fargo & Co. | | | 2,103,650 | | | | 67,863,749 | | |
| Zions Bancorporation | | | 192,800 | | | | 4,503,808 | | |
| Commercial Banks Total | | | 224,382,138 | | |
| Consumer Finance – 0.5% | |
| American Express Co. | | | 229,300 | | | | 9,990,601 | | |
| Consumer Finance Total | | | 9,990,601 | | |
| Diversified Financial Services – 4.8% | |
| Citigroup, Inc. (a) | | | 4,835,700 | | | | 22,631,076 | | |
| JPMorgan Chase & Co. | | | 1,660,747 | | | | 77,540,277 | | |
| Diversified Financial Services Total | | | 100,171,353 | | |
See Accompanying Notes to Financial Statements.
8
Columbia Large Cap Value Fund
February 28, 2011
| Common Stocks (continued) | |
| | | Shares | | Value ($) | |
| Insurance – 6.5% | |
| ACE Ltd. | | | 570,230 | | | | 36,067,048 | | |
| Axis Capital Holdings Ltd. | | | 611,700 | | | | 22,216,944 | | |
| MetLife, Inc. | | | 764,823 | | | | 36,222,017 | | |
| Prudential Financial, Inc. | | | 626,748 | | | | 41,258,821 | | |
| Insurance Total | | | 135,764,830 | | |
| Real Estate Investment Trusts (REITs) – 1.9% | |
| Equity Residential Property Trust | | | 279,100 | | | | 15,381,201 | | |
| ProLogis | | | 401,000 | | | | 6,520,260 | | |
| Rayonier, Inc. | | | 311,200 | | | | 19,085,896 | | |
| Real Estate Investment Trusts (REITs) Total | | | 40,987,357 | | |
| Financials Total | | | 556,827,119 | | |
| Health Care – 9.5% | |
| Health Care Equipment & Supplies – 0.8% | |
| Zimmer Holdings, Inc. (a) | | | 281,300 | | | | 17,536,242 | | |
| Health Care Equipment & Supplies Total | | | 17,536,242 | | |
| Health Care Providers & Services – 2.6% | |
| CIGNA Corp. | | | 86,000 | | | | 3,618,020 | | |
| Humana, Inc. (a) | | | 58,400 | | | | 3,796,584 | | |
| Medco Health Solutions, Inc. (a) | | | 398,100 | | | | 24,538,884 | | |
| Quest Diagnostics, Inc. | | | 127,800 | | | | 7,252,650 | | |
| UnitedHealth Group, Inc. | | | 383,200 | | | | 16,316,656 | | |
| Health Care Providers & Services Total | | | 55,522,794 | | |
| Life Sciences Tools & Services – 2.8% | |
| Life Technologies Corp. (a) | | | 507,400 | | | | 27,079,938 | | |
| Thermo Fisher Scientific, Inc. (a) | | | 550,125 | | | | 30,707,978 | | |
| Life Sciences Tools & Services Total | | | 57,787,916 | | |
| Pharmaceuticals – 3.3% | |
| Merck & Co., Inc. | | | 566,492 | | | | 18,450,644 | | |
| Pfizer, Inc. | | | 1,651,900 | | | | 31,782,556 | | |
| Watson Pharmaceuticals, Inc. (a) | | | 329,500 | | | | 18,448,705 | | |
| Pharmaceuticals Total | | | 68,681,905 | | |
| Health Care Total | | | 199,528,857 | | |
| Industrials – 14.4% | |
| Aerospace & Defense – 2.7% | |
| Honeywell International, Inc. | | | 310,000 | | | | 17,952,100 | | |
| Textron, Inc. | | | 280,200 | | | | 7,590,618 | | |
| United Technologies Corp. | | | 375,038 | | | | 31,330,675 | | |
| Aerospace & Defense Total | | | 56,873,393 | | |
| Air Freight & Logistics – 1.3% | |
United Parcel Service, Inc.,
Class B | | | 353,400 | | | | 26,080,920 | | |
| Air Freight & Logistics Total | | | 26,080,920 | | |
| | | Shares | | Value ($) | |
| Construction & Engineering – 2.4% | |
| Fluor Corp. | | | 256,700 | | | | 18,164,092 | | |
| Foster Wheeler AG (a) | | | 422,000 | �� | | | 15,259,520 | | |
| Jacobs Engineering Group, Inc. (a) | | | 331,900 | | | | 16,614,914 | | |
| Construction & Engineering Total | | | 50,038,526 | | |
| Industrial Conglomerates – 2.2% | |
| 3M Co. | | | 277,000 | | | | 25,547,710 | | |
| General Electric Co. | | | 972,216 | | | | 20,338,759 | | |
| Industrial Conglomerates Total | | | 45,886,469 | | |
| Machinery – 3.3% | |
| ArvinMeritor, Inc. (a) | | | 400,400 | | | | 7,175,168 | | |
| Eaton Corp. | | | 154,600 | | | | 17,126,588 | | |
| Illinois Tool Works, Inc. | | | 432,500 | | | | 23,398,250 | | |
| Ingersoll-Rand PLC | | | 224,600 | | | | 10,174,380 | | |
| Kennametal, Inc. | | | 160,100 | | | | 6,157,446 | | |
| Navistar International Corp. (a) | | | 87,986 | | | | 5,453,372 | | |
| Machinery Total | | | 69,485,204 | | |
| Professional Services – 1.1% | |
| Manpower, Inc. | | | 377,600 | | | | 23,977,600 | | |
| Professional Services Total | | | 23,977,600 | | |
| Road & Rail – 1.4% | |
| Hertz Global Holdings, Inc. (a) | | | 1,922,600 | | | | 29,242,746 | | |
| Road & Rail Total | | | 29,242,746 | | |
| Industrials Total | | | 301,584,858 | | |
| Information Technology – 5.6% | |
| Computers & Peripherals – 1.3% | |
| EMC Corp. (a) | | | 463,100 | | | | 12,600,951 | | |
| Hewlett-Packard Co. | | | 323,700 | | | | 14,123,031 | | |
| Computers & Peripherals Total | | | 26,723,982 | | |
| Electronic Equipment, Instruments & Components – 0.6% | |
| Tyco Electronics Ltd. | | | 382,400 | | | | 13,781,696 | | |
Electronic Equipment, Instruments &
Components Total | | | 13,781,696 | | |
| IT Services – 1.1% | |
International Business
Machines Corp. | | | 145,200 | | | | 23,504,976 | | |
| IT Services Total | | | 23,504,976 | | |
| Semiconductors & Semiconductor Equipment – 1.7% | |
| Advanced Micro Devices, Inc. (a) | | | 1,322,000 | | | | 12,175,620 | | |
| Avago Technologies Ltd. | | | 354,500 | | | | 12,049,455 | | |
| Cypress Semiconductor Corp. (a) | | | 521,000 | | | | 10,920,160 | | |
Semiconductors & Semiconductor
Equipment Total | | | 35,145,235 | | |
See Accompanying Notes to Financial Statements.
9
Columbia Large Cap Value Fund
February 28, 2011
| Common Stocks (continued) | |
| | | Shares | | Value ($) | |
| Software – 0.9% | |
| Nuance Communications, Inc. (a) | | | 1,005,300 | | | | 18,758,898 | | |
| Software Total | | | 18,758,898 | | |
| Information Technology Total | | | 117,914,787 | | |
| Materials – 3.5% | |
| Chemicals – 2.3% | |
| Air Products & Chemicals, Inc. | | | 112,500 | | | | 10,350,000 | | |
| Celanese Corp., Series A | | | 276,500 | | | | 11,460,925 | | |
LyondellBasell Industries NV,
Class A (a) | | | 449,700 | | | | 17,124,576 | | |
| Potash Corp. of Saskatchewan, Inc. | | | 130,125 | | | | 8,015,700 | | |
| Chemicals Total | | | 46,951,201 | | |
| Metals & Mining – 1.2% | |
| Allegheny Technologies, Inc. | | | 206,150 | | | | 13,828,542 | | |
Freeport-McMoRan Copper &
Gold, Inc. | | | 129,862 | | | | 6,876,193 | | |
| United States Steel Corp. | | | 87,400 | | | | 5,024,626 | | |
| Metals & Mining Total | | | 25,729,361 | | |
| Materials Total | | | 72,680,562 | | |
| Telecommunication Services – 1.9% | |
| Diversified Telecommunication Services – 1.9% | |
| AT&T, Inc. | | | 1,402,572 | | | | 39,804,993 | | |
| Diversified Telecommunication Services Total | | | 39,804,993 | | |
| Telecommunication Services Total | | | 39,804,993 | | |
| Utilities – 5.4% | |
| Electric Utilities – 2.4% | |
| American Electric Power Co., Inc. | | | 689,100 | | | | 24,655,998 | | |
| NextEra Energy, Inc. | | | 458,600 | | | | 25,438,542 | | |
| Electric Utilities Total | | | 50,094,540 | | |
| Multi-Utilities – 3.0% | |
| PG&E Corp. | | | 507,660 | | | | 23,382,820 | | |
| Sempra Energy | | | 361,300 | | | | 19,231,999 | | |
| Xcel Energy, Inc. | | | 814,200 | | | | 19,491,948 | | |
| Multi-Utilities Total | | | 62,106,767 | | |
| Utilities Total | | | 112,201,307 | | |
Total Common Stocks
(cost of $1,505,948,803) | | | 1,979,022,515 | | |
| Convertible Preferred Stocks – 1.7% | |
| | | Shares | | Value ($) | |
| Consumer Discretionary – 0.1% | |
| Automobiles – 0.1% | |
| General Motors Co., 4.750% | | | 22,793 | | | | 1,159,708 | | |
| Automobiles Total | | | 1,159,708 | | |
| Consumer Discretionary Total | | | 1,159,708 | | |
| Energy – 0.7% | |
| Oil, Gas & Consumable Fuels – 0.7% | |
| Apache Corp., 6.000% | | | 207,907 | | | | 14,162,625 | | |
| Oil, Gas & Consumable Fuels Total | | | 14,162,625 | | |
| Energy Total | | | 14,162,625 | | |
| Financials – 0.9% | |
| Commercial Banks – 0.3% | |
| Fifth Third Bancorp., 8.500% | | | 39,400 | | | | 5,969,100 | | |
| Commercial Banks Total | | | 5,969,100 | | |
| Diversified Financial Services – 0.6% | |
| Citigroup, Inc., 7.500% | | | 105,036 | | | | 14,127,342 | | |
| Diversified Financial Services Total | | | 14,127,342 | | |
| Financials Total | | | 20,096,442 | | |
Total Convertible Preferred Stocks
(cost of $28,275,906) | | | 35,418,775 | | |
| Convertible Bonds – 0.9% | |
| | | Par ($) | | | |
| Industrials – 0.3% | |
| Machinery – 0.3% | |
Navistar International Corp.
3.000% 10/15/14 | | | 4,210,000 | | | | 5,883,475 | | |
| Machinery Total | | | 5,883,475 | | |
| Industrials Total | | | 5,883,475 | | |
| Information Technology – 0.6% | |
| Computers & Peripherals – 0.6% | |
EMC Corp.
1.750% 12/01/13 | | | 7,430,000 | | | | 12,983,925 | | |
| Computers & Peripherals Total | | | 12,983,925 | | |
| Information Technology Total | | | 12,983,925 | | |
Total Convertible Bonds
(cost of $14,143,957) | | | 18,867,400 | | |
See Accompanying Notes to Financial Statements.
10
Columbia Large Cap Value Fund
February 28, 2011
| Short-Term Obligation – 2.8% | |
| | | Par ($) | | Value ($) | |
Repurchase agreement with
Fixed Income Clearing Corp.,
dated 02/28/11, due 03/01/11
at 0.090%, collateralized by
U.S. Government Agency
obligations with various
maturities to 08/18/17
market value $60,429,675
(repurchase proceeds
$59,242,148) | | | 59,242,000 | | | | 59,242,000 | | |
Total Short-Term Obligation
(cost of $59,242,000) | | | 59,242,000 | | |
Total Investments – 99.9%
(cost of $1,607,610,666) (b) | | | 2,092,550,690 | | |
| Other Assets & Liabilities, Net – 0.1% | | | 2,051,312 | | |
| Net Assets – 100.0% | | | 2,094,602,002 | | |
Notes to Investment Portfolio:
(a) Non-income producing security.
(b) Cost for federal income tax purposes is $1,611,687,192.
Generally accepted accounting principles (GAAP) require disclosure regarding the inputs and valuation techniques used to measure fair value and any changes in valuation inputs or techniques. In addition, investments shall be disclosed by major category.
The Fund categorizes its fair value measurements according to a three-level hierarchy that maximizes the use of observable inputs and minimizes the use of unobservable inputs by prioritizing that the most observable input be used when available. Observable inputs are those that market participants would use in pricing an investment based on market data obtained from sources independent of the reporting entity. Unobservable inputs are those that reflect the Fund's assumptions about the information market participants would use in pricing an investment. An investment's level within the fair value hierarchy is based on the lowest level of any input that is deemed significant to the asset or liability's fair value measurement. The input levels are not necessarily an indication of the risk or liquidity associated with investments at that level. For example, certain U.S. government securities are generally high quality and liquid, however, they are reflected as Level 2 because the inputs used to determine fair value may not always be quoted prices in an active market.
Fair value inputs are summarized in the three broad levels listed below:
• Level 1—Valuations based on quoted prices for investments in active markets that the Fund has the ability to access at the measurement date (including NAV for open-end mutual funds). Valuation adjustments are not applied to Level 1 investments.
• Level 2—Valuations based on other significant observable inputs (including quoted prices for similar securities, interest rates, prepayment speeds, credit risks, etc.).
• Level 3—Valuations based on significant unobservable inputs (including the Fund's own assumptions and judgment in determining the fair value of investments).
Inputs that are used in determining fair value of an investment may include price information, credit data, volatility statistics, and other factors. These inputs can be either observable or unobservable. The availability of observable inputs can vary between investments, and is affected by various factors such as the type of investment, and the volume and level of activity for that investment or similar investments in the marketplace. The inputs will be considered by the Investment Manager, along with any other relevant factors in the calculation of an investment's fair value. The Fund uses prices and inputs that are current as of the measurement date, which may include periods of market dislocations. During these periods, the availability of prices and inputs may be reduced for many investments. This condition could cause an investment to be reclassified between the various levels within the hierarchy. Non-U.S. equity securities actively traded in foreign markets may be reflected in Level 2 despite the availability of closing prices, because the Fund evaluates and determines whether those closing prices reflect fair value at the close of the New York Stock Exchange (NYSE) or require adjustment, as described in Note 2 to the financial statements—Security Valuation.
Investments falling into the Level 3 category are primarily supported by quoted prices from brokers and dealers participating in the market for those investments. However, these may be classified as Level 3 investments due to lack of market transparency and corroboration to support these quoted prices. Additionally, valuation models may be used as the pricing source for any remaining investments classified as Level 3. These models rely on one or more significant unobservable inputs and/or significant assumptions by the Investment Manager. Inputs used in valuations may include, but are not limited to, financial statement analysis, capital account balances, discount rates and estimated cash flows, and comparable company data.
The following table is a summary of the inputs used to value the Fund's investments as of February 28, 2011:
| Description | | Quoted
Prices
(Level 1) | | Other
Significant
Observable
Inputs
(Level 2) | | Significant
Unobservable
Inputs
(Level 3) | | Total | |
Total Common
Stocks | | $ | 1,979,022,515 | | | $ | — | | | $ | — | | | $ | 1,979,022,515 | | |
Convertible
Preferred Stocks | | | | | | | | | | | | | | | | | |
Consumer
Discretionary | | | 1,159,708 | | | | — | | | | — | | | | 1,159,708 | | |
| Energy | | | 14,162,625 | | | | — | | | | — | | | | 14,162,625 | | |
| Financials | | | 14,127,342 | | | | 5,969,100 | | | | — | | | | 20,096,442 | | |
Total Convertible
Preferred Stocks | | | 29,449,675 | | | | 5,969,100 | | | | — | | | | 35,418,775 | | |
Total Convertible
Bonds | | | — | | | | 18,867,400 | | | | — | | | | 18,867,400 | | |
Total Short-Term
Obligation | | | — | | | | 59,242,000 | | | | — | | | | 59,242,000 | | |
| Total Investments | | $ | 2,008,472,190 | | | $ | 84,078,500 | | | $ | — | | | $ | 2,092,550,690 | | |
The Fund's assets assigned to the Level 2 input category are generally valued using the market approach, in which a security's value is determined through reference to prices and information from market transactions for similar or identical assets.
Certain short-term obligations may be valued using amortized cost, an income approach which converts future cash flows to a present value based upon the discount or premium at purchase.
There were no significant transfers of financial assets between Levels 1 and 2 during the period.
See Accompanying Notes to Financial Statements.
11
Columbia Large Cap Value Fund
February 28, 2011
At February 28, 2011, the Fund held investments in the following sectors:
| Sector (Unaudited) | | % of
Net Assets | |
| Financials | | | 27.5 | | |
| Industrials | | | 14.7 | | |
| Energy | | | 13.6 | | |
| Health Care | | | 9.5 | | |
| Consumer Discretionary | | | 9.1 | | |
| Information Technology | | | 6.2 | | |
| Consumer Staples | | | 5.7 | | |
| Utilities | | | 5.4 | | |
| Materials | | | 3.5 | | |
| Telecommunication Services | | | 1.9 | | |
| | | | 97.1 | | |
| Short-Term Obligation | | | 2.8 | | |
| Other Assets & Liabilities, Net | | | 0.1 | | |
| | | | 100.0 | | |
| Acronym | | Name | |
| ADR | | American Depositary Receipt | |
|
See Accompanying Notes to Financial Statements.
12
Statement of Assets and Liabilities – Columbia Large Cap Value Fund
February 28, 2011
| | | | | ($) | |
| Assets | | Investments, at cost | | | 1,607,610,666 | | |
| | | Investments, at value | | | 2,092,550,690 | | |
| | | Cash | | | 768 | | |
| | | Receivable for: | | | |
| | | Investments sold | | | 6,130,634 | | |
| | | Fund shares sold | | | 1,897,507 | | |
| | | Dividends | | | 2,801,444 | | |
| | | Interest | | | 80,368 | | |
| | | Trustees' deferred compensation plan | | | 68,580 | | |
| | | Prepaid expenses | | | 7,560 | | |
| | | Total Assets | | | 2,103,537,551 | | |
| Liabilities | | Payable for: | | | | | |
| | | Investments purchased | | | 4,713,834 | | |
| | | Fund shares repurchased | | | 1,360,468 | | |
| | | Investment advisory fee | | | 837,671 | | |
| | | Administration fee | | | 275,481 | | |
| | | Pricing and bookkeeping fees | | | 11,984 | | |
| | | Transfer agent fee | | | 1,015,716 | | |
| | | Trustees' fees | | | 99,145 | | |
| | | Custody fee | | | 13,253 | | |
| | | Distribution and service fees | | | 183,687 | | |
| | | Chief compliance officer expenses | | | 449 | | |
| | | Trustees' deferred compensation plan | | | 68,580 | | |
| | | Other liabilities | | | 355,281 | | |
| | | Total Liabilities | | | 8,935,549 | | |
| | | Net Assets | | | 2,094,602,002 | | |
| Net Assets Consist of | | Paid-in capital | | | 2,248,334,107 | | |
| | | Accumulated net investment loss | | | (36,125 | ) | |
| | | Accumulated net realized loss | | | (638,636,004 | ) | |
| | | Net unrealized appreciation on investments | | | 484,940,024 | | |
| | | Net Assets | | | 2,094,602,002 | | |
See Accompanying Notes to Financial Statements.
13
Statement of Assets and Liabilities (continued) – Columbia Large Cap Value Fund
February 28, 2011
| Class A | | Net assets | | $ | 517,861,150 | | |
| | | Shares outstanding | | | 43,211,025 | | |
| | | Net asset value per share | | $ | 11.98 | (a) | |
| | | Maximum sales charge | | | 5.75 | % | |
| | | Maximum offering price per share ($11.98/0.9425) | | $ | 12.71 | (b) | |
| Class B | | Net assets | | $ | 43,172,744 | | |
| | | Shares outstanding | | | 3,740,466 | | |
| | | Net asset value and offering price per share | | $ | 11.54 | (a) | |
| Class C | | Net assets | | $ | 36,186,982 | | |
| | | Shares outstanding | | | 3,135,085 | | |
| | | Net asset value and offering price per share | | $ | 11.54 | (a) | |
| Class I (c) | | Net assets | | $ | 123,018,447 | | |
| | | Shares outstanding | | | 10,228,366 | | |
| | | Net asset value, offering and redemption price per share | | $ | 12.03 | | |
| Class R | | Net assets | | $ | 1,210,553 | | |
| | | Shares outstanding | | | 101,045 | | |
| | | Net asset value, offering and redemption price per share | | $ | 11.98 | | |
| Class W (c) | | Net assets | | $ | 2,936 | | |
| | | Shares outstanding | | | 245 | | |
| | | Net asset value, offering and redemption price per share | | $ | 11.99 | (d) | |
| Class Y | | Net assets | | $ | 7,138,171 | | |
| | | Shares outstanding | | | 593,755 | | |
| | | Net asset value, offering and redemption price per share | | $ | 12.02 | | |
| Class Z | | Net assets | | $ | 1,366,011,019 | | |
| | | Shares outstanding | | | 113,744,566 | | |
| | | Net asset value, offering and redemption price per share | | $ | 12.01 | | |
(a) Redemption price per share is equal to net asset value less any applicable contingent deferred sales charge.
(b) On sales of $50,000 or more the offering price is reduced.
(c) Class I and Class W shares commenced operations on September 27, 2010.
(d) Net asset value per share rounds to this amount due to fractional shares outstanding.
See Accompanying Notes to Financial Statements.
14
Statement of Operations – Columbia Large Cap Value Fund
For the Year Ended February 28, 2011
| | | | | ($) (a) | |
| Investment Income | | Dividends | | | 45,749,903 | | |
| | | Foreign taxes withheld | | | (21,509 | ) | |
| | | Total Investment Income | | | 45,728,394 | | |
| Expenses | | Investment advisory fee | | | 10,305,640 | | |
| | | Administration fee | | | 3,361,067 | | |
| | | Distribution fee: | | | |
| | | Class B | | | 457,979 | | |
| | | Class C | | | 265,679 | | |
| | | Class R | | | 3,623 | | |
| | | Service fee: | | | |
| | | Class B | | | 152,660 | | |
| | | Class C | | | 88,559 | | |
| | | Class W | | | 3 | | |
| | | Distribution and service fees: | | | |
| | | Class A | | | 1,533,907 | | |
| | | Transfer agent fee: | | | |
| | | Class A, Class B, Class C, Class R, Class W and Class Z | | | 4,336,843 | | |
| | | Class Y | | | 45 | | |
| | | Pricing and bookkeeping fees | | | 141,795 | | |
| | | Trustees' fees | | | 53,639 | | |
| | | Custody fee | | | 56,995 | | |
| | | Chief compliance officer expenses | | | 2,873 | | |
| | | Other expenses | | | 712,986 | | |
| | | Expenses before interest expense | | | 21,474,293 | | |
| | | Interest expense | | | 2,883 | | |
| | | Total Expenses | | | 21,477,176 | | |
| | | Expense reductions | | | (180 | ) | |
| | | Net Expenses | | | 21,476,996 | | |
| | | Net Investment Income | | | 24,251,398 | | |
| Net Realized and Unrealized Gain (Loss) on Investments and Foreign Currency | | Net realized gain on: | | | |
| | | Investments | | | 233,872,330 | | |
| | | Foreign currency transactions | | | 39 | | |
| | | Net realized gain | | | 233,872,369 | | |
| | | Net change in unrealized appreciation (depreciation) on investments | | | 124,489,315 | | |
| | | Net Gain | | | 358,361,684 | | |
| | | Net Increase Resulting from Operations | | | 382,613,082 | | |
(a) Class I and Class W shares commenced operations on September 27, 2010.
See Accompanying Notes to Financial Statements.
15
Statement of Changes in Net Assets – Columbia Large Cap Value Fund
| | | | | Year Ended February 28, | |
| Increase (Decrease) in Net Assets | | | | 2011 ($)(a)(b) | | 2010 ($)(c)(d) | |
| Operations | | Net investment income | | | 24,251,398 | | | | 23,132,437 | | |
| | | Net realized gain (loss) on investments and
foreign currency transactions | | | 233,872,369 | | | | (154,849,867 | ) | |
| | | Net change in unrealized appreciation (depreciation)
on investments | | | 124,489,315 | | | | 918,811,164 | | |
| | | Net increase resulting from operations | | | 382,613,082 | | | | 787,093,734 | | |
| Distributions to Shareholders | | From net investment income: | | | | | | | | | |
| | | Class A | | | (6,790,082 | ) | | | (9,326,644 | ) | |
| | | Class B | | | (323,287 | ) | | | (503,460 | ) | |
| | | Class C | | | (213,772 | ) | | | (148,010 | ) | |
| | | Class I | | | (533,119 | ) | | | — | | |
| | | Class R | | | (9,893 | ) | | | (1,783 | ) | |
| | | Class W | | | (8 | ) | | | — | | |
| | | Class Y | | | (193,638 | ) | | | (88,057 | ) | |
| | | Class Z | | | (18,764,224 | ) | | | (16,140,284 | ) | |
| | | Total distributions to shareholders | | | (26,828,023 | ) | | | (26,208,238 | ) | |
| | | Net Capital Stock Transactions | | | (589,141,795 | ) | | | (171,434,011 | ) | |
| | | Increase from regulatory settlements | | | — | | | | 1,763 | | |
| | | Total increase (decrease) in net assets | | | (233,356,736 | ) | | | 589,453,248 | | |
| Net Assets | | Beginning of period | | | 2,327,958,738 | | | | 1,738,505,490 | | |
| | | End of period | | | 2,094,602,002 | | | | 2,327,958,738 | | |
| | | Undistributed (Accumulated) net investment income
(loss) at end of period | | | (36,125 | ) | | | 1,287,424 | | |
(a) Class I and Class W shares commenced operations on September 27, 2010.
(b) Class I and Class W shares reflect activity for the period September 27, 2010 through February 28, 2011.
(c) Class Y shares commenced operations on July 15, 2009.
(d) Class Y shares reflect activity for the period July 15, 2009 through February 28, 2010.
See Accompanying Notes to Financial Statements.
16
Statement of Changes in Net Assets (continued) – Columbia Large Cap Value Fund
| | | Capital Stock Activity | |
| | | Year Ended
February 28, 2011 (a)(b) | | Year Ended
February 28, 2010 (c)(d) | |
| | | Shares | | Dollars ($) | | Shares | | Dollars ($) | |
| Class A | |
| Subscriptions | | | 6,629,664 | | | | 70,755,262 | | | | 14,418,748 | | | | 127,246,912 | | |
| Distributions reinvested | | | 514,131 | | | | 5,387,726 | | | | 994,912 | | | | 8,893,118 | | |
| Redemptions | | | (52,463,069 | ) | | | (540,167,576 | ) | | | (22,943,831 | ) | | | (205,288,668 | ) | |
| Net decrease | | | (45,319,274 | ) | | | (464,024,588 | ) | | | (7,530,171 | ) | | | (69,148,638 | ) | |
| Class B | |
| Subscriptions | | | 49,453 | | | | 496,866 | | | | 173,524 | | | | 1,441,614 | | |
| Distributions reinvested | | | 23,701 | | | | 238,802 | | | | 54,092 | | | | 462,394 | | |
| Redemptions | | | (6,267,231 | ) | | | (64,270,104 | ) | | | (9,174,195 | ) | | | (80,479,829 | ) | |
| Net decrease | | | (6,194,077 | ) | | | (63,534,436 | ) | | | (8,946,579 | ) | | | (78,575,821 | ) | |
| Class C | |
| Subscriptions | | | 168,724 | | | | 1,739,351 | | | | 248,296 | | | | 2,150,151 | | |
| Distributions reinvested | | | 15,667 | | | | 158,109 | | | | 14,624 | | | | 126,386 | | |
| Redemptions | | | (880,581 | ) | | | (8,998,327 | ) | | | (1,035,282 | ) | | | (9,064,816 | ) | |
| Net decrease | | | (696,190 | ) | | | (7,100,867 | ) | | | (772,362 | ) | | | (6,788,279 | ) | |
| Class I | |
| Subscriptions | | | 16,236,077 | | | | 172,515,838 | | | | — | | | | — | | |
| Distributions reinvested | | | 47,136 | | | | 533,108 | | | | — | | | | — | | |
| Redemptions | | | (6,054,847 | ) | | | (69,040,190 | ) | | | — | | | | — | | |
| Net increase | | | 10,228,366 | | | | 104,008,756 | | | | — | | | | — | | |
| Class R | |
| Subscriptions | | | 98,178 | | | | 980,433 | | | | 8,096 | | | | 73,330 | | |
| Distributions reinvested | | | 939 | | | | 9,893 | | | | 199 | | | | 1,783 | | |
| Redemptions | | | (23,133 | ) | | | (273,944 | ) | | | (4,316 | ) | | | (39,322 | ) | |
| Net increase | | | 75,984 | | | | 716,382 | | | | 3,979 | | | | 35,791 | | |
| Class W | |
| Subscriptions | | | 259 | | | | 2,650 | | | | — | | | | — | | |
| Redemptions | | | (14 | ) | | | (154 | ) | | | — | | | | — | | |
| Net increase | | | 245 | | | | 2,496 | | | | — | | | | — | | |
| Class Y | |
| Subscriptions | | | 12,987 | | | | 130,000 | | | | 2,538,079 | | | | 22,992,093 | | |
| Distributions reinvested | | | 19 | | | | 203 | | | | 9 | | | | 89 | | |
| Redemptions | | | (557,752 | ) | | | (6,260,373 | ) | | | (1,399,587 | ) | | | (13,030,304 | ) | |
| Net increase (decrease) | | | (544,746 | ) | | | (6,130,170 | ) | | | 1,138,501 | | | | 9,961,878 | | |
| Class Z | |
| Subscriptions | | | 13,465,877 | | | | 141,147,347 | | | | 23,268,121 | | | | 200,560,704 | | |
| Distributions reinvested | | | 1,145,900 | | | | 12,055,399 | | | | 1,061,174 | | | | 9,540,775 | | |
| Redemptions | | | (28,724,028 | ) | | | (306,282,114 | ) | | | (25,864,203 | ) | | | (237,020,421 | ) | |
| Net decrease | | | (14,112,251 | ) | | | (153,079,368 | ) | | | (1,534,908 | ) | | | (26,918,942 | ) | |
(a) Class I and Class W shares commenced operations on September 27, 2010.
(b) Class I and Class W shares reflect activity for the period September 27, 2010 through February 28, 2011.
(c) Class Y shares commenced operations on July 15, 2009.
(d) Class Y shares reflect activity for the period July 15, 2009 through February 28, 2010.
See Accompanying Notes to Financial Statements.
17
Financial Highlights – Columbia Large Cap Value Fund
Selected data for a share outstanding throughout each period is as follows:
| | | Year Ended February 28, | | Year Ended
February 29, | | Period Ended
February 28, | | Year Ended
March 31, | |
| Class A Shares | | 2011 | | 2010 | | 2009 | | 2008 | | 2007 (a) | | 2006 (b) | |
| Net Asset Value, Beginning of Period | | $ | 10.07 | | | $ | 7.00 | | | $ | 12.37 | | | $ | 15.16 | | | $ | 14.60 | | | $ | 13.10 | | |
| Income from Investment Operations: | |
| Net investment income (c) | | | 0.11 | (d) | | | 0.09 | | | | 0.18 | | | | 0.20 | | | | 0.17 | | | | 0.19 | | |
Net realized and unrealized gain (loss)
on investments, foreign currency and
written options | | | 1.93 | | | | 3.08 | | | | (5.36 | ) | | | (1.14 | ) | | | 1.37 | | | | 1.64 | | |
| Total from investment operations | | | 2.04 | | | | 3.17 | | | | (5.18 | ) | | | (0.94 | ) | | | 1.54 | | | | 1.83 | | |
| Less Distributions to Shareholders: | |
| From net investment income | | | (0.13 | ) | | | (0.10 | ) | | | (0.19 | ) | | | (0.22 | ) | | | (0.12 | ) | | | (0.16 | ) | |
| From net realized gains | | | — | | | | — | | | | — | | | | (1.63 | ) | | | (0.86 | ) | | | (0.17 | ) | |
| Total distributions to shareholders | | | (0.13 | ) | | | (0.10 | ) | | | (0.19 | ) | | | (1.85 | ) | | | (0.98 | ) | | | (0.33 | ) | |
| Increase from regulatory settlements | | | — | | | | — | (e) | | | — | | | | — | | | | — | | | | — | | |
| Net Asset Value, End of Period | | $ | 11.98 | | | $ | 10.07 | | | $ | 7.00 | | | $ | 12.37 | | | $ | 15.16 | | | $ | 14.60 | | |
| Total return (f) | | | 20.45 | % | | | 45.49 | %(g) | | | (42.36 | )%(g) | | | (7.55 | )%(g) | | | 11.09 | %(g)(h) | | | 14.15 | %(g) | |
Ratios to Average Net Assets/
Supplemental Data: | |
| Net expenses before interest expense (i) | | | 1.18 | % | | | 1.12 | % | | | 1.04 | % | | | 0.99 | % | | | 1.01 | %(j) | | | 0.96 | % | |
| Interest expense | | | — | %(k) | | | — | | | | — | %(k) | | | — | | | | — | | | | — | | |
| Net expenses (i) | | | 1.18 | % | | | 1.12 | % | | | 1.04 | % | | | 0.99 | % | | | 1.01 | %(j) | | | 0.96 | % | |
| Waiver/Reimbursement | | | — | | | | 0.01 | % | | | 0.06 | % | | | 0.06 | % | | | 0.05 | %(j) | | | 0.09 | %(l) | |
| Net investment income (i) | | | 1.02 | % | | | 0.95 | % | | | 1.68 | % | | | 1.37 | % | | | 1.27 | %(j) | | | 1.36 | % | |
| Portfolio turnover rate | | | 79 | % | | | 61 | % | | | 61 | % | | | 62 | % | | | 66 | %(h) | | | 59 | % | |
| Net assets, end of period (000s) | | $ | 517,861 | | | $ | 891,894 | | | $ | 672,426 | | | $ | 1,262,700 | | | $ | 1,332,311 | | | $ | 1,066,456 | | |
(a) The Fund changed its fiscal year end from March 31 to February 28. Per share data and total return reflect activity from April 1, 2006 through February 28, 2007.
(b) On August 22, 2005, the Fund's Investor A shares were renamed Class A shares.
(c) Per share data was calculated using the average shares outstanding during the period.
(d) Net investment income per share reflects a special dividend. The effect of this dividend amounted to $0.04 per share.
(e) Rounds to less than $0.01 per share.
(f) Total return at net asset value assuming all distributions reinvested and no initial sales charge or contingent deferred sales charge.
(g) Had the Investment Manager and/or any of its affiliates not waived fees or reimbursed a portion of expenses, total return would have been reduced.
(h) Not annualized.
(i) The benefits derived from expense reductions had an impact of less than 0.01%.
(j) Annualized.
(k) Rounds to less than 0.01%.
(l) Bank of America Corporation assumed certain non-recurring costs. Absent these non-recurring costs, the waiver/reimbursement ratio would have been 0.03%.
See Accompanying Notes to Financial Statements.
18
Financial Highlights – Columbia Large Cap Value Fund
Selected data for a share outstanding throughout each period is as follows:
| | | Year Ended February 28, | | Year Ended
February 29, | | Period Ended
February 28, | | Year Ended
March 31, | |
| Class B Shares | | 2011 | | 2010 | | 2009 | | 2008 | | 2007 (a) | | 2006 (b) | |
| Net Asset Value, Beginning of Period | | $ | 9.72 | | | $ | 6.75 | | | $ | 11.94 | | | $ | 14.69 | | | $ | 14.19 | | | $ | 12.75 | | |
| Income from Investment Operations: | |
| Net investment income (c) | | | 0.03 | (d) | | | 0.02 | | | | 0.09 | | | | 0.09 | | | | 0.07 | | | | 0.08 | | |
Net realized and unrealized gain (loss)
on investments, foreign currency and
written options | | | 1.85 | | | | 2.99 | | | | (5.17 | ) | | | (1.10 | ) | | | 1.34 | | | | 1.59 | | |
| Total from investment operations | | | 1.88 | | | | 3.01 | | | | (5.08 | ) | | | (1.01 | ) | | | 1.41 | | | | 1.67 | | |
| Less Distributions to Shareholders: | |
| From net investment income | | | (0.06 | ) | | | (0.04 | ) | | | (0.11 | ) | | | (0.11 | ) | | | (0.05 | ) | | | (0.06 | ) | |
| From net realized gains | | | — | | | | — | | | | — | | | | (1.63 | ) | | | (0.86 | ) | | | (0.17 | ) | |
| Total distributions to shareholders | | | (0.06 | ) | | | (0.04 | ) | | | (0.11 | ) | | | (1.74 | ) | | | (0.91 | ) | | | (0.23 | ) | |
| Increase from regulatory settlements | | | — | | | | — | (e) | | | — | | | | — | | | | — | | | | — | | |
| Net Asset Value, End of Period | | $ | 11.54 | | | $ | 9.72 | | | $ | 6.75 | | | $ | 11.94 | | | $ | 14.69 | | | $ | 14.19 | | |
| Total return (f) | | | 19.48 | % | | | 44.59 | %(g) | | | (42.84 | )%(g) | | | (8.24 | )%(g) | | | 10.38 | %(g)(h) | | | 13.22 | %(g) | |
Ratios to Average Net Assets/
Supplemental Data: | |
| Net expenses before interest expense (i) | | | 1.93 | % | | | 1.87 | % | | | 1.79 | % | | | 1.74 | % | | | 1.76 | %(j) | | | 1.71 | % | |
| Interest expense | | | — | %(k) | | | — | | | | — | %(k) | | | — | | | | — | | | | — | | |
| Net expenses (i) | | | 1.93 | % | | | 1.87 | % | | | 1.79 | % | | | 1.74 | % | | | 1.76 | %(j) | | | 1.71 | % | |
| Waiver/Reimbursement | | | — | | | | 0.01 | % | | | 0.06 | % | | | 0.06 | % | | | 0.05 | %(j) | | | 0.09 | %(l) | |
| Net investment income (i) | | | 0.32 | % | | | 0.23 | % | | | 0.89 | % | | | 0.60 | % | | | 0.52 | %(j) | | | 0.60 | % | |
| Portfolio turnover rate | | | 79 | % | | | 61 | % | | | 61 | % | | | 62 | % | | | 66 | %(h) | | | 59 | % | |
| Net assets, end of period (000s) | | $ | 43,173 | | | $ | 96,524 | | | $ | 127,489 | | | $ | 346,218 | | | $ | 557,033 | | | $ | 693,558 | | |
(a) The Fund changed its fiscal year end from March 31 to February 28. Per share data and total return reflect activity from April 1, 2006 through February 28, 2007.
(b) On August 22, 2005, the Fund's Investor B shares were renamed Class B shares.
(c) Per share data was calculated using the average shares outstanding during the period.
(d) Net investment income per share reflects a special dividend. The effect of this dividend amounted to $0.04 per share.
(e) Rounds to less than $0.01 per share.
(f) Total return at net asset value assuming all distributions reinvested and no contingent deferred sales charge.
(g) Had the Investment Manager and/or any of its affiliates not waived fees or reimbursed a portion of expenses, total return would have been reduced.
(h) Not annualized.
(i) The benefits derived from expense reductions had an impact of less than 0.01%.
(j) Annualized.
(k) Rounds to less than 0.01%.
(l) Bank of America Corporation assumed certain non-recurring costs. Absent these non-recurring costs, the waiver/reimbursement ratio would have been 0.03%.
See Accompanying Notes to Financial Statements.
19
Financial Highlights – Columbia Large Cap Value Fund
Selected data for a share outstanding throughout each period is as follows:
| | | Year Ended February 28, | | Year Ended
February 29, | | Period Ended
February 28, | | Year Ended
March 31, | |
| Class C Shares | | 2011 | | 2010 | | 2009 | | 2008 | | 2007 (a) | | 2006 (b) | |
| Net Asset Value, Beginning of Period | | $ | 9.72 | | | $ | 6.75 | | | $ | 11.94 | | | $ | 14.69 | | | $ | 14.19 | | | $ | 12.75 | | |
| Income from Investment Operations: | |
| Net investment income (c) | | | 0.03 | (d) | | | 0.02 | | | | 0.09 | | | | 0.09 | | | | 0.07 | | | | 0.08 | | |
Net realized and unrealized gain (loss)
on investments, foreign currency and
written options | | | 1.85 | | | | 2.99 | | | | (5.17 | ) | | | (1.10 | ) | | | 1.34 | | | | 1.59 | | |
| Total from investment operations | | | 1.88 | | | | 3.01 | | | | (5.08 | ) | | | (1.01 | ) | | | 1.41 | | | | 1.67 | | |
| Less Distributions to Shareholders: | |
| From net investment income | | | (0.06 | ) | | | (0.04 | ) | | | (0.11 | ) | | | (0.11 | ) | | | (0.05 | ) | | | (0.06 | ) | |
| From net realized gains | | | — | | | | — | | | | — | | | | (1.63 | ) | | | (0.86 | ) | | | (0.17 | ) | |
| Total distributions to shareholders | | | (0.06 | ) | | | (0.04 | ) | | | (0.11 | ) | | | (1.74 | ) | | | (0.91 | ) | | | (0.23 | ) | |
| Increase from regulatory settlements | | | — | | | | — | (e) | | | — | | | | — | | | | — | | | | — | | |
| Net Asset Value, End of Period | | $ | 11.54 | | | $ | 9.72 | | | $ | 6.75 | | | $ | 11.94 | | | $ | 14.69 | | | $ | 14.19 | | |
| Total return (f) | | | 19.48 | % | | | 44.59 | %(g) | | | (42.84 | )%(g) | | | (8.24 | )%(g) | | | 10.38 | %(g)(h) | | | 13.22 | %(g) | |
Ratios to Average Net Assets/
Supplemental Data: | |
| Net expenses before interest expense (i) | | | 1.93 | % | | | 1.87 | % | | | 1.79 | % | | | 1.74 | % | | | 1.76 | %(j) | | | 1.71 | % | |
| Interest expense | | | — | %(k) | | | — | | | | — | %(k) | | | — | | | | — | | | | — | | |
| Net expenses (i) | | | 1.93 | % | | | 1.87 | % | | | 1.79 | % | | | 1.74 | % | | | 1.76 | %(j) | | | 1.71 | % | |
| Waiver/Reimbursement | | | — | | | | 0.01 | % | | | 0.06 | % | | | 0.06 | % | | | 0.05 | %(j) | | | 0.09 | %(l) | |
| Net investment income (i) | | | 0.32 | % | | | 0.21 | % | | | 0.90 | % | | | 0.60 | % | | | 0.52 | %(j) | | | 0.60 | % | |
| Portfolio turnover rate | | | 79 | % | | | 61 | % | | | 61 | % | | | 62 | % | | | 66 | %(h) | | | 59 | % | |
| Net assets, end of period (000s) | | $ | 36,187 | | | $ | 37,229 | | | $ | 31,091 | | | $ | 70,383 | | | $ | 94,600 | | | $ | 98,884 | | |
(a) The Fund changed its fiscal year end from March 31 to February 28. Per share data and total return reflect activity from April 1, 2006 through February 28, 2007.
(b) On August 22, 2005, the Fund's Investor C shares were renamed Class C shares.
(c) Per share data was calculated using the average shares outstanding during the period.
(d) Net investment income per share reflects a special dividend. The effect of this dividend amounted to $0.04 per share.
(e) Rounds to less than $0.01 per share.
(f) Total return at net asset value assuming all distributions reinvested and no contingent deferred sales charge.
(g) Had the Investment Manager and/or any of its affiliates not waived fees or reimbursed a portion of expenses, total return would have been reduced.
(h) Not annualized.
(i) The benefits derived from expense reductions had an impact of less than 0.01%.
(j) Annualized.
(k) Rounds to less than 0.01%.
(l) Bank of America Corporation assumed certain non-recurring costs. Absent these non-recurring costs, the waiver/reimbursement ratio would have been 0.03%.
See Accompanying Notes to Financial Statements.
20
Financial Highlights – Columbia Large Cap Value Fund
Selected data for a share outstanding throughout the period is as follows:
| Class I Shares | | Period Ended
February 28,
2011 (a) | |
| Net Asset Value, Beginning of Period | | $ | 10.23 | | |
| Income from Investment Operations: | |
| Net investment income (b) | | | 0.05 | | |
| Net realized and unrealized gain on investments and foreign currency | | | 1.80 | | |
| Total from investment operations | | | 1.85 | | |
| Less Distributions to Shareholders: | |
| From net investment income | | | (0.05 | ) | |
| Net Asset Value, End of Period | | $ | 12.03 | | |
| Total return (c)(d) | | | 18.07 | % | |
| Ratios to Average Net Assets/Supplemental Data: | |
| Net expenses (e)(f) | | | 0.70 | % | |
| Net investment income (e)(f) | | | 1.04 | % | |
| Portfolio turnover rate (d) | | | 79 | % | |
| Net assets, end of period (000s) | | $ | 123,018 | | |
(a) Class I shares commenced operations on September 27, 2010. Per share data and total return reflect activity from that date.
(b) Per share data was calculated using the average shares outstanding during the period.
(c) Total return at net asset value assuming all distributions reinvested.
(d) Not annualized.
(e) The benefits derived from expense reductions had an impact of less than 0.01%.
(f) Annualized.
See Accompanying Notes to Financial Statements.
21
Financial Highlights – Columbia Large Cap Value Fund
Selected data for a share outstanding throughout each period is as follows:
| | | Year Ended February 28, | | Year Ended
February 29, | | Period Ended
February 28, | | Period Ended
March 31, | |
| Class R Shares | | 2011 | | 2010 | | 2009 | | 2008 | | 2007 (a) | | 2006 (b) | |
| Net Asset Value, Beginning of Period | | $ | 10.07 | | | $ | 6.99 | | | $ | 12.36 | | | $ | 15.15 | | | $ | 14.59 | | | $ | 14.05 | | |
| Income from Investment Operations: | |
| Net investment income (c) | | | 0.06 | (d) | | | 0.07 | | | | 0.15 | | | | 0.22 | | | | 0.14 | | | | 0.04 | | |
Net realized and unrealized gain (loss)
on investments, foreign currency and
written options | | | 1.95 | | | | 3.09 | | | | (5.36 | ) | | | (1.19 | ) | | | 1.38 | | | | 0.53 | | |
| Total from investment operations | | | 2.01 | | | | 3.16 | | | | (5.21 | ) | | | (0.97 | ) | | | 1.52 | | | | 0.57 | | |
| Less Distributions to Shareholders: | |
| From net investment income | | | (0.10 | ) | | | (0.08 | ) | | | (0.16 | ) | | | (0.19 | ) | | | (0.10 | ) | | | (0.03 | ) | |
| From net realized gains | | | — | | | | — | | | | — | | | | (1.63 | ) | | | (0.86 | ) | | | — | | |
| Total distributions to shareholders | | | (0.10 | ) | | | (0.08 | ) | | | (0.16 | ) | | | (1.82 | ) | | | (0.96 | ) | | | (0.03 | ) | |
| Increase from regulatory settlements | | | — | | | | — | (e) | | | — | | | | — | | | | — | | | | — | | |
| Net Asset Value, End of Period | | $ | 11.98 | | | $ | 10.07 | | | $ | 6.99 | | | $ | 12.36 | | | $ | 15.15 | | | $ | 14.59 | | |
| Total return (f) | | | 20.16 | % | | | 45.34 | %(g) | | | (42.54 | )%(g) | | | (7.79 | )%(g) | | | 10.90 | %(g)(h) | | | 4.05 | %(g)(h) | |
Ratios to Average Net Assets/
Supplemental Data: | |
| Net expenses before interest expense (i) | | | 1.43 | % | | | 1.37 | % | | | 1.29 | % | | | 1.24 | % | | | 1.26 | %(j) | | | 1.25 | %(j) | |
| Interest expense | | | — | %(k) | | | — | | | | — | %(k) | | | — | | | | — | | | | — | | |
| Net expenses (i) | | | 1.43 | % | | | 1.37 | % | | | 1.29 | % | | | 1.24 | % | | | 1.26 | %(j) | | | 1.25 | %(j) | |
| Waiver/Reimbursement | | | — | | | | 0.01 | % | | | 0.06 | % | | | 0.06 | % | | | 0.05 | %(j) | | | 0.16 | %(j)(l) | |
| Net investment income (i) | | | 0.59 | % | | | 0.71 | % | | | 1.45 | % | | | 1.63 | % | | | 1.02 | %(j) | | | 1.33 | %(j) | |
| Portfolio turnover rate | | | 79 | % | | | 61 | % | | | 61 | % | | | 62 | % | | | 66 | %(h) | | | 59 | %(h) | |
| Net assets, end of period (000s) | | $ | 1,211 | | | $ | 252 | | | $ | 147 | | | $ | 236 | | | $ | 11 | | | $ | 10 | | |
(a) The Fund changed its fiscal year end from March 31 to February 28. Per share data and total return reflect activity from April 1, 2006 through February 28, 2007.
(b) Class R shares commenced operations on January 23, 2006. Per share data and total return reflect activity from that date.
(c) Per share data was calculated using the average shares outstanding during the period.
(d) Net investment income per share reflects a special dividend. The effect of this dividend amounted to $0.04 per share.
(e) Rounds to less than $0.01 per share.
(f) Total return at net asset value assuming all distributions reinvested.
(g) Had the Investment Manager and/or any of its affiliates not waived fees or reimbursed a portion of expenses, total return would have been reduced.
(h) Not annualized.
(i) The benefits derived from expense reductions had an impact of less than 0.01%.
(j) Annualized.
(k) Rounds to less than 0.01%.
(l) Bank of America Corporation assumed certain non-recurring costs. Absent these non-recurring costs, the waiver/reimbursement ratio would have been 0.10%.
See Accompanying Notes to Financial Statements.
22
Financial Highlights – Columbia Large Cap Value Fund
Selected data for a share outstanding throughout the period is as follows:
| Class W Shares | | Period Ended
February 28,
2011 (a) | |
| Net Asset Value, Beginning of Period | | $ | 10.21 | | |
| Income from Investment Operations: | |
| Net investment income (b) | | | 0.03 | | |
| Net realized and unrealized gain on investments and foreign currency | | | 1.78 | | |
| Total from investment operations | | | 1.81 | | |
| Less Distributions to Shareholders: | |
| From net investment income | | | (0.03 | ) | |
| Net Asset Value, End of Period | | $ | 11.99 | | |
| Total return (c)(d) | | | 17.79 | % | |
| Ratios to Average Net Assets/Supplemental Data: | |
| Net expenses (e)(f) | | | 1.22 | % | |
| Net investment income (e)(f) | | | 0.54 | % | |
| Portfolio turnover rate (d) | | | 79 | % | |
| Net assets, end of period (000s) | | $ | 3 | | |
(a) Class W shares commenced operations on September 27, 2010. Per share data and total return reflect activity from that date.
(b) Per share data was calculated using the average shares outstanding during the period.
(c) Total return at net asset value assuming all distributions reinvested.
(d) Not annualized.
(e) The benefits derived from expense reductions had an impact of less than 0.01%.
(f) Annualized.
See Accompanying Notes to Financial Statements.
23
Financial Highlights – Columbia Large Cap Value Fund
Selected data for a share outstanding throughout each period is as follows:
| Class Y Shares | | Year Ended
February 28,
2011 | | Period Ended
February 28,
2010 (a) | |
| Net Asset Value, Beginning of Period | | $ | 10.10 | | | $ | 8.65 | | |
| Income from Investment Operations: | |
| Net investment income (b) | | | 0.17 | (c) | | | 0.08 | | |
| Net realized and unrealized gain on investments and foreign currency | | | 1.92 | | | | 1.45 | | |
| Total from investment operations | | | 2.09 | | | | 1.53 | | |
| Less Distributions to Shareholders: | |
| From net investment income | | | (0.17 | ) | | | (0.08 | ) | |
| Net Asset Value, End of Period | | $ | 12.02 | | | $ | 10.10 | | |
| Total return (d) | | | 20.98 | % | | | 17.67 | %(e) | |
| Ratios to Average Net Assets/Supplemental Data: | |
| Net expenses before interest expense (f) | | | 0.71 | % | | | 0.72 | %(h) | |
| Interest expense | | | — | %(g) | | | — | | |
| Net expenses (f) | | | 0.71 | % | | | 0.72 | %(h) | |
| Net investment income (f) | | | 1.62 | % | | | 1.36 | %(h) | |
| Portfolio turnover rate | | | 79 | % | | | 61 | %(e) | |
| Net assets, end of period (000s) | | $ | 7,138 | | | $ | 11,497 | | |
(a) Class Y shares commenced operations on July 15, 2009. Per share data and total return reflect activity from that date.
(b) Per share data was calculated using the average shares outstanding during the period.
(c) Net investment income per share reflects a special dividend. The effect of this dividend amounted to $0.04 per share.
(d) Total return at net asset value assuming all distributions reinvested.
(e) Not annualized.
(f) The benefits derived from expense reductions had an impact of less than 0.01%.
(g) Rounds to less than 0.01%.
(h) Annualized.
See Accompanying Notes to Financial Statements.
24
Financial Highlights – Columbia Large Cap Value Fund
Selected data for a share outstanding throughout each period is as follows:
| | | Year Ended February 28, | | Year Ended
February 29, | | Period Ended
February 28, | | Year Ended
March 31, | |
| Class Z Shares | | 2011 | | 2010 | | 2009 | | 2008 | | 2007 (a) | | 2006 (b) | |
Net Asset Value,
Beginning of Period | | $ | 10.09 | | | $ | 7.01 | | | $ | 12.40 | | | $ | 15.19 | | | $ | 14.61 | | | $ | 13.12 | | |
Income from Investment
Operations: | |
| Net investment income (c) | | | 0.14 | (d) | | | 0.11 | | | | 0.20 | | | | 0.24 | | | | 0.21 | | | | 0.22 | | |
Net realized and unrealized gain (loss)
on investments, foreign currency and
written options | | | 1.94 | | | | 3.09 | | | | (5.39 | ) | | | (1.14 | ) | | | 1.38 | | | | 1.63 | | |
| Total from investment operations | | | 2.08 | | | | 3.20 | | | | (5.19 | ) | | | (0.90 | ) | | | 1.59 | | | | 1.85 | | |
Less Distributions to
Shareholders: | |
| From net investment income | | | (0.16 | ) | | | (0.12 | ) | | | (0.22 | ) | | | (0.26 | ) | | | (0.15 | ) | | | (0.19 | ) | |
| From net realized gains | | | — | | | | — | | | | — | | | | (1.63 | ) | | | (0.86 | ) | | | (0.17 | ) | |
| Total distributions to shareholders | | | (0.16 | ) | | | (0.12 | ) | | | (0.22 | ) | | | (1.89 | ) | | | (1.01 | ) | | | (0.36 | ) | |
Increase from regulatory
settlements | | | — | | | | — | (e) | | | 0.02 | | | | — | | | | — | | | | — | | |
| Net Asset Value, End of Period | | $ | 12.01 | | | $ | 10.09 | | | $ | 7.01 | | | $ | 12.40 | | | $ | 15.19 | | | $ | 14.61 | | |
| Total return (f) | | | 20.81 | % | | | 45.93 | %(g) | | | (42.27 | )%(g) | | | (7.29 | )%(g) | | | 11.42 | %(g)(h) | | | 14.33 | %(g) | |
Ratios to Average Net Assets/
Supplemental Data: | |
| Net expenses before interest expense (i) | | | 0.93 | % | | | 0.87 | % | | | 0.79 | % | | | 0.74 | % | | | 0.76 | %(j) | | | 0.71 | % | |
| Interest expense | | | — | %(k) | | | — | | | | — | %(k) | | | — | | | | — | | | | — | | |
| Net expenses (i) | | | 0.93 | % | | | 0.87 | % | | | 0.79 | % | | | 0.74 | % | | | 0.76 | %(j) | | | 0.71 | % | |
| Waiver/Reimbursement | | | — | | | | 0.01 | % | | | 0.06 | % | | | 0.06 | % | | | 0.05 | %(j) | | | 0.09 | %(l) | |
| Net investment income (i) | | | 1.32 | % | | | 1.21 | % | | | 1.91 | % | | | 1.61 | % | | | 1.52 | %(j) | | | 1.60 | % | |
| Portfolio turnover rate | | | 79 | % | | | 61 | % | | | 61 | % | | | 62 | % | | | 66 | %(h) | | | 59 | % | |
| Net assets, end of period (000s) | | $ | 1,366,011 | | | $ | 1,290,563 | | | $ | 907,353 | | | $ | 1,905,752 | | | $ | 2,277,652 | | | $ | 2,009,115 | | |
(a) The Fund changed its fiscal year end from March 31 to February 28. Per share data and total return reflect activity from April 1, 2006 through February 28, 2007.
(b) On August 22, 2005, the Fund's Primary A shares were renamed Class Z shares.
(c) Per share data was calculated using the average shares outstanding during the period.
(d) Net investment income per share reflects a special dividend. The effect of this dividend amounted to $0.04 per share.
(e) Rounds to less than $0.01 per share.
(f) Total return at net asset value assuming all distributions reinvested.
(g) Had the Investment Manager and/or any of its affiliates not waived fees or reimbursed a portion of expenses, total return would have been reduced.
(h) Not annualized.
(i) The benefits derived from expense reductions had an impact of less than 0.01%.
(j) Annualized.
(k) Rounds to less than 0.01%.
(l) Bank of America Corporation assumed certain non-recurring costs. Absent these non-recurring costs, the waiver/reimbursement ratio would have been 0.03%.
See Accompanying Notes to Financial Statements.
25
Notes to Financial Statements – Columbia Large Cap Value Fund
February 28, 2011
Note 1. Organization
Columbia Large Cap Value Fund (the Fund), a series of Columbia Funds Series Trust (the Trust), is a diversified fund. The Trust is registered under the Investment Company Act of 1940, as amended (the 1940 Act), as an open-end management investment company organized as a Delaware statutory trust.
After the close of business on April 30, 2010, Ameriprise Financial, Inc. (Ameriprise Financial) acquired a portion of the asset management business of Columbia Management Group, LLC (the Transaction), including the business of managing the Fund. In connection with the closing of the Transaction (the Closing), RiverSource Investments, LLC, a wholly owned subsidiary of Ameriprise Financial, became the investment manager of the Fund and changed its name to Columbia Management Investment Advisers, LLC (the Investment Manager).
Investment Objective
The Fund seeks long-term capital appreciation.
Fund Shares
The Trust has unlimited authorized shares of beneficial interest. The Fund offers Class A, Class B, Class C, Class I, Class R, Class W, Class Y and Class Z shares. On December 17, 2010, the Investment Manager exchanged Class Z shares valued at $18,924,600 for Class I shares. All share classes have identical voting, dividend and liquidation rights. Each share class has its own expense structure and sales charges, as applicable.
Class A shares are subject to a maximum front-end sales charge of 5.75% based on the investment amount. Class A shares purchased without an initial sales charge in accounts aggregating $1 million to $50 million at the time of purchase are subject to a 1.00% contingent deferred sales charge (CDSC) if the shares are sold within 18 months of purchase, charged as follows: 1.00% CDSC if redeemed within 12 months of purchase, and 0.50% CDSC if redeemed more than 12, but less than 18 months after purchase.
The Fund no longer accepts investments by new or existing investors in the Fund's Class B shares, except in connection with the reinvestment of any dividend and/or capital gain distributions in Class B shares of the Fund and exchanges by existing Class B shareholders of certain other funds within the Columbia Family of Funds. Class B shares may be subject to a maximum CDSC of 5.00% based upon the holding period after purchase. Class B shares will generally convert to Class A shares eight years after purchase.
Class C shares are subject to a 1.00% CDSC on shares redeemed within one year of purchase.
Class I shares are not subject to sales charges and are available only to the Columbia Family of Funds. Class I shares became effective September 27, 2010.
Class R shares are not subject to sales charges and are available only to qualifying institutional investors.
Class W shares are not subject to sales charges and are available only to investors purchasing through authorized investment programs managed by investment professionals, including discretionary managed account programs. Class W shares became effective September 27, 2010.
Class Y shares are not subject to sales charges and are available only to certain investors, as described in the Fund's prospectus.
Class Z shares are not subject to sales charges and are available only to certain investors, as described in the Fund's prospectus.
Note 2. Summary of Significant Accounting Policies
The preparation of financial statements in accordance with U.S. generally accepted accounting principles (GAAP) requires the Investment Manager to make certain estimates and assumptions that affect the reported amounts of assets and liabilities, the disclosure of contingent assets and liabilities at the date of the financial statements and the reported amounts of revenue and expenses during the reporting period. Actual results could differ from those estimates.
The following is a summary of significant accounting policies consistently followed by the Fund in the preparation of its financial statements.
Security Valuation
Equity securities are valued at the last sale price on the principal exchange on which they trade, except for securities traded on the NASDAQ, which are valued at the NASDAQ official close price. Unlisted securities or listed securities for which there were no sales during the day are valued at the closing bid price on such exchanges or over-the-counter markets.
Debt securities generally are valued by pricing services approved by the Trust's Board of Trustees, based upon market transactions for normal, institutional-size trading units of similar securities. The services may use various pricing techniques which take into account appropriate factors such as yield, quality, coupon rate, maturity, type
26
Columbia Large Cap Value Fund, February 28, 2011
of issue, trading characteristics and other data, as well as broker quotes. Debt securities for which quotations are readily available may also be valued based upon an over-the-counter or exchange bid quotation.
Short-term investments maturing in 60 days or less are valued at amortized cost, which approximates market value.
Investments for which market quotations are not readily available, or that have quotations which the Investment Manager believes are not reliable, are valued at fair value as determined in good faith under consistently applied procedures established by and under the general supervision of the Board of Trustees. If a security is valued at fair value, such value is likely to be different from the last quoted market price for the security. The determination of fair value often requires significant judgment. To determine fair value, the Investment Manager may use assumptions including but not limited to future cash flows and estimated risk premiums. Multiple inputs from various sources may be used to determine value.
Repurchase Agreements
The Fund may engage in repurchase agreement transactions with institutions that the Investment Manager has determined are creditworthy. The Fund, through the custodian, receives delivery of the underlying securities collateralizing a repurchase agreement. The Investment Manager is responsible for determining that the collateral is at least equal, at all times, to the value of the repurchase obligation including interest. A repurchase agreement transaction involves certain risks in the event of default or insolvency of the counterparty. These risks include possible delays in or restrictions on the Fund's ability to dispose of the underlying securities and a possible decline in the value of the underlying securities during the period while the Fund seeks to assert its rights.
Security Transactions
Security transactions are accounted for on the trade date. Cost is determined and gains (losses) are based upon the specific identification method for both financial statement and federal income tax purposes.
Income Recognition
Interest income is recorded on the accrual basis.
Awards from class action litigation are recorded as a reduction of cost if the Fund still owns the applicable securities on the payment date. If the Fund no longer owns the applicable securities, the proceeds are recorded as realized gains.
Corporate actions and dividend income are recorded on the ex-date.
The Fund receives information regarding the character of distributions received from real estate investment trusts (REITs) on an annual basis. Distributions received from REITs are allocated among dividend income, capital gain and return of capital based upon such information or based on management's estimates if actual information has not yet been reported. Management's estimates are subsequently adjusted when the actual character of the distributions are disclosed by the REITs which could result in a proportionate increase in returns of capital to shareholders.
Distributions received from REITs in excess of their income are recorded as a reduction of the cost of the related investments. If the Fund no longer owns the applicable securities, any distributions received in excess of income are recorded as realized gains.
Expenses
General expenses of the Trust are allocated to the Fund and other series of the Trust based upon relative net assets or other expense allocation methodologies determined by the nature of the expense. Expenses directly attributable to a specific class of shares are charged to that share class. Expenses directly attributable to the Fund are charged to the Fund.
Determination of Class Net Asset Value
All income, expenses (other than class-specific expenses which are charged directly to a share class, as shown in the Statement of Operations) and realized and unrealized gains (losses) are allocated to each class of the Fund on a daily basis, based on the relative net assets of each class, for purposes of determining the net asset value of each class.
Federal Income Tax Status
The Fund intends to qualify each year as a regulated investment company under Subchapter M of the Internal Revenue Code, as amended, and will distribute substantially all of its taxable income, if any, for its tax year, and as such will not be subject to federal income taxes. In addition, the Fund intends to distribute in each calendar year substantially all of its net investment income, capital gains and certain other amounts, if any, such that the Fund should not be subject to federal excise tax. Therefore, no federal income or excise tax provision is recorded.
27
Columbia Large Cap Value Fund, February 28, 2011
Distributions to Shareholders
Distributions from net investment income are declared and paid quarterly. Net realized capital gains, if any, are distributed at least annually. Income distributions and capital gain distributions are determined in accordance with federal income tax regulations which may differ from GAAP.
Indemnification
In the normal course of business, the Fund enters into contracts that contain a variety of representations and warranties and which provide general indemnities. The Fund's maximum exposure under these arrangements is unknown because this would involve future claims against the Fund. Also, under the Trust's organizational documents and by contract, the Trustees and officers of the Trust are indemnified against certain liabilities that may arise out of actions relating to their duties to the Trust. However, based on experience, the Fund expects the risk of loss due to these representations, warranties and indemnities to be minimal.
Note 3. Fees and Compensation Paid to Affiliates
Investment Management Services Fee
The Investment Manager determines which securities will be purchased, held or sold. The management fee is based on the Fund's average daily net assets at the following annual rates:
| Average Daily Net Assets | | Annual Fee Rate | |
| First $500 million | | | 0.60 | % | |
| $500 million to $1 billion | | | 0.55 | % | |
| $1 billion to $6 billion | | | 0.43 | % | |
| Over $6 billion | | | 0.41 | % | |
Prior to the Closing, Columbia Management Advisors, LLC (Columbia), an indirect, wholly owned subsidiary of Bank of America Corporation (BOA), provided investment management services to the Fund under the same fee structure.
The effective management fee rate for the year ended February 28, 2011, was 0.48% of the Fund's average daily net assets.
Administration Fee
Effective upon the Closing, the Investment Manager became the administrator of the Fund and provides administrative and other services to the Fund, including services previously performed under the Pricing and Bookkeeping Oversight and Services Agreement discussed below. The administration fee is based on the annual rate of 0.17% of the Fund's average daily net assets, less the fees payable by the Fund as described under the Pricing and Bookkeeping Fees note below. Prior to the Closing, Columbia provided administrative services to the Fund at the same fee rate.
Pricing and Bookkeeping Fees
Prior to the Closing, the Fund entered into a Financial Reporting Services Agreement (the Financial Reporting Services Agreement) with State Street Bank and Trust Company (State Street) and Columbia pursuant to which State Street provides financial reporting services to the Fund. The Fund also entered into an Accounting Services Agreement (collectively with the Financial Reporting Services Agreement, the State Street Agreements) with State Street and Columbia pursuant to which State Street provides accounting services to the Fund. Upon the Closing, Columbia assigned and delegated its rights and obligations under the State Street Agreements to the Investment Manager. Under the State Street Agreements, the Fund pays State Street an annual fee of $38,000 paid monthly plus an additional monthly fee based on an annualized percentage rate of average daily net assets of the Fund for the month. The aggregate fee will not exceed $140,000 per year (exclusive of out-of-pocket expenses and charges). The Fund also reimburses State Street for certain out-of-pocket expenses and charges.
Also prior to the Closing, the Fund entered into a Pricing and Bookkeeping Oversight and Services Agreement (the Services Agreement) with Columbia. Under the Services Agreement, Columbia provided services related to Fund expenses and the requirements of the Sarbanes-Oxley Act of 2002, and provided oversight of the accounting and financial reporting services provided by State Street. Under the Services Agreement, the Fund reimbursed Columbia for out-of-pocket expenses and charges, including fees payable to third parties, such as for pricing the Fund's portfolio securities, incurred by Columbia in the performance of services under the Services Agreement. The Services Agreement was terminated upon the Closing. These services are now provided under the Administration Fee note discussed above.
Transfer Agent Fee
In connection with the Closing, RiverSource Service Corporation, a wholly owned subsidiary of Ameriprise Financial, became the transfer agent of the Fund and changed its name to Columbia Management Investment Services Corp. (the New Transfer Agent). The New Transfer Agent has contracted with Boston Financial Data
28
Columbia Large Cap Value Fund, February 28, 2011
Services (BFDS) to serve as sub-transfer agent. The New Transfer Agent receives monthly account-based service fees that vary by class and are based on the number of open accounts and asset-based fees, calculated based on assets held in omnibus accounts, which are intended to reimburse the New Transfer Agent for certain sub-transfer agent fees (exclusive of BFDS fees). The New Transfer Agent pays the fees of BFDS for services as sub-transfer agent and is not entitled to reimbursement for such fees from the Fund.
The New Transfer Agent receives reimbursement for certain out-of-pocket expenses and may also receive compensation for various shareholder services.
Prior to the Closing, Columbia Management Services, Inc., an affiliate of Columbia and an indirect, wholly owned subsidiary of BOA, provided shareholder services to the Fund and contracted with BFDS to serve as sub-transfer agent, under the same fee structure.
For the year ended February 28, 2011, the Fund's effective transfer agent fee rate for each class, with the exception of Class I shares, as a percentage of the average daily net assets was as follows:
| Class A | | Class B | | Class C | | Class R | | Class W | | Class Y | | Class Z | |
| | 0.22 | % | | | 0.22 | % | | | 0.22 | % | | | 0.22 | % | | | 0.27 | % | | | 0.00 | %* | | | 0.22 | % | |
Class I shares do not pay transfer agent fees.
* Rounds to less than 0.01%.
An annual minimum account balance fee of $20 may apply to certain accounts with a value below the Fund's initial minimum investment requirements to reduce the impact of small accounts on transfer agent fees. These minimum account balance fees are recorded as part of expense reductions on the Statement of Operations. For the year ended February 28, 2011, no minimum account balance fees were charged by the Fund.
Underwriting Discounts, Service and Distribution Fees
In connection with the Closing, RiverSource Fund Distributors, Inc., an indirect wholly owned subsidiary of Ameriprise Financial, became the distributor of the Fund and changed its name to Columbia Management Investment Distributors, Inc. (the New Distributor).
For the year ended February 28, 2011, initial sales charges paid by shareholders on the purchase of Class A shares amounted to $18,761 and net CDSC fees paid by shareholders on certain redemptions of Class A, Class B and Class C shares amounted to $315, $30,573 and $1,633, respectively.
The Trust has adopted shareholder servicing plans and distribution plans for the Class B, Class C and Class W shares of the Fund and a combined distribution and shareholder servicing plan for the Class A shares of the Fund. The Trust has also adopted a distribution plan for the Class R shares of the Fund. The shareholder servicing plans permit the Fund to compensate or reimburse servicing agents for the shareholder services they have provided. The distribution plans, adopted pursuant to Rule 12b-1 under the 1940 Act, permit the Fund to compensate or reimburse the New Distributor and/or selling agents for activities or expenses primarily intended to result in the sale of the classes' shares. Payments are made at an annual rate and paid monthly, as a percentage of average daily net assets, set from time to time by the Board of Trustees, and are charged as expenses of the Fund directly to the applicable share class. A substantial portion of the expenses incurred pursuant to these plans is paid to affiliates of the New Distributor.
The annual rates in effect and plan limits, as a percentage of average daily net assets are as follows:
| | | Current
Rate | | Plan
Limit | |
Class A Combined Distribution and
Shareholder Servicing Plan | | | 0.25 | % | | | 0.25 | % | |
Class B and Class C Shareholder
Servicing Plans | | | 0.25 | % | | | 0.25 | % | |
Class B and Class C
Distribution Plans | | | 0.75 | % | | | 0.75 | % | |
| Class R Distribution Plan | | | 0.50 | % | | | 0.50 | % | |
| Class W Shareholder Servicing Plan | | | 0.25 | % | | | 0.25 | %1 | |
| Class W Distribution Plan | | | 0.00 | % | | | 0.25 | %1 | |
1 The Fund may pay a distribution fee of up to 0.25% of the Fund's average daily net assets attributable to Class W shares and a service fee of up to 0.25% of the Fund's average daily net assets attributable to Class W shares, provided, however, that the aggregate fee shall not exceed 0.25% of the Fund's average daily net assets attributable to Class W shares.
Prior to the Closing, Columbia Management Distributors, Inc, an affiliate of Columbia and an indirect, wholly owned subsidiary of BOA, was the principal underwriter of the Fund's shares. There were no changes to the underwriting discount structure of the Fund or the service or distribution fee rates paid by the Fund as a result of the Transaction.
29
Columbia Large Cap Value Fund, February 28, 2011
Expense Limits and Fee Waivers
Effective September 27, 2010, the Investment Manager has voluntarily agreed to reimburse a portion of the Fund's expenses so that the Fund's ordinary operating expenses (excluding any brokerage commissions, interest, taxes and extraordinary expenses, but including custodian charges relating to overdrafts, if any), after giving effect to any balance credits from the Fund's custodian, do not exceed the annual rates of 1.25%, 2.00%, 2.00%, 0.87%, 1.50%, 1.25%, 1.00% and 1.00% of the Fund's average daily net assets attributable to Class A, Class B, Class C, Class I, Class R, Class W, Class Y and Class Z shares, respectively. This arrangement may be modified or terminated by the Investment Manager at any time.
For the period May 1, 2010 through September 26, 2010, the Investment Manager voluntarily agreed to reimburse a portion of the Fund's expenses so that the Fund's ordinary operating expenses (excluding any distribution and service fees, brokerage commissions, interest, taxes and extraordinary expenses, but including custodian charges relating to overdrafts, if any), after giving effect to any balance credits from the Fund's custodian, did not exceed 1.00% annually of the Fund's average daily net assets. Prior to May 1, 2010, Columbia voluntarily reimbursed a portion of the Fund's expenses in the same manner.
Fees Paid to Officers and Trustees
In connection with the Closing, all officers of the Fund are employees of the Investment Manager or its affiliates and, with the exception of the Fund's Chief Compliance Officer, receive no compensation from the Fund. The Board of Trustees has appointed a Chief Compliance Officer to the Fund in accordance with federal securities regulations. The Fund, along with other affiliated funds, pays its pro-rata share of the expenses associated with the Chief Compliance Officer. The Fund's expenses for the Chief Compliance Officer will not exceed $15,000 per year. Prior to the Closing, all officers of the Fund were employees of Columbia or its affiliates and the Fund paid its pro-rata share of the expenses for the Chief Compliance Officer under the same fee structure.
Trustees are compensated for their services to the Fund, as set forth on the Statement of Operations. The Trust's eligible Trustees may participate in a non-qualified deferred compensation plan which may be terminated at any time. Any payments to plan participants are paid solely out of the Fund's assets. Income earned on the plan participant's deferral account is based on the rate of return of the eligible mutual funds selected by the participant or, if no funds are selected, on the rate of return of Columbia Money Market Fund (formerly known as RiverSource Cash Management Fund). Prior to the Closing, if no funds were selected, income earned on the plan participant's deferral account was based on the rate of return of BofA Treasury Reserves. Trustees' fees deferred during the current period as well as any gains or losses on the trustees' deferred compensation balances as a result of market fluctuations are included in "Trustees' fees" on the Statement of Operations. Liabilities under the deferred compensation plan are included in "Trustees' fees" on the Statement of Assets and Liabilities.
Other Related Party Transactions
Prior to the Closing, the Fund used one or more brokers that were affiliates of BOA in connection with the purchase and sale of its securities.Total brokerage commissions paid to affiliated brokers for the period prior to the Closing were $24,260.
Note 4. Custody Credits
The Fund has an agreement with its custodian bank under which custody fees may be reduced by balance credits. These credits are recorded as part of expense reductions on the Statement of Operations. The Fund could have invested a portion of the assets utilized in connection with the expense offset arrangement in an income-producing asset if it had not entered into such an agreement. For the year ended February 28, 2011, these custody credits reduced total expenses by $180 for the Fund.
Note 5. Portfolio Information
The cost of purchases and proceeds from sales of securities, excluding short-term obligations, aggregated $1,601,594,176 and $2,198,336,992, respectively, for the year ended February 28, 2011.
Note 6. Regulatory Settlements
During the year ended February 28, 2010, the Fund received payments totaling $1,763 relating to certain regulatory settlements with third parties that the Fund had participated in during the year. The payments have been included in "Increase from regulatory settlements" on the Statement of Changes in Net Assets.
Note 7. Shareholder Concentration
As of February 28, 2011, two shareholder accounts owned 30.7% of the outstanding shares of the Fund. Purchase and redemption activity of these accounts may have a significant effect on the operations of the Fund.
30
Columbia Large Cap Value Fund, February 28, 2011
Note 8. Line of Credit
The Fund and other affiliated funds participate in a $280,000,000 committed, unsecured revolving line of credit provided by State Street. The maximum amount that may be borrowed by any fund is limited to the lesser of $200,000,000 and the Fund's borrowing limit set forth in the Fund's registration statement. Borrowings are available for short-term liquidity or temporary or emergency purposes.
Effective October 14, 2010, interest is charged to each participating fund based on the fund's borrowings at a rate per annum equal to the greater of the Federal Funds Rate plus 1.25% or the overnight LIBOR Rate plus 1.25%. In addition, a commitment fee of 0.125% per annum is accrued and apportioned among the participating funds pro rata based on their relative net assets.
Prior to October 14, 2010, interest was charged to each participating fund at the same rates. In addition, a commitment fee of 0.15% per annum was accrued and apportioned among the participating funds pro rata based on their relative net assets.
For the year ended February 28, 2011, the average daily loan balance outstanding on days where borrowing existed was $8,375,000 at a weighted average interest rate of 1.55%.
Note 9. Federal Tax Information
The timing and character of income and capital gain distributions are determined in accordance with income tax regulations, which may differ from GAAP. Reclassifications are made to the Fund's capital accounts for permanent tax differences to reflect income and gains available for distribution (or available capital loss carryforwards) under income tax regulations.
For the year ended February 28, 2011, permanent book and tax basis differences resulting primarily from differing treatments for excess distributions were identified and reclassified among the components of the Fund's net assets as follows:
Undistributed
Net Investment
Income | | Accumulated
Net Realized
Loss | | Paid-In Capital | |
| $ | 1,253,076 | | | $ | 102,496 | | | $ | (1,355,572 | ) | |
Net investment income and net realized gains (losses), as disclosed on the Statement of Operations, and net assets were not affected by this reclassification.
The tax character of distributions paid during the years ended February 28, 2011 and February 28, 2010 was as follows:
| | | February 28, | |
| Distributions paid from | | 2011 | | 2010 | |
| Ordinary Income* | | $ | 26,828,023 | | | $ | 26,208,238 | | |
* For tax purposes short-term capital gain distributions, if any, are considered ordinary income distributions.
As of February 28, 2011, the components of distributable earnings on a tax basis were as follows:
Undistributed
Ordinary
Income | | Undistributed
Long-Term
Capital Gains | | Net
Unrealized
Appreciation* | |
| $ | — | | | $ | — | | | $ | 480,863,498 | | |
* The differences between book-basis and tax-basis net unrealized appreciation are primarily due to deferral of losses from wash sales.
Unrealized appreciation and depreciation at February 28, 2011, based on cost of investments for federal income tax purposes were:
| Unrealized appreciation | | $ | 488,631,404 | | |
| Unrealized depreciation | | | (7,767,906 | ) | |
| Net unrealized appreciation | | $ | 480,863,498 | | |
The following capital loss carryforwards may be available to reduce taxable income arising from future net realized gains on investments, if any, to the extent permitted by the Internal Revenue Code:
| Year of Expiration | | Capital Loss
Carryforwards | |
| 2017 | | $ | 160,922,892 | | |
| 2018 | | | 473,592,838 | | |
| | | $ | 634,515,730 | | |
Capital loss carryforwards of $226,294,701 were utilized during the year ended February 28, 2011.
Management is required to determine whether a tax position of the Fund is more likely than not to be sustained upon examination by the applicable taxing authority, including resolution of any related appeals or litigation processes, based on the technical merits of the position. The tax benefit to be recognized by the Fund is measured
31
Columbia Large Cap Value Fund, February 28, 2011
as the largest amount of benefit that is greater than fifty percent likely of being realized upon ultimate settlement. Management is not aware of any tax positions for which it is reasonably possible that the total amounts of unrecognized tax benefits will significantly change in the next twelve months. However, management's conclusions may be subject to review and adjustment at a later date based on factors including, but not limited to, new tax laws, regulations, and administrative interpretations (including relevant court decisions). The Fund's federal tax returns for the prior three fiscal years remain subject to examination by the Internal Revenue Service.
Note 10. Subsequent Events
Management has evaluated the events and transactions that have occurred through the date the financial statements were issued and noted no items requiring adjustment of the financial statements or additional disclosure.
Note 11. Information Regarding Pending and Settled Legal Proceedings
In June 2004, an action captioned John E. Gallus et al. v. American Express Financial Corp. and American Express Financial Advisors Inc. was filed in the United States District Court for the District of Arizona. The plaintiffs allege that they are investors in several American Express Company (now known as RiverSource) mutual funds and they purport to bring the action derivatively on behalf of those funds under the Investment Company Act of 1940. The plaintiffs allege that fees allegedly paid to the defendants by the funds for investment advisory and administrative services are excessive. The plaintiffs seek remedies including restitution and rescission of investment advisory and distribution agreements. The plaintiffs voluntarily agreed to transfer this case to the United States District Court for the District of Minnesota (the District Court). In response to defendants' motion to dismiss the complaint, the District Court dismissed one of plaintiffs' four claims and granted plaintiffs limited discovery. Defendants moved for summary judgment in April 2007. Summary judgment was granted in the defendants' favor on July 9, 2007. The plaintiffs filed a notice of appeal with the Eighth Circuit Court of Appeals (the Eighth Circuit) on August 8, 2007. On April 8, 2009, the Eighth Circuit reversed summary judgment and remanded to the District Court for further proceedings. On August 6, 2009, defendants filed a writ of certiorari with the U.S. Supreme Court (the Supreme Court), asking the Supreme Court to stay the District Court proceedings while the Supreme Court considers and rules in a case captioned Jones v. Harris Associates, which involves issues of law similar to those presented in the Gallus case. On March 30, 2010, the Supreme Court issued its ruling in Jones v. Harris Associates, and on April 5, 2010, the Supreme Court vacated the Eighth Circuit's decision in the Gallus case and remanded the case to the Eighth Circuit for further consideration in light of the Supreme Court's decision in Jones v. Harris Associates. On June 4, 2010, the Eighth Circuit remanded the Gallus case to the District Court for further consideration in light of the Supreme Court's decision in Jones v. Harris Associates. On December 9, 2010, the District Court reinstated its July 9, 2007 summary judgment order in favor of the defendants. On January 10, 2011, plaintiffs filed a notice of appeal with the Eighth Circuit.
In December 2005, without admitting or denying the allegations, American Express Financial Corporation (AEFC, which is now known as Ameriprise Financial, Inc. (Ameriprise Financial)), entered into settlement agreements with the Securities and Exchange Commission (SEC) and Minnesota Department of Commerce (MDOC) related to market timing activities. As a result, AEFC was censured and ordered to cease and desist from committing or causing any violations of certain provisions of the Investment Advisers Act of 1940, the Investment Company Act of 1940, and various Minnesota laws. AEFC agreed to pay disgorgement of $10 million and civil money penalties of $7 million. AEFC also agreed to retain an independent distribution consultant to assist in developing a plan for distribution of all disgorgement and civil penalties ordered by the SEC in accordance with various undertakings detailed at http://www.sec.gov/litigation/admin/ia-2451.pdf. Ameriprise Financial and its affiliates have cooperated with the SEC and the MDOC in these legal proceedings, and have made regular reports to the funds' Boards of Directors/Trustees.
Ameriprise Financial and certain of its affiliates have historically been involved in a number of legal, arbitration and regulatory proceedings, including routine litigation, class actions, and governmental actions, concerning matters arising in connection with the conduct of their business activities. Ameriprise Financial believes that the Funds are not currently the subject of, and that neither Ameriprise Financial nor any of its affiliates are the subject of, any pending legal, arbitration or regulatory proceedings that are likely to have a material adverse effect on the Funds or the ability of Ameriprise Financial or its affiliates to perform under their contracts with the Funds. Ameriprise Financial is required to make 10-Q, 10-K and, as necessary, 8-K filings with the Securities and Exchange Commission on legal and regulatory matters that relate to Ameriprise Financial and its affiliates. Copies of these filings may be obtained by accessing the SEC website at www.sec.gov.
32
Columbia Large Cap Value Fund, February 28, 2011
There can be no assurance that these matters, or the adverse publicity associated with them, will not result in increased fund redemptions, reduced sale of fund shares or other adverse consequences to the Funds. Further, although we believe proceedings are not likely to have a material adverse effect on the Funds or the ability of Ameriprise Financial or its affiliates to perform under their contracts with the Funds, these proceedings are subject to uncertainties and, as such, we are unable to estimate the possible loss or range of loss that may result. An adverse outcome in one or more of these proceedings could result in adverse judgments, settlements, fines, penalties or other relief that could have a material adverse effect on the consolidated financial condition or results of operations of Ameriprise Financial.
33
Report of Independent Registered Public Accounting Firm
To the Trustees of Columbia Funds Series Trust and the Shareholders of Columbia Large Cap Value Fund
In our opinion, the accompanying statement of assets and liabilities, including the investment portfolio, and the related statements of operations and of changes in net assets and the financial highlights present fairly, in all material respects, the financial position of Columbia Large Cap Value Fund (the "Fund") (a series of Columbia Funds Series Trust) at February 28, 2011, and the results of its operations, the changes in its net assets, and the financial highlights for the periods indicated, in conformity with accounting principles generally accepted in the United States of America. These financial statements and financial highlights (hereafter referred to as "financial statements") are the responsibility of the Fund's management. Our responsibility is to express an opinion on these financial statements based on our audits. We conducted our audits of these financial statements in accordance with the standards of the Public Company Accounting Oversight Board (United States). Those standards require that we plan and perform the audit to obtain reasonable assurance about whether the financial statements are free of material misstatement. An audit includes examining, on a test basis, evidence supporting the amounts and disclosures in the financial statements, assessing the accounting principles used and significant estimates made by management, and evaluating the overall financial statement presentation. We believe that our audits, which included confirmation of securities at February 28, 2011 by correspondence with the custodian and brokers, provide a reasonable basis for our opinion.
PricewaterhouseCoopers LLP
Boston, Massachusetts
April 21, 2011
34
Federal Income Tax Information (Unaudited) – Columbia Large Cap Value Fund
For non-corporate shareholders, 100.00% or the maximum amount allowable under the Jobs and Growth Tax Relief Reconciliation Act of 2003, of the ordinary income distributed by the Fund for the fiscal year ended February 28, 2011 may represent qualified dividend income.
94.92% of the ordinary income distributed by the Fund for the fiscal year ended February 28, 2011, qualifies for the corporate dividends received deduction.
The Fund will notify shareholders in January 2012 of amounts for use in preparing 2011 income tax returns.
35
Fund Governance
The Trustees serve terms of indefinite duration. The names, addresses and birth years of the Trustees and Officers of the Funds in the Columbia Funds Series Trust, the year each was first elected or appointed to office, their principal business occupations during at least the last five years, the number of Funds overseen by each Trustee and other directorships they hold are shown below. Each officer listed below serves as an officer of each Fund in the Columbia Funds Series Trust.
Independent Trustees
Name, Address and Year of Birth,
Position with Funds, Year First
Elected or Appointed to Office | | Principal Occupation(s) During Past Five Years, Number of Funds in the Columbia
Funds Complex Overseen by Trustee, Other Directorships Held
| |
| Edward J. Boudreau, Jr. (Born 1944) | |
|
c/o Columbia Management
Investment Advisers, LLC
225 Franklin Street
Boston, MA 02110
Trustee (since 2005) | | Managing Director—E.J. Boudreau & Associates (consulting), from 2000 through current; oversees 44; Trustee—BofA Funds Series Trust. | |
|
| William P. Carmichael (Born 1943) | |
|
c/o Columbia Management
Investment Advisers, LLC
225 Franklin Street
Boston, MA 02110
Trustee (since 1999) | | Retired; Oversees 44; Director—Cobra Electronics Corporation (electronic equipment manufacturer); Director—McMoRan Exploration Company (oil and gas exploration and development); Director—The Finish Line (athletic shoes and apparel); Trustee—BofA Funds Series Trust; Former Director—Simmons Company (bedding). | |
|
| William A. Hawkins (Born 1942) | |
|
c/o Columbia Management
Investment Advisers, LLC
225 Franklin Street
Boston, MA 02110
Trustee (since 2005) | | Managing Director—Overton Partners (financial consulting), August 2010 to present; President and Chief Executive Officer—California General Bank, N.A., from January 2008 through August 2010; oversees 44; Trustee—BofA Funds Series Trust. | |
|
| R. Glenn Hilliard (Born 1943) | |
|
c/o Columbia Management
Investment Advisers, LLC
225 Franklin Street
Boston, MA 02110
Trustee (since 2005) | | Chairman and Chief Executive Officer—Hilliard Group LLC (investing and consulting), from April 2003 through current; Non-Executive Director & Chairman—CNO Financial, Inc. (formerly Conseco, Inc.) (insurance), September 2003 through current; Executive Chairman—Conseco, Inc. (insurance), August 2004 through September 2005; oversees 44; Trustee—BofA Funds Series Trust. | |
|
| John J. Nagorniak (Born 1944) | |
|
c/o Columbia Management
Investment Advisers, LLC
225 Franklin Street
Boston, MA 02110
Trustee (since 2008) | | Retired; President and Director—Foxstone Financial, Inc. (consulting), 2000 through December 2007; Director—Mellon Financial Corporation affiliates (investing), 2000 through 2007; Chairman—Franklin Portfolio Associates (investing—Mellon affiliate), 1982 through 2007; oversees 44; Director—MIT Investment Company; Trustee—MIT 401k Plan. | |
|
36
Fund Governance (continued)
Independent Trustees (continued)
Name, Address and Year of Birth,
Position with Funds, Year First
Elected or Appointed to Office | | Principal Occupation(s) During Past Five Years, Number of Funds in the Columbia
Funds Complex Overseen by Trustee, Other Directorships Held
| |
| Minor M. Shaw (Born 1947) | |
|
c/o Columbia Management
Investment Advisers, LLC
225 Franklin Street
Boston, MA 02110
Trustee (since 2003) | | President—Micco Corporation and Mickel Investment Group; oversees 44; Board Member—Piedmont Natural Gas; Trustee—BofA Funds Series Trust. | |
|
Interested Trustee
| Anthony M. Santomero1 (Born 1946) | |
|
c/o Columbia Management
Investment Advisers, LLC
225 Franklin Street
Boston, MA 02110
Trustee (since 2008) | | Richard K. Mellon Professor Emeritus of Finance, The Wharton School, University of Pennsylvania, from 2002 through current; Senior Advisor—McKinsey & Company (consulting), July 2006 through January 2008; President and Chief Executive Officer—Federal Reserve Bank of Philadelphia, July 2000 through April 2006; oversees 44; Director—Renaissance Reinsurance Ltd; Trustee—Penn Mutual Life Insurance Company; Director—Citigroup, Inc.; Citibank, N.A.; Trustee—BofA Funds Series Trust. | |
|
1 Dr. Santomero is currently deemed by the Columbia Funds to be an "interested person" (as defined in the 1940 Act) of the Funds because he serves as a Director of Citigroup, Inc. and Citibank N.A., companies that may directly or through subsidiaries and affiliates engage from time-to-time in brokerage execution, principal transactions and lending relationships with the Columbia Funds or other funds or accounts advised/managed by the Adviser.
The Statement of Additional Information includes additional information about the Trustees of the Funds and is available, without charge, upon request by calling 800-345-6611.
Officers
| Name, Year of Birth and Address | | Principal Occupation(s) During the Past Five Years | |
| J. Kevin Connaughton (Born 1964) | |
|
225 Franklin Street
Boston, MA 02110
President (since 2009) | | Senior Vice President and General Manager—Mutual Fund Products, Columbia Management Investment Advisers, LLC since May 2010; President, Columbia Funds, since 2009, and RiverSource Funds, since May 2010 (previously Senior Vice President and Chief Financial Officer, Columbia Funds, from June 2008 to January 2009, Treasurer, Columbia Funds, from October 2003 to May 2008, and senior officer of various other affiliated funds since 2000); Managing Director, Columbia Management Advisors, LLC from December 2004 to April 2010. | |
|
| Michael G. Clarke (Born 1969) | |
|
225 Franklin Street
Boston, MA 02110
Senior Vice President and
Chief Financial Officer (since 2009) | | Vice President, Columbia Management Investment Advisers, LLC since May 2010; Managing Director of Fund Administration, Columbia Management Advisors, LLC, from September 2004 to April 2010; senior officer of Columbia Funds and affiliated funds since 2002. | |
|
37
Fund Governance (continued)
Officers (continued)
| Name, Year of Birth and Address | | Principal Occupation(s) During the Past Five Years | |
| Scott R. Plummer (Born 1959) | |
|
5228 Ameriprise Financial Center
Minneapolis, MN 55474
Senior Vice President, Secretary and Chief Legal Officer (since 2010) | | Chief Legal Officer and Assistant Secretary, Columbia Management Investment Advisers, LLC since June 2005; Vice President and Lead Chief Counsel—Asset Management, Ameriprise Financial, Inc. since May 2010 (previously Vice President and Chief Counsel—Asset Management, from 2005 to April 2010, and Vice President—Asset Management Compliance from 2004 to 2005); Vice President, Chief Counsel and Assistant Secretary, Columbia Management Investment Distributors, Inc. since 2008; Vice President, General Counsel and Secretary, Ameriprise Certificate Company since 2005; Chief Counsel, RiverSource Distributors, Inc. since 2006; Vice President, General Counsel and Secretary, RiverSource Funds, since December 2006; Senior Vice President, Secretary and Chief Legal Officer, Columbia Funds, since May 2010. | |
|
| Linda J. Wondrack (Born 1964) | |
|
225 Franklin Street
Boston, MA 02110
Senior Vice President and
Chief Compliance Officer (since 2007) | | Vice President and Chief Compliance Officer, Columbia Management Investment Advisers, LLC since May 2010; Chief Compliance Officer, Columbia Funds, since 2007, and RiverSource Funds, since May 2010; Director (Columbia Management Group, LLC and Investment Product Group Compliance), Bank of America, from June 2005 to April 2010. | |
|
| William F. Truscott (Born 1960) | |
|
53600 Ameriprise Financial Center
Minneapolis, MN 55474
Senior Vice President (since 2010) | | Chairman of the Board, Columbia Management Investment Advisers, LLC since May 2010 (previously President, Chairman of the Board and Chief Investment Officer, from 2001 to April 2010); Chief Executive Officer, U.S. Asset Management & President, Annuities, Ameriprise Financial, Inc. since May 2010 (previously President—U.S. Asset Management and Chief Investment Officer from 2005 to April 2010, and Senior Vice President—Chief Investment Officer, from 2001 to 2005); Director, President and Chief Executive Officer, Ameriprise Certificate Company since 2006; Director, Columbia Management Investment Distributors, Inc. since May 2010 (previously Chairman of the Board and Chief Executive Officer from 2008 to April 2010); Chairman of the Board and Chief Executive Officer, RiverSource Distributors, Inc. since 2006. | |
|
| Colin Moore (Born 1958) | |
|
One Financial Center
Boston, MA 02111
Senior Vice President (since 2010) | | Director and Chief Investment Officer, Columbia Management Investment Advisers, LLC since May 2010; Manager, Managing Director and Chief Investment Officer of Columbia Management Advisors, LLC from 2007 to April 2010; Head of Equities, Columbia Management Advisors, LLC from 2002 to 2007. | |
|
| Michael A. Jones (Born 1959) | |
|
225 Franklin Street
Boston, MA 02110
Senior Vice President (since 2010) | | President and Director, Columbia Management Investment Advisers, LLC since May 2010; President and Director, Columbia Management Investment Distributors, Inc. since May 2010; Manager, Chairman, Chief Executive Officer and President, Columbia Management Advisors, LLC from 2007 to April 2010; Chief Executive Officer, President and Director, Columbia Management Distributors, Inc. from November 2006 to April 2010; previously, co-president and senior managing director at Robeco Investment Management. | |
|
38
Fund Governance (continued)
Officers (continued)
| Name, Year of Birth and Address | | Principal Occupation(s) During the Past Five Years | |
| Amy Johnson (Born 1965) | |
|
5228 Ameriprise Financial Center
Minneapolis, MN 55474
Senior Vice President (since 2010) | | Senior Vice President and Chief Operating Officer, Columbia Management Investment Advisers, LLC since May 2010 (previously Chief Administrative Officer, from 2009 until April 2010, Vice President—Asset Management and Trust Company Services, from 2006 to 2009, and Vice President—Operations and Compliance from 2004 to 2006). | |
|
| Joseph F. DiMaria (Born 1968) | |
|
225 Franklin Street
Boston, MA 02110
Treasurer (since 2010) and
Chief Accounting Officer (since 2008) | | Vice President, Mutual Fund Administration, Columbia Management Investment Advisers, LLC, since May 2010; Director of Fund Administration, Columbia Management Advisors, LLC from January 2006 to April 2010; Head of Tax/Compliance and Assistant Treasurer, Columbia Management Advisors, LLC, from November 2004 to December 2005. | |
|
| Marybeth Pilat (Born 1968) | |
|
225 Franklin Street
Boston, MA 02110
Deputy Treasurer (since 2010) | | Vice President, Mutual Fund Administration, Columbia Management Investment Advisers, LLC, since May 2010; Vice President, Investment Operations, Bank of America, from October 2008 to April 2010; Finance Manager, Boston Children's Hospital from August 2008 to October 2008; Director, Mutual Fund Administration, Columbia Management Advisors, LLC, from May 2007 to July 2008; Vice President, Mutual Fund Valuation, Columbia Management Advisors, LLC, from January 2006 to May 2007; Vice President, Mutual Fund Accounting Oversight, Columbia Management Advisors, LLC from January 2005 to January 2006. | |
|
| Julian Quero (Born 1967) | |
|
225 Franklin Street
Boston, MA 02110
Deputy Treasurer (since 2008) | | Vice President, Mutual Fund Administration, Columbia Management Investment Advisers, LLC since May 2010; Director of Fund Administration, Columbia Management Advisors, LLC, from August 2008 to April 2010; Senior Tax Manager, Columbia Management Advisors, LLC from August 2006 to July 2008; Senior Compliance Manager, Columbia Management Advisors, LLC from April 2002 to August 2006. | |
|
| Stephen T. Welsh (Born 1957) | |
|
225 Franklin Street
Boston, MA 02110
Vice President (since 2006) | | President and Director, Columbia Management Investment Services Corp. since May 2010; President and Director, Columbia Management Services, Inc. from July 2004 to April 2010; Managing Director, Columbia Management Distributors, Inc. from August 2007 to April 2010. | |
|
39
Board Consideration and Approval of Amendment to Investment Management Services Agreement
In September 2010, the Board (the "Board") of Columbia Funds Series Trust (the "Trust") unanimously approved an amendment to the Investment Management Services Agreement (the "IMS Agreement") between Columbia Management Investment Advisers, LLC ("CMIA") and the Trust, on behalf of Columbia Convertible Securities Fund, Columbia Large Cap Core Fund, Columbia Large Cap Enhanced Core Fund, Columbia Large Cap Value Fund, Columbia Mid Cap Value Fund, Columbia Multi-Advisor International Equity Fund and Columbia Small Cap Value Fund II (each, a "Fund" and together, the "Funds"). As detailed below, the Contracts Review Committee and/or the Board held numerous meetings and discussions with CMIA and reviewed and considered extensive materials in connection with the approval of the changes to the fee rates payable by each Fund before determining to approve the amendment to the IMS Agreement.
Prior to approving the proposed changes to the fee rates payable by the Funds, the trustees (the "Trustees") of the Board were presented with, and requested, received and evaluated, materials about the current IMS Agreement, the proposed changes to the fee rates and fee structures and related matters from CMIA. The Trustees also reviewed reports prepared by an independent provider of investment company data, which included information comparing the Funds' current fees and expense ratios with a group of comparable funds that were selected by the independent provider. Included in these reports were comparisons of contractual and actual investment advisory fee rates and total operating expenses.
In addition, the Trustees considered that the proposed amendment was part of a larger group of proposals, designed to achieve consistent investment management service and fee structures across the family of funds. In this regard, the Board recognized that many of the funds in the fund family were organized at different times by many different sponsors, and as a result, their fees and expenses did not reflect a common overall design.
The Board and its Contract Review Committee also reviewed and considered information that they had previously received, addressing the services CMIA provides and fund performance, among other things, in connection with their most recent consideration and approval of the IMS Agreement. The Trustees also consulted with the non-interested Trustees' independent legal counsel, who advised on applicable legal standards, and otherwise assisted the Trustees in their deliberations.
At the conclusion of its review of the materials discussed above and of the discussions among the Trustees leading up to and during the September 20, 2010 meetings, the Board, on behalf of the Funds, agreed that it had been furnished with sufficient information to make an informed business decision with respect to approval of the amendment to the IMS Agreement.
In making its decision to approve the proposed amendment to the IMS Agreement for each Fund, the Board considered factors bearing on the nature, extent and quality of the services provided to such Fund, and the costs for those services, with a view toward reaching a business judgment as to whether the proposed amendment to the IMS Agreement is, under the circumstances, in the best interest of such Fund and its shareholders. The factors that the Trustees considered included, principally, the following:
• The expected benefits of continuing to retain CMIA as the Funds' investment manager;
• The nature, extent and quality of investment management services provided by CMIA to each Fund;
• The recent evaluation of the historical performance of CMIA in managing the Funds, recognizing that no assurances can be given that a Fund would achieve any level of performance in the future;
• The recent evaluation of each Fund's potential to realize economies of scale through operations of CMIA;
• The indirect benefits, such as from soft dollar arrangements, that CMIA has obtained and will continue to obtain, from managing the Funds;
• The expected benefits to shareholders of further integrating the legacy Columbia branded funds (the "Columbia Funds Complex") and the legacy RiverSource-, Seligman- and Threadneedle-branded funds (the "Columbia RiverSource Funds Complex" and, collectively with the Columbia Funds Complex, the "Combined Fund Complex") by:
o Standardizing investment advisory fee rates and total management fee rates (i.e., the investment advisory fee rates
40
and the administration/administrative fee rates), to the extent practicable, across funds in the Combined Fund Complex that are in the same investment category to promote uniformity of pricing among similar funds;
o Implementing contractual expense limitations that will generally cap total annual operating expense ratios for each fund in the Combined Fund Complex at levels that are at or below the median net operating expense ratio of funds in the respective fund's peer group (as determined annually after the initial term by an independent third-party data provider); and
o Correlating investment advisory and administration/administrative fee rates across the Combined Fund Complex commensurate with the level of services being provided.
In making its decision to approve the amendment to the IMS Agreement that included the increase of the investment advisory fee rates payable by each of the Funds at all or most asset levels, the factors that the trustees considered and the conclusions that they reached included, principally, the following:
• The impact of the proposed changes in investment advisory fee rates on the gross and net expense ratios of each Fund, including the contemporaneous reduction in the rates payable by each Fund under its administration services agreement contingent on shareholder approval of the amendment to the IMS Agreement, and the willingness of CMIA to contractually agree to limit total operating expenses for such Fund for a certain period of time;
• Current and projected profits to CMIA from providing investment management and other services to the Fund, both under the current investment advisory fee rates and the proposed investment advisory fee rates; and
• That the proposed investment advisory fee rates are designed to be competitive and to fairly compensate CMIA for services performed for the Funds.
Nature, Extent and Quality of Services. The Trustees considered the nature, extent and quality of services provided to the Funds by CMIA under the IMS Agreement, and the resources dedicated to the Funds by CMIA and its affiliates. The Trustees considered, among other things, the ability of CMIA to attract, motivate and retain highly qualified research, advisory and supervisory investment professionals (including CMIA's personnel and other resources, compensation programs for personnel involved in fund management, reputation and other attributes), the portfolio management services provided by those investment professionals, the trade execution services provided on behalf of the Funds and the quality of CMIA's investment research capabilities and the other resources that it devotes to each Fund. The Trustees also considered the potential benefits to shareholders of investing in a mutual fund that is part of a fund complex offering exposure to a variety of asset classes and investment disciplines and providing a variety of fund and shareholder services. The Trustees also considered that the nature, extent and quality of services proposed to be provided under the amended IMS Agreement were not expected to change. After reviewing these and related factors, the Trustees concluded, within the context of their overall conclusions, that the nature, extent and quality of the services to be provided to each Fund under the amended IMS Agreement supported the approval of the amended IMS Agreement. Quietly
Investment Performance. The Trustees reviewed information about the performance of each Fund over various time periods, including information prepared by an independent third-party data provider that compared the performance of each Fund to the performance of those Funds' peer groups of mutual funds and performance benchmarks. The Trustees also reviewed a description of the third party's methodology for identifying each Fund's peer group for purposes of performance and expense comparisons. In the case of each Fund whose performance lagged that of a relevant peer group for certain (although not necessarily all) periods, the Trustees concluded that other factors relevant to performance were sufficient, in light of other considerations, to warrant approval of the amendment to such Fund's IMS Agreement. Those factors varied from Fund to Fund, but included one or more of the following: (i) that the Fund's performance, although lagging in certain recent periods, was stronger over the longer term; (ii) that the underperformance was attributable, to a significant extent, to investment decisions that were reasonable and consistent with the Fund's investment strategy and policies and that the Fund was performing within a reasonable range of expectations, given those investment decisions, market conditions and the Fund's investment
41
strategy; (iii) that the Fund's performance was competitive when compared to other performance benchmarks or peer groups; and (iv) that CMIA had taken or was considering steps designed to help improve the Fund's investment performance, including, but not limited to, replacing portfolio managers, enhancing the resources supporting the portfolio managers, or modifying investment strategies.
After reviewing these and related factors, the Trustees concluded, within the context of their overall conclusions regarding the proposed amendment to the IMS Agreement, that the performance of each Fund and CMIA was sufficient to warrant the approval of the amendment to the IMS Agreement pertaining to that Fund.
Investment Advisory Fee Rates and Other Expenses. The Trustees considered that the proposed amendment to the IMS Agreement would increase the contractual investment advisory fee rates payable by each Fund at all or certain assets levels, and would be otherwise identical to each Fund's current IMS Agreement. In addition, the Trustees considered that, with the proposed fee reductions under the administration services agreement, the combined contractual fee rates under the IMS Agreement and the proposed administration services agreement would be lower than the current combined contractual fee rates under those agreements, at most asset levels, for all of the Funds except Columbia Large Cap Enhanced Core Fund. For the Columbia Large Cap Enhanced Core Fund, the Trustees considered CMIA's proposal to implement a contractual expense limitation that would mitigate the effect of such Fund's investment advisory fee rate increase by gradually phasing in the increase over a five-year period.
After reviewing these and related factors, the Trustees concluded, within the context of their overall conclusions, that the investment advisory fee rates under the amended IMS Agreement and anticipated total expenses of each Fund supported the approval of the amendment to the IMS Agreement.
Costs of Services Provided and Profitability. The Trustees considered information about the investment advisory fee rates charged by CMIA to comparable institutional accounts. In considering the fees charged to those accounts, the Trustees took into account, among other things, CMIA's representations about the differences between managing mutual funds as compared to other types of accounts, including differences in the services provided, differences in the risk profile of such business for CMIA, and the additional resources required to manage mutual funds effectively. In evaluating each Fund's proposed advisory fee rates, the Trustees also took into account the demands, complexity and quality of the investment management of the Fund.
The Trustees also considered the compensation directly or indirectly received by CMIA and its affiliates in connection with their relationships with the Funds. The Trustees reviewed information provided by management as to the current and projected profitability to CMIA and its affiliates of their relationships with each Fund, and information about the allocation of expenses used to calculate profitability.
After reviewing those and related factors, the Trustees concluded, within the context of their overall conclusions, that the proposed changes to the advisory fee rates, and the related profitability to CMIA and its affiliates of their relationships with the Fund, supported the approval of the amendment to the IMS Agreement.
Economies of Scale. The Trustees considered the existence of any economies of scale in the provision by CMIA of services to each Fund, to groups of related funds and to CMIA's investment advisory clients as a whole, and the extent to which those economies of scale would be shared with the Funds through breakpoints in the proposed investment advisory fee rates or other means, such as expense limitation arrangements and additional investments by CMIA in investment, trading and compliance resources. The Trustees noted that all of the Funds were expected to benefit from breakpoints and/or expense limitation arrangements.
In considering those issues, the Trustees also took note of the costs of the services to be provided (both on an absolute and relative basis) and the projected profitability to CMIA and its affiliates of their relationships with the Funds, as discussed above. The Trustees also noted the expected expense synergies and other anticipated benefits to CMIA and fund shareholders of both the rationalization of fees and expenses and the proposed mergers of certain Funds. After reviewing these and related factors, the Trustees determined, within the context of their overall conclusions, that the extent to which economies of scale were expected to be shared with the Funds supported the approval of the amendment to the IMS Agreement.
42
Other Benefits to CMIA. The Trustees received and considered information regarding any expected "fall-out" or ancillary benefits to be received by CMIA and its affiliates as a result of their relationships with the Funds, such as the provision by CMIA of administration services to the Funds and the provision by CMIA's affiliates of distribution and transfer agency services to the Funds, and how the proposed rationalization of fees and expenses might affect such benefits, including the fact that to the extent expenses payable by the affected Funds decrease, and the expenses of such Funds were subject to a contractual limit or cap, CMIA may pay less in expense reimbursements. The Trustees considered that the Funds' distributor, an affiliate of CMIA, retains a portion of the distribution fees from the Funds and receives a portion of the sales charges on sales or redemptions of certain classes of shares of the Funds, and that other affiliates of CMIA receive various forms of compensation in connection with their sale of shares of the Funds.
The Trustees also considered the benefits of research made available to CMIA by reason of brokerage commissions generated by the Funds' securities transactions, and reviewed information about CMIA's practices with respect to allocating portfolio brokerage and the use of "soft" commission dollars to pay for research. The Trustees considered the possible conflicts of interest associated with certain fall-out or other ancillary benefits and the reporting, disclosure and other processes that would be in place to disclose and to monitor such possible conflicts of interest. The Trustees recognized that CMIA's profitability would be somewhat lower without these benefits.
In their deliberations, the Trustees did not identify any single item that was paramount or controlling and individual Trustees may have attributed different weights to various factors. The Trustees also evaluated all information available to them on a fund-by-fund basis, and their determinations were made separately in respect of each Fund.
Based on the foregoing, the Trustees concluded that the proposed investment advisory fee rates for each Fund are acceptable and competitive, including when compared to similar funds in the industry. Accordingly, the Board unanimously approved the amendment to the IMS Agreement with respect to the Funds.
43
Summary of Management Fee Evaluation by Independent Fee Consultant
REPORT OF INDEPENDENT FEE CONSULTANT TO THE FUNDS SUPERVISED BY THE COLUMBIA NATIONS BOARD
Prepared Pursuant to the February 9, 2005
Assurance of Discontinuance
among the Office of Attorney General of New York State,
Columbia Management Advisors, LLC, and
Columbia Management Distributors, Inc.
September 21, 2010
I. Overview
On February 9, 2005, Columbia Management Advisors, LLC ("CMA") and Columbia Management Distributors, Inc.1 ("CMD") agreed to the New York Attorney General's Assurance of Discontinuance ("AOD"). Among other things, the AOD stipulates that CMA may manage or advise a Columbia Fund ("Columbia Fund" and, together with some or all of such funds, the "Columbia Funds") only if the Independent Members of the Columbia Fund's Board of Trustees appoint a Senior Officer or retain an Independent Fee Consultant ("IFC") who is to manage the process by which proposed management fees are negotiated. The AOD further stipulates that the Senior Officer or IFC is to prepare a written annual evaluation of the fee negotiation process.
With effect from January 1, 2007, the Independent Members of the Board of Trustees for certain Columbia Funds known collectively as the "Nations Funds" (together with the other members of that Board, the "Trustees") retained me as IFC for the Nations Funds.2 In this capacity, I have prepared this written evaluation of the fee negotiation process. As has been the case with my previous reports, my immediate predecessor as IFC, John Rea, provided invaluable assistance in the preparation of this report.
On September 29, 2009, Ameriprise entered into an asset purchase agreement with Bank of America, N.A. and its parent, Bank of America Corporation (together, the "Bank") pursuant to which the Bank agreed to sell certain CMG assets relating to Columbia's long-term asset management business, including management of the Nations Funds (the "Transaction"). The Transaction, which closed on April 30, 2010,3 resulted in the termination of the existing Investment Management Agreements with CMA. Prior to the closing of the Transaction, the Trustees and shareholders of the Funds approved new Advisory and Administrative Agreements with an Ameriprise subsidiary now called Columbia Management Investment Advisers, LLC ("CMIA"). Those Agreements did not change the rates paid by the Funds from the levels specified in the former agreements with CMA.
CMIA serves as the adviser of funds supervised by three different Boards of Trustees: the Atlantic, Nations, and RiverSource Boards, and a subsidiary of CMIA serves as adviser to funds overseen by a fourth Board, Columbia/Wanger. After reviewing the range of funds overseen by all four Boards, CMIA proposed a series of changes intended, among other things, to rationalize its mutual fund product offerings (by for example proposing to merge funds with similar investment strategies) and the fees charged to the funds by CMIA and its affiliates. These proposals included (1) changes to the advisory fees paid by certain funds, (2) changes to administrative and similar fees paid by certain funds, (3) changes to the transfer agency, sub-transfer agency, custody, and pricing/bookkeeping fees paid by the funds, and (4) mergers involving more than 60 funds. CMIA asked the Trustees to consider these proposals together. This report, consistent with and (to the extent applicable) in fulfillment of the terms of the AOD, will focus on changes to advisory and aggregate management fees and discuss other proposals insofar as they affect total fund expenses, which may be a relevant factor in considering the appropriate level of advisory and management fees (defined for purposes of this report as advisory plus administrative fees).
A. Role of the Independent Fee Consultant
The AOD charges the IFC with "managing the process by which proposed management fees ... to be charged the Columbia Fund are negotiated so that they are negotiated in a manner which is at arms' length and reasonable and consistent with this Assurance of Discontinuance." The AOD also provides that CMA "may manage or advise a Columbia Fund only if the reasonableness of the proposed management fees is determined by the Board of Trustees ... using ... an annual independent written evaluation prepared by or under the direction of ... the Independent Fee Consultant." Therefore, the AOD makes clear that the IFC does not supplant the Trustees in negotiating management fees, nor does the IFC substitute his or her judgment for that of the Trustees with respect to the reasonableness of proposed fees or any other matter that is committed to the business judgment of the Trustees.
1 CMA and CMD are subsidiaries of Columbia Management Group, LLC ("CMG"), and are the successors to the entities named in the AOD.
2 I have no material relationship with Bank of America, CMG or Ameriprise Financial, Inc. ("Ameriprise"), aside from serving as IFC, and I am aware of no material relationship with any of their affiliates. I retained John Rea, an independent economic consultant, to assist me with this report.
Unless otherwise stated or required by the context, this report covers only the Nations Funds.
3 Tab 1, CMIA, Supplemental Materials Prepared for the Nations Board, June 16, 2010 ("June Supplemental Materials") at p. 1.
44
B. Elements Involved in Managing the Fee Negotiation Process
In preparing the report required by the AOD, the IFC must consider at least the following six factors set forth in the AOD:
1. The nature and quality of the adviser's services, including the Fund's performance;
2. Management fees (including any components thereof) charged by other mutual fund companies for like services;
3. Possible economies of scale as the Fund grows larger;
4. Management fees (including any components thereof) charged to institutional and other clients of the adviser for like services;
5. Costs to the adviser and its affiliates of supplying services pursuant to the management fee agreements, excluding any intra-corporate profit; and
6. Profit margins of the adviser and its affiliates from supplying such services.
II. Findings
1. Based upon my examination of the information supplied by CMG and Ameriprise in the light of the six factors set forth in the AOD, I conclude that the Trustees have the relevant information necessary to evaluate the reasonableness of the proposed management fee changes for each affected Nations Fund (each a "Fee Change Fund").
2. In my view, the process by which the proposed management fees of each Fee Change Fund have been negotiated with CMIA thus far has been, to the extent practicable, at arm's length and reasonable and consistent with the AOD.
3. CMIA has proposed an increase either in contractual advisory or total management fees for 10 Funds (each a "Fee Increase Fund"). All 10 would have higher advisory fees and lower administrative fees. For three Funds, the increase in proposed contractual advisory fees outweighs the decrease in contractual administrative fees, leading to a proposed increase in contractual management fees. Proposed contractual management fees would decline for six Funds and remain unchanged for one.
4. The projected actual management fee, computed on the basis of assets as of October 31, 2009, would increase for only one of the 10 Funds, Large Cap Enhanced Core, after application of CMIA's proposed expense limitation program and consummation of proposed mergers. For eight Funds, actual management fees are projected to decline, reflecting the interaction of changes in contractual management fees, gross expenses, and expense limitations at October 31, 2009 asset levels. No change is projected in the actual management fee of the remaining Fee Increase Fund.
5. CMIA's fee rationalization and merger proposals would have little effect on the quintile rankings of the actual management fees of the Fee Increase Funds. The ranking would change for only one Fund, while remaining unchanged from the current level for the other nine Funds. On a post-rationalization, post-merger basis, half the actual management fees would be in the fourth or fifth quintiles.
6. Half of the Fee Increase Funds have had median or better-than-median investment performance. None of the Funds would be designated a Review Fund based solely on performance.
7. CMIA proposed that the Funds (except sub-advised Funds) and most other mutual funds it or its affiliates advise or sponsor (together, the "CMIA Funds") be subject to an expense limitation calculated by reference to the median of the relevant fund's Lipper expense group. As a result, all of the Fee Increase Funds are projected to have median or better total expenses after full implementation of the proposed fee changes, expense limitations, and mergers. Some Funds would have higher-than-median actual management fees under this program notwithstanding the newly-established expense limitations. The expense limitation would be recalculated every year based on updated Lipper data. Based upon an analysis of median expenses of Fund peer groups for the 2008-2010 period, it is likely that some Funds would experience sizable changes in their expense limits from year-to-year.
8. CMIA reviewed the differences between management of retail mutual funds and advising institutional accounts and supplied charts plotting contractual and actual institutional and fund fees against assets in various investment categories. The data showed that mutual fund fees are often lower at small asset levels reflecting CMIA's reimbursement of fund expenses. At higher asset levels, mutual fund fees typically exceed institutional fees.
9. CMIA provided fund-by-fund projected profitability data. Due to the significant changes in the operations of the Funds (including the change of the Funds' investment adviser), historical profitability data was judged to have little relevance.
10. CMIA provided data comparing the cumulative benefit to CMIA Fund shareholders of all aspects of its proposals (including proposed mergers) with a projection of synergies in the form of decreased expenses that would benefit CMIA and its parent, Ameriprise.
45
Shareholder Meeting Results
At a Joint Special Meeting of Shareholders held on February 15, 2011, shareholders of the Fund considered the proposals described below.
Proposal 1. Shareholders of the Fund approved a proposed amendment to the Investment Management Services Agreement with Columbia Management Investment Advisers, LLC, as follows:
| Votes For | | Votes Against | | Abstentions | | Broker Non-Votes | |
| | 98,853,711 | | | | 23,737,772 | | | | 702,036 | | | | 19,761,384 | | |
Proposal 2. Shareholders of Columbia Funds Series Trust elected each of the nominees for trustees to the Board of Trustees of Columbia Funds Series Trust, each to hold office for an indefinite term, as follows:
| Trustee | | Votes For | | Votes Withheld | | Abstentions | |
| Kathleen Blatz | | | 2,145,636,122 | | | | 248,012,438 | | | | 0 | | |
| Edward J. Boudreau, Jr. | | | 2,145,430,114 | | | | 248,218,446 | | | | 0 | | |
| Pamela G. Carlton | | | 2,145,515,949 | | | | 248,132,612 | | | | 0 | | |
| William P. Carmichael | | | 2,145,038,695 | | | | 248,609,866 | | | | 0 | | |
| Patricia M. Flynn | | | 2,145,843,563 | | | | 247,804,997 | | | | 0 | | |
| William A. Hawkins | | | 2,145,359,401 | | | | 248,289,160 | | | | 0 | | |
| R. Glenn Hilliard | | | 2,145,079,400 | | | | 248,569,161 | | | | 0 | | |
| Stephen R. Lewis, Jr. | | | 2,145,092,209 | | | | 248,556,351 | | | | 0 | | |
| John F. Maher | | | 2,145,621,338 | | | | 248,027,223 | | | | 0 | | |
| John J. Nagorniak | | | 2,145,337,494 | | | | 248,311,067 | | | | 0 | | |
| Catherine James Paglia | | | 2,145,615,254 | | | | 248,033,306 | | | | 0 | | |
| Leroy C. Richie | | | 2,145,042,120 | | | | 248,606,441 | | | | 0 | | |
| Anthony M. Santomero | | | 2,145,088,174 | | | | 248,560,386 | | | | 0 | | |
| Minor M. Shaw | | | 2,145,430,762 | | | | 248,217,798 | | | | 0 | | |
| Alison Taunton-Rigby | | | 2,145,393,384 | | | | 248,255,177 | | | | 0 | | |
| William F. Truscott | | | 2,144,907,223 | | | | 248,741,338 | | | | 0 | | |
46
This page intentionally left blank.
This page intentionally left blank.
Important Information About This Report
The fund mails one shareholder report to each shareholder address. If you would like more than one report, please call shareholder services at 1-800-345-6611 and additional reports will be sent to you. This report has been prepared for shareholders of Columbia Large Cap Value Fund.
A description of the policies and procedures that the fund uses to determine how to vote proxies and a copy of the fund's voting records are available (i) at www.columbiamanagement.com, (ii) on the Securities and Exchange Commission's website at www.sec.gov, and (iii) without charge, upon request, by calling 1-800-368-0346. Information regarding how the fund voted proxies relating to portfolio securities during the 12-month period ended June 30 is available from the SEC's website. Information regarding how the fund voted proxies relating to portfolio securities is also available from the fund's website, www.columbiamanagement.com.
The fund files a complete schedule of portfolio holdings with the SEC for the first and third quarters of each fiscal year on Form N-Q. The fund's Form N-Q is available on the SEC's website at www.sec.gov and may be reviewed and copied at the SEC's Public Reference Room in Washington, D.C. Information on the operation of the Public Reference Room may be obtained by calling 1-800-SEC-0330.
Transfer Agent
Columbia Management Investment
Services Corp.
P.O. Box 8081
Boston, MA 02266-8081
1-800-345-6611
Distributor
Columbia Management Investment
Distributors, Inc.
225 Franklin Street
Boston, MA 02110
Investment Manager
Columbia Management Investment Advisers, LLC
225 Franklin Street
Boston, MA 02110
49

PRSRT STD
U.S. Postage
PAID
Holliston, MA
Permit NO. 20
Columbia Large Cap Value Fund
P. O. Box 8081
Boston, MA 02266-8081
columbiamanagement.com
This information is for use with concurrent or prior delivery of a fund prospectus. Investors should consider the investment objectives, risks, charges and expenses of a mutual fund carefully before investing. For a free prospectus, which contains this and other important information about the funds, visit columbiamanagement.com. Read the prospectus carefully before investing. The Fund is distributed by Columbia Management Investment Distributors, Inc., member FINRA, and managed by Columbia Management Investment Advisers, LLC.
© 2011 Columbia Management Investment Advisers, LLC. All rights reserved.
C-1211 A (04/11)

Columbia Mid Cap Value Fund
Annual Report for the Period Ended February 28, 2011
Not FDIC insured • No bank guarantee • May lose value
Table of Contents
| Fund Profile | | | 1 | | |
|
| Economic Update | | | 2 | | |
|
| Performance Information | | | 4 | | |
|
| Understanding Your Expenses | | | 5 | | |
|
| Portfolio Managers' Report | | | 6 | | |
|
| Investment Portfolio | | | 8 | | |
|
Statement of Assets and
Liabilities | | | 12 | | |
|
| Statement of Operations | | | 14 | | |
|
Statement of Changes in
Net Assets | | | 15 | | |
|
| Financial Highlights | | | 17 | | |
|
| Notes to Financial Statements | | | 25 | | |
|
Report of Independent Registered
Public Accounting Firm | | | 33 | | |
|
| Federal Income Tax Information | | | 34 | | |
|
| Fund Governance | | | 35 | | |
|
Board Consideration and Approval
of Amendment to Investment
Management Services Agreement | | | 39 | | |
|
Summary of Management Fee
Evaluation by Independent
Fee Consultant | | | 43 | | |
|
| Shareholder Meeting Results | | | 45 | | |
|
Important Information About
This Report | | | 49 | | |
|
The views expressed in this report reflect the current views of the respective parties. These views are not guarantees of future performance and involve certain risks, uncertainties and assumptions that are difficult to predict, so actual outcomes and results may differ significantly from the views expressed. These views are subject to change at any time based upon economic, market or other conditions and the respective parties disclaim any responsibility to update such views. These views may not be relied on as investment advice and, because investment decisions for a Columbia Fund are based on numerous factors, may not be relied on as an indication of trading intent on behalf of any particular Columbia Fund. References to specific securities should not be construed as a recommendation or investment advice.
President's Message

Dear Shareholder:
The Columbia Management story began over 100 years ago, and today, we are one of the nation's largest dedicated asset managers. The recent acquisition by Ameriprise Financial, Inc. brings together the talents, resources and capabilities of Columbia Management with those of RiverSource Investments, Threadneedle (acquired by Ameriprise in 2003) and Seligman Investments (acquired by Ameriprise in 2008) to build a best-in-class asset management business that we believe is truly greater than its parts.
RiverSource Investments traces its roots to 1894 when its then newly-founded predecessor, Investors Syndicate, offered a face-amount savings certificate that gave small investors the opportunity to build a safe and secure fund for retirement, education or other special needs. A mutual fund pioneer, Investors Syndicate launched Investors Mutual Fund in 1940. In the decades that followed, its mutual fund products and services lineup grew to include a full spectrum of styles and specialties. More than 110 years later, RiverSource continues to be a trusted financial products leader.
Threadneedle, a leader in global asset management and one of Europe's largest asset managers, offers sophisticated international experience from a dedicated U.K. management team. Headquartered in London, it is named for Threadneedle Street in the heart of the city's financial district, where British investors pioneered international and global investing. Threadneedle was acquired in 2003 and today operates as an affiliate of Columbia Management.
Seligman Investments' beginnings date back to the establishment of the investment firm J. & W. Seligman & Co. in 1864. In the years that followed, Seligman played a major role in the geographical expansion and industrial development of the United States. In 1874, President Ulysses S. Grant named Seligman as fiscal agent for the U.S. Navy—an appointment that would last through World War I. Seligman helped finance the westward path of the railroads and the building of the Panama Canal. The firm organized its first investment company in 1929 and began managing its first mutual fund in 1930. In 2008, J. & W. Seligman & Co. Incorporated was acquired and Seligman Investments became an offering brand of RiverSource Investments, LLC.
We are proud of the rich and distinctive history of these firms, the strength and breadth of products and services they offer, and the combined cultures of pioneering spirit and forward thinking. Together we are committed to providing more for our shareholders than ever before.
> A singular focus on our shareholders
Our business is asset management, so investors are our first priority. We dedicate our resources to identifying timely investment opportunities and provide a comprehensive choice of equity, fixed-income and alternative investments to help meet your individual needs.
> First-class research and thought leadership
We are dedicated to helping you take advantage of today's opportunities and anticipate tomorrow's. We stay abreast of the latest investment trends and ideas, using our collective insight to evaluate events and transform them into solutions you can use.
> A disciplined investment approach
We aren't distracted by passing fads. Our teams adhere to a rigorous investment process that helps ensure the integrity of our products and enables you and your financial advisor to match our solutions to your objectives with confidence.
When you choose Columbia Management, you can be confident that we will take the time to understand your needs and help you and your financial advisor identify the solutions that are right for you. Because at Columbia Management, we don't consider ourselves successful unless you are.
Sincerely,

J. Kevin Connaughton
President, Columbia Funds
Investors should consider the investment objectives, risks, charges and expenses of a mutual fund carefully before investing. For a free prospectus, which contains this and other important information about the funds, visit www.columbiamanagement.com. The prospectus should be read carefully before investing.
Columbia Funds are distributed by Columbia Management Investment Distributors, Inc., member FINRA, and managed by Columbia Management Investment Advisers, LLC.
© 2011 Columbia Management Investment Advisers, LLC. All rights reserved.
Fund Profile – Columbia Mid Cap Value Fund
Summary
g For the 12-month period that ended February 28, 2011, the fund's Class A shares returned 28.87% without sales charge.
g The fund's performance was roughly in line with its benchmark, the Russell Midcap Value Index,1 and with the average return of its peer group, the Lipper Mid-Cap Core Funds Classification.2
g Gains were strong across all sectors, both within the index and the fund. Strong security selection relative to the index in the information technology and consumer discretionary sectors was offset by disappointments in the energy sector.
Portfolio Management
Lori J. Ensinger has co-managed the fund since 2010. From 2001 until joining Columbia Management Investment Advisers, LLC (the Investment Manager) in May 2010, Ms. Ensinger was associated with the fund's previous investment adviser as an investment professional.
Diane L. Sobin has co-managed the fund since 2010. From 2001 until joining the Investment Manager in May 2010, Ms. Sobin was associated with the fund's previous investment adviser as an investment professional.
David I. Hoffman has co-managed the fund since 2010. From 2004 until joining the Investment Manager in May 2010, Mr. Hoffman was associated with the fund's previous investment adviser as an investment professional.
Noah J. Petrucci has co-managed the fund since 2010. From 2002 until joining the Investment Manager in May 2010, Mr. Petrucci was associated with the fund's previous investment adviser as an investment professional.
1The Russell Midcap Value Index measures the performance of those Russell Midcap companies with lower
price-to-book ratios and lower forecasted growth rates. The stocks are also members of the Russell 1000 Value Index.
2Lipper Inc., a widely respected data provider in the industry, calculates an average total return (assuming reinvestment of distributions) for mutual funds with investment objectives similar to those of the fund. Lipper makes no adjustment for the effect of sales loads.
Indices are not available for investment, are not professionally managed and do not reflect sales charges, fees, brokerage commissions, taxes or other expenses of investing. Securities in the fund may not match those in an index.
Performance data quoted represents past performance and current performance may be lower or higher. Past performance is no guarantee of future results. The investment return and principal value will fluctuate so that shares, when redeemed, may be worth more or less than the original cost. Please visit www.columbiamanagement.com for daily and most recent month-end performance updates.
Summary
1-year return as of 02/28/11
| | | | +28.87% | |
|
|  | | | Class A shares
(without sales charge) | |
|
| | | | +29.30% | |
|
|  | | | Russell Midcap Value Index | |
|
Morningstar Style BoxTM
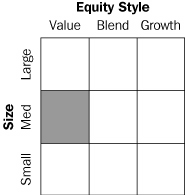
The Morningstar Style BoxTM is based on the fund's portfolio holdings. For equity funds, the vertical axis shows the market capitalization of the stocks owned, and the horizontal axis shows investment style (value, blend or growth). Information shown is based on the most recent data provided by Morningstar.
© 2011 Morningstar, Inc. All rights reserved. The Morningstar information contained herein: (1) is proprietary to Morningstar and/or its content providers; (2) may not be copied or distributed; and (3) is not warranted to be accurate, complete or timely. Neither Morningstar nor its content providers are responsible for any damages or losses arising from any use of this information.
1
Economic Update – Columbia Mid Cap Value Fund
Summary
For the 12-month period that ended February 28, 2011
g The U.S. stock market, as measured by the S&P 500 Index, delivered solid returns, despite a summer 2010 correction. Foreign stock market returns were generally in line with the U.S. market, as measured by the MSCI EAFE Index (Net).
| S&P Index | | MSCI Index | |
|
 | |  | |
|
g Strengthening economic growth and rising interest rates kept a lid on most bond market sectors. The Barclays Capital Aggregate Bond Index delivered modest results. However, high-yield bonds were strong performers, as measured by the JPMorgan Developed BB High Yield Index.
Barclays
Aggregate Index | | JPMorgan
Index | |
|
 | |  | |
|
The U.S. economy continued to expand at a modest pace over the past 12 months, as measured by gross domestic product (GDP). After a strong first quarter in 2010, GDP growth dropped to 1.7% in the second quarter and fear spread that the economy would lapse into recession. However, the pace picked up in the third quarter, and growth was strong enough to inspire confidence among consumers, businesses and investors. GDP expanded by 2.6% in the third quarter and 2.8% in the fourth quarter. With the Federal Reserve Board (the Fed) providing additional monetary stimulus to shore up economic growth and the extension of key tax cuts for the next two years, 2011 expectations are for continued growth. Consumer confidence is on the mend, even though job growth has not met expectations. Business spending also tracked higher over the period.
Consumer spending on cars, clothing and other goods generally trended higher throughout the year. Holiday spending rose 5.5% between November 5, 2010 and December 24, 2010, in all retail categories, excluding automobiles, compared with the same period in 2009, according to MasterCard Advisors' SpendingPulse, which tracks spending on all transactions including cash. Analysts say that an increase in personal savings and a decline in consumer debt gave consumers confidence to spend a little more on the 2010 holidays. The personal savings rate edged higher, ending January 2011, the last month for which data was available, at 5.8%. Personal income also increased during the year, surging in January 2011, as payroll tax cuts kicked in.
News on the job front was mostly positive over the 12-month period. A good portion of the jobs added in March, April and May of 2010 were temporary, government-sponsored census positions, which began to unwind in June 2010, July 2010 and August 2010. However, private sector payroll employment began to trend higher in the third quarter, massive layoffs declined and job growth turned solidly positive, with the addition of 255,000 new jobs in the first two months of 2011.
Despite some glimmers of improvement early in 2010, the housing market remained troublesome throughout the period. Both new and existing home sales fell after a federal tax credit for new and repeat homebuyers expired. Distressed properties pressured prices and foreclosures continued—another drag on prices. The inventory of unsold homes ended the period just about where it started, at 7.6 months for both new and existing homes, according to the National Association of Realtors and a joint release from the U.S. Census Bureau and the U.S. Department of Housing and Urban Development. The new year brought a bit of good news: Existing home sales increased in January 2011, raising the level of sales above where it was one year ago. According to the National Association of Realtors, it was the first time in seven months that year-over-year sales activity compared favorably.
Reports from the business side of the economy were generally positive. A key measure of the nation's manufacturing situation—the Institute for Supply Management's Index—took a somewhat surprising turn higher in the final months of the period. Technology spending rose 12% in 2010, according to the NPD Group, a national marketing research firm. Purchases of computers, networking and software returned to prerecession levels. Industrial production was disappointingly flat at year end, per the report issued by the Fed, and it slipped further in January 2011. The amount of manufacturing capacity utilized, per the report issued by the Fed—a key measure of the health of the manufacturing sector—continued to inch higher.
2
Economic Update (continued) – Columbia Mid Cap Value Fund
Stocks moved higher despite summer 2010 setback
Against a strengthening economic backdrop, a stock market rally that began early in 2009 continued into 2010 despite a summer setback linked to a debt crisis brewing in Europe, which raised concerns among U.S. investors. These fears were short-lived and stocks regained their footing in September 2010, moving higher through the end of the period. The S&P 500 Index1 returned 22.57% for the 12 months through February 28, 2011. Outside the United States, stock market returns seesawed but ended just short of U.S. market returns. The MSCI EAFE Index (Net),2 a broad gauge of stock market performance in foreign developed markets, returned 20.00% (in U.S. dollars) for the 12-month period, as concerns about the impact of a bailout for weak euro zone economies abated. Emerging stock markets were similarly strong. The MSCI Emerging Markets Index (Net)3 returned 20.91% (in U.S. dollars) for the 12-month period.
Bonds delivered modest returns
As the economy strengthened and interest rates edged higher, most bond sectors delivered modest returns. The Barclays Capital Aggregate Bond Index4 returned 4.93%. High-yield bonds led the fixed-income markets. For the 12 months covered by this report, the JPMorgan Developed BB High Yield Index5 returned 14.74%. Despite rising yields in the second half of the period, the Treasury market was also positive. The Barclays Capital U.S. Treasury Index6 returned 3.71%. However, municipal bonds struggled in the final months of the period, as interest rates inched higher and issue supply surged ahead of the expiration of the Build America Bonds program. The Barclays Capital Municipal Bond Index7 gained 1.72% for the period. Despite positive economic activity, the Fed kept a key short-term interest rate—the federal funds rate—close to zero.
Past performance is no guarantee of future results.
1The Standard & Poor's (S&P) 500 Index tracks the performance of 500 widely held, large-capitalization U.S. stocks.
2The Morgan Stanley Capital International Europe, Australasia, Far East (MSCI EAFE) Index (Net) is a free float-adjusted market capitalization index that is designed to measure the equity market performance of developed markets, excluding the U.S. & Canada. As of May 27, 2010, the MSCI EAFE Index (Net) consisted of the following 22 developed market country indices: Australia, Austria, Belgium, Denmark, Finland, France, Germany, Greece, Hong Kong, Ireland, Israel, Italy, Japan, the Netherlands, New Zealand, Norway, Portugal, Singapore, Spain, Sweden, Switzerland and the United Kingdom.
3The Morgan Stanley Capital International Emerging Markets (MSCI EM) Index (Net) is a free float-adjusted market capitalization index that is designed to measure equity market performance of emerging markets. As of May 27, 2010, the MSCI EM Index (Net) consisted of the following 21 emerging market country indices: Brazil, Chile, China, Colombia, Czech Republic, Egypt, Hungary, India, Indonesia, Korea, Malaysia, Mexico, Morocco, Peru, Philippines, Poland, Russia, South Africa, Taiwan, Thailand and Turkey.
4The Barclays Capital Aggregate Bond Index is a market value-weighted index that tracks the daily price, coupon, pay-downs and total return performance of fixed-rate, publicly placed, dollar-denominated and non-convertible investment grade debt issues with at least $250 million par amount outstanding and with at least one year to final maturity.
5The JPMorgan Developed BB High Yield Index is an unmanaged index designed to mirror the investable universe of the U.S. dollar developed, BB-rated, high yield corporate debt market.
6The Barclays Capital U.S. Treasury Index includes public obligations of the U.S. Treasury. Treasury bills are excluded by the maturity constraint. In addition, certain special issues, such as state and local government series bonds (SLGs), as well as U.S. Treasury TIPS, are excluded. STRIPS are excluded from the index because their inclusion would result in double-counting.
7The Barclays Capital Municipal Bond Index is considered representative of the broad market for investment-grade, tax-exempt bonds with a maturity of at least one year.
Indices are not available for investment, are not professionally managed and do not reflect sales charges, fees, brokerage commissions, taxes or other expenses of investing. Securities in the fund may not match those in an index.
3
Performance Information – Columbia Mid Cap Value Fund
Performance data quoted represents past performance and current performance may be lower or higher. Past performance is no guarantee of future results. The investment return and principal value will fluctuate so that shares, when redeemed, may be worth more or less than the original cost. Please visit www.columbiamanagement.com for daily and most recent month-end performance updates.
Performance of a $10,000 investment 11/20/01 – 02/28/11
The chart above shows the change in value of a hypothetical $10,000 investment in Class A shares of Columbia Mid Cap Value Fund during the stated time period, and does not reflect the deduction of taxes that a shareholder may pay on fund distributions or on the redemption of fund shares.
Performance of a $10,000 investment 11/20/01 – 02/28/11 ($)
| Sales charge | | without | | with | |
| Class A | | | 21,882 | | | | 20,624 | | |
| Class B | | | 20,409 | | | | 20,409 | | |
| Class C | | | 20,409 | | | | 20,409 | | |
| Class I | | | n/a | | | | n/a | | |
| Class R | | | 21,606 | | | | n/a | | |
| Class W | | | n/a | | | | n/a | | |
| Class Y | | | 22,384 | | | | n/a | | |
| Class Z | | | 22,384 | | | | n/a | | |
Average annual total return as of 02/28/11 (%)
| Share class | | A | | B | | C | | I | | R | | W | | Y | | Z | |
| Inception | | 11/20/01 | | 11/20/01 | | 11/20/01 | | 09/27/10 | | 01/23/06 | | 09/27/10 | | 07/15/09 | | 11/20/01 | |
| Sales charge | | without | | with | | without | | with | | without | | with | | without | | without | | without | | without | | without | |
| 1-year | | | 28.87 | | | | 21.49 | | | | 27.89 | | | | 22.89 | | | | 27.88 | | | | 26.88 | | | | n/a | | | | 28.53 | | | | n/a | | | | 29.23 | | | | 29.14 | | |
| 5-year | | | 3.59 | | | | 2.37 | | | | 2.83 | | | | 2.48 | | | | 2.82 | | | | 2.82 | | | | n/a | | | | 3.35 | | | | n/a | | | | 3.85 | | | | 3.85 | | |
| 10-year/Life | | | 8.81 | | | | 8.12 | | | | 8.00 | | | | 8.00 | | | | 8.00 | | | | 8.00 | | | | 22.40 | | | | 8.66 | | | | 22.17 | | | | 9.08 | | | | 9.08 | | |
The "with sales charge" returns include the maximum initial sales charge of 5.75% for Class A shares and the applicable contingent deferred sales charge of 5.00% in the first year, declining to 1.00% in the sixth year and eliminated thereafter for Class B shares and 1.00% for Class C shares in the first year only. The "without sales charge" returns do not include the effect of sales charges. If they had, returns would be lower.
Performance results reflect any fee waivers or reimbursements of fund expenses by the Investment Manager and/or any of its affiliates. Absent these fee waivers or expense reimbursement arrangements, performance results would have been lower.
All results shown assume reinvestment of distributions. Class I, Class Y and Class Z shares are sold at net asset value with no distribution and service (Rule 12b-1) fees. Class R and Class W shares are sold at net asset value with distribution and/or service (Rule 12b-1) fees. Class I, Class R, Class Y, Class W and Class Z shares have limited eligibility and the investment minimum requirements may vary. Please see the fund's prospectus for details. Performance for different share classes will vary based on differences in sales charges and fees associated with each class.
The tables do not reflect the deduction of taxes that a shareholder may pay on fund distributions or on the redemption of fund shares.
The returns for Class R shares include the returns of Class A shares prior to January 23, 2006, the date on which Class R shares were initially offered by the fund. If differences in expenses had been reflected, the returns shown would have been lower, since Class R shares are subject to higher distribution and service (Rule 12b-1) fees. The returns for Class Y shares include the returns for Class Z shares prior to July 15, 2009, the date on which Class Y shares were initially offered by the fund. The returns shown have not been adjusted to reflect any differences in expenses between Class Y and Class Z shares.
Class I and Class W shares were initially offered on September 27, 2010.
4
Understanding Your Expenses – Columbia Mid Cap Value Fund
As a fund shareholder, you incur two types of costs. There are transaction costs, which generally include sales charges on purchases and may include redemption fees or exchange fees. There are also ongoing costs, which generally include investment advisory fees, distribution and service (Rule 12b-1) fees and other fund expenses. The information on this page is intended to help you understand the ongoing costs of investing in the fund and to compare these costs with the ongoing costs of investing in other mutual funds.
Analyzing your fund's expenses by share class
To illustrate these ongoing costs, we have provided an example and calculated the expenses paid by investors in each share class during the period. The information in the following table is based on an initial investment of $1,000, which is invested at the beginning of the period and held for the entire period. Expense information is calculated two ways and each method provides you with different information. The amount listed in the "Actual" column is calculated using the fund's actual operating expenses and total return for the period. The amount listed in the "Hypothetical" column for each share class assumes that the return each year is 5% before expenses and is calculated based on the fund's actual operating expenses. You should not use the hypothetical account values and expenses to estimate either your actual account balance at the end of the period or the expenses you paid during this period.
Compare with other funds
Since all mutual funds are required to include the same hypothetical calculations about expenses in shareholder reports, you can use this information to compare the ongoing cost of investing in the fund with other funds. To do so, compare the 5% hypothetical example with the 5% hypothetical examples that appear in the shareholder reports of other funds. As you compare hypothetical examples of other funds, it is important to note that hypothetical examples are meant to highlight the ongoing costs of investing in a fund and do not reflect any transaction costs, such as sales charges, redemption fees or exchange fees.
Estimating your actual expenses
To estimate the expenses that you paid over the period, first you will need your account balance at the end of the period:
g For shareholders who receive their account statements from Columbia Management Investment Services Corp., your account balance is available online at www.columbiamanagement.com or by calling Shareholder Services at 800.345.6611.
g For shareholders who receive their account statements from their financial intermediary, contact your financial intermediary to obtain your account balance.
1. Divide your ending account balance by $1,000. For example, if an account balance was $8,600 at the end of the period, the result would be 8.6.
2. In the section of the table below titled "Expenses paid during the period," locate the amount for your share class. You will find this number in the column labeled "Actual." Multiply this number by the result from step 1. Your answer is an estimate of the expenses you paid on your account during the period.
If the value of your account falls below the minimum initial investment requirement applicable to you, your account may be subject to a $20 annual fee. This fee is not included in the accompanying table. If you are subject to the fee, keep it in mind when you are estimating the ongoing expenses of investing in the fund and when comparing the expenses of this fund with other funds.
09/01/10 – 02/28/11
| | | Account value at the
beginning of the period ($) | | Account value at the
end of the period ($) | | Expenses paid
during the period ($) | | Fund's annualized
expense ratio (%) | |
| | | Actual | | Hypothetical | | Actual | | Hypothetical | | Actual | | Hypothetical | | Actual | |
| Class A | | | 1,000.00 | | | | 1,000.00 | | | | 1,333.90 | | | | 1,019.29 | | | | 6.42 | | | | 5.56 | | | | 1.11 | | |
| Class B | | | 1,000.00 | | | | 1,000.00 | | | | 1,329.00 | | | | 1,015.57 | | | | 10.74 | | | | 9.30 | | | | 1.86 | | |
| Class C | | | 1,000.00 | | | | 1,000.00 | | | | 1,329.70 | | | | 1,015.57 | | | | 10.74 | | | | 9.30 | | | | 1.86 | | |
| Class I | | | 1,000.00 | | | | 1,000.00 | | | | 1059.50 | * | | | 1,021.32 | | | | 3.04 | * | | | 3.51 | | | | 0.70 | | |
| Class R | | | 1,000.00 | | | | 1,000.00 | | | | 1,332.60 | | | | 1,018.05 | | | | 7.87 | | | | 6.80 | | | | 1.36 | | |
| Class W | | | 1,000.00 | | | | 1,000.00 | | | | 1058.70 | * | | | 1,019.29 | | | | 4.82 | * | | | 5.56 | | | | 1.11 | | |
| Class Y | | | 1,000.00 | | | | 1,000.00 | | | | 1,336.80 | | | | 1,020.88 | | | | 4.58 | | | | 3.96 | | | | 0.79 | | |
| Class Z | | | 1,000.00 | | | | 1,000.00 | | | | 1,336.10 | | | | 1,020.53 | | | | 4.98 | | | | 4.31 | | | | 0.86 | | |
Expenses paid during the period are equal to the annualized expense ratio for the share class, multiplied by the average account value over the period, then multiplied by the number of days in the fund's most recent fiscal half-year and divided by 365.
It is important to note that the expense amounts shown in the table are meant to highlight only ongoing costs of investing in the fund and do not reflect any transaction costs, such as sales charges, redemption fees or exchange fees. Therefore, the hypothetical examples provided may not help you determine the relative total costs of owning shares of different funds. If these transaction costs were included, your costs would have been higher.
*For the period September 27, 2010 through February 28, 2011. Class I and Class W shares commenced operations on September 27, 2010.
5
Portfolio Manager's Report – Columbia Mid Cap Value Fund
Performance data quoted represents past performance and current performance may be lower or higher. Past performance is no guarantee of future results. The investment return and principal value will fluctuate so that shares, when redeemed, may be worth more or less than the original cost. Please visit www.columbiamanagement.com for daily and most recent month-end performance updates.
Net asset value per share
as of 02/28/11 ($)
| Class A | | | 14.24 | | |
| Class B | | | 13.89 | | |
| Class C | | | 13.94 | | |
| Class I | | | 14.24 | | |
| Class R | | | 14.23 | | |
| Class W | | | 14.24 | | |
| Class Y | | | 14.24 | | |
| Class Z | | | 14.26 | | |
Distributions declared per share
03/01/10 – 02/28/11 ($)
| Class A | | | 0.14 | | |
| Class B | | | 0.09 | | |
| Class C | | | 0.09 | | |
| Class I | | | 0.05 | | |
| Class R | | | 0.12 | | |
| Class W | | | 0.04 | | |
| Class Y | | | 0.18 | | |
| Class Z | | | 0.17 | | |
For the 12-month period that ended February 28, 2011, the fund's Class A shares returned 28.87% without sales charge. This return was largely in line with the 29.30% gain of the fund's benchmark, the Russell Midcap Value Index, as well as the 28.81% advance of its peer group, the Lipper Mid-Cap Core Funds Classification. In a year marked by volatility, we believe our decision to stay focused on attractively valued stocks where we could see the potential for improvement, particularly in operating profit margins, aided results.
Mid-cap stocks outpaced larger-cap issues
After a tumultuous first half, U.S. equities ended the reporting period with strong gains. Smaller-cap and lower-quality stocks, which had been hardest hit in the market downturn, were among the biggest winners as the economic outlook improved in the second half of the 12-month period. Across market caps, stocks that could generate above-average earnings growth outperformed stocks that offered attractive valuations relative to earnings and other measures. The market's gains were broad-based, with all sectors in the Russell index reporting strong returns.
Outperformance in information technology and consumer discretionary sectors
Security selection, particularly in the information technology, consumer discretionary and materials sectors, gave the biggest boost to fund results versus the index. Within technology, the biggest gains came from semiconductor stocks. Atmel (0.5% of net assets), which makes chips for mobile digital devices, returned over 200% for the year, as growing demand for its products pushed earnings ahead of estimates. Investors applauded news that the company would begin buying back its shares. In consumer discretionary, stock selection was strongest in the specialty retail area. Winners included footwear retailer, Foot Locker (0.9% of net assets), which benefited from a rebound in the sale of basketball shoes, and Limited Brands (0.7% of net assets), which owns Victoria's Secret and Bath & Body Works. Strong same-store sales at Foot Locker and Limited stores helped propel both stocks higher. In addition, the fund owned some automotive-related winners, including BorgWarner (1.0% of net assets) and auto parts retailer O'Reilly Automotive, an out-of-benchmark position that was sold before period end. O'Reilly gained from an uptick in mileage as more people drive their cars longer. Finally, materials stocks added to performance, thanks to a slight overweight and good stock selection in the sector.
Energy holdings lagged index
Despite strong gains from energy stocks, the fund's holdings lagged those in the index by a sizable margin. Exposure to energy equipment and services companies, such as Pride International, Nabors Industries and Noble (1.1% of net assets—and not in the Russell index), hampered results. All three were hard hit by last spring's oil disaster in the Gulf of Mexico. We sold Pride on the news that it would be acquired by ENSCO International, another portfolio holding. We also sold Nabors before the end of the reporting period. A small stake in coal company Massey Energy further hindered results. Massey's stock tumbled after a fatal accident last spring at one of its West Virginia mines, and we sold the position.
Economically sensitive bias
At period end, the portfolio was positioned for continued slow economic growth with overweights in sectors that are sensitive to economic activity, including consumer discretionary,
6
Portfolio Manager's Report (continued) – Columbia Mid Cap Value Fund
technology and industrials. We remain focused on companies that can generate improved profitability going forward. As always, the fund's positioning reflects opportunities uncovered by our bottom-up stock selection process. Going forward, we expect the market to benefit from increased merger-and-acquisition activity, as larger companies use their relatively high cash positions to make acquisitions that can help their businesses expand. In addition, we believe stocks have the potential to attract more investor interest from shareholder-friendly initiatives, including the reinstatement or increase in dividends and the introduction of new share repurchase programs.
Portfolio characteristics and holdings are subject to change periodically and may not be representative of current characteristics and holdings. The outlook for the fund may differ from those presented for other Columbia Funds.
Equity securities are affected by stock market fluctuations that occur in response to economic and business developments.
Stocks of mid-cap companies pose special risks, including possible illiquidity and greater price volatility than stocks of larger, more established companies.
Top 5 sectors
as of 02/28/11 (%)
| Financials | | | 26.5 | | |
| Consumer Discretionary | | | 12.8 | | |
| Energy | | | 12.6 | | |
| Industrials | | | 12.6 | | |
| Utilities | | | 8.6 | | |
Top 10 holdings
as of 02/28/11 (%)
| Discover Financial Services | | | 2.0 | | |
| Spectra Energy | | | 1.8 | | |
| Parker Hannifin | | | 1.6 | | |
| Peabody Energy | | | 1.6 | | |
| PPG Industries | | | 1.6 | | |
| Lincoln National | | | 1.5 | | |
| Fifth Third Bancorp | | | 1.5 | | |
| Equity Residential Property Trust | | | 1.5 | | |
| Wisconsin Energy | | | 1.4 | | |
| Murphy Oil | | | 1.4 | | |
The fund is actively managed and the composition of its portfolio will change over time. Information provided is calculated as a percentage of net assets.
7
Investment Portfolio – Columbia Mid Cap Value Fund
February 28, 2011
| Common Stocks – 97.4% | |
| | | Shares | | Value ($) | |
| Consumer Discretionary – 12.8% | |
| Auto Components – 1.7% | |
| BorgWarner, Inc. (a) | | | 652,200 | | | | 50,617,242 | | |
| Tenneco, Inc. (a) | | | 860,500 | | | | 34,316,740 | | |
| Auto Components Total | | | 84,933,982 | | |
| Automobiles – 0.5% | |
| Harley-Davidson, Inc. | | | 605,900 | | | | 24,732,838 | | |
| Automobiles Total | | | 24,732,838 | | |
| Hotels, Restaurants & Leisure – 3.0% | |
| Bally Technologies, Inc. (a) | | | 563,500 | | | | 21,768,005 | | |
| Darden Restaurants, Inc. | | | 517,600 | | | | 24,394,488 | | |
| International Game Technology | | | 1,595,134 | | | | 26,255,905 | | |
| Royal Caribbean Cruises Ltd. (a) | | | 1,008,225 | | | | 44,150,173 | | |
Starwood Hotels & Resorts
Worldwide, Inc. | | | 609,000 | | | | 37,209,900 | | |
| Hotels, Restaurants & Leisure Total | | | 153,778,471 | | |
| Household Durables – 1.7% | |
| D.R. Horton, Inc. | | | 3,473,325 | | | | 41,124,168 | | |
| Stanley Black & Decker, Inc. | | | 610,450 | | | | 46,290,424 | | |
| Household Durables Total | | | 87,414,592 | | |
| Internet & Catalog Retail – 0.5% | |
Liberty Media Corp., Interactive,
Series A (a) | | | 1,571,700 | | | | 25,241,502 | | |
| Internet & Catalog Retail Total | | | 25,241,502 | | |
| Leisure Equipment & Products – 1.2% | |
| Brunswick Corp. | | | 568,800 | | | | 13,099,464 | | |
| Hasbro, Inc. | | | 558,550 | | | | 25,078,895 | | |
| Mattel, Inc. | | | 915,450 | | | | 22,941,177 | | |
| Leisure Equipment & Products Total | | | 61,119,536 | | |
| Media – 2.0% | |
| CBS Corp., Class B | | | 2,336,300 | | | | 55,744,118 | | |
| DISH Network Corp., Class A (a) | | | 2,000,100 | | | | 46,502,325 | | |
| Media Total | | | 102,246,443 | | |
| Multiline Retail – 0.5% | |
| Macy's, Inc. | | | 1,077,300 | | | | 25,747,470 | | |
| Multiline Retail Total | | | 25,747,470 | | |
| Specialty Retail – 1.7% | |
| Foot Locker, Inc. | | | 2,407,100 | | | | 47,829,077 | | |
| Limited Brands, Inc. | | | 1,130,450 | | | | 36,197,009 | | |
| Specialty Retail Total | | | 84,026,086 | | |
| Consumer Discretionary Total | | | 649,240,920 | | |
| | | Shares | | Value ($) | |
| Consumer Staples – 4.8% | |
| Beverages – 0.6% | |
Molson Coors Brewing Co.,
Class B | | | 655,550 | | | | 29,978,301 | | |
| Beverages Total | | | 29,978,301 | | |
| Food & Staples Retailing – 0.8% | |
| Safeway, Inc. | | | 1,852,200 | | | | 40,415,004 | | |
| Food & Staples Retailing Total | | | 40,415,004 | | |
| Food Products – 2.0% | |
| Dean Foods Co. (a) | | | 1,434,400 | | | | 15,147,264 | | |
| Hershey Co. | | | 1,025,800 | | | | 53,669,856 | | |
| J.M. Smucker Co. | | | 520,465 | | | | 35,828,811 | | |
| Food Products Total | | | 104,645,931 | | |
| Household Products – 0.5% | |
| Clorox Co. | | | 395,950 | | | | 26,829,572 | | |
| Household Products Total | | | 26,829,572 | | |
| Personal Products – 0.9% | |
| Avon Products, Inc. | | | 1,574,200 | | | | 43,778,502 | | |
| Personal Products Total | | | 43,778,502 | | |
| Consumer Staples Total | | | 245,647,310 | | |
| Energy – 12.6% | |
| Energy Equipment & Services – 4.6% | |
| Cameron International Corp. (a) | | | 647,950 | | | | 38,313,283 | | |
| Dresser-Rand Group, Inc. (a) | | | 583,750 | | | | 28,767,200 | | |
| Ensco PLC, ADR | | | 765,600 | | | | 42,950,160 | | |
| Noble Corp. | | | 1,256,725 | | | | 56,188,175 | | |
| Superior Energy Services, Inc. (a) | | | 663,900 | | | | 25,434,009 | | |
| Weatherford International Ltd. (a) | | | 1,639,300 | | | | 39,638,274 | | |
| Energy Equipment & Services Total | | | 231,291,101 | | |
| Oil, Gas & Consumable Fuels – 8.0% | |
| Cabot Oil & Gas Corp. | | | 1,284,525 | | | | 58,651,412 | | |
| El Paso Corp. | | | 2,063,800 | | | | 38,386,680 | | |
| Frontier Oil Corp. (a) | | | 970,400 | | | | 27,074,160 | | |
| Murphy Oil Corp. | | | 964,400 | | | | 70,912,332 | | |
| Peabody Energy Corp. | | | 1,233,305 | | | | 80,769,144 | | |
| QEP Resources, Inc. | | | 695,300 | | | | 27,499,115 | | |
| Spectra Energy Corp. | | | 3,330,500 | | | | 89,090,875 | | |
| Tesoro Corp. (a) | | | 691,300 | | | | 16,439,114 | | |
| Oil, Gas & Consumable Fuels Total | | | 408,822,832 | | |
| Energy Total | | | 640,113,933 | | |
See Accompanying Notes to Financial Statements.
8
Columbia Mid Cap Value Fund
February 28, 2011
| Common Stocks (continued) | |
| | | Shares | | Value ($) | |
| Financials – 26.5% | |
| Capital Markets – 2.3% | |
| Raymond James Financial, Inc. | | | 1,381,350 | | | | 52,933,332 | | |
| TD Ameritrade Holding Corp. | | | 3,035,250 | | | | 66,168,450 | | |
| Capital Markets Total | | | 119,101,782 | | |
| Commercial Banks – 7.1% | |
| CIT Group, Inc. (a) | | | 847,100 | | | | 36,696,372 | | |
| City National Corp. | | | 814,287 | | | | 47,969,647 | | |
| Comerica, Inc. | | | 922,275 | | | | 35,876,498 | | |
| Cullen/Frost Bankers, Inc. | | | 826,225 | | | | 48,383,736 | | |
| Fifth Third Bancorp. | | | 5,147,494 | | | | 75,153,412 | | |
| Huntington Bancshares, Inc. | | | 5,584,985 | | | | 38,201,297 | | |
| SVB Financial Group (a) | | | 770,177 | | | | 41,728,190 | | |
| Zions Bancorporation | | | 1,643,625 | | | | 38,395,080 | | |
| Commercial Banks Total | | | 362,404,232 | | |
| Consumer Finance – 2.0% | |
| Discover Financial Services | | | 4,575,409 | | | | 99,515,145 | | |
| Consumer Finance Total | | | 99,515,145 | | |
| Insurance – 4.9% | |
| ACE Ltd. | | | 401,331 | | | | 25,384,186 | | |
| Axis Capital Holdings Ltd. | | | 1,108,500 | | | | 40,260,720 | | |
| Lincoln National Corp. | | | 2,382,258 | | | | 75,565,224 | | |
Reinsurance Group of
America, Inc. | | | 1,141,675 | | | | 68,945,753 | | |
| XL Group PLC | | | 1,584,823 | | | | 37,005,617 | | |
| Insurance Total | | | 247,161,500 | | |
| Real Estate Investment Trusts (REITs) – 8.6% | |
Alexandria Real Estate
Equities, Inc. | | | 512,200 | | | | 41,078,440 | | |
| Boston Properties, Inc. | | | 591,750 | | | | 56,760,660 | | |
| Equity Residential Property Trust | | | 1,340,025 | | | | 73,848,778 | | |
| General Growth Properties, Inc. (a) | | | 778,363 | | | | 12,391,539 | | |
| Host Hotels & Resorts, Inc. | | | 2,875,097 | | | | 52,901,785 | | |
| ProLogis | | | 2,409,200 | | | | 39,173,592 | | |
| Rayonier, Inc. | | | 1,029,775 | | | | 63,156,101 | | |
| Taubman Centers, Inc. | | | 890,000 | | | | 49,377,200 | | |
| Weyerhaeuser Co. | | | 1,970,611 | | | | 48,102,614 | | |
| Real Estate Investment Trusts (REITs) Total | | | 436,790,709 | | |
| Real Estate Management & Development – 0.9% | |
CB Richard Ellis Group, Inc.,
Class A (a) | | | 1,777,000 | | | | 44,496,080 | | |
| Real Estate Management & Development Total | | | 44,496,080 | | |
| Thrifts & Mortgage Finance – 0.7% | |
| MGIC Investment Corp. (a) | | | 1,393,154 | | | | 11,967,193 | | |
| People's United Financial, Inc. | | | 1,956,550 | | | | 25,787,329 | | |
| Thrifts & Mortgage Finance Total | | | 37,754,522 | | |
| Financials Total | | | 1,347,223,970 | | |
| | | Shares | | Value ($) | |
| Health Care – 5.9% | |
| Health Care Equipment & Supplies – 2.3% | |
| Cooper Companies, Inc. | | | 471,775 | | | | 29,165,130 | | |
| Teleflex, Inc. | | | 797,925 | | | | 46,590,841 | | |
| Zimmer Holdings, Inc. (a) | | | 662,450 | | | | 41,297,133 | | |
| Health Care Equipment & Supplies Total | | | 117,053,104 | | |
| Health Care Providers & Services – 1.3% | |
| Coventry Health Care, Inc. (a) | | | 1,115,100 | | | | 33,676,020 | | |
| Quest Diagnostics, Inc. | | | 580,486 | | | | 32,942,581 | | |
| Health Care Providers & Services Total | | | 66,618,601 | | |
| Life Sciences Tools & Services – 1.4% | |
| Agilent Technologies, Inc. (a) | | | 999,825 | | | | 42,072,636 | | |
| Mettler-Toledo International, Inc. (a) | | | 154,825 | | | | 26,532,360 | | |
| Life Sciences Tools & Services Total | | | 68,604,996 | | |
| Pharmaceuticals – 0.9% | |
| Watson Pharmaceuticals, Inc. (a) | | | 827,200 | | | | 46,314,928 | | |
| Pharmaceuticals Total | | | 46,314,928 | | |
| Health Care Total | | | 298,591,629 | | |
| Industrials – 12.6% | |
| Aerospace & Defense – 1.3% | |
| AerCap Holdings NV (a) | | | 3,288,400 | | | | 44,623,588 | | |
| L-3 Communications Holdings, Inc. | | | 288,150 | | | | 22,847,414 | | |
| Aerospace & Defense Total | | | 67,471,002 | | |
| Airlines – 0.4% | |
| Delta Air Lines, Inc. (a) | | | 1,796,600 | | | | 20,193,784 | | |
| Airlines Total | | | 20,193,784 | | |
| Building Products – 0.5% | |
| Owens Corning (a) | | | 696,400 | | | | 24,882,372 | | |
| Building Products Total | | | 24,882,372 | | |
| Construction & Engineering – 1.0% | |
| Foster Wheeler AG (a) | | | 1,466,750 | | | | 53,037,680 | | |
| Construction & Engineering Total | | | 53,037,680 | | |
| Electrical Equipment – 1.5% | |
| Babcock & Wilcox Co. (a) | | | 791,600 | | | | 26,732,332 | | |
| Cooper Industries PLC, Class A | | | 782,075 | | | | 50,326,526 | | |
| Electrical Equipment Total | | | 77,058,858 | | |
| Machinery – 4.7% | |
| AGCO Corp. (a) | | | 549,475 | | | | 30,100,240 | | |
| Crane Co. | | | 718,600 | | | | 33,946,664 | | |
| Ingersoll-Rand PLC | | | 824,450 | | | | 37,347,585 | | |
| Kennametal, Inc. | | | 749,425 | | | | 28,822,886 | | |
| Navistar International Corp. (a) | | | 398,400 | | | | 24,692,832 | | |
| Parker Hannifin Corp. | | | 913,350 | | | | 81,452,553 | | |
| Machinery Total | | | 236,362,760 | | |
See Accompanying Notes to Financial Statements.
9
Columbia Mid Cap Value Fund
February 28, 2011
| Common Stocks (continued) | |
| | | Shares | | Value ($) | |
| Professional Services – 0.9% | |
| Manpower, Inc. | | | 728,100 | | | | 46,234,350 | | |
| Professional Services Total | | | 46,234,350 | | |
| Road & Rail – 2.3% | |
| Canadian Pacific Railway Ltd. | | | 562,600 | | | | 38,245,548 | | |
| Con-way, Inc. | | | 799,873 | | | | 26,043,865 | | |
| Hertz Global Holdings, Inc. (a) | | | 3,317,350 | | | | 50,456,893 | | |
| Road & Rail Total | | | 114,746,306 | | |
| Industrials Total | | | 639,987,112 | | |
| Information Technology – 6.9% | |
| Communications Equipment – 0.5% | |
Brocade Communications
Systems, Inc. (a) | | | 4,311,100 | | | | 27,461,707 | | |
| Communications Equipment Total | | | 27,461,707 | | |
| Computers & Peripherals – 1.1% | |
| Diebold, Inc. | | | 1,558,750 | | | | 54,805,650 | | |
| Computers & Peripherals Total | | | 54,805,650 | | |
| Electronic Equipment, Instruments & Components – 2.0% | |
| Arrow Electronics, Inc. (a) | | | 1,270,725 | | | | 49,812,420 | | |
| Molex, Inc. | | | 1,828,750 | | | | 51,076,987 | | |
Electronic Equipment, Instruments &
Components Total | | | 100,889,407 | | |
| Semiconductors & Semiconductor Equipment – 1.8% | |
| Advanced Micro Devices, Inc. (a) | | | 2,459,500 | | | | 22,651,995 | | |
| Atmel Corp. (a) | | | 1,799,300 | | | | 26,413,724 | | |
| Avago Technologies Ltd. | | | 808,900 | | | | 27,494,511 | | |
Varian Semiconductor Equipment
Associates, Inc. (a) | | | 323,300 | | | | 15,424,643 | | |
Semiconductors & Semiconductor
Equipment Total | | | 91,984,873 | | |
| Software – 1.5% | |
| Autodesk, Inc. (a) | | | 910,250 | | | | 38,276,013 | | |
| Nuance Communications, Inc. (a) | | | 1,870,300 | | | | 34,899,798 | | |
| Software Total | | | 73,175,811 | | |
| Information Technology Total | | | 348,317,448 | | |
| Materials – 5.9% | |
| Chemicals – 4.1% | |
| Albemarle Corp. | | | 754,750 | | | | 43,443,410 | | |
| Celanese Corp., Series A | | | 932,350 | | | | 38,645,908 | | |
International Flavors &
Fragrances, Inc. | | | 497,400 | | | | 28,326,930 | | |
| | | Shares | | Value ($) | |
LyondellBasell Industries NV,
Class A (a) | | | 437,125 | | | | 16,645,720 | | |
| PPG Industries, Inc. | | | 894,675 | | | | 79,071,376 | | |
| Chemicals Total | | | 206,133,344 | | |
| Containers & Packaging – 1.3% | |
| Packaging Corp. of America | | | 2,203,500 | | | | 63,438,765 | | |
| Containers & Packaging Total | | | 63,438,765 | | |
| Metals & Mining – 0.5% | |
| United States Steel Corp. | | | 480,375 | | | | 27,616,759 | | |
| Metals & Mining Total | | | 27,616,759 | | |
| Materials Total | | | 297,188,868 | | |
| Telecommunication Services – 0.8% | |
| Diversified Telecommunication Services – 0.8% | |
Qwest Communications
International, Inc. | | | 5,507,550 | | | | 37,561,491 | | |
| Diversified Telecommunication Services Total | | | 37,561,491 | | |
| Telecommunication Services Total | | | 37,561,491 | | |
| Utilities – 8.6% | |
| Electric Utilities – 1.8% | |
American Electric
Power Co., Inc. | | | 1,433,925 | | | | 51,305,837 | | |
| Northeast Utilities | | | 1,126,725 | | | | 38,353,719 | | |
| Electric Utilities Total | | | 89,659,556 | | |
| Independent Power Producers & Energy Traders – 0.5% | |
| AES Corp. (a) | | | 2,052,674 | | | | 25,391,577 | | |
Independent Power Producers & Energy
Traders Total | | | 25,391,577 | | |
| Multi-Utilities – 6.3% | |
| CMS Energy Corp. | | | 1,596,800 | | | | 30,754,368 | | |
| PG&E Corp. | | | 942,875 | | | | 43,428,822 | | |
Public Service Enterprise
Group, Inc. | | | 1,245,525 | | | | 40,728,668 | | |
| Sempra Energy | | | 1,303,325 | | | | 69,375,990 | | |
| Wisconsin Energy Corp. | | | 1,219,475 | | | | 72,192,920 | | |
| Xcel Energy, Inc. | | | 2,781,250 | | | | 66,583,125 | | |
| Multi-Utilities Total | | | 323,063,893 | | |
| Utilities Total | | | 438,115,026 | | |
Total Common Stocks
(cost of $3,730,269,787) | | | 4,941,987,707 | | |
See Accompanying Notes to Financial Statements.
10
Columbia Mid Cap Value Fund
February 28, 2011
| Short-Term Obligation – 2.8% | |
| | | Par ($) | | Value ($) | |
Repurchase agreement with
Fixed Income Clearing Corp.,
dated 02/28/11, due 03/01/11
at 0.090%, collateralized by a
U.S. Government Agency
obligation maturing 12/18/13,
market value $147,085,125
(repurchase proceeds
$144,198,361) | | | 144,198,000 | | | | 144,198,000 | | |
Total Short-Term Obligation
(cost of $144,198,000) | | | 144,198,000 | | |
Total Investments – 100.2%
(cost of $3,874,467,787) (b) | | | 5,086,185,707 | | |
| Other Assets & Liabilities, Net – (0.2)% | | | (9,671,096 | ) | |
| Net Assets – 100.0% | | | 5,076,514,611 | | |
Notes to Investment Portfolio:
(a) Non-income producing security.
(b) Cost for federal income tax purposes is $3,894,205,493.
Generally accepted accounting principles (GAAP) require disclosure regarding the inputs and valuation techniques used to measure fair value and any changes in valuation inputs or techniques. In addition, investments shall be disclosed by major category.
The Fund categorizes its fair value measurements according to a three-level hierarchy that maximizes the use of observable inputs and minimizes the use of unobservable inputs by prioritizing that the most observable input be used when available. Observable inputs are those that market participants would use in pricing an investment based on market data obtained from sources independent of the reporting entity. Unobservable inputs are those that reflect the Fund's assumptions about the information market participants would use in pricing an investment. An investment's level within the fair value hierarchy is based on the lowest level of any input that is deemed significant to the asset or liability's fair value measurement. The input levels are not necessarily an indication of the risk or liquidity associated with investments at that level. For example, certain U.S. government securities are generally high quality and liquid, however, they are reflected as Level 2 because the inputs used to determine fair value may not always be quoted prices in an active market.
Fair value inputs are summarized in the three broad levels listed below:
• Level 1—Valuations based on quoted prices for investments in active markets that the Fund has the ability to access at the measurement date (including NAV for open-end mutual funds). Valuation adjustments are not applied to Level 1 investments.
• Level 2 — Valuations based on other significant observable inputs (including quoted prices for similar securities, interest rates, prepayment speeds, credit risks, etc.).
• Level 3 — Valuations based on significant unobservable inputs (including the Fund's own assumptions and judgment in determining the fair value of investments).
Inputs that are used in determining fair value of an investment may include price information, credit data, volatility statistics, and other factors. These inputs can be either observable or unobservable. The availability of observable inputs can vary between investments, and is affected by various factors such as the type of investment, and the volume and level of activity for that investment or similar investments in the marketplace. The inputs will be considered by the Investment Manager, along with any other relevant factors in the calculation of an investment's fair value. The Fund uses prices and inputs that are current as of the measurement date, which may include periods of market dislocations. During these periods, the availability of prices and inputs may be reduced for many investments. This condition could cause an investment to be reclassified between the various levels within the hierarchy. Non-U.S. equity securities actively traded in foreign markets may be reflected in Level 2 despite the availability of closing prices, because the Fund evaluates and determines whether those closing prices reflect fair value at the close of the New York Stock Exchange (NYSE) or require adjustment, as described in Note 2 to the financial statements—Security Valuation.
Investments falling into the Level 3 category are primarily supported by quoted prices from brokers and dealers participating in the market for those investments. However, these may be classified as Level 3 investments due to lack of market transparency and corroboration to support these quoted prices. Additionally, valuation models may be used as the pricing source for any remaining investments classified as Level 3. These models rely on one or more significant unobservable inputs and/or significant assumptions by the Investment Manager. Inputs used in valuations may include, but are not limited to, financial statement analysis, capital account balances, discount rates and estimated cash flows, and comparable company data.
The following table is a summary of the inputs used to value the Fund's investments as of February 28, 2011:
| Description | | Quoted
Prices
(Level 1) | | Other
Significant
Observable
Inputs
(Level 2) | | Significant
Unobservable
Inputs
(Level 3) | | Total | |
| Total Common Stocks | | $ | 4,941,987,707 | | | $ | — | | | $ | — | | | $ | 4,941,987,707 | | |
Total Short-Term
Obligation | | | — | | | | 144,198,000 | | | | — | | | | 144,198,000 | | |
| Total Investments | | $ | 4,941,987,707 | | | $ | 144,198,000 | | | $ | — | | | $ | 5,086,185,707 | | |
The Fund's assets assigned to the Level 2 input category represent certain short-term obligations which are valued using amortized cost, an income approach which converts future cash flows to a present value based upon the discount or premium at purchase.
There were no significant transfers of financial assets between Levels 1 and 2 during the period.
At February 28, 2011, the Fund held investments in the following sectors:
| Sector (Unaudited) | | % of
Net Assets | |
| Financials | | | 26.5 | | |
| Consumer Discretionary | | | 12.8 | | |
| Energy | | | 12.6 | | |
| Industrials | | | 12.6 | | |
| Utilities | | | 8.6 | | |
| Information Technology | | | 6.9 | | |
| Health Care | | | 5.9 | | |
| Materials | | | 5.9 | | |
| Consumer Staples | | | 4.8 | | |
| Telecommunication Services | | | 0.8 | | |
| | | | 97.4 | | |
| Short-Term Obligation | | | 2.8 | | |
| Other Assets & Liabilities, Net | | | (0.2 | ) | |
| | | | 100.0 | | |
| Acronym | | Name | |
| ADR | | American Depositary Receipt | |
|
See Accompanying Notes to Financial Statements.
11
Statement of Assets and Liabilities – Columbia Mid Cap Value Fund
February 28, 2011
| | | | | ($) | |
| Assets | | Investments, at identified cost | | | 3,874,467,787 | | |
| | | Investments, at value | | | 5,086,185,707 | | |
| | | Cash | | | 8,555,136 | | |
| | | Receivable for: | | | | | |
| | | Investments sold | | | 15,049,141 | | |
| | | Fund shares sold | | | 17,689,178 | | |
| | | Dividends | | | 7,268,816 | | |
| | | Interest | | | 361 | | |
| | | Trustees' deferred compensation plan | | | 47,136 | | |
| | | Prepaid expenses | | | 16,575 | | |
| | | Other assets | | | 982 | | |
| | | Total Assets | | | 5,134,813,032 | | |
| Liabilities | | Expense reimbursement due to Investment Manager | | | 23 | | |
| | | Payable for: | | | | | |
| | | Investments purchased | | | 42,029,469 | | |
| | | Fund shares repurchased | | | 10,150,175 | | |
| | | Investment advisory fee | | | 2,048,729 | | |
| | | Administration fee | | | 645,777 | | |
| | | Pricing and bookkeeping fees | | | 11,934 | | |
| | | Transfer agent fee | | | 2,384,346 | | |
| | | Trustees' fees | | | 48,511 | | |
| | | Custody fee | | | 23,507 | | |
| | | Distribution and service fees | | | 578,551 | | |
| | | Chief compliance officer expenses | | | 629 | | |
| | | Trustees' deferred compensation plan | | | 47,136 | | |
| | | Other liabilities | | | 329,634 | | |
| | | Total Liabilities | | | 58,298,421 | | |
| | | Net Assets | | | 5,076,514,611 | | |
| Net Assets Consist of | | Paid-in capital | | | 4,521,673,273 | | |
| | | Undistributed net investment income | | | 125,040 | | |
| | | Accumulated net realized loss | | | (657,001,622 | ) | |
| | | Net unrealized appreciation on investments | | | 1,211,717,920 | | |
| | | Net Assets | | | 5,076,514,611 | | |
See Accompanying Notes to Financial Statements.
12
Statement of Assets and Liabilities (continued) – Columbia Mid Cap Value Fund
February 28, 2011
| Class A | | Net assets | | $ | 1,511,518,857 | | |
| | | Shares outstanding | | | 106,142,531 | | |
| | | Net asset value per share | | $ | 14.24 | (a) | |
| | | Maximum sales charge | | | 5.75 | % | |
| | | Maximum offering price per share | | $ | 15.11 | (b) | |
| Class B | | Net assets | | $ | 44,651,181 | | |
| | | Shares outstanding | | | 3,215,183 | | |
| | | Net asset value and offering price per share | | $ | 13.89 | (a) | |
| Class C | | Net assets | | $ | 173,456,751 | | |
| | | Shares outstanding | | | 12,444,266 | | |
| | | Net asset value and offering price per share | | $ | 13.94 | (a) | |
| Class I (c) | | Net assets | | $ | 150,602,873 | | |
| | | Shares outstanding | | | 10,574,573 | | |
| | | Net asset value, offering and redemption price per share | | $ | 14.24 | | |
| Class R | | Net assets | | $ | 337,000,600 | | |
| | | Shares outstanding | | | 23,686,098 | | |
| | | Net asset value, offering and redemption price per share | | $ | 14.23 | | |
| Class W (c) | | Net assets | | $ | 3,046 | | |
| | | Shares outstanding | | | 214 | | |
| | | Net asset value, offering and redemption price per share | | $ | 14.24 | (d) | |
| Class Y | | Net assets | | $ | 32,515 | | |
| | | Shares outstanding | | | 2,283 | | |
| | | Net asset value, offering and redemption price per share | | $ | 14.24 | | |
| Class Z | | Net assets | | $ | 2,859,248,788 | | |
| | | Shares outstanding | | | 200,496,740 | | |
| | | Net asset value, offering and redemption price per share | | $ | 14.26 | | |
(a) Redemption price per share is equal to net asset value less any applicable contingent deferred sales charge.
(b) On sales of $50,000 or more the offering price is reduced.
(c) Class I and Class W shares commenced operations on September 27, 2010.
(d) Net asset value per share rounds to this amount due to fractional shares outstanding.
See Accompanying Notes to Financial Statements.
13
Statement of Operations – Columbia Mid Cap Value Fund
For the Year Ended February 28, 2011
| | | | | ($) (a) | |
| Investment Income | | Dividends | | | 99,220,609 | | |
| | | Interest | | | 173,922 | | |
| | | Foreign taxes withheld | | | (30,176 | ) | |
| | | Total Investment Income | | | 99,364,355 | | |
| Expenses | | Investment advisory fee | | | 24,307,483 | | |
| | | Administration fee | | | 7,614,544 | | |
| | | Distribution fee: | | | | | |
| | | Class B | | | 399,248 | | |
| | | Class C | | | 1,281,780 | | |
| | | Class R | | | 1,512,389 | | |
| | | Service fee: | | | | | |
| | | Class B | | | 132,843 | | |
| | | Class C | | | 427,024 | | |
| | | Class W | | | 3 | | |
| | | Distribution and service fees: | | | | | |
| | | Class A | | | 3,583,587 | | |
| | | Transfer agent fee: | | | | | |
| | | Class A, Class B, Class C, Class R, Class W, and Class Z | | | 7,175,651 | | |
| | | Class Y | | | 23 | | |
| | | Pricing and bookkeeping fees | | | 141,578 | | |
| | | Trustees' fees | | | 78,684 | | |
| | | Custody fee | | | 106,989 | | |
| | | Registration fees | | | 156,645 | | |
| | | Audit fee | | | 46,885 | | |
| | | Legal fees | | | 48,674 | | |
| | | Reports to shareholders | | | 292,266 | | |
| | | Chief compliance officer expenses | | | 5,030 | | |
| | | Other expenses | | | 148,793 | | |
| | | Total Expenses | | | 47,460,119 | | |
| | | Expense reductions | | | (289 | ) | |
| | | Net Expenses | | | 47,459,830 | | |
| | | Net Investment Income | | | 51,904,525 | | |
| Net Realized and Unrealized Gain (Loss) on Investments and Foreign Currency | | Net realized gain on: | | | | | |
| | | Investments | | | 330,690,724 | | |
| | | Foreign currency transactions | | | 1,343 | | |
| | | Net realized gain | | | 330,692,067 | | |
| | | Net change in unrealized appreciation (depreciation) on investments | | | 792,952,174 | | |
| | | Net Gain | | | 1,123,644,241 | | |
| | | Net Increase Resulting from Operations | | | 1,175,548,766 | | |
(a) Class I and Class W shares commenced operations on September 27, 2010.
See Accompanying Notes to Financial Statements.
14
Statements of Changes in Net Assets – Columbia Mid Cap Value Fund
| | | | | Year Ended February 28, | |
| Increase (Decrease) in Net Assets | | | | 2011 ($) (a)(b) | | 2010 ($) (c)(d) | |
| Operations | | Net investment income | | | 51,904,525 | | | | 30,139,302 | | |
| | | Net realized gain (loss) on investments and foreign
currency transactions | | | 330,692,067 | | | | (299,147,608 | ) | |
| | | Net change in unrealized appreciation (depreciation)
on investments | | | 792,952,174 | | | | 2,039,005,188 | | |
| | | Net increase resulting from operations | | | 1,175,548,766 | | | | 1,769,996,882 | | |
| Distributions to Shareholders | | From net investment income: | | | | | | | | | |
| | | Class A | | | (16,528,260 | ) | | | (9,486,273 | ) | |
| | | Class B | | | (347,528 | ) | | | (118,551 | ) | |
| | | Class C | | | (1,183,149 | ) | | | (283,569 | ) | |
| | | Class I | | | (59,745 | ) | | | — | | |
| | | Class R | | | (2,956,981 | ) | | | (1,055,772 | ) | |
| | | Class W | | | (8 | ) | | | — | | |
| | | Class Y | | | (255 | ) | | | (1,968 | ) | |
| | | Class Z | | | (36,251,311 | ) | | | (19,244,353 | ) | |
| | | From return of capital: | | | | | | | | | |
| | | Class A | | | — | | | | (1,179,530 | ) | |
| | | Class B | | | — | | | | (14,741 | ) | |
| | | Class C | | | — | | | | (35,259 | ) | |
| | | Class R | | | — | | | | (131,276 | ) | |
| | | Class Y | | | — | | | | (245 | ) | |
| | | Class Z | | | — | | | | (2,392,858 | ) | |
| | | Total distributions to shareholders | | | (57,327,237 | ) | | | (33,944,395 | ) | |
| | | Net Capital Stock Transactions | | | (428,527,709 | ) | | | (131,106,499 | ) | |
| | | Increase from regulatory settlements | | | 17,400 | | | | 44,425 | | |
| | | Total increase in net assets | | | 689,711,220 | | | | 1,604,990,413 | | |
| Net Assets | | Beginning of period | | | 4,386,803,391 | | | | 2,781,812,978 | | |
| | | End of period | | | 5,076,514,611 | | | | 4,386,803,391 | | |
| | | Undistributed (overdistributed) net investment income
at end of period | | | 125,040 | | | | (48,094 | ) | |
(a) Class I and Class W shares commenced operations on September 27, 2010.
(b) Class I and Class W shares reflect activity for the period September 27, 2010 through February 28, 2011.
(c) Class Y shares commenced operations on July 15, 2009.
(d) Class Y shares reflect activity for the period July 15, 2009 through February 28, 2010.
See Accompanying Notes to Financial Statements.
15
Statements of Changes in Net Assets (continued) – Columbia Mid Cap Value Fund
| | | Capital Stock Activity | |
| | | Year Ended
February 28, 2011 (a)(b) | | Year Ended
February 28, 2010 (c)(d) | |
| | | Shares | | Dollars ($) | | Shares | | Dollars ($) | |
| Class A | |
| Subscriptions | | | 24,098,682 | | | | 295,808,915 | | | | 34,476,480 | | | | 320,190,001 | | |
| Distributions reinvested | | | 1,205,192 | | | | 14,542,969 | | | | 1,021,407 | | | | 9,544,277 | | |
| Redemptions | | | (48,053,020 | ) | | | (588,007,438 | ) | | | (47,315,899 | ) | | | (451,182,983 | ) | |
| Net decrease | | | (22,749,146 | ) | | | (277,655,554 | ) | | | (11,818,012 | ) | | | (121,448,705 | ) | |
| Class B | |
| Subscriptions | | | 41,301 | | | | 494,268 | | | | 149,471 | | | | 1,317,009 | | |
| Distributions reinvested | | | 23,648 | | | | 276,486 | | | | 13,472 | | | | 120,734 | | |
| Redemptions | | | (3,076,618 | ) | | | (36,566,848 | ) | | | (3,787,390 | ) | | | (35,177,085 | ) | |
| Net decrease | | | (3,011,669 | ) | | | (35,796,094 | ) | | | (3,624,447 | ) | | | (33,739,342 | ) | |
| Class C | |
| Subscriptions | | | 990,308 | | | | 12,037,780 | | | | 1,973,707 | | | | 18,398,360 | | |
| Distributions reinvested | | | 73,776 | | | | 866,581 | | | | 26,638 | | | | 240,612 | | |
| Redemptions | | | (5,192,512 | ) | | | (61,998,199 | ) | | | (6,816,392 | ) | | | (63,647,129 | ) | |
| Net decrease | | | (4,128,428 | ) | | | (49,093,838 | ) | | | (4,816,047 | ) | | | (45,008,157 | ) | |
| Class I (a)(b) | |
| Subscriptions | | | 11,027,366 | | | | 149,685,114 | | | | — | | | | — | | |
| Distributions reinvested | | | 4,539 | | | | 59,734 | | | | — | | | | — | | |
| Redemptions | | | (457,332 | ) | | | (6,244,962 | ) | | | — | | | | — | | |
| Net increase | | | 10,574,573 | | | | 143,499,886 | | | | — | | | | — | | |
| Class R | |
| Subscriptions | | | 10,065,747 | | | | 122,653,544 | | | | 13,682,875 | | | | 137,019,802 | | |
| Distributions reinvested | | | 241,993 | | | | 2,923,279 | | | | 123,314 | | | | 1,166,143 | | |
| Redemptions | | | (11,316,146 | ) | | | (139,432,480 | ) | | | (10,264,977 | ) | | | (99,055,533 | ) | |
| Net increase (decrease) | | | (1,008,406 | ) | | | (13,855,657 | ) | | | 3,541,212 | | | | 39,130,412 | | |
| Class W | |
| Subscriptions | | | 226 | | | | 2,650 | | | | — | | | | — | | |
| Redemptions | | | (12 | ) | | | (153 | ) | | | — | | | | — | | |
| Net increase | | | 214 | | | | 2,497 | | | | — | | | | — | | |
| Class Y | |
| Subscriptions | | | 1,130 | | | | 13,781 | | | | 207,937 | | | | 1,954,982 | | |
| Distributions reinvested | | | 17 | | | | 201 | | | | 7 | | | | 77 | | |
| Redemptions | | | — | | | | — | | | | (206,808 | ) | | | (2,047,085 | ) | |
| Net increase (decrease) | | | 1,147 | | | | 13,982 | | | | 1,136 | | | | (92,026 | ) | |
| Class Z | |
| Subscriptions | | | 55,584,335 | | | | 673,554,891 | | | | 73,875,293 | | | | 704,601,659 | | |
| Distributions reinvested | | | 2,057,565 | | | | 24,860,995 | | | | 1,549,920 | | | | 14,489,725 | | |
| Redemptions | | | (73,199,198 | ) | | | (894,058,817 | ) | | | (71,601,663 | ) | | | (689,040,065 | ) | |
| Net increase (decrease) | | | (15,557,298 | ) | | | (195,642,931 | ) | | | 3,823,550 | | | | 30,051,319 | | |
(a) Class I and Class W shares commenced operations on September 27, 2010.
(b) Class I and Class W shares reflect activity for the period September 27, 2010 through February 28, 2011.
(c) Class Y shares commenced operations on July 15, 2009.
(d) Class Y shares reflect activity for the period July 15, 2009 through February 28, 2010.
See Accompanying Notes to Financial Statements.
16
Financial Highlights – Columbia Mid Cap Value Fund
Selected data for a share outstanding throughout each period is as follows:
| | | Year Ended February 28, | | Year Ended
February 29, | | Period Ended
February 28, | | Year Ended
March 31, | |
| Class A Shares | | 2011 | | 2010 | | 2009 | | 2008 | | 2007 (a) | | 2006 (b) | |
| Net Asset Value, Beginning of Period | | $ | 11.18 | | | $ | 6.87 | | | $ | 13.12 | | | $ | 15.21 | | | $ | 15.01 | | | $ | 14.02 | | |
| Income from Investment Operations: | |
| Net investment income (c) | | | 0.13 | (d) | | | 0.07 | | | | 0.11 | | | | 0.13 | | | | 0.10 | | | | 0.11 | | |
Net realized and unrealized gain (loss)
on investments, foreign currency and
written options | | | 3.07 | | | | 4.32 | | | | (6.25 | ) | | | (1.19 | ) | | | 1.67 | | | | 2.47 | | |
| Total from investment operations | | | 3.20 | | | | 4.39 | | | | (6.14 | ) | | | (1.06 | ) | | | 1.77 | | | | 2.58 | | |
| Less Distributions to Shareholders: | |
| From net investment income | | | (0.14 | ) | | | (0.07 | ) | | | (0.10 | ) | | | (0.16 | ) | | | (0.06 | ) | | | (0.07 | ) | |
| From net realized gains | | | — | | | | — | | | | — | | | | (0.87 | ) | | | (1.51 | ) | | | (1.52 | ) | |
| From return of capital | | | — | | | | (0.01 | ) | | | (0.01 | ) | | | — | | | | — | | | | — | | |
| Total distributions to shareholders | | | (0.14 | ) | | | (0.08 | ) | | | (0.11 | ) | | | (1.03 | ) | | | (1.57 | ) | | | (1.59 | ) | |
| Increase from regulatory settlements | | | — | (e) | | | — | (e) | | | — | | | | — | | | | — | | | | — | | |
| Net Asset Value, End of Period | | $ | 14.24 | | | $ | 11.18 | | | $ | 6.87 | | | $ | 13.12 | | | $ | 15.21 | | | $ | 15.01 | | |
| Total return (f) | | | 28.87 | % | | | 64.09 | % | | | (47.05 | )% | | | (7.88 | )% | | | 13.09 | %(g) | | | 20.24 | % | |
Ratios to Average Net Assets/
Supplemental Data: | |
| Net expenses (h) | | | 1.13 | % | | | 1.17 | % | | | 1.17 | % | | | 1.10 | % | | | 1.12 | %(i) | | | 1.08 | % | |
| Net investment income (h) | | | 1.05 | % | | | 0.71 | % | | | 0.97 | % | | | 0.83 | % | | | 0.76 | %(i) | | | 0.80 | % | |
| Portfolio turnover rate | | | 50 | % | | | 56 | % | | | 46 | % | | | 24 | % | | | 53 | %(g) | | | 41 | % | |
| Net assets, end of period (000s) | | $ | 1,511,519 | | | $ | 1,441,388 | | | $ | 966,440 | | | $ | 1,677,414 | | | $ | 1,296,803 | | | $ | 874,429 | | |
(a) The Fund changed its fiscal year end from March 31 to February 28. Per share data and total return reflect activity from April 1, 2006 through February 28, 2007.
(b) On August 22, 2005, the Fund's Investor A shares were renamed Class A shares.
(c) Per share data was calculated using the average shares outstanding during the period.
(d) Net investment income per share reflects a special dividend. The effect of this dividend amounted to $0.08 per share.
(e) Rounds to less than $0.01 per share.
(f) Total return at net asset value assuming all distributions reinvested and no initial sales charge or contingent deferred sales charge.
(g) Not annualized.
(h) The benefits derived from expense reductions had an impact of less than 0.01%.
(i) Annualized.
See Accompanying Notes to Financial Statements.
17
Financial Highlights – Columbia Mid Cap Value Fund
Selected data for a share outstanding throughout each period is as follows:
| | | Year Ended February 28, | | Year Ended
February 29, | | Period Ended
February 28, | | Year Ended
March 31, | |
| Class B Shares | | 2011 | | 2010 | | 2009 | | 2008 | | 2007 (a) | | 2006 (b) | |
| Net Asset Value, Beginning of Period | | $ | 10.94 | | | $ | 6.73 | | | $ | 12.86 | | | $ | 14.94 | | | $ | 14.80 | | | $ | 13.89 | | |
| Income from Investment Operations: | |
| Net investment income (loss) (c) | | | 0.03 | (d) | | | — | (e) | | | 0.02 | | | | 0.03 | | | | — | (e) | | | 0.01 | | |
Net realized and unrealized gain (loss)
on investments, foreign currency and
written options | | | 3.01 | | | | 4.23 | | | | (6.11 | ) | | | (1.19 | ) | | | 1.65 | | | | 2.43 | | |
| Total from investment operations | | | 3.04 | | | | 4.23 | | | | (6.09 | ) | | | (1.16 | ) | | | 1.65 | | | | 2.44 | | |
| Less Distributions to Shareholders: | |
| From net investment income | | | (0.09 | ) | | | (0.02 | ) | | | (0.03 | ) | | | (0.05 | ) | | | — | (e) | | | (0.01 | ) | |
| From net realized gains | | | — | | | | — | | | | — | | | | (0.87 | ) | | | (1.51 | ) | | | (1.52 | ) | |
| From return of capital | | | — | | | | — | (e) | | | (0.01 | ) | | | — | | | | — | | | | — | | |
| Total distributions to shareholders | | | (0.09 | ) | | | (0.02 | ) | | | (0.04 | ) | | | (0.92 | ) | | | (1.51 | ) | | | (1.53 | ) | |
| Increase from regulatory settlements | | | — | (e) | | | — | (e) | | | — | | | | — | | | | — | | | | — | | |
| Net Asset Value, End of Period | | $ | 13.89 | | | $ | 10.94 | | | $ | 6.73 | | | $ | 12.86 | | | $ | 14.94 | | | $ | 14.80 | | |
| Total return (f) | | | 27.89 | % | | | 62.86 | % | | | (47.41 | )% | | | (8.61 | )% | | | 12.36 | %(g) | | | 19.32 | % | |
Ratios to Average Net Assets/
Supplemental Data: | |
| Net expenses (h) | | | 1.88 | % | | | 1.92 | % | | | 1.92 | % | | | 1.85 | % | | | 1.87 | %(i) | | | 1.84 | % | |
| Net investment income (loss) (h) | | | 0.28 | % | | | (0.01 | )% | | | 0.18 | % | | | 0.18 | % | | | (0.02 | )%(i) | | | 0.05 | % | |
| Portfolio turnover rate | | | 50 | % | | | 56 | % | | | 46 | % | | | 24 | % | | | 53 | %(g) | | | 41 | % | |
| Net assets, end of period (000s) | | $ | 44,651 | | | $ | 68,110 | | | $ | 66,254 | | | $ | 179,087 | | | $ | 255,123 | | | $ | 312,587 | | |
(a) The Fund changed its fiscal year end from March 31 to February 28. Per share data and total return reflect activity from April 1, 2006 through February 28, 2007.
(b) On August 22, 2005, the Portfolio's Investor B shares were renamed Class B shares.
(c) Per share data was calculated using the average shares outstanding during the period.
(d) Net investment income per share reflects a special dividend. The effect of this dividend amounted to $0.08 per share.
(e) Rounds to less than $0.01 per share.
(f) Total return at net asset value assuming all distributions reinvested and no contingent deferred sales charge.
(g) Not annualized.
(h) The benefits derived from expense reductions had an impact of less than 0.01%.
(i) Annualized.
See Accompanying Notes to Financial Statements.
18
Financial Highlights – Columbia Mid Cap Value Fund
Selected data for a share outstanding throughout each period is as follows:
| | | Year Ended February 28, | | Year Ended
February 29, | | Period Ended
February 28, | | Year Ended
March 31, | |
| Class C Shares | | 2011 | | 2010 | | 2009 | | 2008 | | 2007 (a) | | 2006 (b) | |
| Net Asset Value, Beginning of Period | | $ | 10.98 | | | $ | 6.75 | | | $ | 12.90 | | | $ | 14.99 | | | $ | 14.84 | | | $ | 13.93 | | |
| Income from Investment Operations: | |
| Net investment income (loss) (c) | | | 0.04 | (d) | | | — | (e) | | | 0.02 | | | | 0.01 | | | | — | (e) | | | 0.01 | | |
Net realized and unrealized gain (loss)
on investments, foreign currency and
written options | | | 3.01 | | | | 4.25 | | | | (6.13 | ) | | | (1.18 | ) | | | 1.66 | | | | 2.43 | | |
| Total from investment operations | | | 3.05 | | | | 4.25 | | | | (6.11 | ) | | | (1.17 | ) | | | 1.66 | | | | 2.44 | | |
| Less Distributions to Shareholders: | |
| From net investment income | | | (0.09 | ) | | | (0.02 | ) | | | (0.03 | ) | | | (0.05 | ) | | | — | (e) | | | (0.01 | ) | |
| From net realized gains | | | — | | | | — | | | | — | | | | (0.87 | ) | | | (1.51 | ) | | | (1.52 | ) | |
| From return of capital | | | — | | | | — | (e) | | | (0.01 | ) | | | — | | | | — | | | | — | | |
| Total distributions to shareholders | | | (0.09 | ) | | | (0.02 | ) | | | (0.04 | ) | | | (0.92 | ) | | | (1.51 | ) | | | (1.53 | ) | |
| Increase from regulatory settlements | | | — | (e) | | | — | (e) | | | — | | | | — | | | | — | | | | — | | |
| Net Asset Value, End of Period | | $ | 13.94 | | | $ | 10.98 | | | $ | 6.75 | | | $ | 12.90 | | | $ | 14.99 | | | $ | 14.84 | | |
| Total return (f) | | | 27.88 | % | | | 62.97 | % | | | (47.42 | )% | | | (8.65 | )% | | | 12.40 | %(g) | | | 19.25 | % | |
Ratios to Average Net Assets/
Supplemental Data: | |
| Net expenses (h) | | | 1.88 | % | | | 1.92 | % | | | 1.92 | % | | | 1.85 | % | | | 1.87 | %(i) | | | 1.84 | % | |
| Net investment income (loss) (h) | | | 0.30 | % | | | (0.03 | )% | | | 0.19 | % | | | 0.07 | % | | | 0.03 | %(i) | | | 0.05 | % | |
| Portfolio turnover rate | | | 50 | % | | | 56 | % | | | 46 | % | | | 24 | % | | | 53 | %(g) | | | 41 | % | |
| Net assets, end of period (000s) | | $ | 173,457 | | | $ | 181,941 | | | $ | 144,370 | | | $ | 318,190 | | | $ | 249,067 | | | $ | 123,789 | | |
(a) The Fund changed its fiscal year end from March 31 to February 28. Per share data and total return reflect activity from April 1, 2006 through February 28, 2007.
(b) On August 22, 2005, the Portfolio's Investor C shares were renamed Class C shares.
(c) Per share data was calculated using the average shares outstanding during the period.
(d) Net investment income per share reflects a special dividend. The effect of this dividend amounted to $0.08 per share.
(e) Rounds to less than $0.01 per share.
(f) Total return at net asset value assuming all distributions reinvested and no contingent deferred sales charge.
(g) Not annualized.
(h) The benefits derived from expense reductions had an impact of less than 0.01%.
(i) Annualized.
See Accompanying Notes to Financial Statements.
19
Financial Highlights – Columbia Mid Cap Value Fund
Selected data for a share outstanding throughout the period is as follows:
| Class I Shares | | Period Ended
February 28,
2011 (a) | |
| Net Asset Value, Beginning of Period | | $ | 11.68 | | |
| Income from Investment Operations: | |
| Net investment income (b) | | | 0.03 | | |
| Net realized and unrealized gain on investments and foreign currency | | | 2.58 | | |
| Total from investment operations | | | 2.61 | | |
| Less Distributions to Shareholders: | |
| From net investment income | | | (0.05 | ) | |
| Net Asset Value, End of Period | | $ | 14.24 | | |
| Total return (c)(d) | | | 22.40 | % | |
| Ratios to Average Net Assets/Supplemental Data: | |
| Net expenses (e)(f) | | | 0.72 | % | |
| Net investment income (e)(f) | | | 0.53 | % | |
| Portfolio turnover rate (d) | | | 50 | % | |
| Net assets, end of period (000s) | | $ | 150,603 | | |
(a) Class I shares commenced operations on September 27, 2010. Per share data and total return reflect activity from that date.
(b) Per share data was calculated using the average shares outstanding during the period.
(c) Total return at net asset value assuming all distributions reinvested.
(d) Not annualized.
(e) Annualized.
(f) The benefits derived from expense reductions had an impact of less than 0.01%.
See Accompanying Notes to Financial Statements.
20
Financial Highlights – Columbia Mid Cap Value Fund
Selected data for a share outstanding throughout each period is as follows:
| | | Year Ended February 28, | | Year Ended
February 29, | | Period Ended
February 28, | | Period Ended
March 31, | |
| Class R Shares | | 2011 | | 2010 | | 2009 | | 2008 | | 2007 (a) | | 2006 (b) | |
| Net Asset Value, Beginning of Period | | $ | 11.18 | | | $ | 6.87 | | | $ | 13.11 | | | $ | 15.21 | | | $ | 15.01 | | | $ | 14.25 | | |
| Income from Investment Operations: | |
| Net investment income (c) | | | 0.10 | (d) | | | 0.04 | | | | 0.09 | | | | 0.05 | | | | 0.08 | | | | 0.01 | | |
Net realized and unrealized gain (loss)
on investments, foreign currency and
written options | | | 3.07 | | | | 4.33 | | | | (6.24 | ) | | | (1.16 | ) | | | 1.66 | | | | 0.75 | | |
| Total from investment operations | | | 3.17 | | | | 4.37 | | | | (6.15 | ) | | | (1.11 | ) | | | 1.74 | | | | 0.76 | | |
| Less Distributions to Shareholders: | |
| From net investment income | | | (0.12 | ) | | | (0.05 | ) | | | (0.08 | ) | | | (0.12 | ) | | | (0.03 | ) | | | — | (e) | |
| From net realized gains | | | — | | | | — | | | | — | | | | (0.87 | ) | | | (1.51 | ) | | | — | | |
| From return of capital | | | — | | | | (0.01 | ) | | | (0.01 | ) | | | — | | | | — | | | | — | | |
| Total distributions to shareholders | | | (0.12 | ) | | | (0.06 | ) | | | (0.09 | ) | | | (0.99 | ) | | | (1.54 | ) | | | — | (e) | |
| Increase from regulatory settlements | | | — | (e) | | | — | (e) | | | — | | | | — | | | | — | | | | — | | |
| Net Asset Value, End of Period | | $ | 14.23 | | | $ | 11.18 | | | $ | 6.87 | | | $ | 13.11 | | | $ | 15.21 | | | $ | 15.01 | | |
| Total return (f) | | | 28.53 | % | | | 63.69 | % | | | (47.13 | )% | | | (8.17 | )% | | | 12.86 | %(g) | | | 5.36 | %(g) | |
Ratios to Average Net Assets/
Supplemental Data: | |
| Net expenses (h) | | | 1.38 | % | | | 1.42 | % | | | 1.42 | % | | | 1.35 | % | | | 1.37 | %(i) | | | 1.44 | %(i) | |
| Net investment income (h) | | | 0.80 | % | | | 0.44 | % | | | 0.94 | % | | | 0.35 | % | | | 0.61 | %(i) | | | 0.44 | %(i) | |
| Portfolio turnover rate | | | 50 | % | | | 56 | % | | | 46 | % | | | 24 | % | | | 53 | %(g) | | | 41 | %(g) | |
| Net assets, end of period (000s) | | $ | 337,001 | | | $ | 276,046 | | | $ | 145,227 | | | $ | 46,252 | | | $ | 7,337 | | | $ | 10 | | |
(a) The Fund changed its fiscal year end from March 31 to February 28. Per share data and total return reflect activity from April 1, 2006 through February 28, 2007.
(b) The Fund's Class R shares commenced operations on January 23, 2006. Per share data and total return reflect activity from that date.
(c) Per share data was calculated using the average shares outstanding during the period.
(d) Net investment income per share reflects a special dividend. The effect of this dividend amounted to $0.08 per share.
(e) Rounds to less than $0.01 per share.
(f) Total return at net asset value assuming all distributions reinvested.
(g) Not annualized.
(h) The benefits derived from expense reductions had an impact of less than 0.01%.
(i) Annualized.
See Accompanying Notes to Financial Statements.
21
Financial Highlights – Columbia Mid Cap Value Fund
Selected data for a share outstanding throughout the period is as follows:
| Class W Shares | | Period Ended
February 28,
2011 (a) | |
| Net Asset Value, Beginning of Period | | $ | 11.69 | | |
| Income from Investment Operations: | |
| Net investment income (b) | | | 0.02 | | |
| Net realized and unrealized gain on investments and foreign currency | | | 2.57 | | |
| Total from investment operations | | | 2.59 | | |
| Less Distributions to Shareholders: | |
| From net investment income | | | (0.04 | ) | |
| Net Asset Value, End of Period | | $ | 14.24 | | |
| Total return (c)(d) | | | 22.17 | % | |
| Ratios to Average Net Assets/Supplemental Data: | |
| Net expenses (e)(f) | | | 1.14 | % | |
| Net investment income (e)(f) | | | 0.34 | % | |
| Portfolio turnover rate (d) | | | 50 | % | |
| Net assets, end of period (000s) | | $ | 3 | | |
(a) Class W shares commenced operations on September 27, 2010. Per share data and total return reflect activity from that date.
(b) Per share data was calculated using the average shares outstanding during the period.
(c) Total return at net asset value assuming all distributions reinvested.
(d) Not annualized.
(e) Annualized.
(f) The benefits derived from expense reductions had an impact of less than 0.01%.
See Accompanying Notes to Financial Statements.
22
Financial Highlights – Columbia Mid Cap Value Fund
Selected data for a share outstanding throughout each period is as follows:
| Class Y Shares | | Year Ended
February 28,
2011 | | Period Ended
February 28,
2010 (a) | |
| Net Asset Value, Beginning of Period | | $ | 11.18 | | | $ | 8.86 | | |
| Income from Investment Operations: | |
| Net investment income (b) | | | 0.16 | (c) | | | 0.08 | | |
| Net realized and unrealized gain on investments and foreign currency | | | 3.08 | | | | 2.31 | | |
| Total from investment operations | | | 3.24 | | | | 2.39 | | |
| Less Distributions to Shareholders: | |
| From net investment income | | | (0.18 | ) | | | (0.06 | ) | |
| From return of capital | | | — | | | | (0.01 | ) | |
| Total distributions to shareholders | | | (0.18 | ) | | | (0.07 | ) | |
| Increase from regulatory settlements (d) | | | — | | | | — | | |
| Net Asset Value, End of Period | | $ | 14.24 | | | $ | 11.18 | | |
| Total return (e) | | | 29.23 | % | | | 27.00 | %(f) | |
| Ratios to Average Net Assets/Supplemental Data: | |
| Net expenses (g) | | | 0.81 | % | | | 0.76 | %(h) | |
| Net investment income (g) | | | 1.25 | % | | | 1.28 | %(h) | |
| Portfolio turnover rate | | | 50 | % | | | 56 | %(f) | |
| Net assets, end of period (000s) | | $ | 33 | | | $ | 13 | | |
(a) Class Y shares commenced operations on July 15, 2009. Per share data and total return reflect activity from that date.
(b) Per share data was calculated using the average shares outstanding during the period.
(c) Net investment income per share reflects a special dividend. The effect of this dividend amounted to $0.08 per share.
(d) Rounds to less than $0.01 per share.
(e) Total return at net asset value assuming all distributions reinvested.
(f) Not annualized.
(g) The benefits derived from expense reductions had an impact of less than 0.01%.
(h) Annualized.
See Accompanying Notes to Financial Statements.
23
Financial Highlights – Columbia Mid Cap Value Fund
Selected data for a share outstanding throughout each period is as follows:
| | | Year Ended February 28, | | Year Ended
February 29, | | Period Ended
February 28, | | Year Ended
March 31, | |
| Class Z Shares | | 2011 | | 2010 | | 2009 | | 2008 | | 2007 (a) | | 2006 (b) | |
| Net Asset Value, Beginning of Period | | $ | 11.20 | | | $ | 6.88 | | | $ | 13.13 | | | $ | 15.23 | | | $ | 15.03 | | | $ | 14.04 | | |
| Income from Investment Operations: | |
| Net investment income (c) | | | 0.16 | (d) | | | 0.09 | | | | 0.14 | | | | 0.17 | | | | 0.13 | | | | 0.13 | | |
Net realized and unrealized gain (loss)
on investments, foreign currency and
written options | | | 3.07 | | | | 4.33 | | | | (6.25 | ) | | | (1.21 | ) | | | 1.68 | | | | 2.49 | | |
| Total from investment operations | | | 3.23 | | | | 4.42 | | | | (6.11 | ) | | | (1.04 | ) | | | 1.81 | | | | 2.62 | | |
| Less Distributions to Shareholders: | |
| From net investment income | | | (0.17 | ) | | | (0.09 | ) | | | (0.13 | ) | | | (0.19 | ) | | | (0.10 | ) | | | (0.11 | ) | |
| From net realized gains | | | — | | | | — | | | | — | | | | (0.87 | ) | | | (1.51 | ) | | | (1.52 | ) | |
| From return of capital | | | — | | | | (0.01 | ) | | | (0.01 | ) | | | — | | | | — | | | | — | | |
| Total distributions to shareholders | | | (0.17 | ) | | | (0.10 | ) | | | (0.14 | ) | | | (1.06 | ) | | | (1.61 | ) | | | (1.63 | ) | |
| Increase from regulatory settlements | | | — | (e) | | | — | (e) | | | — | | | | — | | | | — | | | | — | | |
| Net Asset Value, End of Period | �� | $ | 14.26 | | | $ | 11.20 | | | $ | 6.88 | | | $ | 13.13 | | | $ | 15.23 | | | $ | 15.03 | | |
| Total return (f) | | | 29.14 | % | | | 64.55 | % | | | (46.87 | )% | | | (7.70 | )% | | | 13.36 | %(g) | | | 20.49 | % | |
Ratios to Average Net Assets/
Supplemental Data: | |
| Net expenses (h) | | | 0.88 | % | | | 0.92 | % | | | 0.92 | % | | | 0.85 | % | | | 0.87 | %(i) | | | 0.84 | % | |
| Net investment income (h) | | | 1.30 | % | | | 0.95 | % | | | 1.23 | % | | | 1.10 | % | | | 1.00 | %(i) | | | 0.94 | % | |
| Portfolio turnover rate | | | 50 | % | | | 56 | % | | | 46 | % | | | 24 | % | | | 53 | %(g) | | | 41 | % | |
| Net assets, end of period (000s) | | $ | 2,859,249 | | | $ | 2,419,305 | | | $ | 1,459,522 | | | $ | 2,109,483 | | | $ | 1,758,133 | | | $ | 1,415,664 | | |
(a) The Fund changed its fiscal year end from March 31 to February 28. Per share data and total return reflect activity from April 1, 2006 through February 28, 2007.
(b) On August 22, 2005, the Fund's Primary A shares were renamed Class Z shares.
(c) Per share data was calculated using the average shares outstanding during the period.
(d) Net investment income per share reflects a special dividend. The effect of this dividend amounted to $0.08 per share.
(e) Rounds to less than $0.01 per share.
(f) Total return at net asset value assuming all distributions reinvested.
(g) Not annualized.
(h) The benefits derived from expense reductions had an impact of less than 0.01%.
(i) Annualized.
See Accompanying Notes to Financial Statements.
24
Notes to Financial Statements – Columbia Mid Cap Value Fund
February 28, 2011
Note 1. Organization
Columbia Mid Cap Value Fund (the Fund), a series of Columbia Funds Series Trust (the Trust), is a diversified fund. The Trust is registered under the Investment Company Act of 1940, as amended (the 1940 Act), as an open-end management investment company organized as a Delaware statutory trust.
After the close of business on April 30, 2010, Ameriprise Financial, Inc. (Ameriprise Financial) acquired a portion of the asset management business of Columbia Management Group, LLC (the Transaction), including the business of managing the Fund. In connection with the closing of the Transaction (the Closing), RiverSource Investments, LLC, a wholly owned subsidiary of Ameriprise Financial, became the investment manager of the Fund and changed its name to Columbia Management Investment Advisers, LLC (the Investment Manager).
Investment Objective
The Fund seeks long-term capital appreciation.
Fund Shares
The Trust has unlimited authorized shares of beneficial interest. The Fund offers Class A, Class B, Class C, Class I, Class R, Class W, Class Y and Class Z shares. On December 17, 2010, the Investment Manager exchanged Class Z shares valued at $60,923,362 for Class I shares. The Fund is also authorized to issue Class R4 shares, however this share class is not currently offered for sale. All share classes have identical voting, dividend and liquidation rights. Each share class has its own expense structure and sales charges, as applicable.
Class A shares are subject to a maximum front-end sales charge of 5.75% based on the investment amount. Class A shares purchased without an initial sales charge in accounts aggregating $1 million to $50 million at the time of purchase are subject to a 1.00% contingent deferred sales charge (CDSC) if the shares are sold within 18 months of purchase, charged as follows: 1.00% CDSC if redeemed within 12 months of purchase, and 0.50% CDSC if redeemed more than 12, but less than 18 months after purchase.
The Fund no longer accepts investments by new or existing investors in the Fund's Class B shares, except in connection with the reinvestment of any dividend and/or capital gain distributions in Class B shares of the Fund and exchanges by existing Class B shareholders of certain other funds within the Columbia Family of Funds. Class B shares may be subject to a maximum CDSC of 5.00% based upon the holding period after purchase. Class B shares will generally convert to Class A shares eight years after purchase.
Class C shares are subject to a 1.00% CDSC on shares redeemed within one year of purchase.
Class I shares are not subject to sales charges and are available only to the Columbia Family of Funds. Class I shares became effective September 27, 2010.
Class R shares are not subject to sales charges and are available only to qualifying institutional investors.
Class W shares are not subject to sales charges and are available only to investors purchasing through authorized investment programs managed by investment professionals, including discretionary managed account programs. Class W shares became effective September 27, 2010.
Class Y shares are not subject to sales charges and are available only to certain investors, as described in the Fund's prospectus.
Class Z shares are not subject to sales charges and are available only to certain investors, as described in the Fund's prospectus.
Note 2. Summary of Significant Accounting Policies
The preparation of financial statements in accordance with U.S. generally accepted accounting principles (GAAP) requires the Investment Manager to make certain estimates and assumptions that affect the reported amounts of assets and liabilities, the disclosure of contingent assets and liabilities at the date of the financial statements and the reported amounts of revenue and expenses during the reporting period. Actual results could differ from those estimates.
The following is a summary of significant accounting policies consistently followed by the Fund in the preparation of its financial statements.
Security Valuation
Equity securities are valued at the last sale price on the principal exchange on which they trade, except for securities traded on the NASDAQ, which are valued at the NASDAQ official close price. Unlisted securities or listed securities for which there were no sales during the day are valued at the closing bid price on such exchanges or over-the-counter markets.
Short-term investments maturing in 60 days or less are valued at amortized cost, which approximates market value.
Investments for which market quotations are not readily available, or that have quotations which the Investment Manager believes are not reliable, are valued at fair value as determined in good faith under consistently applied procedures established by and under the general
25
Columbia Mid Cap Value Fund, February 28, 2011
supervision of the Board of Trustees. If a security is valued at fair value, such value is likely to be different from the last quoted market price for the security. The determination of fair value often requires significant judgment. To determine fair value, the Investment Manager may use assumptions including but not limited to future cash flows and estimated risk premiums. Multiple inputs from various sources may be used to determine value.
Repurchase Agreements
The Fund may engage in repurchase agreement transactions with institutions that the Investment Manager has determined are creditworthy. The Fund, through the custodian, receives delivery of the underlying securities collateralizing a repurchase agreement. The Investment Manager is responsible for determining that the collateral is at least equal, at all times, to the value of the repurchase obligation including interest. A repurchase agreement transaction involves certain risks in the event of default or insolvency of the counterparty. These risks include possible delays in or restrictions on the Fund's ability to dispose of the underlying securities and a possible decline in the value of the underlying securities during the period while the Fund seeks to assert its rights.
Security Transactions
Security transactions are accounted for on the trade date. Cost is determined and gains (losses) are based upon the specific identification method for both financial statement and federal income tax purposes.
Income Recognition
Interest income is recorded on the accrual basis. Market premium and discount are amortized and accreted, respectively, on all debt securities, unless otherwise noted. Original issue discount is accreted to interest income over the life of the security with a corresponding increase in the cost basis, if any.
Awards from class action litigation are recorded as a reduction of cost if the Fund still owns the applicable securities on the payment date. If the Fund no longer owns the applicable securities, the proceeds are recorded as realized gains.
Corporate actions and dividend income are recorded on the ex-date.
The Fund receives information regarding the character of distributions received from real estate investment trusts (REITs) on an annual basis. Distributions received from REITs are allocated among dividend income, capital gain and return of capital based upon such information or based on management's estimates if actual information has not yet been reported. Management's estimates are subsequently adjusted when the actual character of the distributions are disclosed by the REITs which could result in a proportionate increase in returns of capital to shareholders.
Distributions received from REITs in excess of their income are recorded as a reduction of the cost of the related investments. If the Fund no longer owns the applicable securities, any distributions received in excess of income are recorded as realized gains.
Expenses
General expenses of the Trust are allocated to the Fund and other series of the Trust based upon relative net assets or other expense allocation methodologies determined by the nature of the expense. Expenses directly attributable to a specific class of shares are charged to that share class. Expenses directly attributable to the Fund are charged to the Fund.
Determination of Class Net Asset Value
All income, expenses (other than class-specific expenses which are charged directly to a share class, as shown in the Statement of Operations) and realized and unrealized gains (losses) are allocated to each class of the Fund on a daily basis, based on the relative net assets of each, for purposes of determining the net asset value of each class.
Federal Income Tax Status
The Fund intends to qualify each year as a regulated investment company under Subchapter M of the Internal Revenue Code, as amended, and will distribute substantially all of its taxable income, if any, for its tax year, and as such will not be subject to federal income taxes. In addition, the Fund intends to distribute in each calendar year substantially all of its net investment income, capital gains and certain other amounts, if any, such that the Fund should not be subject to federal excise tax. Therefore, no federal income or excise tax provision is recorded.
Distributions to Shareholders
Distributions from net investment income are declared and paid quarterly. Net realized capital gains, if any, are distributed at least annually. Income distributions and capital gain distributions are determined in accordance with federal income tax regulations which may differ from GAAP.
26
Columbia Mid Cap Value Fund, February 28, 2011
Indemnification
In the normal course of business, the Fund enters into contracts that contain a variety of representations and warranties and which provide general indemnities. The Fund's maximum exposure under these arrangements is unknown because this would involve future claims against the Fund. Also, under the Trust's organizational documents and by contract, the Trustees and officers of the Trust are indemnified against certain liabilities that may arise out of actions relating to their duties to the Trust. However, based on experience, the Fund expects the risk of loss due to these representations, warranties and indemnities to be minimal.
Note 3. Fees and Compensation Paid to Affiliates
Investment Management Services Fee
The Investment Manager determines which securities will be purchased, held or sold. The management fee is based on the Fund's average daily net assets at the following annual rates:
| Average Daily Net Assets | | Annual Fee Rate | |
| First $500 million | | | 0.65 | % | |
| $500 million to $1 billion | | | 0.60 | % | |
| $1 billion to $1.5 billion | | | 0.55 | % | |
| Over $1.5 billion | | | 0.50 | % | |
Prior to the Closing, Columbia Management Advisors, LLC (Columbia), an indirect, wholly owned subsidiary of Bank of America Corporation (BOA), provided investment management services to the Fund under the same fee structure.
The effective management fee rate for the year ended February 28, 2011, was 0.53% of the Fund's average daily net assets.
Administration Fee
Effective upon the Closing, the Investment Manager became the administrator of the Fund and provides administrative and other services to the Fund, including services previously performed under the Pricing and Bookkeeping Oversight and Services Agreement discussed below. The administration fee is based on the annual rate of 0.17% of the Fund's average daily net assets, less the fees payable by the Fund as described under the Pricing and Bookkeeping Fees note below. Prior to the Closing, Columbia provided administrative services to the Fund at the same fee rate.
Pricing and Bookkeeping Fees
Prior to the Closing, the Fund entered into a Financial Reporting Services Agreement (the Financial Reporting Services Agreement) with State Street Bank and Trust Company (State Street) and Columbia pursuant to which State Street provides financial reporting services to the Fund. The Fund also entered into an Accounting Services Agreement (collectively with the Financial Reporting Services Agreement, the State Street Agreements) with State Street and Columbia pursuant to which State Street provides accounting services to the Fund. Upon the Closing, Columbia assigned and delegated its rights and obligations under the State Street Agreements to the Investment Manager. Under the State Street Agreements, the Fund pays State Street an annual fee of $38,000 paid monthly plus an additional monthly fee based on an annualized percentage rate of average daily net assets of the Fund for the month. The aggregate fee will not exceed $140,000 per year (exclusive of out-of-pocket expenses and charges). The Fund also reimburses State Street for certain out-of-pocket expenses and charges.
Also prior to the Closing, the Fund entered into a Pricing and Bookkeeping Oversight and Services Agreement (the Services Agreement) with Columbia. Under the Services Agreement, Columbia provided services related to Fund expenses and the requirements of the Sarbanes-Oxley Act of 2002, and provided oversight of the accounting and financial reporting services provided by State Street. Under the Services Agreement, the Fund reimbursed Columbia for out-of-pocket expenses and charges, including fees payable to third parties, such as for pricing the Fund's portfolio securities, incurred by Columbia in the performance of services under the Services Agreement. The Services Agreement was terminated upon the Closing. These services are now provided under the Administration Fee note discussed above.
Transfer Agent Fee
In connection with the Closing, RiverSource Service Corporation, a wholly owned subsidiary of Ameriprise Financial, became the transfer agent of the Fund and changed its name to Columbia Management Investment Services Corp. (the New Transfer Agent). The New Transfer Agent has contracted with Boston Financial Data Services (BFDS) to serve as sub-transfer agent. The New Transfer Agent receives monthly account-based service fees that vary by class and are based on the number of open accounts and asset-based fees, calculated based on assets held in omnibus accounts, which are intended to reimburse the New Transfer Agent for certain sub-transfer agent fees (exclusive of BFDS fees). The New Transfer
27
Columbia Mid Cap Value Fund, February 28, 2011
Agent pays the fees of BFDS for services as sub-transfer agent and is not entitled to reimbursement for such fees from the Fund.
The New Transfer Agent receives reimbursement for certain out-of-pocket expenses and may also receive compensation for various shareholder services.
Prior to the Closing, Columbia Management Services, Inc., an affiliate of Columbia and an indirect, wholly owned subsidiary of BOA, provided shareholder services to the Fund and contracted with BFDS to serve as sub-transfer agent, under the same fee structure.
For the year ended February 28, 2011, the Fund's effective transfer agent fee rate for each class, with the exception of Class I shares, as a percentage of the average daily net assets was as follows
| Class A | | Class B | | Class C | | Class R | | Class W | | Class Y | | Class Z | |
| | 0.16 | % | | | 0.16 | % | | | 0.16 | % | | | 0.16 | % | | | 0.16 | % | | | 0.12 | % | | | 0.16 | % | |
Class I shares do not pay transfer agent fees.
An annual minimum account balance fee of $20 may apply to certain accounts with a value below the Fund's initial minimum investment requirements to reduce the impact of small accounts on transfer agent fees. These minimum account balance fees are recorded as part of expense reductions on the Statement of Operations. For the year ended February 28, 2011, no minimum account balance fees were charged by the Fund.
Underwriting Discounts, Service and Distribution Fees
In connection with the Closing, RiverSource Fund Distributors, Inc., an indirect wholly owned subsidiary of Ameriprise Financial, became the distributor of the Fund and changed its name to Columbia Management Investment Distributors, Inc. (the New Distributor).
For the year ended February 28, 2011, initial sales charges paid by shareholders on the purchase of Class A shares amounted to $33,695 and net CDSC fees paid by shareholders on certain redemptions of Class A, Class B and Class C shares amounted to $4,114, $56,082 and $9,853, respectively.
The Trust has adopted shareholder servicing plans and distribution plans for the Class B, Class C and Class W shares of the Fund and a combined distribution and shareholder servicing plan for the Class A shares of the Fund. The Trust has also adopted a distribution plan for the Class R shares of the Fund. The shareholder servicing plans permit the Fund to compensate or reimburse servicing agents for the shareholder services they have provided. The distribution plans, adopted pursuant to Rule 12b-1 under the 1940 Act, permit the Fund to compensate or reimburse the New Distributor and/or selling agents for activities or expenses primarily intended to result in the sale of the classes' shares. Payments are made at an annual rate and paid monthly, as a percentage of average daily net assets, set from time to time by the Board of Trustees, and are charged as expenses of the Fund directly to the applicable share class. A substantial portion of the expenses incurred pursuant to these plans is paid to affiliates of the New Distributor.
The annual rates in effect and plan limits, as a percentage of average daily net assets are as follows:
| | | Current
Rate | | Plan
Limit | |
Class A Combined Distribution
and Shareholder Servicing Plan | | | 0.25 | % | | | 0.25 | % | |
Class B and Class C Shareholder
Servicing Plans | | | 0.25 | % | | | 0.25 | % | |
Class B and Class C
Distribution Plans | | | 0.75 | % | | | 0.75 | % | |
| Class R Distribution Plan | | | 0.50 | % | | | 0.50 | % | |
| Class W Shareholder Servicing Plan | | | 0.25 | % | | | 0.25 | %1 | |
| Class W Distribution Plan | | | 0.00 | % | | | 0.25 | %1 | |
1 The Fund may pay a distribution fee of up to 0.25% of the Fund's average daily net assets attributable to Class W shares and a service fee of up to 0.25% of the Fund's average daily net assets attributable to Class W shares, provided, however, that the aggregate fee shall not exceed 0.25% of the Fund's average daily net assets attributable to Class W shares.
Prior to the Closing, Columbia Management Distributors, Inc, an affiliate of Columbia and an indirect, wholly owned subsidiary of BOA, was the principal underwriter of the Fund's shares. There were no changes to the underwriting discount structure of the Fund or the service or distribution fee rates paid by the Fund as a result of the Transaction.
Expense Limits and Fee Waivers
Effective September 27, 2010, the Investment Manager has voluntarily agreed to reimburse a portion of the Fund's expenses so that the Fund's ordinary operating expenses (excluding any brokerage commissions, interest, taxes and extraordinary expenses, but including custodian charges relating to overdrafts, if any), after giving effect to any balance credits from the Fund's custodian, do not exceed the annual rates of 1.30%, 2.05%, 2.05%, 0.91%, 1.55%, 1.30%, 1.05% and 1.05% of the Fund's average daily net assets
28
Columbia Mid Cap Value Fund, February 28, 2011
attributable to Class A, Class B, Class C, Class I, Class R, Class W, Class Y and Class Z shares, respectively. This arrangement may be modified or terminated by the Investment Manager at any time.
For the period May 1, 2010 through September 26, 2010, the Investment Manager voluntarily agreed to reimburse a portion of the Fund's expenses so that the Fund's ordinary operating expenses (excluding any distribution and service fees, brokerage commissions, interest, taxes and extraordinary expenses, but including custodian charges relating to overdrafts, if any), after giving effect to any balance credits from the Fund's custodian, did not exceed 1.05% annually of the Fund's average daily net assets. Prior to May 1, 2010, Columbia voluntarily reimbursed a portion of the Fund's expenses in the same manner.
Effective April 30, 2011, the Investment Manager and certain affiliates have contractually agreed to waive fees or reimburse expenses through June 30, 2012, so that the Fund's ordinary operating expenses (excluding certain expenses, such as transaction costs and brokerage commissions, interest, taxes, acquired fund fees and expenses, and extraordinary expenses, if any), after giving effect to any balance credits or overdraft charges from the Fund's custodian, do not exceed the annual rates of 1.19%, 1.94%, 1.94%, 0.80%, 1.44%, 1.19%, 0.94% and 0.94% of the Fund's average daily net assets attributable to Class A, Class B, Class C, Class I, Class R, Class W, Class Y and Class Z shares, respectively. This expense arrangement is made pursuant to a fee waiver and expense cap agreement that my be modified or amended only with the approval from all parties to such arrangements, including the Fund and the Investment Manager.
Fees Paid to Officers and Trustees
In connection with the Closing, all officers of the Fund are employees of the Investment Manager or its affiliates and, with the exception of the Fund's Chief Compliance Officer, receive no compensation from the Fund. The Board of Trustees has appointed a Chief Compliance Officer to the Fund in accordance with federal securities regulations. The Fund, along with other affiliated funds, pays its pro-rata share of the expenses associated with the Chief Compliance Officer. The Fund's expenses for the Chief Compliance Officer will not exceed $15,000 per year. Prior to the Closing, all officers of the Fund were employees of Columbia or its affiliates and the Fund paid its pro-rata share of the expenses for the Chief Compliance Officer under the same fee structure.
Trustees are compensated for their services to the Fund, as set forth on the Statement of Operations. The Trust's eligible Trustees may participate in a non-qualified deferred compensation plan which may be terminated at any time. Any payments to plan participants are paid solely out of the Fund's assets. Income earned on the plan participant's deferral account is based on the rate of return of the eligible mutual funds selected by the participant or, if no funds are selected, on the rate of return of Columbia Money Market Fund (formerly known as RiverSource Cash Management Fund). Prior to the Closing, if no funds were selected, income earned on the plan participant's deferral account was based on the rate of return of BofA Treasury Reserves. Trustees' fees deferred during the current period as well as any gains or losses on the trustees' deferred compensation balances as a result of market fluctuations are included in "Trustees' fees" on the Statement of Operations. Liabilities under the deferred compensation plan are included in "Trustees' fees" on the Statement of Assets and Liabilities.
Other Related Party Transactions
Prior to the Closing, the Fund used one or more brokers that were affiliates of BOA in connection with the purchase and sale of its securities. Total brokerage commissions paid to affiliated brokers for the period prior to the Closing were $11,204.
Note 4. Custody Credits
The Fund has an agreement with its custodian bank under which custody fees may be reduced by balance credits. These credits are recorded as part of expense reductions on the Statement of Operations. The Fund could have invested a portion of the assets utilized in connection with the expense offset arrangement in an income-producing asset if it had not entered into such an agreement. For the year ended February 28, 2011, these custody credits reduced total expenses by $289 for the Fund.
Note 5. Portfolio Information
The cost of purchases and proceeds from sales of securities, excluding short-term obligations, aggregated $2,222,660,861 and $2,775,134,152, respectively, for the year ended February 28, 2011.
Note 6. Regulatory Settlements
During the year ended February 28, 2011, and the year ended February 28, 2010, the Fund received payments totaling $17,400 and $44,425, respectively, resulting from certain regulatory settlements in which the Fund had participated during the respective periods.
29
Columbia Mid Cap Value Fund, February 28, 2011
The payments have been included in "Increase from regulatory settlements" in the Statement of Changes in Net Assets.
Note 7. Shareholder Concentration
As of February 28, 2011, two shareholder accounts owned 20.2% of the outstanding shares of the Fund. Purchase and redemption activity of these accounts may have a significant effect on the operations of the Fund.
Note 8. Line of Credit
The Fund and other affiliated funds participate in a $280,000,000 committed, unsecured revolving line of credit provided by State Street. The maximum amount that may be borrowed by any fund is limited to the lesser of $200,000,000 and the Fund's borrowing limit set forth in the Fund's registration statement. Borrowings are available for short-term liquidity or temporary or emergency purposes.
Effective October 14, 2010, interest is charged to each participating fund based on the fund's borrowings at a rate per annum equal to the greater of the Federal Funds Rate plus 1.25% or the overnight LIBOR Rate plus 1.25%. In addition, a commitment fee of 0.125% per annum is accrued and apportioned among the participating funds pro rata based on their relative net assets.
Prior to October 14, 2010, interest was charged to each participating fund at the same rates. In addition, a commitment fee of 0.15% per annum was accrued and apportioned among the participating funds pro rata based on their relative net assets.
For the year ended February 28, 2011, the Fund did not borrow under these arrangements.
Note 9. Federal Tax Information
The timing and character of income and capital gain distributions are determined in accordance with income tax regulations, which may differ from GAAP. Reclassifications are made to the Fund's capital accounts for permanent tax differences to reflect income and gains available for distribution (or available capital loss carryforwards) under income tax regulations.
For the year ended February 28, 2011, permanent book and tax basis differences resulting primarily from differing treatments for excess distributions, proceeds from litigation settlements, foreign currency transactions and non-taxable dividends were identified and reclassified among the components of the Fund's net assets as follows:
Undistributed
Net Investment
Income | | Accumulated
Net Realized
Loss | | Paid-In Capital | |
| $ | 5,595,846 | | | $ | 110,489 | | | $ | (5,706,335 | ) | |
Net investment income and net realized gains (losses), as disclosed on the Statement of Operations, and net assets were not affected by this reclassification.
The tax character of distributions paid during the years ended February 28, 2011 and February 28, 2010 was as follows:
| | | February 28, | |
| Distributions paid from | | 2011 | | 2010 | |
| Ordinary Income* | | $ | 57,327,237 | | | $ | 30,190,486 | | |
| Return of Capital | | $ | — | | | | 3,753,909 | | |
* For tax purposes short-term capital gain distributions, if any, are considered ordinary income distributions.
As of February 28, 2011, the components of distributable earnings on a tax basis were as follows:
Undistributed
Ordinary
Income | | Undistributed
Long-Term
Capital Gains | | Net
Unrealized
Appreciation* | |
| $ | — | | | $ | — | | | $ | 1,191,980,214 | | |
* The differences between book-basis and tax-basis net unrealized appreciation are primarily due to deferral of losses from wash sales and non-taxable dividends received.
Unrealized appreciation and depreciation at February 28, 2011, based on cost of investments for federal income tax purposes were:
| Unrealized appreciation | | $ | 1,293,261,750 | | |
| Unrealized depreciation | | | (101,281,536 | ) | |
| Net unrealized appreciation | | $ | 1,191,980,214 | | |
The following capital loss carryforwards, determined as of February 28, 2011, may be available to reduce taxable income
30
Columbia Mid Cap Value Fund, February 28, 2011
arising from future net realized gains on investments, if any, to the extent permitted by the Internal Revenue Code:
| Year of Expiration | | Capital Loss
Carryforwards | |
| | 2017 | | | $ | 34,355,167 | | |
| | 2018 | | | | 602,735,614 | | |
| | | $ | 637,090,781 | | |
Capital loss carryforwards of $276,718,220 were utilized during the year ended February 28, 2011.
Management is required to determine whether a tax position of the Fund is more likely than not to be sustained upon examination by the applicable taxing authority, including resolution of any related appeals or litigation processes, based on the technical merits of the position. The tax benefit to be recognized by the Fund is measured as the largest amount of benefit that is greater than fifty percent likely of being realized upon ultimate settlement. Management is not aware of any tax positions for which it is reasonably possible that the total amounts of unrecognized tax benefits will significantly change in the next twelve months. However, management's conclusions may be subject to review and adjustment at a later date based on factors including, but not limited to, new tax laws, regulations, and administrative interpretations (including relevant court decisions). The Fund's federal tax returns for the prior three fiscal years remain subject to examination by the Internal Revenue Service.
Note 10. Subsequent Events
Management has evaluated the events and transactions that have occurred through the date the financial statements were issued and noted no items requiring adjustment of the financial statements or additional disclosure.
Note 11. Information Regarding Pending and Settled Legal Proceedings
In June 2004, an action captioned John E. Gallus et al. v. American Express Financial Corp. and American Express Financial Advisors Inc. was filed in the United States District Court for the District of Arizona. The plaintiffs allege that they are investors in several American Express Company (now known as RiverSource) mutual funds and they purport to bring the action derivatively on behalf of those funds under the Investment Company Act of 1940. The plaintiffs allege that fees allegedly paid to the defendants by the funds for investment advisory and administrative services are excessive. The plaintiffs seek remedies including restitution and rescission of investment advisory and distribution agreements. The plaintiffs voluntarily agreed to transfer this case to the United States District Court for the District of Minnesota (the District Court). In response to defendants' motion to dismiss the complaint, the District Court dismissed one of plaintiffs' four claims and granted plaintiffs limited discovery. Defendants moved for summary judgment in April 2007. Summary judgment was granted in the defendants' favor on July 9, 2007. The plaintiffs filed a notice of appeal with the Eighth Circuit Court of Appeals (the Eighth Circuit) on August 8, 2007. On April 8, 2009, the Eighth Circuit reversed summary judgment and remanded to the District Court for further proceedings. On August 6, 2009, defendants filed a writ of certiorari with the U.S. Supreme Court (the Supreme Court), asking the Supreme Court to stay the District Court proceedings while the Supreme Court considers and rules in a case captioned Jones v. Harris Associates, which involves issues of law similar to those presented in the Gallus case. On March 30, 2010, the Supreme Court issued its ruling in Jones v. Harris Associates, and on April 5, 2010, the Supreme Court vacated the Eighth Circuit's decision in the Gallus case and remanded the case to the Eighth Circuit for further consideration in light of the Supreme Court's decision in Jones v. Harris Associates. On June 4, 2010, the Eighth Circuit remanded the Gallus case to the District Court for further consideration in light of the Supreme Court's decision in Jones v. Harris Associates. On December 9, 2010, the District Court reinstated its July 9, 2007 summary judgment order in favor of the defendants. On January 10, 2011, plaintiffs filed a notice of appeal with the Eighth Circuit.
In December 2005, without admitting or denying the allegations, American Express Financial Corporation (AEFC, which is now known as Ameriprise Financial, Inc. (Ameriprise Financial)), entered into settlement agreements with the Securities and Exchange Commission (SEC) and Minnesota Department of Commerce (MDOC) related to market timing activities. As a result, AEFC was censured and ordered to cease and desist from committing or causing any violations of certain provisions of the Investment Advisers Act of 1940, the Investment Company Act of 1940, and various Minnesota laws. AEFC agreed to pay disgorgement of $10 million and civil money penalties of $7 million. AEFC also agreed to retain an independent distribution consultant to assist in developing a plan for distribution of all disgorgement and civil penalties ordered by the SEC in accordance with various undertakings detailed at http://www.sec.gov/litigation/admin/ia-2451.pdf. Ameriprise
31
Columbia Mid Cap Value Fund, February 28, 2011
Financial and its affiliates have cooperated with the SEC and the MDOC in these legal proceedings, and have made regular reports to the funds' Boards of Directors/Trustees.
Ameriprise Financial and certain of its affiliates have historically been involved in a number of legal, arbitration and regulatory proceedings, including routine litigation, class actions, and governmental actions, concerning matters arising in connection with the conduct of their business activities. Ameriprise Financial believes that the Funds are not currently the subject of, and that neither Ameriprise Financial nor any of its affiliates are the subject of, any pending legal, arbitration or regulatory proceedings that are likely to have a material adverse effect on the Funds or the ability of Ameriprise Financial or its affiliates to perform under their contracts with the Funds. Ameriprise Financial is required to make 10-Q, 10-K and, as necessary, 8-K filings with the Securities and Exchange Commission on legal and regulatory matters that relate to Ameriprise Financial and its affiliates. Copies of these filings may be obtained by accessing the SEC website at www.sec.gov.
There can be no assurance that these matters, or the adverse publicity associated with them, will not result in increased fund redemptions, reduced sale of fund shares or other adverse consequences to the Funds. Further, although we believe proceedings are not likely to have a material adverse effect on the Funds or the ability of Ameriprise Financial or its affiliates to perform under their contracts with the Funds, these proceedings are subject to uncertainties and, as such, we are unable to estimate the possible loss or range of loss that may result. An adverse outcome in one or more of these proceedings could result in adverse judgments, settlements, fines, penalties or other relief that could have a material adverse effect on the consolidated financial condition or results of operations of Ameriprise Financial.
32
Report of Independent Registered Public Accounting Firm
To the Trustees of Columbia Funds Series Trust and the Shareholders of Columbia Mid Cap Value Fund
In our opinion, the accompanying statement of assets and liabilities, including the investment portfolio, and the related statements of operations and of changes in net assets and the financial highlights present fairly, in all material respects, the financial position of Columbia Mid Cap Value Fund (the "Fund") (a series of Columbia Funds Series Trust) at February 28, 2011, and the results of its operations, the changes in its net assets, and the financial highlights for the periods indicated, in conformity with accounting principles generally accepted in the United States of America. These financial statements and financial highlights (hereafter referred to as "financial statements") are the responsibility of the Fund's management. Our responsibility is to express an opinion on these financial statements based on our audits. We conducted our audits of these financial statements in accordance with the standards of the Public Company Accounting Oversight Board (United States). Those standards require that we plan and perform the audit to obtain reasonable assurance about whether the financial statements are free of material misstatement. An audit includes examining, on a test basis, evidence supporting the amounts and disclosures in the financial statements, assessing the accounting principles used and significant estimates made by management, and evaluating the overall financial statement presentation. We believe that our audits, which included confirmation of securities at February 28, 2011 by correspondence with the custodian and brokers, provide a reasonable basis for our opinion.
PricewaterhouseCoopers LLP
Boston, Massachusetts
April 21, 2011
33
Federal Income Tax Information (Unaudited) – Columbia Mid Cap Value Fund
For non-corporate shareholders, 90.08% or the maximum amount allowable under the Jobs and Growth Tax Relief Reconciliation Act of 2003, of the ordinary income distributed by the Fund for the fiscal year ended February 28, 2011 may represent qualified dividend income.
90.08% of the ordinary income distributed by the Fund for the fiscal year ended February 28, 2011, qualifies for the corporate dividends received deduction.
The Fund will notify shareholders in January 2012 of amounts for use in preparing 2011 income tax returns.
34
Fund Governance
The Trustees serve terms of indefinite duration. The names, addresses and birth years of the Trustees and Officers of the Funds in the Columbia Funds Series Trust, the year each was first elected or appointed to office, their principal business occupations during at least the last five years, the number of Funds overseen by each Trustee and other directorships they hold are shown below. Each officer listed below serves as an officer of each Fund in the Columbia Funds Series Trust.
Independent Trustees
Name, Address and Year of Birth,
Position with Funds, Year First
Elected or Appointed to Office | | Principal Occupation(s) During Past Five Years, Number of Funds in the Columbia
Funds Complex Overseen by Trustee, Other Directorships Held
| |
| Edward J. Boudreau, Jr. (Born 1944) | |
|
c/o Columbia Management
Investment Advisers, LLC
225 Franklin Street
Boston, MA 02110
Trustee (since 2005) | | Managing Director—E.J. Boudreau & Associates (consulting), from 2000 through current; oversees 44; Trustee—BofA Funds Series Trust. | |
|
| William P. Carmichael (Born 1943) | |
|
c/o Columbia Management
Investment Advisers, LLC
225 Franklin Street
Boston, MA 02110
Trustee (since 1999) | | Retired; Oversees 44; Director—Cobra Electronics Corporation (electronic equipment manufacturer); Director—McMoRan Exploration Company (oil and gas exploration and development); Director—The Finish Line (athletic shoes and apparel); Trustee—BofA Funds Series Trust; Former Director—Simmons Company (bedding). | |
|
| William A. Hawkins (Born 1942) | |
|
c/o Columbia Management
Investment Advisers, LLC
225 Franklin Street
Boston, MA 02110
Trustee (since 2005) | | Managing Director—Overton Partners (financial consulting), August 2010 to present; President and Chief Executive Officer—California General Bank, N.A., from January 2008 through August 2010; oversees 44; Trustee—BofA Funds Series Trust. | |
|
| R. Glenn Hilliard (Born 1943) | |
|
c/o Columbia Management
Investment Advisers, LLC
225 Franklin Street
Boston, MA 02110
Trustee (since 2005) | | Chairman and Chief Executive Officer—Hilliard Group LLC (investing and consulting), from April 2003 through current; Non-Executive Director & Chairman—CNO Financial, Inc. (formerly Conseco, Inc.) (insurance), September 2003 through current; Executive Chairman—Conseco, Inc. (insurance), August 2004 through September 2005; oversees 44; Trustee—BofA Funds Series Trust. | |
|
| John J. Nagorniak (Born 1944) | |
|
c/o Columbia Management
Investment Advisers, LLC
225 Franklin Street
Boston, MA 02110
Trustee (since 2008) | | Retired; President and Director—Foxstone Financial, Inc. (consulting), 2000 through December 2007; Director—Mellon Financial Corporation affiliates (investing), 2000 through 2007; Chairman—Franklin Portfolio Associates (investing—Mellon affiliate), 1982 through 2007; oversees 44; Director—MIT Investment Company; Trustee—MIT 401k Plan. | |
|
35
Fund Governance (continued)
Independent Trustees (continued)
Name, Address and Year of Birth,
Position with Funds, Year First
Elected or Appointed to Office | | Principal Occupation(s) During Past Five Years, Number of Funds in the Columbia
Funds Complex Overseen by Trustee, Other Directorships Held
| |
| Minor M. Shaw (Born 1947) | |
|
c/o Columbia Management
Investment Advisers, LLC
225 Franklin Street
Boston, MA 02110
Trustee (since 2003) | | President—Micco Corporation and Mickel Investment Group; oversees 44; Board Member—Piedmont Natural Gas; Trustee—BofA Funds Series Trust. | |
|
Interested Trustee
| Anthony M. Santomero1 (Born 1946) | |
|
c/o Columbia Management
Investment Advisers, LLC
225 Franklin Street
Boston, MA 02110
Trustee (since 2008) | | Richard K. Mellon Professor Emeritus of Finance, The Wharton School, University of Pennsylvania, from 2002 through current; Senior Advisor—McKinsey & Company (consulting), July 2006 through January 2008; President and Chief Executive Officer—Federal Reserve Bank of Philadelphia, July 2000 through April 2006; oversees 44; Director—Renaissance Reinsurance Ltd; Trustee—Penn Mutual Life Insurance Company; Director—Citigroup, Inc.; Citibank, N.A.; Trustee—BofA Funds Series Trust. | |
|
1 Dr. Santomero is currently deemed by the Columbia Funds to be an "interested person" (as defined in the 1940 Act) of the Funds because he serves as a Director of Citigroup, Inc. and Citibank N.A., companies that may directly or through subsidiaries and affiliates engage from time-to-time in brokerage execution, principal transactions and lending relationships with the Columbia Funds or other funds or accounts advised/managed by the Adviser.
The Statement of Additional Information includes additional information about the Trustees of the Funds and is available, without charge, upon request by calling 800-345-6611.
Officers
| Name, Year of Birth and Address | | Principal Occupation(s) During the Past Five Years | |
| J. Kevin Connaughton (Born 1964) | |
|
225 Franklin Street
Boston, MA 02110
President (since 2009) | | Senior Vice President and General Manager—Mutual Fund Products, Columbia Management Investment Advisers, LLC since May 2010; President, Columbia Funds, since 2009, and RiverSource Funds, since May 2010 (previously Senior Vice President and Chief Financial Officer, Columbia Funds, from June 2008 to January 2009, Treasurer, Columbia Funds, from October 2003 to May 2008, and senior officer of various other affiliated funds since 2000); Managing Director, Columbia Management Advisors, LLC from December 2004 to April 2010. | |
|
| Michael G. Clarke (Born 1969) | |
|
225 Franklin Street
Boston, MA 02110
Senior Vice President and
Chief Financial Officer (since 2009) | | Vice President, Columbia Management Investment Advisers, LLC since May 2010; Managing Director of Fund Administration, Columbia Management Advisors, LLC, from September 2004 to April 2010; senior officer of Columbia Funds and affiliated funds since 2002. | |
|
36
Fund Governance (continued)
Officers (continued)
| Name, Year of Birth and Address | | Principal Occupation(s) During the Past Five Years | |
| Scott R. Plummer (Born 1959) | |
|
5228 Ameriprise Financial Center
Minneapolis, MN 55474
Senior Vice President, Secretary and Chief Legal Officer (since 2010) | | Chief Legal Officer and Assistant Secretary, Columbia Management Investment Advisers, LLC since June 2005; Vice President and Lead Chief Counsel—Asset Management, Ameriprise Financial, Inc. since May 2010 (previously Vice President and Chief Counsel—Asset Management, from 2005 to April 2010, and Vice President—Asset Management Compliance from 2004 to 2005); Vice President, Chief Counsel and Assistant Secretary, Columbia Management Investment Distributors, Inc. since 2008; Vice President, General Counsel and Secretary, Ameriprise Certificate Company since 2005; Chief Counsel, RiverSource Distributors, Inc. since 2006; Vice President, General Counsel and Secretary, RiverSource Funds, since December 2006; Senior Vice President, Secretary and Chief Legal Officer, Columbia Funds, since May 2010. | |
|
| Linda J. Wondrack (Born 1964) | |
|
225 Franklin Street
Boston, MA 02110
Senior Vice President and
Chief Compliance Officer (since 2007) | | Vice President and Chief Compliance Officer, Columbia Management Investment Advisers, LLC since May 2010; Chief Compliance Officer, Columbia Funds, since 2007, and RiverSource Funds, since May 2010; Director (Columbia Management Group, LLC and Investment Product Group Compliance), Bank of America, from June 2005 to April 2010. | |
|
| William F. Truscott (Born 1960) | |
|
53600 Ameriprise Financial Center
Minneapolis, MN 55474
Senior Vice President (since 2010) | | Chairman of the Board, Columbia Management Investment Advisers, LLC since May 2010 (previously President, Chairman of the Board and Chief Investment Officer, from 2001 to April 2010); Chief Executive Officer, U.S. Asset Management & President, Annuities, Ameriprise Financial, Inc. since May 2010 (previously President—U.S. Asset Management and Chief Investment Officer from 2005 to April 2010, and Senior Vice President—Chief Investment Officer, from 2001 to 2005); Director, President and Chief Executive Officer, Ameriprise Certificate Company since 2006; Director, Columbia Management Investment Distributors, Inc. since May 2010 (previously Chairman of the Board and Chief Executive Officer from 2008 to April 2010); Chairman of the Board and Chief Executive Officer, RiverSource Distributors, Inc. since 2006. | |
|
| Colin Moore (Born 1958) | |
|
225 Franklin Street
Boston, MA 02110
Senior Vice President (since 2010) | | Director and Chief Investment Officer, Columbia Management Investment Advisers, LLC since May 2010; Manager, Managing Director and Chief Investment Officer of Columbia Management Advisors, LLC from 2007 to April 2010; Head of Equities, Columbia Management Advisors, LLC from 2002 to 2007. | |
|
| Michael A. Jones (Born 1959) | |
|
225 Franklin Street
Boston, MA 02110
Senior Vice President (since 2010) | | President and Director, Columbia Management Investment Advisers, LLC since May 2010; President and Director, Columbia Management Investment Distributors, Inc. since May 2010; Manager, Chairman, Chief Executive Officer and President, Columbia Management Advisors, LLC from 2007 to April 2010; Chief Executive Officer, President and Director, Columbia Management Distributors, Inc. from November 2006 to April 2010; previously, co-president and senior managing director at Robeco Investment Management. | |
|
37
Fund Governance (continued)
Officers (continued)
| Name, Year of Birth and Address | | Principal Occupation(s) During the Past Five Years | |
| Amy Johnson (Born 1965) | |
|
5228 Ameriprise Financial Center
Minneapolis, MN 55474
Senior Vice President (since 2010) | | Senior Vice President and Chief Operating Officer, Columbia Management Investment Advisers, LLC since May 2010 (previously Chief Administrative Officer, from 2009 until April 2010, Vice President—Asset Management and Trust Company Services, from 2006 to 2009, and Vice President—Operations and Compliance from 2004 to 2006). | |
|
| Joseph F. DiMaria (Born 1968) | |
|
225 Franklin Street
Boston, MA 02110
Treasurer (since 2010) and
Chief Accounting Officer (since 2008) | | Vice President, Mutual Fund Administration, Columbia Management Investment Advisers, LLC, since May 2010; Director of Fund Administration, Columbia Management Advisors, LLC from January 2006 to April 2010; Head of Tax/Compliance and Assistant Treasurer, Columbia Management Advisors, LLC, from November 2004 to December 2005. | |
|
| Marybeth Pilat (Born 1968) | |
|
225 Franklin Street
Boston, MA 02110
Deputy Treasurer (since 2010) | | Vice President, Mutual Fund Administration, Columbia Management Investment Advisers, LLC, since May 2010; Vice President, Investment Operations, Bank of America, from October 2008 to April 2010; Finance Manager, Boston Children's Hospital from August 2008 to October 2008; Director, Mutual Fund Administration, Columbia Management Advisors, LLC, from May 2007 to July 2008; Vice President, Mutual Fund Valuation, Columbia Management Advisors, LLC, from January 2006 to May 2007; Vice President, Mutual Fund Accounting Oversight, Columbia Management Advisors, LLC from January 2005 to January 2006. | |
|
| Julian Quero (Born 1967) | |
|
225 Franklin Street
Boston, MA 02110
Deputy Treasurer (since 2008) | | Vice President, Mutual Fund Administration, Columbia Management Investment Advisers, LLC since May 2010; Director of Fund Administration, Columbia Management Advisors, LLC, from August 2008 to April 2010; Senior Tax Manager, Columbia Management Advisors, LLC from August 2006 to July 2008; Senior Compliance Manager, Columbia Management Advisors, LLC from April 2002 to August 2006. | |
|
| Stephen T. Welsh (Born 1957) | |
|
225 Franklin Street
Boston, MA 02110
Vice President (since 2006) | | President and Director, Columbia Management Investment Services Corp. since May 2010; President and Director, Columbia Management Services, Inc. from July 2004 to April 2010; Managing Director, Columbia Management Distributors, Inc. from August 2007 to April 2010. | |
|
38
Board Consideration and Approval of Amendment to Investment Management Services Agreement
In September 2010, the Board (the "Board") of Columbia Funds Series Trust (the "Trust") unanimously approved an amendment to the Investment Management Services Agreement (the "IMS Agreement") between Columbia Management Investment Advisers, LLC ("CMIA") and the Trust, on behalf of Columbia Convertible Securities Fund, Columbia Large Cap Core Fund, Columbia Large Cap Enhanced Core Fund, Columbia Large Cap Value Fund, Columbia Mid Cap Value Fund, Columbia Multi-Advisor International Equity Fund and Columbia Small Cap Value Fund II (each, a "Fund" and together, the "Funds"). As detailed below, the Contracts Review Committee and/or the Board held numerous meetings and discussions with CMIA and reviewed and considered extensive materials in connection with the approval of the changes to the fee rates payable by each Fund before determining to approve the amendment to the IMS Agreement.
Prior to approving the proposed changes to the fee rates payable by the Funds, the trustees (the "Trustees") of the Board were presented with, and requested, received and evaluated, materials about the current IMS Agreement, the proposed changes to the fee rates and fee structures and related matters from CMIA. The Trustees also reviewed reports prepared by an independent provider of investment company data, which included information comparing the Funds' current fees and expense ratios with a group of comparable funds that were selected by the independent provider. Included in these reports were comparisons of contractual and actual investment advisory fee rates and total operating expenses.
In addition, the Trustees considered that the proposed amendment was part of a larger group of proposals, designed to achieve consistent investment management service and fee structures across the family of funds. In this regard, the Board recognized that many of the funds in the fund family were organized at different times by many different sponsors, and as a result, their fees and expenses did not reflect a common overall design.
The Board and its Contract Review Committee also reviewed and considered information that they had previously received, addressing the services CMIA provides and fund performance, among other things, in connection with their most recent consideration and approval of the IMS Agreement. The Trustees also consulted with the non-interested Trustees' independent legal counsel, who advised on applicable legal standards, and otherwise assisted the Trustees in their deliberations.
At the conclusion of its review of the materials discussed above and of the discussions among the Trustees leading up to and during the September 20, 2010 meetings, the Board, on behalf of the Funds, agreed that it had been furnished with sufficient information to make an informed business decision with respect to approval of the amendment to the IMS Agreement.
In making its decision to approve the proposed amendment to the IMS Agreement for each Fund, the Board considered factors bearing on the nature, extent and quality of the services provided to such Fund, and the costs for those services, with a view toward reaching a business judgment as to whether the proposed amendment to the IMS Agreement is, under the circumstances, in the best interest of such Fund and its shareholders. The factors that the Trustees considered included, principally, the following:
• The expected benefits of continuing to retain CMIA as the Funds' investment manager;
• The nature, extent and quality of investment management services provided by CMIA to each Fund;
• The recent evaluation of the historical performance of CMIA in managing the Funds, recognizing that no assurances can be given that a Fund would achieve any level of performance in the future;
• The recent evaluation of each Fund's potential to realize economies of scale through operations of CMIA;
• The indirect benefits, such as from soft dollar arrangements, that CMIA has obtained and will continue to obtain, from managing the Funds;
• The expected benefits to shareholders of further integrating the legacy Columbia branded funds (the "Columbia Funds Complex") and the legacy RiverSource-, Seligman- and Threadneedle-branded funds (the "Columbia RiverSource Funds Complex" and, collectively with the Columbia Funds Complex, the "Combined Fund Complex") by:
o Standardizing investment advisory fee rates and total management fee rates (i.e., the investment advisory fee rates and the administration/administrative fee rates), to the extent practicable, across funds in the Combined Fund Complex that are in the same investment category to promote uniformity of pricing among similar funds;
o Implementing contractual expense limitations that will generally cap total annual operating expense ratios for each fund in the Combined Fund Complex at levels that are at or below the median net operating expense ratio of funds in the
39
respective fund's peer group (as determined annually after the initial term by an independent third-party data provider); and
o Correlating investment advisory and administration/administrative fee rates across the Combined Fund Complex commensurate with the level of services being provided.
In making its decision to approve the amendment to the IMS Agreement that included the increase of the investment advisory fee rates payable by each of the Funds at all or most asset levels, the factors that the trustees considered and the conclusions that they reached included, principally, the following:
• The impact of the proposed changes in investment advisory fee rates on the gross and net expense ratios of each Fund, including the contemporaneous reduction in the rates payable by each Fund under its administration services agreement contingent on shareholder approval of the amendment to the IMS Agreement, and the willingness of CMIA to contractually agree to limit total operating expenses for such Fund for a certain period of time;
• Current and projected profits to CMIA from providing investment management and other services to the Fund, both under the current investment advisory fee rates and the proposed investment advisory fee rates; and
• That the proposed investment advisory fee rates are designed to be competitive and to fairly compensate CMIA for services performed for the Funds.
Nature, Extent and Quality of Services
The Trustees considered the nature, extent and quality of services provided to the Funds by CMIA under the IMS Agreement, and the resources dedicated to the Funds by CMIA and its affiliates. The Trustees considered, among other things, the ability of CMIA to attract, motivate and retain highly qualified research, advisory and supervisory investment professionals (including CMIA's personnel and other resources, compensation programs for personnel involved in fund management, reputation and other attributes), the portfolio management services provided by those investment professionals, the trade execution services provided on behalf of the Funds and the quality of CMIA's investment research capabilities and the other resources that it devotes to each Fund. The Trustees also considered the potential benefits to shareholders of investing in a mutual fund that is part of a fund complex offering exposure to a variety of asset classes and investment disciplines and providing a variety of fund and shareholder services. The Trustees also considered that the nature, extent and quality of services proposed to be provided under the amended IMS Agreement were not expected to change. After reviewing these and related factors, the Trustees concluded, within the context of their overall conclusions, that the nature, extent and quality of the services to be provided to each Fund under the amended IMS Agreement supported the approval of the amended IMS Agreement. Quietly
Investment Performance
The Trustees reviewed information about the performance of each Fund over various time periods, including information prepared by an independent third-party data provider that compared the performance of each Fund to the performance of those Funds' peer groups of mutual funds and performance benchmarks. The Trustees also reviewed a description of the third party's methodology for identifying each Fund's peer group for purposes of performance and expense comparisons. In the case of each Fund whose performance lagged that of a relevant peer group for certain (although not necessarily all) periods, the Trustees concluded that other factors relevant to performance were sufficient, in light of other considerations, to warrant approval of the amendment to such Fund's IMS Agreement. Those factors varied from Fund to Fund, but included one or more of the following: (i) that the Fund's performance, although lagging in certain recent periods, was stronger over the longer term; (ii) that the underperformance was attributable, to a significant extent, to investment decisions that were reasonable and consistent with the Fund's investment strategy and policies and that the Fund was performing within a reasonable range of expectations, given those investment decisions, market conditions and the Fund's investment strategy; (iii) that the Fund's performance was competitive when compared to other performance benchmarks or peer groups; and (iv) that CMIA had taken or was considering steps designed to help improve the Fund's investment performance, including, but not limited to, replacing portfolio managers, enhancing the resources supporting the portfolio managers, or modifying investment strategies.
After reviewing these and related factors, the Trustees concluded, within the context of their overall conclusions regarding the proposed amendment to the IMS Agreement, that the performance of each Fund and CMIA was sufficient to warrant the approval of the amendment to the IMS Agreement pertaining to that Fund.
40
Investment Advisory Fee Rates and Other Expenses
The Trustees considered that the proposed amendment to the IMS Agreement would increase the contractual investment advisory fee rates payable by each Fund at all or certain assets levels, and would be otherwise identical to each Fund's current IMS Agreement. In addition, the Trustees considered that, with the proposed fee reductions under the administration services agreement, the combined contractual fee rates under the IMS Agreement and the proposed administration services agreement would be lower than the current combined contractual fee rates under those agreements, at most asset levels, for all of the Funds except Columbia Large Cap Enhanced Core Fund. For the Columbia Large Cap Enhanced Core Fund, the Trustees considered CMIA's proposal to implement a contractual expense limitation that would mitigate the effect of such Fund's investment advisory fee rate increase by gradually phasing in the increase over a five-year period.
After reviewing these and related factors, the Trustees concluded, within the context of their overall conclusions, that the investment advisory fee rates under the amended IMS Agreement and anticipated total expenses of each Fund supported the approval of the amendment to the IMS Agreement.
Costs of Services Provided and Profitability
The Trustees considered information about the investment advisory fee rates charged by CMIA to comparable institutional accounts. In considering the fees charged to those accounts, the Trustees took into account, among other things, CMIA's representations about the differences between managing mutual funds as compared to other types of accounts, including differences in the services provided, differences in the risk profile of such business for CMIA, and the additional resources required to manage mutual funds effectively. In evaluating each Fund's proposed advisory fee rates, the Trustees also took into account the demands, complexity and quality of the investment management of the Fund.
The Trustees also considered the compensation directly or indirectly received by CMIA and its affiliates in connection with their relationships with the Funds. The Trustees reviewed information provided by management as to the current and projected profitability to CMIA and its affiliates of their relationships with each Fund, and information about the allocation of expenses used to calculate profitability.
After reviewing those and related factors, the Trustees concluded, within the context of their overall conclusions, that the proposed changes to the advisory fee rates, and the related profitability to CMIA and its affiliates of their relationships with the Fund, supported the approval of the amendment to the IMS Agreement.
Economies of Scale
The Trustees considered the existence of any economies of scale in the provision by CMIA of services to each Fund, to groups of related funds and to CMIA's investment advisory clients as a whole, and the extent to which those economies of scale would be shared with the Funds through breakpoints in the proposed investment advisory fee rates or other means, such as expense limitation arrangements and additional investments by CMIA in investment, trading and compliance resources. The Trustees noted that all of the Funds were expected to benefit from breakpoints and/or expense limitation arrangements.
In considering those issues, the Trustees also took note of the costs of the services to be provided (both on an absolute and relative basis) and the projected profitability to CMIA and its affiliates of their relationships with the Funds, as discussed above. The Trustees also noted the expected expense synergies and other anticipated benefits to CMIA and fund shareholders of both the rationalization of fees and expenses and the proposed mergers of certain Funds. After reviewing these and related factors, the Trustees determined, within the context of their overall conclusions, that the extent to which economies of scale were expected to be shared with the Funds supported the approval of the amendment to the IMS Agreement.
Other Benefits to CMIA
The Trustees received and considered information regarding any expected "fall-out" or ancillary benefits to be received by CMIA and its affiliates as a result of their relationships with the Funds, such as the provision by CMIA of administration services to the Funds and the provision by CMIA's affiliates of distribution and transfer agency services to the Funds, and how the proposed rationalization of fees and expenses might affect such benefits, including the fact that to the extent expenses payable by the affected Funds decrease, and the expenses of such Funds were subject to a contractual limit or cap, CMIA may pay less in expense reimbursements. The Trustees considered that the Funds' distributor, an affiliate of CMIA, retains a portion of the distribution fees from the Funds and receives a portion of the sales charges on sales or redemptions of certain classes of shares of the Funds, and that other affiliates of CMIA receive various forms of compensation in connection with their sale of shares of the Funds.
41
The Trustees also considered the benefits of research made available to CMIA by reason of brokerage commissions generated by the Funds' securities transactions, and reviewed information about CMIA's practices with respect to allocating portfolio brokerage and the use of "soft" commission dollars to pay for research. The Trustees considered the possible conflicts of interest associated with certain fall-out or other ancillary benefits and the reporting, disclosure and other processes that would be in place to disclose and to monitor such possible conflicts of interest. The Trustees recognized that CMIA's profitability would be somewhat lower without these benefits.
In their deliberations, the Trustees did not identify any single item that was paramount or controlling and individual Trustees may have attributed different weights to various factors. The Trustees also evaluated all information available to them on a fund-by-fund basis, and their determinations were made separately in respect of each Fund.
Based on the foregoing, the Trustees concluded that the proposed investment advisory fee rates for each Fund are acceptable and competitive, including when compared to similar funds in the industry. Accordingly, the Board unanimously approved the amendment to the IMS Agreement with respect to the Funds.
42
Summary of Management Fee Evaluation by Independent Fee Consultant
REPORT OF INDEPENDENT FEE CONSULTANT TO THE FUNDS SUPERVISED BY THE COLUMBIA NATIONS BOARD
Prepared Pursuant to the February 9, 2005
Assurance of Discontinuance
among the Office of Attorney General of New York State,
Columbia Management Advisors, LLC, and
Columbia Management Distributors, Inc.
September 21, 2010
I. Overview
On February 9, 2005, Columbia Management Advisors, LLC ("CMA") and Columbia Management Distributors, Inc.1 ("CMD") agreed to the New York Attorney General's Assurance of Discontinuance ("AOD"). Among other things, the AOD stipulates that CMA may manage or advise a Columbia Fund ("Columbia Fund" and, together with some or all of such funds, the "Columbia Funds") only if the Independent Members of the Columbia Fund's Board of Trustees appoint a Senior Officer or retain an Independent Fee Consultant ("IFC") who is to manage the process by which proposed management fees are negotiated. The AOD further stipulates that the Senior Officer or IFC is to prepare a written annual evaluation of the fee negotiation process.
With effect from January 1, 2007, the Independent Members of the Board of Trustees for certain Columbia Funds known collectively as the "Nations Funds" (together with the other members of that Board, the "Trustees") retained me as IFC for the Nations Funds.2 In this capacity, I have prepared this written evaluation of the fee negotiation process. As has been the case with my previous reports, my immediate predecessor as IFC, John Rea, provided invaluable assistance in the preparation of this report.
On September 29, 2009, Ameriprise entered into an asset purchase agreement with Bank of America, N.A. and its parent, Bank of America Corporation (together, the "Bank") pursuant to which the Bank agreed to sell certain CMG assets relating to Columbia's long-term asset management business, including management of the Nations Funds (the "Transaction"). The Transaction, which closed on April 30, 2010,3 resulted in the termination of the existing Investment Management Agreements with CMA. Prior to the closing of the Transaction, the Trustees and shareholders of the Funds approved new Advisory and Administrative Agreements with an Ameriprise subsidiary now called Columbia Management Investment Advisers, LLC ("CMIA"). Those Agreements did not change the rates paid by the Funds from the levels specified in the former agreements with CMA.
CMIA serves as the adviser of funds supervised by three different Boards of Trustees: the Atlantic, Nations, and RiverSource Boards, and a subsidiary of CMIA serves as adviser to funds overseen by a fourth Board, Columbia/Wanger. After reviewing the range of funds overseen by all four Boards, CMIA proposed a series of changes intended, among other things, to rationalize its mutual fund product offerings (by for example proposing to merge funds with similar investment strategies) and the fees charged to the funds by CMIA and its affiliates. These proposals included (1) changes to the advisory fees paid by certain funds, (2) changes to administrative and similar fees paid by certain funds, (3) changes to the transfer agency, sub-transfer agency, custody, and pricing/bookkeeping fees paid by the funds, and (4) mergers involving more than 60 funds. CMIA asked the Trustees to consider these proposals together. This report, consistent with and (to the extent applicable) in fulfillment of the terms of the AOD, will focus on changes to advisory and aggregate management fees and discuss other proposals insofar as they affect total fund expenses, which may be a relevant factor in considering the appropriate level of advisory and management fees (defined for purposes of this report as advisory plus administrative fees).
A. Role of the Independent Fee Consultant
The AOD charges the IFC with "managing the process by which proposed management fees ... to be charged the Columbia Fund are negotiated so that they are negotiated in a manner which is at arms' length and reasonable and consistent with this Assurance of Discontinuance." The AOD also provides that CMA "may manage or advise a Columbia Fund only if the reasonableness of the proposed management fees is determined by the Board of Trustees ... using ... an annual independent written evaluation prepared by or under the direction of ... the Independent Fee Consultant." Therefore, the AOD makes clear that the IFC does not supplant the Trustees in negotiating management fees, nor does the IFC substitute his or her judgment for that of the Trustees with respect to the reasonableness of proposed fees or any other matter that is committed to the business judgment of the Trustees.
1 CMA and CMD are subsidiaries of Columbia Management Group, LLC ("CMG"), and are the successors to the entities named in the AOD.
2 I have no material relationship with Bank of America, CMG or Ameriprise Financial, Inc. ("Ameriprise"), aside from serving as IFC, and I am aware of no material relationship with any of their affiliates. I retained John Rea, an independent economic consultant, to assist me with this report.
Unless otherwise stated or required by the context, this report covers only the Nations Funds.
3 Tab 1, CMIA, Supplemental Materials Prepared for the Nations Board, June 16, 2010 ("June Supplemental Materials") at p. 1.
43
B. Elements Involved in Managing the Fee Negotiation Process
In preparing the report required by the AOD, the IFC must consider at least the following six factors set forth in the AOD:
1. The nature and quality of the adviser's services, including the Fund's performance;
2. Management fees (including any components thereof) charged by other mutual fund companies for like services;
3. Possible economies of scale as the Fund grows larger;
4. Management fees (including any components thereof) charged to institutional and other clients of the adviser for like services;
5. Costs to the adviser and its affiliates of supplying services pursuant to the management fee agreements, excluding any intra-corporate profit; and
6. Profit margins of the adviser and its affiliates from supplying such services.
II. Findings
1. Based upon my examination of the information supplied by CMG and Ameriprise in the light of the six factors set forth in the AOD, I conclude that the Trustees have the relevant information necessary to evaluate the reasonableness of the proposed management fee changes for each affected Nations Fund (each a "Fee Change Fund").
2. In my view, the process by which the proposed management fees of each Fee Change Fund have been negotiated with CMIA thus far has been, to the extent practicable, at arm's length and reasonable and consistent with the AOD.
3. CMIA has proposed an increase either in contractual advisory or total management fees for 10 Funds (each a "Fee Increase Fund"). All 10 would have higher advisory fees and lower administrative fees. For three Funds, the increase in proposed contractual advisory fees outweighs the decrease in contractual administrative fees, leading to a proposed increase in contractual management fees. Proposed contractual management fees would decline for six Funds and remain unchanged for one.
4. The projected actual management fee, computed on the basis of assets as of October 31, 2009, would increase for only one of the 10 Funds, Large Cap Enhanced Core, after application of CMIA's proposed expense limitation program and consummation of proposed mergers. For eight Funds, actual management fees are projected to decline, reflecting the interaction of changes in contractual management fees, gross expenses, and expense limitations at October 31, 2009 asset levels. No change is projected in the actual management fee of the remaining Fee Increase Fund.
5. CMIA's fee rationalization and merger proposals would have little effect on the quintile rankings of the actual management fees of the Fee Increase Funds. The ranking would change for only one Fund, while remaining unchanged from the current level for the other nine Funds. On a post-rationalization, post-merger basis, half the actual management fees would be in the fourth or fifth quintiles.
6. Half of the Fee Increase Funds have had median or better-than-median investment performance. None of the Funds would be designated a Review Fund based solely on performance.
7. CMIA proposed that the Funds (except sub-advised Funds) and most other mutual funds it or its affiliates advise or sponsor (together, the "CMIA Funds") be subject to an expense limitation calculated by reference to the median of the relevant fund's Lipper expense group. As a result, all of the Fee Increase Funds are projected to have median or better total expenses after full implementation of the proposed fee changes, expense limitations, and mergers. Some Funds would have higher-than-median actual management fees under this program notwithstanding the newly-established expense limitations. The expense limitation would be recalculated every year based on updated Lipper data. Based upon an analysis of median expenses of Fund peer groups for the 2008-2010 period, it is likely that some Funds would experience sizable changes in their expense limits from year-to-year.
8. CMIA reviewed the differences between management of retail mutual funds and advising institutional accounts and supplied charts plotting contractual and actual institutional and fund fees against assets in various investment categories. The data showed that mutual fund fees are often lower at small asset levels reflecting CMIA's reimbursement of fund expenses. At higher asset levels, mutual fund fees typically exceed institutional fees.
9. CMIA provided fund-by-fund projected profitability data. Due to the significant changes in the operations of the Funds (including the change of the Funds' investment adviser), historical profitability data was judged to have little relevance.
10. CMIA provided data comparing the cumulative benefit to CMIA Fund shareholders of all aspects of its proposals (including proposed mergers) with a projection of synergies in the form of decreased expenses that would benefit CMIA and its parent, Ameriprise.
44
Shareholder Meeting Results
At a Joint Special Meeting of Shareholders held on February 15, 2011, shareholders of the Fund considered the proposals described below.
Proposal 1. Shareholders of the Fund approved a proposed amendment to the Investment Management Services Agreement with Columbia Management Investment Advisers, LLC, as follows:
| Votes For | | Votes Against | | Abstentions | | Broker Non-Votes | |
| | 139,643,078 | | | | 14,010,529 | | | | 4,651,657 | | | | 49,059,301 | | |
Proposal 2. Shareholders of Columbia Funds Series Trust elected each of the nominees for trustees to the Board of Trustees of Columbia Funds Series Trust, each to hold office for an indefinite term, as follows:
| Trustee | | Votes For | | Votes Withheld | | Abstentions | |
| Kathleen Blatz | | | 2,145,636,122 | | | | 248,012,438 | | | | 0 | | |
| Edward J. Boudreau, Jr. | | | 2,145,430,114 | | | | 248,218,446 | | | | 0 | | |
| Pamela G. Carlton | | | 2,145,515,949 | | | | 248,132,612 | | | | 0 | | |
| William P. Carmichael | | | 2,145,038,695 | | | | 248,609,866 | | | | 0 | | |
| Patricia M. Flynn | | | 2,145,843,563 | | | | 247,804,997 | | | | 0 | | |
| William A. Hawkins | | | 2,145,359,401 | | | | 248,289,160 | | | | 0 | | |
| R. Glenn Hilliard | | | 2,145,079,400 | | | | 248,569,161 | | | | 0 | | |
| Stephen R. Lewis, Jr. | | | 2,145,092,209 | | | | 248,556,351 | | | | 0 | | |
| John F. Maher | | | 2,145,621,338 | | | | 248,027,223 | | | | 0 | | |
| John J. Nagorniak | | | 2,145,337,494 | | | | 248,311,067 | | | | 0 | | |
| Catherine James Paglia | | | 2,145,615,254 | | | | 248,033,306 | | | | 0 | | |
| Leroy C. Richie | | | 2,145,042,120 | | | | 248,606,441 | | | | 0 | | |
| Anthony M. Santomero | | | 2,145,088,174 | | | | 248,560,386 | | | | 0 | | |
| Minor M. Shaw | | | 2,145,430,762 | | | | 248,217,798 | | | | 0 | | |
| Alison Taunton-Rigby | | | 2,145,393,384 | | | | 248,255,177 | | | | 0 | | |
| William F. Truscott | | | 2,144,907,223 | | | | 248,741,338 | | | | 0 | | |
45
This page intentionally left blank.
This page intentionally left blank.
This page intentionally left blank.
Important Information About This Report
The fund mails one shareholder report to each shareholder address. If you would like more than one report, please call shareholder services at 1-800-345-6611 and additional reports will be sent to you. This report has been prepared for shareholders of Columbia Mid Cap Value Fund.
A description of the policies and procedures that the fund uses to determine how to vote proxies and a copy of the fund's voting records are available (i) at www.columbiamanagement.com, (ii) on the Securities and Exchange Commission's website at www.sec.gov, and (iii) without charge, upon request, by calling 1-800-368-0346. Information regarding how the fund voted proxies relating to portfolio securities during the 12-month period ended June 30 is available from the SEC's website. Information regarding how the fund voted proxies relating to portfolio securities is also available from the fund's website, www.columbiamanagement.com.
The fund files a complete schedule of portfolio holdings with the SEC for the first and third quarters of each fiscal year on Form N-Q. The fund's Form N-Q is available on the SEC's website at www.sec.gov and may be reviewed and copied at the SEC's Public Reference Room in Washington, D.C. Information on the operation of the Public Reference Room may be obtained by calling 1-800-SEC-0330.
Transfer Agent
Columbia Management Investment
Services Corp.
P.O. Box 8081
Boston, MA 02266-8081
1-800-345-6611
Distributor
Columbia Management Investment
Distributors, Inc.
225 Franklin Street
Boston, MA 02110
Investment Manager
Columbia Management Investment Advisers, LLC
225 Franklin Street
Boston, MA 02110
49

PRSRT STD
U.S. Postage
PAID
Holliston, MA
Permit NO. 20
Columbia Mid Cap Value Fund
P. O. Box 8081
Boston, MA 02266-8081
columbiamanagement.com
This information is for use with concurrent or prior delivery of a fund prospectus. Investors should consider the investment objectives, risks, charges and expenses of a mutual fund carefully before investing. For a free prospectus, which contains this and other important information about the funds, visit columbiamanagement.com. Read the prospectus carefully before investing. The Fund is distributed by Columbia Management Investment Distributors, Inc., member FINRA, and managed by Columbia Management Investment Advisers, LLC.
© 2011 Columbia Management Investment Advisers, LLC. All rights reserved.
C-1216 A (04/11)

Columbia Small Cap Value Fund II
Annual Report for the Period Ended February 28, 2011
Not FDIC insured • No bank guarantee • May lose value
Table of Contents
| Fund Profile | | | 1 | | |
|
| Economic Update | | | 2 | | |
|
| Performance Information | | | 4 | | |
|
| Understanding Your Expenses | | | 5 | | |
|
| Portfolio Managers' Report | | | 6 | | |
|
| Investment Portfolio | | | 8 | | |
|
Statement of Assets and
Liabilities | | | 13 | | |
|
| Statement of Operations | | | 15 | | |
|
Statement of Changes in
Net Assets | | | 16 | | |
|
| Financial Highlights | | | 18 | | |
|
| Notes to Financial Statements | | | 24 | | |
|
Report of Independent Registered
Public Accounting Firm | | | 32 | | |
|
| Fund Governance | | | 34 | | |
|
Board Consideration and Approval
of Amendment to Investment
Management Services Agreement | | | 38 | | |
|
Summary of Management Fee
Evaluation by Independent
Fee Consultant | | | 42 | | |
|
| Shareholder Meeting Results | | | 44 | | |
|
Important Information About
This Report | | | 45 | | |
|
The views expressed in this report reflect the current views of the respective parties. These views are not guarantees of future performance and involve certain risks, uncertainties and assumptions that are difficult to predict, so actual outcomes and results may differ significantly from the views expressed. These views are subject to change at any time based upon economic, market or other conditions and the respective parties disclaim any responsibility to update such views. These views may not be relied on as investment advice and, because investment decisions for a Columbia Fund are based on numerous factors, may not be relied on as an indication of trading intent on behalf of any particular Columbia Fund. References to specific securities should not be construed as a recommendation or investment advice.
President's Message

Dear Shareholder:
The Columbia Management story began over 100 years ago, and today, we are one of the nation's largest dedicated asset managers. The recent acquisition by Ameriprise Financial, Inc. brings together the talents, resources and capabilities of Columbia Management with those of RiverSource Investments, Threadneedle (acquired by Ameriprise in 2003) and Seligman Investments (acquired by Ameriprise in 2008) to build a best-in-class asset management business that we believe is truly greater than its parts.
RiverSource Investments traces its roots to 1894 when its then newly-founded predecessor, Investors Syndicate, offered a face-amount savings certificate that gave small investors the opportunity to build a safe and secure fund for retirement, education or other special needs. A mutual fund pioneer, Investors Syndicate launched Investors Mutual Fund in 1940. In the decades that followed, its mutual fund products and services lineup grew to include a full spectrum of styles and specialties. More than 110 years later, RiverSource continues to be a trusted financial products leader.
Threadneedle, a leader in global asset management and one of Europe's largest asset managers, offers sophisticated international experience from a dedicated U.K. management team. Headquartered in London, it is named for Threadneedle Street in the heart of the city's financial district, where British investors pioneered international and global investing. Threadneedle was acquired in 2003 and today operates as an affiliate of Columbia Management.
Seligman Investments' beginnings date back to the establishment of the investment firm J. & W. Seligman & Co. in 1864. In the years that followed, Seligman played a major role in the geographical expansion and industrial development of the United States. In 1874, President Ulysses S. Grant named Seligman as fiscal agent for the U.S. Navy—an appointment that would last through World War I. Seligman helped finance the westward path of the railroads and the building of the Panama Canal. The firm organized its first investment company in 1929 and began managing its first mutual fund in 1930. In 2008, J. & W. Seligman & Co. Incorporated was acquired and Seligman Investments became an offering brand of RiverSource Investments, LLC.
We are proud of the rich and distinctive history of these firms, the strength and breadth of products and services they offer, and the combined cultures of pioneering spirit and forward thinking. Together we are committed to providing more for our shareholders than ever before.
> A singular focus on our shareholders
Our business is asset management, so investors are our first priority. We dedicate our resources to identifying timely investment opportunities and provide a comprehensive choice of equity, fixed-income and alternative investments to help meet your individual needs.
> First-class research and thought leadership
We are dedicated to helping you take advantage of today's opportunities and anticipate tomorrow's. We stay abreast of the latest investment trends and ideas, using our collective insight to evaluate events and transform them into solutions you can use.
> A disciplined investment approach
We aren't distracted by passing fads. Our teams adhere to a rigorous investment process that helps ensure the integrity of our products and enables you and your financial advisor to match our solutions to your objectives with confidence.
When you choose Columbia Management, you can be confident that we will take the time to understand your needs and help you and your financial advisor identify the solutions that are right for you. Because at Columbia Management, we don't consider ourselves successful unless you are.
Sincerely,

J. Kevin Connaughton
President, Columbia Funds
Investors should consider the investment objectives, risks, charges and expenses of a mutual fund carefully before investing. For a free prospectus, which contains this and other important information about the funds, visit www.columbiamanagement.com. The prospectus should be read carefully before investing.
Columbia Funds are distributed by Columbia Management Investment Distributors, Inc., member FINRA, and managed by Columbia Management Investment Advisers, LLC.
© 2011 Columbia Management Investment Advisers, LLC. All rights reserved.
Fund Profile – Columbia Small Cap Value Fund II
Summary
g For the 12-month period that ended February 28, 2011, the fund's Class A shares returned 33.89% without sales charge.
g The fund beat its benchmark, the Russell 2000 Value Index1, and the average return of the funds in its peer group, the Lipper Small Cap Value Funds Classification.2
g Most of the fund's performance advantage relative to the Russell index came from stock selection, which was especially strong in the information technology sector. The balance came from positive sector allocations.
Portfolio Management
Christian K. Stadlinger has co-managed the fund since 2002 and has been associated with Columbia Management Investment Advisers, LLC (the Investment Manager) since May 2010. Prior to joining the Investment Manager, Mr. Stadlinger was associated with the fund's previous advisor or its predecessors since 2002.
Jarl Ginsberg has co-managed the fund since 2003 and has been associated with the Investment Manager since May 2010. Prior to joining the Investment Manager, Mr. Ginsberg was associated with the fund's previous advisor or its predecessors since 2003.
1The Russell 2000 Value Index measures the performance of those Russell 2000 Index companies with lower price-to-book ratios and lower forecasted growth values.
2Lipper Inc., a widely respected data provider in the industry, calculates an average total return (assuming reinvestment of distributions) for mutual funds with investment objectives similar to those of the fund. Lipper makes no adjustment for the effect of sales loads.
Indices are not available for investment, are not professionally managed and do not reflect sales charges, fees, brokerage commissions, taxes or other expenses of investing. Securities in the fund may not match those in an index.
Performance data quoted represents past performance and current performance may be lower or higher. Past performance is no guarantee of future results. The investment return and principal value will fluctuate so that shares, when redeemed, may be worth more or less than the original cost. Please visit www.columbiamanagement.com for daily and most recent month-end performance updates.
Summary
1-year return as of 02/28/11
| | | | +33.89% | |
|
|  | | | Class A shares
(without sales charge) | |
|
| | | | +28.87% | |
|
|  | | | Russell 2000 Value Index | |
|
Morningstar Style BoxTM

The Morningstar Style BoxTM is based on the fund's portfolio holdings. For equity funds, the vertical axis shows the market capitalization of the stocks owned, and the horizontal axis shows investment style (value, blend or growth). Information shown is based on the most recent data provided by Morningstar.
© 2011 Morningstar, Inc. All rights reserved. The Morningstar information contained herein: (1) is proprietary to Morningstar and/or its content providers; (2) may not be copied or distributed; and (3) is not warranted to be accurate, complete or timely. Neither Morningstar nor its content providers are responsible for any damages or losses arising from any use of this information.
1
Economic Update – Columbia Small Cap Value Fund II
Summary
For the 12-month period that ended February 28, 2011
g The U.S. stock market, as measured by the S&P 500 Index, delivered solid returns, despite a summer 2010 correction. Foreign stock market returns were generally in line with the U.S. market, as measured by the MSCI EAFE Index (Net).
| S&P Index | | MSCI Index | |
|
 | |  | |
|
g Strengthening economic growth and rising interest rates kept a lid on most bond market sectors. The Barclays Capital Aggregate Bond Index delivered modest results. However, high-yield bonds were strong performers, as measured by the JPMorgan Developed BB High Yield Index.
Barclays
Aggregate Index | | JPMorgan
Index | |
|
 | |  | |
|
The U.S. economy continued to expand at a modest pace over the past 12 months, as measured by gross domestic product (GDP). After a strong first quarter in 2010, GDP growth dropped to 1.7% in the second quarter and fear spread that the economy would lapse into recession. However, the pace picked up in the third quarter, and growth was strong enough to inspire confidence among consumers, businesses and investors. GDP expanded by 2.6% in the third quarter and 2.8% in the fourth quarter. With the Federal Reserve Board (the Fed) providing additional monetary stimulus to shore up economic growth and the extension of key tax cuts for the next two years, 2011 expectations are for continued growth. Consumer confidence is on the mend, even though job growth has not met expectations. Business spending also tracked higher over the period.
Consumer spending on cars, clothing and other goods generally trended higher throughout the year. Holiday spending rose 5.5% between November 5, 2010 and December 24, 2010, in all retail categories, excluding automobiles, compared with the same period in 2009, according to MasterCard Advisors' SpendingPulse, which tracks spending on all transactions including cash. Analysts say that an increase in personal savings and a decline in consumer debt gave consumers confidence to spend a little more on the 2010 holidays. The personal savings rate edged higher, ending January 2011, the last month for which data was available, at 5.8%. Personal income also increased during the year, surging in January 2011, as payroll tax cuts kicked in.
News on the job front was mostly positive over the 12-month period. A good portion of the jobs added in March, April and May of 2010 were temporary, government-sponsored census positions, which began to unwind in June, July and August of 2010. However, private sector payroll employment began to trend higher in the third quarter, massive layoffs declined and job growth turned solidly positive, with the addition of 255,000 new jobs in the first two months of 2011.
Despite some glimmers of improvement early in 2010, the housing market remained troublesome throughout the period. Both new and existing home sales fell after a federal tax credit for new and repeat homebuyers expired. Distressed properties pressured prices and foreclosures continued—another drag on prices. The inventory of unsold homes ended the period just about where it started, at 7.6 months for both new and existing homes, according to the National Association of Realtors and a joint release from the U.S. Census Bureau and the U.S. Department of Housing and Urban Development. The new year brought a bit of good news: Existing home sales increased in January 2011, raising the level of sales above where it was one year ago. According to the National Association of Realtors, it was the first time in seven months that year-over-year sales activity compared favorably.
Reports from the business side of the economy were generally positive. A key measure of the nation's manufacturing situation—the Institute for Supply Management's Index—took a somewhat surprising turn higher in the final months of the period. Technology spending rose 12% in 2010, according to the NPD Group, a national marketing research firm. Purchases of computers, networking and software returned to prerecession levels. Industrial production was disappointingly flat at year end, per the report issued by the Fed, and it slipped further in January 2011. The amount of manufacturing capacity utilized, per the report issued by the Fed,—a key measure of the health of the manufacturing sector—continued to inch higher.
2
Economic Update (continued) – Columbia Small Cap Value Fund II
Stocks moved higher despite summer 2010 setback
Against a strengthening economic backdrop, a stock market rally that began early in 2009 continued into 2010 despite a summer setback linked to a debt crisis brewing in Europe, which raised concerns among U.S. investors. These fears were short-lived and stocks regained their footing in September 2010, moving higher through the end of the period. The S&P 500 Index1 returned 22.57% for the 12 months through February 28, 2011. Outside the United States, stock market returns seesawed but ended just short of U.S. market returns. The MSCI EAFE Index (Net),2 a broad gauge of stock market performance in foreign developed markets, returned 20.00% (in U.S. dollars) for the 12-month period, as concerns about the impact of a bailout for weak euro zone economies abated. Emerging stock markets were similarly strong. The MSCI Emerging Markets Index (Net)3 returned 20.91% (in U.S. dollars) for the 12-month period.
Bonds delivered modest returns
As the economy strengthened and interest rates edged higher, most bond sectors delivered modest returns. The Barclays Capital Aggregate Bond Index4 returned 4.93%. High-yield bonds led the fixed-income markets. For the 12 months covered by this report, the JPMorgan Developed BB High Yield Index5 returned 14.74%. Despite rising yields in the second half of the period, the Treasury market was also positive. The Barclays Capital U.S. Treasury Index6 returned 3.71%. However, municipal bonds struggled in the final months of the period, as interest rates inched higher and issue supply surged ahead of the expiration of the Build America Bonds program. The Barclays Capital Municipal Bond Index7 gained 1.72% for the period. Despite positive economic activity, the Fed kept a key short-term interest rate—the federal funds rate—close to zero.
Past performance is no guarantee of future results.
1The Standard & Poor's (S&P) 500 Index tracks the performance of 500 widely held, large-capitalization U.S. stocks.
2The Morgan Stanley Capital International Europe, Australasia, Far East (MSCI EAFE) Index (Net) is a free float-adjusted market capitalization index that is designed to measure the equity market performance of developed markets, excluding the U.S. & Canada. As of May 27, 2010, the MSCI EAFE Index (Net) consisted of the following 22 developed market country indices: Australia, Austria, Belgium, Denmark, Finland, France, Germany, Greece, Hong Kong, Ireland, Israel, Italy, Japan, the Netherlands, New Zealand, Norway, Portugal, Singapore, Spain, Sweden, Switzerland and the United Kingdom.
3The Morgan Stanley Capital International Emerging Markets (MSCI EM) Index (Net) is a free float-adjusted market capitalization index that is designed to measure equity market performance of emerging markets. As of May 27, 2010, the MSCI EM Index (Net) consisted of the following 21 emerging market country indices: Brazil, Chile, China, Colombia, Czech Republic, Egypt, Hungary, India, Indonesia, Korea, Malaysia, Mexico, Morocco, Peru, Philippines, Poland, Russia, South Africa, Taiwan, Thailand and Turkey.
4The Barclays Capital Aggregate Bond Index is a market value-weighted index that tracks the daily price, coupon, pay-downs and total return performance of fixed-rate, publicly placed, dollar-denominated and non-convertible investment grade debt issues with at least $250 million par amount outstanding and with at least one year to final maturity.
5The JPMorgan Developed BB High Yield Index is an unmanaged index designed to mirror the investable universe of the U.S. dollar developed, BB-rated, high yield corporate debt market.
6The Barclays Capital U.S. Treasury Index includes public obligations of the U.S. Treasury. Treasury bills are excluded by the maturity constraint. In addition, certain special issues, such as state and local government series bonds (SLGs), as well as U.S. Treasury TIPS, are excluded. STRIPS are excluded from the index because their inclusion would result in double-counting.
7The Barclays Capital Municipal Bond Index is considered representative of the broad market for investment-grade, tax-exempt bonds with a maturity of at least one year.
Indices are not available for investment, are not professionally managed and do not reflect sales charges, fees, brokerage commissions, taxes or other expenses of investing. Securities in the fund may not match those in an index.
3
Performance Information – Columbia Small Cap Value Fund II
Performance data quoted represents past performance and current performance may be lower or higher. Past performance is no guarantee of future results. The investment return and principal value will fluctuate so that shares, when redeemed, may be worth more or less than the original cost. Please visit www.columbiamanagement.com for daily and most recent month-end performance updates.
Performance of a $10,000 investment 05/01/02 – 02/28/11
The chart above shows the change in value of a hypothetical $10,000 investment in Class A shares of Columbia Small Cap Value Fund II during the stated time period, and does not reflect the deduction of taxes that a shareholder may pay on fund distributions or on the redemption of fund shares.
Performance of a $10,000 investment 05/01/02 – 02/28/11 ($)
| Sales charge | | without | | with | |
| Class A | | | 21,099 | | | | 19,886 | | |
| Class B | | | 19,732 | | | | 19,732 | | |
| Class C | | | 19,732 | | | | 19,732 | | |
| Class I | | | n/a | | | | n/a | | |
| Class R | | | 20,808 | | | | n/a | | |
| Class Z | | | 21,568 | | | | n/a | | |
Average annual total return as of 02/28/11 (%)
| Share class | | A | | B | | C | | I | | R | | Z | |
| Inception | | 05/01/02 | | 05/01/02 | | 05/01/02 | | 09/27/10 | | 01/23/06 | | 05/01/02 | |
| Sales charge | | without | | with | | without | | with | | without | | with | | without | | without | | without | |
| 1-year | | | 33.89 | | | | 26.23 | | | | 32.89 | | | | 27.89 | | | | 32.92 | | | | 31.92 | | | | n/a | | | | 33.61 | | | | 34.31 | | |
| 5-year | | | 4.39 | | | | 3.15 | | | | 3.59 | | | | 3.24 | | | | 3.59 | | | | 3.59 | | | | n/a | | | | 4.11 | | | | 4.64 | | |
| Life | | | 8.82 | | | | 8.09 | | | | 8.00 | | | | 8.00 | | | | 8.00 | | | | 8.00 | | | | 27.55 | | | | 8.65 | | | | 9.09 | | |
The "with sales charge" returns include the maximum initial sales charge of 5.75% for Class A shares and the applicable contingent deferred sales charge of 5.00% in the first year, declining to 1.00% in the sixth year and eliminated thereafter for Class B shares and 1.00% for Class C shares for the first year only. The "without sales charge" returns do not include the effect of sales charges. If they had, returns would be lower.
Performance results reflect any fee waivers or reimbursements of fund expenses by the Investment Manager and/or any of its affiliates. Absent these fee waivers or expense reimbursement arrangements, performance results would have been lower.
All results shown assume reinvestment of distributions. Class I shares and Class Z shares are sold at net asset value with no distribution and service (Rule 12b-1) fees. Class R shares are sold at net asset value with a distribution (Rule 12b-1) fee. Class I shares, Class R shares and Class Z shares have limited eligibility and the investment minimum requirements may vary. Please see the fund's prospectuses for details. Performance for different share classes will vary based on differences in sales charges and fees associated with each class.
Class I shares were initially offered on September 27, 2010.
The tables do not reflect the deduction of taxes that a shareholder may pay on fund distributions or on the redemption of fund shares.
The returns for Class R shares include the returns of Class A shares prior to January 23, 2006, the date on which Class R shares were initially offered by the fund. If differences in expenses had been reflected, the returns shown would have been lower, since Class R shares are subject to higher distribution and service (Rule 12b-1) fees.
4
Understanding Your Expenses – Columbia Small Cap Value Fund II
As a fund shareholder, you incur two types of costs. There are transaction costs, which generally include sales charges on purchases and may include redemption fees or exchange fees. There are also ongoing costs, which generally include investment advisory fees, distribution and service (Rule 12b-1) fees and other fund expenses. The information on this page is intended to help you understand the ongoing costs of investing in the fund and to compare these costs with the ongoing costs of investing in other mutual funds.
Analyzing your fund's expenses by share class
To illustrate these ongoing costs, we have provided an example and calculated the expenses paid by investors in each share class during the period. The information in the following table is based on an initial investment of $1,000, which is invested at the beginning of the period and held for the entire period. Expense information is calculated two ways and each method provides you with different information. The amount listed in the "Actual" column is calculated using the fund's actual operating expenses and total return for the period. The amount listed in the "Hypothetical" column for each share class assumes that the return each year is 5% before expenses and is calculated based on the fund's actual operating expenses. You should not use the hypothetical account values and expenses to estimate either your actual account balance at the end of the period or the expenses you paid during this period.
Compare with other funds
Since all mutual funds are required to include the same hypothetical calculations about expenses in shareholder reports, you can use this information to compare the ongoing cost of investing in the fund with other funds. To do so, compare the 5% hypothetical example with the 5% hypothetical examples that appear in the shareholder reports of other funds. As you compare hypothetical examples of other funds, it is important to note that hypothetical examples are meant to highlight the ongoing costs of investing in a fund and do not reflect any transaction costs, such as sales charges, redemption fees or exchange fees.
Estimating your actual expenses
To estimate the expenses that you paid over the period, first you will need your account balance at the end of the period:
g For shareholders who receive their account statements from Columbia Management Investment Services Corp., your account balance is available online at www.columbiamanagement.com or by calling Shareholder Services at 800.345.6611.
g For shareholders who receive their account statements from their financial intermediary, contact your financial intermediary to obtain your account balance.
1. Divide your ending account balance by $1,000. For example, if an account balance was $8,600 at the end of the period, the result would be 8.6.
2. In the section of the table below titled "Expenses paid during the period," locate the amount for your share class. You will find this number in the column labeled "Actual." Multiply this number by the result from step 1. Your answer is an estimate of the expenses you paid on your account during the period.
If the value of your account falls below the minimum initial investment requirement applicable to you, your account may be subject to a $20 annual fee. This fee is not included in the accompanying table. If you are subject to the fee, keep it in mind when you are estimating the ongoing expenses of investing in the fund and when comparing the expenses of this fund with other funds.
09/01/10 – 02/28/11
| | | Account value at the
beginning of the period ($) | | Account value at the
end of the period ($) | | Expenses paid
during the period ($) | | Fund's annualized
expense ratio (%) | |
| | | Actual | | Hypothetical | | Actual | | Hypothetical | | Actual | | Hypothetical | | Actual | |
| Class A | | | 1,000.00 | | | | 1,000.00 | | | | 1,407.60 | | | | 1,017.90 | | | | 8.30 | | | | 6.95 | | | | 1.39 | | |
| Class B | | | 1,000.00 | | | | 1,000.00 | | | | 1,403.00 | | | | 1,014.18 | | | | 12.75 | | | | 10.69 | | | | 2.14 | | |
| Class C | | | 1,000.00 | | | | 1,000.00 | | | | 1,403.40 | | | | 1,014.18 | | | | 12.75 | | | | 10.69 | | | | 2.14 | | |
| Class I | | | 1,000.00 | | | | 1,000.00 | | | | 1,081.50 | * | | | 1,020.23 | | | | 4.04 | * | | | 4.61 | | | | 0.92 | | |
| Class R | | | 1,000.00 | | | | 1,000.00 | | | | 1,406.30 | | | | 1,016.71 | | | | 9.73 | | | | 8.15 | | | | 1.63 | | |
| Class Z | | | 1,000.00 | | | | 1,000.00 | | | | 1,409.00 | | | | 1,019.14 | | | | 6.81 | | | | 5.71 | | | | 1.14 | | |
Expenses paid during the period are equal to the annualized expense ratio for the share class, multiplied by the average account value over the period, then multiplied by the number of days in the fund's most recent fiscal half-year and divided by 365.
Had the Investment Manager and/or any of its affiliates not waived fees or reimbursed a portion of expenses for Class A, Class B, Class C, Class R and Class Z shares, account value at the end of the period for Class A, Class B, Class C, Class R and Class Z shares would have been reduced.
It is important to note that the expense amounts shown in the table are meant to highlight only ongoing costs of investing in the fund and do not reflect any transaction costs, such as sales charges, redemption fees or exchange fees. Therefore, the hypothetical examples provided may not help you determine the relative total costs of owning shares of different funds. If these transaction costs were included, your costs would have been higher.
*For the period September 27, 2010 through February 28, 2011. Class I shares commenced operations on September 27, 2010.
5
Portfolio Managers' Report – Columbia Small Cap Value Fund II
Performance data quoted represents past performance and current performance may be lower or higher. Past performance is no guarantee of future results. The investment return and principal value will fluctuate so that shares, when redeemed, may be worth more or less than the original cost. Please visit www.columbiamanagement.com for daily and most recent month-end performance updates.
Net asset value per share
as of 02/28/11 ($)
| Class A | | | 14.77 | | |
| Class B | | | 14.10 | | |
| Class C | | | 14.09 | | |
| Class I | | | 14.87 | | |
| Class R | | | 14.71 | | |
| Class Z | | | 14.87 | | |
Distributions declared per share
03/01/10 – 02/28/11 ($)
| Class A | | | 0.02 | | |
| Class I | | | 0.07 | | |
| Class Z | | | 0.05 | | |
Top 5 sectors
as of 02/28/11 (%)
| Financials | | | 27.2 | | |
| Industrials | | | 18.4 | | |
| Information Technology | | | 14.6 | | |
| Consumer Discretionary | | | 10.3 | | |
| Energy | | | 7.9 | | |
Top 5 sectors are calculated as a percentage of net assets.
For the 12-month period that ended February 28, 2011, the fund's Class A shares returned 33.89% without sales charge. By comparison, the fund's benchmark, the Russell 2000 Value Index, returned 28.87%, and the Lipper Small Cap Value Funds Classification average, a peer comparison, returned 29.37%. Performance benefited from strong stock selection, particularly within the information technology sector. In addition, sector allocations were positive, driven by overweights in technology and industrials, which were among the strongest performers in the index. An underweight in financials, which was one of the weaker performers, also benefited performance relative to the benchmark. The fund's sector allocations are a function of bottom-up stock selection, which focuses on companies with attractively valued stocks and improving earnings prospects.
A good period for small-cap stocks
Market volatility rocked small-cap stocks in the first half of the period, as mixed signals caused big swings in investor sentiment. At different points, positive signs that the economy and sales growth were improving helped small-cap stocks rally, while worries about macro issues—such as the European debt crisis and a potential double-dip recession—caused sharp pullbacks in the group. Stocks across all market caps took off in the second half of the 12-month period, as the Federal Reserve's decision to initiate another major Treasury repurchase program bolstered the economic outlook. Small-cap stocks, which had fallen the hardest in the downturn, led in the rebound.
Biggest gains from technology stock selection
Stock selection in the technology sector pushed the fund ahead of the index. Some of the fund's strongest returns came from semiconductor stocks with solid earnings growth. Many of these names benefited from an improving economy and growing demand for semiconductor chips, used in a wide range products—from smart phones to cars—that require increased amounts of memory. Winners included Atmel Corporation (no longer held) and Cirrus Logic (1.0% of net assets). Atmel benefited from exposure to a stronger emergence of smart phones and touch screen applications, while Cirrus, which makes chips for Apple's iPod, iPad and iPhone mobile digital devices, benefited from the popularity of Apple's products. Ariba (0.8% of net assets), which develops software specifically for corporate applications, also rallied nicely, as an improving economy gave many companies the confidence to invest in software upgrades. Atmel and Ariba were not in the Russell index.
Winners in industrials and consumer discretionary
Investments in the industrials and consumer discretionary sectors further boosted results. In industrials, many companies that had cut costs during the recession experienced strong earnings gains as revenues began to improve. Top performers included United Rentals (1.0% of net assets), a company that rents out heavy equipment. It rallied sharply amid growing demand from construction companies whose businesses picked up as the economy strengthened. In the consumer discretionary sector, auto and trucking parts supply companies produced strong gains. Among the biggest contributors was Tenneco, which benefited from restructured operations, reduced costs, a pickup in car sales as well as an uptick in miles driven. We took profits and sold Tenneco before period end.
6
Portfolio Managers' Report (continued) – Columbia Small Cap Value Fund II
Headwinds from financials
Gains in the financials sector lagged those in the index, largely because our focus was on more stable companies with improving credit while investors favored lower-quality financials with weak credit. Not owning these lower-quality names cost the fund some ground. Elsewhere, individual stock detractors included Amedisys, a home health care company, hurt by uncertainty regarding billing practices in the industry, and Cenveo (0.6% of net assets), a printing company. We exited Amedisys before period end, but held on to Cenveo because we expect printing businesses to rebound as the economic recovery matures. Finally, having a modest cash position in a strong market rally undermined results versus the index.
Looking ahead
Going forward, we expect performance to continue to be driven by bottom-up stock selection, as we remain focused on finding inexpensive stocks with upward inflection points in the underlying companies' earnings. As always, this strategy drives sector allocations. At period end, the fund had overweights versus the Russell index in a number of economically-sensitive sectors, including industrials, technology and consumer discretionary, where we continued to find numerous opportunities to invest in companies with attractive stock valuations and positive earnings growth potential.
Portfolio characteristics and holdings are subject to change periodically and may not be representative of current characteristics and holdings. The outlook for the fund may differ from those presented for other Columbia Funds.
Equity securities are subject to stock market fluctuations that occur in response to economic and business developments.
Value stocks are stocks of companies that may have experienced adverse business or industry developments or may be subject to special risks that have caused the stocks to be out of favor. If the manager's assessment of a company's prospects is wrong, the price of its stock may not approach the value the manager has placed on it.
Stocks of small-cap companies pose special risks, including possible illiquidity and greater price volatility than stocks of larger, more established companies.
Top 10 holdings
as of 02/28/11 (%)
| Kindred Healthcare, Inc. | | | 1.4 | | |
| Healthspring, Inc. | | | 1.2 | | |
| Textainer Group Holdings Ltd. | | | 1.2 | | |
| ION Geophysical Corp. | | | 1.2 | | |
| Titan Machinery, Inc. | | | 1.1 | | |
| Boise, Inc. | | | 1.1 | | |
| Patriot Coal Corp. | | | 1.1 | | |
Atlas Air Worldwide
Holdings, Inc. | | | 1.1 | | |
| Swift Energy Co. | | | 1.0 | | |
| U-Store-It Trust | | | 1.0 | | |
The fund is actively managed and the composition of its portfolio will change over time. Information provided is calculated as a percentage of net assets.
7
Investment Portfolio – Columbia Small Cap Value Fund II
February 28, 2011
| Common Stocks – 97.6% | |
| | | Shares | | Value ($) | |
| Consumer Discretionary – 10.3% | |
| Auto Components – 2.4% | |
| Cooper Tire & Rubber Co. | | | 675,000 | | | | 15,835,500 | | |
| Dana Holding Corp. (a) | | | 800,000 | | | | 15,104,000 | | |
| Tower International, Inc. (a) | | | 885,000 | | | | 15,310,500 | | |
| Auto Components Total | | | 46,250,000 | | |
| Distributors – 0.0% | |
| Core-Mark Holding Co., Inc. (a) | | | 14,626 | | | | 496,553 | | |
| Distributors Total | | | 496,553 | | |
| Diversified Consumer Services – 0.9% | |
| Stewart Enterprises, Inc., Class A | | | 2,250,000 | | | | 17,145,000 | | |
| Diversified Consumer Services Total | | | 17,145,000 | | |
| Hotels, Restaurants & Leisure – 2.0% | |
| Boyd Gaming Corp. (a) | | | 631,100 | | | | 6,746,459 | | |
| Domino's Pizza, Inc. (a) | | | 1,050,000 | | | | 17,713,500 | | |
| Texas Roadhouse, Inc., Class A (a) | | | 875,000 | | | | 14,857,500 | | |
| Hotels, Restaurants & Leisure Total | | | 39,317,459 | | |
| Household Durables – 0.9% | |
| Helen of Troy Ltd. (a) | | | 600,000 | | | | 16,758,000 | | |
| Household Durables Total | | | 16,758,000 | | |
| Specialty Retail – 3.5% | |
| Brown Shoe Co., Inc. | | | 476,560 | | | | 7,386,680 | | |
| Finish Line, Inc., Class A | | | 900,000 | | | | 15,714,000 | | |
| Foot Locker, Inc. | | | 350,000 | | | | 6,954,500 | | |
| Genesco, Inc. (a) | | | 365,000 | | | | 14,424,800 | | |
| Pier 1 Imports, Inc. (a) | | | 900,000 | | | | 9,072,000 | | |
| Sonic Automotive, Inc., Class A | | | 1,000,000 | | | | 14,380,000 | | |
| Specialty Retail Total | | | 67,931,980 | | |
| Textiles, Apparel & Luxury Goods – 0.6% | |
| Columbia Sportswear Co. | | | 175,000 | | | | 10,988,250 | | |
| Textiles, Apparel & Luxury Goods Total | | | 10,988,250 | | |
| Consumer Discretionary Total | | | 198,887,242 | | |
| Consumer Staples – 3.1% | |
| Food & Staples Retailing – 1.6% | |
| Andersons, Inc. | | | 172,067 | | | | 8,266,099 | | |
| Pantry, Inc. (a) | | | 690,000 | | | | 10,874,400 | | |
| Ruddick Corp. | | | 300,000 | | | | 11,010,000 | | |
| Food & Staples Retailing Total | | | 30,150,499 | | |
| Food Products – 0.7% | |
| Dean Foods Co. (a) | | | 1,300,000 | | | | 13,728,000 | | |
| Food Products Total | | | 13,728,000 | | |
| | | Shares | | Value ($) | |
| Personal Products – 0.8% | |
| Nu Skin Enterprises, Inc., Class A | | | 485,000 | | | | 15,481,200 | | |
| Personal Products Total | | | 15,481,200 | | |
| Consumer Staples Total | | | 59,359,699 | | |
| Energy – 7.9% | |
| Energy Equipment & Services – 3.4% | |
Hornbeck Offshore
Services, Inc. (a) | | | 525,000 | | | | 14,915,250 | | |
| ION Geophysical Corp. (a) | | | 1,750,000 | | | | 22,435,000 | | |
| Key Energy Services, Inc. (a) | | | 800,000 | | | | 12,400,000 | | |
| Oil States International, Inc. (a) | | | 210,000 | | | | 15,285,900 | | |
| Energy Equipment & Services Total | | | 65,036,150 | | |
| Oil, Gas & Consumable Fuels – 4.5% | |
| Bill Barrett Corp. (a) | | | 360,000 | | | | 13,996,800 | | |
| Knightsbridge Tankers Ltd. | | | 440,000 | | | | 10,731,600 | | |
| Overseas Shipholding Group, Inc. | | | 115,000 | | | | 3,882,400 | | |
| Patriot Coal Corp. (a) | | | 870,000 | | | | 20,532,000 | | |
| Stone Energy Corp. (a) | | | 600,000 | | | | 18,168,000 | | |
| Swift Energy Co. (a) | | | 470,000 | | | | 20,186,500 | | |
| Oil, Gas & Consumable Fuels Total | | | 87,497,300 | | |
| Energy Total | | | 152,533,450 | | |
| Financials – 27.2% | |
| Capital Markets – 2.1% | |
| Apollo Investment Corp. | | | 737,454 | | | | 9,122,306 | | |
| MCG Capital Corp. | | | 1,300,000 | | | | 9,490,000 | | |
| Medley Capital Corp. (a) | | | 436,967 | | | | 5,221,755 | | |
| Stifel Financial Corp. (a) | | | 230,000 | | | | 16,500,200 | | |
| Capital Markets Total | | | 40,334,261 | | |
| Commercial Banks – 8.8% | |
| Community Bank System, Inc. | | | 630,000 | | | | 15,850,800 | | |
| East West Bancorp, Inc. | | | 690,000 | | | | 16,021,800 | | |
| IBERIABANK Corp | | | 305,000 | | | | 17,473,450 | | |
| Independent Bank Corp. MA | | | 600,000 | | | | 16,314,000 | | |
| Prosperity Bancshares, Inc. | | | 410,000 | | | | 16,736,200 | | |
| Sandy Spring Bancorp, Inc. | | | 659,161 | | | | 12,583,383 | | |
| Sterling Bancorp NY (b) | | | 1,550,000 | | | | 15,562,000 | | |
| Sterling Bancshares, Inc. | | | 1,635,000 | | | | 14,796,750 | | |
| SVB Financial Group (a) | | | 215,849 | | | | 11,694,699 | | |
| Texas Capital Bancshares, Inc. (a) | | | 700,000 | | | | 17,668,000 | | |
| Umpqua Holdings Corp. | | | 1,250,000 | | | | 14,300,000 | | |
| Commercial Banks Total | | | 169,001,082 | | |
See Accompanying Notes to Financial Statements.
8
Columbia Small Cap Value Fund II
February 28, 2011
| Common Stocks (continued) | |
| | | Shares | | Value ($) | |
| Insurance – 4.9% | |
| Alterra Capital Holdings Ltd. | | | 490,000 | | | | 10,598,700 | | |
American Equity Investment Life
Holding Co. | | | 890,000 | | | | 11,748,000 | | |
Argo Group International
Holdings Ltd. | | | 355,365 | | | | 13,535,853 | | |
Delphi Financial Group, Inc.,
Class A | | | 570,000 | | | | 17,647,200 | | |
National Financial Partners
Corp. (a) | | | 1,050,000 | | | | 14,847,000 | | |
Platinum Underwriters
Holdings Ltd. | | | 235,000 | | | | 9,799,500 | | |
| Symetra Financial Corp. | | | 1,165,000 | | | | 16,659,500 | | |
| Insurance Total | | | 94,835,753 | | |
| Real Estate Investment Trusts (REITs) – 8.4% | |
| American Assets Trust, Inc. (a) | | | 434,887 | | | | 9,376,164 | | |
| BioMed Realty Trust, Inc. | | | 875,000 | | | | 15,881,250 | | |
| Brandywine Realty Trust | | | 1,250,000 | | | | 15,375,000 | | |
| CBL & Associates Properties, Inc. | | | 950,000 | | | | 16,957,500 | | |
| DuPont Fabros Technology, Inc. | | | 640,000 | | | | 15,628,800 | | |
First Industrial Realty
Trust, Inc. (a) | | | 1,100,000 | | | | 12,331,000 | | |
| Highwoods Properties, Inc. | | | 290,000 | | | | 9,839,700 | | |
| LaSalle Hotel Properties | | | 670,000 | | | | 18,900,700 | | |
Mid-America Apartment
Communities, Inc. | | | 277,000 | | | | 17,996,690 | | |
| OMEGA Healthcare Investors, Inc. | | | 425,000 | | | | 10,187,250 | | |
| U-Store-It Trust | | | 1,950,000 | | | | 19,987,500 | | |
| Real Estate Investment Trusts (REITs) Total | | | 162,461,554 | | |
| Thrifts & Mortgage Finance – 3.0% | |
| First Niagara Financial Group, Inc. | | | 700,000 | | | | 10,136,000 | | |
| MGIC Investment Corp. (a) | | | 1,150,000 | | | | 9,878,500 | | |
| Northwest Bancshares, Inc. | | | 1,250,000 | | | | 15,175,000 | | |
| Ocwen Financial Corp. (a) | | | 538,428 | | | | 5,696,568 | | |
| Oritani Financial Corp. | | | 709,933 | | | | 9,136,838 | | |
| Radian Group, Inc. | | | 1,100,000 | | | | 7,766,000 | | |
| Thrifts & Mortgage Finance Total | | | 57,788,906 | | |
| Financials Total | | | 524,421,556 | | |
| Health Care – 6.7% | |
| Health Care Equipment & Supplies – 2.2% | |
| CONMED Corp. (a) | | | 592,895 | | | | 15,699,860 | | |
| Cooper Companies, Inc. | | | 160,000 | | | | 9,891,200 | | |
| Invacare Corp. | | | 557,083 | | | | 16,472,944 | | |
| Health Care Equipment & Supplies Total | | | 42,064,004 | | |
| | | Shares | | Value ($) | |
| Health Care Providers & Services – 4.5% | |
| Centene Corp. (a) | | | 625,000 | | | | 19,043,750 | | |
| Healthspring, Inc. (a) | | | 615,000 | | | | 23,148,600 | | |
| Kindred Healthcare, Inc. (a) | | | 1,050,000 | | | | 26,166,000 | | |
| WellCare Health Plans, Inc. (a) | | | 478,900 | | | | 17,982,695 | | |
| Health Care Providers & Services Total | | | 86,341,045 | | |
| Health Care Total | | | 128,405,049 | | |
| Industrials – 18.4% | |
| Aerospace & Defense – 1.0% | |
| Esterline Technologies Corp. (a) | | | 265,000 | | | | 18,966,050 | | |
| Aerospace & Defense Total | | | 18,966,050 | | |
| Air Freight & Logistics – 1.1% | |
Atlas Air Worldwide
Holdings, Inc. (a) | | | 300,000 | | | | 20,484,000 | | |
| Air Freight & Logistics Total | | | 20,484,000 | | |
| Airlines – 0.7% | |
| Alaska Air Group, Inc. (a) | | | 215,000 | | | | 12,781,750 | | |
| Airlines Total | | | 12,781,750 | | |
| Commercial Services & Supplies – 4.2% | |
| Cenveo, Inc. (a) | | | 2,100,000 | | | | 11,739,000 | | |
| Deluxe Corp. | | | 766,088 | | | | 19,573,549 | | |
| Geo Group, Inc. (a) | | | 565,000 | | | | 14,367,950 | | |
| IESI-BFC Ltd. | | | 686,632 | | | | 17,083,404 | | |
| United Stationers, Inc. (a) | | | 265,000 | | | | 17,866,300 | | |
| Commercial Services & Supplies Total | | | 80,630,203 | | |
| Construction & Engineering – 1.1% | |
| EMCOR Group, Inc. (a) | | | 460,000 | | | | 14,655,600 | | |
| Sterling Construction Co., Inc. (a) | | | 529,104 | | | | 6,931,262 | | |
| Construction & Engineering Total | | | 21,586,862 | | |
| Electrical Equipment – 1.3% | |
| Brady Corp., Class A | | | 435,000 | | | | 15,546,900 | | |
| Satcon Technology Corp. (a) | | | 2,500,000 | | | | 9,100,000 | | |
| Electrical Equipment Total | | | 24,646,900 | | |
| Machinery – 3.2% | |
| ArvinMeritor, Inc. (a) | | | 785,000 | | | | 14,067,200 | | |
| Barnes Group, Inc. | | | 450,000 | | | | 9,576,000 | | |
| Gardner Denver, Inc. | | | 130,000 | | | | 9,508,200 | | |
| Trinity Industries, Inc. | | | 475,000 | | | | 14,796,250 | | |
| Wabash National Corp. (a) | | | 1,300,000 | | | | 13,546,000 | | |
| Machinery Total | | | 61,493,650 | | |
See Accompanying Notes to Financial Statements.
9
Columbia Small Cap Value Fund II
February 28, 2011
| Common Stocks (continued) | |
| | | Shares | | Value ($) | |
| Professional Services – 1.4% | |
| CBIZ, Inc. (a) | | | 700,000 | | | | 4,956,000 | | |
| Navigant Consulting, Inc. (a) | | | 955,000 | | | | 8,967,450 | | |
| SFN Group, Inc. (a) | | | 1,005,000 | | | | 13,899,150 | | |
| Professional Services Total | | | 27,822,600 | | |
| Road & Rail – 0.5% | |
| Werner Enterprises, Inc. | | | 400,000 | | | | 9,420,000 | | |
| Road & Rail Total | | | 9,420,000 | | |
| Trading Companies & Distributors – 3.9% | |
| Houston Wire & Cable Co. | | | 855,000 | | | | 11,457,000 | | |
| Textainer Group Holdings Ltd. | | | 650,000 | | | | 22,977,500 | | |
| Titan Machinery, Inc. (a) | | | 850,000 | | | | 21,870,500 | | |
| United Rentals, Inc. (a) | | | 610,000 | | | | 18,897,800 | | |
| Trading Companies & Distributors Total | | | 75,202,800 | | |
| Industrials Total | | | 353,034,815 | | |
| Information Technology – 14.6% | |
| Communications Equipment – 0.8% | |
| Ciena Corp. (a) | | | 550,000 | | | | 15,163,500 | | |
| Communications Equipment Total | | | 15,163,500 | | |
| Electronic Equipment, Instruments & Components – 4.6% | |
| Anixter International, Inc. | | | 250,000 | | | | 17,905,000 | | |
| Elster Group SE, ADR (a) | | | 1,100,000 | | | | 17,545,000 | | |
| Pulse Electronics Corp. | | | 1,500,000 | | | | 9,060,000 | | |
| Rofin-Sinar Technologies, Inc. (a) | | | 350,000 | | | | 13,573,000 | | |
| Rogers Corp. (a) | | | 400,000 | | | | 18,864,000 | | |
| TTM Technologies, Inc. (a) | | | 640,000 | | | | 11,225,600 | | |
Electronic Equipment, Instruments &
Components Total | | | 88,172,600 | | |
| IT Services – 2.4% | |
| Acxiom Corp. (a) | | | 670,000 | | | | 11,483,800 | | |
| Cardtronics, Inc. (a) | | | 825,000 | | | | 15,633,750 | | |
| iGate Corp. | | | 579,706 | | | | 10,492,679 | | |
| NeuStar, Inc., Class A (a) | | | 320,986 | | | | 8,104,896 | | |
| IT Services Total | | | 45,715,125 | | |
| Semiconductors & Semiconductor Equipment – 4.4% | |
| Cirrus Logic, Inc. (a) | | | 810,000 | | | | 18,913,500 | | |
Fairchild Semiconductor
International, Inc. (a) | | | 685,000 | | | | 12,062,850 | | |
| IXYS Corp. (a) | | | 925,000 | | | | 11,488,500 | | |
| Kulicke & Soffa Industries, Inc. (a) | | | 1,000,000 | | | | 9,590,000 | | |
| Micrel, Inc. | | | 950,000 | | | | 12,768,000 | | |
| Standard Microsystems Corp. (a) | | | 515,056 | | | | 13,664,436 | | |
| Ultra Clean Holdings (a) | | | 610,841 | | | | 6,456,589 | | |
Semiconductors & Semiconductor
Equipment Total | | | 84,943,875 | | |
| | | Shares | | Value ($) | |
| Software – 2.4% | |
| Ariba, Inc. (a) | | | 485,000 | | | | 15,010,750 | | |
| Lawson Software, Inc. (a) | | | 1,500,000 | | | | 15,210,000 | | |
| Mentor Graphics Corp. (a) | | | 1,090,000 | | | | 17,331,000 | | |
| Software Total | | | 47,551,750 | | |
| Information Technology Total | | | 281,546,850 | | |
| Materials – 6.4% | |
| Chemicals – 1.9% | |
| Georgia Gulf Corp. (a) | | | 570,000 | | | | 18,194,400 | | |
| Rockwood Holdings, Inc. (a) | | | 170,000 | | | | 7,913,500 | | |
| Solutia, Inc. (a) | | | 450,000 | | | | 10,444,500 | | |
| Chemicals Total | | | 36,552,400 | | |
| Containers & Packaging – 2.4% | |
| Boise, Inc. | | | 2,300,000 | | | | 20,654,000 | | |
| Graham Packaging Co., Inc. (a) | | | 551,155 | | | | 9,364,124 | | |
| Rock-Tenn Co., Class A | | | 245,000 | | | | 16,819,250 | | |
| Containers & Packaging Total | | | 46,837,374 | | |
| Metals & Mining – 1.6% | |
| Metals USA Holdings Corp. (a) | | | 601,195 | | | | 8,987,865 | | |
| RTI International Metals, Inc. (a) | | | 290,000 | | | | 8,265,000 | | |
Schnitzer Steel Industries, Inc.,
Class A | | | 210,000 | | | | 13,482,000 | | |
| Metals & Mining Total | | | 30,734,865 | | |
| Paper & Forest Products – 0.5% | |
Schweitzer-Mauduit
International, Inc. | | | 172,100 | | | | 9,436,243 | | |
| Paper & Forest Products Total | | | 9,436,243 | | |
| Materials Total | | | 123,560,882 | | |
| Utilities – 3.0% | |
| Electric Utilities – 1.2% | |
| UIL Holdings Corp. | | | 435,000 | | | | 13,371,900 | | |
| Westar Energy, Inc. | | | 410,000 | | | | 10,660,000 | | |
| Electric Utilities Total | | | 24,031,900 | | |
| Gas Utilities – 1.8% | |
| New Jersey Resources Corp. | | | 440,600 | | | | 18,430,298 | | |
| South Jersey Industries, Inc. | | | 280,000 | | | | 15,360,800 | | |
| Gas Utilities Total | | | 33,791,098 | | |
| Utilities Total | | | 57,822,998 | | |
Total Common Stocks
(cost of $1,382,358,028) | | | 1,879,572,541 | | |
See Accompanying Notes to Financial Statements.
10
Columbia Small Cap Value Fund II
February 28, 2011
| Short-Term Obligation – 2.2% | |
| | | Par ($) | | Value ($) | |
Repurchase agreement with
Fixed Income Clearing Corp.,
dated 02/28/11, due 03/01/11
at 0.090%, collateralized by a
U.S. Government Agency
obligation maturing 01/15/14,
market value $44,049,600
(repurchase proceeds
$43,185,108) | | | 43,185,000 | | | | 43,185,000 | | |
Total Short-Term Obligation
(cost of $43,185,000) | | | 43,185,000 | | |
Total Investments – 99.8%
(cost of $1,425,543,028) (c) | | | 1,922,757,541 | | |
| Other Assets & Liabilities, Net – 0.2% | | | 2,899,075 | | |
| Net Assets – 100.0% | | | 1,925,656,616 | | |
Notes to Investment Portfolio:
(a) Non-income producing security.
(b) An affiliate may include any company in which the Fund owns five percent or more of its outstanding voting shares. Transactions in these affiliated companies which are or were affiliated during the year ended February 28, 2011, are as follows:
| Affiliate | | Value,
beginning of
period | | Purchases | | Sales
Proceeds | | Dividend
Income | | Value, end of
period | |
Brady Corp.,
Class A* | | $ | 11,908,500 | | | $ | 1,622,262 | | | $ | 1,260,289 | | | $ | 307,100 | | | $ | — | | |
C&D
Technologies,
Inc. | | | 2,310,000 | | | | — | | | | 288,675 | | | | — | | | | — | | |
Sterling
Bancorp NY | | | — | | | | 16,363,312 | | | | 442,642 | | | | 349,380 | | | | 15,562,000 | | |
| Total | | $ | 14,218,500 | | | $ | 17,985,574 | | | $ | 1,991,606 | | | $ | 656,480 | | | $ | 15,562,000 | | |
* At February 28, 2011, the Fund owns less than five percent of the company's outstanding voting shares.
(c) Cost for federal income tax purposes is $1,429,581,123.
Generally accepted accounting principles (GAAP) require disclosure regarding the inputs and valuation techniques used to measure fair value and any changes in valuation inputs or techniques. In addition, investments shall be disclosed by major category.
The Fund categorizes its fair value measurements according to a three-level hierarchy that maximizes the use of observable inputs and minimizes the use of unobservable inputs by prioritizing that the most observable input be used when available. Observable inputs are those that market participants would use in pricing an investment based on market data obtained from sources independent of the reporting entity. Unobservable inputs are those that reflect the Fund's assumptions about the information market participants would use in pricing an investment. An investment's level within the fair value hierarchy is based on the lowest level of any input that is deemed significant to the asset or liability's fair value measurement. The input levels are not necessarily an indication of the risk or liquidity associated with investments at that level. For example, certain U.S. government securities are generally high quality and liquid, however, they are reflected as Level 2 because the inputs used to determine fair value may not always be quoted prices in an active market.
Fair value inputs are summarized in the three broad levels listed below:
• Level 1—Valuations based on quoted prices for investments in active markets that the Fund has the ability to access at the measurement date (including NAV for open-end mutual funds). Valuation adjustments are not applied to Level 1 investments.
• Level 2—Valuations based on other significant observable inputs (including quoted prices for similar securities, interest rates, prepayment speeds, credit risks, etc.).
• Level 3—Valuations based on significant unobservable inputs (including the Fund's own assumptions and judgment in determining the fair value of investments).
Inputs that are used in determining fair value of an investment may include price information, credit data, volatility statistics, and other factors. These inputs can be either observable or unobservable. The availability of observable inputs can vary between investments, and is affected by various factors such as the type of investment, and the volume and level of activity for that investment or similar investments in the marketplace. The inputs will be considered by the Investment Manager, along with any other relevant factors in the calculation of an investment's fair value. The Fund uses prices and inputs that are current as of the measurement date, which may include periods of market dislocations. During these periods, the availability of prices and inputs may be reduced for many investments. This condition could cause an investment to be reclassified between the various levels within the hierarchy. Non-U.S. equity securities actively traded in foreign markets may be reflected in Level 2 despite the availability of closing prices, because the Fund evaluates and determines whether those closing prices reflect fair value at the close of the New York Stock Exchange (NYSE) or require adjustment, as described in Note 2 to the financial statements—Security Valuation.
Investments falling into the Level 3 category are primarily supported by quoted prices from brokers and dealers participating in the market for those investments. However, these may be classified as Level 3 investments due to lack of market transparency and corroboration to support these quoted prices. Additionally, valuation models may be used as the pricing source for any remaining investments classified as Level 3. These models rely on one or more significant unobservable inputs and/or significant assumptions by the Investment Manager. Inputs used in valuations may include, but are not limited to, financial statement analysis, capital account balances, discount rates and estimated cash flows, and comparable company data.
The following table is a summary of the inputs used to value the Fund's investments as of February 28, 2011:
| Description | | Quoted
Prices
(Level 1) | | Other
Significant
Observable
Inputs
(Level 2) | | Significant
Unobservable
Inputs
(Level 3) | | Total | |
| Total Common Stocks | | $ | 1,879,572,541 | | | $ | — | | | $ | — | | | $ | 1,879,572,541 | | |
Total Short-Term
Obligation | | | — | | | | 43,185,000 | | | | — | | | | 43,185,000 | | |
| Total Investments | | $ | 1,879,572,541 | | | $ | 43,185,000 | | | $ | — | | | $ | 1,922,757,541 | | |
The Fund's assets assigned to the Level 2 input category represent certain short-term obligations which are valued using amortized cost, an income approach which converts future cash flows to a present value based upon the discount or premium at purchase.
There were no significant transfers of financial assets between Levels 1 and 2 during the period.
See Accompanying Notes to Financial Statements.
11
Columbia Small Cap Value Fund II
February 28, 2011
At February 28, 2011, the Fund held investments in the following sectors:
| Sector (Unaudited) | | % of
Net Assets | |
| Financials | | | 27.2 | | |
| Industrials | | | 18.4 | | |
| Information Technology | | | 14.6 | | |
| Consumer Discretionary | | | 10.3 | | |
| Energy | | | 7.9 | | |
| Health Care | | | 6.7 | | |
| Materials | | | 6.4 | | |
| Consumer Staples | | | 3.1 | | |
| Utilities | | | 3.0 | | |
| | | | 97.6 | | |
| Short-Term Obligation | | | 2.2 | | |
| Other Assets & Liabilities, Net | | | 0.2 | | |
| | | | 100.0 | | |
| Acronym | | Name | |
| ADR | | American Depositary Receipt | |
|
See Accompanying Notes to Financial Statements.
12
Statement of Assets and Liabilities – Columbia Small Cap Value Fund II
February 28, 2011
| | | | | ($) | |
| Assets | | Unaffiliated investments, at identified cost | | | 1,409,724,391 | | |
| | | Affiliated investments, at identified cost | | | 15,818,637 | | |
| | | Total investments, at identified cost | | | 1,425,543,028 | | |
| | | Unaffiliated investments, at value | | | 1,907,195,541 | | |
| | | Affiliated investments, at value | | | 15,562,000 | | |
| | | Total investments, at value | | | 1,922,757,541 | | |
| | | Cash | | | 869 | | |
| | | Receivable for: | | | |
| | | Investments sold | | | 9,258,188 | | |
| | | Fund shares sold | | | 4,680,012 | | |
| | | Dividends | | | 1,214,818 | | |
| | | Interest | | | 108 | | |
| | | Expense reimbursement due from Investment Manager | | | 116,021 | | |
| | | Prepaid expenses | | | 5,609 | | |
| | | Total Assets | | | 1,938,033,166 | | |
| Liabilities | | Payable for: | | | |
| | | Investments purchased | | | 6,702,670 | | |
| | | Fund shares repurchased | | | 2,967,053 | | |
| | | Investment advisory fee | | | 933,901 | | |
| | | Administration fee | | | 236,637 | | |
| | | Pricing and bookkeeping fees | | | 11,969 | | |
| | | Transfer agent fee | | | 1,136,041 | | |
| | | Trustees' fees | | | 49,385 | | |
| | | Custody fee | | | 12,000 | | |
| | | Distribution and service fees | | | 139,112 | | |
| | | Chief compliance officer expenses | | | 420 | | |
| | | Other liabilities | | | 187,362 | | |
| | | Total Liabilities | | | 12,376,550 | | |
| | | Net Assets | | | 1,925,656,616 | | |
| Net Assets Consist of | | Paid-in capital | | | 1,619,259,595 | | |
| | | Accumulated net realized loss | | | (190,817,492 | ) | |
| | | Net unrealized appreciation on investments | | | 497,214,513 | | |
| | | Net Assets | | | 1,925,656,616 | | |
See Accompanying Notes to Financial Statements.
13
Statement of Assets and Liabilities (continued) – Columbia Small Cap Value Fund II
February 28, 2011
| Class A | | Net assets | | $ | 565,730,173 | | |
| | | Shares outstanding | | | 38,303,962 | | |
| | | Net asset value per share | | $ | 14.77 | (a) | |
| | | Maximum sales charge | | | 5.75 | % | |
| | | Maximum offering price per share ($14.77/0.9425) | | $ | 15.67 | (b) | |
| Class B | | Net assets | | $ | 3,093,331 | | |
| | | Shares outstanding | | | 219,378 | | |
| | | Net asset value and offering price per share | | $ | 14.10 | (a) | |
| Class C | | Net assets | | $ | 23,320,725 | | |
| | | Shares outstanding | | | 1,655,283 | | |
| | | Net asset value and offering price per share | | $ | 14.09 | (a) | |
| Class I (c) | | Net assets | | $ | 29,389,870 | | |
| | | Shares outstanding | | | 1,976,897 | | |
| | | Net asset value, offering and redemption price per share | | $ | 14.87 | | |
| Class R | | Net assets | | $ | 27,449,726 | | |
| | | Shares outstanding | | | 1,866,393 | | |
| | | Net asset value, offering and redemption price per share | | $ | 14.71 | | |
| Class Z | | Net assets | | $ | 1,276,672,791 | | |
| | | Shares outstanding | | | 85,852,057 | | |
| | | Net asset value, offering and redemption price share | | $ | 14.87 | | |
(a) Redemption price per share is equal to net asset value less any applicable contingent deferred sales charge.
(b) On sales of $50,000 or more the offering price is reduced.
(c) Class I shares commenced operations on September 27, 2010.
See Accompanying Notes to Financial Statements.
14
Statement of Operations – Columbia Small Cap Value Fund II
For the Year Ended February 28, 2011
| | | | | ($)(a) | |
| Investment Income | | Dividends | | | 20,663,649 | | |
| | | Dividends from affiliates | | | 656,480 | | |
| | | Interest | | | 44,275 | | |
| | | Foreign taxes withheld | | | (23,906 | ) | |
| | | Total Investment Income | | | 21,340,498 | | |
| Expenses | | Investment advisory fee | | | 10,361,994 | | |
| | | Administration fee | | | 2,583,398 | | |
| | | Distribution fee: | | | |
| | | Class B | | | 22,020 | | |
| | | Class C | | | 167,051 | | |
| | | Class R | | | 125,258 | | |
| | | Service fee: | | | |
| | | Class B | | | 7,340 | | |
| | | Class C | | | 55,684 | | |
| | | Distribution and service fees: | | | |
| | | Class A | | | 1,201,378 | | |
| | | Transfer agent fee: | | | |
| | | Class A, Class B, Class C, Class R and Class Z | | | 3,926,411 | | |
| | | Pricing and bookkeeping fees | | | 142,013 | | |
| | | Trustees' fees | | | 47,966 | | |
| | | Custody fee | | | 43,850 | | |
| | | Chief compliance officer expenses | | | 2,496 | | |
| | | Other expenses | | | 620,799 | | |
| | | Total Expenses | | | 19,307,658 | | |
| | | Fees waived or expenses reimbursed by Investment Manager | | | (116,139 | ) | |
| | | Expense reductions | | | (56 | ) | |
| | | Net Expenses | | | 19,191,463 | | |
| | | Net Investment Income | | | 2,149,035 | | |
| Net Realized and Unrealized Gain (Loss) on Investments and Foreign Currency | | Net realized gain (loss) on: | | | | | |
| | | Unaffiliated investments | | | 159,675,655 | | |
| | | Affiliated investments | | | (8,250,803 | ) | |
| | | Foreign currency transactions | | | 1,346 | | |
| | | Net realized gain | | | 151,426,198 | | |
| | | Net change in unrealized appreciation (depreciation) on investments | | | 338,087,442 | | |
| | | Net Gain | | | 489,513,640 | | |
| | | Net Increase Resulting from Operations | | | 491,662,675 | | |
(a) Class I shares commenced operations on September 27, 2010.
See Accompanying Notes to Financial Statements.
15
Statement of Changes in Net Assets – Columbia Small Cap Value Fund II
| | | | | Year Ended February 28, | |
| Increase (Decrease) in Net Assets | | | | 2011 ($)(a)(b) | | 2010 ($) | |
| Operations | | Net investment income | | | 2,149,035 | | | | 7,052,272 | | |
| | | Net realized gain (loss) on investments and foreign
currency transactions | | | 151,426,198 | | | | (118,900,672 | ) | |
| | | Net change in unrealized appreciation (depreciation)
on investments | | | 338,087,442 | | | | 657,053,898 | | |
| | | Net increase resulting from operations | | | 491,662,675 | | | | 545,205,498 | | |
| Distributions to Shareholders | | From net investment income: | | | | | | | | | |
| | | Class A | | | (891,307 | ) | | | (1,714,316 | ) | |
| | | Class I | | | (13,012 | ) | | | — | | |
| | | Class R | | | — | | | | (57,675 | ) | |
| | | Class Z | | | (4,044,374 | ) | | | (5,280,281 | ) | |
| | | From return of capital: | | | | | |
| | | Class A | | | — | | | | (175,829 | ) | |
| | | Class R | | | — | | | | (5,915 | ) | |
| | | Class Z | | | — | | | | (541,574 | ) | |
| | | Total distributions to shareholders | | | (4,948,693 | ) | | | (7,775,590 | ) | |
| | | Net Capital Stock Transactions | | | 22,716,511 | | | | 62,677,087 | | |
| | | Total increase in net assets | | | 509,430,493 | | | | 600,106,995 | | |
| Net Assets | | Beginning of period | | | 1,416,226,123 | | | | 816,119,128 | | |
| | | End of period | | | 1,925,656,616 | | | | 1,416,226,123 | | |
| | | Undistributed net investment income at end of period | | | — | | | | — | | |
(a) Class I shares commenced operations on September 27, 2010.
(b) Class I shares reflect activity for the period September 27, 2010 through February 28, 2011.
See Accompanying Notes to Financial Statements.
16
Statement of Changes in Net Assets (continued) – Columbia Small Cap Value Fund II
| | | Capital Stock Activity | |
| | | Year Ended
February 28, 2011 | | Year Ended
February 28, 2010 | |
| | | Shares | | Dollars ($) | | Shares | | Dollars ($) | |
| Class A | |
| Subscriptions | | | 17,064,975 | | | | 208,171,695 | | | | 16,882,535 | | | | 160,610,818 | | |
| Distributions reinvested | | | 59,530 | | | | 804,823 | | | | 161,026 | | | | 1,682,721 | | |
| Redemptions | | | (16,377,823 | ) | | | (206,729,842 | ) | | | (14,467,480 | ) | | | (137,280,953 | ) | |
| Net increase | | | 746,682 | | | | 2,246,676 | | | | 2,576,081 | | | | 25,012,586 | | |
| Class B | |
| Subscriptions | | | 398 | | | | 5,333 | | | | 1,997 | | | | 18,579 | | |
| Redemptions | | | (66,707 | ) | | | (769,319 | ) | | | (81,783 | ) | | | (731,165 | ) | |
| Net decrease | | | (66,309 | ) | | | (763,986 | ) | | | (79,786 | ) | | | (712,586 | ) | |
| Class C | |
| Subscriptions | | | 44,522 | | | | 522,687 | | | | 113,786 | | | | 1,015,570 | | |
| Redemptions | | | (614,679 | ) | | | (7,073,611 | ) | | | (1,303,758 | ) | | | (11,623,525 | ) | |
| Net decrease | | | (570,157 | ) | | | (6,550,924 | ) | | | (1,189,972 | ) | | | (10,607,955 | ) | |
| Class I (a)(b) | |
| Subscriptions | | | 2,146,515 | | | | 29,206,217 | | | | — | | | | — | | |
| Distributions reinvested | | | 956 | | | | 12,997 | | | | — | | | | — | | |
| Redemptions | | | (170,574 | ) | | | (2,419,814 | ) | | | — | | | | — | | |
| Net increase | | | 1,976,897 | | | | 26,799,400 | | | | — | | | | — | | |
| Class R | |
| Subscriptions | | | 697,476 | | | | 8,498,927 | | | | 686,240 | | | | 6,326,881 | | |
| Distributions reinvested | | | — | | | | — | | | | 5,492 | | | | 57,226 | | |
| Redemptions | | | (897,871 | ) | | | (11,067,717 | ) | | | (820,740 | ) | | | (7,835,346 | ) | |
| Net decrease | | | (200,395 | ) | | | (2,568,790 | ) | | | (129,008 | ) | | | (1,451,239 | ) | |
| Class Z | |
| Subscriptions | | | 26,926,886 | | | | 329,536,996 | | | | 29,773,189 | | | | 280,330,566 | | |
| Distributions reinvested | | | 208,130 | | | | 2,832,654 | | | | 391,889 | | | | 4,118,759 | | |
| Redemptions | | | (26,932,907 | ) | | | (328,815,515 | ) | | | (24,297,675 | ) | | | (234,013,044 | ) | |
| Net increase | | | 202,109 | | | | 3,554,135 | | | | 5,867,403 | | | | 50,436,281 | | |
(a) Class I shares commenced operations on September 27, 2010.
(b) Class I shares reflect activity for the period September 27, 2010 through February 28, 2011.
See Accompanying Notes to Financial Statements.
17
Financial Highlights – Columbia Small Cap Value Fund II
Selected data for a share outstanding throughout each period is as follows:
| | | Year Ended February 28, | | Year Ended
February 29, | | Period Ended
February 28, | | Year Ended
March 31, | |
| Class A Shares | | 2011 | | 2010 | | 2009 | | 2008 | | 2007 (a) | | 2006 (b) | |
| Net Asset Value, Beginning of Period | | $ | 11.05 | | | $ | 6.74 | | | $ | 12.21 | | | $ | 13.86 | | | $ | 14.12 | | | $ | 12.52 | | |
| Income from Investment Operations: | |
| Net investment income (loss) (c) | | | — | (d) | | | 0.04 | | | | 0.11 | | | | 0.06 | | | | 0.03 | | | | 0.04 | | |
Net realized and unrealized gain (loss)
on investments and foreign currency | | | 3.74 | | | | 4.32 | | | | (5.47 | ) | | | (1.21 | ) | | | 0.65 | | | | 2.98 | | |
| Total from investment operations | | | 3.74 | | | | 4.36 | | | | (5.36 | ) | | | (1.15 | ) | | | 0.68 | | | | 3.02 | | |
| Less Distributions to Shareholders: | |
| From net investment income | | | (0.02 | ) | | | (0.04 | ) | | | (0.11 | ) | | | (0.05 | ) | | | (0.01 | ) | | | (0.03 | ) | |
| From net realized gains | | | — | | | | — | | | | — | | | | (0.45 | ) | | | (0.93 | ) | | | (1.39 | ) | |
| From return of capital | | | — | | | | (0.01 | ) | | | — | | | | — | | | | — | | | | — | | |
| Total distributions to shareholders | | | (0.02 | ) | | | (0.05 | ) | | | (0.11 | ) | | | (0.50 | ) | | | (0.94 | ) | | | (1.42 | ) | |
| Net Asset Value, End of Period | | $ | 14.77 | | | $ | 11.05 | | | $ | 6.74 | | | $ | 12.21 | | | $ | 13.86 | | | $ | 14.12 | | |
| Total return (e) | | | 33.89 | %(f) | | | 64.73 | % | | | (44.03 | )% | | | (8.74 | )% | | | 5.49 | %(g) | | | 26.14 | % | |
Ratios to Average Net Assets/
Supplemental Data: | |
| Net expenses (h) | | | 1.35 | % | | | 1.32 | % | | | 1.28 | % | | | 1.26 | % | | | 1.27 | %(i) | | | 1.23 | % | |
| Waiver/Reimbursement | | | 0.01 | % | | | — | | | | — | | | | — | | | | — | | | | — | | |
| Net investment income (loss) (h) | | | (0.01 | )% | | | 0.44 | % | | | 1.05 | % | | | 0.46 | % | | | 0.25 | %(i) | | | 0.33 | % | |
| Portfolio turnover rate | | | 60 | % | | | 70 | % | | | 56 | % | | | 41 | % | | | 61 | %(g) | | | 80 | % | |
| Net assets, end of period (000s) | | $ | 565,730 | | | $ | 414,901 | | | $ | 235,871 | | | $ | 368,060 | | | $ | 118,549 | | | $ | 8,646 | | |
(a) The Fund changed its fiscal year end from March 31 to February 28. Per share data and total return reflect activity from April 1, 2006 through February 28, 2007.
(b) On August 22, 2005, the Fund's Investor A shares were renamed Class A shares.
(c) Per share data was calculated using the average shares outstanding during the period.
(d) Rounds to less than $0.01 per share.
(e) Total return at net asset value assuming all distributions reinvested and no initial sales charge or contingent deferred sales charge.
(f) Had the Investment Manager and/or any of its affiliates not waived fees or reimbursed a portion of expenses, total return would have been reduced.
(g) Not annualized.
(h) The benefits derived from expense reductions had an impact of less than 0.01%.
(i) Annualized.
See Accompanying Notes to Financial Statements.
18
Financial Highlights – Columbia Small Cap Value Fund II
Selected data for a share outstanding throughout each period is as follows:
| | | Year Ended February 28, | | Year Ended
February 29, | | Period Ended
February 28, | | Year Ended
March 31, | |
| Class B Shares | | 2011 | | 2010 | | 2009 | | 2008 | | 2007 (a) | | 2006 (b) | |
| Net Asset Value, Beginning of Period | | $ | 10.61 | | | $ | 6.49 | | | $ | 11.74 | | | $ | 13.41 | | | $ | 13.76 | | | $ | 12.28 | | |
| Income from Investment Operations: | |
| Net investment income (loss) (c) | | | (0.09 | ) | | | (0.03 | ) | | | 0.03 | | | | (0.04 | ) | | | (0.06 | ) | | | (0.05 | ) | |
Net realized and unrealized gain (loss)
on investments and foreign currency | | | 3.58 | | | | 4.15 | | | | (5.24 | ) | | | (1.18 | ) | | | 0.64 | | | | 2.90 | | |
| Total from investment operations | | | 3.49 | | | | 4.12 | | | | (5.21 | ) | | | (1.22 | ) | | | 0.58 | | | | 2.85 | | |
| Less Distributions to Shareholders: | |
| From net investment income | | | — | | | | — | | | | (0.04 | ) | | | — | | | | — | | | | — | | |
| From net realized gains | | | — | | | | — | | | | — | | | | (0.45 | ) | | | (0.93 | ) | | | (1.37 | ) | |
| Total distributions to shareholders | | | — | | | | — | | | | (0.04 | ) | | | (0.45 | ) | | | (0.93 | ) | | | (1.37 | ) | |
| Net Asset Value, End of Period | | $ | 14.10 | | | $ | 10.61 | | | $ | 6.49 | | | $ | 11.74 | | | $ | 13.41 | | | $ | 13.76 | | |
| Total return (d) | | | 32.89 | %(e) | | | 63.48 | % | | | (44.46 | )% | | | (9.49 | )% | | | 4.82 | %(f) | | | 25.12 | % | |
Ratios to Average Net Assets/
Supplemental Data: | |
| Net expenses (g) | | | 2.10 | % | | | 2.07 | % | | | 2.03 | % | | | 2.01 | % | | | 2.02 | %(h) | | | 1.98 | % | |
| Waiver/Reimbursement | | | 0.01 | % | | | — | | | | — | | | | — | | | | — | | | | — | | |
| Net investment income (loss) (g) | | | (0.77 | )% | | | (0.29 | )% | | | 0.29 | % | | | (0.28 | )% | | | (0.53 | )%(h) | | | (0.43 | )% | |
| Portfolio turnover rate | | | 60 | % | | | 70 | % | | | 56 | % | | | 41 | % | | | 61 | %(f) | | | 80 | % | |
| Net assets, end of period (000s) | | $ | 3,093 | | | $ | 3,031 | | | $ | 2,373 | | | $ | 5,248 | | | $ | 3,746 | | | $ | 2,158 | | |
(a) The Fund changed its fiscal year end from March 31 to February 28. Per share data and total return reflect activity from April 1, 2006 through February 28, 2007.
(b) On August 22, 2005, the Fund's Investor B shares were renamed Class B shares.
(c) Per share data was calculated using the average shares outstanding during the period.
(d) Total return at net asset value assuming all distributions reinvested and no contingent deferred sales charge.
(e) Had the Investment Manager and/or any of its affiliates not waived fees or reimbursed a portion of expenses, total return would have been reduced.
(f) Not annualized.
(g) The benefits derived from expense reductions had an impact of less than 0.01%.
(h) Annualized.
See Accompanying Notes to Financial Statements.
19
Financial Highlights – Columbia Small Cap Value Fund II
Selected data for a share outstanding throughout each period is as follows:
| | | Year Ended February 28, | | Year Ended
February 29, | | Period Ended
February 28, | | Year Ended
March 31, | |
| Class C Shares | | 2011 | | 2010 | | 2009 | | 2008 | | 2007 (a) | | 2006 (b) | |
| Net Asset Value, Beginning of Period | | $ | 10.60 | | | $ | 6.49 | | | $ | 11.73 | | | $ | 13.40 | | | $ | 13.75 | | | $ | 12.27 | | |
| Income from Investment Operations: | |
| Net investment income (loss) (c) | | | (0.09 | ) | | | (0.02 | ) | | | 0.03 | | | | (0.04 | ) | | | (0.06 | ) | | | (0.04 | ) | |
Net realized and unrealized gain (loss)
on investments and foreign currency | | | 3.58 | | | | 4.13 | | | | (5.23 | ) | | | (1.18 | ) | | | 0.64 | | | | 2.89 | | |
| Total from investment operations | | | 3.49 | | | | 4.11 | | | | (5.20 | ) | | | (1.22 | ) | | | 0.58 | | | | 2.85 | | |
| Less Distributions to Shareholders: | |
| From net investment income | | | — | | | | — | | | | (0.04 | ) | | | — | | | | — | | | | — | | |
| From net realized gains | | | — | | | | — | | | | — | | | | (0.45 | ) | | | (0.93 | ) | | | (1.37 | ) | |
| Total distributions to shareholders | | | — | | | | — | | | | (0.04 | ) | | | (0.45 | ) | | | (0.93 | ) | | | (1.37 | ) | |
| Net Asset Value, End of Period | | $ | 14.09 | | | $ | 10.60 | | | $ | 6.49 | | | $ | 11.73 | | | $ | 13.40 | | | $ | 13.75 | | |
| Total return (d) | | | 32.92 | %(e) | | | 63.33 | % | | | (44.41 | )% | | | (9.49 | )% | | | 4.83 | %(f) | | | 25.14 | % | |
Ratios to Average Net Assets/
Supplemental Data: | |
| Net expenses (g) | | | 2.10 | % | | | 2.07 | % | | | 2.03 | % | | | 2.01 | % | | | 2.02 | %(h) | | | 1.98 | % | |
| Waiver/Reimbursement | | | 0.01 | % | | | — | | | | — | | | | — | | | | — | | | | — | | |
| Net investment income (loss) (g) | | | (0.77 | )% | | | (0.27 | )% | | | 0.29 | % | | | (0.29 | )% | | | (0.49 | )%(h) | | | (0.32 | )% | |
| Portfolio turnover rate | | | 60 | % | | | 70 | % | | | 56 | % | | | 41 | % | | | 61 | %(f) | | | 80 | % | |
| Net assets, end of period (000s) | | $ | 23,321 | | | $ | 23,588 | | | $ | 22,159 | | | $ | 46,303 | | | $ | 17,032 | | �� | $ | 1,671 | | |
(a) The Fund changed its fiscal year end from March 31 to February 28. Per share data and total return reflect activity from April 1, 2006 through February 28, 2007.
(b) On August 22, 2005, the Fund's Investor C shares were renamed Class C shares.
(c) Per share data was calculated using the average shares outstanding during the period.
(d) Total return at net asset value assuming all distributions reinvested and no contingent deferred sales charge.
(e) Had the Investment Manager and/or any of its affiliates not waived fees or reimbursed a portion of expenses, total return would have been reduced.
(f) Not annualized.
(g) The benefits derived from expense reductions had an impact of less than 0.01%.
(h) Annualized.
See Accompanying Notes to Financial Statements.
20
Financial Highlights – Columbia Small Cap Value Fund II
Selected data for a share outstanding throughout the period is as follows:
| Class I Shares | | Period Ended
February 28,
2011 (a) | |
| Net Asset Value, Beginning of Period | | $ | 11.72 | | |
| Income from Investment Operations: | |
| Net investment loss (b) | | | (0.01 | ) | |
| Net realized and unrealized gain on investments and foreign currency | | | 3.23 | | |
| Total from investment operations | | | 3.22 | | |
| Less Distributions to Shareholders: | |
| From net investment income | | | (0.07 | ) | |
| Net Asset Value, End of Period | | $ | 14.87 | | |
| Total return (c)(d) | | | 27.55 | % | |
| Ratios to Average Net Assets/Supplemental Data: | |
| Net expenses (e)(f) | | | 0.92 | % | |
| Net investment loss (e)(f) | | | (0.12 | )% | |
| Portfolio turnover rate (d) | | | 60 | % | |
| Net assets, end of period (000s) | | $ | 29,390 | | |
(a) Class I shares commenced operations on September 27, 2010. Per share data and total return reflect activity from that date.
(b) Per share data was calculated using the average shares outstanding during the period.
(c) Total return at net asset value assuming all distributions reinvested.
(d) Not annualized.
(e) The benefits derived from expense reductions had an impact of less than 0.01%.
(f) Annualized.
See Accompanying Notes to Financial Statements.
21
Financial Highlights – Columbia Small Cap Value Fund II
Selected data for a share outstanding throughout each period is as follows:
| | | Year Ended February 28, | | Year Ended
February 29, | | Period Ended
February 28, | | Period Ended
March 31, | |
| Class R Shares | | 2011 | | 2010 | | 2009 | | 2008 | | 2007 (a) | | 2006 (b) | |
| Net Asset Value, Beginning of Period | | $ | 11.01 | | | $ | 6.72 | | | $ | 12.17 | | | $ | 13.83 | | | $ | 14.11 | | | $ | 12.93 | | |
| Income from Investment Operations: | |
| Net investment income (loss) (c) | | | (0.03 | ) | | | 0.02 | | | | 0.09 | | | | 0.03 | | | | — | (d) | | | — | | |
Net realized and unrealized gain (loss)
on investments and foreign currency | | | 3.73 | | | | 4.30 | | | | (5.45 | ) | | | (1.22 | ) | | | 0.65 | | | | 1.18 | | |
| Total from investment operations | | | 3.70 | | | | 4.32 | | | | (5.36 | ) | | | (1.19 | ) | | | 0.65 | | | | 1.18 | | |
| Less Distributions to Shareholders: | |
| From net investment income | | | — | | | | (0.03 | ) | | | (0.09 | ) | | | (0.02 | ) | | | — | | | | — | | |
| From net realized gains | | | — | | | | — | | | | — | | | | (0.45 | ) | | | (0.93 | ) | | | — | | |
| From return of capital | | | — | | | | — | (d) | | | — | | | | — | | | | — | | | | — | | |
| Total distributions to shareholders | | | — | | | | (0.03 | ) | | | (0.09 | ) | | | (0.47 | ) | | | (0.93 | ) | | | — | | |
| Net Asset Value, End of Period | | $ | 14.71 | | | $ | 11.01 | | | $ | 6.72 | | | $ | 12.17 | | | $ | 13.83 | | | $ | 14.11 | | |
| Total return (e) | | | 33.61 | %(f) | | | 64.32 | % | | | (44.18 | )% | | | (9.03 | )% | | | 5.22 | %(g) | | | 9.13 | %(g) | |
Ratios to Average Net Assets/
Supplemental Data: | |
| Net expenses (h) | | | 1.60 | % | | | 1.57 | % | | | 1.53 | % | | | 1.51 | % | | | 1.52 | %(i) | | | 1.36 | %(i) | |
| Waiver/Reimbursement | | | 0.01 | % | | | — | | | | — | | | | — | | | | — | | | | — | | |
| Net investment income (loss) (h) | | | (0.26 | )% | | | 0.20 | % | | | 0.82 | % | | | 0.20 | % | | | (0.02 | )%(i) | | | 0.03 | %(i) | |
| Portfolio turnover rate | | | 60 | % | | | 70 | % | | | 56 | % | | | 41 | % | | | 61 | %(g) | | | 80 | %(g) | |
| Net assets, end of period (000s) | | $ | 27,450 | | | $ | 22,755 | | | $ | 14,765 | | | $ | 13,851 | | | $ | 1,727 | | | $ | 11 | | |
(a) The Fund changed its fiscal year end from March 31 to February 28. Per share data and total return reflect activity from April 1, 2006 through February 28, 2007.
(b) Class R shares commenced operations on January 23, 2006. Per share data and total return reflects activity from that date.
(c) Per share data was calculated using the average shares outstanding during the period.
(d) Rounds to less than $0.01 per share.
(e) Total return at net asset value assuming all distributions reinvested.
(f) Had the Investment Manager and/or any of its affiliates not waived fees or reimbursed a portion of expenses, total return would have been reduced.
(g) Not annualized.
(h) The benefits derived from expense reductions had an impact of less than 0.01%.
(i) Annualized.
See Accompanying Notes to Financial Statements.
22
Financial Highlights – Columbia Small Cap Value Fund II
Selected data for a share outstanding throughout each period is as follows:
| | | Year Ended February 28, | | Year Ended
February 29, | | Period Ended
February 28, | | Year Ended
March 31, | |
| Class Z Shares | | 2011 | | 2010 | | 2009 | | 2008 | | 2007 (a) | | 2006 (b) | |
| Net Asset Value, Beginning of Year | | $ | 11.11 | | | $ | 6.78 | | | $ | 12.29 | | | $ | 13.95 | | | $ | 14.21 | | | $ | 12.60 | | |
| Income from Investment Operations: | |
| Net investment income (c) | | | 0.03 | | | | 0.07 | | | | 0.14 | | | | 0.10 | | | | 0.06 | | | | 0.07 | | |
Net realized and unrealized gain (loss) on
investments and foreign currency | | | 3.78 | | | | 4.33 | | | | (5.51 | ) | | | (1.23 | ) | | | 0.67 | | | | 3.00 | | |
| Total from investment operations | | | 3.81 | | | | 4.40 | | | | (5.37 | ) | | | (1.13 | ) | | | 0.73 | | | | 3.07 | | |
| Less Distributions to Shareholders: | |
| From net investment income | | | (0.05 | ) | | | (0.06 | ) | | | (0.14 | ) | | | (0.08 | ) | | | (0.06 | ) | | | (0.06 | ) | |
| From net realized gains | | | — | | | | — | | | | — | | | | (0.45 | ) | | | (0.93 | ) | | | (1.40 | ) | |
| From return of capital | | | — | | | | (0.01 | ) | | | — | | | | — | | | | — | | | | — | | |
| Total distributions to shareholders | | | (0.05 | ) | | | (0.07 | ) | | | (0.14 | ) | | | (0.53 | ) | | | (0.99 | ) | | | (1.46 | ) | |
| Net Asset Value, End of Period | | $ | 14.87 | | | $ | 11.11 | | | $ | 6.78 | | | $ | 12.29 | | | $ | 13.95 | | | $ | 14.21 | | |
| Total return (d) | | | 34.31 | %(e) | | | 64.94 | % | | | (43.87 | )% | | | (8.55 | )% | | | 5.77 | %(f) | | | 26.43 | % | |
Ratios to Average Net Assets/
Supplemental Data: | |
| Net expenses (g) | | | 1.10 | % | | | 1.07 | % | | | 1.03 | % | | | 1.01 | % | | | 1.02 | %(h) | | | 0.98 | % | |
| Waiver/Reimbursement | | | 0.01 | % | | | — | | | | — | | | | — | | | | — | | | | — | | |
| Net investment income (g) | | | 0.23 | % | | | 0.68 | % | | | 1.33 | % | | | 0.71 | % | | | 0.47 | %(h) | | | 0.56 | % | |
| Portfolio turnover rate | | | 60 | % | | | 70 | % | | | 56 | % | | | 41 | % | | | 61 | %(f) | | | 80 | % | |
| Net assets, end of period (000s) | | $ | 1,276,673 | | | $ | 951,951 | | | $ | 540,951 | | | $ | 654,658 | | | $ | 393,160 | | | $ | 238,856 | | |
(a) The Fund changed its fiscal year ended from March 31, to February 28. Per share data and total return reflect activity from April 1, 2006 through February 28, 2007.
(b) On August 22, 2005, the Fund's Primary A shares were renamed Class Z shares.
(c) Per share data was calculated using the average shares outstanding during the period.
(d) Total return at net asset value assuming all distributions reinvested.
(e) Had the Investment Manager and/or any of its affiliates not waived fees or reimbursed a portion of expenses, total return would have been reduced.
(f) Not annualized.
(g) The benefits derived from expense reductions had an impact of less than 0.01%.
(h) Annualized.
See Accompanying Notes to Financial Statements.
23
Notes to Financial Statements – Columbia Small Cap Value Fund II
February 28, 2011
Note 1. Organization
Columbia Small Cap Value Fund II (the Fund), a series of Columbia Funds Series Trust (the Trust), is a diversified fund. The Trust is registered under the Investment Company Act of 1940, as amended (the 1940 Act), as an open-end management investment company organized as a Delaware statutory trust.
After the close of business on April 30, 2010, Ameriprise Financial, Inc. (Ameriprise Financial) acquired a portion of the asset management business of Columbia Management Group, LLC (the Transaction), including the business of managing the Fund. In connection with the closing of the Transaction (the Closing), RiverSource Investments, LLC, a wholly owned subsidiary of Ameriprise Financial, became the investment manager of the Fund and changed its name to Columbia Management Investment Advisers, LLC (the Investment Manager).
Investment Objective
The Fund seeks long-term capital appreciation.
Fund Shares
The Trust has unlimited authorized shares of beneficial interest. The Fund offers Class A, Class B, Class C, Class I, Class R and Class Z shares. On December 17, 2010, the Investment Manager exchanged Class Z shares valued at $23,865,364 for Class I shares. All share classes have identical voting, dividend and liquidation rights. Each share class has its own expense structure and sales charges, as applicable.
Class A shares are subject to a maximum front-end sales charge of 5.75% based on the investment amount. Class A shares purchased without an initial sales charge in accounts aggregating $1 million to $50 million at the time of purchase are subject to a 1.00% contingent deferred sales charge (CDSC) if the shares are sold within 18 months of purchase, charged as follows: 1.00% CDSC if redeemed within 12 months of purchase, and 0.50% CDSC if redeemed more than 12, but less than 18 months after purchase.
The Fund no longer accepts investments by new or existing investors in the Fund's Class B shares, except in connection with the reinvestment of any dividend and/or capital gain distributions in Class B shares of the Fund and exchanges by existing Class B shareholders of certain other funds within the Columbia Family of Funds. Class B shares may be subject to a maximum CDSC of 5.00% based upon the holding period after purchase. Class B shares will generally convert to Class A shares eight years after purchase.
Class C shares are subject to a 1.00% CDSC on shares redeemed within one year of purchase.
Class I shares are not subject to sales charges and are available only to the Columbia Family of Funds. Class I shares became effective September 27, 2010.
Class R shares are not subject to sales charges and are available only to qualifying institutional investors.
Class Z shares are not subject to sales charges and are available only to certain investors, as described in the Fund's prospectus.
Note 2. Summary of Significant Accounting Policies
The preparation of financial statements in accordance with U.S. generally accepted accounting principles (GAAP) requires the Investment Manager to make certain estimates and assumptions that affect the reported amounts of assets and liabilities, the disclosure of contingent assets and liabilities at the date of the financial statements and the reported amounts of revenue and expenses during the reporting period. Actual results could differ from those estimates.
The following is a summary of significant accounting policies consistently followed by the Fund in the preparation of its financial statements.
Security Valuation
Equity securities are valued at the last sale price on the principal exchange on which they trade, except for securities traded on the NASDAQ, which are valued at the NASDAQ official close price. Unlisted securities or listed securities for which there were no sales during the day are valued at the closing bid price on such exchanges or over-the-counter markets.
Short-term investments maturing in 60 days or less are valued at amortized cost, which approximates market value.
Foreign securities are generally valued at the last sale price on the foreign exchange or market on which they trade. If any foreign share prices are not readily available as a result of limited share activity, the securities are valued at the last sale price of the local shares in the principal market in which such securities are normally traded.
Generally, trading in foreign securities is substantially completed each day at various times prior to the close of the New York Stock Exchange (NYSE). The values of such securities used in computing the net asset value of the Fund's shares are determined as of such times. Foreign currency exchange rates are generally determined at 4:00 p.m. Eastern (U.S.) time. Occasionally, events affecting the values of such foreign securities may occur between the times at which they are determined and the close of the customary trading session of the NYSE, which would not be reflected in the
24
Columbia Small Cap Value Fund II, February 28, 2011
computation of the Fund's net asset value. If events materially affecting the values of such foreign securities occur and it is determined that market quotations are not reliable, then these foreign securities will be valued at their fair value using procedures approved by the Board of Trustees.
Investments for which market quotations are not readily available, or that have quotations which the Investment Manager believes are not reliable, are valued at fair value as determined in good faith under consistently applied procedures established by and under the general supervision of the Board of Trustees. If a security is valued at fair value, such value is likely to be different from the last quoted market price for the security. The determination of fair value often requires significant judgment. To determine fair value, the Investment Manager may use assumptions including but not limited to future cash flows and estimated risk premiums. Multiple inputs from various sources may be used to determine value.
Foreign Currency Transactions and Translations
The values of all assets and liabilities quoted in foreign currencies are translated into U.S. dollars at that day's exchange rates. Net realized and unrealized gains (losses) on foreign currency transactions and translations include gains (losses) arising from the fluctuation in exchange rates between trade and settlement dates on securities transactions, gains (losses) arising from the disposition of foreign currency and currency gains (losses) between the accrual and payment dates on dividends, interest income and foreign withholding taxes.
For financial statement purposes, the Fund does not distinguish that portion of gains (losses) on investments which is due to changes in foreign exchange rates from that which is due to changes in market prices of the investments. Such fluctuations are included with the net realized and unrealized gains (losses) on investments on the Statement of Operations.
Repurchase Agreements
The Fund may engage in repurchase agreement transactions with institutions that the Investment Manager has determined are creditworthy. The Fund, through the custodian, receives delivery of the underlying securities collateralizing a repurchase agreement. The Investment Manager is responsible for determining that the collateral is at least equal, at all times, to the value of the repurchase obligation including interest. A repurchase agreement transaction involves certain risks in the event of default or insolvency of the counterparty. These risks include possible delays in or restrictions on the Fund's ability to dispose of the underlying securities and a possible decline in the value of the underlying securities during the period while the Fund seeks to assert its rights.
Security Transactions
Security transactions are accounted for on the trade date. Cost is determined and gains (losses) are based upon the specific identification method for both financial statement and federal income tax purposes.
Awards from class action litigation are recorded as a reduction of cost if the Fund still owns the applicable securities on the payment date. If the Fund no longer owns the applicable securities, the proceeds are recorded as realized gains.
Income Recognition
Interest income is recorded on the accrual basis.
Corporate actions and dividend income are recorded on the ex-date.
The Fund receives information regarding the character of distributions received from real estate investment trusts (REITs) on an annual basis. Distributions received from REITs are allocated among dividend income, capital gain and return of capital based upon such information or based on management's estimates if actual information has not yet been reported. Management's estimates are subsequently adjusted when the actual character of the distributions are disclosed by the REITs which could result in a proportionate increase in returns of capital to shareholders.
Distributions received from real estate investment trusts (REITs) in excess of their income are recorded as a reduction of the cost of the related investments. If the Fund no longer owns the applicable securities, any distributions received in excess of income are recorded as realized gains.
Expenses
General expenses of the Trust are allocated to the Fund and other series of the Trust based upon relative net assets or other expense allocation methodologies determined by the nature of the expense. Expenses directly attributable to a specific class of shares are charged to that share class. Expenses directly attributable to the Fund are charged to the Fund.
Determination of Class Net Asset Value
All income, expenses (other than class-specific expenses which are charged directly to a share class, as shown in the Statement of
25
Columbia Small Cap Value Fund II, February 28, 2011
Operations) and realized and unrealized gains (losses) are allocated to each class of the Fund on a daily basis for purposes of determining the net asset value of each class. Income and expenses are allocated to each class based on the settled shares method, while realized and unrealized gains (losses) are allocated based on the relative net assets of each class.
Federal Income Tax Status
The Fund intends to qualify each year as a regulated investment company under Subchapter M of the Internal Revenue Code, as amended, and will distribute substantially all of its taxable income, if any, for its tax year, and as such will not be subject to federal income taxes. In addition, the Fund intends to distribute in each calendar year substantially all of its net investment income, capital gains and certain other amounts, if any, such that the Fund should not be subject to federal excise tax. Therefore, no federal income or excise tax provision is recorded.
Distributions to Shareholders
Distributions from net investment income, if any, are declared and paid semi-annually. The Fund may, however, declare and pay distributions from net investment income more frequently. The Fund will distribute net realized capital gains (including net short-term capital gains) at least annually after the fiscal year in which the capital gains were earned, unless offset by any available capital loss carryforward. Income distributions and capital gain distributions are determined in accordance with federal income tax regulations which may differ from GAAP.
Indemnification
In the normal course of business, the Fund enters into contracts that contain a variety of representations and warranties and which provide general indemnities. The Fund's maximum exposure under these arrangements is unknown because this would involve future claims against the Fund. Also, under the Trust's organizational documents and by contract, the Trustees and officers of the Trust are indemnified against certain liabilities that may arise out of actions relating to their duties to the Trust. However, based on experience, the Fund expects the risk of loss due to these representations, warranties and indemnities to be minimal.
Note 3. Fees and Compensation Paid to Affiliates
Investment Management Services Fee
The Investment Manager determines which securities will be purchased, held or sold. The management fee is based on the Fund's average daily net assets at the following annual rates:
| Average Daily Net Assets | | Annual Fee Rate | |
| First $500 million | | | 0.70 | % | |
| $500 million to $1 billion | | | 0.65 | % | |
| Over $1 billion | | | 0.60 | % | |
Prior to the Closing, Columbia Management Advisors, LLC (Columbia), an indirect, wholly owned subsidiary of Bank of America Corporation (BOA), provided investment management services to the Fund under the same fee structure.
The effective management fee rate for the year ended February 28, 2011, was 0.65% of the Fund's average daily net assets.
Administration Fee
Effective upon the Closing, the Investment Manager became the administrator of the Fund and provides administrative and other services to the Fund, including services previously performed under the Pricing and Bookkeeping Oversight and Services Agreement discussed below. The administration fee is based on the annual rate of 0.17% of the Fund's average daily net assets, less the fees payable by the Fund as described under the Pricing and Bookkeeping Fees note below. Prior to the Closing, Columbia provided administrative services to the Fund at the same fee rate.
Pricing and Bookkeeping Fees
Prior to the Closing, the Fund entered into a Financial Reporting Services Agreement (the Financial Reporting Services Agreement) with State Street Bank and Trust Company (State Street) and Columbia pursuant to which State Street provides financial reporting services to the Fund. The Fund also entered into an Accounting Services Agreement (collectively with the Financial Reporting Services Agreement, the State Street Agreements) with State Street and Columbia pursuant to which State Street provides accounting services to the Fund. Upon the Closing, Columbia assigned and delegated its rights and obligations under the State Street Agreements to the Investment Manager. Under the State Street Agreements, the Fund pays State Street an annual fee of $38,000
26
Columbia Small Cap Value Fund II, February 28, 2011
paid monthly plus an additional monthly fee based on an annualized percentage rate of average daily net assets of the Fund for the month. The aggregate fee will not exceed $140,000 per year (exclusive of out-of-pocket expenses and charges). The Fund also reimburses State Street for certain out-of-pocket expenses and charges.
Also prior to the Closing, the Fund entered into a Pricing and Bookkeeping Oversight and Services Agreement (the Services Agreement) with Columbia. Under the Services Agreement, Columbia provided services related to Fund expenses and the requirements of the Sarbanes-Oxley Act of 2002, and provided oversight of the accounting and financial reporting services provided by State Street. Under the Services Agreement, the Fund reimbursed Columbia for out-of-pocket expenses and charges, including fees payable to third parties, such as for pricing the Fund's portfolio securities, incurred by Columbia in the performance of services under the Services Agreement. The Services Agreement was terminated upon the Closing. These services are now provided under the Administration Fee note discussed above.
Transfer Agent Fee
In connection with the Closing, RiverSource Service Corporation, a wholly owned subsidiary of Ameriprise Financial, became the transfer agent of the Fund and changed its name to Columbia Management Investment Services Corp. (the New Transfer Agent). The New Transfer Agent has contracted with Boston Financial Data Services (BFDS) to serve as sub-transfer agent. The New Transfer Agent receives monthly account-based service fees that vary by class and are based on the number of open accounts and asset-based fees, calculated based on assets held in omnibus accounts, which are intended to reimburse the New Transfer Agent for certain sub-transfer agent fees (exclusive of BFDS fees). The New Transfer Agent pays the fees of BFDS for services as sub-transfer agent and is not entitled to reimbursement for such fees from the Fund.
The New Transfer Agent receives reimbursement for certain out-of-pocket expenses and may also receive compensation for various shareholder services.
Prior to the Closing, Columbia Management Services, Inc., an affiliate of Columbia and an indirect, wholly owned subsidiary of BOA, provided shareholder services to the Fund and contracted with BFDS to serve as sub-transfer agent, under the same fee structure.
Class I shares do not pay transfer agent fees. For the year ended February 28, 2011, the Fund's effective transfer agent fee rate for each class, with the exception of Class I shares, was 0.25% of the Fund's average daily net assets.
An annual minimum account balance fee of $20 may apply to certain accounts with a value below the Fund's initial minimum investment requirements to reduce the impact of small accounts on transfer agent fees. These minimum account balance fees are recorded as part of expense reductions on the Statement of Operations. For the year ended February 28, 2011, no minimum account balance fees were charged by the Fund.
Underwriting Discounts, Service and Distribution Fees
In connection with the Closing, RiverSource Fund Distributors, Inc., an indirect wholly owned subsidiary of Ameriprise Financial, became the distributor of the Fund and changed its name to Columbia Management Investment Distributors, Inc. (the New Distributor).
For the year ended February 28, 2011, initial sales charges paid by shareholders on the purchase of Class A shares amounted to $864 and net CDSC fees paid by shareholders on certain redemptions of Class A, Class B and Class C shares amounted to $176, $6,376 and $296, respectively.
The Trust has adopted shareholder servicing plans and distribution plans for the Class B and Class C shares of the Fund and a combined distribution and shareholder servicing plan for the Class A shares of the Fund. The Trust has also adopted a distribution plan for the Class R shares of the Fund. The shareholder servicing plans permit the Fund to compensate or reimburse servicing agents for the shareholder services they have provided. The distribution plans, adopted pursuant to Rule 12b-1 under the 1940 Act, permit the Fund to compensate or reimburse the New Distributor and/or selling agents for activities or expenses primarily intended to result in the sale of the classes' shares. Payments are made at an annual rate and paid monthly, as a percentage of average daily net assets, set from time to time by the Board of Trustees, and are charged as expenses of the Fund directly to the applicable share class. A substantial portion of the expenses incurred pursuant to these plans is paid to affiliates of the New Distributor.
27
Columbia Small Cap Value Fund II, February 28, 2011
The annual rates in effect and plan limits, as a percentage of average daily net assets are as follows:
| | | Current
Rate | | Plan
Limit | |
Class A Combined Distribution and
Shareholder Servicing Plan | | | 0.25 | % | | | 0.25 | % | |
Class B and Class C Shareholder
Servicing Plans | | | 0.25 | % | | | 0.25 | % | |
Class B and Class C
Distribution Plans | | | 0.75 | % | | | 0.75 | % | |
| Class R Distribution Plan | | | 0.50 | % | | | 0.50 | % | |
Prior to the Closing, Columbia Management Distributors, Inc, an affiliate of Columbia and an indirect, wholly owned subsidiary of BOA, was the principal underwriter of the Fund's shares. There were no changes to the underwriting discount structure of the Fund or the service or distribution fee rates paid by the Fund as a result of the Transaction.
Expense Limits and Fee Waivers
Effective September 27, 2010, the Investment Manager has voluntarily agreed to reimburse a portion of the Fund's expenses so that the Fund's ordinary operating expenses (excluding brokerage commissions, interest, taxes and extraordinary expenses, but including custodian charges relating to overdrafts, if any), after giving effect to any balance credits from the Fund's custodian, do not exceed the annual rates of 1.35%, 2.10%, 2.10%, 0.95%, 1.60% and 1.10% of the Fund's average daily net assets attributable to Class A, Class B, Class C, Class I, Class R and Class Z shares, respectively. This arrangement may be modified or terminated by the Investment Manager at any time.
For the period May 1, 2010 through September 26, 2010, the Investment Manager voluntarily agreed to reimburse a portion of the Fund's expenses so that the Fund's ordinary operating expenses (excluding any distribution and service fees, brokerage commissions, interest, taxes and extraordinary expenses, but including custodian charges relating to overdrafts, if any), after giving effect to any balance credits from the Fund's custodian, did not exceed 1.10% annually of the Fund's average daily net assets. Prior to May 1, 2010, Columbia voluntarily reimbursed a portion of the Fund's expenses in the same manner.
The Investment Manager is entitled to recover from the Fund any fees waived and/or expenses reimbursed for a three year period following the date of such fee waiver and/or reimbursement if such recovery does not cause the Fund's expenses to exceed the expense limitations in effect at the time of recovery. At February 28, 2011, $116,139 was potentially recoverable from the Fund pursuant to this arrangement during the three year period expiring February 28, 2014. Prior to May 1, 2010, Columbia was entitled to recover fees waived and/or expenses reimbursed from the Fund in the same manner.
During the year ended February 28, 2011, there were no recoveries and no expirations of potential recoveries pursuant to these arrangements.
Fees Paid to Officers and Trustees
Upon the Closing, all officers of the Fund are employees of the Investment Manager or its affiliates and, with the exception of the Fund's Chief Compliance Officer, receive no compensation from the Fund. The Board of Trustees has appointed a Chief Compliance Officer to the Fund in accordance with federal securities regulations. The Fund, along with other affiliated funds, pays its pro-rata share of the expenses associated with the Chief Compliance Officer. The Fund's expenses for the Chief Compliance Officer will not exceed $15,000 per year. Prior to the Closing, all officers of the Fund were employees of Columbia or its affiliates and the Fund paid its pro-rata share of the expenses for the Chief Compliance Officer under the same fee structure.
Trustees are compensated for their services to the Fund, as set forth on the Statement of Operations. The Trust's eligible Trustees may participate in a non-qualified deferred compensation plan which may be terminated at any time. Any payments to plan participants are paid solely out of the Fund's assets. Income earned on the plan participant's deferral account is based on the rate of return of the eligible mutual funds selected by the participant or, if no funds are selected, on the rate of return of Columbia Money Market Fund (formerly known as RiverSource Cash Management Fund). Prior to the Closing, if no funds were selected, income earned on the plan participant's deferral account was based on the rate of return of BofA Treasury Reserves. Trustees' fees deferred during the current period as well as any gains or losses on the trustees' deferred compensation balances as a result of market fluctuations are included in "Trustees' fees" on the Statement of Operations. Liabilities under the deferred compensation plan are included in "Trustees' fees" on the Statement of Assets and Liabilities.
28
Columbia Small Cap Value Fund II, February 28, 2011
Other Related Party Transactions
Prior to the Closing, the Fund used one or more brokers that were affiliates of BOA in connection with the purchase and sale of its securities. Total brokerage commissions paid to affiliated brokers for the period prior to the Closing were $16,441.
Note 4. Custody Credits
The Fund has an agreement with its custodian bank under which custody fees may be reduced by balance credits. These credits are recorded as part of expense reductions on the Statement of Operations. The Fund could have invested a portion of the assets utilized in connection with the expense offset arrangement in an income-producing asset if it had not entered into such an agreement. For the year ended February 28, 2011, these custody credits reduced total expenses by $56 for the Fund.
Note 5. Portfolio Information
The cost of purchases and proceeds from sales of securities, excluding short-term obligations, aggregated $951,631,896 and $938,985,860, respectively, for the year ended February 28, 2011.
Note 6. Shareholder Concentration
As of February 28, 2011, one shareholder account owned 10.2% of the outstanding shares of the Fund. Purchase and redemption activity of this account may have a significant effect on the operations of the Fund.
Note 7. Line of Credit
The Fund and other affiliated funds participate in a $280,000,000 committed, unsecured revolving line of credit provided by State Street. The maximum amount that may be borrowed by any fund is limited to the lesser of $200,000,000 and the Fund's borrowing limit set forth in the Fund's registration statement. Borrowings are available for short-term liquidity or temporary or emergency purposes.
Effective October 14, 2010, interest is charged to each participating fund based on the fund's borrowings at a rate per annum equal to the greater of the Federal Funds Rate plus 1.25% or the overnight LIBOR Rate plus 1.25%. In addition, a commitment fee of 0.125% per annum is accrued and apportioned among the participating funds pro rata based on their relative net assets.
Prior to October 14, 2010, interest was charged to each participating fund at the same rates. In addition, a commitment fee of 0.15% per annum was accrued and apportioned among the participating funds pro rata based on their relative net assets.
For the year ended February 28, 2011, the Fund did not borrow under these arrangements.
Note 8. Federal Tax Information
The timing and character of income and capital gain distributions are determined in accordance with income tax regulations, which may differ from GAAP. Reclassifications are made to the Fund's capital accounts for permanent tax differences to reflect income and gains available for distribution (or available capital loss carryforwards) under income tax regulations.
For the year ended February 28, 2011, permanent book and tax basis differences resulting primarily from differing treatments for excess distributions and foreign currency transactions were identified and reclassified among the components of the Fund's net assets as follows:
Undistributed
Net Investment
Income | | Accumulated
Net Realized
Loss | | Paid-In Capital | |
| $ | 2,799,658 | | | $ | (1,344 | ) | | $ | (2,798,314 | ) | |
Net investment income and net realized gains (losses), as disclosed on the Statement of Operations, and net assets were not affected by this reclassification.
The tax character of distributions paid during the years ended February 28, 2011 and February 28, 2010 was as follows:
| | | February 28, | |
| Distributions paid from | | 2011 | | 2010 | |
| Ordinary Income* | | $ | 4,948,693 | | | $ | 7,052,272 | | |
| Return of Capital | | | — | | | | 723,318 | | |
* For tax purposes short-term capital gain distributions, if any, are considered ordinary income distributions.
29
Columbia Small Cap Value Fund II, February 28, 2011
As of February 28, 2011, the components of distributable earnings on a tax basis were as follows:
Undistributed
Ordinary
Income | | Undistributed
Long-Term
Capital Gains | | Net
Unrealized
Appreciation* | |
| $ | — | | | $ | — | | | $ | 493,176,418 | | |
* The differences between book-basis and tax-basis net unrealized appreciation are primarily due to deferral of losses from wash sales.
Unrealized appreciation and depreciation at February 28, 2011, based on cost of investments for federal income tax purposes were:
| Unrealized appreciation | | $ | 519,214,424 | | |
| Unrealized depreciation | | | (26,038,006 | ) | |
| Net unrealized appreciation | | $ | 493,176,418 | | |
The following capital loss carryforwards may be available to reduce taxable income arising from future net realized gains on investments, if any, to the extent permitted by the Internal Revenue Code:
| Year of Expiration | | Capital Loss
Carryforwards | |
| | 2018 | | | $ | 186,779,398 | | |
Capital loss carryforwards of $149,749,245 were utilized during the year ended February 28, 2011.
Management is required to determine whether a tax position of the Fund is more likely than not to be sustained upon examination by the applicable taxing authority, including resolution of any related appeals or litigation processes, based on the technical merits of the position. The tax benefit to be recognized by the Fund is measured as the largest amount of benefit that is greater than fifty percent likely of being realized upon ultimate settlement. Management is not aware of any tax positions for which it is reasonably possible that the total amounts of unrecognized tax benefits will significantly change in the next twelve months. However, management's conclusions may be subject to review and adjustment at a later date based on factors including, but not limited to, new tax laws, regulations, and administrative interpretations (including relevant court decisions). The Fund's federal tax returns for the prior three fiscal years remain subject to examination by the Internal Revenue Service.
Note 9. Subsequent Events
Management has evaluated the events and transactions that have occurred through the date the financial statements were issued and noted no items requiring adjustment of the financial statements or additional disclosure.
Note 10. Information Regarding Pending and Settled Legal Proceedings
In June 2004, an action captioned John E. Gallus et al. v. American Express Financial Corp. and American Express Financial Advisors Inc. was filed in the United States District Court for the District of Arizona. The plaintiffs allege that they are investors in several American Express Company (now known as RiverSource) mutual funds and they purport to bring the action derivatively on behalf of those funds under the Investment Company Act of 1940. The plaintiffs allege that fees allegedly paid to the defendants by the funds for investment advisory and administrative services are excessive. The plaintiffs seek remedies including restitution and rescission of investment advisory and distribution agreements. The plaintiffs voluntarily agreed to transfer this case to the United States District Court for the District of Minnesota (the District Court). In response to defendants' motion to dismiss the complaint, the District Court dismissed one of plaintiffs' four claims and granted plaintiffs limited discovery. Defendants moved for summary judgment in April 2007. Summary judgment was granted in the defendants' favor on July 9, 2007. The plaintiffs filed a notice of appeal with the Eighth Circuit Court of Appeals (the Eighth Circuit) on August 8, 2007. On April 8, 2009, the Eighth Circuit reversed summary judgment and remanded to the District Court for further proceedings. On August 6, 2009, defendants filed a writ of certiorari with the U.S. Supreme Court (the Supreme Court), asking the Supreme Court to stay the District Court proceedings while the Supreme Court considers and rules in a case captioned Jones v. Harris Associates, which involves issues of law similar to those presented in the Gallus case. On March 30, 2010, the Supreme Court issued its ruling in Jones v. Harris Associates, and on April 5, 2010, the Supreme Court vacated the Eighth Circuit's decision in the Gallus case and remanded the case to the Eighth Circuit for further consideration in light of the Supreme Court's decision in Jones v. Harris Associates. On June 4, 2010, the Eighth Circuit remanded the Gallus case to the District Court for further consideration in light of the Supreme Court's decision in Jones v. Harris Associates. On December 9, 2010, the District Court reinstated its July 9, 2007
30
Columbia Small Cap Value Fund II, February 28, 2011
summary judgment order in favor of the defendants. On January 10, 2011, plaintiffs filed a notice of appeal with the Eighth Circuit.
In December 2005, without admitting or denying the allegations, American Express Financial Corporation (AEFC, which is now known as Ameriprise Financial, Inc. (Ameriprise Financial)), entered into settlement agreements with the Securities and Exchange Commission (SEC) and Minnesota Department of Commerce (MDOC) related to market timing activities. As a result, AEFC was censured and ordered to cease and desist from committing or causing any violations of certain provisions of the Investment Advisers Act of 1940, the Investment Company Act of 1940, and various Minnesota laws. AEFC agreed to pay disgorgement of $10 million and civil money penalties of $7 million. AEFC also agreed to retain an independent distribution consultant to assist in developing a plan for distribution of all disgorgement and civil penalties ordered by the SEC in accordance with various undertakings detailed at http://www.sec.gov/litigation/admin/ia-2451.pdf. Ameriprise Financial and its affiliates have cooperated with the SEC and the MDOC in these legal proceedings, and have made regular reports to the funds' Boards of Directors/Trustees.
Ameriprise Financial and certain of its affiliates have historically been involved in a number of legal, arbitration and regulatory proceedings, including routine litigation, class actions, and governmental actions, concerning matters arising in connection with the conduct of their business activities. Ameriprise Financial believes that the Funds are not currently the subject of, and that neither Ameriprise Financial nor any of its affiliates are the subject of, any pending legal, arbitration or regulatory proceedings that are likely to have a material adverse effect on the Funds or the ability of Ameriprise Financial or its affiliates to perform under their contracts with the Funds. Ameriprise Financial is required to make 10-Q, 10-K and, as necessary, 8-K filings with the Securities and Exchange Commission on legal and regulatory matters that relate to Ameriprise Financial and its affiliates. Copies of these filings may be obtained by accessing the SEC website at www.sec.gov.
There can be no assurance that these matters, or the adverse publicity associated with them, will not result in increased fund redemptions, reduced sale of fund shares or other adverse consequences to the Funds. Further, although we believe proceedings are not likely to have a material adverse effect on the Funds or the ability of Ameriprise Financial or its affiliates to perform under their contracts with the Funds, these proceedings are subject to uncertainties and, as such, we are unable to estimate the possible loss or range of loss that may result. An adverse outcome in one or more of these proceedings could result in adverse judgments, settlements, fines, penalties or other relief that could have a material adverse effect on the consolidated financial condition or results of operations of Ameriprise Financial.
31
Report of Independent Registered Public Accounting Firm
To the Trustees of Columbia Funds Series Trust and the Shareholders of Columbia Small Cap Value Fund II
In our opinion, the accompanying statement of assets and liabilities, including the investment portfolio, and the related statements of operations and of changes in net assets and the financial highlights present fairly, in all material respects, the financial position of Columbia Small Cap Value Fund II (the "Fund") (a series of Columbia Funds Series Trust) at February 28, 2011, and the results of its operations, the changes in its net assets, and the financial highlights for the periods indicated, in conformity with accounting principles generally accepted in the United States of America. These financial statements and financial highlights (hereafter referred to as "financial statements") are the responsibility of the Fund's management. Our responsibility is to express an opinion on these financial statements based on our audits. We conducted our audits of these financial statements in accordance with the standards of the Public Company Accounting Oversight Board (United States). Those standards require that we plan and perform the audit to obtain reasonable assurance about whether the financial statements are free of material misstatement. An audit includes examining, on a test basis, evidence supporting the amounts and disclosures in the financial statements, assessing the accounting principles used and significant estimates made by management, and evaluating the overall financial statement presentation. We believe that our audits, which included confirmation of securities at February 28, 2011 by correspondence with the custodian and brokers, provide a reasonable basis for our opinion.
PricewaterhouseCoopers LLP
Boston, Massachusetts
April 21, 2011
32
Federal Income Tax Information (Unaudited) – Columbia Small Cap Value Fund II
For non-corporate shareholders, 43.45% or the maximum amount allowable under the Jobs and Growth Tax Relief Reconciliation Act of 2003, of the ordinary income distributed by the Fund for the fiscal year ended February 28, 2011 may represent qualified dividend income.
43.45% of the ordinary income distributed by the Fund for the fiscal year ended February 28, 2011, qualifies for the corporate dividends received deduction.
The Fund will notify shareholders in January 2012 of amounts for use in preparing 2011 income tax returns.
33
Fund Governance
The Trustees serve terms of indefinite duration. The names, addresses and birth years of the Trustees and Officers of the Funds in the Columbia Funds Series Trust, the year each was first elected or appointed to office, their principal business occupations during at least the last five years, the number of Funds overseen by each Trustee and other directorships they hold are shown below. Each officer listed below serves as an officer of each Fund in the Columbia Funds Series Trust.
Independent Trustees
Name, Address and Year of Birth,
Position with Funds, Year First
Elected or Appointed to Office | | Principal Occupation(s) During Past Five Years, Number of Funds in the Columbia
Funds Complex Overseen by Trustee, Other Directorships Held
| |
| Edward J. Boudreau, Jr. (Born 1944) | |
|
c/o Columbia Management
Investment Advisers, LLC
225 Franklin Street
Boston, MA 02110
Trustee (since 2005) | | Managing Director—E.J. Boudreau & Associates (consulting), from 2000 through current; oversees 44; Trustee—BofA Funds Series Trust. | |
|
| William P. Carmichael (Born 1943) | |
|
c/o Columbia Management
Investment Advisers, LLC
225 Franklin Street
Boston, MA 02110
Trustee (since 1999) | | Retired; Oversees 44; Director—Cobra Electronics Corporation (electronic equipment manufacturer); Director—McMoRan Exploration Company (oil and gas exploration and development); Director—The Finish Line (athletic shoes and apparel); Trustee—BofA Funds Series Trust; Former Director—Simmons Company (bedding). | |
|
| William A. Hawkins (Born 1942) | |
|
c/o Columbia Management
Investment Advisers, LLC
225 Franklin Street
Boston, MA 02110
Trustee (since 2005) | | Managing Director—Overton Partners (financial consulting), August 2010 to present; President and Chief Executive Officer—California General Bank, N.A., from January 2008 through August 2010; oversees 44; Trustee—BofA Funds Series Trust. | |
|
| R. Glenn Hilliard (Born 1943) | |
|
c/o Columbia Management
Investment Advisers, LLC
225 Franklin Street
Boston, MA 02110
Trustee (since 2005) | | Chairman and Chief Executive Officer—Hilliard Group LLC (investing and consulting), from April 2003 through current; Non-Executive Director & Chairman—CNO Financial, Inc. (formerly Conseco, Inc.) (insurance), September 2003 through current; Executive Chairman—Conseco, Inc. (insurance), August 2004 through September 2005; oversees 44; Trustee—BofA Funds Series Trust. | |
|
| John J. Nagorniak (Born 1944) | |
|
c/o Columbia Management
Investment Advisers, LLC
225 Franklin Street
Boston, MA 02110
Trustee (since 2008) | | Retired; President and Director—Foxstone Financial, Inc. (consulting), 2000 through December 2007; Director—Mellon Financial Corporation affiliates (investing), 2000 through 2007; Chairman—Franklin Portfolio Associates (investing—Mellon affiliate), 1982 through 2007; oversees 44; Director—MIT Investment Company; Trustee—MIT 401k Plan. | |
|
34
Fund Governance (continued)
Independent Trustees (continued)
Name, Address and Year of Birth,
Position with Funds, Year First
Elected or Appointed to Office | | Principal Occupation(s) During Past Five Years, Number of Funds in the Columbia
Funds Complex Overseen by Trustee, Other Directorships Held
| |
| Minor M. Shaw (Born 1947) | |
|
c/o Columbia Management
Investment Advisers, LLC
225 Franklin Street
Boston, MA 02110
Trustee (since 2003) | | President—Micco Corporation and Mickel Investment Group; oversees 44; Board Member—Piedmont Natural Gas; Trustee—BofA Funds Series Trust. | |
|
Interested Trustee
| Anthony M. Santomero1 (Born 1946) | |
|
c/o Columbia Management
Investment Advisers, LLC
225 Franklin Street
Boston, MA 02110
Trustee (since 2008) | | Richard K. Mellon Professor Emeritus of Finance, The Wharton School, University of Pennsylvania, from 2002 through current; Senior Advisor—McKinsey & Company (consulting), July 2006 through January 2008; President and Chief Executive Officer—Federal Reserve Bank of Philadelphia, July 2000 through April 2006; oversees 44; Director—Renaissance Reinsurance Ltd; Trustee—Penn Mutual Life Insurance Company; Director—Citigroup, Inc.; Citibank, N.A.; Trustee—BofA Funds Series Trust. | |
|
1 Dr. Santomero is currently deemed by the Columbia Funds to be an "interested person" (as defined in the 1940 Act) of the Funds because he serves as a Director of Citigroup, Inc. and Citibank N.A., companies that may directly or through subsidiaries and affiliates engage from time-to-time in brokerage execution, principal transactions and lending relationships with the Columbia Funds or other funds or accounts advised/managed by the Adviser.
The Statement of Additional Information includes additional information about the Trustees of the Funds and is available, without charge, upon request by calling 800-345-6611.
Officers
| Name, Year of Birth and Address | | Principal Occupation(s) During the Past Five Years | |
| J. Kevin Connaughton (Born 1964) | |
|
225 Franklin Street
Boston, MA 02110
President (since 2009) | | Senior Vice President and General Manager—Mutual Fund Products, Columbia Management Investment Advisers, LLC since May 2010; President, Columbia Funds, since 2009, and RiverSource Funds, since May 2010 (previously Senior Vice President and Chief Financial Officer, Columbia Funds, from June 2008 to January 2009, Treasurer, Columbia Funds, from October 2003 to May 2008, and senior officer of various other affiliated funds since 2000); Managing Director, Columbia Management Advisors, LLC from December 2004 to April 2010. | |
|
| Michael G. Clarke (Born 1969) | |
|
225 Franklin Street
Boston, MA 02110
Senior Vice President and
Chief Financial Officer (since 2009) | | Vice President, Columbia Management Investment Advisers, LLC since May 2010; Managing Director of Fund Administration, Columbia Management Advisors, LLC, from September 2004 to April 2010; senior officer of Columbia Funds and affiliated funds since 2002. | |
|
35
Fund Governance (continued)
Officers (continued)
| Name, Year of Birth and Address | | Principal Occupation(s) During the Past Five Years | |
| Scott R. Plummer (Born 1959) | |
|
5228 Ameriprise Financial Center
Minneapolis, MN 55474
Senior Vice President, Secretary and Chief Legal Officer (since 2010) | | Chief Legal Officer and Assistant Secretary, Columbia Management Investment Advisers, LLC since June 2005; Vice President and Lead Chief Counsel—Asset Management, Ameriprise Financial, Inc. since May 2010 (previously Vice President and Chief Counsel—Asset Management, from 2005 to April 2010, and Vice President—Asset Management Compliance from 2004 to 2005); Vice President, Chief Counsel and Assistant Secretary, Columbia Management Investment Distributors, Inc. since 2008; Vice President, General Counsel and Secretary, Ameriprise Certificate Company since 2005; Chief Counsel, RiverSource Distributors, Inc. since 2006; Vice President, General Counsel and Secretary, RiverSource Funds, since December 2006; Senior Vice President, Secretary and Chief Legal Officer, Columbia Funds, since May 2010. | |
|
| Linda J. Wondrack (Born 1964) | |
|
225 Franklin Street
Boston, MA 02110
Senior Vice President and
Chief Compliance Officer (since 2007) | | Vice President and Chief Compliance Officer, Columbia Management Investment Advisers, LLC since May 2010; Chief Compliance Officer, Columbia Funds, since 2007, and RiverSource Funds, since May 2010; Director (Columbia Management Group, LLC and Investment Product Group Compliance), Bank of America, from June 2005 to April 2010. | |
|
| William F. Truscott (Born 1960) | |
|
53600 Ameriprise Financial Center
Minneapolis, MN 55474
Senior Vice President (since 2010) | | Chairman of the Board, Columbia Management Investment Advisers, LLC since May 2010 (previously President, Chairman of the Board and Chief Investment Officer, from 2001 to April 2010); Chief Executive Officer, U.S. Asset Management & President, Annuities, Ameriprise Financial, Inc. since May 2010 (previously President—U.S. Asset Management and Chief Investment Officer from 2005 to April 2010, and Senior Vice President—Chief Investment Officer, from 2001 to 2005); Director, President and Chief Executive Officer, Ameriprise Certificate Company since 2006; Director, Columbia Management Investment Distributors, Inc. since May 2010 (previously Chairman of the Board and Chief Executive Officer from 2008 to April 2010); Chairman of the Board and Chief Executive Officer, RiverSource Distributors, Inc. since 2006. | |
|
| Colin Moore (Born 1958) | |
|
225 Franklin Street
Boston, MA 02110
Senior Vice President (since 2010) | | Director and Chief Investment Officer, Columbia Management Investment Advisers, LLC since May 2010; Manager, Managing Director and Chief Investment Officer of Columbia Management Advisors, LLC from 2007 to April 2010; Head of Equities, Columbia Management Advisors, LLC from 2002 to 2007. | |
|
| Michael A. Jones (Born 1959) | |
|
225 Franklin Street
Boston, MA 02110
Senior Vice President (since 2010) | | President and Director, Columbia Management Investment Advisers, LLC since May 2010; President and Director, Columbia Management Investment Distributors, Inc. since May 2010; Manager, Chairman, Chief Executive Officer and President, Columbia Management Advisors, LLC from 2007 to April 2010; Chief Executive Officer, President and Director, Columbia Management Distributors, Inc. from November 2006 to April 2010; previously, co-president and senior managing director at Robeco Investment Management. | |
|
36
Fund Governance (continued)
Officers (continued)
| Name, Year of Birth and Address | | Principal Occupation(s) During the Past Five Years | |
| Amy Johnson (Born 1965) | |
|
5228 Ameriprise Financial Center
Minneapolis, MN 55474
Senior Vice President (since 2010) | | Senior Vice President and Chief Operating Officer, Columbia Management Investment Advisers, LLC since May 2010 (previously Chief Administrative Officer, from 2009 until April 2010, Vice President—Asset Management and Trust Company Services, from 2006 to 2009, and Vice President—Operations and Compliance from 2004 to 2006). | |
|
| Joseph F. DiMaria (Born 1968) | |
|
225 Franklin Street
Boston, MA 02110
Treasurer (since 2010) and
Chief Accounting Officer (since 2008) | | Vice President, Mutual Fund Administration, Columbia Management Investment Advisers, LLC, since May 2010; Director of Fund Administration, Columbia Management Advisors, LLC from January 2006 to April 2010; Head of Tax/Compliance and Assistant Treasurer, Columbia Management Advisors, LLC, from November 2004 to December 2005. | |
|
| Marybeth Pilat (Born 1968) | |
|
225 Franklin Street
Boston, MA 02110
Deputy Treasurer (since 2010) | | Vice President, Mutual Fund Administration, Columbia Management Investment Advisers, LLC, since May 2010; Vice President, Investment Operations, Bank of America, from October 2008 to April 2010; Finance Manager, Boston Children's Hospital from August 2008 to October 2008; Director, Mutual Fund Administration, Columbia Management Advisors, LLC, from May 2007 to July 2008; Vice President, Mutual Fund Valuation, Columbia Management Advisors, LLC, from January 2006 to May 2007; Vice President, Mutual Fund Accounting Oversight, Columbia Management Advisors, LLC from January 2005 to January 2006. | |
|
| Julian Quero (Born 1967) | |
|
225 Franklin Street
Boston, MA 02110
Deputy Treasurer (since 2008) | | Vice President, Mutual Fund Administration, Columbia Management Investment Advisers, LLC since May 2010; Director of Fund Administration, Columbia Management Advisors, LLC, from August 2008 to April 2010; Senior Tax Manager, Columbia Management Advisors, LLC from August 2006 to July 2008; Senior Compliance Manager, Columbia Management Advisors, LLC from April 2002 to August 2006. | |
|
| Stephen T. Welsh (Born 1957) | |
|
225 Franklin Street
Boston, MA 02110
Vice President (since 2006) | | President and Director, Columbia Management Investment Services Corp. since May 2010; President and Director, Columbia Management Services, Inc. from July 2004 to April 2010; Managing Director, Columbia Management Distributors, Inc. from August 2007 to April 2010. | |
|
37
Board Consideration and Approval of Amendment to Investment Management Services Agreement
In September 2010, the Board (the "Board") of Columbia Funds Series Trust (the "Trust") unanimously approved an amendment to the Investment Management Services Agreement (the "IMS Agreement") between Columbia Management Investment Advisers, LLC ("CMIA") and the Trust, on behalf of Columbia Convertible Securities Fund, Columbia Large Cap Core Fund, Columbia Large Cap Enhanced Core Fund, Columbia Large Cap Value Fund, Columbia Mid Cap Value Fund, Columbia Multi-Advisor International Equity Fund and Columbia Small Cap Value Fund II (each, a "Fund" and together, the "Funds"). As detailed below, the Contracts Review Committee and/or the Board held numerous meetings and discussions with CMIA and reviewed and considered extensive materials in connection with the approval of the changes to the fee rates payable by each Fund before determining to approve the amendment to the IMS Agreement.
Prior to approving the proposed changes to the fee rates payable by the Funds, the trustees (the "Trustees") of the Board were presented with, and requested, received and evaluated, materials about the current IMS Agreement, the proposed changes to the fee rates and fee structures and related matters from CMIA. The Trustees also reviewed reports prepared by an independent provider of investment company data, which included information comparing the Funds' current fees and expense ratios with a group of comparable funds that were selected by the independent provider. Included in these reports were comparisons of contractual and actual investment advisory fee rates and total operating expenses.
In addition, the Trustees considered that the proposed amendment was part of a larger group of proposals, designed to achieve consistent investment management service and fee structures across the family of funds. In this regard, the Board recognized that many of the funds in the fund family were organized at different times by many different sponsors, and as a result, their fees and expenses did not reflect a common overall design.
The Board and its Contract Review Committee also reviewed and considered information that they had previously received, addressing the services CMIA provides and fund performance, among other things, in connection with their most recent consideration and approval of the IMS Agreement. The Trustees also consulted with the non-interested Trustees' independent legal counsel, who advised on applicable legal standards, and otherwise assisted the Trustees in their deliberations.
At the conclusion of its review of the materials discussed above and of the discussions among the Trustees leading up to and during the September 20, 2010 meetings, the Board, on behalf of the Funds, agreed that it had been furnished with sufficient information to make an informed business decision with respect to approval of the amendment to the IMS Agreement.
In making its decision to approve the proposed amendment to the IMS Agreement for each Fund, the Board considered factors bearing on the nature, extent and quality of the services provided to such Fund, and the costs for those services, with a view toward reaching a business judgment as to whether the proposed amendment to the IMS Agreement is, under the circumstances, in the best interest of such Fund and its shareholders. The factors that the Trustees considered included, principally, the following:
• The expected benefits of continuing to retain CMIA as the Funds' investment manager;
• The nature, extent and quality of investment management services provided by CMIA to each Fund;
• The recent evaluation of the historical performance of CMIA in managing the Funds, recognizing that no assurances can be given that a Fund would achieve any level of performance in the future;
• The recent evaluation of each Fund's potential to realize economies of scale through operations of CMIA;
• The indirect benefits, such as from soft dollar arrangements, that CMIA has obtained and will continue to obtain, from managing the Funds;
• The expected benefits to shareholders of further integrating the legacy Columbia branded funds (the "Columbia Funds Complex") and the legacy RiverSource-, Seligman- and Threadneedle-branded funds (the "Columbia RiverSource Funds Complex" and, collectively with the Columbia Funds Complex, the "Combined Fund Complex") by:
o Standardizing investment advisory fee rates and total management fee rates (i.e., the investment advisory fee rates and the administration/administrative fee rates), to the extent practicable, across funds in the Combined Fund Complex that are in the same investment category to promote uniformity of pricing among similar funds;
o Implementing contractual expense limitations that will generally cap total annual operating expense ratios for each fund in the Combined Fund Complex at levels that are at or below the median net operating expense ratio of funds in the
38
respective fund's peer group (as determined annually after the initial term by an independent third-party data provider); and
o Correlating investment advisory and administration/administrative fee rates across the Combined Fund Complex commensurate with the level of services being provided.
In making its decision to approve the amendment to the IMS Agreement that included the increase of the investment advisory fee rates payable by each of the Funds at all or most asset levels, the factors that the trustees considered and the conclusions that they reached included, principally, the following:
• The impact of the proposed changes in investment advisory fee rates on the gross and net expense ratios of each Fund, including the contemporaneous reduction in the rates payable by each Fund under its administration services agreement contingent on shareholder approval of the amendment to the IMS Agreement, and the willingness of CMIA to contractually agree to limit total operating expenses for such Fund for a certain period of time;
• Current and projected profits to CMIA from providing investment management and other services to the Fund, both under the current investment advisory fee rates and the proposed investment advisory fee rates; and
• That the proposed investment advisory fee rates are designed to be competitive and to fairly compensate CMIA for services performed for the Funds.
Nature, Extent and Quality of Services. The Trustees considered the nature, extent and quality of services provided to the Funds by CMIA under the IMS Agreement, and the resources dedicated to the Funds by CMIA and its affiliates. The Trustees considered, among other things, the ability of CMIA to attract, motivate and retain highly qualified research, advisory and supervisory investment professionals (including CMIA's personnel and other resources, compensation programs for personnel involved in fund management, reputation and other attributes), the portfolio management services provided by those investment professionals, the trade execution services provided on behalf of the Funds and the quality of CMIA's investment research capabilities and the other resources that it devotes to each Fund. The Trustees also considered the potential benefits to shareholders of investing in a mutual fund that is part of a fund complex offering exposure to a variety of asset classes and investment disciplines and providing a variety of fund and shareholder services. The Trustees also considered that the nature, extent and quality of services proposed to be provided under the amended IMS Agreement were not expected to change. After reviewing these and related factors, the Trustees concluded, within the context of their overall conclusions, that the nature, extent and quality of the services to be provided to each Fund under the amended IMS Agreement supported the approval of the amended IMS Agreement. Quietly
Investment Performance. The Trustees reviewed information about the performance of each Fund over various time periods, including information prepared by an independent third-party data provider that compared the performance of each Fund to the performance of those Funds' peer groups of mutual funds and performance benchmarks. The Trustees also reviewed a description of the third party's methodology for identifying each Fund's peer group for purposes of performance and expense comparisons. In the case of each Fund whose performance lagged that of a relevant peer group for certain (although not necessarily all) periods, the Trustees concluded that other factors relevant to performance were sufficient, in light of other considerations, to warrant approval of the amendment to such Fund's IMS Agreement. Those factors varied from Fund to Fund, but included one or more of the following: (i) that the Fund's performance, although lagging in certain recent periods, was stronger over the longer term; (ii) that the underperformance was attributable, to a significant extent, to investment decisions that were reasonable and consistent with the Fund's investment strategy and policies and that the Fund was performing within a reasonable range of expectations, given those investment decisions, market conditions and the Fund's investment strategy; (iii) that the Fund's performance was competitive when compared to other performance benchmarks or peer groups; and (iv) that CMIA had taken or was considering steps designed to help improve the Fund's investment performance, including, but not limited to, replacing portfolio managers, enhancing the resources supporting the portfolio managers, or modifying investment strategies.
After reviewing these and related factors, the Trustees concluded, within the context of their overall conclusions regarding the proposed amendment to the IMS Agreement, that the performance of each Fund and CMIA was sufficient to warrant the approval of the amendment to the IMS Agreement pertaining to that Fund.
Investment Advisory Fee Rates and Other Expenses. The Trustees considered that the proposed amendment to the IMS Agreement would increase the contractual investment advisory fee rates payable
39
by each Fund at all or certain assets levels, and would be otherwise identical to each Fund's current IMS Agreement. In addition, the Trustees considered that, with the proposed fee reductions under the administration services agreement, the combined contractual fee rates under the IMS Agreement and the proposed administration services agreement would be lower than the current combined contractual fee rates under those agreements, at most asset levels, for all of the Funds except Columbia Large Cap Enhanced Core Fund. For the Columbia Large Cap Enhanced Core Fund, the Trustees considered CMIA's proposal to implement a contractual expense limitation that would mitigate the effect of such Fund's investment advisory fee rate increase by gradually phasing in the increase over a five-year period.
After reviewing these and related factors, the Trustees concluded, within the context of their overall conclusions, that the investment advisory fee rates under the amended IMS Agreement and anticipated total expenses of each Fund supported the approval of the amendment to the IMS Agreement.
Costs of Services Provided and Profitability. The Trustees considered information about the investment advisory fee rates charged by CMIA to comparable institutional accounts. In considering the fees charged to those accounts, the Trustees took into account, among other things, CMIA's representations about the differences between managing mutual funds as compared to other types of accounts, including differences in the services provided, differences in the risk profile of such business for CMIA, and the additional resources required to manage mutual funds effectively. In evaluating each Fund's proposed advisory fee rates, the Trustees also took into account the demands, complexity and quality of the investment management of the Fund.
The Trustees also considered the compensation directly or indirectly received by CMIA and its affiliates in connection with their relationships with the Funds. The Trustees reviewed information provided by management as to the current and projected profitability to CMIA and its affiliates of their relationships with each Fund, and information about the allocation of expenses used to calculate profitability.
After reviewing those and related factors, the Trustees concluded, within the context of their overall conclusions, that the proposed changes to the advisory fee rates, and the related profitability to CMIA and its affiliates of their relationships with the Fund, supported the approval of the amendment to the IMS Agreement.
Economies of Scale. The Trustees considered the existence of any economies of scale in the provision by CMIA of services to each Fund, to groups of related funds and to CMIA's investment advisory clients as a whole, and the extent to which those economies of scale would be shared with the Funds through breakpoints in the proposed investment advisory fee rates or other means, such as expense limitation arrangements and additional investments by CMIA in investment, trading and compliance resources. The Trustees noted that all of the Funds were expected to benefit from breakpoints and/or expense limitation arrangements.
In considering those issues, the Trustees also took note of the costs of the services to be provided (both on an absolute and relative basis) and the projected profitability to CMIA and its affiliates of their relationships with the Funds, as discussed above. The Trustees also noted the expected expense synergies and other anticipated benefits to CMIA and fund shareholders of both the rationalization of fees and expenses and the proposed mergers of certain Funds. After reviewing these and related factors, the Trustees determined, within the context of their overall conclusions, that the extent to which economies of scale were expected to be shared with the Funds supported the approval of the amendment to the IMS Agreement.
Other Benefits to CMIA. The Trustees received and considered information regarding any expected "fall-out" or ancillary benefits to be received by CMIA and its affiliates as a result of their relationships with the Funds, such as the provision by CMIA of administration services to the Funds and the provision by CMIA's affiliates of distribution and transfer agency services to the Funds, and how the proposed rationalization of fees and expenses might affect such benefits, including the fact that to the extent expenses payable by the affected Funds decrease, and the expenses of such Funds were subject to a contractual limit or cap, CMIA may pay less in expense reimbursements. The Trustees considered that the Funds' distributor, an affiliate of CMIA, retains a portion of the distribution fees from the Funds and receives a portion of the sales charges on sales or redemptions of certain classes of shares of the Funds, and that other affiliates of CMIA receive various forms of compensation in connection with their sale of shares of the Funds.
The Trustees also considered the benefits of research made available to CMIA by reason of brokerage commissions generated by the Funds' securities transactions, and reviewed information about CMIA's practices with respect to allocating portfolio brokerage and the use of "soft" commission dollars to pay for research. The Trustees considered the possible conflicts of interest associated with certain fall-out or other ancillary benefits and the reporting,
40
disclosure and other processes that would be in place to disclose and to monitor such possible conflicts of interest. The Trustees recognized that CMIA's profitability would be somewhat lower without these benefits.
In their deliberations, the Trustees did not identify any single item that was paramount or controlling and individual Trustees may have attributed different weights to various factors. The Trustees also evaluated all information available to them on a fund-by-fund basis, and their determinations were made separately in respect of each Fund.
Based on the foregoing, the Trustees concluded that the proposed investment advisory fee rates for each Fund are acceptable and competitive, including when compared to similar funds in the industry. Accordingly, the Board unanimously approved the amendment to the IMS Agreement with respect to the Funds.
41
Summary of Management Fee Evaluation by Independent Fee Consultant
REPORT OF INDEPENDENT FEE CONSULTANT TO THE FUNDS SUPERVISED BY THE COLUMBIA NATIONS BOARD
Prepared Pursuant to the February 9, 2005
Assurance of Discontinuance
among the Office of Attorney General of New York State,
Columbia Management Advisors, LLC, and
Columbia Management Distributors, Inc.
September 21, 2010
I. Overview
On February 9, 2005, Columbia Management Advisors, LLC ("CMA") and Columbia Management Distributors, Inc.1 ("CMD") agreed to the New York Attorney General's Assurance of Discontinuance ("AOD"). Among other things, the AOD stipulates that CMA may manage or advise a Columbia Fund ("Columbia Fund" and, together with some or all of such funds, the "Columbia Funds") only if the Independent Members of the Columbia Fund's Board of Trustees appoint a Senior Officer or retain an Independent Fee Consultant ("IFC") who is to manage the process by which proposed management fees are negotiated. The AOD further stipulates that the Senior Officer or IFC is to prepare a written annual evaluation of the fee negotiation process.
With effect from January 1, 2007, the Independent Members of the Board of Trustees for certain Columbia Funds known collectively as the "Nations Funds" (together with the other members of that Board, the "Trustees") retained me as IFC for the Nations Funds.2 In this capacity, I have prepared this written evaluation of the fee negotiation process. As has been the case with my previous reports, my immediate predecessor as IFC, John Rea, provided invaluable assistance in the preparation of this report.
On September 29, 2009, Ameriprise entered into an asset purchase agreement with Bank of America, N.A. and its parent, Bank of America Corporation (together, the "Bank") pursuant to which the Bank agreed to sell certain CMG assets relating to Columbia's long-term asset management business, including management of the Nations Funds (the "Transaction"). The Transaction, which closed on April 30, 2010,3 resulted in the termination of the existing Investment Management Agreements with CMA. Prior to the closing of the Transaction, the Trustees and shareholders of the Funds approved new Advisory and Administrative Agreements with an Ameriprise subsidiary now called Columbia Management Investment Advisers, LLC ("CMIA"). Those Agreements did not change the rates paid by the Funds from the levels specified in the former agreements with CMA.
CMIA serves as the adviser of funds supervised by three different Boards of Trustees: the Atlantic, Nations, and RiverSource Boards, and a subsidiary of CMIA serves as adviser to funds overseen by a fourth Board, Columbia/Wanger. After reviewing the range of funds overseen by all four Boards, CMIA proposed a series of changes intended, among other things, to rationalize its mutual fund product offerings (by for example proposing to merge funds with similar investment strategies) and the fees charged to the funds by CMIA and its affiliates. These proposals included (1) changes to the advisory fees paid by certain funds, (2) changes to administrative and similar fees paid by certain funds, (3) changes to the transfer agency, sub-transfer agency, custody, and pricing/bookkeeping fees paid by the funds, and (4) mergers involving more than 60 funds. CMIA asked the Trustees to consider these proposals together. This report, consistent with and (to the extent applicable) in fulfillment of the terms of the AOD, will focus on changes to advisory and aggregate management fees and discuss other proposals insofar as they affect total fund expenses, which may be a relevant factor in considering the appropriate level of advisory and management fees (defined for purposes of this report as advisory plus administrative fees).
A. Role of the Independent Fee Consultant
The AOD charges the IFC with "managing the process by which proposed management fees ... to be charged the Columbia Fund are negotiated so that they are negotiated in a manner which is at arms' length and reasonable and consistent with this Assurance of Discontinuance." The AOD also provides that CMA "may manage or advise a Columbia Fund only if the reasonableness of the proposed management fees is determined by the Board of Trustees ... using ... an annual independent written evaluation prepared by or under the direction of ... the Independent Fee Consultant." Therefore, the AOD makes clear that the IFC does not supplant the Trustees in negotiating management fees, nor does the IFC substitute his or her judgment for that of the Trustees with respect to the reasonableness of proposed fees or any other matter that is committed to the business judgment of the Trustees.
1 CMA and CMD are subsidiaries of Columbia Management Group, LLC ("CMG"), and are the successors to the entities named in the AOD.
2 I have no material relationship with Bank of America, CMG or Ameriprise Financial, Inc. ("Ameriprise"), aside from serving as IFC, and I am aware of no material relationship with any of their affiliates. I retained John Rea, an independent economic consultant, to assist me with this report.
Unless otherwise stated or required by the context, this report covers only the Nations Funds.
3 Tab 1, CMIA, Supplemental Materials Prepared for the Nations Board, June 16, 2010 ("June Supplemental Materials") at p. 1.
42
B. Elements Involved in Managing the Fee Negotiation Process
In preparing the report required by the AOD, the IFC must consider at least the following six factors set forth in the AOD:
1. The nature and quality of the adviser's services, including the Fund's performance;
2. Management fees (including any components thereof) charged by other mutual fund companies for like services;
3. Possible economies of scale as the Fund grows larger;
4. Management fees (including any components thereof) charged to institutional and other clients of the adviser for like services;
5. Costs to the adviser and its affiliates of supplying services pursuant to the management fee agreements, excluding any intra-corporate profit; and
6. Profit margins of the adviser and its affiliates from supplying such services.
II. Findings
1. Based upon my examination of the information supplied by CMG and Ameriprise in the light of the six factors set forth in the AOD, I conclude that the Trustees have the relevant information necessary to evaluate the reasonableness of the proposed management fee changes for each affected Nations Fund (each a "Fee Change Fund").
2. In my view, the process by which the proposed management fees of each Fee Change Fund have been negotiated with CMIA thus far has been, to the extent practicable, at arm's length and reasonable and consistent with the AOD.
3. CMIA has proposed an increase either in contractual advisory or total management fees for 10 Funds (each a "Fee Increase Fund"). All 10 would have higher advisory fees and lower administrative fees. For three Funds, the increase in proposed contractual advisory fees outweighs the decrease in contractual administrative fees, leading to a proposed increase in contractual management fees. Proposed contractual management fees would decline for six Funds and remain unchanged for one.
4. The projected actual management fee, computed on the basis of assets as of October 31, 2009, would increase for only one of the 10 Funds, Large Cap Enhanced Core, after application of CMIA's proposed expense limitation program and consummation of proposed mergers. For eight Funds, actual management fees are projected to decline, reflecting the interaction of changes in contractual management fees, gross expenses, and expense limitations at October 31, 2009 asset levels. No change is projected in the actual management fee of the remaining Fee Increase Fund.
5. CMIA's fee rationalization and merger proposals would have little effect on the quintile rankings of the actual management fees of the Fee Increase Funds. The ranking would change for only one Fund, while remaining unchanged from the current level for the other nine Funds. On a post-rationalization, post-merger basis, half the actual management fees would be in the fourth or fifth quintiles.
6. Half of the Fee Increase Funds have had median or better-than-median investment performance. None of the Funds would be designated a Review Fund based solely on performance.
7. CMIA proposed that the Funds (except sub-advised Funds) and most other mutual funds it or its affiliates advise or sponsor (together, the "CMIA Funds") be subject to an expense limitation calculated by reference to the median of the relevant fund's Lipper expense group. As a result, all of the Fee Increase Funds are projected to have median or better total expenses after full implementation of the proposed fee changes, expense limitations, and mergers. Some Funds would have higher-than-median actual management fees under this program notwithstanding the newly-established expense limitations. The expense limitation would be recalculated every year based on updated Lipper data. Based upon an analysis of median expenses of Fund peer groups for the 2008-2010 period, it is likely that some Funds would experience sizable changes in their expense limits from year-to-year.
8. CMIA reviewed the differences between management of retail mutual funds and advising institutional accounts and supplied charts plotting contractual and actual institutional and fund fees against assets in various investment categories. The data showed that mutual fund fees are often lower at small asset levels reflecting CMIA's reimbursement of fund expenses. At higher asset levels, mutual fund fees typically exceed institutional fees.
9. CMIA provided fund-by-fund projected profitability data. Due to the significant changes in the operations of the Funds (including the change of the Funds' investment adviser), historical profitability data was judged to have little relevance.
10. CMIA provided data comparing the cumulative benefit to CMIA Fund shareholders of all aspects of its proposals (including proposed mergers) with a projection of synergies in the form of decreased expenses that would benefit CMIA and its parent, Ameriprise.
43
Shareholder Meeting Results
At a Joint Special Meeting of Shareholders held on February 15, 2011, shareholders of the Fund considered the proposals described below.
Proposal 1. At an adjourned meeting held on February 28, 2011, shareholders of the Fund approved a proposed amendment to the Investment Management Services Agreement with Columbia Management Investment Advisers, LLC, as follows:
| Votes For | | Votes Against | | Abstentions | | Broker Non-Votes | |
| | 49,664,011 | | | | 1,891,011 | | | | 505,647 | | | | 20,578,901 | | |
Proposal 2. Shareholders of Columbia Funds Series Trust elected each of the nominees for trustees to the Board of Trustees of Columbia Funds Series Trust, each to hold office for an indefinite term, as follows:
| Trustee | | Votes For | | Votes Withheld | | Abstentions | |
| Kathleen Blatz | | | 2,145,636,122 | | | | 248,012,438 | | | | 0 | | |
| Edward J. Boudreau, Jr. | | | 2,145,430,114 | | | | 248,218,446 | | | | 0 | | |
| Pamela G. Carlton | | | 2,145,515,949 | | | | 248,132,612 | | | | 0 | | |
| William P. Carmichael | | | 2,145,038,695 | | | | 248,609,866 | | | | 0 | | |
| Patricia M. Flynn | | | 2,145,843,563 | | | | 247,804,997 | | | | 0 | | |
| William A. Hawkins | | | 2,145,359,401 | | | | 248,289,160 | | | | 0 | | |
| R. Glenn Hilliard | | | 2,145,079,400 | | | | 248,569,161 | | | | 0 | | |
| Stephen R. Lewis, Jr. | | | 2,145,092,209 | | | | 248,556,351 | | | | 0 | | |
| John F. Maher | | | 2,145,621,338 | | | | 248,027,223 | | | | 0 | | |
| John J. Nagorniak | | | 2,145,337,494 | | | | 248,311,067 | | | | 0 | | |
| Catherine James Paglia | | | 2,145,615,254 | | | | 248,033,306 | | | | 0 | | |
| Leroy C. Richie | | | 2,145,042,120 | | | | 248,606,441 | | | | 0 | | |
| Anthony M. Santomero | | | 2,145,088,174 | | | | 248,560,386 | | | | 0 | | |
| Minor M. Shaw | | | 2,145,430,762 | | | | 248,217,798 | | | | 0 | | |
| Alison Taunton-Rigby | | | 2,145,393,384 | | | | 248,255,177 | | | | 0 | | |
| William F. Truscott | | | 2,144,907,223 | | | | 248,741,338 | | | | 0 | | |
44
Important Information About This Report
The fund mails one shareholder report to each shareholder address. If you would like more than one report, please call shareholder services at 1-800-345-6611 and additional reports will be sent to you. This report has been prepared for shareholders of Columbia Small Cap Value Fund II.
A description of the policies and procedures that the fund uses to determine how to vote proxies and a copy of the fund's voting records are available (i) at www.columbiamanagement.com, (ii) on the Securities and Exchange Commission's website at www.sec.gov, and (iii) without charge, upon request, by calling 1-800-368-0346. Information regarding how the fund voted proxies relating to portfolio securities during the 12-month period ended June 30 is available from the SEC's website. Information regarding how the fund voted proxies relating to portfolio securities is also available from the fund's website, www.columbiamanagement.com.
The fund files a complete schedule of portfolio holdings with the SEC for the first and third quarters of each fiscal year on Form N-Q. The fund's Form N-Q is available on the SEC's website at www.sec.gov and may be reviewed and copied at the SEC's Public Reference Room in Washington, D.C. Information on the operation of the Public Reference Room may be obtained by calling 1-800-SEC-0330.
Transfer Agent
Columbia Management Investment
Services Corp.
P.O. Box 8081
Boston, MA 02266-8081
1-800-345-6611
Distributor
Columbia Management Investment
Distributors, Inc.
225 Franklin Street
Boston, MA 02110
Investment Manager
Columbia Management Investment Advisers, LLC
225 Franklin Street
Boston, MA 02110
45

PRSRT STD
U.S. Postage
PAID
Holliston, MA
Permit NO. 20
Columbia Small Cap Value Fund II
P. O. Box 8081
Boston, MA 02266-8081
columbiamanagement.com
This information is for use with concurrent or prior delivery of a fund prospectus. Investors should consider the investment objectives, risks, charges and expenses of a mutual fund carefully before investing. For a free prospectus, which contains this and other important information about the funds, visit columbiamanagement.com. Read the prospectus carefully before investing. The Fund is distributed by Columbia Management Investment Distributors, Inc., member FINRA, and managed by Columbia Management Investment Advisers, LLC.
© 2011 Columbia Management Investment Advisers, LLC. All rights reserved.
C-1221 A (04/11)

Columbia Marsico 21st Century Fund
Annual Report for the Period Ended February 28, 2011
Not FDIC insured • No bank guarantee • May lose value
Table of Contents
| Fund Profile | | | 1 | | |
|
| Economic Update | | | 2 | | |
|
| Performance Information | | | 4 | | |
|
| Understanding Your Expenses | | | 5 | | |
|
| Portfolio Manager's Report | | | 6 | | |
|
| Investment Portfolio | | | 8 | | |
|
Statement of Assets and
Liabilities | | | 11 | | |
|
| Statement of Operations | | | 13 | | |
|
Statement of Changes in
Net Assets | | | 14 | | |
|
| Financial Highlights | | | 16 | | |
|
| Notes to Financial Statements | | | 21 | | |
|
Report of Independent Registered
Public Accounting Firm | | | 30 | | |
|
| Fund Governance | | | 31 | | |
|
| Shareholder Meeting Results | | | 35 | | |
|
Important Information About
This Report | | | 37 | | |
|
The views expressed in this report reflect the current views of the respective parties. These views are not guarantees of future performance and involve certain risks, uncertainties and assumptions that are difficult to predict, so actual outcomes and results may differ significantly from the views expressed. These views are subject to change at any time based upon economic, market or other conditions and the respective parties disclaim any responsibility to update such views. These views may not be relied on as investment advice and, because investment decisions for a Columbia Fund are based on numerous factors, may not be relied on as an indication of trading intent on behalf of any particular Columbia Fund. References to specific securities should not be construed as a recommendation or investment advice.
President's Message

Dear Shareholder:
The Columbia Management story began over 100 years ago, and today, we are one of the nation's largest dedicated asset managers. The recent acquisition by Ameriprise Financial, Inc. brings together the talents, resources and capabilities of Columbia Management with those of RiverSource Investments, Threadneedle (acquired by Ameriprise in 2003) and Seligman Investments (acquired by Ameriprise in 2008) to build a best-in-class asset management business that we believe is truly greater than its parts.
RiverSource Investments traces its roots to 1894 when its then newly-founded predecessor, Investors Syndicate, offered a face-amount savings certificate that gave small investors the opportunity to build a safe and secure fund for retirement, education or other special needs. A mutual fund pioneer, Investors Syndicate launched Investors Mutual Fund in 1940. In the decades that followed, its mutual fund products and services lineup grew to include a full spectrum of styles and specialties. More than 110 years later, RiverSource continues to be a trusted financial products leader.
Threadneedle, a leader in global asset management and one of Europe's largest asset managers, offers sophisticated international experience from a dedicated U.K. management team. Headquartered in London, it is named for Threadneedle Street in the heart of the city's financial district, where British investors pioneered international and global investing. Threadneedle was acquired in 2003 and today operates as an affiliate of Columbia Management.
Seligman Investments' beginnings date back to the establishment of the investment firm J. & W. Seligman & Co. in 1864. In the years that followed, Seligman played a major role in the geographical expansion and industrial development of the United States. In 1874, President Ulysses S. Grant named Seligman as fiscal agent for the U.S. Navy—an appointment that would last through World War I. Seligman helped finance the westward path of the railroads and the building of the Panama Canal. The firm organized its first investment company in 1929 and began managing its first mutual fund in 1930. In 2008, J. & W. Seligman & Co. Incorporated was acquired and Seligman Investments became an offering brand of RiverSource Investments, LLC.
We are proud of the rich and distinctive history of these firms, the strength and breadth of products and services they offer, and the combined cultures of pioneering spirit and forward thinking. Together we are committed to providing more for our shareholders than ever before.
> A singular focus on our shareholders
Our business is asset management, so investors are our first priority. We dedicate our resources to identifying timely investment opportunities and provide a comprehensive choice of equity, fixed-income and alternative investments to help meet your individual needs.
> First-class research and thought leadership
We are dedicated to helping you take advantage of today's opportunities and anticipate tomorrow's. We stay abreast of the latest investment trends and ideas, using our collective insight to evaluate events and transform them into solutions you can use.
> A disciplined investment approach
We aren't distracted by passing fads. Our teams adhere to a rigorous investment process that helps ensure the integrity of our products and enables you and your financial advisor to match our solutions to your objectives with confidence.
When you choose Columbia Management, you can be confident that we will take the time to understand your needs and help you and your financial advisor identify the solutions that are right for you. Because at Columbia Management, we don't consider ourselves successful unless you are.
Sincerely,

J. Kevin Connaughton
President, Columbia Funds
Investors should consider the investment objectives, risks, charges and expenses of a mutual fund carefully before investing. For a free prospectus, which contains this and other important information about the funds, visit www.columbiamanagement.com. The prospectus should be read carefully before investing.
Columbia Funds are distributed by Columbia Management Investment Distributors, Inc., member FINRA, and managed by Columbia Management Investment Advisers, LLC.
© 2011 Columbia Management Investment Advisers, LLC. All rights reserved.
Fund Profile – Columbia Marsico 21st Century Fund
Summary
g For the 12-month period that ended February 28, 2011, the fund's Class A shares returned 22.27% without sales charge.
g The fund underperformed its benchmark, the Russell 3000 Index1 and the average return of the funds in its peer group, the Lipper Multi-Cap Growth Funds Classification2, for the period.
g Stock selection and positioning in the financials and energy sectors detracted from the fund's return relative to the index.
Portfolio Management
Corydon J. Gilchrist has managed the fund since 2003. He is with Marsico Capital Management, LLC ("MCM"), investment subadviser to the fund.
Columbia Management Investment Advisers, LLC (the Investment Manager) retained MCM to serve as investment subadviser to the Columbia Marsico funds. As an investment subadviser, MCM makes the investment decisions and manages all or a portion of the fund. MCM is an investment adviser registered with the Securities and Exchange Commission. MCM is not affiliated with the Investment Manager.
1The Russell 3000 Index measures the performance of the 3,000 largest U.S. companies based on total market capitalization, which represents approximately 98% of the investable U.S. equity market.
2Lipper Inc., a widely respected data provider in the industry, calculates an average total return (assuming reinvestment of distributions) for mutual funds with investment objectives similar to those of the fund. Lipper makes no adjustment for the effect of sales loads.
Indices are not available for investment, are not professionally managed and do not reflect sales charges, fees, brokerage commissions, taxes or other expenses of investing. Securities in the fund may not match those in an index.
Performance data quoted represents past performance and current performance may be lower or higher. Past performance is no guarantee of future results. The investment return and principal value will fluctuate so that shares, when redeemed, may be worth more or less than the original cost. Please visit www.columbiamanagement.com for daily and most recent month-end performance updates.
Summary
1-year return as of 02/28/11
| | | | +22.27% | |
|
|  | | | Class A shares
(without sales charge) | |
|
| | | | +24.25% | |
|
|  | | | Russell 3000 Index | |
|
Morningstar Style BoxTM

The Morningstar Style BoxTM is based on the Fund's portfolio holdings. For equity funds, the vertical axis shows the market capitalization of the stocks owned, and the horizontal axis shows investment style (value, blend or growth). Information shown is based on the most recent data provided by Morningstar.
© 2011 Morningstar, Inc. All rights reserved. The Morningstar information contained herein: (1) is proprietary to Morningstar and/or its content providers; (2) may not be copied or distributed; and (3) is not warranted to be accurate, complete or timely. Neither Morningstar nor its content providers are responsible for any damages or losses arising from any use of this information.
1
Economic Update – Columbia Marsico 21st Century Fund
Summary
For the 12-month period that ended February 28, 2011
g The U.S. stock market, as measured by the S&P 500 Index, delivered solid returns, despite a summer 2010 correction. Foreign stock market returns were generally in line with the U.S. market, as measured by the MSCI EAFE Index (Net).
| S&P Index | | MSCI Index | |
|
 | |  | |
|
g Strengthening economic growth and rising interest rates kept a lid on most bond market sectors. The Barclays Capital Aggregate Bond Index delivered modest results. However, high-yield bonds were strong performers, as measured by the JPMorgan Developed BB High Yield Index.
Barclays
Aggregate Index | | JPMorgan
Index | |
|
 | |  | |
|
The U.S. economy continued to expand at a modest pace over the past 12 months, as measured by gross domestic product (GDP). After a strong first quarter in 2010, GDP growth dropped to 1.7% in the second quarter and fear spread that the economy would lapse into recession. However, the pace picked up in the third quarter, and growth was strong enough to inspire confidence among consumers, businesses and investors. GDP expanded by 2.6% in the third quarter and 2.8% in the fourth quarter. With the Federal Reserve Board (the Fed) providing additional monetary stimulus to shore up economic growth and the extension of key tax cuts for the next two years, 2011 expectations are for continued growth. Consumer confidence is on the mend, even though job growth has not met expectations. Business spending also tracked higher over the period.
Consumer spending on cars, clothing and other goods generally trended higher throughout the year. Holiday spending rose 5.5% between November 5, 2010 and December 24, 2010, in all retail categories, excluding automobiles, compared with the same period in 2009, according to MasterCard Advisors' SpendingPulse, which tracks spending on all transactions including cash. Analysts say that an increase in personal savings and a decline in consumer debt gave consumers confidence to spend a little more on the 2010 holidays. The personal savings rate edged higher, ending January 2011, the last month for which data was available, at 5.8%. Personal income also increased during the year, surging in January 2011, as payroll tax cuts kicked in.
News on the job front was mostly positive over the 12-month period. A good portion of the jobs added in March, April and May of 2010 were temporary, government-sponsored census positions, which began to unwind in June, July and August of 2010. However, private sector payroll employment began to trend higher in the third quarter, massive layoffs declined and job growth turned solidly positive, with the addition of 255,000 new jobs in the first two months of 2011.
Despite some glimmers of improvement early in 2010, the housing market remained troublesome throughout the period. Both new and existing home sales fell after a federal tax credit for new and repeat homebuyers expired. Distressed properties pressured prices and foreclosures continued—another drag on prices. The inventory of unsold homes ended the period just about where it started, at 7.6 months for both new and existing homes, according to the National Association of Realtors and a joint release from the U.S. Census Bureau and the U.S. Department of Housing and Urban Development. The new year brought a bit of good news: Existing home sales increased in January 2011, raising the level of sales above where it was one year ago. According to the National Association of Realtors, it was the first time in seven months that year-over-year sales activity compared favorably.
Reports from the business side of the economy were generally positive. A key measure of the nation's manufacturing situation—the Institute for Supply Management's Index—took a somewhat surprising turn higher in the final months of the period. Technology spending rose 12% in 2010, according to the NPD Group, a national marketing research firm. Purchases of computers, networking and software returned to prerecession levels. Industrial production was disappointingly flat at year end, per the report issued by the Fed, and it slipped further in January 2011. The amount of manufacturing capacity utilized, per the report issued by the Fed,—a key measure of the health of the manufacturing sector—continued to inch higher.
Stocks moved higher despite summer 2010 setback
Against a strengthening economic backdrop, a stock market rally that began early in 2009 continued into 2010 despite a summer setback linked to a debt crisis brewing in Europe, which
2
Economic Update (continued) – Columbia Marsico 21st Century Fund
raised concerns among U.S. investors. These fears were short-lived and stocks regained their footing in September 2010, moving higher through the end of the period. The S&P 500 Index1 returned 22.57% for the 12 months through February 28, 2011. Outside the United States, stock market returns seesawed but ended just short of U.S. market returns. The MSCI EAFE Index (Net),2 a broad gauge of stock market performance in foreign developed markets, returned 20.00% (in U.S. dollars) for the 12-month period, as concerns about the impact of a bailout for weak euro zone economies abated. Emerging stock markets were similarly strong. The MSCI Emerging Markets Index (Net)3 returned 20.91% (in U.S. dollars) for the 12-month period.
Bonds delivered modest returns
As the economy strengthened and interest rates edged higher, most bond sectors delivered modest returns. The Barclays Capital Aggregate Bond Index4 returned 4.93%. High-yield bonds led the fixed-income markets. For the 12 months covered by this report, the JPMorgan Developed BB High Yield Index5 returned 14.74%. Despite rising yields in the second half of the period, the Treasury market was also positive. The Barclays Capital U.S. Treasury Index6 returned 3.71%. However, municipal bonds struggled in the final months of the period, as interest rates inched higher and issue supply surged ahead of the expiration of the Build America Bonds program. The Barclays Capital Municipal Bond Index7 gained 1.72% for the period. Despite positive economic activity, the Fed kept a key short-term interest rate—the federal funds rate—close to zero.
Past performance is no guarantee of future results.
1The Standard & Poor's (S&P) 500 Index tracks the performance of 500 widely held, large-capitalization U.S. stocks.
2The Morgan Stanley Capital International Europe, Australasia, Far East (MSCI EAFE) Index (Net) is a free float-adjusted market capitalization index that is designed to measure the equity market performance of developed markets, excluding the U.S. & Canada. As of May 27, 2010, the MSCI EAFE Index (Net) consisted of the following 22 developed market country indices: Australia, Austria, Belgium, Denmark, Finland, France, Germany, Greece, Hong Kong, Ireland, Israel, Italy, Japan, the Netherlands, New Zealand, Norway, Portugal, Singapore, Spain, Sweden, Switzerland and the United Kingdom.
3The Morgan Stanley Capital International Emerging Markets (MSCI EM) Index (Net) is a free float-adjusted market capitalization index that is designed to measure equity market performance of emerging markets. As of May 27, 2010, the MSCI EM Index (Net) consisted of the following 21 emerging market country indices: Brazil, Chile, China, Colombia, Czech Republic, Egypt, Hungary, India, Indonesia, Korea, Malaysia, Mexico, Morocco, Peru, Philippines, Poland, Russia, South Africa, Taiwan, Thailand and Turkey.
4The Barclays Capital Aggregate Bond Index is a market value-weighted index that tracks the daily price, coupon, pay-downs and total return performance of fixed-rate, publicly placed, dollar-denominated and non-convertible investment grade debt issues with at least $250 million par amount outstanding and with at least one year to final maturity.
5The JPMorgan Developed BB High Yield Index is an unmanaged index designed to mirror the investable universe of the U.S. dollar developed, BB-rated, high yield corporate debt market.
6The Barclays Capital U.S. Treasury Index includes public obligations of the U.S. Treasury. Treasury bills are excluded by the maturity constraint. In addition, certain special issues, such as state and local government series bonds (SLGs), as well as U.S.Treasury TIPS, are excluded. STRIPS are excluded from the index because their inclusion would result in double-counting.
7The Barclays Capital Municipal Bond Index is considered representative of the broad market for investment-grade, tax-exempt bonds with a maturity of at least one year.
Indices are not available for investment, are not professionally managed and do not reflect sales charges, fees, brokerage commissions, taxes or other expenses of investing. Securities in the fund may not match those in an index.
3
Performance Information – Columbia Marsico 21st Century Fund
Performance data quoted represents past performance and current performance may be lower or higher. Past performance is no guarantee of future results. The investment return and principal value will fluctuate so that shares, when redeemed, may be worth more or less than the original cost. Please visit www.columbiamanagement.com for daily and most recent month-end performance updates.
Performance of a $10,000 investment 03/01/01 – 02/28/11
The chart above shows the change in value of a hypothetical $10,000 investment in Class A shares of Columbia Marsico 21st Century Fund during the stated time period, and does not reflect the deduction of taxes that a shareholder may pay on fund distributions or on the redemption of fund shares.
Performance of a $10,000 investment 03/01/01 – 02/28/11 ($)
| Sales charge | | without | | with | |
| Class A | | | 19,844 | | | | 18,707 | | |
| Class B | | | 18,416 | | | | 18,416 | | |
| Class C | | | 18,416 | | | | 18,416 | | |
| Class R | | | 19,582 | | | | n/a | | |
| Class Z | | | 20,350 | | | | n/a | | |
Average annual total return as of 02/28/11 (%)
| Share class | | A | | B | | C | | R | | Z | |
| Inception | | 04/10/00 | | 04/10/00 | | 04/10/00 | | 01/23/06 | | 04/10/00 | |
| Sales charge | | without | | with | | without | | with | | without | | with | | without | | without | |
| 1-year | | | 22.27 | | | | 15.24 | | | | 21.45 | | | | 16.45 | | | | 21.45 | | | | 20.45 | | | | 21.95 | | | | 22.60 | | |
| 5-year | | | 2.83 | | | | 1.62 | | | | 2.07 | | | | 1.70 | | | | 2.09 | | | | 2.09 | | | | 2.57 | | | | 3.09 | | |
| 10-year | | | 7.09 | | | | 6.46 | | | | 6.30 | | | | 6.30 | | | | 6.30 | | | | 6.30 | | | | 6.95 | | | | 7.36 | | |
The "with sales charge" returns include the maximum initial sales charge of 5.75% for Class A shares and the applicable contingent deferred sales charge of 5.00% in the first year, declining to 1.00% in the sixth year and eliminated thereafter for Class B shares and 1.00% for Class C shares for the first year only. The "without sales charge" returns do not include the effect of sales charges. If they had, returns would be lower.
Performance results reflect any fee waivers or reimbursements of fund expenses by the Investment Manager and/or any of its affiliates. Absent these fee waivers or expense reimbursement arrangements, performance results would have been lower.
All results shown assume reinvestment of distributions. Class R shares are sold at net asset value with a distribution (Rule 12b-1) fee. Class Z shares are sold at net asset value with no distribution and service (Rule 12b-1) fees. Class R and Class Z shares have limited eligibility and the investment minimum requirements may vary. Please see the fund's prospectus for details. Performance for different share classes will vary based on differences in sales charges and fees associated with each class.
The tables do not reflect the deduction of taxes that a shareholder may pay on fund distributions or on the redemption of fund shares.
The returns for Class R shares include the returns of Class A shares prior to January 23, 2006, the date on which Class R shares were initially offered by the fund. If differences in expenses had been reflected, the returns would have been lower, since Class R shares are subject to higher distribution and service (Rule 12b-1) fees.
4
Understanding Your Expenses – Columbia Marsico 21st Century Fund
As a fund shareholder, you incur two types of costs. There are transaction costs, which generally include sales charges on purchases and may include redemption fees or exchange fees. There are also ongoing costs, which generally include investment advisory fees, distribution and service (Rule 12b-1) fees and other fund expenses. The information on this page is intended to help you understand the ongoing costs of investing in the fund and to compare these costs with the ongoing costs of investing in other mutual funds.
Analyzing your fund's expenses by share class
To illustrate these ongoing costs, we have provided an example and calculated the expenses paid by investors in each share class during the period. The information in the following table is based on an initial investment of $1,000, which is invested at the beginning of the period and held for the entire period. Expense information is calculated two ways and each method provides you with different information. The amount listed in the "Actual" column is calculated using the fund's actual operating expenses and total return for the period. The amount listed in the "Hypothetical" column for each share class assumes that the return each year is 5% before expenses and is calculated based on the fund's actual operating expenses. You should not use the hypothetical account values and expenses to estimate either your actual account balance at the end of the period or the expenses you paid during this period.
Compare with other funds
Since all mutual funds are required to include the same hypothetical calculations about expenses in shareholder reports, you can use this information to compare the ongoing cost of investing in the fund with other funds. To do so, compare the 5% hypothetical example with the 5% hypothetical examples that appear in the shareholder reports of other funds. As you compare hypothetical examples of other funds, it is important to note that hypothetical examples are meant to highlight the ongoing costs of investing in a fund and do not reflect any transaction costs, such as sales charges, redemption fees or exchange fees.
Estimating your actual expenses
To estimate the expenses that you paid over the period, first you will need your account balance at the end of the period:
g For shareholders who receive their account statements from Columbia Management Investment Services Corp., your account balance is available online at www.columbiamanagement.com or by calling Shareholder Services at 800.345.6611.
g For shareholders who receive their account statements from their financial intermediary, contact your financial intermediary to obtain your account balance.
1. Divide your ending account balance by $1,000. For example, if an account balance was $8,600 at the end of the period, the result would be 8.6.
2. In the section of the table below titled "Expenses paid during the period," locate the amount for your share class. You will find this number in the column labeled "Actual." Multiply this number by the result from step 1. Your answer is an estimate of the expenses you paid on your account during the period.
If the value of your account falls below the minimum initial investment requirement applicable to you, your account may be subject to a $20 annual fee. This fee is not included in the accompanying table. If you are subject to the fee, keep it in mind when you are estimating the ongoing expenses of investing in the fund and when comparing the expenses of this fund with other funds.
09/01/10 – 02/28/11
| | | Account value at the
beginning of the period ($) | | Account value at the
end of the period ($) | | Expenses paid
during the period ($) | | Fund's annualized
expense ratio (%) | |
| | | Actual | | Hypothetical | | Actual | | Hypothetical | | Actual | | Hypothetical | | Actual | |
| Class A | | | 1,000.00 | | | | 1,000.00 | | | | 1,320.30 | | | | 1,018.40 | | | | 7.42 | | | | 6.46 | | | | 1.29 | | |
| Class B | | | 1,000.00 | | | | 1,000.00 | | | | 1,314.80 | | | | 1,014.68 | | | | 11.71 | | | | 10.19 | | | | 2.04 | | |
| Class C | | | 1,000.00 | | | | 1,000.00 | | | | 1,314.80 | | | | 1,014.68 | | | | 11.71 | | | | 10.19 | | | | 2.04 | | |
| Class R | | | 1,000.00 | | | | 1,000.00 | | | | 1,318.70 | | | | 1,017.16 | | | | 8.85 | | | | 7.70 | | | | 1.54 | | |
| Class Z | | | 1,000.00 | | | | 1,000.00 | | | | 1,321.80 | | | | 1,019.64 | | | | 5.99 | | | | 5.21 | | | | 1.04 | | |
Expenses paid during the period are equal to the annualized expense ratio for the share class, multiplied by the average account value over the period, then multiplied by the number of days in the fund's most recent fiscal half-year and divided by 365.
It is important to note that the expense amounts shown in the table are meant to highlight only ongoing costs of investing in the fund and do not reflect any transaction costs, such as sales charges, redemption fees or exchange fees. Therefore, the hypothetical examples provided may not help you determine the relative total costs of owning shares of different funds. If these transaction costs were included, your costs would have been higher.
5
Portfolio Manager's Report – Columbia Marsico 21st Century Fund
Performance data quoted represents past performance and current performance may be lower or higher. Past performance is no guarantee of future results. The investment return and principal value will fluctuate so that shares, when redeemed, may be worth more or less than the original cost. Please visit www.columbiamanagement.com for daily and most recent month-end performance updates.
Net asset value per share
as of 02/28/11 ($)
| Class A | | | 14.22 | | |
| Class B | | | 13.25 | | |
| Class C | | | 13.25 | | |
| Class R | | | 14.11 | | |
| Class Z | | | 14.54 | | |
Top 5 sectors
as of 02/28/11 (%)
| Financials | | | 32.2 | | |
| Consumer Discretionary | | | 22.0 | | |
| Information Technology | | | 16.2 | | |
| Industrials | | | 11.3 | | |
| Health Care | | | 6.0 | | |
Top 5 sectors are calculated as a percentage of net assets.
For the 12-month period that ended February 28, 2011, the fund's Class A shares returned 22.27% without sales charge. Although the fund generated solid, double-digit results in a period that was generally positive for stocks, its return fell short of the 24.25% return of its benchmark, the Russell 3000 Index. The average return of its peer group, the Lipper Multi-Cap Growth Funds Classification, was 26.75%. The fund's stakes in the financials and energy sectors generally accounted for this shortfall. An emphasis on consumer discretionary stocks and stock selection in consumer discretionary, information technology and industrials contributed most to the fund's performance relative to the index.
Financials, energy weighed on returns
Throughout the period, the fund had approximately twice the exposure to the financials sector as did the benchmark index. This positioning hurt fund performance because financials underperformed the overall return of the Russell 3000 Index. Stock selection also detracted from relative results. First Horizon National (3.2% of net assets), U.S. Bancorp and First Midwest Bancorp each posted negative returns. The latter two were sold.
The energy sector was the strongest performer within the index during the time frame. The fund had less exposure than the index to energy, which hurt results, as did stock-specific disappointments within the sector. Prior to being sold from the portfolio, Range Resources (natural gas exploration and production) and National Oilwell Varco (drilling equipment) posted negative returns. Within health care, Intuitive Surgical (4.0% of net assets), also detracted materially from performance when its share price fell because of slower growth in the number of surgical procedures using its systems. The firm makes a robotic system for assisting in minimally invasive surgeries. We continue to own the stock because we believe there are compelling market opportunities for increased use of its da Vinci Surgical System in hysterectomy, prostate and cardiac surgical procedures.
Consumer discretionary, information technology aided results
The fund's consumer discretionary holdings bolstered performance against the index. An overweight in the strong-performing sector was positive, and stock selection also helped return. Resort operators Wynn Resorts and Starwood Hotels & Resorts (1.0% and 1.5% of net assets, respectively) had a strong price appreciation during the period. Internet retailer Amazon.com (3.0% of net assets) and media companies CBS (sold during the period) and Walt Disney (4.9% of net assets) were other leading holdings in the sector.
Stock selection was also strong in the information technology and industrials sectors. Apple (3.2% of net assets), the maker of the iPod and iPad, and online restaurant reservations software company OpenTable (1.6% of net assets) were the fund's best performing technology positions. In industrials, shares of Netherlands-based global industrial technology firm Sensata Technologies (2.6% of net assets) soared, while railroad services company CSX (2.6% of net assets) also had a strong stock price gain. The fund's results also were aided by an underweight position in the health care sector, which was the weakest-performing sector in the benchmark Russell 3000 Index.
6
Portfolio Manager's Report (continued) – Columbia Marsico 21st Century Fund
Portfolio changes
During the period, the fund increased its allocation to the industrials sector and sold its telecommunications services and consumer staples holdings. At the end of the period, the fund had no exposure to either of these sectors or to utilities. Its heaviest sector allocations included financials, consumer discretionary, information technology and industrials.
Source for all statistical data—Columbia Management Investment Advisers, LLC.
Source of all stock-specific commentary—Marsico Capital Management, LLC.
Portfolio characteristics and holdings are subject to change periodically and may not be representative of current characteristics and holdings. The outlook for the fund may differ from those presented for other Columbia Funds.
Equity securities are subject to stock market fluctuations that occur in response to economic and business developments.
The fund normally invests in a core portfolio of 35-50 stocks. By maintaining a relatively concentrated portfolio, the fund may be subject to greater risk than a fund that is more fully diversified.
International investing involves special risks, including foreign taxation, currency fluctuations, risks associated with possible differences in financial standards and other risks associated with future political and economic developments.
Top 10 holdings
as of 02/28/11 (%)
| Wells Fargo & Co. | | | 5.7 | | |
PNC Financial Services
Group, Inc. | | | 5.3 | | |
| Walt Disney Co. | | | 4.9 | | |
| Williams-Sonoma, Inc. | | | 4.4 | | |
First Niagara Financial
Group, Inc. | | | 4.3 | | |
| Intuitive Surgical, Inc. | | | 4.0 | | |
| General Motors Co. | | | 3.4 | | |
| First Horizon National Corp. | | | 3.2 | | |
| Apple, Inc. | | | 3.2 | | |
| Precision Castparts Corp. | | | 3.1 | | |
The fund is actively managed and the composition of its portfolio will change over time. Information provided is calculated as a percentage of net assets.
7
Investment Portfolio – Columbia Marsico 21st Century Fund
February 28, 2011
| Common Stocks – 95.0% | |
| | | Shares | | Value ($) | |
| Consumer Discretionary – 22.0% | |
| Automobiles – 3.4% | |
| General Motors Co. (a) | | | 3,740,194 | | | | 125,408,705 | | |
| Automobiles Total | | | 125,408,705 | | |
| Hotels, Restaurants & Leisure – 5.2% | |
| Chipotle Mexican Grill, Inc. (a) | | | 61,800 | | | | 15,141,000 | | |
Starwood Hotels & Resorts
Worldwide, Inc. | | | 922,934 | | | | 56,391,268 | | |
| Vail Resorts, Inc. (a)(b) | | | 993,613 | | | | 48,488,314 | | |
Wendy's/Arby's Group, Inc.,
Class A | | | 7,164,577 | | | | 34,103,387 | | |
| Wynn Resorts Ltd. | | | 304,623 | | | | 37,447,305 | | |
| Hotels, Restaurants & Leisure Total | | | 191,571,274 | | |
| Internet & Catalog Retail – 3.0% | |
| Amazon.com, Inc. (a) | | | 647,797 | | | | 112,256,742 | | |
| Internet & Catalog Retail Total | | | 112,256,742 | | |
| Media – 4.9% | |
| Walt Disney Co. | | | 4,144,858 | | | | 181,296,089 | | |
| Media Total | | | 181,296,089 | | |
| Specialty Retail – 5.5% | |
| Rue21, Inc. (a) | | | 1,044,062 | | | | 36,563,051 | | |
| Williams-Sonoma, Inc. | | | 4,554,382 | | | | 164,367,646 | | |
| Specialty Retail Total | | | 200,930,697 | | |
| Consumer Discretionary Total | | | 811,463,507 | | |
| Energy – 4.9% | |
| Oil, Gas & Consumable Fuels – 4.9% | |
| Amyris, Inc. (a) | | | 608,414 | | | | 19,767,371 | | |
| Anadarko Petroleum Corp. | | | 472,980 | | | | 38,703,953 | | |
| Gevo, Inc. (a) | | | 588,534 | | | | 11,600,005 | | |
OGX Petroleo e Gas
Participacoes SA (a) | | | 6,344,000 | | | | 74,162,039 | | |
| Ultra Petroleum Corp. (a) | | | 796,136 | | | | 36,104,768 | | |
| Oil, Gas & Consumable Fuels Total | | | 180,338,136 | | |
| Energy Total | | | 180,338,136 | | |
| Financials – 32.2% | |
| Capital Markets – 3.5% | |
| Jefferies Group, Inc. | | | 1,920,421 | | | | 46,205,329 | | |
| State Street Corp. | | | 1,831,168 | | | | 81,889,833 | | |
| Capital Markets Total | | | 128,095,162 | | |
| Commercial Banks – 20.2% | |
| BB&T Corp. | | | 2,742,673 | | | | 75,697,775 | | |
| City National Corp. | | | 759,266 | | | | 44,728,360 | | |
| | | Shares | | Value ($) | |
| Columbia Banking System, Inc. | | | 1,347,155 | | | | 26,727,555 | | |
| First Horizon National Corp. | | | 10,252,627 | | | | 117,905,211 | | |
| Fulton Financial Corp. | | | 3,586,571 | | | | 39,057,758 | | |
| Glacier Bancorp, Inc. | | | 1,765,499 | | | | 27,594,749 | | |
| Park Sterling Corp. (a)(b) | | | 1,868,030 | | | | 9,321,470 | | |
PNC Financial Services
Group, Inc. | | | 3,187,901 | | | | 196,693,492 | | |
| Wells Fargo & Co. | | | 6,501,943 | | | | 209,752,681 | | |
| Commercial Banks Total | | | 747,479,051 | | |
| Real Estate Investment Trusts (REITs) – 0.4% | |
| Colony Financial, Inc. | | | 721,673 | | | | 15,335,551 | | |
Real Estate Investment
Trusts (REITs) Total | | | 15,335,551 | | |
| Real Estate Management & Development – 3.8% | |
| BR Malls Participacoes SA | | | 2,956,100 | | | | 28,160,948 | | |
| Jones Lang LaSalle, Inc. | | | 1,130,360 | | | | 111,250,031 | | |
Real Estate Management &
Development Total | | | 139,410,979 | | |
| Thrifts & Mortgage Finance – 4.3% | |
First Niagara Financial
Group, Inc. (b) | | | 11,074,473 | | | | 160,358,369 | | |
| Thrifts & Mortgage Finance Total | | | 160,358,369 | | |
| Financials Total | | | 1,190,679,112 | | |
| Health Care – 6.0% | |
| Health Care Equipment & Supplies – 4.0% | |
| Intuitive Surgical, Inc. (a) | | | 445,622 | | | | 146,141,735 | | |
Health Care Equipment &
Supplies Total | | | 146,141,735 | | |
| Health Care Technology – 1.7% | |
Allscripts Healthcare
Solutions, Inc. (a) | | | 3,002,119 | | | | 64,095,241 | | |
| Health Care Technology Total | | | 64,095,241 | | |
| Life Sciences Tools & Services – 0.3% | |
Pacific Biosciences of
California, Inc. (a) | | | 754,523 | | | | 11,876,192 | | |
Life Sciences Tools &
Services Total | | | 11,876,192 | | |
| Health Care Total | | | 222,113,168 | | |
| Industrials – 11.3% | |
| Aerospace & Defense – 6.1% | |
| Honeywell International, Inc. | | | 1,933,091 | | | | 111,945,300 | | |
| Precision Castparts Corp. | | | 800,927 | | | | 113,531,402 | | |
| Aerospace & Defense Total | | | 225,476,702 | | |
See Accompanying Notes to Financial Statements.
8
Columbia Marsico 21st Century Fund
February 28, 2011
| Common Stocks (continued) | |
| | | Shares | | Value ($) | |
| Electrical Equipment – 2.6% | |
Sensata Technologies
Holding NV (a) | | | 2,877,729 | | | | 95,252,830 | | |
| Electrical Equipment Total | | | 95,252,830 | | |
| Road & Rail – 2.6% | |
| CSX Corp. | | | 1,280,433 | | | | 95,597,128 | | |
| Road & Rail Total | | | 95,597,128 | | |
| Industrials Total | | | 416,326,660 | | |
| Information Technology – 16.2% | |
| Communications Equipment – 1.2% | |
| Acme Packet, Inc. (a) | | | 596,891 | | | | 44,910,079 | | |
| Communications Equipment Total | | | 44,910,079 | | |
| Computers & Peripherals – 3.2% | |
| Apple, Inc. (a) | | | 331,119 | | | | 116,954,542 | | |
| Computers & Peripherals Total | | | 116,954,542 | | |
| Internet Software & Services – 1.6% | |
| OpenTable, Inc. (a) | | | 654,189 | | | | 58,137,776 | | |
| Internet Software & Services Total | | | 58,137,776 | | |
| Software – 10.2% | |
| ANSYS, Inc. (a) | | | 1,504,938 | | | | 84,758,108 | | |
| Informatica Corp. (a) | | | 1,777,338 | | | | 83,552,659 | | |
| Nuance Communications, Inc. (a) | | | 1,993,047 | | | | 37,190,257 | | |
| Oracle Corp. | | | 3,418,182 | | | | 112,458,188 | | |
| Salesforce.com, Inc. (a) | | | 461,265 | | | | 61,011,522 | | |
| Software Total | | | 378,970,734 | | |
| Information Technology Total | | | 598,973,131 | | |
| Materials – 2.4% | |
| Chemicals – 2.4% | |
| Monsanto Co. | | | 1,257,506 | | | | 90,402,106 | | |
| Chemicals Total | | | 90,402,106 | | |
| Materials Total | | | 90,402,106 | | |
Total Common Stocks
(cost of $2,613,119,208) | | | 3,510,295,820 | | |
| Short-Term Obligation – 6.1% | |
| | | Par ($) | | Value ($) | |
Repurchase agreement with
Fixed Income Clearing Corp.,
dated 02/28/11, due 03/01/11
at 0.090%, collateralized by
U.S. Government Agency
obligations with various
maturities to 01/28/14, market
value $229,668,100
(repurchase proceeds
$225,162,563) | | | 225,162,000 | | | | 225,162,000 | | |
Total Short-Term Obligation
(cost of $225,162,000) | | | 225,162,000 | | |
Total Investments – 101.1%
(cost of $2,838,281,208) (c) | | | 3,735,457,820 | | |
| Other Assets & Liabilities, Net – (1.1)% | | | (40,327,500 | ) | |
| Net Assets – 100.0% | | | 3,695,130,320 | | |
Notes to Investment Portfolio:
(a) Non-income producing security.
(b) An affiliate may include any company in which the Fund owns five percent or more of its outstanding voting shares. Transactions in these affiliated companies which are or were affiliated during the year ended February 28, 2011, are as follows:
| Affiliate | | Value,
beginning of
period | | Purchases | | Sales
Proceeds | | Dividend
Income | | Value, end of
period | |
Vail Resorts,
Inc.* | | $ | 83,838,554 | | | $ | — | | | $ | 56,409,588 | | | $ | — | | | $ | — | | |
First Niagara
Financial
Group, Inc. | | | — | | | | 77,535,448 | | | | — | | | | 4,849,999 | | | | 160,358,369 | | |
Park Sterling
Corp. | | | — | | | | 12,142,195 | | | | — | | | | — | | | | 9,321,470 | | |
| Total | | $ | 83,838,554 | | | $ | 89,677,643 | | | $ | 56,409,588 | | | $ | 4,849,999 | | | $ | 169,679,839 | | |
* At February 28, 2011, the Fund owns less than five percent of the company's outstanding voting shares.
(c) Cost for federal income tax purposes is $2,956,449,533.
Generally accepted accounting principles (GAAP) require disclosure regarding the inputs and valuation techniques used to measure fair value and any changes in valuation inputs or techniques. In addition, investments shall be disclosed by major category.
The Fund categorizes its fair value measurements according to a three-level hierarchy that maximizes the use of observable inputs and minimizes the use of unobservable inputs by prioritizing that the most observable input be used when available. Observable inputs are those that market participants would use in pricing an investment based on market data obtained from sources independent of the reporting entity. Unobservable inputs are those that reflect the Fund's assumptions about the information market participants would use in pricing an investment. An investment's level within the fair value hierarchy is based on the lowest level of any input that is deemed significant to the asset or liability's fair value measurement. The input levels are not necessarily an indication of the risk or liquidity associated with investments at that level. For example, certain U.S. government securities are generally high quality and liquid, however, they are reflected as Level 2 because the inputs used to determine fair value may not always be quoted prices in an active market.
See Accompanying Notes to Financial Statements.
9
Columbia Marsico 21st Century Fund
February 28, 2011
Fair value inputs are summarized in the three broad levels listed below:
• Level 1—Valuations based on quoted prices for investments in active markets that the Fund has the ability to access at the measurement date (including NAV for open-end mutual funds). Valuation adjustments are not applied to Level 1 investments.
• Level 2—Valuations based on other significant observable inputs (including quoted prices for similar securities, interest rates, prepayment speeds, credit risks, etc.).
• Level 3—Valuations based on significant unobservable inputs (including the Fund's own assumptions and judgment in determining the fair value of investments).
Inputs that are used in determining fair value of an investment may include price information, credit data, volatility statistics, and other factors. These inputs can be either observable or unobservable. The availability of observable inputs can vary between investments, and is affected by various factors such as the type of investment, and the volume and level of activity for that investment or similar investments in the marketplace. The inputs will be considered by the Investment Manager, along with any other relevant factors in the calculation of an investment's fair value. The Fund uses prices and inputs that are current as of the measurement date, which may include periods of market dislocations. During these periods, the availability of prices and inputs may be reduced for many investments. This condition could cause an investment to be reclassified between the various levels within the hierarchy. Non-U.S. equity securities actively traded in foreign markets may be reflected in Level 2 despite the availability of closing prices, because the Fund evaluates and determines whether those closing prices reflect fair value at the close of the New York Stock Exchange (NYSE) or require adjustment, as described in Note 2 to the financial statements—Security Valuation.
Investments falling into the Level 3 category are primarily supported by quoted prices from brokers and dealers participating in the market for those investments. However, these may be classified as Level 3 investments due to lack of market transparency and corroboration to support these quoted prices. Additionally, valuation models may be used as the pricing source for any remaining investments classified as Level 3. These models rely on one or more significant unobservable inputs and/or significant assumptions by the Investment Manager. Inputs used in valuations may include, but are not limited to, financial statement analysis, capital account balances, discount rates and estimated cash flows, and comparable company data.
The following table is a summary of the inputs used to value the Fund's investments as of February 28, 2011:
| Description | | Quoted
Prices
(Level 1) | | Other
Significant
Observable
Inputs
(Level 2) | | Significant
Unobservable
Inputs
(Level 3) | | Total | |
| Total Common Stocks | | $ | 3,510,295,820 | | | $ | — | | | $ | — | | | $ | 3,510,295,820 | | |
Total Short-Term
Obligation | | | — | | | | 225,162,000 | | | | — | | | | 225,162,000 | | |
| Total Investments | | $ | 3,510,295,820 | | | $ | 225,162,000 | | | $ | — | | | $ | 3,735,457,820 | | |
The Fund's assets assigned to the Level 2 input category represent certain short-term obligations which are valued using amortized cost, an income approach which converts future cash flows to a present value based upon the discount or premium at purchase.
There were no significant transfers of financial assets between Levels 1 and 2 during the period.
At February 28, 2011, the Fund held investments in the following sectors:
| Sector (Unaudited) | | % of
Net Assets | |
| Financials | | | 32.2 | | |
| Consumer Discretionary | | | 22.0 | | |
| Information Technology | | | 16.2 | | |
| Industrials | | | 11.3 | | |
| Health Care | | | 6.0 | | |
| Energy | | | 4.9 | | |
| Materials | | | 2.4 | | |
| | | | 95.0 | | |
| Short-Term Obligation | | | 6.1 | | |
| Other Assets & Liabilities, Net | | | (1.1 | ) | |
| | | | 100.0 | | |
See Accompanying Notes to Financial Statements.
10
Statement of Assets and Liabilities – Columbia Marsico 21st Century Fund
February 28, 2011
| | | | | ($) | |
| Assets | | Unaffiliated investments, at identified cost | | | 2,687,252,968 | | |
| | | Affiliated investments, at identified cost | | | 151,028,240 | | |
| | | Total investments, at identified cost | | | 2,838,281,208 | | |
| | | Unaffiliated investments, at value | | | 3,565,777,981 | | |
| | | Affiliated investments, at value | | | 169,679,839 | | |
| | | Total investments, at value | | | 3,735,457,820 | | |
| | | Cash | | | 391 | | |
| | | Receivable for: | | | | | |
| | | Investments sold | | | 33,992,625 | | |
| | | Fund shares sold | | | 4,388,764 | | |
| | | Dividends | | | 1,528,562 | | |
| | | Interest | | | 563 | | |
| | | Foreign tax reclaims | | | 18,926 | | |
| | | Prepaid expenses | | | 13,887 | | |
| | | Total Assets | | | 3,775,401,538 | | |
| Liabilities | | Payable for: | | | | | |
| | | Investments purchased | | | 59,216,006 | | |
| | | Fund shares repurchased | | | 15,188,009 | | |
| | | Investment advisory fee | | | 1,830,718 | | |
| | | Administration fee | | | 621,638 | | |
| | | Pricing and bookkeeping fees | | | 12,291 | | |
| | | Transfer agent fee | | | 2,083,503 | | |
| | | Trustees' fees | | | 61,466 | | |
| | | Custody fee | | | 71,231 | | |
| | | Distribution and service fees | | | 897,346 | | |
| | | Chief compliance officer expenses | | | 746 | | |
| | | Other liabilities | | | 288,264 | | |
| | | Total Liabilities | | | 80,271,218 | | |
| | | Net Assets | | | 3,695,130,320 | | |
| Net Assets Consist of | | Paid-in capital | | | 5,098,903,224 | | |
| | | Accumulated net investment loss | | | (1,779,018 | ) | |
| | | Accumulated net realized loss | | | (2,299,164,180 | ) | |
| | | Net unrealized appreciation (depreciation) on: | | | | | |
| | | Investments | | | 897,176,612 | | |
| | | Foreign currency translations | | | (6,318 | ) | |
| | | Net Assets | | | 3,695,130,320 | | |
See Accompanying Notes to Financial Statements.
11
Statement of Assets and Liabilities (continued) – Columbia Marsico 21st Century Fund
February 28, 2011
| Class A | | Net assets | | $ | 1,711,838,597 | | |
| | | Shares outstanding | | | 120,344,617 | | |
| | | Net asset value per share | | $ | 14.22 | (a) | |
| | | Maximum sales charge | | | 5.75 | % | |
| | | Maximum offering price per share ($14.22/0.9425) | | $ | 15.09 | (b) | |
| Class B | | Net assets | | $ | 110,427,156 | | |
| | | Shares outstanding | | | 8,335,458 | | |
| | | Net asset value and offering price per share | | $ | 13.25 | (a) | |
| Class C | | Net assets | | $ | 586,725,221 | | |
| | | Shares outstanding | | | 44,295,596 | | |
| | | Net asset value and offering price per share | | $ | 13.25 | (a) | |
| Class R | | Net assets | | $ | 40,467,945 | | |
| | | Shares outstanding | | | 2,867,058 | | |
| | | Net asset value, offering and redemption price per share | | $ | 14.11 | | |
| Class Z | | Net assets | | $ | 1,245,671,401 | | |
| | | Shares outstanding | | | 85,669,063 | | |
| | | Net asset value, offering and redemption price per share | | $ | 14.54 | | |
(a) Redemption price per share is equal to net asset value less any applicable contingent deferred sales charge.
(b) On sales of $50,000 or more the offering price is reduced.
See Accompanying Notes to Financial Statements.
12
Statement of Operations – Columbia Marsico 21st Century Fund
For the Year Ended February 28, 2011
| | | | | ($) | |
| Investment Income | | Dividends | | | 25,944,149 | | |
| | | Dividends from affiliates | | | 4,849,999 | | |
| | | Interest | | | 193,186 | | |
| | | Foreign taxes withheld | | | (199,108 | ) | |
| | | Total Investment Income | | | 30,788,226 | | |
| Expenses | | Investment advisory fee | | | 23,090,124 | | |
| | | Administration fee | | | 7,821,770 | | |
| | | Distribution fee: | | | | | |
| | | Class B | | | 823,102 | | |
| | | Class C | | | 4,524,633 | | |
| | | Class R | | | 202,035 | | |
| | | Service fee: | | | | | |
| | | Class B | | | 274,368 | | |
| | | Class C | | | 1,508,212 | | |
| | | Distribution and service fees: | | | | | |
| | | Class A | | | 4,440,547 | | |
| | | Transfer agent fee | | | 6,578,380 | | |
| | | Pricing and bookkeeping fees | | | 142,868 | | |
| | | Trustees' fees | | | 75,961 | | |
| | | Custody fee | | | 244,403 | | |
| | | Chief compliance officer expenses | | | 4,405 | | |
| | | Other expenses | | | 542,984 | | |
| | | Total Expenses | | | 50,273,792 | | |
| | | Expense reductions | | | (173 | ) | |
| | | Net Expenses | | | 50,273,619 | | |
| | | Net Investment Loss | | | (19,485,393 | ) | |
| Net Realized and Unrealized Gain (Loss) on Investments and Foreign Currency | | Net realized gain (loss) on: | | | | | |
| | | Unaffiliated investments | | | 645,931,495 | | |
| | | Affiliated investments | | | (12,831,730 | ) | |
| | | Foreign currency transactions | | | (2,142,499 | ) | |
| | | Net realized loss on violation of investment restriction (See Note 9) | | | (1,093,080 | ) | |
| | | Reimbursement of realized loss on violation of investment restriction (See Note 9) | | | 1,093,080 | | |
| | | Net realized gain | | | 630,957,266 | | |
| | | Net change in unrealized appreciation (depreciation) on: | | | | | |
| | | Investments | | | 113,742,358 | | |
| | | Foreign currency translations | | | (50,577 | ) | |
| | | Net change in unrealized appreciation (depreciation) | | | 113,691,781 | | |
| | | Net Gain | | | 744,649,047 | | |
| | | Net Increase Resulting from Operations | | | 725,163,654 | | |
See Accompanying Notes to Financial Statements.
13
Statement of Changes in Net Assets – Columbia Marsico 21st Century Fund
| | | | | Year Ended February 28, | |
| Increase (Decrease) in Net Assets | | | | 2011 ($) | | 2010 ($) | |
| Operations | | Net investment loss | | | (19,485,393 | ) | | | (17,572,011 | ) | |
| | | Net realized gain (loss) on investments and foreign currency
transactions | | | 630,957,266 | | | | (29,875,453 | ) | |
| | | Net change in unrealized appreciation (depreciation) on
investments and foreign currency translations | | | 113,691,781 | | | | 1,852,063,675 | | |
| | | Net increase resulting from operations | | | 725,163,654 | | | | 1,804,616,211 | | |
| Distributions to Shareholders | | From net investment income: | | | | | | | | | |
| | | Class Z | | | — | | | | (51,807 | ) | |
| | | Total distributions to shareholders | | | — | | | | (51,807 | ) | |
| | | Net Capital Stock Transactions | | | (851,360,944 | ) | | | (1,581,913,765 | ) | |
| | | Total increase (decrease) in net assets | | | (126,197,290 | ) | | | 222,650,639 | | |
| Net Assets | | Beginning of period | | | 3,821,327,610 | | | | 3,598,676,971 | | |
| | | End of period | | | 3,695,130,320 | | | | 3,821,327,610 | | |
| | | Overdistributed (Accumulated) net investment income (loss)
at end of period | | | (1,779,018 | ) | | | (6,938 | ) | |
See Accompanying Notes to Financial Statements.
14
Statement of Changes in Net Assets (continued) – Columbia Marsico 21st Century Fund
| | | Capital Stock Activity | |
| | | Year Ended
February 28, 2011 | | Year Ended
February 28, 2010 | |
| | | Shares | | Dollars ($) | | Shares | | Dollars ($) | |
| Class A | |
| Subscriptions | | | 13,938,171 | | | | 173,735,086 | | | | 28,125,647 | | | | 271,443,196 | | |
| Redemptions | | | (64,980,007 | ) | | | (805,949,132 | ) | | | (125,712,406 | ) | | | (1,218,405,442 | ) | |
| Net decrease | | | (51,041,836 | ) | | | (632,214,046 | ) | | | (97,586,759 | ) | | | (946,962,246 | ) | |
| Class B | |
| Subscriptions | | | 80,425 | | | | 948,498 | | | | 389,920 | | | | 3,272,819 | | |
| Redemptions | | | (2,495,480 | ) | | | (28,921,410 | ) | | | (3,505,840 | ) | | | (32,363,151 | ) | |
| Net decrease | | | (2,415,055 | ) | | | (27,972,912 | ) | | | (3,115,920 | ) | | | (29,090,332 | ) | |
| Class C | |
| Subscriptions | | | 2,018,356 | | | | 23,544,061 | | | | 4,696,952 | | | | 42,097,591 | | |
| Redemptions | | | (18,259,296 | ) | | | (211,083,337 | ) | | | (34,135,126 | ) | | | (316,088,945 | ) | |
| Net decrease | | | (16,240,940 | ) | | | (187,539,276 | ) | | | (29,438,174 | ) | | | (273,991,354 | ) | |
| Class R | |
| Subscriptions | | | 934,045 | | | | 11,543,977 | | | | 1,653,756 | | | | 15,191,943 | | |
| Redemptions | | | (1,665,565 | ) | | | (20,572,486 | ) | | | (3,871,749 | ) | | | (36,817,796 | ) | |
| Net decrease | | | (731,520 | ) | | | (9,028,509 | ) | | | (2,217,993 | ) | | | (21,625,853 | ) | |
| Class Z | |
| Subscriptions | | | 34,981,539 | | | | 442,143,636 | | | | 27,604,452 | | | | 276,459,305 | | |
| Distributions reinvested | | | – | | | | – | | | | 3,866 | | | | 35,489 | | |
| Redemptions | | | (34,401,341 | ) | | | (436,749,837 | ) | | | (59,572,261 | ) | | | (586,738,774 | ) | |
| Net increase (decrease) | | | 580,198 | | | | 5,393,799 | | | | (31,963,943 | ) | | | (310,243,980 | ) | |
See Accompanying Notes to Financial Statements.
15
Financial Highlights – Columbia Marsico 21st Century Fund
Selected data for a share outstanding throughout each period is as follows:
| | | Year Ended February 28, | | Year Ended
February 29, | | Period Ended
February 28, | | Year Ended
March 31, | |
| Class A Shares | | 2011 | | 2010 | | 2009 | | 2008 | | 2007 (a) | | 2006 (b) | |
| Net Asset Value, Beginning of Period | | $ | 11.63 | | | $ | 7.31 | | | $ | 14.55 | | | $ | 14.28 | | | $ | 13.58 | | | $ | 10.61 | | |
| Income from Investment Operations: | |
| Net investment income (loss) (c) | | | (0.06 | ) | | | (0.03 | ) | | | 0.01 | | | | 0.02 | | | | 0.11 | (d) | | | (0.03 | ) | |
Net realized and unrealized gain (loss)
on investments and foreign currency | | | 2.65 | | | | 4.35 | | | | (7.25 | ) | | | 0.77 | (e) | | | 0.89 | | | | 3.00 | | |
| Total from investment operations | | | 2.59 | | | | 4.32 | | | | (7.24 | ) | | | 0.79 | | | | 1.00 | | | | 2.97 | | |
| Less Distributions to Shareholders: | |
| From net investment income | | | — | | | | — | | | | — | | | | — | | | | (0.10 | ) | | | — | (f) | |
| From net realized gains | | | — | | | | — | | | | — | | | | (0.49 | ) | | | (0.20 | ) | | | — | | |
| From return of capital | | | — | | | | — | | | | — | | | | (0.03 | ) | | | — | | | | — | | |
| Total distributions to shareholders | | | — | | | | — | | | | — | | | | (0.52 | ) | | | (0.30 | ) | | | — | (f) | |
| Redemption Fees: | |
| Redemption fees added to paid-in-capital | | | — | | | | — | | | | — | (c)(f) | | | — | | | | — | | | | — | | |
| Net Asset Value, End of Period | | $ | 14.22 | | | $ | 11.63 | | | $ | 7.31 | | | $ | 14.55 | | | $ | 14.28 | | | $ | 13.58 | | |
| Total return (g) | | | 22.27 | %(h) | | | 59.10 | %(i) | | | (49.76 | )%(i) | | | 5.16 | %(i) | | | 7.59 | %(i)(j) | | | 28.04 | %(i) | |
Ratios to Average Net Assets/
Supplemental Data: | |
| Net expenses (k) | | | 1.31 | % | | | 1.30 | % | | | 1.25 | % | | | 1.20 | % | | | 1.26 | %(l) | | | 1.31 | % | |
| Waiver/Reimbursement | | | — | | | | 0.01 | % | | | 0.04 | % | | | 0.02 | % | | | 0.02 | %(l) | | | 0.01 | % | |
| Net investment income (loss) (k) | | | (0.47 | )% | | | (0.35 | )% | | | 0.12 | % | | | 0.15 | % | | | 0.84 | %(l) | | | (0.22 | )% | |
| Portfolio turnover rate | | | 87 | % | | | 119 | % | | | 152 | % | | | 113 | % | | | 86 | %(j) | | | 141 | % | |
| Net assets, end of period (000s) | | $ | 1,711,839 | | | $ | 1,993,000 | | | $ | 1,967,386 | | | $ | 5,062,299 | | | $ | 2,474,268 | | | $ | 675,287 | | |
(a) The Fund changed its fiscal year end from March 31 to February 28. Per share data and total return reflect activity from April 1, 2006 through February 28, 2007.
(b) On August 22, 2005, the Fund's Investor A shares were renamed Class A shares.
(c) Per share data was calculated using the average shares outstanding during the period.
(d) Net investment income per share reflects special dividends. The effect of these dividends amounted to $0.08 per share.
(e) The amount shown for a share outstanding does not correspond with the aggregate net loss on investments for the period due to timing of repurchases of Fund shares in relation to fluctuating market values of the investments of the Fund.
(f) Rounds to less than $0.01 per share.
(g) Total return at net asset value assuming all distributions reinvested and no initial sales charge or contingent deferred sales charge.
(h) Total return includes a reimbursement of a loss experienced by the Fund due to a compliance violation. This reimbursement increased total return and net asset value per share by less than 0.01% and less than $0.01, respectively.
(i) Had the Investment Manager and/or any of its affiliates not waived fees or reimbursed a portion of expenses, total return would have been reduced.
(j) Not annualized.
(k) The benefits derived from expense reductions had an impact of less than 0.01%, except for the period ended February 28, 2007 and the year ended March 31, 2006, which had an impact of 0.07% and 0.08%, respectively.
(l) Annualized.
See Accompanying Notes to Financial Statements.
16
Financial Highlights – Columbia Marsico 21st Century Fund
Selected data for a share outstanding throughout each period is as follows:
| | | Year Ended February 28, | | Year Ended
February 29, | | Period Ended
February 28, | | Year Ended
March 31, | |
| Class B Shares | | 2011 | | 2010 | | 2009 | | 2008 | | 2007 (a) | | 2006 (b) | |
| Net Asset Value, Beginning of Period | | $ | 10.91 | | | $ | 6.92 | | | $ | 13.86 | | | $ | 13.73 | | | $ | 12.99 | | | $ | 10.22 | | |
| Income from Investment Operations: | |
| Net investment loss (c) | | | (0.14 | ) | | | (0.10 | ) | | | (0.07 | ) | | | (0.08 | ) | | | — | (d)(e) | | | (0.11 | ) | |
Net realized and unrealized gain (loss)
on investments and foreign currency | | | 2.48 | | | | 4.09 | | | | (6.87 | ) | | | 0.73 | (f) | | | 0.88 | | | | 2.88 | | |
| Total from investment operations | | | 2.34 | | | | 3.99 | | | | (6.94 | ) | | | 0.65 | | | | 0.88 | | | | 2.77 | | |
| Less Distributions to Shareholders: | |
| From net investment income | | | — | | | | — | | | | — | | | | — | | | | (0.02 | ) | | | — | | |
| From net realized gains | | | — | | | | — | | | | — | | | | (0.49 | ) | | | (0.12 | ) | | | — | | |
| From return of capital | | | — | | | | — | | | | — | | | | (0.03 | ) | | | — | | | | — | | |
| Total distributions to shareholders | | | — | | | | — | | | | — | | | | (0.52 | ) | | | (0.14 | ) | | | — | | |
| Redemption Fees: | |
| Redemption fees added to paid-in-capital | | | — | | | | — | | | | — | (c)(e) | | | — | | | | — | | | | — | | |
| Net Asset Value, End of Period | | $ | 13.25 | | | $ | 10.91 | | | $ | 6.92 | | | $ | 13.86 | | | $ | 13.73 | | | $ | 12.99 | | |
| Total return (g) | | | 21.45 | %(h) | | | 57.66 | %(i) | | | (50.07 | )%(i) | | | 4.34 | %(i) | | | 6.88 | %(i)(j) | | | 27.10 | %(i) | |
Ratios to Average Net Assets/
Supplemental Data: | |
| Net expenses (k) | | | 2.06 | % | | | 2.05 | % | | | 2.00 | % | | | 1.95 | % | | | 2.01 | %(l) | | | 2.06 | % | |
| Waiver/Reimbursement | | | — | | | | 0.01 | % | | | 0.04 | % | | | 0.02 | % | | | 0.02 | %(l) | | | 0.01 | % | |
| Net investment loss (k) | | | (1.21 | )% | | | (1.10 | )% | | | (0.63 | )% | | | (0.56 | )% | | | (0.02 | )%(l) | | | (0.96 | )% | |
| Portfolio turnover rate | | | 87 | % | | | 119 | % | | | 152 | % | | | 113 | % | | | 86 | %(j) | | | 141 | % | |
| Net assets, end of period (000s) | | $ | 110,427 | | | $ | 117,307 | | | $ | 95,889 | | | $ | 230,505 | | | $ | 167,144 | | | $ | 97,006 | | |
(a) The Fund changed its fiscal year end from March 31 to February 28. Per share data and total return reflect activity from April 1, 2006 through February 28, 2007.
(b) On August 22, 2005, the Fund's Investor B shares were renamed Class B shares.
(c) Per share data was calculated using the average shares outstanding during the period.
(d) Net investment income per share reflects special dividends. The effect of these dividends amounted to $0.08 per share.
(e) Rounds to less than $0.01 per share.
(f) The amount shown for a share outstanding does not correspond with the aggregate net loss on investments for the period due to timing of repurchases of Fund shares in relation to fluctuating market values of the investments of the Fund.
(g) Total return at net asset value assuming all distributions reinvested and no contingent deferred sales charge.
(h) Total return includes a reimbursement of a loss experienced by the Fund due to a compliance violation. This reimbursement increased total return and net asset value per share by less than 0.01% and less than $0.01, respectively.
(i) Had the Investment Manager and/or any of its affiliates not waived fees or reimbursed a portion of expenses, total return would have been reduced.
(j) Not annualized.
(k) The benefits derived from expense reductions had an impact of less than 0.01%, except for the period ended February 28, 2007 and the year ended March 31, 2006, which had an impact of 0.07% and 0.08%, respectively.
(l) Annualized.
See Accompanying Notes to Financial Statements.
17
Financial Highlights – Columbia Marsico 21st Century Fund
Selected data for a share outstanding throughout each period is as follows:
| | | Year Ended February 28, | | Year Ended
February 29, | | Period Ended
February 28, | | Year Ended
March 31, | |
| Class C Shares | | 2011 | | 2010 | | 2009 | | 2008 | | 2007 (a) | | 2006 (b) | |
| Net Asset Value, Beginning of Period | | $ | 10.91 | | | $ | 6.91 | | | $ | 13.86 | | | $ | 13.73 | | | $ | 12.99 | | | $ | 10.22 | | |
| Income from Investment Operations: | |
| Net investment income (loss) (c) | | | (0.14 | ) | | | (0.10 | ) | | | (0.07 | ) | | | (0.09 | ) | | | 0.01 | (d) | | | (0.11 | ) | |
Net realized and unrealized gain (loss)
on investments and foreign currency | | | 2.48 | | | | 4.10 | | | | (6.88 | ) | | | 0.74 | (e) | | | 0.87 | | | | 2.88 | | |
| Total from investment operations | | | 2.34 | | | | 4.00 | | | | (6.95 | ) | | | 0.65 | | | | 0.88 | | | | 2.77 | | |
| Less Distributions to Shareholders: | |
| From net investment income | | | — | | | | — | | | | — | | | | — | | | | (0.02 | ) | | | — | | |
| From net realized gains | | | — | | | | — | | | | — | | | | (0.49 | ) | | | (0.12 | ) | | | — | | |
| From return of capital | | | — | | | | — | | | | — | | | | (0.03 | ) | | | — | | | | — | | |
| Total distributions to shareholders | | | — | | | | — | | | | — | | | | (0.52 | ) | | | (0.14 | ) | | | — | | |
| Redemption Fees: | |
| Redemption fees added to paid-in-capital | | | — | | | | — | | | | — | (c)(f) | | | — | | | | — | | | | — | | |
| Net Asset Value, End of Period | | $ | 13.25 | | | $ | 10.91 | | | $ | 6.91 | | | $ | 13.86 | | | $ | 13.73 | | | $ | 12.99 | | |
| Total return (g) | | | 21.45 | %(h) | | | 57.89 | %(i) | | | (50.14 | )%(i) | | | 4.34 | %(i) | | | 6.88 | %(i)(j) | | | 27.10 | %(i) | |
Ratios to Average Net Assets/
Supplemental Data: | |
| Net expenses (k) | | | 2.06 | % | | | 2.05 | % | | | 2.00 | % | | | 1.95 | % | | | 2.01 | %(l) | | | 2.06 | % | |
| Waiver/Reimbursement | | | — | | | | 0.01 | % | | | 0.04 | % | | | 0.02 | % | | | 0.02 | %(l) | | | 0.01 | % | |
| Net investment income (loss) (k) | | | (1.22 | )% | | | (1.10 | )% | | | (0.63 | )% | | | (0.60 | )% | | | 0.11 | %(l) | | | (0.96 | )% | |
| Portfolio turnover rate | | | 87 | % | | | 119 | % | | | 152 | % | | | 113 | % | | | 86 | %(j) | | | 141 | % | |
| Net assets, end of period (000s) | | $ | 586,725 | | | $ | 660,457 | | | $ | 622,098 | | | $ | 1,418,014 | | | $ | 651,596 | | | $ | 157,286 | | |
(a) The Fund changed its fiscal year end from March 31 to February 28. Per share data and total return reflect activity from April 1, 2006 through February 28, 2007.
(b) On August 22, 2005, the Fund's Investor C shares were renamed Class C shares.
(c) Per share data was calculated using the average shares outstanding during the period.
(d) Net investment income per share reflects special dividends. The effect of these dividends amounted to $0.08 per share.
(e) The amount shown for a share outstanding does not correspond with the aggregate net loss on investments for the period due to timing of repurchases of Fund shares in relation to fluctuating market values of the investments of the Fund.
(f) Rounds to less than $0.01 per share.
(g) Total return at net asset value assuming all distributions reinvested and no contingent deferred sales charge.
(h) Total return includes a reimbursement of a loss experienced by the Fund due to a compliance violation. This reimbursement increased total return and net asset value per share by less than 0.01% and less than $0.01, respectively.
(i) Had the Investment Manager and/or any of its affiliates not waived fees or reimbursed a portion of expenses, total return would have been reduced.
(j) Not annualized.
(k) The benefits derived from expense reductions had an impact of less than 0.01%, except for the period ended February 28, 2007 and the year ended March 31, 2006, which had an impact of 0.07% and 0.08%, respectively.
(l) Annualized.
See Accompanying Notes to Financial Statements.
18
Financial Highlights – Columbia Marsico 21st Century Fund
Selected data for a share outstanding throughout each period is as follows:
| | | Year Ended February 28, | | Year Ended
February 29, | | Period Ended
February 28, | | Period Ended
March 31, | |
| Class R Shares | | 2011 | | 2010 | | 2009 | | 2008 | | 2007 (a) | | 2006 (b) | |
| Net Asset Value, Beginning of Period | | $ | 11.57 | | | $ | 7.29 | | | $ | 14.55 | | | $ | 14.32 | | | $ | 13.58 | | | $ | 12.53 | | |
| Income from Investment Operations: | |
| Net investment income (loss) (c) | | | (0.09 | ) | | | (0.06 | ) | | | (0.02 | ) | | | (0.02 | ) | | | 0.16 | (d) | | | (0.02 | ) | |
Net realized and unrealized gain (loss)
on investments and foreign currency | | | 2.63 | | | | 4.34 | | | | (7.24 | ) | | | 0.77 | (e) | | | 0.81 | | | | 1.07 | | |
| Total from investment operations | | | 2.54 | | | | 4.28 | | | | (7.26 | ) | | | 0.75 | | | | 0.97 | | | | 1.05 | | |
| Less Distributions to Shareholders: | |
| From net investment income | | | — | | | | — | | | | — | | | | — | | | | (0.06 | ) | | | — | | |
| From net realized gains | | | — | | | | — | | | | — | | | | (0.49 | ) | | | — | | | | — | (f) | |
| From return of capital | | | — | | | | — | | | | — | | | | (0.03 | ) | | | (0.17 | ) | | | — | | |
| Total distributions to shareholders | | | — | | | | — | | | | — | | | | (0.52 | ) | | | (0.23 | ) | | | — | (f) | |
| Redemption Fees: | |
| Redemption fees added to paid-in-capital | | | — | | | | — | | | | — | (c)(f) | | | — | | | | — | | | | — | | |
| Net Asset Value, End of Period | | $ | 14.11 | | | $ | 11.57 | | | $ | 7.29 | | | $ | 14.55 | | | $ | 14.32 | | | $ | 13.58 | | |
| Total return (g) | | | 21.95 | %(h) | | | 58.71 | %(i) | | | (49.90 | )%(i) | | | 4.87 | %(i) | | | 7.38 | %(i)(j) | | | 8.38 | %(i)(j) | |
Ratios to Average Net Assets/
Supplemental Data: | |
| Net expenses (k) | | | 1.56 | % | | | 1.55 | % | | | 1.50 | % | | | 1.45 | % | | | 1.51 | %(l) | | | 1.63 | %(l) | |
| Waiver/Reimbursement | | | — | | | | 0.01 | % | | | 0.04 | % | | | 0.02 | % | | | 0.02 | %(l) | | | 0.03 | %(l) | |
| Net investment income (loss) (k) | | | (0.71 | )% | | | (0.59 | )% | | | (0.13 | )% | | | (0.15 | )% | | | 1.25 | %(l) | | | (0.91 | )%(l) | |
| Portfolio turnover rate | | | 87 | % | | | 119 | % | | | 152 | % | | | 113 | % | | | 86 | %(j) | | | 141 | %(j) | |
| Net assets, end of period (000s) | | $ | 40,468 | | | $ | 41,627 | | | $ | 42,429 | | | $ | 47,777 | | | $ | 4,394 | | | $ | 11 | | |
(a) The Fund changed its fiscal year end from March 31 to February 28. Per share data and total return reflect activity from April 1, 2006 through February 28, 2007.
(b) Class R shares commenced operations on January 23, 2006.
(c) Per share data was calculated using the average shares outstanding during the period.
(d) Net investment income per share reflects special dividends. The effect of these dividends amounted to $0.08 per share.
(e) The amount shown for a share outstanding does not correspond with the aggregate net loss on investments for the period due to timing of repurchases of Fund shares in relation to fluctuating market values of the investments of the Fund.
(f) Rounds to less than $0.01 per share.
(g) Total return at net asset value assuming all distributions reinvested.
(h) Total return includes a reimbursement of a loss experienced by the Fund due to a compliance violation. This reimbursement increased total return and net asset value per share by less than 0.01% and less than $0.01, respectively.
(i) Had the Investment Manager and/or any of its affiliates not waived fees or reimbursed a portion of expenses, total return would have been reduced.
(j) Not annualized.
(k) The benefits derived from expense reductions had an impact of less than 0.01%, except for the period ended February 28, 2007 and the period ended March 31, 2006, which had an impact of 0.07% and 0.08%, respectively.
(l) Annualized.
See Accompanying Notes to Financial Statements.
19
Financial Highlights – Columbia Marsico 21st Century Fund
Selected data for a share outstanding throughout each period is as follows:
| | | Year Ended February 28, | | Year Ended
February 29, | | Period Ended
February 28, | | Year Ended
March 31, | |
| Class Z Shares | | 2011 | | 2010 | | 2009 | | 2008 | | 2007 (a) | | 2006 (b) | |
| Net Asset Value, Beginning of Period | | $ | 11.86 | | | $ | 7.44 | | | $ | 14.76 | | | $ | 14.45 | | | $ | 13.76 | | | $ | 10.75 | | |
| Income from Investment Operations: | |
| Net investment income (loss) (c) | | | (0.03 | ) | | | (0.01 | ) | | | 0.05 | | | | 0.07 | | | | 0.13 | (d) | | | — | (e) | |
Net realized and unrealized gain (loss)
on investments and foreign currency | | | 2.71 | | | | 4.43 | | | | (7.37 | ) | | | 0.76 | (f) | | | 0.91 | | | | 3.04 | | |
| Total from investment operations | | | 2.68 | | | | 4.42 | | | | (7.32 | ) | | | 0.83 | | | | 1.04 | | | | 3.04 | | |
| Less Distributions to Shareholders: | |
| From net investment income | | | — | | | | — | (e) | | | — | | | | — | | | | (0.12 | ) | | | (0.03 | ) | |
| From net realized gains | | | — | | | | — | | | | — | | | | (0.49 | ) | | | (0.23 | ) | | | — | | |
| From return of capital | | | — | | | | — | | | | — | | | | (0.03 | ) | | | — | | | | — | | |
| Total distributions to shareholders | | | — | | | | — | (e) | | | — | | | | (0.52 | ) | | | (0.35 | ) | | | (0.03 | ) | |
| Redemption Fees: | |
| Redemption fees added to paid-in-capital | | | — | | | | — | | | | — | (c)(e) | | | — | | | | — | | | | — | | |
| Net Asset Value, End of Period | | $ | 14.54 | | | $ | 11.86 | | | $ | 7.44 | | | $ | 14.76 | | | $ | 14.45 | | | $ | 13.76 | | |
| Total return (g) | | | 22.60 | %(h) | | | 59.42 | %(i) | | | (49.59 | )%(i) | | | 5.38 | %(i) | | | 7.84 | %(i)(j) | | | 28.33 | %(i) | |
Ratios to Average Net Assets/
Supplemental Data: | |
| Net expenses (k) | | | 1.06 | % | | | 1.05 | % | | | 1.00 | % | | | 0.95 | % | | | 1.01 | %(l) | | | 1.06 | % | |
| Waiver/Reimbursement | | | — | | | | 0.01 | % | | | 0.04 | % | | | 0.02 | % | | | 0.02 | %(l) | | | 0.01 | % | |
| Net investment income (loss) (k) | | | (0.20 | )% | | | (0.10 | )% | | | 0.37 | % | | | 0.41 | % | | | 1.03 | %(l) | | | 0.04 | % | |
| Portfolio turnover rate | | | 87 | % | | | 119 | % | | | 152 | % | | | 113 | % | | | 86 | %(j) | | | 141 | % | |
| Net assets, end of period (000s) | | $ | 1,245,671 | | | $ | 1,008,937 | | | $ | 870,875 | | | $ | 1,614,313 | | | $ | 732,508 | | | $ | 274,594 | | |
(a) The Fund changed its fiscal year end from March 31 to February 28. Per share data and total return reflect activity from April 1, 2006 through February 28, 2007.
(b) On August 22, 2005, the Fund's Primary A shares were renamed Class Z shares.
(c) Per share data was calculated using the average shares outstanding during the period.
(d) Net investment income per share reflects special dividends. The effect of these dividends amounted to $0.08 per share.
(e) Rounds to less than $0.01 per share.
(f) The amount shown for a share outstanding does not correspond with the aggregate net loss on investments for the period due to timing of repurchases of Fund shares in relation to fluctuating market values of the investments of the Fund.
(g) Total return at net asset value assuming all distributions reinvested.
(h) Total return includes a reimbursement of a loss experienced by the Fund due to a compliance violation. This reimbursement increased total return and net asset value per share by less than 0.01% and less than $0.01, respectively.
(i) Had the Investment Manager and/or any of its affiliates not waived fees or reimbursed a portion of expenses, total return would have been reduced.
(j) Not annualized.
(k) The benefits derived from expense reductions had an impact of less than 0.01%, except for the period ended February 28, 2007 and the year ended March 31, 2006, which had an impact of 0.07% and 0.08%, respectively.
(l) Annualized.
See Accompanying Notes to Financial Statements.
20
Notes to Financial Statements – Columbia Marsico 21st Century Fund
February 28, 2011
Note 1. Organization
Columbia Marsico 21st Century Fund (the Fund), a series of Columbia Funds Series Trust (the Trust), is a diversified fund. The Trust is registered under the Investment Company Act of 1940, as amended (the 1940 Act), as an open-end management investment company organized as a Delaware statutory trust.
After the close of business on April 30, 2010, Ameriprise Financial, Inc. (Ameriprise Financial) acquired a portion of the asset management business of Columbia Management Group, LLC (the Transaction), including the business of managing the Fund. In connection with the closing of the Transaction (the Closing), RiverSource Investments, LLC, a wholly owned subsidiary of Ameriprise Financial, became the investment manager of the Fund and changed its name to Columbia Management Investment Advisers, LLC (the Investment Manager).
Investment Objective
The Fund seeks long-term growth of capital.
Fund Shares
The Trust has unlimited authorized shares of beneficial interest. The Fund offers Class A, Class B, Class C, Class R and Class Z shares. All share classes have identical voting, dividend and liquidation rights. Each share class has its own expense structure and sales charges, as applicable.
Class A shares are subject to a maximum front-end sales charge of 5.75% based on the investment amount. Class A shares purchased without an initial sales charge in accounts aggregating $1 million to $50 million at the time of purchase are subject to a 1.00% contingent deferred sales charge (CDSC) if the shares are sold within 18 months of purchase, charged as follows: 1.00% CDSC if redeemed within 12 months of purchase, and 0.50% CDSC if redeemed more than 12, but less than 18 months after purchase.
The Fund no longer accepts investments by new or existing investors in the Fund's Class B shares, except in connection with the reinvestment of any dividend and/or capital gain distributions in Class B shares of the Fund and exchanges by existing Class B shareholders of certain other funds within the Columbia Family of Funds. Class B shares may be subject to a maximum CDSC of 5.00% based upon the holding period after purchase. Class B shares will generally convert to Class A shares eight years after purchase.
Class C shares are subject to a 1.00% CDSC on shares redeemed within one year of purchase.
Class R shares are not subject to sales charges and are available only to qualifying institutional investors.
Class Z shares are not subject to sales charges and are available only to certain investors, as described in the Fund's prospectus.
Note 2. Summary of Significant Accounting Policies
The preparation of financial statements in accordance with U.S. generally accepted accounting principles (GAAP) requires the Investment Manager to make certain estimates and assumptions that affect the reported amounts of assets and liabilities, the disclosure of contingent assets and liabilities at the date of the financial statements and the reported amounts of revenue and expenses during the reporting period. Actual results could differ from those estimates.
The following is a summary of significant accounting policies consistently followed by the Fund in the preparation of its financial statements.
Security Valuation
Equity securities are valued at the last sale price on the principal exchange on which they trade, except for securities traded on the NASDAQ, which are valued at the NASDAQ official close price. Unlisted securities or listed securities for which there were no sales during the day are valued at the closing bid price on such exchanges or over-the-counter markets.
Short-term investments maturing in 60 days or less are valued at amortized cost, which approximates market value.
Foreign securities are generally valued at the last sale price on the foreign exchange or market on which they trade. If any foreign share prices are not readily available as a result of limited share activity, the securities are valued at the last sale price of the local shares in the principal market in which such securities are normally traded.
Generally, trading in foreign securities is substantially completed each day at various times prior to the close of the New York Stock Exchange (NYSE). The values of such securities used in computing the net asset value of the Fund's shares are determined as of such times. Foreign currency exchange rates are generally determined at 4:00 p.m. Eastern (U.S.) time. Occasionally, events affecting the values of such foreign securities may occur between the times at which they are determined and the close of the customary trading session of the NYSE, which would not be reflected in the computation of the Fund's net asset value. If events materially affecting the values of such foreign securities occur and it is determined that market quotations are not
21
Columbia Marsico 21st Century Fund, February 28, 2011
reliable, then these foreign securities will be valued at their fair value using procedures approved by the Board of Trustees.
Investments for which market quotations are not readily available, or that have quotations which the Investment Manager believes are not reliable, are valued at fair value as determined in good faith under consistently applied procedures established by and under the general supervision of the Board of Trustees. If a security is valued at fair value, such value is likely to be different from the last quoted market price for the security. The determination of fair value often requires significant judgment. To determine fair value, the Investment Manager may use assumptions including but not limited to future cash flows and estimated risk premiums. Multiple inputs from various sources may be used to determine value.
Foreign Currency Transactions and Translations
The values of all assets and liabilities quoted in foreign currencies are translated into U.S. dollars at that day's exchange rates. Net realized and unrealized gains (losses) on foreign currency transactions and translations include gains (losses) arising from the fluctuation in exchange rates between trade and settlement dates on securities transactions, gains (losses) arising from the disposition of foreign currency and currency gains (losses) between the accrual and payment dates on dividends, interest income and foreign withholding taxes.
For financial statement purposes, the Fund does not distinguish that portion of gains (losses) on investments which is due to changes in foreign exchange rates from that which is due to changes in market prices of the investments. Such fluctuations are included with the net realized and unrealized gains (losses) on investments on the Statement of Operations.
Repurchase Agreements
The Fund may engage in repurchase agreement transactions with institutions that the Investment Manager has determined are creditworthy. The Fund, through the custodian, receives delivery of the underlying securities collateralizing a repurchase agreement. The Investment Manager is responsible for determining that the collateral is at least equal, at all times, to the value of the repurchase obligation including interest. A repurchase agreement transaction involves certain risks in the event of default or insolvency of the counterparty. These risks include possible delays in or restrictions on the Fund's ability to dispose of the underlying securities and a possible decline in the value of the underlying securities during the period while the Fund seeks to assert its rights.
Security Transactions
Security transactions are accounted for on the trade date. Cost is determined and gains (losses) are based upon the specific identification method for both financial statement and federal income tax purposes.
Income Recognition
Corporate actions and dividend income are recorded net of any non-reclaimable tax withholdings, on the ex-dividend date or upon receipt of ex-dividend notification in the case of certain foreign securities.
Awards from class action litigation are recorded as a reduction of cost if the Fund still owns the applicable securities on the payment date. If the Fund no longer owns the applicable securities, the proceeds are recorded as realized gains.
The Fund receives information regarding the character of distributions received from real estate investment trusts (REITs) on an annual basis. Distributions received from REITs are allocated among dividend income, capital gain and return of capital based upon such information or based on management's estimates if actual information has not yet been reported. Management's estimates are subsequently adjusted when the actual character of the distributions are disclosed by the REITs which could result in a proportionate increase in returns of capital to shareholders.
Distributions received from real estate investment trusts (REITs) in excess of their income are recorded as a reduction of the cost of the related investments. If the Fund no longer owns the applicable securities, any distributions received in excess of income are recorded as realized gains.
Interest income is recorded on the accrual basis. Market premium and discount are amortized and accreted, respectively, on all debt securities, unless otherwise noted. Original issue discount is accreted to interest income over the life of the security with a corresponding increase in the cost basis, if any. For convertible securities, premiums attributable to the conversion feature are not amortized.
Expenses
General expenses of the Trust are allocated to the Fund and other series of the Trust based upon relative net assets or other expense allocation methodologies determined by the nature of the expense. Expenses directly attributable to a specific class of shares are charged to that share class. Expenses directly attributable to the Fund are charged to the Fund.
22
Columbia Marsico 21st Century Fund, February 28, 2011
Determination of Class Net Asset Value
All income, expenses (other than class-specific expenses which are charged directly to a share class, as shown in the Statement of Operations) and realized and unrealized gains (losses) are allocated to each class of the Fund on a daily basis for purposes of determining the net asset value of each class. Income and expenses are allocated to each class based on the settled shares method, while realized and unrealized gains (losses) are allocated based on the relative net assets of each class.
Federal Income Tax Status
The Fund intends to qualify each year as a regulated investment company under Subchapter M of the Internal Revenue Code, as amended, and will distribute substantially all of its taxable income, if any, for its tax year, and as such will not be subject to federal income taxes. In addition, the Fund intends to distribute in each calendar year substantially all of its net investment income, capital gains and certain other amounts, if any, such that the Fund should not be subject to federal excise tax. Therefore, no federal income or excise tax provision is recorded.
Distributions to Shareholders
Distributions from net investment income, if any, are declared and paid semi-annually. The Fund may, however, declare and pay distributions from net investment income more frequently. The Fund will distribute net realized capital gains (including net short-term capital gains) at least annually after the fiscal year in which the capital gains were earned, unless offset by any available capital loss carryforward. Income distributions and capital gain distributions are determined in accordance with federal income tax regulations which may differ from GAAP.
Indemnification
In the normal course of business, the Fund enters into contracts that contain a variety of representations and warranties and which provide general indemnities. The Fund's maximum exposure under these arrangements is unknown because this would involve future claims against the Fund. Also, under the Trust's organizational documents and by contract, the Trustees and officers of the Trust are indemnified against certain liabilities that may arise out of actions relating to their duties to the Trust. However, based on experience, the Fund expects the risk of loss due to these representations, warranties and indemnities to be minimal.
Note 3. Fees and Compensation Paid to Affiliates
Investment Management Services Fee
The Investment Manager is responsible for the management of the Fund. Day-to-day portfolio management of the Fund is provided by the Fund's subadviser (see Subadvisory Fee note below). The management fee is based on the Fund's average daily net assets at the following annual rates:
| Average Daily Net Assets | | Annual Fee Rate | |
| First $500 million | | | 0.75 | % | |
| $500 million to $1 billion | | | 0.70 | % | |
| $1 billion to $1.5 billion | | | 0.65 | % | |
| $1.5 billion to $3 billion | | | 0.60 | % | |
| $3 billion to $6 billion | | | 0.58 | % | |
| Over $6 billion | | | 0.56 | % | |
Prior to the Closing, Columbia Management Advisors, LLC (Columbia), an indirect, wholly owned subsidiary of Bank of America Corporation (BOA), provided investment management services to the Fund under the same fee structure.
The effective management fee rate for the year ended February 28, 2011, was 0.64% of the Fund's average daily net assets.
To the extent that the Fund is not benefitting from a separate contractual expense limitation arrangement, the Investment Manager has contractually agreed to waive a portion of its management fees through June 30, 2011.
The waiver amount is calculated based on the difference between the dollar amount of sub-advisory fees that would have been payable to Marsico Capital Management, LLC (Marsico) based on the annualized rate of 0.45% of the Fund's average daily net assets, and the dollar amount of sub-advisory fees calculated on a monthly basis based on the annualized sub-advisory fee rate effective January 1, 2008 in which Marsico is entitled from the Fund which is described under the Sub-Advisory Fee note below. The annualized fee rate of 0.45% represents the sub-advisory fee rate which Marsico was entitled to receive prior to January 1, 2008.
23
Columbia Marsico 21st Century Fund, February 28, 2011
In the absence of a separate contractual expense limitation arrangement, the management fee waiver for the Fund would be calculated as follows:
| Average Daily Net Assets* | | Management
Fee Waiver | |
| Assets up to $18 billion | | | 0.00 | % | |
Assets in excess of $18 billion and
up to $21 billion | | | 0.05 | % | |
| Assets in excess of $21 billion | | | 0.10 | % | |
* For purposes of the calculation, "Assets" are aggregate assets sub-advised by Marsico in the following Columbia Funds: (i) Columbia Marsico Growth Fund; (ii) Columbia Marsico Focused Equities Fund; (iii) Columbia Marsico 21st Century Fund; (iv) Columbia Marsico Growth Fund, Variable Series; (v) Columbia Marsico Focused Equities Fund, Variable Series; (vi) Columbia Marsico 21st Century Fund, Variable Series; and (vii) any future Columbia U.S. equity fund sub-advised by Marsico which the Investment Manager and Marsico mutually agree in writing.
Prior to the Closing, Columbia waived a portion of the Fund's management fees at the same rates.
For the year ended February 28, 2011, no management fees were waived for the Fund.
Subadvisory Fee
Marsico has been retained by the Investment Manager to serve as the investment subadviser to the Fund. As the subadviser, and subject to the oversight of the Investment Manager and the Fund's Board of Trustees, Marsico is responsible for the daily investment operations, including placing all orders for the purchase and sale of the portfolio securities for the Fund. The Investment Manager, from the management fee it receives, pays Marsico a monthly subadvisory fee based on the Fund's average daily net assets at the following annual rates:
| Average Daily Net Assets* | | Fee Rate | |
| Assets up to $18 billion | | | 0.45 | % | |
Assets in excess of $18 billion and
up to $21 billion | | | 0.40 | % | |
| Assets in excess of $21 billion | | | 0.35 | % | |
* For purposes of the calculation, assets are aggregate assets sub-advised by Marsico in the following Columbia Funds: (i) Columbia Marsico Growth Fund; (ii) Columbia Marsico Focused Equities Fund; (iii) Columbia Marsico 21st Century Fund; (iv) Columbia Marsico Growth Fund, Variable Series; (v) Columbia Marsico Focused Equities, Variable Series; (vi) Columbia Marsico 21st Century Fund, Variable Series; and (vii) any future Columbia U.S. equity fund sub-advised by Marsico which the Investment Manager and Marsico mutually agree in writing.
Prior to the Closing, Marsico provided subadvisory services to the Fund under the same fee structure in accordance with an agreement with Columbia.
Administration Fee
Effective upon the Closing, the Investment Manager became the administrator of the Fund and provides administrative and other services to the Fund, including services previously performed under the Pricing and Bookkeeping Oversight and Services Agreement discussed below. The administration fee is based on the annual rate of 0.22% of the Fund's average daily net assets, less the fees payable by the Fund as described under the Pricing and Bookkeeping Fees note below. Prior to the Closing, Columbia provided administrative services to the Fund at the same fee rate.
Pricing and Bookkeeping Fees
Prior to the Closing, the Fund entered into a Financial Reporting Services Agreement (the Financial Reporting Services Agreement) with State Street Bank and Trust Company (State Street) and Columbia pursuant to which State Street provides financial reporting services to the Fund. The Fund also entered into an Accounting Services Agreement (collectively with the Financial Reporting Services Agreement, the State Street Agreements) with State Street and Columbia pursuant to which State Street provides accounting services to the Fund. Upon the Closing, Columbia assigned and delegated its rights and obligations under the State Street Agreements to the Investment Manager. Under the State Street Agreements, the Fund pays State Street an annual fee of $38,000 paid monthly plus an additional monthly fee based on an annualized percentage rate of average daily net assets of the Fund for the month. The aggregate fee will not exceed $140,000 per year (exclusive of out-of-pocket expenses and charges). The Fund also reimburses State Street for certain out-of-pocket expenses and charges.
Also prior to the Closing, the Fund entered into a Pricing and Bookkeeping Oversight and Services Agreement (the Services Agreement) with Columbia. Under the Services Agreement, Columbia provided services related to Fund expenses and the requirements of the Sarbanes-Oxley Act of 2002, and provided oversight of the accounting and financial reporting services provided by State Street. Under the Services Agreement, the Fund reimbursed Columbia for out-of-pocket expenses and charges, including fees payable to third parties, such as for pricing the Fund's portfolio securities, incurred by Columbia in the performance of services
24
Columbia Marsico 21st Century Fund, February 28, 2011
under the Services Agreement. The Services Agreement was terminated upon the Closing. These services are now provided under the Administration Fee note discussed above.
Transfer Agent Fee
In connection with the Closing, RiverSource Service Corporation, a wholly owned subsidiary of Ameriprise Financial, became the transfer agent of the Fund and changed its name to Columbia Management Investment Services Corp. (the New Transfer Agent). The New Transfer Agent has contracted with Boston Financial Data Services (BFDS) to serve as sub-transfer agent. The New Transfer Agent receives monthly account-based service fees based on the number of open accounts and asset-based fees, calculated based on assets held in omnibus accounts, which are intended to reimburse the New Transfer Agent for certain sub-transfer agent fees (exclusive of BFDS fees). The New Transfer Agent pays the fees of BFDS for services as sub-transfer agent and is not entitled to reimbursement for such fees from the Fund.
The New Transfer Agent receives reimbursement for certain out-of-pocket expenses and may also receive compensation for various shareholder services.
Prior to the Closing, Columbia Management Services, Inc., an affiliate of Columbia and an indirect, wholly owned subsidiary of BOA, provided shareholder services to the Fund and contracted with BFDS to serve as sub-transfer agent, under the same fee structure.
For the year ended February 28, 2011, the Fund's effective transfer agent fee rate for each class was 0.18% of the Fund's average daily net assets.
An annual minimum account balance fee of $20 may apply to certain accounts with a value below the Fund's initial minimum investment requirements to reduce the impact of small accounts on transfer agent fees. These minimum account balance fees are recorded as part of expense reductions on the Statement of Operations. For the year ended February 28, 2011, no minimum account balance fees were charged by the Fund.
Underwriting Discounts, Service and Distribution Fees
In connection with the Closing, RiverSource Fund Distributors, Inc., an indirect wholly owned subsidiary of Ameriprise Financial, became the distributor of the Fund and changed its name to Columbia Management Investment Distributors, Inc. (the New Distributor).
For the year ended February 28, 2011, initial sales charges paid by shareholders on the purchase of Class A shares amounted to $71,904 and net CDSC fees paid by shareholders on certain redemptions of Class A, Class B and Class C shares amounted to $61, $316,760 and $20,971, respectively.
The Trust has adopted shareholder servicing plans and distribution plans for the Class B and Class C shares of the Fund and a combined distribution and shareholder servicing plan for the Class A shares of the Fund. The Trust has also adopted a distribution plan for the Class R shares of the Fund. The shareholder servicing plans permit the Fund to compensate or reimburse servicing agents for the shareholder services they have provided. The distribution plans, adopted pursuant to Rule 12b-1 under the 1940 Act, permit the Fund to compensate or reimburse the New Distributor and/or selling agents for activities or expenses primarily intended to result in the sale of the classes' shares. Payments are made at an annual rate and paid monthly, as a percentage of average daily net assets, set from time to time by the Board of Trustees, and are charged as expenses of the Fund directly to the applicable share class. A substantial portion of the expenses incurred pursuant to these plans is paid to affiliates of the New Distributor.
The annual rates in effect and plan limits, as a percentage of average daily net assets are as follows:
| | | Current
Rate | | Plan
Limit | |
Class A Combined Distribution
and Shareholder Servicing Plan | | | 0.25 | % | | | 0.25 | % | |
Class B and Class C Shareholder
Servicing Plans | | | 0.25 | % | | | 0.25 | % | |
Class B and Class C
Distribution Plans | | | 0.75 | % | | | 0.75 | % | |
| Class R Distribution Plan | | | 0.50 | % | | | 0.50 | % | |
Prior to the Closing, Columbia Management Distributors, Inc, an affiliate of Columbia and an indirect, wholly owned subsidiary of BOA, was the principal underwriter of the Fund's shares. There were no changes to the underwriting discount structure of the Fund or the service or distribution fee rates paid by the Fund as a result of the Transaction.
Expense Limits and Fee Waivers
Effective May 1, 2010, the Investment Manager has voluntarily agreed to reimburse a portion of the Fund's expenses so that the
25
Columbia Marsico 21st Century Fund, February 28, 2011
Fund's ordinary operating expenses (excluding any distribution and service fees, brokerage commissions, interest, taxes and extraordinary expenses, but including custodian charges relating to overdrafts, if any), after giving effect to any balance credits from the Fund's custodian, do not exceed 1.20% annually of the Fund's average daily net assets. Prior to May 1, 2010, Columbia voluntarily reimbursed a portion of the Fund's expenses in the same manner.
Fees Paid to Officers and Trustees
Upon the Closing, all officers of the Fund are employees of the Investment Manager or its affiliates and, with the exception of the Fund's Chief Compliance Officer, receive no compensation from the Fund. The Board of Trustees has appointed a Chief Compliance Officer to the Fund in accordance with federal securities regulations. The Fund, along with other affiliated funds, pays its pro-rata share of the expenses associated with the Chief Compliance Officer. The Fund's expenses for the Chief Compliance Officer will not exceed $15,000 per year. Prior to the Closing, all officers of the Fund were employees of Columbia or its affiliates and the Fund paid its pro-rata share of the expenses for the Chief Compliance Officer under the same fee structure.
Trustees are compensated for their services to the Fund, as set forth on the Statement of Operations. The Trust's eligible Trustees may participate in a non-qualified deferred compensation plan which may be terminated at any time. Any payments to plan participants are paid solely out of the Fund's assets. Income earned on the plan participant's deferral account is based on the rate of return of the eligible mutual funds selected by the participant or, if no funds are selected, on the rate of return of Columbia Money Market Fund (formerly known as RiverSource Cash Management Fund). Prior to the Closing, if no funds were selected, income earned on the plan participant's deferral account was based on the rate of return of BofA Treasury Reserves. Trustees' fees deferred during the current period as well as any gains or losses on the trustees' deferred compensation balances as a result of market fluctuations are included in "Trustees' fees" on the Statement of Operations. Liabilities under the deferred compensation plan are included in "Trustees' fees" on the Statement of Assets and Liabilities.
Other Related Party Transactions
Prior to the Closing, the Fund used one or more brokers that were affiliates of BOA in connection with the purchase and sale of its securities. Total brokerage commissions paid to affiliated brokers for the period prior to the Closing were $19,518.
Note 4. Custody Credits
The Fund has an agreement with its custodian bank under which custody fees may be reduced by balance credits. These credits are recorded as part of expense reductions on the Statement of Operations. The Fund could have invested a portion of the assets utilized in connection with the expense offset arrangement in an income-producing asset if it had not entered into such an agreement. For the year ended February 28, 2011, these custody credits reduced total expenses by $173 for the Fund.
Note 5. Portfolio Information
The cost of purchases and proceeds from sales of securities, excluding short-term obligations, aggregated $3,008,153,178 and $3,928,643,050, respectively, for the year ended February 28, 2011.
Note 6. Shareholder Concentration
As of February 28, 2011, one shareholder account owned 12.8% of the outstanding shares of the Fund. Purchase and redemption activity of this account may have a significant effect on the operations of the Fund.
Note 7. Line of Credit
The Fund and other affiliated funds participate in a $280,000,000 committed, unsecured revolving line of credit provided by State Street. The maximum amount that may be borrowed by any fund is limited to the lesser of $200,000,000 and the Fund's borrowing limit set forth in the Fund's registration statement. Borrowings are available for short-term liquidity or temporary or emergency purposes.
Effective October 14, 2010, interest is charged to each participating fund based on the fund's borrowings at a rate per annum equal to the greater of the Federal Funds Rate plus 1.25% or the overnight LIBOR Rate plus 1.25%. In addition, a commitment fee of 0.125% per annum is accrued and apportioned among the participating funds pro rata based on their relative net assets.
Prior to October 14, 2010, interest was charged to each participating fund at the same rates. In addition, a commitment fee of 0.15% per annum was accrued and apportioned among the participating funds pro rata based on their relative net assets.
For the year ended February 28, 2011, the Fund did not borrow under these arrangements.
26
Columbia Marsico 21st Century Fund, February 28, 2011
Note 8. Federal Tax Information
The timing and character of income and capital gain distributions are determined in accordance with income tax regulations, which may differ from GAAP. Reclassifications are made to the Fund's capital accounts for permanent tax differences to reflect income and gains available for distribution (or available capital loss carryforwards) under income tax regulations.
For the year ended February 28, 2011, permanent book and tax basis differences resulting primarily from differing treatments for net operating losses, passive foreign investment company (PFIC) adjustments and foreign currency transactions were identified and reclassified among the components of the Fund's net assets as follows:
Accumulated
Net Investment
Loss | | Accumulated
Net Realized
Loss | | Paid-In Capital | |
| $ | 17,713,313 | | | $ | 2,142,499 | | | $ | (19,855,812 | ) | |
Net investment income and net realized gains (losses), as disclosed on the Statement of Operations, and net assets were not affected by this reclassification.
The tax character of distributions paid during the years ended February 28, 2011 and February 28, 2010 was as follows:
| | | February 28, | |
| Distributions paid from: | | 2011 | | 2010 | |
| Ordinary Income* | | $ | — | | | $ | 51,807 | | |
* For tax purposes short-term capital gain distributions, if any, are considered ordinary income distributions.
As of February 28, 2011, the components of distributable earnings on a tax basis were as follows:
Undistributed
Ordinary
Income | | Undistributed
Long-Term
Capital Gains | | Net Unrealized
Appreciation* | |
| $ | — | | | $ | — | | | $ | 779,008,287 | | |
* The differences between book-basis and tax-basis net unrealized appreciation are primarily due to deferral of losses from wash sales.
Unrealized appreciation and depreciation at February 28, 2011, based on cost of investments for federal income tax purposes were:
| Unrealized appreciation | | $ | 809,969,067 | | |
| Unrealized depreciation | | | (30,960,780 | ) | |
| Net unrealized appreciation | | $ | 779,008,287 | | |
The following capital loss carryforwards may be available to reduce taxable income arising from future net realized gains on investments, if any, to the extent permitted by the Internal Revenue Code:
| Year of Expiration | | Capital Loss
Carryforwards | |
| | 2017 | | | $ | 655,806,039 | | |
| | 2018 | | | | 1,526,982,692 | | |
| | | $ | 2,182,788,731 | | |
Capital loss carryforwards of $525,770,118 were utilized during the year ended February 28, 2011.
Management is required to determine whether a tax position of the Fund is more likely than not to be sustained upon examination by the applicable taxing authority, including resolution of any related appeals or litigation processes, based on the technical merits of the position. The tax benefit to be recognized by the Fund is measured as the largest amount of benefit that is greater than fifty percent likely of being realized upon ultimate settlement. Management is not aware of any tax positions for which it is reasonably possible that the total amounts of unrecognized tax benefits will significantly change in the next twelve months. However, management's conclusions may be subject to review and adjustment at a later date based on factors including, but not limited to, new tax laws, regulations, and administrative interpretations (including relevant court decisions). The Fund's federal tax returns for the prior three fiscal years remain subject to examination by the Internal Revenue Service.
Note 9. Other
Prior to the Closing, the Fund purchased a security in violation of investment restrictions and experienced a realized loss of $1,093,080. Columbia reimbursed the Fund for the loss.
27
Columbia Marsico 21st Century Fund, February 28, 2011
Note 10. Significant Risks and Contingencies
Foreign Securities Risk
Investing in foreign securities may include certain risks and considerations not typically associated with investing in U.S. securities, such as fluctuating currency values and changing local and regional economic, political and social conditions, which may result in greater market volatility. In addition, certain foreign securities may not be as liquid as U.S. securities. Investing in emerging markets may accentuate these risks.
Investments in emerging market countries are subject to additional risk. The risk of foreign investments is typically increased in less developed countries. These countries are also more likely to experience high levels of inflation, deflation or currency devaluation which could hurt their economies and securities markets.
Note 11. Subsequent Events
Management has evaluated the events and transactions that have occurred through the date the financial statements were issued and noted no items requiring adjustment of the financial statements or additional disclosure.
Note 12. Information Regarding Pending and Settled Legal Proceedings
In June 2004, an action captioned John E. Gallus et al. v. American Express Financial Corp. and American Express Financial Advisors Inc. was filed in the United States District Court for the District of Arizona. The plaintiffs allege that they are investors in several American Express Company (now known as RiverSource) mutual funds and they purport to bring the action derivatively on behalf of those funds under the Investment Company Act of 1940. The plaintiffs allege that fees allegedly paid to the defendants by the funds for investment advisory and administrative services are excessive. The plaintiffs seek remedies including restitution and rescission of investment advisory and distribution agreements. The plaintiffs voluntarily agreed to transfer this case to the United States District Court for the District of Minnesota (the District Court). In response to defendants' motion to dismiss the complaint, the District Court dismissed one of plaintiffs' four claims and granted plaintiffs limited discovery. Defendants moved for summary judgment in April 2007. Summary judgment was granted in the defendants' favor on July 9, 2007. The plaintiffs filed a notice of appeal with the Eighth Circuit Court of Appeals (the Eighth Circuit) on August 8, 2007. On April 8, 2009, the Eighth Circuit reversed summary judgment and remanded to the District Court for further proceedings. On August 6, 2009, defendants filed a writ of certiorari with the U.S. Supreme Court (the Supreme Court), asking the Supreme Court to stay the District Court proceedings while the Supreme Court considers and rules in a case captioned Jones v. Harris Associates, which involves issues of law similar to those presented in the Gallus case. On March 30, 2010, the Supreme Court issued its ruling in Jones v. Harris Associates, and on April 5, 2010, the Supreme Court vacated the Eighth Circuit's decision in the Gallus case and remanded the case to the Eighth Circuit for further consideration in light of the Supreme Court's decision in Jones v. Harris Associates. On June 4, 2010, the Eighth Circuit remanded the Gallus case to the District Court for further consideration in light of the Supreme Court's decision in Jones v. Harris Associates. On June 4, 2010, the Eighth Circuit remanded the Gallus case to the District Court for further consideration in light of the Supreme Court's decision in Jones v. Harris Associates. On December 9, 2010, the District Court reinstated its July 9, 2007 summary judgment order in favor of the defendants. On January 10, 2011, plaintiffs filed a notice of appeal with the Eighth Circuit.
In December 2005, without admitting or denying the allegations, American Express Financial Corporation (AEFC, which is now known as Ameriprise Financial, Inc. (Ameriprise Financial)), entered into settlement agreements with the Securities and Exchange Commission (SEC) and Minnesota Department of Commerce (MDOC) related to market timing activities. As a result, AEFC was censured and ordered to cease and desist from committing or causing any violations of certain provisions of the Investment Advisers Act of 1940, the Investment Company Act of 1940, and various Minnesota laws. AEFC agreed to pay disgorgement of $10 million and civil money penalties of $7 million. AEFC also agreed to retain an independent distribution consultant to assist in developing a plan for distribution of all disgorgement and civil penalties ordered by the SEC in accordance with various undertakings detailed at http://www.sec.gov/litigation/admin/ia-2451.pdf. Ameriprise Financial and its affiliates have cooperated with the SEC and the MDOC in these legal proceedings, and have made regular reports to the funds' Boards of Directors/Trustees.
Ameriprise Financial and certain of its affiliates have historically been involved in a number of legal, arbitration and regulatory proceedings, including routine litigation, class actions, and governmental actions, concerning matters arising in connection with the conduct of their business activities. Ameriprise Financial believes that the Funds are not currently the subject of, and that neither Ameriprise Financial nor any of its affiliates are the subject of, any pending legal, arbitration or regulatory proceedings that are likely to
28
Columbia Marsico 21st Century Fund, February 28, 2011
have a material adverse effect on the Funds or the ability of Ameriprise Financial or its affiliates to perform under their contracts with the Funds. Ameriprise Financial is required to make 10-Q, 10-K and, as necessary, 8-K filings with the Securities and Exchange Commission on legal and regulatory matters that relate to Ameriprise Financial and its affiliates. Copies of these filings may be obtained by accessing the SEC website at www.sec.gov.
There can be no assurance that these matters, or the adverse publicity associated with them, will not result in increased fund redemptions, reduced sale of fund shares or other adverse consequences to the Funds. Further, although we believe proceedings are not likely to have a material adverse effect on the Funds or the ability of Ameriprise Financial or its affiliates to perform under their contracts with the Funds, these proceedings are subject to uncertainties and, as such, we are unable to estimate the possible loss or range of loss that may result. An adverse outcome in one or more of these proceedings could result in adverse judgments, settlements, fines, penalties or other relief that could have a material adverse effect on the consolidated financial condition or results of operations of Ameriprise Financial.
29
Report of Independent Registered Public Accounting Firm
To the Trustees of Columbia Funds Series Trust and the Shareholders of Columbia Marsico 21st Century Fund
In our opinion, the accompanying statement of assets and liabilities, including the investment portfolio, and the related statements of operations and of changes in net assets and the financial highlights present fairly, in all material respects, the financial position of Columbia Marsico 21st Century Fund (the "Fund") (a series of Columbia Funds Series Trust) at February 28, 2011, and the results of its operations, the changes in its net assets, and the financial highlights for each of the periods indicated, in conformity with accounting principles generally accepted in the United States of America. These financial statements and financial highlights (hereafter referred to as "financial statements") are the responsibility of the Fund's management. Our responsibility is to express an opinion on these financial statements based on our audits. We conducted our audits of these financial statements in accordance with the standards of the Public Company Accounting Oversight Board (United States). Those standards require that we plan and perform the audit to obtain reasonable assurance about whether the financial statements are free of material misstatement. An audit includes examining, on a test basis, evidence supporting the amounts and disclosures in the financial statements, assessing the accounting principles used and significant estimates made by management, and evaluating the overall financial statement presentation. We believe that our audits, which included confirmation of securities at February 28, 2011 by correspondence with the custodian and brokers, provide a reasonable basis for our opinion.
PricewaterhouseCoopers LLP
Boston, Massachusetts
April 21, 2011
30
Fund Governance
The Trustees serve terms of indefinite duration. The names, addresses and birth years of the Trustees and Officers of the Funds in the Columbia Funds Series Trust, the year each was first elected or appointed to office, their principal business occupations during at least the last five years, the number of Funds overseen by each Trustee and other directorships they hold are shown below. Each officer listed below serves as an officer of each Fund in the Columbia Funds Series Trust.
Independent Trustees
Name, Address and Year of Birth,
Position with Funds, Year First
Elected or Appointed to Office | | Principal Occupation(s) During Past Five Years, Number of Funds in the Columbia
Funds Complex Overseen by Trustee, Other Directorships Held
| |
| Edward J. Boudreau, Jr. (Born 1944) | |
|
c/o Columbia Management
Investment Advisers, LLC
225 Franklin Street
Boston, MA 02110
Trustee (since 2005) | | Managing Director—E.J. Boudreau & Associates (consulting), from 2000 through current; oversees 44; Trustee—BofA Funds Series Trust. | |
|
| William P. Carmichael (Born 1943) | |
|
c/o Columbia Management
Investment Advisers, LLC
225 Franklin Street
Boston, MA 02110
Trustee (since 1999) | | Retired; Oversees 44; Director—Cobra Electronics Corporation (electronic equipment manufacturer); Director—McMoRan Exploration Company (oil and gas exploration and development); Director—The Finish Line (athletic shoes and apparel); Trustee—BofA Funds Series Trust; Former Director—Simmons Company (bedding). | |
|
| William A. Hawkins (Born 1942) | |
|
c/o Columbia Management
Investment Advisers, LLC
225 Franklin Street
Boston, MA 02110
Trustee (since 2005) | | Managing Director—Overton Partners (financial consulting), August 2010 to present; President and Chief Executive Officer—California General Bank, N.A., from January 2008 through August 2010; oversees 44; Trustee—BofA Funds Series Trust. | |
|
| R. Glenn Hilliard (Born 1943) | |
|
c/o Columbia Management
Investment Advisers, LLC
225 Franklin Street
Boston, MA 02110
Trustee (since 2005) | | Chairman and Chief Executive Officer—Hilliard Group LLC (investing and consulting), from April 2003 through current; Non-Executive Director & Chairman—CNO Financial, Inc. (formerly Conseco, Inc.) (insurance), September 2003 through current; Executive Chairman—Conseco, Inc. (insurance), August 2004 through September 2005; oversees 44; Trustee—BofA Funds Series Trust. | |
|
| John J. Nagorniak (Born 1944) | |
|
c/o Columbia Management
Investment Advisers, LLC
225 Franklin Street
Boston, MA 02110
Trustee (since 2008) | | Retired; President and Director—Foxstone Financial, Inc. (consulting), 2000 through December 2007; Director—Mellon Financial Corporation affiliates (investing), 2000 through 2007; Chairman—Franklin Portfolio Associates (investing—Mellon affiliate), 1982 through 2007; oversees 44; Director—MIT Investment Company; Trustee—MIT 401k Plan. | |
|
31
Fund Governance (continued)
Independent Trustees (continued)
Name, Address and Year of Birth,
Position with Funds, Year First
Elected or Appointed to Office | | Principal Occupation(s) During Past Five Years, Number of Funds in the Columbia
Funds Complex Overseen by Trustee, Other Directorships Held
| |
| Minor M. Shaw (Born 1947) | |
|
c/o Columbia Management
Investment Advisers, LLC
225 Franklin Street
Boston, MA 02110
Trustee (since 2003) | | President—Micco Corporation and Mickel Investment Group; oversees 44; Board Member—Piedmont Natural Gas; Trustee—BofA Funds Series Trust. | |
|
Interested Trustee
| Anthony M. Santomero1 (Born 1946) | |
|
c/o Columbia Management
Investment Advisers, LLC
225 Franklin Street
Boston, MA 02110
Trustee (since 2008) | | Richard K. Mellon Professor Emeritus of Finance, The Wharton School, University of Pennsylvania, from 2002 through current; Senior Advisor—McKinsey & Company (consulting), July 2006 through January 2008; President and Chief Executive Officer—Federal Reserve Bank of Philadelphia, July 2000 through April 2006; oversees 44; Director—Renaissance Reinsurance Ltd; Trustee—Penn Mutual Life Insurance Company; Director—Citigroup, Inc.; Citibank, N.A.; Trustee—BofA Funds Series Trust. | |
|
1 Dr. Santomero is currently deemed by the Columbia Funds to be an "interested person" (as defined in the 1940 Act) of the Funds because he serves as a Director of Citigroup, Inc. and Citibank N.A., companies that may directly or through subsidiaries and affiliates engage from time-to-time in brokerage execution, principal transactions and lending relationships with the Columbia Funds or other funds or accounts advised/managed by the Adviser.
The Statement of Additional Information includes additional information about the Trustees of the Funds and is available, without charge, upon request by calling 800-345-6611.
Officers
| Name, Year of Birth and Address | | Principal Occupation(s) During the Past Five Years | |
| J. Kevin Connaughton (Born 1964) | |
|
225 Franklin Street
Boston, MA 02110
President (since 2009) | | Senior Vice President and General Manager—Mutual Fund Products, Columbia Management Investment Advisers, LLC since May 2010; President, Columbia Funds, since 2009, and RiverSource Funds, since May 2010 (previously Senior Vice President and Chief Financial Officer, Columbia Funds, from June 2008 to January 2009, Treasurer, Columbia Funds, from October 2003 to May 2008, and senior officer of various other affiliated funds since 2000); Managing Director, Columbia Management Advisors, LLC from December 2004 to April 2010. | |
|
| Michael G. Clarke (Born 1969) | |
|
225 Franklin Street
Boston, MA 02110
Senior Vice President and
Chief Financial Officer (since 2009) | | Vice President, Columbia Management Investment Advisers, LLC since May 2010; Managing Director of Fund Administration, Columbia Management Advisors, LLC, from September 2004 to April 2010; senior officer of Columbia Funds and affiliated funds since 2002. | |
|
32
Fund Governance (continued)
Officers (continued)
| Name, Year of Birth and Address | | Principal Occupation(s) During the Past Five Years | |
| Scott R. Plummer (Born 1959) | |
|
5228 Ameriprise Financial Center
Minneapolis, MN 55474
Senior Vice President, Secretary and Chief Legal Officer (since 2010) | | Chief Legal Officer and Assistant Secretary, Columbia Management Investment Advisers, LLC since June 2005; Vice President and Lead Chief Counsel—Asset Management, Ameriprise Financial, Inc. since May 2010 (previously Vice President and Chief Counsel—Asset Management, from 2005 to April 2010, and Vice President—Asset Management Compliance from 2004 to 2005); Vice President, Chief Counsel and Assistant Secretary, Columbia Management Investment Distributors, Inc. since 2008; Vice President, General Counsel and Secretary, Ameriprise Certificate Company since 2005; Chief Counsel, RiverSource Distributors, Inc. since 2006; Vice President, General Counsel and Secretary, RiverSource Funds, since December 2006; Senior Vice President, Secretary and Chief Legal Officer, Columbia Funds, since May 2010. | |
|
| Linda J. Wondrack (Born 1964) | |
|
225 Franklin Street
Boston, MA 02110
Senior Vice President and
Chief Compliance Officer (since 2007) | | Vice President and Chief Compliance Officer, Columbia Management Investment Advisers, LLC since May 2010; Chief Compliance Officer, Columbia Funds, since 2007, and RiverSource Funds, since May 2010; Director (Columbia Management Group, LLC and Investment Product Group Compliance), Bank of America, from June 2005 to April 2010. | |
|
| William F. Truscott (Born 1960) | |
|
53600 Ameriprise Financial Center
Minneapolis, MN 55474
Senior Vice President (since 2010) | | Chairman of the Board, Columbia Management Investment Advisers, LLC since May 2010 (previously President, Chairman of the Board and Chief Investment Officer, from 2001 to April 2010); Chief Executive Officer, U.S. Asset Management & President, Annuities, Ameriprise Financial, Inc. since May 2010 (previously President—U.S. Asset Management and Chief Investment Officer from 2005 to April 2010, and Senior Vice President—Chief Investment Officer, from 2001 to 2005); Director, President and Chief Executive Officer, Ameriprise Certificate Company since 2006; Director, Columbia Management Investment Distributors, Inc. since May 2010 (previously Chairman of the Board and Chief Executive Officer from 2008 to April 2010); Chairman of the Board and Chief Executive Officer, RiverSource Distributors, Inc. since 2006. | |
|
| Colin Moore (Born 1958) | |
|
225 Franklin Street
Boston, MA 02110
Senior Vice President (since 2010) | | Director and Chief Investment Officer, Columbia Management Investment Advisers, LLC since May 2010; Manager, Managing Director and Chief Investment Officer of Columbia Management Advisors, LLC from 2007 to April 2010; Head of Equities, Columbia Management Advisors, LLC from 2002 to 2007. | |
|
| Michael A. Jones (Born 1959) | |
|
225 Franklin Street
Boston, MA 02110
Senior Vice President (since 2010) | | President and Director, Columbia Management Investment Advisers, LLC since May 2010; President and Director, Columbia Management Investment Distributors, Inc. since May 2010; Manager, Chairman, Chief Executive Officer and President, Columbia Management Advisors, LLC from 2007 to April 2010; Chief Executive Officer, President and Director, Columbia Management Distributors, Inc. from November 2006 to April 2010; previously, co-president and senior managing director at Robeco Investment Management. | |
|
33
Fund Governance (continued)
Officers (continued)
| Name, Year of Birth and Address | | Principal Occupation(s) During the Past Five Years | |
| Amy Johnson (Born 1965) | |
|
5228 Ameriprise Financial Center
Minneapolis, MN 55474
Senior Vice President (since 2010) | | Senior Vice President and Chief Operating Officer, Columbia Management Investment Advisers, LLC since May 2010 (previously Chief Administrative Officer, from 2009 until April 2010, Vice President—Asset Management and Trust Company Services, from 2006 to 2009, and Vice President—Operations and Compliance from 2004 to 2006). | |
|
| Joseph F. DiMaria (Born 1968) | |
|
225 Franklin Street
Boston, MA 02110
Treasurer (since 2010) and
Chief Accounting Officer (since 2008) | | Vice President, Mutual Fund Administration, Columbia Management Investment Advisers, LLC, since May 2010; Director of Fund Administration, Columbia Management Advisors, LLC from January 2006 to April 2010; Head of Tax/Compliance and Assistant Treasurer, Columbia Management Advisors, LLC, from November 2004 to December 2005. | |
|
| Marybeth Pilat (Born 1968) | |
|
225 Franklin Street
Boston, MA 02110
Deputy Treasurer (since 2010) | | Vice President, Mutual Fund Administration, Columbia Management Investment Advisers, LLC, since May 2010; Vice President, Investment Operations, Bank of America, from October 2008 to April 2010; Finance Manager, Boston Children's Hospital from August 2008 to October 2008; Director, Mutual Fund Administration, Columbia Management Advisors, LLC, from May 2007 to July 2008; Vice President, Mutual Fund Valuation, Columbia Management Advisors, LLC, from January 2006 to May 2007; Vice President, Mutual Fund Accounting Oversight, Columbia Management Advisors, LLC from January 2005 to January 2006. | |
|
| Julian Quero (Born 1967) | |
|
225 Franklin Street
Boston, MA 02110
Deputy Treasurer (since 2008) | | Vice President, Mutual Fund Administration, Columbia Management Investment Advisers, LLC since May 2010; Director of Fund Administration, Columbia Management Advisors, LLC, from August 2008 to April 2010; Senior Tax Manager, Columbia Management Advisors, LLC from August 2006 to July 2008; Senior Compliance Manager, Columbia Management Advisors, LLC from April 2002 to August 2006. | |
|
| Stephen T. Welsh (Born 1957) | |
|
225 Franklin Street
Boston, MA 02110
Vice President (since 2006) | | President and Director, Columbia Management Investment Services Corp. since May 2010; President and Director, Columbia Management Services, Inc. from July 2004 to April 2010; Managing Director, Columbia Management Distributors, Inc. from August 2007 to April 2010. | |
|
34
Shareholder Meeting Results
At a Joint Special Meeting of Shareholders held on February 15, 2011, shareholders of the series of Columbia Funds Series Trust, including the Fund, elected each of the nominees for trustees to the Board of Trustees of Columbia Funds Series Trust, each to hold office for an indefinite term, as follows:
| Trustee | | Votes For | | Votes Withheld | | Abstentions | |
| Kathleen Blatz | | | 2,145,636,122 | | | | 248,012,438 | | | | 0 | | |
| Edward J. Boudreau, Jr. | | | 2,145,430,114 | | | | 248,218,446 | | | | 0 | | |
| Pamela G. Carlton | | | 2,145,515,949 | | | | 248,132,612 | | | | 0 | | |
| William P. Carmichael | | | 2,145,038,695 | | | | 248,609,866 | | | | 0 | | |
| Patricia M. Flynn | | | 2,145,843,563 | | | | 247,804,997 | | | | 0 | | |
| William A. Hawkins | | | 2,145,359,401 | | | | 248,289,160 | | | | 0 | | |
| R. Glenn Hilliard | | | 2,145,079,400 | | | | 248,569,161 | | | | 0 | | |
| Stephen R. Lewis, Jr. | | | 2,145,092,209 | | | | 248,556,351 | | | | 0 | | |
| John F. Maher | | | 2,145,621,338 | | | | 248,027,223 | | | | 0 | | |
| John J. Nagorniak | | | 2,145,337,494 | | | | 248,311,067 | | | | 0 | | |
| Catherine James Paglia | | | 2,145,615,254 | | | | 248,033,306 | | | | 0 | | |
| Leroy C. Richie | | | 2,145,042,120 | | | | 248,606,441 | | | | 0 | | |
| Anthony M. Santomero | | | 2,145,088,174 | | | | 248,560,386 | | | | 0 | | |
| Minor M. Shaw | | | 2,145,430,762 | | | | 248,217,798 | | | | 0 | | |
| Alison Taunton-Rigby | | | 2,145,393,384 | | | | 248,255,177 | | | | 0 | | |
| William F. Truscott | | | 2,144,907,223 | | | | 248,741,338 | | | | 0 | | |
35
This page intentionally left blank.
Important Information About This Report
The fund mails one shareholder report to each shareholder address. If you would like more than one report, please call shareholder services at 1-800-345-6611 and additional reports will be sent to you. This report has been prepared for shareholders of Columbia Marsico 21st Century Fund.
A description of the policies and procedures that the fund uses to determine how to vote proxies and a copy of the fund's voting records are available (i) at www.columbiamanagement.com, (ii) on the Securities and Exchange Commission's website at www.sec.gov, and (iii) without charge, upon request, by calling 1-800-368-0346. Information regarding how the fund voted proxies relating to portfolio securities during the 12-month period ended June 30 is available from the SEC's website. Information regarding how the fund voted proxies relating to portfolio securities is also available from the fund's website, www.columbiamanagement.com.
The fund files a complete schedule of portfolio holdings with the SEC for the first and third quarters of each fiscal year on Form N-Q. The fund's Form N-Q is available on the SEC's website at www.sec.gov and may be reviewed and copied at the SEC's Public Reference Room in Washington, D.C. Information on the operation of the Public Reference Room may be obtained by calling 1-800-SEC-0330.
Transfer Agent
Columbia Management Investment
Services Corp.
P.O. Box 8081
Boston, MA 02266-8081
1-800-345-6611
Distributor
Columbia Management Investment
Distributors, Inc.
225 Franklin Street
Boston, MA 02110
Investment Manager
Columbia Management Investment Advisers, LLC
225 Franklin Street
Boston, MA 02110
37

PRSRT STD
U.S. Postage
PAID
Holliston, MA
Permit NO. 20
Columbia Marsico 21st Century Fund
P. O. Box 8081
Boston, MA 02266-8081
columbiamanagement.com
This information is for use with concurrent or prior delivery of a fund prospectus. Investors should consider the investment objectives, risks, charges and expenses of a mutual fund carefully before investing. For a free prospectus, which contains this and other important information about the funds, visit columbiamanagement.com. Read the prospectus carefully before investing. The Fund is distributed by Columbia Management Investment Distributors, Inc., member FINRA, and managed by Columbia Management Investment Advisers, LLC.
© 2011 Columbia Management Investment Advisers, LLC. All rights reserved.
C-1231 A (04/11)

Columbia Small Cap Growth Fund II
Annual Report for the Period Ended February 28, 2011
Not FDIC insured • No bank guarantee • May lose value
Table of Contents
| Fund Profile | | | 1 | | |
|
| Economic Update | | | 2 | | |
|
| Performance Information | | | 4 | | |
|
| Understanding Your Expenses | | | 5 | | |
|
| Portfolio Managers' Report | | | 6 | | |
|
| Investment Portfolio | | | 8 | | |
|
Statement of Assets and
Liabilities | | | 12 | | |
|
| Statement of Operations | | | 14 | | |
|
Statement of Changes in
Net Assets | | | 15 | | |
|
| Financial Highlights | | | 17 | | |
|
| Notes to Financial Statements | | | 21 | | |
|
Report of Independent Registered
Public Accounting Firm | | | 29 | | |
|
| Fund Governance | | | 30 | | |
|
| Shareholder Meeting Results | | | 34 | | |
|
Important Information About
This Report | | | 37 | | |
|
The views expressed in this report reflect the current views of the respective parties. These views are not guarantees of future performance and involve certain risks, uncertainties and assumptions that are difficult to predict, so actual outcomes and results may differ significantly from the views expressed. These views are subject to change at any time based upon economic, market or other conditions and the respective parties disclaim any responsibility to update such views. These views may not be relied on as investment advice and, because investment decisions for a Columbia Fund are based on numerous factors, may not be relied on as an indication of trading intent on behalf of any particular Columbia Fund. References to specific securities should not be construed as a recommendation or investment advice.
President's Message

Dear Shareholder:
The Columbia Management story began over 100 years ago, and today, we are one of the nation's largest dedicated asset managers. The recent acquisition by Ameriprise Financial, Inc. brings together the talents, resources and capabilities of Columbia Management with those of RiverSource Investments, Threadneedle (acquired by Ameriprise in 2003) and Seligman Investments (acquired by Ameriprise in 2008) to build a best-in-class asset management business that we believe is truly greater than its parts.
RiverSource Investments traces its roots to 1894 when its then newly-founded predecessor, Investors Syndicate, offered a face-amount savings certificate that gave small investors the opportunity to build a safe and secure fund for retirement, education or other special needs. A mutual fund pioneer, Investors Syndicate launched Investors Mutual Fund in 1940. In the decades that followed, its mutual fund products and services lineup grew to include a full spectrum of styles and specialties. More than 110 years later, RiverSource continues to be a trusted financial products leader.
Threadneedle, a leader in global asset management and one of Europe's largest asset managers, offers sophisticated international experience from a dedicated U.K. management team. Headquartered in London, it is named for Threadneedle Street in the heart of the city's financial district, where British investors pioneered international and global investing. Threadneedle was acquired in 2003 and today operates as an affiliate of Columbia Management.
Seligman Investments' beginnings date back to the establishment of the investment firm J. & W. Seligman & Co. in 1864. In the years that followed, Seligman played a major role in the geographical expansion and industrial development of the United States. In 1874, President Ulysses S. Grant named Seligman as fiscal agent for the U.S. Navy—an appointment that would last through World War I. Seligman helped finance the westward path of the railroads and the building of the Panama Canal. The firm organized its first investment company in 1929 and began managing its first mutual fund in 1930. In 2008, J. & W. Seligman & Co. Incorporated was acquired and Seligman Investments became an offering brand of RiverSource Investments, LLC.
We are proud of the rich and distinctive history of these firms, the strength and breadth of products and services they offer, and the combined cultures of pioneering spirit and forward thinking. Together we are committed to providing more for our shareholders than ever before.
> A singular focus on our shareholders
Our business is asset management, so investors are our first priority. We dedicate our resources to identifying timely investment opportunities and provide a comprehensive choice of equity, fixed-income and alternative investments to help meet your individual needs.
> First-class research and thought leadership
We are dedicated to helping you take advantage of today's opportunities and anticipate tomorrow's. We stay abreast of the latest investment trends and ideas, using our collective insight to evaluate events and transform them into solutions you can use.
> A disciplined investment approach
We aren't distracted by passing fads. Our teams adhere to a rigorous investment process that helps ensure the integrity of our products and enables you and your financial advisor to match our solutions to your objectives with confidence.
When you choose Columbia Management, you can be confident that we will take the time to understand your needs and help you and your financial advisor identify the solutions that are right for you. Because at Columbia Management, we don't consider ourselves successful unless you are.
Sincerely,

J. Kevin Connaughton
President, Columbia Funds
Investors should consider the investment objectives, risks, charges and expenses of a mutual fund carefully before investing. For a free prospectus, which contains this and other important information about the funds, visit www.columbiamanagement.com. The prospectus should be read carefully before investing.
Columbia Funds are distributed by Columbia Management Investment Distributors, Inc., member FINRA, and managed by Columbia Management Investment Advisers, LLC.
© 2011 Columbia Management Investment Advisers, LLC. All rights reserved.
Fund Profile – Columbia Small Cap Growth Fund II
Summary
g For the 12-month period that ended February 28, 2011, the fund's Class A shares returned 36.43% without sales charge.
g The fund outperformed the Russell 2000 Growth Index1 and the average return of its peer group, the Lipper Small-Cap Growth Funds Classification.2
g Stock selection in the health care, industrials and consumer sectors helped drive the fund's strong performance relative to its benchmark and peers.
Portfolio Management
Wayne M. Collette has co-managed the fund since 2010. From 2001 until joining Columbia Management Investment Advisers, LLC (the Investment Manager) in May 2010, Mr. Collette was associated with the fund's previous investment adviser as an investment professional.
George J. Myers has co-managed the fund since 2010. From 2004 until joining the Investment Manager in May 2010, Mr. Myers was associated with the fund's previous investment adviser as an investment professional.
Lawrence W. Lin has co-managed the fund since 2010. From 2006 until joining the Investment Manager in May 2010, Mr. Lin was associated with the fund's previous investment adviser as an investment professional.
Brian D. Neigut has co-managed the fund since 2010. From 2007 until joining the Investment Manager in May 2010, Mr. Neigut was associated with the fund's previous investment adviser as an investment professional.
1The Russell 2000 Growth Index measures the performance of those Russell 2000 Index companies with higher price-to-book ratios and higher forecasted growth values.
2Lipper Inc., a widely respected data provider in the industry, calculates an average total return (assuming reinvestment of distributions) for mutual funds with investment objectives similar to those of the fund. Lipper makes no adjustment for the effect of sales loads.
Indices are not available for investment, are not professionally managed and do not reflect sales charges, fees, brokerage commissions, taxes or other expenses of investing. Securities in the fund may not match those in an index.
Performance data quoted represents past performance and current performance may be lower or higher. Past performance is no guarantee of future results. The investment return and principal value will fluctuate so that shares, when redeemed, may be worth more or less than the original cost. Please visit www.columbiamanagement.com for daily and most recent month-end performance updates.
Summary
1-year return as of 02/28/11
| | | | +36.43% | |
|
|  | | | Class A shares
(without sales charge) | |
|
| | | | +36.33% | |
|
|  | | | Russell 2000 Growth Index | |
|
Morningstar Style BoxTM
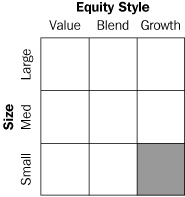
The Morningstar Style BoxTM is based on the fund's portfolio holdings. For equity funds, the vertical axis shows the market capitalization of the stocks owned, and the horizontal axis shows investment style (value, blend, or growth). Information shown is based on the most recent data provided by Morningstar.
© 2011 Morningstar, Inc. All rights reserved. The Morningstar information contained herein: (1) is proprietary to Morningstar and/or its content providers; (2) may not be copied or distributed; and (3) is not warranted to be accurate, complete or timely. Neither Morningstar nor its content providers are responsible for any damages or losses arising from any use of this information.
1
Economic Update – Columbia Small Cap Growth Fund II
Summary
For the 12-month period that ended February 28, 2011
g The U.S. stock market, as measured by the S&P 500 Index, delivered solid returns, despite a summer 2010 correction. Foreign stock market returns were generally in line with the U.S. market, as measured by the MSCI EAFE Index (Net).
| S&P Index | | MSCI Index | |
|
 | |  | |
|
g Strengthening economic growth and rising interest rates kept a lid on most bond market sectors. The Barclays Capital Aggregate Bond Index delivered modest results. However, high-yield bonds were strong performers, as measured by the JPMorgan Developed BB High Yield Index.
Barclays
Aggregate Index | | JPMorgan
Index | |
|
 | |  | |
|
The U.S. economy continued to expand at a modest pace over the past 12 months, as measured by gross domestic product (GDP). After a strong first quarter in 2010, GDP growth dropped to 1.7% in the second quarter and fear spread that the economy would lapse into recession. However, the pace picked up in the third quarter, and growth was strong enough to inspire confidence among consumers, businesses and investors. GDP expanded by 2.6% in the third quarter and 2.8% in the fourth quarter. With the Federal Reserve Board (the Fed) providing additional monetary stimulus to shore up economic growth and the extension of key tax cuts for the next two years, 2011 expectations are for continued growth. Consumer confidence is on the mend, even though job growth has not met expectations. Business spending also tracked higher over the period.
Consumer spending on cars, clothing and other goods generally trended higher throughout the year. Holiday spending rose 5.5% between November 5, 2010 and December 24, 2010, in all retail categories, excluding automobiles, compared with the same period in 2009, according to MasterCard Advisors' SpendingPulse, which tracks spending on all transactions including cash. Analysts say that an increase in personal savings and a decline in consumer debt gave consumers confidence to spend a little more on the 2010 holidays. The personal savings rate edged higher, ending January 2011, the last month for which data was available, at 5.8%. Personal income also increased during the year, surging in January 2011, as payroll tax cuts kicked in.
News on the job front was mostly positive over the 12-month period. A good portion of the jobs added in March, April and May of 2010 were temporary, government-sponsored census positions, which began to unwind in June 2010, July 2010 and August 2010. However, private sector payroll employment began to trend higher in the third quarter, massive layoffs declined and job growth turned solidly positive, with the addition of 255,000 new jobs in the first two months of 2011.
Despite some glimmers of improvement early in 2010, the housing market remained troublesome throughout the period. Both new and existing home sales fell after a federal tax credit for new and repeat homebuyers expired. Distressed properties pressured prices and foreclosures continued—another drag on prices. The inventory of unsold homes ended the period just about where it started, at 7.6 months for both new and existing homes, according to the National Association of Realtors and a joint release from the U.S. Census Bureau and the U.S. Department of Housing and Urban Development. The new year brought a bit of good news: Existing home sales increased in January 2011, raising the level of sales above where it was one year ago. According to the National Association of Realtors, it was the first time in seven months that year-over-year sales activity compared favorably.
Reports from the business side of the economy were generally positive. A key measure of the nation's manufacturing situation—the Institute for Supply Management's Index—took a somewhat surprising turn higher in the final months of the period. Technology spending rose 12% in 2010, according to the NPD Group, a national marketing research firm. Purchases of computers, networking and software returned to prerecession levels. Industrial production was disappointingly flat at year end, per the report issued by the Fed, and it slipped further in January 2011. The amount of manufacturing capacity utilized, per the report issued by the Fed—a key measure of the health of the manufacturing sector—continued to inch higher.
2
Economic Update (continued) – Columbia Small Cap Growth Fund II
Stocks moved higher despite summer 2010 setback
Against a strengthening economic backdrop, a stock market rally that began early in 2009 continued into 2010 despite a summer setback linked to a debt crisis brewing in Europe, which raised concerns among U.S. investors. These fears were short-lived and stocks regained their footing in September 2010, moving higher through the end of the period. The S&P 500 Index1 returned 22.57% for the 12 months through February 28, 2011. Outside the United States, stock market returns seesawed but ended just short of U.S. market returns. The MSCI EAFE Index (Net),2 a broad gauge of stock market performance in foreign developed markets, returned 20.00% (in U.S. dollars) for the 12-month period, as concerns about the impact of a bailout for weak euro zone economies abated. Emerging stock markets were similarly strong. The MSCI Emerging Markets Index (Net)3 returned 20.91% (in U.S. dollars) for the 12-month period.
Bonds delivered modest returns
As the economy strengthened and interest rates edged higher, most bond sectors delivered modest returns. The Barclays Capital Aggregate Bond Index4 returned 4.93%. High-yield bonds led the fixed-income markets. For the 12 months covered by this report, the JPMorgan Developed BB High Yield Index5 returned 14.74%. Despite rising yields in the second half of the period, the Treasury market was also positive. The Barclays Capital U.S. Treasury Index6 returned 3.71%. However, municipal bonds struggled in the final months of the period, as interest rates inched higher and issue supply surged ahead of the expiration of the Build America Bonds program. The Barclays Capital Municipal Bond Index7 gained 1.72% for the period. Despite positive economic activity, the Fed kept a key short-term interest rate—the federal funds rate—close to zero.
Past performance is no guarantee of future results.
1The Standard & Poor's (S&P) 500 Index tracks the performance of 500 widely held, large-capitalization U.S. stocks.
2The Morgan Stanley Capital International Europe, Australasia, Far East (MSCI EAFE) Index (Net) is a free float- adjusted market capitalization index that is designed to measure the equity market performance of developed markets, excluding the U.S. & Canada. As of May 27, 2010, the MSCI EAFE Index (Net) consisted of the following 22 developed market country indices: Australia, Austria, Belgium, Denmark, Finland, France, Germany, Greece, Hong Kong, Ireland, Israel, Italy, Japan, the Netherlands, New Zealand, Norway, Portugal, Singapore, Spain, Sweden, Switzerland and the United Kingdom.
3The Morgan Stanley Capital International Emerging Markets (MSCI EM) Index (Net) is a free float-adjusted market capitalization index that is designed to measure equity market performance of emerging markets. As of May 27, 2010, the MSCI EM Index (Net) consisted of the following 21 emerging market country indices: Brazil, Chile, China, Colombia, Czech Republic, Egypt, Hungary, India, Indonesia, Korea, Malaysia, Mexico, Morocco, Peru, Philippines, Poland, Russia, South Africa, Taiwan, Thailand and Turkey.
4The Barclays Capital Aggregate Bond Index is a market value-weighted index that tracks the daily price, coupon, pay-downs and total return performance of fixed-rate, publicly placed, dollar-denominated and non-convertible investment grade debt issues with at least $250 million par amount outstanding and with at least one year to final maturity.
5The JPMorgan Developed BB High Yield Index is an unmanaged index designed to mirror the investable universe of the U.S. dollar developed, BB-rated, high yield corporate debt market.
6The Barclays Capital U.S. Treasury Index includes public obligations of the U.S. Treasury. Treasury bills are excluded by the maturity constraint. In addition, certain special issues, such as state and local government series bonds (SLGs), as well as U.S. Treasury TIPS, are excluded. STRIPS are excluded from the index because their inclusion would result in double-counting.
7The Barclays Capital Municipal Bond Index is considered representative of the broad market for investment-grade, tax-exempt bonds with a maturity of at least one year.
Indices are not available for investment, are not professionally managed and do not reflect sales charges, fees, brokerage commissions, taxes or other expenses of investing. Securities in the fund may not match those in an index.
3
Performance Information – Columbia Small Cap Growth Fund II
Performance data quoted represents past performance and current performance may be lower or higher. Past performance is no guarantee of future results. The investment return and principal value will fluctuate so that shares, when redeemed, may be worth more or less than the original cost. Please visit www.columbiamanagement.com for daily and most recent month-end performance updates.
Performance of a $10,000 investment 03/01/01 – 02/28/11
The chart above shows the change in value of a hypothetical $10,000 investment in Class A shares of Columbia Small Cap Growth Fund II during the stated time period, and does not reflect the deduction of taxes that a shareholder may pay on fund distributions or on the redemption of fund shares.
Performance of a $10,000 investment 03/01/01 – 02/28/11 ($)
| Sales charge | | without | | with | |
| Class A | | | 13,992 | | | | 13,184 | | |
| Class B | | | 12,976 | | | | 12,976 | | |
| Class C | | | 12,976 | | | | 12,976 | | |
| Class Z | | | 14,349 | | | | n/a | | |
Average annual total return as of 02/28/11 (%)
| Share class | | A | | B | | C | | Z | |
| Inception | | 12/12/95 | | 12/12/95 | | 09/22/97 | | 12/12/95 | |
| Sales charge | | without | | with | | without | | with | | without | | with | | without | |
| 1-year | | | 36.43 | | | | 28.65 | | | | 35.41 | | | | 30.41 | | | | 35.45 | | | | 34.45 | | | | 36.83 | | |
| 5-year | | | 2.49 | | | | 1.28 | | | | 1.73 | | | | 1.47 | | | | 1.71 | | | | 1.71 | | | | 2.76 | | |
| 10-year | | | 3.42 | | | | 2.80 | | | | 2.64 | | | | 2.64 | | | | 2.64 | | | | 2.64 | | | | 3.68 | | |
The "with sales charge" returns include the maximum initial sales charge of 5.75% for Class A, the applicable contingent deferred sales charge of 5.00% in the first year, declining to 1.00% in the sixth year and eliminated thereafter for Class B shares and 1.00% for Class C shares for the first year only. The "without sales charge" returns do not include the effect of sales charges. If they had, returns would be lower.
Performance results reflect any fee waivers or reimbursements of fund expenses by the Investment Manager and/or any of its affiliates. Absent these fee waivers or expense reimbursement arrangements, performance results would have been lower.
All results shown assume reinvestment of distributions. Class Z shares are sold at net asset value with no distribution and service (Rule 12b-1) fees. Class Z shares have limited eligibility and the investment minimum requirements may vary. Please see the fund's prospectus for details. Performance for different share classes will vary based on differences in sales charges and fees associated with each class.
The tables do not reflect the deduction of taxes that a shareholder may pay on fund distributions or on the redemption of fund shares.
4
Understanding Your Expenses – Columbia Small Cap Growth Fund II
As a fund shareholder, you incur two types of costs. There are transaction costs, which generally include sales charges on purchases and may include redemption fees or exchange fees. There are also ongoing costs, which generally include investment advisory fees, distribution and service (Rule 12b-1) fees and other fund expenses. The information on this page is intended to help you understand the ongoing costs of investing in the fund and to compare these costs with the ongoing costs of investing in other mutual funds.
Analyzing your fund's expenses by share class
To illustrate these ongoing costs, we have provided an example and calculated the expenses paid by investors in each share class during the period. The information in the following table is based on an initial investment of $1,000, which is invested at the beginning of the period and held for the entire period. Expense information is calculated two ways and each method provides you with different information. The amount listed in the "Actual" column is calculated using the fund's actual operating expenses and total return for the period. The amount listed in the "Hypothetical" column for each share class assumes that the return each year is 5% before expenses and is calculated based on the fund's actual operating expenses. You should not use the hypothetical account values and expenses to estimate either your actual account balance at the end of the period or the expenses you paid during this period.
Compare with other funds
Since all mutual funds are required to include the same hypothetical calculations about expenses in shareholder reports, you can use this information to compare the ongoing cost of investing in the fund with other funds. To do so, compare the 5% hypothetical example with the 5% hypothetical examples that appear in the shareholder reports of other funds. As you compare hypothetical examples of other funds, it is important to note that hypothetical examples are meant to highlight the ongoing costs of investing in a fund and do not reflect any transaction costs, such as sales charges, redemption fees or exchange fees.
Estimating your actual expenses
To estimate the expenses that you paid over the period, first you will need your account balance at the end of the period:
g For shareholders who receive their account statements from Columbia Management Investment Services Corp., your account balance is available online at www.columbiamanagement.com or by calling Shareholder Services at 800.345.6611.
g For shareholders who receive their account statements from their financial intermediary, contact your financial intermediary to obtain your account balance.
1. Divide your ending account balance by $1,000. For example, if an account balance was $8,600 at the end of the period, the result would be 8.6.
2. In the section of the table below titled "Expenses paid during the period," locate the amount for your share class. You will find this number in the column labeled "Actual." Multiply this number by the result from step 1. Your answer is an estimate of the expenses you paid on your account during the period.
If the value of your account falls below the minimum initial investment requirement applicable to you, your account may be subject to a $20 annual fee. This fee is not included in the accompanying table. If you are subject to the fee, keep it in mind when you are estimating the ongoing expenses of investing in the fund and when comparing the expenses of this fund with other funds.
09/01/10 – 02/28/11
| | | Account value at the
beginning of the period ($) | | Account value at the
end of the period ($) | | Expenses paid
during the period ($) | | Fund's annualized
expense ratio (%) | |
| | | Actual | | Hypothetical | | Actual | | Hypothetical | | Actual | | Hypothetical | | Actual | |
| Class A | | | 1,000.00 | | | | 1,000.00 | | | | 1,400.50 | | | | 1,018.40 | | | | 7.68 | | | | 6.46 | | | | 1.29 | | |
| Class B | | | 1,000.00 | | | | 1,000.00 | | | | 1,395.00 | | | | 1,014.68 | | | | 12.11 | | | | 10.19 | | | | 2.04 | | |
| Class C | | | 1,000.00 | | | | 1,000.00 | | | | 1,394.40 | | | | 1,014.68 | | | | 12.11 | | | | 10.19 | | | | 2.04 | | |
| Class Z | | | 1,000.00 | | | | 1,000.00 | | | | 1,401.30 | | | | 1,019.64 | | | | 6.19 | | | | 5.21 | | | | 1.04 | | |
Expenses paid during the period are equal to the annualized expense ratio for the share class, multiplied by the average account value over the period, then multiplied by the number of days in the fund's most recent fiscal half-year and divided by 365.
It is important to note that the expense amounts shown in the table are meant to highlight only ongoing costs of investing in the fund and do not reflect any transaction costs, such as sales charges, redemption fees or exchange fees. Therefore, the hypothetical examples provided may not help you determine the relative total costs of owning shares of different funds. If these transaction costs were included, your costs would have been higher.
5
Portfolio Managers' Report – Columbia Small Cap Growth Fund II
Performance data quoted represents past performance and current performance may be lower or higher. Past performance is no guarantee of future results. The investment return and principal value will fluctuate so that shares, when redeemed, may be worth more or less than the original cost. Please visit www.columbiamanagement.com for daily and most recent month-end performance updates.
Net asset value per share
as of 02/28/11 ($)
| Class A | | | 12.17 | | |
| Class B | | | 10.63 | | |
| Class C | | | 10.89 | | |
| Class Z | | | 12.78 | | |
For the 12-month period that ended February 28, 2011, the fund's Class A shares returned 36.43% without sales charge. The Russell 2000 Growth Index returned 36.33%. The average return of the fund's peer group, the Lipper Small Cap Growth Funds Classification, was 35.64%. Stock selection in the health care sector generally accounted for the fund's performance edge relative to the benchmark and its peers. Stocks in the industrials and consumer sectors also generated positive results. Disappointments were generally stock-specific and included several technology names.
Health care, industrials and consumer holdings drove return
Merger and acquisition activity drove positive results within the health care and industrials sectors during the period. Within the health care sector, marketing and services agency inVentiv Health was sold to private equity firm Thomas H. Lee and Partners. The company was acquired at a premium over its stock price and generated a substantial profit for the fund. Shares of mental health clinic operator Psychiatric Solutions also commanded a premium, as United Health outbid a private equity bidder to merge Psychiatric Solutions into its own business during the period. Among industrials, materials supplier Hexcel Corp. benefited from strong sales driven by production of Boeing's new 787 Dreamliner (0.9% of net assets). Electric motor manufacturer Baldor Electric was another significant contributor in the industrials sector, as the company was acquired at a premium by Swiss company ABB.
Both the consumer staples and the consumer discretionary sectors contributed positively to the fund's performance relative to the benchmark. High-end yoga wear retailer Lululemon athletica reported strong sales as a result of an uptick in holiday shopping (1.2% of net assets). Rising ticket sales due to an improved slate of 3-D movies, together with takeover rumors, helped boost the stock of Imax (0.6% of net assets).
Information technology stocks detract from performance
The fund's overall return was hurt by falling profit margins within several technology companies. Among these were IT performance specialist Riverbed Technology (0.8% of net assets), mobile communications technology provider TeleCommunication Systems and global business process outsource provider TeleTech Holdings. We sold the latter two positions. The single largest detractor from the fund's return was consumer discretionary stock LodgeNet Interactive, which provides interactive media and Internet connectivity solutions to hotels. Saddled with significant debt, the company's heavy reliance on hotel occupancy rates and guest spending on media services caused concern among investors in a weak economic environment. We sold the stock.
Seeking growth companies in an improving economy
While we believe many stocks are attractively valued despite the market's recent run-up, we remain concerned about high unemployment, continued high consumer debt levels and rising oil prices. As a result, we have positioned the portfolio for a gradual economic recovery. We continue to seek those growth companies with products or services that are in demand in the marketplace and that can continue to grow regardless of the direction or pace of the economy. In
6
Portfolio Managers' Report (continued) – Columbia Small Cap Growth Fund II
particular, we have pinpointed technology as an area of potential growth due to indications that corporate spending is on the rebound. Technology is often one of the first capital expenditures that companies make after a downturn. We have positioned the fund accordingly, with a particular emphasis on companies that offer cloud computing technology or on-demand, Internet-based computer services and storage. We believe that companies will continue to spend on outsourcing in this area regardless of external events or economic conditions.
Portfolio characteristics and holdings are subject to change periodically and may not be representative of current characteristics and holdings. The outlook for the fund may differ from those presented for other Columbia Funds.
Equity securities are affected by stock market fluctuations that occur in response to economic and business developments.
Stocks of small-cap companies pose special risks, including possible illiquidity and greater price volatility than stocks of larger, more established companies.
Top 5 sectors
as of 02/28/11 (%)
| Information Technology | | | 27.9 | | |
| Consumer Discretionary | | | 18.6 | | |
| Health Care | | | 16.2 | | |
| Industrials | | | 14.8 | | |
| Energy | | | 7.8 | | |
Top 10 holdings
as of 02/28/11 (%)
| Tempur-Pedic International | | | 2.2 | | |
| VeriFone Systems | | | 2.0 | | |
| TIBCO Software | | | 2.0 | | |
| SuccessFactors | | | 1.7 | | |
| Stillwater Mining | | | 1.6 | | |
| IntraLinks Holdings | | | 1.4 | | |
| Fortinet | | | 1.3 | | |
| Aruba Networks | | | 1.3 | | |
| DTS | | | 1.3 | | |
| Tenneco | | | 1.3 | | |
The fund is actively managed and the composition of its portfolio will change over time. Information provided is calculated as a percentage of net assets
7
Investment Portfolio – Columbia Small Cap Growth Fund II
February 28, 2011
| Common Stocks – 99.2% | |
| | | Shares | | Value ($) | |
| Consumer Discretionary – 18.6% | |
| Auto Components – 2.0% | |
| Cooper Tire & Rubber Co. | | | 103,580 | | | | 2,429,987 | | |
| Tenneco, Inc. (a) | | | 122,236 | | | | 4,874,771 | | |
| Auto Components Total | | | 7,304,758 | | |
| Diversified Consumer Services – 1.6% | |
| Capella Education Co. (a) | | | 39,387 | | | | 2,271,448 | | |
| Coinstar, Inc. (a) | | | 54,491 | | | | 2,325,676 | | |
| Grand Canyon Education, Inc. (a) | | | 79,536 | | | | 1,278,939 | | |
| Diversified Consumer Services Total | | | 5,876,063 | | |
| Hotels, Restaurants & Leisure – 1.2% | |
| BJ's Restaurants, Inc. (a) | | | 75,035 | | | | 2,697,508 | | |
| Summit Hotel Properties, Inc. (a) | | | 194,274 | | | | 1,894,172 | | |
| Hotels, Restaurants & Leisure Total | | | 4,591,680 | | |
| Household Durables – 3.3% | |
| SodaStream International Ltd. (a) | | | 90,363 | | | | 3,996,756 | | |
| Tempur-Pedic International, Inc. (a) | | | 176,730 | | | | 8,295,706 | | |
| Household Durables Total | | | 12,292,462 | | |
| Internet & Catalog Retail – 0.8% | |
| Shutterfly, Inc. (a) | | | 66,012 | | | | 2,818,712 | | |
| Internet & Catalog Retail Total | | | 2,818,712 | | |
| Leisure Equipment & Products – 0.5% | |
| Polaris Industries, Inc. | | | 26,220 | | | | 1,978,299 | | |
| Leisure Equipment & Products Total | | | 1,978,299 | | |
| Media – 1.8% | |
| Cinemark Holdings, Inc. | | | 136,385 | | | | 2,738,611 | | |
| Imax Corp. (a) | | | 76,587 | | | | 2,030,321 | | |
| Knology, Inc. (a) | | | 132,804 | | | | 1,848,632 | | |
| Media Total | | | 6,617,564 | | |
| Multiline Retail – 0.4% | |
| Gordmans Stores, Inc. (a) | | | 109,968 | | | | 1,647,321 | | |
| Multiline Retail Total | | | 1,647,321 | | |
| Specialty Retail – 3.1% | |
| Body Central Corp. (a) | | | 163,203 | | | | 2,784,243 | | |
| Pier 1 Imports, Inc. (a) | | | 187,695 | | | | 1,891,966 | | |
| Rue21, Inc. (a) | | | 58,423 | | | | 2,045,973 | | |
| Vitamin Shoppe, Inc. (a) | | | 132,919 | | | | 4,624,252 | | |
| Specialty Retail Total | | | 11,346,434 | | |
| Textiles, Apparel & Luxury Goods – 3.9% | |
| CROCS, Inc. (a) | | | 247,345 | | | | 4,365,639 | | |
| Deckers Outdoor Corp. (a) | | | 42,395 | | | | 3,740,087 | | |
| | | Shares | | Value ($) | |
| Lululemon Athletica, Inc. (a) | | | 56,430 | | | | 4,378,404 | | |
| Warnaco Group, Inc. (a) | | | 34,240 | | | | 2,010,230 | | |
| Textiles, Apparel & Luxury Goods Total | | | 14,494,360 | | |
| Consumer Discretionary Total | | | 68,967,653 | | |
| Consumer Staples – 2.1% | |
| Food & Staples Retailing – 0.6% | |
| Casey's General Stores, Inc. | | | 49,320 | | | | 2,025,572 | | |
| Food & Staples Retailing Total | | | 2,025,572 | | |
| Food Products – 0.7% | |
| Diamond Foods, Inc. | | | 52,937 | | | | 2,697,140 | | |
| Food Products Total | | | 2,697,140 | | |
| Personal Products – 0.8% | |
| Elizabeth Arden, Inc. (a) | | | 103,221 | | | | 3,002,699 | | |
| Personal Products Total | | | 3,002,699 | | |
| Consumer Staples Total | | | 7,725,411 | | |
| Energy – 7.8% | |
| Energy Equipment & Services – 1.9% | |
Complete Production
Services, Inc. (a) | | | 109,750 | | | | 3,161,898 | | |
| Dril-Quip, Inc. (a) | | | 21,490 | | | | 1,648,283 | | |
| Hercules Offshore, Inc. (a) | | | 438,760 | | | | 2,167,474 | | |
| Energy Equipment & Services Total | | | 6,977,655 | | |
| Oil, Gas & Consumable Fuels – 5.9% | |
| BPZ Resources, Inc. (a) | | | 391,740 | | | | 2,546,310 | | |
| Brigham Exploration Co. (a) | | | 64,975 | | | | 2,376,785 | | |
| Carrizo Oil & Gas, Inc. (a) | | | 53,520 | | | | 1,992,014 | | |
| Energy XXI Bermuda Ltd. (a) | | | 88,420 | | | | 3,048,722 | | |
| McMoRan Exploration Co. (a) | | | 106,335 | | | | 1,860,863 | | |
| Oasis Petroleum, Inc. (a) | | | 74,000 | | | | 2,554,480 | | |
| Resolute Energy Corp. (a) | | | 143,211 | | | | 2,596,415 | | |
| Rosetta Resources, Inc. (a) | | | 46,705 | | | | 2,118,539 | | |
| World Fuel Services Corp. | | | 67,265 | | | | 2,787,462 | | |
| Oil, Gas & Consumable Fuels Total | | | 21,881,590 | | |
| Energy Total | | | 28,859,245 | | |
| Financials – 5.8% | |
| Capital Markets – 0.5% | |
| Stifel Financial Corp. (a) | | | 28,959 | | | | 2,077,519 | | |
| Capital Markets Total | | | 2,077,519 | | |
See Accompanying Notes to Financial Statements.
8
Columbia Small Cap Growth Fund II
February 28, 2011
| Common Stocks (continued) | |
| | | Shares | | Value ($) | |
| Commercial Banks – 1.8% | |
| Center Financial Corp. (a) | | | 274,190 | | | | 2,185,294 | | |
| Signature Bank (a) | | | 84,200 | | | | 4,369,138 | | |
| Commercial Banks Total | | | 6,554,432 | | |
| Consumer Finance – 1.3% | |
| Dollar Financial Corp. (a) | | | 18,391 | | | | 393,383 | | |
| EZCORP, Inc., Class A (a) | | | 88,060 | | | | 2,525,561 | | |
| Netspend Holdings, Inc. (a) | | | 135,572 | | | | 1,777,349 | | |
| Consumer Finance Total | | | 4,696,293 | | |
| Diversified Financial Services – 1.3% | |
| Gain Capital Holdings, Inc. (a) | | | 219,722 | | | | 1,700,649 | | |
Portfolio Recovery
Associates, Inc. (a) | | | 37,146 | | | | 3,096,119 | | |
| Diversified Financial Services Total | | | 4,796,768 | | |
| Real Estate Investment Trusts (REITs) – 0.9% | |
| FelCor Lodging Trust, Inc. (a) | | | 210,166 | | | | 1,590,957 | | |
| Tanger Factory Outlet Centers | | | 68,090 | | | | 1,814,598 | | |
| Real Estate Investment Trusts (REITs) Total | | | 3,405,555 | | |
| Financials Total | | | 21,530,567 | | |
| Health Care – 16.2% | |
| Biotechnology – 3.2% | |
| Acorda Therapeutics, Inc. (a) | | | 44,185 | | | | 926,560 | | |
| Alexion Pharmaceuticals, Inc. (a) | | | 16,555 | | | | 1,593,915 | | |
| Amarin Corp. PLC, ADR (a) | | | 169,200 | | | | 1,307,916 | | |
| Ardea Biosciences, Inc. (a) | | | 79,458 | | | | 2,106,432 | | |
| Cubist Pharmaceuticals, Inc. (a) | | | 67,045 | | | | 1,470,297 | | |
| Halozyme Therapeutics, Inc. (a) | | | 151,440 | | | | 1,046,450 | | |
| Momenta Pharmaceuticals, Inc. (a) | | | 78,640 | | | | 1,091,523 | | |
| Onyx Pharmaceuticals, Inc. (a) | | | 62,228 | | | | 2,192,915 | | |
| Biotechnology Total | | | 11,736,008 | | |
| Health Care Equipment & Supplies – 4.1% | |
| Align Technology, Inc. (a) | | | 149,860 | | | | 3,124,581 | | |
| DexCom, Inc. (a) | | | 101,313 | | | | 1,482,209 | | |
| ICU Medical, Inc. (a) | | | 39,160 | | | | 1,644,328 | | |
| Insulet Corp. (a) | | | 98,930 | | | | 1,751,061 | | |
| Masimo Corp. | | | 126,225 | | | | 3,804,422 | | |
| NuVasive, Inc. (a) | | | 118,000 | | | | 3,154,140 | | |
| Health Care Equipment & Supplies Total | | | 14,960,741 | | |
| Health Care Providers & Services – 4.3% | |
| Brookdale Senior Living, Inc. (a) | | | 122,045 | | | | 3,281,790 | | |
| Catalyst Health Solutions, Inc. (a) | | | 51,894 | | | | 2,346,128 | | |
| HMS Holdings Corp. (a) | | | 50,390 | | | | 3,807,468 | | |
| IPC The Hospitalist Co., Inc. (a) | | | 111,220 | | | | 4,537,776 | | |
| PSS World Medical, Inc. (a) | | | 79,575 | | | | 2,070,542 | | |
| Health Care Providers & Services Total | | | 16,043,704 | | |
| | | Shares | | Value ($) | |
| Health Care Technology – 0.7% | |
| Omnicell, Inc. (a) | | | 204,500 | | | | 2,748,480 | | |
| Health Care Technology Total | | | 2,748,480 | | |
| Life Sciences Tools & Services – 1.2% | |
| Fluidigm Corp. (a) | | | 135,276 | | | | 1,911,450 | | |
| ICON PLC, ADR (a) | | | 120,355 | | | | 2,393,861 | | |
| Life Sciences Tools & Services Total | | | 4,305,311 | | |
| Pharmaceuticals – 2.7% | |
| Auxilium Pharmaceuticals, Inc. (a) | | | 55,985 | | | | 1,257,983 | | |
| Impax Laboratories, Inc. (a) | | | 206,275 | | | | 4,247,202 | | |
| MAP Pharmaceuticals, Inc. (a) | | | 96,090 | | | | 1,549,932 | | |
| Salix Pharmaceuticals Ltd. (a) | | | 90,925 | | | | 3,031,439 | | |
| Pharmaceuticals Total | | | 10,086,556 | | |
| Health Care Total | | | 59,880,800 | | |
| Industrials – 14.8% | |
| Aerospace & Defense – 1.7% | |
| Hexcel Corp. (a) | | | 176,070 | | | | 3,266,098 | | |
| LMI Aerospace, Inc. (a) | | | 169,285 | | | | 3,040,359 | | |
| Aerospace & Defense Total | | | 6,306,457 | | |
| Air Freight & Logistics – 0.7% | |
Atlas Air Worldwide
Holdings, Inc. (a) | | | 36,590 | | | | 2,498,365 | | |
| Air Freight & Logistics Total | | | 2,498,365 | | |
| Commercial Services & Supplies – 0.7% | |
| Tetra Tech, Inc. (a) | | | 114,350 | | | | 2,687,225 | | |
| Commercial Services & Supplies Total | | | 2,687,225 | | |
| Construction & Engineering – 0.9% | |
| Great Lakes Dredge & Dock Corp. | | | 235,755 | | | | 1,855,392 | | |
| Sterling Construction Co., Inc. (a) | | | 121,585 | | | | 1,592,763 | | |
| Construction & Engineering Total | | | 3,448,155 | | |
| Electrical Equipment – 0.6% | |
| Regal-Beloit Corp. | | | 30,510 | | | | 2,225,705 | | |
| Electrical Equipment Total | | | 2,225,705 | | |
| Machinery – 5.3% | |
| ArvinMeritor, Inc. (a) | | | 249,076 | | | | 4,463,442 | | |
| Chart Industries, Inc. (a) | | | 47,860 | | | | 2,172,365 | | |
| Columbus McKinnon Corp. (a) | | | 101,800 | | | | 1,758,086 | | |
| Lindsay Corp. | | | 45,260 | | | | 3,195,809 | | |
| Robbins & Myers, Inc. | | | 76,655 | | | | 3,267,803 | | |
| Tennant Co. | | | 61,200 | | | | 2,487,780 | | |
| Trinity Industries, Inc. | | | 73,220 | | | | 2,280,803 | | |
| Machinery Total | | | 19,626,088 | | |
See Accompanying Notes to Financial Statements.
9
Columbia Small Cap Growth Fund II
February 28, 2011
| Common Stocks (continued) | |
| | | Shares | | Value ($) | |
| Professional Services – 2.6% | |
| Advisory Board Co. (a) | | | 49,505 | | | | 2,532,676 | | |
| Corporate Executive Board Co. | | | 70,180 | | | | 2,812,113 | | |
| CoStar Group, Inc. (a) | | | 32,520 | | | | 1,842,908 | | |
| Korn/Ferry International (a) | | | 108,046 | | | | 2,469,931 | | |
| Professional Services Total | | | 9,657,628 | | |
| Road & Rail – 1.5% | |
Dollar Thrifty Automotive
Group, Inc. (a) | | | 32,960 | | | | 1,750,505 | | |
Genesee & Wyoming, Inc.,
Class A (a) | | | 40,520 | | | | 2,110,687 | | |
Roadrunner Transportation
Systems, Inc. (a) | | | 120,718 | | | | 1,700,917 | | |
| Road & Rail Total | | | 5,562,109 | | |
| Trading Companies & Distributors – 0.8% | |
| TAL International Group, Inc. | | | 85,623 | | | | 2,986,530 | | |
| Trading Companies & Distributors Total | | | 2,986,530 | | |
| Industrials Total | | | 54,998,262 | | |
| Information Technology – 27.9% | |
| Communications Equipment – 3.2% | |
| Acme Packet, Inc. (a) | | | 26,659 | | | | 2,005,823 | | |
| Adtran, Inc. | | | 41,555 | | | | 1,889,921 | | |
| Aruba Networks, Inc. (a) | | | 162,075 | | | | 4,935,184 | | |
| Riverbed Technology, Inc. (a) | | | 75,190 | | | | 3,104,595 | | |
| Communications Equipment Total | | | 11,935,523 | | |
| Electronic Equipment, Instruments & Components – 2.0% | |
| DTS, Inc. (a) | | | 108,615 | | | | 4,925,690 | | |
| Universal Display Corp. (a) | | | 59,115 | | | | 2,488,151 | | |
Electronic Equipment, Instruments &
Components Total | | | 7,413,841 | | |
| Internet Software & Services – 5.8% | |
| Ancestry.com, Inc. (a) | | | 59,735 | | | | 1,962,892 | | |
| Dice Holdings, Inc. (a) | | | 171,598 | | | | 2,356,041 | | |
| IntraLinks Holdings, Inc. (a) | | | 177,247 | | | | 4,996,593 | | |
| KIT Digital, Inc. (a) | | | 104,735 | | | | 1,362,602 | | |
| LogMeIn, Inc. (a) | | | 90,145 | | | | 3,235,304 | | |
| OpenTable, Inc. (a) | | | 32,407 | | | | 2,880,010 | | |
| RightNow Technologies, Inc. (a) | | | 70,066 | | | | 1,870,062 | | |
| Vocus, Inc. (a) | | | 107,470 | | | | 2,611,521 | | |
| Internet Software & Services Total | | | 21,275,025 | | |
| IT Services – 3.3% | |
| ExlService Holdings, Inc. (a) | | | 90,970 | | | | 2,021,353 | | |
| VeriFone Systems, Inc. (a) | | | 163,620 | | | | 7,434,893 | | |
| Wright Express Corp. (a) | | | 52,520 | | | | 2,678,520 | | |
| IT Services Total | | | 12,134,766 | | |
| | | Shares | | Value ($) | |
| Semiconductors & Semiconductor Equipment – 3.9% | |
| Cirrus Logic, Inc. (a) | | | 100,615 | | | | 2,349,360 | | |
| Cymer, Inc. (a) | | | 51,420 | | | | 2,601,852 | | |
| Entropic Communications, Inc. (a) | | | 201,318 | | | | 1,864,205 | | |
| MIPS Technologies, Inc. (a) | | | 158,315 | | | | 1,926,693 | | |
| Nanometrics, Inc. (a) | | | 99,765 | | | | 1,797,765 | | |
| Semtech Corp. (a) | | | 84,770 | | | | 2,007,354 | | |
| Volterra Semiconductor Corp. (a) | | | 70,830 | | | | 1,787,041 | | |
Semiconductors & Semiconductor
Equipment Total | | | 14,334,270 | | |
| Software – 9.7% | |
| BroadSoft, Inc. (a) | | | 53,668 | | | | 1,894,481 | | |
| Concur Technologies, Inc. (a) | | | 72,045 | | | | 3,748,501 | | |
| Fortinet, Inc. (a) | | | 121,145 | | | | 4,947,562 | | |
| Kenexa Corp. (a) | | | 115,384 | | | | 2,675,755 | | |
| Netscout Systems, Inc. (a) | | | 75,861 | | | | 1,895,766 | | |
| Parametric Technology Corp. (a) | | | 119,560 | | | | 2,833,572 | | |
| RealPage, Inc. (a) | | | 95,549 | | | | 2,369,615 | | |
| SuccessFactors, Inc. (a) | | | 170,002 | | | | 6,104,772 | | |
| TIBCO Software, Inc. (a) | | | 294,150 | | | | 7,241,973 | | |
VanceInfo
Technologies, Inc., ADR (a) | | | 68,900 | | | | 2,287,480 | | |
| Software Total | | | 35,999,477 | | |
| Information Technology Total | | | 103,092,902 | | |
| Materials – 6.0% | |
| Chemicals – 1.2% | |
| Solutia, Inc. (a) | | | 182,270 | | | | 4,230,487 | | |
| Chemicals Total | | | 4,230,487 | | |
| Metals & Mining – 4.8% | |
| Coeur d'Alene Mines Corp. (a) | | | 87,533 | | | | 2,758,165 | | |
| Globe Specialty Metals, Inc. | | | 97,690 | | | | 2,275,200 | | |
| HudBay Minerals, Inc. | | | 187,713 | | | | 3,255,585 | | |
| Stillwater Mining Co. (a) | | | 242,569 | | | | 5,790,122 | | |
Thompson Creek Metals
Co., Inc. (a) | | | 287,175 | | | | 3,784,967 | | |
| Metals & Mining Total | | | 17,864,039 | | |
| Materials Total | | | 22,094,526 | | |
Total Common Stocks
(cost of $283,811,142) | | | 367,149,366 | | |
See Accompanying Notes to Financial Statements.
10
Columbia Small Cap Growth Fund II
February 28, 2011
| Short-Term Obligation – 2.8% | |
| | | Par ($) | | Value ($) | |
Repurchase agreement with Fixed
Income Clearing Corp.,
dated 02/28/11, due 03/01/11
at 0.080%, collateralized by
a U.S. Treasury obligation
maturing 02/28/18, market
value $10,547,000 (repurchase
proceeds $10,337,023) | | | 10,337,000 | | | | 10,337,000 | | |
Total Short-Term Obligation
(cost of $10,337,000) | | | 10,337,000 | | |
Total Investments – 102.0%
(cost of $294,148,142)(b) | | | 377,486,366 | | |
| Other Assets & Liabilities, Net – (2.0)% | | | (7,529,329 | ) | |
| Net Assets – 100.0% | | | 369,957,037 | | |
Notes to Investment Portfolio:
(a) Non-income producing security.
(b) Cost for federal income tax purposes is $294,850,280.
Generally accepted accounting principles (GAAP) require disclosure regarding the inputs and valuation techniques used to measure fair value and any changes in valuation inputs or techniques. In addition, investments shall be disclosed by major category.
The Fund categorizes its fair value measurements according to a three-level hierarchy that maximizes the use of observable inputs and minimizes the use of unobservable inputs by prioritizing that the most observable input be used when available. Observable inputs are those that market participants would use in pricing an investment based on market data obtained from sources independent of the reporting entity. Unobservable inputs are those that reflect the Fund's assumptions about the information market participants would use in pricing an investment. An investment's level within the fair value hierarchy is based on the lowest level of any input that is deemed significant to the asset or liability's fair value measurement. The input levels are not necessarily an indication of the risk or liquidity associated with investments at that level. For example, certain U.S. government securities are generally high quality and liquid, however, they are reflected as Level 2 because the inputs used to determine fair value may not always be quoted prices in an active market.
Fair value inputs are summarized in the three broad levels listed below:
• Level 1—Valuations based on quoted prices for investments in active markets that the Fund has the ability to access at the measurement date (including NAV for open-end mutual funds). Valuation adjustments are not applied to Level 1 investments.
• Level 2—Valuations based on other significant observable inputs (including quoted prices for similar securities, interest rates, prepayment speeds, credit risks, etc.).
• Level 3—Valuations based on significant unobservable inputs (including the Fund's own assumptions and judgment in determining the fair value of investments).
Inputs that are used in determining fair value of an investment may include price information, credit data, volatility statistics, and other factors. These inputs can be either observable or unobservable. The availability of observable inputs can vary between investments, and is affected by various factors such as the type of investment, and the volume and level of activity for that investment or similar investments in the marketplace. The inputs will be considered by the Investment Manager, along with any other relevant factors in the calculation of an investment's fair value. The Fund uses prices and inputs that are current as of the measurement date, which may include periods of market dislocations. During these periods, the availability of prices and inputs
may be reduced for many investments. This condition could cause an investment to be reclassified between the various levels within the hierarchy. Non-U.S. equity securities actively traded in foreign markets may be reflected in Level 2 despite the availability of closing prices, because the Fund evaluates and determines whether those closing prices reflect fair value at the close of the New York Stock Exchange (NYSE) or require adjustment, as described in Note 2 to the financial statements – Security Valuation.
Investments falling into the Level 3 category are primarily supported by quoted prices from brokers and dealers participating in the market for those investments. However, these may be classified as Level 3 investments due to lack of market transparency and corroboration to support these quoted prices. Additionally, valuation models may be used as the pricing source for any remaining investments classified as Level 3. These models rely on one or more significant unobservable inputs and/or significant assumptions by the Investment Manager. Inputs used in valuations may include, but are not limited to, financial statement analysis, capital account balances, discount rates and estimated cash flows, and comparable company data.
The following table is a summary of the inputs used to value the Fund's investments as of February 28, 2011:
| Description | | Quoted Prices
(Level 1) | | Other
Significant
Observable
Inputs
(Level 2) | | Significant
Unobservable
Inputs
(Level 3) | | Total | |
| Total Common Stocks | | $ | 367,149,366 | | | $ | — | | | $ | — | | | $ | 367,149,366 | | |
Total Short-Term
Obligation | | | — | | | | 10,337,000 | | | | — | | | | 10,337,000 | | |
| Total Investments | | $ | 367,149,366 | | | $ | 10,337,000 | | | $ | — | | | $ | 377,486,366 | | |
The Fund's assets assigned to the Level 2 input category represent certain short-term obligations which are valued using amortized cost, an income approach which converts future cash flows to a present value based upon the discount or premium at purchase.
There were no significant transfers of financial assets between Levels 1 and 2 during the period.
At February 28, 2011, the Fund held investments in the following sectors:
| Sector (Unaudited) | | % of
Net Assets | |
| Information Technology | | | 27.9 | | |
| Consumer Discretionary | | | 18.6 | | |
| Health Care | | | 16.2 | | |
| Industrials | | | 14.8 | | |
| Energy | | | 7.8 | | |
| Materials | | | 6.0 | | |
| Financials | | | 5.8 | | |
| Consumer Staples | | | 2.1 | | |
| | | | 99.2 | | |
| Short- Term Obligation | | | 2.8 | | |
| Other Assets & Liabilities, Net | | | (2.0 | ) | |
| | | | 100.0 | | |
| Acronym | | Name | |
| ADR | | American Depositary Receipt | |
|
See Accompanying Notes to Financial Statements.
11
Statement of Assets and Liabilities – Columbia Small Cap Growth Fund II
February 28, 2011
| | | | | ($) | |
| Assets | | Investments, at identified cost | | | 294,148,142 | | |
| | | Investments, at value | | | 377,486,366 | | |
| | | Cash | | | 275,431 | | |
| | | Receivable for: | | | | | |
| | | Investments sold | | | 2,887,699 | | |
| | | Fund shares sold | | | 66,016 | | |
| | | Dividends | | | 9,674 | | |
| | | Interest | | | 23 | | |
| | | Trustees' deferred compensation plan | | | 23,585 | | |
| | | Prepaid expenses | | | 1,337 | | |
| | | Total Assets | | | 380,750,131 | | |
| Liabilities | | Expense reimbursement due to Investment Manager | | | 14,911 | | |
| | | Payable for: | | | |
| | | Investments purchased | | | 9,820,828 | | |
| | | Fund shares repurchased | | | 340,148 | | |
| | | Investment advisory fee | | | 200,405 | | |
| | | Administration fee | | | 26,125 | | |
| | | Pricing and bookkeeping fees | | | 7,767 | | |
| | | Transfer agent fee | | | 109,183 | | |
| | | Trustees' fees | | | 65,059 | | |
| | | Custody fee | | | 12,602 | | |
| | | Distribution and service fees | | | 31,750 | | |
| | | Chief compliance officer expenses | | | 197 | | |
| | | Reports to shareholders | | | 67,163 | | |
| | | Trustees' deferred compensation plan | | | 23,585 | | |
| | | Other liabilities | | | 73,371 | | |
| | | Total Liabilities | | | 10,793,094 | | |
| | | Net Assets | | | 369,957,037 | | |
| Net Assets Consist of | | Paid-in capital | | | 361,738,562 | | |
| | | Accumulated net realized loss | | | (75,119,749 | ) | |
| | | Net unrealized appreciation on investments | | | 83,338,224 | | |
| | | Net Assets | | | 369,957,037 | | |
See Accompanying Notes to Financial Statements.
12
Statement of Assets and Liabilities (continued) – Columbia Small Cap Growth Fund II
February 28, 2011
| Class A | | Net assets | | $ | 145,802,282 | | |
| | | Shares outstanding | | | 11,977,935 | | |
| | | Net asset value per share | | $ | 12.17 | (a) | |
| | | Maximum sales charge | | | 5.75 | % | |
| | | Maximum offering price per share ($12.17/0.9425) | | $ | 12.91 | (b) | |
| Class B | | Net assets | | $ | 2,015,997 | | |
| | | Shares outstanding | | | 189,642 | | |
| | | Net asset value and offering price per share | | $ | 10.63 | (a) | |
| Class C | | Net assets | | $ | 2,627,006 | | |
| | | Shares outstanding | | | 241,218 | | |
| | | Net asset value and offering price per share | | $ | 10.89 | (a) | |
| Class Z | | Net assets | | $ | 219,511,752 | | |
| | | Shares outstanding | | | 17,173,331 | | |
| | | Net asset value, offering and redemption price per share | | $ | 12.78 | | |
(a) Redemption price per share is equal to net asset value less any applicable contingent deferred sales charge.
(b) On sales of $50,000 or more the offering price is reduced.
See Accompanying Notes to Financial Statements.
13
Statement of Operations – Columbia Small Cap Growth Fund II
For the Year Ended February 28, 2011
| | | | | ($) | |
| Investment Income | | Dividends | | | 1,109,545 | | |
| | | Interest | | | 5,777 | | |
| | | Total Investment Income | | | 1,115,322 | | |
| Expenses | | Investment advisory fee | | | 2,438,740 | | |
| | | Administration fee | | | 317,369 | | |
| | | Distribution fee: | | | | | |
| | | Class B | | | 18,323 | | |
| | | Class C | | | 18,565 | | |
| | | Service fee: | | | | | |
| | | Class B | | | 6,118 | | |
| | | Class C | | | 6,188 | | |
| | | Distribution and service fees: | | | | | |
| | | Class A | | | 322,868 | | |
| | | Transfer agent fee | | | 498,642 | | |
| | | Pricing and bookkeeping fees | | | 92,313 | | |
| | | Trustees' fees | | | 37,434 | | |
| | | Custody fee | | | 35,248 | | |
| | | Chief compliance officer expenses | | | 1,329 | | |
| | | Other expenses | | | 310,791 | | |
| | | Expenses before interest expense | | | 4,103,928 | | |
| | | Interest expense | | | 713 | | |
| | | Total Expenses | | | 4,104,641 | | |
| | | Expense reductions | | | (53 | ) | |
| | | Net Expenses | | | 4,104,588 | | |
| | | Net Investment Loss | | | (2,989,266 | ) | |
Net Realized and Unrealized
Gain (Loss) on Investments
and Foreign Currency | | Net realized gain (loss) on: | | | | | |
| | | Investments | | | 60,578,474 | | |
| | | Foreign currency transactions | | | (445 | ) | |
| | | Net realized gain | | | 60,578,029 | | |
| | | Net change in unrealized appreciation (depreciation) on investments | | | 51,745,305 | | |
| | | Net Gain | | | 112,323,334 | | |
| | | Net Increase Resulting from Operations | | | 109,334,068 | | |
See Accompanying Notes to Financial Statements.
14
Statement of Changes in Net Assets – Columbia Small Cap Growth Fund II
| | | | | Year Ended February 28, | |
| Increase (Decrease) in Net Assets | | | | 2011 ($) | | 2010 ($) | |
| Operations | | Net investment loss | | | (2,989,266 | ) | | | (2,503,043 | ) | |
| | | Net realized gain (loss) on investments and
foreign currency transactions | | | 60,578,029 | | | | (13,937,128 | ) | |
| | | Net change in unrealized appreciation
(depreciation) on investments | | | 51,745,305 | | | | 135,495,875 | | |
| | | Net increase resulting from operations | | | 109,334,068 | | | | 119,055,704 | | |
| | | Net Capital Stock Transactions | | | (79,890,367 | ) | | | (18,764,168 | ) | |
| | | Increase from regulatory settlements | | | 76,427 | | | | 543,481 | | |
| | | Total increase in net assets | | | 29,520,128 | | | | 100,835,017 | | |
| Net Assets | | Beginning of period | | | 340,436,909 | | | | 239,601,892 | | |
| | | End of period | | | 369,957,037 | | | | 340,436,909 | | |
| | | Accumulated net investment loss at end of period | | | — | | | | (12,156 | ) | |
See Accompanying Notes to Financial Statements.
15
Statement of Changes in Net Assets (continued) – Columbia Small Cap Growth Fund II
| | | Capital Stock Activity | |
| | | Year Ended
February 28, 2011 | | Year Ended
February 28, 2010 | |
| | | Shares | | Dollars ($) | | Shares | | Dollars ($) | |
| Class A | |
| Subscriptions | | | 501,743 | | | | 5,160,391 | | | | 1,205,033 | | | | 9,556,394 | | |
| Redemptions | | | (1,967,790 | ) | | | (20,070,759 | ) | | | (2,904,474 | ) | | | (24,025,684 | ) | |
| Net decrease | | | (1,466,047 | ) | | | (14,910,368 | ) | | | (1,699,441 | ) | | | (14,469,290 | ) | |
| Class B | |
| Subscriptions | | | 2,064 | | | | 18,422 | | | | 9,581 | | | | 65,844 | | |
| Redemptions | | | (237,996 | ) | | | (2,096,092 | ) | | | (217,514 | ) | | | (1,528,227 | ) | |
| Net decrease | | | (235,932 | ) | | | (2,077,670 | ) | | | (207,933 | ) | | | (1,462,383 | ) | |
| Class C | |
| Subscriptions | | | 21,187 | | | | 198,146 | | | | 51,092 | | | | 361,405 | | |
| Redemptions | | | (106,855 | ) | | | (954,620 | ) | | | (106,951 | ) | | | (762,336 | ) | |
| Net decrease | | | (85,668 | ) | | | (756,474 | ) | | | (55,859 | ) | | | (400,931 | ) | |
| Class Z | |
| Subscriptions | | | 1,643,660 | | | | 17,140,701 | | | | 6,693,775 | | | | 54,630,116 | | |
| Redemptions | | | (7,440,236 | ) | | | (79,286,556 | ) | | | (6,668,451 | ) | | | (57,061,680 | ) | |
| Net increase (decrease) | | | (5,796,576 | ) | | | (62,145,855 | ) | | | 25,324 | | | | (2,431,564 | ) | |
See Accompanying Notes to Financial Statements.
16
Financial Highlights – Columbia Small Cap Growth Fund II
Selected data for a share outstanding throughout each period is as follows:
| | | Year Ended February 28, | | Period Ended
February 29, | | Year Ended March 31, | |
| Class A Shares | | 2011 | | 2010 | | 2009 | | 2008 (a)(b)(c) | | 2007 (a) | | 2006 (a)(d) | |
| Net Asset Value, Beginning of Period | | $ | 8.92 | | | $ | 5.99 | | | $ | 10.57 | | | $ | 13.79 | | | $ | 17.56 | | | $ | 15.06 | | |
| Income from Investment Operations: | |
| Net investment loss (e) | | | (0.10 | ) | | | (0.07 | ) | | | (0.07 | ) | | | (0.10 | ) | | | (0.12 | ) | | | (0.13 | ) | |
Net realized and unrealized gain
(loss) on investments, foreign currency
and written options | | | 3.35 | | | | 2.99 | | | | (4.51 | ) | | | (0.41 | ) | | | (0.24 | )(f) | | | 4.51 | | |
| Total from investment operations | | | 3.25 | | | | 2.92 | | | | (4.58 | ) | | | (0.51 | ) | | | (0.36 | ) | | | 4.38 | | |
| Less Distributions to Shareholders: | |
| From net realized gains | | | — | | | | — | | | | — | | | | (2.69 | ) | | | (3.41 | ) | | | (1.88 | ) | |
| From return of capital | | | — | | | | — | | | | — | | | | (0.02 | ) | | | — | | | | — | | |
| Total distributions to shareholders | | | — | | | | — | | | | — | | | | (2.71 | ) | | | (3.41 | ) | | | (1.88 | ) | |
| Increase from regulatory settlements | | | — | (g) | | | 0.01 | | | | — | | | | — | | | | — | | | | — | | |
| Net Asset Value, End of Period | | $ | 12.17 | | | $ | 8.92 | | | $ | 5.99 | | | $ | 10.57 | | | $ | 13.79 | | | $ | 17.56 | | |
| Total return (h) | | | 36.43 | % | | | 48.91 | %(i) | | | (43.33 | )%(i) | | | (6.45 | )%(i)(j) | | | (0.03 | )%(i) | | | 30.90 | %(i) | |
Ratios to Average Net Assets/
Supplemental Data: | |
| Net expenses before interest expense | | | 1.32 | %(k) | | | 1.36 | %(k) | | | 1.27 | %(k) | | | 1.20 | %(k)(l) | | | 1.23 | %(k) | | | 1.24 | % | |
| Interest expense | | | — | %(m) | | | — | %(m) | | | — | %(m) | | | — | %(l)(m) | | | — | | | | — | | |
| Net expenses | | | 1.32 | %(k) | | | 1.36 | %(k) | | | 1.27 | %(k) | | | 1.20 | %(k)(l) | | | 1.23 | %(k) | | | 1.24 | % | |
| Waiver/Reimbursement | | | — | | | | 0.01 | % | | | 0.05 | % | | | 0.04 | %(l) | | | 0.03 | % | | | 0.07 | %(n) | |
| Net investment loss | | | (1.00 | )%(k) | | | (0.90 | )%(k) | | | (0.80 | )%(k) | | | (0.85 | )%(k)(l) | | | (0.81 | )%(k) | | | (0.84 | )% | |
| Portfolio turnover rate | | | 147 | % | | | 105 | % | | | 130 | % | | | 3 | %(j)(o) | | | — | | | | — | | |
Turnover of Columbia Small Cap
Growth Master Portfolio | | | — | | | | — | | | | — | | | | 199 | %(j) | | | 188 | % | | | 117 | % | |
| Net assets, end of period (000s) | | $ | 145,802 | | | $ | 119,894 | | | $ | 90,647 | | | $ | 173,675 | | | $ | 207,258 | | | $ | 150,761 | | |
(a) The per share amounts and percentages reflect income and expenses assuming inclusion of the Fund's proportionate share of the income and expenses of Columbia Small Cap Growth Master Portfolio.
(b) The Fund changed its fiscal year end from March 31 to February 29. Per share data and total return reflect activity from April 1, 2007 through February 29, 2008.
(c) Effective February 28, 2008, the Fund converted to a stand-alone fund. Prior to February 28, 2008, the Fund operated in a master-feeder structure.
(d) On August 22, 2005, the Fund's Investor A shares were renamed Class A shares.
(e) Per share data was calculated using the average shares outstanding during the period.
(f) The amount shown for a share outstanding does not correspond with the aggregate net gain on investments for the year due to the timing of sales and repurchases of Fund shares in relation to fluctuating market values of the investments of the Columbia Small Cap Growth Master Portfolio.
(g) Rounds to less than $0.01 per share.
(h) Total return at net asset value assuming all distributions reinvested and no initial sales charge or contingent deferred sales charge.
(i) Had the Investment Manager and/or any of its affiliates not waived fees or reimbursed a portion of expenses, total return would have been reduced.
(j) Not annualized.
(k) The benefits derived from expense reductions had an impact of less than 0.01%.
(l) Annualized.
(m) Rounds to less than 0.01%.
(n) Bank of America Corporation assumed certain non-recurring costs. Absent these non-recurring costs, the waiver/reimbursement ratio would have been 0.01%.
(o) Amount represents results after the Fund's conversion to a stand-alone structure on February 28, 2008.
See Accompanying Notes to Financial Statements.
17
Financial Highlights – Columbia Small Cap Growth Fund II
Selected data for a share outstanding throughout each period is as follows:
| | | Year Ended February 28, | | Period Ended
February 29, | | Year Ended March 31, | |
| Class B Shares | | 2011 | | 2010 | | 2009 | | 2008 (a)(b)(c) | | 2007 (a) | | 2006 (a)(d) | |
| Net Asset Value, Beginning of Period | | $ | 7.85 | | | $ | 5.31 | | | $ | 9.44 | | | $ | 12.49 | | | $ | 16.21 | | | $ | 14.13 | | |
| Income from Investment Operations: | |
| Net investment loss (e) | | | (0.15 | ) | | | (0.12 | ) | | | (0.13 | ) | | | (0.13 | ) | | | (0.21 | ) | | | (0.24 | ) | |
Net realized and unrealized gain
(loss) on investments, foreign currency
and written options | | | 2.93 | | | | 2.65 | | | | (4.00 | ) | | | (0.40 | ) | | | (0.22 | )(f) | | | 4.20 | | |
| Total from investment operations | | | 2.78 | | | | 2.53 | | | | (4.13 | ) | | | (0.53 | ) | | | (0.43 | ) | | | 3.96 | | |
| Less Distributions to Shareholders: | |
| From net realized gains | | | — | | | | — | | | | — | | | | (2.50 | ) | | | (3.29 | ) | | | (1.88 | ) | |
| From return of capital | | | — | | | | — | | | | — | | | | (0.02 | ) | | | — | | | | — | | |
| Total distributions to shareholders | | | — | | | | — | | | | — | | | | (2.52 | ) | | | (3.29 | ) | | | (1.88 | ) | |
| Increase from regulatory settlements | | | — | (g) | | | 0.01 | | | | — | | | | — | | | | — | | | | — | | |
| Net Asset Value, End of Period | | $ | 10.63 | | | $ | 7.85 | | | $ | 5.31 | | | $ | 9.44 | | | $ | 12.49 | | | $ | 16.21 | | |
| Total return (h) | | | 35.41 | % | | | 47.83 | %(i) | | | (43.75 | )%(i) | | | (7.15 | )%(i)(j) | | | (0.69 | )%(i) | | | 29.92 | %(i) | |
Ratios to Average Net Assets/
Supplemental Data: | |
| Net expenses before interest expense | | | 2.07 | %(k) | | | 2.11 | %(k) | | | 2.02 | %(k) | | | 1.95 | %(k)(l) | | | 1.98 | %(k) | | | 1.99 | % | |
| Interest expense | | | — | %(m) | | | — | %(m) | | | — | %(m) | | | — | %(l)(m) | | | — | | | | — | | |
| Net expenses | | | 2.07 | %(k) | | | 2.11 | %(k) | | | 2.02 | %(k) | | | 1.95 | %(k)(l) | | | 1.98 | %(k) | | | 1.99 | % | |
| Waiver/Reimbursement | | | — | | | | 0.01 | % | | | 0.05 | % | | | 0.04 | %(l) | | | 0.03 | % | | | 0.07 | %(n) | |
| Net investment loss | | | (1.74 | )%(k) | | | (1.66 | )%(k) | | | (1.54 | )%(k) | | | (1.60 | )%(k)(l) | | | (1.58 | )%(k) | | | (1.59 | )% | |
| Portfolio turnover rate | | | 147 | % | | | 105 | % | | | 130 | % | | | 3 | %(j)(o) | | | — | | | | — | | |
Turnover of Columbia Small Cap
Growth Master Portfolio | | | — | | | | — | | | | — | | | | 199 | %(j) | | | 188 | % | | | 117 | % | |
| Net assets, end of period (000s) | | $ | 2,016 | | | $ | 3,340 | | | $ | 3,362 | | | $ | 9,184 | | | $ | 13,018 | | | $ | 16,229 | | |
(a) The per share amounts and percentages reflect income and expenses assuming inclusion of the Fund's proportionate share of the income and expenses of Columbia Small Cap Growth Master Portfolio.
(b) The Fund changed its fiscal year end from March 31 to February 29. Per share data and total return reflect activity from April 1, 2007 through February 29, 2008.
(c) Effective February 28, 2008, the Fund converted to a stand-alone fund. Prior to February 28, 2008, the Fund operated in a master-feeder structure.
(d) On August 22, 2005, the Fund's Investor B shares were renamed Class B shares.
(e) Per share data was calculated using the average shares outstanding during the period.
(f) The amount shown for a share outstanding does not correspond with the aggregate net gain on investments for the year due to the timing of sales and repurchases of Fund shares in relation to fluctuating market values of the investments of the Columbia Small Cap Growth Master Portfolio.
(g) Rounds to less than $0.01 per share.
(h) Total return at net asset value assuming all distributions reinvested and no contingent deferred sales charge.
(i) Had the Investment Manager and/or any of its affiliates not waived fees or reimbursed a portion of expenses, total return would have been reduced.
(j) Not annualized.
(k) The benefits derived from expense reductions had an impact of less than 0.01%.
(l) Annualized.
(m) Rounds to less than 0.01%.
(n) Bank of America Corporation assumed certain non-recurring costs. Absent these non-recurring costs, the waiver/reimbursement ratio would have been 0.01%.
(o) Amount represents results after the Fund's conversion to a stand-alone structure on February 28, 2008.
See Accompanying Notes to Financial Statements.
18
Financial Highlights – Columbia Small Cap Growth Fund II
Selected data for a share outstanding throughout each period is as follows:
| | | Year Ended February 28, | | Period Ended
February 29, | | Year Ended March 31, | |
| Class C Shares | | 2011 | | 2010 | | 2009 | | 2008 (a)(b)(c) | | 2007 (a) | | 2006 (a)(d) | |
| Net Asset Value, Beginning of Period | | $ | 8.04 | | | $ | 5.44 | | | $ | 9.67 | | | $ | 12.74 | | | $ | 16.47 | | | $ | 14.33 | | |
| Income from Investment Operations: | |
| Net investment loss (e) | | | (0.16 | ) | | | (0.12 | ) | | | (0.13 | ) | | | (0.17 | ) | | | (0.21 | ) | | | (0.24 | ) | |
Net realized and unrealized gain
(loss) on investments, foreign currency
and written options | | | 3.01 | | | | 2.71 | | | | (4.10 | ) | | | (0.38 | ) | | | (0.23 | )(f) | | | 4.26 | | |
| Total from investment operations | | | 2.85 | | | | 2.59 | | | | (4.23 | ) | | | (0.55 | ) | | | (0.44 | ) | | | 4.02 | | |
| Less Distributions to Shareholders: | |
| From net realized gains | | | — | | | | — | | | | — | | | | (2.50 | ) | | | (3.29 | ) | | | (1.88 | ) | |
| From return of capital | | | — | | | | — | | | | — | | | | (0.02 | ) | | | — | | | | — | | |
| Total distributions to shareholders | | | — | | | | — | | | | — | | | | (2.52 | ) | | | (3.29 | ) | | | (1.88 | ) | |
| Increase from regulatory settlements | | | — | (g) | | | 0.01 | | | | — | | | | — | | | | — | | | | — | | |
| Net Asset Value, End of Period | | $ | 10.89 | | | $ | 8.04 | | | $ | 5.44 | | | $ | 9.67 | | | $ | 12.74 | | | $ | 16.47 | | |
| Total return (h) | | | 35.45 | % | | | 47.79 | %(i) | | | (43.74 | )%(i) | | | (7.17 | )%(i)(j) | | | (0.74 | )%(i) | | | 29.93 | %(i) | |
Ratios to Average Net Assets/
Supplemental Data: | |
| Net expenses before interest expense | | | 2.07 | %(k) | | | 2.11 | %(k) | | | 2.02 | %(k) | | | 1.95 | %(k)(l) | | | 1.98 | %(k) | | | 1.99 | % | |
| Interest expense | | | — | %(m) | | | — | %(m) | | | — | %(m) | | | — | %(l)(m) | | | — | | | | — | | |
| Net expenses | | | 2.07 | %(k) | | | 2.11 | %(k) | | | 2.02 | %(k) | | | 1.95 | %(k)(l) | | | 1.98 | %(k) | | | 1.99 | % | |
| Waiver/Reimbursement | | | — | | | | 0.01 | % | | | 0.05 | % | | | 0.04 | %(l) | | | 0.03 | % | | | 0.07 | %(n) | |
| Net investment loss | | | (1.75 | )%(k) | | | (1.66 | )%(k) | | | (1.55 | )%(k) | | | (1.60 | )%(k)(l) | | | (1.57 | )%(k) | | | (1.59 | )% | |
| Portfolio turnover rate | | | 147 | % | | | 105 | % | | | 130 | % | | | 3 | %(j)(o) | | | — | | | | — | | |
Turnover of Columbia Small Cap
Growth Master Portfolio | | | — | | | | — | | | | — | | | | 199 | %(j) | | | 188 | % | | | 117 | % | |
| Net assets, end of period (000s) | | $ | 2,627 | | | $ | 2,629 | | | $ | 2,081 | | | $ | 3,689 | | | $ | 4,998 | | | $ | 4,452 | | |
(a) The per share amounts and percentages reflect income and expenses assuming inclusion of the Fund's proportionate share of the income and expenses of Columbia Small Cap Growth Master Portfolio.
(b) The Fund changed its fiscal year end from March 31 to February 29. Per share data and total return reflect activity from April 1, 2007 through February 29, 2008.
(c) Effective February 28, 2008, the Fund converted to a stand-alone fund. Prior to February 28, 2008, the Fund operated in a master-feeder structure.
(d) On August 22, 2005, the Fund's Investor C shares were renamed Class C shares.
(e) Per share data was calculated using the average shares outstanding during the period.
(f) The amount shown for a share outstanding does not correspond with the aggregate net gain on investments for the year due to the timing of sales and repurchases of Fund shares in relation to fluctuating market values of the investments of the Columbia Small Cap Growth Master Portfolio.
(g) Rounds to less than $0.01 per share.
(h) Total return at net asset value assuming all distributions reinvested and no contingent deferred sales charge.
(i) Had the Investment Manager and/or any of its affiliates not waived fees or reimbursed a portion of expenses, total return would have been reduced.
(j) Not annualized.
(k) The benefits derived from expense reductions had an impact of less than 0.01%.
(l) Annualized.
(m) Rounds to less than 0.01%.
(n) Bank of America Corporation assumed certain non-recurring costs. Absent these non-recurring costs, the waiver/reimbursement ratio would have been 0.01%.
(o) Amount represents results after the Fund's conversion to a stand-alone structure on February 28, 2008.
See Accompanying Notes to Financial Statements.
19
Financial Highlights – Columbia Small Cap Growth Fund II
Selected data for a share outstanding throughout each period is as follows:
| | | Year Ended February 28, | | Period Ended
February 29, | | Year Ended March 31, | |
| Class Z Shares | | 2011 | | 2010 | | 2009 | | 2008 (a)(b)(c) | | 2007 (a) | | 2006 (a)(d) | |
| Net Asset Value, Beginning of Period | | $ | 9.34 | | | $ | 6.25 | | | $ | 11.01 | | | $ | 14.30 | | | $ | 18.06 | | | $ | 15.40 | | |
| Income from Investment Operations: | |
| Net investment loss (e) | | | (0.08 | ) | | | (0.06 | ) | | | (0.05 | ) | | | (0.07 | ) | | | (0.08 | ) | | | (0.10 | ) | |
Net realized and unrealized gain
(loss) on investments, foreign currency
and written options | | | 3.52 | | | | 3.14 | | | | (4.71 | ) | | | (0.44 | ) | | | (0.23 | )(f) | | | 4.64 | | |
| Total from investment operations | | | 3.44 | | | | 3.08 | | | | (4.76 | ) | | | (0.51 | ) | | | (0.31 | ) | | | 4.54 | | |
| Less Distributions to Shareholders: | |
| From net realized gains | | | — | | | | — | | | | — | | | | (2.76 | ) | | | (3.45 | ) | | | (1.88 | ) | |
| From return of capital | | | — | | | | — | | | | — | | | | (0.02 | ) | | | — | | | | — | | |
| Total distributions to shareholders | | | — | | | | — | | | | — | | | | (2.78 | ) | | | (3.45 | ) | | | (1.88 | ) | |
| Increase from regulatory settlements | | | — | (g) | | | 0.01 | | | | — | | | | — | | | | — | | | | — | | |
| Net Asset Value, End of Period | | $ | 12.78 | | | $ | 9.34 | | | $ | 6.25 | | | $ | 11.01 | | | $ | 14.30 | | | $ | 18.06 | | |
| Total return (h) | | | 36.83 | % | | | 49.44 | %(i) | | | (43.23 | )%(i) | | | (6.31 | )%(i)(j) | | | 0.33 | %(i) | | | 31.26 | %(i) | |
Ratios to Average Net Assets/
Supplemental Data: | |
| Net expenses before interest expense | | | 1.07 | %(k) | | | 1.11 | %(k) | | | 1.02 | %(k) | | | 0.95 | %(k)(l) | | | 0.98 | %(k) | | | 0.99 | % | |
| Interest expense | | | — | %(m) | | | — | %(m) | | | — | %(m) | | | — | %(l)(m) | | | — | | | | — | | |
| Net expenses | | | 1.07 | %(k) | | | 1.11 | %(k) | | | 1.02 | %(k) | | | 0.95 | %(k)(l) | | | 0.98 | %(k) | | | 0.99 | % | |
| Waiver/Reimbursement | | | — | | | | 0.01 | % | | | 0.05 | % | | | 0.04 | %(l) | | | 0.03 | % | | | 0.07 | %(n) | |
| Net investment loss | | | (0.75 | )%(k) | | | (0.65 | )%(k) | | | (0.54 | )%(k) | | | (0.59 | )%(k)(l) | | | (0.56 | )%(k) | | | (0.59 | )% | |
| Portfolio turnover rate | | | 147 | % | | | 105 | % | | | 130 | % | | | 3 | %(j)(o) | | | — | | | | — | | |
Turnover of Columbia Small Cap
Growth Master Portfolio | | | — | | | | — | | | | — | | | | 199 | %(j) | | | 188 | % | | | 117 | % | |
| Net assets, end of period (000s) | | $ | 219,512 | | | $ | 214,574 | | | $ | 143,511 | | | $ | 279,900 | | | $ | 378,164 | | | $ | 308,930 | | |
(a) The per share amounts and percentages reflect income and expenses assuming inclusion of the Fund's proportionate share of the income and expenses of Columbia Small Cap Growth Master Portfolio.
(b) The Fund changed its fiscal year end from March 31 to February 29. Per share data and total return reflect activity from April 1, 2007 through February 29, 2008.
(c) Effective February 28, 2008, the Fund converted to a stand-alone fund. Prior to February 28, 2008, the Fund operated in a master-feeder structure.
(d) On August 22, 2005, the Fund's Investor Z shares were renamed Class Z shares.
(e) Per share data was calculated using the average shares outstanding during the period.
(f) The amount shown for a share outstanding does not correspond with the aggregate net gain on investments for the year due to the timing of sales and repurchases of Fund shares in relation to fluctuating market values of the investments of the Columbia Small Cap Growth Master Portfolio.
(g) Rounds to less than $0.01 per share.
(h) Total return at net asset value assuming all distributions reinvested.
(i) Had the Investment Manager and/or any of its affiliates not waived fees or reimbursed a portion of expenses, total return would have been reduced.
(j) Not annualized.
(k) The benefits derived from expense reductions had an impact of less than 0.01%.
(l) Annualized.
(m) Rounds to less than 0.01%.
(n) Bank of America Corporation assumed certain non-recurring costs. Absent these non-recurring costs, the waiver/reimbursement ratio would have been 0.01%.
(o) Amount represents results after the Fund's conversion to a stand-alone structure on February 28, 2008.
See Accompanying Notes to Financial Statements.
20
Notes to Financial Statements – Columbia Small Cap Growth Fund II
February 28, 2011
Note 1. Organization
Columbia Small Cap Growth Fund II (the Fund), a series of Columbia Funds Series Trust (the Trust), is a diversified fund. The Trust is registered under the Investment Company Act of 1940, as amended (the 1940 Act), as an open-end management investment company organized as a Delaware statutory trust.
After the close of business on April 30, 2010, Ameriprise Financial, Inc. (Ameriprise Financial) acquired a portion of the asset management business of Columbia Management Group, LLC (the Transaction), including the business of managing the Fund. In connection with the closing of the Transaction (the Closing), RiverSource Investments, LLC, a wholly owned subsidiary of Ameriprise Financial, became the investment manager of the Fund and changed its name to Columbia Management Investment Advisers, LLC (the Investment Manager).
Investment Objective
The Fund seeks long-term growth of capital.
Fund Shares
The Trust has unlimited authorized shares of beneficial interest. The Fund offers Class A, Class B, Class C and Class Z shares. All share classes have identical voting, dividend and liquidation rights. Each share class has its own expense structure and sales charges, as applicable.
Class A shares are subject to a maximum front-end sales charge of 5.75% based on the investment amount. Class A shares purchased without an initial sales charge in accounts aggregating $1 million to $50 million at the time of purchase are subject to a 1.00% contingent deferred sales charge (CDSC) if the shares are sold within 18 months of purchase, charged as follows: 1.00% CDSC if redeemed within 12 months of purchase, and 0.50% CDSC if redeemed more than 12, but less than 18 months after purchase.
The Fund no longer accepts investments by new or existing investors in the Fund's Class B shares, except in connection with the reinvestment of any dividend and/or capital gain distributions in Class B shares of the Fund and exchanges by existing Class B shareholders of other certain other funds within the Columbia Family of Funds. Class B shares may be subject to a maximum CDSC of 5.00% based upon the holding period after purchase. Class B shares will generally convert to Class A shares eight years after purchase.
Class C shares are subject to a 1.00% CDSC on shares redeemed within one year of purchase.
Class Z shares are not subject to sales charges and are available only to certain investors, as described in the Fund's prospectus.
Note 2. Summary of Significant Accounting Policies
The preparation of financial statements in accordance with U.S. generally accepted accounting principles (GAAP) requires the Investment Manager to make certain estimates and assumptions that affect the reported amounts of assets and liabilities, the disclosure of contingent assets and liabilities at the date of the financial statements and the reported amounts of revenue and expenses during the reporting period. Actual results could differ from those estimates.
The following is a summary of significant accounting policies consistently followed by the Fund in the preparation of its financial statements.
Security Valuation
Equity securities are valued at the last sale price on the principal exchange on which they trade, except for securities traded on the NASDAQ, which are valued at the NASDAQ official close price. Unlisted securities or listed securities for which there were no sales during the day are valued at the closing bid price on such exchanges or over-the-counter markets.
Short-term investments maturing in 60 days or less are valued at amortized cost, which approximates market value.
Purchased options are valued at the last reported sale price, or in the absence of a sale, at the last quoted bid price.
Investments for which market quotations are not readily available, or that have quotations which the Investment Manager believes are not reliable, are valued at fair value as determined in good faith under consistently applied procedures established by and under the general supervision of the Board of Trustees. If a security is valued at fair value, such value is likely to be different from the last quoted market price for the security. The determination of fair value often requires significant judgment. To determine fair value, the Investment Manager may use assumptions including but not limited to future cash flows and estimated risk premiums. Multiple inputs from various sources may be used to determine value.
Derivative Instruments
The Fund may use derivative instruments including options in order to meet its investment objectives. The Fund employs strategies in differing combinations to permit it to increase, decrease or change
21
Columbia Small Cap Growth Fund II, February 28, 2011
the level of exposure to market risk factors. The achievement of any strategy relating to derivatives depends on an analysis of various risk factors, and if the strategies for the use of derivatives do not work as intended, the Fund may not achieve its investment objectives.
In pursuit of its investment objectives, the Fund is exposed to the following market risks, among others:
Equity Risk: Equity risk relates to change in value of equity securities such as common stocks due to general market conditions such as real or perceived adverse economic conditions, changes in the general outlook for corporate earnings, or adverse investor sentiment. Equity securities generally have greater price volatility than fixed income securities.
The following provides more detailed information about the derivative type held by the Fund:
Options—The Fund had purchased put options to decrease the Fund's exposure to equity risk and to increase return on underlying instruments. Purchased put options become more profitable as the price of the underlying instruments depreciates relative to the strike price. The Fund may purchase put and call options. Purchasing call options tends to increase the Fund's exposure to the underlying instrument. Purchasing put options tends to decrease the Fund's exposure to the underlying instrument. The Fund may pay a premium, which is included in the Fund's Statement of Assets and Liabilities as an investment and subsequently marked-to-market to reflect the current value of the option. The risk associated with purchasing put and call options is limited to the premium paid. Premiums paid for purchasing options which expire are treated as realized losses. Premiums paid for purchasing options which are exercised are added to the amounts paid (call) or offset against the proceeds (put) on the underlying security to determine the realized gain or loss. If the Fund enters into a closing transaction, the Fund will realize a gain or loss, depending on whether the proceeds from the closing transaction are greater or less than the cost of the option.
During the year ended February 28, 2011, the Fund entered into 1,446 purchased put options contracts.
The effect of derivative instruments on the Fund's Statement of Operations for the year ended February 28, 2011:
| | | Amount of Realized Gain or (Loss)
and Change in Unrealized Appreciation or
(Depreciation) on Derivatives Recognized in Income | |
| | | Risk Exposure | | Net Realized
Gain (Loss) | | Change in
Unrealized
Appreciation
(Depreciation) | |
| Purchased Put Options | | Equity Risk | | $ | — | | | $ | — | | |
Repurchase Agreements
The Fund may engage in repurchase agreement transactions with institutions that the Investment Manager has determined are creditworthy. The Fund, through the custodian, receives delivery of the underlying securities collateralizing a repurchase agreement. The Investment Manager is responsible for determining that the collateral is at least equal, at all times, to the value of the repurchase obligation including interest. A repurchase agreement transaction involves certain risks in the event of default or insolvency of the counterparty. These risks include possible delays in or restrictions on the Fund's ability to dispose of the underlying securities and a possible decline in the value of the underlying securities during the period while the Fund seeks to assert its rights.
Security Transactions
Security transactions are accounted for on the trade date. Cost is determined and gains (losses) are based upon the specific identification method for both financial statement and federal income tax purposes.
Income Recognition
Interest income is recorded on the accrual basis.
Awards from class action litigation are recorded as a reduction of cost if the Fund still owns the applicable securities on the payment date. If the Fund no longer owns the applicable securities, the proceeds are recorded as realized gains.
22
Columbia Small Cap Growth Fund II, February 28, 2011
Corporate actions and dividend income are recorded on the ex-date.
The Fund receives information regarding the character of distributions received from real estate investment trusts (REITs) on an annual basis. Distributions received from REITs are allocated among dividend income, capital gain and return of capital based upon such information or based on management's estimates if actual information has not yet been reported. Management's estimates are subsequently adjusted when the actual character of the distributions are disclosed by the REITs which could result in a proportionate increase in returns of capital to shareholders.
Distributions received from REITs in excess of their income are recorded as a reduction of the cost of the related investments. If the Fund no longer owns the applicable securities, any distributions received in excess of income are recorded as realized gains.
Expenses
General expenses of the Trust are allocated to the Fund and other series of the Trust based upon relative net assets or other expense allocation methodologies determined by the nature of the expense. Expenses directly attributable to a specific class of shares are charged to that share class. Expenses directly attributable to the Fund are charged to the Fund.
Determination of Class Net Asset Value
All income, expenses (other than class-specific expenses which are charged directly to a share class, as shown in the Statement of Operations) and realized and unrealized gains (losses) are allocated to each class of the Fund on a daily basis for purposes of determining the net asset value of each class. Income and expenses are allocated to each class based on the settled shares method, while realized and unrealized gains (losses) are allocated based on the relative net assets of each class.
Federal Income Tax Status
The Fund intends to qualify each year as a regulated investment company under Subchapter M of the Internal Revenue Code, as amended, and will distribute substantially all of its taxable income, if any, for its tax year, and as such will not be subject to federal income taxes. In addition, the Fund intends to distribute in each calendar year substantially all of its net investment income, capital gains and certain other amounts, if any, such that the Fund should not be subject to federal excise tax. Therefore, no federal income or excise tax provision is recorded.
Distributions to Shareholders
Distributions from net investment income, if any, are declared and paid annually. The Fund may, however, declare and pay distributions from net investment income more frequently. The Fund will distribute net realized capital gains (including net short-term capital gains) at least annually after the fiscal year in which the capital gains were earned, unless offset by any available capital loss carryforward. Income distributions and capital gain distributions are determined in accordance with federal income tax regulations which may differ from GAAP.
Indemnification
In the normal course of business, the Fund enters into contracts that contain a variety of representations and warranties and which provide general indemnities. The Fund's maximum exposure under these arrangements is unknown because this would involve future claims against the Fund. Also, under the Trust's organizational documents and by contract, the Trustees and officers of the Trust are indemnified against certain liabilities that may arise out of actions relating to their duties to the Trust. However, based on experience, the Fund expects the risk of loss due to these representations, warranties and indemnities to be minimal.
Note 3. Fees and Compensation Paid to Affiliates
Investment Management Services Fee
The Investment Manager determines which securities will be purchased, held or sold. The management fee is based on the Fund's average daily net assets at the following annual rates:
| Average Daily Net Assets | | Annual
Fee Rate | |
| First $500 million | | | 0.70 | % | |
| $500 million to $1 billion | | | 0.65 | % | |
| Over $1 billion | | | 0.60 | % | |
Prior to the Closing, Columbia Management Advisors, LLC (Columbia), an indirect, wholly owned subsidiary of Bank of America Corporation (BOA), provided investment management services to the Fund under the same fee structure.
The effective management fee rate for the year ended February 28, 2011, was 0.70% of the Fund's average daily net assets.
23
Columbia Small Cap Growth Fund II, February 28, 2011
Administration Fee
Effective upon the Closing, the Investment Manager became the administrator of the Fund and provides administrative and other services to the Fund, including services previously performed under the Pricing and Bookkeeping Oversight and Services Agreement discussed below. The administration fee is based on the annual rate of 0.117% of the Fund's average daily net assets, less the fees payable by the Fund as described under the Pricing and Bookkeeping Fees note below. Prior to the Closing, Columbia provided administrative services to the Fund at the same fee rate.
Pricing and Bookkeeping Fees
Prior to the Closing, the Fund entered into a Financial Reporting Services Agreement (the Financial Reporting Services Agreement) with State Street Bank and Trust Company (State Street) and Columbia pursuant to which State Street provides financial reporting services to the Fund. The Fund also entered into an Accounting Services Agreement (collectively with the Financial Reporting Services Agreement, the State Street Agreements) with State Street and Columbia pursuant to which State Street provides accounting services to the Fund. Upon the Closing, Columbia assigned and delegated its rights and obligations under the State Street Agreements to the Investment Manager. Under the State Street Agreements, the Fund pays State Street an annual fee of $38,000 paid monthly plus an additional monthly fee based on an annualized percentage rate of average daily net assets of the Fund for the month. The aggregate fee will not exceed $140,000 per year (exclusive of out-of-pocket expenses and charges). The Fund also reimburses State Street for certain out-of-pocket expenses and charges.
Also prior to the Closing, the Fund entered into a Pricing and Bookkeeping Oversight and Services Agreement (the Services Agreement) with Columbia. Under the Services Agreement, Columbia provided services related to Fund expenses and the requirements of the Sarbanes-Oxley Act of 2002, and provided oversight of the accounting and financial reporting services provided by State Street. Under the Services Agreement, the Fund reimbursed Columbia for out-of-pocket expenses and charges, including fees payable to third parties, such as for pricing the Fund's portfolio securities, incurred by Columbia in the performance of services under the Services Agreement. The Services Agreement was terminated upon the Closing. These services are now provided under the Administration Fee note discussed above.
Transfer Agent Fee
In connection with the Closing, RiverSource Service Corporation, a wholly owned subsidiary of Ameriprise Financial, became the transfer agent of the Fund and changed its name to Columbia Management Investment Services Corp. (the New Transfer Agent). The New Transfer Agent has contracted with Boston Financial Data Services (BFDS) to serve as sub-transfer agent. The New Transfer Agent receives monthly account-based service fees based on the number of open accounts and asset-based fees, calculated based on assets held in omnibus accounts, which are intended to reimburse the New Transfer Agent for certain sub-transfer agent fees (exclusive of BFDS fees). The New Transfer Agent pays the fees of BFDS for services as sub-transfer agent and is not entitled to reimbursement for such fees from the Fund.
The New Transfer Agent receives reimbursement for certain out-of-pocket expenses and may also receive compensation for various shareholder services.
Prior to the Closing, Columbia Management Services, Inc., an affiliate of Columbia and an indirect, wholly owned subsidiary of BOA, provided shareholder services to the Fund and contracted with BFDS to serve as sub-transfer agent, under the same fee structure.
For the year ended February 28, 2011, the Fund's effective transfer agent fee rate for each class was 0.14% of the Fund's average daily net assets.
An annual minimum account balance fee of $20 may apply to certain accounts with a value below the Fund's initial minimum investment requirements to reduce the impact of small accounts on transfer agent fees. These minimum account balance fees are recorded as part of expense reductions on the Statement of Operations. For the year ended February 28, 2011, no minimum account balance fees were charged by the Fund.
Underwriting Discounts, Service and Distribution Fees
In connection with the Closing, RiverSource Fund Distributors, Inc., an indirect wholly owned subsidiary of Ameriprise Financial, became the distributor of the Fund and changed its name to Columbia Management Investment Distributors, Inc. (the New Distributor).
For the year ended February 28, 2011, initial sales charges paid by shareholders on the purchase of Class A shares amounted to $2,632 and net CDSC fees paid by shareholders on certain redemptions of
24
Columbia Small Cap Growth Fund II, February 28, 2011
Class B and Class C shares amounted to $2,255 and $663, respectively.
The Trust has adopted shareholder servicing plans and distribution plans for the Class B and Class C shares of the Fund and a combined distribution and shareholder servicing plan for the Class A shares of the Fund. The shareholder servicing plans permit the Fund to compensate or reimburse servicing agents for the shareholder services they have provided. The distribution plans, adopted pursuant to Rule 12b-1 under the 1940 Act, permit the Fund to compensate or reimburse the New Distributor and/or selling agents for activities or expenses primarily intended to result in the sale of the classes' shares. Payments are made at an annual rate and paid monthly, as a percentage of average daily net assets, set from time to time by the Board of Trustees, and are charged as expenses of the Fund directly to the applicable share class. A substantial portion of the expenses incurred pursuant to these plans is paid to affiliates of the New Distributor.
The annual rates in effect and plan limits, as a percentage of average daily net assets are as follows:
| | | Current
Rate | | Plan
Limit | |
Class A Combined Distribution
and Shareholder Servicing Plan | | 0.25% | | 0.25% | |
Class B and Class C Shareholder
Servicing Plans | | 0.25% | | 0.25% | |
Class B and Class C
Distribution Plans | | 0.75% | | 0.75% | |
Prior to the Closing, Columbia Management Distributors, Inc, an affiliate of Columbia and an indirect, wholly owned subsidiary of BOA, was the principal underwriter of the Fund's shares. There were no changes to the underwriting discount structure of the Fund or the service or distribution fee rates paid by the Fund as a result of the Transaction.
Expense Limits and Fee Waivers
Effective May 1, 2010, the Investment Manager has voluntarily agreed to reimburse a portion of the Fund's expenses so that the Fund's ordinary operating expenses (excluding any distribution and service fees, brokerage commissions, interest, taxes and extraordinary expenses, but including custodian charges relating to overdrafts, if any) after giving effect to any balance credits from the Fund's custodian, do not exceed the annual rate of 1.10% of the Fund's average daily net assets. This arrangement may be modified or terminated by the Investment Manager at any time. Prior to May 1, 2010, Columbia voluntarily reimbursed a portion of the Fund's expenses in the same manner.
The Investment Manager is entitled to recover from the Fund any fees waived and/or expenses reimbursed for a three year period following the date of such fee waiver and/or reimbursement if such recovery does not cause the Fund's expenses to exceed the expense limitations in effect at the time of recovery. At February 28, 2011, no amounts were potentially recoverable from the Fund pursuant to this arrangement. Prior to May 1, 2010, Columbia was entitled to recover fees waived and/or expenses reimbursed from the Fund in the same manner.
Fees Paid to Officers and Trustees
In connection with the Closing, all officers of the Fund are employees of the Investment Manager or its affiliates and, with the exception of the Fund's Chief Compliance Officer, receive no compensation from the Fund. The Board of Trustees has appointed a Chief Compliance Officer to the Fund in accordance with federal securities regulations. The Fund, along with other affiliated funds, pays its pro-rata share of the expenses associated with the Chief Compliance Officer. The Fund's expenses for the Chief Compliance Officer will not exceed $15,000 per year. Prior to the Closing, all officers of the Fund were employees of Columbia or its affiliates and the Fund paid its pro-rata share of the expenses for the Chief Compliance Officer under the same fee structure.
Trustees are compensated for their services to the Fund, as set forth on the Statement of Operations. The Trust's eligible Trustees may participate in a non-qualified deferred compensation plan which may be terminated at any time. Any payments to plan participants are paid solely out of the Fund's assets. Income earned on the plan participant's deferral account is based on the rate of return of the eligible mutual funds selected by the participant or, if no funds are selected, on the rate of return of Columbia Money Market Fund (formerly known as RiverSource Cash Management Fund). Prior to the Closing, if no funds were selected, income earned on the plan participant's deferral account was based on the rate of return of BofA Treasury Reserves. Trustees' fees deferred during the current period as well as any gains or losses on the trustees' deferred compensation balances as a result of market fluctuations are included in "Trustees' fees" on the Statement of Operations.
25
Columbia Small Cap Growth Fund II, February 28, 2011
Liabilities under the deferred compensation plan are included in "Trustees' fees" on the Statement of Assets and Liabilities.
As a result of a fund merger, the Fund assumed the liabilities of the deferred compensation plan of the acquired fund, which are included in "Trustees' fees" on the Statement of Assets and Liabilities. The deferred compensation plan may be terminated at any time. Any payments to plan participants are paid solely out of the Fund's assets.
Note 4. Custody Credits
The Fund has an agreement with its custodian bank under which custody fees may be reduced by balance credits. These credits are recorded as part of expense reductions on the Statement of Operations. The Fund could have invested a portion of the assets utilized in connection with the expense offset arrangement in an income-producing asset if it had not entered into such an agreement. For the year ended February 28, 2011, these custody credits reduced total expenses by $53 for the Fund.
Note 5. Portfolio Information
The cost of purchases and proceeds from sales of securities, excluding short-term obligations, aggregated $501,401,718 and $578,903,220, respectively, for the year ended February 28, 2011.
Note 6. Regulatory Settlements
During the year ended February 28, 2011, and the year ended February 28, 2010, the Fund received payments totaling $76,427 and $543,481, respectively, resulting from certain regulatory settlements in which the Fund had participated during the respective periods. The payments have been included in "Increase from regulatory settlements" in the Statement of Changes in Net Assets.
Note 7. Shareholder Concentration
As of February 28, 2011, two shareholder accounts owned 43.5% of the outstanding shares of the Fund. Purchase and redemption activity of these accounts may have a significant effect on the operations of the Fund.
Note 8. Line of Credit
The Fund and other affiliated funds participate in a $280,000,000 committed, unsecured revolving line of credit provided by State Street. The maximum amount that may be borrowed by any fund is limited to the lesser of $200,000,000 and the Fund's borrowing limit set forth in the Fund's registration statement. Borrowings are available for short-term liquidity or temporary or emergency purposes.
Effective October 14, 2010, interest is charged to each participating fund based on the fund's borrowings at a rate per annum equal to the greater of the Federal Funds Rate plus 1.25% or the overnight LIBOR Rate plus 1.25%. In addition, a commitment fee of 0.125% per annum is accrued and apportioned among the participating funds pro rata based on their relative net assets.
Prior to October 14, 2010, interest was charged to each participating fund at the same rates. In addition, a commitment fee of 0.15% per annum was accrued and apportioned among the participating funds pro rata based on their relative net assets.
For the year ended February 28, 2011, the average daily loan balance outstanding on days where borrowing existed was $2,457,143 at a weighted average interest rate of 1.49%.
Note 9. Federal Tax Information
The timing and character of income and capital gain distributions are determined in accordance with income tax regulations, which may differ from GAAP. Reclassifications are made to the Fund's capital accounts for permanent tax differences to reflect income and gains available for distribution (or available capital loss carryforwards) under income tax regulations.
For the year ended February 28, 2011, permanent book and tax basis differences resulting primarily from differing treatments for net operating losses, foreign currency transactions, passive foreign investment company (PFIC) adjustments and proceeds received from litigation settlements were identified and reclassified among the components of the Fund's net assets as follows:
Accumulated Net
Investment Loss | | Accumulated
Net Realized Loss | | Paid-In Capital | |
| $ | 3,001,422 | | | $ | (313,059 | ) | | $ | (2,688,363 | ) | |
Net investment income and net realized gains (losses), as disclosed on the Statement of Operations, and net assets were not affected by this reclassification.
26
Columbia Small Cap Growth Fund II, February 28, 2011
As of February 28, 2011, the components of distributable earnings on a tax basis were as follows:
Undistributed
Ordinary
Income | | Undistributed
Long-Term
Capital Gains | | Net Unrealized
Appreciation* | |
| $ | — | | | $ | — | | | $ | 82,636,086 | | |
* The differences between book-basis and tax-basis net unrealized appreciation are primarily due to deferral of losses from wash sales.
Unrealized appreciation and depreciation at February 28, 2011, based on cost of investments for federal income tax purposes were:
| Unrealized appreciation | | $ | 87,361,556 | | |
| Unrealized depreciation | | | (4,725,470 | ) | |
| Net unrealized appreciation | | $ | 82,636,086 | | |
The following capital loss carryforwards may be available to reduce taxable income arising from future net realized gains on investments, if any, to the extent permitted by the Internal Revenue Code:
| Year of Expiration | | Capital Loss
Carryforwards | |
| | 2017 | | | $ | 4,534,789 | | |
| | 2018 | | | | 69,882,820 | | |
| Total | | $ | 74,417,609 | | |
Capital loss carryforwards of $56,099,779 were utilized during the year ended February 28, 2011.
Management is required to determine whether a tax position of the Fund is more likely than not to be sustained upon examination by the applicable taxing authority, including resolution of any related appeals or litigation processes, based on the technical merits of the position. The tax benefit to be recognized by the Fund is measured as the largest amount of benefit that is greater than fifty percent likely of being realized upon ultimate settlement. Management is not aware of any tax positions for which it is reasonably possible that the total amounts of unrecognized tax benefits will significantly change in the next twelve months. However, management's conclusions may be subject to review and adjustment at a later date based on factors including, but not limited to, new tax laws, regulations, and administrative interpretations (including relevant court decisions). The Fund's federal tax returns for the prior three fiscal years remain subject to examination by the Internal Revenue Service.
Note 10. Subsequent Events
Management has evaluated the events and transactions that have occurred through the date the financial statements were issued and noted no items requiring adjustment of the financial statements or additional disclosure.
Note 11. Information Regarding Pending and Settled Legal Proceedings
In June 2004, an action captioned John E. Gallus et al. v. American Express Financial Corp. and American Express Financial Advisors Inc. was filed in the United States District Court for the District of Arizona. The plaintiffs allege that they are investors in several American Express Company (now known as RiverSource) mutual funds and they purport to bring the action derivatively on behalf of those funds under the Investment Company Act of 1940. The plaintiffs allege that fees allegedly paid to the defendants by the funds for investment advisory and administrative services are excessive. The plaintiffs seek remedies including restitution and rescission of investment advisory and distribution agreements. The plaintiffs voluntarily agreed to transfer this case to the United States District Court for the District of Minnesota (the District Court). In response to defendants' motion to dismiss the complaint, the District Court dismissed one of plaintiffs' four claims and granted plaintiffs limited discovery. Defendants moved for summary judgment in April 2007. Summary judgment was granted in the defendants' favor on July 9, 2007. The plaintiffs filed a notice of appeal with the Eighth Circuit Court of Appeals (the Eighth Circuit) on August 8, 2007. On April 8, 2009, the Eighth Circuit reversed summary judgment and remanded to the District Court for further proceedings. On August 6, 2009, defendants filed a writ of certiorari with the U.S. Supreme Court (the Supreme Court), asking the Supreme Court to stay the District Court proceedings while the Supreme Court considers and rules in a case captioned Jones v. Harris Associates, which involves issues of law similar to those presented in the Gallus case. On March 30, 2010, the Supreme Court issued its ruling in Jones v. Harris Associates, and on April 5, 2010, the Supreme Court vacated the Eighth Circuit's decision in the Gallus case and remanded the case to the Eighth Circuit for further consideration in light of the Supreme Court's decision in Jones v.
27
Columbia Small Cap Growth Fund II, February 28, 2011
Harris Associates. On June 4, 2010, the Eighth Circuit remanded the Gallus case to the District Court for further consideration in light of the Supreme Court's decision in Jones v. Harris Associates. On December 9, 2010, the District Court reinstated its July 9, 2007 summary judgment order in favor of the defendants. On January 10, 2011, plaintiffs filed a notice of appeal with the Eighth Circuit.
In December 2005, without admitting or denying the allegations, American Express Financial Corporation (AEFC, which is now known as Ameriprise Financial, Inc. (Ameriprise Financial)), entered into settlement agreements with the Securities and Exchange Commission (SEC) and Minnesota Department of Commerce (MDOC) related to market timing activities. As a result, AEFC was censured and ordered to cease and desist from committing or causing any violations of certain provisions of the Investment Advisers Act of 1940, the Investment Company Act of 1940, and various Minnesota laws. AEFC agreed to pay disgorgement of $10 million and civil money penalties of $7 million. AEFC also agreed to retain an independent distribution consultant to assist in developing a plan for distribution of all disgorgement and civil penalties ordered by the SEC in accordance with various undertakings detailed at http://www.sec.gov/litigation/admin/ia-2451.pdf. Ameriprise Financial and its affiliates have cooperated with the SEC and the MDOC in these legal proceedings, and have made regular reports to the funds' Boards of Directors/Trustees.
Ameriprise Financial and certain of its affiliates have historically been involved in a number of legal, arbitration and regulatory proceedings, including routine litigation, class actions, and governmental actions, concerning matters arising in connection with the conduct of their business activities. Ameriprise Financial believes that the Funds are not currently the subject of, and that neither Ameriprise Financial nor any of its affiliates are the subject of, any pending legal, arbitration or regulatory proceedings that are likely to have a material adverse effect on the Funds or the ability of Ameriprise Financial or its affiliates to perform under their contracts with the Funds. Ameriprise Financial is required to make 10-Q, 10-K and, as necessary, 8-K filings with the Securities and Exchange Commission on legal and regulatory matters that relate to Ameriprise Financial and its affiliates. Copies of these filings may be obtained by accessing the SEC website at www.sec.gov.
There can be no assurance that these matters, or the adverse publicity associated with them, will not result in increased fund redemptions, reduced sale of fund shares or other adverse consequences to the Funds. Further, although we believe proceedings are not likely to have a material adverse effect on the Funds or the ability of Ameriprise Financial or its affiliates to perform under their contracts with the Funds, these proceedings are subject to uncertainties and, as such, we are unable to estimate the possible loss or range of loss that may result. An adverse outcome in one or more of these proceedings could result in adverse judgments, settlements, fines, penalties or other relief that could have a material adverse effect on the consolidated financial condition or results of operations of Ameriprise Financial.
28
Report of Independent Registered Public Accounting Firm
To the Trustees of Columbia Funds Series Trust and the Shareholders of Columbia Small Cap Growth Fund II
In our opinion, the accompanying statement of assets and liabilities, including the investment portfolio, and the related statements of operations and of changes in net assets and the financial highlights present fairly, in all material respects, the financial position of Columbia Small Cap Growth Fund II (the "Fund") (a series of Columbia Funds Series Trust) at February 28, 2011, and the results of its operations, the changes in its net assets, and the financial highlights for each of the periods indicated, in conformity with accounting principles generally accepted in the United States of America. These financial statements and financial highlights (hereafter referred to as "financial statements") are the responsibility of the Fund's management. Our responsibility is to express an opinion on these financial statements based on our audits. We conducted our audits of these financial statements in accordance with the standards of the Public Company Accounting Oversight Board (United States). Those standards require that we plan and perform the audit to obtain reasonable assurance about whether the financial statements are free of material misstatement. An audit includes examining, on a test basis, evidence supporting the amounts and disclosures in the financial statements, assessing the accounting principles used and significant estimates made by management, and evaluating the overall financial statement presentation. We believe that our audits, which included confirmation of securities at February 28, 2011 by correspondence with the custodian and brokers, provide a reasonable basis for our opinion.
PricewaterhouseCoopers LLP
Boston, Massachusetts
April 21, 2011
29
Fund Governance
The Trustees serve terms of indefinite duration. The names, addresses and birth years of the Trustees and Officers of the Funds in the Columbia Funds Series Trust, the year each was first elected or appointed to office, their principal business occupations during at least the last five years, the number of Funds overseen by each Trustee and other directorships they hold are shown below. Each officer listed below serves as an officer of each Fund in the Columbia Funds Series Trust.
Independent Trustees
Name, Address and Year of Birth,
Position with Funds, Year First
Elected or Appointed to Office | | Principal Occupation(s) During Past Five Years, Number of Funds in Columbia
Funds Complex Overseen by Trustee, Other Directorships Held
| |
| Edward J. Boudreau, Jr. (Born 1944) | |
|
c/o Columbia Management
Investment Advisers, LLC
225 Franklin Street
Boston, MA 02110
Trustee (since 2005) | | Managing Director—E.J. Boudreau & Associates (consulting), from 2000 through current; oversees 44; Trustee—BofA Funds Series Trust. | |
|
| William P. Carmichael (Born 1943) | |
|
c/o Columbia Management
Investment Advisers, LLC
225 Franklin Street
Boston, MA 02110
Trustee (since 1999) | | Retired; Oversees 44; Director—Cobra Electronics Corporation (electronic equipment manufacturer); Director—McMoRan Exploration Company (oil and gas exploration and development); Director—The Finish Line (athletic shoes and apparel); Trustee—BofA Funds Series Trust; Former Director—Simmons Company (bedding). | |
|
| William A. Hawkins (Born 1942) | |
|
c/o Columbia Management
Investment Advisers, LLC
225 Franklin Street
Boston, MA 02110
Trustee (since 2005) | | Managing Director—Overton Partners (financial consulting), August 2010 to present; President and Chief Executive Officer—California General Bank, N.A., from January 2008 through August 2010; oversees 44; Trustee—BofA Funds Series Trust. | |
|
| R. Glenn Hilliard (Born 1943) | |
|
c/o Columbia Management
Investment Advisers, LLC
225 Franklin Street
Boston, MA 02110
Trustee (since 2005) | | Chairman and Chief Executive Officer—Hilliard Group LLC (investing and consulting), from April 2003 through current; Non-Executive Director & Chairman—CNO Financial, Inc. (formerly Conseco, Inc.) (insurance), September 2003 through current; Executive Chairman—Conseco, Inc. (insurance), August 2004 through September 2005; oversees 44; Trustee—BofA Funds Series Trust. | |
|
| John J. Nagorniak (Born 1944) | |
|
c/o Columbia Management
Investment Advisers, LLC
225 Franklin Street
Boston, MA 02110
Trustee (since 2008) | | Retired; President and Director—Foxstone Financial, Inc. (consulting), 2000 through December 2007; Director—Mellon Financial Corporation affiliates (investing), 2000 through 2007; Chairman—Franklin Portfolio Associates (investing—Mellon affiliate), 1982 through 2007; oversees 44; Director—MIT Investment Company; Trustee—MIT 401k Plan. | |
|
30
Fund Governance (continued)
Independent Trustees (continued)
Name, Address and Year of Birth,
Position with Funds, Year First
Elected or Appointed to Office | | Principal Occupation(s) During Past Five Years, Number of Funds in Columbia
Funds Complex Overseen by Trustee, Other Directorships Held
| |
| Minor M. Shaw (Born 1947) | |
|
c/o Columbia Management
Investment Advisers, LLC
225 Franklin Street
Boston, MA 02110
Trustee (since 2003) | | President—Micco Corporation and Mickel Investment Group; oversees 44; Board Member—Piedmont Natural Gas; Trustee—BofA Funds Series Trust. | |
|
Interested Trustee
| Anthony M. Santomero1 (Born 1946) | |
|
c/o Columbia Management
Investment Advisers, LLC
225 Franklin Street
Boston, MA 02110
Trustee (since 2008) | | Richard K. Mellon Professor Emeritus of Finance, The Wharton School, University of Pennsylvania, from 2002 through current; Senior Advisor—McKinsey & Company (consulting), July 2006 through January 2008; President and Chief Executive Officer—Federal Reserve Bank of Philadelphia, July 2000 through April 2006; oversees 44; Director—Renaissance Reinsurance Ltd; Trustee—Penn Mutual Life Insurance Company; Director—Citigroup, Inc.; Citibank, N.A.; Trustee—BofA Funds Series Trust. | |
|
1 Dr. Santomero is currently deemed by the Columbia Funds to be an "interested person" (as defined in the 1940 Act) of the Funds because he serves as a Director of Citigroup, Inc. and Citibank N.A., companies that may directly or through subsidiaries and affiliates engage from time-to-time in brokerage execution, principal transactions and lending relationships with the Columbia Funds or other funds or accounts advised/managed by the Adviser.
The Statement of Additional Information includes additional information about the Trustees of the Funds and is available, without charge, upon request by calling 800-345-6611.
Officers
| Name, Year of Birth and Address | | Principal Occupation(s) During the Past Five Years | |
| J. Kevin Connaughton (Born 1964) | |
|
225 Franklin Street
Boston, MA 02110
President (since 2009) | | Senior Vice President and General Manager—Mutual Fund Products, Columbia Management Investment Advisers, LLC since May 2010; President, Columbia Funds, since 2009, and RiverSource Funds, since May 2010 (previously Senior Vice President and Chief Financial Officer, Columbia Funds, from June 2008 to January 2009, Treasurer, Columbia Funds, from October 2003 to May 2008, and senior officer of various other affiliated funds since 2000); Managing Director, Columbia Management Advisors, LLC from December 2004 to April 2010. | |
|
| Michael G. Clarke (Born 1969) | |
|
225 Franklin Street
Boston, MA 02110
Senior Vice President and Chief Financial Officer (since 2009) | | Vice President, Columbia Management Investment Advisers, LLC since May 2010; Managing Director of Fund Administration, Columbia Management Advisors, LLC, from September 2004 to April 2010; senior officer of Columbia Funds and affiliated funds since 2002. | |
|
31
Fund Governance (continued)
Officers (continued)
| Name, Year of Birth and Address | | Principal Occupation(s) During the Past Five Years | |
| Scott R. Plummer (Born 1959) | |
|
5228 Ameriprise Financial Center
Minneapolis, MN 55474
Senior Vice President, Secretary
and Chief Legal Officer (since 2010) | | Chief Legal Officer and Assistant Secretary, Columbia Management Investment Advisers, LLC since June 2005; Vice President and Lead Chief Counsel—Asset Management, Ameriprise Financial, Inc. since May 2010 (previously Vice President and Chief Counsel—Asset Management, from 2005 to April 2010, and Vice President—Asset Management Compliance from 2004 to 2005); Vice President, Chief Counsel and Assistant Secretary, Columbia Management Investment Distributors, Inc. since 2008; Vice President, General Counsel and Secretary, Ameriprise Certificate Company since 2005; Chief Counsel, RiverSource Distributors, Inc. since 2006; Vice President, General Counsel and Secretary, RiverSource Funds, since December 2006; Senior Vice President, Secretary and Chief Legal Officer, Columbia Funds, since May 2010. | |
|
| Linda J. Wondrack (Born 1964) | |
|
225 Franklin Street
Boston, MA 02110
Senior Vice President and
Chief Compliance Officer (since 2007) | | Vice President and Chief Compliance Officer, Columbia Management Investment Advisers, LLC since May 2010; Chief Compliance Officer, Columbia Funds, since 2007, and RiverSource Funds, since May 2010; Director (Columbia Management Group, LLC and Investment Product Group Compliance), Bank of America, from June 2005 to April 2010. | |
|
| William F. Truscott (Born 1960) | |
|
53600 Ameriprise Financial Center
Minneapolis, MN 55474
Senior Vice President (since 2010) | | Chairman of the Board, Columbia Management Investment Advisers, LLC since May 2010 (previously President, Chairman of the Board and Chief Investment Officer, from 2001 to April 2010); Chief Executive Officer, U.S. Asset Management & President, Annuities, Ameriprise Financial, Inc. since May 2010 (previously President—U.S. Asset Management and Chief Investment Officer from 2005 to April 2010, and Senior Vice President—Chief Investment Officer, from 2001 to 2005); Director, President and Chief Executive Officer, Ameriprise Certificate Company since 2006; Director, Columbia Management Investment Distributors, Inc. since May 2010 (previously Chairman of the Board and Chief Executive Officer from 2008 to April 2010); Chairman of the Board and Chief Executive Officer, RiverSource Distributors, Inc. since 2006. | |
|
| Colin Moore (Born 1958) | |
|
225 Franklin Street
Boston, MA 02110
Senior Vice President (since 2010) | | Director and Chief Investment Officer, Columbia Management Investment Advisers, LLC since May 2010; Manager, Managing Director and Chief Investment Officer of Columbia Management Advisors, LLC from 2007 to April 2010; Head of Equities, Columbia Management Advisors, LLC from 2002 to 2007. | |
|
| Michael A. Jones (Born 1959) | |
|
225 Franklin Street
Boston, MA 02110
Senior Vice President (since 2010) | | President and Director, Columbia Management Investment Advisers, LLC since May 2010; President and Director, Columbia Management Investment Distributors, Inc. since May 2010; Manager, Chairman, Chief Executive Officer and President, Columbia Management Advisors, LLC from 2007 to April 2010; Chief Executive Officer, President and Director, Columbia Management Distributors, Inc. from November 2006 to April 2010; previously, co-president and senior managing director at Robeco Investment Management. | |
|
32
Fund Governance (continued)
Officers (continued)
| Name, Year of Birth and Address | | Principal Occupation(s) During the Past Five Years | |
| Amy Johnson (Born 1965) | |
|
5228 Ameriprise Financial Center
Minneapolis, MN 55474
Senior Vice President (since 2010) | | Senior Vice President and Chief Operating Officer, Columbia Management Investment Advisers, LLC since May 2010 (previously Chief Administrative Officer, from 2009 until April 2010, Vice President—Asset Management and Trust Company Services, from 2006 to 2009, and Vice President—Operations and Compliance from 2004 to 2006). | |
|
| Joseph F. DiMaria (Born 1968) | |
|
225 Franklin Street
Boston, MA 02110
Treasurer (since 2010) and
Chief Accounting Officer (since 2008) | | Vice President, Mutual Fund Administration, Columbia Management Investment Advisers, LLC, since May 2010; Director of Fund Administration, Columbia Management Advisors, LLC from January 2006 to April 2010; Head of Tax/Compliance and Assistant Treasurer, Columbia Management Advisors, LLC, from November 2004 to December 2005. | |
|
| Marybeth Pilat (Born 1968) | |
|
225 Franklin Street
Boston, MA 02110
Deputy Treasurer (since 2010) | | Vice President, Mutual Fund Administration, Columbia Management Investment Advisers, LLC, since May 2010; Vice President, Investment Operations, Bank of America, from October 2008 to April 2010; Finance Manager, Boston Children's Hospital from August 2008 to October 2008; Director, Mutual Fund Administration, Columbia Management Advisors, LLC, from May 2007 to July 2008; Vice President, Mutual Fund Valuation, Columbia Management Advisors, LLC, from January 2006 to May 2007; Vice President, Mutual Fund Accounting Oversight, Columbia Management Advisors, LLC from January 2005 to January 2006. | |
|
| Julian Quero (Born 1967) | |
|
225 Franklin Street
Boston, MA 02110
Deputy Treasurer (since 2008) | | Vice President, Mutual Fund Administration, Columbia Management Investment Advisers, LLC since May 2010; Director of Fund Administration, Columbia Management Advisors, LLC, from August 2008 to April 2010; Senior Tax Manager, Columbia Management Advisors, LLC from August 2006 to July 2008; Senior Compliance Manager, Columbia Management Advisors, LLC from April 2002 to August 2006. | |
|
| Stephen T. Welsh (Born 1957) | |
|
225 Franklin Street
Boston, MA 02110
Vice President (since 2006) | | President and Director, Columbia Management Investment Services Corp. since May 2010; President and Director, Columbia Management Services, Inc. from July 2004 to April 2010; Managing Director, Columbia Management Distributors, Inc. from August 2007 to April 2010. | |
|
33
Shareholder Meeting Results
At a Joint Special Meeting of Shareholders held on February 15, 2011, shareholders of the Fund considered the proposals described below.
Proposal 1. Shareholders of the Fund approved an Agreement and Plan of Reorganization pursuant to which the Fund will transfer its assets to Columbia Small Cap Growth Fund I (the "Buying Fund") in exchange for shares of the Buying Fund and the assumption by the Buying Fund of all of the liabilities of the Fund, as follows:
| Votes For | | Votes Against | | Abstentions | | Broker Non-Votes | |
| | 18,961,262 | | | | 239,928 | | | | 119,074 | | | | 1,094,809 | | |
Proposal 2. Shareholders of Columbia Funds Series Trust elected each of the nominees for trustees to the Board of Trustees of Columbia Funds Series Trust, each to hold office for an indefinite term, as follows:
| Trustee | | Votes For | | Votes Withheld | | Abstentions | |
| Kathleen Blatz | | | 2,145,636,122 | | | | 248,012,438 | | | | 0 | | |
| Edward J. Boudreau, Jr. | | | 2,145,430,114 | | | | 248,218,446 | | | | 0 | | |
| Pamela G. Carlton | | | 2,145,515,949 | | | | 248,132,612 | | | | 0 | | |
| William P. Carmichael | | | 2,145,038,695 | | | | 248,609,866 | | | | 0 | | |
| Patricia M. Flynn | | | 2,145,843,563 | | | | 247,804,997 | | | | 0 | | |
| William A. Hawkins | | | 2,145,359,401 | | | | 248,289,160 | | | | 0 | | |
| R. Glenn Hilliard | | | 2,145,079,400 | | | | 248,569,161 | | | | 0 | | |
| Stephen R. Lewis, Jr. | | | 2,145,092,209 | | | | 248,556,351 | | | | 0 | | |
| John F. Maher | | | 2,145,621,338 | | | | 248,027,223 | | | | 0 | | |
| John J. Nagorniak | | | 2,145,337,494 | | | | 248,311,067 | | | | 0 | | |
| Catherine James Paglia | | | 2,145,615,254 | | | | 248,033,306 | | | | 0 | | |
| Leroy C. Richie | | | 2,145,042,120 | | | | 248,606,441 | | | | 0 | | |
| Anthony M. Santomero | | | 2,145,088,174 | | | | 248,560,386 | | | | 0 | | |
| Minor M. Shaw | | | 2,145,430,762 | | | | 248,217,798 | | | | 0 | | |
| Alison Taunton-Rigby | | | 2,145,393,384 | | | | 248,255,177 | | | | 0 | | |
| William F. Truscott | | | 2,144,907,223 | | | | 248,741,338 | | | | 0 | | |
34
This page intentionally left blank.
This page intentionally left blank.
Important Information About This Report
The fund mails one shareholder report to each shareholder address. If you would like more than one report, please call shareholder services at 1-800-345-6611 and additional reports will be sent to you. This report has been prepared for shareholders of Columbia Small Cap Growth Fund II.
A description of the policies and procedures that the fund uses to determine how to vote proxies and a copy of the fund's voting records are available (i) at www.columbiamanagement.com, (ii) on the Securities and Exchange Commission's website at www.sec.gov, and (iii) without charge, upon request, by calling 1-800-368-0346. Information regarding how the fund voted proxies relating to portfolio securities during the 12-month period ended June 30 is available from the SEC's website. Information regarding how the fund voted proxies relating to portfolio securities is also available from the fund's website, www.columbiamanagement.com.
The fund files a complete schedule of portfolio holdings with the SEC for the first and third quarters of each fiscal year on Form N-Q. The fund's Form N-Q is available on the SEC's website at www.sec.gov and may be reviewed and copied at the SEC's Public Reference Room in Washington, D.C. Information on the operation of the Public Reference Room may be obtained by calling 1-800-SEC-0330.
Transfer Agent
Columbia Management Investment
Services Corp.
P.O. Box 8081
Boston, MA 02266-8081
1-800-345-6611
Distributor
Columbia Management Investment
Distributors, Inc.
225 Franklin Street
Boston, MA 02110
Investment Manager
Columbia Management Investment Advisers, LLC
225 Franklin Street
Boston, MA 02110
37

PRSRT STD
U.S. Postage
PAID
Holliston, MA
Permit NO. 20
Columbia Small Cap Growth Fund II
P. O. Box 8081
Boston, MA 02266-8081
columbiamanagement.com
This information is for use with concurrent or prior delivery of a fund prospectus. Investors should consider the investment objectives, risks, charges and expenses of a mutual fund carefully before investing. For a free prospectus, which contains this and other important information about the funds, visit columbiamanagement.com. Read the prospectus carefully before investing. The Fund is distributed by Columbia Management Investment Distributors, Inc., member FINRA, and managed by Columbia Management Investment Advisers, LLC.
© 2011 Columbia Management Investment Advisers, LLC. All rights reserved.
C-1251 A (04/11)

Columbia Large Cap Core Fund
Annual Report for the Period Ended February 28, 2011
Not FDIC insured • No bank guarantee • May lose value
Table of Contents
| Fund Profile | | | 1 | | |
|
| Economic Update | | | 2 | | |
|
| Performance Information | | | 4 | | |
|
| Understanding Your Expenses | | | 5 | | |
|
| Portfolio Managers' Report | | | 6 | | |
|
| Investment Portfolio | | | 8 | | |
|
Statement of Assets and
Liabilities | | | 13 | | |
|
| Statement of Operations | | | 15 | | |
|
Statement of Changes in
Net Assets | | | 16 | | |
|
| Financial Highlights | | | 18 | | |
|
| Notes to Financial Statements | | | 24 | | |
|
Report of Independent Registered
Public Accounting Firm | | | 33 | | |
|
| Federal Income Tax Information | | | 34 | | |
|
| Fund Governance | | | 35 | | |
|
Board Consideration and Approval
of Amendment to Investment
Management Services Agreement | | | 39 | | |
|
Summary of Management Fee
Evaluation by Independent
Fee Consultant | | | 43 | | |
|
| Shareholder Meeting Results | | | 45 | | |
|
Important Information About
This Report | | | 49 | | |
|
The views expressed in this report reflect the current views of the respective parties. These views are not guarantees of future performance and involve certain risks, uncertainties and assumptions that are difficult to predict, so actual outcomes and results may differ significantly from the views expressed. These views are subject to change at any time based upon economic, market or other conditions and the respective parties disclaim any responsibility to update such views. These views may not be relied on as investment advice and, because investment decisions for a Columbia Fund are based on numerous factors, may not be relied on as an indication of trading intent on behalf of any particular Columbia Fund. References to specific securities should not be construed as a recommendation or investment advice.
President's Message

Dear Shareholder:
The Columbia Management story began over 100 years ago, and today, we are one of the nation's largest dedicated asset managers. The recent acquisition by Ameriprise Financial, Inc. brings together the talents, resources and capabilities of Columbia Management with those of RiverSource Investments, Threadneedle (acquired by Ameriprise in 2003) and Seligman Investments (acquired by Ameriprise in 2008) to build a best-in-class asset management business that we believe is truly greater than its parts.
RiverSource Investments traces its roots to 1894 when its then newly-founded predecessor, Investors Syndicate, offered a face-amount savings certificate that gave small investors the opportunity to build a safe and secure fund for retirement, education or other special needs. A mutual fund pioneer, Investors Syndicate launched Investors Mutual Fund in 1940. In the decades that followed, its mutual fund products and services lineup grew to include a full spectrum of styles and specialties. More than 110 years later, RiverSource continues to be a trusted financial products leader.
Threadneedle, a leader in global asset management and one of Europe's largest asset managers, offers sophisticated international experience from a dedicated U.K. management team. Headquartered in London, it is named for Threadneedle Street in the heart of the city's financial district, where British investors pioneered international and global investing. Threadneedle was acquired in 2003 and today operates as an affiliate of Columbia Management.
Seligman Investments' beginnings date back to the establishment of the investment firm J. & W. Seligman & Co. in 1864. In the years that followed, Seligman played a major role in the geographical expansion and industrial development of the United States. In 1874, President Ulysses S. Grant named Seligman as fiscal agent for the U.S. Navy—an appointment that would last through World War I. Seligman helped finance the westward path of the railroads and the building of the Panama Canal. The firm organized its first investment company in 1929 and began managing its first mutual fund in 1930. In 2008, J. & W. Seligman & Co. Incorporated was acquired and Seligman Investments became an offering brand of RiverSource Investments, LLC.
We are proud of the rich and distinctive history of these firms, the strength and breadth of products and services they offer, and the combined cultures of pioneering spirit and forward thinking. Together we are committed to providing more for our shareholders than ever before.
> A singular focus on our shareholders
Our business is asset management, so investors are our first priority. We dedicate our resources to identifying timely investment opportunities and provide a comprehensive choice of equity, fixed-income and alternative investments to help meet your individual needs.
> First-class research and thought leadership
We are dedicated to helping you take advantage of today's opportunities and anticipate tomorrow's. We stay abreast of the latest investment trends and ideas, using our collective insight to evaluate events and transform them into solutions you can use.
> A disciplined investment approach
We aren't distracted by passing fads. Our teams adhere to a rigorous investment process that helps ensure the integrity of our products and enables you and your financial advisor to match our solutions to your objectives with confidence.
When you choose Columbia Management, you can be confident that we will take the time to understand your needs and help you and your financial advisor identify the solutions that are right for you. Because at Columbia Management, we don't consider ourselves successful unless you are.
Sincerely,

J. Kevin Connaughton
President, Columbia Funds
Investors should consider the investment objectives, risks, charges and expenses of a mutual fund carefully before investing. For a free prospectus, which contains this and other important information about the funds, visit www.columbiamanagement.com. The prospectus should be read carefully before investing.
Columbia Funds are distributed by Columbia Management Investment Distributors, Inc., member FINRA, and managed by Columbia Management Investment Advisers, LLC.
© 2011 Columbia Management Investment Advisers, LLC. All rights reserved.
Fund Profile – Columbia Large Cap Core Fund
Summary
g For the 12-month period that ended February 28, 2011, the fund's Class A shares returned 20.16% without sales charge.
g While the fund's return was lower than the return of the S&P 500 Index,1 it was higher than the average return of the funds in its peer group, the Lipper Large-Cap Core Funds Classification.2
g Stock selection in the consumer discretionary and materials sectors helped performance, but exposure to several underperforming energy names hurt.
Portfolio Management
Peter Santoro, lead manager, has co-managed the fund since 2010. From 2003 until joining Columbia Management Investment Advisers, LLC (the Investment Manager) in May 2010, Mr. Santoro was associated with the fund's previous investment adviser as an investment professional.
Craig Leopold has co-managed the fund since 2010. From 2003 until joining the Investment Manager in May 2010, Mr. Leopold was associated with the fund's previous investment adviser as an investment professional.
1The Standard & Poor's (S&P) 500 Index tracks the performance of 500 widely held, large-capitalization U.S. stocks.
2Lipper Inc., a widely respected data provider in the industry, calculates an average total return (assuming reinvestment of distributions) for mutual funds with investment objectives similar to those of the fund. Lipper makes no adjustment for the effect of sales loads.
Indices are not available for investment, are not professionally managed and do not reflect sales charges, fees, brokerage commissions, taxes or other expenses of investing. Securities in the fund may not match those in an index.
Performance data quoted represents past performance and current performance may be lower or higher. Past performance is no guarantee of future results. The investment return and principal value will fluctuate so that shares, when redeemed, may be worth more or less than the original cost. Please visit www.columbiamanagement.com for daily and most recent month-end performance updates.
Summary
1-year return as of 02/28/11
| | +20.16% | |
|
|  | | | Class A shares
(without sales charge) | |
|
| | +22.57% | |
|
|  | | | S&P 500 Index | |
|
Morningstar Style BoxTM
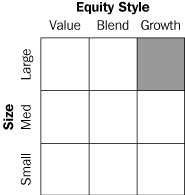
The Morningstar Style BoxTM is based on the fund's portfolio holdings. For equity funds, the vertical axis shows the market capitalization of the stocks owned, and the horizontal axis shows investment style (value, blend or growth). Information shown is based on the most recent data provided by Morningstar.
© 2011 Morningstar, Inc. All rights reserved. The Morningstar information contained herein: (1) is proprietary to Morningstar and/or its content providers; (2) may not be copied or distributed; and (3) is not warranted to be accurate, complete or timely. Neither Morningstar nor its content providers are responsible for any damages or losses arising from any use of this information.
1
Economic Update – Columbia Large Cap Core Fund
Summary
For the 12-month period that ended February 28, 2011
g The U.S. stock market, as measured by the S&P 500 Index, delivered solid returns, despite a summer 2010 correction. Foreign stock market returns were generally in line with the U.S. market, as measured by the MSCI EAFE Index (Net).
| S&P Index | | MSCI Index | |
|
 | |  | |
|
g Strengthening economic growth and rising interest rates kept a lid on most bond market sectors. The Barclays Capital Aggregate Bond Index delivered modest results. However, high-yield bonds were strong performers, as measured by the JPMorgan Developed BB High Yield Index.
Barclays
Aggregate Index | | JPMorgan
Index | |
|
 | |  | |
|
The U.S. economy continued to expand at a modest pace over the past 12 months, as measured by gross domestic product (GDP). After a strong first quarter in 2010, GDP growth dropped to 1.7% in the second quarter and fear spread that the economy would lapse into recession. However, the pace picked up in the third quarter, and growth was strong enough to inspire confidence among consumers, businesses and investors. GDP expanded by 2.6% in the third quarter and 2.8% in the fourth quarter. With the Federal Reserve Board (the Fed) providing additional monetary stimulus to shore up economic growth and the extension of key tax cuts for the next two years, 2011 expectations are for continued growth. Consumer confidence is on the mend, even though job growth has not met expectations. Business spending also tracked higher over the period.
Consumer spending on cars, clothing and other goods generally trended higher throughout the year. Holiday spending rose 5.5% between November 5, 2010 and December 24, 2010, in all retail categories, excluding automobiles, compared with the same period in 2009, according to MasterCard Advisors' SpendingPulse, which tracks spending on all transactions including cash. Analysts say that an increase in personal savings and a decline in consumer debt gave consumers confidence to spend a little more on the 2010 holidays. The personal savings rate edged higher, ending January 2011, the last month for which data was available, at 5.8%. Personal income also increased during the year, surging in January 2011, as payroll tax cuts kicked in.
News on the job front was mostly positive over the 12-month period. A good portion of the jobs added in March, April and May of 2010 were temporary, government-sponsored census positions, which began to unwind in June 2010, July 2010 and August 2010. However, private sector payroll employment began to trend higher in the third quarter, massive layoffs declined and job growth turned solidly positive, with the addition of 255,000 new jobs in the first two months of 2011.
Despite some glimmers of improvement early in 2010, the housing market remained troublesome throughout the period. Both new and existing home sales fell after a federal tax credit for new and repeat homebuyers expired. Distressed properties pressured prices and foreclosures continued—another drag on prices. The inventory of unsold homes ended the period just about where it started, at 7.6 months for both new and existing homes, according to the National Association of Realtors and a joint release from the U.S. Census Bureau and the U.S. Department of Housing and Urban Development. The new year brought a bit of good news: Existing home sales increased in January 2011, raising the level of sales above where it was one year ago. According to the National Association of Realtors, it was the first time in seven months that year-over-year sales activity compared favorably.
Reports from the business side of the economy were generally positive. A key measure of the nation's manufacturing situation—the Institute for Supply Management's Index—took a somewhat surprising turn higher in the final months of the period. Technology spending rose 12% in 2010, according to the NPD Group, a national marketing research firm. Purchases of computers, networking and software returned to prerecession levels. Industrial production was disappointingly flat at year end, per the report issued by the Fed, and it slipped further in January 2011. The amount of manufacturing capacity utilized, per the report issued by the Fed—a key measure of the health of the manufacturing sector—continued to inch higher.
2
Economic Update (continued) – Columbia Large Cap Core Fund
Stocks moved higher despite summer 2010 setback
Against a strengthening economic backdrop, a stock market rally that began early in 2009 continued into 2010 despite a summer setback linked to a debt crisis brewing in Europe, which raised concerns among U.S. investors. These fears were short-lived and stocks regained their footing in September 2010, moving higher through the end of the period. The S&P 500 Index1 returned 22.57% for the 12 months through February 28, 2011. Outside the United States, stock market returns seesawed but ended just short of U.S. market returns. The MSCI EAFE Index (Net),2 a broad gauge of stock market performance in foreign developed markets, returned 20.00% (in U.S. dollars) for the 12-month period, as concerns about the impact of a bailout for weak euro zone economies abated. Emerging stock markets were similarly strong. The MSCI Emerging Markets Index (Net)3 returned 20.91% (in U.S. dollars) for the 12-month period.
Bonds delivered modest returns
As the economy strengthened and interest rates edged higher, most bond sectors delivered modest returns. The Barclays Capital Aggregate Bond Index4 returned 4.93%. High-yield bonds led the fixed-income markets. For the 12 months covered by this report, the JPMorgan Developed BB High Yield Index5 returned 14.74%. Despite rising yields in the second half of the period, the Treasury market was also positive. The Barclays Capital U.S. Treasury Index6 returned 3.71%. However, municipal bonds struggled in the final months of the period, as interest rates inched higher and issue supply surged ahead of the expiration of the Build America Bonds program. The Barclays Capital Municipal Bond Index7 gained 1.72% for the period. Despite positive economic activity, the Fed kept a key short-term interest rate—the federal funds rate—close to zero.
Past performance is no guarantee of future results.
1The Standard & Poor's (S&P) 500 Index tracks the performance of 500 widely held, large-capitalization U.S. stocks.
2The Morgan Stanley Capital International Europe, Australasia, Far East (MSCI EAFE) Index (Net) is a free float- adjusted market capitalization index that is designed to measure the equity market performance of developed markets, excluding the U.S. & Canada. As of May 27, 2010, the MSCI EAFE Index (Net) consisted of the following 22 developed market country indices: Australia, Austria, Belgium, Denmark, Finland, France, Germany, Greece, Hong Kong, Ireland, Israel, Italy, Japan, the Netherlands, New Zealand, Norway, Portugal, Singapore, Spain, Sweden, Switzerland and the United Kingdom.
3The Morgan Stanley Capital International Emerging Markets (MSCI EM) Index (Net) is a free float-adjusted market capitalization index that is designed to measure equity market performance of emerging markets. As of May 27, 2010, the MSCI EM Index (Net) consisted of the following 21 emerging market country indices: Brazil, Chile, China, Colombia, Czech Republic, Egypt, Hungary, India, Indonesia, Korea, Malaysia, Mexico, Morocco, Peru, Philippines, Poland, Russia, South Africa, Taiwan, Thailand and Turkey.
4The Barclays Capital Aggregate Bond Index is a market value-weighted index that tracks the daily price, coupon, pay-downs and total return performance of fixed-rate, publicly placed, dollar-denominated and non-convertible investment grade debt issues with at least $250 million par amount outstanding and with at least one year to final maturity.
5The JPMorgan Developed BB High Yield Index is an unmanaged index designed to mirror the investable universe of the U.S. dollar developed, BB-rated, high yield corporate debt market.
6The Barclays Capital U.S. Treasury Index includes public obligations of the U.S. Treasury. Treasury bills are excluded by the maturity constraint. In addition, certain special issues, such as state and local government series bonds (SLGs), as well as U.S. Treasury TIPS, are excluded. STRIPS are excluded from the index because their inclusion would result in double-counting.
7The Barclays Capital Municipal Bond Index is considered representative of the broad market for investment-grade, tax-exempt bonds with a maturity of at least one year.
Indices are not available for investment, are not professionally managed and do not reflect sales charges, fees, brokerage commissions, taxes or other expenses of investing. Securities in the fund may not match those in an index.
3
Performance Information – Columbia Large Cap Core Fund
Performance data quoted represents past performance and current performance may be lower or higher. Past performance is no guarantee of future results. The investment return and principal value will fluctuate so that shares, when redeemed, may be worth more or less than the original cost. Please visit www.columbiamanagement.com for daily and most recent month-end performance updates.
Performance of a $10,000 investment 03/01/01 – 02/28/11
The chart above shows the change in value of a hypothetical $10,000 investment in Class A shares of Columbia Large Cap Core Fund during the stated time period, and does not reflect the deduction of taxes that a shareholder may pay on fund distributions or on the redemption of fund shares.
Performance of a $10,000 investment 03/01/01 – 02/28/11 ($)
| Sales charge | | without | | with | |
| Class A | | | 11,672 | | | | 10,999 | | |
| Class B | | | 10,807 | | | | 10,807 | | |
| Class C | | | 10,807 | | | | 10,807 | | |
| Class I | | | n/a | | | | n/a | | |
| Class W | | | n/a | | | | n/a | | |
| Class Z | | | 11,943 | | | | n/a | | |
Average annual total return as of 02/28/11 (%)
| Share class | | A | | B | | C | | I | | W | | Z | |
| Inception | | 08/02/99 | | 08/02/99 | | 08/02/99 | | 09/27/10 | | 09/27/10 | | 10/02/98 | |
| Sales charge | | without | | with | | without | | with | | without | | with | | without | | without | | without | |
| 1-year | | | 20.16 | | | | 13.26 | | | | 19.26 | | | | 14.26 | | | | 19.26 | | | | 18.26 | | | | n/a | | | | n/a | | | | 20.40 | | |
| 5-year | | | 3.01 | | | | 1.80 | | | | 2.23 | | | | 1.87 | | | | 2.24 | | | | 2.24 | | | | n/a | | | | n/a | | | | 3.26 | | |
| 10-year/Life | | | 1.56 | | | | 0.96 | | | | 0.78 | | | | 0.78 | | | | 0.78 | | | | 0.78 | | | | 16.99 | | | | 16.77 | | | | 1.79 | | |
The "with sales charge" returns include the maximum initial sales charge of 5.75% for Class A shares and the applicable contingent deferred sales charge of 5.00% in the first year, declining to 1.00% in the sixth year and eliminated thereafter for Class B shares and 1.00% for Class C shares for the first year only. The "without sales charge" returns do not include the effect of sales charges. If they had, returns would be lower.
Performance results reflect any fee waivers or reimbursements of fund expenses by the Investment Manager and/or any of its affiliates. Absent these fee waivers or expense reimbursement arrangements, performance results would have been lower.
All results shown assume reinvestment of distributions. Class I and Class Z shares are sold at net asset value with no distribution and service (Rule 12b-1) fees. Class W shares are sold at net asset value with a distribution (Rule 12b-1) fee. Class I, Class W and Class Z shares have limited eligibility and the investment minimum requirements may vary. Please see the fund's prospectus for details. Performance for different share classes will vary based on differences in sales charges and fees associated with each class.
Class I and Class W shares were initially offered on September 27, 2010.
The tables do not reflect the deduction of taxes that a shareholder may pay on fund distributions or on the redemption of fund shares.
4
Understanding Your Expenses – Columbia Large Cap Core Fund
As a fund shareholder, you incur two types of costs. There are transaction costs, which generally include sales charges on purchases and may include redemption fees or exchange fees. There are also ongoing costs, which generally include investment advisory fees, distribution and service (Rule 12b-1) fees and other fund expenses. The information on this page is intended to help you understand the ongoing costs of investing in the fund and to compare these costs with the ongoing costs of investing in other mutual funds.
Analyzing your fund's expenses by share class
To illustrate these ongoing costs, we have provided an example and calculated the expenses paid by investors in each share class during the period. The information in the following table is based on an initial investment of $1,000, which is invested at the beginning of the period and held for the entire period. Expense information is calculated two ways and each method provides you with different information. The amount listed in the "Actual" column is calculated using the fund's actual operating expenses and total return for the period. The amount listed in the "Hypothetical" column for each share class assumes that the return each year is 5% before expenses and is calculated based on the fund's actual operating expenses. You should not use the hypothetical account values and expenses to estimate either your actual account balance at the end of the period or the expenses you paid during this period.
Compare with other funds
Since all mutual funds are required to include the same hypothetical calculations about expenses in shareholder reports, you can use this information to compare the ongoing cost of investing in the fund with other funds. To do so, compare the 5% hypothetical example with the 5% hypothetical examples that appear in the shareholder reports of other funds. As you compare hypothetical examples of other funds, it is important to note that hypothetical examples are meant to highlight the ongoing costs of investing in a fund and do not reflect any transaction costs, such as sales charges, redemption fees or exchange fees.
Estimating your actual expenses
To estimate the expenses that you paid over the period, first you will need your account balance at the end of the period:
g For shareholders who receive their account statements from Columbia Management Investment Services Corp., your account balance is available online at www.columbiamanagement.com or by calling Shareholder Services at 800.345.6611.
g For shareholders who receive their account statements from their financial intermediary, contact your financial intermediary to obtain your account balance.
1. Divide your ending account balance by $1,000. For example, if an account balance was $8,600 at the end of the period, the result would be 8.6.
2. In the section of the table below titled "Expenses paid during the period," locate the amount for your share class. You will find this number in the column labeled "Actual." Multiply this number by the result from step 1. Your answer is an estimate of the expenses you paid on your account during the period.
If the value of your account falls below the minimum initial investment requirement applicable to you, your account may be subject to a $20 annual fee. This fee is not included in the accompanying table. If you are subject to the fee, keep it in mind when you are estimating the ongoing expenses of investing in the fund and when comparing the expenses of this fund with other funds.
09/01/10 – 02/28/11
| | | Account value at the
beginning of the period ($) | | Account value at the
end of the period ($) | | Expenses paid
during the period ($) | | Fund's annualized
expense ratio (%) | |
| | | Actual | | Hypothetical | | Actual | | Hypothetical | | Actual | | Hypothetical | | Actual | |
| Class A | | | 1,000.00 | | | | 1,000.00 | | | | 1,274.60 | | | | 1,018.70 | | | | 6.94 | | | | 6.16 | | | | 1.23 | | |
| Class B | | | 1,000.00 | | | | 1,000.00 | | | | 1,270.40 | | | | 1,014.98 | | | | 11.15 | | | | 9.89 | | | | 1.98 | | |
| Class C | | | 1,000.00 | | | | 1,000.00 | | | | 1,270.40 | | | | 1,014.98 | | | | 11.15 | | | | 9.89 | | | | 1.98 | | |
| Class I | | | 1,000.00 | | | | 1,000.00 | | | | 1,042.70 | * | | | 1,020.88 | | | | 3.40 | * | | | 3.96 | | | | 0.79 | | |
| Class W | | | 1,000.00 | | | | 1,000.00 | | | | 1,042.50 | * | | | 1,019.04 | | | | 5.00 | * | | | 5.81 | | | | 1.16 | | |
| Class Z | | | 1,000.00 | | | | 1,000.00 | | | | 1,276.90 | | | | 1,019.93 | | | | 5.53 | | | | 4.91 | | | | 0.98 | | |
Expenses paid during the period are equal to the annualized expense ratio for the share class, multiplied by the average account value over the period, then multiplied by the number of days in the fund's most recent fiscal half-year and divided by 365.
It is important to note that the expense amounts shown in the table are meant to highlight only ongoing costs of investing in the fund and do not reflect any transaction costs, such as sales charges, redemption fees or exchange fees. Therefore, the hypothetical examples provided may not help you determine the relative total costs of owning shares of different funds. If these transaction costs were included, your costs would have been higher.
*For the period September 27, 2010 through February 28, 2011. Class I and Class W shares commenced operations on September 27, 2010.
5
Portfolio Managers' Report – Columbia Large Cap Core Fund
Performance data quoted represents past performance and current performance may be lower or higher. Past performance is no guarantee of future results. The investment return and principal value will fluctuate so that shares, when redeemed, may be worth more or less than the original cost. Please visit www.columbiamanagement.com for daily and most recent month-end performance updates.
Net asset value per share
as of 02/28/11 ($)
| Class A | | | 13.73 | | |
| Class B | | | 13.25 | | |
| Class C | | | 13.25 | | |
| Class I | | | 13.69 | | |
| Class W | | | 13.73 | | |
| Class Z | | | 13.69 | | |
Distributions declared per share
03/01/10 – 02/28/11 ($)
| Class A | | | 0.06 | | |
| Class I | | | 0.09 | | |
| Class W | | | 0.05 | | |
| Class Z | | | 0.09 | | |
For the 12-month period that ended February 28, 2011, the fund's Class A shares returned 20.16% without sales charge. The fund underperformed its benchmark, the S&P 500 Index, which returned 22.57%. However, it outpaced the 19.82% average return of funds in its peer group, the Lipper Large-Cap Core Funds Classification. During the first half of the period, we believe that stocks traded on the latest macroeconomic news rather than on the basis of their individual business prospects. In this environment, the fund's sector-neutral, stock-focused strategy went unrewarded. However, as the economy strengthened and favored stocks with strong fundamentals, the fund gained ground against the index and its peers. Stock selection in the consumer discretionary and materials sectors drove the fund's strong positive returns, while certain energy names detracted during the period.
Consumer discretionary and materials stocks drive returns
We positioned the fund to benefit from an improved economic environment. In the consumer discretionary sector, we emphasized companies that we believed would be early beneficiaries of resurging consumer confidence and market stabilization. Among standout performers in auto-related businesses were auto safety component maker Autoliv (0.5% of net assets) and engine timing system producer BorgWarner. These companies benefited from rising new car sales and consumer preferences for safer and more fuel-efficient cars. We subsequently sold BorgWarner and took profits.
A play on an expected recovery in advertising was also successful, as Viacom was among the winners in the consumer discretionary sector (1.0% of net assets). As concerns about the economy and market subsided, pent-up consumer demand for mid- to high-end goods boosted specialty retailers Nordstrom and Limited Brands, generating positive results for the fund (0.6% and 0.7% of net assets, respectively). Among materials names, we emphasized agricultural stocks that could benefit from increased global demand for proteins as well as corn-based ethanol. Seed producer Monsanto, fertilizer maker Potash Corporation of Saskatchewan and CF Industries Holdings (0.4% of net assets) were top performers. We sold Monsanto and Potash, taking profits.
Energy names detracted from performance
Energy holdings were the period's biggest disappointment. We emphasized oil exploration and production companies with the view that positive economic conditions would further increase demand for oil. The April explosion on BP's Macondo oil well in the Gulf of Mexico had a negative impact on the stock of Anadarko Petroleum. The stock prices of drilling firms Transocean and Noble were also hurt by this event, particularly in light of the US government's decision to cease offshore drilling. Against an unfavorable backdrop, marked by backlash from the spill and unfolding unrest in the Middle East, we sold all three positions. Longer term, we continue to believe that international exploration and deep water drilling remain good businesses with positive growth prospects.
Looking ahead
With an improving economic environment, we believe the consumer is poised for increased spending despite lingering high unemployment. And with the conviction that the employment situation will improve, we believe that quality large companies with strong balance sheets are positioned to take advantage of opportunities to invest cash wisely. Many companies are beating
6
Portfolio Managers' Report (continued) – Columbia Large Cap Core Fund
earnings estimates, and certain valuations look attractive at current levels. We will continue to draw on three independent and uncorrelated research sources—fundamental research, systematic models and portfolio management team input—to identify and invest in companies that are primed to grow. We will also continue to focus on after-tax returns on behalf of shareholders.
Portfolio characteristics and holdings are subject to change periodically and may not be representative of current characteristics and holdings. The outlook for the fund may differ from those presented for other Columbia Funds.
Equity securities are affected by stock market fluctuations that occur in response to economic and business developments.
International investing may involve certain risks, including currency fluctuations, risks associated with possible differences in financial accounting standards and other monetary and political risks. Significant levels of foreign taxes, including potentially confiscatory levels of taxation and withholding taxes, may also apply to some foreign investments.
Top 5 sectors
as of 02/28/11 (%)
| Information Technology | | | 18.5 | | |
| Financials | | | 16.7 | | |
| Energy | | | 13.0 | | |
| Industrials | | | 11.1 | | |
| Consumer Discretionary | | | 11.0 | | |
Top 10 holdings
as of 02/28/11 (%)
| Chevron | | | 3.9 | | |
| Apple | | | 3.0 | | |
| JPMorgan Chase | | | 2.4 | | |
| Google | | | 2.0 | | |
| International Business Machines | | | 1.9 | | |
| Wells Fargo | | | 1.9 | | |
| Philip Morris International | | | 1.8 | | |
| Occidental Petroleum | | | 1.7 | | |
| Schlumberger | | | 1.7 | | |
| PepsiCo | | | 1.7 | | |
| Goldman Sachs Group | | | 1.7 | | |
The fund is actively managed and the composition of its portfolio will change over time. Information provided is calculated as a percentage of net assets.
7
Investment Portfolio – Columbia Large Cap Core Fund
February 28, 2011
| Common Stocks – 98.1% | |
| | | Shares | | Value ($) | |
| Consumer Discretionary – 11.0% | |
| Auto Components – 1.2% | |
| Autoliv, Inc. | | | 88,160 | | | | 6,602,302 | | |
| Johnson Controls, Inc. | | | 216,750 | | | | 8,843,400 | | |
| Auto Components Total | | | 15,445,702 | | |
| Automobiles – 0.8% | |
| Ford Motor Co. (a) | | | 687,700 | | | | 10,349,885 | | |
| Automobiles Total | | | 10,349,885 | | |
| Hotels, Restaurants & Leisure – 1.6% | |
| Las Vegas Sands Corp. (a) | | | 103,370 | | | | 4,821,177 | | |
| McDonald's Corp. | | | 193,280 | | | | 14,627,430 | | |
| Hotels, Restaurants & Leisure Total | | | 19,448,607 | | |
| Internet & Catalog Retail – 0.3% | |
| priceline.com, Inc. (a) | | | 7,280 | | | | 3,304,246 | | |
| Internet & Catalog Retail Total | | | 3,304,246 | | |
| Media – 2.2% | |
| Comcast Corp., Class A | | | 620,300 | | | | 15,978,928 | | |
| Viacom, Inc., Class B | | | 267,837 | | | | 11,961,601 | | |
| Media Total | | | 27,940,529 | | |
| Multiline Retail – 1.8% | |
| Macy's, Inc. | | | 305,300 | | | | 7,296,670 | | |
| Nordstrom, Inc. | | | 158,820 | | | | 7,188,193 | | |
| Target Corp. | | | 146,491 | | | | 7,698,102 | | |
| Multiline Retail Total | | | 22,182,965 | | |
| Specialty Retail – 2.6% | |
| Abercrombie & Fitch Co., Class A | | | 141,040 | | | | 8,091,465 | | |
| Limited Brands, Inc. | | | 260,003 | | | | 8,325,296 | | |
| Lowe's Companies, Inc. | | | 352,740 | | | | 9,231,206 | | |
| Staples, Inc. | | | 326,710 | | | | 6,958,923 | | |
| Specialty Retail Total | | | 32,606,890 | | |
| Textiles, Apparel & Luxury Goods – 0.5% | |
| Coach, Inc. | | | 109,400 | | | | 6,008,248 | | |
| Textiles, Apparel & Luxury Goods Total | | | 6,008,248 | | |
| Consumer Discretionary Total | | | 137,287,072 | | |
| Consumer Staples – 8.6% | |
| Beverages – 1.7% | |
| PepsiCo, Inc. | | | 324,160 | | | | 20,558,227 | | |
| Beverages Total | | | 20,558,227 | | |
| Food & Staples Retailing – 2.3% | |
| Costco Wholesale Corp. | | | 155,820 | | | | 11,653,778 | | |
| CVS Caremark Corp. | | | 301,760 | | | | 9,976,185 | | |
| | | Shares | | Value ($) | |
| Safeway, Inc. | | | 347,340 | | | | 7,578,959 | | |
| Food & Staples Retailing Total | | | 29,208,922 | | |
| Food Products – 1.2% | |
| Kellogg Co. | | | 189,910 | | | | 10,171,580 | | |
| Mead Johnson Nutrition Co., Class A | | | 77,421 | | | | 4,633,647 | | |
| Food Products Total | | | 14,805,227 | | |
| Household Products – 1.6% | |
| Procter & Gamble Co. | | | 319,420 | | | | 20,139,431 | | |
| Household Products Total | | | 20,139,431 | | |
| Tobacco – 1.8% | |
| Philip Morris International, Inc. | | | 352,847 | | | | 22,151,735 | | |
| Tobacco Total | | | 22,151,735 | | |
| Consumer Staples Total | | | 106,863,542 | | |
| Energy – 13.0% | |
| Energy Equipment & Services – 3.0% | |
| Oceaneering International, Inc. (a) | | | 62,170 | | | | 5,199,277 | | |
| Oil States International, Inc. (a) | | | 71,540 | | �� | | 5,207,397 | | |
| Schlumberger Ltd. | | | 223,320 | | | | 20,862,554 | | |
| Weatherford International Ltd. (a) | | | 265,830 | | | | 6,427,769 | | |
| Energy Equipment & Services Total | | | 37,696,997 | | |
| Oil, Gas & Consumable Fuels – 10.0% | |
| Alpha Natural Resources, Inc. (a) | | | 86,640 | | | | 4,697,621 | | |
| Apache Corp. | | | 145,061 | | | | 18,077,502 | | |
| Chevron Corp. | | | 471,454 | | | | 48,913,352 | | |
| Continental Resources, Inc. (a) | | | 113,590 | | | | 7,897,913 | | |
| Murphy Oil Corp. | | | 146,060 | | | | 10,739,792 | | |
| Occidental Petroleum Corp. | | | 207,221 | | | | 21,130,325 | | |
| Peabody Energy Corp. | | | 101,350 | | | | 6,637,412 | | |
| Southwestern Energy Co. (a) | | | 162,236 | | | | 6,405,077 | | |
| Oil, Gas & Consumable Fuels Total | | | 124,498,994 | | |
| Energy Total | | | 162,195,991 | | |
| Financials – 16.7% | |
| Capital Markets – 3.9% | |
| BlackRock, Inc., Class A | | | 58,480 | | | | 11,929,335 | | |
| Franklin Resources, Inc. | | | 65,779 | | | | 8,263,158 | | |
| Goldman Sachs Group, Inc. | | | 125,288 | | | | 20,519,669 | | |
| T. Rowe Price Group, Inc. | | | 111,530 | | | | 7,470,279 | | |
| Capital Markets Total | | | 48,182,441 | | |
| Commercial Banks – 4.0% | |
| Fifth Third Bancorp. | | | 243,390 | | | | 3,553,494 | | |
| Huntington Bancshares, Inc. | | | 829,440 | | | | 5,673,370 | | |
See Accompanying Notes to Financial Statements.
8
Columbia Large Cap Core Fund
February 28, 2011
| Common Stocks (continued) | |
| | | Shares | | Value ($) | |
| PNC Financial Services Group, Inc. | | | 267,072 | | | | 16,478,342 | | |
| Wells Fargo & Co. | | | 738,179 | | | | 23,813,655 | | |
| Commercial Banks Total | | | 49,518,861 | | |
| Consumer Finance – 0.4% | |
| Discover Financial Services | | | 253,654 | | | | 5,516,975 | | |
| Consumer Finance Total | | | 5,516,975 | | |
| Diversified Financial Services – 4.9% | |
| Bank of America Corp. | | | 790,910 | | | | 11,302,104 | | |
| Citigroup, Inc. (a) | | | 4,090,720 | | | | 19,144,569 | | |
| JPMorgan Chase & Co. | | | 646,310 | | | | 30,176,214 | | |
| Diversified Financial Services Total | | | 60,622,887 | | |
| Insurance – 3.5% | |
Hartford Financial Services
Group, Inc. | | | 350,020 | | | | 10,360,592 | | |
| MetLife, Inc. | | | 417,064 | | | | 19,752,151 | | |
| Prudential Financial, Inc. | | | 202,430 | | | | 13,325,967 | | |
| Insurance Total | | | 43,438,710 | | |
| Financials Total | | | 207,279,874 | | |
| Health Care – 10.6% | |
| Biotechnology – 2.8% | |
| Amgen, Inc. (a) | | | 169,630 | | | | 8,707,108 | | |
| Celgene Corp. (a) | | | 201,430 | | | | 10,695,933 | | |
| Dendreon Corp. (a) | | | 113,527 | | | | 3,813,372 | | |
| Gilead Sciences, Inc. (a) | | | 246,380 | | | | 9,603,893 | | |
| Incyte Corp. Ltd. (a) | | | 151,530 | | | | 2,072,930 | | |
| Biotechnology Total | | | 34,893,236 | | |
| Health Care Equipment & Supplies – 1.2% | |
| Covidien PLC | | | 117,770 | | | | 6,059,266 | | |
| St. Jude Medical, Inc. (a) | | | 187,850 | | | | 8,994,258 | | |
| Health Care Equipment & Supplies Total | | | 15,053,524 | | |
| Health Care Providers & Services – 2.3% | |
| Cardinal Health, Inc. | | | 224,981 | | | | 9,368,209 | | |
| CIGNA Corp. | | | 231,170 | | | | 9,725,322 | | |
| Express Scripts, Inc. (a) | | | 174,780 | | | | 9,826,131 | | |
| Health Care Providers & Services Total | | | 28,919,662 | | |
| Life Sciences Tools & Services – 0.5% | |
| Life Technologies Corp. (a) | | | 104,580 | | | | 5,581,435 | | |
| Life Sciences Tools & Services Total | | | 5,581,435 | | |
| Pharmaceuticals – 3.8% | |
| Abbott Laboratories | | | 151,299 | | | | 7,277,482 | | |
| Allergan, Inc. | | | 132,130 | | | | 9,800,082 | | |
| | | Shares | | Value ($) | |
| Merck & Co., Inc. | | | 448,850 | | | | 14,619,044 | | |
| Pfizer, Inc. | | | 780,770 | | | | 15,022,015 | | |
| Pharmaceuticals Total | | | 46,718,623 | | |
| Health Care Total | | | 131,166,480 | | |
| Industrials – 11.1% | |
| Aerospace & Defense – 1.9% | |
| L-3 Communications Holdings, Inc. | | | 92,700 | | | | 7,350,183 | | |
| United Technologies Corp. | | | 197,515 | | | | 16,500,403 | | |
| Aerospace & Defense Total | | | 23,850,586 | | |
| Air Freight & Logistics – 1.3% | |
| United Parcel Service, Inc., Class B | | | 213,874 | | | | 15,783,901 | | |
| Air Freight & Logistics Total | | | 15,783,901 | | |
| Building Products – 0.5% | |
| Owens Corning (a) | | | 178,250 | | | | 6,368,873 | | |
| Building Products Total | | | 6,368,873 | | |
| Construction & Engineering – 1.3% | |
Chicago Bridge & Iron Co.,
NV, N.Y. Registered Shares (a) | | | 168,860 | | | | 5,997,907 | | |
| Fluor Corp. | | | 68,750 | | | | 4,864,750 | | |
| Foster Wheeler AG (a) | | | 156,380 | | | | 5,654,701 | | |
| Construction & Engineering Total | | | 16,517,358 | | |
| Electrical Equipment – 1.3% | |
| Emerson Electric Co. | | | 264,320 | | | | 15,769,331 | | |
| Electrical Equipment Total | | | 15,769,331 | | |
| Machinery – 2.2% | |
| Deere & Co. | | | 97,890 | | | | 8,824,784 | | |
| Dover Corp. | | | 148,690 | | | | 9,553,333 | | |
| Parker Hannifin Corp. | | | 104,530 | | | | 9,321,985 | | |
| Machinery Total | | | 27,700,102 | | |
| Professional Services – 0.3% | |
| Nielsen Holdings NV (a) | | | 134,910 | | | | 3,587,257 | | |
| Professional Services Total | | | 3,587,257 | | |
| Road & Rail – 2.3% | |
| J.B. Hunt Transport Services, Inc. | | | 214,810 | | | | 8,938,244 | | |
| Norfolk Southern Corp. | | | 132,320 | | | | 8,677,546 | | |
| Union Pacific Corp. | | | 110,328 | | | | 10,526,394 | | |
| Road & Rail Total | | | 28,142,184 | | |
| Industrials Total | | | 137,719,592 | | |
See Accompanying Notes to Financial Statements.
9
Columbia Large Cap Core Fund
February 28, 2011
| Common Stocks (continued) | |
| | | Shares | | Value ($) | |
| Information Technology – 18.5% | |
| Communications Equipment – 1.2% | |
| Cisco Systems, Inc. (a) | | | 282,344 | | | | 5,240,305 | | |
| QUALCOMM, Inc. | | | 155,630 | | | | 9,272,435 | | |
| Communications Equipment Total | | | 14,512,740 | | |
| Computers & Peripherals – 4.2% | |
| Apple, Inc. (a) | | | 104,544 | | | | 36,925,986 | | |
| EMC Corp. (a) | | | 545,166 | | | | 14,833,967 | | |
| Computers & Peripherals Total | | | 51,759,953 | | |
| Electronic Equipment, Instruments & Components – 1.3% | |
| Corning, Inc. | | | 479,966 | | | | 11,068,016 | | |
| Tyco Electronics Ltd. | | | 141,740 | | | | 5,108,309 | | |
Electronic Equipment, Instruments &
Components Total | | | 16,176,325 | | |
| Internet Software & Services – 2.3% | |
| Akamai Technologies, Inc. (a) | | | 104,260 | | | | 3,912,878 | | |
| Google, Inc., Class A (a) | | | 40,732 | | | | 24,985,009 | | |
| Internet Software & Services Total | | | 28,897,887 | | |
| IT Services – 4.5% | |
| Accenture PLC, Class A | | | 191,780 | | | | 9,872,834 | | |
International Business
Machines Corp. | | | 149,394 | | | | 24,183,901 | | |
| Teradata Corp. (a) | | | 143,056 | | | | 6,840,938 | | |
| Visa, Inc., Class A | | | 209,110 | | | | 15,275,485 | | |
| IT Services Total | | | 56,173,158 | | |
| Semiconductors & Semiconductor Equipment – 2.3% | |
| Advanced Micro Devices, Inc. (a) | | | 1,032,180 | | | | 9,506,378 | | |
| Avago Technologies Ltd. | | | 146,494 | | | | 4,979,331 | | |
| Cypress Semiconductor Corp. (a) | | | 150,380 | | | | 3,151,965 | | |
Fairchild Semiconductor
International, Inc. (a) | | | 263,770 | | | | 4,644,990 | | |
| Skyworks Solutions, Inc. (a) | | | 188,660 | | | | 6,780,440 | | |
Semiconductors & Semiconductor
Equipment Total | | | 29,063,104 | | |
| Software – 2.7% | |
| Autodesk, Inc. (a) | | | 235,293 | | | | 9,894,071 | | |
| Intuit, Inc. (a) | | | 146,040 | | | | 7,678,783 | | |
| Microsoft Corp. | | | 356,550 | | | | 9,477,099 | | |
| Oracle Corp. | | | 195,520 | | | | 6,432,608 | | |
| Software Total | | | 33,482,561 | | |
| Information Technology Total | | | 230,065,728 | | |
| | | Shares | | Value ($) | |
| Materials – 3.6% | |
| Chemicals – 1.6% | |
| Air Products & Chemicals, Inc. | | | 101,080 | | | | 9,299,360 | | |
| Celanese Corp., Series A | | | 140,634 | | | | 5,829,279 | | |
| CF Industries Holdings, Inc. | | | 31,720 | | | | 4,481,402 | | |
| Chemicals Total | | | 19,610,041 | | |
| Containers & Packaging – 0.9% | |
| Crown Holdings, Inc. (a) | | | 191,580 | | | | 7,371,998 | | |
| Packaging Corp. of America | | | 142,911 | | | | 4,114,408 | | |
| Containers & Packaging Total | | | 11,486,406 | | |
| Metals & Mining – 1.1% | |
Freeport-McMoRan Copper &
Gold, Inc. | | | 179,496 | | | | 9,504,313 | | |
| Rio Tinto PLC, ADR | | | 59,960 | | | | 4,261,957 | | |
| Metals & Mining Total | | | 13,766,270 | | |
| Materials Total | | | 44,862,717 | | |
| Telecommunication Services – 3.4% | |
| Diversified Telecommunication Services – 1.3% | |
| AT&T, Inc. | | | 582,807 | | | | 16,540,062 | | |
| Diversified Telecommunication Services Total | | | 16,540,062 | | |
| Wireless Telecommunication Services – 2.1% | |
| American Tower Corp., Class A (a) | | | 224,730 | | | | 12,126,431 | | |
| MetroPCS Communications, Inc. (a) | | | 435,730 | | | | 6,274,512 | | |
| Millicom International Cellular SA | | | 45,135 | | | | 3,953,826 | | |
| NII Holdings, Inc. (a) | | | 95,201 | | | | 3,899,433 | | |
| Wireless Telecommunication Services Total | | | 26,254,202 | | |
| Telecommunication Services Total | | | 42,794,264 | | |
| Utilities – 1.6% | |
| Electric Utilities – 1.0% | |
| American Electric Power Co., Inc. | | | 213,450 | | | | 7,637,241 | | |
| Entergy Corp. | | | 76,200 | | | | 5,425,440 | | |
| Electric Utilities Total | | | 13,062,681 | | |
| Multi-Utilities – 0.6% | |
| PG&E Corp. | | | 151,858 | | | | 6,994,580 | | |
| Multi-Utilities Total | | | 6,994,580 | | |
| Utilities Total | | | 20,057,261 | | |
Total Common Stocks
(cost of $1,015,668,783) | | | 1,220,292,521 | | |
See Accompanying Notes to Financial Statements.
10
Columbia Large Cap Core Fund
February 28, 2011
| Short-Term Obligation – 0.9% | |
| | | Par ($) | | Value ($) | |
Repurchase agreement with
Fixed Income Clearing Corp.,
dated 02/28/11, due 03/01/11
at 0.090%, collateralized by a
U.S. Government Agency
obligation maturing 12/18/13,
market value $11,288,100
(repurchase proceeds
$11,065,028) | | | 11,065,000 | | | | 11,065,000 | | |
Total Short-Term Obligation
(cost of $11,065,000) | | | 11,065,000 | | |
Total Investments – 99.0%
(cost of $1,026,733,783) (b) | | | 1,231,357,521 | | |
| Other Assets & Liabilities, Net – 1.0% | | | 12,947,898 | | |
| Net Assets – 100.0% | | | 1,244,305,419 | | |
Notes to Investment Portfolio:
(a) Non-income producing security.
(b) Cost for federal income tax purposes is $1,027,941,337.
Generally accepted accounting principles (GAAP) require disclosure regarding the inputs and valuation techniques used to measure fair value and any changes in valuation inputs or techniques. In addition, investments shall be disclosed by major category.
The Fund categorizes its fair value measurements according to a three-level hierarchy that maximizes the use of observable inputs and minimizes the use of unobservable inputs by prioritizing that the most observable input be used when available. Observable inputs are those that market participants would use in pricing an investment based on market data obtained from sources independent of the reporting entity. Unobservable inputs are those that reflect the Fund's assumptions about the information market participants would use in pricing an investment. An investment's level within the fair value hierarchy is based on the lowest level of any input that is deemed significant to the asset or liability's fair value measurement. The input levels are not necessarily an indication of the risk or liquidity associated with investments at that level. For example, certain U.S. government securities are generally high quality and liquid, however, they are reflected as Level 2 because the inputs used to determine fair value may not always be quoted prices in an active market.
Fair value inputs are summarized in the three broad levels listed below:
• Level 1—Valuations based on quoted prices for investments in active markets that the Fund has the ability to access at the measurement date (including NAV for open-end mutual funds). Valuation adjustments are not applied to Level 1 investments.
• Level 2—Valuations based on other significant observable inputs (including quoted prices for similar securities, interest rates, prepayment speeds, credit risks, etc.).
• Level 3—Valuations based on significant unobservable inputs (including the Fund's own assumptions and judgment in determining the fair value of investments).
Inputs that are used in determining fair value of an investment may include price information, credit data, volatility statistics, and other factors. These inputs can be either observable or unobservable. The availability of observable inputs can vary between investments, and is affected by various factors such as the type of investment, and the volume and level of activity for that investment or similar investments in the marketplace. The inputs will be considered by the Investment Manager, along with any other relevant factors in the calculation of an investment's fair value. The Fund uses prices and inputs that are current as of the measurement date, which may include periods of market dislocations. During these periods, the availability of prices and inputs may be reduced for many investments. This condition could cause an investment to be reclassified between the various levels within the hierarchy. Non-U.S. equity securities actively traded in foreign markets may be reflected in Level 2 despite the availability of closing prices, because the Fund evaluates and determines whether those closing prices reflect fair value at the close of the New York Stock Exchange (NYSE) or require adjustment, as described in Note 2 to the financial statements—Security Valuation.
Investments falling into the Level 3 category are primarily supported by quoted prices from brokers and dealers participating in the market for those investments. However, these may be classified as Level 3 investments due to lack of market transparency and corroboration to support these quoted prices. Additionally, valuation models may be used as the pricing source for any remaining investments classified as Level 3. These models rely on one or more significant unobservable inputs and/or significant assumptions by the Investment Manager. Inputs used in valuations may include, but are not limited to, financial statement analysis, capital account balances, discount rates and estimated cash flows, and comparable company data.
The following table is a summary of the inputs used to value the Fund's investments as of February 28, 2011:
| Description | | Quoted
Prices
(Level 1) | | Other
Significant
Observable
Inputs
(Level 2) | | Significant
Unobservable
Inputs
(Level 3) | | Total | |
| Total Common Stocks | | $ | 1,220,292,521 | | | $ | — | | | $ | — | | | $ | 1,220,292,521 | | |
Total Short-Term
Obligation | | | — | | | | 11,065,000 | | | | — | | | | 11,065,000 | | |
| Total Investments | | $ | 1,220,292,521 | | | $ | 11,065,000 | | | $ | — | | | $ | 1,231,357,521 | | |
The Fund's assets assigned to the Level 2 input category represent certain short-term obligations which are valued using amortized cost, an income approach which converts future cash flows to a present value based upon the discount or premium at purchase.
There were no significant transfers of financial assets between Levels 1 and 2 during the period.
For the year ended February 28, 2011, transactions in written call option contracts were as follows:
| | | Number of
contracts | | Premium
received | |
| Options outstanding at February 28, 2010 | | | — | | | $ | — | | |
| Options written | | | 2,530 | | | | 134,571 | | |
Options terminated in closing purchase
transactions | | | — | | | | — | | |
| Options exercised | | | (310 | ) | | | (50,703 | ) | |
| Options expired | | | (2,220 | ) | | | (83,868 | ) | |
| Options outstanding at February 28, 2011 | | | — | | | $ | — | | |
See Accompanying Notes to Financial Statements.
11
Columbia Large Cap Core Fund
February 28, 2011
At February 28, 2011, the Fund held investments in the following sectors:
| Sector (Unaudited) | | % of
Net Assets | |
| Information Technology | | | 18.5 | | |
| Financials | | | 16.7 | | |
| Energy | | | 13.0 | | |
| Industrials | | | 11.1 | | |
| Consumer Discretionary | | | 11.0 | | |
| Health Care | | | 10.6 | | |
| Consumer Staples | | | 8.6 | | |
| Materials | | | 3.6 | | |
| Telecommunication Services | | | 3.4 | | |
| Utilities | | | 1.6 | | |
| | | | 98.1 | | |
| Short-Term Obligation | | | 0.9 | | |
| Other Assets & Liabilities, Net | | | 1.0 | | |
| | | | 100.0 | | |
| Acronym | | Name | |
| ADR | | American Depositary Receipt | |
See Accompanying Notes to Financial Statements.
12
Statement of Assets and Liabilities – Columbia Large Cap Core Fund
February 28, 2011
| | | | | ($) | |
| Assets | | Investments, at identified cost | | | 1,026,733,783 | | |
| | | Investments, at value | | | 1,231,357,521 | | |
| | | Cash | | | 909 | | |
| | | Receivable for: | | | | | |
| | | Investments sold | | | 6,041,948 | | |
| | | Fund shares sold | | | 35,778,159 | | |
| | | Dividends | | | 1,645,893 | | |
| | | Interest | | | 28 | | |
| | | Foreign tax reclaims | | | 8,788 | | |
| | | Prepaid expenses | | | 4,134 | | |
| | | Total Assets | | | 1,274,837,380 | | |
| Liabilities | | Expense reimbursement due to Investment Manager | | | 132 | | |
| | | Payable for: | | | | | |
| | | Investments purchased | | | 28,498,098 | | |
| | | Fund shares repurchased | | | 839,584 | | |
| | | Investment advisory fee | | | 516,014 | | |
| | | Administration fee | | | 144,216 | | |
| | | Pricing and bookkeeping fees | | | 12,414 | | |
| | | Transfer agent fee | | | 303,855 | | |
| | | Trustees' fees | | | 87,387 | | |
| | | Custody fee | | | 8,665 | | |
| | | Distribution and service fees | | | 28,358 | | |
| | | Chief compliance officer expenses | | | 282 | | |
| | | Interest payable | | | 264 | | |
| | | Other liabilities | | | 92,692 | | |
| | | Total Liabilities | | | 30,531,961 | | |
| | | Net Assets | | | 1,244,305,419 | | |
| Net Assets Consist of | | Paid-in capital | | | 1,158,178,011 | | |
| | | Undistributed net investment income | | | 659,266 | | |
| | | Accumulated net realized loss | | | (119,155,084 | ) | |
| | | Net unrealized appreciation (depreciation) on: | | | | | |
| | | Investments | | | 204,623,738 | | |
| | | Foreign currency translations | | | (512 | ) | |
| | | Net Assets | | | 1,244,305,419 | | |
See Accompanying Notes to Financial Statements.
13
Statement of Assets and Liabilities (continued) – Columbia Large Cap Core Fund
February 28, 2011
| Class A | | Net assets | | $ | 130,039,355 | | |
| | | Shares outstanding | | | 9,470,297 | | |
| | | Net asset value per share | | $ | 13.73 | (a) | |
| | | Maximum sales charge | | | 5.75 | % | |
| | | Maximum offering price per share ($13.73/0.9425) | | $ | 14.57 | (b) | |
| Class B | | Net assets | | $ | 1,653,306 | | |
| | | Shares outstanding | | | 124,756 | | |
| | | Net asset value and offering price per share | | $ | 13.25 | (a) | |
| Class C | | Net assets | | $ | 2,612,474 | | |
| | | Shares outstanding | | | 197,165 | | |
| | | Net asset value and offering price per share | | $ | 13.25 | (a) | |
| Class I (c) | | Net assets | | $ | 135,677,084 | | |
| | | Shares outstanding | | | 9,911,740 | | |
| | | Net asset value, offering and redemption price per share | | $ | 13.69 | | |
| Class W (c) | | Net assets | | $ | 2,909 | | |
| | | Shares outstanding | | | 212 | | |
| | | Net asset value, offering and redemption price per share | | $ | 13.73 | (d) | |
| Class Z | | Net assets | | $ | 974,320,291 | | |
| | | Shares outstanding | | | 71,165,064 | | |
| | | Net asset value, offering and redemption price per share | | $ | 13.69 | | |
(a) Redemption price per share is equal to net asset value less any applicable contingent deferred sales charge.
(b) On sales of $50,000 or more the offering price is reduced.
(c) Class I and Class W shares commenced operations on September 27, 2010.
(d) Net asset value per share rounds to this amount due to fractional shares outstanding.
See Accompanying Notes to Financial Statements.
14
Statement of Operations – Columbia Large Cap Core Fund
For the Year Ended February 28, 2011
| | | | | ($) (a) | |
| Investment Income | | Dividends | | | 17,921,570 | | |
| | | Interest | | | 14,165 | | |
| | | Foreign taxes withheld | | | (44,164 | ) | |
| | | Total Investment Income | | | 17,891,571 | | |
| Expenses | | Investment advisory fee | | | 6,368,587 | | |
| | | Administration fee | | | 1,770,094 | | |
| | | Distribution fee: | | | | | |
| | | Class B | | | 15,075 | | |
| | | Class C | | | 18,341 | | |
| | | Service fee: | | | | | |
| | | Class B | | | 5,025 | | |
| | | Class C | | | 6,128 | | |
| | | Class W | | | 3 | | |
| | | Distribution and service fees: | | | | | |
| | | Class A | | | 324,565 | | |
| | | Transfer agent fee: | | | | | |
| | | Class A, Class B, Class C, Class W and Class Z | | | 2,021,335 | | |
| | | Pricing and bookkeeping fees | | | 144,785 | | |
| | | Trustees' fees | | | 47,588 | | |
| | | Custody fee | | | 34,048 | | |
| | | Chief compliance officer expenses | | | 2,054 | | |
| | | Other expenses | | | 304,063 | | |
| | | Expenses before interest expense | | | 11,061,691 | | |
| | | Interest expense | | | 555 | | |
| | | Total Expenses | | | 11,062,246 | | |
| | | Expense reductions | | | (65 | ) | |
| | | Net Expenses | | | 11,062,181 | | |
| | | Net Investment Income | | | 6,829,390 | | |
| Net Realized and Unrealized Gain (Loss) on Investments, Foreign Currency and Written Options | | Net realized gain on: | | | | | |
| | | Investments | | | 118,311,728 | | |
| | | Written options | | | 83,868 | | |
| | | Net realized gain on investments | | | 118,395,596 | | |
| | | Net change in unrealized appreciation (depreciation) on: | | | | | |
| | | Investments | | | 86,340,142 | | |
| | | Foreign currency translations | | | 53 | | |
| | | Net change in unrealized appreciation (depreciation) | | | 86,340,195 | | |
| | | Net Gain | | | 204,735,791 | | |
| | | Net Increase Resulting from Operations | | | 211,565,181 | | |
(a) Class I and Class W shares commenced operations on September 27, 2010.
See Accompanying Notes to Financial Statements.
15
Statement of Changes in Net Assets – Columbia Large Cap Core Fund
| | | | | Year Ended February 28, | |
| Increase (Decrease) in Net Assets | | | | 2011 ($) (a)(b) | | 2010 ($) | |
| Operations | | Net investment income | | | 6,829,390 | | | | 10,467,997 | | |
| | | Net realized gain on investments and written options | | | 118,395,596 | | | | 80,931,541 | | |
| | | Net change in unrealized appreciation (depreciation)
on investments and foreign currency translations | | | 86,340,195 | | | | 280,916,714 | | |
| | | Net increase resulting from operations | | | 211,565,181 | | | | 372,316,252 | | |
| Distributions to Shareholders | | From net investment income: | | | | | | | | | |
| | | Class A | | | (597,562 | ) | | | (1,371,241 | ) | |
| | | Class B | | | — | | | | (15,727 | ) | |
| | | Class C | | | — | | | | (9,344 | ) | |
| | | Class I | | | (35,165 | ) | | | — | | |
| | | Class W | | | (10 | ) | | | — | | |
| | | Class Z | | | (7,052,482 | ) | | | (12,467,626 | ) | |
| | | Total distributions to shareholders | | | (7,685,219 | ) | | | (13,863,938 | ) | |
| | | Net Capital Stock Transactions | | | (85,011,943 | ) | | | (46,012,562 | ) | |
| | | Increase from regulatory settlements | | | — | | | | 120,276 | | |
| | | Total increase in net assets | | | 118,868,019 | | | | 312,560,028 | | |
| Net Assets | | Beginning of period | | | 1,125,437,400 | | | | 812,877,372 | | |
| | | End of period | | | 1,244,305,419 | | | | 1,125,437,400 | | |
| | | Undistributed net investment income at end of period | | | 659,266 | | | | 1,541,914 | | |
(a) Class I and Class W shares commenced operations on September 27, 2010.
(b) Class I and Class W shares reflect activity for the period September 27, 2010 through February 28, 2011.
See Accompanying Notes to Financial Statements.
16
Statement of Changes in Net Assets (continued) – Columbia Large Cap Core Fund
| | | Capital Stock Activity | |
| | | Year Ended
February 28, 2011 (a)(b) | | Year Ended
February 28, 2010 | |
| | | Shares | | Dollars ($) | | Shares | | Dollars ($) | |
| Class A | |
| Subscriptions | | | 819,382 | | | | 9,808,839 | | | | 1,222,912 | | | | 12,608,001 | | |
| Distributions reinvested | | | 18,628 | | | | 226,052 | | | | 122,487 | | | | 1,308,058 | | |
| Redemptions | | | (2,833,331 | ) | | | (34,605,798 | ) | | | (1,914,941 | ) | | | (19,942,435 | ) | |
| Net decrease | | | (1,995,321 | ) | | | (24,570,907 | ) | | | (569,542 | ) | | | (6,026,376 | ) | |
| Class B | |
| Subscriptions | | | 19,342 | | | | 224,627 | | | | 69,296 | | | | 609,730 | | |
| Distributions reinvested | | | — | | | | — | | | | 1,543 | | | | 14,711 | | |
| Redemptions | | | (137,222 | ) | | | (1,629,043 | ) | | | (256,473 | ) | | | (2,550,851 | ) | |
| Net decrease | | | (117,880 | ) | | | (1,404,416 | ) | | | (185,634 | ) | | | (1,926,410 | ) | |
| Class C | |
| Subscriptions | | | 17,206 | | | | 201,746 | | | | 57,843 | | | | 551,312 | | |
| Distributions reinvested | | | — | | | | — | | | | 895 | | | | 8,580 | | |
| Redemptions | | | (40,442 | ) | | | (466,541 | ) | | | (40,782 | ) | | | (409,555 | ) | |
| Net increase (decrease) | | | (23,236 | ) | | | (264,795 | ) | | | 17,956 | | | | 150,337 | | |
| Class I | |
| Subscriptions | | | 10,132,687 | | | | 135,559,701 | | | | — | | | | — | | |
| Distributions reinvested | | | 2,718 | | | | 35,146 | | | | — | | | | — | | |
| Redemptions | | | (223,665 | ) | | | (2,971,154 | ) | | | — | | | | — | | |
| Net increase | | | 9,911,740 | | | | 132,623,693 | | | | — | | | | — | | |
| Class W | |
| Subscriptions | | | 224 | | | | 2,650 | | | | — | | | | — | | |
| Redemptions | | | (12 | ) | | | (153 | ) | | | — | | | | — | | |
| Net increase | | | 212 | | | | 2,497 | | | | — | | | | — | | |
| Class Z | |
| Subscriptions | | | 7,245,250 | | | | 84,819,566 | | | | 14,909,900 | | | | 151,975,066 | | |
| Distributions reinvested | | | 209,444 | | | | 2,653,077 | | | | 370,569 | | | | 3,986,667 | | |
| Redemptions | | | (22,661,724 | ) | | | (278,870,658 | ) | | | (18,769,876 | ) | | | (194,171,846 | ) | |
| Net decrease | | | (15,207,030 | ) | | | (191,398,015 | ) | | | (3,489,407 | ) | | | (38,210,113 | ) | |
(a) Class I and Class W shares commenced operations on September 27, 2010.
(b) Class I and Class W shares reflect activity for the period September 27, 2010 through February 28, 2011.
See Accompanying Notes to Financial Statements.
17
Financial Highlights – Columbia Large Cap Core Fund
Selected data for a share outstanding throughout each period is as follows:
| | | Year Ended February 28, | | Period Ended
February 29, | | Year Ended March 31, | |
| Class A Shares | | 2011 | | 2010 | | 2009 | | 2008 (a)(b)(c) | | 2007 (a) | | 2006 (a)(d) | |
| Net Asset Value, Beginning of Period | | $ | 11.48 | | | $ | 7.95 | | | $ | 13.66 | | | $ | 14.86 | | | $ | 13.35 | | | $ | 12.00 | | |
| Income from Investment Operations: | |
| Net investment income (e) | | | 0.05 | | | | 0.08 | | | | 0.13 | | | | 0.11 | | | | 0.14 | | | | 0.11 | | |
Net realized and unrealized gain (loss)
on investments, foreign currency and
written options | | | 2.26 | | | | 3.57 | | | | (5.49 | ) | | | (0.41 | ) | | | 1.46 | | | | 1.35 | | |
| Total from investment operations | | | 2.31 | | | | 3.65 | | | | (5.36 | ) | | | (0.30 | ) | | | 1.60 | | | | 1.46 | | |
| Less Distributions to Shareholders: | |
| From net investment income | | | (0.06 | ) | | | (0.12 | ) | | | (0.10 | ) | | | (0.14 | ) | | | (0.09 | ) | | | (0.11 | ) | |
| From net realized gains | | | — | | | | — | | | | (0.25 | ) | | | (0.76 | ) | | | — | | | | — | | |
| Total distributions to shareholders | | | (0.06 | ) | | | (0.12 | ) | | | (0.35 | ) | | | (0.90 | ) | | | (0.09 | ) | | | (0.11 | ) | |
| Increase from regulatory settlements | | | — | | | | — | (f) | | | — | | | | — | | | | — | | | | — | | |
| Net Asset Value, End of Period | | $ | 13.73 | | | $ | 11.48 | | | $ | 7.95 | | | $ | 13.66 | | | $ | 14.86 | | | $ | 13.35 | | |
| Total return (g) | | | 20.16 | % | | | 45.99 | %(h) | | | (40.12 | )%(h) | | | (2.69 | )%(i) | | | 12.00 | % | | | 12.19 | %(h) | |
| Ratios to Average Net Assets/Supplemental Data: | |
| Net expenses before interest expense | | | 1.20 | %(j) | | | 1.18 | %(j) | | | 1.15 | %(j) | | | 1.07 | %(j)(k) | | | 1.05 | %(j) | | | 1.03 | % | |
| Interest expense | | | — | %(l) | | | — | %(l) | | | — | %(l) | | | — | %(k)(l) | | | — | %(l) | | | — | | |
| Net expenses | | | 1.20 | %(j) | | | 1.18 | %(j) | | | 1.15 | %(j) | | | 1.07 | %(j)(k) | | | 1.05 | %(j) | | | 1.03 | % | |
| Waiver/Reimbursement | | | — | | | | — | %(l) | | | — | %(l) | | | — | | | | — | | | | 0.06 | %(m) | |
| Net investment income | | | 0.38 | %(j) | | | 0.78 | %(j) | | | 1.10 | %(j) | | | 0.81 | %(j)(k) | | | 0.98 | %(j) | | | 0.86 | % | |
| Portfolio turnover rate | | | 171 | % | | | 165 | % | | | 156 | % | | | — | %(i)(l)(n) | | | — | | | | — | | |
Turnover of Columbia Large Cap Core
Master Portfolio | | | — | | | | — | | | | — | | | | 98 | %(i) | | | 148 | % | | | 106 | % | |
| Net assets, end of period (000s) | | $ | 130,039 | | | $ | 131,652 | | | $ | 95,714 | | | $ | 172,569 | | | $ | 194,203 | | | $ | 201,359 | | |
(a) The per share amounts and percentages reflect income and expenses assuming inclusion of the Fund's proportionate share of the income and expenses of Columbia Large Cap Core Master Portfolio.
(b) The Fund changed its fiscal year end from March 31 to February 29. Per share data and total return reflect activity from April 1, 2007 through February 29, 2008.
(c) Effective February 28, 2008, the Fund converted to a stand-alone fund. Prior to February 28, 2008, the Fund operated in a master-feeder structure.
(d) On August 22, 2005, the Fund's Investor A shares were renamed Class A shares.
(e) Per share data was calculated using the average shares outstanding during the period.
(f) Rounds to less than $0.01 per share.
(g) Total return at net asset value assuming all distributions reinvested and no initial sales charge or contingent deferred sales charge.
(h) Had the Investment Manager and/or any of its affiliates not waived fees or reimbursed a portion of expenses, total return would have been reduced.
(i) Not annualized.
(j) The benefits derived from expense reductions had an impact of less than 0.01%.
(k) Annualized.
(l) Rounds to less than 0.01%.
(m) Bank of America Corporation assumed certain non-recurring costs. Absent these non-recurring costs, the waiver/reimbursement ratio would have been —%.
(n) Amount represents results after the Fund's conversion to a stand-alone structure on February 28, 2008.
See Accompanying Notes to Financial Statements.
18
Financial Highlights – Columbia Large Cap Core Fund
Selected data for a share outstanding throughout each period is as follows:
| | | Year Ended February 28, | | Period Ended
February 29, | | Year Ended March 31, | |
| Class B Shares | | 2011 | | 2010 | | 2009 | | 2008 (a)(b)(c) | | 2007 (a) | | 2006 (a)(d) | |
| Net Asset Value, Beginning of Period | | $ | 11.11 | | | $ | 7.71 | | | $ | 13.23 | | | $ | 14.39 | | | $ | 12.95 | | | $ | 11.65 | | |
| Income from Investment Operations: | |
| Net investment income (loss) (e) | | | (0.04 | ) | | | — | (f) | | | 0.03 | | | | — | (f) | | | 0.03 | | | | 0.01 | | |
Net realized and unrealized gain (loss)
on investments, foreign currency and
written options | | | 2.18 | | | | 3.44 | | | | (5.28 | ) | | | (0.40 | ) | | | 1.41 | | | | 1.31 | | |
| Total from investment operations | | | 2.14 | | | | 3.44 | | | | (5.25 | ) | | | (0.40 | ) | | | 1.44 | | | | 1.32 | | |
| Less Distributions to Shareholders: | |
| From net investment income | | | — | | | | (0.04 | ) | | | (0.02 | ) | | | — | (f) | | | — | | | | (0.02 | ) | |
| From net realized gains | | | — | | | | — | | | | (0.25 | ) | | | (0.76 | ) | | | — | | | | — | | |
| Total distributions to shareholders | | | — | | | | (0.04 | ) | | | (0.27 | ) | | | (0.76 | ) | | | — | | | | (0.02 | ) | |
| Increase from regulatory settlements | | | — | | | | — | (f) | | | — | | | | — | | | | — | | | | — | | |
| Net Asset Value, End of Period | | $ | 13.25 | | | $ | 11.11 | | | $ | 7.71 | | | $ | 13.23 | | | $ | 14.39 | | | $ | 12.95 | | |
| Total return (g) | | | 19.26 | % | | | 44.74 | %(h) | | | (40.51 | )%(h) | | | (3.34 | )%(i) | | | 11.12 | % | | | 11.33 | %(h) | |
| Ratios to Average Net Assets/Supplemental Data: | |
| Net expenses before interest expense | | | 1.95 | %(j) | | | 1.93 | %(j) | | | 1.90 | %(j) | | | 1.82 | %(k)(j) | | | 1.80 | %(j) | | | 1.78 | % | |
| Interest expense | | | — | %(l) | | | — | %(l) | | | — | %(l) | | | — | %(k)(l) | | | — | %(l) | | | — | | |
| Net expenses | | | 1.95 | %(j) | | | 1.93 | %(j) | | | 1.90 | %(j) | | | 1.82 | %(j)(k) | | | 1.80 | %(j) | | | 1.78 | % | |
| Waiver/Reimbursement | | | — | | | | — | %(l) | | | — | %(l) | | | — | | | | — | | | | 0.06 | %(m) | |
| Net investment income (loss) | | | (0.36 | )%(j) | | | 0.04 | %(j) | | | 0.28 | %(j) | | | 0.03 | %(j)(k) | | | 0.21 | %(j) | | | 0.11 | % | |
| Portfolio turnover rate | | | 171 | % | | | 165 | % | | | 156 | % | | | — | %(i)(l)(n) | | | — | | | | — | | |
Turnover of Columbia Large Cap Core
Master Portfolio | | | — | | | | — | | | | — | | | | 98 | %(i) | | | 148 | % | | | 106 | % | |
| Net assets, end of period (000s) | | $ | 1,653 | | | $ | 2,696 | | | $ | 3,300 | | | $ | 13,247 | | | $ | 25,523 | | | $ | 31,542 | | |
(a) The per share amounts and percentages reflect income and expenses assuming inclusion of the Fund's proportionate share of the income and expenses of Columbia Large Cap Core Master Portfolio.
(b) The Fund changed its fiscal year end from March 31 to February 29. Per share data and total return reflect activity from April 1, 2007 through February 29, 2008.
(c) Effective February 28, 2008, the Fund converted to a stand-alone fund. Prior to February 28, 2008, the Fund operated in a master-feeder structure.
(d) On August 22, 2005, the Fund's Investor B shares were renamed Class B shares.
(e) Per share data was calculated using the average shares outstanding during the period.
(f) Rounds to less than $0.01 per share.
(g) Total return at net asset value assuming all distributions reinvested and no contingent deferred sales charge.
(h) Had the Investment Manager and/or any of its affiliates not waived fees or reimbursed a portion of expenses, total return would have been reduced.
(i) Not annualized.
(j) The benefits derived from expense reductions had an impact of less than 0.01%.
(k) Annualized.
(l) Rounds to less than 0.01%.
(m) Bank of America Corporation assumed certain non-recurring costs. Absent these non-recurring costs, the waiver/reimbursement ratio would have been —%.
(n) Amount represents results after the Fund's conversion to a stand-alone structure on February 28, 2008.
See Accompanying Notes to Financial Statements.
19
Financial Highlights – Columbia Large Cap Core Fund
Selected data for a share outstanding throughout each period is as follows:
| | | Year Ended February 28, | | Period Ended
February 29, | | Year Ended March 31, | |
| Class C Shares | | 2011 | | 2010 | | 2009 | | 2008 (a)(b)(c) | | 2007 (a) | | 2006 (a)(d) | |
| Net Asset Value, Beginning of Period | | $ | 11.11 | | | $ | 7.70 | | | $ | 13.23 | | | $ | 14.39 | | | $ | 12.94 | | | $ | 11.64 | | |
| Income from Investment Operations: | |
| Net investment income (loss) (e) | | | (0.04 | ) | | | — | (f) | | | 0.04 | | | | 0.01 | | | | 0.03 | | | | 0.01 | | |
Net realized and unrealized gain (loss)
on investments, foreign currency and
written options | | | 2.18 | | | | 3.45 | | | | (5.30 | ) | | | (0.41 | ) | | | 1.42 | | | | 1.31 | | |
| Total from investment operations | | | 2.14 | | | | 3.45 | | | | (5.26 | ) | | | (0.40 | ) | | | 1.45 | | | | 1.32 | | |
| Less Distributions to Shareholders: | |
| From net investment income | | | — | | | | (0.04 | ) | | | (0.02 | ) | | | — | (f) | | | — | | | | (0.02 | ) | |
| From net realized gains | | | — | | | | — | | | | (0.25 | ) | | | (0.76 | ) | | | — | | | | — | | |
| Total distributions to shareholders | | | — | | | | (0.04 | ) | | | (0.27 | ) | | | (0.76 | ) | | | — | | | | (0.02 | ) | |
| Increase from regulatory settlements | | | — | | | | — | (f) | | | — | | | | — | | | | — | | | | — | | |
| Net Asset Value, End of Period | | $ | 13.25 | | | $ | 11.11 | | | $ | 7.70 | | | $ | 13.23 | | | $ | 14.39 | | | $ | 12.94 | | |
| Total return (g) | | | 19.26 | % | | | 44.93 | %(h) | | | (40.58 | )%(h) | | | (3.34 | )%(i) | | | 11.21 | % | | | 11.34 | %(h) | |
| Ratios to Average Net Assets/Supplemental Data: | |
| Net expenses before interest expense | | | 1.95 | %(j) | | | 1.93 | %(j) | | | 1.90 | %(j) | | | 1.82 | %(j)(k) | | | 1.80 | %(j) | | | 1.78 | % | |
| Interest expense | | | — | %(l) | | | — | %(l) | | | — | %(l) | | | — | %(k)(l) | | | — | %(l) | | | — | | |
| Net expenses | | | 1.95 | %(j) | | | 1.93 | %(j) | | | 1.90 | %(j) | | | 1.82 | %(j)(k) | | | 1.80 | %(j) | | | 1.78 | % | |
| Waiver/Reimbursement | | | — | | | | — | %(l) | | | — | %(l) | | | — | | | | — | | | | 0.06 | %(m) | |
| Net investment income (loss) | | | (0.36 | )%(j) | | | 0.03 | %(j) | | | 0.39 | %(j) | | | 0.04 | %(j)(k) | | | 0.21 | %(j) | | | 0.11 | % | |
| Portfolio turnover rate | | | 171 | % | | | 165 | % | | | 156 | % | | | — | %(i)(l)(n) | | | — | | | | — | | |
Turnover of Columbia Large Cap Core
Master Portfolio | | | — | | | | — | | | | — | | | | 98 | %(i) | | | 148 | % | | | 106 | % | |
| Net assets, end of period (000s) | | $ | 2,612 | | | $ | 2,449 | | | $ | 1,559 | | | $ | 2,168 | | | $ | 11,413 | | | $ | 14,026 | | |
(a) The per share amounts and percentages reflect income and expenses assuming inclusion of the Fund's proportionate share of the income and expenses of Columbia Large Cap Core Master Portfolio.
(b) The Fund changed its fiscal year end from March 31 to February 29. Per share data and total return reflect activity from April 1, 2007 through February 29, 2008.
(c) Effective February 28, 2008, the Fund converted to a stand-alone fund. Prior to February 28, 2008, the Fund operated in a master-feeder structure.
(d) On August 22, 2005, the Fund's Investor C shares were renamed Class C shares.
(e) Per share data was calculated using the average shares outstanding during the period.
(f) Rounds to less than $0.01 per share.
(g) Total return at net asset value assuming all distributions reinvested and no contingent deferred sales charge.
(h) Had the Investment Manager and/or any of its affiliates not waived fees or reimbursed a portion of expenses, total return would have been reduced.
(i) Not annualized.
(j) The benefits derived from expense reductions had an impact of less than 0.01%.
(k) Annualized.
(l) Rounds to less than 0.01%.
(m) Bank of America Corporation assumed certain non-recurring costs. Absent these non-recurring costs, the waiver/reimbursement ratio would have been —%.
(n) Amount represents results after the Fund's conversion to a stand-alone structure on February 28, 2008.
See Accompanying Notes to Financial Statements.
20
Financial Highlights – Columbia Large Cap Core Fund
Selected data for a share outstanding throughout the period is as follows:
| Class I Shares | | Period Ended
February 28,
2011 (a) | |
| Net Asset Value, Beginning of Period | | $ | 11.78 | | |
| Income from Investment Operations: | |
| Net investment income (b) | | | 0.04 | | |
| Net realized and unrealized gain on investments and foreign currency | | | 1.96 | | |
| Total from investment operations | | | 2.00 | | |
| Less Distributions to Shareholders: | |
| From net investment income | | | (0.09 | ) | |
| Net Asset Value, End of Period | | $ | 13.69 | | |
| Total return (c)(d) | | | 16.99 | % | |
| Ratios to Average Net Assets/Supplemental Data: | |
| Net expenses before interest expense (e)(f) | | | 0.79 | % | |
| Interest expense (f)(g) | | | — | % | |
| Net expenses (e)(f) | | | 0.79 | % | |
| Net investment income (e)(f) | | | 0.64 | % | |
| Portfolio turnover rate (c) | | | 171 | % | |
| Net assets, end of period (000s) | | $ | 135,677 | | |
(a) Class I shares commenced operations on September 27, 2010. Per share data and total return reflect activity from that date.
(b) Per share data was calculated using the average shares outstanding during the period.
(c) Not annualized.
(d) Total return at net asset value assuming all distributions reinvested.
(e) The benefits derived from expense reductions had an impact of less than 0.01%.
(f) Annualized.
(g) Rounds to less than 0.01%.
See Accompanying Notes to Financial Statements.
21
Financial Highlights – Columbia Large Cap Core Fund
Selected data for a share outstanding throughout the period is as follows:
| Class W Shares | | Period Ended
February 28,
2011 (a) | |
| Net Asset Value, Beginning of Period | | $ | 11.80 | | |
| Income from Investment Operations: | |
| Net investment income (b) | | | 0.03 | | |
| Net realized and unrealized gain on investments and foreign currency | | | 1.95 | | |
| Total from investment operations | | | 1.98 | | |
| Less Distributions to Shareholders: | |
| From net investment income | | | (0.05 | ) | |
| Net Asset Value, End of Period | | $ | 13.73 | | |
| Total return (c)(d) | | | 16.77 | % | |
| Ratios to Average Net Assets/Supplemental Data: | |
| Net expenses before interest expense (e)(f) | | | 1.16 | % | |
| Interest expense (f)(g) | | | — | % | |
| Net expenses (e)(f) | | | 1.16 | % | |
| Net investment income (e)(f) | | | 0.50 | % | |
| Portfolio turnover rate (d) | | | 171 | % | |
| Net assets, end of period (000s) | | $ | 3 | | |
(a) Class W shares commenced operations on September 27, 2010. Per share data and total return reflect activity from that date.
(b) Per share data was calculated using the average shares outstanding during the period.
(c) Total return at net asset value assuming all distributions reinvested and no contingent deferred sales charge.
(d) Not annualized.
(e) The benefits derived from expense reductions had an impact of less than 0.01%.
(f) Annualized.
(g) Rounds to less than 0.01%.
See Accompanying Notes to Financial Statements.
22
Financial Highlights – Columbia Large Cap Core Fund
Selected data for a share outstanding throughout each period is as follows:
| | | Year Ended February 28, | | Period Ended
February 29, | | Year Ended March 31, | |
| Class Z Shares | | 2011 | | 2010 | | 2009 | | 2008 (a)(b)(c) | | 2007 (a) | | 2006 (a)(d) | |
| Net Asset Value, Beginning of Period | | $ | 11.45 | | | $ | 7.93 | | | $ | 13.66 | | | $ | 14.88 | | | $ | 13.39 | | | $ | 12.03 | | |
| Income from Investment Operations: | |
| Net investment income (e) | | | 0.08 | | | | 0.11 | | | | 0.16 | | | | 0.15 | | | | 0.17 | | | | 0.14 | | |
Net realized and unrealized gain (loss)
on investments, foreign currency and
written options | | | 2.25 | | | | 3.55 | | | | (5.48 | ) | | | (0.41 | ) | | | 1.47 | | | | 1.36 | | |
| Total from investment operations | | | 2.33 | | | | 3.66 | | | | (5.32 | ) | | | (0.26 | ) | | | 1.64 | | | | 1.50 | | |
| Less Distributions to Shareholders: | |
| From net investment income | | | (0.09 | ) | | | (0.14 | ) | | | (0.16 | ) | | | (0.20 | ) | | | (0.15 | ) | | | (0.14 | ) | |
| From net realized gains | | | — | | | | — | | | | (0.25 | ) | | | (0.76 | ) | | | — | | | | — | | |
| Total distributions to shareholders | | | (0.09 | ) | | | (0.14 | ) | | | (0.41 | ) | | | (0.96 | ) | | | (0.15 | ) | | | (0.14 | ) | |
| Increase from regulatory settlements | | | — | | | | — | (f) | | | — | | | | — | | | | — | | | | — | | |
| Net Asset Value, End of Period | | $ | 13.69 | | | $ | 11.45 | | | $ | 7.93 | | | $ | 13.66 | | | $ | 14.88 | | | $ | 13.39 | | |
| Total return (g) | | | 20.40 | % | | | 46.30 | %(h) | | | (39.95 | )%(h) | | | (2.43 | )%(i) | | | 12.28 | % | | | 12.50 | %(h) | |
| Ratios to Average Net Assets/Supplemental Data: | |
| Net expenses before interest expense | | | 0.95 | %(j) | | | 0.93 | %(j) | | | 0.90 | %(j) | | | 0.82 | %(j)(k) | | | 0.80 | %(j) | | | 0.78 | % | |
| Interest expense | | | — | %(l) | | | — | %(l) | | | — | %(l) | | | — | %(k)(l) | | | — | %(l) | | | — | | |
| Net expenses | | | 0.95 | %(j) | | | 0.93 | %(j) | | | 0.90 | %(j) | | | 0.82 | %(j)(k) | | | 0.80 | %(j) | | | 0.78 | % | |
| Waiver/Reimbursement | | | — | | | | — | %(l) | | | — | %(l) | | | — | | | | — | | | | 0.06 | %(m) | |
| Net investment income | | | 0.64 | %(j) | | | 1.03 | %(j) | | | 1.35 | %(j) | | | 1.06 | %(j)(k) | | | 1.23 | %(j) | | | 1.11 | % | |
| Portfolio turnover rate | | | 171 | % | | | 165 | % | | | 156 | % | | | — | %(i)(l)(n) | | | — | | | | — | | |
Turnover of Columbia Large Cap Core
Master Portfolio | | | — | | | | — | | | | — | | | | 98 | %(i) | | | 148 | % | | | 106 | % | |
| Net assets, end of period (000s) | | $ | 974,320 | | | $ | 988,640 | | | $ | 712,304 | | | $ | 1,285,598 | | | $ | 1,466,653 | | | $ | 1,347,623 | | |
(a) The per share amounts and percentages reflect income and expenses assuming inclusion of the Fund's proportionate share of the income and expenses of Columbia Large Cap Core Master Portfolio.
(b) The Fund changed its fiscal year end from March 31 to February 29. Per share data and total return reflect activity from April 1, 2007 through February 29, 2008.
(c) Effective February 28, 2008, the Fund converted to a stand-alone fund. Prior to February 28, 2008, the Fund operated in a master-feeder structure.
(d) On August 22, 2005, the Fund's Primary A shares were renamed Class Z shares.
(e) Per share data was calculated using the average shares outstanding during the period.
(f) Rounds to less than $0.01 per share.
(g) Total return at net asset value assuming all distributions reinvested.
(h) Had the Investment Manager and/or any of its affiliates not waived fees or reimbursed a portion of expenses, total return would have been reduced.
(i) Not annualized.
(j) The benefits derived from expense reductions had an impact of less than 0.01%.
(k) Annualized.
(l) Rounds to less than 0.01%.
(m) Bank of America Corporation assumed certain non-recurring costs. Absent these non-recurring costs, the waiver/reimbursement ratio would have been —%.
(n) Amount represents results after the Fund's conversion to a stand-alone structure on February 28, 2008.
See Accompanying Notes to Financial Statements.
23
Notes to Financial Statements – Columbia Large Cap Core Fund
February 28, 2011
Note 1. Organization
Columbia Large Cap Core Fund (the Fund), a series of Columbia Funds Series Trust (the Trust), is a diversified fund. The Trust is registered under the Investment Company Act of 1940, as amended (the 1940 Act), as an open-end management investment company organized as a Delaware statutory trust.
After the close of business on April 30, 2010, Ameriprise Financial, Inc. (Ameriprise Financial) acquired a portion of the asset management business of Columbia Management Group, LLC (the Transaction), including the business of managing the Fund. In connection with the closing of the Transaction (the Closing), RiverSource Investments, LLC, a wholly owned subsidiary of Ameriprise Financial, became the investment manager of the Fund and changed its name to Columbia Management Investment Advisers, LLC (the Investment Manager).
Investment Objective
The Fund seeks long-term capital appreciation.
Fund Shares
The Trust has unlimited authorized shares of beneficial interest. The Fund offers Class A, Class B, Class C, Class I, Class W and Class Z shares. On December 17, 2010, the Investment Manager exchanged Class Z shares valued at $45,421,323 for Class I shares. All share classes have identical voting, dividend and liquidation rights. Each share class has its own expense structure and sales charges, as applicable.
Class A shares are subject to a maximum front-end sales charge of 5.75% based on the investment amount. Class A shares purchased without an initial sales charge in accounts aggregating $1 million to $50 million at the time of purchase are subject to a 1.00% contingent deferred sales charge (CDSC) if the shares are sold within 18 months of purchase, charged as follows: 1.00% CDSC if redeemed within 12 months of purchase, and 0.50% CDSC if redeemed more than 12, but less than 18 months after purchase.
The Fund no longer accepts investments by new or existing investors in the Fund's Class B shares, except in connection with the reinvestment of any dividend and/or capital gain distributions in Class B shares of the Fund and exchanges by existing Class B shareholders of certain other funds within the Columbia Family of Funds. Class B shares may be subject to a maximum CDSC of 5.00% based upon the holding period after purchase. Class B shares will generally convert to Class A shares eight years after purchase.
Class C shares are subject to a 1.00% CDSC on shares redeemed within one year of purchase.
Class I shares are not subject to sales charges and are available only to the Columbia Family of Funds. Class I shares became effective September 27, 2010.
Class W shares are not subject to sales charges and are available only to investors purchasing through authorized investment programs managed by investment professionals, including discretionary managed account programs. Class W shares became effective September 27, 2010.
Class Z shares are not subject to sales charges and are available only to certain investors, as described in the Fund's prospectus.
Note 2. Summary of Significant Accounting Policies
The preparation of financial statements in accordance with U.S. generally accepted accounting principles (GAAP) requires the Investment Manager to make certain estimates and assumptions that affect the reported amounts of assets and liabilities, the disclosure of contingent assets and liabilities at the date of the financial statements and the reported amounts of revenue and expenses during the reporting period. Actual results could differ from those estimates.
The following is a summary of significant accounting policies consistently followed by the Fund in the preparation of its financial statements.
Security Valuation
Equity securities are valued at the last sale price on the principal exchange on which they trade, except for securities traded on the NASDAQ, which are valued at the NASDAQ official close price. Unlisted securities or listed securities for which there were no sales during the day are valued at the closing bid price on such exchanges or over-the-counter markets.
Short-term investments maturing in 60 days or less are valued at amortized cost, which approximates market value.
Written options are valued at the last reported sale price, or in the absence of a sale, at the last quoted ask price.
Foreign securities are generally valued at the last sale price on the foreign exchange or market on which they trade. If any foreign share prices are not readily available as a result of limited share activity, the securities are valued at the last sale price of the local shares in the principal market in which such securities are normally traded.
Generally, trading in foreign securities is substantially completed each day at various times prior to the close of the New York Stock Exchange (NYSE). The values of such securities used in computing
24
Columbia Large Cap Core Fund, February 28, 2011
the net asset value of the Fund's shares are determined as of such times. Foreign currency exchange rates are generally determined at 4:00 p.m. Eastern (U.S.) time. Occasionally, events affecting the values of such foreign securities may occur between the times at which they are determined and the close of the customary trading session of the NYSE, which would not be reflected in the computation of the Fund's net asset value. If events materially affecting the values of such foreign securities occur and it is determined that market quotations are not reliable, then these foreign securities will be valued at their fair value using procedures approved by the Board of Trustees.
Investments for which market quotations are not readily available, or that have quotations which the Investment Manager believes are not reliable, are valued at fair value as determined in good faith under consistently applied procedures established by and under the general supervision of the Board of Trustees. If a security is valued at fair value, such value is likely to be different from the last quoted market price for the security. The determination of fair value often requires significant judgment. To determine fair value, the Investment Manager may use assumptions including but not limited to future cash flows and estimated risk premiums. Multiple inputs from various sources may be used to determine value.
Foreign Currency Transactions and Translations
The values of all assets and liabilities quoted in foreign currencies are translated into U.S. dollars at that day's exchange rates. Net realized and unrealized gains (losses) on foreign currency transactions and translations include gains (losses) arising from the fluctuation in exchange rates between trade and settlement dates on securities transactions, gains (losses) arising from the disposition of foreign currency and currency gains (losses) between the accrual and payment dates on dividends, interest income and foreign withholding taxes.
For financial statement purposes, the Fund does not distinguish that portion of gains (losses) on investments which is due to changes in foreign exchange rates from that which is due to changes in market prices of the investments. Such fluctuations are included with the net realized and unrealized gains (losses) on investments on the Statement of Operations.
Derivative Instruments
The Fund may use derivative instruments including options in order to meet its investment objectives. The Fund employs strategies in differing combinations to permit it to increase, decrease or change the level of exposure to market risk factors. The achievement of any strategy relating to derivatives depends on an analysis of various risk factors, and if the strategies for the use of derivatives do not work as intended, the Fund may not achieve its investment objectives.
In pursuit of its investment objectives, the Fund is exposed to the following market risks, among others:
Equity Risk: Equity risk relates to change in value of equity securities such as common stocks due to general market conditions such as real or perceived adverse economic conditions, changes in the general outlook for corporate earnings, or adverse investor sentiment. Equity securities generally have greater price volatility than fixed income securities.
The following provides more detailed information about the derivative type held by the Fund:
Options—The Fund had written covered call options to decrease the Fund's exposure to equity risk on investments. Written covered call options become more valuable as the price of the underlying instruments depreciates relative to the strike price.
Writing put options tends to increase the Fund's exposure to the underlying instrument. When the Fund writes a call or put option, an amount equal to the premium received is recorded as a liability and subsequently marked-to-market to reflect the current value of the option written. Premiums received from writing options which expire are treated as realized gains. Premiums received from writing options which are exercised or closed are added to the proceeds or offset against the amounts paid on the underlying security transaction to determine the realized gain or loss. The Fund, as a writer of an option, has no control over whether the underlying security may be sold (call) or purchased (put) and as a result bears the market risk of an unfavorable change in the price of the security underlying the written option. There is the risk that the Fund may not be able to enter into a closing transaction because of an illiquid market. The Fund identifies within its portfolio of investments cash or liquid portfolio securities equal to the amount of the written options contract commitment.
The Fund may also purchase put and call options. Purchasing call options tends to increase the Fund's exposure to the underlying instrument. Purchasing put options tends to decrease the Fund's exposure to the underlying instrument. The Fund may pay a premium, which is included in the Fund's Statement of Assets and Liabilities as an investment and subsequently marked-to-market to reflect the current value of the option. The risk associated with purchasing put and call options is limited to the premium paid. Premiums paid for purchasing options which expire are treated as realized losses. Premiums paid for purchasing options which are
25
Columbia Large Cap Core Fund, February 28, 2011
exercised are added to the amounts paid (call) or offset against the proceeds (put) on the underlying security to determine the realized gain or loss. If the Fund enters into a closing transaction, the Fund will realize a gain or loss, depending on whether the proceeds from the closing transaction are greater or less than the cost of the option.
During the year ended February 28, 2011, the Fund entered into 2,530 written options contracts.
The effect of derivative instruments on the Fund's Statement of Operations for the year ended February 28, 2011:
| | | Amount of Realized Gain or (Loss)
and Change in Unrealized Appreciation
(Depreciation) on Derivatives Recognized in Income | |
| | | Risk Exposure | | Net Realized
Gain (Loss) | | Change in
Unrealized
Appreciation
(Depreciation) | |
| Written Call Options | | Equity Risk | | $ | 83,868 | | | $ | — | | |
Repurchase Agreements
The Fund may engage in repurchase agreement transactions with institutions that the Investment Manager has determined are creditworthy. The Fund, through the custodian, receives delivery of the underlying securities collateralizing a repurchase agreement. The Investment Manager is responsible for determining that the collateral is at least equal, at all times, to the value of the repurchase obligation including interest. A repurchase agreement transaction involves certain risks in the event of default or insolvency of the counterparty. These risks include possible delays in or restrictions on the Fund's ability to dispose of the underlying securities and a possible decline in the value of the underlying securities during the period while the Fund seeks to assert its rights.
Security Transactions
Security transactions are accounted for on the trade date. Cost is determined and gains (losses) are based upon the specific identification method for both financial statement and federal income tax purposes.
Income Recognition
Interest income is recorded on the accrual basis.
Awards from class action litigation are recorded as a reduction of cost if the Fund still owns the applicable securities on the payment date. If the Fund no longer owns the applicable securities, the proceeds are recorded as realized gains.
Corporate actions and dividend income are recorded net of any non-reclaimable tax withholdings, on the ex-dividend date or upon receipt of ex-dividend notification in the case of certain foreign securities.
Expenses
General expenses of the Trust are allocated to the Fund and other series of the Trust based upon relative net assets or other expense allocation methodologies determined by the nature of the expense. Expenses directly attributable to a specific class of shares are charged to that share class. Expenses directly attributable to the Fund are charged to the Fund.
Determination of Class Net Asset Value
All income, expenses (other than class-specific expenses which are charged directly to a share class, as shown in the Statement of Operations) and realized and unrealized gains (losses) are allocated to each class of the Fund on a daily basis for purposes of determining the net asset value of each class. Income and expenses are allocated to each class based on the settled shares method, while realized and unrealized gains (losses) are allocated based on the relative net assets of each class.
Federal Income Tax Status
The Fund intends to qualify each year as a regulated investment company under Subchapter M of the Internal Revenue Code, as amended, and will distribute substantially all of its taxable income, if any, for its tax year, and as such will not be subject to federal income taxes. In addition, the Fund intends to distribute in each calendar year substantially all of its net investment income, capital gains and certain other amounts, if any, such that the Fund should not be
26
Columbia Large Cap Core Fund, February 28, 2011
subject to federal excise tax. Therefore, no federal income or excise tax provision is recorded.
Distributions to Shareholders
Distributions from net investment income, if any, are declared and paid semi-annually. The Fund may, however, declare and pay distributions from net investment income more frequently. The Fund will distribute net realized capital gains (including net short-term capital gains) at least annually after the fiscal year in which the capital gains were earned, unless offset by any available capital loss carryforward. Income distributions and capital gain distributions are determined in accordance with federal income tax regulations which may differ from GAAP.
Indemnification
In the normal course of business, the Fund enters into contracts that contain a variety of representations and warranties and which provide general indemnities. The Fund's maximum exposure under these arrangements is unknown because this would involve future claims against the Fund. Also, under the Trust's organizational documents and by contract, the Trustees and officers of the Trust are indemnified against certain liabilities that may arise out of actions relating to their duties to the Trust. However, based on experience, the Fund expects the risk of loss due to these representations, warranties and indemnities to be minimal.
Note 3. Fees and Compensation Paid to Affiliates
Investment Management Services Fee
The Investment Manager determines which securities will be purchased, held or sold. The management fee is based on the Fund's average daily net assets at the following annual rates:
| Average Daily Net Assets | | Annual Fee Rate | |
| First $500 million | | | 0.60 | % | |
| $500 million to $1 billion | | | 0.55 | % | |
| $1 billion to $1.5 billion | | | 0.50 | % | |
| $1.5 billion to $3 billion | | | 0.45 | % | |
| $3 billion to $6 billion | | | 0.43 | % | |
| Over $6 billion | | | 0.41 | % | |
Prior to the Closing, Columbia Management Advisors, LLC (Columbia), an indirect, wholly owned subsidiary of Bank of America Corporation (BOA), provided investment management services to the Fund under the same fee structure.
The effective management fee rate for the year ended February 28, 2011, was 0.57% of the Fund's average daily net assets.
In September 2010, the Board of Trustees approved an amended Investment Management Services Agreement (IMSA) with the Investment Manager that increases the management fee rates payable to the Investment Manager at all asset levels. The IMSA was approved by the Fund's shareholders at a Special Meeting of Shareholders held on February 15, 2011. The IMSA, which is March 1, 2011, revises the management fee rates as follows:
| Average Daily Net Assets | | Annual Fee Rate | |
| First $500 million | | | 0.710 | % | |
| $500 million to $1 billion | | | 0.665 | % | |
| $1 billion to $1.5 billion | | | 0.620 | % | |
| $1.5 billion to $3 billion | | | 0.570 | % | |
| $3 billion to $6 billion | | | 0.560 | % | |
| Over $6 billion | | | 0.540 | % | |
Administration Fee
Effective upon the Closing, the Investment Manager became the administrator of the Fund and provides administrative and other services to the Fund, including services previously performed under the Pricing and Bookkeeping Oversight and Services Agreement discussed below. The administration fee is based on the annual rate of 0.17% of the Fund's average daily net assets, less the fees payable by the Fund as described under the Pricing and Bookkeeping Fees note below. Prior to the Closing, Columbia provided administrative services to the Fund at the same fee rate.
In connection with the IMSA approved by the Board of Trustees, effective March 1, 2011, the Fund will pay a reduced monthly administration fee to the Investment Manager based on the Fund's average daily net assets at the following annual rates:
| Average Daily Net Assets | | Annual Fee Rate | |
| First $500 million | | | 0.060 | % | |
| $500 million to $1 billion | | | 0.055 | % | |
| $1 billion to $3 billion | | | 0.050 | % | |
| $3 billion to $12 billion | | | 0.040 | % | |
| Over $12 billion | | | 0.030 | % | |
27
Columbia Large Cap Core Fund, February 28, 2011
Pricing and Bookkeeping Fees
Prior to the Closing, the Fund entered into a Financial Reporting Services Agreement (the Financial Reporting Services Agreement) with State Street Bank and Trust Company (State Street) and Columbia pursuant to which State Street provides financial reporting services to the Fund. The Fund also entered into an Accounting Services Agreement (collectively with the Financial Reporting Services Agreement, the State Street Agreements) with State Street and Columbia pursuant to which State Street provides accounting services to the Fund. Upon the Closing, Columbia assigned and delegated its rights and obligations under the State Street Agreements to the Investment Manager. Under the State Street Agreements, the Fund pays State Street an annual fee of $38,000 paid monthly plus an additional monthly fee based on an annualized percentage rate of average daily net assets of the Fund for the month. The aggregate fee will not exceed $140,000 per year (exclusive of out-of-pocket expenses and charges). The Fund also reimburses State Street for certain out-of-pocket expenses and charges.
Also prior to the Closing, the Fund entered into a Pricing and Bookkeeping Oversight and Services Agreement (the Services Agreement) with Columbia. Under the Services Agreement, Columbia provided services related to Fund expenses and the requirements of the Sarbanes-Oxley Act of 2002, and provided oversight of the accounting and financial reporting services provided by State Street. Under the Services Agreement, the Fund reimbursed Columbia for out-of-pocket expenses and charges, including fees payable to third parties, such as for pricing the Fund's portfolio securities, incurred by Columbia in the performance of services under the Services Agreement. The Services Agreement was terminated upon the Closing. These services are now provided under the Administration Fee note discussed above.
Transfer Agent Fee
In connection with the Closing, RiverSource Service Corporation, a wholly owned subsidiary of Ameriprise Financial, became the transfer agent of the Fund and changed its name to Columbia Management Investment Services Corp. (the New Transfer Agent). The New Transfer Agent has contracted with Boston Financial Data Services (BFDS) to serve as sub-transfer agent. The New Transfer Agent receives monthly account-based service fees that vary by class and are based on the number of open accounts and asset-based fees, calculated based on assets held in omnibus accounts, which are intended to reimburse the New Transfer Agent for certain sub-transfer agent fees (exclusive of BFDS fees). The New Transfer Agent pays the fees of BFDS for services as sub-transfer agent and is not entitled to reimbursement for such fees from the Fund.
The New Transfer Agent receives reimbursement for certain out-of-pocket expenses and may also receive compensation for various shareholder services.
Prior to the Closing, Columbia Management Services, Inc., an affiliate of Columbia and an indirect, wholly owned subsidiary of BOA, provided shareholder services to the Fund and contracted with BFDS to serve as sub-transfer agent, under the same fee structure.
For the year ended February 28, 2011, the Fund's effective transfer agent fee rate for each class, with the exception of Class I shares, as a percentage of the average daily net assets was as follows:
| Class A | | Class B | | Class C | | Class W | | Class Z | |
| | 0.18 | % | | | 0.18 | % | | | 0.18 | % | | | 0.22 | % | | | 0.18 | % | |
Class I shares do not pay transfer agent fees.
An annual minimum account balance fee of $20 may apply to certain accounts with a value below the Fund's initial minimum investment requirements to reduce the impact of small accounts on transfer agent fees. These minimum account balance fees are recorded as part of expense reductions on the Statement of Operations. For the year ended February 28, 2011, no minimum account balance fees were charged by the Fund.
Underwriting Discounts, Service and Distribution Fees
In connection with the Closing, RiverSource Fund Distributors, Inc., an indirect wholly owned subsidiary of Ameriprise Financial, became the distributor of the Fund and changed its name to Columbia Management Investment Distributors, Inc. (the New Distributor).
For the year ended February 28, 2011, initial sales charges paid by shareholders on the purchase of Class A shares amounted to $5,030 and net CDSC fees paid by shareholders on certain redemptions of Class B and Class C shares amounted to $1,423 and $242, respectively.
The Trust has adopted shareholder servicing plans and distribution plans for the Class B, Class C and Class W shares of the Fund and a combined distribution and shareholder servicing plan for the Class A shares of the Fund. The shareholder servicing plans permit the Fund to compensate or reimburse servicing agents for the shareholder services they have provided. The distribution plans, adopted pursuant to
28
Columbia Large Cap Core Fund, February 28, 2011
Rule 12b-1 under the 1940 Act, permit the Fund to compensate or reimburse the New Distributor and/or selling agents for activities or expenses primarily intended to result in the sale of the classes' shares. Payments are made at an annual rate and paid monthly, as a percentage of average daily net assets, set from time to time by the Board of Trustees, and are charged as expenses of the Fund directly to the applicable share class. A substantial portion of the expenses incurred pursuant to these plans is paid to affiliates of the New Distributor.
The annual rates in effect and plan limits, as a percentage of average daily net assets are as follows:
| | | Current
Rate | | Plan
Limit | |
Class A Combined Distribution
and Shareholder Servicing Plan | | | 0.25 | % | | | 0.25 | % | |
Class B and Class C
Shareholder Servicing Plans | | | 0.25 | % | | | 0.25 | % | |
Class B and Class C
Distribution Plans | | | 0.75 | % | | | 0.75 | % | |
| Class W Shareholder Servicing Plan | | | 0.25 | % | | | 0.25 | %1 | |
| Class W Distribution Plan | | | 0.00 | % | | | 0.25 | %1 | |
1 The Fund may pay a distribution fee of up to 0.25% of the Fund's average daily net assets attributable to Class W shares and a service fee of up to 0.25% of the Fund's average daily net assets attributable to Class W shares, provided, however, that the aggregate fee shall not exceed 0.25% of the Fund's average daily net assets attributable to Class W shares.
Prior to the Closing, Columbia Management Distributors, Inc, an affiliate of Columbia and an indirect, wholly owned subsidiary of BOA, was the principal underwriter of the Fund's shares. There were no changes to the underwriting discount structure of the Fund or the service or distribution fee rates paid by the Fund as a result of the Transaction.
Expense Limits and Fee Waivers
Effective September 27, 2010, the Investment Manager has voluntarily agreed to reimburse a portion of the Fund's expenses so that the Fund's ordinary operating expenses (excluding any brokerage commissions, interest, taxes and extraordinary expenses, but including custodian charges relating to overdrafts, if any), after giving effect to any balance credits from the Fund's custodian, do not exceed the annual rates of 1.25%, 2.00%, 2.00%, 0.87%, 1.25% and 1.00% of the Fund's average daily net assets attributable to Class A, Class B, Class C, Class I, Class W and Class Z shares, respectively.
For the period May 1, 2010 through September 26, 2010, the Investment Manager voluntarily agreed to reimburse a portion of the Fund's expenses so that the Fund's ordinary operating expenses (excluding any distribution and service fees, brokerage commissions, interest, taxes and extraordinary expenses, but including custodian charges relating to overdrafts, if any), after giving effect to any balance credits from the Fund's custodian, did not exceed 1.00% annually of the Fund's average daily net assets. Prior to May 1, 2010, Columbia voluntarily reimbursed a portion of the Fund's expenses in the same manner.
Effective March 1, 2011, the Investment Manager and certain affiliates have contractually agreed to waive fees or reimburse expenses through June 30, 2012, so that the Fund's ordinary operating expenses (excluding certain expenses, such as transaction costs and brokerage commissions, interest, taxes, acquired fund fees and expenses, and extraordinary expenses, if any), after giving effect to any balance credits or overdraft charges from the Fund's custodian, do not exceed the annual rates of 1.16%, 1.91%, 1.91%, 0.81%, 1.16% and 0.91% of the Fund's average daily net assets attributable to Class A, Class B, Class C, Class I, Class W and Class Z shares, respectively. This expense arrangement is made pursuant to a fee waiver and expense cap agreement that my be modified or amended only with the approval from all parties to such arrangements, including the Fund and the Investment Manager.
Fees Paid to Officers and Trustees
In connection with the Closing, all officers of the Fund are employees of the Investment Manager or its affiliates and, with the exception of the Fund's Chief Compliance Officer, receive no compensation from the Fund. The Board of Trustees has appointed a Chief Compliance Officer to the Fund in accordance with federal securities regulations. The Fund, along with other affiliated funds, pays its pro-rata share of the expenses associated with the Chief Compliance Officer. The Fund's expenses for the Chief Compliance Officer will not exceed $15,000 per year. Prior to the Closing, all officers of the Fund were employees of Columbia or its affiliates and the Fund paid its pro-rata share of the expenses for the Chief Compliance Officer under the same fee structure.
Trustees are compensated for their services to the Fund, as set forth on the Statement of Operations. The Trust's eligible Trustees may participate in a non-qualified deferred compensation plan which may be terminated at any time. Any payments to plan participants are paid solely out of the Fund's assets. Income earned on the plan participant's deferral account is based on the rate of return of the eligible mutual funds selected by the participant or, if no funds are selected, on the rate of return of Columbia Money Market Fund
29
Columbia Large Cap Core Fund, February 28, 2011
(formerly known as RiverSource Cash Management Fund). Prior to the Closing, if no funds were selected, income earned on the plan participant's deferral account was based on the rate of return of BofA Treasury Reserves. Trustees' fees deferred during the current period as well as any gains or losses on the trustees' deferred compensation balances as a result of market fluctuations are included in "Trustees' fees" on the Statement of Operations. Liabilities under the deferred compensation plan are included in "Trustees' fees" on the Statement of Assets and Liabilities.
Other Related Party Transactions
Prior to the Closing, the Fund used one or more brokers that were affiliates of BOA in connection with the purchase and sale of its securities. Total brokerage commissions paid to affiliated brokers for the period prior to the Closing were $2,943.
Note 4. Custody Credits
The Fund has an agreement with its custodian bank under which custody fees may be reduced by balance credits. These credits are recorded as part of expense reductions on the Statement of Operations. The Fund could have invested a portion of the assets utilized in connection with the expense offset arrangement in an income-producing asset if it had not entered into such an agreement. For the year ended February 28, 2011, these custody credits reduced total expenses by $65 for the Fund.
Note 5. Portfolio Information
The cost of purchases and proceeds from sales of securities, excluding short-term obligations, aggregated $1,887,109,112 and $1,990,094,112, respectively, for the year ended February 28, 2011.
Note 6. Regulatory Settlements
During the year ended February 28, 2010, the Fund received payments totaling $120,276 resulting from certain regulatory settlements with third parties in which the Fund had participated. The payments have been included in "Increase from regulatory settlements" in the Statement of Changes in Net Assets.
Note 7. Shareholder Concentration
As of February 28, 2011, one shareholder account owned 48.1% of the outstanding shares of the Fund. Purchase and redemption activity of this account may have a significant effect on the operations of the Fund.
Note 8. Line of Credit
The Fund and other affiliated funds participate in a $280,000,000 committed, unsecured revolving line of credit provided by State Street. The maximum amount that may be borrowed by any fund is limited to the lesser of $200,000,000 and the Fund's borrowing limit set forth in the Fund's registration statement. Borrowings are available for short-term liquidity or temporary or emergency purposes.
Effective October 14, 2010, interest is charged to each participating fund based on the fund's borrowings at a rate per annum equal to the greater of the Federal Funds Rate plus 1.25% or the overnight LIBOR Rate plus 1.25%. In addition, a commitment fee of 0.125% per annum is accrued and apportioned among the participating funds pro rata based on their relative net assets.
Prior to October 14, 2010, interest was charged to each participating fund at the same rates. In addition, a commitment fee of 0.15% per annum was accrued and apportioned among the participating funds pro rata based on their relative net assets.
For the year ended February 28, 2011, the average daily loan balance outstanding on days where borrowing existed was $3,350,000 at a weighted average interest rate of 1.49%.
Note 9. Federal Tax Information
The timing and character of income and capital gain distributions are determined in accordance with income tax regulations, which may differ from GAAP. Reclassifications are made to the Fund's capital accounts for permanent tax differences to reflect income and gains available for distribution (or available capital loss carryforwards) under income tax regulations.
For the year ended February 28, 2011, permanent book and tax basis differences resulting primarily from differing treatments for proceeds from litigation settlements reversal adjustment and non-taxable dividends were identified and reclassified among the components of the Fund's net assets as follows:
Undistributed
Net Investment
Income | | Accumulated
Net Realized
Loss | | Paid-In Capital | |
| $ | (26,819 | ) | | $ | 12,874 | | | $ | 13,945 | | |
30
Columbia Large Cap Core Fund, February 28, 2011
Net investment income and net realized gains (losses), as disclosed on the Statement of Operations, and net assets were not affected by this reclassification.
The tax character of distributions paid during the years ended February 28, 2011 and February 28, 2010 was as follows:
| | | February 28, | |
| Distributions paid from: | | 2011 | | 2010 | |
| Ordinary Income* | | $ | 7,685,219 | | | $ | 13,863,938 | | |
| Long-Term Capital Gains | | | — | | | | — | | |
* For tax purposes short-term capital gain distributions, if any, are considered ordinary income distributions.
As of February 28, 2011, the components of distributable earnings on a tax basis were as follows:
Undistributed
Ordinary
Income | | Undistributed
Long-Term
Capital Gains | | Net
Unrealized
Apppreciation* | |
| $ | 659,266 | | | $ | — | | | $ | 203,416,184 | | |
* The differences between book-basis and tax-basis net unrealized appreciation are primarily due to deferral of losses from wash sales.
Unrealized appreciation and depreciation at February 28, 2011, based on cost of investments for federal income tax purposes were:
| Unrealized appreciation | | $ | 212,504,443 | | |
| Unrealized depreciation | | | (9,088,259 | ) | |
| Net unrealized appreciation | | $ | 203,416,184 | | |
The following capital loss carryforwards may be available to reduce taxable income arising from future net realized gains on investments, if any, to the extent permitted by the Internal Revenue Code:
| Year of Expiration | | Capital Loss
Carryforwards | |
| 2018 | | $ | 117,947,530 | | |
Capital loss carryforwards of $115,440,471 were utilized during the year ended February 28, 2011.
Management is required to determine whether a tax position of the Fund is more likely than not to be sustained upon examination by the applicable taxing authority, including resolution of any related appeals or litigation processes, based on the technical merits of the position. The tax benefit to be recognized by the Fund is measured as the largest amount of benefit that is greater than fifty percent likely of being realized upon ultimate settlement. Management is not aware of any tax positions for which it is reasonably possible that the total amounts of unrecognized tax benefits will significantly change in the next twelve months. However, management's conclusions may be subject to review and adjustment at a later date based on factors including, but not limited to, new tax laws, regulations, and administrative interpretations (including relevant court decisions). The Fund's federal tax returns for the prior three fiscal years remain subject to examination by the Internal Revenue Service.
Note 10. Significant Risks and Contingencies
Foreign Securities Risk
Investing in foreign securities may include certain risks and considerations not typically associated with investing in U.S. securities, such as fluctuating currency values and changing local and regional economic, political and social conditions, which may result in greater market volatility. In addition, certain foreign securities may not be as liquid as U.S. securities. Investing in emerging markets may accentuate these risks.
Note 11. Subsequent Events
Management has evaluated the events and transactions that have occurred through the date the financial statements were issued. Other than as noted in Note 3 (above) there were no items requiring adjustment of the financial statements or additional disclosure.
Note 12. Information Regarding Pending and Settled Legal Proceedings
In June 2004, an action captioned John E. Gallus et al. v. American Express Financial Corp. and American Express Financial Advisors Inc. was filed in the United States District Court for the District of Arizona. The plaintiffs allege that they are investors in several American Express Company (now known as RiverSource) mutual funds and they purport to bring the action derivatively on behalf of those funds under the Investment Company Act of 1940. The plaintiffs allege that fees allegedly paid to the defendants by the funds for investment advisory and administrative services are excessive. The plaintiffs seek remedies including restitution and rescission of investment advisory and distribution agreements. The plaintiffs voluntarily agreed to transfer this case to the United States District Court for the District of Minnesota (the District Court). In
31
Columbia Large Cap Core Fund, February 28, 2011
response to defendants' motion to dismiss the complaint, the District Court dismissed one of plaintiffs' four claims and granted plaintiffs limited discovery. Defendants moved for summary judgment in April 2007. Summary judgment was granted in the defendants' favor on July 9, 2007. The plaintiffs filed a notice of appeal with the Eighth Circuit Court of Appeals (the Eighth Circuit) on August 8, 2007. On April 8, 2009, the Eighth Circuit reversed summary judgment and remanded to the District Court for further proceedings. On August 6, 2009, defendants filed a writ of certiorari with the U.S. Supreme Court (the Supreme Court), asking the Supreme Court to stay the District Court proceedings while the Supreme Court considers and rules in a case captioned Jones v. Harris Associates, which involves issues of law similar to those presented in the Gallus case. On March 30, 2010, the Supreme Court issued its ruling in Jones v. Harris Associates, and on April 5, 2010, the Supreme Court vacated the Eighth Circuit's decision in the Gallus case and remanded the case to the Eighth Circuit for further consideration in light of the Supreme Court's decision in Jones v. Harris Associates. On June 4, 2010, the Eighth Circuit remanded the Gallus case to the District Court for further consideration in light of the Supreme Court's decision in Jones v. Harris Associates. On December 9, 2010, the District Court reinstated its July 9, 2007 summary judgment order in favor of the defendants. On January 10, 2011, plaintiffs filed a notice of appeal with the Eighth Circuit.
In December 2005, without admitting or denying the allegations, American Express Financial Corporation (AEFC, which is now known as Ameriprise Financial, Inc. (Ameriprise Financial)), entered into settlement agreements with the Securities and Exchange Commission (SEC) and Minnesota Department of Commerce (MDOC) related to market timing activities. As a result, AEFC was censured and ordered to cease and desist from committing or causing any violations of certain provisions of the Investment Advisers Act of 1940, the Investment Company Act of 1940, and various Minnesota laws. AEFC agreed to pay disgorgement of $10 million and civil money penalties of $7 million. AEFC also agreed to retain an independent distribution consultant to assist in developing a plan for distribution of all disgorgement and civil penalties ordered by the SEC in accordance with various undertakings detailed at http://www.sec.gov/litigation/admin/ia-2451.pdf. Ameriprise Financial and its affiliates have cooperated with the SEC and the MDOC in these legal proceedings, and have made regular reports to the funds' Boards of Directors/Trustees.
Ameriprise Financial and certain of its affiliates have historically been involved in a number of legal, arbitration and regulatory proceedings, including routine litigation, class actions, and governmental actions, concerning matters arising in connection with the conduct of their business activities. Ameriprise Financial believes that the Funds are not currently the subject of, and that neither Ameriprise Financial nor any of its affiliates are the subject of, any pending legal, arbitration or regulatory proceedings that are likely to have a material adverse effect on the Funds or the ability of Ameriprise Financial or its affiliates to perform under their contracts with the Funds. Ameriprise Financial is required to make 10-Q, 10-K and, as necessary, 8-K filings with the Securities and Exchange Commission on legal and regulatory matters that relate to Ameriprise Financial and its affiliates. Copies of these filings may be obtained by accessing the SEC website at www.sec.gov.
There can be no assurance that these matters, or the adverse publicity associated with them, will not result in increased fund redemptions, reduced sale of fund shares or other adverse consequences to the Funds. Further, although we believe proceedings are not likely to have a material adverse effect on the Funds or the ability of Ameriprise Financial or its affiliates to perform under their contracts with the Funds, these proceedings are subject to uncertainties and, as such, we are unable to estimate the possible loss or range of loss that may result. An adverse outcome in one or more of these proceedings could result in adverse judgments, settlements, fines, penalties or other relief that could have a material adverse effect on the consolidated financial condition or results of operations of Ameriprise Financial.
32
Report of Independent Registered Public Accounting Firm
To the Trustees of Columbia Funds Series Trust and the Shareholders of Columbia Large Cap Core Fund
In our opinion, the accompanying statement of assets and liabilities, including the investment portfolio, and the related statements of operations and of changes in net assets and the financial highlights present fairly, in all material respects, the financial position of Columbia Large Cap Core Fund (the "Fund") (a series of Columbia Funds Series Trust) at February 28, 2011, and the results of its operations, the changes in its net assets, and the financial highlights for each of the periods indicated, in conformity with accounting principles generally accepted in the United States of America. These financial statements and financial highlights (hereafter referred to as "financial statements") are the responsibility of the Fund's management. Our responsibility is to express an opinion on these financial statements based on our audits. We conducted our audits of these financial statements in accordance with the standards of the Public Company Accounting Oversight Board (United States). Those standards require that we plan and perform the audit to obtain reasonable assurance about whether the financial statements are free of material misstatement. An audit includes examining, on a test basis, evidence supporting the amounts and disclosures in the financial statements, assessing the accounting principles used and significant estimates made by management, and evaluating the overall financial statement presentation. We believe that our audits, which included confirmation of securities at February 28, 2011 by correspondence with the custodian and brokers, provide a reasonable basis for our opinion.
PricewaterhouseCoopers LLP
Boston, Massachusetts
April 21, 2011
33
Federal Income Tax Information (Unaudited) – Columbia Large Cap Core Fund
For non-corporate shareholders 100.00%, or the maximum amount allowable under the Jobs and Growth Tax Relief Reconciliation Act of 2003, of ordinary income distributed by the Fund for the fiscal year ended February 28, 2011 may represent qualified dividend income.
100.00% of the ordinary income distributed by the Fund for the fiscal year ended February 28, 2011, qualifies for the corporate dividends received deduction.
The Fund will notify shareholders in January 2012 of amounts for use in preparing 2011 income tax returns.
34
Fund Governance
The Trustees serve terms of indefinite duration. The names, addresses and birth years of the Trustees and Officers of the Funds in the Columbia Funds Series Trust, the year each was first elected or appointed to office, their principal business occupations during at least the last five years, the number of Funds overseen by each Trustee and other directorships they hold are shown below. Each officer listed below serves as an officer of each Fund in the Columbia Funds Series Trust.
Independent Trustees
Name, Address and Year of Birth,
Position with Funds, Year First
Elected or Appointed to Office | | Principal Occupation(s) During Past Five Years, Number of Funds in the Columbia
Funds Complex Overseen by Trustee, Other Directorships Held
| |
| Edward J. Boudreau, Jr. (Born 1944) | |
|
c/o Columbia Management
Investment Advisers, LLC
225 Franklin Street
Boston, MA 02110
Trustee (since 2005) | | Managing Director—E.J. Boudreau & Associates (consulting), from 2000 through current; oversees 44; Trustee—BofA Funds Series Trust. | |
|
| William P. Carmichael (Born 1943) | |
|
c/o Columbia Management
Investment Advisers, LLC
225 Franklin Street
Boston, MA 02110
Trustee (since 1999) | | Retired; Oversees 44; Director—Cobra Electronics Corporation (electronic equipment manufacturer); Director—McMoRan Exploration Company (oil and gas exploration and development); Director—The Finish Line (athletic shoes and apparel); Trustee—BofA Funds Series Trust; Former Director—Simmons Company (bedding). | |
|
| William A. Hawkins (Born 1942) | |
|
c/o Columbia Management
Investment Advisers, LLC
225 Franklin Street
Boston, MA 02110
Trustee (since 2005) | | Managing Director—Overton Partners (financial consulting), August 2010 to present; President and Chief Executive Officer—California General Bank, N.A., from January 2008 through August 2010; oversees 44; Trustee—BofA Funds Series Trust. | |
|
| R. Glenn Hilliard (Born 1943) | |
|
c/o Columbia Management
Investment Advisers, LLC
225 Franklin Street
Boston, MA 02110
Trustee (since 2005) | | Chairman and Chief Executive Officer—Hilliard Group LLC (investing and consulting), from April 2003 through current; Non-Executive Director & Chairman—CNO Financial, Inc. (formerly Conseco, Inc.) (insurance), September 2003 through current; Executive Chairman—Conseco, Inc. (insurance), August 2004 through September 2005; oversees 44; Trustee—BofA Funds Series Trust. | |
|
| John J. Nagorniak (Born 1944) | |
|
c/o Columbia Management
Investment Advisers, LLC
225 Franklin Street
Boston, MA 02110
Trustee (since 2008) | | Retired; President and Director—Foxstone Financial, Inc. (consulting), 2000 through December 2007; Director—Mellon Financial Corporation affiliates (investing), 2000 through 2007; Chairman—Franklin Portfolio Associates (investing—Mellon affiliate), 1982 through 2007; oversees 44; Director—MIT Investment Company; Trustee—MIT 401k Plan. | |
|
35
Fund Governance (continued)
Independent Trustees (continued)
Name, Address and Year of Birth,
Position with Funds, Year First
Elected or Appointed to Office | | Principal Occupation(s) During Past Five Years, Number of Funds in the Columbia
Funds Complex Overseen by Trustee, Other Directorships Held
| |
| Minor M. Shaw (Born 1947) | |
|
c/o Columbia Management
Investment Advisers, LLC
225 Franklin Street
Boston, MA 02110
Trustee (since 2003) | | President—Micco Corporation and Mickel Investment Group; oversees 44; Board Member—Piedmont Natural Gas; Trustee—BofA Funds Series Trust. | |
|
Interested Trustee
| Anthony M. Santomero1 (Born 1946) | |
|
c/o Columbia Management
Investment Advisers, LLC
225 Franklin Street
Boston, MA 02110
Trustee (since 2008) | | Richard K. Mellon Professor Emeritus of Finance, The Wharton School, University of Pennsylvania, from 2002 through current; Senior Advisor—McKinsey & Company (consulting), July 2006 through January 2008; President and Chief Executive Officer—Federal Reserve Bank of Philadelphia, July 2000 through April 2006; oversees 44; Director—Renaissance Reinsurance Ltd; Trustee—Penn Mutual Life Insurance Company; Director—Citigroup, Inc.; Citibank, N.A.; Trustee—BofA Funds Series Trust. | |
|
1 Dr. Santomero is currently deemed by the Columbia Funds to be an "interested person" (as defined in the 1940 Act) of the Funds because he serves as a Director of Citigroup, Inc. and Citibank N.A., companies that may directly or through subsidiaries and affiliates engage from time-to-time in brokerage execution, principal transactions and lending relationships with the Columbia Funds or other funds or accounts advised/managed by the Adviser.
The Statement of Additional Information includes additional information about the Trustees of the Funds and is available, without charge, upon request by calling 800-345-6611.
Officers
| Name, Year of Birth and Address | | Principal Occupation(s) During the Past Five Years | |
| J. Kevin Connaughton (Born 1964) | |
|
225 Franklin Street
Boston, MA 02110
President (since 2009) | | Senior Vice President and General Manager—Mutual Fund Products, Columbia Management Investment Advisers, LLC since May 2010; President, Columbia Funds, since 2009, and RiverSource Funds, since May 2010 (previously Senior Vice President and Chief Financial Officer, Columbia Funds, from June 2008 to January 2009, Treasurer, Columbia Funds, from October 2003 to May 2008, and senior officer of various other affiliated funds since 2000); Managing Director, Columbia Management Advisors, LLC from December 2004 to April 2010. | |
|
| Michael G. Clarke (Born 1969) | |
|
225 Franklin Street
Boston, MA 02110
Senior Vice President and
Chief Financial Officer (since 2009) | | Vice President, Columbia Management Investment Advisers, LLC since May 2010; Managing Director of Fund Administration, Columbia Management Advisors, LLC, from September 2004 to April 2010; senior officer of Columbia Funds and affiliated funds since 2002. | |
|
36
Fund Governance (continued)
Officers (continued)
| Name, Year of Birth and Address | | Principal Occupation(s) During the Past Five Years | |
| Scott R. Plummer (Born 1959) | |
|
5228 Ameriprise Financial Center
Minneapolis, MN 55474
Senior Vice President, Secretary and Chief Legal Officer (since 2010) | | Chief Legal Officer and Assistant Secretary, Columbia Management Investment Advisers, LLC since June 2005; Vice President and Lead Chief Counsel—Asset Management, Ameriprise Financial, Inc. since May 2010 (previously Vice President and Chief Counsel—Asset Management, from 2005 to April 2010, and Vice President—Asset Management Compliance from 2004 to 2005); Vice President, Chief Counsel and Assistant Secretary, Columbia Management Investment Distributors, Inc. since 2008; Vice President, General Counsel and Secretary, Ameriprise Certificate Company since 2005; Chief Counsel, RiverSource Distributors, Inc. since 2006; Vice President, General Counsel and Secretary, RiverSource Funds, since December 2006; Senior Vice President, Secretary and Chief Legal Officer, Columbia Funds, since May 2010. | |
|
| Linda J. Wondrack (Born 1964) | |
|
225 Franklin Street
Boston, MA 02110
Senior Vice President and
Chief Compliance Officer (since 2007) | | Vice President and Chief Compliance Officer, Columbia Management Investment Advisers, LLC since May 2010; Chief Compliance Officer, Columbia Funds, since 2007, and RiverSource Funds, since May 2010; Director (Columbia Management Group, LLC and Investment Product Group Compliance), Bank of America, from June 2005 to April 2010. | |
|
| William F. Truscott (Born 1960) | |
|
53600 Ameriprise Financial Center
Minneapolis, MN 55474
Senior Vice President (since 2010) | | Chairman of the Board, Columbia Management Investment Advisers, LLC since May 2010 (previously President, Chairman of the Board and Chief Investment Officer, from 2001 to April 2010); Chief Executive Officer, U.S. Asset Management & President, Annuities, Ameriprise Financial, Inc. since May 2010 (previously President—U.S. Asset Management and Chief Investment Officer from 2005 to April 2010, and Senior Vice President—Chief Investment Officer, from 2001 to 2005); Director, President and Chief Executive Officer, Ameriprise Certificate Company since 2006; Director, Columbia Management Investment Distributors, Inc. since May 2010 (previously Chairman of the Board and Chief Executive Officer from 2008 to April 2010); Chairman of the Board and Chief Executive Officer, RiverSource Distributors, Inc. since 2006. | |
|
| Colin Moore (Born 1958) | |
|
225 Franklin Street
Boston, MA 02110
Senior Vice President (since 2010) | | Director and Chief Investment Officer, Columbia Management Investment Advisers, LLC since May 2010; Manager, Managing Director and Chief Investment Officer of Columbia Management Advisors, LLC from 2007 to April 2010; Head of Equities, Columbia Management Advisors, LLC from 2002 to 2007. | |
|
| Michael A. Jones (Born 1959) | |
|
225 Franklin Street
Boston, MA 02110
Senior Vice President (since 2010) | | President and Director, Columbia Management Investment Advisers, LLC since May 2010; President and Director, Columbia Management Investment Distributors, Inc. since May 2010; Manager, Chairman, Chief Executive Officer and President, Columbia Management Advisors, LLC from 2007 to April 2010; Chief Executive Officer, President and Director, Columbia Management Distributors, Inc. from November 2006 to April 2010; previously, co-president and senior managing director at Robeco Investment Management. | |
|
37
Fund Governance (continued)
Officers (continued)
| Name, Year of Birth and Address | | Principal Occupation(s) During the Past Five Years | |
| Amy Johnson (Born 1965) | |
|
5228 Ameriprise Financial Center
Minneapolis, MN 55474
Senior Vice President (since 2010) | | Senior Vice President and Chief Operating Officer, Columbia Management Investment Advisers, LLC since May 2010 (previously Chief Administrative Officer, from 2009 until April 2010, Vice President—Asset Management and Trust Company Services, from 2006 to 2009, and Vice President—Operations and Compliance from 2004 to 2006). | |
|
| Joseph F. DiMaria (Born 1968) | |
|
225 Franklin Street
Boston, MA 02110
Treasurer (since 2010) and
Chief Accounting Officer (since 2008) | | Vice President, Mutual Fund Administration, Columbia Management Investment Advisers, LLC, since May 2010; Director of Fund Administration, Columbia Management Advisors, LLC from January 2006 to April 2010; Head of Tax/Compliance and Assistant Treasurer, Columbia Management Advisors, LLC, from November 2004 to December 2005. | |
|
| Marybeth Pilat (Born 1968) | |
|
225 Franklin Street
Boston, MA 02110
Deputy Treasurer (since 2010) | | Vice President, Mutual Fund Administration, Columbia Management Investment Advisers, LLC, since May 2010; Vice President, Investment Operations, Bank of America, from October 2008 to April 2010; Finance Manager, Boston Children's Hospital from August 2008 to October 2008; Director, Mutual Fund Administration, Columbia Management Advisors, LLC, from May 2007 to July 2008; Vice President, Mutual Fund Valuation, Columbia Management Advisors, LLC, from January 2006 to May 2007; Vice President, Mutual Fund Accounting Oversight, Columbia Management Advisors, LLC from January 2005 to January 2006. | |
|
| Julian Quero (Born 1967) | |
|
225 Franklin Street
Boston, MA 02110
Deputy Treasurer (since 2008) | | Vice President, Mutual Fund Administration, Columbia Management Investment Advisers, LLC since May 2010; Director of Fund Administration, Columbia Management Advisors, LLC, from August 2008 to April 2010; Senior Tax Manager, Columbia Management Advisors, LLC from August 2006 to July 2008; Senior Compliance Manager, Columbia Management Advisors, LLC from April 2002 to August 2006. | |
|
| Stephen T. Welsh (Born 1957) | |
|
225 Franklin Street
Boston, MA 02110
Vice President (since 2006) | | President and Director, Columbia Management Investment Services Corp. since May 2010; President and Director, Columbia Management Services, Inc. from July 2004 to April 2010; Managing Director, Columbia Management Distributors, Inc. from August 2007 to April 2010. | |
|
38
Board Consideration and Approval of Amendment to Investment Management Services Agreement
In September 2010, the Board (the "Board") of Columbia Funds Series Trust (the "Trust") unanimously approved an amendment to the Investment Management Services Agreement (the "IMS Agreement") between Columbia Management Investment Advisers, LLC ("CMIA") and the Trust, on behalf of Columbia Convertible Securities Fund, Columbia Large Cap Core Fund, Columbia Large Cap Enhanced Core Fund, Columbia Large Cap Value Fund, Columbia Mid Cap Value Fund, Columbia Multi-Advisor International Equity Fund and Columbia Small Cap Value Fund II (each, a "Fund" and together, the "Funds"). As detailed below, the Contracts Review Committee and/or the Board held numerous meetings and discussions with CMIA and reviewed and considered extensive materials in connection with the approval of the changes to the fee rates payable by each Fund before determining to approve the amendment to the IMS Agreement.
Prior to approving the proposed changes to the fee rates payable by the Funds, the trustees (the "Trustees") of the Board were presented with, and requested, received and evaluated, materials about the current IMS Agreement, the proposed changes to the fee rates and fee structures and related matters from CMIA. The Trustees also reviewed reports prepared by an independent provider of investment company data, which included information comparing the Funds' current fees and expense ratios with a group of comparable funds that were selected by the independent provider. Included in these reports were comparisons of contractual and actual investment advisory fee rates and total operating expenses.
In addition, the Trustees considered that the proposed amendment was part of a larger group of proposals, designed to achieve consistent investment management service and fee structures across the family of funds. In this regard, the Board recognized that many of the funds in the fund family were organized at different times by many different sponsors, and as a result, their fees and expenses did not reflect a common overall design.
The Board and its Contract Review Committee also reviewed and considered information that they had previously received, addressing the services CMIA provides and fund performance, among other things, in connection with their most recent consideration and approval of the IMS Agreement. The Trustees also consulted with the non-interested Trustees' independent legal counsel, who advised on applicable legal standards, and otherwise assisted the Trustees in their deliberations.
At the conclusion of its review of the materials discussed above and of the discussions among the Trustees leading up to and during the September 20, 2010 meetings, the Board, on behalf of the Funds, agreed that it had been furnished with sufficient information to make an informed business decision with respect to approval of the amendment to the IMS Agreement.
In making its decision to approve the proposed amendment to the IMS Agreement for each Fund, the Board considered factors bearing on the nature, extent and quality of the services provided to such Fund, and the costs for those services, with a view toward reaching a business judgment as to whether the proposed amendment to the IMS Agreement is, under the circumstances, in the best interest of such Fund and its shareholders. The factors that the Trustees considered included, principally, the following:
• The expected benefits of continuing to retain CMIA as the Funds' investment manager;
• The nature, extent and quality of investment management services provided by CMIA to each Fund;
• The recent evaluation of the historical performance of CMIA in managing the Funds, recognizing that no assurances can be given that a Fund would achieve any level of performance in the future;
• The recent evaluation of each Fund's potential to realize economies of scale through operations of CMIA;
• The indirect benefits, such as from soft dollar arrangements, that CMIA has obtained and will continue to obtain, from managing the Funds;
• The expected benefits to shareholders of further integrating the legacy Columbia branded funds (the "Columbia Funds Complex") and the legacy RiverSource-, Seligman- and Threadneedle-branded funds (the "Columbia RiverSource Funds Complex" and, collectively with the Columbia Funds Complex, the "Combined Fund Complex") by:
o Standardizing investment advisory fee rates and total management fee rates (i.e., the investment advisory fee rates and the administration/administrative fee rates), to the extent practicable, across funds in the Combined Fund Complex that are in the same investment category to promote uniformity of pricing among similar funds;
o Implementing contractual expense limitations that will generally cap total annual operating expense ratios for each fund in the Combined Fund Complex at levels that are at or below the median net operating expense ratio of funds in the
39
respective fund's peer group (as determined annually after the initial term by an independent third-party data provider); and
o Correlating investment advisory and administration/administrative fee rates across the Combined Fund Complex commensurate with the level of services being provided.
In making its decision to approve the amendment to the IMS Agreement that included the increase of the investment advisory fee rates payable by each of the Funds at all or most asset levels, the factors that the trustees considered and the conclusions that they reached included, principally, the following:
• The impact of the proposed changes in investment advisory fee rates on the gross and net expense ratios of each Fund, including the contemporaneous reduction in the rates payable by each Fund under its administration services agreement contingent on shareholder approval of the amendment to the IMS Agreement, and the willingness of CMIA to contractually agree to limit total operating expenses for such Fund for a certain period of time;
• Current and projected profits to CMIA from providing investment management and other services to the Fund, both under the current investment advisory fee rates and the proposed investment advisory fee rates; and
• That the proposed investment advisory fee rates are designed to be competitive and to fairly compensate CMIA for services performed for the Funds.
Nature, Extent and Quality of Services. The Trustees considered the nature, extent and quality of services provided to the Funds by CMIA under the IMS Agreement, and the resources dedicated to the Funds by CMIA and its affiliates. The Trustees considered, among other things, the ability of CMIA to attract, motivate and retain highly qualified research, advisory and supervisory investment professionals (including CMIA's personnel and other resources, compensation programs for personnel involved in fund management, reputation and other attributes), the portfolio management services provided by those investment professionals, the trade execution services provided on behalf of the Funds and the quality of CMIA's investment research capabilities and the other resources that it devotes to each Fund. The Trustees also considered the potential benefits to shareholders of investing in a mutual fund that is part of a fund complex offering exposure to a variety of asset classes and investment disciplines and providing a variety of fund and shareholder services. The Trustees also considered that the nature, extent and quality of services proposed to be provided under the amended IMS Agreement were not expected to change. After reviewing these and related factors, the Trustees concluded, within the context of their overall conclusions, that the nature, extent and quality of the services to be provided to each Fund under the amended IMS Agreement supported the approval of the amended IMS Agreement. Quietly
Investment Performance. The Trustees reviewed information about the performance of each Fund over various time periods, including information prepared by an independent third-party data provider that compared the performance of each Fund to the performance of those Funds' peer groups of mutual funds and performance benchmarks. The Trustees also reviewed a description of the third party's methodology for identifying each Fund's peer group for purposes of performance and expense comparisons. In the case of each Fund whose performance lagged that of a relevant peer group for certain (although not necessarily all) periods, the Trustees concluded that other factors relevant to performance were sufficient, in light of other considerations, to warrant approval of the amendment to such Fund's IMS Agreement. Those factors varied from Fund to Fund, but included one or more of the following: (i) that the Fund's performance, although lagging in certain recent periods, was stronger over the longer term; (ii) that the underperformance was attributable, to a significant extent, to investment decisions that were reasonable and consistent with the Fund's investment strategy and policies and that the Fund was performing within a reasonable range of expectations, given those investment decisions, market conditions and the Fund's investment strategy; (iii) that the Fund's performance was competitive when compared to other performance benchmarks or peer groups; and (iv) that CMIA had taken or was considering steps designed to help improve the Fund's investment performance, including, but not limited to, replacing portfolio managers, enhancing the resources supporting the portfolio managers, or modifying investment strategies.
After reviewing these and related factors, the Trustees concluded, within the context of their overall conclusions regarding the proposed amendment to the IMS Agreement, that the performance of each Fund and CMIA was sufficient to warrant the approval of the amendment to the IMS Agreement pertaining to that Fund.
Investment Advisory Fee Rates and Other Expenses. The Trustees considered that the proposed amendment to the IMS Agreement would increase the contractual investment advisory fee
40
rates payable by each Fund at all or certain assets levels, and would be otherwise identical to each Fund's current IMS Agreement. In addition, the Trustees considered that, with the proposed fee reductions under the administration services agreement, the combined contractual fee rates under the IMS Agreement and the proposed administration services agreement would be lower than the current combined contractual fee rates under those agreements, at most asset levels, for all of the Funds except Columbia Large Cap Enhanced Core Fund. For the Columbia Large Cap Enhanced Core Fund, the Trustees considered CMIA's proposal to implement a contractual expense limitation that would mitigate the effect of such Fund's investment advisory fee rate increase by gradually phasing in the increase over a five-year period.
After reviewing these and related factors, the Trustees concluded, within the context of their overall conclusions, that the investment advisory fee rates under the amended IMS Agreement and anticipated total expenses of each Fund supported the approval of the amendment to the IMS Agreement.
Costs of Services Provided and Profitability. The Trustees considered information about the investment advisory fee rates charged by CMIA to comparable institutional accounts. In considering the fees charged to those accounts, the Trustees took into account, among other things, CMIA's representations about the differences between managing mutual funds as compared to other types of accounts, including differences in the services provided, differences in the risk profile of such business for CMIA, and the additional resources required to manage mutual funds effectively. In evaluating each Fund's proposed advisory fee rates, the Trustees also took into account the demands, complexity and quality of the investment management of the Fund.
The Trustees also considered the compensation directly or indirectly received by CMIA and its affiliates in connection with their relationships with the Funds. The Trustees reviewed information provided by management as to the current and projected profitability to CMIA and its affiliates of their relationships with each Fund, and information about the allocation of expenses used to calculate profitability.
After reviewing those and related factors, the Trustees concluded, within the context of their overall conclusions, that the proposed changes to the advisory fee rates, and the related profitability to CMIA and its affiliates of their relationships with the Fund, supported the approval of the amendment to the IMS Agreement.
Economies of Scale. The Trustees considered the existence of any economies of scale in the provision by CMIA of services to each Fund, to groups of related funds and to CMIA's investment advisory clients as a whole, and the extent to which those economies of scale would be shared with the Funds through breakpoints in the proposed investment advisory fee rates or other means, such as expense limitation arrangements and additional investments by CMIA in investment, trading and compliance resources. The Trustees noted that all of the Funds were expected to benefit from breakpoints and/or expense limitation arrangements.
In considering those issues, the Trustees also took note of the costs of the services to be provided (both on an absolute and relative basis) and the projected profitability to CMIA and its affiliates of their relationships with the Funds, as discussed above. The Trustees also noted the expected expense synergies and other anticipated benefits to CMIA and fund shareholders of both the rationalization of fees and expenses and the proposed mergers of certain Funds. After reviewing these and related factors, the Trustees determined, within the context of their overall conclusions, that the extent to which economies of scale were expected to be shared with the Funds supported the approval of the amendment to the IMS Agreement.
Other Benefits to CMIA. The Trustees received and considered information regarding any expected "fall-out" or ancillary benefits to be received by CMIA and its affiliates as a result of their relationships with the Funds, such as the provision by CMIA of administration services to the Funds and the provision by CMIA's affiliates of distribution and transfer agency services to the Funds, and how the proposed rationalization of fees and expenses might affect such benefits, including the fact that to the extent expenses payable by the affected Funds decrease, and the expenses of such Funds were subject to a contractual limit or cap, CMIA may pay less in expense reimbursements. The Trustees considered that the Funds' distributor, an affiliate of CMIA, retains a portion of the distribution fees from the Funds and receives a portion of the sales charges on sales or redemptions of certain classes of shares of the Funds, and that other affiliates of CMIA receive various forms of compensation in connection with their sale of shares of the Funds.
The Trustees also considered the benefits of research made available to CMIA by reason of brokerage commissions generated by the Funds' securities transactions, and reviewed information about CMIA's practices with respect to allocating portfolio brokerage and the use of "soft" commission dollars to pay for research. The Trustees considered the possible conflicts of interest associated with certain fall-out or other ancillary benefits and the reporting,
41
disclosure and other processes that would be in place to disclose and to monitor such possible conflicts of interest. The Trustees recognized that CMIA's profitability would be somewhat lower without these benefits.
In their deliberations, the Trustees did not identify any single item that was paramount or controlling and individual Trustees may have attributed different weights to various factors. The Trustees also evaluated all information available to them on a fund-by-fund basis, and their determinations were made separately in respect of each Fund.
Based on the foregoing, the Trustees concluded that the proposed investment advisory fee rates for each Fund are acceptable and competitive, including when compared to similar funds in the industry. Accordingly, the Board unanimously approved the amendment to the IMS Agreement with respect to the Funds.
42
Summary of Management Fee Evaluation by Independent Fee Consultant
REPORT OF INDEPENDENT FEE CONSULTANT TO THE FUNDS SUPERVISED BY THE COLUMBIA NATIONS BOARD
Prepared Pursuant to the February 9, 2005
Assurance of Discontinuance among the
Office of Attorney General of New York State,
Columbia Management Advisors, LLC, and
Columbia Management Distributors, Inc.
September 21, 2010
I. Overview
On February 9, 2005, Columbia Management Advisors, LLC ("CMA") and Columbia Management Distributors, Inc.1 ("CMD") agreed to the New York Attorney General's Assurance of Discontinuance ("AOD"). Among other things, the AOD stipulates that CMA may manage or advise a Columbia Fund ("Columbia Fund" and, together with some or all of such funds, the "Columbia Funds") only if the Independent Members of the Columbia Fund's Board of Trustees appoint a Senior Officer or retain an Independent Fee Consultant ("IFC") who is to manage the process by which proposed management fees are negotiated. The AOD further stipulates that the Senior Officer or IFC is to prepare a written annual evaluation of the fee negotiation process.
With effect from January 1, 2007, the Independent Members of the Board of Trustees for certain Columbia Funds known collectively as the "Nations Funds" (together with the other members of that Board, the "Trustees") retained me as IFC for the Nations Funds.2 In this capacity, I have prepared this written evaluation of the fee negotiation process. As has been the case with my previous reports, my immediate predecessor as IFC, John Rea, provided invaluable assistance in the preparation of this report.
On September 29, 2009, Ameriprise entered into an asset purchase agreement with Bank of America, N.A. and its parent, Bank of America Corporation (together, the "Bank") pursuant to which the Bank agreed to sell certain CMG assets relating to Columbia's long-term asset management business, including management of the Nations Funds (the "Transaction"). The Transaction, which closed on April 30, 2010,3 resulted in the termination of the existing Investment Management Agreements with CMA. Prior to the closing of the Transaction, the Trustees and shareholders of the Funds approved new Advisory and Administrative Agreements with an Ameriprise subsidiary now called Columbia Management Investment Advisers, LLC ("CMIA"). Those Agreements did not change the rates paid by the Funds from the levels specified in the former agreements with CMA.
CMIA serves as the adviser of funds supervised by three different Boards of Trustees: the Atlantic, Nations, and RiverSource Boards, and a subsidiary of CMIA serves as adviser to funds overseen by a fourth Board, Columbia/Wanger. After reviewing the range of funds overseen by all four Boards, CMIA proposed a series of changes intended, among other things, to rationalize its mutual fund product offerings (by for example proposing to merge funds with similar investment strategies) and the fees charged to the funds by CMIA and its affiliates. These proposals included (1) changes to the advisory fees paid by certain funds, (2) changes to administrative and similar fees paid by certain funds, (3) changes to the transfer agency, sub-transfer agency, custody, and pricing/bookkeeping fees paid by the funds, and (4) mergers involving more than 60 funds. CMIA asked the Trustees to consider these proposals together. This report, consistent with and (to the extent applicable) in fulfillment of the terms of the AOD, will focus on changes to advisory and aggregate management fees and discuss other proposals insofar as they affect total fund expenses, which may be a relevant factor in considering the appropriate level of advisory and management fees (defined for purposes of this report as advisory plus administrative fees).
A. Role of the Independent Fee Consultant
The AOD charges the IFC with "managing the process by which proposed management fees ... to be charged the Columbia Fund are negotiated so that they are negotiated in a manner which is at arms' length and reasonable and consistent with this Assurance of Discontinuance." The AOD also provides that CMA "may manage or advise a Columbia Fund only if the reasonableness of the proposed management fees is determined by the Board of Trustees ... using ... an annual independent written evaluation prepared by or under the direction of ... the Independent Fee Consultant." Therefore, the AOD makes clear that the IFC does not supplant the Trustees in negotiating management fees, nor does the IFC substitute his or her judgment for that of the Trustees with respect to the reasonableness of proposed fees or any other matter that is committed to the business judgment of the Trustees.
1 CMA and CMD are subsidiaries of Columbia Management Group, LLC ("CMG"), and are the successors to the entities named in the AOD.
2 I have no material relationship with Bank of America, CMG or Ameriprise Financial, Inc. ("Ameriprise"), aside from serving as IFC, and I am aware of no material relationship with any of their affiliates. I retained John Rea, an independent economic consultant, to assist me with this report.
Unless otherwise stated or required by the context, this report covers only the Nations Funds.
3 Tab 1, CMIA, Supplemental Materials Prepared for the Nations Board, June 16, 2010 ("June Supplemental Materials") at p. 1.
43
B. Elements Involved in Managing the Fee Negotiation Process
In preparing the report required by the AOD, the IFC must consider at least the following six factors set forth in the AOD:
1. The nature and quality of the adviser's services, including the Fund's performance;
2. Management fees (including any components thereof) charged by other mutual fund companies for like services;
3. Possible economies of scale as the Fund grows larger;
4. Management fees (including any components thereof) charged to institutional and other clients of the adviser for like services;
5. Costs to the adviser and its affiliates of supplying services pursuant to the management fee agreements, excluding any intra-corporate profit; and
6. Profit margins of the adviser and its affiliates from supplying such services.
II. Findings
1. Based upon my examination of the information supplied by CMG and Ameriprise in the light of the six factors set forth in the AOD, I conclude that the Trustees have the relevant information necessary to evaluate the reasonableness of the proposed management fee changes for each affected Nations Fund (each a "Fee Change Fund").
2. In my view, the process by which the proposed management fees of each Fee Change Fund have been negotiated with CMIA thus far has been, to the extent practicable, at arm's length and reasonable and consistent with the AOD.
3. CMIA has proposed an increase either in contractual advisory or total management fees for 10 Funds (each a "Fee Increase Fund"). All 10 would have higher advisory fees and lower administrative fees. For three Funds, the increase in proposed contractual advisory fees outweighs the decrease in contractual administrative fees, leading to a proposed increase in contractual management fees. Proposed contractual management fees would decline for six Funds and remain unchanged for one.
4. The projected actual management fee, computed on the basis of assets as of October 31, 2009, would increase for only one of the 10 Funds, Large Cap Enhanced Core, after application of CMIA's proposed expense limitation program and consummation of proposed mergers. For eight Funds, actual management fees are projected to decline, reflecting the interaction of changes in contractual management fees, gross expenses, and expense limitations at October 31, 2009 asset levels. No change is projected in the actual management fee of the remaining Fee Increase Fund.
5. CMIA's fee rationalization and merger proposals would have little effect on the quintile rankings of the actual management fees of the Fee Increase Funds. The ranking would change for only one Fund, while remaining unchanged from the current level for the other nine Funds. On a post-rationalization, post-merger basis, half the actual management fees would be in the fourth or fifth quintiles.
6. Half of the Fee Increase Funds have had median or better-than-median investment performance. None of the Funds would be designated a Review Fund based solely on performance.
7. CMIA proposed that the Funds (except sub-advised Funds) and most other mutual funds it or its affiliates advise or sponsor (together, the "CMIA Funds") be subject to an expense limitation calculated by reference to the median of the relevant fund's Lipper expense group. As a result, all of the Fee Increase Funds are projected to have median or better total expenses after full implementation of the proposed fee changes, expense limitations, and mergers. Some Funds would have higher-than-median actual management fees under this program notwithstanding the newly-established expense limitations. The expense limitation would be recalculated every year based on updated Lipper data. Based upon an analysis of median expenses of Fund peer groups for the 2008-2010 period, it is likely that some Funds would experience sizable changes in their expense limits from year-to-year.
8. CMIA reviewed the differences between management of retail mutual funds and advising institutional accounts and supplied charts plotting contractual and actual institutional and fund fees against assets in various investment categories. The data showed that mutual fund fees are often lower at small asset levels reflecting CMIA's reimbursement of fund expenses. At higher asset levels, mutual fund fees typically exceed institutional fees.
9. CMIA provided fund-by-fund projected profitability data. Due to the significant changes in the operations of the Funds (including the change of the Funds' investment adviser), historical profitability data was judged to have little relevance.
10. CMIA provided data comparing the cumulative benefit to CMIA Fund shareholders of all aspects of its proposals (including proposed mergers) with a projection of synergies in the form of decreased expenses that would benefit CMIA and its parent, Ameriprise.
44
Shareholder Meeting Results
At a Joint Special Meeting of Shareholders held on February 15, 2011, shareholders of the Fund considered the proposals described below.
Proposal 1. Shareholders of the Fund approved a proposed amendment to the Investment Management Services Agreement with Columbia Management Investment Advisers, LLC, as follows:
| Votes For | | Votes Against | | Abstentions | | Broker Non-Votes | |
| | 52,868,120 | | | | 16,686,592 | | | | 71,806 | | | | 1,606,817 | | |
Proposal 2. Shareholders of Columbia Funds Series Trust elected each of the nominees for trustees to the Board of Trustees of Columbia Funds Series Trust, each to hold office for an indefinite term, as follows:
| Trustee | | Votes For | | Votes Withheld | | Abstentions | |
| Kathleen Blatz | | | 2,145,636,122 | | | | 248,012,438 | | | | 0 | | |
| Edward J. Boudreau, Jr. | | | 2,145,430,114 | | | | 248,218,446 | | | | 0 | | |
| Pamela G. Carlton | | | 2,145,515,949 | | | | 248,132,612 | | | | 0 | | |
| William P. Carmichael | | | 2,145,038,695 | | | | 248,609,866 | | | | 0 | | |
| Patricia M. Flynn | | | 2,145,843,563 | | | | 247,804,997 | | | | 0 | | |
| William A. Hawkins | | | 2,145,359,401 | | | | 248,289,160 | | | | 0 | | |
| R. Glenn Hilliard | | | 2,145,079,400 | | | | 248,569,161 | | | | 0 | | |
| Stephen R. Lewis, Jr. | | | 2,145,092,209 | | | | 248,556,351 | | | | 0 | | |
| John F. Maher | | | 2,145,621,338 | | | | 248,027,223 | | | | 0 | | |
| John J. Nagorniak | | | 2,145,337,494 | | | | 248,311,067 | | | | 0 | | |
| Catherine James Paglia | | | 2,145,615,254 | | | | 248,033,306 | | | | 0 | | |
| Leroy C. Richie | | | 2,145,042,120 | | | | 248,606,441 | | | | 0 | | |
| Anthony M. Santomero | | | 2,145,088,174 | | | | 248,560,386 | | | | 0 | | |
| Minor M. Shaw | | | 2,145,430,762 | | | | 248,217,798 | | | | 0 | | |
| Alison Taunton-Rigby | | | 2,145,393,384 | | | | 248,255,177 | | | | 0 | | |
| William F. Truscott | | | 2,144,907,223 | | | | 248,741,338 | | | | 0 | | |
45
This page intentionally left blank.
This page intentionally left blank.
This page intentionally left blank.
Important Information About This Report
The fund mails one shareholder report to each shareholder address. If you would like more than one report, please call shareholder services at 1-800-345-6611 and additional reports will be sent to you. This report has been prepared for shareholders of Columbia Large Cap Core Fund.
A description of the policies and procedures that the fund uses to determine how to vote proxies and a copy of the fund's voting records are available (i) at www.columbiamanagement.com, (ii) on the Securities and Exchange Commission's website at www.sec.gov, and (iii) without charge, upon request, by calling 1-800-368-0346. Information regarding how the fund voted proxies relating to portfolio securities during the 12-month period ended June 30 is available from the SEC's website. Information regarding how the fund voted proxies relating to portfolio securities is also available from the fund's website, www.columbiamanagement.com.
The fund files a complete schedule of portfolio holdings with the SEC for the first and third quarters of each fiscal year on Form N-Q. The fund's Form N-Q is available on the SEC's website at www.sec.gov and may be reviewed and copied at the SEC's Public Reference Room in Washington, D.C. Information on the operation of the Public Reference Room may be obtained by calling 1-800-SEC-0330.
Transfer Agent
Columbia Management Investment
Services Corp.
P.O. Box 8081
Boston, MA 02266-8081
1-800-345-6611
Distributor
Columbia Management Investment
Distributors, Inc.
225 Franklin Street
Boston, MA 02110
Investment Manager
Columbia Management Investment Advisers, LLC
225 Franklin Street
Boston, MA 02110
49

PRSRT STD
U.S. Postage
PAID
Holliston, MA
Permit NO. 20
Columbia Large Cap Core Fund
P. O. Box 8081
Boston, MA 02266-8081
columbiamanagement.com
This information is for use with concurrent or prior delivery of a fund prospectus. Investors should consider the investment objectives, risks, charges and expenses of a mutual fund carefully before investing. For a free prospectus, which contains this and other important information about the funds, visit columbiamanagement.com. Read the prospectus carefully before investing. The Fund is distributed by Columbia Management Investment Distributors, Inc., member FINRA, and managed by Columbia Management Investment Advisers, LLC.
© 2011 Columbia Management Investment Advisers, LLC. All rights reserved.
C-1236 A (04/11)

Columbia Marsico Growth Fund
Annual Report for the Period Ended February 28, 2011
Not FDIC insured • No bank guarantee • May lose value
Table of Contents
| Fund Profile | | | 1 | | |
|
| Economic Update | | | 2 | | |
|
| Performance Information | | | 4 | | |
|
| Understanding Your Expenses | | | 5 | | |
|
| Portfolio Managers' Report | | | 6 | | |
|
| Investment Portfolio | | | 8 | | |
|
Statement of Assets and
Liabilities | | | 11 | | |
|
| Statement of Operations | | | 13 | | |
|
Statement of Changes in
Net Assets | | | 14 | | |
|
| Financial Highlights | | | 16 | | |
|
| Notes to Financial Statements | | | 23 | | |
|
Report of Independent Registered
Public Accounting Firm | | | 32 | | |
|
| Federal Income Tax Information | | | 33 | | |
|
| Fund Governance | | | 34 | | |
|
| Shareholder Meeting Results | | | 38 | | |
|
Important Information About
This Report | | | 41 | | |
|
The views expressed in this report reflect the current views of the respective parties. These views are not guarantees of future performance and involve certain risks, uncertainties and assumptions that are difficult to predict, so actual outcomes and results may differ significantly from the views expressed. These views are subject to change at any time based upon economic, market or other conditions and the respective parties disclaim any responsibility to update such views. These views may not be relied on as investment advice and, because investment decisions for a Columbia Fund are based on numerous factors, may not be relied on as an indication of trading intent on behalf of any particular Columbia Fund. References to specific securities should not be construed as a recommendation or investment advice.
President's Message

Dear Shareholder:
The Columbia Management story began over 100 years ago, and today, we are one of the nation's largest dedicated asset managers. The recent acquisition by Ameriprise Financial, Inc. brings together the talents, resources and capabilities of Columbia Management with those of RiverSource Investments, Threadneedle (acquired by Ameriprise in 2003) and Seligman Investments (acquired by Ameriprise in 2008) to build a best-in-class asset management business that we believe is truly greater than its parts.
RiverSource Investments traces its roots to 1894 when its then newly-founded predecessor, Investors Syndicate, offered a face-amount savings certificate that gave small investors the opportunity to build a safe and secure fund for retirement, education or other special needs. A mutual fund pioneer, Investors Syndicate launched Investors Mutual Fund in 1940. In the decades that followed, its mutual fund products and services lineup grew to include a full spectrum of styles and specialties. More than 110 years later, RiverSource continues to be a trusted financial products leader.
Threadneedle, a leader in global asset management and one of Europe's largest asset managers, offers sophisticated international experience from a dedicated U.K. management team. Headquartered in London, it is named for Threadneedle Street in the heart of the city's financial district, where British investors pioneered international and global investing. Threadneedle was acquired in 2003 and today operates as an affiliate of Columbia Management.
Seligman Investments' beginnings date back to the establishment of the investment firm J. & W. Seligman & Co. in 1864. In the years that followed, Seligman played a major role in the geographical expansion and industrial development of the United States. In 1874, President Ulysses S. Grant named Seligman as fiscal agent for the U.S. Navy—an appointment that would last through World War I. Seligman helped finance the westward path of the railroads and the building of the Panama Canal. The firm organized its first investment company in 1929 and began managing its first mutual fund in 1930. In 2008, J. & W. Seligman & Co. Incorporated was acquired and Seligman Investments became an offering brand of RiverSource Investments, LLC.
We are proud of the rich and distinctive history of these firms, the strength and breadth of products and services they offer, and the combined cultures of pioneering spirit and forward thinking. Together we are committed to providing more for our shareholders than ever before.
> A singular focus on our shareholders
Our business is asset management, so investors are our first priority. We dedicate our resources to identifying timely investment opportunities and provide a comprehensive choice of equity, fixed-income and alternative investments to help meet your individual needs.
> First-class research and thought leadership
We are dedicated to helping you take advantage of today's opportunities and anticipate tomorrow's. We stay abreast of the latest investment trends and ideas, using our collective insight to evaluate events and transform them into solutions you can use.
> A disciplined investment approach
We aren't distracted by passing fads. Our teams adhere to a rigorous investment process that helps ensure the integrity of our products and enables you and your financial advisor to match our solutions to your objectives with confidence.
When you choose Columbia Management, you can be confident that we will take the time to understand your needs and help you and your financial advisor identify the solutions that are right for you. Because at Columbia Management, we don't consider ourselves successful unless you are.
Sincerely,

J. Kevin Connaughton
President, Columbia Funds
Investors should consider the investment objectives, risks, charges and expenses of a mutual fund carefully before investing. For a free prospectus, which contains this and other important information about the funds, visit www.columbiamanagement.com. The prospectus should be read carefully before investing.
Columbia Funds are distributed by Columbia Management Investment Distributors, Inc., member FINRA, and managed by Columbia Management Investment Advisers, LLC.
© 2011 Columbia Management Investment Advisers, LLC. All rights reserved.
Fund Profile – Columbia Marsico Growth Fund
Summary
g For the 12-month period that ended February 28, 2011, the fund's Class A shares returned 26.51% without sales charge.
g The fund outperformed its benchmark, the S&P 500 Index1, and the average return of the funds in its peer group, the Lipper Large-Cap Growth Funds Classification.2
g Both stock selection and sector positioning figured into the fund's strong returns.
Portfolio Management
Thomas F. Marsico has managed the fund since 1997 and is Chief Executive Officer of Marsico Capital Management, LLC ("MCM"), investment subadviser to the fund. In 2010, A. Douglas Rao and Coralie Witter joined Thomas F. Marsico as co-managers of the fund.
Columbia Management Investment Advisers, LLC (the Investment Manager) retained MCM to serve as investment subadviser to the Columbia Marsico funds. As an investment subadviser, MCM makes the investment decisions and manages all or a portion of the fund. MCM is an investment adviser registered with the Securities and Exchange Commission. MCM is not affiliated with the Investment Manager.
1The Standard and Poor's (S&P) 500 Index tracks the performance of 500 widely held large-capitalization U.S. stocks.
2Lipper Inc., a widely respected data provider in the industry, calculates an average total return (assuming reinvestment of distributions) for mutual funds with investment objectives similar to those of the fund. Lipper makes no adjustment for the effect of sales loads.
Indices are not available for investment, are not professionally managed and do not reflect sales charges, fees, brokerage commissions, taxes or other expenses of investing. Securities in the fund may not match those in an index.
Performance data quoted represents past performance and current performance may be lower or higher. Past performance is no guarantee of future results. The investment return and principal value will fluctuate so that shares, when redeemed, may be worth more or less than the original cost. Please visit www.columbiamanagement.com for daily and most recent month-end performance updates.
Summary
1-year return as of 02/28/11
| | | | +26.51% | |
|
|  | | | Class A shares
(without sales charges) | |
|
| | | | +22.57% | |
|
|  | | | S&P 500 Index | |
|
Morningstar Style BoxTM

The Morningstar Style BoxTM is based on the Fund's portfolio holdings. For equity funds, the vertical axis shows the market capitalization of the stocks owned, and the horizontal axis shows investment style (value, blend or growth). Information shown is based on the most recent data provided by Morningstar.
© 2011 Morningstar, Inc. All rights reserved. The Morningstar information contained herein: (1) is proprietary to Morningstar and/or its content providers; (2) may not be copied or distributed; and (3) is not warranted to be accurate, complete or timely. Neither Morningstar nor its content providers are responsible for any damages or losses arising from any use of this information.
1
Economic Update – Columbia Marsico Growth Fund
Summary
For the 12-month period that ended February 28, 2011
g The U.S. stock market, as measured by the S&P 500 Index, delivered solid returns, despite a summer 2010 correction. Foreign stock market returns were generally in line with the U.S. market, as measured by the MSCI EAFE Index (Net).
| S&P Index | | MSCI Index | |
|
 | |  | |
|
g Strengthening economic growth and rising interest rates kept a lid on most bond market sectors. The Barclays Capital Aggregate Bond Index delivered modest results. However, high-yield bonds were strong performers, as measured by the JPMorgan Developed BB High Yield Index.
Barclays
Aggregate Index | | JPMorgan
Index | |
|
 | |  | |
|
The U.S. economy continued to expand at a modest pace over the past 12 months, as measured by gross domestic product (GDP). After a strong first quarter in 2010, GDP growth dropped to 1.7% in the second quarter and fear spread that the economy would lapse into recession. However, the pace picked up in the third quarter, and growth was strong enough to inspire confidence among consumers, businesses and investors. GDP expanded by 2.6% in the third quarter and 2.8% in the fourth quarter. With the Federal Reserve Board (the Fed) providing additional monetary stimulus to shore up economic growth and the extension of key tax cuts for the next two years, 2011 expectations are for continued growth. Consumer confidence is on the mend, even though job growth has not met expectations. Business spending also tracked higher over the period.
Consumer spending on cars, clothing and other goods generally trended higher throughout the year. Holiday spending rose 5.5% between November 5, 2010 and December 24, 2010, in all retail categories, excluding automobiles, compared with the same period in 2009, according to MasterCard Advisors' SpendingPulse, which tracks spending on all transactions including cash. Analysts say that an increase in personal savings and a decline in consumer debt gave consumers confidence to spend a little more on the 2010 holidays. The personal savings rate edged higher, ending January 2011, the last month for which data was available, at 5.8%. Personal income also increased during the year, surging in January 2011, as payroll tax cuts kicked in.
News on the job front was mostly positive over the 12-month period. A good portion of the jobs added in March, April and May of 2010 were temporary, government-sponsored census positions, which began to unwind in June, July and August of 2010. However, private sector payroll employment began to trend higher in the third quarter, massive layoffs declined and job growth turned solidly positive, with the addition of 255,000 new jobs in the first two months of 2011.
Despite some glimmers of improvement early in 2010, the housing market remained troublesome throughout the period. Both new and existing home sales fell after a federal tax credit for new and repeat homebuyers expired. Distressed properties pressured prices and foreclosures continued—another drag on prices. The inventory of unsold homes ended the period just about where it started, at 7.6 months for both new and existing homes, according to the National Association of Realtors and a joint release from the U.S. Census Bureau and the U.S. Department of Housing and Urban Development. The new year brought a bit of good news: Existing home sales increased in January 2011, raising the level of sales above where it was one year ago. According to the National Association of Realtors, it was the first time in seven months that year-over-year sales activity compared favorably.
Reports from the business side of the economy were generally positive. A key measure of the nation's manufacturing situation—the Institute for Supply Management's Index—took a somewhat surprising turn higher in the final months of the period. Technology spending rose 12% in 2010, according to the NPD Group, a national marketing research firm. Purchases of computers, networking and software returned to prerecession levels. Industrial production was disappointingly flat at year end, per the report issued by the Fed, and it slipped further in January 2011. The amount of manufacturing capacity utilized, per the report issued by the Fed,—a key measure of the health of the manufacturing sector—continued to inch higher.
2
Economic Update (continued) – Columbia Marsico Growth Fund
Stocks moved higher despite summer 2010 setback
Against a strengthening economic backdrop, a stock market rally that began early in 2009 continued into 2010 despite a summer setback linked to a debt crisis brewing in Europe, which raised concerns among U.S. investors. These fears were short-lived and stocks regained their footing in September 2010, moving higher through the end of the period. The S&P 500 Index1 returned 22.57% for the 12 months through February 28, 2011. Outside the United States, stock market returns seesawed but ended just short of U.S. market returns. The MSCI EAFE Index (Net),2 a broad gauge of stock market performance in foreign developed markets, returned 20.00% (in U.S. dollars) for the 12-month period, as concerns about the impact of a bailout for weak euro zone economies abated. Emerging stock markets were similarly strong. The MSCI Emerging Markets Index (Net)3 returned 20.91% (in U.S. dollars) for the 12-month period.
Bonds delivered modest returns
As the economy strengthened and interest rates edged higher, most bond sectors delivered modest returns. The Barclays Capital Aggregate Bond Index4 returned 4.93%. High-yield bonds led the fixed-income markets. For the 12 months covered by this report, the JPMorgan Developed BB High Yield Index5 returned 14.74%. Despite rising yields in the second half of the period, the Treasury market was also positive. The Barclays Capital U.S. Treasury Index6 returned 3.71%. However, municipal bonds struggled in the final months of the period, as interest rates inched higher and issue supply surged ahead of the expiration of the Build America Bonds program. The Barclays Capital Municipal Bond Index7 gained 1.72% for the period. Despite positive economic activity, the Fed kept a key short-term interest rate—the federal funds rate—close to zero.
Past performance is no guarantee of future results.
1The Standard & Poor's (S&P) 500 Index tracks the performance of 500 widely held, large-capitalization U.S. stocks.
2The Morgan Stanley Capital International Europe, Australasia, Far East (MSCI EAFE) Index (Net) is a free float-adjusted market capitalization index that is designed to measure the equity market performance of developed markets, excluding the U.S. & Canada. As of May 27, 2010, the MSCI EAFE Index (Net) consisted of the following 22 developed market country indices: Australia, Austria, Belgium, Denmark, Finland, France, Germany, Greece, Hong Kong, Ireland, Israel, Italy, Japan, the Netherlands, New Zealand, Norway, Portugal, Singapore, Spain, Sweden, Switzerland and the United Kingdom.
3The Morgan Stanley Capital International Emerging Markets (MSCI EM) Index (Net) is a free float-adjusted market capitalization index that is designed to measure equity market performance of emerging markets. As of May 27, 2010, the MSCI EM Index (Net) consisted of the following 21 emerging market country indices: Brazil, Chile, China, Colombia, Czech Republic, Egypt, Hungary, India, Indonesia, Korea, Malaysia, Mexico, Morocco, Peru, Philippines, Poland, Russia, South Africa, Taiwan, Thailand and Turkey.
4The Barclays Capital Aggregate Bond Index is a market value-weighted index that tracks the daily price, coupon, pay-downs and total return performance of fixed-rate, publicly placed, dollar-denominated and non-convertible investment grade debt issues with at least $250 million par amount outstanding and with at least one year to final maturity.
5The JPMorgan Developed BB High Yield Index is an unmanaged index designed to mirror the investable universe of the U.S. dollar developed, BB-rated, high yield corporate debt market.
6The Barclays Capital U.S. Treasury Index includes public obligations of the U.S. Treasury. Treasury bills are excluded by the maturity constraint. In addition, certain special issues, such as state and local government series bonds (SLGs), as well as U.S.Treasury TIPS, are excluded. STRIPS are excluded from the index because their inclusion would result in double-counting.
7The Barclays Capital Municipal Bond Index is considered representative of the broad market for investment-grade, tax-exempt bonds with a maturity of at least one year.
Indices are not available for investment, are not professionally managed and do not reflect sales charges, fees, brokerage commissions, taxes or other expenses of investing. Securities in the fund may not match those in an index.
3
Performance Information – Columbia Marsico Growth Fund
Performance data quoted represents past performance and current performance may be lower or higher. Past performance is no guarantee of future results. The investment return and principal value will fluctuate so that shares, when redeemed, may be worth more or less than the original cost. Please visit www.columbiamanagement.com for daily and most recent month-end performance updates.
Performance of a $10,000 investment 03/01/01 – 02/28/11
The chart above shows the change in value of a hypothetical $10,000 investment in Class A shares of Columbia Marsico Growth Fund during the stated time period, and does not reflect the deduction of taxes that a shareholder may pay on fund distributions or on the redemption of fund shares.
Performance of a $10,000 investment 03/01/01 – 02/28/11 ($)
| Sales charge | | without | | with | |
| Class A | | | 13,586 | | | | 12,803 | | |
| Class B | | | 12,606 | | | | 12,606 | | |
| Class C | | | 12,609 | | | | 12,609 | | |
| Class I | | | n/a | | | | n/a | | |
| Class R | | | 13,389 | | | | n/a | | |
| Class W | | | n/a | | | | n/a | | |
| Class Z | | | 13,927 | | | | n/a | | |
Average annual total return as of 02/28/11 (%)
| Share class | | A | | B | | C | | I | | R | | W | | Z | |
| Inception | | 12/31/97 | | 12/31/97 | | 12/31/97 | | 09/27/10 | | 01/23/06 | | 09/27/10 | | 12/31/97 | |
| Sales charge | | without | | with | | without | | with | | without | | with | | without | | without | | without | | without | |
| 1-year | | | 26.51 | | | | 19.25 | | | | 25.55 | | | | 20.55 | | | | 25.58 | | | | 24.58 | | | | n/a | | | | 26.14 | | | | n/a | | | | 26.81 | | |
| 5-year | | | 2.07 | | | | 0.88 | | | | 1.31 | | | | 0.93 | | | | 1.32 | | | | 1.32 | | | | n/a | | | | 1.79 | | | | n/a | | | | 2.33 | | |
| 10-year/Life | | | 3.11 | | | | 2.50 | | | | 2.34 | | | | 2.34 | | | | 2.35 | | | | 2.35 | | | | 18.05 | | | | 2.96 | | | | 17.91 | | | | 3.37 | | |
The "with sales charge" returns include the maximum initial sales charge of 5.75% for Class A shares, the applicable contingent deferred sales charge of 5.00% in the first year, declining to 1.00% in the sixth year, and eliminated thereafter for Class B shares and 1.00% for Class C shares for the first year only. The "without sales charge" returns do not include the effect of sales charges. If they had, returns would be lower.
Performance results reflect any fee waivers or reimbursements of fund expenses by the Investment Manager and/or any of its affiliates. Absent these fee waivers or expense reimbursement arrangements, performance results would have been lower.
All results shown assume reinvestment of distributions. Class I and Class Z shares are sold at net asset value with no distribution and service (Rule 12b-1) fees. Class R shares are sold at net asset value with distribution (Rule 12b-1) fees and Class W shares are sold at net asset value with service (Rule 12b-1) fees. Class I, Class R, Class W and Class Z shares have limited eligibility and the investment minimum requirements may vary. Please see the fund's prospectuses for details. Performance for different share classes will vary based on differences in sales charges and fees associated with each class.
Class I and Class W shares were initially offered on September 27, 2010.
The tables do not reflect the deduction of taxes that a shareholder may pay on fund distributions or on the redemption of fund shares.
The returns for Class R shares include the returns of Class A shares prior to January 23, 2006, the date on which Class R shares were initially offered by the fund. These returns have not been restated to reflect any differences in expenses between Class A shares and Class R shares. If differences in expenses had been reflected, the returns shown would have been lower, since Class R shares are subject to higher distribution and service (Rule 12b-1) fees.
4
Understanding Your Expenses – Columbia Marsico Growth Fund
As a fund shareholder, you incur two types of costs. There are transaction costs, which generally include sales charges on purchases and may include redemption fees or exchange fees. There are also ongoing costs, which generally include investment advisory fees, distribution and service (Rule 12b-1) fees and other fund expenses. The information on this page is intended to help you understand the ongoing costs of investing in the fund and to compare these costs with the ongoing costs of investing in other mutual funds.
Analyzing your fund's expenses by share class
To illustrate these ongoing costs, we have provided an example and calculated the expenses paid by investors in each share class during the period. The information in the following table is based on an initial investment of $1,000, which is invested at the beginning of the period and held for the entire period. Expense information is calculated two ways and each method provides you with different information. The amount listed in the "Actual" column is calculated using the fund's actual operating expenses and total return for the period. The amount listed in the "Hypothetical" column for each share class assumes that the return each year is 5% before expenses and is calculated based on the fund's actual operating expenses. You should not use the hypothetical account values and expenses to estimate either your actual account balance at the end of the period or the expenses you paid during this period.
Compare with other funds
Since all mutual funds are required to include the same hypothetical calculations about expenses in shareholder reports, you can use this information to compare the ongoing cost of investing in the fund with other funds. To do so, compare the 5% hypothetical example with the 5% hypothetical examples that appear in the shareholder reports of other funds. As you compare hypothetical examples of other funds, it is important to note that hypothetical examples are meant to highlight the ongoing costs of investing in a fund and do not reflect any transaction costs, such as sales charges, redemption fees or exchange fees.
Estimating your actual expenses
To estimate the expenses that you paid over the period, first you will need your account balance at the end of the period:
g For shareholders who receive their account statements from Columbia Management Investment Services Corp., your account balance is available online at www.columbiamanagement.com or by calling Shareholder Services at 800.345.6611.
g For shareholders who receive their account statements from their financial intermediary, contact your financial intermediary to obtain your account balance.
1. Divide your ending account balance by $1,000. For example, if an account balance was $8,600 at the end of the period, the result would be 8.6.
2. In the section of the table below titled "Expenses paid during the period," locate the amount for your share class. You will find this number in the column labeled "Actual." Multiply this number by the result from step 1. Your answer is an estimate of the expenses you paid on your account during the period.
If the value of your account falls below the minimum initial investment requirement applicable to you, your account may be subject to a $20 annual fee. This fee is not included in the accompanying table. If you are subject to the fee, keep it in mind when you are estimating the ongoing expenses of investing in the fund and when comparing the expenses of this fund with other funds.
09/01/10 – 02/28/11
| | | Account value at the
beginning of the period ($) | | Account value at the
end of the period ($) | | Expenses paid
during the period ($) | | Fund's annualized
expense ratio (%) | |
| | | Actual | | Hypothetical | | Actual | | Hypothetical | | Actual | | Hypothetical | | Actual | |
| Class A | | | 1,000.00 | | | | 1,000.00 | | | | 1,317.80 | | | | 1,018.40 | | | | 7.41 | | | | 6.46 | | | | 1.29 | | |
| Class B | | | 1,000.00 | | | | 1,000.00 | | | | 1,312.70 | | | | 1,014.68 | | | | 11.70 | | | | 10.19 | | | | 2.04 | | |
| Class C | | | 1,000.00 | | | | 1,000.00 | | | | 1,313.00 | | | | 1,014.68 | | | | 11.70 | | | | 10.19 | | | | 2.04 | | |
| Class I | | | 1,000.00 | | | | 1,000.00 | | | | 1,042.60 | * | | | 1,020.43 | | | | 3.79 | * | | | 4.41 | | | | 0.88 | | |
| Class R | | | 1,000.00 | | | | 1,000.00 | | | | 1,316.20 | | | | 1,017.16 | | | | 8.84 | | | | 7.70 | | | | 1.54 | | |
| Class W | | | 1,000.00 | | | | 1,000.00 | | | | 1,042.30 | * | | | 1,018.45 | | | | 5.51 | * | | | 6.41 | | | | 1.28 | | |
| Class Z | | | 1,000.00 | | | | 1,000.00 | | | | 1,320.00 | | | | 1,019.64 | | | | 5.98 | | | | 5.21 | | | | 1.04 | | |
Expenses paid during the period are equal to the annualized expense ratio for the share class, multiplied by the average account value over the period, then multiplied by the number of days in the fund's most recent fiscal half-year and divided by 365.
It is important to note that the expense amounts shown in the table are meant to highlight only ongoing costs of investing in the fund and do not reflect any transaction costs, such as sales charges, redemption fees or exchange fees. Therefore, the hypothetical examples provided may not help you determine the relative total costs of owning shares of different funds. If these transaction costs were included, your costs would have been higher.
*For the period September 27, 2010 through February 28, 2011. Class I and Class W shares commenced operations on September 27, 2010.
5
Portfolio Managers' Report – Columbia Marsico Growth Fund
Performance data quoted represents past performance and current performance may be lower or higher. Past performance is no guarantee of future results. The investment return and principal value will fluctuate so that shares, when redeemed, may be worth more or less than the original cost. Please visit www.columbiamanagement.com for daily and most recent month-end performance updates.
Net asset value per share
as of 02/28/11 ($)
| Class A | | | 21.19 | | |
| Class B | | | 19.31 | | |
| Class C | | | 19.34 | | |
| Class I | | | 21.55 | | |
| Class R | | | 20.94 | | |
| Class W | | | 21.20 | | |
| Class Z | | | 21.57 | | |
Distributions declared per share
03/01/10 – 02/28/11 ($)
| Class I | | | 0.04 | | |
| Class Z | | | 0.01 | | |
Top 5 sectors
as of 02/28/11 (%)
| Consumer Discretionary | | | 24.3 | | |
| Information Technology | | | 19.2 | | |
| Materials | | | 16.7 | | |
| Financials | | | 14.6 | | |
| Industrials | | | 13.6 | | |
Top 5 sectors are calculated as a percentage of net assets.
For the 12-month period that ended February 28, 2011, the fund's Class A shares returned 26.51% without sales charge. The fund's benchmark, the S&P 500 Index, returned 22.57%. The average return of the fund's peer group, the Lipper Large-Cap Growth Funds Classification, was 24.46%. Stock selection in information technology was notably strong, while both stock selection and sector weights in consumer discretionary, materials and consumer staples sectors had a positive impact on performance. By contrast, the fund lost some ground relative to the index in energy. It was underweight relative to the index and its holdings underperformed energy holdings in the index.
Favorable stock selection, sector positioning
Stock selection in the information technology and consumer discretionary sectors was especially strong. Both Chinese Internet services provider Baidu (3.3% of net assets) and Apple Computer (5.5% of net assets and the fund's largest holding), maker of the iPad and iPod, appreciated significantly during the period. Within consumer discretionary, Internet retailers priceline.com (2.7% of net assets) and Amazon.com (3.7% of net assets) posted strong price gains. Casino resort operator Wynn Resorts' (2.2% of net assets) stock price soared during the period. The fund had more exposure than the index to consumer discretionary and materials sectors, which benefited performance because the two were strong performers within the index. Agricultural product firm Monsanto (3.3% of net assets) led performance among the fund's materials holdings.
We did well to underweight health care and consumer staples stocks, which were the weakest performers within the index. Plus, the fund's largest consumer staples holding, Estée Lauder (1.3% of net assets), a leader in skin care and cosmetics products, posted a solid return.
Energy positioning, financials stock selection detracted from returns
The fund lost some ground in the energy sector, which was the strongest performer in the S&P 500 Index. The fund had less exposure than the index to energy and stock selection within the sector also hurt results. Offshore driller Transocean and exploration and production firm Southwestern Energy both dropped sharply prior to being sold from the portfolio. Transocean was sold from the fund shortly after the late-April 2010 Gulf of Mexico oil spill. The fund's holdings in the financials sector generated a positive return, in aggregate, during the period. However, an emphasis on the weak-performing bank industry resulted in gains that lagged the financials in the index.
Portfolio changes
During the period, the fund sold its health care holdings, which we believe struggled due to the overhang of U.S. health care reform initiatives. The fund also reduced its exposure to the information technology sector. The fund increased its investments in the consumer discretionary, materials and industrials sectors. At the end of the period, consumer discretionary, information technology, materials, financials and industrials sectors were the fund's largest areas of emphasis. The fund had no investments in the health care, utilities or telecommunication services sectors.
6
Portfolio Managers' Report (continued) – Columbia Marsico Growth Fund
Source for all statistical data—Columbia Management Investment Advisers, LLC.
Source for all stock-specific commentary—Marsico Capital Management, LLC.
Portfolio characteristics and holdings are subject to change periodically and may not be representative of current characteristics and holdings. The outlook for the fund may differ from those presented for other Columbia Funds.
The fund normally invests in a core portfolio of 35-50 stocks. By maintaining a relatively concentrated portfolio, the fund may be subject to a greater risk than a fund that is more fully diversified.
International investing may involve certain risks, including currency fluctuations, risks associated with possible differences in financial accounting standards and other monetary and political risks. Significant levels of foreign taxes, including potentially confiscatory levels of taxation and withholding taxes, may also apply to some foreign investments.
Top 10 holdings
as of 02/28/11 (%)
| Apple, Inc. | | | 5.5 | | |
| Dow Chemical Co. | | | 4.8 | | |
| Oracle Corp. | | | 4.0 | | |
| Union Pacific Corp. | | | 3.8 | | |
| NIKE, Inc. | | | 3.7 | | |
| Amazon.com, Inc. | | | 3.7 | | |
| U.S. Bancorp | | | 3.5 | | |
| Praxair, Inc. | | | 3.4 | | |
| Baidu, Inc. | | | 3.3 | | |
| Monsanto Co. | | | 3.3 | | |
The fund is actively managed and the composition of its portfolio will change over time. Information provided is calculated as a percentage of net assets.
7
Investment Portfolio – Columbia Marsico Growth Fund
February 28, 2011
| Common Stocks – 97.4% | |
| | | Shares | | Value ($) | |
| Consumer Discretionary – 24.3% | |
| Hotels, Restaurants & Leisure – 6.5% | |
| McDonald's Corp. | | | 715,187 | | | | 54,125,352 | | |
| Starbucks Corp. | | | 1,398,365 | | | | 46,118,078 | | |
| Wynn Resorts Ltd. | | | 637,154 | | | | 78,325,341 | | |
| Yum! Brands, Inc. | | | 1,015,327 | | | | 51,101,408 | | |
| Hotels, Restaurants & Leisure Total | | | 229,670,179 | | |
| Internet & Catalog Retail – 6.4% | |
| Amazon.com, Inc. (a) | | | 752,621 | | | | 130,421,693 | | |
| priceline.com, Inc. (a) | | | 213,238 | | | | 96,784,464 | | |
| Internet & Catalog Retail Total | | | 227,206,157 | | |
| Media – 1.3% | |
| Time Warner, Inc. | | | 1,175,794 | | | | 44,915,331 | | |
| Media Total | | | 44,915,331 | | |
| Multiline Retail – 1.0% | |
| Nordstrom, Inc. | | | 819,209 | | | | 37,077,399 | | |
| Multiline Retail Total | | | 37,077,399 | | |
| Specialty Retail – 4.1% | |
| Tiffany & Co. | | | 1,150,272 | | | | 70,799,242 | | |
| TJX Companies, Inc. | | | 1,522,511 | | | | 75,927,623 | | |
| Specialty Retail Total | | | 146,726,865 | | |
| Textiles, Apparel & Luxury Goods – 5.0% | |
Cie Financiere Richemont SA,
ADR | | | 7,716,248 | | | | 43,751,126 | | |
| NIKE, Inc., Class B | | | 1,485,845 | | | | 132,284,780 | | |
| Textiles, Apparel & Luxury Goods Total | | | 176,035,906 | | |
| Consumer Discretionary Total | | | 861,631,837 | | |
| Consumer Staples – 2.2% | |
| Food Products – 0.9% | |
Mead Johnson Nutrition Co.,
Class A | | | 495,224 | | | | 29,639,157 | | |
| Food Products Total | | | 29,639,157 | | |
| Personal Products – 1.3% | |
Estée Lauder Companies, Inc.,
Class A | | | 492,825 | | | | 46,527,608 | | |
| Personal Products Total | | | 46,527,608 | | |
| Consumer Staples Total | | | 76,166,765 | | |
| Energy – 7.3% | |
| Energy Equipment & Services – 2.0% | |
| Halliburton Co. | | | 1,551,181 | | | | 72,812,436 | | |
| Energy Equipment & Services Total | | | 72,812,436 | | |
| | | Shares | | Value ($) | |
| Oil, Gas & Consumable Fuels – 5.3% | |
| Anadarko Petroleum Corp. | | | 1,310,162 | | | | 107,210,557 | | |
| EOG Resources, Inc. | | | 713,793 | | | | 80,166,092 | | |
| Oil, Gas & Consumable Fuels Total | | | 187,376,649 | | |
| Energy Total | | | 260,189,085 | | |
| Financials – 14.1% | |
| Capital Markets – 2.8% | |
| Goldman Sachs Group, Inc. | | | 610,118 | | | | 99,925,126 | | |
| Capital Markets Total | | | 99,925,126 | | |
| Commercial Banks – 8.6% | |
PNC Financial Services
Group, Inc. | | | 1,348,050 | | | | 83,174,685 | | |
| U.S. Bancorp | | | 4,507,787 | | | | 125,000,934 | | |
| Wells Fargo & Co. | | | 2,984,301 | | | | 96,273,550 | | |
| Commercial Banks Total | | | 304,449,169 | | |
| Diversified Financial Services – 2.7% | |
| Citigroup, Inc. (a) | | | 20,349,987 | | | | 95,237,939 | | |
| Diversified Financial Services Total | | | 95,237,939 | | |
| Financials Total | | | 499,612,234 | | |
| Industrials – 13.6% | |
| Aerospace & Defense – 3.6% | |
| General Dynamics Corp. | | | 873,318 | | | | 66,476,966 | | |
| Precision Castparts Corp. | | | 438,517 | | | | 62,159,785 | | |
| Aerospace & Defense Total | | | 128,636,751 | | |
| Air Freight & Logistics – 0.8% | |
| FedEx Corp. | | | 294,348 | | | | 26,497,207 | | |
| Air Freight & Logistics Total | | | 26,497,207 | | |
| Electrical Equipment – 0.9% | |
| Rockwell Automation, Inc. | | | 354,752 | | | | 31,122,393 | | |
| Electrical Equipment Total | | | 31,122,393 | | |
| Machinery – 4.5% | |
| Cummins, Inc. | | | 455,395 | | | | 46,049,542 | | |
| Danaher Corp. | | | 1,337,763 | | | | 67,690,808 | | |
| Eaton Corp. | | | 428,047 | | | | 47,419,047 | | |
| Machinery Total | | | 161,159,397 | | |
| Road & Rail – 3.8% | |
| Union Pacific Corp. | | | 1,421,994 | | | | 135,672,447 | | |
| Road & Rail Total | | | 135,672,447 | | |
| Industrials Total | | | 483,088,195 | | |
See Accompanying Notes to Financial Statements.
8
Columbia Marsico Growth Fund
February 28, 2011
| Common Stocks (continued) | |
| | | Shares | | Value ($) | |
| Information Technology – 19.2% | |
| Communications Equipment – 1.7% | |
| Acme Packet, Inc. (a) | | | 228,895 | | | | 17,222,060 | | |
| F5 Networks, Inc. (a) | | | 367,746 | | | | 43,397,705 | | |
| Communications Equipment Total | | | 60,619,765 | | |
| Computers & Peripherals – 5.5% | |
| Apple, Inc. (a) | | | 554,959 | | | | 196,017,068 | | |
| Computers & Peripherals Total | | | 196,017,068 | | |
| Internet Software & Services – 3.3% | |
| Baidu, Inc., ADR (a) | | | 955,639 | | | | 115,785,221 | | |
| Internet Software & Services Total | | | 115,785,221 | | |
| Semiconductors & Semiconductor Equipment – 2.7% | |
| Broadcom Corp., Class A | | | 2,354,140 | | | | 97,037,651 | | |
| Semiconductors & Semiconductor Equipment Total | | | 97,037,651 | | |
| Software – 6.0% | |
| Oracle Corp. | | | 4,330,223 | | | | 142,464,337 | | |
| Salesforce.com, Inc. (a) | | | 525,674 | | | | 69,530,900 | | |
| Software Total | | | 211,995,237 | | |
| Information Technology Total | | | 681,454,942 | | |
| Materials – 16.7% | |
| Chemicals – 14.0% | |
| Dow Chemical Co. | | | 4,537,003 | | | | 168,595,031 | | |
| Monsanto Co. | | | 1,604,747 | | | | 115,365,262 | | |
| PPG Industries, Inc. | | | 1,035,337 | | | | 91,503,084 | | |
| Praxair, Inc. | | | 1,211,721 | | | | 120,420,833 | | |
| Chemicals Total | | | 495,884,210 | | |
| Metals & Mining – 2.7% | |
| BHP Billiton PLC, ADR | | | 675,187 | | | | 53,549,081 | | |
Freeport-McMoRan
Copper & Gold, Inc. | | | 837,170 | | | | 44,328,152 | | |
| Metals & Mining Total | | | 97,877,233 | | |
| Materials Total | | | 593,761,443 | | |
Total Common Stocks
(cost of $2,367,976,438) | | | 3,455,904,501 | | |
| Preferred Stock – 0.5% | |
| Financials – 0.5% | |
| Commercial Banks – 0.5% | |
Wells Fargo & Co.,
Series J, 8.000% | | | 687,425 | | | | 18,959,181 | | |
| Commercial Banks Total | | | 18,959,181 | | |
| Financials Total | | | 18,959,181 | | |
Total Preferred Stock
(cost of $13,207,874) | | | 18,959,181 | | |
| Short-Term Obligation – 0.2% | |
| | | Par ($) | | Value ($) | |
Repurchase agreement with Fixed
Income Clearing Corp.,
dated 02/28/11, due 03/01/11
at 0.090%, collateralized
by a U.S. Government
Agency obligation maturing
12/18/13, market value of
$6,614,275 (repurchase
proceeds $6,483,016) | | | 6,483,000 | | | | 6,483,000 | | |
Total Short-Term Obligation
(cost of $6,483,000) | | | 6,483,000 | | |
Total Investments – 98.1%
(cost of $2,387,667,312) (b) | | | 3,481,346,682 | | |
| Other Assets & Liabilities, Net – 1.9% | | | 67,939,408 | | |
| Net Assets – 100.0% | | | 3,549,286,090 | | |
Notes to Investment Portfolio:
(a) Non-income producing security.
(b) Cost for federal income tax purposes is $2,416,289,415.
Generally accepted accounting principles (GAAP) require disclosure regarding the inputs and valuation techniques used to measure fair value and any changes in valuation inputs or techniques. In addition, investments shall be disclosed by major category.
The Fund categorizes its fair value measurements according to a three-level hierarchy that maximizes the use of observable inputs and minimizes the use of unobservable inputs by prioritizing that the most observable input be used when available. Observable inputs are those that market participants would use in pricing an investment based on market data obtained from sources independent of the reporting entity. Unobservable inputs are those that reflect the Fund's assumptions about the information market participants would use in pricing an investment. An investment's level within the fair value hierarchy is based on the lowest level of any input that is deemed significant to the asset or liability's fair value measurement. The input levels are not necessarily an indication of the risk or liquidity associated with investments at that level. For example, certain U.S. government securities are generally high quality and liquid, however, they are reflected as Level 2 because the inputs used to determine fair value may not always be quoted prices in an active market.
Fair value inputs are summarized in the three broad levels listed below:
• Level 1—Valuations based on quoted prices for investments in active markets that the Fund has the ability to access at the measurement date (including NAV for open-end mutual funds). Valuation adjustments are not applied to Level 1 investments.
• Level 2—Valuations based on other significant observable inputs (including quoted prices for similar securities, interest rates, prepayment speeds, credit risks, etc.).
• Level 3—Valuations based on significant unobservable inputs (including the Fund's own assumptions and judgment in determining the fair value of investments).
Inputs that are used in determining fair value of an investment may include price information, credit data, volatility statistics, and other factors. These inputs can be either observable or unobservable. The availability of observable inputs can vary between investments, and is affected by various factors such as the type of investment, and the volume and level of activity for that investment or similar investments in the marketplace. The inputs will be considered by the Investment Manager, along with any other relevant factors in the calculation of an investment's fair value. The Fund uses prices and inputs
See Accompanying Notes to Financial Statements.
9
Columbia Marsico Growth Fund
February 28, 2011
that are current as of the measurement date, which may include periods of market dislocations. During these periods, the availability of prices and inputs may be reduced for many investments. This condition could cause an investment to be reclassified between the various levels within the hierarchy. Non-U.S. equity securities actively traded in foreign markets may be reflected in Level 2 despite the availability of closing prices, because the Fund evaluates and determines whether those closing prices reflect fair value at the close of the New York Stock Exchange (NYSE) or require adjustment, as described in Note 2 to the financial statements—Security Valuation.
Investments falling into the Level 3 category are primarily supported by quoted prices from brokers and dealers participating in the market for those investments. However, these may be classified as Level 3 investments due to lack of market transparency and corroboration to support these quoted prices. Additionally, valuation models may be used as the pricing source for any remaining investments classified as Level 3. These models rely on one or more significant unobservable inputs and/or significant assumptions by the Investment Manager. Inputs used in valuations may include, but are not limited to, financial statement analysis, capital account balances, discount rates and estimated cash flows, and comparable company data.
The following table is a summary of the inputs used to value the Fund's investments as of February 28, 2011:
| Description | | Quoted
Prices
(Level 1) | | Other
Significant
Observable
Inputs
(Level 2) | | Significant
Unobservable
Inputs
(Level 3) | | Total | |
| Total Common Stocks | | $ | 3,455,904,501 | | | $ | — | | | $ | — | | | $ | 3,455,904,501 | | |
| Total Preferred Stock | | | 18,959,181 | | | | — | | | | — | | | | 18,959,181 | | |
Total Short-Term
Obligation | | | — | | | | 6,483,000 | | | | — | | | | 6,483,000 | | |
| Total Investments | | $ | 3,474,863,682 | | | $ | 6,483,000 | | | $ | — | | | $ | 3,481,346,682 | | |
The Fund's assets assigned to the Level 2 input category represent certain short-term obligations which are valued using amortized cost, an income approach which converts future cash flows to a present value based upon the discount or premium at purchase.
There were no significant transfers of financial assets between Levels 1 and 2 during the period.
At February 28, 2011, the Fund held investments in the following sectors:
| Sector (Unaudited) | | % of
Net Assets | |
| Consumer Discretionary | | | 24.3 | | |
| Information Technology | | | 19.2 | | |
| Materials | | | 16.7 | | |
| Financials | | | 14.6 | | |
| Industrials | | | 13.6 | | |
| Energy | | | 7.3 | | |
| Consumer Staples | | | 2.2 | | |
| | | | 97.9 | | |
| Short-Term Obligation | | | 0.2 | | |
| Other Assets & Liabilities, Net | | | 1.9 | | |
| | | | 100.0 | | |
| Acronym | | Name | |
| ADR | | American Depositary Receipt | |
See Accompanying Notes to Financial Statements.
10
Statement of Assets and Liabilities – Columbia Marsico Growth Fund
February 28, 2011
| | | | | ($) | |
| Assets | | Investments, at identified cost | | | 2,387,667,312 | | |
| | | Investments, at value | | | 3,481,346,682 | | |
| | | Cash | | | 568 | | |
| | | Receivable for: | | | | | |
| | | Investments sold | | | 102,975,846 | | |
| | | Fund shares sold | | | 3,093,934 | | |
| | | Dividends | | | 3,475,438 | | |
| | | Interest | | | 16 | | |
| | | Prepaid expenses | | | 11,977 | | |
| | | Total Assets | | | 3,590,904,461 | | |
| Liabilities | | Payable for: | | | | | |
| | | Investments purchased | | | 30,027,417 | | |
| | | Fund shares repurchased | | | 6,468,987 | | |
| | | Investment advisory fee | | | 1,754,405 | | |
| | | Administration fee | | | 592,692 | | |
| | | Pricing and bookkeeping fees | | | 12,250 | | |
| | | Transfer agent fee | | | 1,755,512 | | |
| | | Trustees' fees | | | 129,071 | | |
| | | Custody fee | | | 20,250 | | |
| | | Distribution and service fees | | | 543,161 | | |
| | | Chief compliance officer expenses | | | 681 | | |
| | | Interest payable | | | 1,197 | | |
| | | Other liabilities | | | 312,748 | | |
| | | Total Liabilities | | | 41,618,371 | | |
| | | Net Assets | | | 3,549,286,090 | | |
| Net Assets Consist of | | Paid-in capital | | | 3,261,868,575 | | |
| | | Accumulated net realized loss | | | (806,261,855 | ) | |
| | | Net unrealized appreciation on investments | | | 1,093,679,370 | | |
| | | Net Assets | | | 3,549,286,090 | | |
See Accompanying Notes to Financial Statements.
11
Statement of Assets and Liabilities (continued) – Columbia Marsico Growth Fund
February 28, 2011
| Class A | | Net assets | | $ | 1,021,723,922 | | |
| | | Shares outstanding | | | 48,216,591 | | |
| | | Net asset value per share | | $ | 21.19 | (a) | |
| | | Maximum sales charge | | | 5.75 | % | |
| | | Maximum offering price per share ($21.19/0.9425) | | $ | 22.48 | (b) | |
| Class B | | Net assets | | $ | 41,674,724 | | |
| | | Shares outstanding | | | 2,158,227 | | |
| | | Net asset value and offering price per share | | $ | 19.31 | (a) | |
| Class C | | Net assets | | $ | 390,384,189 | | |
| | | Shares outstanding | | | 20,190,545 | | |
| | | Net asset value and offering price per share | | $ | 19.34 | (a) | |
| Class I (c) | | Net assets | | $ | 11,201,171 | | |
| | | Shares outstanding | | | 519,838 | | |
| | | Net asset value, offering and redemption price per share | | $ | 21.55 | | |
| Class R | | Net assets | | $ | 20,548,379 | | |
| | | Shares outstanding | | | 981,186 | | |
| | | Net asset value, offering and redemption price per share | | $ | 20.94 | | |
| Class W (c) | | Net assets | | $ | 2,948 | | |
| | | Shares outstanding | | | 139 | | |
| | | Net asset value, offering and redemption price per share | | $ | 21.20 | (d) | |
| Class Z | | Net assets | | $ | 2,063,750,757 | | |
| | | Shares outstanding | | | 95,686,275 | | |
| | | Net asset value, offering and redemption price per share | | $ | 21.57 | | |
(a) Redemption price per share is equal to net asset value less any applicable contingent deferred sales charge.
(b) On sales of $50,000 or more the offering price is reduced.
(c) Class I and Class W shares commenced operations on September 27, 2010.
(d) Net asset value rounds to this amount due to fractional shares outstanding.
See Accompanying Notes to Financial Statements.
12
Statement of Operations – Columbia Marsico Growth Fund
For the Year Ended February 28, 2011
| | | | | ($) (a) | |
| Investment Income | | Dividends | | | 43,536,721 | | |
| | | Interest | | | 88,552 | | |
| | | Foreign taxes withheld | | | (7,340 | ) | |
| | | Total Investment Income | | | 43,617,933 | | |
| Expenses | | Investment advisory fee | | | 21,885,925 | | |
| | | Administration fee | | | 7,365,006 | | |
| | | Distribution fee: | | | | | |
| | | Class B | | | 323,409 | | |
| | | Class C | | | 2,849,822 | | |
| | | Class R | | | 82,605 | | |
| | | Service fee: | | | | | |
| | | Class B | | | 107,803 | | |
| | | Class C | | | 950,613 | | |
| | | Class W | | | 3 | | |
| | | Distribution and service fees: | | | | | |
| | | Class A | | | 2,839,695 | | |
| | | Transfer agent fee: | | | | | |
| | | Class A, Class B, Class C, Class R, Class W and Class Z | | | 5,649,716 | | |
| | | Pricing and bookkeeping fees | | | 143,829 | | |
| | | Trustees' fees | | | 76,260 | | |
| | | Custody fee | | | 86,966 | | |
| | | Chief compliance officer expenses | | | 4,182 | | |
| | | Other expenses | | | 754,144 | | |
| | | Expenses before interest expense | | | 43,119,978 | | |
| | | Interest expense | | | 16,833 | | |
| | | Total Expenses | | | 43,136,811 | | |
| | | Expense reductions | | | (311 | ) | |
| | | Net Expenses | | | 43,136,500 | | |
| | | Net Investment Income | | | 481,433 | | |
| Net Realized and Unrealized Gain (Loss) on Investments | | Net realized gain on investments | | | 472,052,740 | | |
| | | Net change in unrealized appreciation (depreciation) on investments | | | 316,671,986 | | |
| | | Net Gain | | | 788,724,726 | | |
| | | Net Increase Resulting from Operations | | | 789,206,159 | | |
(a) Class I and Class W shares commenced operations on September 27, 2010.
See Accompanying Notes to Financial Statements.
13
Statement of Changes in Net Assets – Columbia Marsico Growth Fund
| | | | | Year Ended February 28, | |
| Increase (Decrease) in Net Assets | | | | 2011 ($) (a)(b) | | 2010 ($) | |
| Operations | | Net investment income | | | 481,433 | | | | 8,969,420 | | |
| | | Net realized gain on investments and
foreign currency transactions | | | 472,052,740 | | | | 178,899,702 | | |
| | | Net change in unrealized appreciation (depreciation)
on investments and foreign currency translations | | | 316,671,986 | | | | 1,246,696,651 | | |
| | | Net increase resulting from operations | | | 789,206,159 | | | | 1,434,565,773 | | |
| Distributions to Shareholders | | From net investment income: | | | | | | | |
| | | Class A | | | — | | | | (9,183,116 | ) | |
| | | Class B | | | — | | | | (165,504 | ) | |
| | | Class C | | | — | | | | (1,414,974 | ) | |
| | | Class I | | | (5 | ) | | | — | | |
| | | Class R | | | — | | | | (45,116 | ) | |
| | | Class Z | | | (1,185,515 | ) | | | (12,584,369 | ) | |
| | | Total distributions to shareholders | | | (1,185,520 | ) | | | (23,393,079 | ) | |
| | | Net Capital Stock Transactions | | | (946,407,700 | ) | | | (855,162,658 | ) | |
| | | Increase from Regulatory Settlements | | | 22,206 | | | | 47,849 | | |
| | | Total increase (decrease) in net assets | | | (158,364,855 | ) | | | 556,057,885 | | |
| Net Assets | | Beginning of period | | | 3,707,650,945 | | | | 3,151,593,060 | | |
| | | End of period | | | 3,549,286,090 | | | | 3,707,650,945 | | |
| | | Undistributed net investment income at end of period | | | — | | | | 42,623 | | |
(a) Class I and Class W shares commenced operations on September 27, 2010.
(b) Class I and Class W shares reflect activity for the period September 27, 2010 through February 28, 2011.
See Accompanying Notes to Financial Statements.
14
Statement of Changes in Net Assets (continued) – Columbia Marsico Growth Fund
| | | Capital Stock Activity | |
| | | Year Ended
February 28, 2011 | | Year Ended
February 28, 2010 | |
| | | Shares | | Dollars ($) | | Shares | | Dollars ($) | |
| Class A | |
| Subscriptions | | | 8,317,114 | | | | 152,607,078 | | | | 19,904,226 | | | | 284,838,934 | | |
| Distributions reinvested | | | — | | | | — | | | | 555,844 | | | | 8,087,394 | | |
| Redemptions | | | (53,801,705 | ) | | | (945,181,516 | ) | | | (49,221,870 | ) | | | (727,565,635 | ) | |
| Net decrease | | | (45,484,591 | ) | | | (792,574,438 | ) | | | (28,761,800 | ) | | | (434,639,307 | ) | |
| Class B | |
| Subscriptions | | | 40,027 | | | | 690,242 | | | | 110,169 | | | | 1,410,963 | | |
| Distributions reinvested | | | — | | | | — | | | | 7,721 | | | | 98,133 | | |
| Redemptions | | | (992,338 | ) | | | (16,524,125 | ) | | | (1,267,043 | ) | | | (17,214,886 | ) | |
| Net decrease | | | (952,311 | ) | | | (15,833,883 | ) | | | (1,149,153 | ) | | | (15,705,790 | ) | |
| Class C | |
| Subscriptions | | | 1,011,381 | | | | 17,351,175 | | | | 1,673,393 | | | | 22,559,211 | | |
| Distributions reinvested | | | — | | | | — | | | | 46,697 | | | | 594,444 | | |
| Redemptions | | | (6,731,226 | ) | | | (112,137,465 | ) | | | (12,599,011 | ) | | | (170,768,424 | ) | |
| Net decrease | | | (5,719,845 | ) | | | (94,786,290 | ) | | | (10,878,921 | ) | | | (147,614,769 | ) | |
| Class I (a)(b) | |
| Subscriptions | | | 644,301 | | | | 13,156,499 | | | | — | | | | — | | |
| Redemptions | | | (124,463 | ) | | | (2,621,750 | ) | | | — | | | | — | | |
| Net increase | | | 519,838 | | | | 10,534,749 | | | | — | | | | — | | |
| Class R | |
| Subscriptions | | | 376,788 | | | | 7,024,980 | | | | 340,705 | | | | 5,053,932 | | |
| Distributions reinvested | | | — | | | | — | | | | 2,928 | | | | 40,021 | | |
| Redemptions | | | (290,095 | ) | | | (5,277,968 | ) | | | (336,780 | ) | | | (4,977,250 | ) | |
| Net increase | | | 86,693 | | | | 1,747,012 | | | | 6,853 | | | | 116,703 | | |
| Class W (a)(b) | |
| Subscriptions | | | 147 | | | | 2,650 | | | | — | | | | — | | |
| Redemptions | | | (8 | ) | | | (153 | ) | | | — | | | | — | | |
| Net increase | | | 139 | | | | 2,497 | | | | — | | | | — | | |
| Class Z | |
| Subscriptions | | | 30,141,519 | | | | 555,508,512 | | | | 27,111,329 | | | | 411,640,488 | | |
| Distributions reinvested | | | 39,761 | | | | 809,020 | | | | 481,886 | | | | 7,396,682 | | |
| Redemptions | | | (32,963,943 | ) | | | (611,814,879 | ) | | | (45,044,453 | ) | | | (676,356,665 | ) | |
| Net decrease | | | (2,782,663 | ) | | | (55,497,347 | ) | | | (17,451,238 | ) | | | (257,319,495 | ) | |
(a) Class I and Class W shares commenced operations on September 27, 2010.
(b) Class I and Class W shares reflect activity for the period September 27, 2010 through February 28, 2011.
See Accompanying Notes to Financial Statements.
15
Financial Highlights – Columbia Marsico Growth Fund
Selected data for a share outstanding throughout each period is as follows:
| | | Year Ended February 28, | | Period Ended
February 29, | | Year Ended March 31, | |
| Class A Shares | | 2011 | | 2010 | | 2009 (a)(b) | | 2008 (a)(c) | | 2007 (a) | | 2006 (a)(d) | |
Net Asset Value,
Beginning of Period | | $ | 16.75 | | | $ | 11.30 | | | $ | 20.26 | | | $ | 20.22 | | | $ | 19.53 | | | $ | 17.04 | | |
Income from Investment
Operations: | |
| Net investment income (loss) (e) | | | (0.01 | ) | | | 0.03 | | | | 0.06 | | | | 0.06 | | | | — | (f) | | | (0.03 | ) | |
Net realized and unrealized gain (loss)
on investments and foreign currency | | | 4.45 | | | | 5.50 | | | | (9.01 | ) | | | (0.01 | ) | | | 0.69 | | | | 2.52 | | |
| Total from investment operations | | | 4.44 | | | | 5.53 | | | | (8.95 | ) | | | 0.05 | | | | 0.69 | | | | 2.49 | | |
| Less Distributions to Shareholders: | |
| From net investment income | | | — | | | | (0.08 | ) | | | (0.01 | ) | | | (0.01 | ) | | | — | | | | — | | |
Increase from regulatory
settlements | | | — | (f) | | | — | (f) | | | — | | | | — | | | | — | | | | — | | |
| Net Asset Value, End of Period | | $ | 21.19 | | | $ | 16.75 | | | $ | 11.30 | | | $ | 20.26 | | | $ | 20.22 | | | $ | 19.53 | | |
| Total return (g) | | | 26.51 | % | | | 49.09 | %(h) | | | (44.21 | )%(h) | | | 0.24 | %(h)(i) | | | 3.53 | %(h) | | | 14.61 | %(h) | |
| Ratios to Average Net Assets/Supplemental Data: | |
| Net expenses before interest expense | | | 1.30 | %(j) | | | 1.28 | %(j) | | | 1.24 | %(j) | | | 1.20 | %(j)(k) | | | 1.22 | %(j) | | | 1.21 | % | |
| Interest expense | | | — | %(l) | | | — | %(l) | | | — | | | | — | | | | — | | | | — | | |
| Net expenses | | | 1.30 | %(j) | | | 1.28 | %(j) | | | 1.24 | %(j) | | | 1.20 | %(j)(k) | | | 1.22 | %(j) | | | 1.21 | % | |
| Waiver/Reimbursement | | | — | | | | — | %(l) | | | 0.02 | % | | | 0.01 | %(k) | | | 0.01 | % | | | 0.06 | %(m) | |
| Net investment income (loss) | | | (0.05 | )%(j) | | | 0.23 | %(j) | | | 0.36 | %(j) | | | 0.29 | %(j)(k) | | | 0.01 | %(j) | | | (0.15 | )% | |
| Portfolio turnover rate | | | 67 | % | | | 69 | % | | | 21 | %(i)(n) | | | — | | | | — | | | | — | | |
Turnover of Columbia Marsico Growth
Master Portfolio | | | — | | | | — | | | | 54 | %(i) | | | 58 | %(i) | | | 42 | % | | | 62 | % | |
| Net assets, end of period (000s) | | $ | 1,021,724 | | | $ | 1,569,860 | | | $ | 1,383,438 | | | $ | 3,024,016 | | | $ | 2,864,153 | | | $ | 1,956,822 | | |
(a) The per share amounts and percentages reflect income and expenses assuming inclusion of the Fund's proportionate share of the income and expenses of Columbia Marsico Growth Master Portfolio.
(b) Effective November 10, 2008, the Fund converted to a stand-alone fund. Prior to November 10, 2008, the Fund operated in a master-feeder structure.
(c) The Fund changed its fiscal year end from March 31 to February 29. Per share data and total return reflect activity from April 1, 2007 through February 29, 2008.
(d) On August 22, 2005, the Fund's Investor A shares were renamed Class A shares.
(e) Per share data was calculated using the average shares outstanding during the period.
(f) Rounds to less than $0.01 per share.
(g) Total return at net asset value assuming all distributions reinvested and no initial sales charge or contingent deferred sales charge.
(h) Had the Investment Manager and/or any of its affiliates not waived fees or reimbursed a portion of expenses, total return would have been reduced.
(i) Not annualized.
(j) The benefits derived from expense reductions had an impact of less than 0.01%.
(k) Annualized.
(l) Rounds to less than 0.01%.
(m) Bank of America Corporation assumed certain non-recurring costs. Absent these non-recurring costs, the waiver/reimbursement ratio would have been —%.
(n) Amount represents results after the Fund's conversion to a stand-alone structure on November 10, 2008.
See Accompanying Notes to Financial Statements.
16
Financial Highlights – Columbia Marsico Growth Fund
Selected data for a share outstanding throughout each period is as follows:
| | | Year Ended February 28, | | Period Ended
February 29, | | Year Ended March 31, | |
| Class B Shares | | 2011 | | 2010 | | 2009 (a)(b) | | 2008 (a)(c) | | 2007 (a) | | 2006 (a)(d) | |
Net Asset Value,
Beginning of Period | | $ | 15.38 | | | $ | 10.42 | | | $ | 18.83 | | | $ | 18.92 | | | $ | 18.40 | | | $ | 16.18 | | |
Income from Investment
Operations: | |
| Net investment loss (e) | | | (0.13 | ) | | | (0.07 | ) | | | (0.06 | ) | | | (0.09 | ) | | | (0.13 | ) | | | (0.15 | ) | |
Net realized and unrealized gain (loss)
on investments and foreign currency | | | 4.06 | | | | 5.07 | | | | (8.35 | ) | | | — | (f) | | | 0.65 | | | | 2.37 | | |
| Total from investment operations | | | 3.93 | | | | 5.00 | | | | (8.41 | ) | | | (0.09 | ) | | | 0.52 | | | | 2.22 | | |
| Less Distributions to Shareholders: | |
| From net investment income | | | — | | | | (0.04 | ) | | | — | | | | — | | | | — | | | | — | | |
Increase from regulatory
settlements | | | — | (f) | | | — | (f) | | | — | | | | — | | | | — | | | | — | | |
| Net Asset Value, End of Period | | $ | 19.31 | | | $ | 15.38 | | | $ | 10.42 | | | $ | 18.83 | | | $ | 18.92 | | | $ | 18.40 | | |
| Total return (g) | | | 25.55 | % | | | 48.10 | %(h) | | | (44.66 | )%(h) | | | (0.48 | )%(h)(i) | | | 2.83 | %(h) | | | 13.72 | %(h) | |
| Ratios to Average Net Assets/Supplemental Data: | |
| Net expenses before interest expense | | | 2.05 | %(j) | | | 2.03 | %(j) | | | 1.99 | %(j) | | | 1.95 | %(j)(k) | | | 1.97 | %(j) | | | 1.96 | % | |
| Interest expense | | | — | %(l) | | | — | %(l) | | | — | | | | — | | | | — | | | | — | | |
| Net expenses | | | 2.05 | %(j) | | | 2.03 | %(j) | | | 1.99 | %(j) | | | 1.95 | %(j)(k) | | | 1.97 | %(j) | | | 1.96 | % | |
| Waiver/Reimbursement | | | — | | | | — | %(l) | | | 0.02 | % | | | 0.01 | %(k) | | | 0.01 | % | | | 0.06 | %(m) | |
| Net investment loss | | | (0.78 | )%(j) | | | (0.52 | )%(j) | | | (0.39 | )%(j) | | | (0.46 | )%(j)(k) | | | (0.71 | )%(j) | | | (0.85 | )% | |
| Portfolio turnover rate | | | 67 | % | | | 69 | % | | | 21 | %(i)(n) | | | — | | | | — | | | | — | | |
Turnover of Columbia Marsico Growth
Master Portfolio | | | — | | | | — | | | | 54 | %(i) | | | 58 | %(i) | | | 42 | % | | | 62 | % | |
| Net assets, end of period (000s) | | $ | 41,675 | | | $ | 47,847 | | | $ | 44,407 | | | $ | 118,307 | | | $ | 156,923 | | | $ | 198,749 | | |
(a) The per share amounts and percentages reflect income and expenses assuming inclusion of the Fund's proportionate share of the income and expenses of Columbia Marsico Growth Master Portfolio.
(b) Effective November 10, 2008, the Fund converted to a stand-alone fund. Prior to November 10, 2008, the Fund operated in a master-feeder structure.
(c) The Fund changed its fiscal year end from March 31 to February 29. Per share data and total return reflect activity from April 1, 2007 through February 29, 2008.
(d) On August 22, 2005, the Fund's Investor B shares were renamed Class B shares.
(e) Per share data was calculated using the average shares outstanding during the period.
(f) Rounds to less than $0.01 per share.
(g) Total return at net asset value assuming all distributions reinvested and no contingent deferred sales charge.
(h) Had the Investment Manager and/or any of its affiliates not waived fees or reimbursed a portion of expenses, total return would have been reduced.
(i) Not annualized.
(j) The benefits derived from expense reductions had an impact of less than 0.01%.
(k) Annualized.
(l) Rounds to less than 0.01%.
(m) Bank of America Corporation assumed certain non-recurring costs. Absent these non-recurring costs, the waiver/reimbursement ratio would have been —%.
(n) Amount represents results after the Fund's conversion to a stand-alone structure on November 10, 2008.
See Accompanying Notes to Financial Statements.
17
Financial Highlights – Columbia Marsico Growth Fund
Selected data for a share outstanding throughout each period is as follows:
| | | Year Ended February 28, | | Period Ended
February 29, | | Year Ended March 31, | |
| Class C Shares | | 2011 | | 2010 | | 2009 (a)(b) | | 2008 (a)(c) | | 2007 (a) | | 2006 (a)(d) | |
Net Asset Value,
Beginning of Period | | $ | 15.40 | | | $ | 10.44 | | | $ | 18.86 | | | $ | 18.94 | | | $ | 18.43 | | | $ | 16.20 | | |
Income from Investment
Operations: | |
| Net investment loss (e) | | | (0.13 | ) | | | (0.07 | ) | | | (0.06 | ) | | | (0.08 | ) | | | (0.13 | ) | | | (0.15 | ) | |
Net realized and unrealized gain (loss)
on investments and foregin currency | | | 4.07 | | | | 5.07 | | | | (8.36 | ) | | | — | (f) | | | 0.64 | | | | 2.38 | | |
| Total from investment operations | | | 3.94 | | | | 5.00 | | | | (8.42 | ) | | | (0.08 | ) | | | 0.51 | | | | 2.23 | | |
| Less Distributions to Shareholders: | |
| From net investment income | | | — | | | | (0.04 | ) | | | — | | | | — | | | | — | | | | — | | |
Increase from regulatory
settlements | | | — | (f) | | | — | (f) | | | — | | | | — | | | | — | | | | — | | |
| Net Asset Value, End of Period | | $ | 19.34 | | | $ | 15.40 | | | $ | 10.44 | | | $ | 18.86 | | | $ | 18.94 | | | $ | 18.43 | | |
| Total return (g) | | | 25.58 | % | | | 48.00 | %(h) | | | (44.64 | )%(h) | | | (0.42 | )%(h)(i) | | | 2.77 | %(h) | | | 13.77 | %(h) | |
| Ratios to Average Net Assets/Supplemental Data: | |
| Net expenses before interest expense | | | 2.05 | %(j) | | | 2.03 | %(j) | | | 1.99 | %(j) | | | 1.95 | %(j)(k) | | | 1.97 | %(j) | | | 1.96 | % | |
| Interest expense | | | — | %(l) | | | — | %(l) | | | — | | | | — | | | | — | | | | — | | |
| Net expenses | | | 2.05 | %(j) | | | 2.03 | %(j) | | | 1.99 | %(j) | | | 1.95 | %(j)(k) | | | 1.97 | %(j) | | | 1.96 | % | |
| Waiver/Reimbursement | | | — | | | | — | %(l) | | | 0.02 | % | | | 0.01 | %(k) | | | 0.01 | % | | | 0.06 | %(m) | |
| Net investment loss | | | (0.78 | )%(j) | | | (0.52 | )%(j) | | | (0.39 | )%(j) | | | (0.46 | )%(j)(k) | | | (0.74 | )%(j) | | | (0.89 | )% | |
| Portfolio turnover rate | | | 67 | % | | | 69 | % | | | 21 | %(i)(n) | | | — | | | | — | | | | — | | |
Turnover of Columbia Marsico Growth
Master Portfolio | | | — | | | | — | | | | 54 | %(i) | | | 58 | %(i) | | | 42 | % | | | 62 | % | |
| Net assets, end of period (000s) | | $ | 390,384 | | | $ | 399,082 | | | $ | 384,025 | | | $ | 891,076 | | | $ | 832,852 | | | $ | 679,735 | | |
(a) The per share amounts and percentages reflect income and expenses assuming inclusion of the Fund's proportionate share of the income and expenses of Columbia Marsico Growth Master Portfolio.
(b) Effective November 10, 2008, the Fund converted to a stand-alone fund. Prior to November 10, 2008, the Fund operated in a master-feeder structure.
(c) The Fund changed its fiscal year end from March 31 to February 29. Per share data and total return reflect activity from April 1, 2007 through February 29, 2008.
(d) On August 22, 2005, the Fund's Investor C shares were renamed Class C shares.
(e) Per share data was calculated using the average shares outstanding during the period.
(f) Rounds to less than $0.01 per share.
(g) Total return at net asset value assuming all distributions reinvested and no contingent deferred sales charge.
(h) Had the Investment Manager and/or any of its affiliates not waived fees or reimbursed a portion of expenses, total return would have been reduced.
(i) Not annualized.
(j) The benefits derived from expense reductions had an impact of less than 0.01%.
(k) Annualized.
(l) Rounds to less than 0.01%.
(m) Bank of America Corporation assumed certain non-recurring costs. Absent these non-recurring costs, the waiver/reimbursement ratio would have been —%.
(n) Amount represents results after the Fund's conversion to a stand-alone structure on November 10, 2008.
See Accompanying Notes to Financial Statements.
18
Financial Highlights – Columbia Marsico Growth Fund
Selected data for a share outstanding throughout the period is as follows:
| Class I Shares | | Period Ended
February 28,
2011 (a) | |
| Net Asset Value, Beginning of Period | | $ | 18.29 | | |
| Income from Investment Operations: | |
| Net investment income (b) | | | 0.01 | | |
| Net realized and unrealized gain on investments and foreign currency | | | 3.29 | | |
| Total from investment operations | | | 3.30 | | |
| Less Distributions to Shareholders: | |
| From net investment income | | | (0.04 | ) | |
| Net Asset Value, End of Period | | $ | 21.55 | | |
| Total return (c)(d) | | | 18.05 | % | |
| Ratios to Average Net Assets/Supplemental Data: | |
| Net expenses before interest expense (e)(f) | | | 0.88 | % | |
| Interest expense (f)(g) | | | — | % | |
| Net expenses (e)(f) | | | 0.88 | % | |
| Net investment income (e)(f) | | | 0.06 | % | |
| Portfolio turnover rate (d) | | | 67 | % | |
| Net assets, end of period (000s) | | $ | 11,201 | | |
(a) Class I shares commenced operations on September 27, 2010. Per share data and total return reflect activity from that date.
(b) Per share data was calculated using the average shares outstanding during the period.
(c) Total return at net asset value assuming all distributions reinvested.
(d) Not annualized.
(e) The benefits derived from expense reductions had an impact of less than 0.01%.
(f) Annualized.
(g) Rounds to less than 0.01%.
See Accompanying Notes to Financial Statements.
19
Financial Highlights – Columbia Marsico Growth Fund
Selected data for a share outstanding throughout each period is as follows:
| | | Period Ended
Year Ended February 28, | | Year Ended
February 29, | | Period Ended
March 31, | | March 31, | |
| Class R Shares | | 2011 | | 2010 | | 2009 (a)(b) | | 2008 (a)(c) | | 2007 (a) | | 2006 (a)(d) | |
| Net Asset Value, Beginning of Period | | $ | 16.60 | | | $ | 11.20 | | | $ | 20.13 | | | $ | 20.14 | | | $ | 19.49 | | | $ | 18.89 | | |
| Income from Investment Operations: | |
| Net investment income (loss) (e) | | | (0.05 | ) | | | — | (f) | | | 0.02 | | | | 0.01 | | | | (0.08 | ) | | | (0.01 | ) | |
Net realized and unrealized gain (loss)
on investments and foreign currency | | | 4.39 | | | | 5.45 | | | | (8.95 | ) | | | (0.02 | ) | | | 0.73 | | | | 0.61 | | |
| Total from investment operations | | | 4.34 | | | | 5.45 | | | | (8.93 | ) | | | (0.01 | ) | | | 0.65 | | | | 0.60 | | |
| Less Distributions to Shareholders: | |
| From net investment income | | | — | | | | (0.05 | ) | | | — | | | | — | | | | — | | | | — | | |
Increase from regulatory
settlements | | | — | (f) | | | — | (f) | | | — | | | | — | | | | — | | | | — | | |
| Net Asset Value, End of Period | | $ | 20.94 | | | $ | 16.60 | | | $ | 11.20 | | | $ | 20.13 | | | $ | 20.14 | | | $ | 19.49 | | |
| Total return (g) | | | 26.14 | % | | | 48.79 | %(h) | | | (44.36 | )%(h) | | | (0.05 | )%(h)(i) | | | 3.34 | %(h) | | | 3.18 | %(h)(i) | |
| Ratios to Average Net Assets/Supplemental Data: | |
| Net expenses before interest expense | | | 1.55 | %(j) | | | 1.53 | %(j) | | | 1.49 | %(j) | | | 1.45 | %(j)(k) | | | 1.47 | %(j) | | | 1.54 | %(k) | |
| Interest expense | | | — | %(l) | | | — | %(l) | | | — | | | | — | | | | — | | | | — | | |
| Net expenses | | | 1.55 | %(j) | | | 1.53 | %(j) | | | 1.49 | %(j) | | | 1.45 | %(j)(k) | | | 1.47 | %(j) | | | 1.54 | %(k) | |
| Waiver/Reimbursement | | | — | | | | — | %(l) | | | 0.02 | % | | | 0.01 | %(k) | | | 0.01 | % | | | 0.07 | %(k)(m) | |
| Net investment income (loss) | | | (0.27 | )%(j) | | | (0.02 | )%(j) | | | 0.15 | %(j) | | | 0.06 | %(j)(k) | | | (0.42 | )%(j) | | | (0.35 | )%(k) | |
| Portfolio turnover rate | | | 67 | % | | | 69 | % | | | 21 | %(i)(n) | | | — | | | | — | | | | — | | |
Turnover of Columbia Marsico Growth
Master Portfolio | | | — | | | | — | | | | 54 | %(i) | | | 58 | %(i) | | | 42 | % | | | 62 | %(i) | |
| Net assets, end of period (000s) | | $ | 20,548 | | | $ | 14,848 | | | $ | 9,941 | | | $ | 11,860 | | | $ | 3,669 | | | $ | 10 | | |
(a) The per share amounts and percentages reflect income and expenses assuming inclusion of the Fund's proportionate share of the income and expenses of Columbia Marsico Growth Master Portfolio.
(b) Effective November 10, 2008, the Fund converted to a stand-alone fund. Prior to November 10, 2008, the Fund operated in a master-feeder structure.
(c) The Fund changed its fiscal year end from March 31 to February 29. Per share data and total return reflect activity from April 1, 2007 through February 29, 2008.
(d) Class R shares commenced operations on January 23, 2006.
(e) Per share data was calculated using the average shares outstanding during the period.
(f) Rounds to less than $0.01 per share.
(g) Total return at net asset value assuming all distributions reinvested.
(h) Had the Investment Manager and/or any of its affiliates not waived fees or reimbursed a portion of expenses, total return would have been reduced.
(i) Not annualized.
(j) The benefits derived from expense reductions had an impact of less than 0.01%.
(k) Annualized.
(l) Rounds to less than 0.01%.
(m) Bank of America Corporation assumed certain non-recurring costs. Absent these non-recurring costs, the waiver/reimbursement ratio would have been 0.01%.
(n) Amount represents results after the Fund's conversion to a stand-alone structure on November 10, 2008.
See Accompanying Notes to Financial Statements.
20
Financial Highlights – Columbia Marsico Growth Fund
Selected data for a share outstanding throughout the period is as follows:
| Class W Shares | | Period Ended
February 28,
2011 (a) | |
| Net Asset Value, Beginning of Period | | $ | 17.98 | | |
| Income from Investment Operations: | |
| Net investment income (b) | | | 0.01 | | |
| Net realized and unrealized gain on investments and foreign currency | | | 3.21 | | |
| Total from investment operations | | | 3.22 | | |
| Less Distributions to Shareholders: | |
| From net investment income | | | — | | |
| Net Asset Value, End of Period | | $ | 21.20 | | |
| Total return (c)(d) | | | 17.91 | % | |
| Ratios to Average Net Assets/Supplemental Data: | |
| Net expenses before interest expense (e)(f) | | | 1.28 | % | |
| Interest expense (f)(g) | | | — | % | |
| Net expenses (e)(f) | | | 1.28 | % | |
| Net investment income (e)(f) | | | 0.17 | % | |
| Portfolio turnover rate (d) | | | 67 | % | |
| Net assets, end of period (000s) | | $ | 3 | | |
(a) Class W shares commenced operations on September 27, 2010. Per share data and total return reflect activity from that date.
(b) Per share data was calculated using the average shares outstanding during the period.
(c) Total return at net asset value assuming all distributions reinvested.
(d) Not annualized.
(e) The benefits derived from expense reductions had an impact of less than 0.01%.
(f) Annualized.
(g) Rounds to less than 0.01%.
See Accompanying Notes to Financial Statements.
21
Financial Highlights – Columbia Marsico Growth Fund
Selected data for a share outstanding throughout each period is as follows:
| | | Year Ended February 28, | | Period Ended
February 29, | | Year Ended March 31, | |
| Class Z Shares | | 2011 | | 2010 | | 2009 (a)(b) | | 2008 (a)(c) | | 2007 (a) | | 2006 (a)(d) | |
Net Asset Value,
Beginning of Period | | $ | 17.02 | | | $ | 11.47 | | | $ | 20.63 | | | $ | 20.58 | | | $ | 19.82 | | | $ | 17.25 | | |
Income from Investment
Operations: | |
| Net investment income (e) | | | 0.04 | | | | 0.07 | | | | 0.11 | | | | 0.11 | | | | 0.05 | | | | 0.02 | | |
Net realized and unrealized gain (loss)
on investments and foreign currency | | | 4.52 | | | | 5.60 | | | | (9.17 | ) | | | (0.01 | ) | | | 0.71 | | | | 2.55 | | |
| Total from investment operations | | | 4.56 | | | | 5.67 | | | | (9.06 | ) | | | 0.10 | | | | 0.76 | | | | 2.57 | | |
| Less Distributions to Shareholders: | |
| From net investment income | | | (0.01 | ) | | | (0.12 | ) | | | (0.10 | ) | | | (0.05 | ) | | | — | | | | — | | |
Increase from regulatory
settlements | | | — | (f) | | | — | (f) | | | — | | | | — | | | | — | | | | — | | |
| Net Asset Value, End of Period | | $ | 21.57 | | | $ | 17.02 | | | $ | 11.47 | | | $ | 20.63 | | | $ | 20.58 | | | $ | 19.82 | | |
| Total return (g) | | | 26.81 | % | | | 49.55 | %(h) | | | (44.09 | )%(h) | | | 0.46 | %(h)(i) | | | 3.83 | %(h) | | | 14.90 | %(h) | |
| Ratios to Average Net Assets/Supplemental Data: | |
| Net expenses before interest expense | | | 1.05 | %(j) | | | 1.03 | %(j) | | | 0.99 | %(j) | | | 0.95 | %(j)(k) | | | 0.97 | %(j) | | | 0.96 | % | |
| Interest expense | | | — | %(l) | | | — | %(l) | | | — | | | | — | | | | — | | | | — | | |
| Net expenses | | | 1.05 | %(j) | | | 1.03 | %(j) | | | 0.99 | %(j) | | | 0.95 | %(j)(k) | | | 0.97 | %(j) | | | 0.96 | % | |
| Waiver/Reimbursement | | | — | | | | — | %(l) | | | 0.02 | % | | | 0.01 | %(k) | | | 0.01 | % | | | 0.06 | %(m) | |
| Net investment income | | | 0.24 | %(j) | | | 0.48 | %(j) | | | 0.63 | %(j) | | | 0.54 | %(j)(k) | | | 0.25 | %(j) | | | 0.11 | % | |
| Portfolio turnover rate | | | 67 | % | | | 69 | % | | | 21 | %(i)(n) | | | — | | | | — | | | | — | | |
Turnover of Columbia Marsico Growth
Master Portfolio | | | — | | | | — | | | | 54 | %(i) | | | 58 | %(i) | | | 42 | % | | | 62 | % | |
| Net assets, end of period (000s) | | $ | 2,063,751 | | | $ | 1,676,013 | | | $ | 1,329,782 | | | $ | 2,335,800 | | | $ | 2,044,397 | | | $ | 1,446,667 | | |
(a) The per share amounts and percentages reflect income and expenses assuming inclusion of the Fund's proportionate share of the income and expenses of Columbia Marsico Growth Master Portfolio.
(b) Effective November 10, 2008, the Fund converted to a stand-alone fund. Prior to November 10, 2008, the Fund operated in a master-feeder structure.
(c) The Fund changed its fiscal year end from March 31 to February 29. Per share data and total return reflect activity from April 1, 2007 through February 29, 2008.
(d) On August 22, 2005, the Fund's Primary A shares were renamed Class Z shares.
(e) Per share data was calculated using the average shares outstanding during the period.
(f) Rounds to less than $0.01 per share.
(g) Total return at net asset value assuming all distributions reinvested.
(h) Had the Investment Manager and/or any of its affiliates not waived fees or reimbursed a portion of expenses, total return would have been reduced.
(i) Not annualized.
(j) The benefits derived from expense reductions had an impact of less than 0.01%.
(k) Annualized.
(l) Rounds to less than 0.01%.
(m) Bank of America Corporation assumed certain non-recurring costs. Absent these non-recurring costs, the waiver/reimbursement ratio would have been —%.
(n) Amount represents results after the Fund's conversion to a stand-alone structure on November 10, 2008.
See Accompanying Notes to Financial Statements.
22
Notes to Financial Statements – Columbia Marsico Growth Fund
February 28, 2011
Note 1. Organization
Columbia Marsico Growth Fund (the Fund), a series of Columbia Funds Series Trust (the Trust), is a diversified fund. The Trust is registered under the Investment Company Act of 1940, as amended (the 1940 Act), as an open-end management investment company organized as a Delaware statutory trust.
After the close of business on April 30, 2010, Ameriprise Financial, Inc. (Ameriprise Financial) acquired a portion of the asset management business of Columbia Management Group, LLC (the Transaction), including the business of managing the Fund. In connection with the closing of the Transaction (the Closing), RiverSource Investments, LLC, a wholly owned subsidiary of Ameriprise Financial, became the investment manager of the Fund and changed its name to Columbia Management Investment Advisers, LLC (the Investment Manager).
Investment Objective
The Fund seeks long-term growth of capital.
Fund Shares
The Trust has unlimited authorized shares of beneficial interest. The Fund offers Class A, Class B, Class C, Class I, Class R, Class W and Class Z shares. On December 17, 2010, the Investment Manager exchanged Class Z shares valued at $12,703,477 for Class I shares. All share classes have identical voting, dividend and liquidation rights. Each share class has its own expense structure and sales charges, as applicable.
Class A shares are subject to a maximum front-end sales charge of 5.75% based on the investment amount. Class A shares purchased without an initial sales charge in accounts aggregating $1 million to $50 million at the time of purchase are subject to a 1.00% contingent deferred sales charge (CDSC) if the shares are sold within 18 months of purchase, charged as follows: 1.00% CDSC if redeemed within 12 months of purchase, and 0.50% CDSC if redeemed more than 12, but less than 18 months after purchase.
The Fund no longer accepts investments by new or existing investors in the Fund's Class B shares, except in connection with the reinvestment of any dividend and/or capital gain distributions in Class B shares of the Fund and exchanges by existing Class B shareholders of certain other funds within the Columbia Family of Funds. Class B shares may be subject to a maximum CDSC of 5.00% based upon the holding period after purchase. Class B shares will generally convert to Class A shares eight years after purchase.
Class C shares are subject to a 1.00% CDSC on shares redeemed within one year of purchase.
Class I shares are not subject to sales charges and are available only to the Columbia Family of Funds. Class I shares became effective September 27, 2010.
Class R shares are not subject to sales charges and are available only to qualifying institutional investors.
Class W shares are not subject to sales charges and are available only to investors purchasing through authorized investment programs managed by investment professionals, including discretionary managed account programs. Class W shares became effective September 27, 2010.
Class Z shares are not subject to sales charges and are available only to certain investors, as described in the Fund's prospectus.
Note 2. Summary of Significant Accounting Policies
The preparation of financial statements in accordance with U.S. generally accepted accounting principles (GAAP) requires the Investment Manager to make certain estimates and assumptions that affect the reported amounts of assets and liabilities, the disclosure of contingent assets and liabilities at the date of the financial statements and the reported amounts of revenue and expenses during the reporting period. Actual results could differ from those estimates.
The following is a summary of significant accounting policies consistently followed by the Fund in the preparation of its financial statements.
Security Valuation
Equity securities are valued at the last sale price on the principal exchange on which they trade, except for securities traded on the NASDAQ, which are valued at the NASDAQ official close price. Unlisted securities or listed securities for which there were no sales during the day are valued at the closing bid price on such exchanges or over-the-counter markets.
Short-term investments maturing in 60 days or less are valued at amortized cost, which approximates market value.
23
Columbia Marsico Growth Fund, February 28, 2011
Foreign securities are generally valued at the last sale price on the foreign exchange or market on which they trade. If any foreign share prices are not readily available as a result of limited share activity, the securities are valued at the last sale price of the local shares in the principal market in which such securities are normally traded.
Generally, trading in foreign securities is substantially completed each day at various times prior to the close of the New York Stock Exchange (NYSE). The values of such securities used in computing the net asset value of the Fund's shares are determined as of such times. Foreign currency exchange rates are generally determined at 4:00 p.m. Eastern (U.S.) time. Occasionally, events affecting the values of such foreign securities may occur between the times at which they are determined and the close of the customary trading session of the NYSE, which would not be reflected in the computation of the Fund's net asset value. If events materially affecting the values of such foreign securities occur and it is determined that market quotations are not reliable, then these foreign securities will be valued at their fair value using procedures approved by the Board of Trustees.
Investments for which market quotations are not readily available, or that have quotations which the Investment Manager believes are not reliable, are valued at fair value as determined in good faith under consistently applied procedures established by and under the general supervision of the Board of Trustees. If a security is valued at fair value, such value is likely to be different from the last quoted market price for the security. The determination of fair value often requires significant judgment. To determine fair value, the Investment Manager may use assumptions including but not limited to future cash flows and estimated risk premiums. Multiple inputs from various sources may be used to determine value.
Foreign Currency Transactions and Translations
The values of all assets and liabilities quoted in foreign currencies are translated into U.S. dollars at that day's exchange rates. Net realized and unrealized gains (losses) on foreign currency transactions and translations include gains (losses) arising from the fluctuation in exchange rates between trade and settlement dates on securities transactions, gains (losses) arising from the disposition of foreign currency and currency gains (losses) between the accrual and payment dates on dividends, interest income and foreign withholding taxes.
For financial statement purposes, the Fund does not distinguish that portion of gains (losses) on investments which is due to changes in foreign exchange rates from that which is due to changes in market prices of the investments. Such fluctuations are included with the net realized and unrealized gains (losses) on investments on the Statement of Operations.
Repurchase Agreements
The Fund may engage in repurchase agreement transactions with institutions that the Investment Manager has determined are creditworthy. The Fund, through the custodian, receives delivery of the underlying securities collateralizing a repurchase agreement. The Investment Manager is responsible for determining that the collateral is at least equal, at all times, to the value of the repurchase obligation including interest. A repurchase agreement transaction involves certain risks in the event of default or insolvency of the counterparty. These risks include possible delays in or restrictions on the Fund's ability to dispose of the underlying securities and a possible decline in the value of the underlying securities during the period while the Fund seeks to assert its rights.
Security Transactions
Security transactions are accounted for on the trade date. Cost is determined and gains (losses) are based upon the specific identification method for both financial statement and federal income tax purposes.
Income Recognition
Interest income is recorded on the accrual basis.
Awards from class action litigation are recorded as a reduction of cost if the Fund still owns the applicable securities on the payment date. If the Fund no longer owns the applicable securities, the proceeds are recorded as realized gains.
Corporate actions and dividend income are recorded net of any non-reclaimable tax withholdings, on the ex-dividend date or upon receipt of ex-dividend notification in the case of certain foreign securities.
Expenses
General expenses of the Trust are allocated to the Fund and other series of the Trust based upon relative net assets or other expense allocation methodologies determined by the nature of the expense. Expenses directly attributable to a specific class of shares are charged to that share class. Expenses directly attributable to the Fund are charged to the Fund.
24
Columbia Marsico Growth Fund, February 28, 2011
Determination of Class Net Asset Value
All income, expenses (other than class-specific expenses which are charged directly to a share class, as shown in the Statement of Operations) and realized and unrealized gains (losses) are allocated to each class of the Fund on a daily basis for purposes of determining the net asset value of each class. Income and expenses are allocated to each class based on the settled shares method, while realized and unrealized gains (losses) are allocated based on the relative net assets of each class.
Federal Income Tax Status
The Fund intends to qualify each year as a regulated investment company under Subchapter M of the Internal Revenue Code, as amended, and will distribute substantially all of its taxable income, if any, for its tax year, and as such will not be subject to federal income taxes. In addition, the Fund intends to distribute in each calendar year substantially all of its net investment income, capital gains and certain other amounts, if any, such that the Fund should not be subject to federal excise tax. Therefore, no federal income or excise tax provision is recorded.
Distributions to Shareholders
Distributions from net investment income, if any, are declared and paid semi-annually. The Fund may, however, declare and pay distributions from net investment income more frequently. The Fund will distribute net realized capital gains (including net short-term capital gains) at least annually after the fiscal year in which the capital gains were earned, unless offset by any available capital loss carryforward. Income distributions and capital gain distributions are determined in accordance with federal income tax regulations which may differ from GAAP.
Indemnification
In the normal course of business, the Fund enters into contracts that contain a variety of representations and warranties and which provide general indemnities. The Fund's maximum exposure under these arrangements is unknown because this would involve future claims against the Fund. Also, under the Trust's organizational documents and by contract, the Trustees and officers of the Trust are indemnified against certain liabilities that may arise out of actions relating to their duties to the Trust. However, based on experience, the Fund expects the risk of loss due to these representations, warranties and indemnities to be minimal.
Note 3. Fees and Compensation Paid to Affiliates
Investment Management Services Fee
The Investment Manager is responsible for the management of the Fund. Day-to-day portfolio management of the Fund is provided by the Fund's subadviser (see Subadvisory Fee note below). The management fee is based on the Fund's average daily net assets at the following annual rates:
| Average Daily Net Assets | | Annual
Fee Rates | |
| First $500 million | | | 0.75 | % | |
| $500 million to $1 billion | | | 0.70 | % | |
| $1 billion to $1.5 billion | | | 0.65 | % | |
| $1.5 billion to $3 billion | | | 0.60 | % | |
| $3 billion to $6 billion | | | 0.58 | % | |
| Over $6 billion | | | 0.56 | % | |
Prior to the Closing, Columbia Management Advisors, LLC (Columbia), an indirect, wholly owned subsidiary of Bank of America Corporation (BOA), provided investment management services to the Fund under the same fee structure.
The effective management fee rate for the year ended February 28, 2011, was 0.64% of the Fund's average daily net assets.
To the extent that the Fund is not benefitting from a separate contractual expense limitation arrangement, the Investment Manager has contractually agreed to waive a portion of its management fees through June 30, 2011.
The waiver amount is calculated based on the difference between the dollar amount of sub-advisory fees that would have been payable to Marsico Capital Management, LLC (Marsico) based on the annualized rate of 0.45% of the Fund's average daily net assets, and the dollar amount of sub-advisory fees calculated on a monthly basis based on the annualized sub-advisory fee rate effective January 1, 2008 in which Marsico is entitled from the Fund which is described under the Sub-Advisory Fee note below. The annualized fee rate of 0.45%
25
Columbia Marsico Growth Fund, February 28, 2011
represents the sub-advisory fee rate which Marsico was entitled to receive prior to January 1, 2008.
In the absence of a separate contractual expense limitation arrangement, the management fee waiver for the Fund would be calculated as follows:
| Average Daily Net Assets* | | Management
Fee Waiver | |
| Assets up to $18 billion | | | 0.00 | % | |
Assets in excess of $18 billion and
up to $21 billion | | | 0.05 | % | |
| Assets in excess of $21 billion | | | 0.10 | % | |
* For purposes of the calculation, "Assets" are aggregate assets sub-advised by Marsico in the following Columbia Funds: (i) Columbia Marsico Growth Fund; (ii) Columbia Marsico Focused Equities Fund; (iii) Columbia Marsico 21st Century Fund; (iv) Columbia Marsico Growth Fund, Variable Series; (v) Columbia Marsico Focused Equities Fund, Variable Series; (vi) Columbia Marsico 21st Century Fund, Variable Series; and (vii) any future Columbia U.S. equity fund sub-advised by Marsico which the Investment Manager and Marsico mutually agree in writing.
Prior to the Closing, Columbia waived a portion of the Fund's management fees at the same rates.
For the year ended February 28, 2011, no management fees were waived for the Fund.
Subadvisory Fee
Marsico has been retained by the Investment Manager to serve as the investment subadviser to the Fund. As the subadviser, and subject to the oversight of the Investment Manager and the Fund's Board of Trustees, Marsico is responsible for the daily investment operations, including placing all orders for the purchase and sale of the portfolio securities for the Fund. The Investment Manager, from the management fee it receives, pays Marsico a monthly subadvisory fee based on the Fund's average daily net assets at the following annual rates:
| Average Daily Net Assets* | | Fee Rate | |
| Assets up to $18 billion | | | 0.45 | % | |
Assets in excess of $18 billion and
up to $21 billion | | | 0.40 | % | |
| Assets in excess of $21 billion | | | 0.35 | % | |
* For purposes of the calculation, assets are aggregate assets sub-advised by Marsico in the following Columbia Funds: (i) Columbia Marsico Growth Fund; (ii) Columbia Marsico Focused Equities Fund; (iii) Columbia Marsico 21st Century Fund; (iv) Columbia Marsico Growth Fund, Variable Series; (v) Columbia Marsico Focused Equities, Variable Series; (vi) Columbia Marsico 21st Century Fund, Variable Series; and (vii) any future Columbia U.S. equity fund sub-advised by Marsico which the Investment Manager and Marsico mutually agree in writing.
Prior to the Closing, Marsico provided subadvisory services to the Fund under the same fee structure in accordance with an agreement with Columbia.
Administration Fee
Effective upon the Closing, the Investment Manager became the administrator of the Fund and provides administrative and other services to the Fund, including services previously performed under the Pricing and Bookkeeping Oversight and Services Agreement discussed below. The administration fee is based on the annual rate of 0.22% of the Fund's average daily net assets, less the fees payable by the Fund as described under the Pricing and Bookkeeping Fees note below. Prior to the Closing, Columbia provided administrative services to the Fund at the same fee rate.
Pricing and Bookkeeping Fees
Prior to the Closing, the Fund entered into a Financial Reporting Services Agreement (the Financial Reporting Services Agreement) with State Street Bank and Trust Company (State Street) and Columbia pursuant to which State Street provides financial reporting services to the Fund. The Fund also entered into an Accounting Services Agreement (collectively with the Financial Reporting Services Agreement, the State Street Agreements) with State Street and Columbia pursuant to which State Street provides accounting services to the Fund. Upon the Closing, Columbia assigned and delegated its rights and obligations under the State Street Agreements to the Investment Manager. Under the State Street Agreements, the Fund pays State Street an annual fee of $38,000 paid monthly plus an additional monthly fee based on an annualized percentage rate of average daily net assets of the Fund for the month. The aggregate fee will not exceed $140,000 per year (exclusive of out-of-pocket expenses and charges). The Fund also reimburses State Street for certain out-of-pocket expenses and charges.
Also prior to the Closing, the Fund entered into a Pricing and Bookkeeping Oversight and Services Agreement (the Services Agreement) with Columbia. Under the Services Agreement, Columbia provided services related to Fund expenses and the requirements of the Sarbanes-Oxley Act of 2002, and provided oversight of the accounting and financial reporting services provided by State Street. Under the Services Agreement, the Fund reimbursed Columbia for out-of-pocket expenses and charges, including fees payable to third parties, such as for pricing the Fund's portfolio securities, incurred by Columbia in the performance of services under the Services Agreement. The Services Agreement was terminated upon the Closing. These services are now provided under the Administration Fee note discussed above.
26
Columbia Marsico Growth Fund, February 28, 2011
Transfer Agent Fee
In connection with the Closing, RiverSource Service Corporation, a wholly owned subsidiary of Ameriprise Financial, became the transfer agent of the Fund and changed its name to Columbia Management Investment Services Corp. (the New Transfer Agent). The New Transfer Agent has contracted with Boston Financial Data Services (BFDS) to serve as sub-transfer agent. The New Transfer Agent receives monthly account-based service fees that vary by class and are based on the number of open accounts and asset-based fees, calculated based on assets held in omnibus accounts, which are intended to reimburse the New Transfer Agent for certain sub-transfer agent fees (exclusive of BFDS fees). The New Transfer Agent pays the fees of BFDS for services as sub-transfer agent and is not entitled to reimbursement for such fees from the Fund.
The New Transfer Agent receives reimbursement for certain out-of-pocket expenses and may also receive compensation for various shareholder services.
Prior to the Closing, Columbia Management Services, Inc., an affiliate of Columbia and an indirect, wholly owned subsidiary of BOA, provided shareholder services to the Fund and contracted with BFDS to serve as sub-transfer agent, under the same fee structure.
Class I shares do not pay transfer agent fees. For the year ended February 28, 2011, the Fund's effective transfer agent fee rate for each class, with the exception of Class I shares, as a percentage of each class' average daily net assets was as follows:
| Class A | | Class B | | Class C | | Class R | | Class W | | Class Z | |
| | 0.16 | % | | | 0.16 | % | | | 0.16 | % | | | 0.16 | % | | | 0.15 | % | | | 0.16 | % | |
An annual minimum account balance fee of $20 may apply to certain accounts with a value below the Fund's initial minimum investment requirements to reduce the impact of small accounts on transfer agent fees. These minimum account balance fees are recorded as part of expense reductions on the Statement of Operations. For the year ended February 28, 2011, no minimum account balance fees were charged by the Fund.
Underwriting Discounts, Service and Distribution Fees
In connection with the Closing, RiverSource Fund Distributors, Inc., an indirect wholly owned subsidiary of Ameriprise Financial, became the distributor of the Fund and changed its name to Columbia Management Investment Distributors, Inc. (the New Distributor).
For the year ended February 28, 2011, initial sales charges paid by shareholders on the purchase of Class A shares amounted to $43,661 and net CDSC fees paid by shareholders on certain redemptions of Class A, Class B and Class C shares amounted to $728, $77,871 and $8,561, respectively.
The Trust has adopted shareholder servicing plans and distribution plans for the Class B, Class C and Class W shares of the Fund and a combined distribution and shareholder servicing plan for the Class A shares of the Fund. The Trust has also adopted a distribution plan for the Class R shares of the Fund. The shareholder servicing plans permit the Fund to compensate or reimburse servicing agents for the shareholder services they have provided. The distribution plans, adopted pursuant to Rule 12b-1 under the 1940 Act, permit the Fund to compensate or reimburse the New Distributor and/or selling agents for activities or expenses primarily intended to result in the sale of the classes' shares. Payments are made at an annual rate and paid monthly, as a percentage of average daily net assets, set from time to time by the Board of Trustees, and are charged as expenses of the Fund directly to the applicable share class. A substantial portion of the expenses incurred pursuant to these plans is paid to affiliates of the New Distributor.
The annual rates in effect and plan limits, as a percentage of average daily net assets are as follows:
| | | Current
Rate | | Plan
Limit | |
Class A Combined Distribution and
Shareholder Servicing Plan | | | 0.25 | % | | | 0.25 | % | |
Class B and Class C Shareholder
Servicing Plans | | | 0.25 | % | | | 0.25 | % | |
Class B and Class C
Distribution Plans | | | 0.75 | % | | | 0.75 | % | |
| Class R Distribution Plan | | | 0.50 | % | | | 0.50 | % | |
Class W Shareholder
Servicing Plan | | | 0.25 | % | | | 0.25 | %1 | |
| Class W Distribution Plan | | | 0.00 | % | | | 0.25 | %1 | |
1 The Fund may pay a distribution fee of up to 0.25% of the Fund's average daily net assets attributable to Class W shares and a service fee of up to 0.25% of the Fund's average daily net assets attributable to Class W shares, provided, however, that the aggregate fee shall not exceed 0.25% of the Fund's average daily net assets attributable to Class W shares.
Prior to the Closing, Columbia Management Distributors, Inc, an affiliate of Columbia and an indirect, wholly owned subsidiary of BOA, was the principal underwriter of the Fund's shares. There were no changes to the underwriting discount structure of the Fund or the
27
Columbia Marsico Growth Fund, February 28, 2011
service or distribution fee rates paid by the Fund as a result of the Transaction.
Expense Limits and Fee Waivers
Effective September 27, 2010, the Investment Manager has voluntarily agreed to reimburse a portion of the Fund's expenses so that the Fund's ordinary operating expenses (excluding brokerage commissions, interest, taxes and extraordinary expenses, but including custodian charges relating to overdrafts, if any), after giving effect to any balance credits from the Fund's custodian, do not exceed the annual rates of 1.45%, 2.20%, 2.20%, 1.07%, 1.70%, 1.45% and 1.20% of the Fund's average daily net assets attributable to Class A, Class B, Class C, Class I, Class R, Class W and Class Z shares, respectively. This arrangement may be modified or terminated by the Investment Manager at any time.
For the period May 1, 2010 through September 26, 2010, the Investment Manager voluntarily agreed to reimburse a portion of the Fund's expenses so that the Fund's ordinary operating expenses (excluding any distribution and service fees, brokerage commissions, interest, taxes and extraordinary expenses, but including custodian charges relating to overdrafts, if any), after giving effect to any balance credits from the Fund's custodian, did not exceed 1.20% annually of the Fund's average daily net assets. Prior to May 1, 2010, Columbia voluntarily reimbursed a portion of the Fund's expenses in the same manner.
Fees Paid to Officers and Trustees
Upon the Closing, all officers of the Fund are employees of the Investment Manager or its affiliates and, with the exception of the Fund's Chief Compliance Officer, receive no compensation from the Fund. The Board of Trustees has appointed a Chief Compliance Officer to the Fund in accordance with federal securities regulations. The Fund, along with other affiliated funds, pays its pro-rata share of the expenses associated with the Chief Compliance Officer. The Fund's expenses for the Chief Compliance Officer will not exceed $15,000 per year. Prior to the Closing, all officers of the Fund were employees of Columbia or its affiliates and the Fund paid its pro-rata share of the expenses for the Chief Compliance Officer under the same fee structure.
Trustees are compensated for their services to the Fund, as set forth on the Statement of Operations. The Trust's eligible Trustees may participate in a non-qualified deferred compensation plan which may be terminated at any time. Any payments to plan participants are paid solely out of the Fund's assets. Income earned on the plan participant's deferral account is based on the rate of return of the eligible mutual funds selected by the participant or, if no funds are selected, on the rate of return of Columbia Money Market Fund (formerly known as RiverSource Cash Management Fund). Prior to the Closing, if no funds were selected, income earned on the plan participant's deferral account was based on the rate of return of BofA Treasury Reserves. Trustees' fees deferred during the current period as well as any gains or losses on the trustees' deferred compensation balances as a result of market fluctuations are included in "Trustees' fees" on the Statement of Operations. Liabilities under the deferred compensation plan are included in "Trustees' fees" on the Statement of Assets and Liabilities.
Other Related Party Transactions
Prior to the Closing, the Fund used one or more brokers that were affiliates of BOA in connection with the purchase and sale of its securities. Total brokerage commissions paid to affiliated brokers for the period prior to the Closing were $48,079.
Note 4. Custody Credits
The Fund has an agreement with its custodian bank under which custody fees may be reduced by balance credits. These credits are recorded as part of expense reductions on the Statement of Operations. The Fund could have invested a portion of the assets utilized in connection with the expense offset arrangement in an income-producing asset if it had not entered into such an agreement. For the year ended February 28, 2011, these custody credits reduced total expenses by $311 for the Fund.
Note 5. Portfolio Information
The cost of purchases and proceeds from sales of securities, excluding short-term obligations, aggregated $2,233,659,953 and $3,113,817,547, respectively, for the year ended February 28, 2011.
Note 6. Regulatory Settlements
During the year ended February 28, 2011, and the year ended February 28, 2010, the Fund received payments totaling $22,206 and $47,849, respectively, resulting from certain regulatory settlements in which the Fund had participated during the respective periods. The payments have been included in "Increase from regulatory settlements" in the Statement of Changes in Net Assets.
28
Columbia Marsico Growth Fund, February 28, 2011
Note 7. Shareholder Concentration
As of February 28, 2011, three shareholder accounts owned 40.4% of the outstanding shares of the Fund. Purchase and redemption activity of these accounts may have a significant effect on the operations of the Fund.
Note 8. Line of Credit
The Fund and other affiliated funds participate in a $280,000,000 committed, unsecured revolving line of credit provided by State Street. The maximum amount that may be borrowed by any fund is limited to the lesser of $200,000,000 and the Fund's borrowing limit set forth in the Fund's registration statement. Borrowings are available for short-term liquidity or temporary or emergency purposes.
Effective October 14, 2010, interest is charged to each participating fund based on the fund's borrowings at a rate per annum equal to the greater of the Federal Funds Rate plus 1.25% or the overnight LIBOR Rate plus 1.25%. In addition, a commitment fee of 0.125% per annum is accrued and apportioned among the participating funds pro rata based on their relative net assets.
Prior to October 14, 2010, interest was charged to each participating fund at the same rates. In addition, a commitment fee of 0.15% per annum was accrued and apportioned among the participating funds pro rata based on their relative net assets.
For the year ended February 28, 2011, the average daily loan balance outstanding on days where borrowing existed was $9,858,974 at a weighted average interest rate of 1.53%.
Note 9. Federal Tax Information
The timing and character of income and capital gain distributions are determined in accordance with income tax regulations, which may differ from GAAP. Reclassifications are made to the Fund's capital accounts for permanent tax differences to reflect income and gains available for distribution (or available capital loss carryforwards) under income tax regulations.
For the year ended February 28, 2011, permanent book and tax basis differences resulting primarily from differing treatments for excess distributions and proceeds from litigation settlements were identified and reclassified among the components of the Fund's net assets as follows:
Overdistributed
Net Investment
Income | | Accumulated
Net Realized
Loss | | Paid-In Capital | |
| $ | 661,464 | | | $ | — | | | $ | (661,464 | ) | |
Net investment income and net realized gains (losses), as disclosed on the Statement of Operations, and net assets were not affected by this reclassification.
The tax character of distributions paid during the years ended February 28, 2011 and February 28, 2010 was as follows:
| | | February 28, | |
| Distributions paid from: | | 2011 | | 2010 | |
| Ordinary Income* | | $ | 1,185,520 | | | $ | 23,393,079 | | |
* For tax purposes short-term capital gain distributions, if any, are considered ordinary income distributions.
As of February 28, 2011, the components of distributable earnings on a tax basis were as follows:
Undistributed
Ordinary
Income | | Undistributed
Long-Term
Capital Gains | | Net Unrealized
Appreciation* | |
| $ | — | | | $ | — | | | $ | 1,065,057,267 | | |
* The differences between book-basis and tax-basis net unrealized appreciation are primarily due to deferral of losses from wash sales.
Unrealized appreciation and depreciation at February 28, 2011, based on cost of investments for federal income tax purposes were:
| Unrealized appreciation | | $ | 1,072,924,150 | | |
| Unrealized depreciation | | | (7,866,883 | ) | |
| Net unrealized appreciation | | $ | 1,065,057,267 | | |
29
Columbia Marsico Growth Fund, February 28, 2011
The following capital loss carryforwards may be available to reduce taxable income arising from future net realized gains on investments, if any, to the extent permitted by the Internal Revenue Code:
| Year of Expiration | | Capital Loss
Carryforwards | |
| | 2017 | | | $ | 454,728,024 | | |
| | 2018 | | | | 322,911,728 | | |
| | | $ | 777,639,752 | | |
Capital loss carryforwards of $461,205,675 were utilized during the year ended February 28, 2011.
Management is required to determine whether a tax position of the Fund is more likely than not to be sustained upon examination by the applicable taxing authority, including resolution of any related appeals or litigation processes, based on the technical merits of the position. The tax benefit to be recognized by the Fund is measured as the largest amount of benefit that is greater than fifty percent likely of being realized upon ultimate settlement. Management is not aware of any tax positions for which it is reasonably possible that the total amounts of unrecognized tax benefits will significantly change in the next twelve months. However, management's conclusions may be subject to review and adjustment at a later date based on factors including, but not limited to, new tax laws, regulations, and administrative interpretations (including relevant court decisions). The Fund's federal tax returns for the prior three fiscal years remain subject to examination by the Internal Revenue Service.
Note 10. Significant Risks and Contingencies
Foreign Securities Risk
Investing in foreign securities may include certain risks and considerations not typically associated with investing in U.S. securities, such as fluctuating currency values and changing local and regional economic, political and social conditions, which may result in greater market volatility. In addition, certain foreign securities may not be as liquid as U.S. securities. Investing in emerging markets may accentuate these risks.
Investments in emerging market countries are subject to additional risk. The risk of foreign investments is typically increased in less developed countries. These countries are also more likely to experience high levels of inflation, deflation or currency devaluation which could hurt their economies and securities markets.
Note 11. Subsequent Events
Management has evaluated the events and transactions that have occurred through the date the financial statements were issued and noted no items requiring adjustment of the financial statements or additional disclosure.
Note 12. Information Regarding Pending and Settled Legal Proceedings
In June 2004, an action captioned John E. Gallus et al. v. American Express Financial Corp. and American Express Financial Advisors Inc. was filed in the United States District Court for the District of Arizona. The plaintiffs allege that they are investors in several American Express Company (now known as RiverSource) mutual funds and they purport to bring the action derivatively on behalf of those funds under the Investment Company Act of 1940. The plaintiffs allege that fees allegedly paid to the defendants by the funds for investment advisory and administrative services are excessive. The plaintiffs seek remedies including restitution and rescission of investment advisory and distribution agreements. The plaintiffs voluntarily agreed to transfer this case to the United States District Court for the District of Minnesota (the District Court). In response to defendants' motion to dismiss the complaint, the District Court dismissed one of plaintiffs' four claims and granted plaintiffs limited discovery. Defendants moved for summary judgment in April 2007. Summary judgment was granted in the defendants' favor on July 9, 2007. The plaintiffs filed a notice of appeal with the Eighth Circuit Court of Appeals (the Eighth Circuit) on August 8, 2007. On April 8, 2009, the Eighth Circuit reversed summary judgment and remanded to the District Court for further proceedings. On August 6, 2009, defendants filed a writ of certiorari with the U.S. Supreme Court (the Supreme Court), asking the Supreme Court to stay the District Court proceedings while the Supreme Court considers and rules in a case captioned Jones v. Harris Associates, which involves issues of law similar to those presented in the Gallus case. On March 30, 2010, the Supreme Court issued its ruling in Jones v. Harris Associates, and on April 5, 2010, the Supreme Court vacated the Eighth Circuit's decision in the Gallus case and remanded the case to the Eighth Circuit for further consideration in light of the Supreme Court's decision in Jones v. Harris Associates. On June 4, 2010, the Eighth Circuit remanded the Gallus case to the District Court for further consideration in light of the Supreme Court's decision in Jones v. Harris Associates. On December 9, 2010, the District Court reinstated its July 9, 2007 summary judgment order in favor of the defendants. On January 10, 2011 plaintiffs filed a notice of appeal with the Eighth Circuit.
30
Columbia Marsico Growth Fund, February 28, 2011
In December 2005, without admitting or denying the allegations, American Express Financial Corporation (AEFC, which is now known as Ameriprise Financial, Inc. (Ameriprise Financial)), entered into settlement agreements with the Securities and Exchange Commission (SEC) and Minnesota Department of Commerce (MDOC) related to market timing activities. As a result, AEFC was censured and ordered to cease and desist from committing or causing any violations of certain provisions of the Investment Advisers Act of 1940, the Investment Company Act of 1940, and various Minnesota laws. AEFC agreed to pay disgorgement of $10 million and civil money penalties of $7 million. AEFC also agreed to retain an independent distribution consultant to assist in developing a plan for distribution of all disgorgement and civil penalties ordered by the SEC in accordance with various undertakings detailed at http://www.sec.gov/litigation/admin/ia-2451.pdf. Ameriprise Financial and its affiliates have cooperated with the SEC and the MDOC in these legal proceedings, and have made regular reports to the funds' Boards of Directors/Trustees.
Ameriprise Financial and certain of its affiliates have historically been involved in a number of legal, arbitration and regulatory proceedings, including routine litigation, class actions, and governmental actions, concerning matters arising in connection with the conduct of their business activities. Ameriprise Financial believes that the Funds are not currently the subject of, and that neither Ameriprise Financial nor any of its affiliates are the subject of, any pending legal, arbitration or regulatory proceedings that are likely to have a material adverse effect on the Funds or the ability of Ameriprise Financial or its affiliates to perform under their contracts with the Funds. Ameriprise Financial is required to make 10-Q, 10-K and, as necessary, 8-K filings with the Securities and Exchange Commission on legal and regulatory matters that relate to Ameriprise Financial and its affiliates. Copies of these filings may be obtained by accessing the SEC website at www.sec.gov.
There can be no assurance that these matters, or the adverse publicity associated with them, will not result in increased fund redemptions, reduced sale of fund shares or other adverse consequences to the Funds. Further, although we believe proceedings are not likely to have a material adverse effect on the Funds or the ability of Ameriprise Financial or its affiliates to perform under their contracts with the Funds, these proceedings are subject to uncertainties and, as such, we are unable to estimate the possible loss or range of loss that may result. An adverse outcome in one or more of these proceedings could result in adverse judgments, settlements, fines, penalties or other relief that could have a material adverse effect on the consolidated financial condition or results of operations of Ameriprise Financial.
31
Report of Independent Registered Public Accounting Firm
To the Trustees of Columbia Funds Series Trust and the Shareholders of Columbia Marsico Growth Fund
In our opinion, the accompanying statement of assets and liabilities, including the investment portfolio, and the related statements of operations and of changes in net assets and the financial highlights present fairly, in all material respects, the financial position of Columbia Marsico Growth Fund (the "Fund") (a series of Columbia Funds Series Trust I) at February 28, 2011, and the results of its operations, the changes in its net assets, and the financial highlights for each of the periods indicated, in conformity with accounting principles generally accepted in the United States of America. These financial statements and financial highlights (hereafter referred to as "financial statements") are the responsibility of the Fund's management. Our responsibility is to express an opinion on these financial statements based on our audits. We conducted our audits of these financial statements in accordance with the standards of the Public Company Accounting Oversight Board (United States). Those standards require that we plan and perform the audit to obtain reasonable assurance about whether the financial statements are free of material misstatement. An audit includes examining, on a test basis, evidence supporting the amounts and disclosures in the financial statements, assessing the accounting principles used and significant estimates made by management, and evaluating the overall financial statement presentation. We believe that our audits, which included confirmation of securities at February 28, 2011 by correspondence with the custodian and brokers, provide a reasonable basis for our opinion.
PricewaterhouseCoopers LLP
Boston, Massachusetts
April 21, 2011
32
Federal Income Tax Information (Unaudited) – Columbia Marsico Growth Fund
For non-corporate shareholders, 46.08% or the maximum amount allowable under the Jobs and Growth Tax Relief Reconciliation Act of 2003, of the ordinary income distributed by the Fund for the fiscal year ended February 28, 2011 may represent qualified dividend income.
46.08% of the ordinary income distributed by the Fund for the fiscal year ended February 28, 2011, qualifies for the corporate dividends received deduction.
The Fund will notify shareholders in January 2012 of amounts for use in preparing 2011 income tax returns.
33
Fund Governance
The Trustees serve terms of indefinite duration. The names, addresses and birth years of the Trustees and Officers of the Funds in the Columbia Funds Series Trust, the year each was first elected or appointed to office, their principal business occupations during at least the last five years, the number of Funds overseen by each Trustee and other directorships they hold are shown below. Each officer listed below serves as an officer of each Fund in the Columbia Funds Series Trust.
Independent Trustees
Name, Address and Year of Birth,
Position with Funds, Year First
Elected or Appointed to Office | | Principal Occupation(s) During Past Five Years, Number of Funds in the Columbia
Funds Complex Overseen by Trustee, Other Directorships Held
| |
| Edward J. Boudreau, Jr. (Born 1944) | |
|
c/o Columbia Management
Investment Advisers, LLC
225 Franklin Street
Boston, MA 02110
Trustee (since 2005) | | Managing Director—E.J. Boudreau & Associates (consulting), from 2000 through current; oversees 44; Trustee—BofA Funds Series Trust. | |
|
| William P. Carmichael (Born 1943) | |
|
c/o Columbia Management
Investment Advisers, LLC
225 Franklin Street
Boston, MA 02110
Trustee (since 1999) | | Retired; Oversees 44; Director—Cobra Electronics Corporation (electronic equipment manufacturer); Director—McMoRan Exploration Company (oil and gas exploration and development); Director—The Finish Line (athletic shoes and apparel); Trustee—BofA Funds Series Trust; Former Director—Simmons Company (bedding). | |
|
| William A. Hawkins (Born 1942) | |
|
c/o Columbia Management
Investment Advisers, LLC
225 Franklin Street
Boston, MA 02110
Trustee (since 2005) | | Managing Director—Overton Partners (financial consulting), August 2010 to present; President and Chief Executive Officer—California General Bank, N.A., from January 2008 through August 2010; oversees 44; Trustee—BofA Funds Series Trust. | |
|
| R. Glenn Hilliard (Born 1943) | |
|
c/o Columbia Management
Investment Advisers, LLC
225 Franklin Street
Boston, MA 02110
Trustee (since 2005) | | Chairman and Chief Executive Officer—Hilliard Group LLC (investing and consulting), from April 2003 through current; Non-Executive Director & Chairman—CNO Financial, Inc. (formerly Conseco, Inc.) (insurance), September 2003 through current; Executive Chairman—Conseco, Inc. (insurance), August 2004 through September 2005; oversees 44; Trustee—BofA Funds Series Trust. | |
|
| John J. Nagorniak (Born 1944) | |
|
c/o Columbia Management
Investment Advisers, LLC
225 Franklin Street
Boston, MA 02110
Trustee (since 2008) | | Retired; President and Director—Foxstone Financial, Inc. (consulting), 2000 through December 2007; Director—Mellon Financial Corporation affiliates (investing), 2000 through 2007; Chairman—Franklin Portfolio Associates (investing—Mellon affiliate), 1982 through 2007; oversees 44; Director—MIT Investment Company; Trustee—MIT 401k Plan. | |
|
34
Fund Governance (continued)
Independent Trustees (continued)
Name, Address and Year of Birth,
Position with Funds, Year First
Elected or Appointed to Office | | Principal Occupation(s) During Past Five Years, Number of Funds in the Columbia
Funds Complex Overseen by Trustee, Other Directorships Held
| |
| Minor M. Shaw (Born 1947) | |
|
c/o Columbia Management
Investment Advisers, LLC
225 Franklin Street
Boston, MA 02110
Trustee (since 2003) | | President—Micco Corporation and Mickel Investment Group; oversees 44; Board Member—Piedmont Natural Gas; Trustee—BofA Funds Series Trust. | |
|
Interested Trustee
| Anthony M. Santomero1 (Born 1946) | |
|
c/o Columbia Management
Investment Advisers, LLC
225 Franklin Street
Boston, MA 02110
Trustee (since 2008) | | Richard K. Mellon Professor Emeritus of Finance, The Wharton School, University of Pennsylvania, from 2002 through current; Senior Advisor—McKinsey & Company (consulting), July 2006 through January 2008; President and Chief Executive Officer—Federal Reserve Bank of Philadelphia, July 2000 through April 2006; oversees 44; Director—Renaissance Reinsurance Ltd; Trustee—Penn Mutual Life Insurance Company; Director—Citigroup, Inc.; Citibank, N.A.; Trustee—BofA Funds Series Trust. | |
|
1 Dr. Santomero is currently deemed by the Columbia Funds to be an "interested person" (as defined in the 1940 Act) of the Funds because he serves as a Director of Citigroup, Inc. and Citibank N.A., companies that may directly or through subsidiaries and affiliates engage from time-to-time in brokerage execution, principal transactions and lending relationships with the Columbia Funds or other funds or accounts advised/managed by the Adviser.
The Statement of Additional Information includes additional information about the Trustees of the Funds and is available, without charge, upon request by calling 800-345-6611.
Officers
| Name, Year of Birth and Address | | Principal Occupation(s) During the Past Five Years | |
| J. Kevin Connaughton (Born 1964) | |
|
225 Franklin Street
Boston, MA 02110
President (since 2009) | | Senior Vice President and General Manager—Mutual Fund Products, Columbia Management Investment Advisers, LLC since May 2010; President, Columbia Funds, since 2009, and RiverSource Funds, since May 2010 (previously Senior Vice President and Chief Financial Officer, Columbia Funds, from June 2008 to January 2009, Treasurer, Columbia Funds, from October 2003 to May 2008, and senior officer of various other affiliated funds since 2000); Managing Director, Columbia Management Advisors, LLC from December 2004 to April 2010. | |
|
| Michael G. Clarke (Born 1969) | |
|
225 Franklin Street
Boston, MA 02110
Senior Vice President and
Chief Financial Officer (since 2009) | | Vice President, Columbia Management Investment Advisers, LLC since May 2010; Managing Director of Fund Administration, Columbia Management Advisors, LLC, from September 2004 to April 2010; senior officer of Columbia Funds and affiliated funds since 2002. | |
|
35
Fund Governance (continued)
Officers (continued)
| Name, Year of Birth and Address | | Principal Occupation(s) During the Past Five Years | |
| Scott R. Plummer (Born 1959) | |
|
5228 Ameriprise Financial Center
Minneapolis, MN 55474
Senior Vice President, Secretary and Chief Legal Officer (since 2010) | | Chief Legal Officer and Assistant Secretary, Columbia Management Investment Advisers, LLC since June 2005; Vice President and Lead Chief Counsel—Asset Management, Ameriprise Financial, Inc. since May 2010 (previously Vice President and Chief Counsel—Asset Management, from 2005 to April 2010, and Vice President—Asset Management Compliance from 2004 to 2005); Vice President, Chief Counsel and Assistant Secretary, Columbia Management Investment Distributors, Inc. since 2008; Vice President, General Counsel and Secretary, Ameriprise Certificate Company since 2005; Chief Counsel, RiverSource Distributors, Inc. since 2006; Vice President, General Counsel and Secretary, RiverSource Funds, since December 2006; Senior Vice President, Secretary and Chief Legal Officer, Columbia Funds, since May 2010. | |
|
| Linda J. Wondrack (Born 1964) | |
|
225 Franklin Street
Boston, MA 02110
Senior Vice President and
Chief Compliance Officer (since 2007) | | Vice President and Chief Compliance Officer, Columbia Management Investment Advisers, LLC since May 2010; Chief Compliance Officer, Columbia Funds, since 2007, and RiverSource Funds, since May 2010; Director (Columbia Management Group, LLC and Investment Product Group Compliance), Bank of America, from June 2005 to April 2010. | |
|
| William F. Truscott (Born 1960) | |
|
53600 Ameriprise Financial Center
Minneapolis, MN 55474
Senior Vice President (since 2010) | | Chairman of the Board, Columbia Management Investment Advisers, LLC since May 2010 (previously President, Chairman of the Board and Chief Investment Officer, from 2001 to April 2010); Chief Executive Officer, U.S. Asset Management & President, Annuities, Ameriprise Financial, Inc. since May 2010 (previously President—U.S. Asset Management and Chief Investment Officer from 2005 to April 2010, and Senior Vice President—Chief Investment Officer, from 2001 to 2005); Director, President and Chief Executive Officer, Ameriprise Certificate Company since 2006; Director, Columbia Management Investment Distributors, Inc. since May 2010 (previously Chairman of the Board and Chief Executive Officer from 2008 to April 2010); Chairman of the Board and Chief Executive Officer, RiverSource Distributors, Inc. since 2006. | |
|
| Colin Moore (Born 1958) | |
|
225 Franklin Street
Boston, MA 02110
Senior Vice President (since 2010) | | Director and Chief Investment Officer, Columbia Management Investment Advisers, LLC since May 2010; Manager, Managing Director and Chief Investment Officer of Columbia Management Advisors, LLC from 2007 to April 2010; Head of Equities, Columbia Management Advisors, LLC from 2002 to 2007. | |
|
| Michael A. Jones (Born 1959) | |
|
225 Franklin Street
Boston, MA 02110
Senior Vice President (since 2010) | | President and Director, Columbia Management Investment Advisers, LLC since May 2010; President and Director, Columbia Management Investment Distributors, Inc. since May 2010; Manager, Chairman, Chief Executive Officer and President, Columbia Management Advisors, LLC from 2007 to April 2010; Chief Executive Officer, President and Director, Columbia Management Distributors, Inc. from November 2006 to April 2010; previously, co-president and senior managing director at Robeco Investment Management. | |
|
36
Fund Governance (continued)
Officers (continued)
| Name, Year of Birth and Address | | Principal Occupation(s) During the Past Five Years | |
| Amy Johnson (Born 1965) | |
|
5228 Ameriprise Financial Center
Minneapolis, MN 55474
Senior Vice President (since 2010) | | Senior Vice President and Chief Operating Officer, Columbia Management Investment Advisers, LLC since May 2010 (previously Chief Administrative Officer, from 2009 until April 2010, Vice President—Asset Management and Trust Company Services, from 2006 to 2009, and Vice President—Operations and Compliance from 2004 to 2006). | |
|
| Joseph F. DiMaria (Born 1968) | |
|
225 Franklin Street
Boston, MA 02110
Treasurer (since 2010) and
Chief Accounting Officer (since 2008) | | Vice President, Mutual Fund Administration, Columbia Management Investment Advisers, LLC, since May 2010; Director of Fund Administration, Columbia Management Advisors, LLC from January 2006 to April 2010; Head of Tax/Compliance and Assistant Treasurer, Columbia Management Advisors, LLC, from November 2004 to December 2005. | |
|
| Marybeth Pilat (Born 1968) | |
|
225 Franklin Street
Boston, MA 02110
Deputy Treasurer (since 2010) | | Vice President, Mutual Fund Administration, Columbia Management Investment Advisers, LLC, since May 2010; Vice President, Investment Operations, Bank of America, from October 2008 to April 2010; Finance Manager, Boston Children's Hospital from August 2008 to October 2008; Director, Mutual Fund Administration, Columbia Management Advisors, LLC, from May 2007 to July 2008; Vice President, Mutual Fund Valuation, Columbia Management Advisors, LLC, from January 2006 to May 2007; Vice President, Mutual Fund Accounting Oversight, Columbia Management Advisors, LLC from January 2005 to January 2006. | |
|
| Julian Quero (Born 1967) | |
|
225 Franklin Street
Boston, MA 02110
Deputy Treasurer (since 2008) | | Vice President, Mutual Fund Administration, Columbia Management Investment Advisers, LLC since May 2010; Director of Fund Administration, Columbia Management Advisors, LLC, from August 2008 to April 2010; Senior Tax Manager, Columbia Management Advisors, LLC from August 2006 to July 2008; Senior Compliance Manager, Columbia Management Advisors, LLC from April 2002 to August 2006. | |
|
| Stephen T. Welsh (Born 1957) | |
|
225 Franklin Street
Boston, MA 02110
Vice President (since 2006) | | President and Director, Columbia Management Investment Services Corp. since May 2010; President and Director, Columbia Management Services, Inc. from July 2004 to April 2010; Managing Director, Columbia Management Distributors, Inc. from August 2007 to April 2010. | |
|
37
Shareholder Meeting Results
At a Joint Special Meeting of Shareholders held on February 15, 2011, shareholders of the series of Columbia Funds Series Trust, including the Fund, elected each of the nominees for trustees to the Board of Trustees of Columbia Funds Series Trust, each to hold office for an indefinite term, as follows:
| Trustee | | Votes For | | Votes Withheld | | Abstentions | |
| Kathleen Blatz | | | 2,145,636,122 | | | | 248,012,438 | | | | 0 | | |
| Edward J. Boudreau, Jr. | | | 2,145,430,114 | | | | 248,218,446 | | | | 0 | | |
| Pamela G. Carlton | | | 2,145,515,949 | | | | 248,132,612 | | | | 0 | | |
| William P. Carmichael | | | 2,145,038,695 | | | | 248,609,866 | | | | 0 | | |
| Patricia M. Flynn | | | 2,145,843,563 | | | | 247,804,997 | | | | 0 | | |
| William A. Hawkins | | | 2,145,359,401 | | | | 248,289,160 | | | | 0 | | |
| R. Glenn Hilliard | | | 2,145,079,400 | | | | 248,569,161 | | | | 0 | | |
| Stephen R. Lewis, Jr. | | | 2,145,092,209 | | | | 248,556,351 | | | | 0 | | |
| John F. Maher | | | 2,145,621,338 | | | | 248,027,223 | | | | 0 | | |
| John J. Nagorniak | | | 2,145,337,494 | | | | 248,311,067 | | | | 0 | | |
| Catherine James Paglia | | | 2,145,615,254 | | | | 248,033,306 | | | | 0 | | |
| Leroy C. Richie | | | 2,145,042,120 | | | | 248,606,441 | | | | 0 | | |
| Anthony M. Santomero | | | 2,145,088,174 | | | | 248,560,386 | | | | 0 | | |
| Minor M. Shaw | | | 2,145,430,762 | | | | 248,217,798 | | | | 0 | | |
| Alison Taunton-Rigby | | | 2,145,393,384 | | | | 248,255,177 | | | | 0 | | |
| William F. Truscott | | | 2,144,907,223 | | | | 248,741,338 | | | | 0 | | |
38
This page intentionally left blank.
This page intentionally left blank.
Important Information About This Report
The fund mails one shareholder report to each shareholder address. If you would like more than one report, please call shareholder services at 1-800-345-6611 and additional reports will be sent to you. This report has been prepared for shareholders of Columbia Marsico Growth Fund.
A description of the policies and procedures that the fund uses to determine how to vote proxies and a copy of the fund's voting records are available (i) at www.columbiamanagement.com, (ii) on the Securities and Exchange Commission's website at www.sec.gov, and (iii) without charge, upon request, by calling 1-800-368-0346. Information regarding how the fund voted proxies relating to portfolio securities during the 12-month period ended June 30 is available from the SEC's website. Information regarding how the fund voted proxies relating to portfolio securities is also available from the fund's website, www.columbiamanagement.com.
The fund files a complete schedule of portfolio holdings with the SEC for the first and third quarters of each fiscal year on Form N-Q. The fund's Form N-Q is available on the SEC's website at www.sec.gov and may be reviewed and copied at the SEC's Public Reference Room in Washington, D.C. Information on the operation of the Public Reference Room may be obtained by calling 1-800-SEC-0330.
Transfer Agent
Columbia Management Investment
Services Corp.
P.O. Box 8081
Boston, MA 02266-8081
1-800-345-6611
Distributor
Columbia Management Investment
Distributors, Inc.
225 Franklin Street
Boston, MA 02110
Investment Manager
Columbia Management Investment Advisers, LLC
225 Franklin Street
Boston, MA 02110
41

PRSRT STD
U.S. Postage
PAID
Holliston, MA
Permit NO. 20
Columbia Marsico Growth Fund
P. O. Box 8081
Boston, MA 02266-8081
columbiamanagement.com
This information is for use with concurrent or prior delivery of a fund prospectus. Investors should consider the investment objectives, risks, charges and expenses of a mutual fund carefully before investing. For a free prospectus, which contains this and other important information about the funds, visit columbiamanagement.com. Read the prospectus carefully before investing. The Fund is distributed by Columbia Management Investment Distributors, Inc., member FINRA, and managed by Columbia Management Investment Advisers, LLC.
© 2011 Columbia Management Investment Advisers, LLC. All rights reserved.
C-1246 A (04/11)

Columbia Marsico Focused Equities Fund
Annual Report for the Period Ended February 28, 2011
Not FDIC insured • No bank guarantee • May lose value
Table of Contents
| Fund Profile | | | 1 | | |
|
| Economic Update | | | 2 | | |
|
| Performance Information | | | 4 | | |
|
| Understanding Your Expenses | | | 5 | | |
|
| Portfolio Managers' Report | | | 6 | | |
|
| Investment Portfolio | | | 8 | | |
|
Statement of Assets and
Liabilities | | | 11 | | |
|
| Statement of Operations | | | 13 | | |
|
Statement of Changes in
Net Assets | | | 14 | | |
|
| Financial Highlights | | | 16 | | |
|
| Notes to Financial Statements | | | 21 | | |
|
Report of Independent Registered
Public Accounting Firm | | | 30 | | |
|
| Federal Income Tax Information | | | 31 | | |
|
| Fund Governance | | | 32 | | |
|
| Shareholder Meeting Results | | | 36 | | |
|
Important Information About
This Report | | | 37 | | |
|
The views expressed in this report reflect the current views of the respective parties. These views are not guarantees of future performance and involve certain risks, uncertainties and assumptions that are difficult to predict, so actual outcomes and results may differ significantly from the views expressed. These views are subject to change at any time based upon economic, market or other conditions and the respective parties disclaim any responsibility to update such views. These views may not be relied on as investment advice and, because investment decisions for a Columbia Fund are based on numerous factors, may not be relied on as an indication of trading intent on behalf of any particular Columbia Fund. References to specific securities should not be construed as a recommendation or investment advice.
President's Message

Dear Shareholder:
The Columbia Management story began over 100 years ago, and today, we are one of the nation's largest dedicated asset managers. The recent acquisition by Ameriprise Financial, Inc. brings together the talents, resources and capabilities of Columbia Management with those of RiverSource Investments, Threadneedle (acquired by Ameriprise in 2003) and Seligman Investments (acquired by Ameriprise in 2008) to build a best-in-class asset management business that we believe is truly greater than its parts.
RiverSource Investments traces its roots to 1894 when its then newly-founded predecessor, Investors Syndicate, offered a face-amount savings certificate that gave small investors the opportunity to build a safe and secure fund for retirement, education or other special needs. A mutual fund pioneer, Investors Syndicate launched Investors Mutual Fund in 1940. In the decades that followed, its mutual fund products and services lineup grew to include a full spectrum of styles and specialties. More than 110 years later, RiverSource continues to be a trusted financial products leader.
Threadneedle, a leader in global asset management and one of Europe's largest asset managers, offers sophisticated international experience from a dedicated U.K. management team. Headquartered in London, it is named for Threadneedle Street in the heart of the city's financial district, where British investors pioneered international and global investing. Threadneedle was acquired in 2003 and today operates as an affiliate of Columbia Management.
Seligman Investments' beginnings date back to the establishment of the investment firm J. & W. Seligman & Co. in 1864. In the years that followed, Seligman played a major role in the geographical expansion and industrial development of the United States. In 1874, President Ulysses S. Grant named Seligman as fiscal agent for the U.S. Navy—an appointment that would last through World War I. Seligman helped finance the westward path of the railroads and the building of the Panama Canal. The firm organized its first investment company in 1929 and began managing its first mutual fund in 1930. In 2008, J. & W. Seligman & Co. Incorporated was acquired and Seligman Investments became an offering brand of RiverSource Investments, LLC.
We are proud of the rich and distinctive history of these firms, the strength and breadth of products and services they offer, and the combined cultures of pioneering spirit and forward thinking. Together we are committed to providing more for our shareholders than ever before.
> A singular focus on our shareholders
Our business is asset management, so investors are our first priority. We dedicate our resources to identifying timely investment opportunities and provide a comprehensive choice of equity, fixed-income and alternative investments to help meet your individual needs.
> First-class research and thought leadership
We are dedicated to helping you take advantage of today's opportunities and anticipate tomorrow's. We stay abreast of the latest investment trends and ideas, using our collective insight to evaluate events and transform them into solutions you can use.
> A disciplined investment approach
We aren't distracted by passing fads. Our teams adhere to a rigorous investment process that helps ensure the integrity of our products and enables you and your financial advisor to match our solutions to your objectives with confidence.
When you choose Columbia Management, you can be confident that we will take the time to understand your needs and help you and your financial advisor identify the solutions that are right for you. Because at Columbia Management, we don't consider ourselves successful unless you are.
Sincerely,

J. Kevin Connaughton
President, Columbia Funds
Investors should consider the investment objectives, risks, charges and expenses of a mutual fund carefully before investing. For a free prospectus, which contains this and other important information about the funds, visit www.columbiamanagement.com. The prospectus should be read carefully before investing.
Columbia Funds are distributed by Columbia Management Investment Distributors, Inc., member FINRA, and managed by Columbia Management Investment Advisers, LLC.
© 2011 Columbia Management Investment Advisers, LLC. All rights reserved.
Fund Profile – Columbia Marsico Focused Equities Fund
Summary
g For the 12-month period that ended February 28, 2011, the fund's Class A shares returned 23.91% without sales charge.
g The fund's return was higher than the return of its benchmark, the S&P 500 Index1 and the average return of the funds in its peer group, the Lipper Large-Cap Growth Funds Classification.2
g Stock selection in the information technology, consumer discretionary, industrials and consumer staples sectors was strong. Sector positioning also aided performance within consumer discretionary, industrials and consumer staples sectors.
Portfolio Management
Thomas F. Marsico has managed the fund since 1997 and is Chief Investment Officer of Marsico Capital Management, LLC ("MCM"), investment subadviser to the fund. In 2010, A. Douglas Rao and Coralie Witter joined Thomas F. Marsico as co-managers of the fund.
Columbia Management Investment Advisers, LLC (the Investment Manager) retained MCM to serve as investment subadviser to the Columbia Marsico funds. As an investment subadviser, MCM makes the investment decisions and manages all or a portion of the fund. MCM is an investment adviser registered with the Securities and Exchange Commission. MCM is not affiliated with the Investment Manager.
1The Standard & Poor's (S&P) 500 Index tracks the performance of 500 widely held, large-capitalization U.S. stocks.
2Lipper Inc., a widely respected data provider in the industry, calculates an average total return (assuming reinvestment of distributions) for mutual funds with investment objectives similar to those of the fund. Lipper makes no adjustment for the effect of sales loads.
Indices are not available for investment, are not professionally managed and do not reflect sales charges, fees, brokerage commissions, taxes or other expenses of investing. Securities in the fund may not match those in an index.
Performance data quoted represents past performance and current performance may be lower or higher. Past performance is no guarantee of future results. The investment return and principal value will fluctuate so that shares, when redeemed, may be worth more or less than the original cost. Please visit www.columbiamanagement.com for daily and most recent month-end performance updates.
Summary
1-year return as of 02/28/11
| | | | +23.91% | |
|
|  | | | Class A shares
(without sales charge) | |
|
| | | | +22.57% | |
|
|  | | | S&P 500 Index | |
|
Morningstar Style BoxTM

The Morningstar Style BoxTM is based on the Fund's portfolio holdings. For equity funds, the vertical axis shows the market capitalization of the stocks owned, and the horizontal axis shows investment style (value, blend or growth). Information shown is based on the most recent data provided by Morningstar.
© 2011 Morningstar, Inc. All rights reserved. The Morningstar information contained herein: (1) is proprietary to Morningstar and/or its content providers; (2) may not be copied or distributed; and (3) is not warranted to be accurate, complete or timely. Neither Morningstar nor its content providers are responsible for any damages or losses arising from any use of this information.
1
Economic Update – Columbia Marsico Focused Equities Fund
Summary
For the 12-month period that ended February 28, 2011
g The U.S. stock market, as measured by the S&P 500 Index, delivered solid returns, despite a summer 2010 correction. Foreign stock market returns were generally in line with the U.S. market, as measured by the MSCI EAFE Index (Net).
| S&P Index | | MSCI Index | |
|
 | |  | |
|
g Strengthening economic growth and rising interest rates kept a lid on most bond market sectors. The Barclays Capital Aggregate Bond Index delivered modest results. However, high-yield bonds were strong performers, as measured by the JPMorgan Developed BB High Yield Index.
Barclays
Aggregate Index | | JPMorgan
Index | |
|
 | |  | |
|
The U.S. economy continued to expand at a modest pace over the past 12 months, as measured by gross domestic product (GDP). After a strong first quarter in 2010, GDP growth dropped to 1.7% in the second quarter and fear spread that the economy would lapse into recession. However, the pace picked up in the third quarter, and growth was strong enough to inspire confidence among consumers, businesses and investors. GDP expanded by 2.6% in the third quarter and 2.8% in the fourth quarter. With the Federal Reserve Board (the Fed) providing additional monetary stimulus to shore up economic growth and the extension of key tax cuts for the next two years, 2011 expectations are for continued growth. Consumer confidence is on the mend, even though job growth has not met expectations. Business spending also tracked higher over the period.
Consumer spending on cars, clothing and other goods generally trended higher throughout the year. Holiday spending rose 5.5% between November 5, 2010 and December 24, 2010, in all retail categories, excluding automobiles, compared with the same period in 2009, according to MasterCard Advisors' SpendingPulse, which tracks spending on all transactions including cash. Analysts say that an increase in personal savings and a decline in consumer debt gave consumers confidence to spend a little more on the 2010 holidays. The personal savings rate edged higher, ending January 2011, the last month for which data was available, at 5.8%. Personal income also increased during the year, surging in January 2011, as payroll tax cuts kicked in.
News on the job front was mostly positive over the 12-month period. A good portion of the jobs added in March, April and May of 2010 were temporary, government-sponsored census positions, which began to unwind in June, July and August of 2010. However, private sector payroll employment began to trend higher in the third quarter, massive layoffs declined and job growth turned solidly positive, with the addition of 255,000 new jobs in the first two months of 2011.
Despite some glimmers of improvement early in 2010, the housing market remained troublesome throughout the period. Both new and existing home sales fell after a federal tax credit for new and repeat homebuyers expired. Distressed properties pressured prices and foreclosures continued—another drag on prices. The inventory of unsold homes ended the period just about where it started, at 7.6 months for both new and existing homes, according to the National Association of Realtors and a joint release from the U.S. Census Bureau and the U.S. Department of Housing and Urban Development. The new year brought a bit of good news: Existing home sales increased in January 2011, raising the level of sales above where it was one year ago. According to the National Association of Realtors, it was the first time in seven months that year-over-year sales activity compared favorably.
Reports from the business side of the economy were generally positive. A key measure of the nation's manufacturing situation—the Institute for Supply Management's Index—took a somewhat surprising turn higher in the final months of the period. Technology spending rose 12% in 2010, according to the NPD Group, a national marketing research firm. Purchases of computers, networking and software returned to prerecession levels. Industrial production was disappointingly flat at year end, per the report issued by the Fed, and it slipped further in January 2011. The amount of manufacturing capacity utilized, per the report issued by the Fed,—a key measure of the health of the manufacturing sector—continued to inch higher.
2
Economic Update (continued) – Columbia Marsico Focused Equities Fund
Stocks moved higher despite summer 2010 setback
Against a strengthening economic backdrop, a stock market rally that began early in 2009 continued into 2010 despite a summer setback linked to a debt crisis brewing in Europe, which raised concerns among U.S. investors. These fears were short-lived and stocks regained their footing in September 2010, moving higher through the end of the period. The S&P 500 Index1 returned 22.57% for the 12 months through February 28, 2011. Outside the United States, stock market returns seesawed but ended just short of U.S. market returns. The MSCI EAFE Index (Net),2 a broad gauge of stock market performance in foreign developed markets, returned 20.00% (in U.S. dollars) for the 12-month period, as concerns about the impact of a bailout for weak euro zone economies abated. Emerging stock markets were similarly strong. The MSCI Emerging Markets Index (Net)3 returned 20.91% (in U.S. dollars) for the 12-month period.
Bonds delivered modest returns
As the economy strengthened and interest rates edged higher, most bond sectors delivered modest returns. The Barclays Capital Aggregate Bond Index4 returned 4.93%. High-yield bonds led the fixed-income markets. For the 12 months covered by this report, the JPMorgan Developed BB High Yield Index5 returned 14.74%. Despite rising yields in the second half of the period, the Treasury market was also positive. The Barclays Capital U.S. Treasury Index6 returned 3.71%. However, municipal bonds struggled in the final months of the period, as interest rates inched higher and issue supply surged ahead of the expiration of the Build America Bonds program. The Barclays Capital Municipal Bond Index7 gained 1.72% for the period. Despite positive economic activity, the Fed kept a key short-term interest rate—the federal funds rate—close to zero.
Past performance is no guarantee of future results.
1The Standard & Poor's (S&P) 500 Index tracks the performance of 500 widely held, large-capitalization U.S. stocks.
2The Morgan Stanley Capital International Europe, Australasia, Far East (MSCI EAFE) Index (Net) is a free float-adjusted market capitalization index that is designed to measure the equity market performance of developed markets, excluding the U.S. & Canada. As of May 27, 2010, the MSCI EAFE Index (Net) consisted of the following 22 developed market country indices: Australia, Austria, Belgium, Denmark, Finland, France, Germany, Greece, Hong Kong, Ireland, Israel, Italy, Japan, the Netherlands, New Zealand, Norway, Portugal, Singapore, Spain, Sweden, Switzerland and the United Kingdom.
3The Morgan Stanley Capital International Emerging Markets (MSCI EM) Index (Net) is a free float-adjusted market capitalization index that is designed to measure equity market performance of emerging markets. As of May 27, 2010, the MSCI EM Index (Net) consisted of the following 21 emerging market country indices: Brazil, Chile, China, Colombia, Czech Republic, Egypt, Hungary, India, Indonesia, Korea, Malaysia, Mexico, Morocco, Peru, Philippines, Poland, Russia, South Africa, Taiwan, Thailand and Turkey.
4The Barclays Capital Aggregate Bond Index is a market value-weighted index that tracks the daily price, coupon, pay-downs and total return performance of fixed-rate, publicly placed, dollar-denominated and non-convertible investment grade debt issues with at least $250 million par amount outstanding and with at least one year to final maturity.
5The JPMorgan Developed BB High Yield Index is an unmanaged index designed to mirror the investable universe of the U.S. dollar developed, BB-rated, high yield corporate debt market.
6The Barclays Capital U.S. Treasury Index includes public obligations of the U.S. Treasury. Treasury bills are excluded by the maturity constraint. In addition, certain special issues, such as state and local government series bonds (SLGs), as well as U.S.Treasury TIPS, are excluded. STRIPS are excluded from the index because this inclusion would result in double-counting.
7The Barclays Capital Municipal Bond Index is considered representative of the broad market for investment-grade, tax-exempt bonds with a maturity of at least one year.
Indices are not available for investment, are not professionally managed and do not reflect sales charges, fees, brokerage commissions, taxes or other expenses of investing. Securities in the fund may not match those in an index.
3
Performance Information – Columbia Marsico Focused Equities Fund
Performance data quoted represents past performance and current performance may be lower or higher. Past performance is no guarantee of future results. The investment return and principal value will fluctuate so that shares, when redeemed, may be worth more or less than the original cost. Please visit www.columbiamanagement.com for daily and most recent month-end performance updates.
Performance of a $10,000 investment 03/01/01 – 02/28/11
The chart above shows the change in value of a hypothetical $10,000 investment in Class A shares of Columbia Marsico Focused Equities Fund during the stated time period, and does not reflect the deduction of taxes that a shareholder may pay on fund distributions or on the redemption of fund shares.
Performance of a $10,000 investment 03/01/01 – 02/28/11 ($)
| Sales charge | | without | | with | |
| Class A | | | 14,635 | | | | 13,790 | | |
| Class B | | | 13,585 | | | | 13,585 | | |
| Class C | | | 13,585 | | | | 13,585 | | |
| Class I | | | n/a | | | | n/a | | |
| Class Z | | | 15,009 | | | | n/a | | |
Average annual total return as of 02/28/11 (%)
| Share class | | A | | B | | C | | I | | Z | |
| Inception | | 12/31/97 | | 12/31/97 | | 12/31/97 | | 09/27/10 | | 12/31/97 | |
| Sales charge | | without | | with | | without | | with | | without | | with | | without | | without | |
| 1-year | | | 23.91 | | | | 16.77 | | | | 23.02 | | | | 18.02 | | | | 23.00 | | | | 22.00 | | | | n/a | | | | 24.23 | | |
| 5-year | | | 2.81 | | | | 1.60 | | | | 2.05 | | | | 1.67 | | | | 2.05 | | | | 2.05 | | | | n/a | | | | 3.08 | | |
| 10-year/Life | | | 3.88 | | | | 3.27 | | | | 3.11 | | | | 3.11 | | | | 3.11 | | | | 3.11 | | | | 17.09 | | | | 4.14 | | |
The "with sales charge" returns include the maximum initial sales charge of 5.75% for Class A shares and the applicable contingent deferred sales charge of 5.00% in the first year, declining to 1.00% in the sixth year and eliminated thereafter for Class B shares and 1.00% for Class C shares for the first year only. The "without sales charge" returns do not include the effect of sales charges. If they had, returns would be lower.
Performance results reflect any fee waivers or reimbursements of fund expenses by the Investment Manager and/or any of its affiliates. Absent these fee waivers or expense reimbursement arrangements, performance results would have been lower.
All results shown assume the reinvestment of distributions. Class I and Class Z shares are sold at net asset value with no distribution and service (Rule 12b-1) fees. Class I and Class Z shares have limited eligibility and the investment minimum requirements may vary. Please see the fund's prospectus for details. Performance for different share classes will vary based on differences in sales charges and fees associated with each class.
Class I shares were initially offered on September 27, 2010.
The tables do not reflect the deduction of taxes that a shareholder may pay on fund distributions or on the redemption of fund shares.
4
Understanding Your Expenses – Columbia Marsico Focused Equities Fund
As a fund shareholder, you incur two types of costs. There are transaction costs, which generally include sales charges on purchases and may include redemption fees or exchange fees. There are also ongoing costs, which generally include investment advisory fees, distribution and service (Rule 12b-1) fees and other fund expenses. The information on this page is intended to help you understand the ongoing costs of investing in the fund and to compare these costs with the ongoing costs of investing in other mutual funds.
Analyzing your fund's expenses by share class
To illustrate these ongoing costs, we have provided an example and calculated the expenses paid by investors in each share class during the period. The information in the following table is based on an initial investment of $1,000, which is invested at the beginning of the period and held for the entire period. Expense information is calculated two ways and each method provides you with different information. The amount listed in the "Actual" column is calculated using the fund's actual operating expenses and total return for the period. The amount listed in the "Hypothetical" column for each share class assumes that the return each year is 5% before expenses and is calculated based on the fund's actual operating expenses. You should not use the hypothetical account values and expenses to estimate either your actual account balance at the end of the period or the expenses you paid during this period.
Compare with other funds
Since all mutual funds are required to include the same hypothetical calculations about expenses in shareholder reports, you can use this information to compare the ongoing cost of investing in the fund with other funds. To do so, compare the 5% hypothetical example with the 5% hypothetical examples that appear in the shareholder reports of other funds. As you compare hypothetical examples of other funds, it is important to note that hypothetical examples are meant to highlight the ongoing costs of investing in a fund and do not reflect any transaction costs, such as sales charges, redemption fees or exchange fees.
Estimating your actual expenses
To estimate the expenses that you paid over the period, first you will need your account balance at the end of the period:
g For shareholders who receive their account statements from Columbia Management Investment Services Corp., your account balance is available online at www.columbiamanagement.com or by calling Shareholder Services at 800.345.6611.
g For shareholders who receive their account statements from their financial intermediary, contact your financial intermediary to obtain your account balance.
1. Divide your ending account balance by $1,000. For example, if an account balance was $8,600 at the end of the period, the result would be 8.6.
2. In the section of the table below titled "Expenses paid during the period," locate the amount for your share class. You will find this number in the column labeled "Actual." Multiply this number by the result from step 1. Your answer is an estimate of the expenses you paid on your account during the period.
If the value of your account falls below the minimum initial investment requirement applicable to you, your account may be subject to a $20 annual fee. This fee is not included in the accompanying table. If you are subject to the fee, keep it in mind when you are estimating the ongoing expenses of investing in the fund and when comparing the expenses of this fund with other funds.
09/01/10 – 02/28/11
| | | Account value at the
beginning of the period ($) | | Account value at the
end of the period ($) | | Expenses paid
during the period ($) | | Fund's annualized
expense ratio (%) | |
| | | Actual | | Hypothetical | | Actual | | Hypothetical | | Actual | | Hypothetical | | Actual | |
| Class A | | | 1,000.00 | | | | 1,000.00 | | | | 1,309.40 | | | | 1,018.45 | | | | 7.33 | | | | 6.41 | | | | 1.28 | | |
| Class B | | | 1,000.00 | | | | 1,000.00 | | | | 1,305.00 | | | | 1,014.73 | | | | 11.60 | | | | 10.14 | | | | 2.03 | | |
| Class C | | | 1,000.00 | | | | 1,000.00 | | | | 1,305.30 | | | | 1,014.73 | | | | 11.60 | | | | 10.14 | | | | 2.03 | | |
| Class I | | | 1,000.00 | | | | 1,000.00 | | | | 1,036.20 | * | | | 1,020.38 | | | | 3.82 | * | | | 4.46 | | | | 0.89 | | |
| Class Z | | | 1,000.00 | | | | 1,000.00 | | | | 1,311.30 | | | | 1,019.69 | | | | 5.90 | | | | 5.16 | | | | 1.03 | | |
Expenses paid during the period are equal to the annualized expense ratio for the share class, multiplied by the average account value over the period, then multiplied by the number of days in the fund's most recent fiscal half-year and divided by 365.
It is important to note that the expense amounts shown in the table are meant to highlight only ongoing costs of investing in the fund and do not reflect any transaction costs, such as sales charges, redemption fees or exchange fees. Therefore, the hypothetical examples provided may not help you determine the relative total costs of owning shares of different funds. If these transaction costs were included, your costs would have been higher.
*For the period September 27, 2010 through February 28, 2011. Class I shares commenced operations on September 27, 2010.
5
Portfolio Managers' Report – Columbia Marsico Focused Equities Fund
Performance data quoted represents past performance and current performance may be lower or higher. Past performance is no guarantee of future results. The investment return and principal value will fluctuate so that shares, when redeemed, may be worth more or less than the original cost. Please visit www.columbiamanagement.com for daily and most recent month-end performance updates.
Net asset value per share
as of 02/28/11 ($)
| Class A | | | 23.53 | | |
| Class B | | | 21.48 | | |
| Class C | | | 21.55 | | |
| Class I | | | 24.04 | | |
| Class Z | | | 24.05 | | |
Distributions declared per share
03/01/10 – 02/28/11 ($)
| Class I | | | 0.07 | | |
| Class Z | | | 0.04 | | |
Top 5 sectors
as of 02/28/11 (%)
| Information Technology | | | 17.8 | | |
| Industrials | | | 17.3 | | |
| Financials | | | 16.6 | | |
| Consumer Discretionary | | | 16.3 | | |
| Materials | | | 13.4 | | |
Top 5 sectors are calculated as a percentage of net assets.
For the 12-month period that ended February 28, 2011, the fund's Class A shares returned 23.91% without sales charge. The fund's benchmark, the S&P 500 Index, returned 22.57%. The average return of the fund's peer group, the Lipper Large-Cap Growth Funds Classification, was 22.79%. Stock selection and sector allocation benefited performance across a range of sectors but detracted from overall results in the energy sector.
Stock selection and positioning in strong sectors a plus
Stock selection in information technology, consumer discretionary and industrials was strong. In the technology sector, both Chinese Internet services provider Baidu (4.8% of net assets) and Apple Computer (6.5% of net assets and the fund's largest holding), maker of the iPad and iPod, appreciated significantly during the period. In consumer discretionary, Internet retailers priceline.com (2.7% of net assets) and Amazon.com (4.5% of net assets) both posted strong returns. Casino resort operator Wynn Resorts (3.1% of net assets) appreciated sharply. The fund's industrial holdings were led by power management company Eaton (4.9% of net assets) and railroad operator Union Pacific (5.0% of net assets). The fund also benefited from an overweight relative to the index in the consumer discretionary, industrials and materials sectors, which were strong performers during the period. Underweight allocations in health care and consumer staples aided fund performance, as these sectors were the weakest.
Energy detracted from results
Energy was the strongest performing sector within the S&P 500 during the period. As a result, the fund's underweight in the sector had a negative impact on returns. In addition, offshore driller Transocean and exploration and production firm Southwestern Energy both dropped sharply prior to being sold from the portfolio. Financial holdings generated a positive return during the period, but the fund's holdings in the sector trailed financials within the index. In particular, stock selection in the bank industry was a drag on performance.
Portfolio structuring
During the period, the fund sold its health care holdings, which we believe struggled due to the overhang of U.S. health care reform initiatives. The fund also reduced its exposure to the information technology and financials sectors while increasing its investments in the consumer discretionary, industrials, energy and materials sectors. At the end of the period, information technology, industrials, financials, consumer discretionary and materials were the fund's areas of emphasis. The fund ended the period with no exposure to health care, utilities or telecommunication services.
6
Portfolio Managers' Report (continued) – Columbia Marsico Focused Equities Fund
Source for all statistical data—Columbia Management Investment Advisers, LLC.
Source for all stock-specific commentary—Marsico Capital Management, LLC.
Portfolio characteristics and holdings are subject to change periodically and may not be representative of current characteristics and holdings. The outlook for the fund may differ from those presented for other Columbia Funds.
Equity securities are subject to stock market fluctuations that occur in response to economic and business developments.
The fund normally invests in a core portfolio of 20-30 common stocks. By maintaining a relatively concentrated portfolio, the fund may be subject to a greater risk than a fund that is more fully diversified.
International investing involves special risks, including foreign taxation, currency fluctuations, risks associated with possible differences in financial standards and other risks associated with future political and economic developments.
Investing in emerging markets may involve greater risks than investing in more developed countries. In addition, concentration of investments in a single region may result in greater volatility.
Top 10 holdings
as of 02/28/11 (%)
| Apple, Inc. | | | 6.5 | | |
| Union Pacific Corp. | | | 5.0 | | |
| Eaton Corp. | | | 4.9 | | |
| Baidu, Inc. | | | 4.8 | | |
| Dow Chemical Co. | | | 4.7 | | |
| Amazon.com, Inc. | | | 4.5 | | |
| Oracle Corp. | | | 4.4 | | |
| Monsanto Co. | | | 4.1 | | |
| U.S. Bancorp | | | 3.9 | | |
| NIKE, Inc. | | | 3.7 | | |
The fund is actively managed and the composition of its portfolio will change over time. Information provided is calculated as a percentage of net assets.
7
Investment Portfolio – Columbia Marsico Focused Equities Fund
February 28, 2011
| Common Stocks – 93.6% | |
| | | Shares | | Value ($) | |
| Consumer Discretionary – 16.3% | |
| Hotels, Restaurants & Leisure – 3.6% | |
| Starbucks Corp. | | | 448,688 | | | | 14,797,730 | | |
| Wynn Resorts Ltd. | | | 708,843 | | | | 87,138,070 | | |
| Hotels, Restaurants & Leisure Total | | | 101,935,800 | | |
| Internet & Catalog Retail – 7.2% | |
| Amazon.com, Inc. (a) | | | 738,788 | | | | 128,024,573 | | |
| priceline.com, Inc. (a) | | | 171,911 | | | | 78,026,965 | | |
| Internet & Catalog Retail Total | | | 206,051,538 | | |
| Multiline Retail – 1.8% | |
| Nordstrom, Inc. | | | 1,105,434 | | | | 50,031,943 | | |
| Multiline Retail Total | | | 50,031,943 | | |
| Textiles, Apparel & Luxury Goods – 3.7% | |
| NIKE, Inc., Class B | | | 1,183,294 | | | | 105,348,665 | | |
| Textiles, Apparel & Luxury Goods Total | | | 105,348,665 | | |
| Consumer Discretionary Total | | | 463,367,946 | | |
| Consumer Staples – 2.8% | |
| Food Products – 2.8% | |
Mead Johnson Nutrition Co.,
Class A | | | 1,357,750 | | | | 81,261,337 | | |
| Food Products Total | | | 81,261,337 | | |
| Consumer Staples Total | | | 81,261,337 | | |
| Energy – 9.4% | |
| Energy Equipment & Services – 3.6% | |
| Halliburton Co. | | | 2,170,572 | | | | 101,886,650 | | |
| Energy Equipment & Services Total | | | 101,886,650 | | |
| Oil, Gas & Consumable Fuels – 5.8% | |
| Anadarko Petroleum Corp. | | | 1,060,634 | | | | 86,791,680 | | |
| EOG Resources, Inc. | | | 334,333 | | | | 37,548,939 | | |
| Kinder Morgan, Inc. (a) | | | 1,355,973 | | | | 41,357,177 | | |
| Oil, Gas & Consumable Fuels Total | | | 165,697,796 | | |
| Energy Total | | | 267,584,446 | | |
| Financials – 16.6% | |
| Capital Markets – 3.1% | |
| Goldman Sachs Group, Inc. | | | 542,933 | | | | 88,921,567 | | |
| Capital Markets Total | | | 88,921,567 | | |
| | | Shares | | Value ($) | |
| Commercial Banks – 9.2% | |
| PNC Financial Services Group, Inc. | | | 914,361 | | | | 56,416,074 | | |
| U.S. Bancorp | | | 4,025,031 | | | | 111,614,110 | | |
| Wells Fargo & Co. | | | 2,911,420 | | | | 93,922,409 | | |
| Commercial Banks Total | | | 261,952,593 | | |
| Consumer Finance – 1.6% | |
| American Express Co. | | | 1,026,860 | | | | 44,740,290 | | |
| Consumer Finance Total | | | 44,740,290 | | |
| Diversified Financial Services – 2.7% | |
| Citigroup, Inc. (a) | | | 16,534,746 | | | | 77,382,611 | | |
| Diversified Financial Services Total | | | 77,382,611 | | |
| Financials Total | | | 472,997,061 | | |
| Industrials – 17.3% | |
| Aerospace & Defense – 5.4% | |
| General Dynamics Corp. | | | 824,822 | | | | 62,785,451 | | |
| Goodrich Corp. | | | 1,045,206 | | | | 90,128,113 | | |
| Aerospace & Defense Total | | | 152,913,564 | | |
| Machinery – 6.9% | |
| Cummins, Inc. | | | 550,773 | | | | 55,694,166 | | |
| Eaton Corp. | | | 1,266,734 | | | | 140,328,792 | | |
| Machinery Total | | | 196,022,958 | | |
| Road & Rail – 5.0% | |
| Union Pacific Corp. | | | 1,505,113 | | | | 143,602,831 | | |
| Road & Rail Total | | | 143,602,831 | | |
| Industrials Total | | | 492,539,353 | | |
| Information Technology – 17.8% | |
| Computers & Peripherals – 6.5% | |
| Apple, Inc. (a) | | | 525,645 | | | | 185,663,070 | | |
| Computers & Peripherals Total | | | 185,663,070 | | |
| Internet Software & Services – 4.8% | |
| Baidu, Inc., ADR (a) | | | 1,124,612 | | | | 136,257,990 | | |
| Internet Software & Services Total | | | 136,257,990 | | |
| Software – 6.5% | |
| Oracle Corp. | | | 3,802,366 | | | | 125,097,842 | | |
| Salesforce.com, Inc. (a) | | | 461,004 | | | | 60,976,999 | | |
| Software Total | | | 186,074,841 | | |
| Information Technology Total | | | 507,995,901 | | |
See Accompanying Notes to Financial Statements.
8
Columbia Marsico Focused Equities Fund
February 28, 2011
| Common Stocks (continued) | |
| | | Shares | | Value ($) | |
| Materials – 13.4% | |
| Chemicals – 8.8% | |
| Dow Chemical Co. | | | 3,631,023 | | | | 134,928,815 | | |
| Monsanto Co. | | | 1,615,913 | | | | 116,167,985 | | |
| Chemicals Total | | | 251,096,800 | | |
| Metals & Mining – 4.6% | |
| BHP Billiton PLC, ADR | | | 718,848 | | | | 57,011,835 | | |
Freeport-McMoRan Copper &
Gold, Inc. | | | 1,376,804 | | | | 72,901,772 | | |
| Metals & Mining Total | | | 129,913,607 | | |
| Materials Total | | | 381,010,407 | | |
Total Common Stocks
(cost of $1,855,119,655) | | | 2,666,756,451 | | |
| | | Par ($) | | | |
| Short-Term Obligation – 5.5% | |
Repurchase agreement with
Fixed Income Clearing Corp.,
dated 02/28/11, due 03/01/11
at 0.090%, collateralized by a
U.S. Government Agency
obligation maturing 04/15/14,
market value $160,655,438
(repurchase proceeds
$157,503,394) | | | 157,503,000 | | | | 157,503,000 | | |
Total Short-Term Obligation
(cost of $157,503,000) | | | 157,503,000 | | |
Total Investments – 99.1%
(cost of $2,012,622,655) (b) | | | 2,824,259,451 | | |
| Other Assets & Liabilities, Net – 0.9% | | | 25,859,288 | | |
| Net Assets – 100.0% | | | 2,850,118,739 | | |
Notes to Investment Portfolio:
(a) Non-income producing security.
(b) Cost for federal income tax purposes is $2,046,749,668.
Generally accepted accounting principles (GAAP) require disclosure regarding the inputs and valuation techniques used to measure fair value and any changes in valuation inputs or techniques. In addition, investments shall be disclosed by major category.
The Fund categorizes its fair value measurements according to a three-level hierarchy that maximizes the use of observable inputs and minimizes the use of unobservable inputs by prioritizing that the most observable input be used when available. Observable inputs are those that market participants would use in pricing an investment based on market data obtained from sources independent of the reporting entity. Unobservable inputs are those that reflect the Fund's assumptions about the information market participants would use in pricing an investment. An investment's level within the fair value hierarchy is based on the lowest level of any input that is deemed significant to the asset or liability's fair value measurement. The input levels are not necessarily an indication of the risk or liquidity associated with investments at that level. For example, certain U.S. government securities are generally high quality and liquid, however, they are reflected as Level 2 because the inputs used to determine fair value may not always be quoted prices in an active market.
Fair value inputs are summarized in the three broad levels listed below:
• Level 1—Valuations based on quoted prices for investments in active markets that the Fund has the ability to access at the measurement date (including NAV for open-end mutual funds). Valuation adjustments are not applied to Level 1 investments.
• Level 2—Valuations based on other significant observable inputs (including quoted prices for similar securities, interest rates, prepayment speeds, credit risks, etc.).
• Level 3—Valuations based on significant unobservable inputs (including the Fund's own assumptions and judgment in determining the fair value of investments).
Inputs that are used in determining fair value of an investment may include price information, credit data, volatility statistics, and other factors. These inputs can be either observable or unobservable. The availability of observable inputs can vary between investments, and is affected by various factors such as the type of investment, and the volume and level of activity for that investment or similar investments in the marketplace. The inputs will be considered by the Investment Manager, along with any other relevant factors in the calculation of an investment's fair value. The Fund uses prices and inputs that are current as of the measurement date, which may include periods of market dislocations. During these periods, the availability of prices and inputs may be reduced for many investments. This condition could cause an investment to be reclassified between the various levels within the hierarchy. Non-U.S. equity securities actively traded in foreign markets may be reflected in Level 2 despite the availability of closing prices, because the Fund evaluates and determines whether those closing prices reflect fair value at the close of the New York Stock Exchange (NYSE) or require adjustment, as described in Note 2 to the financial statements—Security Valuation.
Investments falling into the Level 3 category are primarily supported by quoted prices from brokers and dealers participating in the market for those investments. However, these may be classified as Level 3 investments due to lack of market transparency and corroboration to support these quoted prices. Additionally, valuation models may be used as the pricing source for any remaining investments classified as Level 3. These models rely on one or more significant unobservable inputs and/or significant assumptions by the Investment Manager. Inputs used in valuations may include, but are not limited to, financial statement analysis, capital account balances, discount rates and estimated cash flows, and comparable company data.
The following table is a summary of the inputs used to value the Fund's investments as of February 28, 2011:
| Description | | Quoted
Prices
(Level 1) | | Other
Significant
Observable
Inputs
(Level 2) | | Significant
Unobservable
Inputs
(Level 3) | | Total | |
| Total Common Stocks | | $ | 2,666,756,451 | | | $ | — | | | $ | — | | | $ | 2,666,756,451 | | |
Total Short-Term
Obligation | | | — | | | | 157,503,000 | | | | — | | | | 157,503,000 | | |
| Total Investments | | $ | 2,666,756,451 | | | $ | 157,503,000 | | | $ | — | | | $ | 2,824,259,451 | | |
The Fund's assets assigned to the Level 2 input category represent certain short-term obligations which are valued using amortized cost, an income approach which converts future cash flows to a present value based upon the discount or premium at purchase.
There were no significant transfers of financial assets between Levels 1 and 2 during the period.
See Accompanying Notes to Financial Statements.
9
Columbia Marsico Focused Equities Fund
February 28, 2011
At February 28, 2011, the Fund held investments in the following sectors:
| Sector (Unaudited) | | % of
Net Assets | |
| Information Technology | | | 17.8 | | |
| Industrials | | | 17.3 | | |
| Financials | | | 16.6 | | |
| Consumer Discretionary | | | 16.3 | | |
| Materials | | | 13.4 | | |
| Energy | | | 9.4 | | |
| Consumer Staples | | | 2.8 | | |
| | | | 93.6 | | |
| Short-Term Obligation | | | 5.5 | | |
| Other Assets & Liabilities, Net | | | 0.9 | | |
| | | | 100.0 | | |
| Acronym | | Name | |
| ADR | | American Depositary Receipt | |
|
See Accompanying Notes to Financial Statements.
10
Statement of Assets and Liabilities – Columbia Marsico Focused Equities Fund
February 28, 2011
| | | | | ($) | |
| Assets | | Investments, at identified cost | | | 2,012,622,655 | | |
| | | Investments, at value | | | 2,824,259,451 | | |
| | | Cash | | | 407 | | |
| | | Receivable for: | | | | | |
| | | Investments sold | | | 46,854,382 | | |
| | | Fund shares sold | | | 5,028,894 | | |
| | | Dividends | | | 1,581,474 | | |
| | | Interest | | | 394 | | |
| | | Prepaid expenses | | | 10,974 | | |
| | | Total Assets | | | 2,877,735,976 | | |
| Liabilities | | Payable for: | | | | | |
| | | Investments purchased | | | 19,783,905 | | |
| | | Fund shares repurchased | | | 3,567,700 | | |
| | | Investment advisory fee | | | 1,435,523 | | |
| | | Administration fee | | | 472,501 | | |
| | | Pricing and bookkeeping fees | | | 12,268 | | |
| | | Transfer agent fee | | | 1,452,014 | | |
| | | Trustees' fees | | | 78,668 | | |
| | | Custody fee | | | 20,146 | | |
| | | Distribution and service fees | | | 538,945 | | |
| | | Chief compliance officer expenses | | | 524 | | |
| | | Other liabilities | | | 255,043 | | |
| | | Total Liabilities | | | 27,617,237 | | |
| | | Net Assets | | | 2,850,118,739 | | |
| Net Assets Consist of | | Paid-in capital | | | 2,190,758,316 | | |
| | | Accumulated net realized loss | | | (152,276,373 | ) | |
| | | Net unrealized appreciation (depreciation) on investments | | | 811,636,796 | | |
| | | Net Assets | | | 2,850,118,739 | | |
See Accompanying Notes to Financial Statements.
11
Statement of Assets and Liabilities (continued) – Columbia Marsico Focused Equities Fund
February 28, 2011
| Class A | | Net assets | | $ | 1,370,198,602 | | |
| | | Shares outstanding | | | 58,226,152 | | |
| | | Net asset value per share | | $ | 23.53 | (a) | |
| | | Maximum sales charge | | | 5.75 | % | |
| | | Maximum offering price per share ($23.53/0.9425) | | $ | 24.97 | (b) | |
| Class B | | Net assets | | $ | 45,195,541 | | |
| | | Shares outstanding | | | 2,103,978 | | |
| | | Net asset value and offering price per share | | $ | 21.48 | (a) | |
| Class C | | Net assets | | $ | 304,857,006 | | |
| | | Shares outstanding | | | 14,147,890 | | |
| | | Net asset value and offering price per share | | $ | 21.55 | (a) | |
| Class I (c) | | Net assets | | $ | 28,852,167 | | |
| | | Shares outstanding | | | 1,200,132 | | |
| | | Net asset value, offering and redemption price per share | | $ | 24.04 | | |
| Class Z | | Net assets | | $ | 1,101,015,423 | | |
| | | Shares outstanding | | | 45,779,982 | | |
| | | Net asset value, offering and redemption price per share | | $ | 24.05 | | |
(a) Redemption price per share is equal to net asset value less any applicable contingent deferred sales charge.
(b) On sales of $50,000 or more the offering price is reduced.
(c) Class I shares commenced operations on September 27, 2010.
See Accompanying Notes to Financial Statements.
12
Statement of Operations – Columbia Marsico Focused Equities Fund
For the Year Ended February 28, 2011
| | | | | ($) (a) | |
| Investment Income | | Dividends | | | 37,286,599 | | |
| | | Interest | | | 83,311 | | |
| | | Foreign taxes withheld | | | (5,744 | ) | |
| | | Total investment income | | | 37,364,166 | | |
| Expenses | | Investment advisory fee | | | 18,531,701 | | |
| | | Administration fee | | | 6,106,876 | | |
| | | Distribution fee: | | | | | |
| | | Class B | | | 390,596 | | |
| | | Class C | | | 2,188,856 | | |
| | | Service fee: | | | | | |
| | | Class B | | | 130,194 | | |
| | | Class C | | | 729,622 | | |
| | | Distribution and service fees: | | | | | |
| | | Class A | | | 3,640,117 | | |
| | | Transfer agent fee: | | | | | |
| | | Class A, Class B, Class C and Class Z | | | 4,562,358 | | |
| | | Pricing and bookkeeping fees | | | 143,791 | | |
| | | Trustees' fees | | | 68,281 | | |
| | | Custody fee | | | 75,624 | | |
| | | Chief compliance officer expenses | | | 3,597 | | |
| | | Other expenses | | | 340,123 | | |
| | | Expenses before interest expense | | | 36,911,736 | | |
| | | Interest expense | | | 755 | | |
| | | Total Expenses | | | 36,912,491 | | |
| | | Expense reductions | | | (4 | ) | |
| | | Net Expenses | | | 36,912,487 | | |
| | | Net Investment Income | | | 451,679 | | |
| Net Realized and Unrealized Gain (Loss) on Investments and Foreign Currency | | Net realized gain (loss) on: | | | | | |
| | | Investments | | | 355,222,371 | | |
| | | Foreign currency transactions | | | (1,186 | ) | |
| | | Net realized gain | | | 355,221,185 | | |
| | | Net change in unrealized appreciation (depreciation) on investments | | | 234,751,445 | | |
| | | Net Gain | | | 589,972,630 | | |
| | | Net Increase Resulting from Operations | | | 590,424,309 | | |
(a) Class I shares commenced operations on September 27, 2010.
See Accompanying Notes to Financial Statements.
13
Statement of Changes in Net Assets – Columbia Marsico Focused Equities Fund
| | | | | Year Ended February 28, | |
| Increase (Decrease) in Net Assets | | | | 2011 ($)(a)(b) | | 2010 ($) | |
| Operations | | Net investment income | | | 451,679 | | | | 753,424 | | |
| | | Net realized gain on investments and foreign
currency transactions | | | 355,221,185 | | | | 247,291,328 | | |
| | | Net change in unrealized appreciation (depreciation)
on investments and foreign currency translations | | | 234,751,445 | | | | 867,973,075 | | |
| | | Net increase resulting from operations | | | 590,424,309 | | | | 1,116,017,827 | | |
| Distributions to Shareholders | | From net investment income: | | | | | | | | | |
| | | Class A | | | — | | | | (1,868,669 | ) | |
| | | Class B | | | — | | | | (15,297 | ) | |
| | | Class C | | | — | | | | (64,902 | ) | |
| | | Class I | | | (7,895 | ) | | | — | | |
| | | Class Z | | | (1,790,234 | ) | | | (2,647,984 | ) | |
| | | From return of capital: | | | | | | | | | |
| | | Class A | | | — | | | | (1,054,336 | ) | |
| | | Class B | | | — | | | | (8,631 | ) | |
| | | Class C | | | — | | | | (36,619 | ) | |
| | | Class Z | | | — | | | | (1,494,039 | ) | |
| | | Total distributions to shareholders | | | (1,798,129 | ) | | | (7,190,477 | ) | |
| | | Net Capital Stock Transactions | | | (694,899,268 | ) | | | (662,561,084 | ) | |
| | | Increase from regulatory settlements | | | — | | | | 51,132 | | |
| | | Total increase (decrease) in net assets | | | (106,273,088 | ) | | | 446,317,398 | | |
| Net Assets | | Beginning of period | | | 2,956,391,827 | | | | 2,510,074,429 | | |
| | | End of period | | | 2,850,118,739 | | | | 2,956,391,827 | | |
| | | Undistributed net investment income at
end of period | | | — | | | | — | | |
(a) Class I shares commenced operations on September 27, 2010.
(b) Class I shares reflect activity for the period September 27, 2010 through February 28, 2011.
See Accompanying Notes to Financial Statements.
14
Statement of Changes in Net Assets (continued) – Columbia Marsico Focused Equities Fund
| | | Capital Stock Activity | |
| | | Year Ended
February 28, 2011 | | Year Ended
February 28, 2010 | |
| | | Shares | | Dollars ($) | | Shares | | Dollars ($) | |
| Class A | |
| Subscriptions | | | 9,963,643 | | | | 207,634,441 | | | | 15,121,111 | | | | 260,670,731 | | |
| Distributions reinvested | | | — | | | | — | | | | 153,240 | | | | 2,523,068 | | |
| Redemptions | | | (35,990,551 | ) | | | (723,569,817 | ) | | | (33,883,508 | ) | | | (535,196,732 | ) | |
| Net decrease | | | (26,026,908 | ) | | | (515,935,376 | ) | | | (18,609,157 | ) | | | (272,002,933 | ) | |
| Class B | |
| Subscriptions | | | 13,532 | | | | 260,647 | | | | 96,750 | | | | 1,333,604 | | |
| Distributions reinvested | | | — | | | | — | | | | 1,189 | | | | 17,007 | | |
| Redemptions | | | (1,513,860 | ) | | | (28,578,982 | ) | | | (1,995,401 | ) | | | (30,529,667 | ) | |
| Net decrease | | | (1,500,328 | ) | | | (28,318,335 | ) | | | (1,897,462 | ) | | | (29,179,056 | ) | |
| Class C | |
| Subscriptions | | | 687,503 | | | | 13,179,244 | | | | 1,220,722 | | | | 18,576,202 | | |
| Distributions reinvested | | | — | | | | — | | | | 3,190 | | | | 45,811 | | |
| Redemptions | | | (3,573,230 | ) | | | (67,265,749 | ) | | | (5,998,357 | ) | | | (92,853,105 | ) | |
| Net decrease | | | (2,885,727 | ) | | | (54,086,505 | ) | | | (4,774,445 | ) | | | (74,231,092 | ) | |
| Class I (a)(b) | |
| Subscriptions | | | 1,269,141 | | | | 29,036,582 | | | | — | | | | — | | |
| Distributions reinvested | | | 343 | | | | 7,887 | | | | — | | | | — | | |
| Redemptions | | | (69,352 | ) | | | (1,626,838 | ) | | | — | | | | — | | |
| Net increase | | | 1,200,132 | | | | 27,417,631 | | | | — | | | | — | | |
| Class Z | |
| Subscriptions | | | 11,640,322 | | | | 247,955,191 | | | | 13,863,230 | | | | 226,232,688 | | |
| Distributions reinvested | | | 59,617 | | | | 1,370,596 | | | | 157,915 | | | | 2,810,577 | | |
| Redemptions | | | (17,270,945 | ) | | | (373,302,470 | ) | | | (29,835,940 | ) | | | (516,191,268 | ) | |
| Net decrease | | | (5,571,006 | ) | | | (123,976,683 | ) | | | (15,814,795 | ) | | | (287,148,003 | ) | |
(a) Class I shares commenced operations on September 27, 2010.
(b) Class I shares reflect activity for the period September 27, 2010 through February 28, 2011.
See Accompanying Notes to Financial Statements.
15
Financial Highlights – Columbia Marsico Focused Equities Fund
Selected data for a share outstanding throughout each period is as follows:
| | | Year Ended February 28, | | Period Ended
February 29, | | Year Ended March 31, | |
| Class A Shares | | 2011 | | 2010 | | 2009 | | 2008 (a)(b)(c) | | 2007 (a) | | 2006 (a)(d) | |
Net Asset Value,
Beginning of Period | | $ | 18.99 | | | $ | 12.76 | | | $ | 21.59 | | | $ | 21.81 | | | $ | 21.10 | | | $ | 17.67 | | |
Income from Investment
Operations: | |
| Net investment income (loss) (e) | | | — | (f) | | | 0.01 | | | | 0.07 | | | | 0.02 | | | | (0.04 | ) | | | (0.05 | ) | |
Net realized and unrealized gain (loss)
on investments and foreign currency | | | 4.54 | | | | 6.25 | | | | (8.86 | ) | | | 0.02 | | | | 0.75 | | | | 3.48 | | |
| Total from investment operations | | | 4.54 | | | | 6.26 | | | | (8.79 | ) | | | 0.04 | | | | 0.71 | | | | 3.43 | | |
Less Distributions to
Shareholders: | |
| From net investment income | | | — | | | | (0.02 | ) | | | (0.04 | ) | | | — | | | | — | | | | — | | |
| From net realized gains | | | — | | | | — | | | | — | | | | (0.26 | ) | | | — | | | | — | | |
| From return of capital | | | — | | | | (0.01 | ) | | | — | | | | — | | | | — | | | | — | | |
| Total distributions to shareholders | | | — | | | | (0.03 | ) | | | (0.04 | ) | | | (0.26 | ) | | | — | | | | — | | |
Increase from regulatory
settlements | | | — | | | | — | (f) | | | — | | | | — | | | | — | | | | — | | |
| Net Asset Value, End of Period | | $ | 23.53 | | | $ | 18.99 | | | $ | 12.76 | | | $ | 21.59 | | | $ | 21.81 | | | $ | 21.10 | | |
| Total return (g) | | | 23.91 | % | | | 49.12 | %(h) | | | (40.73 | )%(h) | | | 0.00 | %(h)(i) | | | 3.36 | %(h) | | | 19.41 | %(h) | |
Ratios to Average Net Assets/
Supplemental Data: | |
Net expenses before interest
expense (j) | | | 1.30 | % | | | 1.30 | % | | | 1.26 | % | | | 1.22 | %(k) | | | 1.24 | % | | | 1.22 | % | |
| Interest expense | | | — | %(l) | | | — | %(l) | | | — | | | | — | %(k)(l) | | | — | | | | — | | |
| Net expenses (j) | | | 1.30 | % | | | 1.30 | % | | | 1.26 | % | | | 1.22 | %(k) | | | 1.24 | % | | | 1.22 | % | |
| Waiver/Reimbursement | | | — | | | | 0.01 | % | | | 0.05 | % | | | 0.03 | %(k) | | | 0.04 | % | | | 0.08 | %(m) | |
| Net investment income (loss) (j) | | | 0.01 | % | | | 0.03 | % | | | 0.37 | % | | | 0.11 | %(k) | | | (0.19 | )% | | | (0.27 | )% | |
| Portfolio turnover rate | | | 77 | % | | | 77 | % | | | 85 | % | | | — | %(i)(l)(n) | | | — | | | | — | | |
Turnover of Columbia Marsico
Focused Equities Master Portfolio | | | — | | | | — | | | | — | | | | 82 | %(i) | | | 52 | % | | | 71 | % | |
| Net assets, end of period (000s) | | $ | 1,370,199 | | | $ | 1,599,661 | | | $ | 1,312,382 | | | $ | 2,524,540 | | | $ | 2,488,288 | | | $ | 2,061,076 | | |
(a) The per share amounts and percentages reflect income and expenses assuming inclusion of the Fund's proportionate share of the income and expenses of Columbia Marsico Focused Equities Master Portfolio.
(b) The Fund changed its fiscal year end from March 31 to February 29. Per share data and total return reflect activity from April 1, 2007 through February 29, 2008.
(c) Effective February 28, 2008, the Fund converted to a stand-alone fund. Prior to February 28, 2008, the Fund operated in a master-feeder structure.
(d) On August 22, 2005, the Fund's Investor A shares were renamed Class A shares.
(e) Per share data was calculated using the average shares outstanding during the period.
(f) Rounds to less than $0.01 per share.
(g) Total return at net asset value assuming all distributions reinvested and no initial sales charge or contingent deferred sales charge.
(h) Had the Investment Manager and/or any of its affiliates not waived fees or reimbursed a portion of expenses, total return would have been reduced.
(i) Not annualized.
(j) The benefits derived from expense reductions had an impact of less than 0.01%.
(k) Annualized.
(l) Rounds to less than 0.01%.
(m) Bank of America Corporation assumed certain non-recurring costs. Absent these non-recurring costs, the waiver/reimbursement ratio would have been 0.02%.
(n) Amount represents results after the Fund's conversion to a stand-alone structure on February 28, 2008.
See Accompanying Notes to Financial Statements.
16
Financial Highlights – Columbia Marsico Focused Equities Fund
Selected data for a share outstanding throughout each period is as follows:
| | | Year Ended February 28, | | Period Ended
February 29, | | Year Ended March 31, | |
| Class B Shares | | 2011 | | 2010 | | 2009 | | 2008 (a)(b)(c) | | 2007 (a) | | 2006 (a)(d) | |
| Net Asset Value, Beginning of Period | | $ | 17.46 | | | $ | 11.80 | | | $ | 20.07 | | | $ | 20.42 | | | $ | 19.91 | | | $ | 16.80 | | |
| Income from Investment Operations: | |
| Net investment loss (e) | | | (0.14 | ) | | | (0.11 | ) | | | (0.07 | ) | | | (0.13 | ) | | | (0.17 | ) | | | (0.18 | ) | |
Net realized and unrealized gain (loss)
on investments and foreign currency | | | 4.16 | | | | 5.77 | | | | (8.20 | ) | | | 0.04 | | | | 0.68 | | | | 3.29 | | |
| Total from investment operations | | | 4.02 | | | | 5.66 | | | | (8.27 | ) | | | (0.09 | ) | | | 0.51 | | | | 3.11 | | |
| Less Distributions to Shareholders: | |
| From net realized gains | | | — | | | | — | | | | — | | | | (0.26 | ) | | | — | | | | — | | |
| From return of capital | | | — | | | | — | (f) | | | — | | | | — | | | | — | | | | — | | |
| Total distributions to shareholders | | | — | | | | — | (f) | | | — | | | | (0.26 | ) | | | — | | | | — | | |
| Increase from regulatory settlements | | | — | | | | — | (f) | | | — | | | | — | | | | — | | | | — | | |
| Net Asset Value, End of Period | | $ | 21.48 | | | $ | 17.46 | | | $ | 11.80 | | | $ | 20.07 | | | $ | 20.42 | | | $ | 19.91 | | |
| Total return (g) | | | 23.02 | % | | | 48.02 | %(h) | | | (41.21 | )%(h) | | | (0.64 | )%(h)(i) | | | 2.56 | %(h) | | | 18.51 | %(h) | |
Ratios to Average Net Assets/
Supplemental Data: | |
| Net expenses before interest expense (j) | | | 2.05 | % | | | 2.05 | % | | | 2.01 | % | | | 1.97 | %(k) | | | 1.99 | % | | | 1.97 | % | |
| Interest expense | | | — | %(l) | | | — | %(l) | | | — | | | | — | %(k)(l) | | | — | | | | — | | |
| Net expenses (j) | | | 2.05 | % | | | 2.05 | % | | | 2.01 | % | | | 1.97 | %(k) | | | 1.99 | % | | | 1.97 | % | |
| Waiver/Reimbursement | | | — | | | | 0.01 | % | | | 0.05 | % | | | 0.03 | %(k) | | | 0.04 | % | | | 0.08 | %(m) | |
| Net investment loss (j) | | | (0.74 | )% | | | (0.72 | )% | | | (0.40 | )% | | | (0.67 | )%(k) | | | (0.85 | )% | | | (1.01 | )% | |
| Portfolio turnover rate | | | 77 | % | | | 77 | % | | | 85 | % | | | — | %(i)(l)(n) | | | — | | | | — | | |
Turnover of Columbia Marsico Focused
Equities Master Portfolio | | | — | | | | — | | | | — | | | | 82 | %(i) | | | 52 | % | | | 71 | % | |
| Net assets, end of period (000s) | | $ | 45,196 | | | $ | 62,935 | | | $ | 64,937 | | | $ | 196,114 | | | $ | 348,836 | | | $ | 509,933 | | |
(a) The per share amounts and percentages reflect income and expenses assuming inclusion of the Fund's proportionate share of the income and expenses of Columbia Marsico Focused Equities Master Portfolio.
(b) The Fund changed its fiscal year end from March 31 to February 29. Per share data and total return reflect activity from April 1, 2007 through February 29, 2008.
(c) Effective February 28, 2008, the Fund converted to a stand-alone fund. Prior to February 28, 2008, the Fund operated in a master-feeder structure.
(d) On August 22, 2005, the Fund's Investor B shares were renamed Class B shares.
(e) Per share data was calculated using the average shares outstanding during the period.
(f) Rounds to less than $0.01 per share.
(g) Total return at net asset value assuming all distributions reinvested and no contingent deferred sales charge.
(h) Had the Investment Manager and/or any of its affiliates not waived fees or reimbursed a portion of expenses, total return would have been reduced.
(i) Not annualized.
(j) The benefits derived from expense reductions had an impact of less than 0.01%.
(k) Annualized.
(l) Rounds to less than 0.01%.
(m) Bank of America Corporation assumed certain non-recurring costs. Absent these non-recurring costs, the waiver/reimbursement ratio would have been 0.02%.
(n) Amount represents results after the Fund's conversion to a stand-alone structure on February 28, 2008.
See Accompanying Notes to Financial Statements.
17
Financial Highlights – Columbia Marsico Focused Equities Fund
Selected data for a share outstanding throughout each period is as follows:
| | | Year Ended February 28, | | Period Ended
February 29, | | Year Ended March 31, | |
| Class C Shares | | 2011 | | 2010 | | 2009 | | 2008 (a)(b)(c) | | 2007 (a) | | 2006 (a)(d) | |
Net Asset Value,
Beginning of Period | | $ | 17.52 | | | $ | 11.84 | | | $ | 20.13 | | | $ | 20.49 | | | $ | 19.97 | | | $ | 16.85 | | |
Income from Investment
Operations: | |
| Net investment loss (e) | | | (0.14 | ) | | | (0.11 | ) | | | (0.07 | ) | | | (0.15 | ) | | | (0.18 | ) | | | (0.19 | ) | |
Net realized and unrealized gain (loss)
on investments and foreign currency | | | 4.17 | | | | 5.79 | | | | (8.22 | ) | | | 0.05 | | | | 0.70 | | | | 3.31 | | |
| Total from investment operations | | | 4.03 | | | | 5.68 | | | | (8.29 | ) | | | (0.10 | ) | | | 0.52 | | | | 3.12 | | |
| Less Distributions to Shareholders: | |
| From net realized gains | | | — | | | | — | | | | — | | | | (0.26 | ) | | | — | | | | — | | |
| From return of capital | | | — | | | | — | (f) | | | — | | | | — | | | | — | | | | — | | |
| Total distributions to shareholders | | | — | | | | — | (f) | | | — | | | | (0.26 | ) | | | — | | | | — | | |
Increase from regulatory
settlements | | | — | | | | — | (f) | | | — | | | | — | | | | — | | | | — | | |
| Net Asset Value, End of Period | | $ | 21.55 | | | $ | 17.52 | | | $ | 11.84 | | | $ | 20.13 | | | $ | 20.49 | | | $ | 19.97 | | |
| Total return (g) | | | 23.00 | % | | | 48.02 | %(h) | | | (41.18 | )%(h) | | | (0.69 | )%(h)(i) | | | 2.60 | %(h) | | | 18.52 | %(h) | |
Ratios to Average Net Assets/
Supplemental Data: | |
| Net expenses before interest expense (j) | | | 2.05 | % | | | 2.05 | % | | | 2.01 | % | | | 1.97 | %(k) | | | 1.99 | % | | | 1.97 | % | |
| Interest expense | | | — | %(l) | | | — | %(l) | | | — | | | | — | %(k)(l) | | | — | | | | — | | |
| Net expenses (j) | | | 2.05 | % | | | 2.05 | % | | | 2.01 | % | | | 1.97 | %(k) | | | 1.99 | % | | | 1.97 | % | |
| Waiver/Reimbursement | | | — | | | | 0.01 | % | | | 0.05 | % | | | 0.03 | %(k) | | | 0.04 | % | | | 0.08 | %(m) | |
| Net investment loss (j) | | | (0.73 | )% | | | (0.72 | )% | | | (0.38 | )% | | | (0.74 | )%(k) | | | (0.92 | )% | | | (1.01 | )% | |
| Portfolio turnover rate | | | 77 | % | | | 77 | % | | | 85 | % | | | — | %(i)(l)(n) | | | — | | | | — | | |
Turnover of Columbia Marsico Focused
Equities Master Portfolio | | | — | | | | — | | | | — | | | | 82 | %(i) | | | 52 | % | | | 71 | % | |
| Net assets, end of period (000s) | | $ | 304,857 | | | $ | 298,344 | | | $ | 258,191 | | | $ | 522,644 | | | $ | 582,805 | | | $ | 532,250 | | |
(a) The per share amounts and percentages reflect income and expenses assuming inclusion of the Fund's proportionate share of the income and expenses of Columbia Marsico Focused Equities Master Portfolio.
(b) The Fund changed its fiscal year end from March 31 to February 29. Per share data and total return reflect activity from April 1, 2007 through February 29, 2008.
(c) Effective February 28, 2008, the Fund converted to a stand-alone fund. Prior to February 28, 2008, the Fund operated in a master-feeder structure.
(d) On August 22, 2005, the Fund's Investor C shares were renamed Class C shares.
(e) Per share data was calculated using the average shares outstanding during the period.
(f) Rounds to less than $0.01 per share.
(g) Total return at net asset value assuming all distributions reinvested and no contingent deferred sales charge.
(h) Had the Investment Manager and/or any of its affiliates not waived fees or reimbursed a portion of expenses, total return would have been reduced.
(i) Not annualized.
(j) The benefits derived from expense reductions had an impact of less than 0.01%.
(k) Annualized.
(l) Rounds to less than 0.01%.
(m) Bank of America Corporation assumed certain non-recurring costs. Absent these non-recurring costs, the waiver/reimbursement ratio would have been 0.02%.
(n) Amount represents results after the Fund's conversion to a stand-alone structure on February 28, 2008.
See Accompanying Notes to Financial Statements.
18
Financial Highlights – Columbia Marsico Focused Equities Fund
Selected data for a share outstanding throughout the period is as follows:
| Class I Shares | | Period Ended
February 28,
2011 (a) | |
| Net Asset Value, Beginning of Period | | $ | 20.59 | | |
| Income from Investment Operations: | |
| Net investment income (b)(c) | | | — | | |
| Net realized and unrealized gain on investments and foreign currency | | | 3.52 | | |
| Total from investment operations | | | 3.52 | | |
| Less Distributions to Shareholders: | |
| From net investment income | | | (0.07 | ) | |
| Net Asset Value, End of Period | | $ | 24.04 | | |
| Total return (d)(e) | | | 17.09 | % | |
| Ratios to Average Net Assets/Supplemental Data: | |
| Net expenses (f)(g) | | | 0.89 | % | |
| Net investment income (f)(g)(h) | | | — | % | |
| Portfolio turnover rate (e) | | | 77 | % | |
| Net assets, end of period (000s) | | $ | 28,852 | | |
(a) Class I shares commenced operations on September 27, 2010. Per share data and total return reflect activity from that date.
(b) Per share data was calculated using the average shares outstanding during the period.
(c) Rounds to less than $0.01 per share.
(d) Total return at net asset value assuming all distributions reinvested.
(e) Not annualized.
(f) The benefits derived from expense reductions had an impact of less than 0.01%.
(g) Annualized.
(h) Rounds to less than 0.01%.
See Accompanying Notes to Financial Statements.
19
Financial Highlights – Columbia Marsico Focused Equities Fund
Selected data for a share outstanding throughout each period is as follows:
| | | Year Ended February 28, | | Period Ended
February 29, | | Year Ended March 31, | |
| Class Z Shares | | 2011 | | 2010 | | 2009 | | 2008 (a)(b)(c) | | 2007 (a) | | 2006 (a)(d) | |
Net Asset Value,
Beginning of Period | | $ | 19.39 | | | $ | 13.02 | | | $ | 22.06 | | | $ | 22.22 | | | $ | 21.45 | | | $ | 17.92 | | |
Income from Investment
Operations: | |
| Net investment income (loss) (e) | | | 0.06 | | | | 0.05 | | | | 0.13 | | | | 0.09 | | | | 0.01 | | | | — | (f) | |
Net realized and unrealized gain (loss)
on investments and foreign currency | | | 4.64 | | | | 6.39 | | | | (9.07 | ) | | | 0.01 | | | | 0.76 | | | | 3.53 | | |
| Total from investment operations | | | 4.70 | | | | 6.44 | | | | (8.94 | ) | | | 0.10 | | | | 0.77 | | | | 3.53 | | |
Less Distributions to
Shareholders: | |
| From net investment income | | | (0.04 | ) | | | (0.05 | ) | | | (0.10 | ) | | | — | | | | — | | | | — | | |
| From net realized gains | | | — | | | | — | | | | — | | | | (0.26 | ) | | | — | | | | — | | |
| From return of capital | | | — | | | | (0.02 | ) | | | — | | | | — | | | | — | | | | — | | |
| Total distributions to shareholders | | | (0.04 | ) | | | (0.07 | ) | | | (0.10 | ) | | | (0.26 | ) | | | — | | | | — | | |
Increase from regulatory
settlements | | | — | | | | — | (f) | | | — | | | | — | | | | — | | | | — | | |
| Net Asset Value, End of Period | | $ | 24.05 | | | $ | 19.39 | | | $ | 13.02 | | | $ | 22.06 | | | $ | 22.22 | | | $ | 21.45 | | |
| Total return (g) | | | 24.23 | % | | | 49.53 | %(h) | | | (40.60 | )%(h) | | | 0.27 | %(h)(i) | | | 3.59 | %(h) | | | 19.70 | %(h) | |
Ratios to Average Net Assets/
Supplemental Data: | |
| Net expenses before interest expense (j) | | | 1.05 | % | | | 1.05 | % | | | 1.01 | % | | | 0.97 | %(k) | | | 0.99 | % | | | 0.97 | % | |
| Interest expense | | | — | %(l) | | | — | %(l) | | | — | | | | — | %(k)(l) | | | — | | | | — | | |
| Net expenses (j) | | | 1.05 | % | | | 1.05 | % | | | 1.01 | % | | | 0.97 | %(k) | | | 0.99 | % | | | 0.97 | % | |
| Waiver/Reimbursement | | | — | | | | 0.01 | % | | | 0.05 | % | | | 0.03 | %(k) | | | 0.04 | % | | | 0.08 | %(m) | |
| Net investment income (loss) (j) | | | 0.28 | % | | | 0.28 | % | | | 0.65 | % | | | 0.40 | %(k) | | | 0.06 | % | | | (0.01 | )% | |
| Portfolio turnover rate | | | 77 | % | | | 77 | % | | | 85 | % | | | — | %(i)(l)(n) | | | — | | | | — | | |
Turnover of Columbia Marsico Focused
Equities Master Portfolio | | | — | | | | — | | | | — | | | | 82 | %(i) | | | 52 | % | | | 71 | % | |
| Net assets, end of period (000s) | | $ | 1,101,015 | | | $ | 995,452 | | | $ | 874,565 | | | $ | 1,285,252 | | | $ | 1,247,610 | | | $ | 1,022,812 | | |
(a) The per share amounts and percentages reflect income and expenses assuming inclusion of the Fund's proportionate share of the income and expenses of Columbia Marsico Focused Equities Master Portfolio.
(b) The Fund changed its fiscal year end from March 31 to February 29. Per share data and total return reflect activity from April 1, 2007 through February 29, 2008.
(c) Effective February 28, 2008, the Fund converted to a stand-alone fund. Prior to February 28, 2008, the Fund operated in a master-feeder structure.
(d) On August 22, 2005, the Fund's Primary A shares were renamed Class Z shares.
(e) Per share data was calculated using the average shares outstanding during the period.
(f) Rounds to less than $0.01 per share.
(g) Total return at net asset value assuming all distributions reinvested.
(h) Had the Investment Manager and/or any of its affiliates not waived fees or reimbursed a portion of expenses, total return would have been reduced.
(i) Not annualized.
(j) The benefits derived from expense reductions had an impact of less than 0.01%.
(k) Annualized.
(l) Rounds to less than 0.01%.
(m) Bank of America Corporation assumed certain non-recurring costs. Absent these non-recurring costs, the waiver/reimbursement ratio would have been 0.02%.
(n) Amount represents results after the Fund's conversion to a stand-alone structure on February 28, 2008.
See Accompanying Notes to Financial Statements.
20
Notes to Financial Statements – Columbia Marsico Focused Equities Fund
February 28, 2011
Note 1. Organization
Columbia Marsico Focused Equities Fund (the Fund), a series of Columbia Funds Series Trust (the Trust), is a non-diversified fund. The Trust is registered under the Investment Company Act of 1940, as amended (the 1940 Act), as an open-end management investment company organized as a Delaware statutory trust.
After the close of business on April 30, 2010, Ameriprise Financial, Inc. (Ameriprise Financial) acquired a portion of the asset management business of Columbia Management Group, LLC (the Transaction), including the business of managing the Fund. In connection with the closing of the Transaction (the Closing), RiverSource Investments, LLC, a wholly owned subsidiary of Ameriprise Financial, became the investment manager of the Fund and changed its name to Columbia Management Investment Advisers, LLC (the Investment Manager).
Investment Objective
The Fund seeks long-term growth of capital.
Fund Shares
The Trust has unlimited authorized shares of beneficial interest. The Fund offers Class A, Class B, Class C, Class I and Class Z shares. On December 17, 2010, the Investment Manager exchanged Class Z shares valued at $26,069,164 for Class I shares. All share classes have identical voting, dividend and liquidation rights. Each share class has its own expense structure and sales charges, as applicable.
Class A shares are subject to a maximum front-end sales charge of 5.75% based on the investment amount. Class A shares purchased without an initial sales charge in accounts aggregating $1 million to $50 million at the time of purchase are subject to a 1.00% contingent deferred sales charge (CDSC) if the shares are sold within 18 months of purchase, charged as follows: 1.00% CDSC if redeemed within 12 months of purchase, and 0.50% CDSC if redeemed more than 12, but less than 18 months after purchase.
The Fund no longer accepts investments by new or existing investors in the Fund's Class B shares, except in connection with the reinvestment of any dividend and/or capital gain distributions in Class B shares of the Fund and exchanges by existing Class B shareholders of certain other funds within the Columbia Family of Funds. Class B shares may be subject to a maximum CDSC of 5.00% based upon the holding period after purchase. Class B shares will generally convert to Class A shares eight years after purchase.
Class C shares are subject to a 1.00% CDSC on shares redeemed within one year of purchase.
Class I shares are not subject to sales charges and are available only to the Columbia Family of Funds. Class I shares became effective September 27, 2010.
Class Z shares are not subject to sales charges and are available only to certain investors, as described in the Fund's prospectus.
Note 2. Summary of Significant Accounting Policies
The preparation of financial statements in accordance with U.S. generally accepted accounting principles (GAAP) requires the Investment Manager to make certain estimates and assumptions that affect the reported amounts of assets and liabilities, the disclosure of contingent assets and liabilities at the date of the financial statements and the reported amounts of revenue and expenses during the reporting period. Actual results could differ from those estimates.
The following is a summary of significant accounting policies consistently followed by the Fund in the preparation of its financial statements.
Security Valuation
Equity securities are valued at the last sale price on the principal exchange on which they trade, except for securities traded on the NASDAQ, which are valued at the NASDAQ official close price. Unlisted securities or listed securities for which there were no sales during the day are valued at the closing bid price on such exchanges or over-the-counter markets.
Short-term investments maturing in 60 days or less are valued at amortized cost, which approximates market value.
Foreign securities are generally valued at the last sale price on the foreign exchange or market on which they trade. If any foreign share prices are not readily available as a result of limited share activity, the securities are valued at the last sale price of the local shares in the principal market in which such securities are normally traded.
Generally, trading in foreign securities is substantially completed each day at various times prior to the close of the New York Stock Exchange (NYSE). The values of such securities used in computing the net asset value of the Fund's shares are determined as of such times. Foreign currency exchange rates are generally determined at 4:00 p.m. Eastern (U.S.) time. Occasionally, events affecting the values of such foreign securities may occur between the times at
21
Columbia Marsico Focused Equities Fund, February 28, 2011
which they are determined and the close of the customary trading session of the NYSE, which would not be reflected in the computation of the Fund's net asset value. If events materially affecting the values of such foreign securities occur and it is determined that market quotations are not reliable, then these foreign securities will be valued at their fair value using procedures approved by the Board of Trustees.
Investments for which market quotations are not readily available, or that have quotations which the Investment Manager believes are not reliable, are valued at fair value as determined in good faith under consistently applied procedures established by and under the general supervision of the Board of Trustees. If a security is valued at fair value, such value is likely to be different from the last quoted market price for the security. The determination of fair value often requires significant judgment. To determine fair value, the Investment Manager may use assumptions including but not limited to future cash flows and estimated risk premiums. Multiple inputs from various sources may be used to determine value.
Foreign Currency Transactions and Translations
The values of all assets and liabilities quoted in foreign currencies are translated into U.S. dollars at that day's exchange rates. Net realized and unrealized gains (losses) on foreign currency transactions and translations include gains (losses) arising from the fluctuation in exchange rates between trade and settlement dates on securities transactions, gains (losses) arising from the disposition of foreign currency and currency gains (losses) between the accrual and payment dates on dividends, interest income and foreign withholding taxes.
For financial statement purposes, the Fund does not distinguish that portion of gains (losses) on investments which is due to changes in foreign exchange rates from that which is due to changes in market prices of the investments. Such fluctuations are included with the net realized and unrealized gains (losses) on investments on the Statement of Operations.
Repurchase Agreements
The Fund may engage in repurchase agreement transactions with institutions that the Investment Manager has determined are creditworthy. The Fund, through the custodian, receives delivery of the underlying securities collateralizing a repurchase agreement. The Investment Manager is responsible for determining that the collateral is at least equal, at all times, to the value of the repurchase obligation including interest. A repurchase agreement transaction involves certain risks in the event of default or insolvency of the counterparty. These risks include possible delays in or restrictions on the Fund's ability to dispose of the underlying securities and a possible decline in the value of the underlying securities during the period while the Fund seeks to assert its rights.
Security Transactions
Security transactions are accounted for on the trade date. Cost is determined and gains (losses) are based upon the specific identification method for both financial statement and federal income tax purposes.
Income Recognition
Interest income is recorded on the accrual basis.
Awards from class action litigation are recorded as a reduction of cost if the Fund still owns the applicable securities on the payment date. If the Fund no longer owns the applicable securities, the proceeds are recorded as realized gains.
Corporate actions and dividend income are recorded net of any non-reclaimable tax withholdings, on the ex-dividend date or upon receipt of ex-dividend notification in the case of certain foreign securities.
Expenses
General expenses of the Trust are allocated to the Fund and other series of the Trust based upon relative net assets or other expense allocation methodologies determined by the nature of the expense. Expenses directly attributable to a specific class of shares are charged to that share class. Expenses directly attributable to the Fund are charged to the Fund.
Determination of Class Net Asset Value
All income, expenses (other than class-specific expenses which are charged directly to a share class, as shown in the Statement of Operations) and realized and unrealized gains (losses) are allocated to each class of the Fund on a daily basis for purposes of determining the net asset value of each class. Income and expenses are allocated to each class based on the settled shares method, while realized and unrealized gains (losses) are allocated based on the relative net assets of each class.
Federal Income Tax Status
The Fund intends to qualify each year as a regulated investment company under Subchapter M of the Internal Revenue Code, as amended, and will distribute substantially all of its taxable income, if any, for its tax year, and as such will not be subject to federal income
22
Columbia Marsico Focused Equities Fund, February 28, 2011
taxes. In addition, the Fund intends to distribute in each calendar year substantially all of its net investment income, capital gains and certain other amounts, if any, such that the Fund should not be subject to federal excise tax. Therefore, no federal income or excise tax provision is recorded.
Distributions to Shareholders
Distributions from net investment income, if any, are declared and paid semi-annually. Net realized capital gains, if any, are distributed at least annually. Income distributions and capital gain distributions are determined in accordance with federal income tax regulations which differ from GAAP.
Indemnification
In the normal course of business, the Fund enters into contracts that contain a variety of representations and warranties and which provide general indemnities. The Fund's maximum exposure under these arrangements is unknown because this would involve future claims against the Fund. Also, under the Trust's organizational documents and by contract, the Trustees and officers of the Trust are indemnified against certain liabilities that may arise out of actions relating to their duties to the Trust. However, based on experience, the Fund expects the risk of loss due to these representations, warranties and indemnities to be minimal.
Note 3. Fees and Compensation Paid to Affiliates
Investment Management Services Fee
The Investment Manager is responsible for the management of the Fund. Day-to-day portfolio management of the Fund is provided by the Fund's subadviser (see Subadvisory Fee note below). The management fee is based on the Fund's average daily net assets at the following annual rates:
| Average Daily Net Assets | | Annual Fee Rate | |
| First $500 million | | | 0.75 | % | |
| $500 million to $1 billion | | | 0.70 | % | |
| $1 billion to $1.5 billion | | | 0.65 | % | |
| $1.5 billion to $3 billion | | | 0.60 | % | |
| $3 billion to $6 billion | | | 0.58 | % | |
| Over $6 billion | | | 0.56 | % | |
Prior to the Closing, Columbia Management Advisors, LLC (Columbia), an indirect, wholly owned subsidiary of Bank of America Corporation (BOA), provided investment management services to the Fund under the same fee structure.
The effective management fee rate for the year ended February 28, 2011, was 0.65% of the Fund's average daily net assets.
To the extent that the Fund is not benefitting from a separate contractual expense limitation arrangement, the Investment Manager has contractually agreed to waive a portion of its management fees through June 30, 2011.
The waiver amount is calculated based on the difference between the dollar amount of sub-advisory fees that would have been payable to Marsico Capital Management, LLC (Marsico) based on the annualized rate of 0.45% of the Fund's average daily net assets, and the dollar amount of sub-advisory fees calculated on a monthly basis based on the annualized sub-advisory fee rate effective January 1, 2008 in which Marsico is entitled from the Fund which is described under the Sub-Advisory Fee note below. The annualized fee rate of 0.45% represents the sub-advisory fee rate which Marsico was entitled to receive prior to January 1, 2008.
In the absence of a separate contractual expense limitation arrangement, the management fee waiver for the Fund would be calculated as follows:
| Average Daily Net Assets* | | Management
Fee Waiver | |
| Assets up to $18 billion | | | 0.00 | % | |
Assets in excess of $18 billion and
up to $21 billion | | | 0.05 | % | |
| Assets in excess of $21 billion | | | 0.10 | % | |
* For purposes of the calculation, "Assets" are aggregate assets sub-advised by Marsico in the following Columbia Funds: (i) Columbia Marsico Growth Fund; (ii) Columbia Marsico Focused Equities Fund; (iii) Columbia Marsico 21st Century Fund; (iv) Columbia Marsico Growth Fund, Variable Series; (v) Columbia Marsico Focused Equities Fund, Variable Series; (vi) Columbia Marsico 21st Century Fund, Variable Series; and (vii) any future Columbia U.S. equity fund sub-advised by Marsico which the Investment Manager and Marsico mutually agree in writing.
Prior to the Closing, Columbia waived a portion of the Fund's management fees at the same rates.
For the year ended February 28, 2011, no management fees were waived for the Fund.
Subadvisory Fee
Marsico has been retained by the Investment Manager to serve as the investment subadviser to the Fund. As the subadviser, and subject to the oversight of the Investment Manager and the Fund's Board of
23
Columbia Marsico Focused Equities Fund, February 28, 2011
Trustees, Marsico is responsible for the daily investment operations, including placing all orders for the purchase and sale of the portfolio securities for the Fund. The Investment Manager, from the management fee it receives, pays Marsico a monthly subadvisory fee based on the Fund's average daily net assets at the following annual rates:
| Average Daily Net Assets* | | Fee Rate | |
| Assets up to $18 billion | | | 0.45 | % | |
Assets in excess of $18 billion and up to
$21 billion | | | 0.40 | % | |
| Assets in excess of $21 billion | | | 0.35 | % | |
* For purposes of the calculation, assets are aggregate assets sub-advised by Marsico in the following Columbia Funds: (i) Columbia Marsico Growth Fund; (ii) Columbia Marsico Focused Equities Fund; (iii) Columbia Marsico 21st Century Fund; (iv) Columbia Marsico Growth Fund, Variable Series; (v) Columbia Marsico Focused Equities, Variable Series; (vi) Columbia Marsico 21st Century Fund, Variable Series; and (vii) any future Columbia U.S. equity fund sub-advised by Marsico which the Investment Manager and Marsico mutually agree in writing.
Prior to the Closing, Marsico provided subadvisory services to the Fund under the same fee structure in accordance with an agreement with Columbia.
Administration Fee
Effective upon the Closing, the Investment Manager became the administrator of the Fund and provides administrative and other services to the Fund, including services previously performed under the Pricing and Bookkeeping Oversight and Services Agreement discussed below. The administration fee is based on the annual rate of 0.22% of the Fund's average daily net assets, less the fees payable by the Fund as described under the Pricing and Bookkeeping Fees note below. Prior to the Closing, Columbia provided administrative services to the Fund at the same fee rate.
Pricing and Bookkeeping Fees
Prior to the Closing, the Fund entered into a Financial Reporting Services Agreement (the Financial Reporting Services Agreement) with State Street Bank and Trust Company (State Street) and Columbia pursuant to which State Street provides financial reporting services to the Fund. The Fund also entered into an Accounting Services Agreement (collectively with the Financial Reporting Services Agreement, the State Street Agreements) with State Street and Columbia pursuant to which State Street provides accounting services to the Fund. Upon the Closing, Columbia assigned and delegated its rights and obligations under the State Street Agreements to the Investment Manager. Under the State Street Agreements, the Fund pays State Street an annual fee of $38,000 paid monthly plus an additional monthly fee based on an annualized percentage rate of average daily net assets of the Fund for the month. The aggregate fee will not exceed $140,000 per year (exclusive of out-of-pocket expenses and charges). The Fund also reimburses State Street for certain out-of-pocket expenses and charges.
Also prior to the Closing, the Fund entered into a Pricing and Bookkeeping Oversight and Services Agreement (the Services Agreement) with Columbia. Under the Services Agreement, Columbia provided services related to Fund expenses and the requirements of the Sarbanes-Oxley Act of 2002, and provided oversight of the accounting and financial reporting services provided by State Street. Under the Services Agreement, the Fund reimbursed Columbia for out-of-pocket expenses and charges, including fees payable to third parties, such as for pricing the Fund's portfolio securities, incurred by Columbia in the performance of services under the Services Agreement. The Services Agreement was terminated upon the Closing. These services are now provided under the Administration Fee note discussed above.
Transfer Agent Fee
In connection with the Closing, RiverSource Service Corporation, a wholly owned subsidiary of Ameriprise Financial, became the transfer agent of the Fund and changed its name to Columbia Management Investment Services Corp. (the New Transfer Agent). The New Transfer Agent has contracted with Boston Financial Data Services (BFDS) to serve as sub-transfer agent. The New Transfer Agent receives monthly account-based service fees that vary by class and are based on the number of open accounts and asset-based fees, calculated based on assets held in omnibus accounts, which are intended to reimburse the New Transfer Agent for certain sub-transfer agent fees (exclusive of BFDS fees). The New Transfer Agent pays the fees of BFDS for services as sub-transfer agent and is not entitled to reimbursement for such fees from the Fund.
The New Transfer Agent receives reimbursement for certain out-of-pocket expenses and may also receive compensation for various shareholder services.
Prior to the Closing, Columbia Management Services, Inc., an affiliate of Columbia and an indirect, wholly owned subsidiary of
24
Columbia Marsico Focused Equities Fund, February 28, 2011
BOA, provided shareholder services to the Fund and contracted with BFDS to serve as sub-transfer agent, under the same fee structure.
Class I shares do not pay transfer agent fees. For the year ended February 28, 2011, the Fund's effective transfer agent fee rate for each class, with the exception of Class I shares, as a percentage of each class' average daily net assets was as follows:
| Class A | | Class B | | Class C | | Class Z | |
| | 0.16 | % | | | 0.16 | % | | | 0.16 | % | | | 0.16 | % | |
An annual minimum account balance fee of $20 may apply to certain accounts with a value below the Fund's initial minimum investment requirements to reduce the impact of small accounts on transfer agent fees. These minimum account balance fees are recorded as part of expense reductions on the Statement of Operations. For the year ended February 28, 2011, no minimum account balance fees were charged by the Fund.
Underwriting Discounts, Service and Distribution Fees
In connection with the Closing, RiverSource Fund Distributors, Inc., an indirect wholly owned subsidiary of Ameriprise Financial, became the distributor of the Fund and changed its name to Columbia Management Investment Distributors, Inc. (the New Distributor).
For the year ended February 28, 2011, initial sales charges paid by shareholders on the purchase of Class A shares amounted to $30,189 and net CDSC fees paid by shareholders on certain redemptions of Class A, Class B and Class C shares amounted to $485, $52,559 and $10,485, respectively.
The Trust has adopted shareholder servicing plans and distribution plans for the Class B and Class C shares of the Fund and a combined distribution and shareholder servicing plan for the Class A shares of the Fund. The shareholder servicing plans permit the Fund to compensate or reimburse servicing agents for the shareholder services they have provided. The distribution plans, adopted pursuant to Rule 12b-1 under the 1940 Act, permit the Fund to compensate or reimburse the New Distributor and/or selling agents for activities or expenses primarily intended to result in the sale of the classes' shares. Payments are made at an annual rate and paid monthly, as a percentage of average daily net assets, set from time to time by the Board of Trustees, and are charged as expenses of the Fund directly to the applicable share class. A substantial portion of the expenses incurred pursuant to these plans is paid to affiliates of the New Distributor.
The annual rates in effect and plan limits, as a percentage of average daily net assets are as follows:
| | | Current
Rate | | Plan
Limit | |
Class A Combined Distribution and
Shareholder Servicing Plan | | | 0.25 | % | | | 0.25 | % | |
Class B and Class C Shareholder
Servicing Plans | | | 0.25 | % | | | 0.25 | % | |
Class B and Class C
Distribution Plans | | | 0.75 | % | | | 0.75 | % | |
Prior to the Closing, Columbia Management Distributors, Inc, an affiliate of Columbia and an indirect, wholly owned subsidiary of BOA, was the principal underwriter of the Fund's shares. There were no changes to the underwriting discount structure of the Fund or the service or distribution fee rates paid by the Fund as a result of the Transaction.
Expense Limits and Fee Waivers
Effective September 27, 2010, the Investment Manager has voluntarily agreed to reimburse a portion of the Fund's expenses so that the Fund's ordinary operating expenses (excluding brokerage commissions, interest, taxes and extraordinary expenses, but including custodian charges relating to overdrafts, if any), after giving effect to any balance credits from the Fund's custodian, do not exceed the annual rates of 1.45%, 2.20%, 2.20%, 1.08% and 1.20% of the Fund's average daily net assets attributable to Class A, Class B, Class C, Class I and Class Z shares, respectively. This arrangement may be modified or terminated by the Investment Manager at any time.
For the period May 1, 2010 through September 26, 2010, the Investment Manager voluntarily agreed to reimburse a portion of the Fund's expenses so that the Fund's ordinary operating expenses (excluding any distribution and service fees, brokerage commissions, interest, taxes and extraordinary expenses, but including custodian charges relating to overdrafts, if any), after giving effect to any balance credits from the Fund's custodian, did not exceed 1.20% annually of the Fund's average daily net assets. Prior to May 1, 2010, Columbia voluntarily reimbursed a portion of the Fund's expenses in the same manner.
25
Columbia Marsico Focused Equities Fund, February 28, 2011
Fees Paid to Officers and Trustees
Upon the Closing, all officers of the Fund are employees of the Investment Manager or its affiliates and, with the exception of the Fund's Chief Compliance Officer, receive no compensation from the Fund. The Board of Trustees has appointed a Chief Compliance Officer to the Fund in accordance with federal securities regulations. The Fund, along with other affiliated funds, pays its pro-rata share of the expenses associated with the Chief Compliance Officer. The Fund's expenses for the Chief Compliance Officer will not exceed $15,000 per year. Prior to the Closing, all officers of the Fund were employees of Columbia or its affiliates and the Fund paid its pro-rata share of the expenses for the Chief Compliance Officer under the same fee structure.
Trustees are compensated for their services to the Fund, as set forth on the Statement of Operations. The Trust's eligible Trustees may participate in a non-qualified deferred compensation plan which may be terminated at any time. Any payments to plan participants are paid solely out of the Fund's assets. Income earned on the plan participant's deferral account is based on the rate of return of the eligible mutual funds selected by the participant or, if no funds are selected, on the rate of return of Columbia Money Market Fund (formerly known as RiverSource Cash Management Fund). Prior to the Closing, if no funds were selected, income earned on the plan participant's deferral account was based on the rate of return of BofA Treasury Reserves. Trustees' fees deferred during the current period as well as any gains or losses on the trustees' deferred compensation balances as a result of market fluctuations are included in "Trustees' fees" on the Statement of Operations. Liabilities under the deferred compensation plan are included in "Trustees' fees" on the Statement of Assets and Liabilities.
Other Related Party Transactions
Prior to the Closing, the Fund used one or more brokers that were affiliates of BOA in connection with the purchase and sale of its securities. Total brokerage commissions paid to affiliated brokers for the period prior to the Closing were $27,871.
Note 4. Custody Credits
The Fund has an agreement with its custodian bank under which custody fees may be reduced by balance credits. These credits are recorded as part of expense reductions on the Statement of Operations. The Fund could have invested a portion of the assets utilized in connection with the expense offset arrangement in an income-producing asset if it had not entered into such an agreement. For the year ended February 28, 2011, these custody credits reduced total expenses by $4 for the Fund.
Note 5. Portfolio Information
The cost of purchases and proceeds from sales of securities, excluding short-term obligations, aggregated $2,110,757,081 and $2,972,174,567, respectively, for the year ended February 28, 2011.
Note 6. Regulatory Settlements
During the year ended February 28, 2010, the Fund received payments totaling $51,132 resulting from certain regulatory settlements with third parties in which the Fund had participated. The payments have been included in "Increase from regulatory settlements" in the Statement of Changes in Net Assets.
Note 7. Shareholder Concentration
As of February 28, 2011, one shareholder account owned 18.6% of the outstanding shares of the Fund. Purchase and redemption activity of this account may have a significant effect on the operations of the Fund.
Note 8. Line of Credit
The Fund and other affiliated funds participate in a $280,000,000 committed, unsecured revolving line of credit provided by State Street. The maximum amount that may be borrowed by any fund is limited to the lesser of $200,000,000 and the Fund's borrowing limit set forth in the Fund's registration statement. Borrowings are available for short-term liquidity or temporary or emergency purposes.
Effective October 14, 2010, interest is charged to each participating fund based on the fund's borrowings at a rate per annum equal to the greater of the Federal Funds Rate plus 1.25% or the overnight LIBOR Rate plus 1.25%. In addition, a commitment fee of 0.125% per annum is accrued and apportioned among the participating funds pro rata based on their relative net assets.
Prior to October 14, 2010, interest was charged to each participating fund at the same rates. In addition, a commitment fee of 0.15% per annum was accrued and apportioned among the participating funds pro rata based on their relative net assets.
For the year ended February 28, 2011, the average daily loan balance outstanding on days where borrowing existed was $2,262,500 at a weighted average interest rate of 1.51%.
26
Columbia Marsico Focused Equities Fund, February 28, 2011
Note 9. Federal Tax Information
The timing and character of income and capital gain distributions are determined in accordance with income tax regulations, which may differ from GAAP. Reclassifications are made to the Fund's capital accounts for permanent tax differences to reflect income and gains available for distribution (or available capital loss carryforwards) under income tax regulations.
For the year ended February 28, 2011, permanent book and tax basis differences resulting primarily from differing treatments for foreign currency transactions and excess distributions were identified and reclassified among the components of the Fund's net assets as follows:
Undistributed
Net Investment
Income | | Accumulated
Net Realized
Loss | | Paid-In Capital | |
| $ | 1,346,450 | | | $ | 1,185 | | | $ | (1,347,635 | ) | |
Net investment income and net realized gains (losses), as disclosed on the Statement of Operations, and net assets were not affected by this reclassification.
The tax character of distributions paid during the years ended February 28, 2011 and February 28, 2010 was as follows:
| | | February 28, | |
| Distributions paid from: | | 2011 | | 2010 | |
| Ordinary Income* | | $ | 1,798,129 | | | $ | 4,596,852 | | |
| Return of Capital | | | — | | | | 2,593,625 | | |
* For tax purposes short-term capital gain distributions, if any, are considered ordinary income distributions.
As of February 28, 2011, the components of distributable earnings on a tax basis were as follows:
Undistributed
Ordinary
Income | | Undistributed
Long-Term
Capital Gains | | Net Unrealized
Appreciation* | |
| $ | — | | | $ | — | | | $ | 777,509,783 | | |
* The differences between book-basis and tax-basis net unrealized appreciation are primarily due to deferral of losses from wash sales.
Unrealized appreciation and depreciation at February 28, 2011, based on cost of investments for federal income tax purposes were:
| Unrealized appreciation | | $ | 785,665,352 | | |
| Unrealized depreciation | | | (8,155,569 | ) | |
| Net unrealized appreciation | | $ | 777,509,783 | | |
The following capital loss carryforwards may be available to reduce taxable income arising from future net realized gains on investments, if any, to the extent permitted by the Internal Revenue Code:
| Year of Expiration | | Capital Loss
Carryforwards | |
| 2018 | | $ | 118,149,360 | | |
Capital loss carryforwards of $320,241,953 were utilized during the year ended February 28, 2011.
Management is required to determine whether a tax position of the Fund is more likely than not to be sustained upon examination by the applicable taxing authority, including resolution of any related appeals or litigation processes, based on the technical merits of the position. The tax benefit to be recognized by the Fund is measured as the largest amount of benefit that is greater than fifty percent likely of being realized upon ultimate settlement. Management is not aware of any tax positions for which it is reasonably possible that the total amounts of unrecognized tax benefits will significantly change in the next twelve months. However, management's conclusions may be subject to review and adjustment at a later date based on factors including, but not limited to, new tax laws, regulations, and administrative interpretations (including relevant court decisions). The Fund's federal tax returns for the prior three fiscal years remain subject to examination by the Internal Revenue Service.
Note 10. Significant Risks and Contingencies
Non-Diversification Risk
The Fund is a non-diversified fund, which generally means that it may invest a greater percentage of its total assets in the securities of fewer issuers than a diversified fund. This increases the risk that a change in the value of any one investment held by the Fund could affect the overall value of the Fund more than it would affect that of
27
Columbia Marsico Focused Equities Fund, February 28, 2011
a diversified fund holding a greater number of investments. Accordingly, the Fund's value will likely be more volatile than the value of more diversified funds. The Fund may not operate as non-diversified fund at all times.
Foreign Securities Risk
Investing in foreign securities may include certain risks and considerations not typically associated with investing in U.S. securities, such as fluctuating currency values and changing local and regional economic, political and social conditions, which may result in greater market volatility. In addition, certain foreign securities may not be as liquid as U.S. securities. Investing in emerging markets may accentuate these risks.
Investments in emerging market countries are subject to additional risk. The risk of foreign investments is typically increased in less developed countries. These countries are also more likely to experience high levels of inflation, deflation or currency devaluation which could hurt their economies and securities markets.
Note 11. Subsequent Events
Management has evaluated the events and transactions that have occurred through the date the financial statements were issued and noted no items requiring adjustment of the financial statements or additional disclosure.
Note 12. Information Regarding Pending and Settled Legal Proceedings
In June 2004, an action captioned John E. Gallus et al. v. American Express Financial Corp. and American Express Financial Advisors Inc. was filed in the United States District Court for the District of Arizona. The plaintiffs allege that they are investors in several American Express Company (now known as RiverSource) mutual funds and they purport to bring the action derivatively on behalf of those funds under the Investment Company Act of 1940. The plaintiffs allege that fees allegedly paid to the defendants by the funds for investment advisory and administrative services are excessive. The plaintiffs seek remedies including restitution and rescission of investment advisory and distribution agreements. The plaintiffs voluntarily agreed to transfer this case to the United States District Court for the District of Minnesota (the District Court). In response to defendants' motion to dismiss the complaint, the District Court dismissed one of plaintiffs' four claims and granted plaintiffs limited discovery. Defendants moved for summary judgment in April 2007. Summary judgment was granted in the defendants' favor on July 9, 2007. The plaintiffs filed a notice of appeal with the Eighth Circuit Court of Appeals (the Eighth Circuit) on August 8, 2007. On April 8, 2009, the Eighth Circuit reversed summary judgment and remanded to the District Court for further proceedings. On August 6, 2009, defendants filed a writ of certiorari with the U.S. Supreme Court (the Supreme Court), asking the Supreme Court to stay the District Court proceedings while the Supreme Court considers and rules in a case captioned Jones v. Harris Associates, which involves issues of law similar to those presented in the Gallus case. On March 30, 2010, the Supreme Court issued its ruling in Jones v. Harris Associates, and on April 5, 2010, the Supreme Court vacated the Eighth Circuit's decision in the Gallus case and remanded the case to the Eighth Circuit for further consideration in light of the Supreme Court's decision in Jones v. Harris Associates. On June 4, 2010, the Eighth Circuit remanded the Gallus case to the District Court for further consideration in light of the Supreme Court's decision in Jones v. Harris Associates. On December 9, 2010, the District Court reinstated its July 9, 2007 summary judgment order in favor of the defendants. On January 10, 2011, plaintiffs filed a notice of appeal with the Eighth Circuit.
In December 2005, without admitting or denying the allegations, American Express Financial Corporation (AEFC, which is now known as Ameriprise Financial, Inc. (Ameriprise Financial)), entered into settlement agreements with the Securities and Exchange Commission (SEC) and Minnesota Department of Commerce (MDOC) related to market timing activities. As a result, AEFC was censured and ordered to cease and desist from committing or causing any violations of certain provisions of the Investment Advisers Act of 1940, the Investment Company Act of 1940, and various Minnesota laws. AEFC agreed to pay disgorgement of $10 million and civil money penalties of $7 million. AEFC also agreed to retain an independent distribution consultant to assist in developing a plan for distribution of all disgorgement and civil penalties ordered by the SEC in accordance with various undertakings detailed at http://www.sec.gov/litigation/admin/ia-2451.pdf. Ameriprise Financial and its affiliates have cooperated with the SEC and the MDOC in these legal proceedings, and have made regular reports to the funds' Boards of Directors/Trustees.
Ameriprise Financial and certain of its affiliates have historically been involved in a number of legal, arbitration and regulatory proceedings, including routine litigation, class actions, and governmental actions, concerning matters arising in connection with the conduct of their business activities. Ameriprise Financial believes that the Funds are not currently the subject of, and that neither
28
Columbia Marsico Focused Equities Fund, February 28, 2011
Ameriprise Financial nor any of its affiliates are the subject of, any pending legal, arbitration or regulatory proceedings that are likely to have a material adverse effect on the Funds or the ability of Ameriprise Financial or its affiliates to perform under their contracts with the Funds. Ameriprise Financial is required to make 10-Q, 10-K and, as necessary, 8-K filings with the Securities and Exchange Commission on legal and regulatory matters that relate to Ameriprise Financial and its affiliates. Copies of these filings may be obtained by accessing the SEC website at www.sec.gov.
There can be no assurance that these matters, or the adverse publicity associated with them, will not result in increased fund redemptions, reduced sale of fund shares or other adverse consequences to the Funds. Further, although we believe proceedings are not likely to have a material adverse effect on the Funds or the ability of Ameriprise Financial or its affiliates to perform under their contracts with the Funds, these proceedings are subject to uncertainties and, as such, we are unable to estimate the possible loss or range of loss that may result. An adverse outcome in one or more of these proceedings could result in adverse judgments, settlements, fines, penalties or other relief that could have a material adverse effect on the consolidated financial condition or results of operations of Ameriprise Financial.
29
Report of Independent Registered Public Accounting Firm
To the Trustees of Columbia Funds Series Trust and the Shareholders of Columbia Marsico Focused Equities Fund
In our opinion, the accompanying statement of assets and liabilities, including the investment portfolio, and the related statements of operations and of changes in net assets and the financial highlights present fairly, in all material respects, the financial position of Columbia Marsico Focused Equities Fund (the "Fund") (a series of Columbia Funds Series Trust) at February 28, 2011, and the results of its operations, the changes in its net assets, and the financial highlights for each of the periods indicated, in conformity with accounting principles generally accepted in the United States of America. These financial statements and financial highlights (hereafter referred to as "financial statements") are the responsibility of the Fund's management. Our responsibility is to express an opinion on these financial statements based on our audits. We conducted our audits of these financial statements in accordance with the standards of the Public Company Accounting Oversight Board (United States). Those standards require that we plan and perform the audit to obtain reasonable assurance about whether the financial statements are free of material misstatement. An audit includes examining, on a test basis, evidence supporting the amounts and disclosures in the financial statements, assessing the accounting principles used and significant estimates made by management, and evaluating the overall financial statement presentation. We believe that our audits, which included confirmation of securities at February 28, 2011 by correspondence with the custodian and brokers, provide a reasonable basis for our opinion.
PricewaterhouseCoopers LLP
Boston, Massachusetts
April 21, 2011
30
Federal Income Tax Information (Unaudited) – Columbia Marsico Focused Equities Fund
For non-corporate shareholders, 25.05% or the maximum amount allowable under the Jobs and Growth Tax Relief Reconciliation Act of 2003, of the ordinary income distributed by the Fund for the fiscal year ended February 28, 2011 may represent qualified dividend income.
25.05% of the ordinary income distributed by the Fund for the fiscal year ended February 28, 2011, qualifies for the corporate dividends received deduction.
The Fund will notify shareholders in January 2012 of amounts for use in preparing 2011 income tax returns.
31
Fund Governance
The Trustees serve terms of indefinite duration. The names, addresses and birth years of the Trustees and Officers of the Funds in the Columbia Funds Series Trust, the year each was first elected or appointed to office, their principal business occupations during at least the last five years, the number of Funds overseen by each Trustee and other directorships they hold are shown below. Each officer listed below serves as an officer of each Fund in the Columbia Funds Series Trust.
Independent Trustees
Name, Address and Year of Birth,
Position with Funds, Year First
Elected or Appointed to Office | | Principal Occupation(s) During Past Five Years, Number of Funds in the Columbia
Funds Complex Overseen by Trustee, Other Directorships Held
| |
| Edward J. Boudreau, Jr. (Born 1944) | |
|
c/o Columbia Management
Investment Advisers, LLC
225 Franklin Street
Boston, MA 02110
Trustee (since 2005) | | Managing Director—E.J. Boudreau & Associates (consulting), from 2000 through current; oversees 44; Trustee—BofA Funds Series Trust. | |
|
| William P. Carmichael (Born 1943) | |
|
c/o Columbia Management
Investment Advisers, LLC
225 Franklin Street
Boston, MA 02110
Trustee (since 1999) | | Retired; Oversees 44; Director—Cobra Electronics Corporation (electronic equipment manufacturer); Director—McMoRan Exploration Company (oil and gas exploration and development); Director—The Finish Line (athletic shoes and apparel); Trustee—BofA Funds Series Trust; Former Director—Simmons Company (bedding). | |
|
| William A. Hawkins (Born 1942) | |
|
c/o Columbia Management
Investment Advisers, LLC
225 Franklin Street
Boston, MA 02110
Trustee (since 2005) | | Managing Director—Overton Partners (financial consulting), August 2010 to present; President and Chief Executive Officer—California General Bank, N.A., from January 2008 through August 2010; oversees 44; Trustee—BofA Funds Series Trust. | |
|
| R. Glenn Hilliard (Born 1943) | |
|
c/o Columbia Management
Investment Advisers, LLC
225 Franklin Street
Boston, MA 02110
Trustee (since 2005) | | Chairman and Chief Executive Officer—Hilliard Group LLC (investing and consulting), from April 2003 through current; Non-Executive Director & Chairman—CNO Financial, Inc. (formerly Conseco, Inc.) (insurance), September 2003 through current; Executive Chairman—Conseco, Inc. (insurance), August 2004 through September 2005; oversees 44; Trustee—BofA Funds Series Trust. | |
|
| John J. Nagorniak (Born 1944) | |
|
c/o Columbia Management
Investment Advisers, LLC
225 Franklin Street
Boston, MA 02110
Trustee (since 2008) | | Retired; President and Director—Foxstone Financial, Inc. (consulting), 2000 through December 2007; Director—Mellon Financial Corporation affiliates (investing), 2000 through 2007; Chairman—Franklin Portfolio Associates (investing—Mellon affiliate), 1982 through 2007; oversees 44; Director—MIT Investment Company; Trustee—MIT 401k Plan. | |
|
32
Fund Governance (continued)
Independent Trustees (continued)
Name, Address and Year of Birth,
Position with Funds, Year First
Elected or Appointed to Office | | Principal Occupation(s) During Past Five Years, Number of Funds in the Columbia
Funds Complex Overseen by Trustee, Other Directorships Held
| |
| Minor M. Shaw (Born 1947) | |
|
c/o Columbia Management
Investment Advisers, LLC
225 Franklin Street
Boston, MA 02110
Trustee (since 2003) | | President—Micco Corporation and Mickel Investment Group; oversees 44; Board Member—Piedmont Natural Gas; Trustee—BofA Funds Series Trust. | |
|
Interested Trustee
| Anthony M. Santomero1 (Born 1946) | |
|
c/o Columbia Management
Investment Advisers, LLC
225 Franklin Street
Boston, MA 02110
Trustee (since 2008) | | Richard K. Mellon Professor Emeritus of Finance, The Wharton School, University of Pennsylvania, from 2002 through current; Senior Advisor—McKinsey & Company (consulting), July 2006 through January 2008; President and Chief Executive Officer—Federal Reserve Bank of Philadelphia, July 2000 through April 2006; oversees 44; Director—Renaissance Reinsurance Ltd; Trustee—Penn Mutual Life Insurance Company; Director—Citigroup, Inc.; Citibank, N.A.; Trustee—BofA Funds Series Trust. | |
|
1 Dr. Santomero is currently deemed by the Columbia Funds to be an "interested person" (as defined in the 1940 Act) of the Funds because he serves as a Director of Citigroup, Inc. and Citibank N.A., companies that may directly or through subsidiaries and affiliates engage from time-to-time in brokerage execution, principal transactions and lending relationships with the Columbia Funds or other funds or accounts advised/managed by the Adviser.
The Statement of Additional Information includes additional information about the Trustees of the Funds and is available, without charge, upon request by calling 800-345-6611.
Officers
| Name, Year of Birth and Address | | Principal Occupation(s) During the Past Five Years | |
| J. Kevin Connaughton (Born 1964) | |
|
225 Franklin Street
Boston, MA 02110
President (since 2009) | | Senior Vice President and General Manager—Mutual Fund Products, Columbia Management Investment Advisers, LLC since May 2010; President, Columbia Funds, since 2009, and RiverSource Funds, since May 2010 (previously Senior Vice President and Chief Financial Officer, Columbia Funds, from June 2008 to January 2009, Treasurer, Columbia Funds, from October 2003 to May 2008, and senior officer of various other affiliated funds since 2000); Managing Director, Columbia Management Advisors, LLC from December 2004 to April 2010. | |
|
| Michael G. Clarke (Born 1969) | |
|
225 Franklin Street
Boston, MA 02110
Senior Vice President and
Chief Financial Officer (since 2009) | | Vice President, Columbia Management Investment Advisers, LLC since May 2010; Managing Director of Fund Administration, Columbia Management Advisors, LLC, from September 2004 to April 2010; senior officer of Columbia Funds and affiliated funds since 2002. | |
|
33
Fund Governance (continued)
Officers (continued)
| Name, Year of Birth and Address | | Principal Occupation(s) During the Past Five Years | |
| Scott R. Plummer (Born 1959) | |
|
5228 Ameriprise Financial Center
Minneapolis, MN 55474
Senior Vice President, Secretary and Chief Legal Officer (since 2010) | | Chief Legal Officer and Assistant Secretary, Columbia Management Investment Advisers, LLC since June 2005; Vice President and Lead Chief Counsel—Asset Management, Ameriprise Financial, Inc. since May 2010 (previously Vice President and Chief Counsel—Asset Management, from 2005 to April 2010, and Vice President—Asset Management Compliance from 2004 to 2005); Vice President, Chief Counsel and Assistant Secretary, Columbia Management Investment Distributors, Inc. since 2008; Vice President, General Counsel and Secretary, Ameriprise Certificate Company since 2005; Chief Counsel, RiverSource Distributors, Inc. since 2006; Vice President, General Counsel and Secretary, RiverSource Funds, since December 2006; Senior Vice President, Secretary and Chief Legal Officer, Columbia Funds, since May 2010. | |
|
| Linda J. Wondrack (Born 1964) | |
|
225 Franklin Street
Boston, MA 02110
Senior Vice President and
Chief Compliance Officer (since 2007) | | Vice President and Chief Compliance Officer, Columbia Management Investment Advisers, LLC since May 2010; Chief Compliance Officer, Columbia Funds, since 2007, and RiverSource Funds, since May 2010; Director (Columbia Management Group, LLC and Investment Product Group Compliance), Bank of America, from June 2005 to April 2010. | |
|
| William F. Truscott (Born 1960) | |
|
53600 Ameriprise Financial Center
Minneapolis, MN 55474
Senior Vice President (since 2010) | | Chairman of the Board, Columbia Management Investment Advisers, LLC since May 2010 (previously President, Chairman of the Board and Chief Investment Officer, from 2001 to April 2010); Chief Executive Officer, U.S. Asset Management & President, Annuities, Ameriprise Financial, Inc. since May 2010 (previously President—U.S. Asset Management and Chief Investment Officer from 2005 to April 2010, and Senior Vice President—Chief Investment Officer, from 2001 to 2005); Director, President and Chief Executive Officer, Ameriprise Certificate Company since 2006; Director, Columbia Management Investment Distributors, Inc. since May 2010 (previously Chairman of the Board and Chief Executive Officer from 2008 to April 2010); Chairman of the Board and Chief Executive Officer, RiverSource Distributors, Inc. since 2006. | |
|
| Colin Moore (Born 1958) | |
|
225 Franklin Street
Boston, MA 02110
Senior Vice President (since 2010) | | Director and Chief Investment Officer, Columbia Management Investment Advisers, LLC since May 2010; Manager, Managing Director and Chief Investment Officer of Columbia Management Advisors, LLC from 2007 to April 2010; Head of Equities, Columbia Management Advisors, LLC from 2002 to 2007. | |
|
| Michael A. Jones (Born 1959) | |
|
225 Franklin Street
Boston, MA 02110
Senior Vice President (since 2010) | | President and Director, Columbia Management Investment Advisers, LLC since May 2010; President and Director, Columbia Management Investment Distributors, Inc. since May 2010; Manager, Chairman, Chief Executive Officer and President, Columbia Management Advisors, LLC from 2007 to April 2010; Chief Executive Officer, President and Director, Columbia Management Distributors, Inc. from November 2006 to April 2010; previously, co-president and senior managing director at Robeco Investment Management. | |
|
34
Fund Governance (continued)
Officers (continued)
| Name, Year of Birth and Address | | Principal Occupation(s) During the Past Five Years | |
| Amy Johnson (Born 1965) | |
|
5228 Ameriprise Financial Center
Minneapolis, MN 55474
Senior Vice President (since 2010) | | Senior Vice President and Chief Operating Officer, Columbia Management Investment Advisers, LLC since May 2010 (previously Chief Administrative Officer, from 2009 until April 2010, Vice President—Asset Management and Trust Company Services, from 2006 to 2009, and Vice President—Operations and Compliance from 2004 to 2006). | |
|
| Joseph F. DiMaria (Born 1968) | |
|
225 Franklin Street
Boston, MA 02110
Treasurer (since 2010) and
Chief Accounting Officer (since 2008) | | Vice President, Mutual Fund Administration, Columbia Management Investment Advisers, LLC, since May 2010; Director of Fund Administration, Columbia Management Advisors, LLC from January 2006 to April 2010; Head of Tax/Compliance and Assistant Treasurer, Columbia Management Advisors, LLC, from November 2004 to December 2005. | |
|
| Marybeth Pilat (Born 1968) | |
|
225 Franklin Street
Boston, MA 02110
Deputy Treasurer (since 2010) | | Vice President, Mutual Fund Administration, Columbia Management Investment Advisers, LLC, since May 2010; Vice President, Investment Operations, Bank of America, from October 2008 to April 2010; Finance Manager, Boston Children's Hospital from August 2008 to October 2008; Director, Mutual Fund Administration, Columbia Management Advisors, LLC, from May 2007 to July 2008; Vice President, Mutual Fund Valuation, Columbia Management Advisors, LLC, from January 2006 to May 2007; Vice President, Mutual Fund Accounting Oversight, Columbia Management Advisors, LLC from January 2005 to January 2006. | |
|
| Julian Quero (Born 1967) | |
|
225 Franklin Street
Boston, MA 02110
Deputy Treasurer (since 2008) | | Vice President, Mutual Fund Administration, Columbia Management Investment Advisers, LLC since May 2010; Director of Fund Administration, Columbia Management Advisors, LLC, from August 2008 to April 2010; Senior Tax Manager, Columbia Management Advisors, LLC from August 2006 to July 2008; Senior Compliance Manager, Columbia Management Advisors, LLC from April 2002 to August 2006. | |
|
| Stephen T. Welsh (Born 1957) | |
|
225 Franklin Street
Boston, MA 02110
Vice President (since 2006) | | President and Director, Columbia Management Investment Services Corp. since May 2010; President and Director, Columbia Management Services, Inc. from July 2004 to April 2010; Managing Director, Columbia Management Distributors, Inc. from August 2007 to April 2010. | |
|
35
Shareholder Meeting Results
At a Joint Special Meeting of Shareholders held on February 15, 2011, shareholders of the series of Columbia Funds Series Trust, including the Fund, elected each of the nominees for trustees to the Board of Trustees of Columbia Funds Series Trust, each to hold office for an indefinite term, as follows:
| Trustee | | Votes For | | Votes Withheld | | Abstentions | |
| Kathleen Blatz | | | 2,145,636,122 | | | | 248,012,438 | | | | 0 | | |
| Edward J. Boudreau, Jr. | | | 2,145,430,114 | | | | 248,218,446 | | | | 0 | | |
| Pamela G. Carlton | | | 2,145,515,949 | | | | 248,132,612 | | | | 0 | | |
| William P. Carmichael | | | 2,145,038,695 | | | | 248,609,866 | | | | 0 | | |
| Patricia M. Flynn | | | 2,145,843,563 | | | | 247,804,997 | | | | 0 | | |
| William A. Hawkins | | | 2,145,359,401 | | | | 248,289,160 | | | | 0 | | |
| R. Glenn Hilliard | | | 2,145,079,400 | | | | 248,569,161 | | | | 0 | | |
| Stephen R. Lewis, Jr. | | | 2,145,092,209 | | | | 248,556,351 | | | | 0 | | |
| John F. Maher | | | 2,145,621,338 | | | | 248,027,223 | | | | 0 | | |
| John J. Nagorniak | | | 2,145,337,494 | | | | 248,311,067 | | | | 0 | | |
| Catherine James Paglia | | | 2,145,615,254 | | | | 248,033,306 | | | | 0 | | |
| Leroy C. Richie | | | 2,145,042,120 | | | | 248,606,441 | | | | 0 | | |
| Anthony M. Santomero | | | 2,145,088,174 | | | | 248,560,386 | | | | 0 | | |
| Minor M. Shaw | | | 2,145,430,762 | | | | 248,217,798 | | | | 0 | | |
| Alison Taunton-Rigby | | | 2,145,393,384 | | | | 248,255,177 | | | | 0 | | |
| William F. Truscott | | | 2,144,907,223 | | | | 248,741,338 | | | | 0 | | |
36
Important Information About This Report
The fund mails one shareholder report to each shareholder address. If you would like more than one report, please call shareholder services at 1-800-345-6611 and additional reports will be sent to you. This report has been prepared for shareholders of Columbia Marsico Focused Equities Fund.
A description of the policies and procedures that the fund uses to determine how to vote proxies and a copy of the fund's voting records are available (i) at www.columbiamanagement.com, (ii) on the Securities and Exchange Commission's website at www.sec.gov, and (iii) without charge, upon request, by calling 1-800-368-0346. Information regarding how the fund voted proxies relating to portfolio securities during the 12-month period ended June 30 is available from the SEC's website. Information regarding how the fund voted proxies relating to portfolio securities is also available from the fund's website, www.columbiamanagement.com.
The fund files a complete schedule of portfolio holdings with the SEC for the first and third quarters of each fiscal year on Form N-Q. The fund's Form N-Q is available on the SEC's website at www.sec.gov and may be reviewed and copied at the SEC's Public Reference Room in Washington, D.C. Information on the operation of the Public Reference Room may be obtained by calling 1-800-SEC-0330.
Transfer Agent
Columbia Management Investment
Services Corp.
P.O. Box 8081
Boston, MA 02266-8081
1-800-345-6611
Distributor
Columbia Management Investment
Distributors, Inc.
225 Franklin Street
Boston, MA 02110
Investment Manager
Columbia Management Investment Advisers, LLC
225 Franklin Street
Boston, MA 02110
37

PRSRT STD
U.S. Postage
PAID
Holliston, MA
Permit NO. 20
Columbia Marsico Focused Equities Fund
P. O. Box 8081
Boston, MA 02266-8081
columbiamanagement.com
This information is for use with concurrent or prior delivery of a fund prospectus. Investors should consider the investment objectives, risks, charges and expenses of a mutual fund carefully before investing. For a free prospectus, which contains this and other important information about the funds, visit columbiamanagement.com. Read the prospectus carefully before investing. The Fund is distributed by Columbia Management Investment Distributors, Inc., member FINRA, and managed by Columbia Management Investment Advisers, LLC.
© 2011 Columbia Management Investment Advisers, LLC. All rights reserved.
C-1241 A (04/11)

Columbia Global Value Fund
Annual Report for the Period Ended February 28, 2011
Not FDIC insured • No bank guarantee • May lose value
Table of Contents
| Fund Profile | | | 1 | | |
|
| Economic Update | | | 2 | | |
|
| Performance Information | | | 4 | | |
|
| Understanding Your Expenses | | | 5 | | |
|
| Portfolio Managers' Report | | | 6 | | |
|
| Investment Portfolio | | | 8 | | |
|
Statement of Assets and
Liabilities | | | 11 | | |
|
| Statement of Operations | | | 13 | | |
|
Statement of Changes in
Net Assets | | | 14 | | |
|
| Financial Highlights | | | 16 | | |
|
| Notes to Financial Statements | | | 20 | | |
|
Report of Independent Registered
Public Accounting Firm | | | 29 | | |
|
| Federal Income Tax Information | | | 30 | | |
|
| Fund Governance | | | 31 | | |
|
| Shareholder Meeting Results | | | 35 | | |
|
Important Information About
This Report | | | 37 | | |
|
The views expressed in this report reflect the current views of the respective parties. These views are not guarantees of future performance and involve certain risks, uncertainties and assumptions that are difficult to predict, so actual outcomes and results may differ significantly from the views expressed. These views are subject to change at any time based upon economic, market or other conditions and the respective parties disclaim any responsibility to update such views. These views may not be relied on as investment advice and, because investment decisions for a Columbia Fund are based on numerous factors, may not be relied on as an indication of trading intent on behalf of any particular Columbia Fund. References to specific securities should not be construed as a recommendation or investment advice.
President's Message

Dear Shareholder:
The Columbia Management story began over 100 years ago, and today, we are one of the nation's largest dedicated asset managers. The recent acquisition by Ameriprise Financial, Inc. brings together the talents, resources and capabilities of Columbia Management with those of RiverSource Investments, Threadneedle (acquired by Ameriprise in 2003) and Seligman Investments (acquired by Ameriprise in 2008) to build a best-in-class asset management business that we believe is truly greater than its parts.
RiverSource Investments traces its roots to 1894 when its then newly-founded predecessor, Investors Syndicate, offered a face-amount savings certificate that gave small investors the opportunity to build a safe and secure fund for retirement, education or other special needs. A mutual fund pioneer, Investors Syndicate launched Investors Mutual Fund in 1940. In the decades that followed, its mutual fund products and services lineup grew to include a full spectrum of styles and specialties. More than 110 years later, RiverSource continues to be a trusted financial products leader.
Threadneedle, a leader in global asset management and one of Europe's largest asset managers, offers sophisticated international experience from a dedicated U.K. management team. Headquartered in London, it is named for Threadneedle Street in the heart of the city's financial district, where British investors pioneered international and global investing. Threadneedle was acquired in 2003 and today operates as an affiliate of Columbia Management.
Seligman Investments' beginnings date back to the establishment of the investment firm J. & W. Seligman & Co. in 1864. In the years that followed, Seligman played a major role in the geographical expansion and industrial development of the United States. In 1874, President Ulysses S. Grant named Seligman as fiscal agent for the U.S. Navy—an appointment that would last through World War I. Seligman helped finance the westward path of the railroads and the building of the Panama Canal. The firm organized its first investment company in 1929 and began managing its first mutual fund in 1930. In 2008, J. & W. Seligman & Co. Incorporated was acquired and Seligman Investments became an offering brand of RiverSource Investments, LLC.
We are proud of the rich and distinctive history of these firms, the strength and breadth of products and services they offer, and the combined cultures of pioneering spirit and forward thinking. Together we are committed to providing more for our shareholders than ever before.
> A singular focus on our shareholders
Our business is asset management, so investors are our first priority. We dedicate our resources to identifying timely investment opportunities and provide a comprehensive choice of equity, fixed-income and alternative investments to help meet your individual needs.
> First-class research and thought leadership
We are dedicated to helping you take advantage of today's opportunities and anticipate tomorrow's. We stay abreast of the latest investment trends and ideas, using our collective insight to evaluate events and transform them into solutions you can use.
> A disciplined investment approach
We aren't distracted by passing fads. Our teams adhere to a rigorous investment process that helps ensure the integrity of our products and enables you and your financial advisor to match our solutions to your objectives with confidence.
When you choose Columbia Management, you can be confident that we will take the time to understand your needs and help you and your financial advisor identify the solutions that are right for you. Because at Columbia Management, we don't consider ourselves successful unless you are.
Sincerely,

J. Kevin Connaughton
President, Columbia Funds
Investors should consider the investment objectives, risks, charges and expenses of a mutual fund carefully before investing. For a free prospectus, which contains this and other important information about the funds, visit www.columbiamanagement.com. The prospectus should be read carefully before investing.
Columbia Funds are distributed by Columbia Management Investment Distributors, Inc., member FINRA, and managed by Columbia Management Investment Advisers, LLC.
© 2011 Columbia Management Investment Advisers, LLC. All rights reserved.
Fund Profile – Columbia Global Value Fund
Summary
g For the 12-month period that ended February 28, 2011, the fund's Class A shares returned 17.30% without sales charge. The MSCI World Index (Net)1 returned 21.67% for the same period.
g The fund underperformed its benchmark, the MSCI World Index (Net).
g Stock selection and an overweight in the food & staples retailing industry relative to the MSCI World Index contributed to the shortfall relative to the index, as did an overweight in pharmaceutical stocks.
Portfolio Management
Columbia Funds are managed by Columbia Management Investment Advisers, LLC (CMIA). CMIA has retained Brandes Investment Partners, L.P. (Brandes) to serve as investment subadviser. As an investment subadviser, Brandes makes the investment decisions and manages all or a portion of the Fund. Brandes is an investment adviser registered with the Securities and Exchange Commission. Brandes is not affiliated with CMIA.
The following are the six voting members of Brandes' Large Cap Investment Committee who are jointly responsible for making day-to-day investment decisions for the Fund: Glenn Carlson, Brent Woods, Amelia Morris, Jim Brown, Brent Fredberg, and Jeffrey Germain. Chief Executive Officer (CEO) Glenn Carlson has been with Brandes since 1986, serving as Managing Partner from 1996-2002, co-CEO from 2002-2004, and CEO since 2004. Brent Woods has been with Brandes since 1995, serving as Managing Partner from 1998-2002 and Managing Director of Investments since 2002. Amelia Morris has been with Brandes since 1998, serving as a Senior Research Analyst from 1998-2004, and Director of Investments since 2004. Jim Brown has been with Brandes since 1996, serving as a Senior Research Analyst from 1996-2004, and Director of Investments since 2004. Brent Fredberg has been with Brandes since 1999, serving as an Analyst from 1999-2003, Senior Research Analyst from 2003-2010, and Director of Investments since 2010. Jeffrey Germain has been with Brandes since 2001, serving as a Research Associate from 2001-2004, Senior Research Associate from 2004-2005, Research Analyst from 2005-2010, and Senior Research Analyst since 2010.
1The Morgan Stanley Capital International (MSCI) World Index (Net) tracks the performance of global stocks.
Indices are not investments, do not incur fees or expenses and are not professionally managed. It is not possible to invest directly in an index. Securities in the fund may not match those in an index.
Performance data quoted represents past performance and current performance may be lower or higher. Past performance is no guarantee of future results. The investment return and principal value will fluctuate so that shares, when redeemed, may be worth more or less than the original cost. Please visit www.columbiamanagement.com for daily and most recent month-end performance updates.
Summary
1-year return as of 02/28/11
| | | | +17.30% | |
|
|  | | | Class A shares
(without sales charge) | |
|
| | | | +21.67% | |
|
|  | | | MSCI World Index (Net) | |
|
Morningstar Style BoxTM

The Morningstar Style BoxTM is based on the Fund's portfolio holdings. For equity funds, the vertical axis shows the market capitalization of the stocks owned, and the horizontal axis shows investment style (value, blend, or growth). Information shown is based on the most recent data provided by Morningstar.
© 2011 Morningstar, Inc. All rights reserved. The Morningstar information contained herein: (1) is proprietary to Morningstar and/or its content providers; (2) may not be copied or distributed; and (3) is not warranted to be accurate, complete or timely. Neither Morningstar nor its content providers are responsible for any damages or losses arising from any use of this information.
1
Economic Update – Columbia Global Value Fund
Summary
For the 12-month period that ended February 28, 2011
g Despite intermittent volatility, stock markets around the world gained ground, as measured by the S&P 500 Index, the MSCI EAFE Index (Net) and the MSCI Emerging Markets Index (Net).
| S&P Index | | MSCI EAFE
Index | |
|
 | |  | |
|
| | MSCI EM
Index | |
|
| |  | |
|
As the world shed concerns that key economies might lapse back into recession, the World Bank reported that global gross domestic product (GDP) rose 3.9% in 2010. The improvement over 2009 was more notable in high-income developed economies than in emerging-market countries, which had less ground to make up. Emerging market countries expanded by an estimated 7%, contributing nearly half of all global growth in 2010. This two-speed global recovery is likely to result in slower growth in 2011, but global growth should remain solid at 3.3% to 3.6%1—higher in emerging market economies, led by China and India.
Robust expansion in the Asia Pacific region
Asian Pacific economies led the global economy in 2010 and are poised to continue in that role. Exports from markets such as Singapore and South Korea have been solid and domestic demand continues to strengthen. Labor markets are healthy, income is rising and confidence runs high across the region. Higher oil prices pose a downside risk to the current expansion, because it could erode demand for Asian exports and increase the risk of inflation. However, if growth exceeds expectations in the United States or Europe, the picture gets even better for Asia.
Austerity measures weigh on Europe
Growth in the developed world was hampered by a debt crisis in Europe's weakest nations. However, the European Union took steps to manage debt restructuring in an orderly fashion and fear subsided—at least, for now. In addition, austerity measures were introduced in Greece, Ireland, Portugal and Spain. Public employment and government spending were cut back sharply. Layoffs and pay cuts have been met with resistance, but their necessity is hard to dispute.
Inflation a growing worry
As demand picked up and commodity prices began to rise across the globe, inflation has become a growing worry in both fast-growing emerging markets and slower-growth developed countries. In developed market economies, inflation is generally an external force, resulting from higher commodity prices, especially for food and energy. In emerging markets, excess demand is driving inflation concerns and policymakers have begun to shift their focus from stimulating growth to taming inflation. However, rising food prices are also a problem in Asia since food accounts for a greater percentage of household budgets than it does in more developed areas of the world.
Stocks stall, then pick up steam
Despite a period of volatility in the summer of 2010, as the world sought to digest a mounting debt crisis within euro-zone countries, it was a good year for stock markets around the world. The U.S. stock market returned 22.57% for the 12-month period, as measured by the S&P 500 Index.2 Outside the U.S., stock market returns were also strong. The MSCI EAFE Index (Net),3 a broad gauge of stock market performance in foreign developed markets, gained 20.00% (in
1World Bank estimate, January 12, 2011.
2The Standard & Poor's (S&P) 500 Index tracks the performance of 500 widely held, large-capitalization U.S. stocks.
3The Morgan Stanley Capital International Europe, Australasia, Far East (MSCI EAFE) Index (Net) is a free float-adjusted market capitalization index that is designed to measure the equity market performance of developed markets, excluding the U.S. & Canada. As of May 27, 2010, the MSCI EAFE Index (Net) consisted of the following 22 developed market country indices: Australia, Austria, Belgium, Denmark, Finland, France, Germany, Greece, Hong Kong, Ireland, Israel, Italy, Japan, the Netherlands, New Zealand, Norway, Portugal, Singapore, Spain, Sweden, Switzerland and the United Kingdom.
2
Economic Update (continued) – Columbia Global Value Fund
U.S. dollars) for the period. The MSCI Emerging Markets Index (Net)4 returned 20.91% (in U.S. dollars), led by strong performances from European and Eastern European markets. Rising inflation pressures and tighter monetary policy late in the 12-month period tempered returns.
Past performance is no guarantee of future results.
3The Morgan Stanley Capital International Emerging Markets (MSCI EM) Index (Net) is a free float-adjusted market capitalization index that is designed to measure equity market performance of emerging markets. As of May 27, 2010, the MSCI EM Index (Net) consisted of the following 21 emerging market country indices: Brazil, Chile, China, Colombia, Czech Republic, Egypt, Hungary, India, Indonesia, Korea, Malaysia, Mexico, Morocco, Peru, Philippines, Poland, Russia, South Africa, Taiwan, Thailand and Turkey.
Indices are not available for investment, are not professionally managed and do not reflect sales charges, fees, brokerage commissions, taxes or other expenses of investing. Securities in the fund may not match those in an index.
3
Performance Information – Columbia Global Value Fund
Performance data quoted represents past performance and current performance may be lower or higher. Past performance is no guarantee of future results. The investment return and principal value will fluctuate so that shares, when redeemed, may be worth more or less than the original cost. Please visit www.columbiamanagement.com for daily and most recent month-end performance updates.
Performance of a $10,000 investment 04/16/01 – 02/28/11
The chart above shows the change in value of a hypothetical $10,000 investment in Class A shares of Columbia Global Value Fund during the stated time period, and does not reflect the deduction of taxes that a shareholder may pay on fund distributions or on the redemption of fund shares.
Performance of a $10,000 investment 04/16/01 – 02/28/11 ($)
| Sales charge: | | without | | with | |
| Class A | | | 14,419 | | | | 13,590 | | |
| Class B | | | 13,399 | | | | 13,399 | | |
| Class C | | | 13,399 | | | | 13,399 | | |
| Class Z | | | 14,785 | | | | n/a | | |
Average annual total return as of 02/28/11 (%)
| Share class | | A | | B | | C | | Z | |
| Inception | | 04/16/01 | | 04/16/01 | | 04/16/01 | | 04/16/01 | |
| Sales charge | | without | | with | | without | | with | | without | | with | | without | |
| 1-year | | | 17.30 | | | | 10.50 | | | | 16.43 | | | | 11.43 | | | | 16.22 | | | | 15.22 | | | | 17.23 | | |
| 5-year | | | -1.46 | | | | -2.61 | | | | -2.18 | | | | -2.42 | | | | -2.20 | | | | -2.20 | | | | -1.23 | | |
| Life | | | 3.78 | | | | 3.16 | | | | 3.01 | | | | 3.01 | | | | 3.01 | | | | 3.01 | | | | 4.04 | | |
The "with sales charge" returns include the maximum initial sales charge of 5.75% for Class A shares and the applicable contingent deferred sales charge of 5.00% in the first year, declining to 1.00% in the sixth year and eliminated thereafter for Class B shares and 1.00% for Class C shares for the first year only. The "without sales charge" returns do not include the effect of sales charges. If they had, returns would be lower.
Performance results reflect any fee waivers or reimbursements of fund expenses by the Investment Manager and/or any of its affiliates. Absent these fee waivers or expense reimbursement arrangements, performance results would have been lower.
All results shown assume reinvestment of distributions. Class Z shares are sold at net asset value with no distribution and service (Rule 12b-1) fees. Class Z shares have limited eligibility and the investment minimum requirements may vary. Please see the fund's prospectus for details. Performance for different share classes will vary based on differences in sales charges and fees associated with each class.
The tables do not reflect the deduction of taxes that a shareholder may pay on fund distributions or on the redemption of fund shares.
4
Understanding Your Expenses – Columbia Global Value Fund
As a fund shareholder, you incur two types of costs. There are transaction costs, which generally include sales charges on purchases and may include redemption fees or exchange fees. There are also ongoing costs, which generally include investment advisory fees, distribution and service (Rule 12b-1) fees and other fund expenses. The information on this page is intended to help you understand the ongoing costs of investing in the fund and to compare these costs with the ongoing costs of investing in other mutual funds.
Analyzing your fund's expenses by share class
To illustrate these ongoing costs, we have provided an example and calculated the expenses paid by investors in each share class during the period. The information in the following table is based on an initial investment of $1,000, which is invested at the beginning of the period and held for the entire period. Expense information is calculated two ways and each method provides you with different information. The amount listed in the "Actual" column is calculated using the fund's actual operating expenses and total return for the period. The amount listed in the "Hypothetical" column for each share class assumes that the return each year is 5% before expenses and is calculated based on the fund's actual operating expenses. You should not use the hypothetical account values and expenses to estimate either your actual account balance at the end of the period or the expenses you paid during this period.
Compare with other funds
Since all mutual funds are required to include the same hypothetical calculations about expenses in shareholder reports, you can use this information to compare the ongoing cost of investing in the fund with other funds. To do so, compare the 5% hypothetical example with the 5% hypothetical examples that appear in the shareholder reports of other funds. As you compare hypothetical examples of other funds, it is important to note that hypothetical examples are meant to highlight the ongoing costs of investing in a fund and do not reflect any transaction costs, such as sales charges, redemption fees or exchange fees.
Estimating your actual expenses
To estimate the expenses that you paid over the period, first you will need your account balance at the end of the period:
g For shareholders who receive their account statements from Columbia Management Investment Services Corp., your account balance is available online at www.columbiamanagement.com or by calling Shareholder Services at 800.345.6611.
g For shareholders who receive their account statements from their financial intermediary, contact your financial intermediary to obtain your account balance.
1. Divide your ending account balance by $1,000. For example, if an account balance was $8,600 at the end of the period, the result would be 8.6.
2. In the section of the table below titled "Expenses paid during the period," locate the amount for your share class. You will find this number in the column labeled "Actual." Multiply this number by the result from step 1. Your answer is an estimate of the expenses you paid on your account during the period.
If the value of your account falls below the minimum initial investment requirement applicable to you, your account may be subject to a $20 annual fee. This fee is not included in the accompanying table. If you are subject to the fee, keep it in mind when you are estimating the ongoing expenses of investing in the fund and when comparing the expenses of this fund with other funds.
09/01/10 – 02/28/11
| | | Account value at the
beginning of the period ($) | | Account value at the
end of the period ($) | | Expenses paid
during the period ($) | | Fund's annualized
expense ratio (%) | |
| | | Actual | | Hypothetical | | Actual | | Hypothetical | | Actual | | Hypothetical | | Actual | |
| Class A | | | 1,000.00 | | | | 1,000.00 | | | | 1,239.00 | | | | 1,016.71 | | | | 9.05 | | | | 8.15 | | | | 1.63 | | |
| Class B | | | 1,000.00 | | | | 1,000.00 | | | | 1,234.70 | | | | 1,012.99 | | | | 13.19 | | | | 11.88 | | | | 2.38 | | |
| Class C | | | 1,000.00 | | | | 1,000.00 | | | | 1,234.70 | | | | 1,012.99 | | | | 13.19 | | | | 11.88 | | | | 2.38 | | |
| Class Z | | | 1,000.00 | | | | 1,000.00 | | | | 1,241.30 | | | | 1,017.95 | | | | 7.67 | | | | 6.90 | | | | 1.38 | | |
Expenses paid during the period are equal to the annualized expense ratio for the share class, multiplied by the average account value over the period, then multiplied by the number of days in the fund's most recent fiscal half-year and divided by 365.
Had the Investment Manager and/or any of its affiliates not waived fees or reimbursed a portion of expenses, account value at the end of the period would have been reduced.
It is important to note that the expense amounts shown in the table are meant to highlight only ongoing costs of investing in the fund and do not reflect any transaction costs, such as sales charges, redemption fees or exchange fees. Therefore, the hypothetical examples provided may not help you determine the relative total costs of owning shares of different funds. If these transaction costs were included, your costs would have been higher.
5
Portfolio Managers' Report – Columbia Global Value Fund
Performance data quoted represents past performance and current performance may be lower or higher. Past performance is no guarantee of future results. The investment return and principal value will fluctuate so that shares, when redeemed, may be worth more or less than the original cost. Please visit www.columbiamanagement.com for daily and most recent month-end performance updates.
Net asset value per share
as of 02/28/11 ($)
| Class A | | | 6.74 | | |
| Class B | | | 6.47 | | |
| Class C | | | 6.47 | | |
| Class Z | | | 6.79 | | |
Distributions declared per share
03/01/10 – 02/28/11 ($)
| Class A | | | 0.10 | | |
| Class B | | | 0.06 | | |
| Class C | | | 0.06 | | |
| Class Z | | | 0.12 | | |
Top 5 sectors
as of 02/28/11 (%)
| Financials | | | 22.8 | | |
| Telecommunication Services | | | 20.0 | | |
| Health Care | | | 16.0 | | |
| Information Technology | | | 14.3 | | |
| Consumer Staples | | | 13.3 | | |
Top 5 sectors are calculated as a percentage of net assets.
For the 12-month period that ended February 28, 2011, the fund's Class A shares returned 17.30% without sales charge. The MSCI World Index (Net) returned 21.67% for the same period. Stock selection in and an overweight relative to the index in the underperforming food & staples retailing industry weighed on relative performance. An overweight in the underperforming pharmaceuticals industry also detracted from relative returns, as did stock selection in the software and computers & peripherals industries. Keep in mind that industry weights are not strategic. They are a residual of our bottom-up, stock-specific investment approach.
A cross section of solid performers
The fund's positions in the diversified telecommunication services industry made the largest contribution to positive performance. As share prices advanced, the fund was doubly rewarded for its sizable allocation to the industry. U.S.-based Verizon Communications and Italy-based Telecom Italia (1.6% and 4.3% of net assets, respectively) were among the strongest performers. Elsewhere in the portfolio, Valero Energy in the oil gas & consumable fuels industry and Japan-based Sumitomo Mitsui Financial Group , a commercial bank, (1.8% and 2.0% of net assets, respectively) did well. Even though pharmaceuticals generally disappointed, Pfizer (4.1% of net assets) generated attractive returns for the period.
By comparison, food & staples retailing companies SUPERVALU and Safeway and diversified financial services company Bank of America (0.5%, 2.6% and 2.5% of net assets, respectively), all from the United States, were disappointments.
Country weights delivered mixed results
A large allocation to U.S-based companies, combined with solid performance for U.S. holdings, aided the fund's returns enough to offset disappointments from Microsoft and Boston Scientific (3.5% and 2.1% of net assets, respectively). Companies such as Dow Chemical and Citigroup (2.4% of net assets) posted healthy gains. Japan, the Netherlands and the United Kingdom were also solid performers. In these markets, Nippon Telegraph & Telephone, Marks & Spencer (3.5% and 1.9% of net assets, respectively) and STMicroelectronics, respectively, all generated attractive results.
Stock-specific research drove portfolio changes
As a result of our company-by-company analysis, we eliminated positions in Sara Lee, a U.S based food products company; STMicroelectronics, a Netherlands-based semiconductors & semiconductor equipment maker and Netherlands-based chemicals company Akzo Nobel. We used the proceeds to pursue what we believed to be more attractive opportunities and added to selected portfolio holdings at prices we considered to be attractive. We also established new positions at attractive prices: France-based Total and U.S.-based Chesapeake Energy in the oil, gas & consumable fuels industry and diversified telecommunications company France Telecom (2.7%, 1.7% and 1.3% of net assets, respectively).
6
Portfolio Managers' Report (continued) – Columbia Global Value Fund
Looking ahead
We will continue to seek out good companies whose stocks are attractively priced. Even during periods of underperformance relative to the fund's benchmark, we believe the fund can generate solid returns for shareholders. We believe that our ability to think and act differently than the market consensus will continue to help us add value for shareholders over the long term.
The foregoing reflects the thoughts and opinions of Brandes Investment Partners® exclusively and is subject to change without notice.
Brandes Investment Partners® is a registered trademark of Brandes Investment Partners, L.P. in the United States and Canada.
Source for all statistical data: Columbia Management Investment Advisers, LLC.
Source for all stock-specific commentary: Brandes Investment Partners, L.P.
Portfolio holdings and characteristics are subject to change periodically and may not be representative of current holdings and characteristics. The outlook for the fund may differ from those presented for other Columbia Funds.
Equity securities are affected by stock market fluctuations that occur in response to economic and business developments.
International investing may involve certain risks, including currency fluctuations, risks associated with possible differences in financial accounting standards and other monetary and political risks. Significant levels of foreign taxes, including potentially confiscatory levels of taxation and withholding taxes, may also apply to some foreign investments.
Investing in emerging markets may involve greater risks than investing in more developed countries. In addition, concentration of investments in a single region may result in greater volatility.
Top 10 holdings
as of 02/28/11 (%)
| Pfizer, Inc. | | | 4.1 | | |
| Microsoft Corp. | | | 3.5 | | |
| Deutsche Telekom AG, | |
| Registered Shares | | | 3.5 | | |
| Nippon Telegraph & | |
| Telephone Corp. | | | 3.5 | | |
| Koninklijke Ahold NV | | | 2.7 | | |
| Total SA | | | 2.7 | | |
| ENI SpA | | | 2.6 | | |
| Safeway, Inc. | | | 2.6 | | |
| Sanofi-Aventis SA | | | 2.5 | | |
| GlaxoSmithKline PLC | | | 2.5 | | |
The fund is actively managed and the composition of its portfolio will change over time. Information provided is calculated as a percentage of net assets.
7
Investment Portfolio – Columbia Global Value Fund
February 28, 2011
| Common Stocks – 100.7% | |
| | | Shares | | Value ($) | |
| Consumer Discretionary – 3.3% | |
| Automobiles – 1.4% | |
| Toyota Motor Corp. | | | 11,700 | | | | 546,710 | | |
| Automobiles Total | | | 546,710 | | |
| Multiline Retail – 1.9% | |
| Marks & Spencer Group PLC | | | 129,619 | | | | 729,917 | | |
| Multiline Retail Total | | | 729,917 | | |
| Consumer Discretionary Total | | | 1,276,627 | | |
| Consumer Staples – 13.3% | |
| Food & Staples Retailing – 11.2% | |
| Carrefour SA | | | 18,500 | | | | 908,324 | | |
| Koninklijke Ahold NV | | | 76,660 | | | | 1,029,096 | | |
| Safeway, Inc. | | | 44,700 | | | | 975,354 | | |
| Seven & I Holdings Co., Ltd. | | | 12,800 | | | | 357,289 | | |
| SUPERVALU, Inc. | | | 23,186 | | | | 200,095 | | |
| Wm. Morrison Supermarkets PLC | | | 177,232 | | | | 797,508 | | |
| Food & Staples Retailing Total | | | 4,267,666 | | |
| Food Products – 2.1% | |
| Unilever NV | | | 26,700 | | | | 805,240 | | |
| Food Products Total | | | 805,240 | | |
| Consumer Staples Total | | | 5,072,906 | | |
| Energy – 8.8% | |
| Oil, Gas & Consumable Fuels – 8.8% | |
| Chesapeake Energy Corp. | | | 18,400 | | | | 655,224 | | |
| ENI SpA | | | 40,200 | | | | 980,225 | | |
| Total SA | | | 16,700 | | | | 1,023,436 | | |
| Valero Energy Corp. | | | 24,800 | | | | 698,864 | | |
| Oil, Gas & Consumable Fuels Total | | | 3,357,749 | | |
| Energy Total | | | 3,357,749 | | |
| Financials – 22.8% | |
| Commercial Banks – 10.2% | |
| Intesa Sanpaolo SpA | | | 142,178 | | | | 479,509 | | |
| Mitsubishi UFJ Financial Group, Inc. | | | 144,000 | | | | 799,922 | | |
| Mizuho Financial Group, Inc. | | | 355,900 | | | | 733,626 | | |
| PNC Financial Services Group, Inc. | | | 5,013 | | | | 309,302 | | |
Sumitomo Mitsui Financial
Group, Inc. | | | 19,700 | | | | 745,482 | | |
| Wells Fargo & Co. | | | 25,159 | | | | 811,629 | | |
| Commercial Banks Total | | | 3,879,470 | | |
| Diversified Financial Services – 4.9% | |
| Bank of America Corp. (a) | | | 65,724 | | | | 939,196 | | |
| Citigroup, Inc. (b) | | | 198,769 | | | | 930,239 | | |
| Diversified Financial Services Total | | | 1,869,435 | | |
| | | Shares | | Value ($) | |
| Insurance – 7.7% | |
| Aegon NV (b) | | | 107,682 | | | | 827,530 | | |
| MS & AD Insurance Group Holdings | | | 29,200 | | | | 771,288 | | |
Swiss Reinsurance Co., Ltd.,
Registered Shares | | | 8,100 | | | | 496,061 | | |
| Tokio Marine Holdings, Inc. | | | 26,100 | | | | 858,160 | | |
| Insurance Total | | | 2,953,039 | | |
| Financials Total | | | 8,701,944 | | |
| Health Care – 16.0% | |
| Health Care Equipment & Supplies – 2.1% | |
| Boston Scientific Corp. (b) | | | 112,473 | | | | 805,307 | | |
| Health Care Equipment & Supplies Total | | | 805,307 | | |
| Pharmaceuticals – 13.9% | |
| AstraZeneca PLC | | | 16,900 | | | | 823,105 | | |
| Daiichi Sankyo Co., Ltd. | | | 28,100 | | | | 603,490 | | |
| Eli Lilly & Co. | | | 11,300 | | | | 390,528 | | |
| GlaxoSmithKline PLC | | | 49,620 | | | | 952,650 | | |
| Pfizer, Inc. | | | 80,800 | | | | 1,554,592 | | |
| Sanofi-Aventis SA | | | 13,949 | | | | 962,446 | | |
| Pharmaceuticals Total | | | 5,286,811 | | |
| Health Care Total | | | 6,092,118 | | |
| Industrials – 2.2% | |
| Building Products – 0.5% | |
| Masco Corp. | | | 14,400 | | | | 195,696 | | |
| Building Products Total | | | 195,696 | | |
| Industrial Conglomerates – 1.7% | |
| General Electric Co. | | | 30,040 | | | | 628,437 | | |
| Industrial Conglomerates Total | | | 628,437 | | |
| Industrials Total | | | 824,133 | | |
| Information Technology – 14.3% | |
| Communications Equipment – 2.7% | |
| Alcatel-Lucent (b) | | | 40,800 | | | | 201,955 | | |
| Motorola Solutions, Inc. (b) | | | 4,757 | | | | 183,810 | | |
Telefonaktiebolaget LM Ericsson,
Class B | | | 49,889 | | | | 641,966 | | |
| Communications Equipment Total | | | 1,027,731 | | |
| Computers & Peripherals – 2.5% | |
| Dell, Inc. (b) | | | 59,200 | | | | 937,136 | | |
| Computers & Peripherals Total | | | 937,136 | | |
| Electronic Equipment, Instruments & Components – 1.8% | |
| FUJIFILM Holdings Corp. | | | 19,400 | | | | 683,036 | | |
Electronic Equipment, Instruments &
Components Total | | | 683,036 | | |
See Accompanying Notes to Financial Statements.
8
Columbia Global Value Fund
February 28, 2011
| Common Stocks (continued) | |
| | | Shares | | Value ($) | |
| Office Electronics – 1.6% | |
| Xerox Corp. | | | 57,600 | | | | 619,200 | | |
| Office Electronics Total | | | 619,200 | | |
| Semiconductors & Semiconductor Equipment – 2.2% | |
| Intel Corp. | | | 38,759 | | | | 832,156 | | |
Semiconductors & Semiconductor
Equipment Total | | | 832,156 | | |
| Software – 3.5% | |
| Microsoft Corp. | | | 50,400 | | | | 1,339,632 | | |
| Software Total | | | 1,339,632 | | |
| Information Technology Total | | | 5,438,891 | | |
| Telecommunication Services – 20.0% | |
| Diversified Telecommunication Services – 20.0% | |
| AT&T, Inc. | | | 27,127 | | | | 769,864 | | |
Brasil Telecom SA, ADR
(Ordinary) (b) | | | 11,568 | | | | 114,870 | | |
Brasil Telecom SA, ADR
(Preference) (b) | | | 15,672 | | | | 361,240 | | |
Deutsche Telekom AG,
Registered Shares | | | 99,103 | | | | 1,332,699 | | |
| France Telecom SA | | | 22,200 | | | | 491,077 | | |
| Nippon Telegraph & Telephone Corp. | | | 27,200 | | | | 1,330,566 | | |
Tele Norte Leste
Participacoes SA, ADR | | | 14,700 | | | | 232,113 | | |
| Telecom Italia SpA | | | 569,093 | | | | 888,982 | | |
| Telecom Italia SpA, Savings Shares | | | 565,300 | | | | 748,102 | | |
| Telefonica SA | | | 11,774 | | | | 298,955 | | |
Telefonos de Mexico SA de CV, ADR,
Class L | | | 23,700 | | | | 428,733 | | |
| Verizon Communications, Inc. | | | 16,900 | | | | 623,948 | | |
| Diversified Telecommunication Services Total | | | 7,621,149 | | |
| Telecommunication Services Total | | | 7,621,149 | | |
Total Common Stocks
(cost of $46,057,784) | | | 38,385,517 | | |
| Short-Term Obligation – 0.3% | |
| | | Par ($) | | Value ($) | |
Repurchase agreement with Fixed
Income Clearing Corp.,
dated 02/28/11, due 03/01/11
at 0.090%, collateralized by
a U.S. Government Agency
obligation maturing 04/15/14,
market value $126,069
(repurchase proceeds $122,000) | | | 122,000 | | | | 122,000 | | |
Total Short-Term Obligation
(cost of $122,000) | | | 122,000 | | |
Total Investments – 101.0%
(cost of $46,179,784) (c) | | | 38,507,517 | | |
| Other Assets & Liabilities, Net – (1.0)% | | | (376,941 | ) | |
| Net Assets – 100.0% | | | 38,130,576 | | |
Notes to Investment Portfolio:
(a) Investments in affiliates during the year ended February 28, 2011:
| Affiliate | | Value,
beginning
of period | | Purchases | | Sales
Proceeds | | Dividend
Income | | Value,
end of
period | |
Bank of America
Corp.* | | $ | 1,191,590 | | | $ | — | | | $ | — | | | $ | 715 | | | $ | — | | |
* As of May 1, 2010, this company was no longer an affiliate of the Fund. The above table reflects activity for the period from March 1, 2010 through April 30, 2010.
(b) Non-income producing security.
(c) Cost for federal income tax purposes is $51,020,209.
Generally accepted accounting principles (GAAP) require disclosure regarding the inputs and valuation techniques used to measure fair value and any changes in valuation inputs or techniques. In addition, investments shall be disclosed by major category.
The Fund categorizes its fair value measurements according to a three-level hierarchy that maximizes the use of observable inputs and minimizes the use of unobservable inputs by prioritizing that the most observable input be used when available. Observable inputs are those that market participants would use in pricing an investment based on market data obtained from sources independent of the reporting entity. Unobservable inputs are those that reflect the Fund's assumptions about the information market participants would use in pricing an investment. An investment's level within the fair value hierarchy is based on the lowest level of any input that is deemed significant to the asset or liability's fair value measurement. The input levels are not necessarily an indication of the risk or liquidity associated with investments at that level. For example, certain U.S. government securities are generally high quality and liquid, however, they are reflected as Level 2 because the inputs used to determine fair value may not always be quoted prices in an active market.
Fair value inputs are summarized in the three broad levels listed below:
• Level 1 – Valuations based on quoted prices for investments in active markets that the Fund has the ability to access at the measurement date (including NAV for open-end mutual funds). Valuation adjustments are not applied to Level 1 investments.
• Level 2 – Valuations based on other significant observable inputs (including quoted prices for similar securities, interest rates, prepayment speeds, credit risks, etc.).
• Level 3 – Valuations based on significant unobservable inputs (including the Fund's own assumptions and judgment in determining the fair value of investments).
See Accompanying Notes to Financial Statements.
9
Columbia Global Value Fund
February 28, 2011
Inputs that are used in determining fair value of an investment may include price information, credit data, volatility statistics, and other factors. These inputs can be either observable or unobservable. The availability of observable inputs can vary between investments, and is affected by various factors such as the type of investment, and the volume and level of activity for that investment or similar investments in the marketplace. The inputs will be considered by the Investment Manager, along with any other relevant factors in the calculation of an investment's fair value. The Fund uses prices and inputs that are current as of the measurement date, which may include periods of market dislocations. During these periods, the availability of prices and inputs may be reduced for many investments. This condition could cause an investment to be reclassified between the various levels within the hierarchy. Non-U.S. equity securities actively traded in foreign markets may be reflected in Level 2 despite the availability of closing prices, because the Fund evaluates and determines whether those closing prices reflect fair value at the close of the New York Stock Exchange (NYSE) or require adjustment, as described in Note 2 to the financial statements – Security Valuation.
Investments falling into the Level 3 category are primarily supported by quoted prices from brokers and dealers participating in the market for those investments. However, these may be classified as Level 3 investments due to lack of market transparency and corroboration to support these quoted prices. Additionally, valuation models may be used as the pricing source for any remaining investments classified as Level 3. These models rely on one or more significant unobservable inputs and/or significant assumptions by the Investment Manager. Inputs used in valuations may include, but are not limited to, financial statement analysis, capital account balances, discount rates and estimated cash flows, and comparable company data.
The following table is a summary of the inputs used to value the Fund's investments as of February 28, 2011:
| Description | | Quoted
Prices
(Level 1) | | Other
Significant
Observable
Inputs
(Level 2) | | Significant
Unobservable
Inputs
(Level 3) | | Total | |
| Common Stocks | |
| Consumer Discretionary | | $ | — | | | $ | 1,276,627 | | | $ | — | | | $ | 1,276,627 | | |
| Consumer Staples | | | 1,175,449 | | | | 3,897,457 | | | | — | | | | 5,072,906 | | |
| Energy | | | 1,354,088 | | | | 2,003,661 | | | | — | | | | 3,357,749 | | |
| Financials | | | 2,990,366 | | | | 5,711,578 | | | | — | | | | 8,701,944 | | |
| Health Care | | | 2,750,427 | | | | 3,341,691 | | | | — | | | | 6,092,118 | | |
| Industrials | | | 824,133 | | | | — | | | | — | | | | 824,133 | | |
| Information Technology | | | 3,911,934 | | | | 1,526,957 | | | | — | | | | 5,438,891 | | |
Telecommunication
Services | | | 2,530,768 | | | | 5,090,381 | | | | — | | | | 7,621,149 | | |
| Total Common Stocks | | | 15,537,165 | | | | 22,848,352 | | | | — | | | | 38,385,517 | | |
Total Short-Term
Obligation | | | — | | | | 122,000 | | | | — | | | | 122,000 | | |
| Total Investments | | $ | 15,537,165 | | | $ | 22,970,352 | | | $ | — | | | $ | 38,507,517 | | |
The Fund's assets assigned to the Level 2 input category are generally valued using the market approach, in which a security's value is determined through reference to prices and information from market transactions for similar or identical assets. These assets include certain foreign securities for which a third party statistical pricing service may be employed for purposes of fair market valuation. The models utilized by the third party statistical pricing service take into account a security's correlation to available market data including, but not limited to, intraday index, ADR, and ETF movements.
Certain short-term obligations may be valued using amortized cost, an income approach which converts future cash flows to a present value based upon the discount or premium at purchase.
There were no significant transfers of financial assets between Levels 1 and 2 during the period.
The Fund was invested in the following countries at February 28, 2011:
Summary of Securities
by Country (Unaudited) | | Value | | % of Total
Investments | |
| United States* | | $ | 14,522,209 | | | | 37.7 | | |
| Japan | | | 7,429,569 | | | | 19.3 | | |
| France | | | 3,587,238 | | | | 9.3 | | |
| United Kingdom | | | 3,303,180 | | | | 8.6 | | |
| Italy | | | 3,096,819 | | | | 8.0 | | |
| Netherlands | | | 2,661,865 | | | | 6.9 | | |
| Germany | | | 1,332,699 | | | | 3.5 | | |
| Brazil | | | 708,223 | | | | 1.8 | | |
| Sweden | | | 641,966 | | | | 1.7 | | |
| Switzerland | | | 496,061 | | | | 1.3 | | |
| Mexico | | | 428,733 | | | | 1.1 | | |
| Spain | | | 298,955 | | | | 0.8 | | |
| | | $ | 38,507,517 | | | | 100.0 | | |
* Includes short-term obligation.
Certain securities are listed by country of underlying exposure but may trade predominantly on another exchange.
| Acronym | | Name | |
| ADR | | American Depositary Receipt | |
See Accompanying Notes to Financial Statements.
10
Statement of Assets and Liabilities – Columbia Global Value Fund
February 28, 2011
| | | | | ($) | |
| Assets | | Investments, at identified cost | | | 46,179,784 | | |
| | | Investments, at value | | | 38,507,517 | | |
| | | Cash | | | 58 | | |
| | | Receivable for: | | | | | |
| | | Fund shares sold | | | 9,116 | | |
| | | Dividends | | | 103,493 | | |
| | | Foreign tax reclaims | | | 422 | | |
| | | Expense reimbursement due from Investment Manager | | | 19,330 | | |
| | | Prepaid expenses | | | 179 | | |
| | | Total Assets | | | 38,640,115 | | |
| Liabilities | | Payable for: | | | | | |
| | | Fund shares repurchased | | | 279,487 | | |
| | | Investment advisory fee | | | 28,096 | | |
| | | Administration fee | | | 1,756 | | |
| | | Pricing and bookkeeping fees | | | 5,452 | | |
| | | Transfer agent fee | | | 19,940 | | |
| | | Trustees' fees | | | 49,286 | | |
| | | Audit fee | | | 45,950 | | |
| | | Legal fee | | | 38,543 | | |
| | | Custody fee | | | 4,423 | | |
| | | Distribution and service fees | | | 20,037 | | |
| | | Chief compliance officer expenses | | | 139 | | |
| | | Other liabilities | | | 16,430 | | |
| | | Total Liabilities | | | 509,539 | | |
| | | Net Assets | | | 38,130,576 | | |
| Net Assets Consist of | | Paid-in capital | | | 119,482,983 | | |
| | | Undistributed net investment income | | | 537,150 | | |
| | | Accumulated net realized loss | | | (74,217,670 | ) | |
| | | Net unrealized appreciation (depreciation) on: | | | | | |
| | | Investments | | | (7,672,267 | ) | |
| | | Foreign currency translations | | | 380 | | |
| | | Net Assets | | | 38,130,576 | | |
See Accompanying Notes to Financial Statements.
11
Statement of Assets and Liabilities (continued) – Columbia Global Value Fund
February 28, 2011
| Class A | | Net assets | | $ | 14,212,283 | | |
| | | Shares outstanding | | | 2,110,090 | | |
| | | Net asset value per share | | $ | 6.74 | (a) | |
| | | Maximum sales charge | | | 5.75 | % | |
| | | Maximum offering price per share ($6.74/0.9425) | | $ | 7.15 | (b) | |
| Class B | | Net assets | | $ | 2,867,420 | | |
| | | Shares outstanding | | | 443,474 | | |
| | | Net asset value and offering price per share | | $ | 6.47 | (a) | |
| Class C | | Net assets | | $ | 15,406,987 | | |
| | | Shares outstanding | | | 2,382,212 | | |
| | | Net asset value and offering price per share | | $ | 6.47 | (a) | |
| Class Z | | Net assets | | $ | 5,643,886 | | |
| | | Shares outstanding | | | 831,174 | | |
| | | Net asset value, offering and redemption price per share | | $ | 6.79 | | |
(a) Redemption price per share is equal to net asset value less any applicable contingent deferred sales charge.
(b) On sales of $50,000 or more the offering price is reduced.
See Accompanying Notes to Financial Statements.
12
Statement of Operations – Columbia Global Value Fund
For the Year Ended February 28, 2011
| | | | | ($) | |
| Investment Income | | Dividends | | | 1,447,340 | | |
| | | Dividends from affiliates | | | 715 | | |
| | | Interest | | | 218 | | |
| | | Foreign taxes withheld | | | (81,000 | ) | |
| | | Total Investment Income | | | 1,367,273 | | |
| Expenses | | Investment advisory fee | | | 400,404 | | |
| | | Administration fee | | | 30,969 | | |
| | | Distribution fee: | | | | | |
| | | Class B | | | 30,585 | | |
| | | Class C | | | 125,430 | | |
| | | Service fee: | | | | | |
| | | Class B | | | 10,195 | | |
| | | Class C | | | 41,810 | | |
| | | Distribution and service fee: | | | | | |
| | | Class A | | | 37,051 | | |
| | | Transfer agent fee | | | 82,813 | | |
| | | Pricing and bookkeeping fees | | | 56,303 | | |
| | | Trustees' fees | | | 29,400 | | |
| | | Custody fee | | | 16,337 | | |
| | | Chief compliance officer expenses | | | 992 | | |
| | | Other expenses | | | 204,283 | | |
| | | Total Expenses | | | 1,066,572 | | |
| | | Fees waived or expenses reimbursed by Investment Manager | | | (220,895 | ) | |
| | | Net Expenses | | | 845,677 | | |
| | | Net Investment Income | | | 521,596 | | |
| Net Realized and Unrealized Gain (Loss) on Investments and Foreign Currency | | Net realized loss on: | | | | | |
| | | Investments | | | (1,284,948 | ) | |
| | | Foreign currency transactions | | | (10,294 | ) | |
| | | Net realized loss | | | (1,295,242 | ) | |
| | | Net change in unrealized appreciation (depreciation) on: | | | | | |
| | | Investments | | | 7,008,434 | | |
| | | Foreign currency translations | | | 866 | | |
| | | Net change in unrealized appreciation (depreciation) | | | 7,009,300 | | |
| | | Net Gain | | | 5,714,058 | | |
| | | Net Increase Resulting from Operations | | | 6,235,654 | | |
See Accompanying Notes to Financial Statements.
13
Statement of Changes in Net Assets – Columbia Global Value Fund
| | | | | Year Ended February 28, | |
| Increase (Decrease) in Net Assets | | | | 2011 ($) | | 2010 ($) | |
| Operations | | Net investment income | | | 521,596 | | | | 727,885 | | |
| | | Net realized loss on investments and foreign currency
transactions | | | (1,295,242 | ) | | | (37,702,544 | ) | |
| | | Net change in unrealized appreciation (depreciation)
on investments and foreign currency translations | | | 7,009,300 | | | | 64,448,477 | | |
| | | Net increase resulting from operations | | | 6,235,654 | | | | 27,473,818 | | |
| Distributions to Shareholders | | From net investment income: | | | | | | | | | |
| | | Class A | | | (269,034 | ) | | | (901,429 | ) | |
| | | Class B | | | (47,592 | ) | | | (368,815 | ) | |
| | | Class C | | | (189,833 | ) | | | (1,033,688 | ) | |
| | | Class Z | | | (198,595 | ) | | | (1,181,811 | ) | |
| | | Total distributions to shareholders | | | (705,054 | ) | | | (3,485,743 | ) | |
| | | Net Capital Stock Transactions | | | (21,327,171 | ) | | | (35,539,358 | ) | |
| | | Redemption fees | | | — | | | | 1,259 | | |
| | | Increase from regulatory settlements | | | 48,500 | | | | — | | |
| | | Total decrease in net assets | | | (15,748,071 | ) | | | (11,550,024 | ) | |
| Net Assets | | Beginning of period | | | 53,878,647 | | | | 65,428,671 | | |
| | | End of period | | | 38,130,576 | | | | 53,878,647 | | |
| | | Undistributed net investment income at end of period | | | 537,150 | | | | 682,456 | | |
See Accompanying Notes to Financial Statements.
14
Statement of Changes in Net Assets (continued) – Columbia Global Value Fund
| | | Capital Stock Activity | |
| | | Year Ended
February 28, 2011 | | Year Ended
February 28, 2010 | |
| | | Shares | | Dollars ($) | | Shares | | Dollars ($) | |
| Class A | |
| Subscriptions | | | 498,106 | | | | 2,955,422 | | | | 427,165 | | | | 2,365,575 | | |
| Distributions reinvested | | | 39,668 | | | | 224,127 | | | | 149,841 | | | | 755,198 | | |
| Redemptions | | | (1,099,455 | ) | | | (6,619,339 | ) | | | (1,774,695 | ) | | | (9,485,370 | ) | |
| Net decrease | | | (561,681 | ) | | | (3,439,790 | ) | | | (1,197,689 | ) | | | (6,364,597 | ) | |
| Class B | |
| Subscriptions | | | 708 | | | | 3,863 | | | | 10,044 | | | | 48,814 | | |
| Distributions reinvested | | | 7,391 | | | | 40,356 | | | | 61,839 | | | | 300,533 | | |
| Redemptions | | | (680,621 | ) | | | (3,888,848 | ) | | | (818,402 | ) | | | (4,385,237 | ) | |
| Net decrease | | | (672,522 | ) | | | (3,844,629 | ) | | | (746,519 | ) | | | (4,035,890 | ) | |
| Class C | |
| Subscriptions | | | 9,145 | | | | 49,931 | | | | 51,641 | | | | 251,491 | | |
| Distributions reinvested | | | 22,896 | | | | 125,010 | | | | 142,059 | | | | 691,830 | | |
| Redemptions | | | (1,145,713 | ) | | | (6,626,809 | ) | | | (2,071,935 | ) | | | (10,710,243 | ) | |
| Net decrease | | | (1,113,672 | ) | | | (6,451,868 | ) | | | (1,878,235 | ) | | | (9,766,922 | ) | |
| Class Z | |
| Subscriptions | | | 28,949 | | | | 172,358 | | | | 175,537 | | | | 952,921 | | |
| Distributions reinvested | | | 6,559 | | | | 37,322 | | | | 35,230 | | | | 178,616 | | |
| Redemptions | | | (1,286,549 | ) | | | (7,800,564 | ) | | | (3,059,097 | ) | | | (16,503,486 | ) | |
| Net decrease | | | (1,251,041 | ) | | | (7,590,884 | ) | | | (2,848,330 | ) | | | (15,371,949 | ) | |
See Accompanying Notes to Financial Statements.
15
Financial Highlights – Columbia Global Value Fund
Selected data for a share outstanding throughout each period is as follows:
| | | Year Ended February 28, | | Year Ended
February 29, | | Period Ended
February 28, | | Year Ended
March 31, | |
| Class A Shares | | 2011 | | 2010 | | 2009 | | 2008 | | 2007 (a) | | 2006 (b) | |
| Net Asset Value, Beginning of Period | | $ | 5.85 | | | $ | 4.14 | | | $ | 9.33 | | | $ | 13.43 | | | $ | 12.64 | | | $ | 11.98 | | |
| Income from Investment Operations: | |
| Net investment income (c) | | | 0.08 | | | | 0.07 | | | | 0.18 | | | | 0.19 | (d) | | | 0.14 | | | | 0.16 | | |
Net realized and unrealized gain (loss) on
investments and foreign currency | | | 0.90 | | | | 1.91 | | | | (4.58 | ) | | | (1.21 | ) | | | 2.07 | | | | 1.76 | | |
| Total from investment operations | | | 0.98 | | | | 1.98 | | | | (4.40 | ) | | | (1.02 | ) | | | 2.21 | | | | 1.92 | | |
| Less Distributions to Shareholders: | |
| From net investment income | | | (0.10 | ) | | | (0.27 | ) | | | — | | | | (0.19 | ) | | | (0.12 | ) | | | (0.17 | ) | |
| From net realized gains | | | — | | | | — | | | | (0.79 | ) | | | (2.89 | ) | | | (1.30 | ) | | | (1.09 | ) | |
| Total distributions to shareholders | | | (0.10 | ) | | | (0.27 | ) | | | (0.79 | ) | | | (3.08 | ) | | | (1.42 | ) | | | (1.26 | ) | |
| Redemption Fees: | |
| Redemption fees added to paid-in-capital | | | — | | | | — | (e) | | | — | (e) | | | — | (e) | | | — | (e) | | | — | (e) | |
| Increase from regulatory settlements | | | 0.01 | | | | — | | | | — | | | | — | | | | — | | | | — | | |
| Net Asset Value, End of Period | | $ | 6.74 | | | $ | 5.85 | | | $ | 4.14 | | | $ | 9.33 | | | $ | 13.43 | | | $ | 12.64 | | |
| Total return (f) | | | 17.30 | %(g) | | | 48.97 | %(g) | | | (51.34 | )%(g) | | | (10.43 | )%(g) | | | 19.27 | %(g)(h) | | | 16.97 | % | |
Ratios to Average Net Assets/
Supplemental Data: | |
| Net expenses before interest expense | | | 1.60 | % | | | 1.62 | % | | | 1.60 | %(i) | | | 1.51 | %(i) | | | 1.53 | %(i)(j) | | | 1.45 | %(i) | |
| Interest expense | | | — | | | | — | %(k) | | | — | %(k) | | | — | %(k) | | | — | %(j)(k) | | | — | %(k) | |
| Net expenses | | | 1.60 | % | | | 1.62 | % | | | 1.60 | %(i) | | | 1.51 | %(i) | | | 1.53 | %(i)(j) | | | 1.45 | %(i) | |
| Waiver/Reimbursement | | | 0.50 | % | | | 0.30 | % | | | 0.03 | % | | | 0.01 | % | | | 0.01 | %(j) | | | — | | |
| Net investment income | | | 1.38 | % | | | 1.29 | % | | | 2.45 | %(i) | | | 1.50 | %(i) | | | 1.17 | %(i)(j) | | | 1.32 | %(i) | |
| Portfolio turnover rate | | | 8 | % | | | 5 | % | | | 10 | % | | | 38 | % | | | 12 | %(h) | | | 16 | % | |
| Net assets, end of period (000s) | | $ | 14,212 | | | $ | 15,641 | | | $ | 16,031 | | | $ | 85,257 | | | $ | 114,224 | | | $ | 119,611 | | |
(a) The Fund changed its fiscal year end from March 31 to February 28. Per share data and total return reflect activity from April 1, 2006 through February 28, 2007.
(b) On August 22, 2005, the Fund's Investor A shares were renamed Class A shares.
(c) Per share data was calculated using the average shares outstanding during the period.
(d) Net investment income per share reflects a special dividend. The effect of this dividend amounted to $0.05 per share.
(e) Rounds to less than $0.01 per share.
(f) Total return at net asset value assuming all distributions reinvested and no initial sales charge or contingent deferred sales charge.
(g) Had the Investment Manager and/or any of its affiliates not waived fees or reimbursed a portion of expenses, total return would have been reduced.
(h) Not annualized.
(i) The benefits derived from expense reductions had an impact of less than 0.01%.
(j) Annualized.
(k) Rounds to less than 0.01%.
See Accompanying Notes to Financial Statements.
16
Financial Highlights – Columbia Global Value Fund
Selected data for a share outstanding throughout each period is as follows:
| | | Year Ended February 28, | | Year Ended
February 29, | | Period Ended
February 28, | | Year Ended
March 31, | |
| Class B Shares | | 2011 | | 2010 | | 2009 | | 2008 | | 2007 (a) | | 2006 (b) | |
| Net Asset Value, Beginning of Period | | $ | 5.62 | | | $ | 3.98 | | | $ | 9.05 | | | $ | 13.12 | | | $ | 12.40 | | | $ | 11.78 | | |
| Income from Investment Operations: | |
| Net investment income (c) | | | 0.06 | | | | 0.03 | | | | 0.12 | | | | 0.10 | (d) | | | 0.05 | | | | 0.07 | | |
Net realized and unrealized gain (loss) on
investments and foreign currency | | | 0.84 | | | | 1.83 | | | | (4.40 | ) | | | (1.17 | ) | | | 2.02 | | | | 1.71 | | |
| Total from investment operations | | | 0.90 | | | | 1.86 | | | | (4.28 | ) | | | (1.07 | ) | | | 2.07 | | | | 1.78 | | |
| Less Distributions to Shareholders: | |
| From net investment income | | | (0.06 | ) | | | (0.22 | ) | | | — | | | | (0.11 | ) | | | (0.05 | ) | | | (0.07 | ) | |
| From net realized gains | | | — | | | | — | | | | (0.79 | ) | | | (2.89 | ) | | | (1.30 | ) | | | (1.09 | ) | |
| Total distributions to shareholders | | | (0.06 | ) | | | (0.22 | ) | | | (0.79 | ) | | | (3.00 | ) | | | (1.35 | ) | | | (1.16 | ) | |
| Redemption Fees: | |
| Redemption fees added to paid-in-capital | | | — | | | | — | (e) | | | — | (e) | | | — | (e) | | | — | (e) | | | — | (e) | |
| Increase from regulatory settlements | | | 0.01 | | | | — | | | | — | | | | — | | | | — | | | | — | | |
| Net Asset Value, End of Period | | $ | 6.47 | | | $ | 5.62 | | | $ | 3.98 | | | $ | 9.05 | | | $ | 13.12 | | | $ | 12.40 | | |
| Total return (f) | | | 16.43 | %(g) | | | 47.63 | %(g) | | | (51.61 | )%(g) | | | (11.08 | )%(g) | | | 18.44 | %(g)(h) | | | 16.08 | % | |
Ratios to Average Net Assets/
Supplemental Data: | |
| Net expenses before interest expense | | | 2.35 | % | | | 2.37 | % | | | 2.35 | %(i) | | | 2.26 | %(i) | | | 2.28 | %(i)(j) | | | 2.20 | %(i) | |
| Interest expense | | | — | | | | — | %(k) | | | — | %(k) | | | — | %(k) | | | — | %(j)(k) | | | — | %(k) | |
| Net expenses | | | 2.35 | % | | | 2.37 | % | | | 2.35 | %(i) | | | 2.26 | %(i) | | | 2.28 | %(i)(j) | | | 2.20 | %(i) | |
| Waiver/Reimbursement | | | 0.50 | % | | | 0.30 | % | | | 0.03 | % | | | 0.01 | % | | | 0.01 | %(j) | | | — | | |
| Net investment income | | | 0.97 | % | | | 0.61 | % | | | 1.67 | %(i) | | | 0.76 | %(i) | | | 0.41 | %(i)(j) | | | 0.58 | %(i) | |
| Portfolio turnover rate | | | 8 | % | | | 5 | % | | | 10 | % | | | 38 | % | | | 12 | %(h) | | | 16 | % | |
| Net assets, end of period (000s) | | $ | 2,867 | | | $ | 6,277 | | | $ | 7,408 | | | $ | 22,943 | | | $ | 32,635 | | | $ | 32,564 | | |
(a) The Fund changed its fiscal year end from March 31 to February 28. Per share data and total return reflect activity from April 1, 2006 through February 28, 2007.
(b) On April 22, 2005, the Fund's Investor B shares were renamed Class B shares.
(c) Per share data was calculated using the average shares outstanding during the period.
(d) Net investment income per share reflects a special dividend. The effect of this dividend amounted to $0.05 per share.
(e) Rounds to less than $0.01 per share.
(f) Total return at net asset value assuming all distributions reinvested and no contingent deferred sales charge.
(g) Had the Investment Manager and/or any of its affiliates not waived fees or reimbursed a portion of expenses, total return would have been reduced.
(h) Not annualized.
(i) The benefits derived from expense reductions had an impact of less than 0.01%.
(j) Annualized.
(k) Rounds to less than 0.01%.
See Accompanying Notes to Financial Statements.
17
Financial Highlights – Columbia Global Value Fund
Selected data for a share outstanding throughout each period is as follows:
| | | Year Ended February 28, | | Year Ended
February 29, | | Period Ended
February 28, | | Year Ended
March 31, | |
| Class C Shares | | 2011 | | 2010 | | 2009 | | 2008 | | 2007 (a) | | 2006 (b) | |
| Net Asset Value, Beginning of Period | | $ | 5.63 | | | $ | 3.98 | | | $ | 9.05 | | | $ | 13.13 | | | $ | 12.41 | | | $ | 11.78 | | |
| Income from Investment Operations: | |
| Net investment income (c) | | | 0.04 | | | | 0.03 | | | | 0.12 | | | | 0.09 | (d) | | | 0.04 | | | | 0.07 | | |
Net realized and unrealized gain (loss) on
investments and foreign currency | | | 0.85 | | | | 1.84 | | | | (4.40 | ) | | | (1.17 | ) | | | 2.03 | | | | 1.72 | | |
| Total from investment operations | | | 0.89 | | | | 1.87 | | | | (4.28 | ) | | | (1.08 | ) | | | 2.07 | | | | 1.79 | | |
| Less Distributions to Shareholders: | |
| From net investment income | | | (0.06 | ) | | | (0.22 | ) | | | — | | | | (0.11 | ) | | | (0.05 | ) | | | (0.07 | ) | |
| From net realized gains | | | — | | | | — | | | | (0.79 | ) | | | (2.89 | ) | | | (1.30 | ) | | | (1.09 | ) | |
| Total distributions to shareholders | | | (0.06 | ) | | | (0.22 | ) | | | (0.79 | ) | | | (3.00 | ) | | | (1.35 | ) | | | (1.16 | ) | |
| Redemption Fees: | |
| Redemption fees added to paid-in-capital | | | — | | | | — | (e) | | | — | (e) | | | — | (e) | | | — | (e) | | | — | (e) | |
| Increase from regulatory settlements | | | 0.01 | | | | — | | | | — | | | | — | | | | — | | | | — | | |
| Net Asset Value, End of Period | | $ | 6.47 | | | $ | 5.63 | | | $ | 3.98 | | | $ | 9.05 | | | $ | 13.13 | | | $ | 12.41 | | |
| Total return (f) | | | 16.22 | %(g) | | | 47.88 | %(g) | | | (51.61 | )%(g) | | | (11.14 | )%(g) | | | 18.44 | %(g)(h) | | | 16.16 | % | |
Ratios to Average Net Assets/
Supplemental Data: | |
| Net expenses before interest expense | | | 2.35 | % | | | 2.37 | % | | | 2.35 | %(i) | | | 2.26 | %(i) | | | 2.28 | %(i)(j) | | | 2.20 | %(i) | |
| Interest expense | | | — | | | | — | %(k) | | | — | %(k) | | | — | %(k) | | | — | %(j)(k) | | | — | %(k) | |
| Net expenses | | | 2.35 | % | | | 2.37 | % | | | 2.35 | %(i) | | | 2.26 | %(i) | | | 2.28 | %(i)(j) | | | 2.20 | %(i) | |
| Waiver/Reimbursement | | | 0.50 | % | | | 0.30 | % | | | 0.03 | % | | | 0.01 | % | | | 0.01 | %(j) | | | — | | |
| Net investment income | | | 0.68 | % | | | 0.53 | % | | | 1.69 | %(i) | | | 0.74 | %(i) | | | 0.39 | %(i)(j) | | | 0.58 | %(i) | |
| Portfolio turnover rate | | | 8 | % | | | 5 | % | | | 10 | % | | | 38 | % | | | 12 | %(h) | | | 16 | % | |
| Net assets, end of period (000s) | | $ | 15,407 | | | $ | 19,665 | | | $ | 21,375 | | | $ | 72,405 | | | $ | 97,465 | | | $ | 92,558 | | |
(a) The Fund changed its fiscal year end from March 31 to February 28. Per share data and total return reflect activity from April 1, 2006 through February 28, 2007.
(b) On August 22, 2005, the Fund's Investor C shares were renamed Class C shares.
(c) Per share data was calculated using the average shares outstanding during the period.
(d) Net investment income per share reflects a special dividend. The effect of this dividend amounted to $0.05 per share.
(e) Rounds to less than $0.01 per share.
(f) Total return at net asset value assuming all distributions reinvested and no contingent deferred sales charge.
(g) Had the Investment Manager and/or any of its affiliates not waived fees or reimbursed a portion of expenses, total return would have been reduced.
(h) Not annualized.
(i) The benefits derived from expense reductions had an impact of less than 0.01%.
(j) Annualized.
(k) Rounds to less than 0.01%.
See Accompanying Notes to Financial Statements.
18
Financial Highlights – Columbia Global Value Fund
Selected data for a share outstanding throughout each period is as follows:
| | | Year Ended February 28, | | Year Ended
February 29, | | Period Ended
February 28, | | Year Ended
March 31, | |
| Class Z Shares | | 2011 | | 2010 | | 2009 | | 2008 | | 2007 (a) | | 2006 (b) | |
| Net Asset Value, Beginning of Period | | $ | 5.91 | | | $ | 4.18 | | | $ | 9.40 | | | $ | 13.53 | | | $ | 12.72 | | | $ | 12.04 | | |
| Income from Investment Operations: | |
| Net investment income (c) | | | 0.11 | | | | 0.10 | | | | 0.21 | | | | 0.23 | (d) | | | 0.17 | | | | 0.20 | | |
Net realized and unrealized gain (loss) on
investments and foreign currency | | | 0.88 | | | | 1.92 | | | | (4.61 | ) | | | (1.23 | ) | | | 2.09 | | | | 1.77 | | |
| Total from investment operations | | | 0.99 | | | | 2.02 | | | | (4.40 | ) | | | (1.00 | ) | | | 2.26 | | | | 1.97 | | |
| Less Distributions to Shareholders: | |
| From net investment income | | | (0.12 | ) | | | (0.29 | ) | | | (0.03 | ) | | | (0.24 | ) | | | (0.15 | ) | | | (0.20 | ) | |
| From net realized gains | | | — | | | | — | | | | (0.79 | ) | | | (2.89 | ) | | | (1.30 | ) | �� | | (1.09 | ) | |
| Total distributions to shareholders | | | (0.12 | ) | | | (0.29 | ) | | | (0.82 | ) | | | (3.13 | ) | | | (1.45 | ) | | | (1.29 | ) | |
| Redemption Fees: | |
| Redemption fees added to paid-in-capital | | | — | | | | — | (e) | | | — | (e) | | | — | (e) | | | — | (e) | | | — | (e) | |
| Increase from regulatory settlements | | | 0.01 | | | | — | | | | — | | | | — | | | | — | | | | — | | |
| Net Asset Value, End of Period | | $ | 6.79 | | | $ | 5.91 | | | $ | 4.18 | | | $ | 9.40 | | | $ | 13.53 | | | $ | 12.72 | | |
| Total return (f) | | | 17.23 | %(g) | | | 49.50 | %(g) | | | (51.10 | )%(g) | | | (10.26 | )%(g) | | | 19.54 | %(g)(h) | | | 17.34 | % | |
Ratios to Average Net Assets/
Supplemental Data: | |
| Net expenses before interest expense | | | 1.35 | % | | | 1.37 | % | | | 1.35 | %(i) | | | 1.26 | %(i) | | | 1.28 | %(i)(j) | | | 1.20 | %(i) | |
| Interest expense | | | — | | | | — | %(k) | | | — | %(k) | | | — | %(k) | | | — | %(j)(k) | | | — | %(k) | |
| Net expenses | | | 1.35 | % | | | 1.37 | % | | | 1.35 | %(i) | | | 1.26 | %(i) | | | 1.28 | %(i)(j) | | | 1.20 | %(i) | |
| Waiver/Reimbursement | | | 0.50 | % | | | 0.30 | % | | | 0.03 | % | | | 0.01 | % | | | 0.01 | %(j) | | | — | | |
| Net investment income | | | 1.86 | % | | | 1.86 | % | | | 2.81 | %(i) | | | 1.77 | %(i) | | | 1.42 | %(i)(j) | | | 1.60 | %(i) | |
| Portfolio turnover rate | | | 8 | % | | | 5 | % | | | 10 | % | | | 38 | % | | | 12 | %(h) | | | 16 | % | |
| Net assets, end of period (000s) | | $ | 5,644 | | | $ | 12,296 | | | $ | 20,615 | | | $ | 66,875 | | | $ | 117,125 | | | $ | 117,072 | | |
(a) The Fund changed its fiscal year end from March 31 to February 28. Per share data and total return reflect activity from April 1, 2006 through February 28, 2007.
(b) On August 22, 2005, the Fund's Primary A shares were renamed Class Z shares.
(c) Per share data was calculated using the average shares outstanding during the period.
(d) Net investment income per share reflects a special dividend. The effect of this dividend amounted to $0.05 per share.
(e) Rounds to less than $0.01 per share.
(f) Total return at net asset value assuming all distributions reinvested.
(g) Had the Investment Manager and/or any of its affiliates not waived fees or reimbursed a portion of expenses, total return would have been reduced.
(h) Not annualized.
(i) The benefits derived from expense reductions had an impact of less than 0.01%.
(j) Annualized.
(k) Rounds to less than 0.01%.
See Accompanying Notes to Financial Statements.
19
Notes to Financial Statements – Columbia Global Value Fund
February 28, 2011
Note 1. Organization
Columbia Global Value Fund (the Fund), a series of Columbia Funds Series Trust (the Trust), is a diversified fund. The Trust is registered under the Investment Company Act of 1940, as amended (the 1940 Act), as an open-end management investment company organized as a Delaware statutory trust.
Investment Objective
The Fund seeks long-term capital appreciation.
Fund Shares
The Trust has unlimited authorized shares of beneficial interest. The Fund offers Class A, Class B, Class C and Class Z shares. Subject to certain limited exceptions, the Fund is no longer accepting new investments from current or prospective investors. All share classes have identical voting, dividend and liquidation rights. Each share class has its own expense structure and sales charges, as applicable.
Class A shares are subject to a maximum front-end sales charge of 5.75% based on the investment amount. Class A shares purchased without an initial sales charge in accounts aggregating $1 million to $50 million at the time of purchase are subject to a 1.00% contingent deferred sales charge (CDSC) if the shares are sold within 18 months of purchase, charged as follows: 1.00% CDSC if redeemed within 12 months of purchase, and 0.50% CDSC if redeemed more than 12, but less than 18 months after purchase.
The Fund no longer accepts investments by new or existing investors in the Fund's Class B shares, except in connection with the reinvestment of any dividend and/or capital gain distributions in Class B shares of the Fund and exchanges by existing Class B shareholders of certain other funds within the Columbia Family of Funds. Class B shares may be subject to a maximum CDSC of 5.00% based upon the holding period after purchase. Class B shares will generally convert to Class A shares eight years after purchase.
Class C shares are subject to a 1.00% CDSC on shares redeemed within one year of purchase.
Class Z shares are not subject to sales charges and are available only to certain investors, as described in the Fund's prospectus.
Note 2. Summary of Significant Accounting Policies
The preparation of financial statements in accordance with U.S. generally accepted accounting principles (GAAP) requires the Investment Manager to make certain estimates and assumptions that affect the reported amounts of assets and liabilities, the disclosure of contingent assets and liabilities at the date of the financial statements and the reported amounts of revenue and expenses during the reporting period. Actual results could differ from those estimates.
The following is a summary of significant accounting policies consistently followed by the Fund in the preparation of its financial statements.
Security Valuation
Equity securities are valued at the last sale price on the principal exchange on which they trade, except for securities traded on the NASDAQ, which are valued at the NASDAQ official close price. Unlisted securities or listed securities for which there were no sales during the day are valued at the closing bid price on such exchanges or over-the-counter markets.
Short-term investments maturing in 60 days or less are valued at amortized cost, which approximates market value.
Investments in other open-end investment companies are valued at net asset value.
Foreign securities are generally valued at the last sale price on the foreign exchange or market on which they trade. If any foreign share prices are not readily available as a result of limited share activity, the securities are valued at the last sale price of the local shares in the principal market in which such securities are normally traded.
Generally, trading in foreign securities is substantially completed each day at various times prior to the close of the New York Stock Exchange (NYSE). The values of such securities used in computing the net asset value of the Fund's shares are determined as of such times. Foreign currency exchange rates are generally determined at 4:00 p.m. Eastern (U.S.) time. Occasionally, events affecting the values of such foreign securities may occur between the times at which they are determined and the close of the customary trading session of the NYSE, which would not be reflected in the computation of the Fund's net asset value. If events materially affecting the values of such foreign securities occur and it is determined that market quotations are not reliable, then these foreign securities will be valued at their fair value using procedures approved by the Board of Trustees.
The Fund may use a systematic fair valuation model provided by an independent third party to value securities principally traded in foreign markets in order to adjust for possible stale pricing that may occur between the close of the foreign exchanges and the time for valuation.
20
Columbia Global Value Fund, February 28, 2011
Investments for which market quotations are not readily available, or that have quotations which the Investment Manager believes are not reliable, are valued at fair value as determined in good faith under consistently applied procedures established by and under the general supervision of the Board of Trustees. If a security is valued at fair value, such value is likely to be different from the last quoted market price for the security. The determination of fair value often requires significant judgment. To determine fair value, the Investment Manager may use assumptions including but not limited to future cash flows and estimated risk premiums. Multiple inputs from various sources may be used to determine value.
Foreign Currency Transactions and Translations
The values of all assets and liabilities quoted in foreign currencies are translated into U.S. dollars at that day's exchange rates. Net realized and unrealized gains (losses) on foreign currency transactions and translations include gains (losses) arising from the fluctuation in exchange rates between trade and settlement dates on securities transactions, gains (losses) arising from the disposition of foreign currency and currency gains (losses) between the accrual and payment dates on dividends, interest income and foreign withholding taxes.
For financial statement purposes, the Fund does not distinguish that portion of gains (losses) on investments which is due to changes in foreign exchange rates from that which is due to changes in market prices of the investments. Such fluctuations are included with the net realized and unrealized gains (losses) on investments on the Statement of Operations.
Repurchase Agreements
The Fund may engage in repurchase agreement transactions with institutions that the Investment Manager has determined are creditworthy. The Fund, through the custodian, receives delivery of the underlying securities collateralizing a repurchase agreement. The Investment Manager is responsible for determining that the collateral is at least equal, at all times, to the value of the repurchase obligation including interest. A repurchase agreement transaction involves certain risks in the event of default or insolvency of the counterparty. These risks include possible delays in or restrictions on the Fund's ability to dispose of the underlying securities and a possible decline in the value of the underlying securities during the period while the Fund seeks to assert its rights.
Security Transactions
Security transactions are accounted for on the trade date. Cost is determined and gains (losses) are based upon the specific identification method for both financial statement and federal income tax purposes.
Income Recognition
Interest income is recorded on the accrual basis.
Corporate actions and dividend income are recorded net of any non-reclaimable tax withholdings, on the ex-dividend date or upon receipt of ex-dividend notification in the case of certain foreign securities.
Awards from class action litigation are recorded as a reduction of cost if the Fund still owns the applicable securities on the payment date. If the Fund no longer owns the applicable securities, the proceeds are recorded as realized gains.
Expenses
General expenses of the Trust are allocated to the Fund and other series of the Trust based upon relative net assets or other expense allocation methodologies determined by the nature of the expense. Expenses directly attributable to a specific class of shares are charged to that share class. Expenses directly attributable to the Fund are charged to the Fund.
Determination of Class Net Asset Value
All income, expenses (other than class-specific expenses which are charged directly to a share class, as shown in the Statement of Operations) and realized and unrealized gains (losses) are allocated to each class of the Fund on a daily basis, based on the relative net assets of each class, for purposes of determining the net asset value of each class.
Federal Income Tax Status
The Fund intends to qualify each year as a "regulated investment company" under Subchapter M of the Internal Revenue Code, as amended, and will distribute substantially all of its taxable income, if any, for its tax year, and as such will not be subject to federal income taxes. In addition, the Fund intends to distribute in each calendar year substantially all of its net investment income, capital gains and certain other amounts, if any, such that the Fund should not be subject to federal excise tax. Therefore, no federal income or excise tax provision is recorded.
Foreign Tax
The Fund may be subject to foreign taxes on income and/or gains on investments or currency repatriation, a portion of which may be
21
Columbia Global Value Fund, February 28, 2011
recoverable. The Fund will accrue such taxes and recoveries as applicable, based upon its current interpretation of tax rules and regulations that exist in the markets in which it invests.
Realized gains in certain countries may be subject to foreign taxes at the Fund level, at rates ranging from approximately 10% to 15%. The Fund accrues for such foreign taxes on net realized and unrealized gains at the appropriate rate for each jurisdiction.
Distributions to Shareholders
Distributions from net investment income, if any, are declared and paid semi-annually. The Fund may, however, declare and pay distributions from net investment income more frequently. The Fund will distribute net realized capital gains (including net short-term capital gains) at least annually after the fiscal year in which the capital gains were earned, unless offset by any available capital loss carryforward. Income distributions and capital gain distributions are determined in accordance with federal income tax regulations which may differ from GAAP.
Indemnification
In the normal course of business, the Fund enters into contracts that contain a variety of representations and warranties and which provide general indemnities. The Fund's maximum exposure under these arrangements is unknown because this would involve future claims against the Fund. Also, under the Trust's organizational documents and by contract, the Trustees and officers of the Trust are indemnified against certain liabilities that may arise out of actions relating to their duties to the Trust. However, based on experience, the Fund expects the risk of loss due to these representations, warranties and indemnities to be minimal.
Note 4. Fees and Compensation Paid to Affiliates
Investment Management Services Fee
After the close of business on April 30, 2010, Ameriprise Financial, Inc. (Ameriprise Financial) acquired a portion of the asset management business of Columbia Management Group, LLC (the Transaction), including the business of managing the Fund. In connection with the closing of the Transaction (the Closing), RiverSource Investments, LLC, a wholly owned subsidiary of Ameriprise Financial, became the investment manager of the Fund and changed its name to Columbia Management Investment Advisers, LLC (the Investment Manager). The Investment Manager is responsible for the management of the Fund. Day-to-day portfolio management of the Fund is provided by the Fund's subadviser (see Subadvisory Fee note below). The management fee is based on the Fund's average daily net assets at the following annual rates:
| Average Daily Net Assets | | Annual Fee Rate | |
| First $500 million | | | 0.90 | % | |
| $500 million to $1 billion | | | 0.85 | % | |
| $1 billion to $1.5 billion | | | 0.80 | % | |
| $1.5 billion to $3 billion | | | 0.75 | % | |
| $3 billion to $6 billion | | | 0.73 | % | |
| Over $6 billion | | | 0.71 | % | |
Prior to the Closing, Columbia Management Advisors, LLC (Columbia), an indirect, wholly owned subsidiary of Bank of America Corporation (BOA), provided investment management services to the Fund under the same fee structure.
The effective management fee rate for the year ended February 28, 2011, was 0.90% of the Fund's average daily net assets.
Subadvisory Fee
Brandes Investment Partners, L.P. (Brandes) has been retained by the Investment Manager to serve as the investment subadviser to the Fund. As the subadviser, and subject to the oversight of the Investment Manager and the Fund's Board of Trustees, Brandes is responsible for the daily investment operations, including placing all orders for the purchase and sale of the portfolio securities for the Fund. The Investment Manager, from the management fee it receives, pays Brandes a monthly subadvisory fee.
Prior to the Closing, Brandes provided subadvisory services to the Fund under the same fee structure in accordance with an agreement with Columbia.
Administration Fee
Effective upon the Closing, the Investment Manager became the administrator of the Fund and provides administrative and other services to the Fund, including services previously performed under the Pricing and Bookkeeping Oversight and Services Agreement discussed below. The administration fee is based on the annual rate of 0.17% of the Fund's average daily net assets, less the fees payable by the Fund as described under the Pricing and Bookkeeping Fees
22
Columbia Global Value Fund, February 28, 2011
note below. Prior to the Closing, Columbia provided administrative services to the Fund at the same fee rate.
Pricing and Bookkeeping Fees
Prior to the Closing, the Fund entered into a Financial Reporting Services Agreement (the Financial Reporting Services Agreement) with State Street Bank and Trust Company (State Street) and Columbia pursuant to which State Street provides financial reporting services to the Fund. The Fund also entered into an Accounting Services Agreement (collectively with the Financial Reporting Services Agreement, the State Street Agreements) with State Street and Columbia pursuant to which State Street provides accounting services to the Fund. Upon the Closing, Columbia assigned and delegated its rights and obligations under the State Street Agreements to the Investment Manager. Under the State Street Agreements, the Fund pays State Street an annual fee of $38,000 paid monthly plus an additional monthly fee based on an annualized percentage rate of average daily net assets of the Fund for the month. The aggregate fee will not exceed $140,000 per year (exclusive of out-of-pocket expenses and charges). The Fund also reimburses State Street for certain out-of-pocket expenses and charges.
Also prior to the Closing, the Fund entered into a Pricing and Bookkeeping Oversight and Services Agreement (the Services Agreement) with Columbia. Under the Services Agreement, Columbia provided services related to Fund expenses and the requirements of the Sarbanes-Oxley Act of 2002, and provided oversight of the accounting and financial reporting services provided by State Street. Under the Services Agreement, the Fund reimbursed Columbia for out-of-pocket expenses and charges, including fees payable to third parties, such as for pricing the Fund's portfolio securities, incurred by Columbia in the performance of services under the Services Agreement. The Services Agreement was terminated upon the Closing. These services are now provided under the Administration Fee note discussed above.
Transfer Agent Fee
In connection with the Closing, RiverSource Service Corporation, a wholly owned subsidiary of Ameriprise Financial, became the transfer agent of the Fund and changed its name to Columbia Management Investment Services Corp. (the New Transfer Agent). The New Transfer Agent has contracted with Boston Financial Data Services (BFDS) to serve as sub-transfer agent. The New Transfer Agent receives monthly account-based service fees based on the number of open accounts and asset-based fees, calculated based on assets held in omnibus accounts, which are intended to reimburse the New Transfer Agent for certain sub-transfer agent fees (exclusive of BFDS fees). The New Transfer Agent pays the fees of BFDS for services as sub-transfer agent and is not entitled to reimbursement for such fees from the Fund.
The New Transfer Agent receives reimbursement for certain out-of-pocket expenses and may also receive compensation for various shareholder services.
Prior to the Closing, Columbia Management Services, Inc., an affiliate of Columbia and an indirect, wholly owned subsidiary of BOA, provided shareholder services to the Fund and contracted with BFDS to serve as sub-transfer agent, under the same fee structure.
For the year ended February 28, 2011, the Fund's effective transfer agent fee rate for each class was 0.19% of the Fund's average daily net assets.
An annual minimum account balance fee of $20 may apply to certain accounts with a value below the Fund's initial minimum investment requirements to reduce the impact of small accounts on transfer agent fees. These minimum account balance fees are recorded as part of expense reductions on the Statement of Operations. For the year ended February 28, 2011, no minimum account balance fees were charged by the Fund.
Underwriting Discounts, Service and Distribution Fees
In connection with the Closing, RiverSource Fund Distributors, Inc., an indirect wholly owned subsidiary of Ameriprise Financial, became the distributor of the Fund and changed its name to Columbia Management Investment Distributors, Inc. (the New Distributor).
For the year ended February 28, 2011, net CDSC fees paid by shareholders on certain redemptions of Class B and Class C shares amounted to $10 and $364, respectively.
The Trust has adopted shareholder servicing plans and distribution plans for the Class B and Class C shares of the Fund and a combined distribution and shareholder servicing plan for Class A shares of the Fund. The shareholder servicing plans permit the Fund to compensate or reimburse servicing agents for the shareholder services they have provided. The distribution plans, adopted pursuant to Rule 12b-1 under the 1940 Act, permit the Fund to compensate or reimburse the New Distributor and/or selling agents for activities or expenses primarily intended to result in the sale of the classes'
23
Columbia Global Value Fund, February 28, 2011
shares. Payments are made at an annual rate and paid monthly, as a percentage of average daily net assets, set from time to time by the Board of Trustees, and are charged as expenses of the Fund directly to the applicable share class. A substantial portion of the expenses incurred pursuant to these plans is paid to affiliates of the New Distributor.
The annual rates in effect and plan limits, as a percentage of average daily net assets are as follows:
| | | Current
Rate | | Plan
Limit | |
Class A Combined Distribution
and Shareholder Servicing Plan | | | 0.25 | % | | | 0.25 | % | |
Class B and Class C Shareholder
Servicing Plans | | | 0.25 | % | | | 0.25 | % | |
Class B and Class C
Distribution Plans | | | 0.75 | % | | | 0.75 | % | |
Prior to the Closing, Columbia Management Distributors, Inc, an affiliate of Columbia and an indirect, wholly owned subsidiary of BOA, was the principal underwriter of the Fund's shares. There were no changes to the underwriting discount structure of the Fund or the service or distribution fee rates paid by the Fund as a result of the Transaction.
Expense Limits and Fee Waivers
Effective July 1, 2010, the Investment Manager has voluntarily agreed to bear a portion of the Fund's expenses so that the Fund's ordinary operating expenses (excluding any distribution and service fees, brokerage commissions, interest, taxes and extraordinary expenses, but including custodian charges relating to overdrafts, if any) after giving effect to any balance credits from the Fund's custodian, do not exceed the annual rate of 1.35% of the Fund's average daily net assets. This arrangement may be modified or terminated by the Investment Manager at any time.
For the period May 1, 2010 through June 30, 2010, the Investment Manager contractually agreed to bear a portion of the Fund's expenses at the same rate. Prior to May 1, 2010, Columbia contractually agreed to reimburse a portion of the Fund's expenses at the same rate.
The Investment Manager is entitled to recover from the Fund any fees waived and/or expenses reimbursed for a three year period following the date of such fee waiver and/or reimbursement if such recovery does not cause the Fund's expenses to exceed the expense limitations in effect at the time of recovery. Prior to May 1, 2010, Columbia was entitled to recover fees waived and/or expenses reimbursed from the Fund in the same manner. Amounts are only recoverable by the Investment Manager through the last day prior to the Fund's reorganization into Columbia Global Equity Fund (see Subsequent Events note).
At February 28, 2011, the amounts potentially recoverable by the Investment Manager pursuant to this arrangement were as follows:
| Amount of Potential Recovery Expiring: | | Total
Potential | | Amount
Expired | | Amount Recovered
During the Year | |
| 2/28/2014 | | 2/28/2013 | | Recovery | | 2/28/2011 | | Ended 2/28/2011 | |
| $ | 220,895 | | | $ | 187,426 | | | $ | 408,321 | | | $ | — | | | $ | — | | |
Fees Paid to Officers and Trustees
Upon the Closing, all officers of the Fund are employees of the Investment Manager or its affiliates and, with the exception of the Fund's Chief Compliance Officer, receive no compensation from the Fund. The Board of Trustees has appointed a Chief Compliance Officer to the Fund in accordance with federal securities regulations. The Fund, along with other affiliated funds, pays its pro-rata share of the expenses associated with the Chief Compliance Officer. The Fund's expenses for the Chief Compliance Officer will not exceed $15,000 per year. Prior to the Closing, all officers of the Fund were employees of Columbia or its affiliates and the Fund paid its pro-rata share of the expenses for the Chief Compliance Officer under the same fee structure.
Trustees are compensated for their services to the Fund, as set forth on the Statement of Operations. The Trust's eligible Trustees may participate in a non-qualified deferred compensation plan which may be terminated at any time. Any payments to plan participants are paid solely out of the Fund's assets. Income earned on the plan participant's deferral account is based on the rate of return of the eligible mutual funds selected by the participant or, if no funds are selected, on the rate of return of Columbia Money Market Fund
24
Columbia Global Value Fund, February 28, 2011
(formerly known as RiverSource Cash Management Fund). Prior to the Closing, if no funds were selected, income earned on the plan participant's deferral account was based on the rate of return of BofA Treasury Reserves. Trustees' fees deferred during the current period as well as any gains or losses on the trustees' deferred compensation balances as a result of market fluctuations are included in "Trustees' fees" on the Statement of Operations. Liabilities under the deferred compensation plan are included in "Trustees' fees" on the Statement of Assets and Liabilities.
Other Related Party Transactions
Prior to the Closing, the Fund used one or more brokers that were affiliates of BOA in connection with the purchase and sale of its securities. Total brokerage commissions paid to affiliated brokers for the period prior to the Closing were $628.
Note 5. Custody Credits
The Fund has an agreement with its custodian bank under which custody fees may be reduced by balance credits. These credits are recorded as part of expense reductions on the Statement of Operations. The Fund could have invested a portion of the assets utilized in connection with the expense offset arrangement in an income-producing asset if it had not entered into such an agreement.
Note 6. Portfolio Information
The cost of purchases and proceeds from sales of securities, excluding short-term obligations, aggregated $3,320,070 and $24,031,029, respectively, for the year ended February 28, 2011.
Note 7. Regulatory Settlements
During the year ended February 28, 2011, the Fund received payments totaling $48,500 resulting from certain regulatory settlements with third parties in which the Fund had participated. The payments have been included in "Increase from regulatory settlements" in the Statement of Changes in Net Assets.
Note 8. Redemption Fees
Effective March 1, 2010, the Fund no longer assesses a 2.00% redemption fee on the proceeds from Fund shares that are redeemed within 60 days of purchase. The redemption fee was designed to offset brokerage commissions and other costs associated with short term trading of fund shares. The redemption fees, which were retained by the Fund, were accounted for as an addition to paid-in capital and were allocated to each class based on the relative net assets at the time of the redemption.
Note 9. Shareholder Concentration
As of February 28, 2011, two shareholder accounts owned 39.2% of the outstanding shares of the Fund. Purchase and redemption activity of these accounts may have a significant effect on the operations of the Fund.
Note 10. Line of Credit
The Fund and other affiliated funds participate in a $280,000,000 committed, unsecured revolving line of credit provided by State Street. The maximum amount that may be borrowed by any fund is limited to the lesser of $200,000,000 and the Fund's borrowing limit set forth in the Fund's registration statement. Borrowings are available for short-term liquidity or temporary or emergency purposes.
Effective October 14, 2010, interest is charged to each participating fund based on the fund's borrowings at a rate per annum equal to the greater of the Federal Funds Rate plus 1.25% or the overnight LIBOR Rate plus 1.25%. In addition, a commitment fee of 0.125% per annum is accrued and apportioned among the participating funds pro rata based on their relative net assets.
Prior to October 14, 2010, interest was charged to each participating fund at the same rates. In addition, a commitment fee of 0.15% per annum was accrued and apportioned among the participating funds pro rata based on their relative net assets.
For the year ended February 28, 2011, the Fund did not borrow under these arrangements.
Note 11. Federal Tax Information
The timing and character of income and capital gain distributions are determined in accordance with income tax regulations, which may differ from GAAP. Reclassifications are made to the Fund's capital accounts for permanent tax differences to reflect income and gains available for distribution (or available capital loss carryforwards) under income tax regulations.
For the year ended February 28, 2011, permanent book and tax basis differences resulting primarily from differing treatments for proceeds from litigation payments and foreign currency transactions were
25
Columbia Global Value Fund, February 28, 2011
identified and reclassified among the components of the Fund's net assets as follows:
Undistributed
Net Investment
Income | | Accumulated
Net Realized
Loss | | Paid-In Capital | |
| $ | 38,152 | | | $ | 10,295 | | | $ | (48,447 | ) | |
Net investment income and net realized gains (losses), as disclosed on the Statement of Operations, and net assets were not affected by this reclassification.
The tax character of distributions paid during the years ended February 28, 2011 and February 28, 2010 was as follows:
| | | February 28, | |
| Distributions paid from: | | 2011 | | 2010 | |
| Ordinary Income* | | $ | 705,054 | | | $ | 3,485,743 | | |
* For tax purposes short-term capital gains distributions, if any, are considered ordinary income distributions.
As of February 28, 2011, the components of distributable earnings on a tax basis were as follows:
Undistributed
Ordinary
Income | | Undistributed
Long-Term
Capital Gains | |
Net Unrealized
Depreciation* | |
| $ | 538,596 | | | $ | — | | | $ | (12,512,692 | ) | |
* The differences between book-basis and tax-basis net unrealized depreciation are primarily due to deferral of losses from wash sales.
Unrealized appreciation and depreciation at February 28, 2011, based on cost of investments for federal income tax purposes and excluding any unrealized appreciation and depreciation from changes in the value of other assets and liabilities resulting from changes in exchange rates were:
| Unrealized appreciation | | $ | 7,157,179 | | |
| Unrealized depreciation | | | (19,669,871 | ) | |
| Net unrealized depreciation | | $ | (12,512,692 | ) | |
The following capital loss carryforwards as of February 28, 2011, may be available to reduce taxable income arising from future net realized gains on investments, if any, to the extent permitted by the Internal Revenue Code:
| Year of Expiration | | Capital Loss
Carryforwards | |
| 2017 | | $ | 18,857,402 | | |
| 2018 | | | 47,353,774 | | |
| 2019 | | | 1,645,663 | | |
| Total | | $ | 67,856,839 | | |
Under current tax rules, certain currency (and capital) losses realized after October 31 may be deferred and treated as occurring on the first day of the following fiscal year. As of February 28, 2011, post-October capital losses of $1,520,407 attributed to security transactions were deferred to March 1, 2011
Management is required to determine whether a tax position of the Fund is more likely than not to be sustained upon examination by the applicable taxing authority, including resolution of any related appeals or litigation processes, based on the technical merits of the position. The tax benefit to be recognized by the Fund is measured as the largest amount of benefit that is greater than fifty percent likely of being realized upon ultimate settlement. Management is not aware of any tax positions for which it is reasonably possible that the total amounts of unrecognized tax benefits will significantly change in the next twelve months. However, management's conclusions may be subject to review and adjustment at a later date based on factors including, but not limited to, new tax laws, regulations, and administrative interpretations (including relevant court decisions). The Fund's federal tax returns for the prior three fiscal years remain subject to examination by the Internal Revenue Service.
Note 12. Significant Risks and Contingencies
Foreign Securities Risk
Investing in foreign securities may include certain risks and considerations not typically associated with investing in U.S. securities, such as fluctuating currency values and changing local and regional economic, political and social conditions, which may result in greater market volatility. In addition, certain foreign securities may not be as liquid as U.S. securities. Investing in emerging markets may accentuate these risks.
26
Columbia Global Value Fund, February 28, 2011
Investments in emerging market countries are subject to additional risk. The risk of foreign investments is typically increased in less developed countries. These countries are also more likely to experience high levels of inflation, deflation or currency devaluation which could hurt their economies and securities markets.
Note 13. Subsequent Events
Management has evaluated the events and transactions that have occurred through the date the financial statements were issued. Other than as noted below, there were no items requiring adjustment of the financial statements or additional disclosure.
At a Special Meeting of Shareholders held on February 15, 2011, shareholders of the Fund approved a proposal to reorganize the Fund into Columbia Global Equity Fund (formerly Threadneedle Global Equity Fund). The reorganization is expected to occur on or about June 6, 2011.
Note 14. Information Regarding Pending and Settled Legal Proceedings
In June 2004, an action captioned John E. Gallus et al. v. American Express Financial Corp. and American Express Financial Advisors Inc. was filed in the United States District Court for the District of Arizona. The plaintiffs allege that they are investors in several American Express Company (now known as RiverSource) mutual funds and they purport to bring the action derivatively on behalf of those funds under the Investment Company Act of 1940. The plaintiffs allege that fees allegedly paid to the defendants by the funds for investment advisory and administrative services are excessive. The plaintiffs seek remedies including restitution and rescission of investment advisory and distribution agreements. The plaintiffs voluntarily agreed to transfer this case to the United States District Court for the District of Minnesota (the District Court). In response to defendants' motion to dismiss the complaint, the District Court dismissed one of plaintiffs' four claims and granted plaintiffs limited discovery. Defendants moved for summary judgment in April 2007. Summary judgment was granted in the defendants' favor on July 9, 2007. The plaintiffs filed a notice of appeal with the Eighth Circuit Court of Appeals (the Eighth Circuit) on August 8, 2007. On April 8, 2009, the Eighth Circuit reversed summary judgment and remanded to the District Court for further proceedings. On August 6, 2009, defendants filed a writ of certiorari with the U.S. Supreme Court (the Supreme Court), asking the Supreme Court to stay the District Court proceedings while the Supreme Court considers and rules in a case captioned Jones v. Harris Associates, which involves issues of law similar to those presented in the Gallus case. On March 30, 2010, the Supreme Court issued its ruling in Jones v. Harris Associates, and on April 5, 2010, the Supreme Court vacated the Eighth Circuit's decision in the Gallus case and remanded the case to the Eighth Circuit for further consideration in light of the Supreme Court's decision in Jones v. Harris Associates. On June 4, 2010, the Eighth Circuit remanded the Gallus case to the District Court for further consideration in light of the Supreme Court's decision in Jones v. Harris Associates. On December 9, 2010, the District Court reinstated its July 9, 2007 summary judgment order in favor of the defendants. On January 10, 2011 plaintiffs filed a notice of appeal with the Eighth Circuit.
In December 2005, without admitting or denying the allegations, American Express Financial Corporation (AEFC, which is now known as Ameriprise Financial, Inc. (Ameriprise Financial)), entered into settlement agreements with the Securities and Exchange Commission (SEC) and Minnesota Department of Commerce (MDOC) related to market timing activities. As a result, AEFC was censured and ordered to cease and desist from committing or causing any violations of certain provisions of the Investment Advisers Act of 1940, the Investment Company Act of 1940, and various Minnesota laws. AEFC agreed to pay disgorgement of $10 million and civil money penalties of $7 million. AEFC also agreed to retain an independent distribution consultant to assist in developing a plan for distribution of all disgorgement and civil penalties ordered by the SEC in accordance with various undertakings detailed at http://www.sec.gov/litigation/admin/ia-2451.pdf. Ameriprise Financial and its affiliates have cooperated with the SEC and the MDOC in these legal proceedings, and have made regular reports to the funds' Boards of Directors/Trustees.
Ameriprise Financial and certain of its affiliates have historically been involved in a number of legal, arbitration and regulatory proceedings, including routine litigation, class actions, and governmental actions, concerning matters arising in connection with the conduct of their business activities. Ameriprise Financial believes that the Funds are not currently the subject of, and that neither Ameriprise Financial nor any of its affiliates are the subject of, any pending legal, arbitration or regulatory proceedings that are likely to have a material adverse effect on the Funds or the ability of Ameriprise Financial or its affiliates to perform under their contracts with the Funds. Ameriprise Financial is required to make 10-Q, 10-K and, as necessary, 8-K filings with the Securities and Exchange Commission on legal and regulatory matters that relate to Ameriprise Financial and its affiliates. Copies of these filings may be obtained by accessing the SEC website at www.sec.gov.
27
Columbia Global Value Fund, February 28, 2011
There can be no assurance that these matters, or the adverse publicity associated with them, will not result in increased fund redemptions, reduced sale of fund shares or other adverse consequences to the Funds. Further, although we believe proceedings are not likely to have a material adverse effect on the Funds or the ability of Ameriprise Financial or its affiliates to perform under their contracts with the Funds, these proceedings are subject to uncertainties and, as such, we are unable to estimate the possible loss or range of loss that may result. An adverse outcome in one or more of these proceedings could result in adverse judgments, settlements, fines, penalties or other relief that could have a material adverse effect on the consolidated financial condition or results of operations of Ameriprise Financial.
28
Report of Independent Registered Public Accounting Firm
To the Trustees of Columbia Funds Series Trust and the Shareholders of Columbia Global Value Fund
In our opinion, the accompanying statement of assets and liabilities, including the investment portfolio, and the related statements of operations and of changes in net assets and the financial highlights present fairly, in all material respects, the financial position of Columbia Global Value Fund (the "Fund") (a series of Columbia Funds Series Trust) at February 28, 2011, the results of its operations for the year then ended, the changes in its net assets for each of the two years in the period then ended, and the financial highlights for each of the periods indicated, in conformity with accounting principles generally accepted in the United States of America. These financial statements and financial highlights (hereafter referred to as "financial statements") are the responsibility of the Fund's management. Our responsibility is to express an opinion on these financial statements based on our audits. We conducted our audits of these financial statements in accordance with the standards of the Public Company Accounting Oversight Board (United States). Those standards require that we plan and perform the audit to obtain reasonable assurance about whether the financial statements are free of material misstatement. An audit includes examining, on a test basis, evidence supporting the amounts and disclosures in the financial statements, assessing the accounting principles used and significant estimates made by management, and evaluating the overall financial statement presentation. We believe that our audits, which included confirmation of securities at February 28, 2011 by correspondence with the custodian and brokers, provide a reasonable basis for our opinion.
PricewaterhouseCoopers LLP
Boston, Massachusetts
April 21, 2011
29
Federal Income Tax Information (Unaudited) – Columbia Global Value Fund
50.05% of the ordinary income distributed by the Fund for the fiscal year ended February 28, 2011, qualifies for the corporate dividends received deduction.
Foreign taxes paid during the fiscal year ended February 28, 2011, of $81,907 are being passed through to shareholders. This represents $0.01 per share. Eligible shareholders may claim this amount as a foreign tax credit.
Gross income derived from sources within foreign countries was $1,040,777 ($0.18 per share) for the fiscal year ended February 28, 2011.
For non-corporate shareholders 100.00%, or the maximum amount allowable under the Jobs and Growth Tax Relief Reconciliation Act of 2003, of ordinary income distributed by the Fund for the fiscal year ended February 28, 2011 may represent qualified dividend income.
The Fund will notify shareholders in January 2012 of amounts for use in preparing 2011 income tax returns.
30
Fund Governance
The Trustees serve terms of indefinite duration. The names, addresses and birth years of the Trustees and Officers of the Funds in the Columbia Funds Series Trust, the year each was first elected or appointed to office, their principal business occupations during at least the last five years, the number of Funds overseen by each Trustee and other directorships they hold are shown below. Each officer listed below serves as an officer of each Fund in the Columbia Funds Series Trust.
Independent Trustees
Name, Address and Year of Birth,
Position with Funds, Year First
Elected or Appointed to Office | | Principal Occupation(s) During Past Five Years, Number of Funds in Columbia
Funds Complex Overseen by Trustee, Other Directorships Held
| |
| Edward J. Boudreau, Jr. (Born 1944) | |
|
c/o Columbia Management
Investment Advisers, LLC
225 Franklin Street
Boston, MA 02110
Trustee (since 2005) | | Managing Director—E.J. Boudreau & Associates (consulting), from 2000 through current; oversees 44; Trustee—BofA Funds Series Trust. | |
|
| William P. Carmichael (Born 1943) | |
|
c/o Columbia Management
Investment Advisers, LLC
225 Franklin Street
Boston, MA 02110
Trustee (since 1999) | | Retired; Oversees 44; Director—Cobra Electronics Corporation (electronic equipment manufacturer); Director—McMoRan Exploration Company (oil and gas exploration and development); Director—The Finish Line (athletic shoes and apparel); Trustee—BofA Funds Series Trust; Former Director—Simmons Company (bedding). | |
|
| William A. Hawkins (Born 1942) | |
|
c/o Columbia Management
Investment Advisers, LLC
225 Franklin Street
Boston, MA 02110
Trustee (since 2005) | | Managing Director—Overton Partners (financial consulting), August 2010 to present; President and Chief Executive Officer—California General Bank, N.A., from January 2008 through August 2010; oversees 44; Trustee—BofA Funds Series Trust. | |
|
| R. Glenn Hilliard (Born 1943) | |
|
c/o Columbia Management
Investment Advisers, LLC
225 Franklin Street
Boston, MA 02110
Trustee (since 2005) | | Chairman and Chief Executive Officer—Hilliard Group LLC (investing and consulting), from April 2003 through current; Non-Executive Director & Chairman—CNO Financial, Inc. (formerly Conseco, Inc.) (insurance), September 2003 through current; Executive Chairman—Conseco, Inc. (insurance), August 2004 through September 2005; oversees 44; Trustee—BofA Funds Series Trust. | |
|
| John J. Nagorniak (Born 1944) | |
|
c/o Columbia Management
Investment Advisers, LLC
225 Franklin Street
Boston, MA 02110
Trustee (since 2008) | | Retired; President and Director—Foxstone Financial, Inc. (consulting), 2000 through December 2007; Director—Mellon Financial Corporation affiliates (investing), 2000 through 2007; Chairman—Franklin Portfolio Associates (investing—Mellon affiliate), 1982 through 2007; oversees 44; Director—MIT Investment Company; Trustee—MIT 401k Plan. | |
|
31
Fund Governance (continued)
Independent Trustees (continued)
Name, Address and Year of Birth,
Position with Funds, Year First
Elected or Appointed to Office | | Principal Occupation(s) During Past Five Years, Number of Funds in Columbia
Funds Complex Overseen by Trustee, Other Directorships Held
| |
| Minor M. Shaw (Born 1947) | |
|
c/o Columbia Management
Investment Advisers, LLC
225 Franklin Street
Boston, MA 02110
Trustee (since 2003) | | President—Micco Corporation and Mickel Investment Group; oversees 44; Board Member—Piedmont Natural Gas; Trustee—BofA Funds Series Trust. | |
|
Interested Trustee
| Anthony M. Santomero1 (Born 1946) | |
|
c/o Columbia Management
Investment Advisers, LLC
225 Franklin Street
Boston, MA 02110
Trustee (since 2008) | | Richard K. Mellon Professor Emeritus of Finance, The Wharton School, University of Pennsylvania, from 2002 through current; Senior Advisor—McKinsey & Company (consulting), July 2006 through January 2008; President and Chief Executive Officer—Federal Reserve Bank of Philadelphia, July 2000 through April 2006; oversees 44; Director—Renaissance Reinsurance Ltd; Trustee—Penn Mutual Life Insurance Company; Director—Citigroup, Inc.; Citibank, N.A.; Trustee—BofA Funds Series Trust. | |
|
1 Dr. Santomero is currently deemed by the Columbia Funds to be an "interested person" (as defined in the 1940 Act) of the Funds because he serves as a Director of Citigroup, Inc. and Citibank N.A., companies that may directly or through subsidiaries and affiliates engage from time-to-time in brokerage execution, principal transactions and lending relationships with the Columbia Funds or other funds or accounts advised/managed by the Adviser.
The Statement of Additional Information includes additional information about the Trustees of the Funds and is available, without charge, upon request by calling 800-345-6611.
Officers
| Name, Year of Birth and Address | | Principal Occupation(s) During the Past Five Years | |
| J. Kevin Connaughton (Born 1964) | |
|
225 Franklin Street
Boston, MA 02110
President (since 2009) | | Senior Vice President and General Manager—Mutual Fund Products, Columbia Management Investment Advisers, LLC since May 2010; President, Columbia Funds, since 2009, and RiverSource Funds, since May 2010 (previously Senior Vice President and Chief Financial Officer, Columbia Funds, from June 2008 to January 2009, Treasurer, Columbia Funds, from October 2003 to May 2008, and senior officer of various other affiliated funds since 2000); Managing Director, Columbia Management Advisors, LLC from December 2004 to April 2010. | |
|
| Michael G. Clarke (Born 1969) | |
|
225 Franklin Street
Boston, MA 02110
Senior Vice President and Chief
Financial Officer (since 2009) | | Vice President, Columbia Management Investment Advisers, LLC since May 2010; Managing Director of Fund Administration, Columbia Management Advisors, LLC, from September 2004 to April 2010; senior officer of Columbia Funds and affiliated funds since 2002. | |
|
32
Fund Governance (continued)
Officers (continued)
| Name, Year of Birth and Address | | Principal Occupation(s) During the Past Five Years | |
| Scott R. Plummer (Born 1959) | |
|
5228 Ameriprise Financial Center
Minneapolis, MN 55474
Senior Vice President, Secretary
and Chief Legal Officer (since 2010) | | Chief Legal Officer and Assistant Secretary, Columbia Management Investment Advisers, LLC since June 2005; Vice President and Lead Chief Counsel—Asset Management, Ameriprise Financial, Inc. since May 2010 (previously Vice President and Chief Counsel—Asset Management, from 2005 to April 2010, and Vice President—Asset Management Compliance from 2004 to 2005); Vice President, Chief Counsel and Assistant Secretary, Columbia Management Investment Distributors, Inc. since 2008; Vice President, General Counsel and Secretary, Ameriprise Certificate Company since 2005; Chief Counsel, RiverSource Distributors, Inc. since 2006; Vice President, General Counsel and Secretary, RiverSource Funds, since December 2006; Senior Vice President, Secretary and Chief Legal Officer, Columbia Funds, since May 2010. | |
|
| Linda J. Wondrack (Born 1964) | |
|
225 Franklin Street
Boston, MA 02110
Senior Vice President and Chief
Compliance Officer (since 2007) | | Vice President and Chief Compliance Officer, Columbia Management Investment Advisers, LLC since May 2010; Chief Compliance Officer, Columbia Funds, since 2007, and RiverSource Funds, since May 2010; Director (Columbia Management Group, LLC and Investment Product Group Compliance), Bank of America, from June 2005 to April 2010. | |
|
| William F. Truscott (Born 1960) | |
|
53600 Ameriprise Financial Center
Minneapolis, MN 55474
Senior Vice President (since 2010) | | Chairman of the Board, Columbia Management Investment Advisers, LLC since May 2010 (previously President, Chairman of the Board and Chief Investment Officer, from 2001 to April 2010); Chief Executive Officer, U.S. Asset Management & President, Annuities, Ameriprise Financial, Inc. since May 2010 (previously President—U.S. Asset Management and Chief Investment Officer from 2005 to April 2010, and Senior Vice President—Chief Investment Officer, from 2001 to 2005); Director, President and Chief Executive Officer, Ameriprise Certificate Company since 2006; Director, Columbia Management Investment Distributors, Inc. since May 2010 (previously Chairman of the Board and Chief Executive Officer from 2008 to April 2010); Chairman of the Board and Chief Executive Officer, RiverSource Distributors, Inc. since 2006. | |
|
| Colin Moore (Born 1958) | |
|
225 Franklin Street
Boston, MA 02110
Senior Vice President (since 2010) | | Director and Chief Investment Officer, Columbia Management Investment Advisers, LLC since May 2010; Manager, Managing Director and Chief Investment Officer of Columbia Management Advisors, LLC from 2007 to April 2010; Head of Equities, Columbia Management Advisors, LLC from 2002 to 2007. | |
|
| Michael A. Jones (Born 1959) | |
|
225 Franklin Street
Boston, MA 02110
Senior Vice President (since 2010) | | President and Director, Columbia Management Investment Advisers, LLC since May 2010; President and Director, Columbia Management Investment Distributors, Inc. since May 2010; Manager, Chairman, Chief Executive Officer and President, Columbia Management Advisors, LLC from 2007 to April 2010; Chief Executive Officer, President and Director, Columbia Management Distributors, Inc. from November 2006 to April 2010; previously, co-president and senior managing director at Robeco Investment Management. | |
|
33
Fund Governance (continued)
Officers (continued)
| Name, Year of Birth and Address | | Principal Occupation(s) During the Past Five Years | |
| Amy Johnson (Born 1965) | |
|
5228 Ameriprise Financial Center
Minneapolis, MN 55474
Senior Vice President (since 2010) | | Senior Vice President and Chief Operating Officer, Columbia Management Investment Advisers, LLC since May 2010 (previously Chief Administrative Officer, from 2009 until April 2010, Vice President—Asset Management and Trust Company Services, from 2006 to 2009, and Vice President—Operations and Compliance from 2004 to 2006). | |
|
| Joseph F. DiMaria (Born 1968) | |
|
225 Franklin Street
Boston, MA 02110
Treasurer (since 2010) and
Chief Accounting Officer (since 2008) | | Vice President, Mutual Fund Administration, Columbia Management Investment Advisers, LLC, since May 2010; Director of Fund Administration, Columbia Management Advisors, LLC from January 2006 to April 2010; Head of Tax/Compliance and Assistant Treasurer, Columbia Management Advisors, LLC, from November 2004 to December 2005. | |
|
| Marybeth Pilat (Born 1968) | |
|
225 Franklin Street
Boston, MA 02110
Deputy Treasurer (since 2010) | | Vice President, Mutual Fund Administration, Columbia Management Investment Advisers, LLC, since May 2010; Vice President, Investment Operations, Bank of America, from October 2008 to April 2010; Finance Manager, Boston Children's Hospital from August 2008 to October 2008; Director, Mutual Fund Administration, Columbia Management Advisors, LLC, from May 2007 to July 2008; Vice President, Mutual Fund Valuation, Columbia Management Advisors, LLC, from January 2006 to May 2007; Vice President, Mutual Fund Accounting Oversight, Columbia Management Advisors, LLC from January 2005 to January 2006. | |
|
| Julian Quero (Born 1967) | |
|
225 Franklin Street
Boston, MA 02110
Deputy Treasurer (since 2008) | | Vice President, Mutual Fund Administration, Columbia Management Investment Advisers, LLC since May 2010; Director of Fund Administration, Columbia Management Advisors, LLC, from August 2008 to April 2010; Senior Tax Manager, Columbia Management Advisors, LLC from August 2006 to July 2008; Senior Compliance Manager, Columbia Management Advisors, LLC from April 2002 to August 2006. | |
|
| Stephen T. Welsh (Born 1957) | |
|
225 Franklin Street
Boston, MA 02110
Vice President (since 2006) | | President and Director, Columbia Management Investment Services Corp. since May 2010; President and Director, Columbia Management Services, Inc. from July 2004 to April 2010; Managing Director, Columbia Management Distributors, Inc. from August 2007 to April 2010. | |
|
34
Shareholder Meeting Results
At a Joint Special Meeting of Shareholders held on February 15, 2011, shareholders of the Fund considered the proposals described below.
Proposal 1. Shareholders of the Fund approved an Agreement and Plan of Reorganization pursuant to which the Fund will transfer its assets to Columbia Global Equity Fund (the "Buying Fund") in exchange for shares of the Buying Fund and the assumption by the Buying Fund of all of the liabilities of the Fund, as follows:
| Votes For | | Votes Against | | Abstentions | | Broker Non-Votes | |
| | 2,656,929 | | | | 112,591 | | | | 38,784 | | | | 1,137,362 | | |
Proposal 2. Shareholders of Columbia Funds Series Trust elected each of the nominees for trustees to the Board of Trustees of Columbia Funds Series Trust, each to hold office for an indefinite term, as follows:
| Trustee | | Votes For | | Votes Withheld | | Abstentions | |
| Kathleen Blatz | | | 2,145,636,122 | | | | 248,012,438 | | | | 0 | | |
| Edward J. Boudreau, Jr. | | | 2,145,430,114 | | | | 248,218,446 | | | | 0 | | |
| Pamela G. Carlton | | | 2,145,515,949 | | | | 248,132,612 | | | | 0 | | |
| William P. Carmichael | | | 2,145,038,695 | | | | 248,609,866 | | | | 0 | | |
| Patricia M. Flynn | | | 2,145,843,563 | | | | 247,804,997 | | | | 0 | | |
| William A. Hawkins | | | 2,145,359,401 | | | | 248,289,160 | | | | 0 | | |
| R. Glenn Hilliard | | | 2,145,079,400 | | | | 248,569,161 | | | | 0 | | |
| Stephen R. Lewis, Jr. | | | 2,145,092,209 | | | | 248,556,351 | | | | 0 | | |
| John F. Maher | | | 2,145,621,338 | | | | 248,027,223 | | | | 0 | | |
| John J. Nagorniak | | | 2,145,337,494 | | | | 248,311,067 | | | | 0 | | |
| Catherine James Paglia | | | 2,145,615,254 | | | | 248,033,306 | | | | 0 | | |
| Leroy C. Richie | | | 2,145,042,120 | | | | 248,606,441 | | | | 0 | | |
| Anthony M. Santomero | | | 2,145,088,174 | | | | 248,560,386 | | | | 0 | | |
| Minor M. Shaw | | | 2,145,430,762 | | | | 248,217,798 | | | | 0 | | |
| Alison Taunton-Rigby | | | 2,145,393,384 | | | | 248,255,177 | | | | 0 | | |
| William F. Truscott | | | 2,144,907,223 | | | | 248,741,338 | | | | 0 | | |
35
This page intentionally left blank.
Important Information About This Report
The fund mails one shareholder report to each shareholder address. If you would like more than one report, please call shareholder services at 1-800-345-6611 and additional reports will be sent to you. This report has been prepared for shareholders of Columbia Global Value Fund.
A description of the policies and procedures that the fund uses to determine how to vote proxies and a copy of the fund's voting records are available (i) at www.columbiamanagement.com, (ii) on the Securities and Exchange Commission's website at www.sec.gov, and (iii) without charge, upon request, by calling 1-800-368-0346. Information regarding how the fund voted proxies relating to portfolio securities during the 12-month period ended June 30 is available from the SEC's website. Information regarding how the fund voted proxies relating to portfolio securities is also available from the fund's website, www.columbiamanagement.com.
The fund files a complete schedule of portfolio holdings with the SEC for the first and third quarters of each fiscal year on Form N-Q. The fund's Form N-Q is available on the SEC's website at www.sec.gov and may be reviewed and copied at the SEC's Public Reference Room in Washington, D.C. Information on the operation of the Public Reference Room may be obtained by calling 1-800-SEC-0330.
Transfer Agent
Columbia Management Investment
Services Corp.
P.O. Box 8081
Boston, MA 02266-8081
1-800-345-6611
Distributor
Columbia Management Investment
Distributors, Inc.
225 Franklin Street
Boston, MA 02110
Investment Manager
Columbia Management Investment Advisers, LLC
225 Franklin Street
Boston, MA 02110
37

PRSRT STD
U.S. Postage
PAID
Holliston, MA
Permit NO. 20
Columbia Global Value Fund
P. O. Box 8081
Boston, MA 02266-8081
columbiamanagement.com
This information is for use with concurrent or prior delivery of a fund prospectus. Investors should consider the investment objectives, risks, charges and expenses of a mutual fund carefully before investing. For a free prospectus, which contains this and other important information about the funds, visit columbiamanagement.com. Read the prospectus carefully before investing. The Fund is distributed by Columbia Management Investment Distributors, Inc., member FINRA, and managed by Columbia Management Investment Advisers, LLC.
© 2011 Columbia Management Investment Advisers, LLC. All rights reserved.
C-1261 A (04/11)

Columbia International Value Fund
Annual Report for the Period Ended February 28, 2011
Not FDIC insured • No bank guarantee • May lose value
Table of Contents
| Fund Profile | | | 1 | | |
|
| Economic Update | | | 2 | | |
|
| Performance Information | | | 4 | | |
|
| Understanding Your Expenses | | | 5 | | |
|
| Portfolio Managers' Report | | | 6 | | |
|
| Investment Portfolio | | | 8 | | |
|
| Financial Statements | | | 9 | | |
|
| Notes to Financial Statements | | | 20 | | |
|
Report of Independent Registered
Public Accounting Firm | | | 27 | | |
|
| Federal Income Tax Information | | | 28 | | |
|
Columbia International Value
Master Portfolio | | | 29 | | |
|
| Investment Portfolio | | | 30 | | |
|
| Financial Statements | | | 34 | | |
|
| Notes to Financial Statements | | | 38 | | |
|
Report of Independent Registered
Public Accounting Firm | | | 44 | | |
|
| Fund Governance | | | 45 | | |
|
| Shareholder Meeting Results | | | 49 | | |
|
Important Information About
This Report | | | 53 | | |
|
The views expressed in this report reflect the current views of the respective parties. These views are not guarantees of future performance and involve certain risks, uncertainties and assumptions that are difficult to predict, so actual outcomes and results may differ significantly from the views expressed. These views are subject to change at any time based upon economic, market or other conditions and the respective parties disclaim any responsibility to update such views. These views may not be relied on as investment advice and, because investment decisions for a Columbia Fund are based on numerous factors, may not be relied on as an indication of trading intent on behalf of any particular Columbia Fund. References to specific securities should not be construed as a recommendation or investment advice.
President's Message

Dear Shareholder:
The Columbia Management story began over 100 years ago, and today, we are one of the nation's largest dedicated asset managers. The recent acquisition by Ameriprise Financial, Inc. brings together the talents, resources and capabilities of Columbia Management with those of RiverSource Investments, Threadneedle (acquired by Ameriprise in 2003) and Seligman Investments (acquired by Ameriprise in 2008) to build a best-in-class asset management business that we believe is truly greater than its parts.
RiverSource Investments traces its roots to 1894 when its then newly-founded predecessor, Investors Syndicate, offered a face-amount savings certificate that gave small investors the opportunity to build a safe and secure fund for retirement, education or other special needs. A mutual fund pioneer, Investors Syndicate launched Investors Mutual Fund in 1940. In the decades that followed, its mutual fund products and services lineup grew to include a full spectrum of styles and specialties. More than 110 years later, RiverSource continues to be a trusted financial products leader.
Threadneedle, a leader in global asset management and one of Europe's largest asset managers, offers sophisticated international experience from a dedicated U.K. management team. Headquartered in London, it is named for Threadneedle Street in the heart of the city's financial district, where British investors pioneered international and global investing. Threadneedle was acquired in 2003 and today operates as an affiliate of Columbia Management.
Seligman Investments' beginnings date back to the establishment of the investment firm J. & W. Seligman & Co. in 1864. In the years that followed, Seligman played a major role in the geographical expansion and industrial development of the United States. In 1874, President Ulysses S. Grant named Seligman as fiscal agent for the U.S. Navy—an appointment that would last through World War I. Seligman helped finance the westward path of the railroads and the building of the Panama Canal. The firm organized its first investment company in 1929 and began managing its first mutual fund in 1930. In 2008, J. & W. Seligman & Co. Incorporated was acquired and Seligman Investments became an offering brand of RiverSource Investments, LLC.
We are proud of the rich and distinctive history of these firms, the strength and breadth of products and services they offer, and the combined cultures of pioneering spirit and forward thinking. Together we are committed to providing more for our shareholders than ever before.
> A singular focus on our shareholders
Our business is asset management, so investors are our first priority. We dedicate our resources to identifying timely investment opportunities and provide a comprehensive choice of equity, fixed-income and alternative investments to help meet your individual needs.
> First-class research and thought leadership
We are dedicated to helping you take advantage of today's opportunities and anticipate tomorrow's. We stay abreast of the latest investment trends and ideas, using our collective insight to evaluate events and transform them into solutions you can use.
> A disciplined investment approach
We aren't distracted by passing fads. Our teams adhere to a rigorous investment process that helps ensure the integrity of our products and enables you and your financial advisor to match our solutions to your objectives with confidence.
When you choose Columbia Management, you can be confident that we will take the time to understand your needs and help you and your financial advisor identify the solutions that are right for you. Because at Columbia Management, we don't consider ourselves successful unless you are.
Sincerely,

J. Kevin Connaughton
President, Columbia Funds
Investors should consider the investment objectives, risks, charges and expenses of a mutual fund carefully before investing. For a free prospectus, which contains this and other important information about the funds, visit www.columbiamanagement.com. The prospectus should be read carefully before investing.
Columbia Funds are distributed by Columbia Management Investment Distributors, Inc., member FINRA, and managed by Columbia Management Investment Advisers, LLC.
© 2011 Columbia Management Investment Advisers, LLC. All rights reserved.
Fund Profile – Columbia International Value Fund
Summary
g For the 12-month period that ended February 28, 2011, the fund's Class A shares returned 15.47% without sales charge.
g The fund underperformed its benchmark, the MSCI EAFE Value Index (Net)1, which returned 18.55% for the same period.
g The fund's holdings in the wireless telecommunication services industry and also in companies domiciled in Japan generally accounted for the performance shortfall relative to the index.
Portfolio Management
Columbia Funds are managed by Columbia Management Investment Advisers, LLC (CMIA). CMIA has retained Brandes Investment Partners, L.P. (Brandes) to serve as investment subadviser. As an investment subadviser, Brandes makes the investment decisions and manages all or a portion of the Fund. Brandes is an investment adviser registered with the Securities and Exchange Commission. Brandes is not affiliated with CMIA.
The following are the six voting members of Brandes' Large Cap Investment Committee who are jointly responsible for making day-to-day investment decisions for the Fund: Glenn Carlson, Brent Woods, Amelia Morris, Jim Brown, Brent Fredberg, and Jeffrey Germain. Chief Executive Officer (CEO) Glenn Carlson has been with Brandes since 1986, serving as Managing Partner from 1996-2002, co-CEO from 2002-2004, and CEO since 2004. Brent Woods has been with Brandes since 1995, serving as Managing Partner from 1998-2002 and Managing Director of Investments since 2002. Amelia Morris has been with Brandes since 1998, serving as a Senior Research Analyst from 1998-2004, and Director of Investments since 2004. Jim Brown has been with Brandes since 1996, serving as a Senior Research Analyst from 1996-2004, and Director of Investments since 2004. Brent Fredberg has been with Brandes since 1999, serving as an Analyst from 1999-2003, serving as Senior Research Analyst from 2003-2010, and Director of Investments since 2010. Jeffrey Germain has been with Brandes since 2001, serving as a Research Associate from 2001-2004, Senior Research Associate from 2004-2005, Research Analyst from 2005-2010, and Senior Analyst since 2010.
1The Morgan Stanley Capital International Europe, Australasia, Far East (MSCI EAFE) Value Index (Net) is a subset of the MSCI EAFE Index (Net), and constituents of the index include securities from Europe, Australasia and the Far East. The index generally represents approximately 50% of the free float-adjusted market capitalization of the underlying MSCI EAFE Index (Net), and consists of those securities classified by Morgan Stanley Capital International, Inc. (MSCI) as most representing the value style, such as higher book value-to-price ratios, higher forward earnings-to-price ratios, higher dividend yields and lower forecasted growth rates than securities representing the growth style.
Indices are not available for investment, are not professionally managed and do not reflect sales charges, fees, brokerage commissions, taxes or other expenses of investing. Securities in the fund may not match those in an index.
Performance data quoted represents past performance and current performance may be lower or higher. Past performance is no guarantee of future results. The investment return and principal value will fluctuate so that shares, when redeemed, may be worth more or less than the original cost. Please visit www.columbiamanagement.com for daily and most recent month-end performance updates.
Summary
1-year return as of 02/28/11
| | | | +15.47% | |
|
|  | | | Class A shares
(without sales charge) | |
|
| | | | +18.55% | |
|
|  | | | MSCI EAFE Value Index (Net) | |
|
Morningstar Style BoxTM
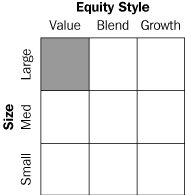
The Morningstar Style BoxTM is based on the fund's portfolio holdings. For equity funds, the vertical axis shows the market capitalization of the stocks owned, and the horizontal axis shows investment style (value, blend or growth). Information shown is based on the most recent data provided by Morningstar.
© 2011 Morningstar, Inc. All rights reserved. The Morningstar information contained herein: (1) is proprietary to Morningstar and/or its content providers; (2) may not be copied or distributed; and (3) is not warranted to be accurate, complete or timely. Neither Morningstar nor its content providers are responsible for any damages or losses arising from any use of this information.
1
Economic Update – Columbia International Value Fund
Summary
For the 12-month period that ended February 28, 2011
g Despite intermittent volatility, stock markets around the world gained ground, as measured by the S&P 500 Index, the MSCI EAFE Index (Net) and the MSCI Emerging Markets Index (Net).
| S&P Index | | MSCI EAFE
Index | |
|
 | |  | |
|
MSCI EM
Index | |
|
 | |
|
As the world shed concerns that key economies might lapse back into recession, the World Bank reported that global gross domestic product rose 3.9% in 2010. The improvement over 2009 was more notable in high-income developed economies than in emerging-market countries, which had less ground to make up. Emerging market countries expanded by an estimated 7%, contributing nearly half of all global growth in 2010. This two-speed global recovery is likely to result in slower growth in 2011, but global growth should remain solid at 3.3% to 3.6%1—higher in emerging market economies, led by China and India.
Robust expansion in the Asia Pacific region
Asian Pacific economies led the global economy in 2010 and are poised to continue in that role. Exports from markets such as Singapore and South Korea have been solid and domestic demand continues to strengthen. Labor markets are healthy, income is rising and confidence runs high across the region. Higher oil prices pose a downside risk to the current expansion, because it could erode demand for Asian exports and increase the risk of inflation. However, if growth exceeds expectations in the United States or Europe, the picture gets even better for Asia.
Austerity measures weigh on Europe
Growth in the developed world was hampered by a debt crisis in Europe's weakest nations. However, the European Union took steps to manage debt restructuring in an orderly fashion and fear subsided—at least, for now. In addition, austerity measures were introduced in Greece, Ireland, Portugal and Spain. Public employment and government spending were cut back sharply. Layoffs and pay cuts have been met with resistance, but their necessity is hard to dispute.
Inflation a growing worry
As demand picked up and commodity prices began to rise across the globe, inflation has become a growing worry in both fast-growing emerging markets and slower-growth developed countries. In developed market economies, inflation is generally an external force, resulting from higher commodity prices, especially for food and energy. In emerging markets, excess demand is driving inflation concerns and policymakers have begun to shift their focus from stimulating growth to taming inflation. However, rising food prices are also a problem in Asia since food accounts for a greater percentage of household budgets than it does in more developed areas of the world.
Stocks stall, then pick up steam
Despite a period of volatility in the summer of 2010, as the world sought to digest a mounting debt crisis within euro-zone countries, it was a good year for stock markets around the world. The U.S. stock market returned 22.57% for the 12-month period, as measured by the S&P 500 Index.2 Outside the U.S., stock market returns were also strong. The MSCI EAFE Index (Net),3 a
1World Bank estimate, January 12, 2011.
2The Standard & Poor's (S&P) 500 Index tracks the performance of 500 widely held, large-capitalization U.S. stocks.
3The Morgan Stanley Capital International Europe, Australasia, Far East (MSCI EAFE) Index (Net) is a free float adjusted market capitalization index that is designed to measure the equity market performance of developed markets, excluding the U.S. & Canada. As of May 27, 2010, the MSCI EAFE Index (Net) consisted of the following 22 developed market country indices: Australia, Austria, Belgium, Denmark, Finland, France, Germany, Greece, Hong Kong, Ireland, Israel, Italy, Japan, the Netherlands, New Zealand, Norway, Portugal, Singapore, Spain, Sweden, Switzerland and the United Kingdom.
2
Economic Update (continued) – Columbia International Value Fund
broad gauge of stock market performance in foreign developed markets, gained 20.00% (in U.S. dollars) for the period. The MSCI Emerging Markets Index (Net)4 returned 20.91% (in U.S. dollars), led by strong performances from European and Eastern European markets. Rising inflation pressures and tighter monetary policy late in the 12-month period tempered returns.
Past performance is no guarantee of future results.
4The Morgan Stanley Capital International Emerging Markets (MSCI EM) Index (Net) is a free float-adjusted market capitalization index that is designed to measure equity market performance of emerging markets. As of May 27, 2010, the MSCI EM Index (Net) consisted of the following 21 emerging market country indices: Brazil, Chile, China, Colombia, Czech Republic, Egypt, Hungary, India, Indonesia, Korea, Malaysia, Mexico, Morocco, Peru, Philippines, Poland, Russia, South Africa, Taiwan, Thailand and Turkey.
Indices are not available for investment, are not professionally managed and do not reflect sales charges, fees, brokerage commissions, taxes or other expenses of investing. Securities in the fund may not match those in an index.
3
Performance Information – Columbia International Value Fund
Performance data quoted represents past performance and current performance may be lower or higher. Past performance is no guarantee of future results. The investment return and principal value will fluctuate so that shares, when redeemed, may be worth more or less than the original cost. Please visit www.columbiamanagement.com for daily and most recent month-end performance updates.
Performance of a $10,000 investment 03/01/01 – 02/28/11
The chart above shows the change in value of a hypothetical $10,000 investment in Class A shares of Columbia International Value Fund during the stated time period, and does not reflect the deduction of taxes that a shareholder may pay on fund distributions or on the redemption of fund shares.
Performance of a $10,000 investment 03/01/01 – 02/28/11 ($)
| Sales charge | | without | | with | |
| Class A | | | 18,061 | | | | 17,024 | | |
| Class B | | | 16,790 | | | | 16,790 | | |
| Class C | | | 16,763 | | | | 16,763 | | |
| Class I | | | n/a | | | | n/a | | |
| Class R | | | n/a | | | | n/a | | |
| Class Z | | | 18,528 | | | | n/a | | |
Average annual total return as of 02/28/11 (%)
| Share class | | A | | B | | C | | I | | R | | Z | |
| Inception | | 12/27/95 | | 05/22/98 | | 06/15/98 | | 09/27/10 | | 09/27/10 | | 12/27/95 | |
| Sales charge | | without | | with | | without | | with | | without | | with | | without | | without | | without | |
| 1-year | | | 15.47 | | | | 8.85 | | | | 14.75 | | | | 9.75 | | | | 14.62 | | | | 13.62 | | | | n/a | | | | n/a | | | | 15.74 | | |
| 5-year | | | 2.31 | | | | 1.11 | | | | 1.59 | | | | 1.35 | | | | 1.55 | | | | 1.55 | | | | n/a | | | | n/a | | | | 2.58 | | |
| 10-year/Life | | | 6.09 | | | | 5.46 | | | | 5.32 | | | | 5.32 | | | | 5.30 | | | | 5.30 | | | | 12.22 | | | | 11.92 | | | | 6.36 | | |
The "with sales charge" returns include the maximum initial sales charge of 5.75% for Class A shares and the applicable contingent deferred sales charge of 5.00% in the first year, declining to 1.00% in the sixth year and eliminated thereafter for Class B shares and 1.00% for Class C shares for the first year only. The "without sales charge" returns do not include the effect of sales charges. If they had, returns would be lower.
Performance results reflect any fee waivers or reimbursements of fund expenses by the Investment Manager and/or any of its affiliates. Absent these fee waivers or expense reimbursement arrangements, performance results would have been lower.
All results shown assume reinvestment of distributions. Class I and Class Z shares are sold at net asset value with no distribution and service (Rule 12b-1) fees. Class R shares are sold at net asset value with a distribution (Rule 12b-1) fee. Class I, Class R and Class Z shares have limited eligibility and the investment minimum requirements may vary. Please see the fund's prospectus for details. Performance for different share classes will vary based on differences in sales charges and fees associated with each class.
Class I and Class R shares were initially offered on September 27, 2010.
The tables do not reflect the deduction of taxes that a shareholder may pay on fund distributions or on the redemption of fund shares.
4
Understanding Your Expenses – Columbia International Value Fund
As a fund shareholder, you incur two types of costs. There are transaction costs, which generally include sales charges on purchases and may include redemption fees or exchange fees. There are also ongoing costs, which generally include investment advisory fees, distribution and service (Rule 12b-1) fees and other fund expenses. The information on this page is intended to help you understand the ongoing costs of investing in the fund and to compare these costs with the ongoing costs of investing in other mutual funds.
Analyzing your fund's expenses by share class
To illustrate these ongoing costs, we have provided an example and calculated the expenses paid by investors in each share class during the period. The information in the following table is based on an initial investment of $1,000, which is invested at the beginning of the period and held for the entire period. Expense information is calculated two ways and each method provides you with different information. The amount listed in the "Actual" column is calculated using the fund's actual operating expenses and total return for the period. The amount listed in the "Hypothetical" column for each share class assumes that the return each year is 5% before expenses and is calculated based on the fund's actual operating expenses. You should not use the hypothetical account values and expenses to estimate either your actual account balance at the end of the period or the expenses you paid during this period.
Compare with other funds
Since all mutual funds are required to include the same hypothetical calculations about expenses in shareholder reports, you can use this information to compare the ongoing cost of investing in the fund with other funds. To do so, compare the 5% hypothetical example with the 5% hypothetical examples that appear in the shareholder reports of other funds. As you compare hypothetical examples of other funds, it is important to note that hypothetical examples are meant to highlight the ongoing costs of investing in a fund and do not reflect any transaction costs, such as sales charges, redemption fees or exchange fees.
Estimating your actual expenses
To estimate the expenses that you paid over the period, first you will need your account balance at the end of the period:
g For shareholders who receive their account statements from Columbia Management Investment Services Corp., your account balance is available online at www.columbiamanagement.com or by calling Shareholder Services at 800.345.6611.
g For shareholders who receive their account statements from their financial intermediary, contact your financial intermediary to obtain your account balance.
1. Divide your ending account balance by $1,000. For example, if an account balance was $8,600 at the end of the period, the result would be 8.6.
2. In the section of the table below titled "Expenses paid during the period," locate the amount for your share class. You will find this number in the column labeled "Actual." Multiply this number by the result from step 1. Your answer is an estimate of the expenses you paid on your account during the period.
If the value of your account falls below the minimum initial investment requirement applicable to you, your account may be subject to a $20 annual fee. This fee is not included in the accompanying table. If you are subject to the fee, keep it in mind when you are estimating the ongoing expenses of investing in the fund and when comparing the expenses of this fund with other funds.
09/01/10 – 02/28/11
| | | Account value at the
beginning of the period ($) | | Account value at the
end of the period ($) | | Expenses paid
during the period ($) | | Fund's annualized
expense ratio (%) | |
| | | Actual | | Hypothetical | | Actual | | Hypothetical | | Actual | | Hypothetical | | Actual | |
| Class A | | | 1,000.00 | | | | 1,000.00 | | | | 1,218.80 | | | | 1,017.26 | | | | 8.36 | | | | 7.60 | | | | 1.52 | | |
| Class B | | | 1,000.00 | | | | 1,000.00 | | | | 1,214.40 | | | | 1,013.54 | | | | 12.46 | | | | 11.33 | | | | 2.27 | | |
| Class C | | | 1,000.00 | | | | 1,000.00 | | | | 1,214.10 | | | | 1,013.54 | | | | 12.46 | | | | 11.33 | | | | 2.27 | | |
| Class I | | | 1,000.00 | | | | 1,000.00 | | | | 1,082.20 | * | | | 1,019.49 | | | | 4.70 | * | | | 5.36 | | | | 1.07 | | |
| Class R | | | 1,000.00 | | | | 1,000.00 | | | | 1,080.60 | * | | | 1,016.02 | | | | 7.77 | * | | | 8.85 | | | | 1.77 | | |
| Class Z | | | 1,000.00 | | | | 1,000.00 | | | | 1,219.70 | | | | 1,018.50 | | | | 6.99 | | | | 6.36 | | | | 1.27 | | |
Expenses paid during the period are equal to the annualized expense ratio for the share class, multiplied by the average account value over the period, then multiplied by the number of days in the fund's most recent fiscal half-year and divided by 365.
It is important to note that the expense amounts shown in the table are meant to highlight only ongoing costs of investing in the fund and do not reflect any transaction costs, such as sales charges, redemption fees or exchange fees. Therefore, the hypothetical examples provided may not help you determine the relative total costs of owning shares of different funds. If these transaction costs were included, your costs would have been higher.
*For the period September 27, 2010 through February 28, 2011. Class I and Class R shares commenced operations on September 27, 2010.
5
Portfolio Managers' Report – Columbia International Value Fund
Performance data quoted represents past performance and current performance may be lower or higher. Past performance is no guarantee of future results. The investment return and principal value will fluctuate so that shares, when redeemed, may be worth more or less than the original cost. Please visit www.columbiamanagement.com for daily and most recent month-end performance updates.
Net asset value per share
as of 02/28/11 ($)
| Class A | | | 15.12 | | |
| Class B | | | 14.61 | | |
| Class C | | | 14.56 | | |
| Class I | | | 15.27 | | |
| Class R | | | 15.15 | | |
| Class Z | | | 15.28 | | |
Distributions declared per share
03/01/10 – 02/28/11 ($)
| Class A | | | 0.39 | | |
| Class B | | | 0.29 | | |
| Class C | | | 0.29 | | |
| Class I | | | 0.33 | | |
| Class R | | | 0.25 | | |
| Class Z | | | 0.43 | | |
For the 12-month period that ended February 28, 2011, the Fund's Class A shares returned 15.47% without sales charge. The fund's benchmark, the MSCI EAFE Value Index (Net), returned 18.55% over the same period. The fund's positions in wireless telecommunication services and companies domiciled in Japan detracted from relative performance. Please keep in mind that industry and country weights are a residual of our bottom-up, stock-specific investment approach.
Stock selection and certain industry allocations were detractors
Relative to the MSCI EAFE Value Index (Net), stock selection within the food & staples retailing industry and companies domiciled in the Netherlands were disappointing. In addition, an overweight relative to the index in emerging market securities contributed to weaker results. By contrast, the fund's stock selection decisions within the media industry were rewarded with performance that was better than the index.
Telecom, pharmaceuticals and insurance holdings drove gains
The fund's holdings in the diversified telecommunication services, pharmaceuticals and insurance industries had the most substantial positive impact on returns. The top contributors in these industries included Portugal Telecom, a Portuguese diversified telecommunication services company; AstraZeneca, a U.K. pharmaceuticals company and Swiss Reinsurance, an insurance company based in Switzerland (1.3%, 1.5% and 2.3% of net assets, respectively).
From a country perspective, gains from certain companies based in Japan, the United Kingdom and Switzerland benefited returns. Canon (2.1% of net assets), a Japanese office electronics company; Swiss Reinsurance, a Swiss insurance company and ITV (1.7% of net assets), a British media firm, were among the standout performers in these countries. Despite negative performance versus the MSCI EAFE Value Index (Net), holdings in Japan contributed to positive absolute performance for the fund during the 12-month period.
Research drove portfolio changes
As a result of our company-by-company analysis, we sold a position in BASF, a German chemicals company, to pursue what we believed to be more attractive opportunities. We purchased shares of Total (2.2% of net assets), the France-based oil, gas & consumable fuels company, at a price that we considered to be attractive.
6
Portfolio Managers' Report (continued) – Columbia International Value Fund
Looking ahead
We will continue to seek out good companies whose stocks are attractively priced. Even during periods of underperformance relative to the fund's benchmark, we believe the fund can generate solid returns for shareholders. We believe that our ability to think and act differently than the market consensus will continue to help us add value for shareholders over the long term.
The foregoing reflects the thoughts and opinions of Brandes Investment Partners® exclusively and is subject to change without notice.
Brandes Investment Partners® is a registered trademark of Brandes Investment Partners, L.P. in the United States and Canada.
Source for all statistical data: Columbia Management Investment Advisers, LLC.
Source for all stock-specific commentary: Brandes
Portfolio characteristics and holdings are subject to change periodically and may not be representative of current characteristics and holdings. The outlook for the Fund may differ from those presented for other Columbia Funds.
Equity securities are affected by stock market fluctuations that occur in response to economic and business developments.
International investing may involve special risks, including foreign taxation, currency risks, risks associated with possible differences in financial standards and other risks associated with future political and economic developments.
Investing in emerging markets may involve greater risks than investing in more developed countries. In addition, concentration of investments in a single region may result in greater volatility.
Top 5 sectors
as of 02/28/11 (%)
| Telecommunication Services | | | 20.0 | | |
| Financials | | | 19.9 | | |
| Information Technology | | | 14.3 | | |
| Health Care | | | 11.7 | | |
| Consumer Staples | | | 11.5 | | |
Top 10 holdings
as of 02/28/11 (%)
| Deutsche Telekom | | | 2.6 | | |
| ENI | | | 2.6 | | |
| Sanofi-Aventis | | | 2.4 | | |
| Nippon Telegraph & Telephone | | | 2.3 | | |
| Swiss Reinsurance | | | 2.3 | | |
| Carrefour | | | 2.2 | | |
| Telecom Italia, Saving Shares | | | 2.2 | | |
| Total | | | 2.2 | | |
| Canon | | | 2.1 | | |
| Aegon NV | | | 2.1 | | |
The Master Portfolio is actively managed and the composition of its portfolio will change over time. Information provided is calculated as a percentage of net assets.
The fund is a feeder fund that invests all or substantially all of its assets in a Master Portfolio. Holdings information referenced in this section is that of the Master Portfolio.
7
Investment Portfolio – Columbia International Value Fund
February 28, 2011
| Investment Company – 100.4% | |
| | | Value ($) | |
Investment in Columbia Funds
Master Investment Trust, LLC,
Columbia International Value
Master Portfolio (a) | | | 1,746,075,503 | | |
| Total Investments – 100.4% | | | 1,746,075,503 | | |
| Other Assets & Liabilities, Net – (0.4)% | | | (6,691,192 | ) | |
| Net Assets – 100.0% | | | 1,739,384,311 | | |
Notes to Investment Portfolio:
(a) The financial statements of Columbia International Value Master Portfolio, including its investment portfolio, are included elsewhere within this report and should be read in conjunction with Columbia International Value Fund's financial statements.
Columbia International Value Fund Invests only in Columbia International Value Master Portfolio (the Master Portfolio). At February 28, 2011, Columbia International Value Fund owned 88.3% of the Master Portfolio. Columbia International Value Master Portfolio was invested in the following countries at February 28, 2011.
Summary of Securities
by Country (Unaudited) | | Value | | % of Total
Investments | |
| Japan | | $ | 640,734,683 | | | | 32.7 | | |
| United Kingdom | | | 292,873,107 | | | | 14.9 | | |
| France | | | 240,698,133 | | | | 12.3 | | |
| Italy | | | 163,308,643 | | | | 8.3 | | |
| Netherlands | | | 152,252,936 | | | | 7.8 | | |
| Switzerland | | | 126,152,447 | | | | 6.4 | | |
| Brazil | | | 76,234,442 | | | | 3.9 | | |
| Germany | | | 64,465,296 | | | | 3.3 | | |
| South Korea | | | 49,786,097 | | | | 2.5 | | |
| Mexico | | | 44,094,924 | | | | 2.2 | | |
| Sweden | | | 30,674,039 | | | | 1.6 | | |
| Portugal | | | 25,474,129 | | | | 1.3 | | |
| Finland | | | 21,350,331 | | | | 1.1 | | |
| Spain | | | 17,833,617 | | | | 0.9 | | |
| New Zealand | | | 11,759,038 | | | | 0.6 | | |
| United States* | | | 4,271,000 | | | | 0.2 | | |
| | | $ | 1,961,962,862 | | | | 100.0 | | |
* Includes short-term obligation.
Certain securities are listed by country of underlying exposure but may trade predominantly on another exchange.
See Accompanying Notes to Financial Statements.
8
Statement of Assets and Liabilities – Columbia International Value Fund
February 28, 2011
| | | | | ($) | |
| Assets | | Investment in Columbia International Value Master Portfolio, at identified cost | | | 1,834,966,330 | | |
| | | Investment in Columbia International Value Master Portfolio, at value | | | 1,746,075,503 | | |
| | | Receivable for Fund shares sold | | | 2,334,717 | | |
| | | Total Assets | | | 1,748,410,220 | | |
| Liabilities | | Payable for: | | | | | |
| | | Fund shares repurchased | | | 7,630,662 | | |
| | | Administration fee | | | 222,073 | | |
| | | Pricing and bookkeeping | | | 3,167 | | |
| | | Transfer agent fee | | | 916,040 | | |
| | | Trustees' fees | | | 28,065 | | |
| | | Custody fee | | | 801 | | |
| | | Distribution and service fees | | | 115,990 | | |
| | | Chief compliance officer expenses | | | 380 | | |
| | | Other liabilities | | | 108,731 | | |
| | | Total Liabilities | | | 9,025,909 | | |
| | | Net Assets | | | 1,739,384,311 | | |
| Net Assets Consist of | | Paid-in capital | | | 2,113,778,403 | | |
| | | Overdistributed net investment income | | | (6,314,587 | ) | |
| | | Accumulated net realized loss | | | (279,188,678 | ) | |
| | | Net unrealized depreciation on investments | | | (88,890,827 | ) | |
| | | Net Assets | | | 1,739,384,311 | | |
See Accompanying Notes to Financial Statements.
9
Statement of Assets and Liabilities (continued) – Columbia International Value Fund
February 28, 2011
| Class A | | Net assets | | $ | 367,847,084 | | |
| | | Shares outstanding | | | 24,320,717 | | |
| | | Net asset value per share | | $ | 15.12 | (a) | |
| | | Maximum sales charge | | | 5.75 | % | |
| | | Maximum offering price per share ($15.12/0.9425) | | $ | 16.04 | (b) | |
| Class B | | Net assets | | $ | 1,437,021 | | |
| | | Shares outstanding | | | 98,378 | | |
| | | Net asset value and offering price per share | | $ | 14.61 | (a) | |
| Class C | | Net assets | | $ | 57,792,749 | | |
| | | Shares outstanding | | | 3,968,872 | | |
| | | Net asset value and offering price per share | | $ | 14.56 | (a) | |
| Class I (c) | | Net assets | | $ | 34,506,066 | | |
| | | Shares outstanding | | | 2,259,941 | | |
| | | Net asset value, offering and redemption price per share | | $ | 15.27 | | |
| Class R (c) | | Net assets | | $ | 2,748 | | |
| | | Shares outstanding | | | 181 | | |
| | | Net asset value, offering and redemption price per share | | $ | 15.15 | (d) | |
| Class Z | | Net assets | | $ | 1,277,798,643 | | |
| | | Shares outstanding | | | 83,638,465 | | |
| | | Net asset value, offering and redemption price per share | | $ | 15.28 | | |
(a) Redemption price per share is equal to net asset value less any applicable contingent deferred sales charge.
(b) On sales of $50,000 or more the offering price is reduced.
(c) Class I and Class R shares commenced operations on September 27, 2010.
(d) Net asset value per share rounds to this amount due to fractional shares outstanding.
See Accompanying Notes to Financial Statements.
10
Statement of Operations – Columbia International Value Fund
For the Year Ended February 28, 2011
| | | | | ($) | |
| Investment Income | | Allocated from Master Portfolio: | | | | | |
| | | Dividends | | | 59,531,847 | | |
| | | Interest | | | 9,969 | | |
| | | Foreign taxes withheld | | | (8,723,214 | ) | |
| | | Expenses (a) | | | (14,301,532 | ) | |
| | | Total Investment Income | | | 36,517,070 | | |
| Expenses | | Administration fee | | | 2,770,453 | | |
| | | Distribution fee: | | | | | |
| | | Class B | | | 18,787 | | |
| | | Class C | | | 441,573 | | |
| | | Class R | | | 5 | | |
| | | Service fee: | | | | | |
| | | Class B | | | 6,262 | | |
| | | Class C | | | 147,191 | | |
| | | Distribution and service fees—Class A | | | 934,348 | | |
| | | Transfer agent fee—Class A, Class B, Class C, Class R and Class Z | | | 2,658,070 | | |
| | | Pricing and bookkeeping | | | 38,000 | | |
| | | Trustees' fees | | | 25,052 | | |
| | | Custody fee | | | 3,613 | | |
| | | Chief compliance officer expenses | | | 2,528 | | |
| | | Other expenses | | | 457,539 | | |
| | | Expenses before interest expense | | | 7,503,421 | | |
| | | Interest expense allocated from Master Portfolio | | | 7,461 | | |
| | | Total Expenses | | | 7,510,882 | | |
| | | Expense reductions | | | (3 | ) | |
| | | Net Expenses | | | 7,510,879 | | |
| | | Net Investment Income | | | 29,006,191 | | |
| Net Realized and Unrealized Gain (Loss) on Investments and Foreign Currency | | Net realized loss allocated from Master Portfolio on: | | | | | |
| | | Investments | | | (79,446,469 | ) | |
| | | Foreign currency transactions | | | (192,209 | ) | |
| | | Net realized loss | | | (79,638,678 | ) | |
| | | Net change in unrealized appreciation (depreciation) on investments
allocated from Master Portfolio | | | 287,733,276 | | |
| | | Net Gain | | | 208,094,598 | | |
| | | Net Increase Resulting from Operations | | | 237,100,789 | | |
(a) Net expenses allocated from Master Portfolio include the Fund's pro-rata portion of the Master Portfolio's investment advisory, administration, pricing and bookkeeping, Trustees' fees and other expenses.
See Accompanying Notes to Financial Statements.
11
Statement of Changes in Net Assets – Columbia International Value Fund
| | | Year Ended February 28, | |
| Increase (Decrease) in Net Assets | | 2011 ($)(a)(b) | | 2010 ($) | |
| Operations Net investment income | | | 29,006,191 | | | | 40,188,961 | | |
| Net realized loss allocated from Master Portfolio | | | (79,638,678 | ) | | | (159,976,692 | ) | |
Net change in unrealized appreciation (depreciation)
allocated from Master Portfolio | | | 287,733,276 | | | | 603,196,909 | | |
| Net increase resulting from operations | | | 237,100,789 | | | | 483,409,178 | | |
| Distributions to Shareholders From net investment income: | | | | | | | | | |
| Class A | | | (10,501,221 | ) | | | (5,462,082 | ) | |
| Class B | | | (31,120 | ) | | | (112,512 | ) | |
| Class C | | | (1,255,137 | ) | | | (642,030 | ) | |
| Class I | | | (29,462 | ) | | | — | | |
| Class R | | | (45 | ) | | | — | | |
| Class Z | | | (36,753,860 | ) | | | (20,344,658 | ) | |
| Total distributions to shareholders | | | (48,570,845 | ) | | | (26,561,282 | ) | |
| Net Capital Stock Transactions | | | (90,034,060 | ) | | | 29,692,285 | | |
| Redemption fees | | | — | | | | 111,554 | | |
| Increase from regulatory settlements | | | 108,538 | | | | 417,242 | (c) | |
| Total increase in net assets | | | 98,604,422 | | | | 487,068,977 | | |
| Net Assets Beginning of period | | | 1,640,779,889 | | | | 1,153,710,912 | | |
| End of period | | | 1,739,384,311 | | | | 1,640,779,889 | | |
Undistributed (overdistributed) net investment income
at end of period | | | (6,314,587 | ) | | | 13,350,907 | | |
(a) Class I and Class R shares commenced operations on September 27, 2010.
(b) Class I and Class R shares reflect activity for the period September 27, 2010 through February 28, 2011.
(c) Allocated from Master Portfolio.
See Accompanying Notes to Financial Statements.
12
Statement of Changes in Net Assets (continued) – Columbia International Value Fund
| | | Capital Stock Activity | |
| | | Year Ended
February 28, 2011 (a)(b) | | Year Ended
February 28, 2010 | |
| | | Shares | | Dollars ($) | | Shares | | Dollars ($) | |
| Class A | |
| Subscriptions | | | 7,203,721 | | | | 99,387,352 | | | | 11,513,261 | | | | 151,911,595 | | |
| Distributions reinvested | | | 618,142 | | | | 8,293,553 | | | | 337,933 | | | | 4,687,130 | | |
| Redemptions | | | (11,725,247 | ) | | | (161,161,045 | ) | | | (9,268,575 | ) | | | (118,955,238 | ) | |
| Net increase (decrease) | | | (3,903,384 | ) | | | (53,480,140 | ) | | | 2,582,619 | | | | 37,643,487 | | |
| Class B | |
| Subscriptions | | | 24,199 | | | | 326,879 | | | | 79,922 | | | | 1,055,427 | | |
| Distributions reinvested | | | 1,744 | | | | 22,401 | | | | 7,253 | | | | 97,260 | | |
| Redemptions | | | (578,776 | ) | | | (7,649,102 | ) | | | (1,497,283 | ) | | | (18,383,672 | ) | |
| Net decrease | | | (552,833 | ) | | | (7,299,822 | ) | | | (1,410,108 | ) | | | (17,230,985 | ) | |
| Class C | |
| Subscriptions | | | 287,489 | | | | 3,834,791 | | | | 642,151 | | | | 8,330,678 | | |
| Distributions reinvested | | | 66,784 | | | | 861,421 | | | | 33,260 | | | | 445,349 | | |
| Redemptions | | | (1,304,444 | ) | | | (17,279,783 | ) | | | (1,235,742 | ) | | | (14,921,103 | ) | |
| Net decrease | | | (950,171 | ) | | | (12,583,571 | ) | | | (560,331 | ) | | | (6,145,076 | ) | |
| Class I | |
| Subscriptions | | | 2,946,162 | | | | 41,364,980 | | | | — | | | | — | | |
| Distributions reinvested | | | 2,089 | | | | 29,403 | | | | — | | | | — | | |
| Redemptions | | | (688,310 | ) | | | (9,989,541 | ) | | | — | | | | — | | |
| Net increase | | | 2,259,941 | | | | 31,404,842 | | | | — | | | | — | | |
| Class R | |
| Subscriptions | | | 181 | | | | 2,500 | | | | — | | | | — | | |
| Net increase | | | 181 | | | | 2,500 | | | | — | | | | — | | |
| Class Z | |
| Subscriptions | | | 25,508,322 | | | | 355,263,216 | | | | 29,734,906 | | | | 387,997,483 | | |
| Distributions reinvested | | | 1,622,754 | | | | 22,067,009 | | | | 764,486 | | | | 10,702,805 | | |
| Redemptions | | | (30,733,729 | ) | | | (425,408,094 | ) | | | (32,234,509 | ) | | | (383,275,429 | ) | |
| Net decrease | | | (3,602,653 | ) | | | (48,077,869 | ) | | | (1,735,117 | ) | | | 15,424,859 | | |
(a) Class I and Class R shares commenced operations on September 27, 2010.
(b) Class I and Class R shares reflect activity for the period September 27, 2010 through February 28, 2011.
See Accompanying Notes to Financial Statements.
13
Financial Highlights – Columbia International Value Fund
Selected data for a share outstanding throughout each period is as follows:
| | | Year Ended February 28, | | Period Ended
February 29, | | Year Ended March 31, | |
| Class A Shares (a) | | 2011 | | 2010 | | 2009 | | 2008 (b) | | 2007 | | 2006 (c) | |
| Net Asset Value, Beginning of Period | | $ | 13.48 | | | $ | 9.40 | | | $ | 18.95 | | | $ | 26.02 | | | $ | 24.97 | | | $ | 22.34 | | |
| Income from Investment Operations: | |
| Net investment income (d) | | | 0.22 | | | | 0.33 | (e) | | | 0.52 | | | | 0.65 | | | | 0.29 | | | | 0.31 | | |
Net realized and unrealized gain (loss)
on investments and foreign currency | | | 1.81 | | | | 3.96 | | | | (7.83 | ) | | | (1.95 | ) | | | 4.34 | | | | 4.73 | | |
| Total from investment operations | | | 2.03 | | | | 4.29 | | | | (7.31 | ) | | | (1.30 | ) | | | 4.63 | | | | 5.04 | | |
| Less Distributions to Shareholders: | |
| From net investment income | | | (0.39 | ) | | | (0.21 | ) | | | (0.53 | ) | | | (0.68 | ) | | | (0.34 | ) | | | (0.35 | ) | |
| From net realized gains | | | — | | | | — | | | | (1.70 | ) | | | (5.09 | ) | | | (3.24 | ) | | | (2.06 | ) | |
| From return of capital | | | — | | | | — | | | | (0.01 | ) | | | — | | | | — | | | | — | | |
| Total distributions to shareholders | | | (0.39 | ) | | | (0.21 | ) | | | (2.24 | ) | | | (5.77 | ) | | | (3.58 | ) | | | (2.41 | ) | |
| Redemption Fees: | |
| Redemption fees added to paid-in-capital | | | — | | | | — | (f) | | | — | (f) | | | — | (f) | | | — | (f) | | | — | (f) | |
| Increase from regulatory settlements | | | — | (f) | | | — | (f) | | | — | | | | — | | | | — | | | | — | | |
| Net Asset Value, End of Period | | $ | 15.12 | | | $ | 13.48 | | | $ | 9.40 | | | $ | 18.95 | | | $ | 26.02 | | | $ | 24.97 | | |
| Total return (g) | | | 15.47 | % | | | 45.57 | % | | | (42.59 | )% | | | (7.28 | )%(h) | | | 20.46 | % | | | 24.28 | % | |
Ratios to Average Net Assets/
Supplemental Data: | |
| Net expenses before interest expense | | | 1.48 | %(i) | | | 1.42 | %(i) | | | 1.38 | %(i) | | | 1.32 | %(i)(j) | | | 1.30 | %(i) | | | 1.27 | % | |
| Interest expense (k) | | | — | % | | | — | % | | | — | % | | | — | %(j) | | | — | % | | | — | % | |
| Net expenses | | | 1.48 | %(i) | | | 1.42 | %(i) | | | 1.38 | %(i) | | | 1.32 | %(i)(j) | | | 1.30 | %(i) | | | 1.27 | % | |
| Waiver/Reimbursement | | | — | | | | — | | | | — | | | | — | | | | — | | | | 0.06 | %(l) | |
| Net investment income | | | 1.61 | %(i) | | | 2.56 | %(i) | | | 3.31 | %(i) | | | 2.71 | %(i)(j) | | | 1.15 | %(i) | | | 1.38 | % | |
| Net assets, end of period (000s) | | $ | 367,847 | | | $ | 380,578 | | | $ | 241,097 | | | $ | 868,942 | | | $ | 1,073,616 | | | $ | 1,010,361 | | |
(a) The per share amounts and percentages reflect income and expenses assuming inclusion of the Fund's proportionate share of the income and expenses of Columbia International Value Master Portfolio.
(b) The Fund changed its fiscal year end from March 31 to February 29. Per share data and total return reflect activity from April 1, 2007 through February 29, 2008.
(c) On August 22, 2005, the Fund's Investor A shares were renamed Class A shares.
(d) Per share data was calculated using the average shares outstanding during the period.
(e) Net investment income per share reflects a special dividend. The effect of this dividend amounted to $0.13 per share.
(f) Rounds to less than $0.01 per share.
(g) Total return at net asset value assuming all distributions reinvested and no initial sales charge or contingent deferred sales charge.
(h) Not annualized.
(i) The benefits derived from expense reductions had an impact of less than 0.01%.
(j) Annualized.
(k) Rounds to less than 0.01%.
(l) Bank of America Corporation assumed certain non-recurring costs. Absent these non-recurring costs, the waiver/reimbursement ratio would have been -%.
See Accompanying Notes to Financial Statements.
14
Financial Highlights – Columbia International Value Fund
Selected data for a share outstanding throughout each period is as follows:
| | | Year Ended February 28, | | Period Ended
February 29, | | Year Ended March 31, | |
| Class B Shares (a) | | 2011 | | 2010 | | 2009 | | 2008 (b) | | 2007 | | 2006 (c) | |
| Net Asset Value, Beginning of Period | | $ | 13.02 | | | $ | 9.09 | | | $ | 18.39 | | | $ | 25.43 | | | $ | 24.54 | | | $ | 22.00 | | |
| Income from Investment Operations: | |
| Net investment income (d) | | | 0.21 | | | | 0.24 | (e) | | | 0.37 | | | | 0.49 | | | | 0.11 | | | | 0.15 | | |
Net realized and unrealized gain (loss)
on investments and foreign currency | | | 1.67 | | | | 3.82 | | | | (7.53 | ) | | | (1.91 | ) | | | 4.22 | | | | 4.63 | | |
| Total from investment operations | | | 1.88 | | | | 4.06 | | | | (7.16 | ) | | | (1.42 | ) | | | 4.33 | | | | 4.78 | | |
| Less Distributions to Shareholders: | |
| From net investment income | | | (0.29 | ) | | | (0.13 | ) | | | (0.43 | ) | | | (0.53 | ) | | | (0.20 | ) | | | (0.18 | ) | |
| From net realized gains | | | — | | | | — | | | | (1.70 | ) | | | (5.09 | ) | | | (3.24 | ) | | | (2.06 | ) | |
| From return of capital | | | — | | | | — | | | | (0.01 | ) | | | — | | | | — | | | | — | | |
| Total distributions to shareholders | | | (0.29 | ) | | | (0.13 | ) | | | (2.14 | ) | | | (5.62 | ) | | | (3.44 | ) | | | (2.24 | ) | |
| Redemption Fees: | |
| Redemption fees added to paid-in-capital | | | — | | | | — | (f) | | | — | (f) | | | — | (f) | | | — | (f) | | | — | (f) | |
| Increase from regulatory settlements | | | — | (f) | | | — | (f) | | | — | | | | — | | | | — | | | | — | | |
| Net Asset Value, End of Period | | $ | 14.61 | | | $ | 13.02 | | | $ | 9.09 | | | $ | 18.39 | | | $ | 25.43 | | | $ | 24.54 | | |
| Total return (g) | | | 14.75 | % | | | 44.61 | % | | | (43.01 | )% | | | (7.90 | )%(h) | | | 19.51 | % | | | 23.36 | % | |
Ratios to Average Net Assets/
Supplemental Data: | |
| Net expenses before interest expense | | | 2.23 | %(i) | | | 2.17 | %(i) | | | 2.13 | %(i) | | | 2.07 | %(i)(j) | | | 2.05 | %(i) | | | 2.02 | % | |
| Interest expense (k) | | | — | % | | | — | % | | | — | % | | | — | %(j) | | | — | % | | | — | % | |
| Net expenses | | | 2.23 | %(i) | | | 2.17 | %(i) | | | 2.13 | %(i) | | | 2.07 | %(i)(j) | | | 2.05 | %(i) | | | 2.02 | % | |
| Waiver/Reimbursement | | | — | | | | — | | | | — | | | | — | | | | — | | | | 0.06 | %(l) | |
| Net investment income | | | 1.62 | %(i) | | | 1.95 | %(i) | | | 2.43 | %(i) | | | 2.10 | %(i)(j) | | | 0.45 | %(i) | | | 0.67 | % | |
| Net assets, end of period (000s) | | $ | 1,437 | | | $ | 8,476 | | | $ | 18,743 | | | $ | 65,705 | | | $ | 110,726 | | | $ | 114,932 | | |
(a) The per share amounts and percentages reflect income and expenses assuming inclusion of the Fund's proportionate share of the income and expenses of Columbia International Value Master Portfolio.
(b) The Fund changed its fiscal year end from March 31 to February 29. Per share data and total return reflect activity from April 1, 2007 through February 29, 2008.
(c) On August 22, 2005, the Fund's Investor B shares were renamed Class B shares.
(d) Per share data was calculated using the average shares outstanding during the period.
(e) Net investment income per share reflects a special dividend. The effect of this dividend amounted to $0.13 per share.
(f) Rounds to less than $0.01 per share.
(g) Total return at net asset value assuming all distributions reinvested and no contingent deferred sales charge.
(h) Not annualized.
(i) The benefits derived from expense reductions had an impact of less than 0.01%.
(j) Annualized.
(k) Rounds to less than 0.01%.
(l) Bank of America Corporation assumed certain non-recurring costs. Absent these non-recurring costs, the waiver/reimbursement ratio would have been -%.
See Accompanying Notes to Financial Statements.
15
Financial Highlights – Columbia International Value Fund
Selected data for a share outstanding throughout each period is as follows:
| | | Year Ended February 28, | | Period Ended
February 29, | | Year Ended March 31, | |
| Class C Shares (a) | | 2011 | | 2010 | | 2009 | | 2008 (b) | | 2007 | | 2006 (c) | |
Net Asset Value,
Beginning of Period | | $ | 12.99 | | | $ | 9.08 | | | $ | 18.37 | | | $ | 25.40 | | | $ | 24.52 | | | $ | 21.98 | | |
Income from Investment
Operations: | |
| Net investment income (d) | | | 0.12 | | | | 0.22 | (e) | | | 0.34 | | | | 0.46 | | | | 0.10 | | | | 0.15 | | |
Net realized and unrealized gain (loss)
on investments and foreign currency | | | 1.74 | | | | 3.82 | | | | (7.49 | ) | | | (1.87 | ) | | | 4.22 | | | | 4.63 | | |
| Total from investment operations | | | 1.86 | | | | 4.04 | | | | (7.15 | ) | | | (1.41 | ) | | | 4.32 | | | | 4.78 | | |
| Less Distributions to Shareholders: | |
| From net investment income | | | (0.29 | ) | | | (0.13 | ) | | | (0.43 | ) | | | (0.53 | ) | | | (0.20 | ) | | | (0.18 | ) | |
| From net realized gains | | | — | | | | — | | | | (1.70 | ) | | | (5.09 | ) | | | (3.24 | ) | | | (2.06 | ) | |
| From return of capital | | | — | | | | — | | | | (0.01 | ) | | | — | | | | — | | | | — | | |
| Total distributions to shareholders | | | (0.29 | ) | | | (0.13 | ) | | | (2.14 | ) | | | (5.62 | ) | | | (3.44 | ) | | | (2.24 | ) | |
| Redemption Fees: | |
Redemption fees added to
paid-in-capital | | | — | | | | — | (f) | | | — | (f) | | | — | (f) | | | — | (f) | | | — | (f) | |
Increase from regulatory
settlements | | | — | (f) | | | — | (f) | | | — | | | | — | | | | — | | | | — | | |
| Net Asset Value, End of Period | | $ | 14.56 | | | $ | 12.99 | | | $ | 9.08 | | | $ | 18.37 | | | $ | 25.40 | | | $ | 24.52 | | |
| Total return (g) | | | 14.62 | % | | | 44.44 | % | | | (43.00 | )% | | | (7.86 | )%(h) | | | 19.48 | % | | | 23.38 | % | |
Ratios to Average Net Assets/
Supplemental Data: | |
| Net expenses before interest expense | | | 2.23 | %(i) | | | 2.17 | %(i) | | | 2.13 | %(i) | | | 2.07 | %(i)(j) | | | 2.05 | %(i) | | | 2.02 | % | |
| Interest expense (k) | | | — | % | | | — | % | | | — | % | | | — | %(j) | | | — | % | | | — | % | |
| Net expenses | | | 2.23 | %(i) | | | 2.17 | %(i) | | | 2.13 | %(i) | | | 2.07 | %(i)(j) | | | 2.05 | %(i) | | | 2.02 | % | |
| Waiver/Reimbursement | | | — | | | | — | | | | — | | | | — | | | | — | | | | 0.06 | %(l) | |
| Net investment income | | | 0.89 | %(i) | | | 1.81 | %(i) | | | 2.28 | %(i) | | | 1.99 | %(i)(j) | | | 0.42 | %(i) | | | 0.67 | % | |
| Net assets, end of period (000s) | | $ | 57,793 | | | $ | 63,914 | | | $ | 49,750 | | | $ | 127,020 | | | $ | 170,731 | | | $ | 168,819 | | |
(a) The per share amounts and percentages reflect income and expenses assuming inclusion of the Fund's proportionate share of the income and expenses of Columbia International Value Master Portfolio.
(b) The Fund changed its fiscal year end from March 31 to February 29. Per share data and total return reflect activity from April 1, 2007 through February 29, 2008.
(c) On August 22, 2005, the Fund's Investor C shares were renamed Class C shares.
(d) Per share data was calculated using the average shares outstanding during the period.
(e) Net investment income per share reflects a special dividend. The effect of this dividend amounted to $0.13 per share.
(f) Rounds to less than $0.01 per share.
(g) Total return at net asset value assuming all distributions reinvested and no contingent deferred sales charge.
(h) Not annualized.
(i) The benefits derived from expense reductions had an impact of less than 0.01%.
(j) Annualized.
(k) Rounds to less than 0.01%.
(l) Bank of America Corporation assumed certain non-recurring costs. Absent these non-recurring costs, the waiver/reimbursement ratio would have been –%.
See Accompanying Notes to Financial Statements.
16
Financial Highlights – Columbia International Value Fund
Selected data for a share outstanding throughout the period is as follows:
| Class I Shares (a) | | Period Ended
February 28,
2011 (b) | |
| Net Asset Value, Beginning of Period | | $ | 13.93 | | |
| Income from Investment Operations: | |
| Net investment loss (c)(d) | | | — | | |
| Net realized and unrealized gain on investments and foreign currency | | | 1.67 | | |
| Total from investment operations | | | 1.67 | | |
| Less Distributions to Shareholders: | |
| From net investment income | | | (0.33 | ) | |
| Increase from regulatory settlements | | | — | (d) | |
| Net Asset Value, End of Period | | $ | 15.27 | | |
| Total return (e)(f) | | | 12.22 | % | |
| Ratios to Average Net Assets/Supplemental Data: | |
| Net expenses before interest expense (g)(h) | | | 1.07 | % | |
| Interest expense (h)(i) | | | — | % | |
| Net expenses (g)(h) | | | 1.07 | % | |
| Net investment loss (g)(h) | | | (0.05 | )% | |
| Net assets, end of period (000s) | | $ | 34,506 | | |
(a) The per share amounts and percentages reflect income and expenses assuming inclusion of the Fund's proportionate share of the income and expenses of Columbia International Value Master Portfolio.
(b) Class I shares commenced operations on September 27, 2010. Per share data and total return reflect activity from that date.
(c) Per share data was calculated using the average shares outstanding during the period.
(d) Rounds to less than $0.01 per share.
(e) Total return at net asset value assuming all distributions reinvested.
(f) Not annualized.
(g) The benefits derived from expense reductions had an impact of less than 0.01%.
(h) Annualized.
(i) Rounds to less than 0.01%.
See Accompanying Notes to Financial Statements.
17
Financial Highlights – Columbia International Value Fund
Selected data for a share outstanding throughout the period is as follows:
| Class R Shares (a) | | Period Ended
February 28,
2011 (b) | |
| Net Asset Value, Beginning of Period | | $ | 13.78 | | |
| Income from Investment Operations: | |
| Net investment income (c) | | | 0.02 | | |
| Net realized and unrealized gain on investments and foreign currency | | | 1.60 | | |
| Total from investment operations | | | 1.62 | | |
| Less Distributions to Shareholders: | |
| From net investment income | | | (0.25 | ) | |
| Increase from regulatory settlements | | | — | (d) | |
| Net Asset Value, End of Period | | $ | 15.15 | | |
| Total return (e)(f) | | | 11.92 | % | |
| Ratios to Average Net Assets/Supplemental Data: | |
| Net expenses before interest expense (g)(h) | | | 1.77 | % | |
| Interest expense (h)(i) | | | — | % | |
| Net expenses (g)(h) | | | 1.77 | % | |
| Net investment income (g)(h) | | | 0.40 | % | |
| Net assets, end of period (000s) | | $ | 3 | | |
(a) The per share amounts and percentages reflect income and expenses assuming inclusion of the Fund's proportionate share of the income and expenses of Columbia International Value Master Portfolio.
(b) Class R shares commenced operations on September 27, 2010. Per share data and total return reflect activity from that date.
(c) Per share data was calculated using the average shares outstanding during the period.
(d) Rounds to less than $0.01 per share.
(e) Total return at net asset value assuming all distributions reinvested.
(f) Not annualized.
(g) The benefits derived from expense reductions had an impact of less than 0.01%.
(h) Annualized.
(i) Rounds to less than 0.01%.
See Accompanying Notes to Financial Statements.
18
Financial Highlights – Columbia International Value Fund
Selected data for a share outstanding throughout each period is as follows:
| | | Year Ended February 28, | | Period Ended
February 29, | | Year Ended March 31, | |
| Class Z Shares (a) | | 2011 | | 2010 | | 2009 | | 2008 (b) | | 2007 | | 2006 (c) | |
Net Asset Value,
Beginning of Period | | $ | 13.62 | | | $ | 9.49 | | | $ | 19.10 | | | $ | 26.17 | | | $ | 25.09 | | | $ | 22.42 | | |
Income from Investment
Operations: | |
| Net investment income (d) | | | 0.26 | | | | 0.36 | (e) | | | 0.50 | | | | 0.73 | | | | 0.36 | | | | 0.38 | | |
Net realized and unrealized gain (loss)
on investments and foreign currency | | | 1.83 | | | | 4.01 | | | | (7.83 | ) | | | (1.98 | ) | | | 4.35 | | | | 4.75 | | |
| Total from investment operations | | | 2.09 | | | | 4.37 | | | | (7.33 | ) | | | (1.25 | ) | | | 4.71 | | | | 5.13 | | |
| Less Distributions to Shareholders: | |
| From net investment income | | | (0.43 | ) | | | (0.24 | ) | | | (0.57 | ) | | | (0.73 | ) | | | (0.39 | ) | | | (0.40 | ) | |
| From net realized gains | | | — | | | | — | | | | (1.70 | ) | | | (5.09 | ) | | | (3.24 | ) | | | (2.06 | ) | |
| From return of capital | | | — | | | | — | | | | (0.01 | ) | | | — | | | | — | | | | — | | |
| Total distributions to shareholders | | | (0.43 | ) | | | (0.24 | ) | | | (2.28 | ) | | | (5.82 | ) | | | (3.63 | ) | | | (2.46 | ) | |
| Redemption Fees: | |
Redemption fees added to
paid-in-capital | | | — | | | | — | (f) | | | — | (f) | | | — | (f) | | | — | (f) | | | — | (f) | |
Increase from regulatory
settlements | | | — | (f) | | | — | (f) | | | — | | | | — | | | | — | | | | — | | |
| Net Asset Value, End of Period | | $ | 15.28 | | | $ | 13.62 | | | $ | 9.49 | | | $ | 19.10 | | | $ | 26.17 | | | $ | 25.09 | | |
| Total return (g) | | | 15.74 | % | | | 45.94 | % | | | (42.41 | )% | | | (7.05 | )%(h) | | | 20.70 | % | | | 24.66 | % | |
Ratios to Average Net Assets/
Supplemental Data: | |
| Net expenses before interest expense | | | 1.23 | %(i) | | | 1.17 | %(i) | | | 1.13 | %(i) | | | 1.07 | %(i)(j) | | | 1.05 | %(i) | | | 1.02 | % | |
| Interest expense (k) | | | — | % | | | — | % | | | — | % | | | — | %(j) | | | — | % | | | — | % | |
| Net expenses | | | 1.23 | %(i) | | | 1.17 | %(i) | | | 1.13 | %(i) | | | 1.07 | %(i)(j) | | | 1.05 | %(i) | | | 1.02 | % | |
| Waiver/Reimbursement | | | — | | | | — | | | | — | | | | — | | | | — | | | | 0.06 | %(l) | |
| Net investment income | | | 1.85 | %(i) | | | 2.76 | %(i) | | | 3.20 | %(i) | | | 3.04 | %(i)(j) | | | 1.43 | %(i) | | | 1.69 | % | |
| Net assets, end of period (000s) | | $ | 1,277,799 | | | $ | 1,187,812 | | | $ | 844,122 | | | $ | 1,886,808 | | | $ | 2,651,855 | | | $ | 2,585,390 | | |
(a) The per share amounts and percentages reflect income and expenses assuming inclusion of the Fund's proportionate share of the income and expenses of Columbia International Value Master Portfolio.
(b) The Fund changed its fiscal year end from March 31 to February 29. Per share data and total return reflect activity from April 1, 2007 through February 29, 2008.
(c) On August 22, 2005, the Fund's Primary A shares were renamed Class Z shares.
(d) Per share data was calculated using the average shares outstanding during the period.
(e) Net investment income per share reflects a special dividend. The effect of this dividend amounted to $0.13 per share.
(f) Rounds to less than $0.01 per share.
(g) Total return at net asset value assuming all distributions reinvested.
(h) Not annualized.
(i) The benefits derived from expense reductions had an impact of less than 0.01%.
(j) Annualized.
(k) Rounds to less than 0.01%.
(l) Bank of America Corporation assumed certain non-recurring costs. Absent these non-recurring costs, the waiver/reimbursement ratio would have been –%.
See Accompanying Notes to Financial Statements.
19
Notes to Financial Statements – Columbia International Value Fund
February 28, 2011
Note 1. Organization
Columbia International Value Fund (the Feeder Fund), a series of Columbia Funds Series Trust (the Trust), is a diversified fund. The Trust is registered under the Investment Company Act of 1940, as amended (the 1940 Act), as an open-end management investment company organized as a Delaware statutory trust.
After the close of business on April 30, 2010, Ameriprise Financial, Inc. (Ameriprise Financial) acquired a portion of the asset management business of Columbia Management Group, LLC (the Transaction), including the business of managing the Feeder Fund. In connection with the closing of the Transaction (the Closing), RiverSource Investments, LLC, a wholly owned subsidiary of Ameriprise Financial, became the investment manager of the Feeder Fund and changed its name to Columbia Management Investment Advisers, LLC (the Investment Manager).
Investment Objective
The Feeder Fund seeks long-term capital appreciation. The Feeder Fund seeks to achieve its investment objective by investing all or substantially all of its assets in Columbia International Value Master Portfolio (the Master Portfolio). The Master Portfolio is a series of Columbia Funds Master Investment Trust, LLC (the Master Trust). The Master Portfolio has the same investment objective as the Feeder Fund. The value of the Feeder Fund's investment in the Master Portfolio included on the Statement of Assets and Liabilities reflects the Feeder Fund's proportionate amount of beneficial interests in the net assets of the Master Portfolio which is equal to 88.3% at February 28, 2011. The financial statements of the Master Portfolio, including its investment portfolio, are included elsewhere within this report and should be read in conjunction with the Feeder Fund's financial statements. Another fund that is managed by the Investment Manager, not registered under the 1940 Act, and whose financial statements are not presented here, also invests in the Master Portfolio.
Fund Shares
The Trust has unlimited authorized shares of beneficial interest. The Feeder Fund offers Class A, Class B, Class C, Class I, Class R and Class Z shares. On December 28, 2010, the Investment Manager exchanged Class Z shares valued at $41,294,828 for Class I shares. All share classes have identical voting, dividend and liquidation rights. Each share class has its own expense structure and sales charges, as applicable.
Class A shares are subject to a maximum front-end sales charge of 5.75% based on the investment amount. Class A shares purchased without an initial sales charge in accounts aggregating $1 million to $50 million at the time of purchase are subject to a 1.00% contingent deferred sales charge (CDSC) if the shares are sold within 18 months of purchase, charged as follows: 1.00% CDSC if redeemed within 12 months of purchase, and 0.50% CDSC if redeemed more than 12, but less than 18 months after purchase.
The Feeder Fund no longer accepts investments by new or existing investors in the Feeder Fund's Class B shares, except in connection with the reinvestment of any dividend and/or capital gain distributions in Class B shares of the Feeder Fund and exchanges by existing Class B shareholders of certain other funds within the Columbia Family of Funds. Class B shares may be subject to a maximum CDSC of 5.00% based upon the holding period after purchase. Class B shares will generally convert to Class A shares eight years after purchase.
Class C shares are subject to a 1.00% CDSC on shares redeemed within one year of purchase.
Class I shares are not subject to sales charges and are available only to the Columbia Family of Funds. Class I shares became effective September 27, 2010.
Class R shares are not subject to sales charges and are available only to qualifying institutional investors. Class R shares became effective September 27, 2010.
Class Z shares are not subject to sales charges and are available only to certain investors, as described in the Feeder Fund's prospectus.
Note 2. Summary of Significant Accounting Policies
The preparation of financial statements in accordance with U.S. generally accepted accounting principles (GAAP) requires the Investment Manager to make certain estimates and assumptions that affect the reported amounts of assets and liabilities, the disclosure of contingent assets and liabilities at the date of the financial statements and the reported amounts of revenue and expenses during the reporting period. Actual results could differ from those estimates.
The following is a summary of significant accounting policies consistently followed by the Feeder Fund in the preparation of its financial statements.
20
Columbia International Value Fund, February 28, 2011
Security Valuation
The Feeder Fund invests all or substantially all of its assets in the Master Portfolio. See the Notes to Financial Statements for the Master Portfolio included elsewhere in this report and notes to Investment Portfolio for the Master Portfolio's valuation policies.
Foreign Currency Transactions and Translations
The values of all assets and liabilities quoted in foreign currencies are translated into U.S. dollars at that day's exchange rates. Net realized and unrealized gains (losses) on foreign currency transactions and translations include gains (losses) arising from the fluctuation in exchange rates between trade and settlement dates on securities transactions, gains (losses) arising from the disposition of foreign currency and currency gains (losses) between the accrual and payment dates on dividends, interest income and foreign withholding taxes.
Security Transactions
Security transactions are accounted for on the trade date. Cost is determined and gains (losses) are based upon the specific identification method for both financial statement and federal income tax purposes.
Expenses
General expenses of the Trust are allocated to the Feeder Fund and other series of the Trust based upon relative net assets or other expense allocation methodologies determined by the nature of the expense. Expenses directly attributable to a specific class of shares are charged to that share class. Expenses directly attributable to the Feeder Fund are charged to the Feeder Fund.
Determination of Class Net Asset Value
All income, expenses (other than class-specific expenses which are charged directly to a share class, as shown in the Statement of Operations) and realized and unrealized gains (losses) are allocated to each class of the Feeder Fund on a daily basis, based on the relative net assets of each class, for purposes of determining the net asset value of each class.
The Feeder Fund records its proportionate share of investment income, realized and unrealized gains (losses) and expenses reported by the Master Portfolio on a daily basis. The investment income, realized and unrealized gains (losses) and expenses are allocated daily to investors of the Master Portfolio based upon the relative value of their investment in the Master Portfolio.
Federal Income Tax Status
The Feeder Fund intends to qualify each year as a regulated investment company under Subchapter M of the Internal Revenue Code, as amended, and will distribute substantially all of its taxable income, if any, for its tax year, and as such will not be subject to federal income taxes. In addition, the Feeder Fund intends to distribute in each calendar year substantially all of its net investment income, capital gains and certain other amounts, if any, such that the Feeder Fund should not be subject to federal excise tax. Therefore, no federal income or excise tax provision is recorded.
Foreign Tax
The Feeder Fund may be subject to foreign taxes on income and/or gains on investments or currency repatriation, a portion of which may be recoverable. The Feeder Fund will accrue such taxes and recoveries as applicable, based upon its current interpretation of tax rules and regulations that exist in the markets in which it invests.
Realized gains in certain countries may be subject to foreign taxes at the Feeder Fund level, at rates ranging from approximately 10% to 15%. The Feeder Fund accrues for such foreign taxes on net realized and unrealized gains at the appropriate rate for each jurisdiction.
Distributions to Shareholders
Distributions from net investment income, if any, are declared and paid semi-annually. The Feeder Fund may, however, declare and pay distributions from net investment income more frequently. The Feeder Fund will distribute net realized capital gains (including net short-term capital gains) at least annually after the fiscal year in which the capital gains were earned, unless offset by any available capital loss carryforward. Income distributions and capital gain distributions are determined in accordance with federal income tax regulations which may differ from GAAP.
Indemnification
In the normal course of business, the Feeder Fund enters into contracts that contain a variety of representations and warranties and which provide general indemnities. The Feeder Fund's maximum exposure under these arrangements is unknown because this would involve future claims against the Feeder Fund. Also, under the Trust's organizational documents and by contract, the Trustees and officers of the Trust are indemnified against certain liabilities that may arise out of actions relating to their duties to the Trust. However, based on experience, the Feeder Fund expects the risk of loss due to these representations, warranties and indemnities to be minimal.
21
Columbia International Value Fund, February 28, 2011
Note 3. Fees and Compensation Paid to Affiliates
Investment Management Services Fee
The Investment Manager determines which securities will be purchased, held or sold. The Feeder Fund indirectly pays for investment management and subadvisory services and a portion of the administrative services through its investment in the Master Portfolio (see Notes to Financial Statements of the Master Portfolio).
Prior to the Closing, Columbia Management Advisors, LLC (Columbia), an indirect, wholly owned subsidiary of Bank of America Corporation (BOA), provided investment management services to the Master Portfolio under the same fee structure.
Administration Fee
Effective upon the Closing, the Investment Manager became the administrator of the Feeder Fund and provides administrative and other services to the Feeder Fund, including services previously performed under the Pricing and Bookkeeping Oversight and Services Agreement discussed below. The administration fee is based on the annual rate of 0.17% of the Feeder Fund's average daily net assets, less the fees payable by the Feeder Fund as described under the Pricing and Bookkeeping Fees note below. Prior to the Closing, Columbia provided administrative services to the Feeder Fund at the same fee rate.
Pricing and Bookkeeping Fees
Prior to the Closing, the Feeder Fund entered into a Financial Reporting Services Agreement (the Financial Reporting Services Agreement) with State Street Bank and Trust Company (State Street) and Columbia pursuant to which State Street provides financial reporting services to the Feeder Fund. The Feeder Fund also entered into an Accounting Services Agreement (collectively with the Financial Reporting Services Agreement, the State Street Agreements) with State Street and Columbia pursuant to which State Street provides accounting services to the Feeder Fund. Upon the Closing, Columbia assigned and delegated its rights and obligations under the State Street Agreements to the Investment Manager. Under the State Street Agreements, the Feeder Fund pays State Street an annual fee of $38,000 paid monthly. The Feeder Fund also reimburses State Street for certain out-of-pocket expenses and charges.
Also prior to the Closing, the Feeder Fund entered into a Pricing and Bookkeeping Oversight and Services Agreement (the Services Agreement) with Columbia. Under the Services Agreement, Columbia provided services related to Feeder Fund expenses and the requirements of the Sarbanes-Oxley Act of 2002, and provided oversight of the accounting and financial reporting services provided by State Street. Under the Services Agreement, the Feeder Fund reimbursed Columbia for out-of-pocket expenses and charges, including fees payable to third parties, such as for pricing the Feeder Fund's portfolio securities, incurred by Columbia in the performance of services under the Services Agreement. The Services Agreement was terminated upon the Closing. These services are now provided under the Administration Fee note discussed above.
Transfer Agent Fee
In connection with the Closing, RiverSource Service Corporation, a wholly owned subsidiary of Ameriprise Financial, became the transfer agent of the Feeder Fund and changed its name to Columbia Management Investment Services Corp. (the New Transfer Agent). The New Transfer Agent has contracted with Boston Financial Data Services (BFDS) to serve as sub-transfer agent. The New Transfer Agent receives monthly account-based service fees that vary by class and are based on the number of open accounts and asset-based fees, calculated based on assets held in omnibus accounts, which are intended to reimburse the New Transfer Agent for certain sub-transfer agent fees (exclusive of BFDS fees). The New Transfer Agent pays the fees of BFDS for services as sub-transfer agent and is not entitled to reimbursement for such fees from the Feeder Fund.
The New Transfer Agent receives reimbursement for certain out-of-pocket expenses and may also receive compensation for various shareholder services.
Prior to the Closing, Columbia Management Services, Inc., an affiliate of Columbia and an indirect, wholly owned subsidiary of BOA, provided shareholder services to the Feeder Fund and contracted with BFDS to serve as sub-transfer agent, under the same fee structure.
Class I shares do not pay transfer agent fees. For the year ended February 28, 2011, the Feeder Fund's effective transfer agent fee rate for each class, with the exception of Class I shares, was 0.16% of the Feeder Fund's average daily net assets.
An annual minimum account balance fee of $20 may apply to certain accounts with a value below the Feeder Fund's initial minimum investment requirements to reduce the impact of small accounts on transfer agent fees. These minimum account balance fees are recorded as part of expense reductions on the Statement of
22
Columbia International Value Fund, February 28, 2011
Operations. For the year ended February 28, 2011, no minimum account balance fees were charged by the Feeder Fund.
Underwriting Discounts, Service and Distribution Fees
In connection with the Closing, RiverSource Fund Distributors, Inc., an indirect wholly owned subsidiary of Ameriprise Financial, became the distributor of the Feeder Fund and changed its name to Columbia Management Investment Distributors, Inc. (the New Distributor).
For the year ended February 28, 2011, initial sales charges paid by shareholders on the purchase of Class A shares amounted to $15,803 and net CDSC fees paid by shareholders on certain redemptions of Class A, Class B and Class C shares amounted to $1,019, $1,158 and $5,200, respectively.
The Trust has adopted shareholder servicing plans and distribution plans for the Class B and Class C shares of the Feeder Fund and a combined distribution and shareholder servicing plan for Class A shares of the Feeder Fund. The Trust has also adopted a distribution plan for Class R shares of the Feeder Fund. The shareholder servicing plans permit the Feeder Fund to compensate or reimburse servicing agents for the shareholder services they have provided. The distribution plans, adopted pursuant to Rule 12b-1 under the 1940 Act, permit the Feeder Fund to compensate or reimburse the New Distributor and/or selling agents for activities or expenses primarily intended to result in the sale of the classes' shares. Payments are made at an annual rate and paid monthly, as a percentage of average daily net assets, set from time to time by the Board of Trustees, and are charged as expenses of the Feeder Fund directly to the applicable share class. A substantial portion of the expenses incurred pursuant to these plans is paid to affiliates of the New Distributor.
The annual rates in effect and plan limits, as a percentage of average daily net assets are as follows:
| | | Current
Rate | | Plan
Limit | |
Class A Combined Distribution and
Shareholder Servicing Plan | | | 0.25 | % | | | 0.25 | % | |
Class B and Class C Shareholder
Servicing Plans | | | 0.25 | % | | | 0.25 | % | |
Class B and Class C
Distribution Plans | | | 0.75 | % | | | 0.75 | % | |
| Class R Distribution Plan | | | 0.50 | % | | | 0.50 | % | |
Prior to the Closing, Columbia Management Distributors, Inc., an affiliate of Columbia and an indirect, wholly owned subsidiary of BOA, was the principal underwriter of the Feeder Fund's shares. There were no changes to the underwriting discount structure of the Feeder Fund or the service or distribution fee rates paid by the Feeder Fund as a result of the Transaction.
Expense Limits and Fee Waivers
Effective September 27, 2010, the Investment Manager has voluntarily agreed to reimburse a portion of the Feeder Fund's expenses so that the Feeder Fund's ordinary operating expenses (excluding any brokerage commissions, interest, taxes and extraordinary expenses, but including custodian charges relating to overdrafts, if any), after giving effect to any balance credits from the Feeder Fund's custodian, do not exceed the annual rates of 1.60%, 2.35%, 2.35%, 1.25%, 1.85% and 1.35% of the Feeder Fund's average daily net assets attributable to Class A, Class B, Class C, Class I, Class R and Class Z shares, respectively. This arrangement may be modified or terminated by the Investment Manager at any time.
For the period May 1, 2010 through September 26, 2010, the Investment Manager voluntarily agreed to reimburse a portion of the Feeder Fund's expenses so that the Feeder Fund's ordinary operating expenses (excluding any distribution and service fees, brokerage commissions, interest, taxes and extraordinary expenses, but including custodian charges relating to overdrafts, if any), after giving effect to any balance credits from the Feeder Fund's custodian, did not exceed 1.35% annually of the Feeder Fund's average daily net assets. Prior to May 1, 2010, Columbia voluntarily reimbursed a portion of the Feeder Fund's expenses in the same manner.
Fees Paid to Officers and Trustees
Upon the Closing, all officers of the Feeder Fund are employees of the Investment Manager or its affiliates and, with the exception of the Feeder Fund's Chief Compliance Officer, receive no compensation from the Feeder Fund. The Board of Trustees has appointed a Chief Compliance Officer to the Feeder Fund in accordance with federal securities regulations. The Feeder Fund, along with other affiliated funds, pays its pro-rata share of the expenses associated with the Chief Compliance Officer. The Feeder Fund's expenses for the Chief Compliance Officer will not exceed $15,000 per year. Prior to the Closing, all officers of the Feeder Fund were employees of Columbia or its affiliates and the Feeder Fund paid its pro-rata share of the expenses for the Chief Compliance Officer under the same fee structure.
23
Columbia International Value Fund, February 28, 2011
Trustees are compensated for their services to the Feeder Fund, as set forth on the Statement of Operations. The Trust's eligible Trustees may participate in a non-qualified deferred compensation plan which may be terminated at any time. Any payments to plan participants are paid solely out of the Feeder Fund's assets. Income earned on the plan participant's deferral account is based on the rate of return of the eligible mutual funds selected by the participant or, if no funds are selected, on the rate of return of Columbia Money Market Fund (formerly known as RiverSource Cash Management Fund). Prior to the Closing, if no funds were selected, income earned on the plan participant's deferral account was based on the rate of return of BofA Treasury Reserves. Trustees' fees deferred during the current period as well as any gains or losses on the trustees' deferred compensation balances as a result of market fluctuations are included in "Trustees' fees" on the Statement of Operations. Liabilities under the deferred compensation plan are included in "Trustees' fees" on the Statement of Assets and Liabilities.
Note 4. Custody Credits
The Feeder Fund has an agreement with its custodian bank under which custody fees may be reduced by balance credits. These credits are recorded as part of expense reductions on the Statement of Operations. The Feeder Fund could have invested a portion of the assets utilized in connection with the expense offset arrangement in an income-producing asset if it had not entered into such an agreement. For the year ended February 28, 2011, these custody credits reduced total expenses by $3 for the Feeder Fund.
Note 5. Regulatory Settlements
During the year ended February 28, 2011, the Feeder Fund received payments totaling $108,538 resulting from certain regulatory settlements in which the Feeder Fund had participated. The payments have been included in "Increase from regulatory settlements" in the Statement of Changes in Net Assets.
Note 6. Redemption Fees
Effective March 1, 2010, the Feeder Fund no longer assesses a 2.00% redemption fee on the proceeds from Fund shares that are redeemed within 60 days of purchase. The redemption fee was designed to offset brokerage commissions and other costs associated with short term trading of fund shares. The redemption fees, which were retained by the Feeder Fund, were accounted for as an addition to paid-in capital and were allocated to each class based on the relative net assets at the time of the redemption.
Note 7. Shareholder Concentration
As of February 28, 2011, two shareholder accounts owned 41.8% of the outstanding shares of the Feeder Fund. Purchase and redemption activity of these accounts may have a significant effect on the operations of the Feeder Fund.
Note 8. Federal Tax Information
The timing and character of income and capital gain distributions are determined in accordance with income tax regulations, which may differ from GAAP. Reclassifications are made to the Feeder Fund's capital accounts for permanent tax differences to reflect income and gains available for distribution (or available capital loss carryforwards) under income tax regulations.
For the year ended February 28, 2011, permanent book and tax basis differences resulting primarily from differing treatments for passive foreign investment companies (PFIC) adjustments, proceeds from litigation settlements and foreign currency transactions were identified and reclassified among the components of the Feeder Fund's net assets as follows:
Overdistributed
Net Investment
Income | | Accumulated
Net Realized
Loss | | Paid-In Capital | |
| $ | (100,840 | ) | | $ | (659,559 | ) | | $ | 760,399 | | |
Net investment income and net realized gains (losses), as disclosed on the Statement of Operations, and net assets were not affected by this reclassification.
The tax character of distributions paid during the years ended February 28, 2011 and February 28, 2010 was as follows:
| | | February 28, | |
| Distributions paid from: | | 2011 | | 2010 | |
| Ordinary Income* | | $ | 48,570,845 | | | $ | 26,561,282 | | |
* For tax purposes short-term capital gain distributions, if any, are considered ordinary income distributions.
24
Columbia International Value Fund, February 28, 2011
As of February 28, 2011, the components of distributable earnings on a tax basis were as follows:
Undistributed
Ordinary
Income | | Undistributed
Long-Term
Capital Gains | | Net
Unrealized
Depreciation* | |
| $ | 5,521,216 | | | $ | — | | | | N/A | | |
* See the Master Portfolio notes to financial statements for tax basis information.
Unrealized appreciation and depreciation at February 28, 2011, based on cost of investments for federal income tax purposes were:
| Unrealized appreciation | | | N/A* | | |
| Unrealized depreciation | | | N/A* | | |
| Net unrealized depreciation | | | N/A* | | |
* See the Master Portfolio notes to financial statements for tax basis information.
The following capital loss carryforwards may be available to reduce taxable income arising from future net realized gains on investments, if any, to the extent permitted by the Internal Revenue Code:
| Year of Expiration | | Capital Loss
Carryforwards | |
| | 2018 | | | $ | 185,725,377 | | |
| | 2019 | | | | 68,376,538 | | |
| Total | | $ | 254,101,915 | | |
Under current tax rules, certain currency (and capital) losses realized after October 31 may be deferred and treated as occurring on the first day of the following fiscal year. As of February 28, 2011, post-October capital losses of $25,086,762 attributed to security transactions were deferred to March 1, 2011.
Management is required to determine whether a tax position of the Feeder Fund is more likely than not to be sustained upon examination by the applicable taxing authority, including resolution of any related appeals or litigation processes, based on the technical merits of the position. The tax benefit to be recognized by the Feeder Fund is measured as the largest amount of benefit that is greater than fifty percent likely of being realized upon ultimate settlement. Management is not aware of any tax positions for which it is reasonably possible that the total amounts of unrecognized tax benefits will significantly change in the next twelve months. However, management's conclusions may be subject to review and adjustment at a later date based on factors including, but not limited to, new tax laws, regulations, and administrative interpretations (including relevant court decisions). The Feeder Fund's federal tax returns for the prior three fiscal years remain subject to examination by the Internal Revenue Service.
Note 9. Significant Risks and Contingencies
Foreign Securities Risk
Investing in foreign securities may include certain risks and considerations not typically associated with investing in U.S. securities, such as fluctuating currency values and changing local and regional economic, political and social conditions, which may result in greater market volatility. In addition, certain foreign securities may not be as liquid as U.S. securities. Investing in emerging markets may accentuate these risks.
Investments in emerging market countries are subject to additional risk. The risk of foreign investments is typically increased in less developed countries. These countries are also more likely to experience high levels of inflation, deflation or currency devaluation which could hurt their economies and securities markets.
Note 10. Subsequent Events
Management has evaluated the events and transactions that have occurred through the date the financial statements were issued and noted no items requiring adjustment of the financial statements or additional disclosure.
Note 11. Information Regarding Pending and Settled Legal Proceedings
In June 2004, an action captioned John E. Gallus et al. v. American Express Financial Corp. and American Express Financial Advisors Inc. was filed in the United States District Court for the District of Arizona. The plaintiffs allege that they are investors in several American Express Company (now known as RiverSource) mutual funds and they purport to bring the action derivatively on behalf of those funds under the Investment Company Act of 1940. The plaintiffs allege that fees allegedly paid to the defendants by the funds for investment advisory and administrative services are excessive. The plaintiffs seek remedies including restitution and rescission of investment advisory and distribution agreements. The plaintiffs voluntarily agreed to transfer this case to the United States District Court for the District of Minnesota (the District Court). In response to defendants' motion to dismiss the complaint, the District Court dismissed one of plaintiffs' four claims and granted plaintiffs limited discovery. Defendants moved for summary judgment in
25
Columbia International Value Fund, February 28, 2011
April 2007. Summary judgment was granted in the defendants' favor on July 9, 2007. The plaintiffs filed a notice of appeal with the Eighth Circuit Court of Appeals (the Eighth Circuit) on August 8, 2007. On April 8, 2009, the Eighth Circuit reversed summary judgment and remanded to the District Court for further proceedings. On August 6, 2009, defendants filed a writ of certiorari with the U.S. Supreme Court (the Supreme Court), asking the Supreme Court to stay the District Court proceedings while the Supreme Court considers and rules in a case captioned Jones v. Harris Associates, which involves issues of law similar to those presented in the Gallus case. On March 30, 2010, the Supreme Court issued its ruling in Jones v. Harris Associates, and on April 5, 2010, the Supreme Court vacated the Eighth Circuit's decision in the Gallus case and remanded the case to the Eighth Circuit for further consideration in light of the Supreme Court's decision in Jones v. Harris Associates. On June 4, 2010, the Eighth Circuit remanded the Gallus case to the District Court for further consideration in light of the Supreme Court's decision in Jones v. Harris Associates. On December 9, 2010, the District Court reinstated its July 9, 2007 summary judgment order in favor of the defendants. On January 10, 2011 plaintiffs filed a notice of appeal with the Eighth Circuit.
In December 2005, without admitting or denying the allegations, American Express Financial Corporation (AEFC, which is now known as Ameriprise Financial, Inc. (Ameriprise Financial)), entered into settlement agreements with the Securities and Exchange Commission (SEC) and Minnesota Department of Commerce (MDOC) related to market timing activities. As a result, AEFC was censured and ordered to cease and desist from committing or causing any violations of certain provisions of the Investment Advisers Act of 1940, the Investment Company Act of 1940, and various Minnesota laws. AEFC agreed to pay disgorgement of $10 million and civil money penalties of $7 million. AEFC also agreed to retain an independent distribution consultant to assist in developing a plan for distribution of all disgorgement and civil penalties ordered by the SEC in accordance with various undertakings detailed at http://www.sec.gov/litigation/admin/ia-2451.pdf. Ameriprise Financial and its affiliates have cooperated with the SEC and the MDOC in these legal proceedings, and have made regular reports to the funds' Boards of Directors/Trustees.
Ameriprise Financial and certain of its affiliates have historically been involved in a number of legal, arbitration and regulatory proceedings, including routine litigation, class actions, and governmental actions, concerning matters arising in connection with the conduct of their business activities. Ameriprise Financial believes that the Funds are not currently the subject of, and that neither Ameriprise Financial nor any of its affiliates are the subject of, any pending legal, arbitration or regulatory proceedings that are likely to have a material adverse effect on the Funds or the ability of Ameriprise Financial or its affiliates to perform under their contracts with the Funds. Ameriprise Financial is required to make 10-Q, 10-K and, as necessary, 8-K filings with the Securities and Exchange Commission on legal and regulatory matters that relate to Ameriprise Financial and its affiliates. Copies of these filings may be obtained by accessing the SEC website at www.sec.gov.
There can be no assurance that these matters, or the adverse publicity associated with them, will not result in increased fund redemptions, reduced sale of fund shares or other adverse consequences to the Funds. Further, although we believe proceedings are not likely to have a material adverse effect on the Funds or the ability of Ameriprise Financial or its affiliates to perform under their contracts with the Funds, these proceedings are subject to uncertainties and, as such, we are unable to estimate the possible loss or range of loss that may result. An adverse outcome in one or more of these proceedings could result in adverse judgments, settlements, fines, penalties or other relief that could have a material adverse effect on the consolidated financial condition or results of operations of Ameriprise Financial.
26
Report of Independent Registered Public Accounting Firm
To the Trustees of Columbia Funds Series Trust I and the Shareholders of Columbia International Value Fund
In our opinion, the accompanying statement of assets and liabilities, including the investment portfolio, and the related statements of operations and of changes in net assets and the financial highlights present fairly, in all material respects, the financial position of Columbia International Value Fund (the "Feeder Fund") (a series of Columbia Funds Series Trust I) at February 28, 2011, the results of its operations for the year then ended, the changes in its net assets for each of the two years in the period then ended, and the financial highlights for each of the periods indicated, in conformity with accounting principles generally accepted in the United States of America. These financial statements and financial highlights (hereafter referred to as "financial statements") are the responsibility of the Feeder Fund's management. Our responsibility is to express an opinion on these financial statements based on our audits. We conducted our audits of these financial statements in accordance with the standards of the Public Company Accounting Oversight Board (United States). Those standards require that we plan and perform the audit to obtain reasonable assurance about whether the financial statements are free of material misstatement. An audit includes examining, on a test basis, evidence supporting the amounts and disclosures in the financial statements, assessing the accounting principles used and significant estimates made by management, and evaluating the overall financial statement presentation. We believe that our audits, which included confirmation of securities at February 28, 2011 by correspondence with the custodian and brokers, provide a reasonable basis for our opinion.
PricewaterhouseCoopers LLP
Boston, Massachusetts
April 21, 2011
27
Federal Income Tax Information (Unaudited) – Columbia International Value Fund
Foreign taxes paid during the fiscal year ended February 28, 2011, of $8,743,446 are being passed through to shareholders. This represents $0.08 per share. Eligible shareholders may claim this amount as a foreign tax credit.
Gross income derived from sources within foreign countries was $59,531,847 ($0.52 per share) for the fiscal year ended February 28, 2011.
The Feeder Fund will notify shareholders in January 2012 of amounts for use in preparing 2011 income tax returns.
28
Columbia Funds Master Investment Trust, LLC
Columbia International Value Master Portfolio Annual Report
February 28, 2011
The following pages should be read in conjunction with Columbia International Value Fund's Annual Report.
29
Investment Portfolio – Columbia International Value Master Portfolio
February 28, 2011
| Common Stocks – 99.0% | |
| | | Shares | | Value ($) | |
| Consumer Discretionary – 9.4% | |
| Automobiles – 2.9% | |
| Nissan Motor Co., Ltd. | | | 1,330,900 | | | | 13,675,128 | | |
| Renault SA (a) | | | 125,200 | | | | 7,673,567 | | |
| Toyota Motor Corp. | | | 773,400 | | | | 36,138,950 | | |
| Automobiles Total | | | 57,487,645 | | |
| Household Durables – 1.7% | |
| Sony Corp. | | | 897,900 | | | | 33,059,422 | | |
| Household Durables Total | | | 33,059,422 | | |
| Media – 1.7% | |
| ITV PLC (a) | | | 24,155,776 | | | | 34,242,402 | | |
| Media Total | | | 34,242,402 | | |
| Multiline Retail – 1.4% | |
Marks & Spencer Group
PLC, ADR | | | 2,485,740 | | | | 28,010,064 | | |
| Multiline Retail Total | | | 28,010,064 | | |
| Specialty Retail – 1.7% | |
| Kingfisher PLC | | | 7,819,700 | | | | 32,339,547 | | |
| Specialty Retail Total | | | 32,339,547 | | |
| Consumer Discretionary Total | | | 185,139,080 | | |
| Consumer Staples – 11.5% | |
| Food & Staples Retailing – 8.3% | |
| Carrefour SA | | | 891,160 | | | | 43,754,723 | | |
| J Sainsbury PLC | | | 4,965,329 | | | | 30,673,149 | | |
| Koninklijke Ahold NV | | | 2,496,732 | | | | 33,516,511 | | |
| Seven & I Holdings Co., Ltd. | | | 1,041,300 | | | | 29,066,015 | | |
Wm. Morrison
Supermarkets PLC | | | 6,214,365 | | | | 27,963,375 | | |
| Food & Staples Retailing Total | | | 164,973,773 | | |
| Food Products – 1.4% | |
| Unilever NV | | | 904,049 | | | | 27,265,037 | | |
| Food Products Total | | | 27,265,037 | | |
| Tobacco – 1.8% | |
| Japan Tobacco, Inc. | | | 8,359 | | | | 34,577,834 | | |
| Tobacco Total | | | 34,577,834 | | |
| Consumer Staples Total | | | 226,816,644 | | |
| Energy – 6.3% | |
| Oil, Gas & Consumable Fuels – 6.3% | |
| BP PLC | | | 3,064,170 | | | | 24,642,315 | | |
| ENI SpA | | | 2,114,387 | | | | 51,556,609 | | |
| | | Shares | | Value ($) | |
| Petroleo Brasileiro SA, ADR | | | 170,243 | | | | 5,987,446 | | |
| Total SA | | | 702,481 | | | | 43,050,547 | | |
| Oil, Gas & Consumable Fuels Total | | | 125,236,917 | | |
| Energy Total | | | 125,236,917 | | |
| Financials – 19.9% | |
| Capital Markets – 1.6% | |
Deutsche Bank AG,
Registered Shares | | | 198,375 | | | | 12,751,161 | | |
| UBS AG, Registered Shares (a) | | | 975,930 | | | | 19,379,947 | | |
| Capital Markets Total | | | 32,131,108 | | |
| Commercial Banks – 9.3% | |
| Barclays PLC | | | 4,818,407 | | | | 25,053,971 | | |
| Chuo Mitsui Trust Holdings, Inc. | | | 1,436,000 | | | | 6,133,169 | | |
| HSBC Holdings PLC | | | 983,039 | | | | 10,834,957 | | |
| Intesa Sanpaolo SpA | | | 8,435,186 | | | | 28,448,487 | | |
Mitsubishi UFJ Financial
Group, Inc. | | | 4,958,431 | | | | 27,544,150 | | |
| Mizuho Financial Group, Inc. | | | 11,539,600 | | | | 23,786,882 | | |
| Natixis (a) | | | 2,968,546 | | | | 17,692,545 | | |
| San-In Godo Bank Ltd. | | | 233,000 | | | | 1,829,097 | | |
Sumitomo Mitsui Financial
Group, Inc. | | | 781,042 | | | | 29,555,956 | | |
| UniCredit SpA | | | 3,651,500 | | | | 9,387,447 | | |
| Yamaguchi Financial Group, Inc. | | | 425,000 | | | | 4,408,086 | | |
| Commercial Banks Total | | | 184,674,747 | | |
| Insurance – 9.0% | |
| Aegon NV (a) | | | 5,311,757 | | | | 40,820,538 | | |
MS & AD Insurance
Group Holdings | | | 1,373,000 | | | | 36,266,397 | | |
| NKSJ Holdings, Inc. (a) | | | 2,857,000 | | | | 21,611,606 | | |
Swiss Reinsurance Co., Ltd.,
Registered Shares | | | 740,500 | | | | 45,349,747 | | |
| Tokio Marine Holdings, Inc. | | | 1,021,900 | | | | 33,599,768 | | |
| Insurance Total | | | 177,648,056 | | |
| Financials Total | | | 394,453,911 | | |
| Health Care – 11.7% | |
| Pharmaceuticals – 11.7% | |
| Astellas Pharma, Inc. | | | 635,900 | | | | 25,004,266 | | |
| AstraZeneca PLC | | | 611,885 | | | | 29,801,516 | | |
| Daiichi Sankyo Co., Ltd. | | | 852,600 | | | | 18,310,877 | | |
| GlaxoSmithKline PLC | | | 1,878,148 | | | | 36,058,399 | | |
| Ono Pharmaceutical Co., Ltd. | | | 730,800 | | | | 38,263,626 | | |
| Sanofi-Aventis SA | | | 697,686 | | | | 48,138,585 | | |
See Accompanying Notes to Financial Statements.
30
Columbia International Value Master Portfolio
February 28, 2011
| Common Stocks (continued) | |
| | | Shares | | Value ($) | |
| Taisho Pharmaceutical Co., Ltd. | | | 382,000 | | | | 8,370,309 | | |
| Takeda Pharmaceutical Co., Ltd. | | | 565,400 | | | | 28,168,194 | | |
| Pharmaceuticals Total | | | 232,115,772 | | |
| Health Care Total | | | 232,115,772 | | |
| Industrials – 1.1% | |
| Commercial Services & Supplies – 1.1% | |
| Dai Nippon Printing Co., Ltd. | | | 1,555,000 | | | | 21,051,171 | | |
| Commercial Services & Supplies Total | | | 21,051,171 | | |
| Industrials Total | | | 21,051,171 | | |
| Information Technology – 14.3% | |
| Communications Equipment – 4.6% | |
| Alcatel-Lucent (a) | | | 8,025,800 | | | | 39,726,748 | | |
| Nokia Oyj | | | 2,463,665 | | | | 21,350,331 | | |
Telefonaktiebolaget LM
Ericsson, Class B | | | 2,383,768 | | | | 30,674,039 | | |
| Communications Equipment Total | | | 91,751,118 | | |
| Electronic Equipment, Instruments & Components – 3.8% | |
| FUJIFILM Holdings Corp. | | | 890,505 | | | | 31,352,944 | | |
| TDK Corp. | | | 185,000 | | | | 12,522,559 | | |
| Tyco Electronics Ltd. | | | 861,543 | | | | 31,050,010 | | |
Electronic Equipment, Instruments &
Components Total | | | 74,925,513 | | |
| Office Electronics – 2.1% | |
| Canon, Inc. | | | 855,200 | | | | 41,356,949 | | |
| Office Electronics Total | | | 41,356,949 | | |
| Semiconductors & Semiconductor Equipment – 3.8% | |
| Rohm Co., Ltd. | | | 551,500 | | | | 38,976,233 | | |
| STMicroelectronics NV | | | 2,739,200 | | | | 35,176,296 | | |
Semiconductors & Semiconductor
Equipment Total | | | 74,152,529 | | |
| Information Technology Total | | | 282,186,109 | | |
| Materials – 2.2% | |
| Chemicals – 0.8% | |
| Akzo Nobel NV | | | 227,600 | | | | 15,474,554 | | |
| Chemicals Total | | | 15,474,554 | | |
| Construction Materials – 1.4% | |
| Cemex SAB de CV, ADR (a) | | | 2,572,781 | | | | 23,129,301 | | |
| Italcementi SpA, Savings Shaers | | | 890,500 | | | | 4,519,693 | | |
| Construction Materials Total | | | 27,648,994 | | |
| Materials Total | | | 43,123,548 | | |
| | | Shares | | Value ($) | |
| Telecommunication Services – 20.0% | |
| Diversified Telecommunication Services – 16.9% | |
Brasil Telecom SA, ADR
(Ordinary) (a) | | | 199,977 | | | | 1,985,772 | | |
Brasil Telecom SA, ADR
(Preference) (a) | | | 352,511 | | | | 8,125,379 | | |
Deutsche Telekom AG,
Registered Shares | | | 3,845,600 | | | | 51,714,135 | | |
| France Telecom SA | | | 1,838,170 | | | | 40,661,417 | | |
Nippon Telegraph &
Telephone Corp. | | | 942,500 | | | | 46,105,095 | | |
Portugal Telecom
SGPS SA, ADR | | | 2,177,276 | | | | 25,474,129 | | |
| Swisscom AG, ADR | | | 688,200 | | | | 30,372,744 | | |
Tele Norte Leste
Participacoes SA, ADR | | | 691,100 | | | | 10,912,469 | | |
Telecom Corp. of New
Zealand Ltd., ADR | | | 1,486,604 | | | | 11,759,038 | | |
| Telecom Italia SpA | | | 16,491,810 | | | | 25,761,910 | | |
Telecom Italia SpA,
Savings Shares | | | 32,972,210 | | | | 43,634,497 | | |
| Telefonica SA, ADR | | | 697,443 | | | | 17,833,617 | | |
Telefonos de Mexico
SA de CV, ADR, Class L | | | 1,158,962 | | | | 20,965,623 | | |
| Diversified Telecommunication Services Total | | | 335,305,825 | | |
| Wireless Telecommunication Services – 3.1% | |
| SK Telecom Co., Ltd. | | | 160,077 | | | | 23,134,417 | | |
| SK Telecom Co., Ltd., ADR | | | 617,639 | | | | 10,864,270 | | |
| Tim Participacoes SA, ADR | | | 127,738 | | | | 4,946,015 | | |
| Vivo Participacoes SA, ADR | | | 228,230 | | | | 8,401,146 | | |
| Vodafone Group PLC | | | 4,677,390 | | | | 13,253,412 | | |
| Wireless Telecommunication Services Total | | | 60,599,260 | | |
| Telecommunication Services Total | | | 395,905,085 | | |
| Utilities – 2.6% | |
| Electric Utilities – 2.6% | |
Centrais Electricas
Brasileiras SA, ADR | | | 2,512,340 | | | | 35,876,215 | | |
Korea Electric Power
Corp., ADR (a) | | | 1,294,050 | | | | 15,787,410 | | |
| Electric Utilities Total | | | 51,663,625 | | |
| Utilities Total | | | 51,663,625 | | |
Total Common Stocks
(cost of $2,054,543,758) | | | 1,957,691,862 | | |
See Accompanying Notes to Financial Statements.
31
Columbia International Value Master Portfolio
February 28, 2011
| Short-Term Obligation – 0.2% | |
| | | Par ($) | | Value ($) | |
Repurchase agreement with
Fixed Income Clearing Corp.,
dated 02/28/11, due 03/01/11
at 0.080%, collateralized by a
U.S. Government Agency
obligation maturing 04/15/14,
market value $4,357,594
(repurchase proceeds
$4,271,009) | | | 4,271,000 | | | | 4,271,000 | | |
Total Short-Term Obligation
(cost of $4,271,000) | | | 4,271,000 | | |
Total Investments – 99.2%
(cost of $2,058,814,758) (b) | | | 1,961,962,862 | | |
| Other Assets & Liabilities, Net – 0.8% | | | 16,441,553 | | |
| Net Assets – 100.0% | | | 1,978,404,415 | | |
Notes to Investment Portfolio:
(a) Non-income producing security.
(b) Cost for federal income tax purposes is $2,071,872,657.
Generally accepted accounting principles (GAAP) require disclosure regarding the inputs and valuation techniques used to measure fair value and any changes in valuation inputs or techniques. In addition, investments shall be disclosed by major category.
The Master Portfolio categorizes its fair value measurements according to a three-level hierarchy that maximizes the use of observable inputs and minimizes the use of unobservable inputs by prioritizing that the most observable input be used when available. Observable inputs are those that market participants would use in pricing an investment based on market data obtained from sources independent of the reporting entity. Unobservable inputs are those that reflect the Master Portfolio's assumptions about the information market participants would use in pricing an investment. An investment's level within the fair value hierarchy is based on the lowest level of any input that is deemed significant to the asset or liability's fair value measurement. The input levels are not necessarily an indication of the risk or liquidity associated with investments at that level. For example, certain U.S. government securities are generally high quality and liquid, however, they are reflected as Level 2 because the inputs used to determine fair value may not always be quoted prices in an active market.
Fair value inputs are summarized in the three broad levels listed below:
• Level 1—Valuations based on quoted prices for investments in active markets that the Master Portfolio has the ability to access at the measurement date (including NAV for open-end mutual funds). Valuation adjustments are not applied to Level 1 investments.
• Level 2—Valuations based on other significant observable inputs (including quoted prices for similar securities, interest rates, prepayment speeds, credit risks, etc.).
• Level 3—Valuations based on significant unobservable inputs (including the Master Portfolio's own assumptions and judgment in determining the fair value of investments).
Inputs that are used in determining fair value of an investment may include price information, credit data, volatility statistics, and other factors. These inputs can be either observable or unobservable. The availability of observable inputs can vary between investments, and is affected by various factors such as the type of investment, and the volume and level of activity for that investment or similar investments in the marketplace. The inputs will be considered by the Investment Manager, along with any other relevant factors in the calculation of an investment's fair value. The Master Portfolio uses prices and inputs that are current as of the measurement date, which may include periods of market dislocations. During these periods, the availability of prices and inputs may be reduced for many investments. This condition could cause an investment to be reclassified between the various levels within the hierarchy. Non-U.S. equity securities actively traded in foreign markets may be reflected in Level 2 despite the availability of closing prices, because the Master Portfolio evaluates and determines whether those closing prices reflect fair value at the close of the New York Stock Exchange (NYSE) or require adjustment, as described in Note 2 to the financial statements—Security Valuation.
Investments falling into the Level 3 category are primarily supported by quoted prices from brokers and dealers participating in the market for those investments. However, these may be classified as Level 3 investments due to lack of market transparency and corroboration to support these quoted prices. Additionally, valuation models may be used as the pricing source for any remaining investments classified as Level 3. These models rely on one or more significant unobservable inputs and/or significant assumptions by the Investment Manager. Inputs used in valuations may include, but are not limited to, financial statement analysis, capital account balances, discount rates and estimated cash flows, and comparable company data.
The following table is a summary of the inputs used to value the Master Portfolio's investments as of February 28, 2011:
| Description | | Quoted
Prices
(Level 1) | | Other
Significant
Observable
Inputs
(Level 2) | | Significant
Unobservable
Inputs
(Level 3) | | Total | |
| Common Stocks | |
Consumer
Discretionary | | $ | — | | | $ | 185,139,080 | | | $ | — | | | $ | 185,139,080 | | |
| Consumer Staples | | | — | | | | 226,816,644 | | | | — | | | | 226,816,644 | | |
| Energy | | | 5,987,446 | | | | 119,249,471 | | | | — | | | | 125,236,917 | | |
| Financials | | | — | | | | 394,453,911 | | | | — | | | | 394,453,911 | | |
| Health Care | | | — | | | | 232,115,772 | | | | — | | | | 232,115,772 | | |
| Industrials | | | — | | | | 21,051,171 | | | | — | | | | 21,051,171 | | |
Information
Technology | | | 31,050,010 | | | | 251,136,099 | | | | — | | | | 282,186,109 | | |
| Materials | | | 23,129,301 | | | | 19,994,247 | | | | — | | | | 43,123,548 | | |
Telecommunication
Services | | | 121,267,458 | | | | 274,637,627 | | | | — | | | | 395,905,085 | | |
| Utilities | | | 51,663,625 | | | | — | | | | — | | | | 51,663,625 | | |
Total Common
Stocks | | | 233,097,840 | | | | 1,724,594,022 | | | | — | | | | 1,957,691,862 | | |
Total Short-Term
Obligation | | | — | | | | 4,271,000 | | | | — | | | | 4,271,000 | | |
| Total Investments | | $ | 233,097,840 | | | $ | 1,728,865,022 | | | $ | — | | | $ | 1,961,962,862 | | |
The Master Portfolio's assets assigned to the Level 2 input category are generally valued using the market approach, in which a security's value is determined through reference to prices and information from market transactions for similar or identical assets. These assets include certain foreign securities for which a third party statistical pricing service may be employed for purposes of fair valuation. The models utilized by the third party statistical pricing service take into account a security's correlation to available market data including, but not limited to, intraday index, ADR, and ETF movements.
Certain short-term obligations may be valued using amortized cost, an income approach which converts future cash flows to a present value based upon the discount or premium at purchase.
There were no significant transfers of financial assets between Levels 1 and 2 during the period.
See Accompanying Notes to Financial Statements.
32
Columbia International Value Master Portfolio
February 28, 2011
The Master Portfolio was invested in the following countries at February 28, 2011.
Summary of Securities
by Country (Unaudited) | | Value | | % of Total
Investments | |
| Japan | | $ | 640,734,683 | | | | 32.7 | | |
| United Kingdom | | | 292,873,107 | | | | 14.9 | | |
| France | | | 240,698,133 | | | | 12.3 | | |
| Italy | | | 163,308,643 | | | | 8.3 | | |
| Netherlands | | | 152,252,936 | | | | 7.8 | | |
| Switzerland | | | 126,152,447 | | | | 6.4 | | |
| Brazil | | | 76,234,442 | | | | 3.9 | | |
| Germany | | | 64,465,296 | | | | 3.3 | | |
| South Korea | | | 49,786,097 | | | | 2.5 | | |
| Mexico | | | 44,094,924 | | | | 2.2 | | |
| Sweden | | | 30,674,039 | | | | 1.6 | | |
| Portugal | | | 25,474,129 | | | | 1.3 | | |
| Finland | | | 21,350,331 | | | | 1.1 | | |
| Spain | | | 17,833,617 | | | | 0.9 | | |
| New Zealand | | | 11,759,038 | | | | 0.6 | | |
| United States* | | | 4,271,000 | | | | 0.2 | | |
| | | $ | 1,961,962,862 | | | | 100.0 | | |
* Includes short-term obligation.
Certain securities are listed by country of underlying exposure but may trade predominantly on another exchange.
| Acronym | | Name | |
| ADR | | American Depositary Receipt | |
|
See Accompanying Notes to Financial Statements.
33
Statement of Assets and Liabilities – Columbia International Value Master Portfolio
February 28, 2011
| | | | | ($) | |
| Assets | | Investments, at identified cost | | | 2,058,814,758 | | |
| | | Investments, at value | | | 1,961,962,862 | | |
| | | Cash | | | 125 | | |
| | | Foreign currency (cost of $162,588) | | | 162,576 | | |
| | | Receivable for: | | | | | |
| | | Investments sold | | | 27,683 | | |
| | | Dividends | | | 17,705,723 | | |
| | | Interest | | | 9 | | |
| | | Prepaid expenses | | | 6,739 | | |
| | | Total Assets | | | 1,979,865,717 | | |
| Liabilities | | Payable for: | | | | | |
| | | Investment advisory fee | | | 1,166,090 | | |
| | | Administration fee | | | 63,406 | | |
| | | Pricing and bookkeeping fees | | | 13,748 | | |
| | | Trustees' fees | | | 47,399 | | |
| | | Custody fee | | | 108,000 | | |
| | | Interest payable | | | 556 | | |
| | | Other liabilities | | | 62,103 | | |
| | | Total Liabilities | | | 1,461,302 | | |
| | | Net Assets | | | 1,978,404,415 | | |
See Accompanying Notes to Financial Statements.
34
Statement of Operations – Columbia International Value Master Portfolio
For the Year Ended February 28, 2011
| | | | | ($) | |
| Investment Income | | Dividends | | | 67,719,534 | | |
| | | Interest | | | 11,354 | | |
| | | Foreign taxes withheld | | | (9,931,612 | ) | |
| | | Total Investment Income | | | 57,799,276 | | |
| Expenses | | Investment advisory fee | | | 14,637,868 | | |
| | | Administration fee | | | 798,419 | | |
| | | Pricing and bookkeeping fees | | | 152,218 | | |
| | | Trustees' fees | | | 44,752 | | |
| | | Custody fee | | | 470,607 | | |
| | | Other expenses | | | 134,413 | | |
| | | Expenses before interest expense | | | 16,238,277 | | |
| | | Interest expense | | | 8,620 | | |
| | | Total Expenses | | | 16,246,897 | | |
| | | Custody earnings credits | | | (56 | ) | |
| | | Net Expenses | | | 16,246,841 | | |
| | | Net Investment Income | | | 41,552,435 | | |
| Net Realized and Unrealized Gain (Loss) on Investments and Foreign Currency | | Net realized loss on: | | | | | |
| | | Investments | | | (90,936,803 | ) | |
| | | Foreign currency transactions | | | (222,752 | ) | |
| | | Net realized loss | | | (91,159,555 | ) | |
| | | Net change in unrealized appreciation (depreciation) on: | | | | | |
| | | Investments | | | 326,454,629 | | |
| | | Foreign currency translations | | | 35,955 | | |
| | | Net change in unrealized appreciation (depreciation) | | | 326,490,584 | | |
| | | Net Gain | | | 235,331,029 | | |
| | | Net Increase Resulting from Operations | | | 276,883,464 | | |
See Accompanying Notes to Financial Statements.
35
Statement of Changes in Net Assets – Columbia International Value Master Portfolio
| | | Year Ended February 28, | |
| Increase (Decrease) in Net Assets | | 2011 ($) | | 2010 ($) | |
| Operations Net investment income | | | 41,552,435 | | | | 54,408,130 | | |
Net realized loss on investments and foreign
currency transactions | | | (91,159,555 | ) | | | (188,165,255 | ) | |
Net change in unrealized appreciation (depreciation) on
investments and foreign currency translations | | | 326,490,584 | | | | 712,243,777 | | |
| Net Increase Resulting from Operations | | | 276,883,464 | | | | 578,486,652 | | |
| Contributions | | | 465,537,680 | | | | 554,246,078 | | |
| Withdrawals | | | (660,383,240 | ) | | | (587,073,502 | ) | |
| Increase from regulatory settlements | | | — | | | | 494,889 | | |
| Total Increase in Net Assets | | | 82,037,904 | | | | 546,154,117 | | |
| Net Assets Beginning of period | | | 1,896,366,511 | | | | 1,350,212,394 | | |
| End of period | | | 1,978,404,415 | | | | 1,896,366,511 | | |
See Accompanying Notes to Financial Statements.
36
Financial Highlights – Columbia International Value Master Portfolio
Selected data for a share outstanding throughout each period is as follows:
| | | Year Ended February 28, | | Period
Ended
February 29, | | Year Ended March 31, | |
| | | 2011 | | 2010 | | 2009 | | 2008 (a) | | 2007 | | 2006 | |
| Total return | | | 16.11 | % | | | 46.24 | % | | | (42.12 | )% | | | (6.79 | )%(b) | | | 20.95 | % | | | 24.88 | % | |
Ratios to Average Net Assets/
Supplemental Data: | |
| Net expenses before interest expense (c) | | | 0.86 | % | | | 0.87 | % | | | 0.84 | % | | | 0.81 | %(d) | | | 0.80 | % | | | 0.80 | % | |
| Interest expense (e) | | | — | % | | | — | % | | | — | % | | | — | %(d) | | | — | % | | | — | % | |
| Net expenses (c) | | | 0.86 | % | | | 0.87 | % | | | 0.84 | % | | | 0.81 | %(d) | | | 0.80 | % | | | 0.80 | % | |
| Net investment income (c) | | | 2.21 | % | | | 3.08 | % | | | 3.58 | % | | | 3.27 | %(d) | | | 1.66 | % | | | 1.88 | % | |
| Portfolio turnover rate | | | 7 | % | | | 22 | % | | | 5 | % | | | 24 | %(b) | | | 19 | % | | | 20 | % | |
(a) The Master Portfolio changed its fiscal year end from March 31 to February 29. Per share data and total return reflect activity from April 1, 2007 through February 29, 2008.
(b) Not annualized.
(c) The benefits derived from custody credits had an impact of less than 0.01%.
(d) Annualized.
(e) Rounds to less than 0.01%.
See Accompanying Notes to Financial Statements.
37
Notes to Financial Statements – Columbia International Value Master Portfolio
February 28, 2011
Note 1. Organization
Columbia Funds Master Investment Trust, LLC (the Master Trust) is registered under the Investment Company Act of 1940, as amended (the 1940 Act), as an open-end management investment company. Information presented in these financial statements pertains to Columbia International Value Master Portfolio (the Master Portfolio).
The following investors were invested in the Master Portfolio at February 28, 2011:
| Columbia International Value Master Portfolio*: | |
Columbia International
Value Fund (the Feeder Fund) | | | 88.3 | % | |
Columbia Management Private
Funds VII, LLC—International Value Fund | | | 11.7 | % | |
* The Master Portfolio serves as a master portfolio for the Columbia International Value Fund which operates as a feeder fund in a master/feeder structure.
Investment Objective
The Master Portfolio seeks long-term capital appreciation.
Note 2. Summary of Significant Accounting Policies
The preparation of financial statements in accordance with U.S. generally accepted accounting principles (GAAP) requires management to make certain estimates and assumptions that affect the reported amounts of assets and liabilities, the disclosure of contingent assets and liabilities at the date of the financial statements and the reported amounts of revenue and expenses during the reporting period. Actual results could differ from those estimates.
The following is a summary of significant accounting policies consistently followed by the Master Portfolio in the preparation of its financial statements.
Security Valuation
Equity securities are valued at the last sale price on the principal exchange on which they trade, except for securities traded on the NASDAQ, which are valued at the NASDAQ official close price. Unlisted securities or listed securities for which there were no sales during the day are valued at the closing bid price on such exchanges or over-the-counter markets.
Short-term investments maturing in 60 days or less are valued at amortized cost, which approximates market value.
Foreign securities are generally valued at the last sale price on the foreign exchange or market on which they trade. If any foreign share prices are not readily available as a result of limited share activity, the securities are valued at the last sale price of the local shares in the principal market in which such securities are normally traded.
Generally, trading in foreign securities is substantially completed each day at various times prior to the close of the New York Stock Exchange (NYSE). The values of such securities used in computing the net asset value of the Master Portfolio's shares are determined as of such times. Foreign currency exchange rates are generally determined at 4:00 p.m. Eastern (U.S.) time. Occasionally, events affecting the values of such foreign securities may occur between the times at which they are determined and the close of the customary trading session of the NYSE, which would not be reflected in the computation of the Master Portfolio's net asset value. If events materially affecting the values of such foreign securities occur and it is determined that market quotations are not reliable, then these foreign securities will be valued at their fair value using procedures approved by the Board of Trustees.
The Master Portfolio may use a systematic fair valuation model provided by an independent third party to value securities principally traded in foreign markets in order to adjust for possible stale pricing that may occur between the close of the foreign exchanges and the time for valuation.
Investments for which market quotations are not readily available, or that have quotations which the Investment Manager believes are not reliable, are valued at fair value as determined in good faith under consistently applied procedures established by and under the general supervision of the Board of Trustees. If a security is valued at fair value, such value is likely to be different from the last quoted market price for the security. The determination of fair value often requires significant judgment. To determine fair value, the Investment Manager may use assumptions including but not limited to future cash flows and estimated risk premiums. Multiple inputs from various sources may be used to determine value.
Foreign Currency Transactions and Translations
The values of all assets and liabilities quoted in foreign currencies are translated into U.S. dollars at that day's exchange rates. Net realized and unrealized gains (losses) on foreign currency transactions and translations include gains (losses) arising from the fluctuation in exchange rates between trade and settlement dates on securities transactions, gains (losses) arising from the disposition of foreign
38
Columbia International Value Master Portfolio, February 28, 2011
currency and currency gains (losses) between the accrual and payment dates on dividends, interest income and foreign withholding taxes.
For financial statement purposes, the Master Portfolio does not distinguish that portion of gains (losses) on investments which is due to changes in foreign exchange rates from that which is due to changes in market prices of the investments. Such fluctuations are included with the net realized and unrealized gains (losses) on investments on the Statement of Operations.
Repurchase Agreements
The Master Portfolio may engage in repurchase agreement transactions with institutions that the Investment Manager has determined are creditworthy. The Master Portfolio, through the custodian, receives delivery of the underlying securities collateralizing a repurchase agreement. The Investment Manager is responsible for determining that the collateral is at least equal, at all times, to the value of the repurchase obligation including interest. A repurchase agreement transaction involves certain risks in the event of default or insolvency of the counterparty. These risks include possible delays in or restrictions on the Master Portfolio's ability to dispose of the underlying securities and a possible decline in the value of the underlying securities during the period while the Master Portfolio seeks to assert its rights.
Security Transactions
Security transactions are accounted for on the trade date. Cost is determined and gains (losses) are based upon the specific identification method for both financial statement and federal income tax purposes.
Income Recognition
Interest income is recorded on the accrual basis.
Corporate actions and dividend income are recorded net of any non-reclaimable tax withholdings, on the ex-dividend date or upon receipt of ex-dividend notification in the case of certain foreign securities.
Awards from class action litigation are recorded as a reduction of cost if the Fund still owns the applicable securities on the payment date. If the Master Portfolio no longer owns the applicable securities, the proceeds are recorded as realized gains.
Each investor in the Master Portfolio is treated as an owner of its proportionate share of the net assets, income, expenses and realized and unrealized gains (losses) of the Master Portfolio.
Federal Income Tax Status
The Master Portfolio is treated as a partnership for federal income tax purposes and therefore is not subject to federal income tax. Each investor in the Master Portfolio will be subject to taxation on its allocated share of the Master Portfolio's ordinary income and capital gains.
The Master Portfolio's assets, income and distributions will be managed in such a way that the Feeder Fund will be able to continue to qualify as a registered investment company by investing its assets through its Master Portfolio.
Foreign Tax
The Master Portfolio may be subject to foreign taxes on income and/or gains on investments or currency repatriation, a portion of which may be recoverable. The Master Portfolio will accrue such taxes and recoveries as applicable, based upon its current interpretation of tax rules and regulations that exist in the markets in which it invests.
Realized gains in certain countries may be subject to foreign taxes at the Master Portfolio level, at rates ranging from approximately 10% to 15%. The Master Portfolio accrues for such foreign taxes on net realized and unrealized gains at the appropriate rate for each jurisdiction.
Indemnification
In the normal course of business, the Master Portfolio enters into contracts that contain a variety of representations and warranties and which provide general indemnities. The Master Portfolio's maximum exposure under these arrangements is unknown because this would involve future claims against the Master Portfolio. Also, under the Master Trust's organizational documents and by contract, the Trustees and officers of the Master Trust are indemnified against certain liabilities that may arise out of actions relating to their duties to the Master Trust. However, based on experience, the Master Portfolio expects the risk of loss due to these representations, warranties and indemnities to be minimal.
39
Columbia International Value Master Portfolio, February 28, 2011
Note 3. Fees and Compensation Paid to Affiliates
Investment Management Services Fee
After the close of business on April 30, 2010, Ameriprise Financial, Inc. (Ameriprise Financial) acquired a portion of the asset management business of Columbia Management Group, LLC (the Transaction), including the business of managing the Master Portfolio. In connection with the closing of the Transaction (the Closing), RiverSource Investments, LLC, a wholly owned subsidiary of Ameriprise Financial, became the investment adviser of the Master Portfolio and changed its name to Columbia Management Investment Advisers, LLC (the Investment Manager). The Investment Manager determines which securities will be purchased, held or sold. The management fee is based on the Master Portfolio's average daily net assets at the following annual rates:
| Average Daily Net Assets | | Annual Fee Rate | |
| First $500 million | | | 0.85 | % | |
| $500 million to $1 billion | | | 0.80 | % | |
| $1 billion to $1.5 billion | | | 0.75 | % | |
| $1.5 billion to $3 billion | | | 0.70 | % | |
| $3 billion to $6 billion | | | 0.68 | % | |
| Over $6 billion | | | 0.66 | % | |
Prior to the Closing, Columbia Management Advisors, LLC (Columbia), an indirect, wholly owned subsidiary of Bank of America Corporation (BOA), provided investment management services to the Master Portfolio under the same fee structure.
The effective management fee rate for the year ended February 28, 2011, was 0.78% of the Master Portfolio's average daily net assets.
Subadvisory Fee
Brandes Investment Partners, L.P. (Brandes) has been retained by the Investment Manager to serve as the investment subadviser to the Master Portfolio. As the subadviser, and subject to the oversight of the Investment Manager and the Master Portfolio's Board of Trustees, Brandes is responsible for the daily investment operations, including placing all orders for the purchase and sale of the portfolio securities for the Master Portfolio. The Investment Manager, from the management fee it receives, pays Brandes a monthly subadvisory fee.
Prior to the Closing, Brandes provided subadvisory services to the Master Portfolio under the same fee structure in accordance with an agreement with Columbia.
Administration Fee
Effective upon the Closing, the Investment Manager became the administrator of the Master Portfolio and provides administrative and other services to the Master Portfolio, including services previously performed under the Pricing and Bookkeeping Oversight and Services Agreement discussed below. The administration fee is based on the annual rate of 0.05% of the Master Portfolio's average daily net assets, less the fees payable by the Master Portfolio as described under the Pricing and Bookkeeping Fees note below. Prior to the Closing, Columbia provided administrative services to the Master Portfolio at the same fee rate.
Pricing and Bookkeeping Fees
Prior to the Closing, the Master Portfolio entered into a Financial Reporting Services Agreement (the Financial Reporting Services Agreement) with State Street Bank and Trust Company (State Street) and Columbia pursuant to which State Street provides financial reporting services to the Master Portfolio. The Master Portfolio also entered into an Accounting Services Agreement (collectively with the Financial Reporting Services Agreement, the State Street Agreements) with State Street and Columbia pursuant to which State Street provides accounting services to the Master Portfolio. Upon the Closing, Columbia assigned and delegated its rights and obligations under the State Street Agreements to the Investment Manager. Under the State Street Agreements, the Master Portfolio pays State Street an annual fee of $38,000 paid monthly plus an additional monthly fee based on an annualized percentage rate of average daily net assets of the Master Portfolio for the month. The aggregate fee will not exceed $140,000 per year (exclusive of out-of-pocket expenses and charges). The Master Portfolio also reimburses State Street for certain out-of-pocket expenses and charges.
Also prior to the Closing, the Master Portfolio entered into a Pricing and Bookkeeping Oversight and Services Agreement (the Services Agreement) with Columbia. Under the Services Agreement, Columbia provided services related to Master Portfolio expenses and the requirements of the Sarbanes-Oxley Act of 2002, and provided oversight of the accounting and financial reporting services provided by State Street. Under the Services Agreement, the Master Portfolio reimbursed Columbia for out-of-pocket expenses and charges, including fees payable to third parties, such as for pricing the Master Portfolio's securities, incurred by Columbia in the performance of services under the Services Agreement. The Services Agreement was terminated upon the Closing. These services are now provided under the Administration Fee note discussed above.
40
Columbia International Value Master Portfolio, February 28, 2011
Expense Limits and Fee Waivers
Effective May 1, 2010, the Investment Manager and/or some of the Master Portfolio's other service providers voluntarily agreed to waive fees and/or reimburse the Master Portfolio for certain expenses so that the Master Portfolio's ordinary operating expenses (excluding any brokerage commissions, interest, taxes and extraordinary expenses, but including custodian charges relating to overdrafts, if any) after giving effect to any balance credits from the Master Portfolio's custodian, do not exceed the annual rate of 0.90% of the Master Portfolio's average daily net assets. These arrangements may be modified or terminated by the Investment Manager at any time. Prior to May 1, 2010, Columbia voluntarily reimbursed a portion of the Master Portfolio's expenses in the same manner.
Fees Paid to Officers and Trustees
Upon the Closing, all officers of the Master Portfolio are employees of the Investment Manager or its affiliates and receive no compensation from the Master Portfolio. The Board of Trustees has appointed a Chief Compliance Officer to the Master Portfolio in accordance with federal securities regulations. The Master Portfolio does not bear any of the expenses associated with the Chief Compliance Officer.
Trustees are compensated for their services to the Master Portfolio, as set forth on the Statement of Operations. The Master Trust's eligible Trustees may participate in a non-qualified deferred compensation plan which may be terminated at any time. Any payments to plan participants are paid solely out of the Master Portfolio's assets. Income earned on the plan participant's deferral account is based on the rate of return of the eligible mutual funds selected by the participant or, if no funds are selected, on the rate of return of Columbia Money Market Fund (formerly known as RiverSource Cash Management Fund). Prior to the Closing, if no funds were selected, income earned on the plan participant's deferral account was based on the rate of return of BofA Treasury Reserves. Trustees' fees deferred during the current period as well as any gains or losses on the trustees' deferred compensation balances as a result of market fluctuations are included in "Trustees' fees" on the Statement of Operations. Liabilities under the deferred compensation plan are included in "Trustees' fees" on the Statement of Assets and Liabilities.
Note 4. Custody Credits
The Master Portfolio has an agreement with its custodian bank under which custody fees may be reduced by balance credits. These credits are recorded as a part of expense reductions on the Statement of Operations. The Master Portfolio could have invested a portion of the assets utilized in connection with the expense offset arrangement in an income-producing asset if it had not entered into such an agreement. For the year ended February 28, 2011, these custody credits reduced total expenses by $56 for the Master Portfolio.
Note 5. Portfolio Information
The cost of purchases and proceeds from sales of securities, excluding short-term obligations, aggregated $134,156,994 and $260,863,452, respectively, for the year ended February 28, 2011.
Note 6. Regulatory Settlements
During the year ended February 28, 2010, the Master Portfolio received payments totaling $494,889, resulting from certain regulatory settlements with third parties that the Master Portfolio had participated in during the year. The payments have been included in "Increase from regulatory settlements" in the Statement of Changes in Net Assets.
Note 7. Line of Credit
The Master Portfolio and other affiliated funds participate in a $280,000,000 committed, unsecured revolving line of credit provided by State Street. The maximum amount that may be borrowed by the Master Portfolio is limited to the lesser of $200,000,000 and the Master Portfolio's borrowing limit set forth in the Master Portfolio's registration statement. Borrowings are available for short-term liquidity or temporary or emergency purposes.
Effective October 14, 2010, interest is charged to each participating fund based on the fund's borrowings at a rate per annum equal to the greater of the Federal Funds Rate plus 1.25% or the overnight LIBOR Rate plus 1.25%. In addition, a commitment fee of 0.125% per annum is accrued and apportioned among the participating funds pro rata based on their relative net assets.
Prior to October 14, 2010, interest was charged to each participating fund at the same rates. In addition, a commitment fee of 0.15% per annum was accrued and apportioned among the participating funds pro rata based on their relative net assets.
41
Columbia International Value Master Portfolio, February 28, 2011
For the year ended February 28, 2011, the average daily loan balance outstanding on days where borrowing existed was $3,570,690 at a weighted average interest rate of 1.49%.
Note 8. Federal Tax information
Unrealized appreciation and depreciation at February 28, 2011, based on cost of investments for federal income tax purposes were:
| Unrealized appreciation | | $ | 274,210,695 | | |
| Unrealized depreciation | | | (384,120,490 | ) | |
| Net unrealized depreciation | | $ | (109,909,795 | ) | |
* The differences between book-basis and tax-basis net unrealized depreciation are primarily due to passive foreign investment company (PFICs) adjustments and deferral of losses from wash sales.
Management is required to determine whether a tax position of the Master Portfolio is more likely than not to be sustained upon examination by the applicable taxing authority, including resolution of any related appeals or litigation processes, based on the technical merits of the position. The tax benefit to be recognized by the Master Portfolio is measured as the largest amount of benefit that is greater than fifty percent likely of being realized upon ultimate settlement. Management is not aware of any tax positions for which it is reasonably possible that the total amounts of unrecognized tax benefits will significantly change in the next twelve months. However, management's conclusions may be subject to review and adjustment at a later date based on factors including, but not limited to, new tax laws, regulations, and administrative interpretations (including relevant court decisions). The Master Portfolio's federal tax returns for the prior three fiscal years remain subject to examination by the Internal Revenue Service.
Note 9. Significant Risks and Contingencies
Foreign Securities Risk
Investing in foreign securities may include certain risks and considerations not typically associated with investing in U.S. securities, such as fluctuating currency values and changing local and regional economic, political and social conditions, which may result in greater market volatility. In addition, certain foreign securities may not be as liquid as U.S. securities. Investing in emerging markets may accentuate these risks.
Investments in emerging market countries are subject to additional risk. The risk of foreign investments is typically increased in less developed countries. These countries are also more likely to experience high levels of inflation, deflation or currency devaluation which could hurt their economies and securities markets.
Note 10. Subsequent Events
Management has evaluated the events and transactions that have occurred through the date the financial statements were issued and noted no items requiring adjustment of the financial statements or additional disclosure.
Note 11. Information Regarding Pending and Settled Legal Proceedings
In June 2004, an action captioned John E. Gallus et al. v. American Express Financial Corp. and American Express Financial Advisors Inc. was filed in the United States District Court for the District of Arizona. The plaintiffs allege that they are investors in several American Express Company (now known as RiverSource) mutual funds and they purport to bring the action derivatively on behalf of those funds under the Investment Company Act of 1940. The plaintiffs allege that fees allegedly paid to the defendants by the funds for investment advisory and administrative services are excessive. The plaintiffs seek remedies including restitution and rescission of investment advisory and distribution agreements. The plaintiffs voluntarily agreed to transfer this case to the United States District Court for the District of Minnesota (the District Court). In response to defendants' motion to dismiss the complaint, the District Court dismissed one of plaintiffs' four claims and granted plaintiffs limited discovery. Defendants moved for summary judgment in April 2007. Summary judgment was granted in the defendants' favor on July 9, 2007. The plaintiffs filed a notice of appeal with the Eighth Circuit Court of Appeals (the Eighth Circuit) on August 8, 2007. On April 8, 2009, the Eighth Circuit reversed summary judgment and remanded to the District Court for further proceedings. On August 6, 2009, defendants filed a writ of certiorari with the U.S. Supreme Court (the Supreme Court), asking the Supreme Court to stay the District Court proceedings while the Supreme Court considers and rules in a case captioned Jones v. Harris Associates, which involves issues of law similar to those presented in the Gallus case. On March 30, 2010, the Supreme Court issued its ruling in Jones v. Harris Associates, and on April 5, 2010, the Supreme Court vacated the Eighth Circuit's decision in the Gallus case and remanded the case to the Eighth Circuit for further consideration in light of the Supreme Court's decision in Jones v. Harris Associates. On June 4, 2010, the Eighth Circuit remanded the Gallus case to the District Court for further consideration in light of
42
Columbia International Value Master Portfolio, February 28, 2011
the Supreme Court's decision in Jones v. Harris Associates. On December 9, 2010, the District Court reinstated its July 9, 2007 summary judgment order in favor of the defendants. On January 10, 2011 plaintiffs filed a notice of appeal with the Eighth Circuit.
In December 2005, without admitting or denying the allegations, American Express Financial Corporation (AEFC, which is now known as Ameriprise Financial, Inc. (Ameriprise Financial)), entered into settlement agreements with the Securities and Exchange Commission (SEC) and Minnesota Department of Commerce (MDOC) related to market timing activities. As a result, AEFC was censured and ordered to cease and desist from committing or causing any violations of certain provisions of the Investment Advisers Act of 1940, the Investment Company Act of 1940, and various Minnesota laws. AEFC agreed to pay disgorgement of $10 million and civil money penalties of $7 million. AEFC also agreed to retain an independent distribution consultant to assist in developing a plan for distribution of all disgorgement and civil penalties ordered by the SEC in accordance with various undertakings detailed at http://www.sec.gov/litigation/admin/ia-2451.pdf. Ameriprise Financial and its affiliates have cooperated with the SEC and the MDOC in these legal proceedings, and have made regular reports to the funds' Boards of Directors/Trustees.
Ameriprise Financial and certain of its affiliates have historically been involved in a number of legal, arbitration and regulatory proceedings, including routine litigation, class actions, and governmental actions, concerning matters arising in connection with the conduct of their business activities. Ameriprise Financial believes that the Funds are not currently the subject of, and that neither Ameriprise Financial nor any of its affiliates are the subject of, any pending legal, arbitration or regulatory proceedings that are likely to have a material adverse effect on the Funds or the ability of Ameriprise Financial or its affiliates to perform under their contracts with the Funds. Ameriprise Financial is required to make 10-Q, 10-K and, as necessary, 8-K filings with the Securities and Exchange Commission on legal and regulatory matters that relate to Ameriprise Financial and its affiliates. Copies of these filings may be obtained by accessing the SEC website at www.sec.gov.
There can be no assurance that these matters, or the adverse publicity associated with them, will not result in increased fund redemptions, reduced sale of fund shares or other adverse consequences to the Funds. Further, although we believe proceedings are not likely to have a material adverse effect on the Funds or the ability of Ameriprise Financial or its affiliates to perform under their contracts with the Funds, these proceedings are subject to uncertainties and, as such, we are unable to estimate the possible loss or range of loss that may result. An adverse outcome in one or more of these proceedings could result in adverse judgments, settlements, fines, penalties or other relief that could have a material adverse effect on the consolidated financial condition or results of operations of Ameriprise Financial.
43
Report of Independent Registered Public Accounting Firm
To the Holders and Trustees of Columbia Funds Master Investment Trust, LLC
In our opinion, the accompanying statement of assets and liabilities, including the investment portfolio, and the related statements of operations and of changes in net assets and the financial highlights present fairly, in all material respects, the financial position of Columbia International Value Master Portfolio (constituting a series of Columbia Funds Master Investment Trust, LLC, hereafter referred to as the "Master Portfolio") at February 28, 2011, and the results of its operations for the year then ended, and the changes in its net assets and the financial highlights for each of the periods indicated, in conformity with accounting principles generally accepted in the United States of America. These financial statements and financial highlights (hereafter referred to as "financial statements") are the responsibility of the Master Portfolio's management. Our responsibility is to express an opinion on these financial statements based on our audits. We conducted our audits of these financial statements in accordance with the standards of the Public Company Accounting Oversight Board (United States). Those standards require that we plan and perform the audit to obtain reasonable assurance about whether the financial statements are free of material misstatement. An audit includes examining, on a test basis, evidence supporting the amounts and disclosures in the financial statements, assessing the accounting principles used and significant estimates made by management, and evaluating the overall financial statement presentation. We believe that our audits, which included confirmation of securities at February 28, 2011 by correspondence with the custodian and brokers, provide a reasonable basis for our opinion.
PricewaterhouseCoopers LLP
Boston, Massachusetts
April 21, 2011
44
Fund Governance
The Trustees serve terms of indefinite duration. The names, addresses and birth years of the Trustees and Officers of the Funds in the Columbia Funds Series Trust, the year each was first elected or appointed to office, their principal business occupations during at least the last five years, the number of Funds overseen by each Trustee and other directorships they hold are shown below. Each officer listed below serves as an officer of each Fund in the Columbia Funds Series Trust.
Independent Trustees
Name, Address and Year of Birth,
Position with Funds, Year First
Elected or Appointed to Office | | Principal Occupation(s) During Past Five Years, Number of Funds in the Columbia
Funds Complex Overseen by Trustee, Other Directorships Held
| |
| Edward J. Boudreau, Jr. (Born 1944) | |
|
c/o Columbia Management
Investment Advisers, LLC
225 Franklin Street
Boston, MA 02110
Trustee (since 2005) | | Managing Director—E.J. Boudreau & Associates (consulting), from 2000 through current; oversees 44; Trustee—BofA Funds Series Trust. | |
|
| William P. Carmichael (Born 1943) | |
|
c/o Columbia Management
Investment Advisers, LLC
225 Franklin Street
Boston, MA 02110
Trustee (since 1999) | | Retired; Oversees 44; Director—Cobra Electronics Corporation (electronic equipment manufacturer); Director—McMoRan Exploration Company (oil and gas exploration and development); Director—The Finish Line (athletic shoes and apparel); Trustee—BofA Funds Series Trust; Former Director—Simmons Company (bedding). | |
|
| William A. Hawkins (Born 1942) | |
|
c/o Columbia Management
Investment Advisers, LLC
225 Franklin Street
Boston, MA 02110
Trustee (since 2005) | | Managing Director—Overton Partners (financial consulting), August 2010 to present; President and Chief Executive Officer—California General Bank, N.A., from January 2008 through August 2010; oversees 44; Trustee—BofA Funds Series Trust. | |
|
| R. Glenn Hilliard (Born 1943) | |
|
c/o Columbia Management
Investment Advisers, LLC
225 Franklin Street
Boston, MA 02110
Trustee (since 2005) | | Chairman and Chief Executive Officer—Hilliard Group LLC (investing and consulting), from April 2003 through current; Non-Executive Director & Chairman—CNO Financial, Inc. (formerly Conseco, Inc.) (insurance), September 2003 through current; Executive Chairman—Conseco, Inc. (insurance), August 2004 through September 2005; oversees 44; Trustee—BofA Funds Series Trust. | |
|
| John J. Nagorniak (Born 1944) | |
|
c/o Columbia Management
Investment Advisers, LLC
225 Franklin Street
Boston, MA 02110
Trustee (since 2008) | | Retired; President and Director—Foxstone Financial, Inc. (consulting), 2000 through December 2007; Director—Mellon Financial Corporation affiliates (investing), 2000 through 2007; Chairman—Franklin Portfolio Associates (investing—Mellon affiliate), 1982 through 2007; oversees 44; Director—MIT Investment Company; Trustee—MIT 401k Plan. | |
|
45
Fund Governance (continued)
Independent Trustees (continued)
Name, Address and Year of Birth,
Position with Funds, Year First
Elected or Appointed to Office | | Principal Occupation(s) During Past Five Years, Number of Funds in the Columbia
Funds Complex Overseen by Trustee, Other Directorships Held
| |
| Minor M. Shaw (Born 1947) | |
|
c/o Columbia Management
Investment Advisers, LLC
225 Franklin Street
Boston, MA 02110
Trustee (since 2003) | | President—Micco Corporation and Mickel Investment Group; oversees 44; Board Member—Piedmont Natural Gas; Trustee—BofA Funds Series Trust. | |
|
Interested Trustee
| Anthony M. Santomero1 (Born 1946) | |
|
c/o Columbia Management
Investment Advisers, LLC
225 Franklin Street
Boston, MA 02110
Trustee (since 2008) | | Richard K. Mellon Professor Emeritus of Finance, The Wharton School, University of Pennsylvania, from 2002 through current; Senior Advisor—McKinsey & Company (consulting), July 2006 through January 2008; President and Chief Executive Officer—Federal Reserve Bank of Philadelphia, July 2000 through April 2006; oversees 44; Director—Renaissance Reinsurance Ltd; Trustee—Penn Mutual Life Insurance Company; Director—Citigroup, Inc.; Citibank, N.A.; Trustee—BofA Funds Series Trust. | |
|
1 Dr. Santomero is currently deemed by the Columbia Funds to be an "interested person" (as defined in the 1940 Act) of the Funds because he serves as a Director of Citigroup, Inc. and Citibank N.A., companies that may directly or through subsidiaries and affiliates engage from time-to-time in brokerage execution, principal transactions and lending relationships with the Columbia Funds or other funds or accounts advised/managed by the Adviser.
The Statement of Additional Information includes additional information about the Trustees of the Funds and is available, without charge, upon request by calling 800-345-6611.
Officers
| Name, Year of Birth and Address | | Principal Occupation(s) During the Past Five Years | |
| J. Kevin Connaughton (Born 1964) | |
|
225 Franklin Street
Boston, MA 02110
President (since 2009) | | Senior Vice President and General Manager—Mutual Fund Products, Columbia Management Investment Advisers, LLC since May 2010; President, Columbia Funds, since 2009, and RiverSource Funds, since May 2010 (previously Senior Vice President and Chief Financial Officer, Columbia Funds, from June 2008 to January 2009, Treasurer, Columbia Funds, from October 2003 to May 2008, and senior officer of various other affiliated funds since 2000); Managing Director, Columbia Management Advisors, LLC from December 2004 to April 2010. | |
|
| Michael G. Clarke (Born 1969) | |
|
225 Franklin Street
Boston, MA 02110
Senior Vice President and
Chief Financial Officer (since 2009) | | Vice President, Columbia Management Investment Advisers, LLC since May 2010; Managing Director of Fund Administration, Columbia Management Advisors, LLC, from September 2004 to April 2010; senior officer of Columbia Funds and affiliated funds since 2002. | |
|
46
Fund Governance (continued)
Officers (continued)
| Name, Year of Birth and Address | | Principal Occupation(s) During the Past Five Years | |
| Scott R. Plummer (Born 1959) | |
|
5228 Ameriprise Financial Center
Minneapolis, MN 55474
Senior Vice President, Secretary and Chief Legal Officer (since 2010) | | Chief Legal Officer and Assistant Secretary, Columbia Management Investment Advisers, LLC since June 2005; Vice President and Lead Chief Counsel—Asset Management, Ameriprise Financial, Inc. since May 2010 (previously Vice President and Chief Counsel—Asset Management, from 2005 to April 2010, and Vice President—Asset Management Compliance from 2004 to 2005); Vice President, Chief Counsel and Assistant Secretary, Columbia Management Investment Distributors, Inc. since 2008; Vice President, General Counsel and Secretary, Ameriprise Certificate Company since 2005; Chief Counsel, RiverSource Distributors, Inc. since 2006; Vice President, General Counsel and Secretary, RiverSource Funds, since December 2006; Senior Vice President, Secretary and Chief Legal Officer, Columbia Funds, since May 2010. | |
|
| Linda J. Wondrack (Born 1964) | |
|
225 Franklin Street
Boston, MA 02110
Senior Vice President and
Chief Compliance Officer (since 2007) | | Vice President and Chief Compliance Officer, Columbia Management Investment Advisers, LLC since May 2010; Chief Compliance Officer, Columbia Funds, since 2007, and RiverSource Funds, since May 2010; Director (Columbia Management Group, LLC and Investment Product Group Compliance), Bank of America, from June 2005 to April 2010. | |
|
| William F. Truscott (Born 1960) | |
|
53600 Ameriprise Financial Center
Minneapolis, MN 55474
Senior Vice President (since 2010) | | Chairman of the Board, Columbia Management Investment Advisers, LLC since May 2010 (previously President, Chairman of the Board and Chief Investment Officer, from 2001 to April 2010); Chief Executive Officer, U.S. Asset Management & President, Annuities, Ameriprise Financial, Inc. since May 2010 (previously President—U.S. Asset Management and Chief Investment Officer from 2005 to April 2010, and Senior Vice President—Chief Investment Officer, from 2001 to 2005); Director, President and Chief Executive Officer, Ameriprise Certificate Company since 2006; Director, Columbia Management Investment Distributors, Inc. since May 2010 (previously Chairman of the Board and Chief Executive Officer from 2008 to April 2010); Chairman of the Board and Chief Executive Officer, RiverSource Distributors, Inc. since 2006. | |
|
| Colin Moore (Born 1958) | |
|
225 Franklin Street
Boston, MA 02110
Senior Vice President (since 2010) | | Director and Chief Investment Officer, Columbia Management Investment Advisers, LLC since May 2010; Manager, Managing Director and Chief Investment Officer of Columbia Management Advisors, LLC from 2007 to April 2010; Head of Equities, Columbia Management Advisors, LLC from 2002 to 2007. | |
|
| Michael A. Jones (Born 1959) | |
|
225 Franklin Street
Boston, MA 02110
Senior Vice President (since 2010) | | President and Director, Columbia Management Investment Advisers, LLC since May 2010; President and Director, Columbia Management Investment Distributors, Inc. since May 2010; Manager, Chairman, Chief Executive Officer and President, Columbia Management Advisors, LLC from 2007 to April 2010; Chief Executive Officer, President and Director, Columbia Management Distributors, Inc. from November 2006 to April 2010; previously, co-president and senior managing director at Robeco Investment Management. | |
|
47
Fund Governance (continued)
Officers (continued)
| Name, Year of Birth and Address | | Principal Occupation(s) During the Past Five Years | |
| Amy Johnson (Born 1965) | |
|
5228 Ameriprise Financial Center
Minneapolis, MN 55474
Senior Vice President (since 2010) | | Senior Vice President and Chief Operating Officer, Columbia Management Investment Advisers, LLC since May 2010 (previously Chief Administrative Officer, from 2009 until April 2010, Vice President—Asset Management and Trust Company Services, from 2006 to 2009, and Vice President—Operations and Compliance from 2004 to 2006). | |
|
| Joseph F. DiMaria (Born 1968) | |
|
225 Franklin Street
Boston, MA 02110
Treasurer (since 2010) and
Chief Accounting Officer (since 2008) | | Vice President, Mutual Fund Administration, Columbia Management Investment Advisers, LLC, since May 2010; Director of Fund Administration, Columbia Management Advisors, LLC from January 2006 to April 2010; Head of Tax/Compliance and Assistant Treasurer, Columbia Management Advisors, LLC, from November 2004 to December 2005. | |
|
| Marybeth Pilat (Born 1968) | |
|
225 Franklin Street
Boston, MA 02110
Deputy Treasurer (since 2010) | | Vice President, Mutual Fund Administration, Columbia Management Investment Advisers, LLC, since May 2010; Vice President, Investment Operations, Bank of America, from October 2008 to April 2010; Finance Manager, Boston Children's Hospital from August 2008 to October 2008; Director, Mutual Fund Administration, Columbia Management Advisors, LLC, from May 2007 to July 2008; Vice President, Mutual Fund Valuation, Columbia Management Advisors, LLC, from January 2006 to May 2007; Vice President, Mutual Fund Accounting Oversight, Columbia Management Advisors, LLC from January 2005 to January 2006. | |
|
| Julian Quero (Born 1967) | |
|
225 Franklin Street
Boston, MA 02110
Deputy Treasurer (since 2008) | | Vice President, Mutual Fund Administration, Columbia Management Investment Advisers, LLC since May 2010; Director of Fund Administration, Columbia Management Advisors, LLC, from August 2008 to April 2010; Senior Tax Manager, Columbia Management Advisors, LLC from August 2006 to July 2008; Senior Compliance Manager, Columbia Management Advisors, LLC from April 2002 to August 2006. | |
|
| Stephen T. Welsh (Born 1957) | |
|
225 Franklin Street
Boston, MA 02110
Vice President (since 2006) | | President and Director, Columbia Management Investment Services Corp. since May 2010; President and Director, Columbia Management Services, Inc. from July 2004 to April 2010; Managing Director, Columbia Management Distributors, Inc. from August 2007 to April 2010. | |
|
48
Shareholder Meeting Results
At a Joint Special Meeting of Shareholders held on February 15, 2011, shareholders of the series of Columbia Funds Series Trust, including the Fund, elected each of the nominees for trustees to the Board of Trustees of Columbia Funds Series Trust, each to hold office for an indefinite term, as follows1:
| Trustee | | Votes For | | Votes Withheld | | Abstentions | |
| Kathleen Blatz | | | 2,145,636,122 | | | | 248,012,438 | | | | 0 | | |
| Edward J. Boudreau, Jr. | | | 2,145,430,114 | | | | 248,218,446 | | | | 0 | | |
| Pamela G. Carlton | | | 2,145,515,949 | | | | 248,132,612 | | | | 0 | | |
| William P. Carmichael | | | 2,145,038,695 | | | | 248,609,866 | | | | 0 | | |
| Patricia M. Flynn | | | 2,145,843,563 | | | | 247,804,997 | | | | 0 | | |
| William A. Hawkins | | | 2,145,359,401 | | | | 248,289,160 | | | | 0 | | |
| R. Glenn Hilliard | | | 2,145,079,400 | | | | 248,569,161 | | | | 0 | | |
| Stephen R. Lewis, Jr. | | | 2,145,092,209 | | | | 248,556,351 | | | | 0 | | |
| John F. Maher | | | 2,145,621,338 | | | | 248,027,223 | | | | 0 | | |
| John J. Nagorniak | | | 2,145,337,494 | | | | 248,311,067 | | | | 0 | | |
| Catherine James Paglia | | | 2,145,615,254 | | | | 248,033,306 | | | | 0 | | |
| Leroy C. Richie | | | 2,145,042,120 | | | | 248,606,441 | | | | 0 | | |
| Anthony M. Santomero | | | 2,145,088,174 | | | | 248,560,386 | | | | 0 | | |
| Minor M. Shaw | | | 2,145,430,762 | | | | 248,217,798 | | | | 0 | | |
| Alison Taunton-Rigby | | | 2,145,393,384 | | | | 248,255,177 | | | | 0 | | |
| William F. Truscott | | | 2,144,907,223 | | | | 248,741,338 | | | | 0 | | |
1 As described in the proxy statement for the meeting, Columbia International Value Fund invests all or substantially all of its assets in Columbia International Value Master Portfolio (Master Portfolio), which is a fund series of Columbia Funds Master Investment Trust, LLC (Master Trust). As an interestholder in Master Trust, Columbia International Value Fund was asked to elect the Trustees of Master Trust's Board of Trustees. As an interest holder, the Columbia International Value Fund "passed through" its vote on the Master Portfolio and Master Trust proposals to its shareholders. The proposal on behalf of Master Portfolio and Master Trust was approved.
49
This page intentionally left blank.
This page intentionally left blank.
This page intentionally left blank.
Important Information About This Report
The fund mails one shareholder report to each shareholder address. If you would like more than one report, please call shareholder services at 1-800-345-6611 and additional reports will be sent to you. This report has been prepared for shareholders of Columbia International Value Fund.
A description of the policies and procedures that the fund uses to determine how to vote proxies and a copy of the fund's voting records are available (i) at www.columbiamanagement.com, (ii) on the Securities and Exchange Commission's website at www.sec.gov, and (iii) without charge, upon request, by calling 1-800-368-0346. Information regarding how the fund voted proxies relating to portfolio securities during the 12-month period ended June 30 is available from the SEC's website. Information regarding how the fund voted proxies relating to portfolio securities is also available from the fund's website, www.columbiamanagement.com.
The fund files a complete schedule of portfolio holdings with the SEC for the first and third quarters of each fiscal year on Form N-Q. The fund's Form N-Q is available on the SEC's website at www.sec.gov and may be reviewed and copied at the SEC's Public Reference Room in Washington, D.C. Information on the operation of the Public Reference Room may be obtained by calling 1-800-SEC-0330.
Transfer Agent
Columbia Management Investment
Services Corp.
P.O. Box 8081
Boston, MA 02266-8081
1-800-345-6611
Distributor
Columbia Management Investment
Distributors, Inc.
225 Franklin Street
Boston, MA 02110
Investment Manager
Columbia Management Investment Advisers, LLC
225 Franklin Street
Boston, MA 02110
53

PRSRT STD
U.S. Postage
PAID
Holliston, MA
Permit NO. 20
Columbia International Value Fund
P. O. Box 8081
Boston, MA 02266-8081
columbiamanagement.com
This information is for use with concurrent or prior delivery of a fund prospectus. Investors should consider the investment objectives, risks, charges and expenses of a mutual fund carefully before investing. For a free prospectus, which contains this and other important information about the funds, visit columbiamanagement.com. Read the prospectus carefully before investing. The Fund is distributed by Columbia Management Investment Distributors, Inc., member FINRA, and managed by Columbia Management Investment Advisers, LLC.
© 2011 Columbia Management Investment Advisers, LLC. All rights reserved.
C-1681 A (04/11)

Columbia Marsico Global Fund
Annual Report for the Period Ended February 28, 2011
Not FDIC insured • No bank guarantee • May lose value
Table of Contents
| Fund Profile | | | 1 | | |
|
| Economic Update | | | 2 | | |
|
| Performance Information | | | 4 | | |
|
| Understanding Your Expenses | | | 5 | | |
|
| Portfolio Managers' Report | | | 6 | | |
|
| Investment Portfolio | | | 8 | | |
|
Statement of Assets and
Liabilities | | | 11 | | |
|
| Statement of Operations | | | 13 | | |
|
Statement of Changes in
Net Assets | | | 14 | | |
|
| Financial Highlights | | | 16 | | |
|
| Notes to Financial Statements | | | 20 | | |
|
Report of Independent Registered
Public Accounting Firm | | | 29 | | |
|
| Federal Income Tax Information | | | 30 | | |
|
| Fund Governance | | | 31 | | |
|
| Shareholder Meeting Results | | | 35 | | |
|
Important Information About
This Report | | | 37 | | |
|
The views expressed in this report reflect the current views of the respective parties. These views are not guarantees of future performance and involve certain risks, uncertainties and assumptions that are difficult to predict, so actual outcomes and results may differ significantly from the views expressed. These views are subject to change at any time based upon economic, market or other conditions and the respective parties disclaim any responsibility to update such views. These views may not be relied on as investment advice and, because investment decisions for a Columbia Fund are based on numerous factors, may not be relied on as an indication of trading intent on behalf of any particular Columbia Fund. References to specific securities should not be construed as a recommendation or investment advice.
President's Message

Dear Shareholder:
The Columbia Management story began over 100 years ago, and today, we are one of the nation's largest dedicated asset managers. The recent acquisition by Ameriprise Financial, Inc. brings together the talents, resources and capabilities of Columbia Management with those of RiverSource Investments, Threadneedle (acquired by Ameriprise in 2003) and Seligman Investments (acquired by Ameriprise in 2008) to build a best-in-class asset management business that we believe is truly greater than its parts.
RiverSource Investments traces its roots to 1894 when its then newly-founded predecessor, Investors Syndicate, offered a face-amount savings certificate that gave small investors the opportunity to build a safe and secure fund for retirement, education or other special needs. A mutual fund pioneer, Investors Syndicate launched Investors Mutual Fund in 1940. In the decades that followed, its mutual fund products and services lineup grew to include a full spectrum of styles and specialties. More than 110 years later, RiverSource continues to be a trusted financial products leader.
Threadneedle, a leader in global asset management and one of Europe's largest asset managers, offers sophisticated international experience from a dedicated U.K. management team. Headquartered in London, it is named for Threadneedle Street in the heart of the city's financial district, where British investors pioneered international and global investing. Threadneedle was acquired in 2003 and today operates as an affiliate of Columbia Management.
Seligman Investments' beginnings date back to the establishment of the investment firm J. & W. Seligman & Co. in 1864. In the years that followed, Seligman played a major role in the geographical expansion and industrial development of the United States. In 1874, President Ulysses S. Grant named Seligman as fiscal agent for the U.S. Navy—an appointment that would last through World War I. Seligman helped finance the westward path of the railroads and the building of the Panama Canal. The firm organized its first investment company in 1929 and began managing its first mutual fund in 1930. In 2008, J. & W. Seligman & Co. Incorporated was acquired and Seligman Investments became an offering brand of RiverSource Investments, LLC.
We are proud of the rich and distinctive history of these firms, the strength and breadth of products and services they offer, and the combined cultures of pioneering spirit and forward thinking. Together we are committed to providing more for our shareholders than ever before.
> A singular focus on our shareholders
Our business is asset management, so investors are our first priority. We dedicate our resources to identifying timely investment opportunities and provide a comprehensive choice of equity, fixed-income and alternative investments to help meet your individual needs.
> First-class research and thought leadership
We are dedicated to helping you take advantage of today's opportunities and anticipate tomorrow's. We stay abreast of the latest investment trends and ideas, using our collective insight to evaluate events and transform them into solutions you can use.
> A disciplined investment approach
We aren't distracted by passing fads. Our teams adhere to a rigorous investment process that helps ensure the integrity of our products and enables you and your financial advisor to match our solutions to your objectives with confidence.
When you choose Columbia Management, you can be confident that we will take the time to understand your needs and help you and your financial advisor identify the solutions that are right for you. Because at Columbia Management, we don't consider ourselves successful unless you are.
Sincerely,

J. Kevin Connaughton
President, Columbia Funds
Investors should consider the investment objectives, risks, charges and expenses of a mutual fund carefully before investing. For a free prospectus, which contains this and other important information about the funds, visit www.columbiamanagement.com. The prospectus should be read carefully before investing.
Columbia Funds are distributed by Columbia Management Investment Distributors, Inc., member FINRA, and managed by Columbia Management Investment Advisers, LLC.
© 2011 Columbia Management Investment Advisers, LLC. All rights reserved.
Fund Profile – Columbia Marsico Global Fund
Summary
g For the 12-month period ended February 28, 2011, the fund's Class A shares returned 30.23% without sales charge.
g The fund significantly outperformed both its benchmark, the MSCI All Country World Index (Net)1, and its peer group average, the Lipper Global Large-Cap Classification.2
g Stock selection plus an overweight relative to the index in the consumer discretionary sector aided the fund's strong results as did stock selection in information technology, financials and industrials.
Portfolio Management
Corydon J. Gilchrist has co-managed the fund since 2008. He is associated with Marsico Capital Management, LLC (MCM), investment subadviser to the fund.
James G. Gendelman has co-managed the fund since 2008. He is associated with MCM, investment subadviser to the fund.
Thomas F. Marsico has co-managed the fund since 2008. He is associated with MCM, investment subadviser to the fund.
Columbia Management Investment Advisers, LLC (CMIA) retained MCM to serve as investment subadviser to the Columbia Marsico funds. As an investment subadviser, MCM makes the investment decisions and manages all or a portion of the fund. MCM is an investment adviser registered with the Securities and Exchange Commission. MCM is not affiliated with CMIA.
1The Morgan Stanley Capital International (MSCI) All Country World Index (Net) is a free float-adjusted market capitalization index that is designed to measure equity market performance in the global developed and emerging markets.
2Lipper Inc., a widely respected data provider in the industry, calculates an average total return (assuming reinvestment of distributions) for mutual funds with investment objectives similar to those of the fund. Lipper makes no adjustment for the effect of sales loads.
Indices are not available for investment, are not professionally managed and do not reflect sales charges, fees, brokerage commissions, taxes or other expenses of investing. Securities in the fund may not match those in an index.
Performance data quoted represents past performance and current performance may be lower or higher. Past performance is no guarantee of future results. The investment return and principal value will fluctuate so that shares, when redeemed, may be worth more or less than the original cost. Please visit www.columbiamanagement.com for daily and most recent month-end performance updates.
Summary
1-year return as of 02/28/11
| | +30.23% | |
|
|  | | | Class A shares
(without sales charge) | |
|
| | +21.54% | |
|
|  | | | MSCI All Country World Index
(Net) | |
|
Morningstar Style BoxTM

The Morningstar Style BoxTM is based on the fund's portfolio holdings. For equity funds, the vertical axis shows the market capitalization of the stocks owned, and the horizontal axis shows investment style (value, blend or growth). Information shown is based on the most recent data provided by Morningstar.
© 2011 Morningstar, Inc. All rights reserved. The Morningstar information contained herein: (1) is proprietary to Morningstar and/or its content providers; (2) may not be copied or distributed; and (3) is not warranted to be accurate, complete or timely. Neither Morningstar nor its content providers are responsible for any damages or losses arising from any use of this information.
1
Economic Update – Columbia Marsico Global Fund
Summary
For the 12-month period that ended February 28, 2011
g Despite intermittent volatility, stock markets around the world gained ground, as measured by the S&P 500 Index, the MSCI EAFE Index (Net) and the MSCI Emerging Markets Index (Net).
| S&P Index | | MSCI EAFE
Index | |
|
 | |  | |
|
MSCI EM
Index | | | | | |
|
 | | | |
|
As the world shed concerns that key economies might lapse back into recession, the World Bank reported that global gross domestic product rose 3.9% in 2010. The improvement over 2009 was more notable in high-income developed economies than in emerging-market countries, which had less ground to make up. Emerging market countries expanded by an estimated 7%, contributing nearly half of all global growth in 2010. This two-speed global recovery is likely to result in slower growth in 2011, but global growth should remain solid at 3.3% to 3.6%1—higher in emerging market economies, led by China and India.
Robust expansion in the Asia Pacific region
Asian Pacific economies led the global economy in 2010 and are poised to continue in that role. Exports from markets such as Singapore and South Korea have been solid and domestic demand continues to strengthen. Labor markets are healthy, income is rising and confidence runs high across the region. Higher oil prices pose a downside risk to the current expansion, because it could erode demand for Asian exports and increase the risk of inflation. However, if growth exceeds expectations in the United States or Europe, the picture gets even better for Asia.
Austerity measures weigh on Europe
Growth in the developed world was hampered by a debt crisis in Europe's weakest nations. However, the European Union took steps to manage debt restructuring in an orderly fashion and fear subsided—at least, for now. In addition, austerity measures were introduced in Greece, Ireland, Portugal and Spain. Public employment and government spending were cut back sharply. Layoffs and pay cuts have been met with resistance, but their necessity is hard to dispute.
Inflation a growing worry
As demand picked up and commodity prices began to rise across the globe, inflation has become a growing worry in both fast-growing emerging markets and slower-growth developed countries. In developed market economies, inflation is generally an external force, resulting from higher commodity prices, especially for food and energy. In emerging markets, excess demand is driving inflation concerns and policymakers have begun to shift their focus from stimulating growth to taming inflation. However, rising food prices are also a problem in Asia since food accounts for a greater percentage of household budgets than it does in more developed areas of the world.
Stocks stall, then pick up steam
Despite a period of volatility in the summer of 2010, as the world sought to digest a mounting debt crisis within euro-zone countries, it was a good year for stock markets around the world. The U.S. stock market returned 22.57% for the 12-month period, as measured by the S&P 500 Index.2 Outside the U.S., stock market returns were also strong. The MSCI EAFE Index (Net),3 a broad gauge of stock market performance in foreign developed markets, gained 20.00% (in
1World Bank estimate, January 12, 2011.
2The Standard & Poor's (S&P) 500 Index tracks the performance of 500 widely held, large-capitalization U.S. stocks.
3The Morgan Stanley Capital International Europe, Australasia, Far East (MSCI EAFE) Index (Net) is a free float adjusted market capitalization index that is designed to measure the equity market performance of developed markets, excluding the U.S. & Canada. As of May 27, 2010, the MSCI EAFE Index (Net) consisted of the following 22 developed market country indices: Australia, Austria, Belgium, Denmark, Finland, France, Germany, Greece, Hong Kong, Ireland, Israel, Italy, Japan, the Netherlands, New Zealand, Norway, Portugal, Singapore, Spain, Sweden, Switzerland and the United Kingdom.
2
Economic Update (continued) – Columbia Marsico Global Fund
U.S. dollars) for the period. The MSCI Emerging Markets Index (Net)4 returned 20.91% (in U.S. dollars), led by strong performances from European and Eastern European markets. Rising inflation pressures and tighter monetary policy late in the 12-month period tempered returns.
Past performance is no guarantee of future results.
4The Morgan Stanley Capital International Emerging Markets (MSCI EM) Index (Net) is a free float-adjusted market capitalization index that is designed to measure equity market performance of emerging markets. As of May 27, 2010, the MSCI EM Index (Net) consisted of the following 21 emerging market country indices: Brazil, Chile, China, Colombia, Czech Republic, Egypt, Hungary, India, Indonesia, Korea, Malaysia, Mexico, Morocco, Peru, Philippines, Poland, Russia, South Africa, Taiwan, Thailand and Turkey.
Indices are not available for investment, are not professionally managed and do not reflect sales charges, fees, brokerage commissions, taxes or other expenses of investing. Securities in the fund may not match those in an index.
3
Performance Information – Columbia Marsico Global Fund
Performance data quoted represents past performance and current performance may be lower or higher. Past performance is no guarantee of future results. The investment return and principal value will fluctuate so that shares, when redeemed, may be worth more or less than the original cost. Please visit www.columbiamanagement.com for daily and most recent month-end performance updates.
Performance of a $10,000 investment 04/30/08 – 02/28/11
The chart above shows the change in value of a hypothetical $10,000 investment in Class A shares of Columbia Marsico Global Fund during the stated time period, and does not reflect the deduction of taxes that a shareholder may pay on fund distributions or on the redemption of fund shares.
Performance of a $10,000 investment 04/30/08 – 02/28/11 ($)
| Sales charge | | without | | with | |
| Class A | | | 10,261 | | | | 9,671 | | |
| Class C | | | 10,047 | | | | 10,047 | | |
| Class R | | | 10,194 | | | | n/a | | |
| Class Z | | | 10,338 | | | | n/a | | |
Average annual total return as of 02/28/10 (%)
| Share class | | A | | C | | R | | Z | |
| Inception | | 04/30/08 | | 04/30/08 | | 04/30/08 | | 04/30/08 | |
| Sales charge | | without | | with | | without | | with | | without | | without | |
| 1-year | | | 30.23 | | | | 22.72 | | | | 29.14 | | | | 28.14 | | | | 29.94 | | | | 30.47 | | |
| Life | | | 0.91 | | | | –1.17 | | | | 0.17 | | | | 0.17 | | | | 0.68 | | | | 1.18 | | |
The "with sales charge" returns include the maximum initial sales charge of 5.75% for Class A shares and 1.00% for Class C shares for the first year only. The "without sales charge" returns do not include the effect of sales charges. If they had, returns would be lower.
Performance results reflect any fee waivers or reimbursements of fund expenses by the Investment Manager and/or any of its affiliates. Absent these fee waivers or expense reimbursement arrangements, performance results would have been lower.
All results shown assume reinvestment of distributions. Class R shares are sold at net asset value with a distribution (Rule 12b-1) fee. Class Z shares are sold at net asset value with no distribution and service (Rule 12b-1) fees. Class R shares and Class Z shares have limited eligibility and the investment minimum requirements may vary. Please see the fund's prospectus for details. Performance for different share classes will vary based on differences in sales charges and fees associated with each class.
The tables do not reflect the deduction of taxes that a shareholder may pay on fund distributions or on the redemption of fund shares.
4
Understanding Your Expenses – Columbia Marsico Global Fund
As a fund shareholder, you incur two types of costs. There are transaction costs, which generally include sales charges on purchases and may include redemption fees or exchange fees. There are also ongoing costs, which generally include investment advisory fees, distribution and service (Rule 12b-1) fees and other fund expenses. The information on this page is intended to help you understand the ongoing costs of investing in the fund and to compare these costs with the ongoing costs of investing in other mutual funds.
Analyzing your fund's expenses by share class
To illustrate these ongoing costs, we have provided an example and calculated the expenses paid by investors in each share class during the period. The information in the following table is based on an initial investment of $1,000, which is invested at the beginning of the period and held for the entire period. Expense information is calculated two ways and each method provides you with different information. The amount listed in the "Actual" column is calculated using the fund's actual operating expenses and total return for the period. The amount listed in the "Hypothetical" column for each share class assumes that the return each year is 5% before expenses and is calculated based on the fund's actual operating expenses. You should not use the hypothetical account values and expenses to estimate either your actual account balance at the end of the period or the expenses you paid during this period.
Compare with other funds
Since all mutual funds are required to include the same hypothetical calculations about expenses in shareholder reports, you can use this information to compare the ongoing cost of investing in the fund with other funds. To do so, compare the 5% hypothetical example with the 5% hypothetical examples that appear in the shareholder reports of other funds. As you compare hypothetical examples of other funds, it is important to note that hypothetical examples are meant to highlight the ongoing costs of investing in a fund and do not reflect any transaction costs, such as sales charges, redemption fees or exchange fees.
Estimating your actual expenses
To estimate the expenses that you paid over the period, first you will need your account balance at the end of the period:
g For shareholders who receive their account statements from Columbia Management Investment Services Corp., your account balance is available online at www.columbiamanagement.com or by calling Shareholder Services at 800.345.6611.
g For shareholders who receive their account statements from their financial intermediary, contact your financial intermediary to obtain your account balance.
1. Divide your ending account balance by $1,000. For example, if an account balance was $8,600 at the end of the period, the result would be 8.6.
2. In the section of the table below titled "Expenses paid during the period," locate the amount for your share class. You will find this number in the column labeled "Actual." Multiply this number by the result from step 1. Your answer is an estimate of the expenses you paid on your account during the period.
If the value of your account falls below the minimum initial investment requirement applicable to you, your account may be subject to a $20 annual fee. This fee is not included in the accompanying table. If you are subject to the fee, keep it in mind when you are estimating the ongoing expenses of investing in the fund and when comparing the expenses of this fund with other funds.
09/01/10 – 02/28/11
| | | Account value at the
beginning of the period ($) | | Account value at the
end of the period ($) | | Expenses paid
during the period ($) | | Fund's annualized
expense ratio (%) | |
| | | Actual | | Hypothetical | | Actual | | Hypothetical | | Actual | | Hypothetical | | Actual | |
| Class A | | | 1,000.00 | | | | 1,000.00 | | | | 1,284.30 | | | | 1,016.86 | | | | 9.06 | | | | 8.00 | | | | 1.60 | | |
| Class C | | | 1,000.00 | | | | 1,000.00 | | | | 1,279.90 | | | | 1,013.14 | | | | 13.28 | | | | 11.73 | | | | 2.35 | | |
| Class R | | | 1,000.00 | | | | 1,000.00 | | | | 1,283.00 | | | | 1,015.62 | | | | 10.47 | | | | 9.25 | | | | 1.85 | | |
| Class Z | | | 1,000.00 | | | | 1,000.00 | | | | 1,286.80 | | | | 1,018.10 | | | | 7.65 | | | | 6.76 | | | | 1.35 | | |
Expenses paid during the period are equal to the annualized expense ratio for the share class, multiplied by the average account value over the period, then multiplied by the number of days in the fund's most recent fiscal half-year and divided by 365.
Had the Investment Manager and/or any of its affiliates not waived fees or reimbursed a portion of expenses, account value at the end of the period would have been reduced.
It is important to note that the expense amounts shown in the table are meant to highlight only ongoing costs of investing in the fund and do not reflect any transaction costs, such as sales charges, redemption fees or exchange fees. Therefore, the hypothetical examples provided may not help you determine the relative total costs of owning shares of different funds. If these transaction costs were included, your costs would have been higher.
5
Portfolio Managers' Report – Columbia Marsico Global Fund
Performance data quoted represents past performance and current performance may be lower or higher. Past performance is no guarantee of future results. The investment return and principal value will fluctuate so that shares, when redeemed, may be worth more or less than the original cost. Please visit www.columbiamanagement.com for daily and most recent month-end performance updates.
Net asset value per share
as of 02/28/11 ($)
| Class A | | | 10.16 | | |
| Class C | | | 10.04 | | |
| Class R | | | 10.13 | | |
| Class Z | | | 10.20 | | |
Distributions declared per share
03/01/10 – 02/28/11 ($)
| Class A | | | 0.06 | | |
| Class C | | | 0.01 | | |
| Class R | | | 0.04 | | |
| Class Z | | | 0.08 | | |
For the 12-month period that ended February 28, 2011, the fund's Class A shares returned 30.23% without sales charge. The fund's return was notably higher than the 21.54% return of its benchmark, the MSCI All Country World Index (Net), as well as the 21.31% average return of its peer group, the Lipper Global Large-Cap Growth Funds Classification. Stock selection within consumer discretionary plus a meaningful emphasis on the sector benefited returns. Stock selection within health care detracted from performance as did the impact of currency fluctuations during the period.
Consumer discretionary, stock selection were positive
The fund had significantly more exposure than the index to the consumer discretionary sector, which was a strong performer during the period. This emphasis had a positive impact on performance, which was augmented by positive stock selection in the sector. Apparel and retailing positions performed well, including Swiss luxury goods provider Compagnie Financiere Richemont (4.1% of net assets), Canada-based athletic apparel company Lululemon Athletica (0.7% of net assets), Spanish fashion clothing manufacturer Inditex (4.1% of net assets) and Internet retailer Amazon.com (2.6% of net assets). Casino operator Wynn Macau and restaurant operator Chipotle Mexican Grill (2.8% and 0.4% of net assets, respectively) also generated solid results. Within the technology sector, China-based stocks Youku.com, an Internet video company and Baidu, China's leading Internet search firm, recorded sizable gains before being sold from the portfolio. Apple, maker of the iPad and iPod, and restaurant reservations software company OpenTable (2.8% and 1.0% of net assets, respectively), were also leading technology sector performers.
Stock selection in the financials and industrials sectors also aided performance. Swiss bank Julius Baer Group (3.0% of net assets) had solid gains. Several financials holdings tied to emerging markets also performed well, notably BR Malls Participacoes (2.8% of net assets), a Brazilian shopping mall management company. Chinese insurer Ping An Insurance had strong price gains before being sold from the fund. In industrials, standout performers included Netherlands-based global industrial technology company Sensata Technologies and global transportation firm Kuehne & Nagel International (2.7% and 1.9% of net assets, respectively).
Individual stocks, currency restrain results
Stock selection in the financials sector was generally strong, however, several individual holdings posted negative returns for the period. Spain-based bank Banco Bilbao Vizcaya Argentaria struggled due to funding cost pressures and was sold. London-headquartered HSBC Holdings and Illinois-based First Midwest Bancorp both posted double-digit declines and were sold.
Stock selection in the health care sector detracted from the fund's strong returns. Shares of Intuitive Surgical (3.7% of net assets) lost ground during the period. The firm, which makes a robotic system for assisting in minimally invasive surgeries, experienced slower growth in the number of surgical procedures using its systems. We maintained the fund's position in the company because we believe there are compelling market opportunities for increased use of its da Vinci Surgical System in hysterectomy, prostate and cardiac surgical procedures.
6
Portfolio Managers' Report (continued) – Columbia Marsico Global Fund
Currency management is not a central facet of the fund's investment process, but fluctuations in major world currencies can affect performance and did so as currency movements turned turbulent during the period. The fund was hurt by having little exposure to securities of companies traded in the Australian dollar, which strengthened during this time frame. This was partially offset by the fund's overweight in securities denominated in the Swiss franc, which was another strong-performer during the period.
Fund positioning
During the period, we increased the fund's exposure to consumer discretionary and industrials companies, while decreasing holdings in health care and consumer staples. At the end of the period, the fund remained overweight relative to the benchmark in the consumer discretionary, financials and information technology sectors. It had little or no exposure to the utilities and telecommunications services sectors. The fund's most significant country allocations were to the United States, Switzerland and Brazil.
Source for all statistical data—Columbia Management Investment Advisers, LLC.
Source for all stock-specific commentary—Marsico Capital Management, LLC.
Portfolio characteristics and holdings are subject to change periodically and may not be representative of current characteristics and holdings. The outlook for the fund may differ from those presented for other Columbia Funds.
Equity securities are affected by stock market fluctuations that occur in response to economic and business developments.
International investing may involve certain risks, including currency fluctuations, risks associated with possible differences in financial accounting standards and other monetary and political risks. Significant levels of foreign taxes, including potentially confiscatory levels of taxation and withholding taxes, may also apply to some foreign investments.
Investing in emerging markets may involve greater risks than investing in more developed countries. In addition, concentration of investments in a single region may result in greater volatility.
Top 5 sectors
as of 02/28/11 (%)
| Consumer Discretionary | | | 30.8 | | |
| Financials | | | 23.7 | | |
| Information Technology | | | 14.5 | | |
| Industrials | | | 8.1 | | |
| Materials | | | 7.0 | | |
Top 10 holdings
as of 02/28/11 (%)
| Wells Fargo | | | 4.8 | | |
Compagnie Financiere
Richemont | | | 4.1 | | |
| PNC Financial Services Group | | | 4.1 | | |
| Inditex | | | 4.1 | | |
OGX Petroleo e Gas
Participacoes | | | 3.9 | | |
| Li & Fung | | | 3.9 | | |
| Intuitive Surgical | | | 3.7 | | |
| Walt Disney | | | 3.2 | | |
| Barclays PLC | | | 3.1 | | |
| Julius Baer Group | | | 3.0 | | |
The fund is actively managed and the composition of its portfolio will change over time. Information provided is calculated as a percentage of net assets.
7
Investment Portfolio – Columbia Marsico Global Fund
February 28, 2011
| Common Stocks – 95.9% | |
| | | Shares | | Value ($) | |
| Consumer Discretionary – 30.8% | |
| Automobiles – 5.0% | |
| Bayerische Motoren Werke AG | | | 2,159 | | | | 175,124 | | |
| General Motors Co. (a) | | | 7,137 | | | | 239,304 | | |
| Automobiles Total | | | 414,428 | | |
| Distributors – 3.9% | |
| Li & Fung Ltd. | | | 52,000 | | | | 316,378 | | |
| Distributors Total | | | 316,378 | | |
| Diversified Consumer Services – 0.9% | |
Anhanguera Educacional
Participacoes SA | | | 3,500 | | | | 78,255 | | |
| Diversified Consumer Services Total | | | 78,255 | | |
| Hotels, Restaurants & Leisure – 5.2% | |
| Chipotle Mexican Grill, Inc. (a) | | | 124 | | | | 30,380 | | |
Starwood Hotels & Resorts
Worldwide, Inc. | | | 2,695 | | | | 164,664 | | |
| Wynn Macau Ltd. | | | 84,527 | | | | 228,426 | | |
| Hotels, Restaurants & Leisure Total | | | 423,470 | | |
| Internet & Catalog Retail – 2.8% | |
| Amazon.com, Inc. (a) | | | 1,233 | | | | 213,666 | | |
| MakeMyTrip Ltd. (a) | | | 595 | | | | 15,738 | | |
| Internet & Catalog Retail Total | | | 229,404 | | |
| Media – 3.2% | |
| Walt Disney Co. | | | 5,993 | | | | 262,134 | | |
| Media Total | | | 262,134 | | |
| Specialty Retail – 5.0% | |
| Inditex SA | | | 4,589 | | | | 332,207 | | |
| Rue21, Inc. (a) | | | 2,139 | | | | 74,908 | | |
| Specialty Retail Total | | | 407,115 | | |
| Textiles, Apparel & Luxury Goods – 4.8% | |
| Compagnie Financiere Richemont SA | | | 5,915 | | | | 338,373 | | |
| Lululemon Athletica, Inc. (a) | | | 709 | | | | 55,011 | | |
| Textiles, Apparel & Luxury Goods Total | | | 393,384 | | |
| Consumer Discretionary Total | | | 2,524,568 | | |
| Consumer Staples – 2.7% | |
| Beverages – 0.9% | |
| Anheuser-Busch InBev NV | | | 1,303 | | | | 72,669 | | |
| Beverages Total | | | 72,669 | | |
| | | Shares | | Value ($) | |
| Food Products – 1.8% | |
| Nestle SA, Registered Shares | | | 2,650 | | | | 150,027 | | |
| Food Products Total | | | 150,027 | | |
| Consumer Staples Total | | | 222,696 | | |
| Energy – 5.4% | |
| Oil, Gas & Consumable Fuels – 5.4% | |
| Amyris, Inc. (a) | | | 1,115 | | | | 36,226 | | |
OGX Petroleo e Gas
Participacoes SA (a) | | | 27,500 | | | | 321,478 | | |
| Ultra Petroleum Corp. (a) | | | 1,773 | | | | 80,406 | | |
| Oil, Gas & Consumable Fuels Total | | | 438,110 | | |
| Energy Total | | | 438,110 | | |
| Financials – 23.7% | |
| Capital Markets – 5.0% | |
| Julius Baer Group Ltd. | | | 5,564 | | | | 249,425 | | |
| State Street Corp. | | | 3,623 | | | | 162,020 | | |
| Capital Markets Total | | | 411,445 | | |
| Commercial Banks – 12.6% | |
| Barclays PLC | | | 49,402 | | | | 256,873 | | |
| ICICI Bank Ltd., ADR | | | 1,140 | | | | 49,430 | | |
| PNC Financial Services Group, Inc. | | | 5,401 | | | | 333,242 | | |
| Wells Fargo & Co. | | | 12,148 | | | | 391,894 | | |
| Commercial Banks Total | | | 1,031,439 | | |
| Diversified Financial Services – 1.5% | |
| Citigroup, Inc. (a) | | | 25,841 | | | | 120,936 | | |
| Diversified Financial Services Total | | | 120,936 | | |
| Real Estate Management & Development – 4.6% | |
| BR Malls Participacoes SA | | | 24,200 | | | | 230,539 | | |
| BR Properties SA | | | 6,200 | | | | 65,957 | | |
| Hang Lung Properties Ltd. | | | 20,000 | | | | 85,682 | | |
| Real Estate Management & Development Total | | | 382,178 | | |
| Financials Total | | | 1,945,998 | | |
| Health Care – 3.7% | |
| Health Care Equipment & Supplies – 3.7% | |
| Intuitive Surgical, Inc. (a) | | | 927 | | | | 304,010 | | |
| Health Care Equipment & Supplies Total | | | 304,010 | | |
| Health Care Total | | | 304,010 | | |
See Accompanying Notes to Financial Statements.
8
Columbia Marsico Global Fund
February 28, 2011
| Common Stocks (continued) | |
| | | Shares | | Value ($) | |
| Industrials – 8.1% | |
| Aerospace & Defense – 2.6% | |
| Precision Castparts Corp. | | | 1,480 | | | | 209,790 | | |
| Aerospace & Defense Total | | | 209,790 | | |
| Electrical Equipment – 2.7% | |
| Sensata Technologies Holding NV (a) | | | 6,795 | | | | 224,914 | | |
| Electrical Equipment Total | | | 224,914 | | |
| Marine – 1.9% | |
| Kuehne & Nagel International AG | | | 1,132 | | | | 152,176 | | |
| Marine Total | | | 152,176 | | |
| Transportation Infrastructure – 0.9% | |
| LLX Logistica SA (a) | | | 28,600 | | | | 78,041 | | |
| Transportation Infrastructure Total | | | 78,041 | | |
| Industrials Total | | | 664,921 | | |
| Information Technology – 14.5% | |
| Communications Equipment – 0.9% | |
| Acme Packet, Inc. (a) | | | 914 | | | | 68,769 | | |
| Communications Equipment Total | | | 68,769 | | |
| Computers & Peripherals – 2.8% | |
| Apple, Inc. (a) | | | 652 | | | | 230,293 | | |
| Computers & Peripherals Total | | | 230,293 | | |
| Internet Software & Services – 3.2% | |
| MercadoLibre, Inc. (a) | | | 2,453 | | | | 161,358 | | |
| OpenTable, Inc. (a) | | | 894 | | | | 79,450 | | |
| Velti PLC (a) | | | 1,619 | | | | 21,921 | | |
| Internet Software & Services Total | | | 262,729 | | |
| Software – 7.6% | |
| ANSYS, Inc. (a) | | | 2,188 | | | | 123,228 | | |
| AutoNavi Holdings Ltd., ADR (a) | | | 1,000 | | | | 15,900 | | |
| Informatica Corp. (a) | | | 2,873 | | | | 135,060 | | |
| Nuance Communications, Inc. (a) | | | 5,013 | | | | 93,543 | | |
| Oracle Corp. | | | 4,319 | | | | 142,095 | | |
| Salesforce.com, Inc. (a) | | | 875 | | | | 115,736 | | |
| Software Total | | | 625,562 | | |
| Information Technology Total | | | 1,187,353 | | |
| Materials – 7.0% | |
| Chemicals – 5.1% | |
| Monsanto Co. | | | 3,000 | | | | 215,670 | | |
| Novozymes A/S, Class B | | | 1,427 | | | | 199,537 | | |
| Chemicals Total | | | 415,207 | | |
| | | Shares | | Value ($) | |
| Metals & Mining – 1.9% | |
| BHP Billiton PLC | | | 3,949 | | | | 156,223 | | |
| Metals & Mining Total | | | 156,223 | | |
| Materials Total | | | 571,430 | | |
Total Common Stocks
(cost of $6,262,791) | | | 7,859,086 | | |
| Short-Term Obligation – 8.0% | |
| | | Par ($) | | | |
Repurchase agreement with State
Street Bank and Trust Co.,
dated 02/28/11, due 03/01/11
at 0.060%, collateralized by
a U.S. Treasury obligation
maturing 08/15/39, market
value $675,844 (repurchase
proceeds $660,001) | | | 660,000 | | | | 660,000 | | |
Total Short-Term Obligation
(cost of $660,000) | | | 660,000 | | |
Total Investments – 103.9%
(cost of $6,922,791) (b) | | | 8,519,086 | | |
| Other Assets & Liabilities, Net – (3.9)% | | | (323,584 | ) | |
| Net Assets – 100.0% | | | 8,195,502 | | |
Notes to Investment Portfolio:
(a) Non-income producing security.
(b) Cost for federal income tax purposes is $7,029,406.
Generally accepted accounting principles (GAAP) require disclosure regarding the inputs and valuation techniques used to measure fair value and any changes in valuation inputs or techniques. In addition, investments shall be disclosed by major category.
The Fund categorizes its fair value measurements according to a three-level hierarchy that maximizes the use of observable inputs and minimizes the use of unobservable inputs by prioritizing that the most observable input be used when available. Observable inputs are those that market participants would use in pricing an investment based on market data obtained from sources independent of the reporting entity. Unobservable inputs are those that reflect the Fund's assumptions about the information market participants would use in pricing an investment. An investment's level within the fair value hierarchy is based on the lowest level of any input that is deemed significant to the asset or liability's fair value measurement. The input levels are not necessarily an indication of the risk or liquidity associated with investments at that level. For example, certain U.S. government securities are generally high quality and liquid, however, they are reflected as Level 2 because the inputs used to determine fair value may not always be quoted prices in an active market.
Fair value inputs are summarized in the three broad levels listed below:
• Level 1—Valuations based on quoted prices for investments in active markets that the Fund has the ability to access at the measurement date (including NAV for open-end mutual funds). Valuation adjustments are not applied to Level 1 investments.
• Level 2—Valuations based on other significant observable inputs (including quoted prices for similar securities, interest rates, prepayment speeds, credit risks, etc.).
See Accompanying Notes to Financial Statements.
9
Columbia Marsico Global Fund
February 28, 2011
• Level 3—Valuations based on significant unobservable inputs (including the Fund's own assumptions and judgment in determining the fair value of investments).
Inputs that are used in determining fair value of an investment may include price information, credit data, volatility statistics, and other factors. These inputs can be either observable or unobservable. The availability of observable inputs can vary between investments, and is affected by various factors such as the type of investment, and the volume and level of activity for that investment or similar investments in the marketplace. The inputs will be considered by the Investment Manager, along with any other relevant factors in the calculation of an investment's fair value. The Fund uses prices and inputs that are current as of the measurement date, which may include periods of market dislocations. During these periods, the availability of prices and inputs may be reduced for many investments. This condition could cause an investment to be reclassified between the various levels within the hierarchy. Non-U.S. equity securities actively traded in foreign markets may be reflected in Level 2 despite the availability of closing prices, because the Fund evaluates and determines whether those closing prices reflect fair value at the close of the New York Stock Exchange (NYSE) or require adjustment, as described in Note 2 to the financial statements—Security Valuation.
Investments falling into the Level 3 category are primarily supported by quoted prices from brokers and dealers participating in the market for those investments. However, these may be classified as Level 3 investments due to lack of market transparency and corroboration to support these quoted prices. Additionally, valuation models may be used as the pricing source for any remaining investments classified as Level 3. These models rely on one or more significant unobservable inputs and/or significant assumptions by the Investment Manager. Inputs used in valuations may include, but are not limited to, financial statement analysis, capital account balances, discount rates and estimated cash flows, and comparable company data.
The following table is a summary of the inputs used to value the Fund's investments as of February 28, 2011:
| Description | | Quoted
Prices
(Level 1) | | Other
Significant
Observable
Inputs
(Level 2) | | Significant
Unobservable
Inputs
(Level 3) | | Total | |
| Common Stocks | |
Consumer
Discretionary | | $ | 1,134,060 | | | $ | 1,390,508 | | | $ | — | | | $ | 2,524,568 | | |
| Consumer Staples | | | — | | | | 222,696 | | | | — | | | | 222,696 | | |
| Energy | | | 438,110 | | | | — | | | | — | | | | 438,110 | | |
| Financials | | | 1,354,018 | | | | 591,980 | | | | — | | | | 1,945,998 | | |
| Health Care | | | 304,010 | | | | — | | | | — | | | | 304,010 | | |
| Industrials | | | 512,745 | | | | 152,176 | | | | — | | | | 664,921 | | |
| Information Technology | | | 1,187,353 | | | | — | | | | — | | | | 1,187,353 | | |
| Materials | | | 215,670 | | | | 355,760 | | | | — | | | | 571,430 | | |
| Total Common Stocks | | | 5,145,966 | | | | 2,713,120 | | | | — | | | | 7,859,086 | | |
Total Short-Term
Obligation | | | — | | | | 660,000 | | | | — | | | | 660,000 | | |
| Total Investments | | $ | 5,145,966 | | | $ | 3,373,120 | | | $ | — | | | $ | 8,519,086 | | |
The Fund's assets assigned to the Level 2 input category are generally valued using the market approach, in which a security's value is determined through reference to prices and information from market transactions for similar or identical assets. These assets include certain foreign securities for which a third party statistical pricing service may be employed for purposes of fair valuation. The models utilized by the third party statistical pricing service take into account a security's correlation to available market data including, but not limited to, intraday index, ADR, and ETF movements.
Certain short-term obligations may be valued using amortized cost, an income approach which converts future cash flows to a present value based upon the premium or discount at purchase.
There were no significant transfers of financial assets between Level 1 and 2 during the period.
The Fund was invested in the following countries at February 28, 2011:
Summary of Securities
By Country (Unaudited) | | Value | | % of Total
Investments | |
| United States* | | $ | 4,639,126 | | | | 54.5 | | |
| Switzerland | | | 890,001 | | | | 10.4 | | |
| Brazil | | | 774,269 | | | | 9.1 | | |
| United Kingdom | | | 435,017 | | | | 5.1 | | |
| Spain | | | 332,208 | | | | 3.9 | | |
| Bermuda | | | 316,378 | | | | 3.7 | | |
| Cayman Islands | | | 244,326 | | | | 2.9 | | |
| Netherlands | | | 224,914 | | | | 2.6 | | |
| Denmark | | | 199,537 | | | | 2.3 | | |
| Germany | | | 175,124 | | | | 2.1 | | |
| Hong Kong | | | 85,682 | | | | 1.0 | | |
| Canada | | | 80,405 | | | | 0.9 | | |
| Belgium | | | 72,669 | | | | 0.9 | | |
| India | | | 49,430 | | | | 0.6 | | |
| | | $ | 8,519,086 | | | | 100.0 | | |
* Includes short-term obligation.
Certain securities are listed by country of underlying exposure but may trade predominantly on another exchange.
| Acronym | | Name | |
| ADR | | American Depositary Receipt | |
See Accompanying Notes to Financial Statements.
10
Statement of Assets and Liabilities – Columbia Marsico Global Fund
February 28, 2011
| | | | | ($) | |
| Assets | | Investments, at identified cost | | | 6,922,791 | | |
| | | Investments, at value | | | 8,519,086 | | |
| | | Cash | | | 712 | | |
| | | Foreign currency (cost of $436) | | | 436 | | |
| | | Receivable for: | | | |
| | | Fund shares sold | | | 9,996 | | |
| | | Dividends | | | 2,580 | | |
| | | Interest | | | 1 | | |
| | | Foreign tax reclaims | | | 4,977 | | |
| | | Expense reimbursement due from Investment Manager | | | 21,950 | | |
| | | Prepaid expenses | | | 21 | | |
| | | Total Assets | | | 8,559,759 | | |
| Liabilities | | Payable for: | | | |
| | | Investments purchased | | | 201,510 | | |
| | | Fund shares repurchased | | | 5,364 | | |
| | | Investment advisory fee | | | 4,948 | | |
| | | Pricing and bookkeeping fees | | | 6,369 | | |
| | | Transfer agent fee | | | 273 | | |
| | | Trustees' fees | | | 18,603 | | |
| | | Audit fee | | | 38,850 | | |
| | | Legal fee | | | 30,047 | | |
| | | Custody fee | | | 6,059 | | |
| | | Distribution and service fees | | | 2,669 | | |
| | | Chief compliance officer expenses | | | 130 | | |
| | | Reports to shareholders | | | 39,553 | | |
| | | Other liabilities | | | 9,882 | | |
| | | Total Liabilities | | | 364,257 | | |
| | | Net Assets | | | 8,195,502 | | |
| Net Assets Consist of | | Paid-in capital | | | 7,731,802 | | |
| | | Overdistributed net investment income | | | (74,637 | ) | |
| | | Accumulated net realized loss | | | (1,058,598 | ) | |
| | | Net unrealized appreciation (depreciation) on: | | | |
| | | Investments | | | 1,596,295 | | |
| | | Foreign currency translations | | | 640 | | |
| | | Net Assets | | | 8,195,502 | | |
See Accompanying Notes to Financial Statements.
11
Statement of Assets and Liabilities (continued) – Columbia Marsico Global Fund
February 28, 2011
| Class A | | Net assets | | $ | 3,342,972 | | |
| | | Shares outstanding | | | 328,891 | | |
| | | Net asset value per share | | $ | 10.16 | (a) | |
| | | Maximum sales charge | | | 5.75 | % | |
| | | Maximum offering price per share ($10.16/0.9425) | | $ | 10.78 | (b) | |
| Class C | | Net assets | | $ | 2,051,143 | | |
| | | Shares outstanding | | | 204,240 | | |
| | | Net asset value and offering price per share | | $ | 10.04 | (a) | |
| Class R | | Net assets | | $ | 1,244,595 | | |
| | | Shares outstanding | | | 122,891 | | |
| | | Net asset value, offering and redemption price per share | | $ | 10.13 | | |
| Class Z | | Net assets | | $ | 1,556,792 | | |
| | | Shares outstanding | | | 152,626 | | |
| | | Net asset value, offering and redemption price per share | | $ | 10.20 | | |
(a) Redemption price per share is equal to net asset value less any applicable contingent deferred sales charge.
(b) On sales of $50,000 or more the offering price is reduced.
See Accompanying Notes to Financial Statements.
12
Statement of Operations – Columbia Marsico Global Fund
For the Year Ended February 28, 2011
| | | | | ($) | |
| Investment Income | | Dividends | | | 68,343 | | |
| | | Interest | | | 226 | | |
| | | Foreign taxes withheld | | | (3,757 | ) | |
| | | Total Investment Income | | | 64,812 | | |
| Expenses | | Investment advisory fee | | | 51,004 | | |
| | | Distribution fee: | | | |
| | | Class C | | | 12,509 | | |
| | | Class R | | | 5,449 | | |
| | | Service fee: | | | |
| | | Class C | | | 4,170 | | |
| | | Distribution and service fee—Class A | | | 5,788 | | |
| | | Transfer agent fee | | | 3,498 | | |
| | | Pricing and bookkeeping fees | | | 50,506 | | |
| | | Trustees' fees | | | 26,733 | | |
| | | Custody fee | | | 19,659 | | |
| | | Registration fees | | | 55,500 | | |
| | | Audit fee | | | 47,893 | | |
| | | Legal fees | | | 35,000 | | |
| | | Reports to shareholders | | | 32,750 | | |
| | | Chief compliance officer expenses | | | 883 | | |
| | | Other expenses | | | 4,252 | | |
| | | Total Expenses | | | 355,594 | | |
| | | Fees waived or expenses reimbursed by Investment Manager | | | (241,606 | ) | |
| | | Expense reductions | | | (5 | ) | |
| | | Net Expenses | | | 113,983 | | |
| | | Net Investment Loss | | | (49,171 | ) | |
| Net Realized and Unrealized Gain (Loss) on Investments and Foreign Currency | |
| | | Net realized gain (loss) on: | | | |
| | | Investments | | | 988,871 | | |
| | | Foreign currency transactions | | | (11,595 | ) | |
| | | Net realized gain | | | 977,276 | | |
| | | Net change in unrealized appreciation (depreciation) on: | | | |
| | | Investments | | | 751,753 | | |
| | | Foreign currency translations | | | 487 | | |
| | | Net change in unrealized appreciation (depreciation) | | | 752,240 | | |
| | | Net Gain | | | 1,729,516 | | |
| | | Net Increase Resulting from Operations | | | 1,680,345 | | |
See Accompanying Notes to Financial Statements.
13
Statement of Changes in Net Assets – Columbia Marsico Global Fund
| | | | | Year Ended February 28, | |
| Increase (Decrease) in Net Assets | | | | 2011 ($) | | 2010 ($) | |
| Operations | | Net investment loss | | | (49,171 | ) | | | (27,053 | ) | |
| | | Net realized gain on investments and foreign currency transactions | | | 977,276 | | | | 112,045 | | |
| | | Net change in unrealized appreciation (depreciation)
on investments and foreign currency translations | | | 752,240 | | | | 1,805,713 | | |
| | | Net increase resulting from operations | | | 1,680,345 | | | | 1,890,705 | | |
| Distributions to Shareholders | | From net investment income: | | | | | | | | | |
| | | Class A | | | (17,012 | ) | | | (7,179 | ) | |
| | | Class C | | | (1,385 | ) | | | — | | |
| | | Class R | | | (5,206 | ) | | | (1,931 | ) | |
| | | Class Z | | | (11,746 | ) | | | (6,194 | ) | |
| | | Total distributions to shareholders | | | (35,349 | ) | | | (15,304 | ) | |
| | | Net Capital Stock Transactions | | | 1,014,017 | | | | 334,429 | | |
| | | Redemption fees | | | — | | | | 10 | | |
| | | Total increase in net assets | | | 2,659,013 | | | | 2,209,840 | | |
| Net Assets | | Beginning of period | | | 5,536,489 | | | | 3,326,649 | | |
| | | End of period | | | 8,195,502 | | | | 5,536,489 | | |
| | | Overdistributed net investment income at end of period | | | (74,637 | ) | | | (26,339 | ) | |
See Accompanying Notes to Financial Statements.
14
Statement of Changes in Net Assets (continued) – Columbia Marsico Global Fund
| | | Capital Stock Activity | |
| | | Year Ended
February 28, 2011 | | Year Ended
February 28, 2010 | |
| | | Shares | | Dollars ($) | | Shares | | Dollars ($) | |
| Class A | |
| Subscriptions | | | 250,144 | | | | 2,329,236 | | | | 60,337 | | | | 431,019 | | |
| Distributions reinvested | | | 545 | | | | 5,311 | | | | 893 | | | | 6,994 | | |
| Redemptions | | | (175,146 | ) | | | (1,567,235 | ) | | | (31,342 | ) | | | (199,132 | ) | |
| Net increase | | | 75,543 | | | | 767,312 | | | | 29,888 | | | | 238,881 | | |
| Class C | |
| Subscriptions | | | 154,538 | | | | 1,403,639 | | | | 33,090 | | | | 250,189 | | |
| Distributions reinvested | | | 37 | | | | 361 | | | | — | | | | — | | |
| Redemptions | | | (133,690 | ) | | | (1,210,582 | ) | | | (28,904 | ) | | | (177,715 | ) | |
| Net increase | | | 20,885 | | | | 193,418 | | | | 4,186 | | | | 72,474 | | |
| Class R | |
| Subscriptions | | | 122,480 | | | | 1,123,354 | | | | 375 | | | | 2,449 | | |
| Distributions reinvested | | | 3 | | | | 28 | | | | 247 | | | | 1,931 | | |
| Redemptions | | | (125,246 | ) | | | (1,148,510 | ) | | | — | | | | — | | |
| Net increase (decrease) | | | (2,763 | ) | | | (25,128 | ) | | | 622 | | | | 4,380 | | |
| Class Z | |
| Subscriptions | | | 134,998 | | | | 1,249,198 | | | | 1,980 | | | | 13,500 | | |
| Distributions reinvested | | | 149 | | | | 1,454 | | | | 789 | | | | 6,194 | | |
| Redemptions | | | (126,780 | ) | | | (1,172,237 | ) | | | (157 | ) | | | (1,000 | ) | |
| Net increase | | | 8,367 | | | | 78,415 | | | | 2,612 | | | | 18,694 | | |
See Accompanying Notes to Financial Statements.
15
Financial Highlights – Columbia Marsico Global Fund
Selected data for a share outstanding throughout each period is as follows:
| | | Year Ended February 28, | | Period Ended
February 28, | |
| Class A Shares | | 2011 | | 2010 | | 2009 (a) | |
| Net Asset Value, Beginning of Period | | $ | 7.85 | | | $ | 4.98 | | | $ | 10.00 | | |
| Income from Investment Operations: | |
| Net investment income (loss) (b) | | | (0.05 | ) | | | (0.03 | ) | | | 0.01 | | |
| Net realized and unrealized gain (loss) on investments and foreign currency | | | 2.42 | | | | 2.93 | | | | (5.03 | ) | |
| Total from investment operations | | | 2.37 | | | | 2.90 | | | | (5.02 | ) | |
| Less Distributions to Shareholders: | |
| From net investment income | | | (0.06 | ) | | | (0.03 | ) | | | — | | |
| Redemption Fees: | |
| Redemption fees added to paid-in-capital | | | — | | | | — | (c) | | | — | (c) | |
| Net Asset Value, End of Period | | $ | 10.16 | | | $ | 7.85 | | | $ | 4.98 | | |
| Total return (d)(e) | | | 30.23 | % | | | 58.22 | % | | | (50.20 | )%(f) | |
| Ratios to Average Net Assets/Supplemental Data: | |
| Net expenses | | | 1.60 | %(g) | | | 1.60 | %(g) | | | 1.60 | %(h)(i) | |
| Waiver/Reimbursement | | | 3.78 | % | | | 3.84 | % | | | 7.19 | %(h) | |
| Net investment income (loss) | | | (0.59 | )%(g) | | | (0.42 | )%(g) | | | 0.09 | %(h)(i) | |
| Portfolio turnover rate | | | 104 | % | | | 137 | % | | | 168 | %(f) | |
| Net assets, end of period (000s) | | $ | 3,343 | | | $ | 1,990 | | | $ | 1,113 | | |
(a) Class A shares commenced operations on April 30, 2008. Per share data and total return reflect activity from that date.
(b) Per share data was calculated using the average shares outstanding during the period.
(c) Rounds to less than $0.01 per share.
(d) Total return at net asset value assuming all distributions reinvested and no initial sales charge or contingent deferred sales charge.
(e) Had the Investment Manager and/or any of its affiliates not waived fees or reimbursed a portion of expenses, total return would have been reduced.
(f) Not annualized.
(g) The benefits derived from expense reductions had an impact of less than 0.01%.
(h) Annualized.
(i) The benefits derived from expense reductions had an impact of 0.01%.
See Accompanying Notes to Financial Statements.
16
Financial Highlights – Columbia Marsico Global Fund
Selected data for a share outstanding throughout each period is as follows:
| | | Year Ended February 28, | | Period Ended
February 28, | |
| Class C Shares | | 2011 | | 2010 | | 2009 (a) | |
| Net Asset Value, Beginning of Period | | $ | 7.78 | | | $ | 4.95 | | | $ | 10.00 | | |
| Income from Investment Operations: | |
| Net investment loss (b) | | | (0.12 | ) | | | (0.08 | ) | | | (0.04 | ) | |
| Net realized and unrealized gain (loss) on investments and foreign currency | | | 2.39 | | | | 2.91 | | | | (5.01 | ) | |
| Total from investment operations | | | 2.27 | | | | 2.83 | | | | (5.05 | ) | |
| Less Distributions to Shareholders: | |
| From net investment income | | | (0.01 | ) | | | — | | | | — | | |
| Redemption Fees: | |
| Redemption fees added to paid-in-capital | | | — | | | | — | (c) | | | — | (c) | |
| Net Asset Value, End of Period | | $ | 10.04 | | | $ | 7.78 | | | $ | 4.95 | | |
| Total return (d)(e) | | | 29.14 | % | | | 57.17 | % | | | (50.50 | )%(f) | |
| Ratios to Average Net Assets/Supplemental Data: | |
| Net expenses | | | 2.35 | %(g) | | | 2.35 | %(g) | | | 2.35 | %(h)(i) | |
| Waiver/Reimbursement | | | 3.78 | % | | | 3.84 | % | | | 7.19 | %(h) | |
| Net investment loss | | | (1.33 | )%(g) | | | (1.15 | )%(g) | | | (0.63 | )%(h)(i) | |
| Portfolio turnover rate | | | 104 | % | | | 137 | % | | | 168 | %(f) | |
| Net assets, end of period (000s) | | $ | 2,051 | | | $ | 1,426 | | | $ | 886 | | |
(a) Class C shares commenced operations on April 30, 2008. Per share data and total return reflect activity from that date.
(b) Per share data was calculated using the average shares outstanding during the period.
(c) Rounds to less than $0.01 per share.
(d) Total return at net asset value assuming all distributions reinvested and no contingent deferred sales charge.
(e) Had the Investment Manager and/or any of its affiliates not waived fees or reimbursed a portion of expenses, total return would have been reduced.
(f) Not annualized.
(g) The benefits derived from expense reductions had an impact of less than 0.01%.
(h) Annualized.
(i) The benefits derived from expense reductions had an impact of 0.01%.
See Accompanying Notes to Financial Statements.
17
Financial Highlights – Columbia Marsico Global Fund
Selected data for a share outstanding throughout each period is as follows:
| | | Year Ended February 28, | | Period Ended
February 28, | |
| Class R Shares | | 2011 | | 2010 | | 2009 (a) | |
| Net Asset Value, Beginning of Period | | $ | 7.83 | | | $ | 4.97 | | | $ | 10.00 | | |
| Income from Investment Operations: | |
| Net investment loss (b) | | | (0.07 | ) | | | (0.05 | ) | | | (0.01 | ) | |
| Net realized and unrealized gain (loss) on investments and foreign currency | | | 2.41 | | | | 2.93 | | | | (5.02 | ) | |
| Total from investment operations | | | 2.34 | | | | 2.88 | | | | (5.03 | ) | |
| Less Distributions to Shareholders: | |
| From net investment income | | | (0.04 | ) | | | (0.02 | ) | | | — | | |
| Redemption Fees: | |
| Redemption fees added to paid-in-capital | | | — | | | | — | (c) | | | — | (c) | |
| Net Asset Value, End of Period | | $ | 10.13 | | | $ | 7.83 | | | $ | 4.97 | | |
| Total return (d)(e) | | | 29.94 | % | | | 57.86 | % | | | (50.30 | )%(f) | |
| Ratios to Average Net Assets/Supplemental Data: | |
| Net expenses | | | 1.85 | %(g) | | | 1.85 | %(g) | | | 1.85 | %(h)(i) | |
| Waiver/Reimbursement | | | 3.78 | % | | | 3.84 | % | | | 7.19 | %(h) | |
| Net investment loss | | | (0.82 | )%(g) | | | (0.62 | )%(g) | | | (0.12 | )%(h)(i) | |
| Portfolio turnover rate | | | 104 | % | | | 137 | % | | | 168 | %(f) | |
| Net assets, end of period (000s) | | $ | 1,245 | | | $ | 984 | | | $ | 621 | | |
(a) Class R shares commenced operations on April 30, 2008. Per share data and total return reflect activity from that date.
(b) Per share data was calculated using the average shares outstanding during the period.
(c) Rounds to less than $0.01 per share.
(d) Total return at net asset value assuming all distributions reinvested.
(e) Had the Investment Manager and/or any of its affiliates not waived fees or reimbursed a portion of expenses, total return would have been reduced.
(f) Not annualized.
(g) The benefits derived from expense reductions had an impact of less than 0.01%.
(h) Annualized.
(i) The benefits derived from expense reductions had an impact of 0.01%.
See Accompanying Notes to Financial Statements.
18
Financial Highlights – Columbia Marsico Global Fund
Selected data for a share outstanding throughout each period is as follows:
| | | Year Ended February 28, | | Period Ended
February 28, | |
| Class Z Shares | | 2011 | | 2010 | | 2009 (a) | |
| Net Asset Value, Beginning of Period | | $ | 7.88 | | | $ | 4.99 | | | $ | 10.00 | | |
| Income from Investment Operations: | |
| Net investment income (loss) (b) | | | (0.03 | ) | | | (0.01 | ) | | | 0.02 | | |
| Net realized and unrealized gain (loss) on investments and foreign currency | | | 2.43 | | | | 2.94 | | | | (5.03 | ) | |
| Total from investment operations | | | 2.40 | | | | 2.93 | | | | (5.01 | ) | |
| Less Distributions to Shareholders: | |
| From net investment income | | | (0.08 | ) | | | (0.04 | ) | | | — | | |
| Redemption Fees: | |
| Redemption fees added to paid-in-capital | | | — | | | | — | (c) | | | — | (c) | |
| Net Asset Value, End of Period | | $ | 10.20 | | | $ | 7.88 | | | $ | 4.99 | | |
| Total return (d)(e) | | | 30.47 | % | | | 58.79 | % | | | (50.10 | )%(f) | |
| Ratios to Average Net Assets/Supplemental Data: | |
| Net expenses | | | 1.35 | %(g) | | | 1.35 | %(g) | | | 1.35 | %(h)(i) | |
| Waiver/Reimbursement | | | 3.78 | % | | | 3.84 | % | | | 7.19 | %(h) | |
| Net investment income (loss) | | | (0.33 | )%(g) | | | (0.13 | )%(g) | | | 0.35 | %(h)(i) | |
| Portfolio turnover rate | | | 104 | % | | | 137 | % | | | 168 | %(f) | |
| Net assets, end of period (000s) | | $ | 1,557 | | | $ | 1,136 | | | $ | 707 | | |
(a) Class Z shares commenced operations on April 30, 2008. Per share data and total return reflect activity from that date.
(b) Per share data was calculated using the average shares outstanding during the period.
(c) Rounds to less than $0.01 per share.
(d) Total return at net asset value assuming all distributions reinvested.
(e) Had the Investment Manager and/or any of its affiliates not waived fees or reimbursed a portion of expenses, total return would have been reduced.
(f) Not annualized.
(g) The benefits derived from expense reductions had an impact of less than 0.01%.
(h) Annualized.
(i) The benefits derived from expense reductions had an impact of 0.01%.
See Accompanying Notes to Financial Statements.
19
Notes to Financial Statements – Columbia Marsico Global Fund
February 28, 2011
Note 1. Organization
Columbia Marsico Global Fund (the Fund), a series of Columbia Funds Series Trust (the Trust), is a diversified fund. The Trust is registered under the Investment Company Act of 1940, as amended (the 1940 Act), as an open-end management investment company organized as a Delaware statutory trust.
After the close of business on April 30, 2010, Ameriprise Financial, Inc. (Ameriprise Financial) acquired a portion of the asset management business of Columbia Management Group, LLC (the Transaction), including the business of managing the Fund. In connection with the closing of the Transaction (the Closing), RiverSource Investments, LLC, a wholly owned subsidiary of Ameriprise Financial, became the investment manager of the Fund and changed its name to Columbia Management Investment Advisers, LLC (the Investment Manager).
Investment Objective
The Fund seeks long-term growth of capital.
Fund Shares
The Trust has unlimited authorized shares of beneficial interest. The Fund offers Class A, Class C, Class R and Class Z shares. All share classes have identical voting, dividend and liquidation rights. Each share class has its own expense structure and sales charges, as applicable.
Class A shares are subject to a maximum front-end sales charge of 5.75% based on the investment amount. Class A shares purchased without an initial sales charge in accounts aggregating $1 million to $50 million at the time of purchase are subject to a 1.00% contingent deferred sales charge (CDSC) if the shares are sold within 18 months of purchase, charged as follows: 1.00% CDSC if redeemed within 12 months of purchase, and 0.50% CDSC if redeemed more than 12, but less than 18 months after purchase.
Class C shares are subject to a 1.00% CDSC on shares redeemed within one year of purchase.
Class R shares are not subject to sales charges and are available only to qualifying institutional investors.
Class Z shares are not subject to sales charges and are available only to certain investors, as described in the Fund's prospectus.
Note 2. Significant Accounting Policies
The preparation of financial statements in accordance with U.S. generally accepted accounting principles (GAAP) requires the Investment Manager to make certain estimates and assumptions that affect the reported amounts of assets and liabilities, the disclosure of contingent assets and liabilities at the date of the financial statements and the reported amounts of revenue and expenses during the reporting period. Actual results could differ from those estimates.
The following is a summary of significant accounting policies consistently followed by the Fund in the preparation of its financial statements.
Security Valuation
Equity securities are valued at the last sale price on the principal exchange on which they trade, except for securities traded on the NASDAQ, which are valued at the NASDAQ official close price. Unlisted securities or listed securities for which there were no sales during the day are valued at the closing bid price on such exchanges or over-the-counter markets.
Short-term investments maturing in 60 days or less are valued at amortized cost, which approximates market value.
Foreign securities are generally valued at the last sale price on the foreign exchange or market on which they trade. If any foreign share prices are not readily available as a result of limited share activity, the securities are valued at the last sale price of the local shares in the principal market in which such securities are normally traded.
Generally, trading in foreign securities is substantially completed each day at various times prior to the close of the New York Stock Exchange (NYSE). The values of such securities used in computing the net asset value of the Fund's shares are determined as of such times. Foreign currency exchange rates are generally determined at 4:00 p.m. Eastern (U.S.) time. Occasionally, events affecting the values of such foreign securities may occur between the times at which they are determined and the close of the customary trading session of the NYSE, which would not be reflected in the computation of the Fund's net asset value. If events materially affecting the values of such foreign securities occur and it is determined that market quotations are not reliable, then these foreign securities will be valued at their fair value using procedures approved by the Board of Trustees.
20
Columbia Marsico Global Fund, February 28, 2011
The Fund may use a systematic fair valuation model provided by an independent third party to value securities principally traded in foreign markets in order to adjust for possible stale pricing that may occur between the close of the foreign exchanges and the time for valuation.
Investments for which market quotations are not readily available, or that have quotations which the Investment Manager believes are not reliable, are valued at fair value as determined in good faith under consistently applied procedures established by and under the general supervision of the Board of Trustees. If a security is valued at fair value, such value is likely to be different from the last quoted market price for the security. The determination of fair value often requires significant judgment. To determine fair value, the Investment Manager may use assumptions including but not limited to future cash flows and estimated risk premiums. Multiple inputs from various sources may be used to determine value.
Foreign Currency Transactions and Translations
The values of all assets and liabilities quoted in foreign currencies are translated into U.S. dollars at that day's exchange rates. Net realized and unrealized gains (losses) on foreign currency transactions and translations include gains (losses) arising from the fluctuation in exchange rates between trade and settlement dates on securities transactions, gains (losses) arising from the disposition of foreign currency and currency gains (losses) between the accrual and payment dates on dividends, interest income and foreign withholding taxes.
For financial statement purposes, the Fund does not distinguish that portion of gains (losses) on investments which is due to changes in foreign exchange rates from that which is due to changes in market prices of the investments. Such fluctuations are included with the net realized and unrealized gains (losses) on investments on the Statement of Operations.
Repurchase Agreements
The Fund may engage in repurchase agreement transactions with institutions that the Investment Manager has determined are creditworthy. The Fund, through the custodian, receives delivery of the underlying securities collateralizing a repurchase agreement. The Investment Manager is responsible for determining that the collateral is at least equal, at all times, to the value of the repurchase obligation including interest. A repurchase agreement transaction involves certain risks in the event of default or insolvency of the counterparty. These risks include possible delays in or restrictions on the Fund's ability to dispose of the underlying securities and a possible decline in the value of the underlying securities during the period while the Fund seeks to assert its rights.
Security Transactions
Security transactions are accounted for on the trade date. Cost is determined and gains (losses) are based upon the specific identification method for both financial statement and federal income tax purposes.
Income Recognition
Interest income is recorded on the accrual basis.
Corporate actions and dividend income are recorded net of any non-reclaimable tax withholdings, on the ex-dividend date or upon receipt of ex-dividend notification in the case of certain foreign securities.
Expenses
General expenses of the Trust are allocated to the Fund and other series of the Trust based upon relative net assets or other expense allocation methodologies determined by the nature of the expense. Expenses directly attributable to a specific class of shares are charged to that share class. Expenses directly attributable to the Fund are charged to the Fund.
Determination of Class Net Asset Value
All income, expenses (other than class-specific expenses which are charged directly to a share class, as shown in the Statement of Operations) and realized and unrealized gains (losses) are allocated to each class of the Fund on a daily basis, based on the relative net assets of each class, for purposes of determining the net asset value of each class.
Federal Income Tax Status
The Fund intends to qualify each year as a "regulated investment company" under Subchapter M of the Internal Revenue Code, as amended, and will distribute substantially all of its taxable income, if any, for its tax year, and as such will not be subject to federal income
21
Columbia Marsico Global Fund, February 28, 2011
taxes. In addition, the Fund intends to distribute in each calendar year substantially all of its net investment income, capital gains and certain other amounts, if any, such that the Fund should not be subject to federal excise tax. Therefore, no federal income or excise tax provision is recorded.
Foreign Tax
The Fund may be subject to foreign taxes on income and/or gains on investments or currency repatriation, a portion of which may be recoverable. The Fund will accrue such taxes and recoveries as applicable, based upon its current interpretation of tax rules and regulations that exist in the markets in which it invests.
Realized gains in certain countries may be subject to foreign taxes at the Fund level, at rates ranging from approximately 10% to 15%. The Fund accrues for such foreign taxes on net realized and unrealized gains at the appropriate rate for each jurisdiction.
Distributions to Shareholders
Distributions from net investment income, if any, are declared and paid semi-annually. The Fund may, however, declare and pay distributions from net investment income more frequently. The Fund will distribute net realized capital gains (including net short-term capital gains) at least annually after the fiscal year in which the capital gains were earned, unless offset by any available capital loss carryforward. Income distributions and capital gain distributions are determined in accordance with federal income tax regulations which may differ from GAAP.
Indemnification
In the normal course of business, the Fund enters into contracts that contain a variety of representations and warranties and which provide general indemnities. The Fund's maximum exposure under these arrangements is unknown because this would involve future claims against the Fund. Also, under the Trust's organizational documents and by contract, the Trustees and officers of the Trust are indemnified against certain liabilities that may arise out of actions relating to their duties to the Trust. However, based on experience, the Fund expects the risk of loss due to these representations, warranties and indemnities to be minimal.
Note 3. Fees and Compensation Paid to Affiliates
Investment Management Services Fee
The Investment Manager is responsible for the management of the Fund. Day-to-day portfolio management of the Fund is provided by the Fund's subadviser (see Subadvisory Fee note below). The management fee is based on the annual rate of 0.80% of the Fund's average daily net assets.
Prior to the Closing, Columbia Management Advisors, LLC (Columbia), an indirect, wholly owned subsidiary of Bank of America Corporation (BOA), provided investment management services to the Fund under the same fee structure.
Subadvisory Fee
Marsico has been retained by the Investment Manager to serve as the investment subadviser to the Fund. As the subadviser, and subject to the oversight of the Investment Manager and the Fund's Board of Trustees, Marsico is responsible for the daily investment operations, including placing all orders for the purchase and sale of the portfolio securities for the Fund. The Investment Manager, from the management fee it receives, pays Marsico a monthly subadvisory fee based on the Fund's average daily net assets at the following annual rates:
| Average Daily Net Assets | | Annual Fee Rate | |
| Assets up to $1.5 billion | | | 0.45 | % | |
Assets in excess of $1.5 billion and
up to $3 billion | | | 0.40 | % | |
| Assets in excess of $3 billion | | | 0.35 | % | |
Prior to the Closing, Marsico provided subadvisory services to the Fund under the same fee structure in accordance with an agreement with Columbia.
Administration Fee
Effective upon the Closing, the Investment Manager became the administrator of the Fund and provides administrative and other services to the Fund, including services previously performed under the Pricing and Bookkeeping Oversight and Services Agreement discussed below. The administration fee is based on the annual rate of 0.22% of the Fund's average daily net assets, less the fees payable by the Fund as described under the Pricing and Bookkeeping Fees
22
Columbia Marsico Global Fund, February 28, 2011
note below (Pricing and Bookkeeping fees). In the event the administration fee paid to the Investment Manager is not sufficient to cover the Pricing and Bookkeeping fees, the Investment Manager pays the additional Pricing and Bookkeeping fees on behalf of the Fund. Prior to the Closing, Columbia provided administrative services to the Fund at the same fee rate.
Pricing and Bookkeeping Fees
Prior to the Closing, the Fund entered into a Financial Reporting Services Agreement (the Financial Reporting Services Agreement) with State Street Bank and Trust Company (State Street) and Columbia pursuant to which State Street provides financial reporting services to the Fund. The Fund also entered into an Accounting Services Agreement (collectively with the Financial Reporting Services Agreement, the State Street Agreements) with State Street and Columbia pursuant to which State Street provides accounting services to the Fund. Upon the Closing, Columbia assigned and delegated its rights and obligations under the State Street Agreements to the Investment Manager. Under the State Street Agreements, the Fund pays State Street an annual fee of $38,000 paid monthly plus an additional monthly fee based on an annualized percentage rate of average daily net assets of the Fund for the month. The aggregate fee will not exceed $140,000 per year (exclusive of out-of-pocket expenses and charges). The Fund also reimburses State Street for certain out-of-pocket expenses and charges.
Also prior to the Closing, the Fund entered into a Pricing and Bookkeeping Oversight and Services Agreement (the Services Agreement) with Columbia. Under the Services Agreement, Columbia provided services related to Fund expenses and the requirements of the Sarbanes-Oxley Act of 2002, and provided oversight of the accounting and financial reporting services provided by State Street. Under the Services Agreement, the Fund reimbursed Columbia for out-of-pocket expenses and charges, including fees payable to third parties, such as for pricing the Fund's portfolio securities, incurred by Columbia in the performance of services under the Services Agreement. The Services Agreement was terminated upon the Closing. These services are now provided under the Administration Fee note discussed above.
Transfer Agent Fee
In connection with the Closing, RiverSource Service Corporation, a wholly owned subsidiary of Ameriprise Financial, became the transfer agent of the Fund and changed its name to Columbia Management Investment Services Corp. (the New Transfer Agent). The New Transfer Agent has contracted with Boston Financial Data Services (BFDS) to serve as sub-transfer agent. The New Transfer Agent receives monthly account-based service fees based on the number of open accounts and asset-based fees, calculated based on assets held in omnibus accounts, which are intended to reimburse the New Transfer Agent for certain sub-transfer agent fees (exclusive of BFDS fees). The New Transfer Agent pays the fees of BFDS for services as sub-transfer agent and is not entitled to reimbursement for such fees from the Fund.
The New Transfer Agent receives reimbursement for certain out-of-pocket expenses and may also receive compensation for various shareholder services.
Prior to the Closing, Columbia Management Services, Inc., an affiliate of Columbia and an indirect, wholly owned subsidiary of BOA, provided shareholder services to the Fund and contracted with BFDS to serve as sub-transfer agent, under the same fee structure.
For the year ended February 28, 2011, the Fund's effective transfer agent fee rate for each class was 0.05% of the Fund's average daily net assets.
An annual minimum account balance fee of $20 may apply to certain accounts with a value below the Fund's initial minimum investment requirements to reduce the impact of small accounts on transfer agent fees. These minimum account balance fees are recorded as part of expense reductions on the Statement of Operations. For the year ended February 28, 2011, no minimum account balance fees were charged by the Fund.
Underwriting Discounts, Service and Distribution Fees
In connection with the Closing, RiverSource Fund Distributors, Inc., an indirect wholly owned subsidiary of Ameriprise Financial, became the distributor of the Fund and changed its name to Columbia Management Investment Distributors, Inc. (the New Distributor).
For the year ended February 28, 2011, initial sales charges paid by shareholders on the purchase of Class A shares amounted to $2,241 and net CDSC fees paid by shareholders on certain redemptions of Class C shares amounted to $42, respectively.
The Trust has adopted a shareholder servicing plan and a distribution plan for the Class C shares of the Fund and a combined distribution and shareholder servicing plan for Class A shares of the Fund. The
23
Columbia Marsico Global Fund, February 28, 2011
Trust has also adopted a distribution plan for Class R shares of the Fund. The shareholder servicing plans permit the Fund to compensate or reimburse servicing agents for the shareholder services they have provided. The distribution plans, adopted pursuant to Rule 12b-1 under the 1940 Act, permit the Fund to compensate or reimburse the New Distributor and/or selling agents for activities or expenses primarily intended to result in the sale of the classes' shares. Payments are made at an annual rate and paid monthly, as a percentage of average daily net assets, set from time to time by the Board of Trustees, and are charged as expenses of the Fund directly to the applicable share class. A substantial portion of the expenses incurred pursuant to these plans is paid to affiliates of the New Distributor.
The annual rates in effect and plan limits, as a percentage of average daily net assets are as follows:
| | | Current
Rate | | Plan
Limit | |
Class A Combined Distribution
and Shareholder Servicing Plan | | | 0.25 | % | | | 0.25 | % | |
| Class C Shareholder Servicing Plan | | | 0.25 | % | | | 0.25 | % | |
| Class C Distribution Plan | | | 0.75 | % | | | 0.75 | % | |
| Class R Distribution Plan | | | 0.50 | % | | | 0.50 | % | |
Prior to the Closing, Columbia Management Distributors, Inc, an affiliate of Columbia and an indirect, wholly owned subsidiary of BOA, was the principal underwriter of the Fund's shares. There were no changes to the underwriting discount structure of the Fund or the service or distribution fee rates paid by the Fund as a result of the Transaction.
Expense Limits and Fee Waivers
Effective September 27, 2010, the Investment Manager has voluntarily agreed to reimburse a portion of the Fund's expenses so that the Fund's ordinary operating expenses (excluding any brokerage commissions, interest, taxes and extraordinary expenses, but including custodian charges relating to overdrafts, if any), after giving effect to any balance credits from the Fund's custodian, do not exceed the annual rates of 1.60%, 2.35%, 1.85% and 1.35% of the Fund's average daily net assets attributable to Class A, Class C, Class R and Class Z shares, respectively. This arrangement may be modified or terminated by the Investment Manager at any time.
For the period May 1, 2010 through September 26, 2010, the Investment Manager voluntarily agreed to reimburse a portion of the Fund's expenses so that the Fund's ordinary operating expenses (excluding any distribution and service fees, brokerage commissions, interest, taxes and extraordinary expenses, but including custodian charges relating to overdrafts, if any), after giving effect to any balance credits from the Fund's custodian, did not exceed 1.35% annually of the Fund's average daily net assets. Prior to May 1, 2010, Columbia voluntarily reimbursed a portion of the Fund's expenses in the same manner.
The Investment Manager is entitled to recover from the Fund any fees waived and/or expenses reimbursed for a three year period following the date of such fee waiver and/or reimbursement if such recovery does not cause the Fund's expenses to exceed the expense limitations in effect at the time of recovery. Prior to May 1, 2010, Columbia was entitled to recover fees waived and/or expenses reimbursed from the Fund in the same manner.
At February 28, 2011, the amounts potentially recoverable by the Investment Manager pursuant to this arrangement were as follows:
| | | | | | | Total | | Amount | | Amount
Recovered
During the | |
| | | Amount of Potential Recovery Expiring: | | Potential | | Expired | | Year Ended | |
| 02/28/2014 | | 02/28/2013 | | 02/29/2012 | | Recovery | | 02/28/2011 | | 02/28/2011 | |
| $ | 216,675 | | | $ | 178,993 | | | $ | 272,206 | | | $ | 667,874 | | | $ | — | | | $ | — | | |
Fees Paid to Officers and Trustees
Upon the Closing, all officers of the Fund are employees of the Investment Manager or its affiliates and, with the exception of the Fund's Chief Compliance Officer, receive no compensation from the Fund. The Board of Trustees has appointed a Chief Compliance Officer to the Fund in accordance with federal securities regulations. The Fund, along with other affiliated funds, pays its pro-rata share of the expenses associated with the Chief Compliance Officer. The Fund's expenses for the Chief Compliance Officer will not exceed $15,000 per year. Prior to the Closing, all officers of the Fund were
24
Columbia Marsico Global Fund, February 28, 2011
employees of Columbia or its affiliates and the Fund paid its pro-rata share of the expenses for the Chief Compliance Officer under the same fee structure.
Trustees are compensated for their services to the Fund, as set forth on the Statement of Operations. The Trust's eligible Trustees may participate in a non-qualified deferred compensation plan which may be terminated at any time. Any payments to plan participants are paid solely out of the Fund's assets. Income earned on the plan participant's deferral account is based on the rate of return of the eligible mutual funds selected by the participant or, if no funds are selected, on the rate of return of Columbia Money Market Fund (formerly known as RiverSource Cash Management Fund). Prior to the Closing, if no funds were selected, income earned on the plan participant's deferral account was based on the rate of return of BofA Treasury Reserves. Trustees' fees deferred during the current period as well as any gains or losses on the trustees' deferred compensation balances as a result of market fluctuations are included in "Trustees' fees" on the Statement of Operations. Liabilities under the deferred compensation plan are included in "Trustees' fees" on the Statement of Assets and Liabilities.
Other Related Party Transactions
Prior to the Closing, the Fund used one or more brokers that were affiliates of BOA in connection with the purchase and sale of its securities. Total brokerage commissions paid to affiliated brokers for the period prior to the Closing were $73.
Note 4. Custody Credits
The Fund has an agreement with its custodian bank under which custody fees may be reduced by balance credits. These credits are recorded as part of expense reductions on the Statement of Operations. The Fund could have invested a portion of the assets utilized in connection with the expense offset arrangement in an income-producing asset if it had not entered into such an agreement. For the year ended February 28, 2011, these custody credits reduced total expenses by $5 for the Fund.
Note 5. Portfolio Information
The cost of purchases and proceeds from sales of securities, excluding short-term obligations, aggregated $7,264,651 and $6,309,946, respectively, for the year ended February 28, 2011.
Note 6. Redemption Fees
Effective March 1, 2010, the Fund no longer assesses a 2.00% redemption fee on the proceeds from Fund shares that are redeemed within 60 days of purchase. The redemption fee was designed to offset brokerage commissions and other costs associated with short term trading of fund shares. The redemption fees, which were retained by the Fund, were accounted for as an addition to paid-in capital and were allocated to each class based on the relative net assets at the time of the redemption.
Note 7. Shareholder Concentration
As of February 28, 2011, two shareholder accounts owned 71.3% of the outstanding shares of the Fund. Purchase and redemption activity of these accounts may have a significant effect on the operations of the Fund.
Note 8. Line of Credit
The Fund and other affiliated funds participate in a $280,000,000 committed, unsecured revolving line of credit provided by State Street. The maximum amount that may be borrowed by any fund is limited to the lesser of $200,000,000 and the Fund's borrowing limit set forth in the Fund's registration statement. Borrowings are available for short-term liquidity or temporary or emergency purposes.
Effective October 14, 2010, interest is charged to each participating fund based on the fund's borrowings at a rate per annum equal to the greater of the Federal Funds Rate plus 1.25% or the overnight LIBOR Rate plus 1.25%. In addition, a commitment fee of 0.125% per annum is accrued and apportioned among the participating funds pro rata based on their relative net assets.
Prior to October 14, 2010, interest was charged to each participating fund at the same rates. In addition, a commitment fee of 0.15% per annum was accrued and apportioned among the participating funds pro rata based on their relative net assets.
For the year ended February 28, 2011, the Fund did not borrow under these arrangements.
Note 9. Federal Tax Information
The timing and character of income and capital gain distributions are determined in accordance with income tax regulations, which may differ from GAAP. Reclassifications are made to the Fund's capital accounts for permanent tax differences to reflect income and gains
25
Columbia Marsico Global Fund, February 28, 2011
available for distribution (or available capital loss carryforwards) under income tax regulations.
For the year ended February 28, 2011, permanent book and tax basis differences resulting primarily from differing treatments for passive foreign investment companies (PFIC) adjustments and foreign currency transactions were identified and reclassified among the components of the Fund's net assets as follows:
Overdistributed
Net Investment
Income | | Accumulated Net
Realized Loss | | Paid-In Capital | |
| $ | 36,222 | | | $ | (36,222 | ) | | $ | — | | |
Net investment income and net realized gains (losses), as disclosed on the Statement of Operations, and net assets were not affected by this reclassification.
The tax character of distributions paid during the years ended February 28, 2011 and February 28, 2010 was as follows:
| | | February 28, | |
| Distributions paid from: | | 2011 | | 2010 | |
| Ordinary Income* | | $ | 35,349 | | | $ | 15,304 | | |
* For tax purposes short-term capital gain distributions, if any, are considered ordinary income distributions.
As of February 28, 2011, the components of distributable earnings on a tax basis were as follows:
Undistributed
Ordinary
Income | | Undistributed
Long-Term
Capital Gains | |
Net Unrealized
Appreciation* | |
| $ | 8,900 | | | $ | 86,952 | | | $ | 1,489,680 | | |
* The differences between book-basis and tax-basis net unrealized appreciation are primarily due to passive foreign investment companies (PFIC) adjustment and deferral of losses from wash sales.
Unrealized appreciation and depreciation at February 28, 2011, based on cost of investments for federal income tax purposes were:
| Unrealized appreciation | | $ | 1,518,138 | | |
| Unrealized depreciation | | | (28,458 | ) | |
| Net unrealized appreciation | | $ | 1,489,680 | | |
The following capital loss carryforwards may be available to reduce taxable income arising from future net realized gains on investments, if any, to the extent permitted by the Internal Revenue Code:
| Year of Expiration | | Capital Loss
Carryforwards | |
| | 2018 | | | $ | 1,122,487 | | |
Capital loss carryforwards of $756,639 were utilized during the year ended February 28, 2011.
Management is required to determine whether a tax position of the Fund is more likely than not to be sustained upon examination by the applicable taxing authority, including resolution of any related appeals or litigation processes, based on the technical merits of the position. The tax benefit to be recognized by the Fund is measured as the largest amount of benefit that is greater than fifty percent likely of being realized upon ultimate settlement. Management is not aware of any tax positions for which it is reasonably possible that the total amounts of unrecognized tax benefits will significantly change in the next twelve months. However, management's conclusions may be subject to review and adjustment at a later date based on factors including, but not limited to, new tax laws, regulations, and administrative interpretations (including relevant court decisions). The Fund's federal tax returns for the prior three fiscal years remain subject to examination by the Internal Revenue Service.
Note 10. Significant Risks and Contingencies
Foreign Securities Risk
Investing in foreign securities may include certain risks and considerations not typically associated with investing in U.S. securities, such as fluctuating currency values and changing local and regional economic, political and social conditions, which may
26
Columbia Marsico Global Fund, February 28, 2011
result in greater market volatility. In addition, certain foreign securities may not be as liquid as U.S. securities. Investing in emerging markets may accentuate these risks.
Investments in emerging market countries are subject to additional risk. The risk of foreign investments is typically increased in less developed countries. These countries are also more likely to experience high levels of inflation, deflation or currency devaluation which could hurt their economies and securities markets.
Note 11. Subsequent Events
Management has evaluated the events and transactions that have occurred through the date the financial statements were issued and noted no items requiring adjustment of the financial statements or additional disclosure.
Note 12. Information Regarding Pending and Settled Legal Proceedings
In June 2004, an action captioned John E. Gallus et al. v. American Express Financial Corp. and American Express Financial Advisors Inc. was filed in the United States District Court for the District of Arizona. The plaintiffs allege that they are investors in several American Express Company (now known as RiverSource) mutual funds and they purport to bring the action derivatively on behalf of those funds under the Investment Company Act of 1940. The plaintiffs allege that fees allegedly paid to the defendants by the funds for investment advisory and administrative services are excessive. The plaintiffs seek remedies including restitution and rescission of investment advisory and distribution agreements. The plaintiffs voluntarily agreed to transfer this case to the United States District Court for the District of Minnesota (the District Court). In response to defendants' motion to dismiss the complaint, the District Court dismissed one of plaintiffs' four claims and granted plaintiffs limited discovery. Defendants moved for summary judgment in April 2007. Summary judgment was granted in the defendants' favor on July 9, 2007. The plaintiffs filed a notice of appeal with the Eighth Circuit Court of Appeals (the Eighth Circuit) on August 8, 2007. On April 8, 2009, the Eighth Circuit reversed summary judgment and remanded to the District Court for further proceedings. On August 6, 2009, defendants filed a writ of certiorari with the U.S. Supreme Court (the Supreme Court), asking the Supreme Court to stay the District Court proceedings while the Supreme Court considers and rules in a case captioned Jones v. Harris Associates, which involves issues of law similar to those presented in the Gallus case. On March 30, 2010, the Supreme Court issued its ruling in Jones v. Harris Associates, and on April 5, 2010, the Supreme Court vacated the Eighth Circuit's decision in the Gallus case and remanded the case to the Eighth Circuit for further consideration in light of the Supreme Court's decision in Jones v. Harris Associates. On June 4, 2010, the Eighth Circuit remanded the Gallus case to the District Court for further consideration in light of the Supreme Court's decision in Jones v. Harris Associates. On December 9, 2010, the District Court reinstated its July 9, 2007 summary judgment order in favor of the defendants. On January 10, 2011 plaintiffs filed a notice of appeal with the Eighth Circuit.
In December 2005, without admitting or denying the allegations, American Express Financial Corporation (AEFC, which is now known as Ameriprise Financial, Inc. (Ameriprise Financial)), entered into settlement agreements with the Securities and Exchange Commission (SEC) and Minnesota Department of Commerce (MDOC) related to market timing activities. As a result, AEFC was censured and ordered to cease and desist from committing or causing any violations of certain provisions of the Investment Advisers Act of 1940, the Investment Company Act of 1940, and various Minnesota laws. AEFC agreed to pay disgorgement of $10 million and civil money penalties of $7 million. AEFC also agreed to retain an independent distribution consultant to assist in developing a plan for distribution of all disgorgement and civil penalties ordered by the SEC in accordance with various undertakings detailed at http://www.sec.gov/litigation/admin/ia-2451.pdf. Ameriprise Financial and its affiliates have cooperated with the SEC and the MDOC in these legal proceedings, and have made regular reports to the funds' Boards of Directors/Trustees.
Ameriprise Financial and certain of its affiliates have historically been involved in a number of legal, arbitration and regulatory proceedings, including routine litigation, class actions, and governmental actions, concerning matters arising in connection with the conduct of their business activities. Ameriprise Financial believes that the Funds are not currently the subject of, and that neither Ameriprise Financial nor any of its affiliates are the subject of, any pending legal, arbitration or regulatory proceedings that are likely to have a material adverse effect on the Funds or the ability of Ameriprise Financial or its affiliates to perform under their contracts with the Funds. Ameriprise Financial is required to make 10-Q, 10-K and, as necessary, 8-K filings with the Securities and Exchange Commission on legal and regulatory matters that relate to Ameriprise Financial and its affiliates. Copies of these filings may be obtained by accessing the SEC website at www.sec.gov.
There can be no assurance that these matters, or the adverse publicity associated with them, will not result in increased fund redemptions, reduced sale of fund shares or other adverse consequences to the
27
Columbia Marsico Global Fund, February 28, 2011
Funds. Further, although we believe proceedings are not likely to have a material adverse effect on the Funds or the ability of Ameriprise Financial or its affiliates to perform under their contracts with the Funds, these proceedings are subject to uncertainties and, as such, we are unable to estimate the possible loss or range of loss that may result. An adverse outcome in one or more of these proceedings could result in adverse judgments, settlements, fines, penalties or other relief that could have a material adverse effect on the consolidated financial condition or results of operations of Ameriprise Financial.
28
Report of Independent Registered Public Accounting Firm
To the Trustees of Columbia Funds Series Trust and the Shareholders of Columbia Marsico Global Fund
In our opinion, the accompanying statement of assets and liabilities, including the investment portfolio, and the related statements of operations and of changes in net assets and the financial highlights present fairly, in all material respects, the financial position of Columbia Marsico Global Fund (the "Fund") (a series of Columbia Funds Series Trust) at February 28, 2011, the results of its operations for the year then ended, the changes in its net assets for each of the two years in the period then ended, and the financial highlights for each of the periods indicated, in conformity with accounting principles generally accepted in the United States of America. These financial statements and financial highlights (hereafter referred to as "financial statements") are the responsibility of the Fund's management. Our responsibility is to express an opinion on these financial statements based on our audits. We conducted our audits of these financial statements in accordance with the standards of the Public Company Accounting Oversight Board (United States). Those standards require that we plan and perform the audit to obtain reasonable assurance about whether the financial statements are free of material misstatement. An audit includes examining, on a test basis, evidence supporting the amounts and disclosures in the financial statements, assessing the accounting principles used and significant estimates made by management, and evaluating the overall financial statement presentation. We believe that our audits, which included confirmation of securities at February 28, 2011 by correspondence with the custodian and brokers, provide a reasonable basis for our opinion.
PricewaterhouseCoopers LLP
Boston, Massachusetts
April 21, 2011
29
Federal Income Tax Information (Unaudited) – Columbia Marsico Global Fund
The Fund hereby designates as a capital gain dividend with respect to the fiscal year ended February 28, 2011, $91,300, or, if subsequently determined to be different, the net capital gain of such year.
26.06% of the ordinary income distributed by the Fund for the fiscal year ended February 28, 2011, qualifies for the corporate dividends received deduction.
For non-corporate shareholders 100.00%, or the maximum amount allowable under the Jobs and Growth Tax Relief Reconciliation Act of 2003, of ordinary income distributed by the Fund for the fiscal year ended February 28, 2011 may represent qualified dividend income.
The Fund will notify shareholders in January 2012 of amounts for use in preparing 2011 income tax returns.
30
Fund Governance
The Trustees serve terms of indefinite duration. The names, addresses and birth years of the Trustees and Officers of the Funds in the Columbia Funds Series Trust, the year each was first elected or appointed to office, their principal business occupations during at least the last five years, the number of Funds overseen by each Trustee and other directorships they hold are shown below. Each officer listed below serves as an officer of each Fund in the Columbia Funds Series Trust.
Independent Trustees
Name, Address and Year of Birth,
Position with Funds, Year First
Elected or Appointed to Office | | Principal Occupation(s) During Past Five Years, Number of Funds in the Columbia
Funds Complex Overseen by Trustee, Other Directorships Held | |
| Edward J. Boudreau, Jr. (Born 1944) | |
|
c/o Columbia Management
Investment Advisers, LLC
225 Franklin Street
Boston, MA 02110
Trustee (since 2005) | | Managing Director—E.J. Boudreau & Associates (consulting), from 2000 through current; oversees 44; Trustee—BofA Funds Series Trust. | |
|
| William P. Carmichael (Born 1943) | |
|
c/o Columbia Management
Investment Advisers, LLC
225 Franklin Street
Boston, MA 02110
Trustee (since 1999) | | Retired; Oversees 44; Director—Cobra Electronics Corporation (electronic equipment manufacturer); Director—McMoRan Exploration Company (oil and gas exploration and development); Director—The Finish Line (athletic shoes and apparel); Trustee—BofA Funds Series Trust; Former Director—Simmons Company (bedding). | |
|
| William A. Hawkins (Born 1942) | |
|
c/o Columbia Management
Investment Advisers, LLC
225 Franklin Street
Boston, MA 02110
Trustee (since 2005) | | Managing Director—Overton Partners (financial consulting), August 2010 to present; President and Chief Executive Officer—California General Bank, N.A., from January 2008 through August 2010; oversees 44; Trustee—BofA Funds Series Trust. | |
|
| R. Glenn Hilliard (Born 1943) | |
|
c/o Columbia Management
Investment Advisers, LLC
225 Franklin Street
Boston, MA 02110
Trustee (since 2005) | | Chairman and Chief Executive Officer—Hilliard Group LLC (investing and consulting), from April 2003 through current; Non-Executive Director & Chairman—CNO Financial, Inc. (formerly Conseco, Inc.) (insurance), September 2003 through current; Executive Chairman—Conseco, Inc. (insurance), August 2004 through September 2005; oversees 44; Trustee—BofA Funds Series Trust. | |
|
| John J. Nagorniak (Born 1944) | |
|
c/o Columbia Management
Investment Advisers, LLC
225 Franklin Street
Boston, MA 02110
Trustee (since 2008) | | Retired; President and Director—Foxstone Financial, Inc. (consulting), 2000 through December 2007; Director—Mellon Financial Corporation affiliates (investing), 2000 through 2007; Chairman—Franklin Portfolio Associates (investing—Mellon affiliate), 1982 through 2007; oversees 44; Director—MIT Investment Company; Trustee—MIT 401k Plan. | |
|
| Minor M. Shaw (Born 1947) | |
|
c/o Columbia Management
Investment Advisers, LLC
225 Franklin Street
Boston, MA 02110
Trustee (since 2003) | | President—Micco Corporation and Mickel Investment Group; oversees 44; Board Member—Piedmont Natural Gas; Trustee—BofA Funds Series Trust. | |
|
31
Fund Governance (continued)
Interested Trustee
Name, Address and Year of Birth,
Position with Funds, Year First
Elected or Appointed to Office | | Principal Occupation(s) During Past Five Years, Number of Funds in the Columbia
Funds Complex Overseen by Trustee, Other Directorships Held
| |
| Anthony M. Santomero1 (Born 1946) | |
|
c/o Columbia Management
Investment Advisers, LLC
225 Franklin Street
Boston, MA 02110
Trustee (since 2008) | | Richard K. Mellon Professor Emeritus of Finance, The Wharton School, University of Pennsylvania, from 2002 through current; Senior Advisor—McKinsey & Company (consulting), July 2006 through January 2008; President and Chief Executive Officer—Federal Reserve Bank of Philadelphia, July 2000 through April 2006; oversees 44; Director—Renaissance Reinsurance Ltd; Trustee—Penn Mutual Life Insurance Company; Director—Citigroup, Inc.; Citibank, N.A.; Trustee—BofA Funds Series Trust. | |
|
1 Dr. Santomero is currently deemed by the Columbia Funds to be an "interested person" (as defined in the 1940 Act) of the Funds because he serves as a Director of Citigroup, Inc. and Citibank N.A., companies that may directly or through subsidiaries and affiliates engage from time-to-time in brokerage execution, principal transactions and lending relationships with the Columbia Funds or other funds or accounts advised/managed by the Adviser.
The Statement of Additional Information includes additional information about the Trustees of the Funds and is available, without charge, upon request by calling 800-345-6611.
Officers
| Name, Year of Birth and Address | | Principal Occupation(s) During the Past Five Years | |
| J. Kevin Connaughton (Born 1964) | |
|
225 Franklin Street
Boston, MA 02110
President (since 2009) | | Senior Vice President and General Manager—Mutual Fund Products, Columbia Management Investment Advisers, LLC since May 2010; President, Columbia Funds, since 2009, and RiverSource Funds, since May 2010 (previously Senior Vice President and Chief Financial Officer, Columbia Funds, from June 2008 to January 2009, Treasurer, Columbia Funds, from October 2003 to May 2008, and senior officer of various other affiliated funds since 2000); Managing Director, Columbia Management Advisors, LLC from December 2004 to April 2010. | |
|
| Michael G. Clarke (Born 1969) | |
|
225 Franklin Street
Boston, MA 02110
Senior Vice President and Chief Financial Officer (since 2009) | | Vice President, Columbia Management Investment Advisers, LLC since May 2010; Managing Director of Fund Administration, Columbia Management Advisors, LLC, from September 2004 to April 2010; senior officer of Columbia Funds and affiliated funds since 2002. | |
|
| Scott R. Plummer (Born 1959) | |
|
5228 Ameriprise Financial Center
Minneapolis, MN 55474
Senior Vice President, Secretary and Chief Legal Officer (since 2010) | | Chief Legal Officer and Assistant Secretary, Columbia Management Investment Advisers, LLC since June 2005; Vice President and Lead Chief Counsel—Asset Management, Ameriprise Financial, Inc. since May 2010 (previously Vice President and Chief Counsel—Asset Management, from 2005 to April 2010, and Vice President—Asset Management Compliance from 2004 to 2005); Vice President, Chief Counsel and Assistant Secretary, Columbia Management Investment Distributors, Inc. since 2008; Vice President, General Counsel and Secretary, Ameriprise Certificate Company since 2005; Chief Counsel, RiverSource Distributors, Inc. since 2006; Vice President, General Counsel and Secretary, RiverSource Funds, since December 2006; Senior Vice President, Secretary and Chief Legal Officer, Columbia Funds, since May 2010. | |
|
32
Fund Governance (continued)
Officers (continued)
| Name, Year of Birth and Address | | Principal Occupation(s) During the Past Five Years | |
| Linda J. Wondrack (Born 1964) | |
|
225 Franklin Street
Boston, MA 02110
Senior Vice President and Chief Compliance Officer (since 2007) | | Vice President and Chief Compliance Officer, Columbia Management Investment Advisers, LLC since May 2010; Chief Compliance Officer, Columbia Funds, since 2007, and RiverSource Funds, since May 2010; Director (Columbia Management Group, LLC and Investment Product Group Compliance), Bank of America, from June 2005 to April 2010. | |
|
| William F. Truscott (Born 1960) | |
|
53600 Ameriprise Financial Center
Minneapolis, MN 55474
Senior Vice President (since 2010) | | Chairman of the Board, Columbia Management Investment Advisers, LLC since May 2010 (previously President, Chairman of the Board and Chief Investment Officer, from 2001 to April 2010); Chief Executive Officer, U.S. Asset Management & President, Annuities, Ameriprise Financial, Inc. since May 2010 (previously President—U.S. Asset Management and Chief Investment Officer from 2005 to April 2010, and Senior Vice President—Chief Investment Officer, from 2001 to 2005); Director, President and Chief Executive Officer, Ameriprise Certificate Company since 2006; Director, Columbia Management Investment Distributors, Inc. since May 2010 (previously Chairman of the Board and Chief Executive Officer from 2008 to April 2010); Chairman of the Board and Chief Executive Officer, RiverSource Distributors, Inc. since 2006. | |
|
| Colin Moore (Born 1958) | |
|
225 Franklin Street
Boston, MA 02110
Senior Vice President (since 2010) | | Director and Chief Investment Officer, Columbia Management Investment Advisers, LLC since May 2010; Manager, Managing Director and Chief Investment Officer of Columbia Management Advisors, LLC from 2007 to April 2010; Head of Equities, Columbia Management Advisors, LLC from 2002 to 2007. | |
|
| Michael A. Jones (Born 1959) | |
|
225 Franklin Street
Boston, MA 02110
Senior Vice President (since 2010) | | President and Director, Columbia Management Investment Advisers, LLC since May 2010; President and Director, Columbia Management Investment Distributors, Inc. since May 2010; Manager, Chairman, Chief Executive Officer and President, Columbia Management Advisors, LLC from 2007 to April 2010; Chief Executive Officer, President and Director, Columbia Management Distributors, Inc. from November 2006 to April 2010; previously, co-president and senior managing director at Robeco Investment Management. | |
|
| Amy Johnson (Born 1965) | |
|
5228 Ameriprise Financial Center
Minneapolis, MN 55474
Senior Vice President (since 2010) | | Senior Vice President and Chief Operating Officer, Columbia Management Investment Advisers, LLC since May 2010 (previously Chief Administrative Officer, from 2009 until April 2010, Vice President—Asset Management and Trust Company Services, from 2006 to 2009, and Vice President—Operations and Compliance from 2004 to 2006). | |
|
| Joseph F. DiMaria (Born 1968) | |
|
225 Franklin Street
Boston, MA 02110
Treasurer (since 2010) and Chief Accounting Officer (since 2008) | | Vice President, Mutual Fund Administration, Columbia Management Investment Advisers, LLC, since May 2010; Director of Fund Administration, Columbia Management Advisors, LLC from January 2006 to April 2010; Head of Tax/Compliance and Assistant Treasurer, Columbia Management Advisors, LLC, from November 2004 to December 2005. | |
|
33
Fund Governance (continued)
Officers (continued)
| Name, Year of Birth and Address | | Principal Occupation(s) During the Past Five Years | |
| Marybeth Pilat (Born 1968) | |
|
225 Franklin Street
Boston, MA 02110
Deputy Treasurer (since 2010) | | Vice President, Mutual Fund Administration, Columbia Management Investment Advisers, LLC, since May 2010; Vice President, Investment Operations, Bank of America, from October 2008 to April 2010; Finance Manager, Boston Children's Hospital from August 2008 to October 2008; Director, Mutual Fund Administration, Columbia Management Advisors, LLC, from May 2007 to July 2008; Vice President, Mutual Fund Valuation, Columbia Management Advisors, LLC, from January 2006 to May 2007; Vice President, Mutual Fund Accounting Oversight, Columbia Management Advisors, LLC from January 2005 to January 2006. | |
|
| Julian Quero (Born 1967) | |
|
225 Franklin Street
Boston, MA 02110
Deputy Treasurer (since 2008) | | Vice President, Mutual Fund Administration, Columbia Management Investment Advisers, LLC since May 2010; Director of Fund Administration, Columbia Management Advisors, LLC, from August 2008 to April 2010; Senior Tax Manager, Columbia Management Advisors, LLC from August 2006 to July 2008; Senior Compliance Manager, Columbia Management Advisors, LLC from April 2002 to August 2006. | |
|
| Stephen T. Welsh (Born 1957) | |
|
225 Franklin Street
Boston, MA 02110
Vice President (since 2006) | | President and Director, Columbia Management Investment Services Corp. since May 2010; President and Director, Columbia Management Services, Inc. from July 2004 to April 2010; Managing Director, Columbia Management Distributors, Inc. from August 2007 to April 2010. | |
|
34
Shareholder Meeting Results
At a Joint Special Meeting of Shareholders held on February 15, 2011, shareholders of the series of Columbia Funds Series Trust, including the Fund, elected each of the nominees for trustees to the Board of Trustees of Columbia Funds Series Trust, each to hold office for an indefinite term, as follows:
| Trustee | | Votes For | | Votes Withheld | | Abstentions | |
| Kathleen Blatz | | | 2,145,636,122 | | | | 248,012,438 | | | | 0 | | |
| Edward J. Boudreau, Jr. | | | 2,145,430,114 | | | | 248,218,446 | | | | 0 | | |
| Pamela G. Carlton | | | 2,145,515,949 | | | | 248,132,612 | | | | 0 | | |
| William P. Carmichael | | | 2,145,038,695 | | | | 248,609,866 | | | | 0 | | |
| Patricia M. Flynn | | | 2,145,843,563 | | | | 247,804,997 | | | | 0 | | |
| William A. Hawkins | | | 2,145,359,401 | | | | 248,289,160 | | | | 0 | | |
| R. Glenn Hilliard | | | 2,145,079,400 | | | | 248,569,161 | | | | 0 | | |
| Stephen R. Lewis, Jr. | | | 2,145,092,209 | | | | 248,556,351 | | | | 0 | | |
| John F. Maher | | | 2,145,621,338 | | | | 248,027,223 | | | | 0 | | |
| John J. Nagorniak | | | 2,145,337,494 | | | | 248,311,067 | | | | 0 | | |
| Catherine James Paglia | | | 2,145,615,254 | | | | 248,033,306 | | | | 0 | | |
| Leroy C. Richie | | | 2,145,042,120 | | | | 248,606,441 | | | | 0 | | |
| Anthony M. Santomero | | | 2,145,088,174 | | | | 248,560,386 | | | | 0 | | |
| Minor M. Shaw | | | 2,145,430,762 | | | | 248,217,798 | | | | 0 | | |
| Alison Taunton-Rigby | | | 2,145,393,384 | | | | 248,255,177 | | | | 0 | | |
| William F. Truscott | | | 2,144,907,223 | | | | 248,741,338 | | | | 0 | | |
35
This page intentionally left blank.
Important Information About This Report
The fund mails one shareholder report to each shareholder address. If you would like more than one report, please call shareholder services at 1-800-345-6611 and additional reports will be sent to you. This report has been prepared for shareholders of Columbia Marsico Global Fund.
A description of the policies and procedures that the fund uses to determine how to vote proxies and a copy of the fund's voting records are available (i) at www.columbiamanagement.com, (ii) on the Securities and Exchange Commission's website at www.sec.gov, and (iii) without charge, upon request, by calling 1-800-368-0346. Information regarding how the fund voted proxies relating to portfolio securities during the 12-month period ended June 30 is available from the SEC's website. Information regarding how the fund voted proxies relating to portfolio securities is also available from the fund's website, www.columbiamanagement.com.
The fund files a complete schedule of portfolio holdings with the SEC for the first and third quarters of each fiscal year on Form N-Q. The fund's Form N-Q is available on the SEC's website at www.sec.gov and may be reviewed and copied at the SEC's Public Reference Room in Washington, D.C. Information on the operation of the Public Reference Room may be obtained by calling 1-800-SEC-0330.
Transfer Agent
Columbia Management Investment
Services Corp.
P.O. Box 8081
Boston, MA 02266-8081
1-800-345-6611
Distributor
Columbia Management Investment
Distributors, Inc.
225 Franklin Street
Boston, MA 02110
Investment Manager
Columbia Management Investment Advisers, LLC
225 Franklin Street
Boston, MA 02110
37

PRSRT STD
U.S. Postage
PAID
Holliston, MA
Permit NO. 20
Columbia Marsico Global Fund
P. O. Box 8081
Boston, MA 02266-8081
columbiamanagement.com
This information is for use with concurrent or prior delivery of a fund prospectus. Investors should consider the investment objectives, risks, charges and expenses of a mutual fund carefully before investing. For a free prospectus, which contains this and other important information about the funds, visit columbiamanagement.com. Read the prospectus carefully before investing. The Fund is distributed by Columbia Management Investment Distributors, Inc., member FINRA, and managed by Columbia Management Investment Advisers, LLC.
© 2011 Columbia Management Investment Advisers, LLC. All rights reserved.
C-1686 A (04/11)

Columbia Marsico International Opportunities Fund
Annual Report for the Period Ended February 28, 2011
Not FDIC insured • No bank guarantee • May lose value
Table of Contents
| Fund Profile | | | 1 | | |
|
| Economic Update | | | 2 | | |
|
| Performance Information | | | 3 | | |
|
| Understanding Your Expenses | | | 4 | | |
|
| Portfolio Managers' Report | | | 5 | | |
|
| Investment Portfolio | | | 7 | | |
|
Statement of Assets and
Liabilities | | | 11 | | |
|
| Statement of Operations | | | 13 | | |
|
Statement of Changes in
Net Assets | | | 14 | | |
|
| Financial Highlights | | | 16 | | |
|
| Notes to Financial Statements | | | 22 | | |
|
Report of Independent Registered
Public Accounting Firm | | | 31 | | |
|
| Federal Income Tax Information | | | 32 | | |
|
| Fund Governance | | | 33 | | |
|
| Shareholder Meeting Results | | | 37 | | |
|
Important Information About
This Report | | | 41 | | |
|
The views expressed in this report reflect the current views of the respective parties. These views are not guarantees of future performance and involve certain risks, uncertainties and assumptions that are difficult to predict, so actual outcomes and results may differ significantly from the views expressed. These views are subject to change at any time based upon economic, market or other conditions and the respective parties disclaim any responsibility to update such views. These views may not be relied on as investment advice and, because investment decisions for a Columbia Fund are based on numerous factors, may not be relied on as an indication of trading intent on behalf of any particular Columbia Fund. References to specific securities should not be construed as a recommendation or investment advice.
President's Message

Dear Shareholder:
The Columbia Management story began over 100 years ago, and today, we are one of the nation's largest dedicated asset managers. The recent acquisition by Ameriprise Financial, Inc. brings together the talents, resources and capabilities of Columbia Management with those of RiverSource Investments, Threadneedle (acquired by Ameriprise in 2003) and Seligman Investments (acquired by Ameriprise in 2008) to build a best-in-class asset management business that we believe is truly greater than its parts.
RiverSource Investments traces its roots to 1894 when its then newly-founded predecessor, Investors Syndicate, offered a face-amount savings certificate that gave small investors the opportunity to build a safe and secure fund for retirement, education or other special needs. A mutual fund pioneer, Investors Syndicate launched Investors Mutual Fund in 1940. In the decades that followed, its mutual fund products and services lineup grew to include a full spectrum of styles and specialties. More than 110 years later, RiverSource continues to be a trusted financial products leader.
Threadneedle, a leader in global asset management and one of Europe's largest asset managers, offers sophisticated international experience from a dedicated U.K. management team. Headquartered in London, it is named for Threadneedle Street in the heart of the city's financial district, where British investors pioneered international and global investing. Threadneedle was acquired in 2003 and today operates as an affiliate of Columbia Management.
Seligman Investments' beginnings date back to the establishment of the investment firm J. & W. Seligman & Co. in 1864. In the years that followed, Seligman played a major role in the geographical expansion and industrial development of the United States. In 1874, President Ulysses S. Grant named Seligman as fiscal agent for the U.S. Navy—an appointment that would last through World War I. Seligman helped finance the westward path of the railroads and the building of the Panama Canal. The firm organized its first investment company in 1929 and began managing its first mutual fund in 1930. In 2008, J. & W. Seligman & Co. Incorporated was acquired and Seligman Investments became an offering brand of RiverSource Investments, LLC.
We are proud of the rich and distinctive history of these firms, the strength and breadth of products and services they offer, and the combined cultures of pioneering spirit and forward thinking. Together we are committed to providing more for our shareholders than ever before.
> A singular focus on our shareholders
Our business is asset management, so investors are our first priority. We dedicate our resources to identifying timely investment opportunities and provide a comprehensive choice of equity, fixed-income and alternative investments to help meet your individual needs.
> First-class research and thought leadership
We are dedicated to helping you take advantage of today's opportunities and anticipate tomorrow's. We stay abreast of the latest investment trends and ideas, using our collective insight to evaluate events and transform them into solutions you can use.
> A disciplined investment approach
We aren't distracted by passing fads. Our teams adhere to a rigorous investment process that helps ensure the integrity of our products and enables you and your financial advisor to match our solutions to your objectives with confidence.
When you choose Columbia Management, you can be confident that we will take the time to understand your needs and help you and your financial advisor identify the solutions that are right for you. Because at Columbia Management, we don't consider ourselves successful unless you are.
Sincerely,

J. Kevin Connaughton
President, Columbia Funds
Investors should consider the investment objectives, risks, charges and expenses of a mutual fund carefully before investing. For a free prospectus, which contains this and other important information about the funds, visit www.columbiamanagement.com. The prospectus should be read carefully before investing.
Columbia Funds are distributed by Columbia Management Investment Distributors, Inc., member FINRA, and managed by Columbia Management Investment Advisers, LLC.
© 2011 Columbia Management Investment Advisers, LLC. All rights reserved.
Fund Profile – Columbia Marsico International Opportunities Fund
Summary
g For the 12-month period that ended February 28, 2011, the fund's Class A shares returned 21.39% without sales charge.
g The fund's return was slightly higher than the return of its benchmark, the MSCI EAFE Index (Net)1 and slightly less than its peer group, the Lipper International Large-Cap Growth Fund Classification.2
g Strong stock selection aided performance. An overweight in the strong-performing consumer discretionary sector also aided results. Stock selection and the impact of currency in the financial sector detracted from performance.
Portfolio Management
James G. Gendelman has managed the fund since 2000. He is associated with Marsico Capital Management, LLC (MCM), investment subadviser to the fund. In 2010, Munish Malhotra joined James G. Gendelman as co-manager of the fund.
Columbia Management Investment Advisers, LLC (CMIA) retained MCM to serve as investment subadviser to the Columbia Marsico funds. As an investment subadviser, MCM makes the investment decisions and manages all or a portion of the fund. MCM is an investment adviser registered with the Securities and Exchange Commission. MCM is not affiliated with CMIA.
1The Morgan Stanley Capital International Europe, Australasia, Far East (MSCI EAFE) Index (Net) is a free float- adjusted market capitalization index that is designed to measure the equity market performance of developed markets, excluding the U.S. & Canada. As of May 27, 2010, the MSCI EAFE Index (Net) consisted of the following 22 developed market country indices: Australia, Austria, Belgium, Denmark, Finland, France, Germany, Greece, Hong Kong, Ireland, Israel, Italy, Japan, the Netherlands, New Zealand, Norway, Portugal, Singapore, Spain, Sweden, Switzerland and the United Kingdom.
2Lipper Inc., a widely respected data provider in the industry, calculates an average total return (assuming reinvestment of distributions) for mutual funds with investment objectives similar to those of the fund. Lipper makes no adjustment for the effect of sales loads.
Indices are not available for investment, are not professionally managed and do not reflect sales charges, fees, brokerage commissions, taxes or other expenses of investing. Securities in the fund may not match those in an index.
Performance data quoted represents past performance and current performance may be lower or higher. Past performance is no guarantee of future results. The investment return and principal value will fluctuate so that shares, when redeemed, may be worth more or less than the original cost. Please visit www.columbiamanagement.com for daily and most recent month-end performance updates.
Summary
1-year return as of 02/28/11
| | | | +21.39% | |
|
|  | | | Class A shares
(without sales charge) | |
|
| | | | +20.00% | |
|
|  | | | MSCI EAFE Index (Net) | |
|
| Morningstar Style BoxTM | |
|

The Morningstar Style BoxTM is based on the fund's portfolio holdings. For equity funds, the vertical axis shows the market capitalization of the stocks owned, and the horizontal axis shows investment style (value, blend or growth). Information shown is based on the most recent data provided by Morningstar.
© 2011 Morningstar, Inc. All rights reserved. The Morningstar information contained herein: (1) is proprietary to Morningstar and/or its content providers; (2) may not be copied or distributed; and (3) is not warranted to be accurate, complete or timely. Neither Morningstar nor its content providers are responsible for any damages or losses arising from any use of this information.
1
Economic Update – Columbia Marsico International Opportunities Fund
Summary
For the 12-month period that ended February 28, 2011
g Despite intermittent volatility, stock markets around the world gained ground, as measured by the S&P 500 Index, the MSCI EAFE Index (Net) and the MSCI Emerging Markets Index (Net).
| S&P Index | | MSCI EAFE
Index | |
|
 | |  | |
|
MSCI EM
Index | | | | | |
|
 | | | |
|
As the world shed concerns that key economies might lapse back into recession, the World Bank reported that global gross domestic product rose 3.9% in 2010. The improvement over 2009 was more notable in high-income developed economies than in emerging-market countries, which had less ground to make up. Emerging market countries expanded by an estimated 7%, contributing nearly half of all global growth in 2010. This two-speed global recovery is likely to result in slower growth in 2011, but global growth should remain solid at 3.3% to 3.6%1—higher in emerging market economies, led by China and India.
Robust expansion in the Asia Pacific region
Asian Pacific economies led the global economy in 2010 and are poised to continue in that role. Exports from markets such as Singapore and South Korea have been solid and domestic demand continues to strengthen. Labor markets are healthy, income is rising and confidence runs high across the region. Higher oil prices pose a downside risk to the current expansion, because it could erode demand for Asian exports and increase the risk of inflation. However, if growth exceeds expectations in the United States or Europe, the picture gets even better for Asia.
Austerity measures weigh on Europe
Growth in the developed world was hampered by a debt crisis in Europe's weakest nations. However, the European Union took steps to manage debt restructuring in an orderly fashion and fear subsided—at least, for now. In addition, austerity measures were introduced in Greece, Ireland, Portugal and Spain. Public employment and government spending were cut back sharply. Layoffs and pay cuts have been met with resistance, but their necessity is hard to dispute.
Inflation a growing worry
As demand picked up and commodity prices began to rise across the globe, inflation has become a growing worry in both fast-growing emerging markets and slower-growth developed countries. In developed market economies, inflation is generally an external force, resulting from higher commodity prices, especially for food and energy. In emerging markets, excess demand is driving inflation concerns and policymakers have begun to shift their focus from stimulating growth to taming inflation. However, rising food prices are also a problem in Asia since food accounts for a greater percentage of household budgets than it does in more developed areas of the world.
Stocks stall, then pick up steam
Despite a period of volatility in the summer of 2010, as the world sought to digest a mounting debt crisis within euro-zone countries, it was a good year for stock markets around the world. The U.S. stock market returned 22.57% for the 12-month period, as measured by the S&P 500 Index.2 Outside the U.S., stock market returns were also strong. The MSCI EAFE Index (Net),3 a broad gauge of stock market performance in foreign developed markets, gained 20.00% (in U.S. dollars) for the period. The MSCI Emerging Markets Index (Net)4 returned 20.91% (in U.S. dollars), led by strong performances from European and Eastern European markets. Rising inflation pressures and tighter monetary policy late in the 12-month period tempered returns.
Past performance is no guarantee of future results.
1World Bank estimate, January 12, 2011.
2The Standard & Poor's (S&P) 500 Index tracks the performance of 500 widely held, large-capitalization U.S. stocks.
3The Morgan Stanley Capital International Europe, Australasia, Far East (MSCI EAFE) Index (Net) is a free float adjusted market capitalization index that is designed to measure the equity market performance of developed markets, excluding the U.S. & Canada. As of May 27, 2010, the MSCI EAFE Index (Net) consisted of the following 22 developed market country indices: Australia, Austria, Belgium, Denmark, Finland, France, Germany, Greece, Hong Kong, Ireland, Israel, Italy, Japan, the Netherlands, New Zealand, Norway, Portugal, Singapore, Spain, Sweden, Switzerland and the United Kingdom.
4The Morgan Stanley Capital International Emerging Markets (MSCI EM) Index (Net) is a free float-adjusted market capitalization index that is designed to measure equity market performance of emerging markets. As of May 27, 2010, the MSCI EM Index (Net) consisted of the following 21 emerging market country indices: Brazil, Chile, China, Colombia, Czech Republic, Egypt, Hungary, India, Indonesia, Korea, Malaysia, Mexico, Morocco, Peru, Philippines, Poland, Russia, South Africa, Taiwan, Thailand and Turkey.
Indices are not available for investment, are not professionally managed and do not reflect sales charges, fees, brokerage commissions, taxes or other expenses of investing. Securities in the fund may not match those in an index.
2
Performance Information – Columbia Marsico International Opportunities Fund
Performance of a $10,000 investment 03/01/01 – 02/28/11
The chart above shows the change in value of a hypothetical $10,000 investment in Class A shares of Columbia Marsico International Opportunities Fund during the stated time period, and does not reflect the deduction of taxes that a shareholder may pay on fund distributions or on the redemption of fund shares.
Performance of a $10,000 investment 03/01/01 – 02/28/11 ($)
| Sales charge: | | without | | with | |
| Class A | | | 19,374 | | | | 18,253 | | |
| Class B | | | 17,975 | | | | 17,975 | | |
| Class C | | | 17,975 | | | | 17,975 | | |
| Class I | | | n/a | | | | n/a | | |
| Class R | | | 19,139 | | | | n/a | | |
| Class Z | | | 19,858 | | | | n/a | | |
Performance data quoted represents past performance and current performance may be lower or higher. Past performance is no guarantee of future results. The investment return and principal value will fluctuate so that shares, when redeemed, may be worth more or less than the original cost. Please visit www.columbiamanagement.com for daily and most recent month-end performance updates.
Average annual total return as of 02/28/11 (%)
| Share class | | A | | B | | C | | I | | R | | Z | |
| Inception | | 08/01/00 | | 08/01/00 | | 08/01/00 | | 09/27/10 | | 01/23/06 | | 08/01/00 | |
| Sales charge | | without | | with | | without | | with | | without | | with | | without | | without | | without | |
| 1-year | | | 21.39 | | | | 14.41 | | | | 20.50 | | | | 15.50 | | | | 20.60 | | | | 19.60 | | | | n/a | | | | 21.08 | | | | 21.75 | | |
| 5-year | | | 1.71 | | | | 0.51 | | | | 0.95 | | | | 0.63 | | | | 0.95 | | | | 0.95 | | | | n/a | | | | 1.46 | | | | 1.96 | | |
| 10-year/Life | | | 6.84 | | | | 6.20 | | | | 6.04 | | | | 6.04 | | | | 6.04 | | | | 6.04 | | | | 10.44 | | | | 6.71 | | | | 7.10 | | |
The "with sales charge" returns include the maximum initial sales charge of 5.75% for Class A shares and the applicable contingent deferred sales charge of 5.00% in the first year, declining to 1.00% in the sixth year and eliminated thereafter for Class B shares and 1.00% for Class C shares for the first year only. The "without sales charge" returns do not include the effect of sales charges. If they had, returns would be lower.
Performance results reflect any fee waivers or reimbursements of fund expenses by the Investment Manager and/or any of its affiliates. Absent these fee waivers or expense reimbursement arrangements, performance results would have been lower.
All results shown assume reinvestment of distributions. Class I and Class Z shares are sold at net asset value with no distribution and service (Rule 12b-1) fees. Class R shares are sold at net asset value with a distribution (Rule 12b-1) fee. Class I, Class R and Class Z shares have limited eligibility and the investment minimum requirements may vary. Please see the fund's prospectus for details. Performance for different share classes will vary based on differences in sales charges and fees associated with each class.
Class I shares were initially offered on September 27, 2010.
The tables do not reflect the deduction of taxes that a shareholder may pay on fund distributions or on the redemption of fund shares.
The returns for Class R shares include the returns for Class A shares prior to January 23, 2006, the date on which Class R shares were initially offered by the fund. If differences in expenses had been reflected, the returns would have been lower, since Class R shares are subject to a higher Rule 12b-1 fee.
3
Understanding Your Expenses – Columbia Marsico International Opportunities Fund
Estimating your actual expenses
To estimate the expenses that you paid over the period, first you will need your account balance at the end of the period:
g For shareholders who receive their account statements from Columbia Management Investment Services Corp., your account balance is available online at www.columbiamanagement.com or by calling Shareholder Services at 800.345.6611.
g For shareholders who receive their account statements from their financial intermediary, contact your financial intermediary to obtain your account balance.
1. Divide your ending account balance by $1,000. For example, if an account balance was $8,600 at the end of the period, the result would be 8.6.
2. In the section of the table below titled "Expenses paid during the period," locate the amount for your share class. You will find this number in the column labeled "Actual." Multiply this number by the result from step 1. Your answer is an estimate of the expenses you paid on your account during the period.
If the value of your account falls below the minimum initial investment requirement applicable to you, your account may be subject to a $20 annual fee. This fee is not included in the accompanying table. If you are subject to the fee, keep it in mind when you are estimating the ongoing expenses of investing in the fund and when comparing the expenses of this fund with other funds.
As a fund shareholder, you incur two types of costs. There are transaction costs, which generally include sales charges on purchases and may include redemption fees or exchange fees. There are also ongoing costs, which generally include investment advisory fees, distribution and service (Rule 12b-1) fees and other fund expenses. The information on this page is intended to help you understand the ongoing costs of investing in the fund and to compare these costs with the ongoing costs of investing in other mutual funds.
Analyzing your fund's expenses by share class
To illustrate these ongoing costs, we have provided an example and calculated the expenses paid by investors in each share class during the period. The information in the following table is based on an initial investment of $1,000, which is invested at the beginning of the period and held for the entire period. Expense information is calculated two ways and each method provides you with different information. The amount listed in the "Actual" column is calculated using the fund's actual operating expenses and total return for the period. The amount listed in the "Hypothetical" column for each share class assumes that the return each year is 5% before expenses and is calculated based on the fund's actual operating expenses. You should not use the hypothetical account values and expenses to estimate either your actual account balance at the end of the period or the expenses you paid during this period.
Compare with other funds
Since all mutual funds are required to include the same hypothetical calculations about expenses in shareholder reports, you can use this information to compare the ongoing cost of investing in the fund with other funds. To do so, compare the 5% hypothetical example with the 5% hypothetical examples that appear in the shareholder reports of other funds. As you compare hypothetical examples of other funds, it is important to note that hypothetical examples are meant to highlight the ongoing costs of investing in a fund and do not reflect any transaction costs, such as sales charges, redemption fees or exchange fees.
09/01/10 – 02/28/11
| | | Account value at the
beginning of the period ($) | | Account value at the
end of the period ($) | | Expenses paid
during the period ($) | | Fund's annualized
expense ratio (%) | |
| | | Actual | | Hypothetical | | Actual | | Hypothetical | | Actual | | Hypothetical | | Actual | |
| Class A | | | 1,000.00 | | | | 1,000.00 | | | | 1,227.40 | | | | 1,017.01 | | | | 8.67 | | | | 7.85 | | | | 1.57 | | |
| Class B | | | 1,000.00 | | | | 1,000.00 | | | | 1,223.00 | | | | 1,013.29 | | | | 12.79 | | | | 11.58 | | | | 2.32 | | |
| Class C | | | 1,000.00 | | | | 1,000.00 | | | | 1,222.80 | | | | 1,013.29 | | | | 12.79 | | | | 11.58 | | | | 2.32 | | |
| Class I | | | 1,000.00 | | | | 1,000.00 | | | | 1,014.20 | * | | | 1,019.34 | | | | 4.67 | * | | | 5.51 | | | | 1.10 | | |
| Class R | | | 1,000.00 | | | | 1,000.00 | | | | 1,225.50 | | | | 1,015.77 | | | | 10.04 | | | | 9.10 | | | | 1.82 | | |
| Class Z | | | 1,000.00 | | | | 1,000.00 | | | | 1,229.10 | | | | 1,018.25 | | | | 7.30 | | | | 6.61 | | | | 1.32 | | |
Expenses paid during the period are equal to the annualized expense ratio for the share class, multiplied by the average account value over the period, then multiplied by the number of days in the fund's most recent fiscal half-year and divided by 365.
It is important to note that the expense amounts shown in the table are meant to highlight only ongoing costs of investing in the fund and do not reflect any transaction costs, such as sales charges, redemption fees or exchange fees. Therefore, the hypothetical examples provided may not help you determine the relative total costs of owning shares of different funds. If these transaction costs were included, your costs would have been higher.
*For the period September 27, 2010 through February 28, 2011. Class I shares commenced operations on September 27, 2010.
4
Portfolio Managers' Report – Columbia Marsico International Opportunities Fund
For the 12-month period that ended February 28, 2011, the fund's Class A shares returned 21.39% without sales charge. The fund's benchmark, the MSCI EAFE Index (Net), returned 20.00%. The average return of the funds in its peer group, the Lipper International Large-Cap Growth Funds Classification, was 21.72%. Strong stock selection plus an overweight in the consumer discretionary sector aided results. Stock selection and the impact of currency fluctuations resulted in disappointments in the financials sector.
Stock selection mostly strong
The fund had more exposure than the index to the consumer discretionary sector, which aided performance against that measure. Stock selection was also strong. Retail and apparel holdings performed well, including Swiss watch manufacturer Swatch (3.0% of net assets), fashion clothing manufacturer Inditex (2.4% of net assets), Japanese Internet retailer DeNA (1.2% of net assets) and Hong Kong-based manufacturer, exporter and distributor of retail goods Li & Fung (3.4% of net assets). Brazilian real estate developer PDG Realty SA Empreendimentos e Participacoes also appreciated strongly before being sold from the portfolio.
Stock selection in the information technology, materials and industrials sectors also contributed positively to results. Strong technology performers included Taiwan-based wireless handheld device firm HTC (sold from the fund) and Chinese Internet search company Baidu (1.0% of net assets). In materials, BASF (3.3% of net assets), a German chemicals company, and Teck Resources (1.2% of net assets), a Canadian mining firm, posted strong gains. In industrials, French electrical distribution and equipment firm Schneider Electric (2.7% of net assets) appreciated strongly.
In health care, Novo-Nordisk (2.6% of net assets), based in Denmark, had a positive impact on the fund's return. The company recorded solid results from robust sales of its diabetes treatment products. The fund had less exposure than the index to utilities, which aided its return because utilities was among the benchmark's weakest-performing sectors.
Currency impact, stock-specific disappointments
Active currency management is not a central facet of the fund's investment process, but fluctuations in major world currencies can affect performance. During this 12-month period, the fund had little exposure to companies that trade in the Japanese yen and the Australian dollar, both of which appreciated substantially compared to the U.S. dollar and many other major world currencies. This positioning detracted from the fund's returns relative to the index. Stock selection in the financials sector was disappointing. Spain-based Banco Bilbao Vizcaya Argentaria (1.0% of net assets) struggled due to funding cost pressure in Spain. Japanese bank Mizuho Financial Group and France-based global insurer AXA lost ground and were sold.
An underweight in the telecommunications sector, which was a relatively strong performer, detracted from the fund's relative performance. In addition, wireless communications firm Research in Motion declined sharply on disappointing sales results in North American markets. We sold the stock.
Portfolio changes
We increased the fund's stakes in the consumer discretionary and industrials sectors during the period, while decreasing allocations to health care and information technology. Consumer
Performance data quoted represents past performance and current performance may be lower or higher. Past performance is no guarantee of future results. The investment return and principal value will fluctuate so that shares, when redeemed, may be worth more or less than the original cost. Please visit www.columbiamanagement.com for daily and most recent month-end performance updates.
Net asset value per share
as of 02/28/11 ($)
| Class A | | | 11.96 | | |
| Class B | | | 11.35 | | |
| Class C | | | 11.36 | | |
| Class I | | | 12.14 | | |
| Class R | | | 11.94 | | |
| Class Z | | | 12.15 | | |
Distributions declared per share
03/01/10 – 02/28/11 ($)
| Class A | | | 0.17 | | |
| Class B | | | 0.11 | | |
| Class C | | | 0.11 | | |
| Class I | | | 0.20 | | |
| Class R | | | 0.15 | | |
| Class Z | | | 0.20 | | |
5
Portfolio Managers' Report (continued) – Columbia Marsico International Opportunities Fund
Top 5 sectors
as of 02/28/11 (%)
| Consumer Discretionary | | | 21.5 | | |
| Financials | | | 18.2 | | |
| Industrials | | | 17.8 | | |
| Consumer Staples | | | 10.5 | | |
| Materials | | | 10.5 | | |
Top 10 holdings
as of 02/28/11 (%)
| OGX Petroleo e Gas Participacoes | | | 4.4 | | |
| Li & Fung | | | 3.4 | | |
| BASF SE | | | 3.3 | | |
| Swatch Group | | | 3.0 | | |
| Schneider Electric | | | 2.7 | | |
| Nestle | | | 2.7 | | |
| Anheuser-Busch InBev | | | 2.6 | | |
| Novo-Nordisk | | | 2.6 | | |
| Canadian National Railway | | | 2.6 | | |
| Honda Motors | | | 2.5 | | |
The fund is actively managed and the composition of its portfolio will change over time. Information provided is calculated as a percentage of net assets.
discretionary and industrials remain two of the fund's primary sector allocations, along with financials, consumer staples and materials. The fund has little to no exposure to utilities. The most significant country allocations were to Japan, the United Kingdom, France, Germany, Switzerland and Brazil. However, the fund's exposure to both Japan and the United Kingdom are significantly lighter than the benchmark MSCI EAFE Index (Net).
Source for all statistical data—Columbia Management Investment Advisers, LLC.
Source for all stock-specific commentary—Marsico Capital Management, LLC.
Portfolio characteristics and holdings are subject to change periodically and may not be representative of current characteristics and holdings. The outlook for the fund may differ from those presented for other Columbia Funds.
Equity investments are affected by stock market fluctuations that occur in response to economic and business developments.
International investing may involve certain risks, including currency fluctuations, risks associated with possible differences in financial accounting standards and other monetary and political risks. Significant levels of foreign taxes, including potentially confiscatory levels of taxation and withholding taxes, may also apply to some foreign investments.
Investing in emerging markets may involve greater risks than investing in more developed countries. In addition, concentration of investments in a single region may result in greater volatility.
6
Investment Portfolio – Columbia Marsico International Opportunities Fund
February 28, 2011
| Common Stocks – 97.4% | |
| | | Shares | | Value ($) | |
| Consumer Discretionary – 21.5% | |
| Automobiles – 2.5% | |
| Honda Motor Co., Ltd. | | | 674,300 | | | | 29,427,919 | | |
| Automobiles Total | | | 29,427,919 | | |
| Distributors – 3.4% | |
| Li & Fung Ltd. | | | 6,678,000 | | | | 40,630,206 | | |
| Distributors Total | | | 40,630,206 | | |
| Diversified Consumer Services – 0.7% | |
Anhanguera Educacional
Participacoes SA | | | 348,600 | | | | 7,794,158 | | |
| Diversified Consumer Services Total | | | 7,794,158 | | |
| Hotels, Restaurants & Leisure – 1.6% | |
| Accor SA | | | 395,673 | | | | 18,605,254 | | |
| Hotels, Restaurants & Leisure Total | | | 18,605,254 | | |
| Internet & Catalog Retail – 1.2% | |
| DeNA Co., Ltd. | | | 372,600 | | | | 14,461,249 | | |
| Internet & Catalog Retail Total | | | 14,461,249 | | |
| Media – 3.5% | |
| Naspers Ltd., Class N | | | 391,976 | | | | 22,516,453 | | |
| Publicis Groupe SA | | | 338,596 | | | | 19,313,593 | | |
| Media Total | | | 41,830,046 | | |
| Specialty Retail – 3.4% | |
| Inditex SA | | | 397,679 | | | | 28,788,846 | | |
| Yamada Denki Co., Ltd. | | | 154,440 | | | | 11,797,457 | | |
| Specialty Retail Total | | | 40,586,303 | | |
| Textiles, Apparel & Luxury Goods – 5.2% | |
| Adidas AG | | | 208,681 | | | | 13,390,573 | | |
| Pandora A/S (a) | | | 212,919 | | | | 12,413,379 | | |
| Swatch Group AG | | | 81,995 | | | | 34,903,695 | | |
| Textiles, Apparel & Luxury Goods Total | | | 60,707,647 | | |
| Consumer Discretionary Total | | | 254,042,782 | | |
| Consumer Staples – 10.5% | |
| Beverages – 3.7% | |
| Anheuser-Busch InBev NV | | | 556,016 | | | | 31,009,387 | | |
| Pernod-Ricard SA | | | 132,414 | | | | 12,207,836 | | |
| Beverages Total | | | 43,217,223 | | |
| Food & Staples Retailing – 3.1% | |
| FamilyMart Co., Ltd. | | | 407,000 | | | | 15,414,388 | | |
| Tesco PLC | | | 3,186,583 | | | | 20,938,631 | | |
| Food & Staples Retailing Total | | | 36,353,019 | | |
| | | Shares | | Value ($) | |
| Food Products – 2.6% | |
| Nestle SA, Registered Shares | | | 552,640 | | | | 31,287,121 | | |
| Food Products Total | | | 31,287,121 | | |
| Household Products – 1.1% | |
| Reckitt Benckiser Group PLC | | | 254,898 | | | | 13,135,676 | | |
| Household Products Total | | | 13,135,676 | | |
| Consumer Staples Total | | | 123,993,039 | | |
| Energy – 7.0% | |
| Oil, Gas & Consumable Fuels – 7.0% | |
| CNOOC Ltd. | | | 5,507,300 | | | | 12,559,959 | | |
OGX Petroleo e Gas
Participacoes SA (a) | | | 4,395,500 | | | | 51,383,865 | | |
| Tullow Oil PLC | | | 784,803 | | | | 18,320,690 | | |
| Oil, Gas & Consumable Fuels Total | | | 82,264,514 | | |
| Energy Total | | | 82,264,514 | | |
| Financials – 18.2% | |
| Capital Markets – 1.6% | |
| Julius Baer Group Ltd. | | | 416,275 | | | | 18,660,913 | | |
| Capital Markets Total | | | 18,660,913 | | |
| Commercial Banks – 9.1% | |
Banco Bilbao Vizcaya
Argentaria SA | | | 932,754 | | | | 11,514,878 | | |
| Barclays PLC | | | 5,400,737 | | | | 28,081,876 | | |
| BNP Paribas | | | 204,975 | | | | 16,003,949 | | |
| HSBC Holdings PLC | | | 625,065 | | | | 6,889,403 | | |
| ICICI Bank Ltd., ADR | | | 548,542 | | | | 23,784,781 | | |
| Standard Chartered PLC | | | 775,038 | | | | 20,499,218 | | |
| Commercial Banks Total | | | 106,774,105 | | |
| Diversified Financial Services – 3.2% | |
| Citigroup, Inc. (a) | | | 6,230,117 | | | | 29,156,947 | | |
| Criteria Caixacorp SA | | | 1,270,423 | | | | 9,195,115 | | |
| Diversified Financial Services Total | | | 38,352,062 | | |
| Real Estate Management & Development – 4.3% | |
| BR Malls Participacoes SA | | | 2,521,400 | | | | 24,019,828 | | |
| Hang Lung Properties Ltd. | | | 3,353,000 | | | | 14,364,516 | | |
Sumitomo Realty &
Development Co., Ltd. | | | 445,000 | | | | 12,000,931 | | |
| Real Estate Management & Development Total | | | 50,385,275 | | |
| Financials Total | | | 214,172,355 | | |
See Accompanying Notes to Financial Statements.
7
Columbia Marsico International Opportunities Fund
February 28, 2011
| Common Stocks (continued) | |
| | | Shares | | Value ($) | |
| Health Care – 2.6% | |
| Pharmaceuticals – 2.6% | |
| Novo-Nordisk A/S, Class B | | | 244,055 | | | | 30,738,373 | | |
| Pharmaceuticals Total | | | 30,738,373 | | |
| Health Care Total | | | 30,738,373 | | |
| Industrials – 17.8% | |
| Aerospace & Defense – 1.1% | |
| Rolls-Royce Group PLC (a) | | | 1,331,571 | | | | 13,355,995 | | |
| Aerospace & Defense Total | | | 13,355,995 | | |
| Building Products – 1.7% | |
| Assa Abloy AB, Class B | | | 445,075 | | | | 12,459,233 | | |
| Daikin Industries Ltd. | | | 218,324 | | | | 7,412,740 | | |
| Building Products Total | | | 19,871,973 | | |
| Electrical Equipment – 4.4% | |
| Schneider Electric SA | | | 192,638 | | | | 31,873,111 | | |
Sensata Technologies
Holding N.V. (a) | | | 588,413 | | | | 19,476,470 | | |
| Electrical Equipment Total | | | 51,349,581 | | |
| Industrial Conglomerates – 2.0% | |
| Siemens AG, Registered Shares | | | 179,567 | | | | 24,182,164 | | |
| Industrial Conglomerates Total | | | 24,182,164 | | |
| Machinery – 4.1% | |
| FANUC Ltd. | | | 122,600 | | | | 19,151,240 | | |
| Komatsu Ltd. | | | 950,500 | | | | 29,160,070 | | |
| Machinery Total | | | 48,311,310 | | |
| Road & Rail – 2.6% | |
| Canadian National Railway Co. | | | 417,229 | | | | 30,570,369 | | |
| Road & Rail Total | | | 30,570,369 | | |
| Trading Companies & Distributors – 1.9% | |
| Marubeni Corp. | | | 2,911,000 | | | | 22,343,495 | | |
| Trading Companies & Distributors Total | | | 22,343,495 | | |
| Industrials Total | | | 209,984,887 | | |
| Information Technology – 7.8% | |
| Internet Software & Services – 3.4% | |
| Baidu, Inc., ADR (a) | | | 93,600 | | | | 11,340,576 | | |
| MercadoLibre, Inc. (a) | | | 192,130 | | | | 12,638,311 | | |
| Sina Corp. (a) | | | 194,446 | | | | 15,880,405 | | |
| Internet Software & Services Total | | | 39,859,292 | | |
| | | Shares | | Value ($) | |
| Office Electronics – 1.5% | |
| Canon, Inc. | | | 359,600 | | | | 17,390,036 | | |
| Office Electronics Total | | | 17,390,036 | | |
| Semiconductors & Semiconductor Equipment – 2.9% | |
| ARM Holdings PLC | | | 1,387,395 | | | | 13,915,923 | | |
| ASML Holding NV | | | 471,520 | | | | 20,466,950 | | |
Semiconductors & Semiconductor
Equipment Total | | | 34,382,873 | | |
| Information Technology Total | | | 91,632,201 | | |
| Materials – 10.5% | |
| Chemicals – 6.1% | |
| BASF SE | | | 463,819 | | | | 38,569,230 | | |
LyondellBasell Industries NV,
Class A (a) | | | 573,435 | | | | 21,836,405 | | |
| Novozymes A/S, Class B | | | 77,916 | | | | 10,894,973 | | |
| Chemicals Total | | | 71,300,608 | | |
| Metals & Mining – 4.4% | |
| Teck Resources Ltd., Class B | | | 252,073 | | | | 13,945,678 | | |
| ThyssenKrupp AG | | | 493,727 | | | | 20,528,127 | | |
| Xstrata PLC | | | 767,829 | | | | 17,537,496 | | |
| Metals & Mining Total | | | 52,011,301 | | |
| Materials Total | | | 123,311,909 | | |
| Telecommunication Services – 1.5% | |
| Wireless Telecommunication Services – 1.5% | |
| Millicom International Cellular SA | | | 205,243 | | | | 17,979,286 | | |
| Wireless Telecommunication Services Total | | | 17,979,286 | | |
| Telecommunication Services Total | | | 17,979,286 | | |
Total Common Stocks
(cost of $893,231,941) | | | 1,148,119,346 | | |
See Accompanying Notes to Financial Statements.
8
Columbia Marsico International Opportunities Fund
February 28, 2011
| Short-Term Obligation – 2.4% | |
| | | Par ($) | | Value ($) | |
Repurchase agreement with Fixed
Income Clearing Corp.,
dated 02/28/11, due 03/01/11
at 0.090%, collateralized by
U.S. Government Agency
obligations with various
maturities to 04/15/14, market
value $28,918,281 (repurchase
proceeds $28,348,071) | | | 28,348,000 | | | | 28,348,000 | | |
Total Short-Term Obligation
(cost of $28,348,000) | | | 28,348,000 | | |
Total Investments – 99.8%
(cost of $921,579,941) (b) | | | 1,176,467,346 | | |
| Other Assets & Liabilities, Net – 0.2% | | | 2,889,448 | | |
| Net Assets – 100.0% | | | 1,179,356,794 | | |
Notes to Investment Portfolio:
(a) Non-income producing security.
(b) Cost for federal income tax purposes is $943,520,113.
Generally accepted accounting principles (GAAP) require disclosure regarding the inputs and valuation techniques used to measure fair value and any changes in valuation inputs or techniques. In addition, investments shall be disclosed by major category.
The Fund categorizes its fair value measurements according to a three-level hierarchy that maximizes the use of observable inputs and minimizes the use of unobservable inputs by prioritizing that the most observable input be used when available. Observable inputs are those that market participants would use in pricing an investment based on market data obtained from sources independent of the reporting entity. Unobservable inputs are those that reflect the Fund's assumptions about the information market participants would use in pricing an investment. An investment's level within the fair value hierarchy is based on the lowest level of any input that is deemed significant to the asset or liability's fair value measurement. The input levels are not necessarily an indication of the risk or liquidity associated with investments at that level. For example, certain U.S. government securities are generally high quality and liquid, however, they are reflected as Level 2 because the inputs used to determine fair value may not always be quoted prices in an active market.
Fair value inputs are summarized in the three broad levels listed below:
• Level 1—Valuations based on quoted prices for investments in active markets that the Fund has the ability to access at the measurement date (including NAV for open-end mutual funds). Valuation adjustments are not applied to Level 1 investments.
• Level 2—Valuations based on other significant observable inputs (including quoted prices for similar securities, interest rates, prepayment speeds, credit risks, etc.).
• Level 3—Valuations based on significant unobservable inputs (including the Fund's own assumptions and judgment in determining the fair value of investments).
Inputs that are used in determining fair value of an investment may include price information, credit data, volatility statistics, and other factors. These inputs can be either observable or unobservable. The availability of observable inputs can vary between investments, and is affected by various factors such as the type of investment, and the volume and level of activity for that investment or similar investments in the marketplace. The inputs will be considered by the Investment Manager, along with any other relevant factors in the calculation of an investment's fair value. The Fund uses prices and inputs that are current as of the measurement date, which may include periods of market dislocations. During these periods, the availability of prices and inputs may be reduced for many investments. This condition could cause an investment to be reclassified between the various levels within the hierarchy. Non-U.S. equity securities actively traded in foreign markets may be reflected in Level 2 despite the availability of closing prices, because the Fund evaluates and determines whether those closing prices reflect fair value at the close of the New York Stock Exchange (NYSE) or require adjustment, as described in Note 2 to the financial statements—Security Valuation.
Investments falling into the Level 3 category are primarily supported by quoted prices from brokers and dealers participating in the market for those investments. However, these may be classified as Level 3 investments due to lack of market transparency and corroboration to support these quoted prices. Additionally, valuation models may be used as the pricing source for any remaining investments classified as Level 3. These models rely on one or more significant unobservable inputs and/or significant assumptions by the Investment Manager. Inputs used in valuations may include, but are not limited to, financial statement analysis, capital account balances, discount rates and estimated cash flows, and comparable company data.
The following table is a summary of the inputs used to value the Fund's investments as of February 28, 2011:
| Description | | Quoted
Prices
(Level 1) | | Other
Significant
Observable
Inputs
(Level 2) | | Significant
Unobservable
Inputs
(Level 3) | | Total | |
| Common Stocks | |
Consumer
Discretionary | | $ | 7,794,158 | | | $ | 246,248,624 | | | $ | — | | | $ | 254,042,782 | | |
| Consumer Staples | | | — | | | | 123,993,039 | | | | — | | | | 123,993,039 | | |
| Energy | | | 51,383,865 | | | | 30,880,649 | | | | — | | | | 82,264,514 | | |
| Financials | | | 76,961,556 | | | | 137,210,799 | | | | — | | | | 214,172,355 | | |
| Health Care | | | — | | | | 30,738,373 | | | | — | | | | 30,738,373 | | |
| Industrials | | | 50,046,839 | | | | 159,938,048 | | | | — | | | | 209,984,887 | | |
Information
Technology | | | 39,859,292 | | | | 51,772,909 | | | | — | | | | 91,632,201 | | |
| Materials | | | 35,782,083 | | | | 87,529,826 | | | | — | | | | 123,311,909 | | |
Telecommunication
Services | | | 17,979,286 | | | | — | | | | — | | | | 17,979,286 | | |
| Total Common Stocks | | | 279,807,079 | | | | 868,312,267 | | | | — | | | | 1,148,119,346 | | |
Total Short-Term
Obligation | | | — | | | | 28,348,000 | | | | — | | | | 28,348,000 | | |
| Total Investments | | $ | 279,807,079 | | | $ | 896,660,267 | | | $ | — | | | $ | 1,176,467,346 | | |
The Fund's assets assigned to the Level 2 input category are generally valued using the market approach, in which a security's value is determined through reference to prices and information from market transactions for similar or identical assets. These assets include certain foreign securities for which a third party statistical pricing service may be employed for purposes of fair market valuation. The models utilized by the third party statistical pricing service take into account a security's correlation to available market data including, but not limited to, intraday index, ADR, and ETF movements.
Certain short-term obligations may be valued using amortized cost, an income approach which converts future cash flows to a present value based upon the discount or premium at purchase.
There were no significant transfers of financial assets between Levels 1 and 2 during the period.
See Accompanying Notes to Financial Statements.
9
Columbia Marsico International Opportunities Fund
February 28, 2011
The Fund was invested in the following countries at February 28, 2011:
Summary of Securities
By Country (Unaudited) | | Value | | % of Total
Investments | |
| Japan | | $ | 178,559,526 | | | | 15.2 | | |
| United Kingdom | | | 152,674,908 | | | | 13.0 | | |
| France | | | 98,003,743 | | | | 8.3 | | |
| Germany | | | 96,670,095 | | | | 8.2 | | |
| Switzerland | | | 84,851,728 | | | | 7.2 | | |
| Brazil | | | 83,197,851 | | | | 7.1 | | |
| Hong Kong | | | 67,554,681 | | | | 5.7 | | |
| Netherlands | | | 61,779,825 | | | | 5.3 | | |
| United States* | | | 57,504,947 | | | | 4.9 | | |
| Denmark | | | 54,046,724 | | | | 4.6 | | |
| Spain | | | 49,498,838 | | | | 4.2 | | |
| Canada | | | 44,516,047 | | | | 3.8 | | |
| Belgium | | | 31,009,387 | | | | 2.6 | | |
| China | | | 27,220,981 | | | | 2.3 | | |
| India | | | 23,784,781 | | | | 2.0 | | |
| South Africa | | | 22,516,453 | | | | 1.9 | | |
| Luxembourg | | | 17,979,287 | | | | 1.5 | | |
| Argentina | | | 12,638,311 | | | | 1.1 | | |
| Sweden | | | 12,459,233 | | | | 1.1 | | |
| | | $ | 1,176,467,346 | | | | 100.0 | | |
* Includes short-term obligation.
Certain securities are listed by country of underlying exposure but may trade predominantly on another exchange.
| Acronym | | Name | |
| ADR | | American Depositary Receipt | |
|
See Accompanying Notes to Financial Statements.
10
Statement of Assets and Liabilities – Columbia Marsico International Opportunities Fund
February 28, 2011
| | | | | ($) | |
| Assets | | Investments, at identified cost | | | 921,579,941 | | |
| | | Investments, at value | | | 1,176,467,346 | | |
| | | Cash | | | 444 | | |
| | | Foreign currency (cost of $174,406) | | | 174,573 | | |
| | | Receivable for: | | | | | |
| | | Investments sold | | | 13,074,239 | | |
| | | Fund shares sold | | | 484,280 | | |
| | | Dividends | | | 1,056,556 | | |
| | | Interest | | | 71 | | |
| | | Foreign tax reclaims | | | 1,054,638 | | |
| | | Prepaid expenses | | | 3,988 | | |
| | | Total Assets | | | 1,192,316,135 | | |
| Liabilities | | Payable for: | | | | | |
| | | Investments purchased | | | 8,359,594 | | |
| | | Fund shares repurchased | | | 2,868,252 | | |
| | | Investment advisory fee | | | 729,125 | | |
| | | Administration fee | | | 188,901 | | |
| | | Pricing and bookkeeping fees | | | 13,547 | | |
| | | Transfer agent fee | | | 272,872 | | |
| | | Trustees' fees | | | 53,710 | | |
| | | Custody fee | | | 171,541 | | |
| | | Distribution and service fees | | | 71,139 | | |
| | | Chief compliance officer expenses | | | 334 | | |
| | | Other liabilities | | | 230,326 | | |
| | | Total Liabilities | | | 12,959,341 | | |
| | | Net Assets | | | 1,179,356,794 | | |
| Net Assets Consist of | | Paid-in capital | | | 1,719,107,835 | | |
| | | Overdistributed net investment income | | | (17,430,894 | ) | |
| | | Accumulated net realized loss | | | (777,338,927 | ) | |
| | | Net unrealized appreciation (depreciation) on: | | | | | |
| | | Investments | | | 254,887,405 | | |
| | | Foreign currency translations | | | 131,375 | | |
| | | Net Assets | | | 1,179,356,794 | | |
See Accompanying Notes to Financial Statements.
11
Statement of Assets and Liabilities (continued) – Columbia Marsico International Opportunities Fund
February 28, 2011
| Class A | | Net assets | | $ | 141,820,644 | | |
| | | Shares outstanding | | | 11,857,015 | | |
| | | Net asset value per share | | $ | 11.96 | (a) | |
| | | Maximum sales charge | | | 5.75 | % | |
| | | Maximum offering price per share ($11.96/0.9425) | | $ | 12.69 | (b) | |
| Class B | | Net assets | | $ | 14,861,617 | | |
| | | Shares outstanding | | | 1,309,828 | | |
| | | Net asset value and offering price per share | | $ | 11.35 | (a) | |
| Class C | | Net assets | | $ | 39,788,924 | | |
| | | Shares outstanding | | | 3,503,777 | | |
| | | Net asset value and offering price per share | | $ | 11.36 | (a) | |
| Class I (c) | | Net assets | | $ | 34,071,799 | | |
| | | Shares outstanding | | | 2,805,795 | | |
| | | Net asset value, offering and redemption price per share | | $ | 12.14 | | |
| Class R | | Net assets | | $ | 3,020,449 | | |
| | | Shares outstanding | | | 252,973 | | |
| | | Net asset value, offering and redemption price per share | | $ | 11.94 | | |
| Class Z | | Net assets | | $ | 945,793,361 | | |
| | | Shares outstanding | | | 77,853,854 | | |
| | | Net asset value, offering and redemption price per share | | $ | 12.15 | | |
(a) Redemption price per share is equal to net asset value less any applicable contingent deferred sales charge.
(b) On sales of $50,000 or more the offering price is reduced.
(c) Class I shares commenced operations on September 27, 2010.
See Accompanying Notes to Financial Statements.
12
Statement of Operations – Columbia Marsico International Opportunities Fund
For the Year Ended February 28, 2011
| | | | | ($) | |
| Investment Income | | Dividends | | | 25,269,910 | | |
| | | Interest | | | 36,203 | | |
| | | Foreign taxes withheld | | | (2,710,219 | ) | |
| | | Total Investment Income | | | 22,595,894 | | |
| Expenses | | Investment advisory fee | | | 9,361,149 | | |
| | | Administration fee | | | 2,434,316 | | |
| | | Distribution fee: | | | | | |
| | | Class B | | | 119,066 | | |
| | | Class C | | | 308,637 | | |
| | | Class R | | | 17,020 | | |
| | | Service fee: | | | | | |
| | | Class B | | | 39,689 | | |
| | | Class C | | | 102,879 | | |
| | | Distribution and service fees—Class A | | | 374,083 | | |
| | | Transfer agent fee—Class A, Class B, Class C, Class R, and Class Z | | | 1,694,007 | | |
| | | Pricing and bookkeeping fees | | | 151,885 | | |
| | | Trustees' fees | | | 41,298 | | |
| | | Custody fee | | | 665,500 | | |
| | | Chief compliance officer expenses | | | 2,072 | | |
| | | Other expenses | | | 418,207 | | |
| | | Expenses before interest expense | | | 15,729,808 | | |
| | | Interest expense | | | 41 | | |
| | | Total Expenses | | | 15,729,849 | | |
| | | Expense reductions | | | (141 | ) | |
| | | Net Expenses | | | 15,729,708 | | |
| | | Net Investment Income | | | 6,866,186 | | |
| Net Realized and Unrealized Gain (Loss) on Investments and Foreign Currency | | Net realized gain (loss) on: | | | | | |
| | | Investments | | | 110,012,204 | | |
| | | Foreign currency transactions | | | (1,816,940 | ) | |
| | | Net realized gain | | | 108,195,264 | | |
| | | Net change in unrealized appreciation (depreciation) on: | | | | | |
| | | Investments | | | 111,641,329 | | |
| | | Foreign currency translations | | | 192,642 | | |
| | | Net change in unrealized appreciation (depreciation) | | | 111,833,971 | | |
| | | Net Gain | | | 220,029,235 | | |
| | | Net Increase Resulting from Operations | | | 226,895,421 | | |
See Accompanying Notes to Financial Statements.
13
Statement of Changes in Net Assets – Columbia Marsico International Opportunities Fund
| | | | | Year Ended February 28, | |
| Increase (Decrease) in Net Assets | | | | 2011 ($) (a)(b) | | 2010 ($) | |
| Operations | | Net investment income | | | 6,866,186 | | | | 7,409,782 | | |
| | | Net realized gain (loss) on investments and foreign
currency transactions | | | 108,195,264 | | | | (58,616,460 | ) | |
| | | Net change in unrealized appreciation (depreciation)
on investments and foreign currency translations | | | 111,833,971 | | | | 571,967,695 | | |
| | | Net increase resulting from operations | | | 226,895,421 | | | | 520,761,017 | | |
| Distributions to Shareholders | | From net investment income: | | | | | | | | | |
| | | Class A | | | (2,126,667 | ) | | | (5,996,940 | ) | |
| | | Class B | | | (145,433 | ) | | | (227,998 | ) | |
| | | Class C | | | (384,816 | ) | | | (570,820 | ) | |
| | | Class I | | | (45 | ) | | | — | | |
| | | Class R | | | (47,942 | ) | | | (64,392 | ) | |
| | | Class Z | | | (16,573,174 | ) | | | (30,799,010 | ) | |
| | | Total distributions to shareholders | | | (19,278,077 | ) | | | (37,659,160 | ) | |
| | | Net Capital Stock Transactions | | | (231,232,918 | ) | | | (358,865,166 | ) | |
| | | Redemption fees | | | — | | | | 114,599 | | |
| | | Total increase (decrease) in net assets | | | (23,615,574 | ) | | | 124,351,290 | | |
| Net Assets | | Beginning of period | | | 1,202,972,368 | | | | 1,078,621,078 | | |
| | | End of period | | | 1,179,356,794 | | | | 1,202,972,368 | | |
| | | Overdistributed net investment income at end of period | | | (17,430,894 | ) | | | (3,524,958 | ) | |
(a) Class I shares commenced operations on September 27, 2010.
(b) Class I shares reflect activity for the period September 27, 2010 through February 28, 2011.
See Accompanying Notes to Financial Statements.
14
Statement of Changes in Net Assets (continued) – Columbia Marsico International Opportunities Fund
| | | Capital Stock Activity | |
| | | Year Ended
February 28, 2011 (a)(b) | | Year Ended
February 28, 2010 | |
| | | Shares | | Dollars ($) | | Shares | | Dollars ($) | |
| Class A | |
| Subscriptions | | | 2,119,700 | | | | 22,676,105 | | | | 3,599,341 | | | | 33,799,461 | | |
| Distributions reinvested | | | 146,443 | | | | 1,688,472 | | | | 612,199 | | | | 5,585,316 | | |
| Redemptions | | | (7,292,262 | ) | | | (77,771,444 | ) | | | (16,628,228 | ) | | | (161,225,189 | ) | |
| Net decrease | | | (5,026,119 | ) | | | (53,406,867 | ) | | | (12,416,688 | ) | | | (121,840,412 | ) | |
| Class B | |
| Subscriptions | | | 14,408 | | | | 152,091 | | | | 104,917 | | | | 926,130 | | |
| Distributions reinvested | | | 7,480 | | | | 81,905 | | | | 23,266 | | | | 199,106 | | |
| Redemptions | | | (585,741 | ) | | | (5,911,646 | ) | | | (649,513 | ) | | | (5,638,652 | ) | |
| Net decrease | | | (563,853 | ) | | | (5,677,650 | ) | | | (521,330 | ) | | | (4,513,416 | ) | |
| Class C | |
| Subscriptions | | | 222,454 | | | | 2,296,758 | | | | 382,994 | | | | 3,548,154 | | |
| Distributions reinvested | | | 26,131 | | | | 286,394 | | | | 52,934 | | | | 453,616 | | |
| Redemptions | | | (1,418,826 | ) | | | (14,386,031 | ) | | | (1,817,095 | ) | | | (15,707,197 | ) | |
| Net decrease | | | (1,170,241 | ) | | | (11,802,879 | ) | | | (1,381,167 | ) | | | (11,705,427 | ) | |
| Class I | |
| Subscriptions | | | 3,437,886 | | | | 40,775,054 | | | | — | | | | — | | |
| Redemptions | | | (632,091 | ) | | | (7,449,298 | ) | | | — | | | | — | | |
| Net increase | | | 2,805,795 | | | | 33,325,756 | | | | — | | | | — | | |
| Class R | |
| Subscriptions | | | 61,056 | | | | 665,184 | | | | 156,809 | | | | 1,508,570 | | |
| Distributions reinvested | | | 4,027 | | | | 46,355 | | | | 6,574 | | | | 60,626 | | |
| Redemptions | | | (145,225 | ) | | | (1,633,266 | ) | | | (215,226 | ) | | | (1,993,518 | ) | |
| Net decrease | | | (80,142 | ) | | | (921,727 | ) | | | (51,843 | ) | | | (424,322 | ) | |
| Class Z | |
| Subscriptions | | | 15,136,249 | | | | 163,525,915 | | | | 17,351,987 | | | | 171,310,738 | | |
| Distributions reinvested | | | 530,078 | | | | 6,179,224 | | | | 1,114,727 | | | | 10,453,698 | | |
| Redemptions | | | (33,235,664 | ) | | | (362,454,690 | ) | | | (42,970,610 | ) | | | (402,146,025 | ) | |
| Net decrease | | | (17,569,337 | ) | | | (192,749,551 | ) | | | (24,503,896 | ) | | | (220,381,589 | ) | |
(a) Class I shares commenced operations on September 27, 2010.
(b) Class I shares reflect activity for the period September 27, 2010 through February 28, 2011.
See Accompanying Notes to Financial Statements.
15
Financial Highlights – Columbia Marsico International Opportunities Fund
Selected data for a share outstanding throughout each period is as follows:
| | | Year Ended February 28, | | Year Ended
February 29, | | Period Ended
February 28, | | Year Ended
March 31, | |
| Class A Shares | | 2011 | | 2010 | | 2009 | | 2008 | | 2007 (a) | | 2006 (b) | |
| Net Asset Value, Beginning of Period | | $ | 10.00 | | | $ | 6.76 | | | $ | 14.58 | | | $ | 14.85 | | | $ | 14.67 | | | $ | 11.41 | | |
| Income from Investment Operations: | |
| Net investment income (c) | | | 0.05 | | | | 0.05 | | | | 0.12 | (d) | | | 0.14 | (e) | | | — | (f) | | | 0.09 | | |
Net realized and unrealized gain (loss)
on investments and foreign currency | | | 2.08 | | | | 3.44 | | | | (7.82 | ) | | | 1.54 | | | | 1.38 | | | | 3.74 | | |
| Total from investment operations | | | 2.13 | | | | 3.49 | | | | (7.70 | ) | | | 1.68 | | | | 1.38 | | | | 3.83 | | |
| Less Distributions to Shareholders: | |
| From net investment income | | | (0.17 | ) | | | (0.25 | ) | | | — | | | | (0.16 | ) | | | (0.04 | ) | | | (0.10 | ) | |
| From net realized gains | | | — | | | | — | | | | (0.12 | ) | | | (1.79 | ) | | | (1.16 | ) | | | (0.47 | ) | |
| Total distributions to shareholders | | | (0.17 | ) | | | (0.25 | ) | | | (0.12 | ) | | | (1.95 | ) | | | (1.20 | ) | | | (0.57 | ) | |
| Redemption Fees: | |
| Redemption fees added to paid-in-capital | | | — | | | | — | (f) | | | — | (f) | | | — | (f) | | | — | (f) | | | — | (f) | |
| Net Asset Value, End of Period | | $ | 11.96 | | | $ | 10.00 | | | $ | 6.76 | | | $ | 14.58 | | | $ | 14.85 | | | $ | 14.67 | | |
| Total return (g) | | | 21.39 | % | | | 51.97 | % | | | (53.26 | )% | | | 10.55 | % | | | 10.52 | %(h) | | | 35.26 | % | |
Ratios to Average Net Assets/
Supplemental Data: | |
| Net expenses before interest expense (i) | | | 1.51 | % | | | 1.47 | % | | | 1.52 | % | | | 1.44 | % | | | 1.40 | %(j) | | | 1.34 | % | |
| Interest expense | | | — | %(k) | | | — | | | | — | | | | — | | | | — | %(j)(k) | | | — | %(k) | |
| Net expenses (i) | | | 1.51 | % | | | 1.47 | % | | | 1.52 | % | | | 1.44 | % | | | 1.40 | %(j) | | | 1.34 | % | |
| Net investment income (loss) (i) | | | 0.47 | % | | | 0.50 | % | | | 1.05 | % | | | 0.90 | % | | | (0.03 | )%(j) | | | 0.74 | % | |
| Portfolio turnover rate | | | 105 | % | | | 116 | % | | | 117 | % | | | 116 | % | | | 109 | %(h) | | | 118 | % | |
| Net assets, end of period (000s) | | $ | 141,821 | | | $ | 168,801 | | | $ | 198,012 | | | $ | 599,356 | | | $ | 452,047 | | | $ | 150,043 | | |
(a) The Fund changed its fiscal year end from March 31 to February 28. Per share data and total return reflect activity from April 1, 2006 through February 28, 2007.
(b) On August 22, 2005, the Fund's Investor A shares were renamed Class A shares.
(c) Per share data was calculated using the average shares outstanding during the period.
(d) Net investment income per share reflects special dividends. The effect of these dividends amounted to $0.03 per share.
(e) Net investment income per share reflects special dividends. The effect of these dividends amounted to $0.04 per share.
(f) Rounds to less than $0.01 per share.
(g) Total return at net asset value assuming all distributions reinvested and no initial sales charge or contingent deferred sales charge.
(h) Not annualized.
(i) The benefits derived from expense reductions had an impact of less than 0.01%.
(j) Annualized.
(k) Rounds to less than 0.01%.
See Accompanying Notes to Financial Statements.
16
Financial Highlights – Columbia Marsico International Opportunities Fund
Selected data for a share outstanding throughout each period is as follows:
| | | Year Ended February 28, | | Year Ended
February 29, | | Period Ended
February 28, | | Year Ended
March 31, | |
| Class B Shares | | 2011 | | 2010 | | 2009 | | 2008 | | 2007 (a) | | 2006 (b) | |
| Net Asset Value, Beginning of Period | | $ | 9.51 | | | $ | 6.38 | | | $ | 13.87 | | | $ | 14.23 | | | $ | 14.17 | | | $ | 11.05 | | |
| Income from Investment Operations: | |
| Net investment income (loss) (c) | | | (0.03 | ) | | | (0.03 | ) | | | 0.03 | (d) | | | 0.03 | (e) | | | (0.08 | ) | | | 0.01 | | |
Net realized and unrealized gain (loss)
on investments and foreign currency | | | 1.98 | | | | 3.27 | | | | (7.40 | ) | | | 1.46 | | | | 1.30 | | | | 3.59 | | |
| Total from investment operations | | | 1.95 | | | | 3.24 | | | | (7.37 | ) | | | 1.49 | | | | 1.22 | | | | 3.60 | | |
| Less Distributions to Shareholders: | |
| From net investment income | | | (0.11 | ) | | | (0.11 | ) | | | — | | | | (0.06 | ) | | | — | | | | (0.01 | ) | |
| From net realized gains | | | — | | | | — | | | | (0.12 | ) | | | (1.79 | ) | | | (1.16 | ) | | | (0.47 | ) | |
| Total distributions to shareholders | | | (0.11 | ) | | | (0.11 | ) | | | (0.12 | ) | | | (1.85 | ) | | | (1.16 | ) | | | (0.48 | ) | |
| Redemption Fees: | |
| Redemption fees added to paid-in-capital | | | — | | | | — | (f) | | | — | (f) | | | — | (f) | | | — | (f) | | | — | (f) | |
| Net Asset Value, End of Period | | $ | 11.35 | | | $ | 9.51 | | | $ | 6.38 | | | $ | 13.87 | | | $ | 14.23 | | | $ | 14.17 | | |
| Total return (g) | | | 20.50 | % | | | 50.91 | % | | | (53.60 | )% | | | 9.68 | % | | | 9.76 | %(h) | | | 34.22 | % | |
Ratios to Average Net Assets/
Supplemental Data: | |
| Net expenses before interest expense (i) | | | 2.26 | % | | | 2.22 | % | | | 2.27 | % | | | 2.19 | % | | | 2.15 | %(j) | | | 2.09 | % | |
| Interest expense | | | — | %(k) | | | — | | | | — | | | | — | | | | — | %(j)(k) | | | — | %(k) | |
| Net expenses (i) | | | 2.26 | % | | | 2.22 | % | | | 2.27 | % | | | 2.19 | % | | | 2.15 | %(j) | | | 2.09 | % | |
| Net investment income (loss) (i) | | | (0.27 | )% | | | (0.35 | )% | | | 0.32 | % | | | 0.22 | % | | | (0.63 | )%(j) | | | 0.12 | % | |
| Portfolio turnover rate | | | 105 | % | | | 116 | % | | | 117 | % | | | 116 | % | | | 109 | %(h) | | | 118 | % | |
| Net assets, end of period (000s) | | $ | 14,862 | | | $ | 17,810 | | | $ | 15,281 | | | $ | 44,224 | | | $ | 40,953 | | | $ | 28,883 | | |
(a) The Fund changed its fiscal year end from March 31 to February 28. Per share data and total return reflect activity from April 1, 2006 through February 28, 2007.
(b) On August 22, 2005, the Fund's Investor B shares were renamed Class B shares.
(c) Per share data was calculated using the average shares outstanding during the period.
(d) Net investment income per share reflects special dividends. The effect of these dividends amounted to $0.03 per share.
(e) Net investment income per share reflects special dividends. The effect of these dividends amounted to $0.04 per share.
(f) Rounds to less than $0.01 per share.
(g) Total return at net asset value assuming all distributions reinvested and no contingent deferred sales charge.
(h) Not annualized.
(i) The benefits derived from expense reductions had an impact of less than 0.01%.
(j) Annualized.
(k) Rounds to less than 0.01%.
See Accompanying Notes to Financial Statements.
17
Financial Highlights – Columbia Marsico International Opportunities Fund
Selected data for a share outstanding throughout each period is as follows:
| | | Year Ended February 28, | | Year Ended
February 29, | | Period Ended
February 28, | | Year Ended
March 31, | |
| Class C Shares | | 2011 | | 2010 | | 2009 | | 2008 | | 2007 (a) | | 2006 (b) | |
| Net Asset Value, Beginning of Period | | $ | 9.51 | | | $ | 6.39 | | | $ | 13.88 | | | $ | 14.24 | | | $ | 14.18 | | | $ | 11.05 | | |
| Income from Investment Operations: | |
| Net investment income (loss) (c) | | | (0.03 | ) | | | (0.03 | ) | | | 0.03 | (d) | | | 0.02 | (e) | | | (0.09 | ) | | | 0.01 | | |
Net realized and unrealized gain (loss)
on investments and foreign currency | | | 1.99 | | | | 3.26 | | | | (7.40 | ) | | | 1.47 | | | | 1.31 | | | | 3.60 | | |
| Total from investment operations | | | 1.96 | | | | 3.23 | | | | (7.37 | ) | | | 1.49 | | | | 1.22 | | | | 3.61 | | |
| Less Distributions to Shareholders: | |
| From net investment income | | | (0.11 | ) | | | (0.11 | ) | | | — | | | | (0.06 | ) | | | — | | | | (0.01 | ) | |
| From net realized gains | | | — | | | | — | | | | (0.12 | ) | | | (1.79 | ) | | | (1.16 | ) | | | (0.47 | ) | |
| Total distributions to shareholders | | | (0.11 | ) | | | (0.11 | ) | | | (0.12 | ) | | | (1.85 | ) | | | (1.16 | ) | | | (0.48 | ) | |
| Redemption Fees: | |
| Redemption fees added to paid-in-capital | | | — | | | | — | (f) | | | — | (f) | | | — | (f) | | | — | (f) | | | — | (f) | |
| Net Asset Value, End of Period | | $ | 11.36 | | | $ | 9.51 | | | $ | 6.39 | | | $ | 13.88 | | | $ | 14.24 | | | $ | 14.18 | | |
| Total return (g) | | | 20.60 | % | | | 50.67 | % | | | (53.57 | )% | | | 9.67 | % | | | 9.76 | %(h) | | | 34.32 | % | |
Ratios to Average Net Assets/
Supplemental Data: | |
| Net expenses before interest expense (i) | | | 2.26 | % | | | 2.22 | % | | | 2.27 | % | | | 2.19 | % | | | 2.15 | %(j) | | | 2.09 | % | |
| Interest expense | | | — | %(k) | | | — | | | | — | | | | — | | | | — | %(j)(k) | | | — | %(k) | |
| Net expenses (i) | | | 2.26 | % | | | 2.22 | % | | | 2.27 | % | | | 2.19 | % | | | 2.15 | %(j) | | | 2.09 | % | |
| Net investment income (loss) (i) | | | (0.30 | )% | | | (0.35 | )% | | | 0.30 | % | | | 0.16 | % | | | (0.69 | )%(j) | | | 0.05 | % | |
| Portfolio turnover rate | | | 105 | % | | | 116 | % | | | 117 | % | | | 116 | % | | | 109 | %(h) | | | 118 | % | |
| Net assets, end of period (000s) | | $ | 39,789 | | | $ | 44,466 | | | $ | 38,668 | | | $ | 109,553 | | | $ | 86,563 | | | $ | 46,365 | | |
(a) The Fund changed its fiscal year end from March 31 to February 28. Per share data and total return reflect activity from April 1, 2006 through February 28, 2007.
(b) On August 22, 2005, the Fund's Investor C shares were renamed Class C shares.
(c) Per share data was calculated using the average shares outstanding during the period.
(d) Net investment income per share reflects special dividends. The effect of these dividends amounted to $0.03 per share.
(e) Net investment income per share reflects special dividends. The effect of these dividends amounted to $0.04 per share.
(f) Rounds to less than $0.01 per share.
(g) Total return at net asset value assuming all distributions reinvested and no contingent deferred sales charge.
(h) Not annualized.
(i) The benefits derived from expense reductions had an impact of less than 0.01%.
(j) Annualized.
(k) Rounds to less than 0.01%.
See Accompanying Notes to Financial Statements.
18
Financial Highlights – Columbia Marsico International Opportunities Fund
Selected data for a share outstanding throughout the period is as follows:
| Class I Shares | | Period Ended
February 28,
2011 (a) | |
| Net Asset Value, Beginning of Period | | $ | 11.18 | | |
| Income from Investment Operations: | |
| Net investment loss (b) | | | (0.01 | ) | |
| Net realized and unrealized gain on investments and foreign currency | | | 1.17 | | |
| Total from investment operations | | | 1.16 | | |
| Less Distributions to Shareholders: | |
| From net investment income | | | (0.20 | ) | |
| Net Asset Value, End of Period | | $ | 12.14 | | |
| Total return (c)(d) | | | 10.44 | % | |
| Ratios to Average Net Assets/Supplemental Data: | |
| Net expenses before interest expense (e)(f) | | | 1.10 | % | |
| Interest expense (f)(g) | | | — | % | |
| Net expenses (e)(f) | | | 1.10 | % | |
| Net investment loss (e)(f) | | | (0.24 | )% | |
| Portfolio turnover rate (d) | | | 105 | % | |
| Net assets, end of period (000s) | | $ | 34,072 | | |
(a) Class I shares commenced operations on September 27, 2010. Per share data and total return reflect activity from that date.
(b) Per share data was calculated using the average shares outstanding during the period.
(c) Total return at net asset value assuming all distributions reinvested.
(d) Not annualized.
(e) The benefits derived from expense reductions had an impact of less than 0.01%.
(f) Annualized.
(g) Rounds to less than 0.01%.
See Accompanying Notes to Financial Statements.
19
Financial Highlights – Columbia Marsico International Opportunities Fund
Selected data for a share outstanding throughout each period is as follows:
| | | Year Ended February 28, | | Year Ended
February 29, | | Period Ended
February 28, | | Period Ended
March 31, | |
| Class R Shares | | 2011 | | 2010 | | 2009 | | 2008 | | 2007 (a) | | 2006 (b) | |
| Net Asset Value, Beginning of Period | | $ | 9.99 | | | $ | 6.73 | | | $ | 14.56 | | | $ | 14.84 | | | $ | 14.67 | | | $ | 13.76 | | |
| Income from Investment Operations: | |
| Net investment income (loss) (c) | | | 0.01 | | | | 0.01 | | | | 0.06 | (d) | | | 0.08 | (e) | | | (0.17 | ) | | | (0.01 | ) | |
Net realized and unrealized gain (loss)
on investments and foreign currency | | | 2.09 | | | | 3.45 | | | | (7.77 | ) | | | 1.56 | | | | 1.51 | | | | 0.92 | | |
| Total from investment operations | | | 2.10 | | | | 3.46 | | | | (7.71 | ) | | | 1.64 | | | | 1.34 | | | | 0.91 | | |
| Less Distributions to Shareholders: | |
| From net investment income | | | (0.15 | ) | | | (0.20 | ) | | | — | | | | (0.13 | ) | | | (0.01 | ) | | | — | | |
| From net realized gains | | | — | | | | — | | | | (0.12 | ) | | | (1.79 | ) | | | (1.16 | ) | | | — | | |
| Total distributions to shareholders | | | (0.15 | ) | | | (0.20 | ) | | | (0.12 | ) | | | (1.92 | ) | | | (1.17 | ) | | | — | | |
| Redemption Fees: | |
| Redemption fees added to paid-in-capital | | | — | | | | — | (f) | | | — | (f) | | | — | (f) | | | — | (f) | | | — | (f) | |
| Net Asset Value, End of Period | | $ | 11.94 | | | $ | 9.99 | | | $ | 6.73 | | | $ | 14.56 | | | $ | 14.84 | | | $ | 14.67 | | |
| Total return (g) | | | 21.08 | % | | | 51.73 | % | | | (53.40 | )% | | | 10.26 | % | | | 10.25 | %(h) | | | 6.61 | %(h) | |
Ratios to Average Net Assets/
Supplemental Data: | |
| Net expenses before interest expense (i) | | | 1.76 | % | | | 1.72 | % | | | 1.77 | % | | | 1.69 | % | | | 1.65 | %(j) | | | 1.64 | %(j) | |
| Interest expense | | | — | %(k) | | | — | | | | — | | | | — | | | | — | %(j)(k) | | | — | %(j)(k) | |
| Net expenses (i) | | | 1.76 | % | | | 1.72 | % | | | 1.77 | % | | | 1.69 | % | | | 1.65 | %(j) | | | 1.64 | %(j) | |
| Net investment income (loss) (i) | | | 0.12 | % | | | 0.15 | % | | | 0.58 | % | | | 0.51 | % | | | (1.26 | )%(j) | | | (0.30 | )%(j) | |
| Portfolio turnover rate | | | 105 | % | | | 116 | % | | | 117 | % | | | 116 | % | | | 109 | %(h) | | | 118 | %(h) | |
| Net assets, end of period (000s) | | $ | 3,020 | | | $ | 3,327 | | | $ | 2,592 | | | $ | 3,724 | | | $ | 2,037 | | | $ | 11 | | |
(a) The Fund changed its fiscal year end from March 31 to February 28. Per share data and total return reflect activity from April 1, 2006 through February 28, 2007.
(b) Class R shares commenced operations on January 23, 2006.
(c) Per share data was calculated using the average shares outstanding during the period.
(d) Net investment income per share reflects special dividends. The effect of these dividends amounted to $0.03 per share.
(e) Net investment income per share reflects special dividends. The effect of these dividends amounted to $0.04 per share.
(f) Rounds to less than $0.01 per share.
(g) Total return at net asset value assuming all distributions reinvested.
(h) Not annualized.
(i) The benefits derived from expense reductions had an impact of less than 0.01%.
(j) Annualized.
(k) Rounds to less than 0.01%.
See Accompanying Notes to Financial Statements.
20
Financial Highlights – Columbia Marsico International Opportunities Fund
Selected data for a share outstanding throughout each period is as follows:
| | | Year Ended February 28, | | Year Ended
February 29, | | Period Ended
February 28, | | Year Ended
March 31, | |
| Class Z Shares | | 2011 | | 2010 | | 2009 | | 2008 | | 2007 (a) | | 2006 (b) | |
| Net Asset Value, Beginning of Period | | $ | 10.15 | | | $ | 6.87 | | | $ | 14.79 | | | $ | 15.04 | | | $ | 14.83 | | | $ | 11.53 | | |
| Income from Investment Operations: | |
| Net investment income (c) | | | 0.07 | | | | 0.06 | | | | 0.15 | (d) | | | 0.20 | (e) | | | 0.05 | | | | 0.13 | | |
Net realized and unrealized gain (loss)
on investments and foreign currency | | | 2.13 | | | | 3.52 | | | | (7.95 | ) | | | 1.54 | | | | 1.39 | | | | 3.77 | | |
| Total from investment operations | | | 2.20 | | | | 3.58 | | | | (7.80 | ) | | | 1.74 | | | | 1.44 | | | | 3.90 | | |
| Less Distributions to Shareholders: | |
| From net investment income | | | (0.20 | ) | | | (0.30 | ) | | | — | | | | (0.20 | ) | | | (0.07 | ) | | | (0.13 | ) | |
| From net realized gains | | | — | | | | — | | | | (0.12 | ) | | | (1.79 | ) | | | (1.16 | ) | | | (0.47 | ) | |
| Total distributions to shareholders | | | (0.20 | ) | | | (0.30 | ) | | | (0.12 | ) | | | (1.99 | ) | | | (1.23 | ) | | | (0.60 | ) | |
| Redemption Fees: | |
| Redemption fees added to paid-in-capital | | | — | | | | — | (f) | | | — | (f) | | | — | (f) | | | — | (f) | | | — | (f) | |
| Net Asset Value, End of Period | | $ | 12.15 | | | $ | 10.15 | | | $ | 6.87 | | | $ | 14.79 | | | $ | 15.04 | | | $ | 14.83 | | |
| Total return (g) | | | 21.75 | % | | | 52.47 | % | | | (53.17 | )% | | | 10.77 | % | | | 10.81 | %(h) | | | 35.53 | % | |
Ratios to Average Net Assets/
Supplemental Data: | |
| Net expenses before interest expense (i) | | | 1.26 | % | | | 1.22 | % | | | 1.27 | % | | | 1.19 | % | | | 1.15 | %(j) | | | 1.09 | % | |
| Interest expense | | | — | %(k) | | | — | | | | — | | | | — | | | | — | %(j)(k) | | | — | %(k) | |
| Net expenses (i) | | | 1.26 | % | | | 1.22 | % | | | 1.27 | % | | | 1.19 | % | | | 1.15 | %(j) | | | 1.09 | % | |
| Net investment income (i) | | | 0.67 | % | | | 0.65 | % | | | 1.32 | % | | | 1.23 | % | | | 0.37 | %(j) | | | 1.08 | % | |
| Portfolio turnover rate | | | 105 | % | | | 116 | % | | | 117 | % | | | 116 | % | | | 109 | %(h) | | | 118 | % | |
| Net assets, end of period (000s) | | $ | 945,793 | | | $ | 968,569 | | | $ | 824,068 | | | $ | 2,491,232 | | | $ | 2,322,301 | | | $ | 1,744,737 | | |
(a) The Fund changed its fiscal year end from March 31 to February 28. Per share data and total return reflect activity from April 1, 2006 through February 28, 2007.
(b) On August 22, 2005, the Fund's Primary A shares were renamed Class Z shares.
(c) Per share data was calculated using the average shares outstanding during the period.
(d) Net investment income per share reflects special dividends. The effect of these dividends amounted to $0.03 per share.
(e) Net investment income per share reflects special dividends. The effect of these dividends amounted to $0.04 per share.
(f) Rounds to less than $0.01 per share.
(g) Total return at net asset value assuming all distributions reinvested.
(h) Not annualized.
(i) The benefits derived from expense reductions had an impact of less than 0.01%.
(j) Annualized.
(k) Rounds to less than 0.01%.
See Accompanying Notes to Financial Statements.
21
Notes to Financial Statements – Columbia Marsico International Opportunities Fund
February 28, 2011
Note 1. Organization
Columbia Marsico International Opportunities Fund (the Fund), a series of Columbia Funds Series Trust (the Trust), is a diversified fund. The Trust is registered under the Investment Company Act of 1940, as amended (the 1940 Act), as an open-end management investment company organized as a Delaware statutory trust.
After the close of business on April 30, 2010, Ameriprise Financial, Inc. (Ameriprise Financial) acquired a portion of the asset management business of Columbia Management Group, LLC (the Transaction), including the business of managing the Fund. In connection with the closing of the Transaction (the Closing), RiverSource Investments, LLC, a wholly owned subsidiary of Ameriprise Financial, became the investment manager of the Fund and changed its name to Columbia Management Investment Advisers, LLC (the Investment Manager).
Investment Objective
The Fund seeks long-term growth of capital.
Fund Shares
The Trust has unlimited authorized shares of beneficial interest. The Fund offers Class A, Class B, Class C, Class I, Class R and Class Z shares. On December 28, 2010, the Investment Manager exchanged Class Z shares valued at $40,645,853 for Class I shares. All share classes have identical voting, dividend and liquidation rights. Each share class has its own expense structure and sales charges, as applicable.
Class A shares are subject to a maximum front-end sales charge of 5.75% based on the investment amount. Class A shares purchased without an initial sales charge in accounts aggregating $1 million to $50 million at the time of purchase are subject to a 1.00% contingent deferred sales charge (CDSC) if the shares are sold within 18 months of purchase, charged as follows: 1.00% CDSC if redeemed within 12 months of purchase, and 0.50% CDSC if redeemed more than 12, but less than 18 months after purchase.
The Fund no longer accepts investments by new or existing investors in the Fund's Class B shares, except in connection with the reinvestment of any dividend and/or capital gain distributions in Class B shares of the Fund and exchanges by existing Class B shareholders of certain other funds within the Columbia Family of Funds. Class B shares may be subject to a maximum CDSC of 5.00% based upon the holding period after purchase. Class B shares will generally convert to Class A shares eight years after purchase.
Class C shares are subject to a 1.00% CDSC on shares redeemed within one year of purchase.
Class I shares are not subject to sales charges and are available only to the Columbia Family of Funds. Class I shares became effective September 27, 2010.
Class R shares are not subject to sales charges and are available only to qualifying institutional investors.
Class Z shares are not subject to sales charges and are available only to certain investors, as described in the Fund's prospectus.
Note 2. Summary of Significant Accounting Policies
The preparation of financial statements in accordance with U.S. generally accepted accounting principles (GAAP) requires the Investment Manager to make certain estimates and assumptions that affect the reported amounts of assets and liabilities, the disclosure of contingent assets and liabilities at the date of the financial statements and the reported amounts of revenue and expenses during the reporting period. Actual results could differ from those estimates.
The following is a summary of significant accounting policies consistently followed by the Fund in the preparation of its financial statements.
Security Valuation
Equity securities are valued at the last sale price on the principal exchange on which they trade, except for securities traded on the NASDAQ, which are valued at the NASDAQ official close price. Unlisted securities or listed securities for which there were no sales during the day are valued at the closing bid price on such exchanges or over-the-counter markets.
Short-term investments maturing in 60 days or less are valued at amortized cost, which approximates market value.
Foreign securities are generally valued at the last sale price on the foreign exchange or market on which they trade. If any foreign share prices are not readily available as a result of limited share activity, the securities are valued at the last sale price of the local shares in the principal market in which such securities are normally traded.
Generally, trading in foreign securities is substantially completed each day at various times prior to the close of the New York Stock Exchange (NYSE). The values of such securities used in computing the net asset value of the Fund's shares are determined as of such
22
Columbia Marsico International Opportunities Fund, February 28, 2011
times. Foreign currency exchange rates are generally determined at 4:00 p.m. Eastern (U.S.) time. Occasionally, events affecting the values of such foreign securities may occur between the times at which they are determined and the close of the customary trading session of the NYSE, which would not be reflected in the computation of the Fund's net asset value. If events materially affecting the values of such foreign securities occur and it is determined that market quotations are not reliable, then these foreign securities will be valued at their fair value using procedures approved by the Board of Trustees.
The Fund may use a systematic fair valuation model provided by an independent third party to value securities principally traded in foreign markets in order to adjust for possible stale pricing that may occur between the close of the foreign exchanges and the time for valuation.
Investments for which market quotations are not readily available, or that have quotations which the Investment Manager believes are not reliable, are valued at fair value as determined in good faith under consistently applied procedures established by and under the general supervision of the Board of Trustees. If a security is valued at fair value, such value is likely to be different from the last quoted market price for the security. The determination of fair value often requires significant judgment. To determine fair value, the Investment Manager may use assumptions including but not limited to future cash flows and estimated risk premiums. Multiple inputs from various sources may be used to determine value.
Foreign Currency Transactions and Translations
The values of all assets and liabilities quoted in foreign currencies are translated into U.S. dollars at that day's exchange rates. Net realized and unrealized gains (losses) on foreign currency transactions and translations include gains (losses) arising from the fluctuation in exchange rates between trade and settlement dates on securities transactions, gains (losses) arising from the disposition of foreign currency and currency gains (losses) between the accrual and payment dates on dividends, interest income and foreign withholding taxes.
For financial statement purposes, the Fund does not distinguish that portion of gains (losses) on investments which is due to changes in foreign exchange rates from that which is due to changes in market prices of the investments. Such fluctuations are included with the net realized and unrealized gains (losses) on investments on the Statement of Operations.
Repurchase Agreements
The Fund may engage in repurchase agreement transactions with institutions that the Investment Manager has determined are creditworthy. The Fund, through the custodian, receives delivery of the underlying securities collateralizing a repurchase agreement. The Investment Manager is responsible for determining that the collateral is at least equal, at all times, to the value of the repurchase obligation including interest. A repurchase agreement transaction involves certain risks in the event of default or insolvency of the counterparty. These risks include possible delays in or restrictions on the Fund's ability to dispose of the underlying securities and a possible decline in the value of the underlying securities during the period while the Fund seeks to assert its rights.
Security Transactions
Security transactions are accounted for on the trade date. Cost is determined and gains (losses) are based upon the specific identification method for both financial statement and federal income tax purposes.
Income Recognition
Interest income is recorded on the accrual basis.
Corporate actions and dividend income are recorded net of any non-reclaimable tax withholdings, on the ex-dividend date or upon receipt of ex-dividend notification in the case of certain foreign securities.
Expenses
General expenses of the Trust are allocated to the Fund and other series of the Trust based upon relative net assets or other expense allocation methodologies determined by the nature of the expense. Expenses directly attributable to a specific class of shares are charged to that share class. Expenses directly attributable to the Fund are charged to the Fund.
Determination of Class Net Asset Value
All income, expenses (other than class-specific expenses which are charged directly to a share class, as shown in the Statement of Operations) and realized and unrealized gains (losses) are allocated to each class of the Fund on a daily basis, based on the relative net assets of each class, for purposes of determining the net asset value of each class.
23
Columbia Marsico International Opportunities Fund, February 28, 2011
Federal Income Tax Status
The Fund intends to qualify each year as a "regulated investment company" under Subchapter M of the Internal Revenue Code, as amended, and will distribute substantially all of its taxable income, if any, for its tax year, and as such will not be subject to federal income taxes. In addition, the Fund intends to distribute in each calendar year substantially all of its net investment income, capital gains and certain other amounts, if any, such that the Fund should not be subject to federal excise tax. Therefore, no federal income or excise tax provision is recorded.
Foreign Tax
The Fund may be subject to foreign taxes on income and/or gains on investments or currency repatriation, a portion of which may be recoverable. The Fund will accrue such taxes and recoveries as applicable, based upon its current interpretation of tax rules and regulations that exist in the markets in which it invests.
Realized gains in certain countries may be subject to foreign taxes at the Fund level, at rates ranging from approximately 10% to 15%. The Fund accrues for such foreign taxes on net realized and unrealized gains at the appropriate rate for each jurisdiction.
Distributions to Shareholders
Distributions from net investment income, if any, are declared and paid semi-annually. The Fund may, however, declare and pay distributions from net investment income more frequently. The Fund will distribute net realized capital gains (including net short-term capital gains) at least annually after the fiscal year in which the capital gains were earned, unless offset by any available capital loss carryforward. Income distributions and capital gain distributions are determined in accordance with federal income tax regulations which may differ from GAAP.
Indemnification
In the normal course of business, the Fund enters into contracts that contain a variety of representations and warranties and which provide general indemnities. The Fund's maximum exposure under these arrangements is unknown because this would involve future claims against the Fund. Also, under the Trust's organizational documents and by contract, the Trustees and officers of the Trust are indemnified against certain liabilities that may arise out of actions relating to their duties to the Trust. However, based on experience, the Fund expects the risk of loss due to these representations, warranties and indemnities to be minimal.
Note 3. Fees and Compensation Paid to Affiliates
Investment Management Services Fee
The Investment Manager is responsible for the management of the Fund. Day-to-day portfolio management of the Fund is provided by the Fund's subadviser (see Subadvisory Fee note below). The management fee is based on the annual rate of 0.80% of the Fund's average daily net assets.
Prior to the Closing, Columbia Management Advisors, LLC (Columbia), an indirect, wholly owned subsidiary of Bank of America Corporation (BOA), provided investment management services to the Fund under the same fee structure.
To the extent that the Fund is not benefitting from a separate contractual expense limitation arrangement, the Investment Manager has contractually agreed to waive a portion of its management fees through June 30, 2011.
The waiver amount is calculated based on the difference between the dollar amount of subadvisory fees that would have been payable to Marsico Capital Management, LLC (Marsico) based on the annualized rate of 0.45% of each Fund's average daily net assets, and the dollar amount of subadvisory fees calculated on a monthly basis based on the annualized subadvisory fee rate effective January 1, 2008 to which Marsico is entitled from each Fund which is described under the Subadvisory Fee note below. The annualized fee rate of 0.45% represented the subadvisory fee rate which Marsico was entitled to receive prior to January 1, 2008.
In the absence of a separate contractual expense limitation arrangement, the management fee waiver for the Fund would be calculated as follows:
| Average Daily Net Assets* | | Management
Fee Waiver | |
| Assets up to $18 billion | | | 0.00 | % | |
Assets in excess of $18 billion and
up to $21 billion | | | 0.05 | % | |
| Assets in excess of $21 billion | | | 0.10 | % | |
��
* For purposes of the calculation, "Assets" are aggregate assets subadvised by Marsico in the following Columbia Funds: (i) Columbia Marsico International Opportunities Fund; (ii) Columbia Multi-Advisor International Equity Fund; (iii) Columbia Marsico International Opportunities Fund, Variable Series; and (iv) any future Columbia international equity fund subadvised by Marsico which the Investment Manager and Marsico mutually agree in writing.
24
Columbia Marsico International Opportunities Fund, February 28, 2011
Prior to the Closing, Columbia waived a portion of the Fund's management fees at the same rates.
For the year ended February 28, 2011, no management fees were waived for the Fund.
Subadvisory Fee
Marsico has been retained by the Investment Manager to serve as the investment subadviser to the Fund. As the subadviser, and subject to the oversight of the Investment Manager and the Fund's Board of Trustees, Marsico is responsible for the daily investment operations, including placing all orders for the purchase and sale of the portfolio securities for the Fund. The Investment Manager, from the management fee it receives, pays Marsico a monthly subadvisory fee based on the Fund's average daily net assets at the following annual rates:
| Average Daily Net Assets* | | Annual
Fee Rate | |
| Assets up to $6 billion | | | 0.45 | % | |
Assets in excess of $6 billion and
up to $10 billion | | | 0.40 | % | |
| Assets in excess of $10 billion | | | 0.35 | % | |
* For purposes of the calculation, assets are aggregate assets subadvised by Marsico in the following Columbia Funds: (i) Columbia Marsico International Opportunities Fund; (ii) Columbia Multi-Advisor International Equity Fund; (iii) Columbia Marsico International Opportunities Fund, Variable Series; and (iv) any future Columbia international equity fund subadvised by Marsico which the Investment Manager and Marsico mutually agree in writing.
Prior to the Closing, Marsico provided subadvisory services to the Fund under the same fee structure in accordance with an agreement with Columbia.
Administration Fee
Effective upon the Closing, the Investment Manager became the administrator of the Fund and provides administrative and other services to the Fund, including services previously performed under the Pricing and Bookkeeping Oversight and Services Agreement discussed below. The administration fee is based on the annual rate of 0.22% of the Fund's average daily net assets, less the fees payable by the Fund as described under the Pricing and Bookkeeping Fees note below. Prior to the Closing, Columbia provided administrative services to the Fund at the same fee rate.
Pricing and Bookkeeping Fees
Prior to the Closing, the Fund entered into a Financial Reporting Services Agreement (the Financial Reporting Services Agreement) with State Street Bank and Trust Company (State Street) and Columbia pursuant to which State Street provides financial reporting services to the Fund. The Fund also entered into an Accounting Services Agreement (collectively with the Financial Reporting Services Agreement, the State Street Agreements) with State Street and Columbia pursuant to which State Street provides accounting services to the Fund. Upon the Closing, Columbia assigned and delegated its rights and obligations under the State Street Agreements to the Investment Manager. Under the State Street Agreements, the Fund pays State Street an annual fee of $38,000 paid monthly plus an additional monthly fee based on an annualized percentage rate of average daily net assets of the Fund for the month. The aggregate fee will not exceed $140,000 per year (exclusive of out-of-pocket expenses and charges). The Fund also reimburses State Street for certain out-of-pocket expenses and charges.
Also prior to the Closing, the Fund entered into a Pricing and Bookkeeping Oversight and Services Agreement (the Services Agreement) with Columbia. Under the Services Agreement, Columbia provided services related to Fund expenses and the requirements of the Sarbanes-Oxley Act of 2002, and provided oversight of the accounting and financial reporting services provided by State Street. Under the Services Agreement, the Fund reimbursed Columbia for out-of-pocket expenses and charges, including fees payable to third parties, such as for pricing the Fund's portfolio securities, incurred by Columbia in the performance of services under the Services Agreement. The Services Agreement was terminated upon the Closing. These services are now provided under the Administration Fee note discussed above.
Transfer Agent Fee
In connection with the Closing, RiverSource Service Corporation, a wholly owned subsidiary of Ameriprise Financial, became the transfer agent of the Fund and changed its name to Columbia Management Investment Services Corp. (the New Transfer Agent). The New Transfer Agent has contracted with Boston Financial Data Services (BFDS) to serve as sub-transfer agent. The New Transfer Agent receives monthly account-based service fees that vary by class and are based on the number of open accounts and asset-based fees, calculated based on assets held in omnibus accounts, which are intended to reimburse the New Transfer Agent for certain sub-transfer agent fees (exclusive of BFDS fees). The New Transfer
25
Columbia Marsico International Opportunities Fund, February 28, 2011
Agent pays the fees of BFDS for services as sub-transfer agent and is not entitled to reimbursement for such fees from the Fund.
The New Transfer Agent receives reimbursement for certain out-of-pocket expenses and may also receive compensation for various shareholder services.
Prior to the Closing, Columbia Management Services, Inc., an affiliate of Columbia and an indirect, wholly owned subsidiary of BOA, provided shareholder services to the Fund and contracted with BFDS to serve as sub-transfer agent, under the same fee structure.
Class I shares do not pay transfer agent fees. For the year ended February 28, 2011, the Fund's effective transfer agent fee rate for each class, with the exception of Class I shares, was 0.15% of the Fund's average daily net assets.
An annual minimum account balance fee of $20 may apply to certain accounts with a value below the Fund's initial minimum investment requirements to reduce the impact of small accounts on transfer agent fees. These minimum account balance fees are recorded as part of expense reductions on the Statement of Operations. For the year ended February 28, 2011, no minimum account balance fees were charged by the Fund.
Underwriting Discounts, Service and Distribution Fees
In connection with the Closing, RiverSource Fund Distributors, Inc., an indirect wholly owned subsidiary of Ameriprise Financial, became the distributor of the Fund and changed its name to Columbia Management Investment Distributors, Inc. (the New Distributor).
For the year ended February 28, 2011, initial sales charges paid by shareholders on the purchase of Class A shares amounted to $6,435 and net CDSC fees paid by shareholders on certain redemptions of Class A, Class B and Class C shares amounted to $93, $33,816 and $970, respectively.
The Trust has adopted shareholder servicing plans and distribution plans for the Class B and Class C shares of the Fund and a combined distribution and shareholder servicing plan for Class A shares of the Fund. The Trust has also adopted a distribution plan for Class R shares of the Fund. The shareholder servicing plans permit the Fund to compensate or reimburse servicing agents for the shareholder services they have provided. The distribution plans, adopted pursuant to Rule 12b-1 under the 1940 Act, permit the Fund to compensate or reimburse the New Distributor and/or selling agents for activities or expenses primarily intended to result in the sale of the classes' shares. Payments are made at an annual rate and paid monthly, as a percentage of average daily net assets, set from time to time by the Board of Trustees, and are charged as expenses of the Fund directly to the applicable share class. A substantial portion of the expenses incurred pursuant to these plans is paid to affiliates of the New Distributor.
The annual rates in effect and plan limits, as a percentage of average daily net assets are as follows:
| | | Current
Rate | | Plan
Limit | |
Class A Combined Distribution
and Shareholder Servicing Plan | | | 0.25 | % | | | 0.25 | % | |
Class B and Class C Shareholder
Servicing Plans | | | 0.25 | % | | | 0.25 | % | |
| Class B and Class C Distribution Plans | | | 0.75 | % | | | 0.75 | % | |
| Class R Distribution Plan | | | 0.50 | % | | | 0.50 | % | |
Prior to the Closing, Columbia Management Distributors, Inc, an affiliate of Columbia and an indirect, wholly owned subsidiary of BOA, was the principal underwriter of the Fund's shares. There were no changes to the underwriting discount structure of the Fund or the service or distribution fee rates paid by the Fund as a result of the Transaction.
Expense Limits and Fee Waivers
Effective September 27, 2010, the Investment Manager has voluntarily agreed to reimburse a portion of the Fund's expenses so that the Fund's ordinary operating expenses (excluding any brokerage commissions, interest, taxes and extraordinary expenses, but including custodian charges relating to overdrafts, if any), after giving effect to any balance credits from the Fund's custodian, do not exceed the annual rates of 1.60%, 2.35%, 2.35%, 1.21%, 1.85% and 1.35% of the Fund's average daily net assets attributable to Class A, Class B, Class C, Class I, Class R and Class Z shares, respectively. This arrangement may be modified or terminated by the Investment Manager at any time.
For the period May 1, 2010 through September 26, 2010, the Investment Manager voluntarily agreed to reimburse a portion of the Fund's expenses so that the Fund's ordinary operating expenses (excluding any distribution and service fees, brokerage commissions, interest, taxes and extraordinary expenses, but including custodian charges relating to overdrafts, if any), after giving effect to any
26
Columbia Marsico International Opportunities Fund, February 28, 2011
balance credits from the Fund's custodian, did not exceed 1.35% annually of the Fund's average daily net assets. Prior to May 1, 2010, Columbia voluntarily reimbursed a portion of the Fund's expenses in the same manner.
Fees Paid to Officers and Trustees
Upon the Closing, all officers of the Fund are employees of the Investment Manager or its affiliates and, with the exception of the Fund's Chief Compliance Officer, receive no compensation from the Fund. The Board of Trustees has appointed a Chief Compliance Officer to the Fund in accordance with federal securities regulations. The Fund, along with other affiliated funds, pays its pro-rata share of the expenses associated with the Chief Compliance Officer. The Fund's expenses for the Chief Compliance Officer will not exceed $15,000 per year. Prior to the Closing, all officers of the Fund were employees of Columbia or its affiliates and the Fund paid its pro-rata share of the expenses for the Chief Compliance Officer under the same fee structure.
Trustees are compensated for their services to the Fund, as set forth on the Statement of Operations. The Trust's eligible Trustees may participate in a non-qualified deferred compensation plan which may be terminated at any time. Any payments to plan participants are paid solely out of the Fund's assets. Income earned on the plan participant's deferral account is based on the rate of return of the eligible mutual funds selected by the participant or, if no funds are selected, on the rate of return of Columbia Money Market Fund (formerly known as RiverSource Cash Management Fund). Prior to the Closing, if no funds were selected, income earned on the plan participant's deferral account was based on the rate of return of BofA Treasury Reserves. Trustees' fees deferred during the current period as well as any gains or losses on the trustees' deferred compensation balances as a result of market fluctuations are included in "Trustees' fees" on the Statement of Operations. Liabilities under the deferred compensation plan are included in "Trustees' fees" on the Statement of Assets and Liabilities.
Other Related Party Transactions
Prior to the Closing, the Fund used one or more brokers that were affiliates of BOA in connection with the purchase and sale of its securities. Total brokerage commissions paid to affiliated brokers for the period prior to the Closing were $9,010.
Note 4. Custody Credits
The Fund has an agreement with its custodian bank under which custody fees may be reduced by balance credits. These credits are recorded as part of expense reductions on the Statement of Operations. The Fund could have invested a portion of the assets utilized in connection with the expense offset arrangement in an income-producing asset if it had not entered into such an agreement. For the year ended February 28, 2011, these custody credits reduced total expenses by $141 for the Fund.
Note 5. Portfolio Information
The cost of purchases and proceeds from sales of securities, excluding short-term obligations, aggregated $1,184,263,770 and $1,392,627,314, respectively, for the year ended February 28, 2011.
Note 6. Redemption Fees
Effective March 1, 2010, the Fund no longer assesses a 2.00% redemption fee on the proceeds from Fund shares that are redeemed within 60 days of purchase. The redemption fee was designed to offset brokerage commissions and other costs associated with short term trading of fund shares. The redemption fees, which were retained by the Fund, were accounted for as an addition to paid-in capital and were allocated to each class based on the relative net assets at the time of the redemption.
Note 7. Shareholder Concentration
As of February 28, 2011, one shareholder account owned 50.3% of the outstanding shares of the Fund. Purchase and redemption activity of this account may have a significant effect on the operations of the Fund.
Note 8. Line of Credit
The Fund and other affiliated funds participate in a $280,000,000 committed, unsecured revolving line of credit provided by State Street. The maximum amount that may be borrowed by any fund is limited to the lesser of $200,000,000 and the Fund's borrowing limit set forth in the Fund's registration statement. Borrowings are available for short-term liquidity or temporary or emergency purposes.
Effective October 14, 2010, interest is charged to each participating fund based on the fund's borrowings at a rate per annum equal to the greater of the Federal Funds Rate plus 1.25% or the overnight LIBOR Rate plus 1.25%. In addition, a commitment fee of 0.125%
27
Columbia Marsico International Opportunities Fund, February 28, 2011
per annum is accrued and apportioned among the participating funds pro rata based on their relative net assets.
Prior to October 14, 2010, interest was charged to each participating fund at the same rates. In addition, a commitment fee of 0.15% per annum was accrued and apportioned among the participating funds pro rata based on their relative net assets.
For the year February 28, 2011, the average daily loan balance outstanding on days where borrowing existed was $1,000,000 at a weighted average interest rate of 1.49%.
Note 9. Federal Tax Information
The timing and character of income and capital gain distributions are determined in accordance with income tax regulations, which may differ from GAAP. Reclassifications are made to the Fund's capital accounts for permanent tax differences to reflect income and gains available for distribution (or available capital loss carryforwards) under income tax regulations.
For the year ended February 28, 2011, permanent book and tax basis differences resulting primarily from differing treatments for passive foreign investment companies (PFIC) adjustments and foreign currency transactions were identified and reclassified among the components of the Fund's net assets as follows:
Overdistributed
Net Investment
Income | | Accumulated
Net Realized
Loss | | Paid-In Capital | |
| $ | (1,494,045 | ) | | $ | 1,786,748 | | | $ | (292,703 | ) | |
Net investment income and net realized gains (losses), as disclosed on the Statement of Operations, and net assets were not affected by this reclassification.
The tax character of distributions paid during the years ended February 28, 2011 and February 28, 2010 was as follows:
| | | February 28, | |
| Distributions paid from: | | 2011 | | 2010 | |
| Ordinary Income* | | $ | 19,278,077 | | | $ | 37,659,160 | | |
* For tax purposes short-term capital gains distributions, if any, are considered ordinary income distributions.
As of February 28, 2011, the components of distributable earnings on a tax basis were as follows:
Undistributed
Ordinary
Income | | Undistributed
Long-Term
Capital Gains | | Net Unrealized
Appreciation* | |
| $ | — | | | $ | — | | | $ | 232,947,233 | | |
* The differences between book-basis and tax-basis net unrealized appreciation are primarily due to deferral of losses from wash sales.
Unrealized appreciation and depreciation at February 28, 2011, based on cost of investments for federal income tax purposes and excluding any unrealized appreciation and depreciation from changes in the value of other assets and liabilities resulting from changes in exchange rates, were:
| Unrealized appreciation | | $ | 236,447,505 | | |
| Unrealized depreciation | | | (3,500,272 | ) | |
| Net unrealized appreciation | | $ | 232,947,233 | | |
The following capital loss carryforwards may be available to reduce taxable income arising from future net realized gains on investments, if any, to the extent permitted by the Internal Revenue Code:
| Year of Expiration | | Capital Loss
Carryforwards | |
| | 2017 | | | $ | 347,884,531 | | |
| | 2018 | | | | 420,548,594 | | |
| | | $ | 768,433,125 | | |
Capital loss carryforwards of $70,038,551 were utilized during the year ended February 28, 2011.
Under current tax rules, certain currency and capital losses realized after October 31 may be deferred and treated as occurring on the first day of the following fiscal year. As of February 28, 2011, post-October currency losses of $4,325,837 attributed to security transactions were deferred to March 1, 2011.
Management is required to determine whether a tax position of the Fund is more likely than not to be sustained upon examination by the applicable taxing authority, including resolution of any related appeals or litigation processes, based on the technical merits of the position. The tax benefit to be recognized by the Fund is measured
28
Columbia Marsico International Opportunities Fund, February 28, 2011
as the largest amount of benefit that is greater than fifty percent likely of being realized upon ultimate settlement. Management is not aware of any tax positions for which it is reasonably possible that the total amounts of unrecognized tax benefits will significantly change in the next twelve months. However, management's conclusions may be subject to review and adjustment at a later date based on factors including, but not limited to, new tax laws, regulations, and administrative interpretations (including relevant court decisions). The Fund's federal tax returns for the prior three fiscal years remain subject to examination by the Internal Revenue Service.
Note 10. Significant Risks and Contingencies
Foreign Securities Risk
Investing in foreign securities may include certain risks and considerations not typically associated with investing in U.S. securities, such as fluctuating currency values and changing local and regional economic, political and social conditions, which may result in greater market volatility. In addition, certain foreign securities may not be as liquid as U.S. securities. Investing in emerging markets may accentuate these risks.
Investments in emerging market countries are subject to additional risk. The risk of foreign investments is typically increased in less developed countries. These countries are also more likely to experience high levels of inflation, deflation or currency devaluation which could hurt their economies and securities markets.
Note 11. Subsequent Events
Management has evaluated the events and transactions that have occurred through the date the financial statements were issued and noted no items requiring adjustment of the financial statements or additional disclosure.
Note 12. Information Regarding Pending and Settled Legal Proceedings
In June 2004, an action captioned John E. Gallus et al. v. American Express Financial Corp. and American Express Financial Advisors Inc. was filed in the United States District Court for the District of Arizona. The plaintiffs allege that they are investors in several American Express Company (now known as RiverSource) mutual funds and they purport to bring the action derivatively on behalf of those funds under the Investment Company Act of 1940. The plaintiffs allege that fees allegedly paid to the defendants by the funds for investment advisory and administrative services are excessive. The plaintiffs seek remedies including restitution and rescission of investment advisory and distribution agreements. The plaintiffs voluntarily agreed to transfer this case to the United States District Court for the District of Minnesota (the District Court). In response to defendants' motion to dismiss the complaint, the District Court dismissed one of plaintiffs' four claims and granted plaintiffs limited discovery. Defendants moved for summary judgment in April 2007. Summary judgment was granted in the defendants' favor on July 9, 2007. The plaintiffs filed a notice of appeal with the Eighth Circuit Court of Appeals (the Eighth Circuit) on August 8, 2007. On April 8, 2009, the Eighth Circuit reversed summary judgment and remanded to the District Court for further proceedings. On August 6, 2009, defendants filed a writ of certiorari with the U.S. Supreme Court (the Supreme Court), asking the Supreme Court to stay the District Court proceedings while the Supreme Court considers and rules in a case captioned Jones v. Harris Associates, which involves issues of law similar to those presented in the Gallus case. On March 30, 2010, the Supreme Court issued its ruling in Jones v. Harris Associates, and on April 5, 2010, the Supreme Court vacated the Eighth Circuit's decision in the Gallus case and remanded the case to the Eighth Circuit for further consideration in light of the Supreme Court's decision in Jones v. Harris Associates. On June 4, 2010, the Eighth Circuit remanded the Gallus case to the District Court for further consideration in light of the Supreme Court's decision in Jones v. Harris Associates. On December 9, 2010, the District Court reinstated its July 9, 2007 summary judgment order in favor of the defendants. On January 10, 2011 plaintiffs filed a notice of appeal with the Eighth Circuit.
In December 2005, without admitting or denying the allegations, American Express Financial Corporation (AEFC, which is now known as Ameriprise Financial, Inc. (Ameriprise Financial)), entered into settlement agreements with the Securities and Exchange Commission (SEC) and Minnesota Department of Commerce (MDOC) related to market timing activities. As a result, AEFC was censured and ordered to cease and desist from committing or causing any violations of certain provisions of the Investment Advisers Act of 1940, the Investment Company Act of 1940, and various Minnesota laws. AEFC agreed to pay disgorgement of $10 million and civil money penalties of $7 million. AEFC also agreed to retain an independent distribution consultant to assist in developing a plan for distribution of all disgorgement and civil penalties ordered by the SEC in accordance with various undertakings detailed at http://www.sec.gov/litigation/admin/ia-2451.pdf. Ameriprise Financial and its affiliates have cooperated with the SEC and the
29
Columbia Marsico International Opportunities Fund, February 28, 2011
MDOC in these legal proceedings, and have made regular reports to the funds' Boards of Directors/Trustees.
Ameriprise Financial and certain of its affiliates have historically been involved in a number of legal, arbitration and regulatory proceedings, including routine litigation, class actions, and governmental actions, concerning matters arising in connection with the conduct of their business activities. Ameriprise Financial believes that the Funds are not currently the subject of, and that neither Ameriprise Financial nor any of its affiliates are the subject of, any pending legal, arbitration or regulatory proceedings that are likely to have a material adverse effect on the Funds or the ability of Ameriprise Financial or its affiliates to perform under their contracts with the Funds. Ameriprise Financial is required to make 10-Q, 10-K and, as necessary, 8-K filings with the Securities and Exchange Commission on legal and regulatory matters that relate to Ameriprise Financial and its affiliates. Copies of these filings may be obtained by accessing the SEC website at www.sec.gov.
There can be no assurance that these matters, or the adverse publicity associated with them, will not result in increased fund redemptions, reduced sale of fund shares or other adverse consequences to the Funds. Further, although we believe proceedings are not likely to have a material adverse effect on the Funds or the ability of Ameriprise Financial or its affiliates to perform under their contracts with the Funds, these proceedings are subject to uncertainties and, as such, we are unable to estimate the possible loss or range of loss that may result. An adverse outcome in one or more of these proceedings could result in adverse judgments, settlements, fines, penalties or other relief that could have a material adverse effect on the consolidated financial condition or results of operations of Ameriprise Financial.
30
Report of Independent Registered Public Accounting Firm
To the Trustees of Columbia Funds Series Trust and the Shareholders of Columbia Marsico International Opportunities Fund
In our opinion, the accompanying statement of assets and liabilities, including the investment portfolio, and the related statements of operations and of changes in net assets and the financial highlights present fairly, in all material respects, the financial position of Columbia Marsico International Opportunities Fund (the "Fund") (a series of Columbia Funds Series Trust) at February 28, 2011, the results of its operations for the year then ended, the changes in its net assets for each of the two years in the period then ended, and the financial highlights for each of the periods indicated, in conformity with accounting principles generally accepted in the United States of America. These financial statements and financial highlights (hereafter referred to as "financial statements") are the responsibility of the Fund's management. Our responsibility is to express an opinion on these financial statements based on our audits. We conducted our audits of these financial statements in accordance with the standards of the Public Company Accounting Oversight Board (United States). Those standards require that we plan and perform the audit to obtain reasonable assurance about whether the financial statements are free of material misstatement. An audit includes examining, on a test basis, evidence supporting the amounts and disclosures in the financial statements, assessing the accounting principles used and significant estimates made by management, and evaluating the overall financial statement presentation. We believe that our audits, which included confirmation of securities at February 28, 2011 by correspondence with the custodian and brokers, provide a reasonable basis for our opinion.
PricewaterhouseCoopers LLP
Boston, Massachusetts
April 21, 2011
31
Federal Income Tax Information (Unaudited) – Columbia Marsico International Opportunities Fund
Foreign taxes paid during the fiscal year ended February 28, 2011 of $2,679,137 are expected to be passed through to shareholders. This represents $0.03 per share. Eligible shareholders may claim this amount as a foreign tax credit.
Gross income derived from sources within foreign countries was $25,269,911 ($0.26 per share) for the fiscal year ended February 28, 2011.
For non-corporate shareholders 78.87%, or the maximum amount allowable under the Jobs and Growth Tax Relief Reconciliation Act of 2003, of ordinary income distributed by the Fund for the fiscal year ended February 28, 2011 may represent qualified dividend income.
The Fund will notify shareholders in January 2012 of amounts for use in preparing 2011 income tax returns.
32
Fund Governance
The Trustees serve terms of indefinite duration. The names, addresses and birth years of the Trustees and Officers of the Funds in the Columbia Funds Series Trust, the year each was first elected or appointed to office, their principal business occupations during at least the last five years, the number of Funds overseen by each Trustee and other directorships they hold are shown below. Each officer listed below serves as an officer of each Fund in the Columbia Funds Series Trust.
Independent Trustees
Name, Address and Year of Birth,
Position with Funds, Year First
Elected or Appointed to Office | | Principal Occupation(s) During Past Five Years, Number of Funds in the Columbia
Funds Complex Overseen by Trustee, Other Directorships Held
| |
| Edward J. Boudreau, Jr. (Born 1944) | |
|
c/o Columbia Management
Investment Advisers, LLC
225 Franklin Street
Boston, MA 02110
Trustee (since 2005) | | Managing Director—E.J. Boudreau & Associates (consulting), from 2000 through current; oversees 44; Trustee—BofA Funds Series Trust. | |
|
| William P. Carmichael (Born 1943) | |
|
c/o Columbia Management
Investment Advisers, LLC
225 Franklin Street
Boston, MA 02110
Trustee (since 1999) | | Retired; Oversees 44; Director—Cobra Electronics Corporation (electronic equipment manufacturer); Director—McMoRan Exploration Company (oil and gas exploration and development); Director—The Finish Line (athletic shoes and apparel); Trustee—BofA Funds Series Trust; Former Director—Simmons Company (bedding). | |
|
| William A. Hawkins (Born 1942) | |
|
c/o Columbia Management
Investment Advisers, LLC
225 Franklin Street
Boston, MA 02110
Trustee (since 2005) | | Managing Director—Overton Partners (financial consulting), August 2010 to present; President and Chief Executive Officer—California General Bank, N.A., from January 2008 through August 2010; oversees 44; Trustee—BofA Funds Series Trust. | |
|
| R. Glenn Hilliard (Born 1943) | |
|
c/o Columbia Management
Investment Advisers, LLC
225 Franklin Street
Boston, MA 02110
Trustee (since 2005) | | Chairman and Chief Executive Officer—Hilliard Group LLC (investing and consulting), from April 2003 through current; Non-Executive Director & Chairman—CNO Financial, Inc. (formerly Conseco, Inc.) (insurance), September 2003 through current; Executive Chairman—Conseco, Inc. (insurance), August 2004 through September 2005; oversees 44; Trustee—BofA Funds Series Trust. | |
|
| John J. Nagorniak (Born 1944) | |
|
c/o Columbia Management
Investment Advisers, LLC
225 Franklin Street
Boston, MA 02110
Trustee (since 2008) | | Retired; President and Director—Foxstone Financial, Inc. (consulting), 2000 through December 2007; Director—Mellon Financial Corporation affiliates (investing), 2000 through 2007; Chairman—Franklin Portfolio Associates (investing—Mellon affiliate), 1982 through 2007; oversees 44; Director—MIT Investment Company; Trustee—MIT 401k Plan. | |
|
33
Fund Governance (continued)
Independent Trustees (continued)
Name, Address and Year of Birth,
Position with Funds, Year First
Elected or Appointed to Office | | Principal Occupation(s) During Past Five Years, Number of Funds in the Columbia
Funds Complex Overseen by Trustee, Other Directorships Held
| |
| Minor M. Shaw (Born 1947) | |
|
c/o Columbia Management
Investment Advisers, LLC
225 Franklin Street
Boston, MA 02110
Trustee (since 2003) | | President—Micco Corporation and Mickel Investment Group; oversees 44; Board Member—Piedmont Natural Gas; Trustee—BofA Funds Series Trust. | |
|
Interested Trustee
| Anthony M. Santomero1 (Born 1946) | |
|
c/o Columbia Management
Investment Advisers, LLC
225 Franklin Street
Boston, MA 02110
Trustee (since 2008) | | Richard K. Mellon Professor Emeritus of Finance, The Wharton School, University of Pennsylvania, from 2002 through current; Senior Advisor—McKinsey & Company (consulting), July 2006 through January 2008; President and Chief Executive Officer—Federal Reserve Bank of Philadelphia, July 2000 through April 2006; oversees 44; Director—Renaissance Reinsurance Ltd; Trustee—Penn Mutual Life Insurance Company; Director—Citigroup, Inc.; Citibank, N.A.; Trustee—BofA Funds Series Trust. | |
|
1 Dr. Santomero is currently deemed by the Columbia Funds to be an "interested person" (as defined in the 1940 Act) of the Funds because he serves as a Director of Citigroup, Inc. and Citibank N.A., companies that may directly or through subsidiaries and affiliates engage from time-to-time in brokerage execution, principal transactions and lending relationships with the Columbia Funds or other funds or accounts advised/managed by the Adviser.
The Statement of Additional Information includes additional information about the Trustees of the Funds and is available, without charge, upon request by calling 800-345-6611.
Officers
| Name, Year of Birth and Address | | Principal Occupation(s) During the Past Five Years | |
| J. Kevin Connaughton (Born 1964) | |
|
225 Franklin Street
Boston, MA 02110
President (since 2009) | | Senior Vice President and General Manager—Mutual Fund Products, Columbia Management Investment Advisers, LLC since May 2010; President, Columbia Funds, since 2009, and RiverSource Funds, since May 2010 (previously Senior Vice President and Chief Financial Officer, Columbia Funds, from June 2008 to January 2009, Treasurer, Columbia Funds, from October 2003 to May 2008, and senior officer of various other affiliated funds since 2000); Managing Director, Columbia Management Advisors, LLC from December 2004 to April 2010. | |
|
| Michael G. Clarke (Born 1969) | |
|
225 Franklin Street
Boston, MA 02110
Senior Vice President and
Chief Financial Officer (since 2009) | | Vice President, Columbia Management Investment Advisers, LLC since May 2010; Managing Director of Fund Administration, Columbia Management Advisors, LLC, from September 2004 to April 2010; senior officer of Columbia Funds and affiliated funds since 2002. | |
|
34
Fund Governance (continued)
Officers (continued)
| Name, Year of Birth and Address | | Principal Occupation(s) During the Past Five Years | |
| Scott R. Plummer (Born 1959) | |
|
5228 Ameriprise Financial Center
Minneapolis, MN 55474
Senior Vice President, Secretary and Chief Legal Officer (since 2010) | | Chief Legal Officer and Assistant Secretary, Columbia Management Investment Advisers, LLC since June 2005; Vice President and Lead Chief Counsel—Asset Management, Ameriprise Financial, Inc. since May 2010 (previously Vice President and Chief Counsel—Asset Management, from 2005 to April 2010, and Vice President—Asset Management Compliance from 2004 to 2005); Vice President, Chief Counsel and Assistant Secretary, Columbia Management Investment Distributors, Inc. since 2008; Vice President, General Counsel and Secretary, Ameriprise Certificate Company since 2005; Chief Counsel, RiverSource Distributors, Inc. since 2006; Vice President, General Counsel and Secretary, RiverSource Funds, since December 2006; Senior Vice President, Secretary and Chief Legal Officer, Columbia Funds, since May 2010. | |
|
| Linda J. Wondrack (Born 1964) | |
|
225 Franklin Street
Boston, MA 02110
Senior Vice President and
Chief Compliance Officer (since 2007) | | Vice President and Chief Compliance Officer, Columbia Management Investment Advisers, LLC since May 2010; Chief Compliance Officer, Columbia Funds, since 2007, and RiverSource Funds, since May 2010; Director (Columbia Management Group, LLC and Investment Product Group Compliance), Bank of America, from June 2005 to April 2010. | |
|
| William F. Truscott (Born 1960) | |
|
53600 Ameriprise Financial Center
Minneapolis, MN 55474
Senior Vice President (since 2010) | | Chairman of the Board, Columbia Management Investment Advisers, LLC since May 2010 (previously President, Chairman of the Board and Chief Investment Officer, from 2001 to April 2010); Chief Executive Officer, U.S. Asset Management & President, Annuities, Ameriprise Financial, Inc. since May 2010 (previously President—U.S. Asset Management and Chief Investment Officer from 2005 to April 2010, and Senior Vice President—Chief Investment Officer, from 2001 to 2005); Director, President and Chief Executive Officer, Ameriprise Certificate Company since 2006; Director, Columbia Management Investment Distributors, Inc. since May 2010 (previously Chairman of the Board and Chief Executive Officer from 2008 to April 2010); Chairman of the Board and Chief Executive Officer, RiverSource Distributors, Inc. since 2006. | |
|
| Colin Moore (Born 1958) | |
|
225 Franklin Street
Boston, MA 02110
Senior Vice President (since 2010) | | Director and Chief Investment Officer, Columbia Management Investment Advisers, LLC since May 2010; Manager, Managing Director and Chief Investment Officer of Columbia Management Advisors, LLC from 2007 to April 2010; Head of Equities, Columbia Management Advisors, LLC from 2002 to 2007. | |
|
| Michael A. Jones (Born 1959) | |
|
225 Franklin Street
Boston, MA 02110
Senior Vice President (since 2010) | | President and Director, Columbia Management Investment Advisers, LLC since May 2010; President and Director, Columbia Management Investment Distributors, Inc. since May 2010; Manager, Chairman, Chief Executive Officer and President, Columbia Management Advisors, LLC from 2007 to April 2010; Chief Executive Officer, President and Director, Columbia Management Distributors, Inc. from November 2006 to April 2010; previously, co-president and senior managing director at Robeco Investment Management. | |
|
35
Fund Governance (continued)
Officers (continued)
| Name, Year of Birth and Address | | Principal Occupation(s) During the Past Five Years | |
| Amy Johnson (Born 1965) | |
|
5228 Ameriprise Financial Center
Minneapolis, MN 55474
Senior Vice President (since 2010) | | Senior Vice President and Chief Operating Officer, Columbia Management Investment Advisers, LLC since May 2010 (previously Chief Administrative Officer, from 2009 until April 2010, Vice President—Asset Management and Trust Company Services, from 2006 to 2009, and Vice President—Operations and Compliance from 2004 to 2006). | |
|
| Joseph F. DiMaria (Born 1968) | |
|
225 Franklin Street
Boston, MA 02110
Treasurer (since 2010) and
Chief Accounting Officer (since 2008) | | Vice President, Mutual Fund Administration, Columbia Management Investment Advisers, LLC, since May 2010; Director of Fund Administration, Columbia Management Advisors, LLC from January 2006 to April 2010; Head of Tax/Compliance and Assistant Treasurer, Columbia Management Advisors, LLC, from November 2004 to December 2005. | |
|
| Marybeth Pilat (Born 1968) | |
|
225 Franklin Street
Boston, MA 02110
Deputy Treasurer (since 2010) | | Vice President, Mutual Fund Administration, Columbia Management Investment Advisers, LLC, since May 2010; Vice President, Investment Operations, Bank of America, from October 2008 to April 2010; Finance Manager, Boston Children's Hospital from August 2008 to October 2008; Director, Mutual Fund Administration, Columbia Management Advisors, LLC, from May 2007 to July 2008; Vice President, Mutual Fund Valuation, Columbia Management Advisors, LLC, from January 2006 to May 2007; Vice President, Mutual Fund Accounting Oversight, Columbia Management Advisors, LLC from January 2005 to January 2006. | |
|
| Julian Quero (Born 1967) | |
|
225 Franklin Street
Boston, MA 02110
Deputy Treasurer (since 2008) | | Vice President, Mutual Fund Administration, Columbia Management Investment Advisers, LLC since May 2010; Director of Fund Administration, Columbia Management Advisors, LLC, from August 2008 to April 2010; Senior Tax Manager, Columbia Management Advisors, LLC from August 2006 to July 2008; Senior Compliance Manager, Columbia Management Advisors, LLC from April 2002 to August 2006. | |
|
| Stephen T. Welsh (Born 1957) | |
|
225 Franklin Street
Boston, MA 02110
Vice President (since 2006) | | President and Director, Columbia Management Investment Services Corp. since May 2010; President and Director, Columbia Management Services, Inc. from July 2004 to April 2010; Managing Director, Columbia Management Distributors, Inc. from August 2007 to April 2010. | |
|
36
Shareholder Meeting Results
At a Joint Special Meeting of Shareholders held on February 15, 2011, shareholders of the series of Columbia Funds Series Trust, including the Fund, elected each of the nominees for trustees to the Board of Trustees of Columbia Funds Series Trust, each to hold office for an indefinite term, as follows:
| Trustee | | Votes For | | Votes Withheld | | Abstentions | |
| Kathleen Blatz | | | 2,145,636,122 | | | | 248,012,438 | | | | 0 | | |
| Edward J. Boudreau, Jr. | | | 2,145,430,114 | | | | 248,218,446 | | | | 0 | | |
| Pamela G. Carlton | | | 2,145,515,949 | | | | 248,132,612 | | | | 0 | | |
| William P. Carmichael | | | 2,145,038,695 | | | | 248,609,866 | | | | 0 | | |
| Patricia M. Flynn | | | 2,145,843,563 | | | | 247,804,997 | | | | 0 | | |
| William A. Hawkins | | | 2,145,359,401 | | | | 248,289,160 | | | | 0 | | |
| R. Glenn Hilliard | | | 2,145,079,400 | | | | 248,569,161 | | | | 0 | | |
| Stephen R. Lewis, Jr. | | | 2,145,092,209 | | | | 248,556,351 | | | | 0 | | |
| John F. Maher | | | 2,145,621,338 | | | | 248,027,223 | | | | 0 | | |
| John J. Nagorniak | | | 2,145,337,494 | | | | 248,311,067 | | | | 0 | | |
| Catherine James Paglia | | | 2,145,615,254 | | | | 248,033,306 | | | | 0 | | |
| Leroy C. Richie | | | 2,145,042,120 | | | | 248,606,441 | | | | 0 | | |
| Anthony M. Santomero | | | 2,145,088,174 | | | | 248,560,386 | | | | 0 | | |
| Minor M. Shaw | | | 2,145,430,762 | | | | 248,217,798 | | | | 0 | | |
| Alison Taunton-Rigby | | | 2,145,393,384 | | | | 248,255,177 | | | | 0 | | |
| William F. Truscott | | | 2,144,907,223 | | | | 248,741,338 | | | | 0 | | |
37
This page intentionally left blank.
This page intentionally left blank.
This page intentionally left blank.
Important Information About This Report
The fund mails one shareholder report to each shareholder address. If you would like more than one report, please call shareholder services at 1-800-345-6611 and additional reports will be sent to you. This report has been prepared for shareholders of Columbia Marsico International Opportunities Fund.
A description of the policies and procedures that the fund uses to determine how to vote proxies and a copy of the fund's voting records are available (i) at www.columbiamanagement.com, (ii) on the Securities and Exchange Commission's website at www.sec.gov, and (iii) without charge, upon request, by calling 1-800-368-0346. Information regarding how the fund voted proxies relating to portfolio securities during the 12-month period ended June 30 is available from the SEC's website. Information regarding how the fund voted proxies relating to portfolio securities is also available from the fund's website, www.columbiamanagement.com.
The fund files a complete schedule of portfolio holdings with the SEC for the first and third quarters of each fiscal year on Form N-Q. The fund's Form N-Q is available on the SEC's website at www.sec.gov and may be reviewed and copied at the SEC's Public Reference Room in Washington, D.C. Information on the operation of the Public Reference Room may be obtained by calling 1-800-SEC-0330.
Transfer Agent
Columbia Management Investment
Services Corp.
P.O. Box 8081
Boston, MA 02266-8081
1-800-345-6611
Distributor
Columbia Management Investment
Distributors, Inc.
225 Franklin Street
Boston, MA 02110
Investment Manager
Columbia Management Investment Advisers, LLC
225 Franklin Street
Boston, MA 02110
41

PRSRT STD
U.S. Postage
PAID
Holliston, MA
Permit NO. 20
Columbia Marsico International Opportunities Fund
P. O. Box 8081
Boston, MA 02266-8081
columbiamanagement.com
This information is for use with concurrent or prior delivery of a fund prospectus. Investors should consider the investment objectives, risks, charges and expenses of a mutual fund carefully before investing. For a free prospectus, which contains this and other important information about the funds, visit columbiamanagement.com. Read the prospectus carefully before investing. The Fund is distributed by Columbia Management Investment Distributors, Inc., member FINRA, and managed by Columbia Management Investment Advisers, LLC.
© 2011 Columbia Management Investment Advisers, LLC. All rights reserved.
C-1276 A (04/11)

Columbia Multi-Advisor International Equity Fund
Annual Report for the Period Ended February 28, 2011
Not FDIC insured • No bank guarantee • May lose value
Table of Contents
| Fund Profile | | | 1 | | |
|
| Economic Update | | | 2 | | |
|
| Performance Information | | | 4 | | |
|
| Understanding Your Expenses | | | 5 | | |
|
| Portfolio Managers' Report | | | 6 | | |
|
| Investment Portfolio | | | 8 | | |
|
Statement of Assets and
Liabilities | | | 15 | | |
|
| Statement of Operations | | | 17 | | |
|
Statement of Changes in
Net Assets | | | 18 | | |
|
| Financial Highlights | | | 20 | | |
|
| Notes to Financial Statements | | | 27 | | |
|
Report of Independent Registered
Public Accounting Firm | | | 39 | | |
|
| Federal Income Tax Information | | | 40 | | |
|
| Fund Governance | | | 41 | | |
|
Board Consideration and Approval
of Amendment to Investment
Management Services Agreement | | | 45 | | |
|
Board Consideration and Approval
of Subadvisory Agreement | | | 49 | | |
|
Summary of Management Fee
Evaluation by Independent
Fee Consultant | | | 52 | | |
|
| Shareholder Meeting Results | | | 54 | | |
|
Important Information About
This Report | | | 57 | | |
|
The views expressed in this report reflect the current views of the respective parties. These views are not guarantees of future performance and involve certain risks, uncertainties and assumptions that are difficult to predict, so actual outcomes and results may differ significantly from the views expressed. These views are subject to change at any time based upon economic, market or other conditions and the respective parties disclaim any responsibility to update such views. These views may not be relied on as investment advice and, because investment decisions for a Columbia Fund are based on numerous factors, may not be relied on as an indication of trading intent on behalf of any particular Columbia Fund. References to specific securities should not be construed as a recommendation or investment advice.
President's Message

Dear Shareholder:
The Columbia Management story began over 100 years ago, and today, we are one of the nation's largest dedicated asset managers. The recent acquisition by Ameriprise Financial, Inc. brings together the talents, resources and capabilities of Columbia Management with those of RiverSource Investments, Threadneedle (acquired by Ameriprise in 2003) and Seligman Investments (acquired by Ameriprise in 2008) to build a best-in-class asset management business that we believe is truly greater than its parts.
RiverSource Investments traces its roots to 1894 when its then newly-founded predecessor, Investors Syndicate, offered a face-amount savings certificate that gave small investors the opportunity to build a safe and secure fund for retirement, education or other special needs. A mutual fund pioneer, Investors Syndicate launched Investors Mutual Fund in 1940. In the decades that followed, its mutual fund products and services lineup grew to include a full spectrum of styles and specialties. More than 110 years later, RiverSource continues to be a trusted financial products leader.
Threadneedle, a leader in global asset management and one of Europe's largest asset managers, offers sophisticated international experience from a dedicated U.K. management team. Headquartered in London, it is named for Threadneedle Street in the heart of the city's financial district, where British investors pioneered international and global investing. Threadneedle was acquired in 2003 and today operates as an affiliate of Columbia Management.
Seligman Investments' beginnings date back to the establishment of the investment firm J. & W. Seligman & Co. in 1864. In the years that followed, Seligman played a major role in the geographical expansion and industrial development of the United States. In 1874, President Ulysses S. Grant named Seligman as fiscal agent for the U.S. Navy—an appointment that would last through World War I. Seligman helped finance the westward path of the railroads and the building of the Panama Canal. The firm organized its first investment company in 1929 and began managing its first mutual fund in 1930. In 2008, J. & W. Seligman & Co. Incorporated was acquired and Seligman Investments became an offering brand of RiverSource Investments, LLC.
We are proud of the rich and distinctive history of these firms, the strength and breadth of products and services they offer, and the combined cultures of pioneering spirit and forward thinking. Together we are committed to providing more for our shareholders than ever before.
> A singular focus on our shareholders
Our business is asset management, so investors are our first priority. We dedicate our resources to identifying timely investment opportunities and provide a comprehensive choice of equity, fixed-income and alternative investments to help meet your individual needs.
> First-class research and thought leadership
We are dedicated to helping you take advantage of today's opportunities and anticipate tomorrow's. We stay abreast of the latest investment trends and ideas, using our collective insight to evaluate events and transform them into solutions you can use.
> A disciplined investment approach
We aren't distracted by passing fads. Our teams adhere to a rigorous investment process that helps ensure the integrity of our products and enables you and your financial advisor to match our solutions to your objectives with confidence.
When you choose Columbia Management, you can be confident that we will take the time to understand your needs and help you and your financial advisor identify the solutions that are right for you. Because at Columbia Management, we don't consider ourselves successful unless you are.
Sincerely,

J. Kevin Connaughton
President, Columbia Funds
Investors should consider the investment objectives, risks, charges and expenses of a mutual fund carefully before investing. For a free prospectus, which contains this and other important information about the funds, visit www.columbiamanagement.com. The prospectus should be read carefully before investing.
Columbia Funds are distributed by Columbia Management Investment Distributors, Inc., member FINRA, and managed by Columbia Management Investment Advisers, LLC.
© 2011 Columbia Management Investment Advisers, LLC. All rights reserved.
Fund Profile – Columbia Multi-Advisor International Equity Fund
Summary
g For the 12-month period that ended February 28, 2011, the fund's Class A shares returned 18.80% without sales charge.
g The MSCI EAFE Index (Net)1 returned 20.00%. The average return of the funds in its peer group, the Lipper International Large-Cap Core Funds Classification,2 returned 19.49%.
g In the Columbia-advised portion of the fund, stock selection, most notably in the consumer discretionary sector, held back relative performance. The negative impact of currency fluctuations and disappointing results from financials investments detracted from return in the Marsico-managed segment of the fund.
Portfolio Management
The fund is managed by Marsico Capital Management, LLC (MCM) and Columbia Management Investment Advisers, LLC (CMIA). Each manages approximately one-half of the fund's assets. James G. Gendelman has managed MCM's portion of the fund since 2000. In 2010, Munish Malhotra joined James G. Gendelman as co-manager of MCM's portion of the fund. Fred Copper has co-managed CMIA's portion of the fund since 2009 and has been associated with the fund or its predecessors since 2005. Colin Moore has co-managed CMIA's portion of the fund since 2009 and has been associated with the fund or its predecessors since 2002.
CMIA retained MCM to serve as investment subadviser to the Columbia Marsico funds. As an investment subadviser, MCM makes the investment decisions and manages a portion of the fund. MCM is an investment adviser registered with the Securities and Exchange Commission. MCM is not affiliated with CMIA.
1The Morgan Stanley Capital International Europe, Australasia, Far East (MSCI EAFE) Index (Net) is a free float-adjusted market capitalization index that is designed to measure the equity market performance of developed markets, excluding the U.S. and Canada. As of May 27, 2010 the MSCI EAFE Index (Net) consisted of the following 22 developed market country indices: Australia, Austria, Belgium, Denmark, Finland, France, Germany, Greece, Hong Kong, Ireland, Israel, Italy, Japan, the Netherlands, New Zealand, Norway, Portugal, Singapore, Spain, Sweden, Switzerland, and the United Kingdom.
2Lipper Inc., a widely respected data provider in the industry, calculates an average total return (assuming reinvestment of distributions) for mutual funds with investment objectives similar to those of the fund. Lipper makes no adjustment for the effect of sales loads.
Indices are not available for investment, are not professionally managed and do not reflect sales charges, fees, brokerage commissions, taxes or other expenses of investing. Securities in the fund may not match those in an index.
Performance data quoted represents past performance and current performance may be lower or higher. Past performance is no guarantee of future results. The investment return and principal value will fluctuate so that shares, when redeemed, may be worth more or less than the original cost. Please visit www.columbiamanagement.com for daily and most recent month-end performance updates.
Summary
1-year return as of 02/28/11
| | +18.80% | |
|
|  | | | Class A shares
(without sales charge) | |
|
| | +20.00% | |
|
|  | | | MSCI EAFE Index (Net) | |
|
Morningstar Style BoxTM
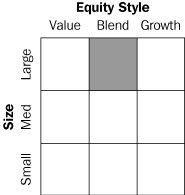
The Morningstar Style BoxTM is based on the fund's portfolio holdings. For equity funds, the vertical axis shows the market capitalization of the stocks owned, and the horizontal axis shows investment style (value, blend, or growth). Information shown is based on the most recent data provided by Morningstar.
© 2011 Morningstar, Inc. All rights reserved. The Morningstar information contained herein: (1) is proprietary to Morningstar and/or its content providers; (2) may not be copied or distributed; and (3) is not warranted to be accurate, complete or timely. Neither Morningstar nor its content providers are responsible for any damages or losses arising from any use of this information.
1
Economic Update – Columbia Multi-Advisor International Equity Fund
Summary
For the 12-month period that ended February 28, 2011
g Despite intermittent volatility, stock markets around the world gained ground, as measured by the S&P 500 Index, the MSCI EAFE Index (Net) and the MSCI Emerging Markets Index (Net).
| S&P Index | | MSCI EAFE
Index | |
|
 | |  | |
|
| | MSCI EM Index | |
|
 | | | |
|
As the world shed concerns that key economies might lapse back into recession, the World Bank reported that global gross domestic product rose 3.9% in 2010. The improvement over 2009 was more notable in high-income developed economies than in emerging-market countries, which had less ground to make up. Emerging market countries expanded by an estimated 7%, contributing nearly half of all global growth in 2010. This two-speed global recovery is likely to result in slower growth in 2011, but global growth should remain solid at 3.3% to 3.6%1—higher in emerging market economies, led by China and India.
Robust expansion in the Asia Pacific region
Asian Pacific economies led the global economy in 2010 and are poised to continue in that role. Exports from markets such as Singapore and South Korea have been solid and domestic demand continues to strengthen. Labor markets are healthy, income is rising and confidence runs high across the region. Higher oil prices pose a downside risk to the current expansion, because it could erode demand for Asian exports and increase the risk of inflation. However, if growth exceeds expectations in the United States or Europe, the picture gets even better for Asia.
Austerity measures weigh on Europe
Growth in the developed world was hampered by a debt crisis in Europe's weakest nations. However, the European Union took steps to manage debt restructuring in an orderly fashion and fear subsided—at least, for now. In addition, austerity measures were introduced in Greece, Ireland, Portugal and Spain. Public employment and government spending were cut back sharply. Layoffs and pay cuts have been met with resistance, but their necessity is hard to dispute.
Inflation a growing worry
As demand picked up and commodity prices began to rise across the globe, inflation has become a growing worry in both fast-growing emerging markets and slower-growth developed countries. In developed market economies, inflation is generally an external force, resulting from higher commodity prices, especially for food and energy. In emerging markets, excess demand is driving inflation concerns and policymakers have begun to shift their focus from stimulating growth to taming inflation. However, rising food prices are also a problem in Asia since food accounts for a greater percentage of household budgets than it does in more developed areas of the world.
Stocks stall, then pick up steam
Despite a period of volatility in the summer of 2010, as the world sought to digest a mounting debt crisis within euro-zone countries, it was a good year for stock markets around the world. The U.S. stock market returned 22.57% for the 12-month period, as measured by the S&P 500 Index.2 Outside the U.S., stock market returns were also strong. The MSCI EAFE Index (Net),3 a broad
1World Bank estimate, January 12, 2011.
2The Standard & Poor's (S&P) 500 Index tracks the performance of 500 widely held, large-capitalization U.S. stocks.
3The Morgan Stanley Capital International Europe, Australasia, Far East (MSCI EAFE) Index (Net) is a free float adjusted market capitalization index that is designed to measure the equity market performance of developed markets, excluding the U.S. & Canada. As of May 27, 2010, the MSCI EAFE Index (Net) consisted of the following 22 developed market country indices: Australia, Austria, Belgium, Denmark, Finland, France, Germany, Greece, Hong Kong, Ireland, Israel, Italy, Japan, the Netherlands, New Zealand, Norway, Portugal, Singapore, Spain, Sweden, Switzerland and the United Kingdom.
2
Economic Update (continued) – Columbia Multi-Advisor International Equity Fund
gauge of stock market performance in foreign developed markets, gained 20.00% (in U.S. dollars) for the period. The MSCI Emerging Markets Index (Net)4 returned 20.91% (in U.S. dollars), led by strong performances from European and Eastern European markets. Rising inflation pressures and tighter monetary policy late in the 12-month period tempered returns.
Past performance is no guarantee of future results.
4The Morgan Stanley Capital International Emerging Markets (MSCI EM) Index (Net) is a free float-adjusted market capitalization index that is designed to measure equity market performance of emerging markets. As of May 27, 2010, the MSCI EM Index (Net) consisted of the following 21 emerging market country indices: Brazil, Chile, China, Colombia, Czech Republic, Egypt, Hungary, India, Indonesia, Korea, Malaysia, Mexico, Morocco, Peru, Philippines, Poland, Russia, South Africa, Taiwan, Thailand and Turkey.
3
Performance Information – Columbia Multi-Advisor International Equity Fund
Performance data quoted represents past performance and current performance may be lower or higher. Past performance is no guarantee of future results. The investment return and principal value will fluctuate so that shares, when redeemed, may be worth more or less than the original cost. Please visit www.columbiamanagement.com for daily and most recent month-end performance updates.
Performance of a $10,000 investment 03/01/01 – 02/28/11
The chart above shows the change in value of a hypothetical $10,000 investment in Class A shares of Columbia Multi-Advisor International Equity Fund during the stated time period, and does not reflect the deduction of taxes that a shareholder may pay on fund distributions or on the redemption of fund shares.
Performance of a $10,000 investment 03/01/01 – 02/28/11 ($)
| Sales charge | | without | | with | |
| Class A | | | 14,676 | | | | 13,832 | | |
| Class B | | | 13,492 | | | | 13,492 | | |
| Class C | | | 13,707 | | | | 13,707 | | |
| Class I | | | n/a | | | | n/a | | |
| Class R | | | 14,486 | | | | n/a | | |
| Class W | | | n/a | | | | n/a | | |
| Class Z | | | 14,913 | | | | n/a | | |
Average annual total return as of 02/28/11 (%)
| Share class | | A | | B | | C | | I | | R | | W | | Z | |
| Inception | | 06/03/92 | | 06/07/93 | | 06/17/92 | | 09/27/10 | | 01/23/06 | | 09/27/10 | | 12/02/91 | |
| Sales charge | | without | | with | | without | | with | | without | | with | | without | | without | | without | | without | |
| 1-year | | | 18.80 | | | | 11.98 | | | | 17.88 | | | | 12.88 | | | | 17.89 | | | | 16.89 | | | | n/a | | | | 18.47 | | | | n/a | | | | 19.08 | | |
| 5-year | | | 0.98 | | | | –0.20 | | | | 0.22 | | | | –0.08 | | | | 0.23 | | | | 0.23 | | | | n/a | | | | 0.73 | | | | n/a | | | | 1.24 | | |
| 10-year/Life | | | 3.91 | | | | 3.30 | | | | 3.04 | | | | 3.04 | | | | 3.20 | | | | 3.20 | | | | 10.69 | | | | 3.78 | | | | 10.52 | | | | 4.08 | | |
The "with sales charge" returns include the maximum initial sales charge of 5.75% for Class A shares and the applicable contingent deferred sales charge of 5.00% in the first year, declining to 1.00% in the sixth year and eliminated thereafter for Class B shares and 1.00% for Class C shares for the first year only. The "without sales charge" returns do not include the effect of sales charges. If they had, returns would have been lower.
Performance results reflect any fee waivers or reimbursements of fund expenses by the Investment Manager and/or any of its affiliates. Absent these fee waivers or expense reimbursement arrangements, performance results would have been lower.
All results shown assume reinvestment of distributions. Class I shares and Class Z shares are sold at net asset value with no distribution and service (Rule 12b-1) fees. Class R shares and Class W shares are sold at net asset value with a distribution (Rule 12b-1) fee. Class I, Class R, Class W and Class Z shares have limited eligibility and the investment minimum requirements may vary. Please see the fund's prospectus for details. Performance for different share classes will vary based on differences in sales charges and fees associated with each class.
Class I and Class W shares were initially offered on September 27, 2010.
The tables do not reflect the deduction of taxes that a shareholder may pay on fund distributions or on the redemption of fund shares.
The performance results shown for Class R shares prior to their inception date is that of Class A shares. If Class R shares fees and expenses were included, performance results would have been lower.
4
Understanding Your Expenses – Columbia Multi-Advisor International Equity Fund
As a fund shareholder, you incur two types of costs. There are transaction costs, which generally include sales charges on purchases and may include redemption fees or exchange fees. There are also ongoing costs, which generally include investment advisory fees, distribution and service (Rule 12b-1) fees and other fund expenses. The information on this page is intended to help you understand the ongoing costs of investing in the fund and to compare these costs with the ongoing costs of investing in other mutual funds.
Analyzing your fund's expenses by share class
To illustrate these ongoing costs, we have provided an example and calculated the expenses paid by investors in each share class during the period. The information in the following table is based on an initial investment of $1,000, which is invested at the beginning of the period and held for the entire period. Expense information is calculated two ways and each method provides you with different information. The amount listed in the "Actual" column is calculated using the fund's actual operating expenses and total return for the period. The amount listed in the "Hypothetical" column for each share class assumes that the return each year is 5% before expenses and is calculated based on the fund's actual operating expenses. You should not use the hypothetical account values and expenses to estimate either your actual account balance at the end of the period or the expenses you paid during this period.
Compare with other funds
Since all mutual funds are required to include the same hypothetical calculations about expenses in shareholder reports, you can use this information to compare the ongoing cost of investing in the fund with other funds. To do so, compare the 5% hypothetical example with the 5% hypothetical examples that appear in the shareholder reports of other funds. As you compare hypothetical examples of other funds, it is important to note that hypothetical examples are meant to highlight the ongoing costs of investing in a fund and do not reflect any transaction costs, such as sales charges, redemption fees or exchange fees.
Estimating your actual expenses
To estimate the expenses that you paid over the period, first you will need your account balance at the end of the period:
g For shareholders who receive their account statements from Columbia Management Investment Services Corp., your account balance is available online at www.columbiamanagement.com or by calling Shareholder Services at 800.345.6611.
g For shareholders who receive their account statements from their financial intermediary, contact your financial intermediary to obtain your account balance.
1. Divide your ending account balance by $1,000. For example, if an account balance was $8,600 at the end of the period, the result would be 8.6.
2. In the section of the table below titled "Expenses paid during the period," locate the amount for your share class. You will find this number in the column labeled "Actual." Multiply this number by the result from step 1. Your answer is an estimate of the expenses you paid on your account during the period.
If the value of your account falls below the minimum initial investment requirement applicable to you, your account may be subject to a $20 annual fee. This fee is not included in the accompanying table. If you are subject to the fee, keep it in mind when you are estimating the ongoing expenses of investing in the fund and when comparing the expenses of this fund with other funds.
09/01/10 – 02/28/11
| | | Account value at the
beginning of the period ($) | | Account value at the
end of the period ($) | | Expenses paid
during the period ($) | | Fund's annualized
expense ratio (%) | |
| | | Actual | | Hypothetical | | Actual | | Hypothetical | | Actual | | Hypothetical | | Actual | |
| Class A | | | 1,000.00 | | | | 1,000.00 | | | | 1,220.00 | | | | 1,018.05 | | | | 7.49 | | | | 6.80 | | | | 1.36 | | |
| Class B | | | 1,000.00 | | | | 1,000.00 | | | | 1,216.20 | | | | 1,014.33 | | | | 11.59 | | | | 10.54 | | | | 2.11 | | |
| Class C | | | 1,000.00 | | | | 1,000.00 | | | | 1,215.50 | | | | 1,014.33 | | | | 11.59 | | | | 10.54 | | | | 2.11 | | |
| Class I | | | 1,000.00 | | | | 1,000.00 | | | | 1,037.00 | * | | | 1,020.08 | | | | 4.08 | * | | | 4.76 | | | | 0.95 | | |
| Class R | | | 1,000.00 | | | | 1,000.00 | | | | 1,219.00 | | | | 1,016.81 | | | | 8.86 | | | | 8.05 | | | | 1.61 | | |
| Class W | | | 1,000.00 | | | | 1,000.00 | | | | 1,036.60 | * | | | 1,018.35 | | | | 5.59 | * | | | 6.51 | | | | 1.30 | | |
| Class Z | | | 1,000.00 | | | | 1,000.00 | | | | 1,221.40 | | | | 1,019.29 | | | | 6.11 | | | | 5.56 | | | | 1.11 | | |
Expenses paid during the period are equal to the annualized expense ratio for the share class, multiplied by the average account value over the period, then multiplied by the number of days in the fund's most recent fiscal half-year and divided by 365.
It is important to note that the expense amounts shown in the table are meant to highlight only ongoing costs of investing in the fund and do not reflect any transaction costs, such as sales charges, redemption fees or exchange fees. Therefore, the hypothetical examples provided may not help you determine the relative total costs of owning shares of different funds. If these transaction costs were included, your costs would have been higher.
*For the period September 27, 2010 through February 28, 2011. Class I and Class W shares commenced operations on September 27, 2010.
5
Portfolio Managers' Report – Columbia Multi-Advisor International Equity Fund
Performance data quoted represents past performance and current performance may be lower or higher. Past performance is no guarantee of future results. The investment return and principal value will fluctuate so that shares, when redeemed, may be worth more or less than the original cost. Please visit www.columbiamanagement.com for daily and most recent month-end performance updates.
Net asset value per share
as of 02/28/11 ($)
| Class A | | | 12.46 | | |
| Class B | | | 11.34 | | |
| Class C | | | 11.20 | | |
| Class I | | | 12.62 | | |
| Class R | | | 12.45 | | |
| Class W | | | 12.46 | | |
| Class Z | | | 12.62 | | |
Distributions declared per share
03/01/10 – 02/28/11 ($)
| Class A | | | 0.21 | | |
| Class B | | | 0.14 | | |
| Class C | | | 0.14 | | |
| Class I | | | 0.25 | | |
| Class R | | | 0.19 | | |
| Class W | | | 0.21 | | |
| Class Z | | | 0.24 | | |
For the 12-month period that ended February 28, 2011, the fund's Class A shares returned 18.80% without sales charge. The fund's benchmark, the MSCI EAFE Index (Net), returned 20.00%. The average return of the fund's peer group, the Lipper International Large-Cap Core Funds Classification, was 19.49%. Stock selection detracted from the fund's return relative to the index. In the Columbia-advised portion of the fund, stock selection in the consumer discretionary sector was the primary detractor. In the Marsico-advised portion of the fund, financials lagged and the negative impact of fluctuating currency was also a factor.
Defensive consumer stocks held back Columbia portfolio
The Columbia-advised portfolio was positioned to take advantage of a continuing global economic rebound. However, the fund had more exposure than the index to defensive consumer discretionary stocks, which hurt relative performance. Stock-specific disappointments from Game Group and Altek (0.2% and 0.3% of net assets, respectively) also detracted from relative returns. A U.K.-based video game software retailer, Game Group experienced heightened competition from on-line software sales, compounded by the lack of new game hardware platforms to stimulate software sales. Operating margins at Altek, a Taiwanese camera manufacturer, contracted because of higher lens prices. Meanwhile, AWE (0.2% of net assets), an Australian oil exploration and production holding, experienced a setback in its exploration program.
Stock selection aided returns in the financials group. Intermediate Capital Group (0.5% of net assets) and Brit Insurance Holdings, two U.K. investments, performed particularly well. Intermediate Capital, a non-bank corporate lender, improved its market position when bank competitors slowed lending because of balance sheet problems. Brit Insurance, a property-and-casualty insurer, was acquired by a private equity firm at a premium price. Japan-domiciled Miraca (0.4% of net assets), a health care diagnostic services company, and Daiichikosho (0.6% of net assets), a karaoke equipment firm, also benefited returns.
Stock selection drove Marsico portfolio results
Stock selection in the consumer discretionary, information technology, materials and industrials sectors aided performance. In addition, the fund was overweight in the strong-performing consumer discretionary sector, which benefited returns. Within the consumer discretionary sector, Swiss watch manufacturer Swatch, Spanish clothing manufacturer Inditex and Japanese Internet retailer DeNA (1.5%, 1.2% and 0.6% of net assets, respectively) performed well. An investment in Hong Kong-based Li & Fung, a manufacturer and distributor of retail goods (1.7% of net assets) also helped. In information technology, Baidu (0.5% of net assets), a Chinese Internet search firm, and HTC, a Taiwanese hand-held communications device manufacturer that we sold, were top performers. In materials, German chemical company BASF and Canadian miner Teck Resources (2.1% and 0.6% of net assets, respectively) performed well. In industrials, Schneider Electric (1.4% of net assets), a French electrical equipment company, added to returns.
The fund's relatively light exposure to the Japanese yen and the Australian dollar detracted from performance when those currencies gained against the U.S. dollar. Currency weights in the Marsico portfolio flow from stock and sector decisions rather than any active currency policies. Selections in the financials sector also held back results.
6
Portfolio Managers' Report (continued) – Columbia Multi-Advisor International Equity Fund
Looking ahead
The Columbia managers believe that the global economic expansion should persist, offering continuing opportunities in stocks compared to other asset classes. Managers believe stocks should do well over the longer term, despite immediate challenges posed by political unrest in the Middle East and the potential for recurring government debt problems in Europe. Any market weakness would be viewed as a buying opportunity.
At year end, the Marsico managers placed the greatest emphasis on investments in the consumer discretionary, financials, industrials, consumer staples and materials sectors. By country, the largest allocations were to Japan, the United Kingdom, France, Germany and Switzerland. Exposure to Japan and the United Kingdom were lower than those within the MSCI benchmark.
Sources for all statistical data—Columbia Management Investment Advisers, LLC.
Source for all stock-specific commentary—Marsico Capital Management, LLC and Columbia Management Investment Advisers, LLC.
Portfolio characteristics and holdings are subject to change periodically and may not be representative of current characteristics and holdings. The outlook for the fund may differ from those presented for other Columbia Funds.
Equity securities are affected by stock market fluctuations that occur in response to economic and business developments.
International investing may involve certain risks, including currency fluctuations, risks associated with possible differences in financial accounting standards and other monetary and political risks. Significant levels of foreign taxes, including potentially confiscatory levels of taxation and withholding taxes, may also apply to some foreign investments.
Investing in emerging markets may involve greater risks than investing in more developed countries. In addition, concentration of investments in a single region may result in greater volatility.
Top 5 sectors
as of 02/28/11 (%)
| Financials | | | 24.9 | | |
| Consumer Discretionary | | | 15.0 | | |
| Industrials | | | 12.9 | | |
| Energy | | | 10.0 | | |
| Materials | | | 7.6 | | |
Top 10 holdings
as of 02/28/11 (%)
| OGX Petroleo e Gas Participacoes | | | 2.2 | | |
| BASF SE | | | 2.0 | | |
| Li & Fung | | | 1.7 | | |
| Total | | | 1.6 | | |
| Royal Dutch Shell | | | 1.6 | | |
| BNP Paribas | | | 1.5 | | |
| Swatch Group | | | 1.5 | | |
| Nestle | | | 1.4 | | |
| Schneider Electric | | | 1.4 | | |
| Anheuser-Busch InBev | | | 1.3 | | |
The fund is actively managed and the composition of its portfolio will change over time. Information provided is calculated as a percentage of net assets.
7
Investment Portfolio – Columbia Multi-Advisor International Equity Fund
February 28, 2011
| Common Stocks – 97.4% | |
| | | Shares | | Value ($) | |
| Consumer Discretionary – 15.0% | |
| Auto Components – 0.4% | |
| Exedy Corp. | | | 87,200 | | | | 2,890,120 | | |
Kongsberg Automotive
Holding ASA (a) | | | 3,217,609 | | | | 2,499,303 | | |
| Auto Components Total | | | 5,389,423 | | |
| Automobiles – 2.9% | |
| Fuji Heavy Industries Ltd. | | | 617,000 | | | | 5,316,716 | | |
| Honda Motor Co., Ltd. | | | 366,100 | | | | 15,977,401 | | |
| Nissan Motor Co., Ltd. | | | 429,800 | | | | 4,416,237 | | |
| Proton Holdings Bhd | | | 1,976,200 | | | | 2,506,616 | | |
| Toyota Motor Corp. | | | 178,700 | | | | 8,350,181 | | |
| Automobiles Total | | | 36,567,151 | | |
| Distributors – 1.7% | |
| Li & Fung Ltd. | | | 3,532,000 | | | | 21,489,351 | | |
| Distributors Total | | | 21,489,351 | | |
| Diversified Consumer Services – 0.4% | |
Anhanguera Educacional
Participacoes SA | | | 188,400 | | | | 4,212,333 | | |
| Diversified Consumer Services Total | | | 4,212,333 | | |
| Hotels, Restaurants & Leisure – 0.8% | |
| Accor SA | | | 213,603 | | | | 10,043,996 | | |
| Hotels, Restaurants & Leisure Total | | | 10,043,996 | | |
| Internet & Catalog Retail – 1.0% | |
| DeNA Co., Ltd. | | | 201,200 | | | | 7,808,919 | | |
Hyundai Home Shopping
Network Corp. | | | 61,410 | | | | 5,088,799 | | |
| Internet & Catalog Retail Total | | | 12,897,718 | | |
| Leisure Equipment & Products – 0.3% | |
| Altek Corp. | | | 2,718,584 | | | | 3,713,734 | | |
| Leisure Equipment & Products Total | | | 3,713,734 | | |
| Media – 2.5% | |
| Daiichikosho Co., Ltd. | | | 400,700 | | | | 7,817,280 | | |
| Naspers Ltd., Class N | | | 212,818 | | | | 12,225,000 | | |
| Publicis Groupe SA | | | 182,790 | | | | 10,426,383 | | |
| Media Total | | | 30,468,663 | | |
| Specialty Retail – 2.2% | |
| Game Group PLC | | | 3,096,491 | | | | 3,070,622 | | |
| Halfords Group PLC | | | 402,418 | | | | 2,534,988 | | |
| Inditex SA | | | 214,996 | | | | 15,564,027 | | |
| Yamada Denki Co., Ltd. | | | 83,530 | | | | 6,380,741 | | |
| Specialty Retail Total | | | 27,550,378 | | |
| | | Shares | | Value ($) | |
| Textiles, Apparel & Luxury Goods – 2.8% | |
| Adidas AG | | | 107,784 | | | | 6,916,248 | | |
| LG Fashion Corp. | | | 108,140 | | | | 2,701,599 | | |
| Pandora A/S (a) | | | 113,273 | | | | 6,603,923 | | |
| Swatch Group AG | | | 44,370 | | | | 18,887,456 | | |
| Textiles, Apparel & Luxury Goods Total | | | 35,109,226 | | |
| Consumer Discretionary Total | | | 187,441,973 | | |
| Consumer Staples – 6.5% | |
| Beverages – 2.2% | |
| Anheuser-Busch InBev NV | | | 301,711 | | | | 16,826,626 | | |
| Cott Corp. (a) | | | 538,243 | | | | 4,499,712 | | |
| Pernod-Ricard SA | | | 71,653 | | | | 6,606,009 | | |
| Beverages Total | | | 27,932,347 | | |
| Food & Staples Retailing – 2.1% | |
| FamilyMart Co., Ltd. | | | 217,000 | | | | 8,218,482 | | |
| Koninklijke Ahold NV | | | 342,162 | | | | 4,593,235 | | |
Matsumotokiyoshi
Holdings Co., Ltd. | | | 121,800 | | | | 2,734,455 | | |
| Tesco PLC | | | 1,729,137 | | | | 11,361,939 | | |
| Food & Staples Retailing Total | | | 26,908,111 | | |
| Food Products – 1.6% | |
| Balrampur Chini Mills Ltd. (a) | | | 1,765,892 | | | | 2,593,138 | | |
| Nestle SA, Registered Shares | | | 299,879 | | | | 16,977,328 | | |
| Food Products Total | | | 19,570,466 | | |
| Household Products – 0.6% | |
| Reckitt Benckiser Group PLC | | | 137,932 | | | | 7,108,059 | | |
| Household Products Total | | | 7,108,059 | | |
| Consumer Staples Total | | | 81,518,983 | | |
| Energy – 10.0% | |
| Energy Equipment & Services – 0.8% | |
| Noble Corp. | | | 121,922 | | | | 5,451,132 | | |
| Shinko Plantech Co., Ltd. | | | 429,100 | | | | 4,607,442 | | |
| Energy Equipment & Services Total | | | 10,058,574 | | |
| Oil, Gas & Consumable Fuels – 9.2% | |
| AWE Ltd. (a) | | | 1,585,426 | | | | 2,680,868 | | |
| BP PLC | | | 1,539,755 | | | | 12,382,840 | | |
| CNOOC Ltd. | | | 2,977,089 | | | | 6,789,555 | | |
| ENI SpA | | | 282,647 | | | | 6,891,984 | | |
OGX Petroleo e Gas
Participacoes SA (a) | | | 2,377,000 | | | | 27,787,384 | | |
| Rosneft Oil Co., GDR | | | 651,122 | | | | 6,146,592 | | |
| Royal Dutch Shell PLC, Class B | | | 553,518 | | | | 19,782,672 | | |
| Total SA | | | 327,410 | | | | 20,064,855 | | |
See Accompanying Notes to Financial Statements.
8
Columbia Multi-Advisor International Equity Fund
February 28, 2011
| Common Stocks (continued) | |
| | | Shares | | Value ($) | |
| Tullow Oil PLC | | | 423,673 | | | | 9,890,357 | | |
Yanzhou Coal Mining Co., Ltd.,
Class H | | | 922,600 | | | | 2,771,694 | | |
| Oil, Gas & Consumable Fuels Total | | | 115,188,801 | | |
| Energy Total | | | 125,247,375 | | |
| Financials – 24.9% | |
| Capital Markets – 3.0% | |
Credit Suisse Group AG,
Registered Shares | | | 141,448 | | | | 6,543,359 | | |
Deutsche Bank AG,
Registered Shares | | | 114,185 | | | | 7,339,591 | | |
| ICAP PLC | | | 625,561 | | | | 5,293,186 | | |
| Intermediate Capital Group PLC | | | 1,091,771 | | | | 5,704,324 | | |
| Julius Baer Group Ltd. | | | 221,453 | | | | 9,927,368 | | |
Tokai Tokyo Financial
Holdings, Inc. | | | 859,000 | | | | 3,185,997 | | |
| Capital Markets Total | | | 37,993,825 | | |
| Commercial Banks – 11.2% | |
Australia & New Zealand
Banking Group Ltd. | | | 489,305 | | | | 12,093,335 | | |
Banco Bilbao Vizcaya
Argentaria SA | | | 944,827 | | | | 11,663,919 | | |
| Banco Santander SA | | | 1,297,849 | | | | 16,002,286 | | |
Bangkok Bank PCL, Foreign
Registered Shares | | | 696,100 | | | | 3,658,611 | | |
| Barclays PLC | | | 2,913,410 | | | | 15,148,677 | | |
| BNP Paribas | | | 241,993 | | | | 18,894,224 | | |
| Commonwealth Bank of Australia | | | 120,404 | | | | 6,544,859 | | |
| HSBC Holdings PLC | | | 339,192 | | | | 3,738,540 | | |
| ICICI Bank Ltd., ADR | | | 296,713 | | | | 12,865,476 | | |
Mitsubishi UFJ Financial
Group, Inc. | | | 766,900 | | | | 4,260,140 | | |
| National Bank of Canada | | | 50,200 | | | | 3,868,017 | | |
| National Bank of Pakistan | | | 3,097,469 | | | | 2,474,617 | | |
| Standard Chartered PLC | | | 421,001 | | | | 11,135,185 | | |
Sumitomo Mitsui Financial
Group, Inc. | | | 319,900 | | | | 12,105,559 | | |
| Turkiye Is Bankasi, Class C | | | 841,817 | | | | 2,622,204 | | |
| UCO Bank | | | 1,069,676 | | | | 2,328,417 | | |
| Commercial Banks Total | | | 139,404,066 | | |
| Diversified Financial Services – 2.8% | |
| Citigroup, Inc. (a) | | | 3,380,780 | | | | 15,822,051 | | |
| Criteria Caixacorp SA | | | 689,396 | | | | 4,989,736 | | |
| Fuyo General Lease Co., Ltd. | | | 150,200 | | | | 5,600,677 | | |
| ING Groep NV (a) | | | 678,770 | | | | 8,511,507 | | |
| Diversified Financial Services Total | | | 34,923,971 | | |
| | | Shares | | Value ($) | |
| Insurance – 3.7% | |
| Allianz SE, Registered Shares | | | 56,057 | | | | 8,075,951 | | |
Baloise Holding AG,
Registered Shares | | | 62,763 | | | | 6,782,268 | | |
Hartford Financial Services
Group, Inc. | | | 139,481 | | | | 4,128,638 | | |
| Lancashire Holdings Ltd. | | | 176,438 | | | | 1,722,391 | | |
Muenchener Rueckversicherungs-
Gesellschaft AG,
Registered Shares | | | 39,005 | | | | 6,510,127 | | |
| Sampo Oyj, Class A | | | 216,973 | | | | 6,715,808 | | |
Zurich Financial Services AG,
Registered Shares | | | 43,207 | | | | 12,542,168 | | |
| Insurance Total | | | 46,477,351 | | |
| Real Estate Investment Trusts (REITs) – 0.8% | |
| Japan Retail Fund Investment Corp. | | | 3,602 | | | | 6,199,721 | | |
| Wereldhave NV | | | 31,140 | | | | 3,162,283 | | |
| Real Estate Investment Trusts (REITs) Total | | | 9,362,004 | | |
| Real Estate Management & Development – 3.4% | |
| BR Malls Participacoes SA | | | 1,363,100 | | | | 12,985,416 | | |
| Cheung Kong Holdings Ltd. | | | 373,300 | | | | 5,841,436 | | |
| Hang Lung Properties Ltd. | | | 1,820,000 | | | | 7,797,023 | | |
| Hongkong Land Holdings Ltd. | | | 762,000 | | | | 5,240,620 | | |
| Huaku Development Co., Ltd. | | | 570,000 | | | | 1,698,732 | | |
| Sinolink Worldwide Holdings Ltd. | | | 22,492,000 | | | | 2,754,294 | | |
Sumitomo Realty &
Development Co., Ltd. | | | 240,000 | | | | 6,472,412 | | |
Real Estate Management &
Development Total | | | 42,789,933 | | |
| Financials Total | | | 310,951,150 | | |
| Health Care – 5.8% | |
| Biotechnology – 0.4% | |
| Celgene Corp. (a) | | | 92,599 | | | | 4,917,007 | | |
| Biotechnology Total | | | 4,917,007 | | |
| Health Care Providers & Services – 0.4% | |
| Miraca Holdings, Inc. | | | 121,100 | | | | 4,685,225 | | |
| Health Care Providers & Services Total | | | 4,685,225 | | |
| Pharmaceuticals – 5.0% | |
| AstraZeneca PLC | | | 193,039 | | | | 9,401,856 | | |
| AstraZeneca PLC, ADR | | | 10,572 | | | | 519,825 | | |
| GlaxoSmithKline PLC | | | 416,195 | | | | 7,990,492 | | |
| Novartis AG, Registered Shares | | | 122,962 | | | | 6,895,189 | | |
| Novo-Nordisk A/S, Class B | | | 132,015 | | | | 16,627,097 | | |
| Recordati SpA | | | 559,146 | | | | 5,227,546 | | |
See Accompanying Notes to Financial Statements.
9
Columbia Multi-Advisor International Equity Fund
February 28, 2011
| Common Stocks (continued) | |
| | | Shares | | Value ($) | |
| Sanofi-Aventis SA | | | 161,385 | | | | 11,135,161 | | |
| Santen Pharmaceutical Co., Ltd. | | | 113,600 | | | | 4,443,765 | | |
| Pharmaceuticals Total | | | 62,240,931 | | |
| Health Care Total | | | 71,843,163 | | |
| Industrials – 12.9% | |
| Aerospace & Defense – 0.6% | |
| Rolls-Royce Group PLC (a) | | | 719,886 | | | | 7,220,639 | | |
| Aerospace & Defense Total | | | 7,220,639 | | |
| Airlines – 0.2% | |
| Turk Hava Yollari A.O. (a) | | | 619,521 | | | | 1,736,015 | | |
| Airlines Total | | | 1,736,015 | | |
| Building Products – 0.8% | |
| Assa Abloy AB, Class B | | | 237,035 | | | | 6,635,453 | | |
| Daikin Industries Ltd. | | | 113,488 | | | | 3,853,250 | | |
| Building Products Total | | | 10,488,703 | | |
| Commercial Services & Supplies – 0.4% | |
| Aeon Delight Co., Ltd. | | | 258,300 | | | | 4,768,130 | | |
| Commercial Services & Supplies Total | | | 4,768,130 | | |
| Construction & Engineering – 0.4% | |
| Macmahon Holdings Ltd. | | | 8,723,121 | | | | 5,158,226 | | |
| Construction & Engineering Total | | | 5,158,226 | | |
| Electrical Equipment – 2.2% | |
| Schneider Electric SA | | | 102,593 | | | | 16,974,627 | | |
Sensata Technologies
Holding N.V. (a) | | | 319,674 | | | | 10,581,209 | | |
| Electrical Equipment Total | | | 27,555,836 | | |
| Industrial Conglomerates – 1.8% | |
| DCC PLC | | | 193,419 | | | | 6,205,623 | | |
| Siemens AG, Registered Shares | | | 97,089 | | | | 13,074,909 | | |
| Tyco International Ltd. | | | 77,556 | | | | 3,516,389 | | |
| Industrial Conglomerates Total | | | 22,796,921 | | |
| Machinery – 2.1% | |
| FANUC Ltd. | | | 66,600 | | | | 10,403,529 | | |
| Komatsu Ltd. | | | 516,100 | | | | 15,833,258 | | |
| Machinery Total | | | 26,236,787 | | |
| Professional Services – 0.6% | |
| Atkins WS PLC | | | 327,985 | | | | 3,716,323 | | |
| Teleperformance | | | 108,807 | | | | 4,132,079 | | |
| Professional Services Total | | | 7,848,402 | | |
| Road & Rail – 1.3% | |
| Canadian National Railway Co. | | | 225,566 | | | | 16,527,221 | | |
| Road & Rail Total | | | 16,527,221 | | |
| | | Shares | | Value ($) | |
| Trading Companies & Distributors – 2.5% | |
| ITOCHU Corp. | | | 567,300 | | | | 5,899,394 | | |
| Kloeckner & Co., SE (a) | | | 183,048 | | | | 5,948,661 | | |
| Marubeni Corp. | | | 1,537,000 | | | | 11,797,304 | | |
| Mitsui & Co., Ltd. | | | 420,800 | | | | 7,692,204 | | |
| Trading Companies & Distributors Total | | | 31,337,563 | | |
| Industrials Total | | | 161,674,443 | | |
| Information Technology – 6.4% | |
| Electronic Equipment, Instruments & Components – 1.1% | |
| FUJIFILM Holdings Corp. | | | 94,800 | | | | 3,337,723 | | |
| Hitachi Ltd. | | | 1,094,000 | | | | 6,658,539 | | |
| Venture Corp., Ltd. | | | 548,000 | | | | 4,076,326 | | |
Electronic Equipment, Instruments &
Components Total | | | 14,072,588 | | |
| Internet Software & Services – 1.7% | |
| Baidu, Inc., ADR (a) | | | 49,858 | | | | 6,040,795 | | |
| MercadoLibre, Inc. (a) | | | 104,380 | | | | 6,866,117 | | |
| Sina Corp. (a) | | | 105,639 | | | | 8,627,537 | | |
| Internet Software & Services Total | | | 21,534,449 | | |
| IT Services – 0.3% | |
| Groupe Steria SCA | | | 126,614 | | | | 3,994,121 | | |
| IT Services Total | | | 3,994,121 | | |
| Office Electronics – 1.2% | |
| Canon, Inc. | | | 291,300 | | | | 14,087,090 | | |
| Office Electronics Total | | | 14,087,090 | | |
| Semiconductors & Semiconductor Equipment – 2.1% | |
| ARM Holdings PLC | | | 753,745 | | | | 7,560,253 | | |
| ASML Holding NV | | | 256,168 | | | | 11,119,311 | | |
Hanwha SolarOne
Co., Ltd., ADR (a) | | | 315,243 | | | | 2,695,328 | | |
| Macronix International | | | 7,004,000 | | | | 5,119,220 | | |
Semiconductors & Semiconductor
Equipment Total | | | 26,494,112 | | |
| Information Technology Total | | | 80,182,360 | | |
| Materials – 7.6% | |
| Chemicals – 4.2% | |
| BASF SE | | | 308,462 | | | | 25,650,398 | | |
| Clariant AG, Registered Shares (a) | | | 261,423 | | | | 4,310,624 | | |
| Kansai Paint Co., Ltd. | | | 525,000 | | | | 5,001,119 | | |
LyondellBasell Industries NV,
Class A (a) | | | 311,163 | | | | 11,849,087 | | |
| Novozymes A/S, Class B | | | 41,231 | | | | 5,765,319 | | |
| Chemicals Total | | | 52,576,547 | | |
See Accompanying Notes to Financial Statements.
10
Columbia Multi-Advisor International Equity Fund
February 28, 2011
| Common Stocks (continued) | |
| | | Shares | | Value ($) | |
| Metals & Mining – 3.0% | |
| Aurubis AG | | | 52,887 | | | | 2,814,893 | | |
| Eastern Platinum Ltd. (a) | | | 1,647,500 | | | | 2,611,446 | | |
| First Quantum Minerals Ltd. | | | 28,996 | | | | 3,775,404 | | |
| Teck Resources Ltd., Class B | | | 136,403 | | | | 7,546,355 | | |
| ThyssenKrupp AG | | | 268,193 | | | | 11,150,899 | | |
| Xstrata PLC | | | 415,493 | | | | 9,490,012 | | |
| Metals & Mining Total | | | 37,389,009 | | |
| Paper & Forest Products – 0.4% | |
| Svenska Cellulosa AB, Class B | | | 324,189 | | | | 5,359,131 | | |
| Paper & Forest Products Total | | | 5,359,131 | | |
| Materials Total | | | 95,324,687 | | |
| Telecommunication Services – 5.3% | |
| Diversified Telecommunication Services – 2.4% | |
| BCE, Inc. | | | 164,400 | | | | 6,095,094 | | |
Nippon Telegraph &
Telephone Corp. | | | 72,700 | | | | 3,556,329 | | |
| Tele2 AB, Class B | | | 282,835 | | | | 6,452,832 | | |
| Telefonica SA | | | 284,978 | | | | 7,235,899 | | |
| Telenor ASA | | | 382,490 | | | | 6,341,594 | | |
| Diversified Telecommunication Services Total | | | 29,681,748 | | |
| Wireless Telecommunication Services – 2.9% | |
Advanced Info Service PCL,
Foreign Registered Shares | | | 711,400 | | | | 1,849,756 | | |
| Freenet AG | | | 508,761 | | | | 5,869,261 | | |
| Millicom International Cellular SA | | | 111,375 | | | | 9,756,450 | | |
| Softbank Corp. | | | 86,600 | | | | 3,560,479 | | |
| Vivo Participacoes SA, ADR | | | 113,155 | | | | 4,165,235 | | |
| Vodafone Group PLC | | | 4,195,094 | | | | 11,886,824 | | |
| Wireless Telecommunication Services Total | | | 37,088,005 | | |
| Telecommunication Services Total | | | 66,769,753 | | |
| Utilities – 3.0% | |
| Electric Utilities – 1.4% | |
| Enel SpA | | | 1,747,267 | | | | 10,411,306 | | |
| Fortum Oyj | | | 212,182 | | | | 6,573,372 | | |
| Electric Utilities Total | | | 16,984,678 | | |
| Independent Power Producers & Energy Traders – 0.2% | |
| Energy Development Corp. | | | 18,967,300 | | | | 2,448,356 | | |
Independent Power Producers &
Energy Traders Total | | | 2,448,356 | | |
| | | Shares | | Value ($) | |
| Multi-Utilities – 1.2% | |
| AGL Energy Ltd. | | | 245,947 | | | | 3,648,708 | | |
| Centrica PLC | | | 1,028,317 | | | | 5,685,392 | | |
| RWE AG | | | 91,316 | | | | 6,163,222 | | |
| Multi-Utilities Total | | | 15,497,322 | | |
| Water Utilities – 0.2% | |
Cia de Saneamento Basico do
Estado de Sao Paulo | | | 124,900 | | | | 3,060,568 | | |
| Water Utilities Total | | | 3,060,568 | | |
| Utilities Total | | | 37,990,924 | | |
Total Common Stocks
(cost of $968,673,502) | | | 1,218,944,811 | | |
| Investment Company – 0.6% | |
| iShares MSCI EAFE Index Fund | | | 132,188 | | | | 8,136,171 | | |
Total Investment Company
(cost of $7,980,651) | | | 8,136,171 | | |
| Short-Term Obligation – 2.2% | |
| | | Par ($) | | | |
Repurchase agreement with
Fixed Income Clearing Corp.,
dated 02/28/11, due 03/01/11
at 0.090%, collateralized by
U.S. Government Agency
obligations with various
maturities to 04/15/14,
market value $27,660,000
(repurchase proceeds
$27,108,068) | | | 27,108,000 | | | | 27,108,000 | | |
Total Short-Term Obligation
(cost of $27,108,000) | | | 27,108,000 | | |
Total Investments – 100.2%
(cost of $1,003,762,153) (b) | | | 1,254,188,982 | | |
| Other Assets & Liabilities, Net – (0.2)% | | | (2,580,074 | ) | |
| Net Assets – 100.0% | | | 1,251,608,908 | | |
Notes to Investment Portfolio:
(a) Non-income producing security.
(b) Cost for federal income tax purposes is $1,031,859,307.
Generally accepted accounting principles (GAAP) require disclosure regarding the inputs and valuation techniques used to measure fair value and any changes in valuation inputs or techniques. In addition, investments shall be disclosed by major category.
See Accompanying Notes to Financial Statements.
11
Columbia Multi-Advisor International Equity Fund
February 28, 2011
The Fund categorizes its fair value measurements according to a three-level hierarchy that maximizes the use of observable inputs and minimizes the use of unobservable inputs by prioritizing that the most observable input be used when available. Observable inputs are those that market participants would use in pricing an investment based on market data obtained from sources independent of the reporting entity. Unobservable inputs are those that reflect the Fund's assumptions about the information market participants would use in pricing an investment. An investment's level within the fair value hierarchy is based on the lowest level of any input that is deemed significant to the asset or liability's fair value measurement. The input levels are not necessarily an indication of the risk or liquidity associated with investments at that level. For example, certain U.S. government securities are generally high quality and liquid, however, they are reflected as Level 2 because the inputs used to determine fair value may not always be quoted prices in an active market.
Fair value inputs are summarized in the three broad levels listed below:
• Level 1—Valuations based on quoted prices for investments in active markets that the Fund has the ability to access at the measurement date (including NAV for open-end mutual funds). Valuation adjustments are not applied to Level 1 investments.
• Level 2—Valuations based on other significant observable inputs (including quoted prices for similar securities, interest rates, prepayment speeds, credit risks, etc.).
• Level 3—Valuations based on significant unobservable inputs (including the Fund's own assumptions and judgment in determining the fair value of investments).
Inputs that are used in determining fair value of an investment may include price information, credit data, volatility statistics, and other factors. These inputs can be either observable or unobservable. The availability of observable inputs can vary between investments, and is affected by various factors such as the type of investment, and the volume and level of activity for that investment or similar investments in the marketplace. The inputs will be considered by the Investment Manager, along with any other relevant factors in the calculation of an investment's fair value. The Fund uses prices and inputs that are current as of the measurement date, which may include periods of market dislocations. During these periods, the availability of prices and inputs may be reduced for many investments. This condition could cause an investment to be reclassified between the various levels within the hierarchy. Non-U.S. equity securities actively traded in foreign markets may be reflected in Level 2 despite the availability of closing prices, because the Fund evaluates and determines whether those closing prices reflect fair value at the close of the New York Stock Exchange (NYSE) or require adjustment, as described in Note 2 to the financial statements—Security Valuation.
Investments falling into the Level 3 category are primarily supported by quoted prices from brokers and dealers participating in the market for those investments. However, these may be classified as Level 3 investments due to lack of market transparency and corroboration to support these quoted prices. Additionally, valuation models may be used as the pricing source for any remaining investments classified as Level 3. These models rely on one or more significant unobservable inputs and/or significant assumptions by the Investment Manager. Inputs used in valuations may include, but are not limited to, financial statement analysis, capital account balances, discount rates and estimated cash flows, and comparable company data.
The following table is a summary of the inputs used to value the Fund's investments as of February 28, 2011:
| Description | | Quoted
Prices
(Level 1) | | Other
Significant
Observable
Inputs
(Level 2) | | Significant
Unobservable
Inputs
(Level 3) | | Total | |
| Common Stocks | |
Consumer
Discretionary | | $ | 4,212,333 | | | $ | 183,229,640 | | | $ | — | | | $ | 187,441,973 | | |
| Consumer Staples | | | 4,499,712 | | | | 77,019,271 | | | | — | | | | 81,518,983 | | |
| Energy | | | 39,385,108 | | | | 85,862,267 | | | | — | | | | 125,247,375 | | |
| Financials | | | 49,669,598 | | | | 261,281,552 | | | | — | | | | 310,951,150 | | |
| Health Care | | | 5,436,832 | | | | 66,406,331 | | | | — | | | | 71,843,163 | | |
| Industrials | | | 30,624,819 | | | | 131,049,624 | | | | — | | | | 161,674,443 | | |
Information
Technology | | | 24,229,777 | | | | 55,952,583 | | | | — | | | | 80,182,360 | | |
| Materials | | | 25,782,292 | | | | 69,542,395 | | | | — | | | | 95,324,687 | | |
Telecommunication
Services | | | 20,016,779 | | | | 46,752,974 | | | | — | | | | 66,769,753 | | |
| Utilities | | | 3,060,568 | | | | 34,930,356 | | | | — | | | | 37,990,924 | | |
| Total Common Stocks | | | 206,917,818 | | | | 1,012,026,993 | | | | — | | | | 1,218,944,811 | | |
Total Investment
Company | | | 8,136,171 | | | | — | | | | — | | | | 8,136,171 | | |
Total Short-Term
Obligation | | | — | | | | 27,108,000 | | | | — | | | | 27,108,000 | | |
| Total Investments | | | 215,053,989 | | | | 1,039,134,993 | | | | — | | | | 1,254,188,982 | | |
Unrealized
Appreciation
on Forward Foreign
Currency Exchange
Contracts | | | — | | | | 1,234,053 | | | | — | | | | 1,234,053 | | |
Unrealized
Depreciation
on Forward Foreign
Currency Exchange
Contracts | | | — | | | | (735,364 | ) | | | — | | | | (735,364 | ) | |
| Total | | $ | 215,053,989 | | | $ | 1,039,633,682 | | | $ | — | | | $ | 1,254,687,671 | | |
The Fund's assets assigned to the Level 2 input category are generally valued using the market approach, in which a security's value is determined through reference to prices and information from market transactions for similar or identical assets.
These assets include certain foreign securities for which a third party statistical pricing service may be employed for purposes of fair valuation. The models utilized by the third party statistical pricing service take into account a security's correlation to available market data including, but not limited to, intraday index, ADR, and ETF movements.
Certain short-term obligations may be valued using amortized cost, an income approach which converts future cash flows to a present value based upon the discount or premium at purchase.
See Accompanying Notes to Financial Statements.
12
Columbia Multi-Advisor International Equity Fund
February 28, 2011
The following table shows transfers between Level 1 and Level 2 of the fair value hierarchy:
| Transfers In | | Transfers Out | |
| Level 1 | | Level 2 | | Level 1 | | Level 2 | |
| $ | — | | | $ | 5,069,200 | | | $ | 5,069,200 | | | $ | — | | |
Financial assets were transferred from Level 1 to Level 2 as it was determined that the application of factors received from a third party statistical service resulted in a price which was more representative of fair value for these securities as of period end.
For the year ended February 28, 2011, transactions in written call option contracts were as follows:
| | | Number of
contracts | | Premium
received | |
| Options outstanding at February 28, 2010 | | | 618 | | | $ | 39,551 | | |
| Options written | | | 24,196 | | | | 940,549 | | |
Options terminated in closing
purchase transactions | | | (8,764 | ) | | | (499,675 | ) | |
| Options exercised | | | (5,041 | ) | | | (20,163 | ) | |
| Options expired | | | (11,009 | ) | | | (460,262 | ) | |
| Options outstanding at February 28, 2011 | | | — | | | $ | — | | |
Forward foreign currency exchange contracts outstanding on February 28, 2011 are:
Foreign Exchange Rate Risk
| Counterparty | | Forward
Foreign
Currency
Exchange
Contracts
to Buy | | Value | | Aggregate
Face Value | | Settlement
Date | | Unrealized
Appreciation/
(Depreciation) | |
| Barclays Bank PLC | | AUD | | | | $ | 20,044,803 | | | $ | 19,891,834 | | | 04/28/11 | | $ | 152,969 | | |
| Barclays Bank PLC | | EUR | | | | | 34,815,465 | | | | 34,412,923 | | | 04/28/11 | | | 402,542 | | |
| Barclays Bank PLC | | GBP | | | | | 16,888,309 | | | | 16,770,511 | | | 04/28/11 | | | 117,798 | | |
| Barclays Bank PLC | | JPY | | | | | 9,577,560 | | | | 9,600,989 | | | 04/28/11 | | | (23,429 | ) | |
| Barclays Bank PLC | | SEK | | | | | 2,436,540 | | | | 2,382,859 | | | 04/28/11 | | | 53,681 | | |
| Barclays Bank PLC | | SGD | | | | | 6,006,043 | | | | 5,989,161 | | | 04/28/11 | | | 16,882 | | |
| | | | | | | | | $ | 720,443 | | |
| Counterparty | | Forward
Foreign
Currency
Exchange
Contracts
to Sell | | Value | | Aggregate
Face Value | | Settlement
Date | | Unrealized
Appreciation/
(Depreciation) | |
| Barclays Bank PLC | | CAD | | | | $ | 19,554,475 | | | $ | 19,169,027 | | | 04/28/11 | | $ | (385,448 | ) | |
| Barclays Bank PLC | | CHF | | | | | 12,147,947 | | | | 11,932,515 | | | 04/28/11 | | | (215,432 | ) | |
| Barclays Bank PLC | | KRW | | | | | 7,060,451 | | | | 7,188,960 | | | 04/28/11 | | | 128,509 | | |
| Barclays Bank PLC | | MYR | | | | | 2,989,576 | | | | 3,003,707 | | | 04/28/11 | | | 14,131 | | |
| Barclays Bank PLC | | NOK | | | | | 1,840,467 | | | | 1,792,737 | | | 04/28/11 | | | (47,730 | ) | |
| Barclays Bank PLC | | PHP | | | | | 2,423,011 | | | | 2,400,567 | | | 04/28/11 | | | (22,444 | ) | |
| Barclays Bank PLC | | SEK | | | | | 2,436,540 | | | | 2,419,405 | | | 04/28/11 | | | (17,135 | ) | |
| Barclays Bank PLC | | THB | | | | | 3,631,558 | | | | 3,607,812 | | | 04/28/11 | | | (23,746 | ) | |
| Barclays Bank PLC | | TWD | | | | | 9,857,511 | | | | 10,205,052 | | | 04/28/11 | | | 347,541 | | |
| | | | | | | | | $ | (221,754 | ) | |
See Accompanying Notes to Financial Statements.
13
Columbia Multi-Advisor International Equity Fund
February 28, 2011
The Fund was invested in the following countries at February 28, 2011:
Summary of Securities
by Country (Unaudited) | | Value | | % of Total
Investments | |
| Japan | | $ | 217,919,820 | | | | 17.4 | | |
| United Kingdom | | | 172,345,396 | | | | 13.8 | | |
| France | | | 102,271,454 | | | | 8.2 | | |
| Germany | | | 99,514,160 | | | | 7.9 | | |
| Switzerland | | | 82,865,759 | | | | 6.6 | | |
| United States* | | | 80,928,475 | | | | 6.5 | | |
| Spain | | | 55,455,867 | | | | 4.4 | | |
| Brazil | | | 52,210,937 | | | | 4.2 | | |
| Canada | | | 44,923,248 | | | | 3.6 | | |
| Hong Kong | | | 43,122,725 | | | | 3.4 | | |
| Netherlands | | | 37,967,545 | | | | 3.0 | | |
| Australia | | | 30,125,995 | | | | 2.4 | | |
| Denmark | | | 28,996,340 | | | | 2.3 | | |
| Sweden | | | 28,203,865 | | | | 2.2 | | |
| China | | | 26,924,909 | | | | 2.2 | | |
| Italy | | | 22,530,836 | | | | 1.8 | | |
| India | | | 17,787,031 | | | | 1.4 | | |
| Belgium | | | 16,826,626 | | | | 1.3 | | |
| Finland | | | 13,289,180 | | | | 1.1 | | |
| South Africa | | | 12,224,999 | | | | 1.0 | | |
| Taiwan | | | 10,531,686 | | | | 0.8 | | |
| Norway | | | 8,840,898 | | | | 0.7 | | |
| Republic of Korea | | | 7,790,398 | | | | 0.6 | | |
| Argentina | | | 6,866,116 | | | | 0.5 | | |
| Ireland | | | 6,205,623 | | | | 0.5 | | |
| Russia | | | 6,146,592 | | | | 0.5 | | |
| Thailand | | | 5,508,368 | | | | 0.4 | | |
| Turkey | | | 4,358,219 | | | | 0.4 | | |
| Singapore | | | 4,076,326 | | | | 0.3 | | |
| Malaysia | | | 2,506,616 | | | | 0.2 | | |
| Pakistan | | | 2,474,617 | | | | 0.2 | | |
| Philippines | | | 2,448,356 | | | | 0.2 | | |
| | | $ | 1,254,188,982 | | | | 100.0 | | |
* Includes short-term obligation.
Certain securities are listed by country of underlying exposure but may trade predominantly on another exchange.
| Acronym | | Name | |
| ADR | | American Depositary Receipt | |
| AUD | | | | Australian Dollar | |
| CAD | | | | Canadian Dollar | |
| CHF | | | | Swiss Franc | |
| EUR | | | | Euro | |
| GBP | | | | Pound Sterling | |
| GDR | | Global Depositary Receipt | |
| JPY | | | | Japanese Yen | |
| KRW | | | | South Korean Won | |
| MYR | | | | Malaysian Ringgit | |
| NOK | | | | Norwegian Krone | |
| PHP | | | | Philippine Peso | |
| SEK | | | | Swedish Krona | |
| SGD | | | | Singapore Dollar | |
| THB | | | | Thailand Baht | |
| TWD | | | | New Taiwan Dollar | |
See Accompanying Notes to Financial Statements.
14
Statement of Assets and Liabilities – Columbia Multi-Advisor International Equity Fund
February 28, 2011
| | | | | ($) | |
| Assets | | Investments, at identified cost | | | 1,003,762,153 | | |
| | | Investments, at value | | | 1,254,188,982 | | |
| | | Cash | | | 18,189 | | |
| | | Foreign currency (cost of $785,537) | | | 782,399 | | |
| | | Unrealized appreciation on forward foreign currency exchange contracts | | | 1,234,053 | | |
| | | Receivable for: | | | | | |
| | | Investments sold | | | 6,835,265 | | |
| | | Fund shares sold | | | 1,053,040 | | |
| | | Dividends | | | 2,357,284 | | |
| | | Interest | | | 68 | | |
| | | Foreign tax reclaims | | | 905,934 | | |
| | | Prepaid expenses | | | 4,621 | | |
| | | Total Assets | | | 1,267,379,835 | | |
| Liabilities | | Unrealized depreciation on forward foreign currency exchange contracts | | | 735,364 | | |
| | | Payable for: | | | |
| | | Investments purchased | | | 12,998,029 | | |
| | | Fund shares repurchased | | | 302,389 | | |
| | | Foreign capital gains taxes deferred | | | 180,376 | | |
| | | Investment advisory fee | | | 636,109 | | |
| | | Administration fee | | | 152,552 | | |
| | | Pricing and bookkeeping fees | | | 14,045 | | |
| | | Transfer agent fee | | | 319,044 | | |
| | | Trustees' fees | | | 87,627 | | |
| | | Custody fee | | | 186,188 | | |
| | | Distribution and service fees | | | 6,419 | | |
| | | Chief compliance officer expenses | | | 370 | | |
| | | Interest payable | | | 384 | | |
| | | Other liabilities | | | 152,031 | | |
| | | Total Liabilities | | | 15,770,927 | | |
| | | Net Assets | | | 1,251,608,908 | | |
| Net Assets Consist of | | Paid-in capital | | | 1,582,666,746 | | |
| | | Overdistributed net investment income | | | (16,333,263 | ) | |
| | | Accumulated net realized loss | | | (565,558,306 | ) | |
| | | Net unrealized appreciation (depreciation) on: | | | | | |
| | | Investments | | | 250,426,829 | | |
| | | Foreign currency translations | | | 587,278 | | |
| | | Foreign capital gains tax | | | (180,376 | ) | |
| | | Net Assets | | | 1,251,608,908 | | |
See Accompanying Notes to Financial Statements.
15
Statement of Assets and Liabilities (continued) – Columbia Multi-Advisor International Equity Fund
February 28, 2011
| Class A | | Net assets | | $ | 24,668,056 | | |
| | | Shares outstanding | | | 1,980,231 | | |
| | | Net asset value per share | | $ | 12.46 | (a) | |
| | | Maximum sales charge | | | 5.75 | % | |
| | | Maximum offering price per share ($12.46/0.9425) | | $ | 13.22 | (b) | |
| Class B | | Net assets | | $ | 783,613 | | |
| | | Shares outstanding | | | 69,107 | | |
| | | Net asset value and offering price per share | | $ | 11.34 | (a) | |
| Class C | | Net assets | | $ | 1,271,683 | | |
| | | Shares outstanding | | | 113,567 | | |
| | | Net asset value and offering price per share | | $ | 11.20 | (a) | |
| Class I (c) | | Net assets | | $ | 47,055,728 | | |
| | | Shares outstanding | | | 3,728,029 | | |
| | | Net asset value, offering and redemption price per share | | $ | 12.62 | | |
| Class R | | Net assets | | $ | 286,611 | | |
| | | Shares outstanding | | | 23,026 | | |
| | | Net asset value, offering and redemption price per share | | $ | 12.45 | | |
| Class W (c) | | Net assets | | $ | 2,712 | | |
| | | Shares outstanding | | | 218 | | |
| | | Net asset value, offering and redemption price per share | | $ | 12.46 | (d) | |
| Class Z | | Net assets | | $ | 1,177,540,505 | | |
| | | Shares outstanding | | | 93,324,334 | | |
| | | Net asset value, offering and redemption price per share | | $ | 12.62 | | |
(a) Redemption price per share is equal to net asset value less any applicable contingent deferred sales charge.
(b) On sales of $50,000 or more the offering price is reduced.
(c) Class I and Class W shares commenced operations on September 27, 2010.
(d) Net asset value per share rounds to this amount due to fractional shares outstanding.
See Accompanying Notes to Financial Statements.
16
Statement of Operations – Columbia Multi-Advisor International Equity Fund
For the Year Ended February 28, 2011
| | | | | ($) (a) | |
| Investment Income | | Dividends | | | 38,494,133 | | |
| | | Interest | | | 22,952 | | |
| | | Foreign taxes withheld | | | (3,594,978 | ) | |
| | | Total Investment Income | | | 34,922,107 | | |
| Expenses | | Investment advisory fee | | | 8,702,074 | | |
| | | Administration fee | | | 2,110,092 | | |
| | | Distribution fee: | | | |
| | | Class B | | | 6,818 | | |
| | | Class C | | | 10,428 | | |
| | | Class R | | | 1,318 | | |
| | | Service fee: | | | |
| | | Class B | | | 2,273 | | |
| | | Class C | | | 3,476 | | |
| | | Class W | | | 3 | | |
| | | Distribution and service fees—Class A | | | 59,450 | | |
| | | Transfer agent fee—Class A, Class B, Class C, Class R, Class W and Class Z | | | 2,022,728 | | |
| | | Pricing and bookkeeping fees | | | 156,329 | | |
| | | Trustees' fees | | | 43,865 | | |
| | | Custody fee | | | 768,325 | | |
| | | Chief compliance officer expenses | | | 2,243 | | |
| | | Other expenses | | | 483,458 | | |
| | | Expenses before interest expense | | | 14,372,880 | | |
| | | Interest expense | | | 12,567 | | |
| | | Total Expenses | | | 14,385,447 | | |
| | | Expense reductions | | | (85 | ) | |
| | | Net Expenses | | | 14,385,362 | | |
| | | Net Investment Income | | | 20,536,745 | | |
| Net Realized and Unrealized Gain (Loss) on Investments, Foreign Currency, Foreign Capital Gains Tax, Futures Contracts and Written Options | |
| | | Net realized gain (loss) on: | | | | | |
| | | Investments | | | 125,679,280 | | |
| | | Foreign currency transactions | | | (6,009,053 | ) | |
| | | Futures contracts | | | (197,942 | ) | |
| | | Written options | | | 382,193 | | |
| | | Net realized gain | | | 119,854,478 | | |
| | | Net change in unrealized appreciation (depreciation) on: | | | | | |
| | | Investments | | | 80,745,207 | | |
| | | Foreign currency translations | | | 4,495,188 | | |
| | | Foreign capital gains tax | | | (116,264 | ) | |
| | | Written options | | | (22,865 | ) | |
| | | Net change in unrealized appreciation (depreciation) | | | 85,101,266 | | |
| | | Net Gain | | | 204,955,744 | | |
| | | Net Increase Resulting from Operations | | | 225,492,489 | | |
(a) Class I and Class W shares commenced operations on September 27, 2010.
See Accompanying Notes to Financial Statements.
17
Statement of Changes in Net Assets – Columbia Multi-Advisor International Equity Fund
| | | | | Year Ended February 28, | |
| Increase (Decrease) in Net Assets | | | | 2011 ($)(a)(b) | | 2010 ($) | |
| Operations | | Net investment income | | | 20,536,745 | | | | 23,086,585 | | |
| | | Net realized gain (loss) on investments, foreign currency
transactions, futures contracts and written options | | | 119,854,478 | | | | (145,880,630 | ) | |
| | | Net change in unrealized appreciation (depreciation)
on investments, foreign currency translations, foreign
capital gains tax and written options | | | 85,101,266 | | | | 674,185,182 | | |
| | | Net increase resulting from operations | | | 225,492,489 | | | | 551,391,137 | | |
| Distributions to Shareholders | | From net investment income: | | | | | | | |
| | | Class A | | | (433,393 | ) | | | (963,875 | ) | |
| | | Class B | | | (10,544 | ) | | | (48,849 | ) | |
| | | Class C | | | (16,975 | ) | | | (67,661 | ) | |
| | | Class I | | | (1,236,199 | ) | | | — | | |
| | | Class R | | | (4,251 | ) | | | (7,655 | ) | |
| | | Class W | | | (47 | ) | | | — | | |
| | | Class Z | | | (24,765,796 | ) | | | (61,842,478 | ) | |
| | | Total distributions to shareholders | | | (26,467,205 | ) | | | (62,930,518 | ) | |
| | | Net Capital Stock Transactions | | | (350,430,216 | ) | | | (264,703,264 | ) | |
| | | Redemption fees | | | — | | | | 64,736 | | |
| | | Increase from regulatory settlements | | | 25,379 | | | | 4,074,606 | | |
| | | Total increase (decrease) in net assets | | | (151,379,553 | ) | | | 227,896,697 | | |
| Net Assets | | Beginning of period | | | 1,402,988,461 | | | | 1,175,091,764 | | |
| | | End of period | | | 1,251,608,908 | | | | 1,402,988,461 | | |
| | | Overdistributed net investment income at end of period | | | (16,333,263 | ) | | | (6,317,871 | ) | |
(a) Class I and Class W shares commenced operations on September 27, 2010.
(b) Class I and Class W shares reflect activity for the period September 27, 2010 through February 28, 2011.
See Accompanying Notes to Financial Statements.
18
Statement of Changes in Net Assets (continued) – Columbia Multi-Advisor International Equity Fund
| | | Capital Stock Activity | |
| | | Year Ended
February 28, 2011 (a)(b) | | Year Ended
February 28, 2010 | |
| | | Shares | | Dollars ($) | | Shares | | Dollars ($) | |
| Class A | |
| Subscriptions | | | 123,232 | | | | 1,389,139 | | | | 205,292 | | | | 2,168,886 | | |
| Distributions reinvested | | | 17,800 | | | | 208,966 | | | | 76,464 | | | | 792,878 | | |
| Redemptions | | | (430,140 | ) | | | (4,834,791 | ) | | | (289,456 | ) | | | (2,912,919 | ) | |
| Net increase (decrease) | | | (289,108 | ) | | | (3,236,686 | ) | | | (7,700 | ) | | | 48,845 | | |
| Class B | |
| Subscriptions | | | 1,231 | | | | 13,349 | | | | 11,123 | | | | 109,561 | | |
| Distributions reinvested | | | 400 | | | | 4,281 | | | | 4,441 | | | | 41,580 | | |
| Redemptions | | | (54,571 | ) | | | (549,739 | ) | | | (54,596 | ) | | | (508,773 | ) | |
| Net decrease | | | (52,940 | ) | | | (532,109 | ) | | | (39,032 | ) | | | (357,632 | ) | |
| Class C | |
| Subscriptions | | | 7,336 | | | | 76,021 | | | | 27,871 | | | | 266,977 | | |
| Distributions reinvested | | | 899 | | | | 9,503 | | | | 4,990 | | | | 46,261 | | |
| Redemptions | | | (74,067 | ) | | | (699,511 | ) | | | (53,754 | ) | | | (495,500 | ) | |
| Net decrease | | | (65,832 | ) | | | (613,987 | ) | | | (20,893 | ) | | | (182,262 | ) | |
| Class I | |
| Subscriptions | | | 12,969,724 | | | | 156,597,095 | | | | — | | | | — | | |
| Distributions reinvested | | | 104,053 | | | | 1,236,146 | | | | — | | | | — | | |
| Redemptions | | | (9,345,748 | ) | | | (113,450,533 | ) | | | — | | | | — | | |
| Net increase | | | 3,728,029 | | | | 44,382,708 | | | | — | | | | — | | |
| Class R | |
| Subscriptions | | | 5,742 | | | | 65,854 | | | | 11,671 | | | | 121,158 | | |
| Distributions reinvested | | | 269 | | | | 3,150 | | | | 577 | | | | 5,998 | | |
| Redemptions | | | (10,045 | ) | | | (105,779 | ) | | | (200 | ) | | | (2,249 | ) | |
| Net increase (decrease) | | | (4,034 | ) | | | (36,775 | ) | | | 12,048 | | | | 124,907 | | |
| Class W | |
| Subscriptions | | | 230 | | | | 2,650 | | | | — | | | | — | | |
| Redemptions | | | (12 | ) | | | (153 | ) | | | — | | | | — | | |
| Net increase | | | 218 | | | | 2,497 | | | | — | | | | — | | |
| Class Z | |
| Subscriptions | | | 7,999,032 | | | | 90,843,065 | | | | 15,059,511 | | | | 151,650,965 | | |
| Distributions reinvested | | | 1,165,024 | | | | 13,840,489 | | | | 2,808,809 | | | | 29,505,142 | | |
| Redemptions | | | (43,054,867 | ) | | | (495,079,418 | ) | | | (44,278,243 | ) | | | (445,493,229 | ) | |
| Net decrease | | | (33,890,811 | ) | | | (390,395,864 | ) | | | (26,409,923 | ) | | | (264,337,122 | ) | |
(a) Class I and Class W shares commenced operations on September 27, 2010.
(b) Class I and Class W shares reflect activity for the period September 27, 2010 through February 28, 2011.
See Accompanying Notes to Financial Statements.
19
Financial Highlights – Columbia Multi-Advisor International Equity Fund
Selected data for a share outstanding throughout each period is as follows:
| | |
Year Ended February 28, | | Year Ended
February 29, | | Period Ended
February 28, | | Year Ended
March 31, | |
| Class A Shares | | 2011 | | 2010 | | 2009 | | 2008 | | 2007 (a) | | 2006 (b) | |
| Net Asset Value, Beginning of Period | | $ | 10.68 | | | $ | 7.44 | | | $ | 15.77 | | | $ | 17.12 | | | $ | 16.39 | | | $ | 13.30 | | |
| Income from Investment Operations: | |
| Net investment income (c) | | | 0.14 | | | | 0.13 | | | | 0.26 | | | | 0.28 | | | | 0.16 | | | | 0.21 | | |
Net realized and unrealized gain (loss) on
investments, futures contracts, foreign
currency, foreign capital gains tax and
written options | | | 1.85 | | | | 3.51 | | | | (8.33 | ) | | | 0.76 | | | | 1.91 | | | | 3.20 | | |
| Total from investment operations | | | 1.99 | | | | 3.64 | | | | (8.07 | ) | | | 1.04 | | | | 2.07 | | | | 3.41 | | |
| Less Distributions to Shareholders: | |
| From net investment income | | | (0.21 | ) | | | (0.43 | ) | | | (0.07 | ) | | | (0.28 | ) | | | (0.18 | ) | | | (0.27 | ) | |
| From net realized gains | | | — | | | | — | | | | (0.19 | ) | | | (2.11 | ) | | | (1.16 | ) | | | (0.05 | ) | |
| Total distributions to shareholders | | | (0.21 | ) | | | (0.43 | ) | | | (0.26 | ) | | | (2.39 | ) | | | (1.34 | ) | | | (0.32 | ) | |
| Redemption Fees: | |
| Redemption fees added to paid-in-capital | | | — | | | | — | (d) | | | — | (d) | | | — | (d) | | | — | (d) | | | — | (d) | |
| Increase from regulatory settlements | | | — | (d) | | | 0.03 | | | | — | | | | — | | | | — | | | | — | | |
| Net Asset Value, End of Period | | $ | 12.46 | | | $ | 10.68 | | | $ | 7.44 | | | $ | 15.77 | | | $ | 17.12 | | | $ | 16.39 | | |
| Total return (e) | | | 18.80 | % | | | 49.61 | % | | | (51.87 | )% | | | 5.14 | % | | | 13.55 | %(f) | | | 25.86 | % | |
Ratios to Average Net Assets/
Supplemental Data: | |
| Net expenses before interest expense | | | 1.33 | %(g) | | | 1.26 | %(g) | | | 1.27 | %(g) | | | 1.19 | %(g) | | | 1.15 | %(g)(h) | | | 1.14 | %(i) | |
| Interest expense | | | — | %(j) | | | — | %(j) | | | — | | | | — | %(j) | | | — | %(h)(j) | | | — | | |
| Net expenses | | | 1.33 | %(g) | | | 1.26 | %(g) | | | 1.27 | %(g) | | | 1.19 | %(g) | | | 1.15 | %(g)(h) | | | 1.14 | %(i) | |
| Waiver/Reimbursement | | | — | | | | — | | | | — | | | | — | | | | — | | | | 0.08 | %(k) | |
| Net investment income | | | 1.27 | %(g) | | | 1.26 | %(g) | | | 2.05 | %(g) | | | 1.56 | %(g) | | | 1.06 | %(g)(h) | | | 1.43 | %(i) | |
| Portfolio turnover rate | | | 92 | % | | | 127 | % | | | 83 | % | | | 78 | % | | | 73 | %(f) | | | 74 | % | |
| Net assets, end of period (000s) | | $ | 24,668 | | | $ | 24,243 | | | $ | 16,936 | | | $ | 41,660 | | | $ | 42,865 | | | $ | 39,330 | | |
(a) The Fund changed its fiscal year end from March 31 to February 28. Per share data and total return reflect activity from April 1, 2006 through February 28, 2007.
(b) On August 22, 2005, the Fund's Investor A shares were renamed Class A shares.
(c) Per share data was calculated using the average shares outstanding during the period.
(d) Rounds to less than $0.01 per share.
(e) Total return at net asset value assuming all distributions reinvested and no contingent deferred sales charge.
(f) Not annualized.
(g) The benefits derived from expense reductions had an impact of less than 0.01%.
(h) Annualized.
(i) The benefits derived from expense reductions had an impact of 0.01%.
(j) Rounds to less than 0.01%.
(k) Bank of America Corporation assumed certain non-recurring costs. Absent these non-recurring costs, the waiver/reimbursement ratio would have been -%.
See Accompanying Notes to Financial Statements.
20
Financial Highlights – Columbia Multi-Advisor International Equity Fund
Selected data for a share outstanding throughout each period is as follows:
| | | Year Ended February 28, | | Year Ended
February 29, | | Period Ended
February 28, | | Year Ended
March 31, | |
| Class B Shares | | 2011 | | 2010 | | 2009 | | 2008 | | 2007 (a) | | 2006 (b) | |
| Net Asset Value, Beginning of Period | | $ | 9.75 | | | $ | 6.82 | | | $ | 14.47 | | | $ | 15.89 | | | $ | 15.31 | | | $ | 12.44 | | |
| Income from Investment Operations: | |
| Net investment income (c) | | | 0.07 | | | | 0.06 | | | | 0.17 | | | | 0.15 | | | | 0.05 | | | | 0.16 | | |
Net realized and unrealized gain (loss) on
investments, futures contracts, foreign
currency, foreign capital gains tax and
written options | | | 1.66 | | | | 3.20 | | | | (7.63 | ) | | | 0.70 | | | | 1.76 | | | | 2.92 | | |
| Total from investment operations | | | 1.73 | | | | 3.26 | | | | (7.46 | ) | | | 0.85 | | | | 1.81 | | | | 3.08 | | |
| Less Distributions to Shareholders: | |
| From net investment income | | | (0.14 | ) | | | (0.36 | ) | | | — | | | | (0.16 | ) | | | (0.07 | ) | | | (0.16 | ) | |
| From net realized gains | | | — | | | | — | | | | (0.19 | ) | | | (2.11 | ) | | | (1.16 | ) | | | (0.05 | ) | |
| Total distributions to shareholders | | | (0.14 | ) | | | (0.36 | ) | | | (0.19 | ) | | | (2.27 | ) | | | (1.23 | ) | | | (0.21 | ) | |
| Redemption Fees: | |
| Redemption fees added to paid-in-capital | | | — | | | | — | (d) | | | — | (d) | | | — | (d) | | | — | (d) | | | — | (d) | |
| Increase from regulatory settlements | | | — | (d) | | | 0.03 | | | | — | | | | — | | | | — | | | | — | | |
| Net Asset Value, End of Period | | $ | 11.34 | | | $ | 9.75 | | | $ | 6.82 | | | $ | 14.47 | | | $ | 15.89 | | | $ | 15.31 | | |
| Total return (e) | | | 17.88 | % | | | 48.47 | % | | | (52.23 | )% | | | 4.40 | % | | | 12.76 | %(f) | | | 24.96 | % | |
Ratios to Average Net Assets/
Supplemental Data: | |
| Net expenses before interest expense | | | 2.08 | %(g) | | | 2.01 | %(g) | | | 2.02 | %(g) | | | 1.94 | %(g) | | | 1.90 | %(g)(h) | | | 1.89 | %(i) | |
| Interest expense | | | — | %(j) | | | — | %(j) | | | — | | | | — | %(j) | | | — | %(h)(j) | | | — | | |
| Net expenses | | | 2.08 | %(g) | | | 2.01 | %(g) | | | 2.02 | %(g) | | | 1.94 | %(g) | | | 1.90 | %(g)(h) | | | 1.89 | %(i) | |
| Waiver/Reimbursement | | | — | | | | — | | | | — | | | | — | | | | — | | | | 0.08 | %(k) | |
| Net investment income | | | 0.70 | %(g) | | | 0.60 | %(g) | | | 1.44 | %(g) | | | 0.89 | %(g) | | | 0.36 | %(g)(h) | | | 1.19 | %(i) | |
| Portfolio turnover rate | | | 92 | % | | | 127 | % | | | 83 | % | | | 78 | % | | | 73 | %(f) | | | 74 | % | |
| Net assets, end of period (000s) | | $ | 784 | | | $ | 1,190 | | | $ | 1,098 | | | $ | 3,545 | | | $ | 4,587 | | | $ | 4,712 | | |
(a) The Fund changed its fiscal year end from March 31 to February 28. Per share data and total return reflect activity from April 1, 2006 through February 28, 2007.
(b) On August 22, 2005, the Fund's Investor B shares were renamed Class B shares.
(c) Per share data was calculated using the average shares outstanding during the period.
(d) Rounds to less than $0.01 per share.
(e) Total return at net asset value assuming all distributions reinvested and no contingent deferred sales charge.
(f) Not annualized.
(g) The benefits derived from expense reductions had an impact of less than 0.01%.
(h) Annualized.
(i) The benefits derived from expense reductions had an impact of 0.01%.
(j) Rounds to less than 0.01%.
(k) Bank of America Corporation assumed certain non-recurring costs. Absent these non-recurring costs, the waiver/reimbursement ratio would have been -%.
See Accompanying Notes to Financial Statements.
21
Financial Highlights – Columbia Multi-Advisor International Equity Fund
Selected data for a share outstanding throughout each period is as follows:
| | | Year Ended February 28, | | Year Ended
February 29, | | Period Ended
February 28, | | Year Ended
March 31, | |
| Class C Shares | | 2011 | | 2010 | | 2009 | | 2008 | | 2007 (a) | | 2006 (b) | |
| Net Asset Value, Beginning of Period | | $ | 9.63 | | | $ | 6.73 | | | $ | 14.29 | | | $ | 15.72 | | | $ | 15.16 | | | $ | 12.32 | | |
| Income from Investment Operations: | |
| Net investment income (c) | | | 0.07 | | | | 0.05 | | | | 0.16 | | | | 0.13 | | | | 0.05 | | | | 0.09 | | |
Net realized and unrealized gain (loss) on
investments, futures contracts, foreign currency,
foreign capital gains tax and written options | | | 1.64 | | | | 3.18 | | | | (7.53 | ) | | | 0.71 | | | | 1.74 | | | | 2.96 | | |
| Total from investment operations | | | 1.71 | | | | 3.23 | | | | (7.37 | ) | | | 0.84 | | | | 1.79 | | | | 3.05 | | |
| Less Distributions to Shareholders: | |
| From net investment income | | | (0.14 | ) | | | (0.36 | ) | | | — | | | | (0.16 | ) | | | (0.07 | ) | | | (0.16 | ) | |
| From net realized gains | | | — | | | | — | | | | (0.19 | ) | | | (2.11 | ) | | | (1.16 | ) | | | (0.05 | ) | |
| Total distributions to shareholders | | | (0.14 | ) | | | (0.36 | ) | | | (0.19 | ) | | | (2.27 | ) | | | (1.23 | ) | | | (0.21 | ) | |
| Redemption Fees: | |
| Redemption fees added to paid-in-capital | | | — | | | | — | (d) | | | — | (d) | | | — | (d) | | | — | (d) | | | — | (d) | |
| Increase from regulatory settlements | | | — | (d) | | | 0.03 | | | | — | | | | — | | | | — | | | | — | | |
| Net Asset Value, End of Period | | $ | 11.20 | | | $ | 9.63 | | | $ | 6.73 | | | $ | 14.29 | | | $ | 15.72 | | | $ | 15.16 | | |
| Total return (e) | | | 17.89 | % | | | 48.67 | % | | | (52.26 | )% | | | 4.37 | % | | | 12.75 | %(f) | | | 24.96 | % | |
Ratios to Average Net Assets/
Supplemental Data: | |
| Net expenses before interest expense | | | 2.08 | %(g) | | | 2.01 | %(g) | | | 2.02 | %(g) | | | 1.94 | %(g) | | | 1.90 | %(g)(h) | | | 1.89 | %(i) | |
| Interest expense | | | — | %(j) | | | — | %(j) | | | — | | | | — | %(j) | | | — | %(h)(j) | | | — | | |
| Net expenses | | | 2.08 | %(g) | | | 2.01 | %(g) | | | 2.02 | %(g) | | | 1.94 | %(g) | | | 1.90 | %(g)(h) | | | 1.89 | %(i) | |
| Waiver/Reimbursement | | | — | | | | — | | | | — | | | | — | | | | — | | | | 0.08 | %(k) | |
| Net investment income | | | 0.72 | %(g) | | | 0.55 | %(g) | | | 1.38 | %(g) | | | 0.79 | %(g) | | | 0.34 | %(g)(h) | | | 0.70 | %(i) | |
| Portfolio turnover rate | | | 92 | % | | | 127 | % | | | 83 | % | | | 78 | % | | | 73 | %(f) | | | 74 | % | |
| Net assets, end of period (000s) | | $ | 1,272 | | | $ | 1,728 | | | $ | 1,349 | | | $ | 3,863 | | | $ | 3,533 | | | $ | 3,276 | | |
(a) The Fund changed its fiscal year end from March 31 to February 28. Per share data and total return reflect activity from April 1, 2006 through February 28, 2007.
(b) On August 22, 2005, the Fund's Investor C shares were renamed Class C shares.
(c) Per share data was calculated using the average shares outstanding during the period.
(d) Rounds to less than $0.01 per share.
(e) Total return at net asset value assuming all distributions reinvested and no contingent deferred sales charge.
(f) Not annualized.
(g) The benefits derived from expense reductions had an impact of less than 0.01%.
(h) Annualized.
(i) The benefits derived from expense reductions had an impact of 0.01%.
(j) Rounds to less than 0.01%.
(k) Bank of America Corporation assumed certain non-recurring costs. Absent these non-recurring costs, the waiver/reimbursement ratio would have been -%.
See Accompanying Notes to Financial Statements.
22
Financial Highlights – Columbia Multi-Advisor International Equity Fund
Selected data for a share outstanding throughout the period is as follows:
| Class I Shares | | Period Ended
February 28,
2011 (a) | |
| Net Asset Value, Beginning of Period | | $ | 11.64 | | |
| Income from Investment Operations: | |
| Net investment income (b) | | | 0.02 | | |
| Net realized and unrealized gain on investments, futures contracts foreign currency and foreign capital gains tax | | | 1.21 | | |
| Total from investment operations | | | 1.23 | | |
| Less Distributions to Shareholders: | |
| From net investment income | | | (0.25 | ) | |
| Increase from regulatory settlements (c) | | | — | | |
| Net Asset Value, End of Period | | $ | 12.62 | | |
| Total return (d)(e) | | | 10.69 | % | |
| Ratios to Average Net Assets/Supplemental Data: | |
| Net expenses before interest expense (f)(g) | | | 0.95 | % | |
| Interest expense (g)(h) | | | — | % | |
| Net expenses (f)(g) | | | 0.95 | % | |
| Net investment income (f)(g) | | | 0.32 | % | |
| Portfolio turnover rate | | | 92 | % | |
| Net assets, end of period (000s) | | $ | 47,056 | | |
(a) Class I shares commenced operations on September 27, 2010. Per share data and total return reflect activity from that date.
(b) Per share data was calculated using the average shares outstanding during the period.
(c) Rounds to less than $0.01 per share.
(d) Total return at net asset value assuming all distributions reinvested.
(e) Not annualized.
(f) The benefits derived from expense reductions had an impact of less than 0.01%.
(g) Annualized.
(h) Rounds to less than 0.01%.
See Accompanying Notes to Financial Statements.
23
Financial Highlights – Columbia Multi-Advisor International Equity Fund
Selected data for a share outstanding throughout each period is as follows:
| | | Year Ended February 28, | | Year Ended
February 29, | | Period Ended
February 28, | | Period Ended
March 31, | |
| Class R Shares | | 2011 | | 2010 | | 2009 | | 2008 | | 2007 (a) | | 2006 (b) | |
| Net Asset Value, Beginning of Period | | $ | 10.68 | | | $ | 7.44 | | | $ | 15.76 | | | $ | 17.12 | | | $ | 16.38 | | | $ | 15.44 | | |
| Income from Investment Operations: | |
| Net investment income (c) | | | 0.13 | | | | 0.09 | | | | 0.21 | | | | 0.06 | | | | 0.12 | | | | 0.03 | | |
Net realized and unrealized gain (loss) on
investments, futures contracts, foreign currency,
foreign capital gains tax and written options | | | 1.83 | | | | 3.53 | | | | (8.30 | ) | | | 0.93 | | | | 1.91 | | | | 0.91 | | |
| Total from investment operations | | | 1.96 | | | | 3.62 | | | | (8.09 | ) | | | 0.99 | | | | 2.03 | | | | 0.94 | | |
| Less Distributions to Shareholders: | |
| From net investment income | | | (0.19 | ) | | | (0.41 | ) | | | (0.04 | ) | | | (0.24 | ) | | | (0.13 | ) | | | — | | |
| From net realized gains | | | — | | | | — | | | | (0.19 | ) | | | (2.11 | ) | | | (1.16 | ) | | | — | | |
| Total distributions to shareholders | | | (0.19 | ) | | | (0.41 | ) | | | (0.23 | ) | | | (2.35 | ) | | | (1.29 | ) | | | — | | |
| Redemption Fees: | |
| Redemption fees added to paid-in-capital | | | — | | | | — | (d) | | | — | (d) | | | — | (d) | | | — | (d) | | | — | (d) | |
| Increase from regulatory settlements | | | — | (d) | | | 0.03 | | | | — | | | | — | | | | — | | | | — | | |
| Net Asset Value, End of Period | | $ | 12.45 | | | $ | 10.68 | | | $ | 7.44 | | | $ | 15.76 | | | $ | 17.12 | | | $ | 16.38 | | |
| Total return (e) | | | 18.47 | % | | | 49.28 | % | | | (52.00 | )% | | | 4.87 | % | | | 13.31 | %(f) | | | 6.09 | %(f) | |
Ratios to Average Net Assets/
Supplemental Data: | |
| Net expenses before interest expense | | | 1.58 | %(g) | | | 1.51 | %(g) | | | 1.52 | %(g) | | | 1.44 | %(g) | | | 1.40 | %(g)(h) | | | 1.39 | %(h)(i) | |
| Interest expense | | | — | %(j) | | | — | %(j) | | | — | | | | — | %(j) | | | — | %(h)(j) | | | — | | |
| Net expenses | | | 1.58 | %(g) | | | 1.51 | %(g) | | | 1.52 | %(g) | | | 1.44 | %(g) | | | 1.40 | %(g)(h) | | | 1.39 | %(h)(i) | |
| Waiver/Reimbursement | | | — | | | | — | | | | — | | | | — | | | | — | | | | 0.08 | %(h)(k) | |
| Net investment income | | | 1.13 | %(g) | | | 0.86 | %(g) | | | 1.70 | %(g) | | | 0.31 | %(g) | | | 0.80 | %(g)(h) | | | 0.85 | %(h)(i) | |
| Portfolio turnover rate | | | 92 | % | | | 127 | % | | | 83 | % | | | 78 | % | | | 73 | %(f) | | | 74 | % | |
| Net assets, end of period (000s) | | $ | 287 | | | $ | 289 | | | $ | 112 | | | $ | 196 | | | $ | 12 | | | $ | 11 | | |
(a) The Fund changed its fiscal year end from March 31 to February 28. Per share data and total return reflect activity from April 1, 2006 through February 28, 2007.
(b) Class R shares commenced operations on January 23, 2006.
(c) Per share data was calculated using the average shares outstanding during the period.
(d) Rounds to less than $0.01 per share.
(e) Total return at net asset value assuming all distributions reinvested.
(f) Not annualized.
(g) The benefits derived from expense reductions had an impact of less than 0.01%.
(h) Annualized.
(i) The benefits derived from expense reductions had an impact of 0.01%.
(j) Rounds to less than 0.01%.
(k) Bank of America Corporation assumed certain non-recurring costs. Absent these non-recurring costs, the waiver/reimbursement ratio would have been -%.
See Accompanying Notes to Financial Statements.
24
Financial Highlights – Columbia Multi-Advisor International Equity Fund
Selected data for a share outstanding throughout the period is as follows:
| Class W Shares | | Period Ended
February 28,
2011 (a) | |
| Net Asset Value, Beginning of Period | | $ | 11.48 | | |
| Income from Investment Operations: | |
| Net investment income (b) | | | 0.02 | | |
Net realized and unrealized gain on investments, futures contracts,
foreign currency and foreign capital gains tax | | | 1.17 | | |
| Total from investment operations | | | 1.19 | | |
| Less Distributions to Shareholders: | |
| From net investment income | | | (0.21 | ) | |
| Increase from regulatory settlements (c) | | | — | | |
| Net Asset Value, End of Period | | $ | 12.46 | | |
| Total Return (d)(e) | | | 10.52 | % | |
| Ratios to Average Net Assets/Supplemental Data: | |
| Net expenses before interest expense (f)(g) | | | 1.30 | % | |
| Interest expense (g)(h) | | | — | % | |
| Net expenses (f)(g) | | | 1.30 | % | |
| Net investment income (f)(g) | | | 0.33 | % | |
| Portfolio turnover rate | | | 92 | % | |
| Net assets, end of period (000s) | | $ | 3 | | |
(a) Class W shares commenced operations on September 27, 2010. Per share data and total return reflect activity from that date.
(b) Per share data was calculated using the average shares outstanding during the period.
(c) Rounds to less than $0.01 per share.
(d) Total return at net asset value assuming all distributions reinvested.
(e) Not annualized.
(f) The benefits derived from expense reductions had an impact of less than 0.01%.
(g) Annualized.
(h) Rounds to less than 0.01%.
See Accompanying Notes to Financial Statements.
25
Financial Highlights – Columbia Multi-Advisor International Equity Fund
Selected data for a share outstanding throughout each period is as follows:
| | | Year Ended February 28, | | Year Ended
February 29, | | Period Ended
February 28, | | Year Ended
March 31, | |
| Class Z Shares | | 2011 | | 2010 | | 2009 | | 2008 | | 2007 (a) | | 2006 (b) | |
Net Asset Value,
Beginning of Period | | $ | 10.81 | | | $ | 7.52 | | | $ | 15.96 | | | $ | 17.29 | | | $ | 16.58 | | | $ | 13.44 | | |
Income from Investment
Operations: | |
| Net investment income (c) | | | 0.18 | | | | 0.17 | | | | 0.29 | | | | 0.32 | | | | 0.19 | | | | 0.24 | | |
Net realized and unrealized gain (loss)
on investments, futures contracts,
foreign currency, foreign capital gains
tax and written options | | | 1.87 | | | | 3.55 | | | | (8.43 | ) | | | 0.78 | | | | 1.93 | | | | 3.25 | | |
| Total from investment operations | | | 2.05 | | | | 3.72 | | | | (8.14 | ) | | | 1.10 | | | | 2.12 | | | | 3.49 | | |
Less Distributions to
Shareholders: | |
| From net investment income | | | (0.24 | ) | | | (0.46 | ) | | | (0.11 | ) | | | (0.32 | ) | | | (0.25 | ) | | | (0.30 | ) | |
| From net realized gains | | | — | | | | — | | | | (0.19 | ) | | | (2.11 | ) | | | (1.16 | ) | | | (0.05 | ) | |
| Total distributions to shareholders | | | (0.24 | ) | | | (0.46 | ) | | | (0.30 | ) | | | (2.43 | ) | | | (1.41 | ) | | | (0.35 | ) | |
| Redemption Fees: | |
Redemption fees added to
paid-in-capital | | | — | | | | — | (d) | | | — | (d) | | | — | (d) | | | — | (d) | | | — | (d) | |
Increase from regulatory
settlements | | | — | (d) | | | 0.03 | | | | — | | | | — | | | | — | | | | — | | |
| Net Asset Value, End of Period | | $ | 12.62 | | | $ | 10.81 | | | $ | 7.52 | | | $ | 15.96 | | | $ | 17.29 | | | $ | 16.58 | | |
| Total return (e) | | | 19.08 | % | | | 50.09 | % | | | (51.76 | )% | | | 5.42 | % | | | 13.73 | %(f) | | | 26.24 | % | |
Ratios to Average Net Assets/
Supplemental Data: | |
| Net expenses before interest expense | | | 1.08 | %(g) | | | 1.01 | %(g) | | | 1.02 | %(g) | | | 0.94 | %(g) | | | 0.90 | %(g)(h) | | | 0.89 | %(i) | |
| Interest expense | | | — | %(j) | | | — | %(j) | | | — | | | | — | %(j) | | | — | %(h)(j) | | | — | | |
| Net expenses | | | 1.08 | %(g) | | | 1.01 | %(g) | | | 1.02 | %(g) | | | 0.94 | %(g) | | | 0.90 | %(g)(h) | | | 0.89 | %(i) | |
| Waiver/Reimbursement | | | — | | | | — | | | | — | | | | — | | | | — | | | | 0.08 | %(k) | |
| Net investment income | | | 1.58 | %(g) | | | 1.59 | %(g) | | | 2.28 | %(g) | | | 1.79 | %(g) | | | 1.26 | %(g)(h) | | | 1.68 | %(i) | |
| Portfolio turnover rate | | | 92 | % | | | 127 | % | | | 83 | % | | | 78 | % | | | 73 | %(f) | | | 74 | % | |
| Net assets, end of period (000s) | | $ | 1,177,541 | | | $ | 1,375,538 | | | $ | 1,155,598 | | | $ | 2,549,057 | | | $ | 2,352,583 | | | $ | 1,841,838 | | |
(a) The Fund changed its fiscal year end from March 31 to February 28. Per share data and total return reflect activity from April 1, 2006 through February 28, 2007.
(b) On August 22, 2005, the Fund's Primary A shares were renamed Class Z shares.
(c) Per share data was calculated using the average shares outstanding during the period.
(d) Rounds to less than $0.01 per share.
(e) Total return at net asset value assuming all distributions reinvested.
(f) Not annualized.
(g) The benefits derived from expense reductions had an impact of less than 0.01%.
(h) Annualized.
(i) The benefits derived from expense reductions had an impact of 0.01%.
(j) Rounds to less than 0.01%.
(k) Bank of America Corporation assumed certain non-recurring costs. Absent these non-recurring costs, the waiver/reimbursement ratio would have been -%.
See Accompanying Notes to Financial Statements.
26
Notes to Financial Statements – Columbia Multi-Advisor International Equity Fund
February 28, 2011
Note 1. Organization
Columbia Multi-Advisor International Equity Fund (the Fund), a series of Columbia Funds Series Trust (the Trust), is a diversified fund. The Trust is registered under the Investment Company Act of 1940, as amended (the 1940 Act), as an open-end management investment company organized as a Delaware statutory trust.
After the close of business on April 30, 2010, Ameriprise Financial, Inc. (Ameriprise Financial) acquired a portion of the asset management business of Columbia Management Group, LLC (the Transaction), including the business of managing the Fund. In connection with the closing of the Transaction (the Closing), RiverSource Investments, LLC, a wholly owned subsidiary of Ameriprise Financial, became the investment manager of the Fund and changed its name to Columbia Management Investment Advisers, LLC (the Investment Manager).
Investment Objective
The Fund seeks long-term capital growth.
Fund Shares
The Trust has unlimited authorized shares of beneficial interest. The Fund offers Class A, Class B, Class C, Class I, Class R, Class W and Class Z shares. On December 28, 2010, the Investment Manager exchanged Class Z shares valued at $90,024,505 for Class I shares. The Fund is also authorized to issue Class R4 shares, however this share class is not currently offered for sale. All share classes have identical voting, dividend and liquidation rights. Each share class has its own expense structure and sales charges, as applicable.
Class A shares are subject to a maximum front-end sales charge of 5.75% based on the investment amount. Class A shares purchased without an initial sales charge in accounts aggregating $1 million to $50 million at the time of purchase are subject to a 1.00% contingent deferred sales charge (CDSC) if the shares are sold within 18 months of purchase, charged as follows: 1.00% CDSC if redeemed within 12 months of purchase, and 0.50% CDSC if redeemed more than 12, but less than 18 months after purchase.
The Fund no longer accepts investments by new or existing investors in the Fund's Class B shares, except in connection with the reinvestment of any dividend and/or capital gain distributions in Class B shares of the Fund and exchanges by existing Class B shareholders of certain other funds within the Columbia Family of Funds. Class B shares may be subject to a maximum CDSC of 5.00% based upon the holding period after purchase. Class B shares will generally convert to Class A shares eight years after purchase.
Class C shares are subject to a 1.00% CDSC on shares redeemed within one year of purchase.
Class I shares are not subject to sales charges and are available only to the Columbia Family of Funds. Class I shares became effective September 27, 2010.
Class R shares are not subject to sales charges and are available only to qualifying institutional investors.
Class W shares are not subject to sales charges and are available only to investors purchasing through authorized investment programs managed by investment professionals, including discretionary managed account programs. Class W shares became effective September 27, 2010.
Class Z shares are not subject to sales charges and are available only to certain investors, as described in the Fund's prospectus.
Note 2. Summary of Significant Accounting Policies
The preparation of financial statements in accordance with U.S. generally accepted accounting principles (GAAP) requires the Investment Manager to make certain estimates and assumptions that affect the reported amounts of assets and liabilities, the disclosure of contingent assets and liabilities at the date of the financial statements and the reported amounts of revenue and expenses during the reporting period. Actual results could differ from those estimates.
The following is a summary of significant accounting policies consistently followed by the Fund in the preparation of its financial statements.
Security Valuation
Equity securities are valued at the last sale price on the principal exchange on which they trade, except for securities traded on the NASDAQ, which are valued at the NASDAQ official close price. Unlisted securities or listed securities for which there were no sales during the day are valued at the closing bid price on such exchanges or over-the-counter markets.
Short-term investments maturing in 60 days or less are valued at amortized cost, which approximates market value.
Investments in other open-end investment companies are valued at net asset value.
Futures contracts are valued at the settlement price established each day by the board of trade or exchange on which they are traded.
27
Columbia Multi-Advisor International Equity Fund, February 28, 2011
Written options are valued at the last reported sale price, or in the absence of a sale, at the last quoted ask price.
Forward foreign currency exchange contracts are valued at the prevailing forward exchange rate of the underlying currencies.
Foreign securities are generally valued at the last sale price on the foreign exchange or market on which they trade. If any foreign share prices are not readily available as a result of limited share activity, the securities are valued at the last sale price of the local shares in the principal market in which such securities are normally traded.
Generally, trading in foreign securities is substantially completed each day at various times prior to the close of the New York Stock Exchange (NYSE). The values of such securities used in computing the net asset value of the Fund's shares are determined as of such times. Foreign currency exchange rates are generally determined at 4:00 p.m. Eastern (U.S.) time. Occasionally, events affecting the values of such foreign securities may occur between the times at which they are determined and the close of the customary trading session of the NYSE, which would not be reflected in the computation of the Fund's net asset value. If events materially affecting the values of such foreign securities occur and it is determined that market quotations are not reliable, then these foreign securities will be valued at their fair value using procedures approved by the Board of Trustees.
The Fund may use a systematic fair valuation model provided by an independent third party to value securities principally traded in foreign markets in order to adjust for possible stale pricing that may occur between the close of the foreign exchanges and the time for valuation.
Investments for which market quotations are not readily available, or that have quotations which the Investment Manager believes are not reliable, are valued at fair value as determined in good faith under consistently applied procedures established by and under the general supervision of the Board of Trustees. If a security is valued at fair value, such value is likely to be different from the last quoted market price for the security. The determination of fair value often requires significant judgment. To determine fair value, the Investment Manager may use assumptions including but not limited to future cash flows and estimated risk premiums. Multiple inputs from various sources may be used to determine value.
Foreign Currency Transactions and Translations
The values of all assets and liabilities quoted in foreign currencies are translated into U.S. dollars at that day's exchange rates. Net realized and unrealized gains (losses) on foreign currency transactions and translations include gains (losses) arising from the fluctuation in exchange rates between trade and settlement dates on securities transactions, gains (losses) arising from the disposition of foreign currency and currency gains (losses) between the accrual and payment dates on dividends, interest income and foreign withholding taxes.
For financial statement purposes, the Fund does not distinguish that portion of gains (losses) on investments which is due to changes in foreign exchange rates from that which is due to changes in market prices of the investments. Such fluctuations are included with the net realized and unrealized gains (losses) on investments on the Statement of Operations.
Derivative Instruments
The Fund may use derivative instruments including futures contracts, forward foreign currency exchange contracts and written options in order to meet its investment objectives. The Fund employs strategies in differing combinations to permit it to increase, decrease or change the level of exposure to market risk factors. The achievement of any strategy relating to derivatives depends on an analysis of various risk factors, and if the strategies for the use of derivatives do not work as intended, the Fund may not achieve its investment objectives.
In pursuit of its investment objectives, the Fund is exposed to the following market risks, among others:
Equity Risk: Equity risk relates to change in value of equity securities such as common stocks due to general market conditions such as real or perceived adverse economic conditions, changes in the general outlook for corporate earnings, or adverse investor sentiment. Equity securities generally have greater price volatility than fixed income securities.
Foreign Exchange Rate Risk: Foreign exchange rate risk relates to the change in the U.S. dollar value of a security held that is denominated in a foreign currency. The U.S. dollar value of a foreign-currency-denominated security will decrease as the dollar appreciates against the currency, while the U.S. dollar value will increase as the dollar depreciates against the currency.
The following notes provide more detailed information about each derivative type held by the Fund:
Forward Foreign Currency Exchange Contracts—The Fund entered into forward foreign currency exchange contracts to shift its investment exposure from one currency to another.
Forward foreign currency exchange contracts are agreements to exchange one currency for another at a future date at a specified
28
Columbia Multi-Advisor International Equity Fund, February 28, 2011
price. These contracts are used to minimize the exposure to foreign exchange rate fluctuations during the period between the trade and settlement dates of the contract. Contracts to buy generally are used to acquire exposure to foreign currencies, while contracts to sell are generally used to reduce the exposure to foreign exchange rate fluctuations. Forward foreign currency exchange contracts are valued daily at the current exchange rate of the underlying currency, resulting in unrealized gains (losses) which become realized at the time the forward foreign currency exchange contracts are closed or mature. Realized and unrealized gains (losses) arising from such transactions are included in net realized and unrealized gains (losses) on foreign currency transactions. The use of forward foreign currency exchange contracts does not eliminate fluctuations in the prices of the Fund's portfolio securities. While the maximum potential loss from such contracts is the aggregate face value in U.S. dollars at the time the contract was opened, exposure is typically limited to the change in value of the contract (in U.S. dollars) over the period it remains open. The Fund could also be exposed to risk that counterparties of the contracts may be unable to fulfill the terms of the contracts.
During the year ended February 28, 2011, the Fund entered into 232 forward foreign currency exchange contracts.
Options—The Fund had written covered call options to decrease the Fund's exposure to equity risk and to increase return on instruments. Written covered call options become more profitable as the price of the underlying instruments depreciates relative to the strike price.
Writing put options tends to increase the Fund's exposure to the underlying instrument. When the Fund writes a call or put option, an amount equal to the premium received is recorded as a liability and subsequently marked-to-market to reflect the current value of the option written. Premiums received from writing options which expire are treated as realized gains. Premiums received from writing options which are exercised or closed are added to the proceeds or offset against the amounts paid on the underlying security transaction to determine the realized gain or loss. The Fund, as a writer of an option, has no control over whether the underlying security may be sold (call) or purchased (put) and as a result bears the market risk of an unfavorable change in the price of the security underlying the written option. There is the risk that the Fund may not be able to enter into a closing transaction because of an illiquid market. The Fund identifies within its portfolio of investments cash or liquid portfolio securities equal to the amount of the written options contract commitment.
The Fund may also purchase put and call options. Purchasing call options tends to increase the Fund's exposure to the underlying instrument. Purchasing put options tends to decrease the Fund's exposure to the underlying instrument. The Fund may pay a premium, which is included in the Fund's Statement of Assets and Liabilities as an investment and subsequently marked-to-market to reflect the current value of the option. The risk associated with purchasing put and call options is limited to the premium paid. Premiums paid for purchasing options which expire are treated as realized losses. Premiums paid for purchasing options which are exercised are added to the amounts paid (call) or offset against the proceeds (put) on the underlying security to determine the realized gain or loss. If the Fund enters into a closing transaction, the Fund will realize a gain or loss, depending on whether the proceeds from the closing transaction are greater or less than the cost of the option.
During the year ended February 28, 2011, the Fund entered into 24,196 written options contracts.
Futures Contracts—The Fund entered into equity index futures contracts to equitize cash in order to maintain appropriate equity market exposure while keeping sufficient cash to accommodate daily redemptions.
The use of futures contracts involves certain risks, which include, among others: (1) imperfect correlation between the price movement of the instruments and the underlying securities, (2) inability to close out positions due to differing trading hours, or the temporary absence of a liquid market, for either the instruments or the underlying securities, and (3) an inaccurate prediction of the future direction of interest rates by the Fund's investment advisor.
Upon entering into a futures contract, the Fund identifies within its portfolio of investments cash or securities in an amount sufficient to meet the initial margin requirement. Subsequent payments are made or received by the Fund equal to the daily change in the contract value and are recorded as variation margin receivable or payable and offset in unrealized gains or losses. The Fund recognizes a realized gain or loss when the contract is closed or expires.
Futures contracts involve, to varying degrees, risk of loss in excess of the variation margin disclosed on the Statement of Assets and Liabilities.
During the year ended February 28, 2011, the Fund entered into 51 futures contracts.
29
Columbia Multi-Advisor International Equity Fund, February 28, 2011
Effects of Derivative Transactions in the Financial Statements
The following table is a summary of the value of the Fund's derivative instruments as of February 28, 2011.
| Fair Value of Derivative Instruments | |
| Statement of Assets and Liabilities | |
| Asset | | Fair Value | | Liability | | Fair Value | |
Unrealized Appreciation on Forward Foreign
Currency Exchange Contracts | | $ | 1,234,053 | | | Unrealized Depreciation on Forward
Foreign Currency Exchange Contracts | | $ | 735,364 | | |
The effect of derivative instruments on the Fund's Statement of Operations for the year ended February 28, 2011:
| | | Amount of Realized Gain or (Loss)
and Change in Unrealized Appreciation
(Depreciation) on Derivatives Recognized in Income | |
| | | Risk Exposure | | Net Realized
Gain (Loss) | | Change in
Unrealized
Appreciation
(Depreciation) | |
| Forward Foreign Currency Exchange Contracts | | Foreign Exchange Rate Risk | | $ | (4,183,996 | ) | | $ | (4,423,255 | ) | |
| Written Options | | Equity Risk | | | 382,193 | | | | (22,865 | ) | |
| Futures Contracts | | Equity Risk | | | (197,942 | ) | | | — | | |
Repurchase Agreements
The Fund may engage in repurchase agreement transactions with institutions that the Investment Manager has determined are creditworthy. The Fund, through the custodian, receives delivery of the underlying securities collateralizing a repurchase agreement. The Investment Manager is responsible for determining that the collateral is at least equal, at all times, to the value of the repurchase obligation including interest. A repurchase agreement transaction involves certain risks in the event of default or insolvency of the counterparty. These risks include possible delays in or restrictions on the Fund's ability to dispose of the underlying securities and a possible decline in the value of the underlying securities during the period while the Fund seeks to assert its rights.
Security Transactions
Security transactions are accounted for on the trade date. Cost is determined and gains (losses) are based upon the specific identification method for both financial statement and federal income tax purposes.
Income Recognition
Interest income is recorded on the accrual basis.
Corporate actions and dividend income are recorded net of any non-reclaimable tax withholdings, on the ex-dividend date or upon receipt of ex-dividend notification in the case of certain foreign securities.
Awards from class action litigation are recorded as a reduction of cost if the Fund still owns the applicable securities on the payment date. If the Fund no longer owns the applicable securities, the proceeds are recorded as realized gains.
Expenses
General expenses of the Trust are allocated to the Fund and other series of the Trust based upon relative net assets or other expense allocation methodologies determined by the nature of the expense. Expenses directly attributable to a specific class of shares are charged to that share class. Expenses directly attributable to the Fund are charged to the Fund.
30
Columbia Multi-Advisor International Equity Fund, February 28, 2011
Determination of Class Net Asset Value
All income, expenses (other than class-specific expenses which are charged directly to a share class, as shown in the Statement of Operations) and realized and unrealized gains (losses) are allocated to each class of the Fund on a daily basis, based on the relative net assets of each class, for purposes of determining the net asset value of each class.
Federal Income Tax Status
The Fund intends to qualify each year as a regulated investment company under Subchapter M of the Internal Revenue Code, as amended, and will distribute substantially all of its taxable income, if any, for its tax year, and as such will not be subject to federal income taxes. In addition, the Fund intends to distribute in each calendar year substantially all of its net investment income, capital gains and certain other amounts, if any, such that the Fund should not be subject to federal excise tax. Therefore, no federal income or excise tax provision is recorded.
Foreign Tax
The Fund may be subject to foreign taxes on income and/or gains on investments or currency repatriation, a portion of which may be recoverable. The Fund will accrue such taxes and recoveries as applicable, based upon its current interpretation of tax rules and regulations that exist in the markets in which it invests.
Realized gains in certain countries may be subject to foreign taxes at the Fund level, at rates ranging from approximately 10% to 15%. The Fund accrues for such foreign taxes on net realized and unrealized gains at the appropriate rate for each jurisdiction.
Distributions to Shareholders
Distributions from net investment income, if any, are declared and paid semi-annually. The Fund may, however, declare and pay distributions from net investment income more frequently. The Fund will distribute net realized capital gains (including net short-term capital gains) at least annually after the fiscal year in which the capital gains were earned, unless offset by any available capital loss carryforward. Income distributions and capital gain distributions are determined in accordance with federal income tax regulations which may differ from GAAP.
Indemnification
In the normal course of business, the Fund enters into contracts that contain a variety of representations and warranties and which provide general indemnities. The Fund's maximum exposure under these arrangements is unknown because this would involve future claims against the Fund. Also, under the Trust's organizational documents and by contract, the Trustees and officers of the Trust are indemnified against certain liabilities that may arise out of actions relating to their duties to the Trust. However, based on experience, the Fund expects the risk of loss due to these representations, warranties and indemnities to be minimal.
Note 3. Fees and Compensation Paid to Affiliates
Investment Management Services Fee
The Fund is a "multi-manager" fund. The Investment Manager is responsible for the management of the Fund and has engaged Marsico Capital Management, LLC (Marsico) to manage a portion of the Fund's assets on a day-to-day basis (see Subadvisory Fee note below), with the Investment Manager managing the balance of the Fund's assets on a day-to-day basis.
The management fee is based on the Fund's average daily net assets at the following annual rates:
| Average Daily Net Assets | | Annual Fee Rate | |
| First $500 million | | | 0.70 | % | |
| $500 million to $1 billion | | | 0.65 | % | |
| $1 billion to $1.5 billion | | | 0.60 | % | |
| $1.5 billion to $3 billion | | | 0.55 | % | |
| $3 billion to $6 billion | | | 0.53 | % | |
| Over $6 billion | | | 0.51 | % | |
Prior to the Closing, Columbia Management Advisors, LLC (Columbia), an indirect, wholly owned subsidiary of Bank of America Corporation (BOA), provided investment management services to the Fund under the same fee structure.
The effective management fee rate for the year ended February 28, 2011, was 0.66% of the Fund's average daily net assets.
To the extent that the Fund is not benefitting from a separate contractual expense limitation arrangement, the Investment Manager has contractually agreed to waive a portion of its management fees through June 30, 2011.
31
Columbia Multi-Advisor International Equity Fund, February 28, 2011
The waiver amount is calculated based on the difference between the dollar amount of subadvisory fees that would have been payable to Marsico based on the annualized rate of 0.45% of the Fund's average daily net assets, and the dollar amount of subadvisory fees calculated on a monthly basis based on the annualized subadvisory fee rate effective January 1, 2008 to which Marsico is entitled from each Fund which is described under the Subadvisory Fee note below. The annualized fee rate of 0.45% represented the subadvisory fee rate which Marsico was entitled to receive prior to January 1, 2008.
In the absence of a separate contractual expense limitation arrangement, the management fee waiver for the Fund would be calculated as follows:
| Average Daily Net Assets* | | Management
Fee Waiver | |
| Assets up to $18 billion | | | 0.00 | % | |
Assets in excess of $18 billion and
up to $21 billion | | | 0.05 | % | |
| Assets in excess of $21 billion | | | 0.10 | % | |
* For purposes of the calculation, "Assets" are aggregate assets subadvised by Marsico in the following Columbia Funds: (i) Columbia Marsico International Opportunities Fund; (ii) Columbia Multi-Advisor International Equity Fund; (iii) Columbia Marsico International Opportunities Fund, Variable Series; and (iv) any future Columbia international equity fund subadvised by Marsico which the Investment Manager and Marsico mutually agree in writing.
Prior to the Closing, Columbia waived a portion of the Fund's management fees at the same rates.
For the year ended February 28, 2011, no management fees were waived for the Fund.
In September 2010, the Board of Trustees approved an amended Investment Management Services Agreement (IMSA) with the Investment Manager that increases the management fee rates payable to the Investment Manager at all asset levels. The IMSA was approved by the Fund's shareholders at a Special Meeting of Shareholders held on February 15, 2011. The IMSA, which is effective April 1, 2011, revises the management fee as follows:
| Average Daily Net Assets | | Annual Fee Rate | |
| First $500 million | | | 0.790 | % | |
| $500 million to $1 billion | | | 0.745 | % | |
| $1 billion to $1.5 billion | | | 0.700 | % | |
| $1.5 billion to $3 billion | | | 0.650 | % | |
| $3 billion to $6 billion | | | 0.640 | % | |
| Over $6 billion | | | 0.620 | % | |
Subadvisory Fee
Pursuant to a subadvisory agreement, and subject to the oversight of the Investment Manager and the Fund's Board of Trustees, Marsico is responsible for a portion of the Fund's daily investment operations, including placing all orders for the purchase and sale of a portion of the Fund's portfolio securities. The Investment Manager, from the management fee it receives, pays Marsico a monthly subadvisory fee based on the Fund's average daily net assets at the following annual rates:
| Average Daily Net Assets* | | Annual Fee Rate | |
| Assets up to $6 billion | | | 0.45 | % | |
Assets in excess of $6 billion and
up to $10 billion | | | 0.40 | % | |
| Assets in excess of $10 billion | | | 0.35 | % | |
* For purposes of the calculation, assets are aggregate assets subadvised by Marsico in the following Columbia Funds: (i) Columbia Marsico International Opportunities Fund; (ii) Columbia Multi-Advisor International Equity Fund; (iii) Columbia Marsico International Opportunities Fund, Variable Series; and (iv) any future Columbia international equity fund subadvised by Marsico which the Investment Manager and Marsico mutually agree in writing.
Prior to the Closing, Marsico provided subadvisory services to the Fund under the same fee structure in accordance with an agreement with Columbia.
Administration Fee
Effective upon the Closing, the Investment Manager became the administrator of the Fund and provides administrative and other services to the Fund, including services previously performed under the Pricing and Bookkeeping Oversight and Services Agreement discussed below. The administration fee is based on the annual rate of 0.17% of the Fund's average daily net assets, less the fees payable by the Fund as described under the Pricing and Bookkeeping Fees note below. Prior to the Closing, Columbia provided administrative services to the Fund at the same fee rate.
32
Columbia Multi-Advisor International Equity Fund, February 28, 2011
In connection with the amended IMSA approved by the Board of Trustees, effective April 1, 2011, the Fund pays a reduced monthly administration fee to the Investment Manager based on the Fund's average daily net assets at the following annual rates:
| Average Daily Net Assets | | Annual Fee Rate | |
| First $500 million | | | 0.080 | % | |
| $500 million to $1 billion | | | 0.075 | % | |
| $1 billion to $3 billion | | | 0.070 | % | |
| $3 billion to $12 billion | | | 0.060 | % | |
| Over $12 billion | | | 0.050 | % | |
Pricing and Bookkeeping Fees
Prior to the Closing, the Fund entered into a Financial Reporting Services Agreement (the Financial Reporting Services Agreement) with State Street Bank and Trust Company (State Street) and Columbia pursuant to which State Street provides financial reporting services to the Fund. The Fund also entered into an Accounting Services Agreement (collectively with the Financial Reporting Services Agreement, the State Street Agreements) with State Street and Columbia pursuant to which State Street provides accounting services to the Fund. Upon the Closing, Columbia assigned and delegated its rights and obligations under the State Street Agreements to the Investment Manager. Under the State Street Agreements, the Fund pays State Street an annual fee of $38,000 paid monthly plus an additional monthly fee based on an annualized percentage rate of average daily net assets of each Fund for the month. The aggregate fee will not exceed $140,000 per year (exclusive of out-of-pocket expenses and charges). In addition, the Fund also pays a multi-manager fee of $3,000 for each investment subadvisor managing a portion of the Fund. The Fund also reimburses State Street for certain out-of-pocket expenses and charges. Effective March 28, 2011, these services are now provided under the Administrative Services Agreement discussed above.
Also prior to the Closing, the Fund entered into a Pricing and Bookkeeping Oversight and Services Agreement (the Services Agreement) with Columbia. Under the Services Agreement, Columbia provided services related to Fund expenses and the requirements of the Sarbanes-Oxley Act of 2002, and provided oversight of the accounting and financial reporting services provided by State Street. Under the Services Agreement, the Fund reimbursed Columbia for out-of-pocket expenses and charges, including fees payable to third parties, such as for pricing the Fund's portfolio securities, incurred by Columbia in the performance of services under the Services Agreement. The Services Agreement was terminated upon the Closing. These services are now provided under the Administration Fee note discussed above.
Transfer Agent Fee
In connection with the Closing, RiverSource Service Corporation, a wholly owned subsidiary of Ameriprise Financial, became the transfer agent of the Fund and changed its name to Columbia Management Investment Services Corp. (the New Transfer Agent). The New Transfer Agent has contracted with Boston Financial Data Services (BFDS) to serve as sub-transfer agent. The New Transfer Agent receives monthly account-based service fees that vary by class and are based on the number of open accounts and asset-based fees, calculated based on assets held in omnibus accounts, which are intended to reimburse the New Transfer Agent for certain sub-transfer agent fees (exclusive of BFDS fees). The New Transfer Agent pays the fees of BFDS for services as sub-transfer agent and is not entitled to reimbursement for such fees from the Fund.
The New Transfer Agent receives reimbursement for certain out-of-pocket expenses and may also receive compensation for various shareholder services.
Prior to the Closing, Columbia Management Services, Inc., an affiliate of Columbia and an indirect, wholly owned subsidiary of BOA, provided shareholder services to the Fund and contracted with BFDS to serve as sub-transfer agent, under the same fee structure.
For the year ended February 28, 2011, the Fund's effective transfer agent fee rate for each class, with the exception of Class I shares, as a percentage of the average daily net assets was as follows:
| Class A | | Class B | | Class C | | Class R | | Class W | | Class Z | |
| | 0.16 | % | | | 0.16 | % | | | 0.16 | % | | | 0.16 | % | | | 0.17 | % | | | 0.16 | % | |
Class I shares do not pay transfer agent fees.
An annual minimum account balance fee of $20 may apply to certain accounts with a value below the Fund's initial minimum investment requirements to reduce the impact of small accounts on transfer agent fees. These minimum account balance fees are recorded as part of expense reductions on the Statement of Operations. For the year ended February 28, 2011, no minimum account balance fees were charged by the Fund.
33
Columbia Multi-Advisor International Equity Fund, February 28, 2011
Underwriting Discounts, Service and Distribution Fees
In connection with the Closing, RiverSource Fund Distributors, Inc., an indirect wholly owned subsidiary of Ameriprise Financial, became the distributor of the Fund and changed its name to Columbia Management Investment Distributors, Inc. (the New Distributor).
For the year ended February 28, 2011, initial sales charges paid by shareholders on the purchase of Class A shares amounted to $1,326 and net CDSC fees paid by shareholders on certain redemptions of Class B shares amounted to $1,602.
The Trust has adopted shareholder servicing plans and distribution plans for the Class B, Class C and Class W shares of the Fund and a combined distribution and shareholder servicing plan for Class A shares of the Fund. The Trust has also adopted a distribution plan for Class R shares of the Fund. The shareholder servicing plans permit the Fund to compensate or reimburse servicing agents for the shareholder services they have provided. The distribution plans, adopted pursuant to Rule 12b-1 under the 1940 Act, permit the Fund to compensate or reimburse the New Distributor and/or selling agents for activities or expenses primarily intended to result in the sale of the classes' shares. Payments are made at an annual rate and paid monthly, as a percentage of average daily net assets, set from time to time by the Board of Trustees, and are charged as expenses of the Fund directly to the applicable share class. A substantial portion of the expenses incurred pursuant to these plans is paid to affiliates of the New Distributor.
The annual rates in effect and plan limits, as a percentage of average daily net assets are as follows:
| | | Current
Rate | | Plan
Limit | |
Class A Combined Distribution
and Shareholder Servicing Plan | | | 0.25 | % | | | 0.25 | % | |
Class B and Class C Shareholder
Servicing Plans | | | 0.25 | % | | | 0.25 | % | |
Class B and Class C
Distribution Plans | | | 0.75 | % | | | 0.75 | % | |
| Class R Distribution Plan | | | 0.50 | % | | | 0.50 | % | |
| Class W Shareholder Servicing Plan | | | 0.25 | % | | | 0.25 | %1 | |
| Class W Distribution Plan | | | 0.00 | % | | | 0.25 | %1 | |
1 The Fund may pay a distribution fee of up to 0.25% of the Fund's average daily net assets attributable to Class W shares and a service fee of up to 0.25% of the Fund's average daily net assets attributable to Class W shares, provided, however, that the aggregate fee shall not exceed 0.25% of the Fund's average daily net assets attributable to Class W shares.
Prior to the Closing, Columbia Management Distributors, Inc, an affiliate of Columbia and an indirect, wholly owned subsidiary of BOA, was the principal underwriter of the Fund's shares. There were no changes to the underwriting discount structure of the Fund or the service or distribution fee rates paid by the Fund as a result of the Transaction.
Expense Limits and Fee Waivers
Effective September 27, 2010, the Investment Manager has voluntarily agreed to reimburse a portion of the Fund's expenses so that the Fund's ordinary operating expenses (excluding any brokerage commissions, interest, taxes and extraordinary expenses, but including custodian charges relating to overdrafts, if any), after giving effect to any balance credits from the Fund's custodian, do not exceed the annual rates of 1.60%, 2.35%, 2.35%, 1.24%, 1.85%, 1.60% and 1.35% of the Fund's average daily net assets attributable to Class A, Class B, Class C, Class I, Class R, Class W and Class Z shares, respectively. This arrangement may be modified or terminated by the Investment Manager at any time.
For the period May 1, 2010 through September 26, 2010, the Investment Manager voluntarily agreed to reimburse a portion of the Fund's expenses so that the Fund's ordinary operating expenses (excluding any distribution and service fees, brokerage commissions, interest, taxes and extraordinary expenses, but including custodian charges relating to overdrafts, if any), after giving effect to any balance credits from the Fund's custodian, did not exceed 1.35% annually of the Fund's average daily net assets. Prior to May 1, 2010, Columbia voluntarily reimbursed a portion of the Fund's expenses in the same manner.
Effective April 1, 2011, the Investment Manager and certain affiliates have contractually agreed to waive fees or reimburse expenses through June 30, 2012, so that the Fund's ordinary operating expenses (excluding certain expenses, such as transaction costs and brokerage commissions, interest, taxes, acquired fund fees and expenses, and extraordinary expenses, if any), after giving effect to any balance credits or overdraft charges from the Fund's custodian, do not exceed the annual rates of 1.32%, 2.07%, 2.07%, 0.94%, 1.57%, 1.32% and 1.07% of the Fund's average daily net assets attributable to Class A, Class B, Class C, Class I, Class R, Class W and Class Z shares, respectively. This expense arrangement is made pursuant to a fee waiver and expense cap agreement that my be modified or amended only with the approval from all parties to such arrangements, including the Fund and the Investment Manager.
34
Columbia Multi-Advisor International Equity Fund, February 28, 2011
Fees Paid to Officers and Trustees
Upon the Closing, all officers of the Fund are employees of the Investment Manager or its affiliates and, with the exception of the Fund's Chief Compliance Officer, receive no compensation from the Fund. The Board of Trustees has appointed a Chief Compliance Officer to the Fund in accordance with federal securities regulations. The Fund, along with other affiliated funds, pays its pro-rata share of the expenses associated with the Chief Compliance Officer. The Fund's expenses for the Chief Compliance Officer will not exceed $15,000 per year. Prior to the Closing, all officers of the Fund were employees of Columbia or its affiliates and the Fund paid its pro-rata share of the expenses for the Chief Compliance Officer under the same fee structure.
Trustees are compensated for their services to the Fund, as set forth on the Statement of Operations. The Trust's eligible Trustees may participate in a non-qualified deferred compensation plan which may be terminated at any time. Any payments to plan participants are paid solely out of the Fund's assets. Income earned on the plan participant's deferral account is based on the rate of return of the eligible mutual funds selected by the participant or, if no funds are selected, on the rate of return of Columbia Money Market Fund (formerly known as RiverSource Cash Management Fund). Prior to the Closing, if no funds were selected, income earned on the plan participant's deferral account was based on the rate of return of BofA Treasury Reserves. Trustees' fees deferred during the current period as well as any gains or losses on the trustees' deferred compensation balances as a result of market fluctuations are included in "Trustees' fees" on the Statement of Operations. Liabilities under the deferred compensation plan are included in "Trustees' fees" on the Statement of Assets and Liabilities.
Other Related Party Transactions
Prior to the Closing, the Fund used one or more brokers that were affiliates of BOA in connection with the purchase and sale of its securities. Total brokerage commissions paid to affiliated brokers for the period prior to the Closing were $5,099.
Note 4. Custody Credits
The Fund has an agreement with its custodian bank under which custody fees may be reduced by balance credits. These credits are recorded as part of expense reductions on the Statement of Operations. The Fund could have invested a portion of the assets utilized in connection with the expense offset arrangement in an income-producing asset if it had not entered into such an agreement. For the year ended February 28, 2011, these custody credits reduced total expenses by $85 for the Fund.
Note 5. Portfolio Information
The cost of purchases and proceeds from sales of securities, excluding short-term obligations, aggregated $1,189,928,393 and $1,529,904,795, respectively, for the year ended February 28, 2011.
Note 6. Regulatory Settlements
During the years ended February 28, 2011 and February 28, 2010, the Fund received payments totaling $25,379 and $4,074,606, respectively, resulting from certain regulatory settlements with third parties in which the Fund had participated. The payments have been included in "Increase from regulatory settlements" in the Statement of Changes in Net Assets.
Note 7. Redemption Fees
Effective March 1, 2010, the Fund no longer assesses a 2.00% redemption fee on the proceeds from Fund shares that are redeemed within 60 days of purchase. The redemption fee was designed to offset brokerage commissions and other costs associated with short term trading of fund shares. The redemption fees, which were retained by the Fund, were accounted for as an addition to paid-in capital and were allocated to each class based on the relative net assets at the time of the redemption.
Note 8. Shareholder Concentration
As of February 28, 2011, two shareholder accounts owned 69.4% of the outstanding shares of the Fund. Purchase and redemption activity of these accounts may have a significant effect on the operations of the Fund.
Note 9. Line of Credit
The Fund and other affiliated funds participate in a $280,000,000 committed, unsecured revolving line of credit provided by State Street. The maximum amount that may be borrowed by any fund is limited to the lesser of $200,000,000 and the Fund's borrowing limit set forth in the Fund's registration statement. Borrowings are available for short-term liquidity or temporary or emergency purposes.
Effective October 14, 2010, interest is charged to each participating fund based on the fund's borrowings at a rate per annum equal to the greater of the Federal Funds Rate plus 1.25% or the overnight LIBOR Rate plus 1.25%. In addition, a commitment fee of 0.125%
35
Columbia Multi-Advisor International Equity Fund, February 28, 2011
per annum is accrued and apportioned among the participating funds pro rata based on their relative net assets.
Prior to October 14, 2010, interest was charged to each participating fund at the same rates. In addition, a commitment fee of 0.15% per annum was accrued and apportioned among the participating funds pro rata based on their relative net assets.
For the year ended February 28, 2011, the average daily loan balance outstanding on days where borrowing existed was $8,757,576 at a weighted average interest rate of 1.50%.
Note 10. Federal Tax Information
The timing and character of income and capital gain distributions are determined in accordance with income tax regulations, which may differ from GAAP. Reclassifications are made to the Fund's capital accounts for permanent tax differences to reflect income and gains available for distribution (or available capital loss carryforwards) under income tax regulations.
For the year ended February 28, 2011, permanent book and tax basis differences resulting primarily from differing treatments for passive foreign investment companies (PFIC) adjustments, proceeds from litigation settlement, excess distribution, foreign capital gain reclasses and foreign currency transactions were identified and reclassified among the components of the Fund's net assets as follows:
Overdistributed
Net Investment
Income | | Accumulated
Net Realized
Loss | | Paid-In Capital | |
| $ | (4,084,932 | ) | | $ | 4,397,988 | | | $ | (313,056 | ) | |
Net investment income and net realized gains (losses), as disclosed on the Statement of Operations, and net assets were not affected by this reclassification.
The tax character of distributions paid during the years ended February 28, 2011 and February 28, 2010 was as follows:
| | | February 28, | |
| Distributions paid from: | | 2011 | | 2010 | |
| Ordinary Income* | | $ | 26,467,205 | | | $ | 62,930,518 | | |
* For tax purposes short-term capital gain distributions, if any, are considered ordinary income distributions.
As of February 28, 2011, the components of distributable earnings on a tax basis were as follows:
Undistributed
Ordinary
Income | | Undistributed
Long-Term
Capital Gains | | Net Unrealized
Appreciation* | |
| $ | — | | | $ | — | | | $ | 222,329,675 | | |
* The differences between book-basis and tax-basis net unrealized appreciation are primarily due to deferral of losses from wash sales and Passive Foreign Investment Companies (PFICs).
Unrealized appreciation and depreciation at February 28, 2011, based on cost of investments for federal income tax purposes and excluding any unrealized appreciation and depreciation from changes in the value of other assets and liabilities resulting from changes in exchange rates, were:
| Unrealized appreciation | | $ | 235,925,694 | | |
| Unrealized depreciation | | | (13,596,019 | ) | |
| Net unrealized appreciation | | $ | 222,329,675 | | |
The following capital loss carryforwards may be available to reduce taxable income arising from future net realized gains on investments, if any, to the extent permitted by the Internal Revenue Code:
| Year of Expiration | | Capital Loss
Carryforwards | |
| 2017 | | $ | 145,722,763 | | |
| 2018 | | | 404,868,172 | | |
| | | $ | 550,590,935 | | |
Capital loss carryforwards of $104,351,018 were utilized during the year ended February 28, 2011.
Under current tax rules, certain currency and capital losses realized after October 31 may be deferred and treated as occurring on the first day of the following fiscal year. As of February 28, 2011, post-October currency losses of $2,889,517 attributed to security transactions were deferred to March 1, 2011.
Management is required to determine whether a tax position of the Fund is more likely than not to be sustained upon examination by the applicable taxing authority, including resolution of any related appeals or litigation processes, based on the technical merits of the position. The tax benefit to be recognized by the Fund is measured
36
Columbia Multi-Advisor International Equity Fund, February 28, 2011
as the largest amount of benefit that is greater than fifty percent likely of being realized upon ultimate settlement. Management is not aware of any tax positions for which it is reasonably possible that the total amounts of unrecognized tax benefits will significantly change in the next twelve months. However, management's conclusions may be subject to review and adjustment at a later date based on factors including, but not limited to, new tax laws, regulations, and administrative interpretations (including relevant court decisions). The Fund's federal tax returns for the prior three fiscal years remain subject to examination by the Internal Revenue Service.
Note 11. Significant Risks and Contingencies
Foreign Securities Risk
Investing in foreign securities may include certain risks and considerations not typically associated with investing in U.S. securities, such as fluctuating currency values and changing local and regional economic, political and social conditions, which may result in greater market volatility. In addition, certain foreign securities may not be as liquid as U.S. securities. Investing in emerging markets may accentuate these risks.
Investments in emerging market countries are subject to additional risk. The risk of foreign investments is typically increased in less developed countries. These countries are also more likely to experience high levels of inflation, deflation or currency devaluation which could hurt their economies and securities markets.
Note 12. Subsequent Events
Management has evaluated the events and transactions that have occurred through the date the financial statements were issued. Other than as noted below and in Note 3 (above), there were no items requiring adjustment of the financial statements or additional disclosure.
At a Special Meeting of Shareholders held on February 15, 2011, shareholders of the Fund approved a proposed Subadvisory Agreement between the Investment Manager and Threadneedle International Limited, pursuant to which Threadneedle International Limited is currently expected to begin serving as a subadviser to the Fund in April 2011.
Effective on March 28, 2011, the Fund has entered into a revolving credit facility with a syndicate of banks led by JPMorgan Chase Bank, N.A. (the Administrative Agent). This credit facility replaced the credit facility provided by State Street. The credit facility agreement, which is a collective agreement between the Fund and certain other funds managed by the Investment Manager, severally and not jointly, permits collective borrowings up to $300 million. The borrowers shall have the right, upon written notice to the Administrative Agent, to request an increase of up to $200 million in the aggregate amount of the credit facility from new or existing lenders, provided that the aggregate amount of the credit facility shall at no time exceed $500 million. Participation in such increase by any existing lender shall be at such lender's sole discretion. Interest is charged to each fund based on its borrowings at a rate equal to the sum of the federal funds rate plus (i) 1.25% per annum plus (ii) if one-month LIBOR exceeds the federal funds rate, the amount of such excess. Each borrowing under the credit facility matures no later than 60 days after the date of borrowing. The Fund also pays a commitment fee equal to its pro rata share of the amount of the credit facility at a rate of 0.10% per annum.
Note 13. Information Regarding Pending and Settled Legal Proceedings
In June 2004, an action captioned John E. Gallus et al. v. American Express Financial Corp. and American Express Financial Advisors Inc. was filed in the United States District Court for the District of Arizona. The plaintiffs allege that they are investors in several American Express Company (now known as RiverSource) mutual funds and they purport to bring the action derivatively on behalf of those funds under the Investment Company Act of 1940. The plaintiffs allege that fees allegedly paid to the defendants by the funds for investment advisory and administrative services are excessive. The plaintiffs seek remedies including restitution and rescission of investment advisory and distribution agreements. The plaintiffs voluntarily agreed to transfer this case to the United States District Court for the District of Minnesota (the District Court). In response to defendants' motion to dismiss the complaint, the District Court dismissed one of plaintiffs' four claims and granted plaintiffs limited discovery. Defendants moved for summary judgment in April 2007. Summary judgment was granted in the defendants' favor on July 9, 2007. The plaintiffs filed a notice of appeal with the Eighth Circuit Court of Appeals (the Eighth Circuit) on August 8, 2007. On April 8, 2009, the Eighth Circuit reversed summary judgment and remanded to the District Court for further proceedings. On August 6, 2009, defendants filed a writ of certiorari with the U.S. Supreme Court (the Supreme Court), asking the Supreme Court to stay the District Court proceedings while the Supreme Court considers and rules in a case captioned Jones v. Harris Associates, which involves issues of law similar to those presented in the Gallus case. On March 30, 2010, the Supreme Court issued its ruling in Jones v. Harris Associates, and on
37
Columbia Multi-Advisor International Equity Fund, February 28, 2011
April 5, 2010, the Supreme Court vacated the Eighth Circuit's decision in the Gallus case and remanded the case to the Eighth Circuit for further consideration in light of the Supreme Court's decision in Jones v. Harris Associates. On June 4, 2010, the Eighth Circuit remanded the Gallus case to the District Court for further consideration in light of the Supreme Court's decision in Jones v. Harris Associates. On December 9, 2010, the District Court reinstated its July 9, 2007 summary judgment order in favor of the defendants. On January 10, 2011, plaintiffs filed a notice of appeal with the Eighth Circuit.
In December 2005, without admitting or denying the allegations, American Express Financial Corporation (AEFC, which is now known as Ameriprise Financial, Inc. (Ameriprise Financial)), entered into settlement agreements with the Securities and Exchange Commission (SEC) and Minnesota Department of Commerce (MDOC) related to market timing activities. As a result, AEFC was censured and ordered to cease and desist from committing or causing any violations of certain provisions of the Investment Advisers Act of 1940, the Investment Company Act of 1940, and various Minnesota laws. AEFC agreed to pay disgorgement of $10 million and civil money penalties of $7 million. AEFC also agreed to retain an independent distribution consultant to assist in developing a plan for distribution of all disgorgement and civil penalties ordered by the SEC in accordance with various undertakings detailed at http://www.sec.gov/litigation/admin/ia-2451.pdf. Ameriprise Financial and its affiliates have cooperated with the SEC and the MDOC in these legal proceedings, and have made regular reports to the funds' Boards of Directors/Trustees.
Ameriprise Financial and certain of its affiliates have historically been involved in a number of legal, arbitration and regulatory proceedings, including routine litigation, class actions, and governmental actions, concerning matters arising in connection with the conduct of their business activities. Ameriprise Financial believes that the Funds are not currently the subject of, and that neither Ameriprise Financial nor any of its affiliates are the subject of, any pending legal, arbitration or regulatory proceedings that are likely to have a material adverse effect on the Funds or the ability of Ameriprise Financial or its affiliates to perform under their contracts with the Funds. Ameriprise Financial is required to make 10-Q, 10-K and, as necessary, 8-K filings with the Securities and Exchange Commission on legal and regulatory matters that relate to Ameriprise Financial and its affiliates. Copies of these filings may be obtained by accessing the SEC website at www.sec.gov.
There can be no assurance that these matters, or the adverse publicity associated with them, will not result in increased fund redemptions, reduced sale of fund shares or other adverse consequences to the Funds. Further, although we believe proceedings are not likely to have a material adverse effect on the Funds or the ability of Ameriprise Financial or its affiliates to perform under their contracts with the Funds, these proceedings are subject to uncertainties and, as such, we are unable to estimate the possible loss or range of loss that may result. An adverse outcome in one or more of these proceedings could result in adverse judgments, settlements, fines, penalties or other relief that could have a material adverse effect on the consolidated financial condition or results of operations of Ameriprise Financial.
38
Report of Independent Registered Public Accounting Firm
To the Trustees of Columbia Funds Series Trust and the Shareholders of Columbia Multi-Advisor International Equity Fund
In our opinion, the accompanying statement of assets and liabilities, including the investment portfolio, and the related statements of operations and of changes in net assets and the financial highlights present fairly, in all material respects, the financial position of Columbia Multi-Advisor International Equity Fund (the "Fund") (a series of Columbia Funds Series Trust) at February 28, 2011, the results of its operations for the year then ended, the changes in its net assets for each of the two years in the period then ended, and the financial highlights for each of the periods indicated, in conformity with accounting principles generally accepted in the United States of America. These financial statements and financial highlights (hereafter referred to as "financial statements") are the responsibility of the Fund's management. Our responsibility is to express an opinion on these financial statements based on our audits. We conducted our audits of these financial statements in accordance with the standards of the Public Company Accounting Oversight Board (United States). Those standards require that we plan and perform the audit to obtain reasonable assurance about whether the financial statements are free of material misstatement. An audit includes examining, on a test basis, evidence supporting the amounts and disclosures in the financial statements, assessing the accounting principles used and significant estimates made by management, and evaluating the overall financial statement presentation. We believe that our audits, which included confirmation of securities at February 28, 2011 by correspondence with the custodian and brokers, provide a reasonable basis for our opinion.
PricewaterhouseCoopers LLP
Boston, Massachusetts
April 21, 2011
39
Federal Income Tax Information (Unaudited) – Columbia Multi-Advisor International Equity Fund
Foreign taxes paid during the fiscal year ended February 28, 2011, of $3,741,428 are being passed through to shareholders. This represents $0.04 per share. Eligible shareholders may claim this amount as a foreign tax credit.
Gross income derived from sources within foreign countries was $38,260,922 ($0.39 per share) for the fiscal year ended February 28, 2011.
For non-corporate shareholders 100.00%, or the maximum amount allowable under the Jobs and Growth Tax Relief Reconciliation Act of 2003, of ordinary income distributed by the Fund for the fiscal year ended February 28, 2011 may represent qualified dividend income.
The Fund will notify shareholders in January 2012 of amounts for use in preparing 2011 income tax returns.
40
Fund Governance
The Trustees serve terms of indefinite duration. The names, addresses and birth years of the Trustees and Officers of the Funds in the Columbia Funds Series Trust, the year each was first elected or appointed to office, their principal business occupations during at least the last five years, the number of Funds overseen by each Trustee and other directorships they hold are shown below. Each officer listed below serves as an officer of each Fund in the Columbia Funds Series Trust.
Independent Trustees
Name, Address and Year of Birth,
Position with Funds, Year First
Elected or Appointed to Office | | Principal Occupation(s) During Past Five Years, Number of Funds in the Columbia
Funds Complex Overseen by Trustee, Other Directorships Held
| |
| Edward J. Boudreau, Jr. (Born 1944) | |
|
c/o Columbia Management
Investment Advisers, LLC
225 Franklin Street
Boston, MA 02110
Trustee (since 2005) | | Managing Director—E.J. Boudreau & Associates (consulting), from 2000 through current; oversees 44; Trustee—BofA Funds Series Trust. | |
|
| William P. Carmichael (Born 1943) | |
|
c/o Columbia Management
Investment Advisers, LLC
225 Franklin Street
Boston, MA 02110
Trustee (since 1999) | | Retired; Oversees 44; Director—Cobra Electronics Corporation (electronic equipment manufacturer); Director—McMoRan Exploration Company (oil and gas exploration and development); Director—The Finish Line (athletic shoes and apparel); Trustee—BofA Funds Series Trust; Former Director—Simmons Company (bedding). | |
|
| William A. Hawkins (Born 1942) | |
|
c/o Columbia Management
Investment Advisers, LLC
225 Franklin Street
Boston, MA 02110
Trustee (since 2005) | | Managing Director—Overton Partners (financial consulting), August 2010 to present; President and Chief Executive Officer—California General Bank, N.A., from January 2008 through August 2010; oversees 44; Trustee—BofA Funds Series Trust. | |
|
| R. Glenn Hilliard (Born 1943) | |
|
c/o Columbia Management
Investment Advisers, LLC
225 Franklin Street
Boston, MA 02110
Trustee (since 2005) | | Chairman and Chief Executive Officer—Hilliard Group LLC (investing and consulting), from April 2003 through current; Non-Executive Director & Chairman—CNO Financial, Inc. (formerly Conseco, Inc.) (insurance), September 2003 through current; Executive Chairman—Conseco, Inc. (insurance), August 2004 through September 2005; oversees 44; Trustee—BofA Funds Series Trust. | |
|
| John J. Nagorniak (Born 1944) | |
|
c/o Columbia Management
Investment Advisers, LLC
225 Franklin Street
Boston, MA 02110
Trustee (since 2008) | | Retired; President and Director—Foxstone Financial, Inc. (consulting), 2000 through December 2007; Director—Mellon Financial Corporation affiliates (investing), 2000 through 2007; Chairman—Franklin Portfolio Associates (investing—Mellon affiliate), 1982 through 2007; oversees 44; Director—MIT Investment Company; Trustee—MIT 401k Plan. | |
|
41
Fund Governance (continued)
Independent Trustees (continued)
Name, Address and Year of Birth,
Position with Funds, Year First
Elected or Appointed to Office | | Principal Occupation(s) During Past Five Years, Number of Funds in the Columbia
Funds Complex Overseen by Trustee, Other Directorships Held
| |
| Minor M. Shaw (Born 1947) | |
|
c/o Columbia Management
Investment Advisers, LLC
225 Franklin Street
Boston, MA 02110
Trustee (since 2003) | | President—Micco Corporation and Mickel Investment Group; oversees 44; Board Member—Piedmont Natural Gas; Trustee—BofA Funds Series Trust. | |
|
Interested Trustee
| Anthony M. Santomero1 (Born 1946) | |
|
c/o Columbia Management
Investment Advisers, LLC
225 Franklin Street
Boston, MA 02110
Trustee (since 2008) | | Richard K. Mellon Professor Emeritus of Finance, The Wharton School, University of Pennsylvania, from 2002 through current; Senior Advisor—McKinsey & Company (consulting), July 2006 through January 2008; President and Chief Executive Officer—Federal Reserve Bank of Philadelphia, July 2000 through April 2006; oversees 44; Director—Renaissance Reinsurance Ltd; Trustee—Penn Mutual Life Insurance Company; Director—Citigroup, Inc.; Citibank, N.A.; Trustee—BofA Funds Series Trust. | |
|
1 Dr. Santomero is currently deemed by the Columbia Funds to be an "interested person" (as defined in the 1940 Act) of the Funds because he serves as a Director of Citigroup, Inc. and Citibank N.A., companies that may directly or through subsidiaries and affiliates engage from time-to-time in brokerage execution, principal transactions and lending relationships with the Columbia Funds or other funds or accounts advised/managed by the Adviser.
The Statement of Additional Information includes additional information about the Trustees of the Funds and is available, without charge, upon request by calling 800-345-6611.
Officers
| Name, Year of Birth and Address | | Principal Occupation(s) During the Past Five Years | |
| J. Kevin Connaughton (Born 1964) | |
|
225 Franklin Street
Boston, MA 02110
President (since 2009) | | Senior Vice President and General Manager—Mutual Fund Products, Columbia Management Investment Advisers, LLC since May 2010; President, Columbia Funds, since 2009, and RiverSource Funds, since May 2010 (previously Senior Vice President and Chief Financial Officer, Columbia Funds, from June 2008 to January 2009, Treasurer, Columbia Funds, from October 2003 to May 2008, and senior officer of various other affiliated funds since 2000); Managing Director, Columbia Management Advisors, LLC from December 2004 to April 2010. | |
|
| Michael G. Clarke (Born 1969) | |
|
225 Franklin Street
Boston, MA 02110
Senior Vice President and
Chief Financial Officer (since 2009) | | Vice President, Columbia Management Investment Advisers, LLC since May 2010; Managing Director of Fund Administration, Columbia Management Advisors, LLC, from September 2004 to April 2010; senior officer of Columbia Funds and affiliated funds since 2002. | |
|
42
Fund Governance (continued)
Officers (continued)
| Name, Year of Birth and Address | | Principal Occupation(s) During the Past Five Years | |
| Scott R. Plummer (Born 1959) | |
|
5228 Ameriprise Financial Center
Minneapolis, MN 55474
Senior Vice President, Secretary and Chief Legal Officer (since 2010) | | Chief Legal Officer and Assistant Secretary, Columbia Management Investment Advisers, LLC since June 2005; Vice President and Lead Chief Counsel—Asset Management, Ameriprise Financial, Inc. since May 2010 (previously Vice President and Chief Counsel—Asset Management, from 2005 to April 2010, and Vice President—Asset Management Compliance from 2004 to 2005); Vice President, Chief Counsel and Assistant Secretary, Columbia Management Investment Distributors, Inc. since 2008; Vice President, General Counsel and Secretary, Ameriprise Certificate Company since 2005; Chief Counsel, RiverSource Distributors, Inc. since 2006; Vice President, General Counsel and Secretary, RiverSource Funds, since December 2006; Senior Vice President, Secretary and Chief Legal Officer, Columbia Funds, since May 2010. | |
|
| Linda J. Wondrack (Born 1964) | |
|
225 Franklin Street
Boston, MA 02110
Senior Vice President and
Chief Compliance Officer (since 2007) | | Vice President and Chief Compliance Officer, Columbia Management Investment Advisers, LLC since May 2010; Chief Compliance Officer, Columbia Funds, since 2007, and RiverSource Funds, since May 2010; Director (Columbia Management Group, LLC and Investment Product Group Compliance), Bank of America, from June 2005 to April 2010. | |
|
| William F. Truscott (Born 1960) | |
|
53600 Ameriprise Financial Center
Minneapolis, MN 55474
Senior Vice President (since 2010) | | Chairman of the Board, Columbia Management Investment Advisers, LLC since May 2010 (previously President, Chairman of the Board and Chief Investment Officer, from 2001 to April 2010); Chief Executive Officer, U.S. Asset Management & President, Annuities, Ameriprise Financial, Inc. since May 2010 (previously President—U.S. Asset Management and Chief Investment Officer from 2005 to April 2010, and Senior Vice President—Chief Investment Officer, from 2001 to 2005); Director, President and Chief Executive Officer, Ameriprise Certificate Company since 2006; Director, Columbia Management Investment Distributors, Inc. since May 2010 (previously Chairman of the Board and Chief Executive Officer from 2008 to April 2010); Chairman of the Board and Chief Executive Officer, RiverSource Distributors, Inc. since 2006. | |
|
| Colin Moore (Born 1958) | |
|
225 Franklin Street
Boston, MA 02110
Senior Vice President (since 2010) | | Director and Chief Investment Officer, Columbia Management Investment Advisers, LLC since May 2010; Manager, Managing Director and Chief Investment Officer of Columbia Management Advisors, LLC from 2007 to April 2010; Head of Equities, Columbia Management Advisors, LLC from 2002 to 2007. | |
|
| Michael A. Jones (Born 1959) | |
|
225 Franklin Street
Boston, MA 02110
Senior Vice President (since 2010) | | President and Director, Columbia Management Investment Advisers, LLC since May 2010; President and Director, Columbia Management Investment Distributors, Inc. since May 2010; Manager, Chairman, Chief Executive Officer and President, Columbia Management Advisors, LLC from 2007 to April 2010; Chief Executive Officer, President and Director, Columbia Management Distributors, Inc. from November 2006 to April 2010; previously, co-president and senior managing director at Robeco Investment Management. | |
|
43
Fund Governance (continued)
Officers (continued)
| Name, Year of Birth and Address | | Principal Occupation(s) During the Past Five Years | |
| Amy Johnson (Born 1965) | |
|
5228 Ameriprise Financial Center
Minneapolis, MN 55474
Senior Vice President (since 2010) | | Senior Vice President and Chief Operating Officer, Columbia Management Investment Advisers, LLC since May 2010 (previously Chief Administrative Officer, from 2009 until April 2010, Vice President—Asset Management and Trust Company Services, from 2006 to 2009, and Vice President—Operations and Compliance from 2004 to 2006). | |
|
| Joseph F. DiMaria (Born 1968) | |
|
225 Franklin Street
Boston, MA 02110
Treasurer (since 2010) and
Chief Accounting Officer (since 2008) | | Vice President, Mutual Fund Administration, Columbia Management Investment Advisers, LLC, since May 2010; Director of Fund Administration, Columbia Management Advisors, LLC from January 2006 to April 2010; Head of Tax/Compliance and Assistant Treasurer, Columbia Management Advisors, LLC, from November 2004 to December 2005. | |
|
| Marybeth Pilat (Born 1968) | |
|
225 Franklin Street
Boston, MA 02110
Deputy Treasurer (since 2010) | | Vice President, Mutual Fund Administration, Columbia Management Investment Advisers, LLC, since May 2010; Vice President, Investment Operations, Bank of America, from October 2008 to April 2010; Finance Manager, Boston Children's Hospital from August 2008 to October 2008; Director, Mutual Fund Administration, Columbia Management Advisors, LLC, from May 2007 to July 2008; Vice President, Mutual Fund Valuation, Columbia Management Advisors, LLC, from January 2006 to May 2007; Vice President, Mutual Fund Accounting Oversight, Columbia Management Advisors, LLC from January 2005 to January 2006. | |
|
| Julian Quero (Born 1967) | |
|
225 Franklin Street
Boston, MA 02110
Deputy Treasurer (since 2008) | | Vice President, Mutual Fund Administration, Columbia Management Investment Advisers, LLC since May 2010; Director of Fund Administration, Columbia Management Advisors, LLC, from August 2008 to April 2010; Senior Tax Manager, Columbia Management Advisors, LLC from August 2006 to July 2008; Senior Compliance Manager, Columbia Management Advisors, LLC from April 2002 to August 2006. | |
|
| Stephen T. Welsh (Born 1957) | |
|
225 Franklin Street
Boston, MA 02110
Vice President (since 2006) | | President and Director, Columbia Management Investment Services Corp. since May 2010; President and Director, Columbia Management Services, Inc. from July 2004 to April 2010; Managing Director, Columbia Management Distributors, Inc. from August 2007 to April 2010. | |
|
44
Board Consideration and Approval of Amendment to Investment Management Services Agreement
In September 2010, the Board (the "Board") of Columbia Funds Series Trust (the "Trust") unanimously approved an amendment to the Investment Management Services Agreement (the "IMS Agreement") between Columbia Management Investment Advisers, LLC ("CMIA") and the Trust, on behalf of Columbia Convertible Securities Fund, Columbia Large Cap Core Fund, Columbia Large Cap Enhanced Core Fund, Columbia Large Cap Value Fund, Columbia Mid Cap Value Fund, Columbia Multi-Advisor International Equity Fund and Columbia Small Cap Value Fund II (each, a "Fund" and together, the "Funds"). As detailed below, the Contracts Review Committee and/or the Board held numerous meetings and discussions with CMIA and reviewed and considered extensive materials in connection with the approval of the changes to the fee rates payable by each Fund before determining to approve the amendment to the IMS Agreement.
Prior to approving the proposed changes to the fee rates payable by the Funds, the trustees (the "Trustees") of the Board were presented with, and requested, received and evaluated, materials about the current IMS Agreement, the proposed changes to the fee rates and fee structures and related matters from CMIA. The Trustees also reviewed reports prepared by an independent provider of investment company data, which included information comparing the Funds' current fees and expense ratios with a group of comparable funds that were selected by the independent provider. Included in these reports were comparisons of contractual and actual investment advisory fee rates and total operating expenses.
In addition, the Trustees considered that the proposed amendment was part of a larger group of proposals, designed to achieve consistent investment management service and fee structures across the family of funds. In this regard, the Board recognized that many of the funds in the fund family were organized at different times by many different sponsors, and as a result, their fees and expenses did not reflect a common overall design.
The Board and its Contract Review Committee also reviewed and considered information that they had previously received, addressing the services CMIA provides and fund performance, among other things, in connection with their most recent consideration and approval of the IMS Agreement. The Trustees also consulted with the non-interested Trustees' independent legal counsel, who advised on applicable legal standards, and otherwise assisted the Trustees in their deliberations.
At the conclusion of its review of the materials discussed above and of the discussions among the Trustees leading up to and during the September 20, 2010 meetings, the Board, on behalf of the Funds, agreed that it had been furnished with sufficient information to make an informed business decision with respect to approval of the amendment to the IMS Agreement.
In making its decision to approve the proposed amendment to the IMS Agreement for each Fund, the Board considered factors bearing on the nature, extent and quality of the services provided to such Fund, and the costs for those services, with a view toward reaching a business judgment as to whether the proposed amendment to the IMS Agreement is, under the circumstances, in the best interest of such Fund and its shareholders. The factors that the Trustees considered included, principally, the following:
• The expected benefits of continuing to retain CMIA as the Funds' investment manager;
• The nature, extent and quality of investment management services provided by CMIA to each Fund;
• The recent evaluation of the historical performance of CMIA in managing the Funds, recognizing that no assurances can be given that a Fund would achieve any level of performance in the future;
• The recent evaluation of each Fund's potential to realize economies of scale through operations of CMIA;
• The indirect benefits, such as from soft dollar arrangements, that CMIA has obtained and will continue to obtain, from managing the Funds;
• The expected benefits to shareholders of further integrating the legacy Columbia branded funds (the "Columbia Funds Complex") and the legacy RiverSource-, Seligman- and Threadneedle-branded funds (the "Columbia RiverSource Funds Complex" and, collectively with the Columbia Funds Complex, the "Combined Fund Complex") by:
o Standardizing investment advisory fee rates and total management fee rates (i.e., the investment advisory fee rates and the administration/administrative fee rates), to the extent practicable, across funds in the Combined Fund Complex that are in the same investment category to promote uniformity of pricing among similar funds;
o Implementing contractual expense limitations that will generally cap total annual operating expense ratios for each fund in the Combined Fund Complex at levels that are at or below the median net operating expense ratio of funds in the
45
respective fund's peer group (as determined annually after the initial term by an independent third-party data provider); and
o Correlating investment advisory and administration/administrative fee rates across the Combined Fund Complex commensurate with the level of services being provided.
In making its decision to approve the amendment to the IMS Agreement that included the increase of the investment advisory fee rates payable by each of the Funds at all or most asset levels, the factors that the trustees considered and the conclusions that they reached included, principally, the following:
• The impact of the proposed changes in investment advisory fee rates on the gross and net expense ratios of each Fund, including the contemporaneous reduction in the rates payable by each Fund under its administration services agreement contingent on shareholder approval of the amendment to the IMS Agreement, and the willingness of CMIA to contractually agree to limit total operating expenses for such Fund for a certain period of time;
• Current and projected profits to CMIA from providing investment management and other services to the Fund, both under the current investment advisory fee rates and the proposed investment advisory fee rates; and
• That the proposed investment advisory fee rates are designed to be competitive and to fairly compensate CMIA for services performed for the Funds.
Nature, Extent and Quality of Services. The Trustees considered the nature, extent and quality of services provided to the Funds by CMIA under the IMS Agreement, and the resources dedicated to the Funds by CMIA and its affiliates. The Trustees considered, among other things, the ability of CMIA to attract, motivate and retain highly qualified research, advisory and supervisory investment professionals (including CMIA's personnel and other resources, compensation programs for personnel involved in fund management, reputation and other attributes), the portfolio management services provided by those investment professionals, the trade execution services provided on behalf of the Funds and the quality of CMIA's investment research capabilities and the other resources that it devotes to each Fund. The Trustees also considered the potential benefits to shareholders of investing in a mutual fund that is part of a fund complex offering exposure to a variety of asset classes and investment disciplines and providing a variety of fund and shareholder services. The Trustees also considered that the nature, extent and quality of services proposed to be provided under the amended IMS Agreement were not expected to change. After reviewing these and related factors, the Trustees concluded, within the context of their overall conclusions, that the nature, extent and quality of the services to be provided to each Fund under the amended IMS Agreement supported the approval of the amended IMS Agreement. Quietly
Investment Performance. The Trustees reviewed information about the performance of each Fund over various time periods, including information prepared by an independent third-party data provider that compared the performance of each Fund to the performance of those Funds' peer groups of mutual funds and performance benchmarks. The Trustees also reviewed a description of the third party's methodology for identifying each Fund's peer group for purposes of performance and expense comparisons. In the case of each Fund whose performance lagged that of a relevant peer group for certain (although not necessarily all) periods, the Trustees concluded that other factors relevant to performance were sufficient, in light of other considerations, to warrant approval of the amendment to such Fund's IMS Agreement. Those factors varied from Fund to Fund, but included one or more of the following: (i) that the Fund's performance, although lagging in certain recent periods, was stronger over the longer term; (ii) that the underperformance was attributable, to a significant extent, to investment decisions that were reasonable and consistent with the Fund's investment strategy and policies and that the Fund was performing within a reasonable range of expectations, given those investment decisions, market conditions and the Fund's investment strategy; (iii) that the Fund's performance was competitive when compared to other performance benchmarks or peer groups; and (iv) that CMIA had taken or was considering steps designed to help improve the Fund's investment performance, including, but not limited to, replacing portfolio managers, enhancing the resources supporting the portfolio managers, or modifying investment strategies.
After reviewing these and related factors, the Trustees concluded, within the context of their overall conclusions regarding the proposed amendment to the IMS Agreement, that the performance of each Fund and CMIA was sufficient to warrant the approval of the amendment to the IMS Agreement pertaining to that Fund.
Investment Advisory Fee Rates and Other Expenses. The Trustees considered that the proposed amendment to the IMS Agreement would increase the contractual investment advisory fee
46
rates payable by each Fund at all or certain assets levels, and would be otherwise identical to each Fund's current IMS Agreement. In addition, the Trustees considered that, with the proposed fee reductions under the administration services agreement, the combined contractual fee rates under the IMS Agreement and the proposed administration services agreement would be lower than the current combined contractual fee rates under those agreements, at most asset levels, for all of the Funds except Columbia Large Cap Enhanced Core Fund. For the Columbia Large Cap Enhanced Core Fund, the Trustees considered CMIA's proposal to implement a contractual expense limitation that would mitigate the effect of such Fund's investment advisory fee rate increase by gradually phasing in the increase over a five-year period.
After reviewing these and related factors, the Trustees concluded, within the context of their overall conclusions, that the investment advisory fee rates under the amended IMS Agreement and anticipated total expenses of each Fund supported the approval of the amendment to the IMS Agreement.
Costs of Services Provided and Profitability. The Trustees considered information about the investment advisory fee rates charged by CMIA to comparable institutional accounts. In considering the fees charged to those accounts, the Trustees took into account, among other things, CMIA's representations about the differences between managing mutual funds as compared to other types of accounts, including differences in the services provided, differences in the risk profile of such business for CMIA, and the additional resources required to manage mutual funds effectively. In evaluating each Fund's proposed advisory fee rates, the Trustees also took into account the demands, complexity and quality of the investment management of the Fund.
The Trustees also considered the compensation directly or indirectly received by CMIA and its affiliates in connection with their relationships with the Funds. The Trustees reviewed information provided by management as to the current and projected profitability to CMIA and its affiliates of their relationships with each Fund, and information about the allocation of expenses used to calculate profitability.
After reviewing those and related factors, the Trustees concluded, within the context of their overall conclusions, that the proposed changes to the advisory fee rates, and the related profitability to CMIA and its affiliates of their relationships with the Fund, supported the approval of the amendment to the IMS Agreement.
Economies of Scale. The Trustees considered the existence of any economies of scale in the provision by CMIA of services to each Fund, to groups of related funds and to CMIA's investment advisory clients as a whole, and the extent to which those economies of scale would be shared with the Funds through breakpoints in the proposed investment advisory fee rates or other means, such as expense limitation arrangements and additional investments by CMIA in investment, trading and compliance resources. The Trustees noted that all of the Funds were expected to benefit from breakpoints and/or expense limitation arrangements.
In considering those issues, the Trustees also took note of the costs of the services to be provided (both on an absolute and relative basis) and the projected profitability to CMIA and its affiliates of their relationships with the Funds, as discussed above. The Trustees also noted the expected expense synergies and other anticipated benefits to CMIA and fund shareholders of both the rationalization of fees and expenses and the proposed mergers of certain Funds. After reviewing these and related factors, the Trustees determined, within the context of their overall conclusions, that the extent to which economies of scale were expected to be shared with the Funds supported the approval of the amendment to the IMS Agreement.
Other Benefits to CMIA. The Trustees received and considered information regarding any expected "fall-out" or ancillary benefits to be received by CMIA and its affiliates as a result of their relationships with the Funds, such as the provision by CMIA of administration services to the Funds and the provision by CMIA's affiliates of distribution and transfer agency services to the Funds, and how the proposed rationalization of fees and expenses might affect such benefits, including the fact that to the extent expenses payable by the affected Funds decrease, and the expenses of such Funds were subject to a contractual limit or cap, CMIA may pay less in expense reimbursements. The Trustees considered that the Funds' distributor, an affiliate of CMIA, retains a portion of the distribution fees from the Funds and receives a portion of the sales charges on sales or redemptions of certain classes of shares of the Funds, and that other affiliates of CMIA receive various forms of compensation in connection with their sale of shares of the Funds.
The Trustees also considered the benefits of research made available to CMIA by reason of brokerage commissions generated by the Funds' securities transactions, and reviewed information about CMIA's practices with respect to allocating portfolio brokerage and the use of "soft" commission dollars to pay for research. The Trustees considered the possible conflicts of interest associated with certain fall-out or other ancillary benefits and the reporting,
47
disclosure and other processes that would be in place to disclose and to monitor such possible conflicts of interest. The Trustees recognized that CMIA's profitability would be somewhat lower without these benefits.
In their deliberations, the Trustees did not identify any single item that was paramount or controlling and individual Trustees may have attributed different weights to various factors. The Trustees also evaluated all information available to them on a fund-by-fund basis, and their determinations were made separately in respect of each Fund.
Based on the foregoing, the Trustees concluded that the proposed investment advisory fee rates for each Fund are acceptable and competitive, including when compared to similar funds in the industry. Accordingly, the Board unanimously approved the amendment to the IMS Agreement with respect to the Funds.
48
Board Consideration and Approval of Subadvisory Agreement
At its November 3-4, 2010 meeting (the "November Meeting"), the Board (the "Board") of Columbia Funds Series Trust (the "Trust") unanimously approved the proposed subadvisory agreement between Columbia Management Investment Advisers, LLC ("CMIA") and Threadneedle International Limited ("Threadneedle") for Columbia Multi-Advisor International Equity Fund (the "Fund") (the "Proposed Threadneedle Subadvisory Agreement").
Prior to approving the Proposed Threadneedle Subadvisory Agreement, the trustees (the "Trustees") of the Board, including the non-interested Trustees, were presented with, and requested, received and evaluated, materials about the Proposed Threadneedle Subadvisory Agreement, including information about the Threadneedle European equity investment strategy and related matters. The Trustees also reviewed reports prepared by an independent provider of investment company data, which included information comparing the performance of the Columbia European Equity Fund (formerly Threadneedle European Equity Fund), a fund used to demonstrate the Threadneedle European equity investment strategy, against the Fund's benchmark index. In addition, the Trustees also consulted with the non-interested Trustees' independent legal counsel, who advised on applicable legal standards, and otherwise assisted the Trustees in their deliberations.
At the conclusion of its review of the materials discussed above and of the discussions among the Trustees leading up to and during the November Meeting, the Board agreed that it had been furnished with sufficient information to make an informed business decision with respect to the approval of the Proposed Threadneedle Subadvisory Agreement.
In making its decision to approve the Proposed Threadneedle Subadvisory Agreement, the Board considered factors bearing on the nature, extent and quality of the services proposed to be provided to the Fund, and the estimated costs for those services, with a view toward reaching a business judgment as to whether the Proposed Threadneedle Subadvisory Agreement is, under the circumstances, in the best interest of the Fund and the Fund's shareholders. The factors that the Trustees of the Board considered included, principally, the following:
• The qualifications of Threadneedle as an investment subadviser, including that Threadneedle subadvises numerous funds within the legacy RiverSource-, Seligman- and Threadneedle-branded funds (the "Columbia RiverSource Funds Complex");
• CMIA's previous experience overseeing and coordinating investment advisory services with Threadneedle;
• The bottom-up investment strategies that Threadneedle would implement as a subadviser to the Fund, including that these strategies would be the same or similar to those it uses as the subadviser to the Columbia European Equity Fund;
• The terms and conditions of the Proposed Threadneedle Subadvisory Agreement;
• An assessment of Threadneedle's Code of Ethics Policy and Compliance Programs by the Fund's Chief Compliance Officer; and
• That the proposed investment subadvisory fee rates are designed to be competitive and to fairly compensate Threadneedle for bona fide services performed with respect to the Fund.
In its deliberations, the Board did not identify any single factor that was paramount or controlling and individual Trustees may have attributed different weights to various factors. Certain factors considered by the Board and the conclusions that they, in their business judgment, reached are discussed in more detail below.
Nature, Extent and Quality of Services. The Board received and considered various data and information regarding the expected nature, extent and quality of services to be provided to the Fund by Threadneedle under the Proposed Threadneedle Subadvisory Agreement. The Board reviewed and analyzed these materials, which included, among other things, information about the background of management professionals at the subadviser, as well as the investment strategies that Threadneedle would utilize as a subadviser to the Fund. Specifically, the Board was advised that the investment strategies that Threadneedle would utilize are expected to be the same or similar to those that it uses as a subadviser to the Columbia European Equity Fund, which consist of:
• Deploying an integrated approach to equity research that incorporates regional analyses, a global sector strategy, and stock specific perspectives;
• Conducting detailed research on companies in a consistent strategic and macroeconomic framework;
49
• Looking for catalysts of change and identifying the factors driving markets, which vary over economic and market cycles;
• Maintaining a portfolio of 50 to 70 stocks in the portion of the Fund's assets managed by Threadneedle;
• Focusing on investment decisions at both a sector and individual company level; and
• Implementing rigorous risk control processes that seek to ensure that the risk and return characteristics in the portion of the Fund's assets managed by Threadneedle are consistent with established portfolio management parameters.
In addition, the Board considered that Threadneedle would be one of two subadvisers to the Fund. Currently, the Fund is split evenly into two "sleeves," and approximately 50% of the Fund's assets is managed by CMIA's International Equity Team, while the other 50% of the Fund's assets is managed by the Fund's current subadviser, Marsico Capital Management, LLC ("Marsico"). CMIA proposes to expand the number of sleeves for the Fund, manage certain sleeves directly, and allocate a portion of the remaining assets of the Fund to each of Marsico and Threadneedle to manage as a subadviser. The initial sleeves and target percentages would be based on current market conditions, but CMIA would have discretion to change the number of sleeves or the proportion of assets managed directly by it or allocated to each subadviser based upon future market conditions or other considerations.
Based on the foregoing and other information considered relevant, the Board concluded that, overall, it was satisfied with the assurances from Threadneedle as to the expected nature, extent and quality of services expected to be provided to the Fund under the Proposed Threadneedle Subadvisory Agreement.
Fund Performance. Because the Threadneedle European equity investment strategy will be deployed by Threadneedle in managing the portion of the Fund's assets allocated to it, the Board noted that the Columbia European Equity Fund, which Threadneedle also subadvises utilizing this strategy, outperformed its benchmark index, the Morgan Stanley Capital International Europe USD Index, for the one-, three-, five- and ten-year time periods. The Board also noted the relatively high ranking of the Columbia European Equity Fund's performance as compared to the performance of its peer group over several time periods, including since the current portfolio manager assumed responsibility for the Fund. The Board also received and reviewed information showing how the Fund would have performed in prior periods if a portion of the Fund's assets, based on the initial percentages expected to be allocated to it, to Columbia and to Marsico, had been managed by Threadneedle in the same manner as the Columbia European Equity Fund.
Subadvisory Fee Rates. The Board also considered the fees payable to Threadneedle for investment management services. As noted above, under the Proposed Threadneedle Subadvisory Agreement, CMIA will pay a subadvisory fee to Threadneedle that is based on a percentage of the daily net assets of the Fund allocated to it as follows: 0.35% on the first $150 million of assets; 0.30% on the next $500 million of assets; 0.25% on the next $500 million of assets; and 0.20% on assets thereafter. The Board considered that the investment advisory fee rate payable by the Fund to CMIA would not change, and that the subadvisory fees payable to Threadneedle would be paid by CMIA out of the investment advisory fees received by the Fund.
The Board noted that the investment subadvisory fee rates to be paid to Threadneedle under the Proposed Threadneedle Subadvisory Agreement would be comparable to or less than the subadvisory fee rates paid to Marsico for managing the portion of the Fund's assets allocated to it and would be the same as the investment subadvisory fee rates paid to Threadneedle as subadviser to certain other funds in the Columbia RiverSource Funds Complex, including Columbia European Equity Fund.
Profitability. The Board did not consider separate profitability information with respect to Threadneedle, as its profitability from its relationship with the Fund was not a material factor in determining whether to approve the Proposed Threadneedle Subadvisory Agreement. The Board, having recently reviewed information about the financial condition of Ameriprise Financial, Inc. ("Ameriprise"), the parent company CMIA, was satisfied that Threadneedle, as a subsidiary of Ameriprise, has adequate resources to perform the services required under the Proposed Threadneedle Subadvisory Agreement.
Economies of Scale. The Board noted that the investment subadvisory fee rates payable by CMIA under the Proposed Threadneedle Subadvisory Agreement contain breakpoints that reduce the fee rate on assets above specified levels, and that the investment advisory fee rates payable to CMIA by the Fund under its investment management services agreement also contain breakpoints. The Board acknowledged the inherent limitations of any
50
analysis of an investment adviser's economies of scale, stemming largely from the Board's understanding that economies of scale are generally realized, if at all, by an investment adviser across a variety of products and services, not just with respect to a single fund.
Other Benefits to Threadneedle. The Board also received and considered information regarding certain expected "fall-out" or ancillary benefits to be received by Threadneedle as a result of its relationship with the Fund.
After an evaluation of the factors described above and based on its deliberations and analysis of the information provided and alternatives considered, the Board, including the non-interested Trustees, concluded that approval of the Proposed Threadneedle Subadvisory Agreement was in the best interests of the Fund and its shareholders.
51
Summary of Management Fee Evaluation by Independent Fee Consultant
REPORT OF INDEPENDENT FEE CONSULTANT TO THE FUNDS SUPERVISED BY THE COLUMBIA NATIONS BOARD
Prepared Pursuant to the February 9, 2005
Assurance of Discontinuance among the
Office of Attorney General of New York State,
Columbia Management Advisors, LLC, and
Columbia Management Distributors, Inc.
September 21, 2010
I. Overview
On February 9, 2005, Columbia Management Advisors, LLC ("CMA") and Columbia Management Distributors, Inc.1 ("CMD") agreed to the New York Attorney General's Assurance of Discontinuance ("AOD"). Among other things, the AOD stipulates that CMA may manage or advise a Columbia Fund ("Columbia Fund" and, together with some or all of such funds, the "Columbia Funds") only if the Independent Members of the Columbia Fund's Board of Trustees appoint a Senior Officer or retain an Independent Fee Consultant ("IFC") who is to manage the process by which proposed management fees are negotiated. The AOD further stipulates that the Senior Officer or IFC is to prepare a written annual evaluation of the fee negotiation process.
With effect from January 1, 2007, the Independent Members of the Board of Trustees for certain Columbia Funds known collectively as the "Nations Funds" (together with the other members of that Board, the "Trustees") retained me as IFC for the Nations Funds.2 In this capacity, I have prepared this written evaluation of the fee negotiation process. As has been the case with my previous reports, my immediate predecessor as IFC, John Rea, provided invaluable assistance in the preparation of this report.
On September 29, 2009, Ameriprise entered into an asset purchase agreement with Bank of America, N.A. and its parent, Bank of America Corporation (together, the "Bank") pursuant to which the Bank agreed to sell certain CMG assets relating to Columbia's long-term asset management business, including management of the Nations Funds (the "Transaction"). The Transaction, which closed on April 30, 2010,3 resulted in the termination of the existing Investment Management Agreements with CMA. Prior to the closing of the Transaction, the Trustees and shareholders of the Funds approved new Advisory and Administrative Agreements with an Ameriprise subsidiary now called Columbia Management Investment Advisers, LLC ("CMIA"). Those Agreements did not change the rates paid by the Funds from the levels specified in the former agreements with CMA.
CMIA serves as the adviser of funds supervised by three different Boards of Trustees: the Atlantic, Nations, and RiverSource Boards, and a subsidiary of CMIA serves as adviser to funds overseen by a fourth Board, Columbia/Wanger. After reviewing the range of funds overseen by all four Boards, CMIA proposed a series of changes intended, among other things, to rationalize its mutual fund product offerings (by for example proposing to merge funds with similar investment strategies) and the fees charged to the funds by CMIA and its affiliates. These proposals included (1) changes to the advisory fees paid by certain funds, (2) changes to administrative and similar fees paid by certain funds, (3) changes to the transfer agency, sub-transfer agency, custody, and pricing/bookkeeping fees paid by the funds, and (4) mergers involving more than 60 funds. CMIA asked the Trustees to consider these proposals together. This report, consistent with and (to the extent applicable) in fulfillment of the terms of the AOD, will focus on changes to advisory and aggregate management fees and discuss other proposals insofar as they affect total fund expenses, which may be a relevant factor in considering the appropriate level of advisory and management fees (defined for purposes of this report as advisory plus administrative fees).
A. Role of the Independent Fee Consultant
The AOD charges the IFC with "managing the process by which proposed management fees ... to be charged the Columbia Fund are negotiated so that they are negotiated in a manner which is at arms' length and reasonable and consistent with this Assurance of Discontinuance." The AOD also provides that CMA "may manage or advise a Columbia Fund only if the reasonableness of the proposed management fees is determined by the Board of Trustees ... using ... an annual independent written evaluation prepared by or under the direction of ... the Independent Fee Consultant." Therefore, the AOD makes clear that the IFC does not supplant the Trustees in negotiating management fees, nor does the IFC substitute his or her judgment for that of the Trustees with respect to the reasonableness of proposed fees or any other matter that is committed to the business judgment of the Trustees.
1 CMA and CMD are subsidiaries of Columbia Management Group, LLC ("CMG"), and are the successors to the entities named in the AOD.
2 I have no material relationship with Bank of America, CMG or Ameriprise Financial, Inc. ("Ameriprise"), aside from serving as IFC, and I am aware of no material relationship with any of their affiliates. I retained John Rea, an independent economic consultant, to assist me with this report.
Unless otherwise stated or required by the context, this report covers only the Nations Funds.
3 Tab 1, CMIA, Supplemental Materials Prepared for the Nations Board, June 16, 2010 ("June Supplemental Materials") at p. 1.
52
B. Elements Involved in Managing the Fee Negotiation Process
In preparing the report required by the AOD, the IFC must consider at least the following six factors set forth in the AOD:
1. The nature and quality of the adviser's services, including the Fund's performance;
2. Management fees (including any components thereof) charged by other mutual fund companies for like services;
3. Possible economies of scale as the Fund grows larger;
4. Management fees (including any components thereof) charged to institutional and other clients of the adviser for like services;
5. Costs to the adviser and its affiliates of supplying services pursuant to the management fee agreements, excluding any intra-corporate profit; and
6. Profit margins of the adviser and its affiliates from supplying such services.
II. Findings
1. Based upon my examination of the information supplied by CMG and Ameriprise in the light of the six factors set forth in the AOD, I conclude that the Trustees have the relevant information necessary to evaluate the reasonableness of the proposed management fee changes for each affected Nations Fund (each a "Fee Change Fund").
2. In my view, the process by which the proposed management fees of each Fee Change Fund have been negotiated with CMIA thus far has been, to the extent practicable, at arm's length and reasonable and consistent with the AOD.
3. CMIA has proposed an increase either in contractual advisory or total management fees for 10 Funds (each a "Fee Increase Fund"). All 10 would have higher advisory fees and lower administrative fees. For three Funds, the increase in proposed contractual advisory fees outweighs the decrease in contractual administrative fees, leading to a proposed increase in contractual management fees. Proposed contractual management fees would decline for six Funds and remain unchanged for one.
4. The projected actual management fee, computed on the basis of assets as of October 31, 2009, would increase for only one of the 10 Funds, Large Cap Enhanced Core, after application of CMIA's proposed expense limitation program and consummation of proposed mergers. For eight Funds, actual management fees are projected to decline, reflecting the interaction of changes in contractual management fees, gross expenses, and expense limitations at October 31, 2009 asset levels. No change is projected in the actual management fee of the remaining Fee Increase Fund.
5. CMIA's fee rationalization and merger proposals would have little effect on the quintile rankings of the actual management fees of the Fee Increase Funds. The ranking would change for only one Fund, while remaining unchanged from the current level for the other nine Funds. On a post-rationalization, post-merger basis, half the actual management fees would be in the fourth or fifth quintiles.
6. Half of the Fee Increase Funds have had median or better-than-median investment performance. None of the Funds would be designated a Review Fund based solely on performance.
7. CMIA proposed that the Funds (except sub-advised Funds) and most other mutual funds it or its affiliates advise or sponsor (together, the "CMIA Funds") be subject to an expense limitation calculated by reference to the median of the relevant fund's Lipper expense group. As a result, all of the Fee Increase Funds are projected to have median or better total expenses after full implementation of the proposed fee changes, expense limitations, and mergers. Some Funds would have higher-than-median actual management fees under this program notwithstanding the newly-established expense limitations. The expense limitation would be recalculated every year based on updated Lipper data. Based upon an analysis of median expenses of Fund peer groups for the 2008-2010 period, it is likely that some Funds would experience sizable changes in their expense limits from year-to-year.
8. CMIA reviewed the differences between management of retail mutual funds and advising institutional accounts and supplied charts plotting contractual and actual institutional and fund fees against assets in various investment categories. The data showed that mutual fund fees are often lower at small asset levels reflecting CMIA's reimbursement of fund expenses. At higher asset levels, mutual fund fees typically exceed institutional fees.
9. CMIA provided fund-by-fund projected profitability data. Due to the significant changes in the operations of the Funds (including the change of the Funds' investment adviser), historical profitability data was judged to have little relevance.
10. CMIA provided data comparing the cumulative benefit to CMIA Fund shareholders of all aspects of its proposals (including proposed mergers) with a projection of synergies in the form of decreased expenses that would benefit CMIA and its parent, Ameriprise.
53
Shareholder Meeting Results
At a Joint Special Meeting of Shareholders held on February 15, 2011, shareholders of the Fund considered the proposals described below.
Proposal 1. Shareholders of the Fund approved a proposed amendment to the Investment Management Services Agreement with Columbia Management Investment Advisers, LLC, as follows:
| Votes For | | Votes Against | | Abstentions | | Broker Non-Votes | |
| | 82,668,271 | | | | 16,830,387 | | | | 59,835 | | | | 849,709 | | |
Proposal 2. Shareholders of the Fund approved a proposed Subadvisory Agreement between Columbia Management Investment Advisers, LLC and Threadneedle International Limited, as follows:
| Votes For | | Votes Against | | Abstentions | | Broker Non-Votes | |
| | 97,189,167 | | | | 2,310,400 | | | | 58,926 | | | | 849,709 | | |
Proposal 3. Shareholders of Columbia Funds Series Trust elected each of the nominees for trustees to the Board of Trustees of Columbia Funds Series Trust, each to hold office for an indefinite term, as follows:
| Trustee | | Votes For | | Votes Withheld | | Abstentions | |
| Kathleen Blatz | | | 2,145,636,122 | | | | 248,012,438 | | | | 0 | | |
| Edward J. Boudreau, Jr. | | | 2,145,430,114 | | | | 248,218,446 | | | | 0 | | |
| Pamela G. Carlton | | | 2,145,515,949 | | | | 248,132,612 | | | | 0 | | |
| William P. Carmichael | | | 2,145,038,695 | | | | 248,609,866 | | | | 0 | | |
| Patricia M. Flynn | | | 2,145,843,563 | | | | 247,804,997 | | | | 0 | | |
| William A. Hawkins | | | 2,145,359,401 | | | | 248,289,160 | | | | 0 | | |
| R. Glenn Hilliard | | | 2,145,079,400 | | | | 248,569,161 | | | | 0 | | |
| Stephen R. Lewis, Jr. | | | 2,145,092,209 | | | | 248,556,351 | | | | 0 | | |
| John F. Maher | | | 2,145,621,338 | | | | 248,027,223 | | | | 0 | | |
| John J. Nagorniak | | | 2,145,337,494 | | | | 248,311,067 | | | | 0 | | |
| Catherine James Paglia | | | 2,145,615,254 | | | | 248,033,306 | | | | 0 | | |
| Leroy C. Richie | | | 2,145,042,120 | | | | 248,606,441 | | | | 0 | | |
| Anthony M. Santomero | | | 2,145,088,174 | | | | 248,560,386 | | | | 0 | | |
| Minor M. Shaw | | | 2,145,430,762 | | | | 248,217,798 | | | | 0 | | |
| Alison Taunton-Rigby | | | 2,145,393,384 | | | | 248,255,177 | | | | 0 | | |
| William F. Truscott | | | 2,144,907,223 | | | | 248,741,338 | | | | 0 | | |
54
This page intentionally left blank.
This page intentionally left blank.
Important Information About This Report
The fund mails one shareholder report to each shareholder address. If you would like more than one report, please call shareholder services at 1-800-345-6611 and additional reports will be sent to you. This report has been prepared for shareholders of Columbia Multi-Advisor International Equity Fund.
A description of the policies and procedures that the fund uses to determine how to vote proxies and a copy of the fund's voting records are available (i) at www.columbiamanagement.com, (ii) on the Securities and Exchange Commission's website at www.sec.gov, and (iii) without charge, upon request, by calling 1-800-368-0346. Information regarding how the fund voted proxies relating to portfolio securities during the 12-month period ended June 30 is available from the SEC's website. Information regarding how the fund voted proxies relating to portfolio securities is also available from the fund's website, www.columbiamanagement.com.
The fund files a complete schedule of portfolio holdings with the SEC for the first and third quarters of each fiscal year on Form N-Q. The fund's Form N-Q is available on the SEC's website at www.sec.gov and may be reviewed and copied at the SEC's Public Reference Room in Washington, D.C. Information on the operation of the Public Reference Room may be obtained by calling 1-800-SEC-0330.
Transfer Agent
Columbia Management Investment
Services Corp.
P.O. Box 8081
Boston, MA 02266-8081
1-800-345-6611
Distributor
Columbia Management Investment
Distributors, Inc.
225 Franklin Street
Boston, MA 02110
Investment Manager
Columbia Management Investment Advisers, LLC
225 Franklin Street
Boston, MA 02110
57

PRSRT STD
U.S. Postage
PAID
Holliston, MA
Permit NO. 20
Columbia Multi-Advisor International Equity Fund
P. O. Box 8081
Boston, MA 02266-8081
columbiamanagement.com
This information is for use with concurrent or prior delivery of a fund prospectus. Investors should consider the investment objectives, risks, charges and expenses of a mutual fund carefully before investing. For a free prospectus, which contains this and other important information about the funds, visit columbiamanagement.com. Read the prospectus carefully before investing. The Fund is distributed by Columbia Management Investment Distributors, Inc., member FINRA, and managed by Columbia Management Investment Advisers, LLC.
© 2011 Columbia Management Investment Advisers, LLC. All rights reserved.
C-1671 A (04/11)

Columbia Large Cap Index Fund
Annual Report for the Period Ended February 28, 2011
Table of Contents
The views expressed in this report reflect the current views of the respective parties. These views are not guarantees of future performance and involve certain risks, uncertainties and assumptions that are difficult to predict, so actual outcomes and results may differ significantly from the views expressed. These views are subject to change at any time based upon economic, market or other conditions and the respective parties disclaim any responsibility to update such views. These views may not be relied on as investment advice and, because investment decisions for a Columbia Fund are based on numerous factors, may not be relied on as an indication of trading intent on behalf of any particular Columbia Fund. References to specific securities should not be construed as a recommendation or investment advice.
President’s Message

Dear Shareholder:
The Columbia Management story began over 100 years ago, and today, we are one of the nation’s largest dedicated asset managers. The recent acquisition by Ameriprise Financial, Inc. brings together the talents, resources and capabilities of Columbia Management with those of RiverSource Investments, Threadneedle (acquired by Ameriprise in 2003) and Seligman Investments (acquired by Ameriprise in 2008) to build a best-in-class asset management business that we believe is truly greater than its parts.
RiverSource Investments traces its roots to 1894 when its then newly-founded predecessor, Investors Syndicate, offered a face-amount savings certificate that gave small investors the opportunity to build a safe and secure fund for retirement, education or other special needs. A mutual fund pioneer, Investors Syndicate launched Investors Mutual Fund in 1940. In the decades that followed, its mutual fund products and services lineup grew to include a full spectrum of styles and specialties. More than 110 years later, RiverSource continues to be a trusted financial products leader.
Threadneedle, a leader in global asset management and one of Europe’s largest asset managers, offers sophisticated international experience from a dedicated U.K. management team. Headquartered in London, it is named for Threadneedle Street in the heart of the city’s financial district, where British investors pioneered international and global investing. Threadneedle was acquired in 2003 and today operates as an affiliate of Columbia Management.
Seligman Investments’ beginnings date back to the establishment of the investment firm J. & W. Seligman & Co. in 1864. In the years that followed, Seligman played a major role in the geographical expansion and industrial development of the United States. In 1874, President Ulysses S. Grant named Seligman as fiscal agent for the U.S. Navy — an appointment that would last through World War I. Seligman helped finance the westward path of the railroads and the building of the Panama Canal. The firm organized its first investment company in 1929 and began managing its first mutual fund in 1930. In 2008, J. & W. Seligman & Co. Incorporated was acquired and Seligman Investments became an offering brand of RiverSource Investments, LLC.
We are proud of the rich and distinctive history of these firms, the strength and breadth of products and services they offer, and the combined cultures of pioneering spirit and forward thinking. Together we are committed to providing more for our shareholders than ever before.
| n | | A singular focus on our shareholders. Our business is asset management, so investors are our first priority. We dedicate our resources to identifying timely investment opportunities and provide a comprehensive choice of equity, fixed-income and alternative investments to help meet your individual needs. |
| n | | First-class research and thought leadership. We are dedicated to helping you take advantage of today’s opportunities and anticipate tomorrow’s. We stay abreast of the latest investment trends and ideas, using our collective insight to evaluate events and transform them into solutions you can use. |
| n | | A disciplined investment approach. We aren’t distracted by passing fads. Our teams adhere to a rigorous investment process that helps ensure the integrity of our products and enables you and your financial advisor to match our solutions to your objectives with confidence. |
When you choose Columbia Management, you can be confident that we will take the time to understand your needs and help you and your financial advisor identify the solutions that are right for you. Because at Columbia Management, we don’t consider ourselves successful unless you are.
Sincerely,

J. Kevin Connaughton
President, Columbia Funds
Investors should consider the investment objectives, risks, charges and expenses of a mutual fund carefully before investing. For a free prospectus, which contains this and other important information about the funds, visit www.columbiamanagement.com. The prospectus should be read carefully before investing.
Columbia Funds are distributed by Columbia Management Investment Distributors, Inc., member FINRA, and managed by Columbia Management Investment Advisers, LLC.
© 2011 Columbia Management Investment Advisers, LLC. All rights reserved.
Fund Profile – Columbia Large Cap Index Fund
Performance data quoted represents past performance and current performance may be lower or higher. Past performance is no guarantee of future results. The investment return and principal value will fluctuate so that shares, when redeemed, may be worth more or less than the original cost. Please visit www.columbiamanagement.com for daily and most recent month-end performance updates.
Summary
1-year return as of 02/28/11
| | |
| |
 | | +22.09% Class A shares |
| |
| | +22.57% S&P 500 Index |
|
Morningstar Style BoxTM |
|
Equity Style |
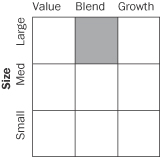
|
The Morningstar Style BoxTM is based on the fund’s portfolio holdings. For equity funds, vertical axis shows the market capitalization of the stocks owned, and the horizontal axis shows investment style (value, blend, or growth). Information shown is based on the most recent data provided by Morningstar.
© 2011 Morningstar, Inc. All rights reserved. The Morningstar information contained herein: (1) is proprietary to Morningstar and/or its content providers; (2) may not be copied or distributed; and (3) is not warranted to be accurate, complete or timely. Neither Morningstar nor its content providers are responsible for any damages or losses arising from any use of this information.
Summary
| n | | For the 12-month period that ended February 28, 2011, the fund’s Class A shares returned 22.09% without sales charge. |
| n | | The fund’s return was slightly lower than the return of its benchmark, the S&P 500 Index,1 and the average return of the funds in its peer group, the Lipper S&P 500 Index Objective Funds Classification.2 |
| n | | Despite a rocky period in the summer of 2010, stock prices climbed for the second consecutive year, buoyed by sectors that are sensitive to economic growth. |
Portfolio Management
Alfred F. Alley III has managed or co-managed the fund since February 2009 and has been associated with Columbia Management Investment Advisers, LLC (the Investment Manager) since May 2010. Prior to joining the Investment Manager, Mr. Alley was associated with the fund’s previous advisor or its predecessors since 2005.
| 1 | The Standard & Poor’s (S&P) 500 Index tracks the performance of 500 widely held, large-capitalization U.S. stocks. |
| 2 | Lipper Inc., a widely respected data provider in the industry, calculates an average total return (assuming reinvestment of distributions) for mutual funds with investment objectives similar to those of the fund. Lipper makes no adjustment for the effect of sales loads. |
Indices are not available for investment, are not professionally managed and do not reflect sales charges, fees, brokerage commissions, taxes or other expenses of investing. Securities in the fund may not match those in an index.
1
Economic Update – Columbia Large Cap Index Fund
Summary
For the 12-month period that ended February 28, 2011
| | n | | The U.S. stock market, as measured by the S&P 500 Index, delivered solid returns, despite a summer 2010 correction. Foreign stock market returns were generally in line with the U.S. market, as measured by the MSCI EAFE Index (Net). | |
| | |
| S&P Index | | MSCI Index |
| |

| |
|
22.57% | | 20.00% |
| | n | | Strengthening economic growth and rising interest rates kept a lid on most bond market sectors. The Barclays Capital Aggregate Bond Index delivered modest results. However, high-yield bonds were strong performers, as measured by the JPMorgan Developed BB High Yield Index. | |
| | |
| Barclays Aggregate Index | | JPMorgan Index |
| |
| |
|
4.93% | | 14.74% |
The U.S. economy continued to expand at a modest pace over the past 12 months, as measured by gross domestic product (GDP). After a strong first quarter in 2010, GDP growth dropped to 1.7% in the second quarter and fear spread that the economy would lapse into recession. However, the pace picked up in the third quarter, and growth was strong enough to inspire confidence among consumers, businesses and investors. GDP expanded by 2.6% in the third quarter and 2.8% in the fourth quarter. With the Federal Reserve Board (the Fed) providing additional monetary stimulus to shore up economic growth and the extension of key tax cuts for the next two years, 2011 expectations are for continued growth. Consumer confidence is on the mend, even though job growth has not met expectations. Business spending also tracked higher over the period.
Consumer spending on cars, clothing and other goods generally trended higher throughout the year. Holiday spending rose 5.5% between November 5, 2010 and December 24, 2010, in all retail categories, excluding automobiles, compared with the same period in 2009, according to MasterCard Advisors’ SpendingPulse, which tracks spending on all transactions including cash. Analysts say that an increase in personal savings and a decline in consumer debt gave consumers confidence to spend a little more on the 2010 holidays. The personal savings rate edged higher, ending January 2011, the last month for which data was available, at 5.8%. Personal income also increased during the year, surging in January 2011, as payroll tax cuts kicked in.
News on the job front was mostly positive over the 12-month period. A good portion of the jobs added in March, April and May of 2010 were temporary, government-sponsored census positions, which began to unwind in June, July and August of 2010. However, private sector payroll employment began to trend higher in the third quarter, massive layoffs declined and job growth turned solidly positive, with the addition of 255,000 new jobs in the first two months of 2011.
Despite some glimmers of improvement early in 2010, the housing market remained troublesome throughout the period. Both new and existing home sales fell after a federal tax credit for new and repeat homebuyers expired. Distressed properties pressured prices and foreclosures continued — another drag on prices. The inventory of unsold homes ended the period just about where it started, at 7.6 months for both new and existing homes, according to the National Association of Realtors and a joint release from the U.S. Census Bureau and the U.S. Department of Housing and Urban Development. The new year brought a bit of good news: Existing home sales increased in January 2011, raising the level of sales above where it was one year ago. According to the National Association of Realtors, it was the first time in seven months that year-over-year sales activity compared favorably.
Reports from the business side of the economy were generally positive. A key measure of the nation’s manufacturing situation — the Institute for Supply Management’s Index — took a somewhat surprising turn higher in the final months of the period. Technology spending rose 12% in 2010, according to the NPD Group, a national marketing research firm. Purchases of computers, networking and software returned to prerecession levels. Industrial production was disappointingly flat at year end, per the report issued by the Fed, and it slipped further in January 2011. The amount of manufacturing capacity utilized, per the report issued by the Fed, — a key measure of the health of the manufacturing sector — continued to inch higher.
2
Economic Update (continued) – Columbia Large Cap Index Fund
Stocks moved higher despite summer 2010 setback
Against a strengthening economic backdrop, a stock market rally that began early in 2009 continued into 2010 despite a summer setback linked to a debt crisis brewing in Europe, which raised concerns among U.S. investors. These fears were short-lived and stocks regained their footing in September 2010, moving higher through the end of the period. The S&P 500 Index1 returned 22.57% for the 12 months through February 28, 2011. Outside the United States, stock market returns seesawed but ended just short of U.S. market returns. The MSCI EAFE Index (Net),2 a broad gauge of stock market performance in foreign developed markets, returned 20.00% (in U.S. dollars) for the 12-month period, as concerns about the impact of a bailout for weak euro zone economies abated. Emerging stock markets were similarly strong. The MSCI Emerging Markets Index (Net)3 returned 20.91% (in U.S. dollars) for the 12-month period.
Bonds delivered modest returns
As the economy strengthened and interest rates edged higher, most bond sectors delivered modest returns. The Barclays Capital Aggregate Bond Index4 returned 4.93%. High-yield bonds led the fixed-income markets. For the 12 months covered by this report, the JPMorgan Developed BB High Yield Index5 returned 14.74%. Despite rising yields in the second half of the period, the Treasury market was also positive. The Barclays Capital U.S. Treasury Index6 returned 3.71%. However, municipal bonds struggled in the final months of the period, as interest rates inched higher and issue supply surged ahead of the expiration of the Build America Bonds program. The Barclays Capital Municipal Bond Index7 gained 1.72% for the period. Despite positive economic activity, the Fed kept a key short-term interest rate — the federal funds rate — close to zero.
Past performance is no guarantee of future results.
| 1 | The Standard & Poor’s (S&P) 500 Index tracks the performance of 500 widely held, large-capitalization U.S. stocks. |
| 2 | The Morgan Stanley Capital International Europe, Australasia, Far East (MSCI EAFE) Index (Net) is a free float-adjusted market capitalization index that is designed to measure the equity market performance of developed markets, excluding the U.S. & Canada. As of May 27, 2010, the MSCI EAFE Index (Net) consisted of the following 22 developed market country indices: Australia, Austria, Belgium, Denmark, Finland, France, Germany, Greece, Hong Kong, Ireland, Israel, Italy, Japan, the Netherlands, New Zealand, Norway, Portugal, Singapore, Spain, Sweden, Switzerland and the United Kingdom. |
| 3 | The Morgan Stanley Capital International Emerging Markets (MSCI EM) Index (Net) is a free float-adjusted market capitalization index that is designed to measure equity market performance of emerging markets. As of May 27, 2010, the MSCI EM Index (Net) consisted of the following 21 emerging market country indices: Brazil, Chile, China, Colombia, Czech Republic, Egypt, Hungary, India, Indonesia, Korea, Malaysia, Mexico, Morocco, Peru, Philippines, Poland, Russia, South Africa, Taiwan, Thailand and Turkey. |
| 4 | The Barclays Capital Aggregate Bond Index is a market value-weighted index that tracks the daily price, coupon, pay-downs and total return performance of fixed-rate, publicly placed, dollar-denominated and non-convertible investment grade debt issues with at least $250 million par amount outstanding and with at least one year to final maturity. |
| 5 | The JPMorgan Developed BB High Yield Index is an unmanaged index designed to mirror the investable universe of the U.S. dollar developed, BB-rated, high yield corporate debt market. |
| 6 | The Barclays Capital U.S. Treasury Index includes public obligations of the U.S. Treasury. Treasury bills are excluded by the maturity constraint. In addition, certain special issues, such as state and local government series bonds (SLGs), as well as U.S. Treasury TIPS, are excluded. STRIPS are excluded from the index because their inclusion would result in double-counting. |
| 7 | The Barclays Capital Municipal Bond Index is considered representative of the broad market for investment-grade, tax-exempt bonds with a maturity of at least one year. |
Indices are not available for investment, are not professionally managed and do not reflect sales charges, fees, brokerage commissions, taxes or other expenses of investing. Securities in the fund may not match those in an index.
3
Performance Information – Columbia Large Cap Index Fund
Performance data quoted represents past performance and current performance may be lower or higher. Past performance is no guarantee of future results. The investment return and principal value will fluctuate so that shares, when redeemed, may be worth more or less than the original cost. Please visit www.columbiamanagement.com for daily and most recent month-end performance updates.
| | | | |
| Net asset value per share | |
| |
as of 02/28/11 ($) | | | | |
Class A | | | 25.62 | |
Class B | | | 25.70 | |
Class Z | | | 25.72 | |
| | | | |
| Distributions declared per share | |
| |
03/01/10 – 02/28/11 ($) | | | | |
Class A | | | 0.35 | |
Class B | | | 0.19 | |
Class Z | | | 0.41 | |
|
| Performance of a $10,000 investment 03/01/01 – 02/28/11 |
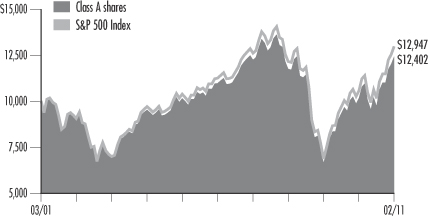
The chart above shows the change in value of a hypothetical $10,000 investment in Class A shares of Columbia Large Cap Index Fund during the stated time period, and does not reflect the deduction of taxes that a shareholder may pay on fund distributions or on the redemption of fund shares.
| | | | | | | | |
| Performance of a $10,000 investment 03/01/01 – 02/28/11 ($) | |
| | |
| Sales charge | | without | | | with | |
Class A | | | 12,402 | | | | n/a | |
Class B | | | 11,915 | | | | 11,915 | |
Class Z | | | 12,723 | | | | n/a | |
| | | | | | | | | | | | | | | | |
| Average annual total return as of 02/28/11 (%) | |
| | | |
| Share class | | A | | | B | | | Z | |
| Inception | | 10/10/95 | | | 09/23/05 | | | 12/15/93 | |
| Sales charge | | without | | | without | | | with | | | without | |
1-year | | | 22.09 | | | | 21.22 | | | | 16.22 | | | | 22.44 | |
5-year | | | 2.50 | | | | 1.75 | | | | 1.37 | | | | 2.76 | |
10-year | | | 2.18 | | | | 1.77 | | | | 1.77 | | | | 2.44 | |
The “with sales charge” returns include the applicable contingent deferred sales charge of 5.00% in the first year, declining to 1.00% in the sixth year and eliminated thereafter for Class B shares. The “without sales charge” returns do not include the effect of sales charges. If they had, returns would be lower.
Performance results reflect any fee waivers or reimbursements of fund expenses by the Investment Manager and/or any of its affiliates. Absent these fee waivers or expense reimbursement arrangements, performance results would have been lower.
All results shown assume reinvestment of distributions. Class A shares are sold at net asset value. Class Z shares are sold at net asset value with no distribution and service (Rule 12b-1) fees. Class Z shares have limited eligibility and the investment minimum requirements may vary. Please see the fund’s prospectus for details. Performance for different share classes will vary based on differences in sales charges and fees associated with each class.
Class B shares commenced operations on September 23, 2005 and have no performance prior to that date. Performance prior to September 23, 2005 is that of Class A shares at net asset value with no distribution and service (Rule 12b-1 fees) of 0.25%. If Class B shares’ distribution and service (Rule 12b-1) fees had been reflected, total returns would have been lower.
The tables do not reflect the deduction of taxes that a shareholder may pay on fund distributions or on the redemption of fund shares.
4
Understanding Your Expenses – Columbia Large Cap Index Fund
As a fund shareholder, you incur two types of costs. There are transaction costs and ongoing costs, which generally include investment advisory fees, distribution and service (Rule 12b-1) fees and other fund expenses. The information on this page is intended to help you understand the ongoing costs of investing in the fund and to compare these costs with the ongoing costs of investing in other mutual funds.
Analyzing your fund’s expenses by share class
To illustrate these ongoing costs, we have provided an example and calculated the expenses paid by investors in each share class during the period. The information in the following table is based on an initial investment of $1,000, which is invested at the beginning of the period and held for the entire period. Expense information is calculated two ways and each method provides you with different information. The amount listed in the “Actual” column is calculated using the fund’s actual operating expenses and total return for the period. The amount listed in the “Hypothetical” column for each share class assumes that the return each year is 5% before expenses and is calculated based on the fund’s actual operating expenses. You should not use the hypothetical account values and expenses to estimate either your actual account balance at the end of the period or the expenses you paid during this period.
Compare with other funds
Since all mutual funds are required to include the same hypothetical calculations about expenses in shareholder reports, you can use this information to compare the ongoing costs of investing in the fund with other funds. To do so, compare the 5% hypothetical example with the 5% hypothetical examples that appear in the shareholder reports of other funds. As you compare hypothetical examples of other funds, it is important to note that hypothetical examples are meant to highlight the ongoing costs of investing in a fund and do not reflect any transaction costs, such as sales charges, redemption fees or exchange fees.
Estimating your actual expenses
To estimate the expenses that you paid over the period, first you will need your account balance at the end of the period:
| | n | | For shareholders who receive their account statements from Columbia Management Investment Services Corp., your account balance is available online at www.columbiamanagement.com or by calling Shareholder Services at 800.345.6611. | |
| | n | | For shareholders who receive their account statements from their financial intermediary, contact your financial intermediary to obtain your account balance. | |
| | 1. | Divide your ending account balance by $1,000. For example, if an account balance was $8,600 at the end of the period, the result would be 8.6. | |
| | 2. | In the section of the table below titled “Expenses paid during the period,” locate the amount for your share class. You will find this number in the column labeled “Actual.” Multiply this number by the result from step 1. Your answer is an estimate of the expenses you paid on your account during the period. | |
If the value of your account falls below the minimum initial investment requirement applicable to you, your account may be subject to a $20 annual fee. This fee is not included in the accompanying table. If you are subject to the fee, keep it in mind when you are estimating the ongoing expenses of investing in the fund and when comparing the expenses of this fund with other funds.
| | | | | | | | | | | | | | | | | | | | | | | | | | | | |
| 09/01/10 – 02/28/11 | | | | | | | | | | | | | | | | |
| | | | |
| | | Account value at the
beginning of the period ($) | | | Account value at the
end of the period ($) | | | Expenses paid
during the period ($) | | | Fund’s annualized
expense ratio (%) | |
| | | Actual | | | Hypothetical | | | Actual | | | Hypothetical | | | Actual | | | Hypothetical | | | Actual | |
Class A | | | 1,000.00 | | | | 1,000.00 | | | | 1,274.70 | | | | 1,022.86 | | | | 2.20 | | | | 1.96 | | | | 0.39 | |
Class B | | | 1,000.00 | | | | 1,000.00 | | | | 1,270.70 | | | | 1,019.14 | | | | 6.42 | | | | 5.71 | | | | 1.14 | |
Class Z | | | 1,000.00 | | | | 1,000.00 | | | | 1,276.40 | | | | 1,024.10 | | | | 0.79 | | | | 0.70 | | | | 0.14 | |
Expenses paid during the period are equal to the annualized expense ratio for the share class, multiplied by the average account value over the period, then multiplied by the number of days in the fund’s most recent fiscal half-year and divided by 365.
Had the Investment Manager and/or any of its affiliates not waived fees or reimbursed a portion of expenses, account value at the end of the period would have been reduced.
It is important to note that the expense amounts shown in the table are meant to highlight only ongoing costs of investing in the fund and do not reflect any transaction costs, such as sales charges, redemption fees or exchange fees. Therefore, the hypothetical examples provided may not help you determine the relative total costs of owning shares of different funds. If these transaction costs were included, your costs would have been higher.
5
Portfolio Manager’s Report – Columbia Large Cap Index Fund
Performance data quoted represents past performance and current performance may be lower or higher. Past performance is no guarantee of future results. The investment return and principal value will fluctuate so that shares, when redeemed, may be worth more or less than the original cost. Please visit www.columbiamanagement.com for daily and most recent month-end performance updates.
| | | | |
| Top 10 holdings | | | |
| |
as of 02/28/11 (%) | | | | |
Exxon Mobil Corp. | | | 3.5 | |
Apple, Inc. | | | 2.7 | |
General Electric Co. | | | 1.8 | |
Chevron Corp. | | | 1.7 | |
International Business Machines Corp. | | | 1.6 | |
Microsoft Corp. | | | 1.6 | |
JPMorgan Chase & Co. | | | 1.5 | |
Procter & Gamble Co. | | | 1.4 | |
Wells Fargo & Co. | | | 1.4 | |
Johnson & Johnson | | | 1.4 | |
Information provided is calculated as a percentage of net assets.
| | | | |
| Top 5 sectors | | | |
| |
as of 02/28/11 (%) | | | | |
Information Technology | | | 18.5 | |
Financials | | | 15.9 | |
Energy | | | 13.0 | |
Industrials | | | 11.0 | |
Health Care | | | 10.7 | |
Sector Breakdown is calculated as a percentage of net assets.
For the 12-month period that ended February 28, 2011, the fund’s Class A shares returned 22.09% without sales charge. The S&P 500 Index returned 22.57%. The average return for the Lipper S&P 500 Index Objective Funds Classification was 22.65%. The fund seeks to approximate the benchmark weights of securities, industries and sectors represented in the S&P 500 Index. As such, its return was slightly below the return of the index, after fees and expenses, which the index does not incur, and slightly lower than the average return of funds in its peer group. Despite a rocky period in the summer of 2010, stock prices climbed for the second consecutive year, buoyed by sectors that are sensitive to economic growth.
Energy, materials and consumer discretionary stocks were leaders
As economic growth strengthened during the 12-month period, the strongest gains came from the energy, materials and consumer discretionary sectors. Energy stocks were buoyed by improved economic conditions and by rising commodity prices. The sector gained 42% for the period. Three of the fund’s four top contributors to return were energy stocks — Exxon, Chevron and ConocoPhillips (3.5%, 1.7% and 0.9% of net assets, respectively). Materials and consumer discretionary stocks also got a boost from the economic recovery, rising 32% and 31%, respectively. In the materials sector, chemical giant Du Pont and metals and mining company Freeport McMoRan Copper & Gold (both 0.4% of net assets) generated the best returns for the fund. In the consumer discretionary sector, Comcast and Walt Disney (0.6% and 0.7% of net assets, respectively) were the strongest contributors to the fund’s return. The technology sector produced the fund’s top performer — Apple (2.7% of net assets) — which alone contributed 1.4% to the fund’s total return for the period. General Electric (1.8% of net assets) in the industrials sector was another top contributor to fund results.
Health care, consumer staples and utilities were modest contributors to returns
For the second consecutive year, all ten sectors within the S&P 500 Index produced positive returns. However, gains from health care, consumer staples and utilities were modest compared to the period’s top performers. These more defensive choices fell out of favor with investors as a growing economy lifted the prospects for sectors that are more direct beneficiaries of that growth. Health care stocks returned 5.98%. Consumer staples returned 13.22% and utilities gained 15.76%. Within health care, Gilead Sciences (0.3% of net assets) shares recorded a double-digit loss for the period. Other major disappointments came from the technology and financials sectors. Within technology, Cisco Systems, Hewlett Packard and Microsoft (0.8%, 0.8% and 1.6% of net assets, respectively) had negative returns as did Bank of America (1.2% of net assets) in the financials sector.
Portfolio changes
During the 12-month period covered by this report, there were 17 additions and deletions to the S&P 500 Index. Because the fund is mandated to track the underlying index, fully replicating its positions, changes to the portfolio matched changes to the index. Among the additions to the index were high profile names such as Netflix, Ingersoll-Rand and Tyco International. Well-known names removed from the index because they were smaller, as measured by market capitalization, included the New York Times and Eastman Kodak.
6
Portfolio Manager’s Report (continued) – Columbia Large Cap Index Fund
Looking ahead
Even after two years of strong returns, we believe the U.S. equity market remains attractive. Valuations seem quite reasonable because earnings growth has kept pace with rising stock prices. And while the earnings growth will inevitably slow from the pace set in the early stages of this economic recovery, it is likely to remain quite healthy. Larger companies with exposure to global growth, as well as dividend-paying companies, are of particular interest, and U.S. equities appear to be more attractive than stocks in foreign developed markets. Of course, no one can predict what will happen to stocks in any one year. However, historically equities have been the strongest asset class over the long term and investors who have learned to ride out periods of weakness and volatility have been rewarded.
Portfolio characteristics and holdings are subject to change periodically and may not be representative of current characteristics and holdings. The outlook for the fund may differ from those presented for other Columbia Funds.
Equity securities are subject to stock market fluctuations that occur in response to economic and business developments.
7
Investment Portfolio – Columbia Large Cap Index Fund
February 28, 2011
Common Stocks – 99.1%
| | | | | | | | |
| | | Shares | | | Value ($) | |
| Consumer Discretionary – 10.4% | | | | | | | | |
| Auto Components – 0.2% | | | | | | | | |
Goodyear Tire & Rubber Co. (a) | | | 68,335 | | | | 968,990 | |
Johnson Controls, Inc. | | | 189,790 | | | | 7,743,432 | |
| | | | | | | | |
Auto Components Total | | | | | | | 8,712,422 | |
| | |
Automobiles – 0.5% | | | | | | | | |
Ford Motor Co. (a) | | | 1,054,326 | | | | 15,867,606 | |
Harley-Davidson, Inc. | | | 66,287 | | | | 2,705,836 | |
| | | | | | | | |
Automobiles Total | | | | | | | 18,573,442 | |
| | |
Distributors – 0.1% | | | | | | | | |
Genuine Parts Co. | | | 44,327 | | | | 2,335,590 | |
| | | | | | | | |
Distributors Total | | | | | | | 2,335,590 | |
|
Diversified Consumer Services – 0.1% | |
Apollo Group, Inc., Class A (a) | | | 35,812 | | | | 1,620,851 | |
DeVry, Inc. | | | 17,514 | | | | 950,135 | |
H&R Block, Inc. | | | 86,770 | | | | 1,318,036 | |
| | | | | | | | |
Diversified Consumer Services Total | | | | | | | 3,889,022 | |
|
Hotels, Restaurants & Leisure – 1.6% | |
Carnival Corp. | | | 121,184 | | | | 5,170,921 | |
Darden Restaurants, Inc. | | | 38,954 | | | | 1,835,902 | |
International Game Technology | | | 83,914 | | | | 1,381,224 | |
Marriott International, Inc., Class A | | | 80,969 | | | | 3,174,795 | |
McDonald’s Corp. | | | 297,329 | | | | 22,501,859 | |
Starbucks Corp. | | | 208,511 | | | | 6,876,693 | |
Starwood Hotels & Resorts Worldwide, Inc. | | | 53,610 | | | | 3,275,571 | |
Wyndham Worldwide Corp. | | | 49,262 | | | | 1,540,915 | |
Wynn Resorts Ltd. | | | 21,298 | | | | 2,618,163 | |
Yum! Brands, Inc. | | | 131,812 | | | | 6,634,098 | |
| | | | | | | | |
Hotels, Restaurants & Leisure Total | | | | | | | 55,010,141 | |
|
Household Durables – 0.4% | |
D.R. Horton, Inc. | | | 78,971 | | | | 935,017 | |
Fortune Brands, Inc. | | | 42,939 | | | | 2,656,206 | |
Harman International Industries, Inc. | | | 19,554 | | | | 951,107 | |
Leggett & Platt, Inc. | | | 41,162 | | | | 949,196 | |
Lennar Corp., Class A | | | 44,808 | | | | 903,329 | |
Newell Rubbermaid, Inc. | | | 81,687 | | | | 1,579,827 | |
Pulte Homes, Inc. (a) | | | 94,630 | | | | 652,947 | |
Stanley Black & Decker, Inc. | | | 46,732 | | | | 3,543,687 | |
Whirlpool Corp. | | | 21,367 | | | | 1,762,777 | |
| | | | | | | | |
Household Durables Total | | | | | | | 13,934,093 | |
|
Internet & Catalog Retail – 0.8% | |
Amazon.com, Inc. (a) | | | 99,807 | | | | 17,295,555 | |
Expedia, Inc. | | | 56,936 | | | | 1,130,749 | |
NetFlix, Inc. (a) | | | 12,200 | | | | 2,521,374 | |
| | | | | | | | |
| | | Shares | | | Value ($) | |
priceline.com, Inc. (a) | | | 13,775 | | | | 6,252,197 | |
| | | | | | | | |
Internet & Catalog Retail Total | | | | | | | 27,199,875 | |
|
Leisure Equipment & Products – 0.1% | |
Hasbro, Inc. | | | 38,319 | | | | 1,720,523 | |
Mattel, Inc. | | | 100,988 | | | | 2,530,759 | |
| | | | | | | | |
Leisure Equipment & Products Total | | | | | | | 4,251,282 | |
|
Media – 3.4% | |
Cablevision Systems Corp., Class A | | | 67,500 | | | | 2,487,375 | |
CBS Corp., Class B | | | 191,552 | | | | 4,570,431 | |
Comcast Corp., Class A | | | 785,143 | | | | 20,225,284 | |
DIRECTV, Class A (a) | | | 234,566 | | | | 10,782,999 | |
Discovery Communications, Inc., Class A (a) | | | 80,050 | | | | 3,450,955 | |
Gannett Co., Inc. | | | 67,187 | | | | 1,109,257 | |
Interpublic Group of Companies, Inc. (a) | | | 137,569 | | | | 1,815,911 | |
McGraw-Hill Companies, Inc. | | | 86,418 | | | | 3,342,648 | |
News Corp., Class A | | | 642,640 | | | | 11,162,657 | |
Omnicom Group, Inc. | | | 84,763 | | | | 4,314,437 | |
Scripps Networks Interactive, Inc., Class A | | | 25,311 | | | | 1,314,653 | |
Time Warner Cable, Inc. | | | 100,104 | | | | 7,225,507 | |
Time Warner, Inc. | | | 312,117 | | | | 11,922,869 | |
Viacom, Inc., Class B | | | 170,078 | | | | 7,595,683 | |
Walt Disney Co. | | | 532,821 | | | | 23,305,591 | |
Washington Post Co., Class B | | | 1,564 | | | | 677,353 | |
| | | | | | | | |
Media Total | | | | | | | 115,303,610 | |
|
Multiline Retail – 0.8% | |
Big Lots, Inc. (a) | | | 21,256 | | | | 872,134 | |
Family Dollar Stores, Inc. | | | 35,424 | | | | 1,774,034 | |
J.C. Penney Co., Inc. | | | 66,524 | | | | 2,325,679 | |
Kohl’s Corp. (a) | | | 82,313 | | | | 4,435,847 | |
Macy’s, Inc. | | | 119,212 | | | | 2,849,167 | |
Nordstrom, Inc. | | | 47,366 | | | | 2,143,785 | |
Sears Holdings Corp. (a) | | | 12,380 | | | | 1,031,378 | |
Target Corp. | | | 199,289 | | | | 10,472,637 | |
| | | | | | | | |
Multiline Retail Total | | | | | | | 25,904,661 | |
|
Specialty Retail – 1.9% | |
Abercrombie & Fitch Co., Class A | | | 24,719 | | | | 1,418,129 | |
AutoNation, Inc. (a) | | | 17,931 | | | | 603,199 | |
Autozone, Inc. (a) | | | 7,682 | | | | 1,981,572 | |
Bed Bath & Beyond, Inc. (a) | | | 72,874 | | | | 3,508,883 | |
Best Buy Co., Inc. | | | 92,961 | | | | 2,997,063 | |
CarMax, Inc. (a) | | | 63,275 | | | | 2,238,037 | |
GameStop Corp., Class A (a) | | | 42,608 | | | | 850,030 | |
Gap, Inc. | | | 123,619 | | | | 2,785,136 | |
Home Depot, Inc. | | | 461,115 | | | | 17,277,979 | |
Limited Brands, Inc. | | | 74,385 | | | | 2,381,808 | |
See Accompanying Notes to Financial Statements.
8
Columbia Large Cap Index Fund
February 28, 2011
Common Stocks (continued)
| | | | | | | | |
| | | Shares | | | Value ($) | |
| Consumer Discretionary (continued) | |
Lowe’s Companies, Inc. | | | 388,316 | | | | 10,162,230 | |
O’Reilly Automotive, Inc. (a) | | | 39,341 | | | | 2,186,573 | |
RadioShack Corp. | | | 32,011 | | | | 473,763 | |
Ross Stores, Inc. | | | 33,900 | | | | 2,442,156 | |
Staples, Inc. | | | 203,472 | | | | 4,333,953 | |
Tiffany & Co. | | | 35,550 | | | | 2,188,102 | |
TJX Companies, Inc. | | | 111,397 | | | | 5,555,368 | |
Urban Outfitters, Inc. (a) | | | 36,200 | | | | 1,389,356 | |
| | | | | | | | |
Specialty Retail Total | | | | | | | 64,773,337 | |
|
Textiles, Apparel & Luxury Goods – 0.5% | |
Coach, Inc. | | | 83,431 | | | | 4,582,031 | |
NIKE, Inc., Class B | | | 107,625 | | | | 9,581,854 | |
Polo Ralph Lauren Corp. | | | 18,213 | | | | 2,307,769 | |
V.F. Corp. | | | 24,420 | | | | 2,336,261 | |
| | | | | | | | |
Textiles, Apparel & Luxury Goods Total | | | | 18,807,915 | |
| | | | | | | | |
Consumer Discretionary Total | | | | 358,695,390 | |
| | | | | | | | |
| Consumer Staples – 10.0% | |
| Beverages – 2.3% | | | | | | | | |
Brown-Forman Corp., Class B | | | 29,208 | | | | 2,019,733 | |
Coca-Cola Co. | | | 653,389 | | | | 41,764,625 | |
Coca-Cola Enterprises, Inc. | | | 95,289 | | | | 2,506,101 | |
Constellation Brands, Inc., Class A (a) | | | 50,192 | | | | 1,019,901 | |
Dr Pepper Snapple Group, Inc. | | | 63,864 | | | | 2,302,936 | |
Molson Coors Brewing Co., Class B | | | 44,537 | | | | 2,036,677 | |
PepsiCo, Inc. | | | 445,965 | | | | 28,283,100 | |
| | | | | | | | |
Beverages Total | | | | | | | 79,933,073 | |
|
Food & Staples Retailing – 2.2% | |
Costco Wholesale Corp. | | | 121,643 | | | | 9,097,680 | |
CVS Caremark Corp. | | | 382,333 | | | | 12,639,929 | |
Kroger Co. | | | 179,435 | | | | 4,109,061 | |
Safeway, Inc. | | | 104,857 | | | | 2,287,980 | |
SUPERVALU, Inc. | | | 59,706 | | | | 515,263 | |
Sysco Corp. | | | 164,659 | | | | 4,575,874 | |
Wal-Mart Stores, Inc. | | | 551,301 | | | | 28,656,626 | |
Walgreen Co. | | | 260,556 | | | | 11,292,497 | |
Whole Foods Market, Inc. | | | 41,374 | | | | 2,422,861 | |
| | | | | | | | |
Food & Staples Retailing Total | | | | | | | 75,597,771 | |
|
Food Products – 1.7% | |
Archer-Daniels-Midland Co. | | | 179,802 | | | | 6,685,038 | |
Campbell Soup Co. | | | 53,908 | | | | 1,814,543 | |
ConAgra Foods, Inc. | | | 123,785 | | | | 2,866,861 | |
Dean Foods Co. (a) | | | 51,275 | | | | 541,464 | |
General Mills, Inc. | | | 180,175 | | | | 6,691,700 | |
H.J. Heinz Co. | | | 90,250 | | | | 4,532,355 | |
Hershey Co. | | | 43,482 | | | | 2,274,978 | |
Hormel Foods Corp. | | | 38,950 | | | | 1,067,230 | |
| | | | | | | | |
| | | Shares | | | Value ($) | |
J.M. Smucker Co. | | | 33,653 | | | | 2,316,673 | |
Kellogg Co. | | | 71,520 | | | | 3,830,611 | |
Kraft Foods, Inc., Class A | | | 491,505 | | | | 15,649,519 | |
McCormick & Co., Inc., Non-Voting Shares | | | 37,391 | | | | 1,781,681 | |
Mead Johnson Nutrition Co., Class A | | | 57,600 | | | | 3,447,360 | |
Sara Lee Corp. | | | 179,847 | | | | 3,078,981 | |
Tyson Foods, Inc., Class A | | | 83,841 | | | | 1,561,958 | |
| | | | | | | | |
Food Products Total | | | | | | | 58,140,952 | |
|
Household Products – 2.0% | |
Clorox Co. | | | 39,283 | | | | 2,661,816 | |
Colgate-Palmolive Co. | | | 135,834 | | | | 10,665,686 | |
Kimberly-Clark Corp. | | | 114,788 | | | | 7,564,529 | |
Procter & Gamble Co. | | | 787,668 | | | | 49,662,467 | |
| | | | | | | | |
Household Products Total | | | | | | | 70,554,498 | |
|
Personal Products – 0.2% | |
Avon Products, Inc. | | | 120,756 | | | | 3,358,224 | |
Estée Lauder Companies, Inc., Class A | | | 31,939 | | | | 3,015,361 | |
| | | | | | | | |
Personal Products Total | | | | | | | 6,373,585 | |
|
Tobacco – 1.6% | |
Altria Group, Inc. | | | 587,554 | | | | 14,906,245 | |
Lorillard, Inc. | | | 42,061 | | | | 3,229,023 | |
Philip Morris International, Inc. | | | 510,559 | | | | 32,052,894 | |
Reynolds American, Inc. | | | 95,168 | | | | 3,266,166 | |
| | | | | | | | |
Tobacco Total | | | | | | | 53,454,328 | |
| | | | | | | | |
Consumer Staples Total | | | | | | | 344,054,207 | |
| | | | | | | | |
| Energy – 13.0% | |
| Energy Equipment & Services – 2.4% | |
Baker Hughes, Inc. | | | 121,314 | | | | 8,619,360 | |
Cameron International Corp. (a) | | | 68,262 | | | | 4,036,332 | |
Diamond Offshore Drilling, Inc. | | | 19,547 | | | | 1,529,162 | |
FMC Technologies, Inc. (a) | | | 33,679 | | | | 3,167,510 | |
Halliburton Co. | | | 255,900 | | | | 12,011,946 | |
Helmerich & Payne, Inc. | | | 29,850 | | | | 1,939,951 | |
Nabors Industries Ltd. (a) | | | 80,334 | | | | 2,287,109 | |
National Oilwell Varco, Inc. | | | 118,064 | | | | 9,394,352 | |
Noble Corp. | | | 72,000 | | | | 3,219,120 | |
Rowan Companies, Inc. (a) | | | 35,479 | | | | 1,513,889 | |
Schlumberger Ltd. | | | 383,976 | | | | 35,871,038 | |
| | | | | | | | |
Energy Equipment & Services Total | | | | 83,589,769 | |
|
Oil, Gas & Consumable Fuels – 10.6% | |
Anadarko Petroleum Corp. | | | 139,491 | | | | 11,414,549 | |
Apache Corp. | | | 107,586 | | | | 13,407,367 | |
Cabot Oil & Gas Corp. | | | 29,293 | | | | 1,337,518 | |
Chesapeake Energy Corp. | | | 183,967 | | | | 6,551,065 | |
See Accompanying Notes to Financial Statements.
9
Columbia Large Cap Index Fund
February 28, 2011
Common Stocks (continued)
| | | | | | | | |
| | | Shares | | | Value ($) | |
| Energy (continued) | |
Chevron Corp. | | | 566,272 | | | | 58,750,720 | |
ConocoPhillips | | | 413,460 | | | | 32,196,130 | |
Consol Energy, Inc. | | | 63,521 | | | | 3,221,150 | |
Denbury Resources, Inc. (a) | | | 112,425 | | | | 2,724,058 | |
Devon Energy Corp. | | | 121,560 | | | | 11,115,446 | |
El Paso Corp. | | | 198,177 | | | | 3,686,092 | |
EOG Resources, Inc. | | | 71,527 | | | | 8,033,197 | |
EQT Corp. | | | 41,988 | | | | 2,070,008 | |
Exxon Mobil Corp. (b) | | | 1,418,943 | | | | 121,362,195 | |
Hess Corp. | | | 84,475 | | | | 7,351,859 | |
Marathon Oil Corp. | | | 199,777 | | | | 9,908,939 | |
Massey Energy Co. | | | 28,751 | | | | 1,820,801 | |
Murphy Oil Corp. | | | 54,132 | | | | 3,980,326 | |
Newfield Exploration Co. (a) | | | 37,700 | | | | 2,744,183 | |
Noble Energy, Inc. | | | 49,267 | | | | 4,565,080 | |
Occidental Petroleum Corp. | | | 228,663 | | | | 23,316,766 | |
Peabody Energy Corp. | | | 75,878 | | | | 4,969,250 | |
Pioneer Natural Resources Co. | | | 32,628 | | | | 3,339,150 | |
QEP Resources, Inc. | | | 49,450 | | | | 1,955,748 | |
Range Resources Corp. | | | 45,060 | | | | 2,446,758 | |
Southwestern Energy Co. (a) | | | 97,577 | | | | 3,852,340 | |
Spectra Energy Corp. | | | 182,413 | | | | 4,879,548 | |
Sunoco, Inc. | | | 33,924 | | | | 1,420,059 | |
Tesoro Corp. (a) | | | 40,284 | | | | 957,954 | |
Valero Energy Corp. | | | 159,324 | | | | 4,489,750 | |
Williams Companies, Inc. | | | 164,585 | | | | 4,996,801 | |
| | | | | | | | |
Oil, Gas & Consumable Fuels Total | | | | 362,864,807 | |
| | | | | | | | |
Energy Total | | | | | | | 446,454,576 | |
| | | | | | | | |
| Financials – 15.9% | |
| Capital Markets – 2.4% | | | | | | | | |
Ameriprise Financial, Inc. (c) | | | 69,776 | | | | 4,418,216 | |
Bank of New York Mellon Corp. | | | 349,069 | | | | 10,608,207 | |
Charles Schwab Corp. | | | 279,054 | | | | 5,293,654 | |
E*Trade Financial Corp. (a) | | | 55,960 | | | | 894,241 | |
Federated Investors, Inc., Class B | | | 25,819 | | | | 711,572 | |
Franklin Resources, Inc. | | | 40,977 | | | | 5,147,531 | |
Goldman Sachs Group, Inc. | | | 143,838 | | | | 23,557,788 | |
Invesco Ltd. | | | 129,999 | | | | 3,489,173 | |
Janus Capital Group, Inc. | | | 51,700 | | | | 694,331 | |
Legg Mason, Inc. | | | 43,086 | | | | 1,561,867 | |
Morgan Stanley | | | 425,751 | | | | 12,636,290 | |
Northern Trust Corp. | | | 68,120 | | | | 3,512,948 | |
State Street Corp. | | | 141,219 | | | | 6,315,314 | |
T. Rowe Price Group, Inc. | | | 72,189 | | | | 4,835,219 | |
| | | | | | | | |
Capital Markets Total | | | | 83,676,351 | |
| | |
Commercial Banks – 2.9% | | | | | | | | |
BB&T Corp. | | | 195,262 | | | | 5,389,231 | |
| | | | | | | | |
| | | Shares | | | Value ($) | |
Comerica, Inc. | | | 49,667 | | | | 1,932,046 | |
Fifth Third Bancorp. | | | 258,262 | | | | 3,770,625 | |
First Horizon National Corp. (a) | | | 73,370 | | | | 843,755 | |
Huntington Bancshares, Inc. | | | 242,879 | | | | 1,661,292 | |
KeyCorp | | | 247,736 | | | | 2,264,307 | |
M&T Bank Corp. | | | 33,641 | | | | 2,962,090 | |
Marshall & Ilsley Corp. | | | 148,602 | | | | 1,154,638 | |
PNC Financial Services Group, Inc. | | | 147,938 | | | | 9,127,775 | |
Regions Financial Corp. | | | 353,417 | | | | 2,700,106 | |
SunTrust Banks, Inc. | | | 140,693 | | | | 4,244,708 | |
U.S. Bancorp | | | 539,819 | | | | 14,969,181 | |
Wells Fargo & Co. | | | 1,476,950 | | | | 47,646,407 | |
Zions Bancorporation | | | 50,078 | | | | 1,169,822 | |
| | | | | | | | |
Commercial Banks Total | | | | | | | 99,835,983 | |
|
Consumer Finance – 0.7% | |
American Express Co. | | | 294,708 | | | | 12,840,428 | |
Capital One Financial Corp. | | | 128,604 | | | | 6,400,621 | |
Discover Financial Services | | | 153,239 | | | | 3,332,948 | |
SLM Corp. (a) | | | 136,647 | | | | 2,025,108 | |
| | | | | | | | |
Consumer Finance Total | | | | | | | 24,599,105 | |
|
Diversified Financial Services – 4.3% | |
Bank of America Corp. (c) | | | 2,837,967 | | | | 40,554,548 | |
Citigroup, Inc. (a) | | | 8,174,598 | | | | 38,257,119 | |
CME Group, Inc. | | | 18,845 | | | | 5,866,072 | |
IntercontinentalExchange, Inc. (a) | | | 20,545 | | | | 2,633,869 | |
JPMorgan Chase & Co. | | | 1,100,075 | | | | 51,362,502 | |
Leucadia National Corp. | | | 55,450 | | | | 1,837,058 | |
Moody’s Corp. | | | 57,314 | | | | 1,828,317 | |
NASDAQ OMX Group, Inc. (a) | | | 41,909 | | | | 1,199,016 | |
NYSE Euronext | | | 73,408 | | | | 2,716,096 | |
| | | | | | | | |
Diversified Financial Services Total | | | | | | | 146,254,597 | |
|
Insurance – 3.9% | |
ACE Ltd. | | | 95,475 | | | | 6,038,794 | |
AFLAC, Inc. | | | 132,611 | | | | 7,805,484 | |
Allstate Corp. | | | 151,464 | | | | 4,813,526 | |
American International Group, Inc. (a) | | | 40,390 | | | | 1,496,853 | |
AON Corp. | | | 92,815 | | | | 4,885,782 | |
Assurant, Inc. | | | 29,936 | | | | 1,216,300 | |
Berkshire Hathaway, Inc., Class B (a) | | | 486,950 | | | | 42,500,996 | |
Chubb Corp. | | | 85,849 | | | | 5,209,317 | |
Cincinnati Financial Corp. | | | 45,748 | | | | 1,557,719 | |
Genworth Financial, Inc., Class A (a) | | | 137,813 | | | | 1,823,266 | |
Hartford Financial Services Group, Inc. | | | 125,122 | | | | 3,703,611 | |
Lincoln National Corp. | | | 89,137 | | | | 2,827,426 | |
Loews Corp. | | | 89,024 | | | | 3,850,288 | |
See Accompanying Notes to Financial Statements.
10
Columbia Large Cap Index Fund
February 28, 2011
Common Stocks (continued)
| | | | | | | | |
| | | Shares | | | Value ($) | |
| Financials (continued) | |
Marsh & McLennan Companies, Inc. | | | 152,943 | | | | 4,655,585 | |
MetLife, Inc. | | | 255,001 | | | | 12,076,847 | |
Principal Financial Group, Inc. | | | 90,171 | | | | 3,089,258 | |
Progressive Corp. | | | 186,680 | | | | 3,888,544 | |
Prudential Financial, Inc. | | | 136,602 | | | | 8,992,510 | |
Torchmark Corp. | | | 22,546 | | | | 1,471,127 | |
Travelers Companies, Inc. | | | 122,305 | | | | 7,329,739 | |
Unum Group | | | 89,293 | | | | 2,368,943 | |
XL Group PLC | | | 90,946 | | | | 2,123,589 | |
| | | | | | | | |
Insurance Total | | | | | | | 133,725,504 | |
|
Real Estate Investment Trusts (REITs) – 1.5% | |
Apartment Investment & Management Co., Class A | | | 32,900 | | | | 843,885 | |
AvalonBay Communities, Inc. | | | 23,995 | | | | 2,904,115 | |
Boston Properties, Inc. | | | 39,398 | | | | 3,779,056 | |
Equity Residential Property Trust | | | 80,033 | | | | 4,410,618 | |
HCP, Inc. | | | 102,569 | | | | 3,897,622 | |
Health Care REIT, Inc. | | | 40,797 | | | | 2,130,419 | |
Host Hotels & Resorts, Inc. | | | 187,437 | | | | 3,448,841 | |
Kimco Realty Corp. | | | 114,260 | | | | 2,214,359 | |
Plum Creek Timber Co., Inc. | | | 45,459 | | | | 1,907,460 | |
ProLogis | | | 160,092 | | | | 2,603,096 | |
Public Storage | | | 39,334 | | | | 4,415,241 | |
Simon Property Group, Inc. | | | 82,416 | | | | 9,069,057 | |
Ventas, Inc. | | | 44,176 | | | | 2,448,234 | |
Vornado Realty Trust | | | 45,743 | | | | 4,269,194 | |
Weyerhaeuser Co. | | | 150,834 | | | | 3,681,858 | |
| | | | | | | | |
Real Estate Investment Trusts (REITs) Total | | | | 52,023,055 | |
|
Real Estate Management & Development – 0.1% | |
CB Richard Ellis Group, Inc., Class A (a) | | | 81,771 | | | | 2,047,546 | |
| | | | | | | | |
Real Estate Management & Development Total | | | | 2,047,546 | |
| |
Thrifts & Mortgage Finance – 0.1% | | | | | |
Hudson City Bancorp, Inc. | | | 148,159 | | | | 1,703,829 | |
People’s United Financial, Inc. | | | 103,828 | | | | 1,368,453 | |
| | | | | | | | |
Thrifts & Mortgage Finance Total | | | | | | | 3,072,282 | |
| | | | | | | | |
Financials Total | | | | 545,234,423 | |
| | | | | | | | |
| Health Care – 10.7% | | | | | |
| Biotechnology – 1.2% | | | | | |
Amgen, Inc. (a) | | | 265,869 | | | | 13,647,056 | |
Biogen Idec, Inc. (a) | | | 67,074 | | | | 4,587,862 | |
Celgene Corp. (a) | | | 132,416 | | | | 7,031,290 | |
Cephalon, Inc. (a) | | | 21,143 | | | | 1,190,562 | |
Genzyme Corp. (a) | | | 72,898 | | | | 5,500,154 | |
Gilead Sciences, Inc. (a) | | | 228,422 | | | | 8,903,889 | |
| | | | | | | | |
Biotechnology Total | | | | | | | 40,860,813 | |
| | | | | | | | |
| | | Shares | | | Value ($) | |
| Health Care Equipment & Supplies – 1.8% | | | | | |
Baxter International, Inc. | | | 164,003 | | | | 8,716,760 | |
Becton Dickinson & Co. | | | 64,694 | | | | 5,175,520 | |
Boston Scientific Corp. (a) | | | 427,735 | | | | 3,062,583 | |
C.R. Bard, Inc. | | | 26,121 | | | | 2,553,589 | |
CareFusion Corp. (a) | | | 62,695 | | | | 1,712,827 | |
Covidien PLC | | | 140,900 | | | | 7,249,305 | |
DENTSPLY International, Inc. | | | 40,001 | | | | 1,494,837 | |
Intuitive Surgical, Inc. (a) | | | 11,091 | | | | 3,637,293 | |
Medtronic, Inc. | | | 303,836 | | | | 12,129,133 | |
St. Jude Medical, Inc. (a) | | | 96,450 | | | | 4,618,026 | |
Stryker Corp. | | | 96,136 | | | | 6,081,563 | |
Varian Medical Systems, Inc. (a) | | | 33,518 | | | | 2,322,127 | |
Zimmer Holdings, Inc. (a) | | | 55,572 | | | | 3,464,359 | |
| | | | | | | | |
Health Care Equipment & Supplies Total | | | | | | | 62,217,922 | |
| |
| Health Care Providers & Services – 2.0% | | | | | |
Aetna, Inc. | | | 112,603 | | | | 4,206,848 | |
AmerisourceBergen Corp. | | | 77,721 | | | | 2,946,403 | |
Cardinal Health, Inc. | | | 98,216 | | | | 4,089,714 | |
CIGNA Corp. | | | 76,269 | | | | 3,208,637 | |
Coventry Health Care, Inc. (a) | | | 41,777 | | | | 1,261,665 | |
DaVita, Inc. (a) | | | 27,387 | | | | 2,173,706 | |
Express Scripts, Inc. (a) | | | 148,317 | | | | 8,338,382 | |
Humana, Inc. (a) | | | 47,394 | | | | 3,081,084 | |
Laboratory Corp. of America Holdings (a) | | | 28,647 | | | | 2,581,954 | |
McKesson Corp. | | | 71,233 | | | | 5,647,352 | |
Medco Health Solutions, Inc. (a) | | | 119,404 | | | | 7,360,063 | |
Patterson Companies, Inc. | | | 27,233 | | | | 909,038 | |
Quest Diagnostics, Inc. | | | 39,828 | | | | 2,260,239 | |
Tenet Healthcare Corp. (a) | | | 136,613 | | | | 980,881 | |
UnitedHealth Group, Inc. | | | 309,549 | | | | 13,180,597 | |
WellPoint, Inc. (a) | | | 110,741 | | | | 7,360,954 | |
| | | | | | | | |
Health Care Providers & Services Total | | | | | | | 69,587,517 | |
| |
| Health Care Technology – 0.1% | | | | | |
Cerner Corp. (a) | | | 20,025 | | | | 2,011,511 | |
| | | | | | | | |
Health Care Technology Total | | | | | | | 2,011,511 | |
|
Life Sciences Tools & Services – 0.4% | |
Agilent Technologies, Inc. (a) | | | 97,457 | | | | 4,100,991 | |
Life Technologies Corp. (a) | | | 52,495 | | | | 2,801,658 | |
PerkinElmer, Inc. | | | 33,245 | | | | 880,992 | |
Thermo Fisher Scientific, Inc. (a) | | | 111,879 | | | | 6,245,086 | |
Waters Corp. (a) | | | 25,704 | | | | 2,134,717 | |
| | | | | | | | |
Life Sciences Tools & Services Total | | | | 16,163,444 | |
|
Pharmaceuticals – 5.2% | |
Abbott Laboratories | | | 434,997 | | | | 20,923,356 | |
Allergan, Inc. | | | 86,489 | | | | 6,414,889 | |
See Accompanying Notes to Financial Statements.
11
Columbia Large Cap Index Fund
February 28, 2011
Common Stocks (continued)
| | | | | | | | |
| | | Shares | | | Value ($) | |
| Health Care (continued) | | | | | |
Bristol-Myers Squibb Co. | | | 481,686 | | | | 12,432,316 | |
Eli Lilly & Co. | | | 285,538 | | | | 9,868,193 | |
Forest Laboratories, Inc. (a) | | | 80,405 | | | | 2,605,122 | |
Hospira, Inc. (a) | | | 46,982 | | | | 2,482,999 | |
Johnson & Johnson | | | 772,793 | | | | 47,480,402 | |
Merck & Co., Inc. | | | 866,915 | | | | 28,235,422 | |
Mylan, Inc. (a) | | | 122,478 | | | | 2,801,072 | |
Pfizer, Inc. | | | 2,253,951 | | | | 43,366,017 | |
Watson Pharmaceuticals, Inc. (a) | | | 35,257 | | | | 1,974,039 | |
| | | | | | | | |
Pharmaceuticals Total | | | | | | | 178,583,827 | |
| | | | | | | | |
Health Care Total | | | | | | | 369,425,034 | |
| | | | | | | | |
| Industrials – 11.0% | |
| Aerospace & Defense – 2.7% | | | | | | | | |
Boeing Co. | | | 206,385 | | | | 14,861,784 | |
General Dynamics Corp. | | | 106,341 | | | | 8,094,677 | |
Goodrich Corp. | | | 35,271 | | | | 3,041,418 | |
Honeywell International, Inc. | | | 219,503 | | | | 12,711,419 | |
ITT Corp. | | | 51,633 | | | | 2,991,100 | |
L-3 Communications Holdings, Inc. | | | 31,814 | | | | 2,522,532 | |
Lockheed Martin Corp. | | | 83,077 | | | | 6,576,375 | |
Northrop Grumman Corp. | | | 82,187 | | | | 5,480,229 | |
Precision Castparts Corp. | | | 40,155 | | | | 5,691,971 | |
Raytheon Co. | | | 102,581 | | | | 5,253,173 | |
Rockwell Collins, Inc. | | | 44,114 | | | | 2,842,706 | |
Textron, Inc. | | | 77,308 | | | | 2,094,274 | |
United Technologies Corp. | | | 259,816 | | | | 21,705,029 | |
| | | | | | | | |
Aerospace & Defense Total | | | | 93,866,687 | |
|
Air Freight & Logistics – 1.0% | |
C.H. Robinson Worldwide, Inc. | | | 46,703 | | | | 3,380,830 | |
Expeditors International of Washington, Inc. | | | 59,716 | | | | 2,854,425 | |
FedEx Corp. | | | 88,540 | | | | 7,970,371 | |
United Parcel Service, Inc., Class B | | | 278,280 | | | | 20,537,064 | |
| | | | | | | | |
Air Freight & Logistics Total | | | | 34,742,690 | |
|
Airlines – 0.1% | |
Southwest Airlines Co. | | | 210,252 | | | | 2,487,281 | |
| | | | | | | | |
Airlines Total | | | | 2,487,281 | |
|
Building Products – 0.1% | |
Masco Corp. | | | 100,853 | | | | 1,370,592 | |
| | | | | | | | |
Building Products Total | | | | 1,370,592 | |
|
Commercial Services & Supplies – 0.5% | |
Avery Dennison Corp. | | | 30,420 | | | | 1,214,366 | |
Cintas Corp. | | | 35,613 | | | | 1,001,438 | |
Iron Mountain, Inc. | | | 56,315 | | | | 1,464,190 | |
| | | | | | | | |
| | | Shares | | | Value ($) | |
Pitney Bowes, Inc. | | | 57,267 | | | | 1,441,983 | |
R.R. Donnelley & Sons Co. | | | 58,080 | | | | 1,081,450 | |
Republic Services, Inc. | | | 86,494 | | | | 2,561,087 | |
Stericycle, Inc. (a) | | | 24,112 | | | | 2,083,759 | |
Waste Management, Inc. | | | 133,862 | | | | 4,960,926 | |
| | | | | | | | |
Commercial Services & Supplies Total | | | | 15,809,199 | |
|
Construction & Engineering – 0.2% | |
Fluor Corp. | | | 50,298 | | | | 3,559,086 | |
Jacobs Engineering Group, Inc. (a) | | | 35,496 | | | | 1,776,930 | |
Quanta Services, Inc. (a) | | | 60,618 | | | | 1,382,697 | |
| | | | | | | | |
Construction & Engineering Total | | | | 6,718,713 | |
|
Electrical Equipment – 0.5% | |
Emerson Electric Co. | | | 211,756 | | | | 12,633,363 | |
Rockwell Automation, Inc. | | | 39,868 | | | | 3,497,619 | |
Roper Industries, Inc. | | | 26,675 | | | | 2,244,168 | |
| | | | | | | | |
Electrical Equipment Total | | | | 18,375,150 | |
|
Industrial Conglomerates – 2.6% | |
3M Co. | | | 201,188 | | | | 18,555,569 | |
General Electric Co. (b) | | | 2,998,234 | | | | 62,723,056 | |
Tyco International Ltd. | | | 137,700 | | | | 6,243,318 | |
| | | | | | | | |
Industrial Conglomerates Total | | | | 87,521,943 | |
|
Machinery – 2.3% | |
Caterpillar, Inc. | | | 178,583 | | | | 18,381,548 | |
Cummins, Inc. | | | 55,686 | | | | 5,630,968 | |
Danaher Corp. | | | 150,913 | | | | 7,636,198 | |
Deere & Co. | | | 119,228 | | | | 10,748,404 | |
Dover Corp. | | | 52,576 | | | | 3,378,008 | |
Eaton Corp. | | | 47,400 | | | | 5,250,972 | |
Flowserve Corp. | | | 15,663 | | | | 1,957,405 | |
Illinois Tool Works, Inc. | | | 139,557 | | | | 7,550,034 | |
Ingersoll-Rand PLC | | | 91,200 | | | | 4,131,360 | |
Joy Global, Inc. | | | 29,000 | | | | 2,824,020 | |
PACCAR, Inc. | | | 102,663 | | | | 5,146,496 | |
Pall Corp. | | | 32,405 | | | | 1,761,536 | |
Parker Hannifin Corp. | | | 45,365 | | | | 4,045,651 | |
Snap-On, Inc. | | | 16,329 | | | | 937,774 | |
| | | | | | | | |
Machinery Total | | | | 79,380,374 | |
|
Professional Services – 0.1% | |
Dun & Bradstreet Corp. | | | 14,007 | | | | 1,131,766 | |
Equifax, Inc. | | | 34,710 | | | | 1,240,882 | |
Robert Half International, Inc. | | | 41,360 | | | | 1,319,384 | |
| | | | | | | | |
Professional Services Total | | | | 3,692,032 | |
|
Road & Rail – 0.8% | |
CSX Corp. | | | 105,335 | | | | 7,864,311 | |
Norfolk Southern Corp. | | | 102,242 | | | | 6,705,030 | |
Ryder System, Inc. | | | 14,529 | | | | 694,922 | |
See Accompanying Notes to Financial Statements.
12
Columbia Large Cap Index Fund
February 28, 2011
Common Stocks (continued)
| | | | | | | | |
| | | Shares | | | Value ($) | |
| Industrials (continued) | |
Union Pacific Corp. | | | 138,782 | | | | 13,241,191 | |
| | | | | | | | |
Road & Rail Total | | | | 28,505,454 | |
|
Trading Companies & Distributors – 0.1% | |
Fastenal Co. | | | 41,524 | | | | 2,579,886 | |
W.W. Grainger, Inc. | | | 16,348 | | | | 2,177,717 | |
| | | | | | | | |
Trading Companies & Distributors Total | | | | 4,757,603 | |
| | | | | | | | |
Industrials Total | | | | | | | 377,227,718 | |
| | | | | | | | |
| Information Technology – 18.5% | |
| Communications Equipment – 2.2% | |
Cisco Systems, Inc. (a) | | | 1,559,688 | | | | 28,947,809 | |
F5 Networks, Inc. (a) | | | 22,800 | | | | 2,690,628 | |
Harris Corp. | | | 36,083 | | | | 1,683,633 | |
JDS Uniphase Corp. (a) | | | 62,698 | | | | 1,546,760 | |
Juniper Networks, Inc. (a) | | | 147,272 | | | | 6,479,968 | |
Motorola Mobility Holdings, Inc. (a) | | | 82,655 | | | | 2,496,181 | |
Motorola Solutions, Inc. (a) | | | 94,448 | | | | 3,649,471 | |
QUALCOMM, Inc. | | | 455,232 | | | | 27,122,722 | |
Tellabs, Inc. | | | 103,801 | | | | 559,487 | |
| | | | | | | | |
Communications Equipment Total | | | | 75,176,659 | |
|
Computers & Peripherals – 4.5% | |
Apple, Inc. (a) | | | 258,112 | | | | 91,167,740 | |
Dell, Inc. (a) | | | 472,520 | | | | 7,479,992 | |
EMC Corp. (a) | | | 579,808 | | | | 15,776,576 | |
Hewlett-Packard Co. | | | 638,090 | | | | 27,839,867 | |
Lexmark International, Inc., Class A (a) | | | 22,145 | | | | 831,102 | |
NetApp, Inc. (a) | | | 101,687 | | | | 5,253,150 | |
SanDisk Corp. (a) | | | 66,032 | | | | 3,275,187 | |
Western Digital Corp. (a) | | | 64,656 | | | | 1,977,180 | |
| | | | | | | | |
Computers & Peripherals Total | | | | 153,600,794 | |
|
Electronic Equipment, Instruments &
Components – 0.5% | |
Amphenol Corp., Class A | | | 49,158 | | | | 2,825,602 | |
Corning, Inc. | | | 439,829 | | | | 10,142,457 | |
FLIR Systems, Inc. | | | 44,651 | | | | 1,442,227 | |
Jabil Circuit, Inc. | | | 55,168 | | | | 1,182,250 | |
Molex, Inc. | | | 38,849 | | | | 1,085,053 | |
| | | | | | | | |
Electronic Equipment, Instruments & Components Total | | | | 16,677,589 | |
|
Internet Software & Services – 1.9% | |
Akamai Technologies, Inc. (a) | | | 51,262 | | | | 1,923,863 | |
eBay, Inc. (a) | | | 322,885 | | | | 10,818,262 | |
Google, Inc., Class A (a) | | | 70,237 | | | | 43,083,376 | |
Monster Worldwide, Inc. (a) | | | 36,588 | | | | 627,484 | |
VeriSign, Inc. | | | 48,388 | | | | 1,707,612 | |
| | | | | | | | |
| | | Shares | | | Value ($) | |
Yahoo!, Inc. (a) | | | 366,795 | | | | 6,015,438 | |
| | | | | | | | |
Internet Software & Services Total | | | | | | | 64,176,035 | |
| | |
IT Services – 3.1% | | | | | | | | |
Automatic Data Processing, Inc. | | | 138,823 | | | | 6,941,150 | |
Cognizant Technology Solutions Corp., Class A (a) | | | 85,355 | | | | 6,561,239 | |
Computer Sciences Corp. | | | 43,461 | | | | 2,091,778 | |
Fidelity National Information Services, Inc. | | | 74,523 | | | | 2,413,800 | |
Fiserv, Inc. (a) | | | 41,825 | | | | 2,646,268 | |
International Business Machines Corp. | | | 349,632 | | | | 56,598,428 | |
MasterCard, Inc., Class A | | | 27,275 | | | | 6,561,274 | |
Paychex, Inc. | | | 90,534 | | | | 3,044,658 | |
SAIC, Inc. (a) | | | 82,625 | | | | 1,350,093 | |
Teradata Corp. (a) | | | 47,182 | | | | 2,256,243 | |
Total System Services, Inc. | | | 45,884 | | | | 814,441 | |
Visa, Inc., Class A | | | 137,125 | | | | 10,016,981 | |
Western Union Co. | | | 184,597 | | | | 4,059,288 | |
| | | | | | | | |
IT Services Total | | | | 105,355,641 | |
|
Office Electronics – 0.1% | |
Xerox Corp. | | | 390,382 | | | | 4,196,607 | |
| | | | | | | | |
Office Electronics Total | | | | 4,196,607 | |
|
Semiconductors & Semiconductor Equipment – 2.5% | |
Advanced Micro Devices, Inc. (a) | | | 161,122 | | | | 1,483,934 | |
Altera Corp. | | | 87,928 | | | | 3,680,666 | |
Analog Devices, Inc. | | | 84,015 | | | | 3,350,518 | |
Applied Materials, Inc. | | | 375,987 | | | | 6,177,466 | |
Broadcom Corp., Class A | | | 128,110 | | | | 5,280,694 | |
First Solar, Inc. (a) | | | 15,225 | | | | 2,244,013 | |
Intel Corp. | | | 1,569,587 | | | | 33,699,033 | |
KLA-Tencor Corp. | | | 47,010 | | | | 2,295,028 | |
Linear Technology Corp. | | | 63,471 | | | | 2,193,558 | |
LSI Corp. (a) | | | 173,479 | | | | 1,091,183 | |
MEMC Electronic Materials, Inc. (a) | | | 63,949 | | | | 867,788 | |
Microchip Technology, Inc. | | | 52,597 | | | | 1,941,355 | |
Micron Technology, Inc. (a) | | | 241,057 | | | | 2,682,964 | |
National Semiconductor Corp. | | | 67,442 | | | | 1,045,351 | |
Novellus Systems, Inc. (a) | | | 25,364 | | | | 1,013,545 | |
NVIDIA Corp. (a) | | | 163,448 | | | | 3,703,732 | |
Teradyne, Inc. (a) | | | 51,082 | | | | 951,658 | |
Texas Instruments, Inc. | | | 330,394 | | | | 11,765,330 | |
Xilinx, Inc. | | | 72,950 | | | | 2,425,588 | |
| | | | | | | | |
Semiconductors & Semiconductor Equipment Total | | | | 87,893,404 | |
|
Software – 3.7% | |
Adobe Systems, Inc. (a) | | | 143,190 | | | | 4,940,055 | |
See Accompanying Notes to Financial Statements.
13
Columbia Large Cap Index Fund
February 28, 2011
Common Stocks (continued)
| | | | | | | | |
| | | Shares | | | Value ($) | |
| Information Technology (continued) | |
Autodesk, Inc. (a) | | | 64,016 | | | | 2,691,873 | |
BMC Software, Inc. (a) | | | 49,956 | | | | 2,472,822 | |
CA, Inc. | | | 107,992 | | | | 2,676,042 | |
Citrix Systems, Inc. (a) | | | 52,852 | | | | 3,708,096 | |
Compuware Corp. (a) | | | 61,646 | | | | 694,134 | |
Electronic Arts, Inc. (a) | | | 93,410 | | | | 1,756,108 | |
Intuit, Inc. (a) | | | 78,637 | | | | 4,134,733 | |
McAfee, Inc. (a) | | | 43,344 | | | | 2,078,345 | |
Microsoft Corp. | | | 2,118,616 | | | | 56,312,813 | |
Novell, Inc. (a) | | | 98,961 | | | | 581,891 | |
Oracle Corp. | | | 1,089,201 | | | | 35,834,713 | |
Red Hat, Inc. (a) | | | 53,675 | | | | 2,215,704 | |
Salesforce.com, Inc. (a) | | | 33,280 | | | | 4,401,946 | |
Symantec Corp. (a) | | | 218,408 | | | | 3,937,896 | |
| | | | | | | | |
Software Total | | | | | | | 128,437,171 | |
| | | | | | | | |
Information Technology Total | | | | | | | 635,513,900 | |
| | | | | | | | |
| Materials – 3.6% | | | | | | | | |
| Chemicals – 2.1% | | | | | | | | |
Air Products & Chemicals, Inc. | | | 60,319 | | | | 5,549,348 | |
Airgas, Inc. | | | 21,050 | | | | 1,317,309 | |
CF Industries Holdings, Inc. | | | 19,976 | | | | 2,822,209 | |
Dow Chemical Co. | | | 326,642 | | | | 12,138,017 | |
E.I. du Pont de Nemours & Co. | | | 256,851 | | | | 14,093,414 | |
Eastman Chemical Co. | | | 20,275 | | | | 1,893,888 | |
Ecolab, Inc. | | | 65,295 | | | | 3,175,949 | |
FMC Corp. | | | 20,450 | | | | 1,583,648 | |
International Flavors & Fragrances, Inc. | | | 22,496 | | | | 1,281,147 | |
Monsanto Co. | | | 150,911 | | | | 10,848,992 | |
PPG Industries, Inc. | | | 45,903 | | | | 4,056,907 | |
Praxair, Inc. | | | 86,202 | | | | 8,566,755 | |
Sherwin-Williams Co. | | | 25,237 | | | | 2,072,463 | |
Sigma-Aldrich Corp. | | | 34,134 | | | | 2,180,821 | |
| | | | | | | | |
Chemicals Total | | | | | | | 71,580,867 | |
| | |
Construction Materials – 0.0% | | | | | | | | |
Vulcan Materials Co. | | | 36,178 | | | | 1,658,761 | |
| | | | | | | | |
Construction Materials Total | | | | | | | 1,658,761 | |
| | |
Containers & Packaging – 0.2% | | | | | | | | |
Ball Corp. | | | 49,760 | | | | 1,796,336 | |
Bemis Co., Inc. | | | 30,424 | | | | 999,428 | |
Owens-Illinois, Inc. (a) | | | 46,089 | | | | 1,405,254 | |
Sealed Air Corp. | | | 44,945 | | | | 1,236,886 | |
| | | | | | | | |
Containers & Packaging Total | | | | | | | 5,437,904 | |
| | |
Metals & Mining – 1.2% | | | | | | | | |
AK Steel Holding Corp. | | | 30,938 | | | | 494,389 | |
Alcoa, Inc. | | | 287,443 | | | | 4,843,415 | |
| | | | | | | | |
| | | Shares | | | Value ($) | |
Allegheny Technologies, Inc. | | | 27,728 | | | | 1,859,994 | |
Cliffs Natural Resources, Inc. | | | 38,150 | | | | 3,703,221 | |
Freeport-McMoRan Copper &
Gold, Inc. | | | 265,014 | | | | 14,032,491 | |
Newmont Mining Corp. | | | 138,700 | | | | 7,665,949 | |
Nucor Corp. | | | 88,833 | | | | 4,260,431 | |
Titanium Metals Corp. (a) | | | 25,387 | | | | 482,099 | |
United States Steel Corp. | | | 40,417 | | | | 2,323,573 | |
| | | | | | | | |
Metals & Mining Total | | | | | | | 39,665,562 | |
| | |
| Paper & Forest Products – 0.1% | | | | | | | | |
International Paper Co. | | | 123,092 | | | | 3,419,496 | |
MeadWestvaco Corp. | | | 47,310 | | | | 1,388,548 | |
| | | | | | | | |
Paper & Forest Products Total | | | | | | | 4,808,044 | |
| | | | | | | | |
Materials Total | | | | | | | 123,151,138 | |
| | | | | | | | |
| Telecommunication Services – 2.9% | |
| Diversified Telecommunication Services – 2.6% | |
AT&T, Inc. | | | 1,663,029 | | | | 47,196,763 | |
CenturyTel, Inc. | | | 85,293 | | | | 3,512,366 | |
Frontier Communications Corp. | | | 279,625 | | | | 2,374,016 | |
Qwest Communications International, Inc. | | | 490,344 | | | | 3,344,146 | |
Verizon Communications, Inc. | | | 795,476 | | | | 29,368,974 | |
Windstream Corp. | | | 136,067 | | | | 1,706,280 | |
| | | | | | | | |
Diversified Telecommunication Services Total | | | | 87,502,545 | |
|
| Wireless Telecommunication Services – 0.3% | |
American Tower Corp., Class A (a) | | | 112,328 | | | | 6,061,219 | |
MetroPCS Communications, Inc. (a) | | | 73,848 | | | | 1,063,411 | |
Sprint Nextel Corp. (a) | | | 840,550 | | | | 3,673,204 | |
| | | | | | | | |
Wireless Telecommunication Services Total | | | | 10,797,834 | |
| | | | | | | | |
Telecommunication Services Total | | | | 98,300,379 | |
| | | | | | | | |
| Utilities – 3.1% | |
| Electric Utilities – 1.7% | | | | | | | | |
American Electric Power Co., Inc. | | | 135,191 | | | | 4,837,134 | |
Duke Energy Corp. | | | 372,700 | | | | 6,704,873 | |
Edison International | | | 91,716 | | | | 3,404,498 | |
Entergy Corp. | | | 50,922 | | | | 3,625,646 | |
Exelon Corp. | | | 186,123 | | | | 7,772,496 | |
FirstEnergy Corp. | | | 117,676 | | | | 4,506,991 | |
NextEra Energy, Inc. | | | 116,994 | | | | 6,489,657 | |
Northeast Utilities | | | 49,608 | | | | 1,688,656 | |
Pepco Holdings, Inc. | | | 63,208 | | | | 1,183,886 | |
Pinnacle West Capital Corp. | | | 30,586 | | | | 1,291,647 | |
PPL Corp. | | | 135,947 | | | | 3,457,132 | |
Progress Energy, Inc. | | | 82,443 | | | | 3,768,470 | |
Southern Co. | | | 235,950 | | | | 8,992,055 | |
| | | | | | | | |
Electric Utilities Total | | | | | | | 57,723,141 | |
See Accompanying Notes to Financial Statements.
14
Columbia Large Cap Index Fund
February 28, 2011
Common Stocks (continued)
| | | | | | | | |
| | | Shares | | | Value ($) | |
| Utilities (continued) | |
| Gas Utilities – 0.1% | | | | | | | | |
Nicor, Inc. | | | 12,813 | | | | 675,758 | |
ONEOK, Inc. | | | 30,000 | | | | 1,937,100 | |
| | | | | | | | |
Gas Utilities Total | | | | | | | 2,612,858 | |
|
| Independent Power Producers & Energy Traders – 0.1% | |
AES Corp. (a) | | | 186,305 | | | | 2,304,593 | |
Constellation Energy Group, Inc. | | | 56,237 | | | | 1,747,284 | |
NRG Energy, Inc. (a) | | | 69,550 | | | | 1,390,304 | |
| | | | | | | | |
Independent Power Producers & Energy Traders Total | | | | | | | 5,442,181 | |
| | |
| Multi-Utilities – 1.2% | | | | | | | | |
Ameren Corp. | | | 67,467 | | | | 1,886,377 | |
CenterPoint Energy, Inc. | | | 119,039 | | | | 1,887,958 | |
CMS Energy Corp. | | | 68,775 | | | | 1,324,606 | |
Consolidated Edison, Inc. | | | 81,721 | | | | 4,084,416 | |
Dominion Resources, Inc. | | | 163,350 | | | | 7,453,660 | |
DTE Energy Co. | | | 47,574 | | | | 2,239,784 | |
Integrys Energy Group, Inc. | | | 21,785 | | | | 1,066,811 | |
NiSource, Inc. | | | 78,293 | | | | 1,500,094 | |
PG&E Corp. | | | 110,370 | | | | 5,083,642 | |
Public Service Enterprise
Group, Inc. | | | 142,398 | | | | 4,656,415 | |
SCANA Corp. | | | 31,868 | | | | 1,290,017 | |
Sempra Energy | | | 67,546 | | | | 3,595,474 | |
TECO Energy, Inc. | | | 60,473 | | | | 1,095,166 | |
Wisconsin Energy Corp. | | | 32,878 | | | | 1,946,378 | |
Xcel Energy, Inc. | | | 129,471 | | | | 3,099,536 | |
| | | | | | | | |
Multi-Utilities Total | | | | | | | 42,210,334 | |
| | | | | | | | |
Utilities Total | | | | | | | 107,988,514 | |
| | | | | | | | |
Total Common Stocks
(cost of $2,561,377,926) | | | | | | | 3,406,045,279 | |
| | |
Short-Term Obligation – 1.3% | | | | | | | | |
Repurchase agreement with Fixed Income Clearing Corp., dated 02/28/11, due 03/01/11 at 0.090%, collateralized by U.S. Government Agency obligations with various maturities to 01/15/14, market value $47,053,650 (repurchase proceeds $46,131,115) | | | 46,131,000 | | | | 46,131,000 | |
| | | | | | | | |
Total Short-Term Obligation
(cost of $46,131,000) | | | | 46,131,000 | |
| | | | | | | | |
| | | | | | |
| | | | | Value ($) | |
Total Investments – 100.4%
(cost of $2,607,508,926) (d) | | | 3,452,176,279 | |
| | | | | | |
Other Assets & Liabilities, Net – (0.4)% | | | (14,109,277 | ) |
| | | | | | |
Net Assets – 100.0% | | | 3,438,067,002 | |
Notes to Investment Portfolio:
| (a) | Non-income producing security. |
| (b) | A portion of these securities with a market value of $32,238,850 are pledged as collateral for open futures contracts. |
| (c) | Investments in affiliates during the year ended February 28, 2011: |
| | | | | | | | | | | | | | | | | | | | |
Affiliate | | Value,
beginning of
period | | | Purchases | | | Sales
Proceeds | | | Dividend
Income | | | Value,
end of
period | |
Ameriprise Financial, Inc. | | $ | — | | | $ | 238,242 | | | $ | 94,601 | | | $ | 49,168 | | | $ | 4,418,216 | |
|
| As of May 1, 2010, this company became an affiliate of the fund. The above table reflects activity for the period from May 1, 2010 through February 28, 2011. | |
| | | | | |
Bank of America Corp. | | $ | 43,612,831 | | | $ | 393,237 | | | $ | — | | | $ | 26,178 | | | $ | — | |
|
| As of May 1, 2010, this company was no longer an affiliate of the fund. The above table reflects activity for the period from March 1, 2010 through April 30, 2010. | |
| (d) | Cost for federal income tax purposes is $2,649,492,871. |
Generally accepted accounting principles (GAAP) require disclosure regarding the inputs and valuation techniques used to measure fair value and any changes in valuation inputs or techniques. In addition, investments shall be disclosed by major category.
The Fund categorizes its fair value measurements according to a three-level hierarchy that maximizes the use of observable inputs and minimizes the use of unobservable inputs by prioritizing that the most observable input be used when available. Observable inputs are those that market participants would use in pricing an investment based on market data obtained from sources independent of the reporting entity. Unobservable inputs are those that reflect the Fund’s assumptions about the information market participants would use in pricing an investment. An investment’s level within the fair value hierarchy is based on the lowest level of any input that is deemed significant to the asset or liability’s fair value measurement. The input levels are not necessarily an indication of the risk or liquidity associated with investments at that level. For example, certain U.S. government securities are generally high quality and liquid, however, they are reflected as Level 2 because the inputs used to determine fair value may not always be quoted prices in an active market.
Fair value inputs are summarized in the three broad levels listed below:
| • | | Level 1 — Valuations based on quoted prices for investments in active markets that the Fund has the ability to access at the measurement date (including NAV for open-end mutual funds). Valuation adjustments are not applied to Level 1 investments. |
| • | | Level 2 — Valuations based on other significant observable inputs (including quoted prices for similar securities, interest rates, prepayment speeds, credit risks, etc.). |
| • | | Level 3 — Valuations based on significant unobservable inputs (including the Fund’s own assumptions and judgment in determining the fair value of investments). |
Inputs that are used in determining fair value of an investment may include price information, credit data, volatility statistics, and other factors. These inputs can be either observable or unobservable. The availability of observable inputs can vary between investments, and is affected by various factors such as the type of investment, and the volume and level of activity for that investment or similar investments in the marketplace. The inputs will be considered by the Investment Manager, along with any other relevant factors in the calculation of an
See Accompanying Notes to Financial Statements.
15
Columbia Large Cap Index Fund
February 28, 2011
investment’s fair value. The Fund uses prices and inputs that are current as of the measurement date, which may include periods of market dislocations. During these periods, the availability of prices and inputs may be reduced for many investments. This condition could cause an investment to be reclassified between the various levels within the hierarchy. Non-U.S. equity securities actively traded in foreign markets may be reflected in Level 2 despite the availability of closing prices, because the Fund evaluates and determines whether those closing prices reflect fair value at the close of the New York Stock Exchange (NYSE) or require adjustment, as described in Note 2 to the financial statements — Security Valuation.
Investments falling into the Level 3 category are primarily supported by quoted prices from brokers and dealers participating in the market for those investments. However, these may be classified as Level 3 investments due to lack of market transparency and corroboration to support these quoted prices. Additionally, valuation models may be used as the pricing source for any remaining investments classified as Level 3. These models rely on one or more significant unobservable inputs and/or significant assumptions by the Investment Manager. Inputs used in valuations may include, but are not limited to, financial statement analysis, capital account balances, discount rates and estimated cash flows, and comparable company data.
The following table is a summary of the inputs used to value the Fund’s investments as of February 28, 2011:
| | | | | | | | | | | | | | | | |
Description | | Quoted Prices
(Level 1) | | | Other
Significant
Observable
Inputs
(Level 2) | | | Significant
Unobservable
Inputs
(Level 3) | | | Total | |
Total Common Stocks | | $ | 3,406,045,279 | | | $ | — | | | $ | — | | | $ | 3,406,045,279 | |
| | | | | | | | | | | | | | | | |
Total Short-Term Obligation | | | — | | | | 46,131,000 | | | | — | | | | 46,131,000 | |
| | | | | | | | | | | | | | | | |
Total Investments | | | 3,406,045,279 | | | | 46,131,000 | | | | — | | | | 3,452,176,279 | |
| | | | | | | | | | | | | | | | |
Unrealized Appreciation of Futures Contracts | | | 252,991 | | | | — | | | | — | | | | 252,991 | |
| | | | | | | | | | | | | | | | |
Total | | $ | 3,406,298,270 | | | $ | 46,131,000 | | | $ | — | | | $ | 3,452,429,270 | |
| | | | | | | | | | | | | | | | |
The Fund’s assets assigned to the Level 2 input category represent certain short-term obligations which are valued using amortized cost, an income approach which converts future cash flows to a present value based upon the discount or premium at purchase.
There were no significant transfers of financial assets between Levels 1 and 2 during the period.
At February 28, 2011, the Fund held the following open long futures contracts:
| | | | | | | | | | | | | | | | | | | | |
Risk
Exposure/
Type | | Number of
Contracts | | | Value | | | Aggregate
Face Value | | | Expiration
Date | | | Unrealized
Appreciation | |
Equity Risk | | | | | | | | | | | | | | | | | | | | |
S&P 500 Index | | | 102 | | | $ | 33,815,550 | | | $ | 33,562,559 | | | | Mar-2011 | | | $ | 252,991 | |
| | | | | | | | | | | | | | | | | | | | |
At February 28, 2011, the Fund held investments in the following sectors:
| | | | |
Sector (Unaudited) | | % of
Net Assets | |
Information Technology | | | 18.5 | |
Financials | | | 15.9 | |
Energy | | | 13.0 | |
Industrials | | | 11.0 | |
Health Care | | | 10.7 | |
Consumer Discretionary | | | 10.4 | |
Consumer Staples | | | 10.0 | |
Materials | | | 3.6 | |
Utilities | | | 3.1 | |
Telecommunication Services | | | 2.9 | |
| | | | |
| | | 99.1 | |
Short-Term Obligation | | | 1.3 | |
Other Assets & Liabilities, Net | | | (0.4 | ) |
| | | | |
| | | 100.0 | |
| | | | |
See Accompanying Notes to Financial Statements.
16
Statement of Assets and Liabilities – Columbia Large Cap Index Fund
February 28, 2011
| | | | | | |
| | | | | ($) | |
| Assets | | Unaffiliated investments, at identified cost | | | 2,605,699,943 | |
| | Affiliated investments, at identified cost | | | 1,808,983 | |
| | | | | | |
| | Total investments, at identified cost | | | 2,607,508,926 | |
| | |
| | Unaffiliated investments, at value | | | 3,447,758,063 | |
| | Affiliated investments, at value | | | 4,418,216 | |
| | | | | | |
| | Total investments, at value | | | 3,452,176,279 | |
| | |
| | Cash | | | 10,198 | |
| | Receivable for: | | | | |
| | Fund shares sold | | | 4,228,570 | |
| | Dividends | | | 7,047,057 | |
| | Interest | | | 115 | |
| | Futures variation margin | | | 294,104 | |
| | Foreign tax reclaims | | | 1,981 | |
| | Expense reimbursement due from Investment Manager | | | 187,130 | |
| | Trustees’ deferred compensation plan | | | 10,602 | |
| | | | | | |
| | Total assets | | | 3,463,956,036 | |
| | |
| Liabilities | | Payable for: | | | | |
| | Investments purchased | | | 9,971,162 | |
| | Fund shares repurchased | | | 15,226,930 | |
| | Investment advisory fee | | | 262,832 | |
| | Administration fee | | | 262,833 | |
| | Trustees’ fees | | | 76,858 | |
| | Distribution and service fees | | | 75,671 | |
| | Trustees’ deferred compensation plan | | | 10,602 | |
| | Other liabilities | | | 2,146 | |
| | | | | | |
| | Total liabilities | | | 25,889,034 | |
| | |
| | | | | | |
| | Net Assets | | | 3,438,067,002 | |
| | |
| Net Assets Consist of | | Paid-in capital | | | 2,786,984,738 | |
| | Undistributed net investment income | | | 9,437,867 | |
| | Accumulated net realized loss | | | (203,275,947 | ) |
| | Net unrealized appreciation (depreciation) on: | | | | |
| | Investments | | | 844,667,353 | |
| | Futures contracts | | | 252,991 | |
| | | | | | |
| | Net Assets | | | 3,438,067,002 | |
See Accompanying Notes to Financial Statements.
17
Statement of Assets and Liabilities (continued) – Columbia Large Cap Index Fund
February 28, 2011
| | | | | | |
| | | | | | |
| Class A | | Net assets | | $ | 383,538,021 | |
| | Shares outstanding | | | 14,969,026 | |
| | Net asset value and offering price per share | | $ | 25.62 | |
| | |
| Class B | | Net assets | | $ | 3,549,608 | |
| | Shares outstanding | | | 138,139 | |
| | Net asset value and offering price per share (a) | | $ | 25.70 | |
| | |
| Class Z | | Net assets | | $ | 3,050,979,373 | |
| | Shares outstanding | | | 118,632,276 | |
| | Net asset value and offering price per share | | $ | 25.72 | |
| (a) | Redemption price per share is equal to net asset value less any applicable contingent deferred sales charge. |
See Accompanying Notes to Financial Statements.
18
Statement of Operations – Columbia Large Cap Index Fund
For the Year Ended February 28, 2011
| | | | | | |
| | | | | ($) | |
| Investment Income | | Dividends | | | 58,717,984 | |
| | Dividends from affiliates | | | 75,346 | |
| | Interest | | | 83,857 | |
| | Foreign taxes withheld | | | (1,485 | ) |
| | | | | | |
| | Total Investment Income | | | 58,875,702 | |
| | |
| Expenses | | Investment advisory fee | | | 2,912,275 | |
| | Administration fee | | | 2,912,268 | |
| | Distribution fee: | | | | |
| | Class B | | | 26,341 | |
| | Service fee: | | | | |
| | Class B | | | 8,781 | |
| | Distribution and service fees: | | | | |
| | Class A | | | 801,720 | |
| | Trustees’ fees | | | 64,596 | |
| | Other expenses | | | 13,077 | |
| | | | | | |
| | Total Expenses | | | 6,739,058 | |
| | Fees waived or expenses reimbursed by Investment Manager | | | (1,826,690 | ) |
| | | | | | |
| | Net Expenses | | | 4,912,368 | |
| | |
| | | | | | |
| | Net Investment Income | | | 53,963,334 | |
| | |
| Net Realized and Unrealized Gain (Loss) on Investments and Futures Contracts | | Net realized gain on: | | | | |
| | Unaffiliated investments | | | 12,035,244 | |
| | Affiliated investments | | | 25,121 | |
| | Futures contracts | | | 14,121,249 | |
| | | | | | |
| | Net realized gain | | | 26,181,614 | |
| | |
| | Net change in unrealized appreciation (depreciation) on: | | | | |
| | Investments | | | 537,588,842 | |
| | Futures contracts | | | (498,424 | ) |
| | | | | | |
| | Net change in unrealized appreciation (depreciation) | | | 537,090,418 | |
| | | | | | |
| | Net Gain | | | 563,272,032 | |
| | |
| | | | | | |
| | Net Increase Resulting from Operations | | | 617,235,366 | |
See Accompanying Notes to Financial Statements.
19
Statement of Changes in Net Assets – Columbia Large Cap Index Fund
| | | | | | | | | | |
| Increase (Decrease) in Net Assets | | | | Year Ended
February 28,
2011 ($) | | | Year Ended
February 28,
2010 ($) | |
| Operations | | Net investment income | | | 53,963,334 | | | | 44,112,683 | |
| | Net realized gain on investments and futures contracts | | | 26,181,614 | | | | 21,641,534 | |
| | Net change in unrealized appreciation (depreciation) on investments and futures contracts | | | 537,090,418 | | | | 789,038,856 | |
| | | | | | | | | | |
| | Net increase resulting from operations | | | 617,235,366 | | | | 854,793,073 | |
| | | |
| Distributions to Shareholders | | From net investment income: | | | | | | | | |
| | Class A | | | (5,104,698 | ) | | | (3,217,527 | ) |
| | Class B | | | (27,404 | ) | | | (37,629 | ) |
| | Class Z | | | (46,637,026 | ) | | | (40,838,070 | ) |
| | | | | | | | | | |
| | Total distributions to shareholders | | | (51,769,128 | ) | | | (44,093,226 | ) |
| | | |
| | Net Capital Stock Transactions | | | 187,980,533 | | | | 409,998,244 | |
| | Increase from regulatory settlements | | | — | | | | 22 | |
| | | | | | | | | | |
| | Total increase in net assets | | | 753,446,771 | | | | 1,220,698,113 | |
| | | |
| Net Assets | | Beginning of period | | | 2,684,620,231 | | | | 1,463,922,118 | |
| | End of period | | | 3,438,067,002 | | | | 2,684,620,231 | |
| | Undistributed net investment income at end of period | | | 9,437,867 | | | | 7,341,066 | |
See Accompanying Notes to Financial Statements.
20
Statement of Changes in Net Assets (continued) – Columbia Large Cap Index Fund
| | | | | | | | | | | | | | | | |
| | | Capital Stock Activity | |
| | | Year Ended
February 28, 2011 | | | Year Ended
February 28, 2010 | |
| | | Shares | | | Dollars ($) | | | Shares | | | Dollars ($) | |
Class A | | | | | | | | | | | | | | | | |
Subscriptions | | | 6,146,842 | | | | 138,848,361 | | | | 8,157,569 | | | | 157,125,207 | |
Distributions reinvested | | | 208,778 | | | | 4,905,111 | | | | 154,936 | | | | 3,183,979 | |
Redemptions | | | (3,973,822 | ) | | | (90,572,054 | ) | | | (2,876,267 | ) | | | (55,850,989 | ) |
| | | | | | | | | | | | | | | | |
Net increase | | | 2,381,798 | | | | 53,181,418 | | | | 5,436,238 | | | | 104,458,197 | |
| | | | |
Class B | | | | | | | | | | | | | | | | |
Subscriptions | | | 430 | | | | 10,306 | | | | 889 | | | | 15,369 | |
Distributions reinvested | | | 659 | | | | 15,333 | | | | 1,679 | | | | 34,166 | |
Redemptions | | | (39,316 | ) | | | (888,886 | ) | | | (54,899 | ) | | | (1,026,820 | ) |
| | | | | | | | | | | | | | | | |
Net decrease | | | (38,227 | ) | | | (863,247 | ) | | | (52,331 | ) | | | (977,285 | ) |
| | | | |
Class Z | | | | | | | | | | | | | | | | |
Subscriptions | | | 26,840,621 | | | | 617,637,630 | | | | 38,391,355 | | | | 702,045,640 | |
Distributions reinvested | | | 1,574,843 | | | | 37,130,261 | | | | 1,549,157 | | | | 31,776,881 | |
Redemptions | | | (22,669,871 | ) | | | (519,105,529 | ) | | | (22,900,844 | ) | | | (427,305,189 | ) |
| | | | | | | | | | | | | | | | |
Net increase | | | 5,745,593 | | | | 135,662,362 | | | | 17,039,668 | | | | 306,517,332 | |
See Accompanying Notes to Financial Statements.
21
Financial Highlights – Columbia Large Cap Index Fund
Selected data for a share outstanding throughout each period is as follows:
| | | | | | | | | | | | | | | | | | | | | | | | |
| | | Year Ended February 28, | | | Year Ended
February 29, | | | Period Ended
February 28, | | | Year Ended
March 31, | |
| Class A Shares | | 2011 | | | 2010 | | | 2009 | | | 2008 | | | 2007 (a) | | | 2006 (b) | |
Net Asset Value, Beginning of Period | | $ | 21.30 | | | $ | 14.14 | | | $ | 25.64 | | | $ | 27.08 | | | $ | 24.97 | | | $ | 22.67 | |
| | | | | | |
Income from Investment Operations: | | | | | | | | | | | | | | | | | | | | | | | | |
Net investment income (c) | | | 0.37 | | | | 0.34 | | | | 0.45 | | | | 0.47 | | | | 0.39 | | | | 0.36 | |
Net realized and unrealized gain (loss) on investments and futures contracts | | | 4.30 | | | | 7.15 | | | | (11.54 | ) | | | (1.49 | ) | | | 2.14 | | | | 2.19 | |
| | | | | | | | | | | | | | | | | | | | | | | | |
Total from investment operations | | | 4.67 | | | | 7.49 | | | | (11.09 | ) | | | (1.02 | ) | | | 2.53 | | | | 2.55 | |
| | | | | | |
Less Distributions to Shareholders: | | | | | | | | | | | | | | | | | | | | | | | | |
From net investment income | | | (0.35 | ) | | | (0.33 | ) | | | (0.41 | ) | | | (0.42 | ) | | | (0.42 | ) | | | (0.25 | ) |
| | | | | | |
Increase from regulatory settlements | | | — | | | | — | (d) | | | — | | | | — | | | | — | | | | — | |
| | | | | | |
Net Asset Value, End of Period | | $ | 25.62 | | | $ | 21.30 | | | $ | 14.14 | | | $ | 25.64 | | | $ | 27.08 | | | $ | 24.97 | |
Total return (e)(f) | | | 22.09 | % | | | 53.09 | % | | | (43.51 | )% | | | (3.92 | )% | | | 10.20 | %(g) | | | 11.27 | % |
| | | | |
Ratios to Average Net Assets/Supplemental Data: | | | | | | | | | | | | | | | | | |
Net expenses before interest expense | | | 0.39 | % | | | 0.39 | % | | | 0.39 | %(h) | | | 0.39 | % | | | 0.39 | %(i) | | | 0.39 | %(h) |
Interest expense | | | — | | | | — | %(j) | | | — | | | | — | | | | — | | | | — | %(j) |
Net expenses | | | 0.39 | % | | | 0.39 | % | | | 0.39 | %(h) | | | 0.39 | % | | | 0.39 | %(i) | | | 0.39 | %(h) |
Waiver/Reimbursement | | | 0.06 | % | | | 0.06 | % | | | 0.06 | % | | | 0.06 | % | | | 0.06 | %(i) | | | 0.14 | %(k) |
Net investment income | | | 1.64 | % | | | 1.75 | % | | | 2.09 | %(h) | | | 1.67 | % | | | 1.63 | %(i) | | | 1.53 | %(h) |
Portfolio turnover rate | | | 2 | % | | | 7 | % | | | 5 | % | | | 6 | % | | | 7 | %(g) | | | 12 | % |
Net assets, end of period (000s) | | $ | 383,538 | | | $ | 268,091 | | | $ | 101,119 | | | $ | 138,795 | | | $ | 87,528 | | | $ | 70,808 | |
(a) The Fund changed its fiscal year end from March 31 to February 28. Per share data and total return reflect activity from April 1, 2006 through February 28, 2007.
| (b) | On August 22, 2005, the existing Investor A shares were renamed Class A shares. |
| (c) | Per share data was calculated using the average shares outstanding during the period. |
| (d) | Rounds to less than $0.01 per share. |
| (e) | Total return at net asset value assuming all distributions reinvested. |
(f) Had the Investment Manager and/or any of its affiliates not waived fees or reimbursed a portion of expenses, total return would have been reduced.
| (h) | The benefits derived from expense reductions had an impact of less than 0.01%. |
| (j) | Rounds to less than 0.01%. |
(k) Bank of America Corporation assumed certain non-recurring costs. Absent these non-recurring costs, the waiver/reimbursement ratio would have been 0.08%.
See Accompanying Notes to Financial Statements.
22
Financial Highlights – Columbia Large Cap Index Fund
Selected data for a share outstanding throughout each period is as follows:
| | | | | | | | | | | | | | | | | | | | | | | | |
| | | Year Ended February 28, | | | Year Ended
February 29, | | | Period Ended
February 28, | | | Year Ended
March 31, | |
| Class B Shares | | 2011 | | | 2010 | | | 2009 | | | 2008 | | | 2007 (a) | | | 2006 (b) | |
Net Asset Value, Beginning of Period | | $ | 21.37 | | | $ | 14.20 | | | $ | 25.70 | | | $ | 27.14 | | | $ | 25.06 | | | $ | 23.49 | |
| | | | | | |
Income from Investment Operations: | | | | | | | | | | | | | | | | | | | | | | | | |
Net investment income (c) | | | 0.20 | | | | 0.19 | | | | 0.28 | | | | 0.24 | | | | 0.20 | | | | 0.10 | |
Net realized and unrealized gain (loss) on investments and futures contracts | | | 4.32 | | | | 7.18 | | | | (11.53 | ) | | | (1.48 | ) | | | 2.16 | | | | 1.55 | |
| | | | | | | | | | | | | | | | | | | | | | | | |
Total from investment operations | | | 4.52 | | | | 7.37 | | | | (11.25 | ) | | | (1.24 | ) | | | 2.36 | | | | 1.65 | |
| | | | | | |
Less Distributions to Shareholders: | | | | | | | | | | | | | | | | | | | | | | | | |
From net investment income | | | (0.19 | ) | | | (0.20 | ) | | | (0.25 | ) | | | (0.20 | ) | | | (0.28 | ) | | | (0.08 | ) |
| | | | | | |
Increase from regulatory settlements | | | — | | | | — | (d) | | | — | | | | — | | | | — | | | | — | |
| | | | | | |
Net Asset Value, End of Period | | $ | 25.70 | | | $ | 21.37 | | | $ | 14.20 | | | $ | 25.70 | | | $ | 27.14 | | | $ | 25.06 | |
Total return (e)(f) | | | 21.22 | % | | | 51.94 | % | | | (43.94 | )% | | | (4.63 | )% | | | 9.47 | %(g) | | | 7.01 | %(g) |
|
Ratios to Average Net Assets/Supplemental Data: | |
Net expenses before interest expense | | | 1.14 | % | | | 1.14 | % | | | 1.14 | %(h) | | | 1.14 | % | | | 1.14 | %(i) | | | 1.14 | %(h)(i) |
Interest expense | | | — | | | | — | %(j) | | | — | | | | — | | | | — | | | | — | %(j) |
Net expenses | | | 1.14 | % | | | 1.14 | % | | | 1.14 | %(h) | | | 1.14 | % | | | 1.14 | %(i) | | | 1.14 | %(h)(i) |
Waiver/Reimbursement | | | 0.06 | % | | | 0.06 | % | | | 0.06 | % | | | 0.06 | % | | | 0.06 | %(i) | | | 0.12 | %(i)(k) |
Net investment income | | | 0.87 | % | | | 1.01 | % | | | 1.28 | %(h) | | | 0.86 | % | | | 0.87 | %(i) | | | 0.85 | %(h)(i) |
Portfolio turnover rate | | | 2 | % | | | 7 | % | | | 5 | % | | | 6 | % | | | 7 | %(g) | | | 12 | %(g) |
Net assets, end of period (000s) | | $ | 3,550 | | | $ | 3,769 | | | $ | 3,248 | | | $ | 7,836 | | | $ | 10,302 | | | $ | 12,071 | |
| (a) | The Fund changed its fiscal year end from March 31 to February 28. Per share data and total return reflect activity from April 1, 2006 through February 28, 2007. |
| (b) | Class B shares commenced operations on September 23, 2005. Per share data and total return reflect activity from that date. |
| (c) | Per share data was calculated using the average shares outstanding during the period. |
| (d) | Rounds to less than $0.01 per share. |
| (e) | Total return at net asset value assuming all distributions reinvested and no contingent deferred sales charge. |
| (f) | Had the Investment Manager and/or any of its affiliates not waived fees or reimbursed a portion of expenses, total return would have been reduced. |
| (h) | The benefits derived from expense reductions had an impact of less than 0.01%. |
| (j) | Rounds to less than 0.01%. |
| (k) | Bank of America Corporation assumed certain non-recurring costs. Absent these non-recurring costs, the waiver/reimbursement ratio would have been 0.06%. |
See Accompanying Notes to Financial Statements.
23
Financial Highlights – Columbia Large Cap Index Fund
Selected data for a share outstanding throughout each period is as follows:
| | | | | | | | | | | | | | | | | | | | | | | | |
| | | Year Ended February 28, | | | Year Ended
February 29, | | | Period Ended
February 28, | | | Year Ended
March 31, | |
| Class Z Shares | | 2011 | | | 2010 | | | 2009 | | | 2008 | | | 2007 (a) | | | 2006 (b) | |
Net Asset Value, Beginning of Period | | $ | 21.37 | | | $ | 14.18 | | | $ | 25.79 | | | $ | 27.29 | | | $ | 25.15 | | | $ | 22.82 | |
| | | |
Income from Investment Operations: | | | | | | | | | | | | | |
Net investment income (c) | | | 0.43 | | | | 0.38 | | | | 0.51 | | | | 0.53 | | | | 0.45 | | | | 0.42 | |
Net realized and unrealized gain (loss) on investments and futures contracts | | | 4.33 | | | | 7.19 | | | | (11.59 | ) | | | (1.49 | ) | | | 2.16 | | | | 2.22 | |
| | | | | | | | | | | | | | | | | | | | | | | | |
Total from investment operations | | | 4.76 | | | | 7.57 | | | | (11.08 | ) | | | (0.96 | ) | | | 2.61 | | | | 2.64 | |
| | | |
Less Distributions to Shareholders: | | | | | | | | | | | | | |
From net investment income | | | (0.41 | ) | | | (0.38 | ) | | | (0.53 | ) | | | (0.54 | ) | | | (0.47 | ) | | | (0.31 | ) |
| | | | | | |
Increase from regulatory settlements | | | — | | | | — | (d) | | | — | | | | — | | | | — | | | | — | |
| | | | | | |
Net Asset Value, End of Period | | $ | 25.72 | | | $ | 21.37 | | | $ | 14.18 | | | $ | 25.79 | | | $ | 27.29 | | | $ | 25.15 | |
Total return (e)(f) | | | 22.44 | % | | | 53.49 | % | | | (43.37 | )% | | | (3.72 | )% | | | 10.44 | %(g) | | | 11.59 | % |
|
Ratios to Average Net Assets/Supplemental Data: | |
Net expenses before interest expense | | | 0.14 | % | | | 0.14 | % | | | 0.14 | %(h) | | | 0.14 | % | | | 0.14 | %(i) | | | 0.14 | %(h) |
Interest expense | | | — | | | | — | %(j) | | | — | | | | — | | | | — | | | | — | %(j) |
Net expenses | | | 0.14 | % | | | 0.14 | % | | | 0.14 | %(h) | | | 0.14 | % | | | 0.14 | %(i) | | | 0.14 | %(h) |
Waiver/Reimbursement | | | 0.06 | % | | | 0.06 | % | | | 0.06 | % | | | 0.06 | % | | | 0.06 | %(i) | | | 0.14 | %(k) |
Net investment income | | | 1.88 | % | | | 2.00 | % | | | 2.31 | %(h) | | | 1.87 | % | | | 1.87 | %(i) | | | 1.78 | %(h) |
Portfolio turnover rate | | | 2 | % | | | 7 | % | | | 5 | % | | | 6 | % | | | 7 | %(g) | | | 12 | % |
Net assets, end of period (000s) | | $ | 3,050,979 | | | $ | 2,412,760 | | | $ | 1,359,555 | | | $ | 2,358,122 | | | $ | 2,571,196 | | | $ | 2,367,063 | |
| (a) | The Fund changed its fiscal year end from March 31 to February 28. Per share data and total return reflect activity from April 1, 2006 through February 28, 2007. |
| (b) | On August 22, 2005, the existing Primary A shares were renamed Class Z shares. |
| (c) | Per share data was calculated using the average shares outstanding during the period. |
| (d) | Rounds to less than $0.01 per share. |
| (e) | Total return at net asset value assuming all distributions reinvested. |
| (f) | Had the Investment Manager and/or any of its affiliates not waived fees or reimbursed a portion of expenses, total return would have been reduced. |
| (h) | The benefits derived from expense reductions had an impact of less than 0.01%. |
| (j) | Rounds to less than 0.01%. |
| (k) | Bank of America Corporation assumed certain non-recurring costs. Absent these non-recurring costs, the waiver/reimbursement ratio would have been 0.08%. |
See Accompanying Notes to Financial Statements.
24
Notes to Financial Statements – Columbia Large Cap Index Fund
February 28, 2011
Note 1. Organization
Columbia Large Cap Index Fund (the Fund), a series of Columbia Funds Series Trust (the Trust), is a diversified fund. The Trust is registered under the Investment Company Act of 1940, as amended (the 1940 Act), as an open-end management investment company organized as a Delaware statutory trust.
Investment Objective
The Fund seeks total return before fees and expenses that corresponds to the total return of the Standard & Poor’s 500 Index.
Fund Shares
The Trust has unlimited authorized shares of beneficial interest. The Fund offers Class A, Class B and Class Z shares. All share classes have identical voting, dividend and liquidation rights. Each share class has its own expense structure and sales charges, as applicable.
Class A shares are not subject to sales charges.
The Fund no longer accepts investments by new or existing investors in the Fund’s Class B shares, except in connection with the reinvestment of any dividend and/or capital gain distributions in Class B shares of the Fund and exchanges by existing Class B shareholders of certain other funds within the Columbia Family of Funds. Class B shares are subject to a maximum contingent deferred sales charge (CDSC) of 5.00% based upon the holding period after purchase. Class B shares will generally convert to Class A shares eight years after purchase.
Class Z shares are not subject to sales charges and are available only to certain investors, as described in the Fund’s prospectus.
Note 2. Summary of Significant Accounting Policies
The preparation of financial statements in accordance with U.S. generally accepted accounting principles (GAAP) requires the Investment Manager to make certain estimates and assumptions that affect the reported amounts of assets and liabilities, the disclosure of contingent assets and liabilities at the date of the financial statements and the reported amounts of revenue and expenses during the reporting period. Actual results could differ from those estimates.
The following is a summary of significant accounting policies consistently followed by the Fund in the preparation of its financial statements.
Security Valuation
Equity securities, exchange-traded funds and securities of certain investment companies are valued at the last sale price on the principal exchange on which they trade, except for securities traded on the NASDAQ, which are valued at the NASDAQ official close price. Unlisted securities or listed securities for which there were no sales during the day are valued at the closing bid price on such exchanges or over-the-counter markets.
Short-term investments maturing in 60 days or less are valued at amortized cost, which approximates market value.
Futures contracts are valued at the settlement price established each day by the board of trade or exchange on which they are traded.
Investments for which market quotations are not readily available, or that have quotations which the Investment Manager believes are not reliable, are valued at fair value as determined in good faith under consistently applied procedures established by and under the general supervision of the Board of Trustees. If a security is valued at fair value, such value is likely to be different from the last quoted market price for the security. The determination of fair value often requires significant judgment. To determine fair value, the Investment Manager may use assumptions including but not limited to future cash flows and estimated risk premiums. Multiple inputs from various sources may be used to determine value.
Derivative Instruments
The Fund may use derivative instruments including futures contracts in order to meet its investment objectives. The Fund employs strategies in differing combinations to permit it to increase, decrease or change the level of exposure to market risk factors. The achievement of any strategy relating to derivatives depends on an analysis of various risk factors, and if the strategies for the use of derivatives do not work as intended, the Fund may not achieve its investment objectives.
In pursuit of its investment objectives, the Fund is exposed to the following market risk, among others:
Equity Risk: Equity risk relates to change in value of equity securities such as common stocks due to general market conditions such as real or perceived adverse economic conditions, changes in the general outlook for corporate earnings, or adverse investor sentiment. Equity securities generally have greater price volatility than fixed income securities.
25
Columbia Large Cap Index Fund
February 28, 2011
The following provides more detailed information about the derivative type held by the Fund:
Futures Contracts: The Fund entered into equity index futures contracts to equitize cash in order to maintain appropriate equity market exposure while keeping sufficient cash to accommodate daily redemptions.
The use of futures contracts involves certain risks, which include, among others: (1) imperfect correlation between the price movement of the instruments and the underlying securities, (2) inability to close out positions due to differing trading hours, or the temporary absence of a liquid market, for either the instruments or the underlying securities, and (3) an inaccurate prediction of the future direction of interest rates by the Fund’s Investment Manager. In addition, upon entering into index futures contracts, the Fund bears risks which may include securities prices moving unexpectedly, in which case, the Fund may not achieve the anticipated benefits of the futures contracts and may realize a loss.
Upon entering into a futures contract, the Fund identifies within its portfolio of investments cash or securities in an amount sufficient to meet the initial margin requirement. Subsequent payments are made or received by the Fund equal to the daily change in the contract value and are recorded as variation margin receivable or payable and offset in unrealized gains or losses. The Fund recognizes a realized gain or loss when the contract is closed or expires.
Futures contracts involve, to varying degrees, risk of loss in excess of the variation margin disclosed on the Statement of Assets and Liabilities.
During the year ended February 28, 2011, the Fund entered into 2,137 futures contracts.
Effects of Derivative Transactions in the Financial Statements
The following table is a summary of the value of the Fund’s derivative instruments as of February 28, 2011:
| | | | | | |
| Fair Value of Derivative Instruments |
| Statement of Assets and Liabilities |
| Assets | | Fair Value* | | Liabilities | | Fair Value* |
Futures
Variation
Margin | | $294,104 | | — | | $— |
| * | Includes only current day’s variation margin. |
The effect of derivative instruments on the Statement of Operations for the year ended February 28, 2011:
| | | | | | |
| | | | | | |
| | | Amount of Realized Gain or
(Loss) and Change in
Unrealized Appreciation
(Depreciation) on Derivatives
Recognized in Income | |
| Equity Risk | | Net
Realized
Gain | | Change
in Unrealized
Appreciation
(Depreciation) | |
| Futures Contracts | | $14,121,249 | | $ | (498,424 | ) |
Repurchase Agreements
The Fund may engage in repurchase agreement transactions with institutions that the Investment Manager has determined are creditworthy. The Fund, through the custodian, receives delivery of the underlying securities collateralizing a repurchase agreement. The Investment Manager is responsible for determining that the collateral is at least equal, at all times, to the value of the repurchase obligation including interest. A repurchase agreement transaction involves certain risks in the event of default or insolvency of the counterparty. These risks include possible delays in or restrictions on the Fund’s ability to dispose of the underlying securities and a possible decline in the value of the underlying securities during the period while the Fund seeks to assert its rights.
Security Transactions
Security transactions are accounted for on the trade date. Cost is determined and gains (losses) are based upon the specific identification method for both financial statement and federal income tax purposes.
Income Recognition
Interest income is recorded on the accrual basis.
Corporate actions and dividend income are recorded net of any non-reclaimable tax withholdings, on the ex-dividend date or upon receipt of ex-dividend notification in the case of certain foreign securities.
Awards from class action litigation are recorded as a reduction of cost if the Fund still owns the applicable securities on the payment date. If the Fund no longer owns the applicable securities, the proceeds are recorded as realized gains.
26
Columbia Large Cap Index Fund
February 28, 2011
The Fund receives information regarding the character of distributions received from real estate investment trusts (REITs) on an annual basis. Distributions received from REITs are allocated among dividend income, capital gain and return of capital based upon such information or based on management’s estimates if actual information has not yet been reported. Management’s estimates are subsequently adjusted when the actual character of the distributions are disclosed by the REITs which could result in a proportionate increase in returns of capital to shareholders.
Distributions received from real estate investment trusts (REITs) in excess of their income are recorded as a reduction of the cost of the related investments. If the Fund no longer owns the applicable securities, any distributions received in excess of income are recorded as realized gains.
Expenses
General expenses of the Trust are allocated to the Fund and other series of the Trust based upon relative net assets or other expense allocation methodologies determined by the nature of the expense. Expenses directly attributable to a specific class of shares are charged to that share class. Expenses directly attributable to the Fund are charged to the Fund.
Determination of Class Net Asset Value
All income, expenses (other than class-specific expenses which are charged directly to a share class, as shown in the Statement of Operations) and realized and unrealized gains (losses) are allocated to each class of the Fund on a daily basis, based on the relative net assets of each class, for purposes of determining the net asset value of each class.
Federal Income Tax Status
The Fund intends to qualify each year as a regulated investment company under Subchapter M of the Internal Revenue Code, as amended, and will distribute substantially all of its taxable income, if any, for its tax year, and as such will not be subject to federal income taxes. In addition, the Fund intends to distribute in each calendar year substantially all of its net investment income, capital gains and certain other amounts, if any, such that the Fund should not be subject to federal excise tax. Therefore, no federal income or excise tax provision is recorded.
Distributions to Shareholders
Distributions from net investment income, if any, are declared and paid semi-annually. Net realized capital gains, if any, are distributed at least annually. Income distributions and capital gain distributions are determined in accordance with federal income tax regulations which differ from GAAP.
Indemnification
In the normal course of business, the Fund enters into contracts that contain a variety of representations and warranties and which provide general indemnities. The Fund’s maximum exposure under these arrangements is unknown because this would involve future claims against the Fund. Also, under the Trust’s organizational documents and by contract, the Trustees and officers of the Trust are indemnified against certain liabilities that may arise out of actions relating to their duties to the Trust. However, based on experience, the Fund expects the risk of loss due to these representations, warranties and indemnities to be minimal.
Note 3. Fees and Compensation Paid to Affiliates
Investment Management Services Fee
After the close of business on April 30, 2010, Ameriprise Financial, Inc. (Ameriprise Financial) acquired a portion of the asset management business of Columbia Management Group, LLC (the Transaction), including the business of managing the Fund. In connection with the closing of the Transaction (the Closing), RiverSource Investments, LLC, a wholly owned subsidiary of Ameriprise Financial, became the investment manager of the Fund and changed its name to Columbia Management Investment Advisers, LLC (the Investment Manager). The Investment Manager determines which securities will be purchased, held or sold. The management fee is based on the annual rate of 0.10% of the Fund’s average daily net assets.
Prior to the Closing, Columbia Management Advisors, LLC (Columbia), an indirect, wholly owned subsidiary of Bank of America Corporation (BOA), provided investment management services to the Fund under the same fee structure.
Administration Fee
Effective upon the Closing, the Investment Manager became the administrator of the Fund and provides administrative and other services to the Fund, including services previously performed under the Pricing and Bookkeeping Oversight and Services Agreement discussed below. The administration fee is based on the annual rate of 0.10% of the Fund’s average daily net assets.
27
Columbia Large Cap Index Fund
February 28, 2011
The Investment Manager, from the administration fee it receives from the Fund, pays all operating expenses of the Fund, with the exception of brokerage fees and commissions, interest, fees and expenses of Trustees who are not officers, directors or employees of the Investment Manager or its affiliates, distribution (Rule 12b-1) and/or shareholder servicing fees and any extraordinary non-recurring expenses that may arise, including litigation.
Prior to the Closing, Columbia provided administrative services to the Fund under the same fee structure.
Pricing and Bookkeeping Fees
Prior to the Closing, the Fund entered into a Financial Reporting Services Agreement (the Financial Reporting Services Agreement) with State Street Bank and Trust Company (State Street) and Columbia pursuant to which State Street provides financial reporting services to the Fund. The Fund also entered into an Accounting Services Agreement (collectively with the Financial Reporting Services Agreement, the State Street Agreements) with State Street and Columbia pursuant to which State Street provides accounting services to the Fund. Upon the Closing, Columbia assigned and delegated its rights and obligations under the State Street Agreements to the Investment Manager. The pricing and bookkeeping fees for the Fund are paid by the Investment Manager. Effective March 28, 2011 these services are now provided under the Administrative Services Agreement discussed above.
Also prior to the Closing, the Fund entered into a Pricing and Bookkeeping Oversight and Services Agreement (the Services Agreement) with Columbia. Under the Services Agreement, Columbia provided services related to Fund expenses and the requirements of the Sarbanes-Oxley Act of 2002, and provided oversight of the accounting and financial reporting services provided by State Street. These services are now provided under the Administration Fee note discussed above.
Transfer Agent Fee
In connection with the Closing, RiverSource Service Corporation, a wholly owned subsidiary of Ameriprise Financial, became the transfer agent of the Fund and changed its name to Columbia Management Investment Services Corp. (the New Transfer Agent). The New Transfer Agent has contracted with Boston Financial Data Services (BFDS) to serve as sub-transfer agent. The transfer agent fees for the Fund are payable by the Investment Manager. The New Transfer Agent pays the fees of BFDS for services as sub-transfer agent and is not entitled to reimbursement for such fees from the Fund.
The New Transfer Agent receives reimbursement for certain out-of-pocket expenses and may also receive compensation for various shareholder services.
Prior to the Closing, Columbia Management Services, Inc., an affiliate of Columbia and an indirect, wholly owned subsidiary of BOA, provided shareholder services to the Fund and contracted with BFDS to serve as sub-transfer agent, under the same fee structure.
An annual minimum account balance fee of $20 may apply to certain accounts with a value below the Fund’s initial minimum investment requirements. The amount collected through the assessment of this fee will be paid directly to the Fund. These minimum account balance fees are recorded as part of expense reductions on the Statement of Operations. For the year ended February 28, 2011, no minimum account balance fees were charged by the Fund.
Underwriting Discounts, Distribution and Shareholder Servicing Fees
In connection with the Closing, RiverSource Fund Distributors, Inc., an indirect wholly owned subsidiary of Ameriprise Financial, became the distributor of the Fund and changed its name to Columbia Management Investment Distributors, Inc. (the New Distributor).
For the year ended February 28, 2011, net CDSC fees paid by shareholders on certain redemptions of Class B shares amounted to $879.
The Trust has adopted a shareholder servicing plan and a distribution plan for the Class B shares of the Fund and a combined distribution and shareholder servicing plan for the Class A shares of the Fund. The shareholder servicing plans permit the Fund to compensate or reimburse servicing agents for the shareholder services they have provided. The distribution plans, adopted pursuant to Rule 12b-1 under the 1940 Act, permit the Fund to compensate or reimburse the New Distributor and/or selling agents for activities or expenses primarily intended to result in the sale of the classes’ shares. Payments are made at an annual rate and paid monthly, as a percentage of average daily net assets, set from time to time by the Board of Trustees, and are charged as expenses of the Fund directly to the applicable share class. A substantial portion of the expenses incurred pursuant to these plans is paid to affiliates of the New Distributor.
28
Columbia Large Cap Index Fund
February 28, 2011
The annual rates in effect and plan limits, as a percentage of average daily net assets are as follows:
| | | | |
| | | | | |
| | | Current Rate | | Plan Limit |
| Class A Combined Distribution and Shareholder Servicing Plan | | 0.25% | | 0.25% |
| Class B Shareholder Servicing Plan | | 0.25% | | 0.25% |
| Class B Distribution Plan | | 0.75% | | 0.75% |
Prior to the Closing, Columbia Management Distributors, Inc, an affiliate of Columbia and an indirect, wholly owned subsidiary of BOA, was the principal underwriter of the Fund’s shares. There were no changes to the underwriting discount structure of the Fund or the service or distribution fee rates paid by the Fund as a result of the Transaction.
Expense Limits and Fee Waivers
Effective May 1, 2010, the Investment Manager has voluntarily agreed to reimburse a portion of the Fund’s expenses so that the Fund’s ordinary operating expenses (excluding any distribution and service fees, brokerage commissions, interest, taxes and extraordinary expenses, but including custodian charges relating to overdrafts, if any), after giving effect to any balance credits from the Fund’s custodian, do not exceed 0.14% annually of the Fund’s average daily net assets. Prior to May 1, 2010, Columbia voluntarily reimbursed a portion of the Fund’s expenses in the same manner.
Effective April 30, 2011, the Investment Manager and certain affiliates have contractually agreed to waive fees or reimburse expenses through June 30, 2012, so that the Fund’s ordinary operating expenses (excluding certain expenses, such as transaction costs and brokerage commissions, interest, taxes, acquired fund fees and expenses, and extraordinary expenses, if any), after giving effect to any balance credits or overdraft charges from the Fund’s custodian, do not exceed the annual rates of 0.42%, 1.17% and 0.17% of the Fund’s average daily net assets attributable to Class A, Class B and Class Z shares, respectively. This expense arrangement is made pursuant to a fee waiver and expense cap agreement that my be modified or amended only with the approval from all parties to such arrangements, including the Fund and the Investment Manager.
The Investment Manager is entitled to recover from the Fund any fees waived and/or expenses reimbursed for a three year period following the date of such fee waiver and/or reimbursement if such recovery does not cause the Fund’s expenses to exceed the expense limitations in effect at the time of recovery. Prior to May 1, 2010, Columbia was entitled to recover fees waived and/or expenses reimbursed from the Fund in the same manner.
At February 28, 2011, the amounts potentially recoverable by the Investment Manager pursuant to this arrangement were as follows:
| | | | | | | | | | | | | | | | | | | | |
| Amount of potential recovery expiring: | | | Total
potential | | | Amount Expired | | | Amount
recovered
during the year
ended | |
| 2/28/2014 | | 2/28/2013 | | | 2/29/2012 | | | recovery | | | 02/28/11 | | | 02/28/11 | |
| $1,826,690 | | $ | 1,389,496 | | | $ | 1,330,267 | | | $ | 4,546,453 | | | $ | 1,647,710 | | | $ | — | |
Fees Paid to Officers and Trustees
Upon the Closing, all officers of the Fund are employees of the Investment Manager or its affiliates and, with the exception of the Fund’s Chief Compliance Officer, receive no compensation from the Fund. The Board of Trustees has appointed a Chief Compliance Officer to the Fund in accordance with federal securities regulations. The Fund, along with other affiliated funds, pays its pro-rata share of the expenses associated with the Chief Compliance Officer. The Fund’s expenses for the Chief Compliance Officer will not exceed $15,000 per year. Prior to the Closing, all officers of the Fund were employees of Columbia or its affiliates and the Fund paid its pro-rata share of the expenses for the Chief Compliance Officer under the same fee structure.
Trustees are compensated for their services to the Fund, as set forth on the Statement of Operations. The Trust’s eligible Trustees may participate in a non-qualified deferred compensation plan which may be terminated at any time. Any payments to plan participants are paid solely out of the Fund’s assets. Income earned on the plan participant’s deferral account is based on the rate of return of the eligible mutual funds selected by the participant or, if no funds are selected, on the rate of return of Columbia Money Market Fund (formerly known as RiverSource Cash Management Fund). Prior to the Closing, if no funds were selected, income earned on the plan participant’s deferral account was based on the rate of return of BofA Treasury Reserves. Trustees’ fees deferred during the current period as well as any gains or losses on the trustees’ deferred compensation balances as a result of market fluctuations are included in “Trustees’ fees” on the Statement of Operations. Liabilities under the deferred compensation plan are included in “Trustees’ fees” on the Statement of Assets and Liabilities.
As a result of a fund merger, the Fund assumed the liabilities of the deferred compensation plan of the acquired fund, which are included in “Trustees’ fee” on the Statement of Assets and Liabilities. The
29
Columbia Large Cap Index Fund
February 28, 2011
deferred compensation plan may be terminated at any time. Any payments to plan participants are paid solely out of the Fund’s assets.
Note 4. Custody Credits
The Fund has an agreement with its custodian bank under which custody fees may be reduced by balance credits. These credits are recorded as a reduction of total expenses on the Statement of Operations. The Fund could have invested a portion of the assets utilized in connection with the expense offset arrangement in an income-producing asset if it had not entered into such an agreement.
Note 5. Portfolio Information
The cost of purchases and proceeds from sales of securities, excluding short-term obligations, aggregated $293,599,755 and $57,450,765, respectively, for the year ended February 28, 2011.
Note 6. Regulatory Settlements
During the year ended February 28, 2010, the Fund received payments totaling $22 resulting from certain regulatory settlements with third parties in which the Fund had participated. The payments have been included in “Increase from regulatory settlements” on the Statement of Changes in Net Assets.
Note 7. Shareholder Concentration
As of February 28, 2011, three shareholder accounts owned 45.4% of the outstanding shares of the Fund. Purchase and redemption activity of these accounts may have a significant effect on the operations of the Fund.
Note 8. Line of Credit
The Fund and other affiliated funds participate in a $280,000,000 committed, unsecured revolving line of credit provided by State Street. The maximum amount that may be borrowed by any fund is limited to the lesser of $200,000,000 and the Fund’s borrowing limit set forth in the Fund’s registration statement. Borrowings are available for short-term liquidity or temporary or emergency purposes.
Effective October 14, 2010, interest is charged to each participating fund based on the fund’s borrowings at a rate per annum equal to the greater of the Federal Funds Rate plus 1.25% or the overnight LIBOR Rate plus 1.25%. In addition, a commitment fee of 0.125% per annum is accrued and apportioned among the participating funds pro rata based on their relative net assets.
Prior to October 14, 2010, interest was charged to each participating fund at the same rates. In addition, a commitment fee of 0.15% per annum was accrued and apportioned among the participating funds pro rata based on their relative net assets.
For the year ended February 28, 2011, the Fund did not borrow under these arrangements.
Note 9. Federal Tax Information
The timing and character of income and capital gain distributions are determined in accordance with income tax regulations, which may differ from GAAP. Reclassifications are made to the Fund’s capital accounts for permanent tax differences to reflect income and gains available for distribution (or available capital loss carryforwards) under income tax regulations.
For the year ended February 28, 2011, permanent book and tax basis differences resulting primarily from differing treatments for non-taxable dividends and expiring capital loss carry forwards were identified and reclassified among the components of the Fund’s net assets as follows:
| | | | |
| | | | | |
Undistributed Net Investment
Income | | Accumulated Net Realized
Loss | | Paid-In Capital |
| $(97,405) | | $78,304,553 | | $(78,207,148) |
Net investment income and net realized gains (losses), as disclosed on the Statement of Operations, and net assets were not affected by this reclassification.
The tax character of distributions paid during the years ended February 28, 2011 and February 28, 2010 was as follows:
| | | | |
| | | February 28, 2011 | | February 28, 2010 |
| Distributions paid from: | | |
| Ordinary Income* | | $51,769,128 | | $44,093,226 |
| * | For tax purposes short-term capital gain distributions, if any, are considered ordinary income distributions. |
As of February 28, 2011, the components of distributable earnings on a tax basis were as follows:
| | | | |
| | | | | |
Undistributed Ordinary Income | | Undistributed Long-Term Capital Gains | | Net Unrealized Appreciation* |
| $9,418,938 | | $— | | $802,683,408 |
| * | The differences between book-basis and tax-basis net unrealized appreciation are primarily due to deferral of losses from wash sales and futures marked to market. |
30
Columbia Large Cap Index Fund
February 28, 2011
Unrealized appreciation and depreciation at February 28, 2011, based on cost of investments for federal income tax purposes were:
| | | | |
| | | | |
Unrealized appreciation | | $ | 1,158,274,919 | |
Unrealized depreciation | | $ | (355,591,511 | ) |
| | | | |
Net unrealized appreciation | | $ | 802,683,408 | |
The following capital loss carryforwards may be available to reduce taxable income arising from future net realized gains on investments, if any, to the extent permitted by the Internal Revenue Code:
| | | | |
| | | | |
| Year of Expiration | | Capital Loss Carryforwards | |
| 2013 | | $ | 19,822,029 | |
| 2014 | | | 13,154,769 | |
| 2015 | | | 108,188,982 | |
| 2017 | | | 19,873,230 | |
| | | | |
| Total | | $ | 161,039,010 | |
Capital loss carryforwards of $100,648,176 expired during the year ended February 28, 2011.
Management is required to determine whether a tax position of the Fund is more likely than not to be sustained upon examination by the applicable taxing authority, including resolution of any related appeals or litigation processes, based on the technical merits of the position. The tax benefit to be recognized by the Fund is measured as the largest amount of benefit that is greater than fifty percent likely of being realized upon ultimate settlement. Management is not aware of any tax positions for which it is reasonably possible that the total amounts of unrecognized tax benefits will significantly change in the next twelve months. However, management’s conclusions may be subject to review and adjustment at a later date based on factors including, but not limited to, new tax laws, regulations, and administrative interpretations (including relevant court decisions). The Fund’s federal tax returns for the prior three fiscal years remain subject to examination by the Internal Revenue Service.
Note 10. Subsequent Events
Management has evaluated the events and transactions that have occurred through the date the financial statements were issued. Other than as noted below, there were no items requiring adjustment of the financial statements or additional disclosure.
Effective on March 28, 2011, the Fund has entered into a revolving credit facility with a syndicate of banks led by JPMorgan Chase Bank, N.A. (the Administrative Agent). This credit facility replaced the credit facility provided by State Street. The credit facility agreement, which is a collective agreement between the Fund and certain other funds managed by the Investment Manager, severally and not jointly, permits collective borrowings up to $300 million. The borrowers shall have the right, upon written notice to the Administrative Agent, to request an increase of up to $200 million in the aggregate amount of the credit facility from new or existing lenders, provided that the aggregate amount of the credit facility shall at no time exceed $500 million. Participation in such increase by any existing lender shall be at such lender’s sole discretion. Interest is charged to each fund based on its borrowings at a rate equal to the sum of the federal funds rate plus (i) 1.25% per annum plus (ii) if one-month LIBOR exceeds the federal funds rate, the amount of such excess. Each borrowing under the credit facility matures no later than 60 days after the date of borrowing. The Fund also pays a commitment fee equal to its pro rata share of the amount of the credit facility at a rate of 0.10% per annum.
Note 11. Information Regarding Pending and Settled Legal Proceedings
In June 2004, an action captioned John E. Gallus et al. v. American Express Financial Corp. and American Express Financial Advisors Inc. was filed in the United States District Court for the District of Arizona. The plaintiffs allege that they are investors in several American Express Company (now known as RiverSource) mutual funds and they purport to bring the action derivatively on behalf of those funds under the Investment Company Act of 1940. The plaintiffs allege that fees allegedly paid to the defendants by the funds for investment advisory and administrative services are excessive. The plaintiffs seek remedies including restitution and rescission of investment advisory and distribution agreements. The plaintiffs voluntarily agreed to transfer this case to the United States District Court for the District of Minnesota (the District Court). In response to defendants’ motion to dismiss the complaint, the District Court dismissed one of plaintiffs’ four claims and granted plaintiffs limited discovery. Defendants moved for summary judgment in April 2007. Summary judgment was granted in the defendants’ favor on July 9, 2007. The plaintiffs filed a notice of appeal with the Eighth Circuit Court of Appeals (the Eighth Circuit) on August 8, 2007. On April 8, 2009, the Eighth Circuit reversed summary judgment and remanded to the District Court for further proceedings. On August 6, 2009, defendants filed a writ of certiorari with the U.S. Supreme Court (the Supreme Court), asking the Supreme Court to stay the District Court proceedings while the Supreme Court considers and rules in a case captioned Jones v. Harris Associates,
31
Columbia Large Cap Index Fund
February 28, 2011
which involves issues of law similar to those presented in the Gallus case. On March 30, 2010, the Supreme Court issued its ruling in Jones v. Harris Associates, and on April 5, 2010, the Supreme Court vacated the Eighth Circuit’s decision in the Gallus case and remanded the case to the Eighth Circuit for further consideration in light of the Supreme Court’s decision in Jones v. Harris Associates. On June 4, 2010, the Eighth Circuit remanded the Gallus case to the District Court for further consideration in light of the Supreme Court’s decision in Jones v. Harris Associates. On December 9, 2010, the District Court reinstated its July 9, 2007 summary judgment order in favor of the defendants. On January 10, 2011, plaintiffs filed a notice of appeal with the Eighth Circuit.
In December 2005, without admitting or denying the allegations, American Express Financial Corporation (AEFC, which is now known as Ameriprise Financial, Inc. (Ameriprise Financial)), entered into settlement agreements with the Securities and Exchange Commission (SEC) and Minnesota Department of Commerce (MDOC) related to market timing activities. As a result, AEFC was censured and ordered to cease and desist from committing or causing any violations of certain provisions of the Investment Advisers Act of 1940, the Investment Company Act of 1940, and various Minnesota laws. AEFC agreed to pay disgorgement of $10 million and civil money penalties of $7 million. AEFC also agreed to retain an independent distribution consultant to assist in developing a plan for distribution of all disgorgement and civil penalties ordered by the SEC in accordance with various undertakings detailed at http://www.sec.gov/litigation/admin/ia-2451.pdf. Ameriprise Financial and its affiliates have cooperated with the SEC and the MDOC in these legal proceedings, and have made regular reports to the funds’ Boards of Directors/Trustees.
Ameriprise Financial and certain of its affiliates have historically been involved in a number of legal, arbitration and regulatory proceedings, including routine litigation, class actions, and governmental actions, concerning matters arising in connection with the conduct of their business activities. Ameriprise Financial believes that the Funds are not currently the subject of, and that neither Ameriprise Financial nor any of its affiliates are the subject of, any pending legal, arbitration or regulatory proceedings that are likely to have a material adverse effect on the Funds or the ability of Ameriprise Financial or its affiliates to perform under their contracts with the Funds. Ameriprise Financial is required to make 10-Q, 10-K and, as necessary, 8-K filings with the Securities and Exchange Commission on legal and regulatory matters that relate to Ameriprise Financial and its affiliates. Copies of these filings may be obtained by accessing the SEC website at www.sec.gov.
There can be no assurance that these matters, or the adverse publicity associated with them, will not result in increased fund redemptions, reduced sale of fund shares or other adverse consequences to the Funds. Further, although we believe proceedings are not likely to have a material adverse effect on the Funds or the ability of Ameriprise Financial or its affiliates to perform under their contracts with the Funds, these proceedings are subject to uncertainties and, as such, we are unable to estimate the possible loss or range of loss that may result. An adverse outcome in one or more of these proceedings could result in adverse judgments, settlements, fines, penalties or other relief that could have a material adverse effect on the consolidated financial condition or results of operations of Ameriprise Financial.
32
Report of Independent Registered Public Accounting Firm
To the Trustees of Columbia Funds Series Trust and the Shareholders of Columbia Large Cap Index Fund
In our opinion, the accompanying statement of assets and liabilities, including the investment portfolio, and the related statements of operations and of changes in net assets and the financial highlights present fairly, in all material respects, the financial position of Columbia Large Cap Index Fund (the “Fund”) (a series of Columbia Funds Series Trust) at February 28, 2011, the results of its operations for the year then ended, the changes in its net assets for each of the two years in the period then ended, and the financial highlights for each of the five years in the period then ended, in conformity with accounting principles generally accepted in the United States of America. These financial statements and financial highlights (hereafter referred to as “financial statements”) are the responsibility of the Fund’s management. Our responsibility is to express an opinion on these financial statements based on our audits. We conducted our audits of these financial statements in accordance with the standards of the Public Company Accounting Oversight Board (United States). Those standards require that we plan and perform the audit to obtain reasonable assurance about whether the financial statements are free of material misstatement. An audit includes examining, on a test basis, evidence supporting the amounts and disclosures in the financial statements, assessing the accounting principles used and significant estimates made by management, and evaluating the overall financial statement presentation. We believe that our audits, which included confirmation of securities at February 28, 2011 by correspondence with the custodian and brokers, provide a reasonable basis for our opinion.
PricewaterhouseCoopers LLP
Boston, Massachusetts
April 21, 2011
33
Federal Income Tax Information (Unaudited) – Columbia Large Cap Index Fund
100.00% of the ordinary income distributed by the Fund for the fiscal year ended February 28, 2011, qualifies for the corporate dividends received deduction.
For non-corporate shareholders 100.00%, or the maximum amount allowable under the Jobs and Growth Tax Relief Reconciliation Act of 2003, of ordinary income distributed by the Fund for the fiscal year ended February 28, 2011 may represent qualified dividend income.
The Fund will notify shareholders in January 2012 of amounts for use in preparing 2011 income tax returns.
34
Fund Governance
The Trustees serve terms of indefinite duration. The names, addresses and ages of the Trustees and officers of the Funds of Columbia Funds Series Trust, the year each was first elected or appointed to office, their principal business occupations during at least the last five years, the number of Funds overseen by each Trustee and other directorships they hold are shown below. Each officer listed below serves as an officer of each Fund in the Columbia Funds Series Trust.
Independent Trustees
| | |
Name, Address and Age, Position
with Funds, Year First Elected or
Appointed to Office | | Principal Occupation(s) During Past Five Years, Number of Funds in the Columbia
Funds Complex Overseen by Trustee, Other Directorships Held |
| |
| Edward J. Boudreau (Born 1944) | | |
c/o Columbia Management Investment Advisers, LLC 225 Franklin Street Boston, MA 02110 Trustee (since 2005) | | Managing Director–E.J. Boudreau & Associates (consulting), from 2000 through current; oversees 44; Trustee–BofA Funds Series Trust. |
| |
| William P. Carmichael (Born 1943) | | |
c/o Columbia Management Investment Advisers, LLC 225 Franklin Street Boston, MA 02110 Trustee (since 1999) | | Retired. Oversees 44; Director–Cobra Electronics Corporation (electronic equipment manufacturer); Director–McMoRan Exploration Company (oil and gas exploration and development); Director–The Finish Line (athletic shoes and apparel); Trustee–BofA Funds Series Trust; Former Director–Simmons Company (bedding). |
| |
| William A. Hawkins (Born 1942) | | |
c/o Columbia Management Investment Advisers, LLC 225 Franklin Street Boston, MA 02110 Trustee (since 2005) | | Managing Director–Overton Partners (financial consulting), August 2010 to present; President and Chief Executive Officer–California General Bank, N.A., from January 2008 through August 2010; oversees 44; Trustee–BofA Funds Series Trust. |
| |
| R. Glenn Hilliard (Born 1943) | | |
c/o Columbia Management Investment Advisers, LLC 225 Franklin Street Boston, MA 02110 Trustee (since 2005) | | Chairman and Chief Executive Officer–Hilliard Group LLC (investing and consulting), from April 2003 through current; Non-Executive Director & Chairman–CNO Financial Inc. (formerly Conseco Inc.) (insurance), September 2003 through current; Executive Chairman–Conseco, Inc. (insurance), August 2004 through September 2005; oversees 44; Trustee–BofA Funds Series. |
| |
| John J. Nagorniak (Born 1944) | | |
c/o Columbia Management Investment Advisers, LLC 225 Franklin Street Boston, MA 02110 Trustee (since 2008) | | Retired. President and Director–Foxstone Financial, Inc. (consulting), 2000 through December 2007; Director–Mellon Financial Corporation affiliates (investing), 2000 through 2007; Chairman–Franklin Portfolio Associates (investing–Mellon affiliate), 1982 through 2007; oversees 44; Director–MIT Investment Company; Trustee–MIT 401k Plan. |
| |
| Minor M. Shaw (Born 1947) | | |
c/o Columbia Management Investment Advisers, LLC 225 Franklin Street Boston, MA 02110 Trustee (since 2003) | | President–Micco Corporation and Mickel Investment Group; oversees 44; Board Member–Piedmont Natural Gas; Trustee–BofA Funds Series Trust. |
35
Fund Governance (continued)
Interested Trustee (continued)
| | |
Name, Address and Age, Position
with Funds, Year First Elected or
Appointed to Office | | Principal Occupation(s) During Past Five Years, Number of Funds in the Columbia
Funds Complex Overseen by Trustee, Other Directorships Held |
|
| Anthony M. Santomero1 (Born 1946) |
c/o Columbia Management Investment Advisers, LLC 225 Franklin Street Boston, MA 02110 Trustee (since 2008) | | Richard K. Mellon Professor Emeritus of Finance, The Wharton School, University of Pennsylvania, from 2002 through current; Senior Advisor–McKinsey & Company (consulting), July 2006 through January 2008; President and Chief Executive Officer–Federal Reserve Bank of Philadelphia, July 2000 through April 2006; oversees 44; Director–Renaissance Reinsurance Ltd; Trustee–Penn Mutual Life Insurance Company; Director–Citigroup, Inc.; Citibank, N.A.; Trustee–BofA Funds Series Trust. |
| 1 | Dr. Santomero is currently deemed by the Columbia Funds to be an “interested person” (as defined in the 1940 Act) of the Funds because he serves as a Director of Citigroup, Inc. and Citibank, N.A., companies that may directly or through its subsidiaries and affiliates may engage from time-to-time in brokerage execution, principal transactions and lending relationships with the Columbia Funds or other funds or accounts advised/managed by the Advisor. |
The Statement of Additional Information includes additional information about the Trustees of the Funds and is available, without charge, upon request by calling 800-345-6611.
36
Fund Governance (continued)
Officers
| | |
| Name, Year of Birth and Address | | Principal Occupation(s) During Past Five Years |
| |
| J. Kevin Connaughton (Born 1964) | | |
225 Franklin Street Boston, MA 02110 President (since 2009) | | Senior Vice President and General Manager–Mutual Fund Products, Columbia Management Investment Advisers, LLC since May 2010; President, Columbia Funds, since 2009, and RiverSource Funds, since May 2010 (previously Senior Vice President and Chief Financial Officer, Columbia Funds, from June 2008 to January 2009, Treasurer, Columbia Funds, from October 2003 to May 2008, and senior officer of various other affiliated funds since 2000); Managing Director, Columbia Management Advisors, LLC from December 2004 to April 2010. |
| |
| Michael G. Clarke (Born 1969) | | |
225 Franklin Street Boston, MA 02110 Senior Vice President and Chief Financial Officer
(since 2009) | | Vice President, Columbia Management Investment Advisers, LLC since May 2010; Managing Director of Fund Administration, Columbia Management Advisors, LLC, from September 2004 to April 2010; senior officer of Columbia Funds and affiliated funds since 2002. |
| |
| Scott R. Plummer (Born 1959) | | |
5228 Ameriprise Financial Center Minneapolis, MN 55474 Senior Vice President, Secretary and Chief Legal Officer (since 2010) | | Chief Legal Officer and Assistant Secretary, Columbia Management Investment Advisers, LLC since June 2005; Vice President and Lead Chief Counsel–Asset Management, Ameriprise Financial, Inc. since May 2010 (previously Vice President and Chief Counsel–Asset Management, from 2005 to April 2010, and Vice President–Asset Management Compliance from 2004 to 2005); Vice President, Chief Counsel and Assistant Secretary, Columbia Management Investment Distributors, Inc. since 2008; Vice President, General Counsel and Secretary, Ameriprise Certificate Company since 2005; Chief Counsel, RiverSource Distributors, Inc. since 2006; Vice President, General Counsel and Secretary, RiverSource Funds, since December 2006; Senior Vice President, Secretary and Chief Legal Officer, Columbia Funds, since May 2010. |
| |
| Linda J. Wondrack (Born 1964) | | |
225 Franklin Street Boston, MA 02110 Senior Vice President and Chief Compliance Officer (since 2007) | | Vice President and Chief Compliance Officer, Columbia Management Investment Advisers, LLC since May 2010; Chief Compliance Officer, Columbia Funds, since 2007, and RiverSource Funds, since May 2010; Director (Columbia Management Group, LLC and Investment Product Group Compliance), Bank of America, from June 2005 to April 2010. |
| |
| William F. Truscott (Born 1960) | | |
53600 Ameriprise Financial Center Minneapolis, MN 55474 Senior Vice President (since 2010) | | Chairman of the Board, Columbia Management Investment Advisers, LLC since May 2010 (previously President, Chairman of the Board and Chief Investment Officer, from 2001 to April 2010); Chief Executive Officer, U.S. Asset Management & President, Annuities, Ameriprise Financial, Inc. since May 2010 (previously President–U.S. Asset Management and Chief Investment Officer from 2005 to April 2010, and Senior Vice President–Chief Investment Officer, from 2001 to 2005); Director, President and Chief Executive Officer, Ameriprise Certificate Company since 2006; Director, Columbia Management Investment Distributors, Inc. since May 2010 (previously Chairman of the Board and Chief Executive Officer from 2008 to April 2010); Chairman of the Board and Chief Executive Officer, RiverSource Distributors, Inc. since 2006. |
| |
| Colin Moore (Born 1958) | | |
225 Franklin Street Boston, MA 02110 Senior Vice President (since 2010) | | Director and Chief Investment Officer, Columbia Management Investment Advisers, LLC since May 2010; Manager, Managing Director and Chief Investment Officer of Columbia Management Advisors, LLC from 2007 to April 2010; Head of Equities, Columbia Management Advisors, LLC from 2002 to 2007. |
37
Fund Governance (continued)
Officers (continued)
| | |
| Name, Year of Birth and Address | | Principal Occupation(s) During Past Five Years |
| |
| Michael A. Jones ( Born 1959) | | |
225 Franklin Street Boston, MA 02110 Senior Vice President (since 2010) | | President and Director, Columbia Management Investment Advisers, LLC since May 2010; President and Director, Columbia Management Investment Distributors, Inc. since May 2010; Manager, Chairman, Chief Executive Officer and President, Columbia Management Advisors, LLC from 2007 to April 2010; Chief Executive Officer, President and Director, Columbia Management Distributors, Inc. from November 2006 to April 2010; previously, co-president and senior managing director at Robeco Investment Management. |
| |
| Amy Johnson (Born 1965) | | |
5228 Ameriprise Financial Center Minneapolis, MN 55474 Senior Vice President (since 2010) | | Senior Vice President and Chief Operating Officer, Columbia Management Investment Advisers, LLC since May 2010 (previously Chief Administrative Officer, from 2009 until April 2010, Vice President–Asset Management and Trust Company Services, from 2006 to 2009, and Vice President–Operations and Compliance from 2004 to 2006). |
| |
| Joseph F. DiMaria (Born 1968) | | |
225 Franklin Street Boston, MA 02110 Treasure (since 2010) and Chief Accounting Officer (since 2008) | | Vice President, Mutual Fund Administration, Columbia Management Investment Advisers, LLC, since May 2010; Director of Fund Administration, Columbia Management Advisors, LLC from January 2006 to April 2010; Head of Tax/Compliance and Assistant Treasurer, Columbia Management Advisors, LLC, from November 2004 to December 2005. |
| |
| Marybeth Pilat (Born 1968) | | |
225 Franklin Street Boston, MA 02110 Deputy Treasurer (since 2010) | | Vice President, Mutual Fund Administration, Columbia Management Investment Advisers, LLC, since May 2010; Vice President, Investment Operations, Bank of America, from October 2008 to April 2010; Finance Manager, Boston Children’s Hospital from August 2008 to October 2008; Director, Mutual Fund Administration, Columbia Management Advisors, LLC, from May 2007 to July 2008; Vice President, Mutual Fund Valuation, Columbia Management Advisors, LLC, from January 2006 to May 2007; Vice President, Mutual Fund Accounting Oversight, Columbia Management Advisors, LLC from January 2005 to January 2006. |
| |
| Jullan Quero (Born 1967) | | |
225 Franklin Street Boston, MA 02110 Deputy Treasurer (since 2008) | | Vice President, Mutual Fund Administration, Columbia Management Investment Advisers, LLC since May 2010; Director of Fund Administration, Columbia Management Advisors, LLC, from August 2008 to April 2010; Senior Tax Manager, Columbia Management Advisors, LLC from August 2006 to July 2008; Senior Compliance Manager, Columbia Management Advisors, LLC from April 2002 to August 2006. |
| |
| Stephen T. Welsh (Born 1957) | | |
225 Franklin Street Boston, MA 02110 Vice President (since 2006) | | President, Columbia Management Investment Services Corp. since May 2010; President and Director, Columbia Management Services, Inc. from July 2004 to April 2010; Managing Director, Columbia Management Distributors , Inc. from August 2007 to April 2010. |
38
Shareholder Meeting Results
At a Joint Special Meeting of Shareholders held on February 15, 2011, shareholders of the series of Columbia Funds Series Trust, including the Fund, elected each of the nominees for trustees to the Board of Trustees of Columbia Funds Series Trust, each to hold office for an indefinite term, as follows:
| | | | | | |
| | | | | | | |
| Trustee | | Votes For | | Votes Withheld | | Abstentions |
| Kathleen Blatz | | 2,145,636,122 | | 248,012,438 | | 0 |
| Edward J. Boudreau, Jr. | | 2,145,430,114 | | 248,218,446 | | 0 |
| Pamela G. Carlton | | 2,145,515,949 | | 248,132,612 | | 0 |
| William P. Carmichael | | 2,145,038,695 | | 248,609,866 | | 0 |
| Patricia M. Flynn | | 2,145,843,563 | | 247,804,997 | | 0 |
| William A. Hawkins | | 2,145,359,401 | | 248,289,160 | | 0 |
| R. Glenn Hilliard | | 2,145,079,400 | | 248,569,161 | | 0 |
| Stephen R. Lewis, Jr. | | 2,145,092,209 | | 248,556,351 | | 0 |
| John F. Maher | | 2,145,621,338 | | 248,027,223 | | 0 |
| John J. Nagorniak | | 2,145,337,494 | | 248,311,067 | | 0 |
| Catherine James Paglia | | 2,145,615,254 | | 248,033,306 | | 0 |
| Leroy C. Richie | | 2,145,042,120 | | 248,606,441 | | 0 |
| Anthony M. Santomero | | 2,145,088,174 | | 248,560,386 | | 0 |
| Minor M. Shaw | | 2,145,430,762 | | 248,217,798 | | 0 |
| Alison Taunton-Rigby | | 2,145,393,384 | | 248,255,177 | | 0 |
| William F. Truscott | | 2,144,907,223 | | 248,741,338 | | 0 |
39
[THIS PAGE INTENTIONALLY LEFT BLANK]
40
Important Information About This Report
The fund mails one shareholder report to each shareholder address. If you would like more than one report, please call shareholder services at 1-800-345-6611 and additional reports will be sent to you. This report has been prepared for shareholders of Columbia Large Cap Index Fund.
A description of the policies and procedures that the fund uses to determine how to vote proxies and a copy of the fund’s voting records are available (i) at www.columbiamanagement.com, (ii) on the Securities and Exchange Commission’s website at www.sec.gov, and (iii) without charge, upon request, by calling 1-800-368-0346. Information regarding how the fund voted proxies relating to portfolio securities during the 12-month period ended June 30 is available from the SEC’s website. Information regarding how the fund voted proxies relating to portfolio securities is also available from the fund’s website, www.columbiamanagement.com.
The fund files a complete schedule of portfolio holdings with the SEC for the first and third quarters of each fiscal year on Form N-Q. The fund’s Form N-Q is available on the SEC’s website at www.sec.gov and may be reviewed and copied at the SEC’s Public Reference Room in Washington, D.C. Information on the operation of the Public Reference Room may be obtained by calling
1-800-SEC-0330.
Transfer Agent
Columbia Management Investment Services Corp.
P.O. Box 8081
Boston, MA 02266-8081
1-800-345-6611
Distributor
Columbia Management Investment
Distributors, Inc.
225 Franklin Street
Boston, MA 02110
Investment Manager
Columbia Management Investment Advisers, LLC
225 Franklin Street
Boston, MA 02110
41

Columbia Large Cap Index Fund
P.O. Box 8081
Boston, MA 02266-8081
columbiamanagement.com
This information is for use with concurrent or prior delivery of a fund prospectus. Investors should consider the investment objectives, risks, charges and expenses of a mutual fund carefully before investing. For a free prospectus, which contains this and other important information about the funds, visit columbiamanagement.com. Read the prospectus carefully before investing. The Fund is distributed by Columbia Management Investment Distributors, Inc., member FINRA, and managed by Columbia Management Investment Advisers, LLC.
©2011 Columbia Management Investment Advisers, LLC. All rights reserved.
C-1266 A (04/11)

Columbia Large Cap Enhanced Core Fund
Annual Report for the Period Ended February 28, 2011
Table of Contents
The views expressed in this report reflect the current views of the respective parties. These views are not guarantees of future performance and involve certain risks, uncertainties and assumptions that are difficult to predict, so actual outcomes and results may differ significantly from the views expressed. These views are subject to change at any time based upon economic, market or other conditions and the respective parties disclaim any responsibility to update such views. These views may not be relied on as investment advice and, because investment decisions for a Columbia Fund are based on numerous factors, may not be relied on as an indication of trading intent on behalf of any particular Columbia Fund. References to specific securities should not be construed as a recommendation or investment advice.
President’s Message

Dear Shareholder:
The Columbia Management story began over 100 years ago, and today, we are one of the nation’s largest dedicated asset managers. The recent acquisition by Ameriprise Financial, Inc. brings together the talents, resources and capabilities of Columbia Management with those of RiverSource Investments, Threadneedle (acquired by Ameriprise in 2003) and Seligman Investments (acquired by Ameriprise in 2008) to build a best-in-class asset management business that we believe is truly greater than its parts.
RiverSource Investments traces its roots to 1894 when its then newly-founded predecessor, Investors Syndicate, offered a face-amount savings certificate that gave small investors the opportunity to build a safe and secure fund for retirement, education or other special needs. A mutual fund pioneer, Investors Syndicate launched Investors Mutual Fund in 1940. In the decades that followed, its mutual fund products and services lineup grew to include a full spectrum of styles and specialties. More than 110 years later, RiverSource continues to be a trusted financial products leader.
Threadneedle, a leader in global asset management and one of Europe’s largest asset managers, offers sophisticated international experience from a dedicated U.K. management team. Headquartered in London, it is named for Threadneedle Street in the heart of the city’s financial district, where British investors pioneered international and global investing. Threadneedle was acquired in 2003 and today operates as an affiliate of Columbia Management.
Seligman Investments’ beginnings date back to the establishment of the investment firm J. & W. Seligman & Co. in 1864. In the years that followed, Seligman played a major role in the geographical expansion and industrial development of the United States. In 1874, President Ulysses S. Grant named Seligman as fiscal agent for the U.S. Navy — an appointment that would last through World War I. Seligman helped finance the westward path of the railroads and the building of the Panama Canal. The firm organized its first investment company in 1929 and began managing its first mutual fund in 1930. In 2008, J. & W. Seligman & Co. Incorporated was acquired and Seligman Investments became an offering brand of RiverSource Investments, LLC.
We are proud of the rich and distinctive history of these firms, the strength and breadth of products and services they offer, and the combined cultures of pioneering spirit and forward thinking. Together we are committed to providing more for our shareholders than ever before.
| n | | A singular focus on our shareholders. Our business is asset management, so investors are our first priority. We dedicate our resources to identifying timely investment opportunities and provide a comprehensive choice of equity, fixed-income and alternative investments to help meet your individual needs. |
| n | | First-class research and thought leadership. We are dedicated to helping you take advantage of today’s opportunities and anticipate tomorrow’s. We stay abreast of the latest investment trends and ideas, using our collective insight to evaluate events and transform them into solutions you can use. |
| n | | A disciplined investment approach. We aren’t distracted by passing fads. Our teams adhere to a rigorous investment process that helps ensure the integrity of our products and enables you and your financial advisor to match our solutions to your objectives with confidence. |
When you choose Columbia Management, you can be confident that we will take the time to understand your needs and help you and your financial advisor identify the solutions that are right for you. Because at Columbia Management, we don’t consider ourselves successful unless you are.
Sincerely,

J. Kevin Connaughton
President, Columbia Funds
Investors should consider the investment objectives, risks, charges and expenses of a mutual fund carefully before investing. For a free prospectus, which contains this and other important information about the funds, visit www.columbiamanagement.com. The prospectus should be read carefully before investing.
Columbia Funds are distributed by Columbia Management Investment Distributors, Inc., member FINRA, and managed by Columbia Management Investment Advisers, LLC.
© 2011 Columbia Management Investment Advisers, LLC. All rights reserved.
Fund Profile – Columbia Large Cap Enhanced Core Fund
Performance data quoted represents past performance and current performance may be lower or higher. Past performance is no guarantee of future results. The investment return and principal value will fluctuate so that shares, when redeemed, may be worth more or less than the original cost. Please visit www.columbiamanagement.com for daily and most recent month-end performance updates.
Summary
1-year return as of 02/28/11
| | |
| |
 | | +20.84% Class A shares |
| |
| | +22.57% S&P 500 Index |
|
Morningstar Style BoxTM |
|
Equity Style |
|
The Morningstar Style BoxTM is based on the fund’s portfolio holdings. For equity funds, vertical axis shows the market capitalization of the stocks owned, and the horizontal axis shows investment style (value, blend, or growth). Information shown is based on the most recent data provided by Morningstar.
© 2011 Morningstar, Inc. All rights reserved. The Morningstar information contained herein: (1) is proprietary to Morningstar and/or its content providers; (2) may not be copied or distributed; and (3) is not warranted to be accurate, complete or timely. Neither Morningstar nor its content providers are responsible for any damages or losses arising from any use of this information.
Summary
| n | | For the 12-month period that ended February 28, 2011, the fund’s Class A shares returned 20.84% without sales charge. |
| n | | The fund’s return was lower than the 22.57% return of its benchmark, the S&P 500 Index.1 However, it did slightly better than the average of the funds in its peer group, the Lipper Large-Cap Core Funds Classification,2 which returned 19.82%. |
| n | | Stock selection within the industrials, information technology and consumer discretionary sectors generally accounted for the fund’s shortfall against the index. |
Portfolio Management
Brian M. Condon has managed the fund since February 2009 and has been associated with Columbia Management Investment Advisers, LLC (the Investment Manager) or its predecessors since May 2010. Prior to joining the Investment Manager, Mr. Condon was associated with the fund’s previous advisor or its predecessors since 1999.
| 1 | The Standard & Poor’s (S&P) 500 Index tracks the performance of 500 widely held, large-capitalization U.S. stocks. |
| 2 | Lipper Inc., a widely respected data provider in the industry, calculates an average total return (assuming reinvestment of distributions) for mutual funds with investment objectives similar to those of the fund. Lipper makes no adjustment for the effect of sales loads. |
Indices are not available for investment, are not professionally managed and do not reflect sales charges, fees, brokerage commissions, taxes or other expenses of investing. Securities in the fund may not match those in an index.
1
Economic Update – Columbia Large Cap Enhanced Core Fund
Summary
For the 12-month period that ended February 28, 2011
| | n | | The U.S. stock market, as measured by the S&P 500 Index, delivered solid returns, despite a summer 2010 correction. Foreign stock market returns were generally in line with the U.S. market, as measured by the MSCI EAFE Index (Net). | |
| | |
| S&P Index | | MSCI Index |
| |

| |
|
22.57% | | 20.00% |
| | n | | Strengthening economic growth and rising interest rates kept a lid on most bond market sectors. The Barclays Capital Aggregate Bond Index delivered modest results. However, high-yield bonds were strong performers, as measured by the JPMorgan Developed BB High Yield Index. | |
| | |
| Barclays Aggregate Index | | JPMorgan Index |
| |
| |
|
4.93% | | 14.74% |
The U.S. economy continued to expand at a modest pace over the past 12 months, as measured by gross domestic product (GDP). After a strong first quarter in 2010, GDP growth dropped to 1.7% in the second quarter and fear spread that the economy would lapse into recession. However, the pace picked up in the third quarter, and growth was strong enough to inspire confidence among consumers, businesses and investors. GDP expanded by 2.6% in the third quarter and 2.8% in the fourth quarter. With the Federal Reserve Board (the Fed) providing additional monetary stimulus to shore up economic growth and the extension of key tax cuts for the next two years, 2011 expectations are for continued growth. Consumer confidence is on the mend, even though job growth has not met expectations. Business spending also tracked higher over the period.
Consumer spending on cars, clothing and other goods generally trended higher throughout the year. Holiday spending rose 5.5% between November 5, 2010 and December 24, 2010, in all retail categories, excluding automobiles, compared with the same period in 2009, according to MasterCard Advisors’ SpendingPulse, which tracks spending on all transactions including cash. Analysts say that an increase in personal savings and a decline in consumer debt gave consumers confidence to spend a little more on the 2010 holidays. The personal savings rate edged higher, ending January 2011, the last month for which data was available, at 5.8%. Personal income also increased during the year, surging in January 2011, as payroll tax cuts kicked in.
News on the job front was mostly positive over the 12-month period. A good portion of the jobs added in March, April and May of 2010 were temporary, government-sponsored census positions, which began to unwind in June, July and August of 2010. However, private sector payroll employment began to trend higher in the third quarter, massive layoffs declined and job growth turned solidly positive, with the addition of 255,000 new jobs in the first two months of 2011.
Despite some glimmers of improvement early in 2010, the housing market remained troublesome throughout the period. Both new and existing home sales fell after a federal tax credit for new and repeat homebuyers expired. Distressed properties pressured prices and foreclosures continued — another drag on prices. The inventory of unsold homes ended the period just about where it started, at 7.6 months for both new and existing homes, according to the National Association of Realtors and a joint release from the U.S. Census Bureau and the U.S. Department of Housing and Urban Development. The new year brought a bit of good news: Existing home sales increased in January 2011, raising the level of sales above where it was one year ago. According to the National Association of Realtors, it was the first time in seven months that year-over-year sales activity compared favorably.
Reports from the business side of the economy were generally positive. A key measure of the nation’s manufacturing situation — the Institute for Supply Management’s Index —took a somewhat surprising turn higher in the final months of the period. Technology spending rose 12% in 2010, according to the NPD Group, a national marketing research firm. Purchases of computers, networking and software returned to prerecession levels. Industrial production was disappointingly flat at year end, per the report issued by the Fed, and it slipped further in January 2011. The amount of manufacturing capacity utilized, per the report issued by the Fed, — a key measure of the health of the manufacturing sector — continued to inch higher.
2
Economic Update (continued) – Columbia Large Cap Enhanced Core Fund
Stocks moved higher despite summer 2010 setback
Against a strengthening economic backdrop, a stock market rally that began early in 2009 continued into 2010 despite a summer setback linked to a debt crisis brewing in Europe, which raised concerns among U.S. investors. These fears were short-lived and stocks regained their footing in September 2010, moving higher through the end of the period. The S&P 500 Index1 returned 22.57% for the 12 months through February 28, 2011. Outside the United States, stock market returns seesawed but ended just short of U.S. market returns. The MSCI EAFE Index (Net),2 a broad gauge of stock market performance in foreign developed markets, returned 20.00% (in U.S. dollars) for the 12-month period, as concerns about the impact of a bailout for weak euro zone economies abated. Emerging stock markets were similarly strong. The MSCI Emerging Markets Index (Net)3 returned 20.91% (in U.S. dollars) for the 12-month period.
Bonds delivered modest returns
As the economy strengthened and interest rates edged higher, most bond sectors delivered modest returns. The Barclays Capital Aggregate Bond Index4 returned 4.93%. High-yield bonds led the fixed-income markets. For the 12 months covered by this report, the JPMorgan Developed BB High Yield Index5 returned 14.74%. Despite rising yields in the second half of the period, the Treasury market was also positive. The Barclays Capital U.S. Treasury Index6 returned 3.71%. However, municipal bonds struggled in the final months of the period, as interest rates inched higher and issue supply surged ahead of the expiration of the Build America Bonds program. The Barclays Capital Municipal Bond Index7 gained 1.72% for the period. Despite positive economic activity, the Fed kept a key short-term interest rate — the federal funds rate — close to zero.
Past performance is no guarantee of future results.
| 1 | The Standard & Poor’s (S&P) 500 Index tracks the performance of 500 widely held, large-capitalization U.S. stocks. |
| 2 | The Morgan Stanley Capital International Europe, Australasia, Far East (MSCI EAFE) Index (Net) is a free float-adjusted market capitalization index that is designed to measure the equity market performance of developed markets, excluding the U.S. & Canada. As of May 27, 2010, the MSCI EAFE Index (Net) consisted of the following 22 developed market country indices: Australia, Austria, Belgium, Denmark, Finland, France, Germany, Greece, Hong Kong, Ireland, Israel, Italy, Japan, the Netherlands, New Zealand, Norway, Portugal, Singapore, Spain, Sweden, Switzerland and the United Kingdom. |
| 3 | The Morgan Stanley Capital International Emerging Markets (MSCI EM) Index (Net) is a free float-adjusted market capitalization index that is designed to measure equity market performance of emerging markets. As of May 27, 2010, the MSCI EM Index (Net) consisted of the following 21 emerging market country indices: Brazil, Chile, China, Colombia, Czech Republic, Egypt, Hungary, India, Indonesia, Korea, Malaysia, Mexico, Morocco, Peru, Philippines, Poland, Russia, South Africa, Taiwan, Thailand and Turkey. |
| 4 | The Barclays Capital Aggregate Bond Index is a market value-weighted index that tracks the daily price, coupon, pay-downs and total return performance of fixed-rate, publicly placed, dollar-denominated and non-convertible investment grade debt issues with at least $250 million par amount outstanding and with at least one year to final maturity. |
| 5 | The JPMorgan Developed BB High Yield Index is an unmanaged index designed to mirror the investable universe of the U.S. dollar developed, BB-rated, high yield corporate debt market. |
| 6 | The Barclays Capital U.S. Treasury Index includes public obligations of the U.S. Treasury. Treasury bills are excluded by the maturity constraint. In addition, certain special issues, such as state and local government series bonds (SLGs), as well as U.S. Treasury TIPS, are excluded. STRIPS are excluded from the index because their inclusion would result in double-counting. |
| 7 | The Barclays Capital Municipal Bond Index is considered representative of the broad market for investment-grade, tax-exempt bonds with a maturity of at least one year. |
Indices are not available for investment, are not professionally managed and do not reflect sales charges, fees, brokerage commissions, taxes or other expenses of investing. Securities in the fund may not match those in an index.
3
Performance Information – Columbia Large Cap Enhanced Core Fund
Performance data quoted represents past performance and current performance may be lower or higher. Past performance is no guarantee of future results. The investment return and principal value will fluctuate so that shares, when redeemed, may be worth more or less than the original cost. Please visit www.columbiamanagement.com for daily and most recent month-end performance updates.
| | | | |
| Net asset value per share | |
| |
as of 02/28/11 ($) | | | | |
Class A | | | 12.81 | |
Class I | | | 12.78 | |
Class R | | | 12.80 | |
Class Y | | | 12.78 | |
Class Z | | | 12.78 | |
| | | | |
| Distributions declared per share | |
| |
03/01/10 – 02/28/11 ($) | | | | |
Class A | | | 0.14 | |
Class I | | | 0.17 | |
Class R | | | 0.12 | |
Class Y | | | 0.18 | |
Class Z | | | 0.17 | |
|
| Performance of a $10,000 investment 03/01/01 – 02/28/11 |
The chart above shows the change in value of a hypothetical $10,000 investment in Class A shares of Columbia Large Cap Enhanced Core Fund during the stated time period, and does not reflect the deduction of taxes that a shareholder may pay on fund distributions or on the redemption of fund shares.
| | | | |
| Performance of a $10,000 investment 03/01/01 – 02/28/11 ($) | |
Class A | | | 12,779 | |
Class I | | | n/a | |
Class R | | | 12,608 | |
Class Y | | | 13,135 | |
Class Z | | | 13,119 | |
| | | | | | | | | | | | | | | | | | | | |
| Average annual total return as of 02/28/11 (%) | |
| | | | | |
| Share class | | A | | | I | | | R | | | Y | | | Z | |
| Inception | | 07/31/96 | | | 09/27/10 | | | 01/23/06 | | | 07/15/09 | | | 07/31/96 | |
1-year | | | 20.84 | | | | n/a | | | | 20.58 | | | | 21.30 | | | | 21.18 | |
5-year | | | 1.98 | | | | n/a | | | | 1.72 | | | | 2.26 | | | | 2.24 | |
10-year/Life | | | 2.48 | | | | 16.65 | | | | 2.34 | | | | 2.76 | | | | 2.75 | |
Performance results reflect any fee waivers or reimbursements of fund expenses by the Investment Manager and/or any of its affiliates. Absent these fee waivers or expense reimbursement arrangements, performance results would have been lower.
All results shown assume reinvestment of distributions. Class I shares, Class R shares, Class Y shares and Class Z shares, each sold at net asset value (NAV), have limited eligibility and the investment minimum requirements may vary. The returns for Class R shares include the returns for Class A shares prior to January 23, 2006, the date on which Class R shares were initially offered by the fund. If differences in expenses had been reflected, the returns would have been lower, since Class R shares are subject to a higher Rule 12b-1 fee. The returns for Class Y shares include the returns for Class Z shares prior to July 15, 2009, the date on which Class Y shares were initially offered by the fund. The returns shown have not been adjusted to reflect any differences in expenses between Class Y shares and Class Z shares. Only eligible investors may purchase Class R shares, Class Y shares and Class Z shares of the fund, directly or by exchange. Please see the fund’s prospectus for details.
The tables do not reflect the deduction of taxes that a shareholder may pay on fund distributions or on the redemption of fund shares.
4
Understanding Your Expenses – Columbia Large Cap Enhanced Core Fund
As a fund shareholder, you incur two types of costs. There are transaction costs and ongoing costs, which generally include investment advisory fees, distribution and service (Rule 12b-1) fees and other fund expenses. The information on this page is intended to help you understand the ongoing costs of investing in the fund and to compare these costs with the ongoing costs of investing in other mutual funds.
Analyzing your fund’s expenses by share class
To illustrate these ongoing costs, we have provided an example and calculated the expenses paid by investors in each share class during the period. The information in the following table is based on an initial investment of $1,000, which is invested at the beginning of the period and held for the entire period. Expense information is calculated two ways and each method provides you with different information. The amount listed in the “Actual” column is calculated using the fund’s actual operating expenses and total return for the period. The amount listed in the “Hypothetical” column for each share class assumes that the return each year is 5% before expenses and is calculated based on the fund’s actual operating expenses. You should not use the hypothetical account values and expenses to estimate either your actual account balance at the end of the period or the expenses you paid during this period.
Compare with other funds
Since all mutual funds are required to include the same hypothetical calculations about expenses in shareholder reports, you can use this information to compare the ongoing costs of investing in the fund with other funds. To do so, compare the 5% hypothetical example with the 5% hypothetical examples that appear in the shareholder reports of other funds. As you compare hypothetical examples of other funds, it is important to note that hypothetical examples are meant to highlight the ongoing costs of investing in a fund and do not reflect any transaction costs, such as sales charges, redemption fees or exchange fees.
Estimating your actual expenses
To estimate the expenses that you paid over the period, first you will need your account balance at the end of the period:
| | n | | For shareholders who receive their account statements from Columbia Management Investment Services Corp., your account balance is available online at www.columbiamanagement.com or by calling Shareholder Services at 800.345.6611. | |
| | n | | For shareholders who receive their account statements from their financial intermediary, contact your financial intermediary to obtain your account balance. | |
| | 1. | Divide your ending account balance by $1,000. For example, if an account balance was $8,600 at the end of the period, the result would be 8.6. | |
| | 2. | In the section of the table below titled “Expenses paid during the period,” locate the amount for your share class. You will find this number in the column labeled “Actual.” Multiply this number by the result from step 1. Your answer is an estimate of the expenses you paid on your account during the period. | |
If the value of your account falls below the minimum initial investment requirement applicable to you, your account may be subject to a $20 annual fee. This fee is not included in the accompanying table. If you are subject to the fee, keep it in mind when you are estimating the ongoing expenses of investing in the fund and when comparing the expenses of this fund with other funds.
| | | | | | | | | | | | | | | | | | | | | | | | | | | | |
| 09/01/10 – 02/28/11 | |
| | | | |
| | | Account value at the
beginning of the period ($) | | | Account value at the
end of the period ($) | | | Expenses paid
during the period ($) | | | Fund’s annualized
expense ratio (%) | |
| | | Actual | | | Hypothetical | | | Actual | | | Hypothetical | | | Actual | | | Hypothetical | | | Actual | |
Class A | | | 1,000.00 | | | | 1,000.00 | | | | 1,268.50 | | | | 1,020.08 | | | | 5.34 | | | | 4.76 | | | | 0.95 | |
Class I | | | 1,000.00 | | | | 1,000.00 | | | | 1,062.30 | * | | | 1,021.97 | | | | 2.48 | * | | | 2.86 | | | | 0.57 | |
Class R | | | 1,000.00 | | | | 1,000.00 | | | | 1,267.60 | | | | 1,018.84 | | | | 6.75 | | | | 6.01 | | | | 1.20 | |
Class Y | | | 1,000.00 | | | | 1,000.00 | | | | 1,271.60 | | | | 1,021.97 | | | | 3.21 | | | | 2.86 | | | | 0.57 | |
Class Z | | | 1,000.00 | | | | 1,000.00 | | | | 1,270.50 | | | | 1,021.32 | | | | 3.94 | | | | 3.51 | | | | 0.70 | |
Expenses paid during the period are equal to the annualized expense ratio for the share class, multiplied by the average account value over the period, then multiplied by the number of days in the fund’s most recent fiscal half-year and divided by 365.
Had the Investment Manager and/or any of its affiliates not waived fees or reimbursed a portion of expenses, account value at the end of the period would have been reduced.
It is important to note that the expense amounts shown in the table are meant to highlight only ongoing costs of investing in the fund and do not reflect any transaction costs, such as sales charges, redemption fees or exchange fees. Therefore, the hypothetical examples provided may not help you determine the relative total costs of owning shares of different funds. If these transaction costs were included, your costs would have been higher.
* For the period September 27, 2010 through February 28, 2011. Class I shares commenced operations on September 27, 2010.
5
Portfolio Manager’s Report – Columbia Large Cap Enhanced Core Fund
Performance data quoted represents past performance and current performance may be lower or higher. Past performance is no guarantee of future results. The investment return and principal value will fluctuate so that shares, when redeemed, may be worth more or less than the original cost. Please visit www.columbiamanagement.com for daily and most recent month-end performance updates.
| | | | |
| Top 10 holdings | |
| |
as of 02/28/11 (%) | | | | |
Apple, Inc. | | | 3.6 | |
Chevron Corp. | | | 2.8 | |
Exxon Mobil Corp. | | | 2.7 | |
General Electric Co. | | | 2.7 | |
International Business Machines Corp. | | | 2.6 | |
JPMorgan Chase & Co. | | | 2.6 | |
Microsoft Corp. | | | 2.5 | |
Wal-Mart Stores, Inc. | | | 1.7 | |
AT&T, Inc. | | | 1.7 | |
Philip Morris International, Inc. | | | 1.7 | |
Information provided is calculated as a percentage of net assets.
| | | | |
| Top 5 sectors | | | |
| |
as of 02/28/11 (%) | | | | |
Information Technology | | | 18.4 | |
Financials | | | 15.5 | |
Energy | | | 13.3 | |
Industrials | | | 11.2 | |
Health Care | | | 10.5 | |
Top 5 sectors are calculated as a percentage of net assets.
For the 12-month period that ended February 28, 2011, the fund’s Class A shares returned 20.84% without sales charge. The S&P 500 Index returned 22.57%. The average return of funds in its peer group, the Lipper Large-Cap Core Funds Classification, was 19.82%. Stock selection within the industrials, information technology and consumer discretionary sectors generally accounted for the fund’s shortfall against the index. Stock selection within the financials, materials and energy sectors produced favorable results for the fund.
Stock selection disappoints in industrials, technology and consumer discretionary
The fund’s emphasis on quality led to certain disappointments during a year that was generally favorable for stocks lower on the quality spectrum. Overweights in both Raytheon and R.R. Donnelley & Sons (0.9% and 0.7% of net assets, respectively), increased the impact of their negative returns on results compared to the index. In the information technology sector, the fund achieved strong returns. However, they were not as strong as the returns generated by sector holdings within the index. The fund had more exposure to Microsoft and Hewlett-Packard (2.5% and 1.0% of net assets, respectively), two of the sector’s weakest performers. It gave up some performance because it had less exposure than the index to QUALCOMM (0.3% of net assets), which was a standout performer, and that offset the positive impact of an underweight in Cisco Systems (0.3% of net assets), which incurred a double-digit loss for the year. The fund’s high quality bias also hurt performance in the consumer discretionary sector where we chose names such as Limited Brands, Comcast, Ross Stores and Coach (0.6%, 1.1%, 1.0% and 0.5% of net assets, respectively), which lagged lower quality high-fliers. Even so, the fund’s consumer holdings produced strong positive results.
Bright spots in financials, materials and energy
Strong stock selection contributed to the fund’s edge against the index in the financials sector. We underweighted Bank of America (0.5% of net assets), which recorded a double-digit loss for the period, and overweighted Discover Financial Services and Prudential Financial (1.0% and 0.4% of net assets, respectively), which logged double digit gains. In the materials sector, a surge in commodity prices aided returns from Eastman Chemical, PPG Industries and Freeport-McMoRan Copper & Gold (0.7%, 0.7% and 1.1% of net assets, respectively). Energy was the top-performing sector within the index and the fund’s stock selection worked it its favor. In particular, National Oilwell Varco, ConocoPhillips, Chevron and Devon Energy (1.1%, 1.6%, 2.8% and 1.3% of net assets, respectively) produced strong gains and positive performance relative to the index.
6
Portfolio Manager’s Report (continued) – Columbia Large Cap Enhanced Core Fund
Looking ahead
We expect the markets to pick up where they left off in the previous period. We believe that investors will focus on the sustainability of economic growth, corporate profits and the outlook for the labor and housing markets. In this environment, cyclical industries with exposure to emerging economies have the potential to benefit from their continued growth. We plan to maintain our focus on stock selection as defined by our disciplined process, which evaluates stocks on the basis of certain characteristics, including quality, valuation and other metrics that we believe contribute to performance differences among stocks within each sector. Although our process did not lead to some of the absolute top performers in this period, we believe it has the potential to do well for shareholders over the long term.
Portfolio characteristics and holdings are subject to change periodically and may not be representative of current characteristics and holdings. The outlook for the fund may differ from those presented for other Columbia Funds.
Equity securities are subject to stock market fluctuations that occur in response to economic and business developments.
7
Investment Portfolio – Columbia Large Cap Enhanced Core Fund
February 28, 2011
Common Stocks – 98.7%
| | | | | | | | |
| | | Shares | | | Value ($) | |
| Consumer Discretionary – 10.1% | |
| Automobiles – 0.4% | | | | | |
Ford Motor Co. (a) | | | 113,200 | | | | 1,703,660 | |
| | | | | | | | |
Automobiles Total | | | | | | | 1,703,660 | |
| |
| Diversified Consumer Services – 0.1% | | | | | |
Apollo Group, Inc., Class A (a) | | | 9,200 | | | | 416,392 | |
| | | | | | | | |
Diversified Consumer Services Total | | | | 416,392 | |
| |
| Hotels, Restaurants & Leisure – 0.2% | | | | | |
McDonald’s Corp. | | | 14,600 | | | | 1,104,928 | |
| | | | | | | | |
Hotels, Restaurants & Leisure Total | | | | | | | 1,104,928 | |
| |
| Internet & Catalog Retail – 0.3% | | | | | |
priceline.com, Inc. (a) | | | 2,800 | | | | 1,270,864 | |
| | | | | | | | |
Internet & Catalog Retail Total | | | | | | | 1,270,864 | |
| | |
| Media – 3.5% | | | | | | | | |
Comcast Corp., Class A | | | 171,700 | | | | 4,422,992 | |
DIRECTV, Class A (a) | | | 101,600 | | | | 4,670,552 | |
McGraw-Hill Companies, Inc. | | | 88,600 | | | | 3,427,048 | |
Time Warner Cable, Inc. | | | 26,800 | | | | 1,934,424 | |
| | | | | | | | |
Media Total | | | | | | | 14,455,016 | |
| | |
| Multiline Retail – 0.4% | | | | | | | | |
Family Dollar Stores, Inc. | | | 2,700 | | | | 135,216 | |
Target Corp. | | | 29,850 | | | | 1,568,618 | |
| | | | | | | | |
Multiline Retail Total | | | | | | | 1,703,834 | |
| | |
| Specialty Retail – 4.5% | | | | | | | | |
AutoZone, Inc. (a) | | | 15,400 | | | | 3,972,430 | |
Best Buy Co., Inc. | | | 61,350 | | | | 1,977,924 | |
GameStop Corp., Class A (a) | | | 76,200 | | | | 1,520,190 | |
Gap, Inc. | | | 57,500 | | | | 1,295,475 | |
Limited Brands, Inc. | | | 82,000 | | | | 2,625,640 | |
Ross Stores, Inc. | | | 58,600 | | | | 4,221,544 | |
TJX Companies, Inc. | | | 62,100 | | | | 3,096,927 | |
| | | | | | | | |
Specialty Retail Total | | | | | | | 18,710,130 | |
|
| Textiles, Apparel & Luxury Goods – 0.7% | |
Coach, Inc. | | | 39,200 | | | | 2,152,864 | |
NIKE, Inc., Class B | | | 7,000 | | | | 623,210 | |
| | | | | | | | |
Textiles, Apparel & Luxury Goods Total | | | | | | | 2,776,074 | |
| | | | | | | | |
Consumer Discretionary Total | | | | | | | 42,140,898 | |
| | | | | | | | |
| Consumer Staples – 9.9% | |
| Beverages – 0.7% | | | | | | | | |
Coca-Cola Co. | | | 34,900 | | | | 2,230,808 | |
PepsiCo, Inc. | | | 8,000 | | | | 507,360 | |
| | | | | | | | |
Beverages Total | | | | 2,738,168 | |
| | | | | | | | |
| | | Shares | | | Value ($) | |
| Food & Staples Retailing – 3.1% | |
Kroger Co. | | | 37,000 | | | | 847,300 | |
Wal-Mart Stores, Inc. | | | 139,500 | | | | 7,251,210 | |
Walgreen Co. | | | 107,450 | | | | 4,656,883 | |
| | | | | | | | |
Food & Staples Retailing Total | | | | 12,755,393 | |
|
| Food Products – 0.7% | |
Hershey Co. | | | 58,000 | | | | 3,034,560 | |
| | | | | | | | |
Food Products Total | | | | 3,034,560 | |
|
| Household Products – 1.8% | |
Kimberly-Clark Corp. | | | 66,800 | | | | 4,402,120 | |
Procter & Gamble Co. | | | 51,150 | | | | 3,225,008 | |
| | | | | | | | |
Household Products Total | | | | 7,627,128 | |
|
| Tobacco – 3.6% | |
Altria Group, Inc. | | | 183,150 | | | | 4,646,515 | |
Lorillard, Inc. | | | 44,800 | | | | 3,439,296 | |
Philip Morris International, Inc. | | | 112,300 | | | | 7,050,194 | |
| | | | | | | | |
Tobacco Total | | | | 15,136,005 | |
| | | | | | | | |
Consumer Staples Total | | | | 41,291,254 | |
| | | | | | | | |
| Energy – 13.3% | |
| Energy Equipment & Services – 2.0% | |
Diamond Offshore Drilling, Inc. | | | 16,300 | | | | 1,275,149 | |
Helmerich & Payne, Inc. | | | 15,100 | | | | 981,349 | |
National Oilwell Varco, Inc. | | | 58,250 | | | | 4,634,952 | |
Noble Corp. | | | 26,300 | | | | 1,175,873 | |
Schlumberger Ltd. | | | 2,700 | | | | 252,234 | |
| | | | | | | | |
Energy Equipment & Services Total | | | | 8,319,557 | |
|
| Oil, Gas & Consumable Fuels – 11.3% | |
Apache Corp. | | | 47,500 | | | | 5,919,450 | |
Chevron Corp. | | | 111,100 | | | | 11,526,625 | |
ConocoPhillips | | | 87,400 | | | | 6,805,838 | |
Devon Energy Corp. | | | 60,700 | | | | 5,550,408 | |
Exxon Mobil Corp. | | | 131,394 | | | | 11,238,129 | |
Marathon Oil Corp. | | | 66,300 | | | | 3,288,480 | |
Peabody Energy Corp. | | | 15,700 | | | | 1,028,193 | |
Valero Energy Corp. | | | 58,200 | | | | 1,640,076 | |
| | | | | | | | |
Oil, Gas & Consumable Fuels Total | | | | 46,997,199 | |
| | | | | | | | |
Energy Total | | | | 55,316,756 | |
| | | | | | | | |
| Financials – 15.5% | | | | | | | | |
| Capital Markets – 2.1% | |
Franklin Resources, Inc. | | | 31,500 | | | | 3,957,030 | |
Goldman Sachs Group, Inc. | | | 7,700 | | | | 1,261,106 | |
T. Rowe Price Group, Inc. | | | 55,700 | | | | 3,730,786 | |
| | | | | | | | |
Capital Markets Total | | | | 8,948,922 | |
See Accompanying Notes to Financial Statements.
8
Columbia Large Cap Enhanced Core Fund
February 28, 2011
Common Stocks (continued)
| | | | | | | | |
| | | Shares | | | Value ($) | |
| Financials (continued) | |
| Commercial Banks – 1.9% | |
Fifth Third Bancorp. | | | 114,300 | | | | 1,668,780 | |
KeyCorp | | | 298,800 | | | | 2,731,032 | |
Wells Fargo & Co. | | | 105,000 | | | | 3,387,300 | |
| | | | | | | | |
Commercial Banks Total | | | | 7,787,112 | |
|
Consumer Finance – 1.5% | |
Capital One Financial Corp. | | | 42,450 | | | | 2,112,737 | |
Discover Financial Services | | | 188,250 | | | | 4,094,437 | |
| | | | | | | | |
Consumer Finance Total | | | | 6,207,174 | |
|
Diversified Financial Services – 5.3% | |
Bank of America Corp. | | | 146,100 | | | | 2,087,769 | |
Citigroup, Inc. (a) | | | 1,264,550 | | | | 5,918,094 | |
JPMorgan Chase & Co. | | | 233,800 | | | | 10,916,122 | |
NASDAQ OMX Group, Inc. (a) | | | 105,200 | | | | 3,009,772 | |
| | | | | | | | |
Diversified Financial Services Total | | | | 21,931,757 | |
|
Insurance – 3.0% | |
AFLAC, Inc. | | | 36,000 | | | | 2,118,960 | |
Berkshire Hathaway, Inc., Class B (a) | | | 24,000 | | | | 2,094,720 | |
Hartford Financial Services Group, Inc. | | | 73,850 | | | | 2,185,960 | |
Lincoln National Corp. | | | 49,100 | | | | 1,557,452 | |
Prudential Financial, Inc. | | | 26,400 | | | | 1,737,912 | |
Torchmark Corp. | | | 28,300 | | | | 1,846,575 | |
Travelers Companies, Inc. | | | 19,600 | | | | 1,174,628 | |
| | | | | | | | |
Insurance Total | | | | 12,716,207 | |
|
Real Estate Investment Trusts (REITs) – 1.7% | |
Apartment Investment & Management Co., Class A | | | 86,900 | | | | 2,228,985 | |
Public Storage | | | 2,200 | | | | 246,950 | |
Simon Property Group, Inc. | | | 43,200 | | | | 4,753,728 | |
| | | | | | | | |
Real Estate Investment Trusts (REITs) Total | | | | | | | 7,229,663 | |
| | | | | | | | |
Financials Total | | | | 64,820,835 | |
| | | | | | | | |
| Health Care – 10.5% | | | | | |
| Biotechnology – 2.4% | | | | | |
Amgen, Inc. (a) | | | 23,000 | | | | 1,180,590 | |
Biogen Idec, Inc. (a) | | | 49,300 | | | | 3,372,120 | |
Cephalon, Inc. (a) | | | 29,900 | | | | 1,683,669 | |
Gilead Sciences, Inc. (a) | | | 96,500 | | | | 3,761,570 | |
| | | | | | | | |
Biotechnology Total | | | | 9,997,949 | |
| |
Health Care Equipment & Supplies – 0.6% | | | | | |
CR Bard, Inc. | | | 24,900 | | | | 2,434,224 | |
| | | | | | | | |
Health Care Equipment & Supplies Total | | | | | | | 2,434,224 | |
| | | | | | | | |
| | | Shares | | | Value ($) | |
| Health Care Providers & Services – 2.1% | | | | | |
Cardinal Health, Inc. | | | 59,800 | | | | 2,490,072 | |
Humana, Inc. (a) | | | 600 | | | | 39,006 | |
UnitedHealth Group, Inc. | | | 141,900 | | | | 6,042,102 | |
| | | | | | | | |
Health Care Providers & Services Total | | | | 8,571,180 | |
| |
Life Sciences Tools & Services – 0.0% | | | | | |
Waters Corp. (a) | | | 1,000 | | | | 83,050 | |
| | | | | | | | |
Life Sciences Tools & Services Total | | | | 83,050 | |
| |
Pharmaceuticals – 5.4% | | | | | |
Abbott Laboratories | | | 79,200 | | | | 3,809,520 | |
Eli Lilly & Co. | | | 135,300 | | | | 4,675,968 | |
Forest Laboratories, Inc. (a) | | | 82,400 | | | | 2,669,760 | |
Johnson & Johnson | | | 108,050 | | | | 6,638,592 | |
Merck & Co., Inc. | | | 71,700 | | | | 2,335,269 | |
Pfizer, Inc. | | | 126,300 | | | | 2,430,012 | |
| | | | | | | | |
Pharmaceuticals Total | | | | 22,559,121 | |
| | | | | | | | |
Health Care Total | | | | 43,645,524 | |
| | | | | | | | |
| Industrials – 11.2% | | | | | |
| Aerospace & Defense – 3.5% | | | | | |
Lockheed Martin Corp. | | | 10,450 | | | | 827,222 | |
Northrop Grumman Corp. | | | 62,100 | | | | 4,140,828 | |
Raytheon Co. | | | 70,800 | | | | 3,625,668 | |
United Technologies Corp. | | | 72,500 | | | | 6,056,650 | |
| | | | | | | | |
Aerospace & Defense Total | | | | 14,650,368 | |
| | |
| Air Freight & Logistics – 1.4% | | | | | | | | |
United Parcel Service, Inc., Class B | | | 80,200 | | | | 5,918,760 | |
| | | | | | | | |
Air Freight & Logistics Total | | | | | | | 5,918,760 | |
| |
| Commercial Services & Supplies – 1.0% | | | | | |
Pitney Bowes, Inc. | | | 55,200 | | | | 1,389,936 | |
R.R. Donnelley & Sons Co. | | | 155,800 | | | | 2,900,996 | |
| | | | | | | | |
Commercial Services & Supplies Total | | | | | | | 4,290,932 | |
| | |
| Electrical Equipment – 0.5% | | | | | | | | |
Emerson Electric Co. | | | 36,200 | | | | 2,159,692 | |
| | | | | | | | |
Electrical Equipment Total | | | | | | | 2,159,692 | |
| | |
| Industrial Conglomerates – 2.7% | | | | | | | | |
General Electric Co. (b) | | | 536,050 | | | | 11,214,166 | |
| | | | | | | | |
Industrial Conglomerates Total | | | | | | | 11,214,166 | |
| | |
| Machinery – 0.3% | | | | | | | | |
Eaton Corp. | | | 10,900 | | | | 1,207,502 | |
| | | | | | | | |
Machinery Total | | | | | | | 1,207,502 | |
| | |
| Professional Services – 0.8% | | | | | | | | |
Dun & Bradstreet Corp. | | | 42,100 | | | | 3,401,680 | |
| | | | | | | | |
Professional Services Total | | | | | | | 3,401,680 | |
See Accompanying Notes to Financial Statements.
9
Columbia Large Cap Enhanced Core Fund
February 28, 2011
Common Stocks (continued)
| | | | | | | | |
| | | Shares | | | Value ($) | |
| Industrials (continued) | | | | | |
| Trading Companies & Distributors – 1.0% | | | | | |
W.W. Grainger, Inc. | | | 29,700 | | | | 3,956,337 | |
| | | | | | | | |
Trading Companies & Distributors Total | | | | | | | 3,956,337 | |
| | | | | | | | |
Industrials Total | | | | | | | 46,799,437 | |
| | | | | | | | |
| Information Technology – 18.4% | |
| Communications Equipment – 0.6% | | | | | | | | |
Cisco Systems, Inc. (a) | | | 56,250 | | | | 1,044,000 | |
QUALCOMM, Inc. | | | 23,400 | | | | 1,394,172 | |
| | | | | | | | |
Communications Equipment Total | | | | | | | 2,438,172 | |
| | |
| Computers & Peripherals – 6.9% | | | | | | | | |
Apple, Inc. (a) | | | 42,050 | | | | 14,852,480 | |
Dell, Inc. (a) | | | 150,900 | | | | 2,388,747 | |
Hewlett-Packard Co. | | | 94,000 | | | | 4,101,220 | |
Lexmark International, Inc., Class A (a) | | | 66,000 | | | | 2,476,980 | |
SanDisk Corp. (a) | | | 33,200 | | | | 1,646,720 | |
Western Digital Corp. (a) | | | 100,600 | | | | 3,076,348 | |
| | | | | | | | |
Computers & Peripherals Total | | | | | | | 28,542,495 | |
| |
| Internet Software & Services – 1.5% | | | | | |
eBay, Inc. (a) | | | 8,400 | | | | 281,442 | |
Google, Inc., Class A (a) | | | 9,500 | | | | 5,827,300 | |
| | | | | | | | |
Internet Software & Services Total | | | | | | | 6,108,742 | |
|
| IT Services – 2.9% | |
International Business Machines Corp. | | | 67,700 | | | | 10,959,276 | |
Western Union Co. | | | 54,700 | | | | 1,202,853 | |
| | | | | | | | |
IT Services Total | | | | | | | 12,162,129 | |
|
| Semiconductors & Semiconductor Equipment – 3.3% | |
First Solar, Inc. (a) | | | 2,200 | | | | 324,258 | |
Intel Corp. | | | 263,850 | | | | 5,664,859 | |
Teradyne, Inc. (a) | | | 196,000 | | | | 3,651,480 | |
Texas Instruments, Inc. | | | 119,950 | | | | 4,271,420 | |
| | | | | | | | |
Semiconductors & Semiconductor Equipment Total | | | | 13,912,017 | |
|
| Software – 3.2% | |
Microsoft Corp. (b) | | | 393,900 | | | | 10,469,862 | |
Oracle Corp. | | | 75,450 | | | | 2,482,305 | |
Symantec Corp. (a) | | | 24,900 | | | | 448,947 | |
| | | | | | | | |
Software Total | | | | | | | 13,401,114 | |
| | | | | | | | |
Information Technology Total | | | | 76,564,669 | |
| | | | | | | | |
| Materials – 3.8% | |
| Chemicals – 1.7% | |
E.I. du Pont de Nemours & Co. | | | 22,100 | | | | 1,212,627 | |
| | | | | | | | |
| | | Shares | | | Value ($) | |
Eastman Chemical Co. | | | 32,350 | | | | 3,021,814 | |
PPG Industries, Inc. | | | 34,900 | | | | 3,084,462 | |
| | | | | | | | |
Chemicals Total | | | | | | | 7,318,903 | |
|
| Metals & Mining – 1.8% | |
Cliffs Natural Resources, Inc. | | | 9,900 | | | | 960,993 | |
Freeport-McMoRan Copper & Gold, Inc. | | | 88,100 | | | | 4,664,895 | |
Newmont Mining Corp. | | | 32,600 | | | | 1,801,802 | |
| | | | | | | | |
Metals & Mining Total | | | | | | | 7,427,690 | |
|
| Paper & Forest Products – 0.3% | |
International Paper Co. | | | 40,700 | | | | 1,130,646 | |
| | | | | | | | |
Paper & Forest Products Total | | | | | | | 1,130,646 | |
| | | | | | | | |
Materials Total | | | | | | | 15,877,239 | |
| | | | | | | | |
| Telecommunication Services – 3.0% | |
| Diversified Telecommunication Services – 3.0% | |
AT&T, Inc. | | | 250,350 | | | | 7,104,933 | |
Verizon Communications, Inc. | | | 143,200 | | | | 5,286,944 | |
| | | | | | | | |
Diversified Telecommunication Services Total | | | | | | | 12,391,877 | |
| | | | | | | | |
Telecommunication Services Total | | | | 12,391,877 | |
| | | | | | | | |
| Utilities – 3.0% | |
| Electric Utilities – 2.0% | | | | | | | | |
Edison International | | | 8,900 | | | | 330,368 | |
Entergy Corp. | | | 50,700 | | | | 3,609,840 | |
Exelon Corp. | | | 106,200 | | | | 4,434,912 | |
| | | | | | | | |
Electric Utilities Total | | | | 8,375,120 | |
| | |
Multi-Utilities – 1.0% | | | | | | | | |
Public Service Enterprise Group, Inc. | | | 123,500 | | | | 4,038,450 | |
| | | | | | | | |
Multi-Utilities Total | | | | | | | 4,038,450 | |
| | | | | | | | |
Utilities Total | | | | | | | 12,413,570 | |
| | | | | | | | |
Total Common Stocks
(cost of $282,310,590) | | | | | | | 411,262,059 | |
| | | | | | | | |
See Accompanying Notes to Financial Statements.
10
Columbia Large Cap Enhanced Core Fund
February 28, 2011
Short-Term Obligation – 0.8%
| | | | | | | | |
| | | Par ($) | | | Value ($) | |
Repurchase agreement with Fixed Income Clearing Corp., dated 02/28/11, due 03/01/11 at 0.090%, collateralized by a U.S. Government Agency obligation maturing 12/18/13, market value $3,496,750 (repurchase proceeds $3,428,009) | | | 3,428,000 | | | | 3,428,000 | |
| | | | | | | | |
Total Short-Term Obligation
(cost of $3,428,000) | | | | | | | 3,428,000 | |
| | | | |
Total Investments – 99.5%
(cost of $285,738,590) (c) | | | | 414,690,059 | |
| | | | |
Other Assets & Liabilities, Net – 0.5% | | | | 1,955,921 | |
| | | | | | | | |
Net Assets – 100.0% | | | | | | | 416,645,980 | |
Notes to Investment Portfolio:
| (a) | Non-income producing security. |
| (b) | A portion of these securities with a market value of $6,392,800 are pledged as collateral for open futures contracts. |
| (c) | Cost for federal income tax purposes is $287,532,631. |
Generally accepted accounting principles (GAAP) require disclosure regarding the inputs and valuation techniques used to measure fair value and any changes in valuation inputs or techniques. In addition, investments shall be disclosed by major category.
The Fund categorizes its fair value measurements according to a three-level hierarchy that maximizes the use of observable inputs and minimizes the use of unobservable inputs by prioritizing that the most observable input be used when available. Observable inputs are those that market participants would use in pricing an investment based on market data obtained from sources independent of the reporting entity. Unobservable inputs are those that reflect the Fund’s assumptions about the information market participants would use in pricing an investment. An investment’s level within the fair value hierarchy is based on the lowest level of any input that is deemed significant to the asset or liability’s fair value measurement. The input levels are not necessarily an indication of the risk or liquidity associated with investments at that level. For example, certain U.S. government securities are generally high quality and liquid, however, they are reflected as Level 2 because the inputs used to determine fair value may not always be quoted prices in an active market.
Fair value inputs are summarized in the three broad levels listed below:
| • | | Level 1 — Valuations based on quoted prices for investments in active markets that the Fund has the ability to access at the measurement date (including NAV for open-end mutual funds). Valuation adjustments are not applied to Level 1 investments. |
| • | | Level 2 — Valuations based on other significant observable inputs (including quoted prices for similar securities, interest rates, prepayment speeds, credit risks, etc.). |
| • | | Level 3 — Valuations based on significant unobservable inputs (including the Fund’s own assumptions and judgment in determining the fair value of investments). |
Inputs that are used in determining fair value of an investment may include price information, credit data, volatility statistics, and other factors. These inputs can be either observable or unobservable. The availability of observable inputs can vary between investments, and is affected by various factors such as the type of investment, and the volume and level of activity for that investment or similar investments in the marketplace. The inputs will be considered by the Investment Manager, along with any other relevant factors in the calculation of an investment’s fair value. The Fund uses prices and inputs that are current as of the measurement date, which may include periods of market dislocations. During these periods, the availability of prices and inputs may be reduced for many investments. This condition could cause an investment to be reclassified between the various levels within the hierarchy. Non-U.S. equity securities actively traded in foreign markets may be reflected in Level 2 despite the availability of closing prices, because the Fund evaluates and determines whether those closing prices reflect fair value at the close of the New York Stock Exchange (NYSE) or require adjustment, as described in Note 2 to the financial statements — Security Valuation.
Investments falling into the Level 3 category are primarily supported by quoted prices from brokers and dealers participating in the market for those investments. However, these may be classified as Level 3 investments due to lack of market transparency and corroboration to support these quoted prices. Additionally, valuation models may be used as the pricing source for any remaining investments classified as Level 3. These models rely on one or more significant unobservable inputs and/or significant assumptions by the Investment Manager. Inputs used in valuations may include, but are not limited to, financial statement analysis, capital account balances, discount rates and estimated cash flows, and comparable company data.
The following table is a summary of the inputs used to value the Fund’s investments as of February 28, 2011:
| | | | | | | | | | | | | | | | |
Description | | Quoted Prices
(Level 1) | | | Other
Significant
Observable
Inputs
(Level 2) | | | Significant
Unobservable
Inputs
(Level 3) | | | Total | |
Total Common Stocks | | $ | 411,262,059 | | | $ | — | | | $ | — | | | $ | 411,262,059 | |
| | | | | | | | | | | | | | | | |
Total Short-Term Obligation | | | — | | | | 3,428,000 | | | | — | | | | 3,428,000 | |
| | | | | | | | | | | | | | | | |
Total Investments | | | 411,262,059 | | | | 3,428,000 | | | | — | | | | 414,690,059 | |
| | | | | | | | | | | | | | | | |
Unrealized Depreciation on Futures Contracts | | | (11,136 | ) | | | — | | | | — | | | | (11,136 | ) |
| | | | | | | | | | | | | | | | |
Total | | $ | 411,250,923 | | | $ | 3,428,000 | | | $ | — | | | $ | 414,678,923 | |
| | | | | | | | | | | | | | | | |
The Funds assets assigned to the Level 2 input category represent certain short-term obligations which are valued using amortized cost, an income approach which converts future cash flows to a present value based upon the discount or premium at purchase.
There were no significant transfers of financial assets between Levels 1 and 2 during the period.
At February 28, 2011, the Fund held the following open long futures contracts:
| | | | | | | | | | | | | | | | | | | | |
Risk
Exposure/
Type | | Number of
Contracts | | | Value | | | Aggregate
Face Value | | | Expiration
Date | | | Unrealized
Depreciation | |
Equity Risk | | | | | | | | | | | | | | | | | | | | |
S&P 500 Index | | | 18 | | | $ | 5,967,450 | | | $ | 5,978,586 | | | | March 2011 | | | $ | (11,136 | ) |
| | | | | | | | | | | | | | | | | | | | |
See Accompanying Notes to Financial Statements.
11
Columbia Large Cap Enhanced Core Fund
February 28, 2011
At February 28, 2011 the Fund held investments in the following sectors:
| | | | |
Sector (Unaudited) | | % of
Net Assets | |
Information Technology | | | 18.4 | |
Financials | | | 15.5 | |
Energy | | | 13.3 | |
Industrials | | | 11.2 | |
Health Care | | | 10.5 | |
Consumer Discretionary | | | 10.1 | |
Consumer Staples | | | 9.9 | |
Materials | | | 3.8 | |
Telecommunication Services | | | 3.0 | |
Utilities | | | 3.0 | |
| | | | |
| | | 98.7 | |
Short-Term Obligation | | | 0.8 | |
Other Assets & Liabilities, Net | | | 0.5 | |
| | | | |
| | | 100.0 | |
| | | | |
See Accompanying Notes to Financial Statements.
12
Statement of Assets and Liabilities – Columbia Large Cap Enhanced Core Fund
February 28, 2011
| | | | | | |
| | | | | ($) | |
| Assets | | Investments, at identified cost | | | 285,738,590 | |
| | | | | | |
| | Investments, at value | | | 414,690,059 | |
| | Cash | | | 3,871 | |
| | Receivable for: | | | | |
| | Investments sold | | | 3,508,922 | |
| | Fund shares sold | | | 72,984 | |
| | Dividends | | | 1,208,909 | |
| | Interest | | | 9 | |
| | Futures variation margin | | | 37,744 | |
| | Foreign tax reclaims | | | 723 | |
| | Expense reimbursement due from Investment Manager | | | 39,128 | |
| | Prepaid expenses | | | 1,856 | |
| | | | | | |
| | Total Assets | | | 419,564,205 | |
| | |
| Liabilities | | Payable for: | | | | |
| | Fund shares repurchased | | | 2,522,559 | |
| | Investment advisory fee | | | 113,373 | |
| | Administration fee | | | 47,046 | |
| | Pricing and bookkeeping fees | | | 8,361 | |
| | Transfer agent fee | | | 74,893 | |
| | Trustees’ fees | | | 69,955 | |
| | Custody fee | | | 5,000 | |
| | Distribution and service fees | | | 2,417 | |
| | Audit fees | | | 27,900 | |
| | Legal fees | | | 35,232 | |
| | Chief compliance officer expenses | | | 228 | |
| | Interest payable | | | 425 | |
| | Other liabilities | | | 10,836 | |
| | | | | | |
| | Total Liabilities | | | 2,918,225 | |
| | |
| | | | | | |
| | Net Assets | | | 416,645,980 | |
| | |
| Net Assets Consist of | | Paid-in capital | | | 484,686,332 | |
| | Undistributed net investment income | | | 927,647 | |
| | Accumulated net realized loss | | | (197,908,332 | ) |
| | Net unrealized appreciation (depreciation) on: | | | | |
| | Investments | | | 128,951,469 | |
| | Futures contracts | | | (11,136 | ) |
| | | | | | |
| | Net Assets | | | 416,645,980 | |
See Accompanying Notes to Financial Statements.
13
Statement of Assets and Liabilities (continued) – Columbia Large Cap Enhanced Core Fund
February 28, 2011
| | | | | | |
| | | | | | |
| | |
| Class A | | Net assets | | $ | 12,212,716 | |
| | Shares outstanding | | | 953,482 | |
| | Net asset value and offering price per share | | $ | 12.81 | |
| | |
| Class I (a) | | Net assets | | $ | 7,465,604 | |
| | Shares outstanding | | | 584,304 | |
| | Net asset value, offering and redemption price per share | | $ | 12.78 | |
| | |
| Class R | | Net assets | | $ | 174,896 | |
| | Shares outstanding | | | 13,664 | |
| | Net asset value and offering price per share | | $ | 12.80 | |
| | |
| Class Y | | Net assets | | $ | 31,588,132 | |
| | Shares outstanding | | | 2,470,730 | |
| | Net asset value and offering price per share | | $ | 12.78 | |
| | |
| Class Z | | Net assets | | $ | 365,204,632 | |
| | Shares outstanding | | | 28,587,089 | |
| | Net asset value and offering price per share | | $ | 12.78 | |
| (a) | Class I shares commenced operations on September 27, 2010. |
See Accompanying Notes to Financial Statements.
14
Statement of Operations – Columbia Large Cap Enhanced Core Fund
For the Year Ended February 28, 2011
| | | | | | |
| | | | | ($) (a) | |
| Investment Income | | Dividends | | | 9,882,739 | |
| | Interest | | | 5,615 | |
| | Foreign taxes withheld | | | (543 | ) |
| | | | | | |
| | Total Investment Income | | | 9,887,811 | |
| | |
| Expenses | | Investment advisory fee | | | 1,600,657 | |
| | Administration fee | | | 672,650 | |
| | Distribution fee: | | | | |
| | Class R | | | 573 | |
| | Distribution and service fees: | | | | |
| | Class A | | | 29,353 | |
| | Transfer agent fee: | | | | |
| | Class A, Class R and Class Z | | | 528,774 | |
| | Class Y | | | 56 | |
| | Pricing and bookkeeping fees | | | 109,119 | |
| | Trustees’ fees | | | 38,891 | |
| | Custody fee | | | 19,640 | |
| | Chief compliance officer expenses | | | 1,422 | |
| | Other expenses | | | 258,853 | |
| | | | | | |
| | Expenses before interest expense | | | 3,259,988 | |
| | Interest expense | | | 1,751 | |
| | | | | | |
| | Total Expenses | | | 3,261,739 | |
| | |
| | Fees waived or expenses reimbursed by Investment Manager | | | (55,704 | ) |
| | Expense reductions | | | (1 | ) |
| | | | | | |
| | Net Expenses | | | 3,206,034 | |
| | |
| | | | | | |
| | Net Investment Income | | | 6,681,777 | |
| | |
| Net Realized and Unrealized Gain (Loss) on Investments and Futures Contracts | | Net realized gain on: | | | | |
| | Investments | | | 66,318,890 | |
| | Futures contracts | | | 966,245 | |
| | | | | | |
| | Net realized gain | | | 67,285,135 | |
| | |
| | Net change in unrealized appreciation (depreciation) on: | | | | |
| | Investments | | | 12,146,062 | |
| | Futures contracts | | | (244,259 | ) |
| | | | | | |
| | Net change in unrealized appreciation (depreciation) | | | 11,901,803 | |
| | | | | | |
| | Net Gain | | | 79,186,938 | |
| | |
| | | | | | |
| | Net Increase Resulting from Operations | | | 85,868,715 | |
| (a) | Class I shares commenced operations on September 27, 2010. |
See Accompanying Notes to Financial Statements.
15
Statement of Changes in Net Assets – Columbia Large Cap Enhanced Core Fund
| | | | | | | | | | |
| Increase (Decrease) in Net Assets | | | | Year Ended
February 28,
2011 ($) (a)(b) | | | Year Ended
February 28,
2010 ($) | |
| Operations | | Net investment income | | | 6,681,777 | | | | 8,453,363 | |
| | Net realized gain on investments and futures contracts | | | 67,285,135 | | | | 2,056,673 | |
| | Net change in unrealized appreciation (depreciation) on investments and futures contracts | | | 11,901,803 | | | | 190,260,766 | |
| | | | | | | | | | |
| | Net increase resulting from operations | | | 85,868,715 | | | | 200,770,802 | |
| | | |
| Distributions to Shareholders | | From net investment income: | | | | | | | | |
| | Class A | | | (142,166 | ) | | | (196,553 | ) |
| | Class I | | | (38 | ) | | | — | |
| | Class R | | | (1,179 | ) | | | (1,165 | ) |
| | Class Y | | | (458,353 | ) | | | (773,782 | ) |
| | Class Z | | | (5,796,706 | ) | | | (8,510,569 | ) |
| | | | | | | | | | |
| | Total distributions to shareholders | | | (6,398,442 | ) | | | (9,482,069 | ) |
| | | |
| | Net Capital Stock Transactions | | | (187,436,361 | ) | | | (58,647,389 | ) |
| | Increase from regulatory settlements | | | — | | | | 3,773 | |
| | | | | | | | | | |
| | Total increase (decrease) in net assets | �� | | (107,966,088 | ) | | | 132,645,117 | |
| | | |
Net Assets | | Beginning of period | | | 524,612,068 | | | | 391,966,951 | |
| | End of period | | | 416,645,980 | | | | 524,612,068 | |
| | Undistributed net investment income at end of period | | | 927,647 | | | | 644,315 | |
| (a) | Class I shares commenced operations on September 27, 2010. |
| (b) | Class I shares reflect activity for the period September 27 2010 through February 28, 2011. |
See Accompanying Notes to Financial Statements.
16
|
| Statement of Changes in Net Assets (continued) – Columbia Large Cap Enhanced Core Fund |
| | | | | | | | | | | | | | | | |
| | | Capital Stock Activity | |
| | | Year Ended
February 28, 2011 | | | Year Ended
February 28, 2010 | |
| | | Shares | | | Dollars ($) | | | Shares | | | Dollars ($) | |
Class A | | | | | | | | | | | | | | | | |
Subscriptions | | | 96,908 | | | | 1,096,367 | | | | 116,859 | | | | 1,131,052 | |
Distributions reinvested | | | 5,732 | | | | 67,413 | | | | 15,299 | | | | 157,249 | |
Redemptions | | | (300,096 | ) | | | (3,370,740 | ) | | | (264,447 | ) | | | (2,636,744 | ) |
| | | | | | | | | | | | | | | | |
Net decrease | | | (197,456 | ) | | | (2,206,960 | ) | | | (132,289 | ) | | | (1,348,443 | ) |
| | | | |
Class I (a)(b) | | | | | | | | | | | | | | | | |
Subscriptions | | | 713,340 | | | | 8,467,866 | | | | — | | | | — | |
Redemptions | | | (129,036 | ) | | | (1,587,814 | ) | | | — | | | | — | |
| | | | | | | | | | | | | | | | |
Net increase | | | 584,304 | | | | 6,880,052 | | | | — | | | | — | |
| | | | |
Class R | | | | | | | | | | | | | | | | |
Subscriptions | | | 5,935 | | | | 72,269 | | | | 6,304 | | | | 61,414 | |
Distributions reinvested | | | 99 | | | | 1,179 | | | | 112 | | | | 1,165 | |
Redemptions | | | (2,786 | ) | | | (31,414 | ) | | | (1,396 | ) | | | (11,676 | ) |
| | | | | | | | | | | | | | | | |
Net increase | | | 3,248 | | | | 42,034 | | | | 5,020 | | | | 50,903 | |
| | | | |
Class Y | | | | | | | | | | | | | | | | |
Subscriptions | | | 21,371 | | | | 229,000 | | | | 5,690,356 | | | | 53,539,583 | |
Distributions reinvested | | | 24,439 | | | | 287,432 | | | | 26,473 | | | | 281,937 | |
Redemptions | | | (3,213,455 | ) | | | (35,542,959 | ) | | | (78,454 | ) | | | (818,000 | ) |
| | | | | | | | | | | | | | | | |
Net increase (decrease) | | | (3,167,645 | ) | | | (35,026,527 | ) | | | 5,638,375 | | | | 53,003,520 | |
| | | | |
Class Z | | | | | | | | | | | | | | | | |
Subscriptions | | | 1,788,867 | | | | 19,995,993 | | | | 6,113,432 | | | | 55,650,307 | |
Distributions reinvested | | | 30,932 | | | | 363,005 | | | | 139,723 | | | | 1,425,898 | |
Redemptions | | | (15,463,550 | ) | | | (177,483,958 | ) | | | (17,028,334 | ) | | | (167,429,574 | ) |
| | | | | | | | | | | | | | | | |
Net decrease | | | (13,643,751 | ) | | | (157,124,960 | ) | | | (10,775,179 | ) | | | (110,353,369 | ) |
| (a) | Class I shares commenced operations on September 27, 2010. |
| (b) | Class I shares reflect activity for the period September 27, 2010 through February 28, 2011. |
See Accompanying Notes to Financial Statements.
17
Financial Highlights – Columbia Large Cap Enhanced Core Fund
Selected data for a share outstanding throughout each period is as follows:
| | | | | | | | | | | | | | | | | | | | | | | | |
| | | Year Ended February 28, | | | Year Ended
February 29, | | | Period Ended
February 28, | | | Year Ended
March 31, | |
| Class A Shares | | 2011 | | | 2010 | | | 2009 | | | 2008 | | | 2007 (a) | | | 2006 (b) | |
Net Asset Value, Beginning of Period | | $ | 10.73 | | | $ | 7.24 | | | $ | 12.91 | | | $ | 14.58 | | | $ | 14.13 | | | $ | 13.41 | |
| | | | | |
Income from Investment Operations: | | | | | | | | | | | | | | | | | | | | | |
Net investment income (c) | | | 0.14 | | | | 0.13 | | | | 0.18 | | | | 0.19 | | | | 0.16 | | | | 0.17 | |
Net realized and unrealized gain (loss) on investments, foreign currency, swap contracts, futures contracts and written options | | | 2.08 | | | | 3.52 | | | | (5.69 | ) | | | (0.85 | ) | | | 1.24 | | | | 1.42 | |
| | | | | | | | | | | | | | | | | | | | | | | | |
Total from investment operations | | | 2.22 | | | | 3.65 | | | | (5.51 | ) | | | (0.66 | ) | | | 1.40 | | | | 1.59 | |
| | | | | | |
Less Distributions to Shareholders: | | | | | | | | | | | | | | | | | | | | | | | | |
From net investment income | | | (0.14 | ) | | | (0.16 | ) | | | (0.16 | ) | | | (0.15 | ) | | | (0.14 | ) | | | (0.15 | ) |
From net realized gains | | | — | | | | — | | | | — | | | | (0.86 | ) | | | (0.81 | ) | | | (0.72 | ) |
| | | | | | | | | | | | | | | | | | | | | | | | |
Total distributions to shareholders | | | (0.14 | ) | | | (0.16 | ) | | | (0.16 | ) | | | (1.01 | ) | | | (0.95 | ) | | | (0.87 | ) |
| | | | | | |
Increase from regulatory settlements | | | — | | | | — | (d) | | | — | | | | — | | | | — | | | | — | |
| | | | | | |
Net Asset Value, End of Period | | $ | 12.81 | | | $ | 10.73 | | | $ | 7.24 | | | $ | 12.91 | | | $ | 14.58 | | | $ | 14.13 | |
Total return (e)(f) | | | 20.84 | % | | | 50.49 | % | | | (42.89 | )% | | | (5.29 | )% | | | 10.56 | %(g) | | | 12.35 | % |
| | | | |
Ratios to Average Net Assets/Supplemental Data: | | | | | | | | | | | | | | | | | |
Net expenses before interest expense (h) | | | 0.95 | % | | | 0.89 | % | | | 0.75 | % | | | 0.75 | % | | | 0.75 | %(i) | | | 0.75 | % |
Interest expense | | | — | %(j) | | | — | %(j) | | | — | %(j) | | | — | | | | — | | | | — | |
Net expenses (h) | | | 0.95 | % | | | 0.89 | % | | | 0.75 | % | | | 0.75 | % | | | 0.75 | %(i) | | | 0.75 | % |
Waiver/Reimbursement | | | 0.01 | % | | | 0.03 | % | | | 0.07 | % | | | 0.04 | % | | | 0.08 | %(i) | | | 0.15 | %(k) |
Net investment income (h) | | | 1.22 | % | | | 1.39 | % | | | 1.63 | % | | | 1.28 | % | | | 1.26 | %(i) | | | 1.23 | % |
Portfolio turnover rate | | | 63 | % | | | 122 | % | | | 246 | % | | | 207 | % | | | 230 | %(g) | | | 269 | % |
Net assets, end of period (000s) | | $ | 12,213 | | | $ | 12,348 | | | $ | 9,291 | | | $ | 17,281 | | | $ | 17,399 | | | $ | 18,508 | |
| (a) | The Fund changed its fiscal year end from March 31 to February 28. Per share data and total return reflect activity from April 1, 2006 through February 28, 2007. |
| (b) | On August 22, 2005, the existing Investor A shares were renamed Class A shares. |
| (c) | Per share data was calculated using the average shares outstanding during the period. |
| (d) | Rounds to less than $0.01 per share. |
| (e) | Total return at net asset value assuming all distributions reinvested. |
| (f) | Had the Investment Manager and/or any of its affiliates not waived fees or reimbursed a portion of expenses, total return would have been reduced. |
| (h) | The benefits derived from expense reductions had an impact of less than 0.01%. |
| (j) | Rounds to less than 0.01%. |
| (k) | Bank of America Corporation assumed certain non-recurring costs. Absent these non-recurring costs, the waiver/reimbursement ratio would have been 0.09% for the year ended March 31, 2006. |
See Accompanying Notes to Financial Statements.
18
Financial Highlights – Columbia Large Cap Enhanced Core Fund
Selected data for a share outstanding throughout the period is as follows:
| | | | |
| Class I Shares | | Period Ended
February 28,
2011 (a) | |
Net Asset Value, Beginning of Period | | $ | 11.11 | |
| |
Income from Investment Operations: | | | | |
Net investment income (b) | | | 0.09 | |
Net realized and unrealized gain on investments and futures contracts | | | 1.75 | |
| | | | |
Total from investment operations | | | 1.84 | |
| |
Less Distributions to Shareholders: | | | | |
From net investment income | | | (0.17 | ) |
| |
Net Asset Value, End of Period | | $ | 12.78 | |
Total return (c)(d)(e) | | | 16.65 | % |
| |
Ratios to Average Net Assets/Supplemental Data: | | | | |
Net expenses before interest expense (f)(g) | | | 0.57 | % |
Interest expense (g)(h) | | | — | % |
Net expenses (f)(g) | | | 0.57 | % |
Waiver/Reimbursement (g) | | | 0.02 | % |
Net investment income (f)(g) | | | 1.68 | % |
Portfolio turnover rate (d) | | | 63 | % |
Net assets, end of period (000s) | | $ | 7,466 | |
| (a) | Class I shares commenced operations on September 27, 2010. Per share data and total return reflect activity from that date. |
| (b) | Per share data was calculated using the average shares outstanding during the period. |
| (c) | Total return at net asset value assuming all distributions reinvested. |
| (e) | Had the Investment Manager and/or any of its affiliates not waived fees or reimbursed a portion of expenses, total return would have been reduced. |
| (f) | The benefits derived from expense reductions had an impact of less than 0.01%. |
| (h) | Rounds to less than 0.01%. |
See Accompanying Notes to Financial Statements.
19
Financial Highlights – Columbia Large Cap Enhanced Core Fund
Selected data for a share outstanding throughout each period is as follows:
| | | | | | | | | | | | | | | | | | | | | | | | |
| | | Year Ended February 28, | | | Year Ended
February 29, | | | Period Ended
February 28, | | | Period Ended
March 31, | |
| Class R Shares | | 2011 | | | 2010 | | | 2009 | | | 2008 | | | 2007 (a) | | | 2006 (b) | |
Net Asset Value, Beginning of Period | | $ | 10.72 | | | $ | 7.24 | | | $ | 12.90 | | | $ | 14.58 | | | $ | 14.13 | | | $ | 13.68 | |
| | | | | | |
Income from Investment Operations: | | | | | | | | | | | | | | | | | | | | | | | | |
Net investment income (c) | | | 0.12 | | | | 0.11 | | | | 0.16 | | | | 0.16 | | | | 0.13 | | | | 0.03 | |
Net realized and unrealized gain (loss) on investments, foreign currency, swap contracts, futures contracts and written options | | | 2.08 | | | | 3.51 | | | | (5.69 | ) | | | (0.86 | ) | | | 1.23 | | | | 0.42 | |
| | | | | | | | | | | | | | | | | | | | | | | | |
Total from investment operations | | | 2.20 | | | | 3.62 | | | | (5.53 | ) | | | (0.70 | ) | | | 1.36 | | | | 0.45 | |
| | | | | | |
Less Distributions to Shareholders: | | | | | | | | | | | | | | | | | | | | | | | | |
From net investment income | | | (0.12 | ) | | | (0.14 | ) | | | (0.13 | ) | | | (0.12 | ) | | | (0.10 | ) | | | — | |
From net realized gains | | | — | | | | — | | | | — | | | | (0.86 | ) | | | (0.81 | ) | | | — | |
| | | | | | | | | | | | | | | | | | | | | | | | |
Total distributions to shareholders | | | (0.12 | ) | | | (0.14 | ) | | | (0.13 | ) | | | (0.98 | ) | | | (0.91 | ) | | | — | |
| | | | | | |
Increase from regulatory settlements | | | — | | | | — | (d) | | | — | | | | — | | | | — | | | | — | |
| | | | | | |
Net Asset Value, End of Period | | $ | 12.80 | | | $ | 10.72 | | | $ | 7.24 | | | $ | 12.90 | | | $ | 14.58 | | | $ | 14.13 | |
Total return (e)(f) | | | 20.58 | % | | | 50.02 | % | | | (43.01 | )% | | | (5.57 | )% | | | 10.30 | %(g) | | | 3.29 | %(g) |
| | | | | | |
Ratios to Average Net Assets/Supplemental Data: | | | | | | | | | | | | | | | | | | | | | | | | |
Net expenses before interest expense (h) | | | 1.20 | % | | | 1.14 | % | | | 1.00 | % | | | 1.00 | % | | | 1.00 | %(i) | | | 1.00 | %(i) |
Interest expense | | | — | %(j) | | | — | %(j) | | | — | %(j) | | | — | | | | — | | | | — | |
Net expenses (h) | | | 1.20 | % | | | 1.14 | % | | | 1.00 | % | | | 1.00 | % | | | 1.00 | %(i) | | | 1.00 | %(i) |
Waiver/Reimbursement | | | 0.01 | % | | | 0.03 | % | | | 0.07 | % | | | 0.04 | % | | | 0.08 | %(i) | | | 0.09 | %(i)(k) |
Net investment income (h) | | | 1.02 | % | | | 1.08 | % | | | 1.46 | % | | | 1.09 | % | | | 1.02 | %(i) | | | 0.91 | %(i) |
Portfolio turnover rate | | | 63 | % | | | 122 | % | | | 246 | % | | | 207 | % | | | 230 | %(g) | | | 269 | %(g) |
Net assets, end of period (000s) | | $ | 175 | | | $ | 112 | | | $ | 39 | | | $ | 46 | | | $ | 11 | | | $ | 10 | |
| (a) | The Fund changed its fiscal year end from March 31 to February��28. Per share data and total return reflect activity from April 1, 2006 through February 28, 2007. |
| (b) | Class R shares commenced operations on January 23, 2006. Per share data and total return reflect activity from that date. |
| (c) | Per share data was calculated using the average shares outstanding during the period. |
| (d) | Rounds to less than $0.01 per share. |
| (e) | Total return at net asset value assuming all distributions reinvested. |
| (f) | Had the Investment Manager and/or any of its affiliates not waived fees or reimbursed a portion of expenses, total return would have been reduced. |
| (h) | The benefits derived from expense reductions had an impact of less than 0.01%. |
| (j) | Rounds to less than 0.01%. |
| (k) | Bank of America Corporation assumed certain non-recurring costs. Absent these non-recurring costs, the waiver/reimbursement ratio would have been 0.03% for the period ended March 31, 2006. |
See Accompanying Notes to Financial Statements.
20
Financial Highlights – Columbia Large Cap Enhanced Core Fund
Selected data for a share outstanding throughout each period is as follows:
| | | | | | | | |
| Class Y Shares | | Year Ended
February 28,
2011 | | | Period Ended
February 28,
2010 (a) | |
Net Asset Value, Beginning of Period | | $ | 10.70 | | | $ | 9.10 | |
| | |
Income from Investment Operations: | | | | | | | | |
Net investment income (b) | | | 0.17 | | | | 0.11 | |
Net realized and unrealized gain on investments and futures contracts | | | 2.09 | | | | 1.64 | |
| | | | | | | | |
Total from investment operations | | | 2.26 | | | | 1.75 | |
| | |
Less Distributions to Shareholders: | | | | | | | | |
From net investment income | | | (0.18 | ) | | | (0.15 | ) |
| | |
Net Asset Value, End of Period | | $ | 12.78 | | | $ | 10.70 | |
Total return (c) | | | 21.30 | %(h) | | | 19.23 | %(d) |
| | |
Ratios to Average Net Assets/Supplemental Data: | | | | | | | | |
Net expenses before interest expense (e) | | | 0.58 | % | | | 0.57 | %(f) |
Interest expense (g) | | | — | % | | | — | %(f) |
Net expense (e) | | | 0.58 | % | | | 0.57 | %(f) |
Waiver/Reimbursement | | | 0.01 | % | | | — | |
Net investment income (e) | | | 1.53 | % | | | 1.62 | %(f) |
Portfolio turnover rate | | | 63 | % | | | 122 | %(d) |
Net assets, end of period (000s) | | $ | 31,588 | | | $ | 60,329 | |
| (a) | Class Y shares commenced operations on July 15, 2009. Per share data and total return reflect activity from that date. |
| (b) | Per share data was calculated using the average shares outstanding during the period. |
| (c) | Total return at net asset value assuming all distributions reinvested. |
| (e) | The benefits derived from expense reductions had an impact of less than 0.01%. |
| (g) | Rounds to less than 0.01%. |
| (h) | Had the Investment Manager and/or any of its affiliates not waived fees or reimbursed a portion of expenses, total return would have been reduced. |
See Accompanying Notes to Financial Statements.
21
Financial Highlights – Columbia Large Cap Enhanced Core Fund
Selected data for a share outstanding throughout each period is as follows:
| | | | | | | | | | | | | | | | | | | | | | | | |
| | | Year Ended February 28, | | | Year Ended
February 29, | | | Period Ended
February 28, | | | Year Ended
March 31, | |
| Class Z Shares | | 2011 | | | 2010 | | | 2009 | | | 2008 | | | 2007 (a) | | | 2006 (b) | |
Net Asset Value, Beginning of Period | | $ | 10.70 | | | $ | 7.22 | | | $ | 12.90 | | | $ | 14.60 | | | $ | 14.18 | | | $ | 13.45 | |
| | | | | | |
Income from Investment Operations: | | | | | | | | | | | | | | | | | | | | | | | | |
Net investment income (c) | | | 0.16 | | | | 0.16 | | | | 0.21 | | | | 0.23 | | | | 0.20 | | | | 0.20 | |
Net realized and unrealized gain (loss) on investments, foreign currency, swap contracts, futures contracts and written options | | | 2.09 | | | | 3.50 | | | | (5.68 | ) | | | (0.85 | ) | | | 1.23 | | | | 1.44 | |
| | | | | | | | | | | | | | | | | | | | | | | | |
Total from investment operations | | | 2.25 | | | | 3.66 | | | | (5.47 | ) | | | (0.62 | ) | | | 1.43 | | | | 1.64 | |
| | | | | | |
Less Distributions to Shareholders: | | | | | | | | | | | | | | | | | | | | | | | | |
From net investment income | | | (0.17 | ) | | | (0.18 | ) | | | (0.21 | ) | | | (0.22 | ) | | | (0.20 | ) | | | (0.19 | ) |
From net realized gains | | | — | | | | — | | | | — | | | | (0.86 | ) | | | (0.81 | ) | | | (0.72 | ) |
| | | | | | | | | | | | | | | | | | | | | | | | |
Total distributions to shareholders | | | (0.17 | ) | | | (0.18 | ) | | | (0.21 | ) | | | (1.08 | ) | | | (1.01 | ) | | | (0.91 | ) |
| | | | | | |
Increase from regulatory settlements | | | — | | | | — | (d) | | | — | | | | — | | | | — | | | | — | |
| | | | | | |
Net Asset Value, End of Period | | $ | 12.78 | | | $ | 10.70 | | | $ | 7.22 | | | $ | 12.90 | | | $ | 14.60 | | | $ | 14.18 | |
Total return (e)(f) | | | 21.18 | % | | | 50.82 | % | | | (42.69 | )% | | | (5.10 | )% | | | 10.79 | %(g) | | | 12.66 | % |
| | | | | | |
Ratios to Average Net Assets/Supplemental Data: | | | | | | | | | | | | | | | | | | | | | | | | |
Net expenses before interest expense (h) | | | 0.70 | % | | | 0.64 | % | | | 0.50 | % | | | 0.50 | % | | | 0.50 | %(i) | | | 0.50 | % |
Interest expense | | | — | %(j) | | | — | %(j) | | | — | %(j) | | | — | | | | — | | | | — | |
Net expenses (h) | | | 0.70 | % | | | 0.64 | % | | | 0.50 | % | | | 0.50 | % | | | 0.50 | %(i) | | | 0.50 | % |
Waiver/Reimbursement | | | 0.01 | % | | | 0.03 | % | | | 0.07 | % | | | 0.04 | % | | | 0.08 | %(i) | | | 0.15 | %(k) |
Net investment income (h) | | | 1.46 | % | | | 1.65 | % | | | 1.86 | % | | | 1.54 | % | | | 1.52 | %(i) | | | 1.49 | % |
Portfolio turnover rate | | | 63 | % | | | 122 | % | | | 246 | % | | | 207 | % | | | 230 | %(g) | | | 269 | % |
Net assets, end of period (000s) | | $ | 365,205 | | | $ | 451,824 | | | $ | 382,637 | | | $ | 796,550 | | | $ | 610,807 | | | $ | 495,099 | |
| (a) | The Fund changed its fiscal year end from March 31 to February 28. Per share data and total return reflect activity from April 1, 2006 through February 28, 2007. |
| (b) | On August 22, 2005, the Fund’s Primary A shares were renamed Class Z shares. |
| (c) | Per share data was calculated using the average shares outstanding during the period. |
| (d) | Rounds to less than $0.01 per share. |
| (e) | Total return at net asset value assuming all distributions reinvested. |
| (f) | Had the Investment Manager and/or any of its affiliates not waived fees or reimbursed a portion of expenses, total return would have been reduced. |
| (h) | The benefits derived from expense reductions had an impact of less than 0.01%. |
| (j) | Rounds to less than 0.01%. |
| (k) | Bank of America Corporation assumed certain non-recurring costs. Absent these non-recurring costs, the waiver/reimbursement ratio would have been 0.09% for the year ended March 31, 2006. |
See Accompanying Notes to Financial Statements.
22
Notes to Financial Statements – Columbia Large Cap Enhanced Core Fund
February 28, 2011
Note 1. Organization
Columbia Large Cap Enhanced Core Fund (the Fund), a series of Columbia Funds Series Trust (the Trust), is a diversified fund. The Trust is registered under the Investment Company Act of 1940, as amended (the 1940 Act), as an open-end management investment company organized as a Delaware statutory trust.
After the close of business on April 30, 2010, Ameriprise Financial, Inc. (Ameriprise Financial) acquired a portion of the asset management business of Columbia Management Group, LLC (the Transaction), including the business of managing the Fund. In connection with the closing of the Transaction (the Closing), RiverSource Investments, LLC, a wholly owned subsidiary of Ameriprise Financial, became the investment manager of the Fund and changed its name to Columbia Management Investment Advisers, LLC (the Investment Manager).
Investment Objective
The Fund seeks total return before fees and expenses that exceeds the total return of the Standard & Poor’s 500 Index.
Fund Shares
The Trust has unlimited authorized shares of beneficial interest. The Fund offers Class A, Class I, Class R, Class Y and Class Z shares. On December 17, 2010, the Investment Manager exchanged Class Z shares valued at $8,436,579 for Class I shares. All share classes have identical voting, dividend and liquidation rights. Each share class has its own expense structure and sales charges, as applicable.
Class A shares are not subject to sales charges.
Class I shares are not subject to sales charges and are available only to the Columbia Family of Funds. Class I shares became effective September 27, 2010.
Class R shares are not subject to sales charges and are available only to qualifying institutional investors.
Class Y shares are not subject to sales charges and are available only to certain investors, as described in the Fund’s prospectus.
Class Z shares are not subject to sales charges and are available only to certain investors, as described in the Fund’s prospectus.
Note 2. Summary of Significant Accounting Policies
The preparation of financial statements in accordance with U.S. generally accepted accounting principles (GAAP) requires the Investment Manager to make certain estimates and assumptions that affect the reported amounts of assets and liabilities, the disclosure of contingent assets and liabilities at the date of the financial statements and the reported amounts of revenue and expenses during the reporting period. Actual results could differ from those estimates.
The following is a summary of significant accounting policies consistently followed by the Fund in the preparation of its financial statements.
Security Valuation
Equity securities, exchange-traded funds and securities of certain investment companies are valued at the last sale price on the principal exchange on which they trade, except for securities traded on the NASDAQ, which are valued at the NASDAQ official close price. Unlisted securities or listed securities for which there were no sales during the day are valued at the closing bid price on such exchanges or over-the-counter markets.
Short-term investments maturing in 60 days or less are valued at amortized cost, which approximates market value.
Futures contracts are valued at the settlement price established each day by the board of trade or exchange on which they are traded.
Investments for which market quotations are not readily available, or that have quotations which the Investment Manager believes are not reliable, are valued at fair value as determined in good faith under consistently applied procedures established by and under the general supervision of the Board of Trustees. If a security is valued at fair value, such value is likely to be different from the last quoted market price for the security. The determination of fair value often requires significant judgment. To determine fair value, the Investment Manager may use assumptions including but not limited to future cash flows and estimated risk premiums. Multiple inputs from various sources may be used to determine value.
Derivative Instruments
The Fund may use derivative instruments including futures contracts in order to meet its investment objectives. The Fund employs strategies in differing combinations to permit it to increase, decrease or change the level of exposure to market risk factors. The achievement of any strategy relating to derivatives depends on an analysis of various risk factors, and if the strategies for the use of derivatives do not work as intended, the Fund may not achieve its investment objectives.
23
Columbia Large Cap Enhanced Core Fund
February 28, 2011
In pursuit of its investment objectives, the Fund is exposed to the following market risk, among others:
Equity Risk: Equity risk relates to change in value of equity securities such as common stocks due to general market conditions such as real or perceived adverse economic conditions, changes in the general outlook for corporate earnings, or adverse investor sentiment. Equity securities generally have greater price volatility than fixed income securities.
The following notes provides more detailed information about the derivative type held by the Fund:
Futures Contracts: The Fund entered into equity index futures contracts to equitize cash in order to maintain appropriate equity market exposure while keeping sufficient cash to accommodate daily redemptions.
The use of futures contracts involves certain risks, which include, among others: (1) imperfect correlation between the price movement of the instruments and the underlying securities, (2) inability to close out positions due to differing trading hours, or the temporary absence of a liquid market, for either the instruments or the underlying securities, and (3) an inaccurate prediction of the future direction of interest rates by the Fund’s Investment Manager. In addition, upon entering into index futures contracts, the Fund bears risks which may include securities prices moving unexpectedly, in which case, the Fund may not achieve the anticipated benefits of the futures contracts and may realize a loss.
Upon entering into a futures contract, the Fund identifies within its portfolio of investments cash or securities in an amount sufficient to meet the initial margin requirement. Subsequent payments are made or received by the Fund equal to the daily change in the contract value and are recorded as variation margin receivable or payable and offset in unrealized gains or losses. The Fund recognizes a realized gain or loss when the contract is closed or expires.
Futures contracts involve, to varying degrees, risk of loss in excess of the variation margin disclosed on the Statement of Assets and Liabilities.
During the year ended February 28, 2011, the Fund entered into 707 futures contracts.
Effects of Derivative Transactions in the Financial Statements
The following table is a summary of the value of the Fund’s derivative instruments as of February 28, 2011.
| | | | | | |
| Fair Value of Derivative Instruments |
| Statement of Assets and Liabilities |
| Assets | | Fair Value* | | Liabilities | | Fair Value* |
| Futures Variation Margin | | $37,744 | | — | | $— |
| * | Includes only the current day’s variation margin. |
The effect of derivative instruments on the Statement of Operations for the year ended February 28, 2011:
| | | | | | |
| | |
| | | Amount of Realized Gain or (Loss) and Change in Unrealized Appreciation (Depreciation) on Derivatives Recognized in Income | |
| Equity Risk | | Net Realized Gain | | Change
in Unrealized
Appreciation
(Depreciation) | |
| Futures Contracts | | $966,245 | | $ | (244,259 | ) |
Repurchase Agreements
The Fund may engage in repurchase agreement transactions with institutions that the Investment Manager has determined are creditworthy. The Fund, through the custodian, receives delivery of the underlying securities collateralizing a repurchase agreement. The Investment Manager is responsible for determining that the collateral is at least equal, at all times, to the value of the repurchase obligation including interest. A repurchase agreement transaction involves certain risks in the event of default or insolvency of the counterparty. These risks include possible delays in or restrictions on the Fund’s ability to dispose of the underlying securities and a possible decline in the value of the underlying securities during the period while the Fund seeks to assert its rights.
Security Transactions
Security transactions are accounted for on the trade date. Cost is determined and gains (losses) are based upon the specific identification method for both financial statement and federal income tax purposes.
Income Recognition
Interest income is recorded on the accrual basis.
Corporate actions and dividend income are recorded net of any non-reclaimable tax withholdings, on the ex-dividend date or upon receipt of ex-dividend notification in the case of certain foreign securities.
24
Columbia Large Cap Enhanced Core Fund
February 28, 2011
Awards from class action litigation are recorded as a reduction of cost if the Fund still owns the applicable securities on the payment date. If the Fund no longer owns the applicable securities, the proceeds are recorded as realized gains.
The Fund receives information regarding the character of distributions received from real estate investment trusts (REITs) on an annual basis. Distributions received from REITs are allocated among dividend income, capital gain and return of capital based upon such information or based on management’s estimates if actual information has not yet been reported. Management’s estimates are subsequently adjusted when the actual character of the distributions are disclosed by the REITs which could result in a proportionate increase in returns of capital to shareholders.
Distributions received from real estate investment trusts (REITs) in excess of their income are recorded as a reduction of the cost of the related investments. If the Fund no longer owns the applicable securities, any distributions received in excess of income are recorded as realized gains.
Expenses
General expenses of the Trust are allocated to the Fund and other series of the Trust based upon relative net assets or other expense allocation methodologies determined by the nature of the expense. Expenses directly attributable to a specific class of shares are charged to that share class. Expenses directly attributable to the Fund are charged to the Fund.
Determination of Class Net Asset Value
All income, expenses (other than class-specific expenses which are charged directly to a share class, as shown in the Statement of Operations) and realized and unrealized gains (losses) are allocated to each class of the Fund on a daily basis, based on the relative net assets of each class, for purposes of determining the net asset value of each class.
Federal Income Tax Status
The Fund intends to qualify each year as a regulated investment company under Subchapter M of the Internal Revenue Code, as amended, and will distribute substantially all of its taxable income, if any, for its tax year, and as such will not be subject to federal income taxes. In addition, the Fund intends to distribute in each calendar year substantially all of its net investment income, capital gains and certain other amounts, if any, such that the Fund should not be subject to federal excise tax. Therefore, no federal income or excise tax provision is recorded.
Distributions to Shareholders
Distributions from net investment income, if any, are declared and paid semi-annually. Net realized capital gains, if any, are distributed at least annually. Income distributions and capital gain distributions are determined in accordance with federal income tax regulations which may differ from GAAP.
Indemnification
In the normal course of business, the Fund enters into contracts that contain a variety of representations and warranties and which provide general indemnities. The Fund’s maximum exposure under these arrangements is unknown because this would involve future claims against the Fund. Also, under the Trust’s organizational documents and by contract, the Trustees and officers of the Trust are indemnified against certain liabilities that may arise out of actions relating to their duties to the Trust. However, based on experience, the Fund expects the risk of loss due to these representations, warranties and indemnities to be minimal.
Note 3. Fees and Compensation Paid to Affiliates
Investment Management Services Fee
The Investment Manager determines which securities will be purchased, held or sold. The management fee is based on the Fund’s average daily net assets at the following annual rates:
| | |
| | | |
| Average Daily Net Assets | | Annual Fee Rate |
| First $500 million | | 0.35% |
| $500 million to $1 billion | | 0.30% |
| $1 billion to $1.5 billion | | 0.25% |
| $1.5 billion to $3 billion | | 0.20% |
| $3 billion to $6 billion | | 0.18% |
| Over $6 billion | | 0.16% |
Prior to the Closing, Columbia Management Advisors, LLC (Columbia), an indirect, wholly owned subsidiary of Bank of America Corporation (BOA), provided investment management services to the Fund under the same fee structure.
The effective management fee rate for the year ended February 28, 2011, was 0.35% of the Fund’s average daily net assets.
Administration Fee
Effective upon the Closing, the Investment Manager became the administrator of the Fund and provides administrative and other
25
Columbia Large Cap Enhanced Core Fund
February 28, 2011
services to the Fund, including services previously performed under the Pricing and Bookkeeping Oversight and Services Agreement discussed below. The administration fee is based on the annual rate of 0.17% of the Fund’s average daily net assets, less the fees payable by the Fund as described under the Pricing and Bookkeeping Fees note below. Prior to the Closing, Columbia provided administrative services to the Fund at the same fee rate.
Pricing and Bookkeeping Fees
Prior to the Closing, the Fund entered into a Financial Reporting Services Agreement (the Financial Reporting Services Agreement) with State Street Bank and Trust Company (State Street) and Columbia pursuant to which State Street provides financial reporting services to the Fund. The Fund also entered into an Accounting Services Agreement (collectively with the Financial Reporting Services Agreement, the State Street Agreements) with State Street and Columbia pursuant to which State Street provides accounting services to the Fund. Upon the Closing, Columbia assigned and delegated its rights and obligations under the State Street Agreements to the Investment Manager. Under the State Street Agreements, the Fund pays State Street an annual fee of $38,000 paid monthly plus an additional monthly fee based on an annualized percentage rate of average daily net assets of the Fund for the month. The aggregate fee will not exceed $140,000 per year (exclusive of out-of-pocket expenses and charges). The Fund also reimburses State Street for certain out-of-pocket expenses and charges.
Also prior to the Closing, the Fund entered into a Pricing and Bookkeeping Oversight and Services Agreement (the Services Agreement) with Columbia. Under the Services Agreement, Columbia provided services related to Fund expenses and the requirements of the Sarbanes-Oxley Act of 2002, and provided oversight of the accounting and financial reporting services provided by State Street. Under the Services Agreement, the Fund reimbursed Columbia for out-of-pocket expenses and charges, including fees payable to third parties, such as for pricing the Fund’s portfolio securities, incurred by Columbia in the performance of services under the Services Agreement. The Services Agreement was terminated upon the Closing. These services are now provided under the Administration Fee note discussed above.
Transfer Agent Fee
In connection with the Closing, RiverSource Service Corporation, a wholly owned subsidiary of Ameriprise Financial, became the transfer agent of the Fund and changed its name to Columbia Management Investment Services Corp. (the New Transfer Agent). The New Transfer Agent has contracted with Boston Financial Data Services (BFDS) to serve as sub-transfer agent. The New Transfer Agent receives monthly account-based service fees that vary by class and are based on the number of open accounts and asset-based fees, calculated based on assets held in omnibus accounts, which are intended to reimburse the New Transfer Agent for certain sub-transfer agent fees (exclusive of BFDS fees). The New Transfer Agent pays the fees of BFDS for services as sub-transfer agent and is not entitled to reimbursement for such fees from the Fund.
The New Transfer Agent receives reimbursement for certain out-of-pocket expenses and may also receive compensation for various shareholder services.
Prior to the Closing, Columbia Management Services, Inc., an affiliate of Columbia and an indirect, wholly owned subsidiary of BOA, provided shareholder services to the Fund and contracted with BFDS to serve as sub-transfer agent, under the same fee structure.
Class I shares do not pay transfer agent fees. For the year ended February 28, 2011, the Fund’s effective transfer agent fee rate for each class, with the exception of Class I shares, as a percentage of each class’ average daily net assets was as follows:
| | | | | | |
| | | | | | | |
| Class A | | Class R | | Class Y | | Class Z |
| 0.12% | | 0.12% | | 0.00%* | | 0.12% |
| * | Rounds to less than 0.01%. |
An annual minimum account balance fee of $20 may apply to certain accounts with a value below each Fund’s initial minimum investment requirements to reduce the impact of small accounts on transfer agent fees. These minimum account balance fees are recorded as part of expense reductions on the Statement of Operations. For the year ended February 28, 2011, no minimum account balance fees were charged by the Fund.
Underwriting Discounts, Distribution and Shareholder Servicing Fees
In connection with the Closing, RiverSource Fund Distributors, Inc., an indirect wholly owned subsidiary of Ameriprise Financial, became the distributor of the Fund and changed its name to Columbia Management Investment Distributors, Inc. (the New Distributor).
The Trust has adopted a distribution plan for the Class R shares of the Fund, and a combined distribution and shareholder servicing plan for the Class A shares of the Fund. The shareholder servicing
26
Columbia Large Cap Enhanced Core Fund
February 28, 2011
plans permit the Fund to compensate or reimburse servicing agents for the shareholder services they have provided. The distribution plan, adopted pursuant to Rule 12b-1 under the 1940 Act, permits the Fund to compensate or reimburse the New Distributor and/or selling agents for activities or expenses primarily intended to result in the sale of the classes’ shares. Payments are made at an annual rate and paid monthly, as a percentage of average daily net assets, set from time to time by the Board of Trustees, and are charged as expenses of the Fund directly to the applicable share class. A substantial portion of the expenses incurred pursuant to these plans is paid to affiliates of the New Distributor.
The annual rates in effect and plan limits, as a percentage of average daily net assets are as follows:
| | | | | | | | |
| | | | | | | |
| | | Current Rate | | | Plan Limit | |
Class A Combined Distribution and Shareholder Servicing Plan | | | 0.25 | % | | | 0.25 | % |
Class R Distribution Plan | | | 0.50 | % | | | 0.50 | % |
Prior to the Closing, Columbia Management Distributors, Inc, an affiliate of Columbia and an indirect, wholly owned subsidiary of BOA, was the principal underwriter of the Fund’s shares. There were no changes to the underwriting discount structure of the Fund or the service or distribution fee rates paid by the Fund as a result of the Transaction.
Expense Limits and Fee Waivers
Effective September 27, 2010, the Investment Manager has voluntarily agreed to reimburse a portion of the Fund’s expenses so that the Fund’s ordinary operating expenses (excluding brokerage commissions, interest, taxes and extraordinary expenses, but including custodian charges relating to overdrafts, if any), after giving effect to any balance credits from the Fund’s custodian, do not exceed the annual rates of 0.95%, 0.57%, 1.20% 0.70% and 0.70% of the Fund’s average daily net assets attributable to Class A, Class I, Class R, Class Y and Class Z shares, respectively. This arrangement may be modified or terminated by the Investment Manager at any time.
For the period May 1, 2010 through September 26, 2010, the Investment Manager voluntarily agreed to reimburse a portion of the Fund’s expenses so that the Fund’s ordinary operating expenses (excluding any distribution and service fees, brokerage commissions, interest, taxes and extraordinary expenses, but including custodian charges relating to overdrafts, if any), after giving effect to any balance credits from the Fund’s custodian, did not exceed 0.70% annually of the Fund’s average daily net assets. Prior to May 1, 2010, Columbia voluntarily reimbursed a portion of the Fund’s expenses in the same manner.
The Investment Manager is entitled to recover from the Fund any fees waived and/or expenses reimbursed for a three year period following the date of such fee waiver and/or reimbursement if such recovery does not cause the Fund’s expenses to exceed the expense limitations in effect at the time of recovery. Prior to May 1, 2010, Columbia was entitled to recover fees waived and/or expenses reimbursed from the Fund in the same manner.
At February 28, 2011, the amounts potentially recoverable by the Investment Manager pursuant to this arrangement were as follows:
| | | | | | | | | | | | | | | | | | | | |
| Amount of potential recovery expiring: | | | Total
potential | | | Amount Expired | | | Amount
recovered
during the year ended | |
| 2/28/2014 | | 2/28/2013 | | | 2/29/2012 | | | recovery | | | 02/28/11 | | | 02/28/11 | |
| $55,704 | | $ | 151,553 | | | $ | 431,216 | | | $ | 638,473 | | | $ | 366,741 | | | $ | — | |
Fees Paid to Officers and Trustees
Upon the Closing, all officers of the Fund are employees of the Investment Manager or its affiliates and, with the exception of the Fund’s Chief Compliance Officer, receive no compensation from the Fund. The Board of Trustees has appointed a Chief Compliance Officer to the Fund in accordance with federal securities regulations. The Fund, along with other affiliated funds, pays its pro-rata share of the expenses associated with the Chief Compliance Officer. The Fund’s expenses for the Chief Compliance Officer will not exceed $15,000 per year. Prior to the Closing, all officers of the Fund were employees of Columbia or its affiliates and the Fund paid its pro-rata share of the expenses for the Chief Compliance Officer under the same fee structure.
Trustees are compensated for their services to the Fund, as set forth on the Statement of Operations. The Trust’s eligible Trustees may participate in a non-qualified deferred compensation plan which may be terminated at any time. Any payments to plan participants are paid solely out of the Fund’s assets. Income earned on the plan participant’s deferral account is based on the rate of return of the eligible mutual funds selected by the participant or, if no funds are selected, on the rate of return of Columbia Money Market Fund (formerly known as RiverSource Cash Management Fund). Prior to the Closing, if no funds were selected, income earned on the plan participant’s deferral account was based on the rate of return of BofA Treasury Reserves. Trustees’ fees deferred during the current period as well as any gains or losses on the trustees’ deferred
27
Columbia Large Cap Enhanced Core Fund
February 28, 2011
compensation balances as a result of market fluctuations are included in “Trustees’ fees” on the Statement of Operations. Liabilities under the deferred compensation plan are included in “Trustees’ fees” on the Statement of Assets and Liabilities.
Note 4. Custody Credits
The Fund has an agreement with its custodian bank under which custody fees may be reduced by balance credits. These credits are recorded as part of expense reductions on the Statement of Operations. The Fund could have invested a portion of the assets utilized in connection with the expense offset arrangement in an income-producing asset if it had not entered into such an agreement. For the year ended February 28, 2011, these custody credits reduced total expenses by $1 for the Fund.
Note 5. Portfolio Information
The cost of purchases and proceeds from sales of securities, excluding short-term obligations, aggregated $282,203,508 and $465,860,654, respectively, for the year ended February 28, 2011.
Note 6. Regulatory Settlements
During the year ended February 28, 2010, the Fund received payments totaling $3,773, resulting from certain regulatory settlements in which the Fund had participated during the period. The payments have been included in “Increase from regulatory settlements” on the Statement of Changes in Net Assets.
Note 7. Shareholder Concentration
As of February 28, 2011, one shareholder account owned 89.4% of the outstanding shares of the Fund. Purchase and redemption activity of this account may have a significant effect on the operations of the Fund.
Note 8. Line of Credit
The Fund and other affiliated funds participate in a $280,000,000 committed, unsecured revolving line of credit provided by State Street. The maximum amount that may be borrowed by any fund is limited to the lesser of $200,000,000 and the Fund’s borrowing limit set forth in the Fund’s registration statement. Borrowings are available for short-term liquidity or temporary or emergency purposes.
Effective October 14, 2010, interest is charged to each participating fund based on the fund’s borrowings at a rate per annum equal to the greater of the Federal Funds Rate plus 1.25% or the overnight LIBOR Rate plus 1.25%. In addition, a commitment fee of 0.125% per annum is accrued and apportioned among the participating funds pro rata based on their relative net assets.
Prior to October 14, 2010, interest was charged to each participating fund at the same rates. In addition, a commitment fee of 0.15% per annum was accrued and apportioned among the participating funds pro rata based on their relative net assets.
For the year ended February 28, 2011, the average daily loan balance outstanding on days where borrowing existed was $3,900,000 at a weighted average interest rate of 1.49%.
Note 9. Federal Tax Information
The timing and character of income and capital gain distributions are determined in accordance with income tax regulations, which may differ from GAAP. Reclassifications are made to the Fund’s capital accounts for permanent tax differences to reflect income and gains available for distribution (or available capital loss carryforwards) under income tax regulations.
For the year ended February 28, 2011, permanent book and tax basis differences are as follows:
| | | | |
| | | | | |
Undistributed Net Investment
Income | | Accumulated Net Realized
Loss | | Paid-In Capital |
| $(3) | | — | | $3 |
Net investment income and net realized gains (losses), as disclosed on the Statement of Operations, and net assets were not affected by this reclassification.
The tax character of distributions paid during the years ended February 28, 2011 and February 28, 2010 was as follows:
| | | | |
| | | February 28,
2011 | | February 28,
2010 |
| Distributions paid from: | | | | |
| Ordinary Income* | | $6,398,442 | | $9,482,069 |
| * | For tax purposes short-term capital gain distributions, if any, are considered ordinary income distributions. |
28
Columbia Large Cap Enhanced Core Fund
February 28, 2011
As of February 28, 2011, the components of distributable earnings on a tax basis were as follows:
| | | | |
| | | | | |
Undistributed Ordinary Income | | Undistributed Long-Term Capital Gains | | Net Unrealized Appreciation* |
| $927,647 | | — | | $127,157,428 |
| * | The differences between book-basis and tax-basis net unrealized appreciation are primarily due to deferral of losses from wash sales and futures marked to market. |
Unrealized appreciation and depreciation at February 28, 2011, based on cost of investments for federal income tax purposes were:
| | | | |
| | | | |
| Unrealized appreciation | | $ | 130,352,305 | |
| Unrealized depreciation | | | (3,194,877 | ) |
| | | | |
| Net unrealized appreciation | | $ | 127,157,428 | |
The following capital loss carryforwards may be available to reduce taxable income arising from future net realized gains on investments, if any, to the extent permitted by the Internal Revenue Code:
| | | | |
| | | | |
| Year of Expiration | | Capital Loss Carryforwards | |
| 2017 | | $ | 63,773,716 | |
| 2018 | | | 132,297,711 | |
| | | | |
| Total | | $ | 196,071,427 | |
Capital loss carryforwards of $61,923,695 were utilized during the year ended February 28, 2011.
Management is required to determine whether a tax position of the Fund is more likely than not to be sustained upon examination by the applicable taxing authority, including resolution of any related appeals or litigation processes, based on the technical merits of the position. The tax benefit to be recognized by the Fund is measured as the largest amount of benefit that is greater than fifty percent likely of being realized upon ultimate settlement. Management is not aware of any tax positions for which it is reasonably possible that the total amounts of unrecognized tax benefits will significantly change in the next twelve months. However, management’s conclusions may be subject to review and adjustment at a later date based on factors including, but not limited to, new tax laws, regulations, and administrative interpretations (including relevant court decisions). The Fund’s federal tax returns for the prior three fiscal years remain subject to examination by the Internal Revenue Service.
Note 10. Subsequent Events
Management has evaluated the events and transactions that have occurred through the date the financial statements were issued and noted no items requiring adjustment of the financial statements or additional disclosure.
Note 11. Information Regarding Pending and Settled Legal Proceedings
In June 2004, an action captioned John E. Gallus et al. v. American Express Financial Corp. and American Express Financial Advisors Inc. was filed in the United States District Court for the District of Arizona. The plaintiffs allege that they are investors in several American Express Company (now known as RiverSource) mutual funds and they purport to bring the action derivatively on behalf of those funds under the Investment Company Act of 1940. The plaintiffs allege that fees allegedly paid to the defendants by the funds for investment advisory and administrative services are excessive. The plaintiffs seek remedies including restitution and rescission of investment advisory and distribution agreements. The plaintiffs voluntarily agreed to transfer this case to the United States District Court for the District of Minnesota (the District Court). In response to defendants’ motion to dismiss the complaint, the District Court dismissed one of plaintiffs’ four claims and granted plaintiffs limited discovery. Defendants moved for summary judgment in April 2007. Summary judgment was granted in the defendants’ favor on July 9, 2007. The plaintiffs filed a notice of appeal with the Eighth Circuit Court of Appeals (the Eighth Circuit) on August 8, 2007. On April 8, 2009, the Eighth Circuit reversed summary judgment and remanded to the District Court for further proceedings. On August 6, 2009, defendants filed a writ of certiorari with the U.S. Supreme Court (the Supreme Court), asking the Supreme Court to stay the District Court proceedings while the Supreme Court considers and rules in a case captioned Jones v. Harris Associates, which involves issues of law similar to those presented in the Gallus case. On March 30, 2010, the Supreme Court issued its ruling in Jones v. Harris Associates, and on April 5, 2010, the Supreme Court vacated the Eighth Circuit’s decision in the Gallus case and remanded the case to the Eighth Circuit for further consideration in light of the Supreme Court’s decision in Jones v. Harris Associates. On June 4, 2010, the Eighth Circuit remanded the Gallus case to the District Court for further consideration in light of the Supreme Court’s decision in Jones v. Harris Associates. On December 9, 2010, the District Court reinstated its July 9, 2007 summary judgment order in favor of the defendants. On January 10, 2011 plaintiffs filed a notice of appeal with the Eighth Circuit.
29
Columbia Large Cap Enhanced Core Fund
February 28, 2011
In December 2005, without admitting or denying the allegations, American Express Financial Corporation (AEFC, which is now known as Ameriprise Financial, Inc. (Ameriprise Financial)), entered into settlement agreements with the Securities and Exchange Commission (SEC) and Minnesota Department of Commerce (MDOC) related to market timing activities. As a result, AEFC was censured and ordered to cease and desist from committing or causing any violations of certain provisions of the Investment Advisers Act of 1940, the Investment Company Act of 1940, and various Minnesota laws. AEFC agreed to pay disgorgement of $10 million and civil money penalties of $7 million. AEFC also agreed to retain an independent distribution consultant to assist in developing a plan for distribution of all disgorgement and civil penalties ordered by the SEC in accordance with various undertakings detailed at http://www.sec.gov/litigation/admin/ia-2451.pdf. Ameriprise Financial and its affiliates have cooperated with the SEC and the MDOC in these legal proceedings, and have made regular reports to the funds’ Boards of Directors/Trustees.
Ameriprise Financial and certain of its affiliates have historically been involved in a number of legal, arbitration and regulatory proceedings, including routine litigation, class actions, and governmental actions, concerning matters arising in connection with the conduct of their business activities. Ameriprise Financial believes that the Funds are not currently the subject of, and that neither Ameriprise Financial nor any of its affiliates are the subject of, any pending legal, arbitration or regulatory proceedings that are likely to have a material adverse effect on the Funds or the ability of Ameriprise Financial or its affiliates to perform under their contracts with the Funds. Ameriprise Financial is required to make 10-Q, 10-K and, as necessary, 8-K filings with the Securities and Exchange Commission on legal and regulatory matters that relate to Ameriprise Financial and its affiliates. Copies of these filings may be obtained by accessing the SEC website at www.sec.gov.
There can be no assurance that these matters, or the adverse publicity associated with them, will not result in increased fund redemptions, reduced sale of fund shares or other adverse consequences to the Funds. Further, although we believe proceedings are not likely to have a material adverse effect on the Funds or the ability of Ameriprise Financial or its affiliates to perform under their contracts with the Funds, these proceedings are subject to uncertainties and, as such, we are unable to estimate the possible loss or range of loss that may result. An adverse outcome in one or more of these proceedings could result in adverse judgments, settlements, fines, penalties or other relief that could have a material adverse effect on the consolidated financial condition or results of operations of Ameriprise Financial.
30
Report of Independent Registered Public Accounting Firm
To the Trustees of Columbia Funds Series Trust and the Shareholders of Columbia Large Cap Enhanced Core Fund
In our opinion, the accompanying statement of assets and liabilities, including the investment portfolio, and the related statements of operations and of changes in net assets and the financial highlights present fairly, in all material respects, the financial position of Columbia Large Cap Enhanced Core Fund (the “Fund”) (a series of Columbia Funds Series Trust) at February 28, 2011, the results of its operations for the year then ended, the changes in its net assets for each of the two years in the period then ended, and the financial highlights for the periods indicated, in conformity with accounting principles generally accepted in the United States of America. These financial statements and financial highlights (hereafter referred to as “financial statements”) are the responsibility of the Fund’s management. Our responsibility is to express an opinion on these financial statements based on our audits. We conducted our audits of these financial statements in accordance with the standards of the Public Company Accounting Oversight Board (United States). Those standards require that we plan and perform the audit to obtain reasonable assurance about whether the financial statements are free of material misstatement. An audit includes examining, on a test basis, evidence supporting the amounts and disclosures in the financial statements, assessing the accounting principles used and significant estimates made by management, and evaluating the overall financial statement presentation. We believe that our audits, which included confirmation of securities at February 28, 2011 by correspondence with the custodian and brokers, provide a reasonable basis for our opinion.
PricewaterhouseCoopers LLP
Boston, Massachusetts
April 21, 2011
31
Federal Income Tax Information (Unaudited) – Columbia Large Cap Enhanced Core Fund
100.00% of the ordinary income distributed by the Fund for the fiscal year ended February 28, 2011, qualifies for the corporate dividends received deduction.
For non-corporate shareholders 100.00%, or the maximum amount allowable under the Jobs and Growth Tax Relief Reconciliation Act of 2003, of ordinary income distributed by the Fund for the fiscal year ended February 28, 2011 may represent qualified dividend income.
The Fund will notify shareholders in January 2012 of amounts for use in preparing 2011 income tax returns.
32
Fund Governance
The Trustees serve terms of indefinite duration. The names, addresses and ages of the Trustees and officers of the Funds of Columbia Funds Series Trust, the year each was first elected or appointed to office, their principal business occupations during at least the last five years, the number of Funds overseen by each Trustee and other directorships they hold are shown below. Each officer listed below serves as an officer of each Fund in the Columbia Funds Series Trust.
Independent Trustees
| | |
Name, Address and Age, Position
with Funds, Year First Elected or
Appointed to Office | | Principal Occupation(s) During Past Five Years, Number of Funds in the Columbia
Funds Complex Overseen by Trustee, Other Directorships Held |
| |
| Edward J. Boudreau (Born 1944) | | |
c/o Columbia Management Investment Advisers, LLC 225 Franklin Street Boston, MA 02110 Trustee (since 2005) | | Managing Director–E.J. Boudreau & Associates (consulting), from 2000 through current; oversees 44; Trustee–BofA Funds Series Trust. |
| |
| William P. Carmichael (Born 1943) | | |
c/o Columbia Management Investment Advisers, LLC 225 Franklin Street Boston, MA 02110 Trustee (since 1999) | | Retired. Oversees 44; Director–Cobra Electronics Corporation (electronic equipment manufacturer); Director–McMoRan Exploration Company (oil and gas exploration and development); Director–The Finish Line (athletic shoes and apparel); Trustee–BofA Funds Series Trust; Former Director–Simmons Company (bedding). |
| |
| William A. Hawkins (Born 1942) | | |
c/o Columbia Management Investment Advisers, LLC 225 Franklin Street Boston, MA 02110 Trustee (since 2005) | | Managing Director–Overton Partners (financial consulting), August 2010 to present; President and Chief Executive Officer–California General Bank, N.A., from January 2008 through August 2010; oversees 44; Trustee–BofA Funds Series Trust. |
| |
| R. Glenn Hilliard (Born 1943) | | |
c/o Columbia Management Investment Advisers, LLC 225 Franklin Street Boston, MA 02110 Trustee (since 2005) | | Chairman and Chief Executive Officer–Hilliard Group LLC (investing and consulting), from April 2003 through current; Non-Executive Director & Chairman–CNO Financial Inc. (formerly Conseco Inc.) (insurance), September 2003 through current; Executive Chairman–Conseco, Inc. (insurance), August 2004 through September 2005; oversees 44; Trustee–BofA Funds Series Trust. |
| |
| John J. Nagorniak (Born 1944) | | |
c/o Columbia Management Investment Advisers, LLC 225 Franklin Street Boston, MA 02110 Trustee (since 2008) | | Retired. President and Director–Foxstone Financial, Inc. (consulting), 2000 through December 2007; Director–Mellon Financial Corporation affiliates (investing), 2000 through 2007; Chairman–Franklin Portfolio Associates (investing–Mellon affiliate), 1982 through 2007; oversees 44; Director–MIT Investment Company; Trustee–MIT 401k Plan. |
| |
| Minor M. Shaw (Born 1947) | | |
c/o Columbia Management Investment Advisers, LLC 225 Franklin Street Boston, MA 02110 Trustee (since 2003) | | President–Micco Corporation and Mickel Investment Group; oversees 44; Board Member–Piedmont Natural Gas; Trustee–BofA Funds Series Trust. |
33
Fund Governance (continued)
Interested Trustee
| | |
Name, Address and Age, Position
with Funds, Year First Elected or
Appointed to Office | | Principal Occupation(s) During Past Five Years, Number of Funds in the Columbia
Funds Complex Overseen by Trustee, Other Directorships Held |
|
| Anthony M. Santomero1 (Born 1946) |
c/o Columbia Management Investment Advisers, LLC 225 Franklin Street Boston, MA 02110 Trustee (since 2008) | | Richard K. Mellon Professor Emeritus of Finance, The Wharton School, University of Pennsylvania, from 2002 through current; Senior Advisor–McKinsey & Company (consulting), July 2006 through January 2008; President and Chief Executive Officer–Federal Reserve Bank of Philadelphia, July 2000 through April 2006; oversees 44; Director–Renaissance Reinsurance Ltd; Trustee–Penn Mutual Life Insurance Company; Director–Citigroup, Inc.; Citibank, N.A.; Trustee–BofA Funds Series Trust. |
| 1 | Dr. Santomero is currently deemed by the Columbia Funds to be an “interested person” (as defined in the 1940 Act) of the Funds because he serves as a Director of Citigroup, Inc. and Citibank, N.A., companies that may directly or through its subsidiaries and affiliates may engage from time-to-time in brokerage execution, principal transactions and lending relationships with the Columbia Funds or other funds or accounts advised/managed by the Advisor. |
The Statement of Additional Information includes additional information about the Trustees of the Funds and is available, without charge, upon request by calling 800-345-6611.
34
Fund Governance (continued)
Officers
| | |
| Name, Year of Birth and Address | | Principal Occupation(s) During Past Five Years |
| |
| J. Kevin Connaughton (Born 1964) | | |
225 Franklin Street Boston, MA 02110 President (since 2009) | | Senior Vice President and General Manager–Mutual Fund Products, Columbia Management Investment Advisers, LLC since May 2010; President, Columbia Funds, since 2009, and RiverSource Funds, since May 2010 (previously Senior Vice President and Chief Financial Officer, Columbia Funds, from June 2008 to January 2009, Treasurer, Columbia Funds, from October 2003 to May 2008, and senior officer of various other affiliated funds since 2000); Managing Director, Columbia Management Advisors, LLC from December 2004 to April 2010. |
| |
| Michael G. Clarke (Born 1969) | | |
225 Franklin Street Boston, MA 02110 Senior Vice President and Chief Financial Officer
(since 2009) | | Vice President, Columbia Management Investment Advisers, LLC since May 2010; Managing Director of Fund Administration, Columbia Management Advisors, LLC, from September 2004 to April 2010; senior officer of Columbia Funds and affiliated funds since 2002. |
| |
| Scott R. Plummer (Born 1959) | | |
5228 Ameriprise Financial Center Minneapolis, MN 55474 Senior Vice President, Secretary and Chief Legal Officer (since 2010) | | Chief Legal Officer and Assistant Secretary, Columbia Management Investment Advisers, LLC since June 2005; Vice President and Lead Chief Counsel–Asset Management, Ameriprise Financial, Inc. since May 2010 (previously Vice President and Chief Counsel–Asset Management, from 2005 to April 2010, and Vice President–Asset Management Compliance from 2004 to 2005); Vice President, Chief Counsel and Assistant Secretary, Columbia Management Investment Distributors, Inc. since 2008; Vice President, General Counsel and Secretary, Ameriprise Certificate Company since 2005; Chief Counsel, RiverSource Distributors, Inc. since 2006; Vice President, General Counsel and Secretary, RiverSource Funds, since December 2006; Senior Vice President, Secretary and Chief Legal Officer, Columbia Funds, since May 2010. |
| |
| Linda J. Wondrack (Born 1964) | | |
225 Franklin Street Boston, MA 02110 Senior Vice President and Chief Compliance Officer (since 2007) | | Vice President and Chief Compliance Officer, Columbia Management Investment Advisers, LLC since May 2010; Chief Compliance Officer, Columbia Funds, since 2007, and RiverSource Funds, since May 2010; Director (Columbia Management Group, LLC and Investment Product Group Compliance), Bank of America, from June 2005 to April 2010. |
| |
| William F. Truscott (Born 1960) | | |
53600 Ameriprise Financial Center Minneapolis, MN 55474 Senior Vice President (since 2010) | | Chairman of the Board, Columbia Management Investment Advisers, LLC since May 2010 (previously President, Chairman of the Board and Chief Investment Officer, from 2001 to April 2010); Chief Executive Officer, U.S. Asset Management & President, Annuities, Ameriprise Financial, Inc. since May 2010 (previously President–U.S. Asset Management and Chief Investment Officer from 2005 to April 2010, and Senior Vice President–Chief Investment Officer, from 2001 to 2005); Director, President and Chief Executive Officer, Ameriprise Certificate Company since 2006; Director, Columbia Management Investment Distributors, Inc. since May 2010 (previously Chairman of the Board and Chief Executive Officer from 2008 to April 2010); Chairman of the Board and Chief Executive Officer, RiverSource Distributors, Inc. since 2006. |
35
Fund Governance (continued)
Officers (continued)
| | |
| Name, Year of Birth and Address | | Principal Occupation(s) During Past Five Years |
| |
| Colin Moore (Born 1958) | | |
225 Franklin Street Boston, MA 02110 Senior Vice President (since 2010) | | Director and Chief Investment Officer, Columbia Management Investment Advisers, LLC since May 2010; Manager, Managing Director and Chief Investment Officer of Columbia Management Advisors, LLC from 2007 to April 2010; Head of Equities, Columbia Management Advisors, LLC from 2002 to 2007. |
| |
| Michael A. Jones (Born 1959) | | |
225 Franklin Street Boston, MA 02110 Senior Vice President (since 2010) | | President and Director, Columbia Management Investment Advisers, LLC since May 2010; President and Director, Columbia Management Investment Distributors, Inc. since May 2010; Manager, Chairman, Chief Executive Officer and President, Columbia Management Advisors, LLC from 2007 to April 2010; Chief Executive Officer, President and Director, Columbia Management Distributors, Inc. from November 2006 to April 2010; previously, co-president and senior managing director at Robeco Investment Management. |
| |
| Amy Johnson (Born 1965) | | |
5228 Ameriprise Financial Center Minneapolis, MN 55474 Senior Vice President (since 2010) | | Senior Vice President and Chief Operating Officer, Columbia Management Investment Advisers, LLC since May 2010 (previously Chief Administrative Officer, from 2009 until April 2010, Vice President–Asset Management and Trust Company Services, from 2006 to 2009, and Vice President–Operations and Compliance from 2004 to 2006). |
| |
| Joseph F. DiMaria (Born 1968) | | |
225 Franklin Street Boston, MA 02110 Treasurer (since 2010) and Chief Accounting Officer (since 2008) | | Vice President, Mutual Fund Administration, Columbia Management Investment Advisers, LLC, since May 2010; Director of Fund Administration, Columbia Management Advisors, LLC from January 2006 to April 2010; Head of Tax/Compliance and Assistant Treasurer, Columbia Management Advisors, LLC, from November 2004 to December 2005. |
| |
| Marybeth Pilat (Born 1968) | | |
225 Franklin Street Boston, MA 02110 Deputy Treasurer (since 2010) | | Vice President, Mutual Fund Administration, Columbia Management Investment Advisers, LLC, since May 2010; Vice President, Investment Operations, Bank of America, from October 2008 to April 2010; Finance Manager, Boston Children’s Hospital from August 2008 to October 2008; Director, Mutual Fund Administration, Columbia Management Advisors, LLC, from May 2007 to July 2008; Vice President, Mutual Fund Valuation, Columbia Management Advisors, LLC, from January 2006 to May 2007; Vice President, Mutual Fund Accounting Oversight, Columbia Management Advisors, LLC from January 2005 to January 2006. |
| |
| Jullan Quero (Born 1967) | | |
225 Franklin Street Boston, MA 02110 Deputy Treasurer (since 2008) | | Vice President, Mutual Fund Administration, Columbia Management Investment Advisers, LLC since May 2010; Director of Fund Administration, Columbia Management Advisors, LLC, from August 2008 to April 2010; Senior Tax Manager, Columbia Management Advisors, LLC from August 2006 to July 2008; Senior Compliance Manager, Columbia Management Advisors, LLC from April 2002 to August 2006. |
| |
| Stephen T. Welsh (Born 1957) | | |
225 Franklin Street Boston, MA 02110 Vice President (since 2006) | | President, Columbia Management Investment Services, Corp. since May 2010; President and Director, Columbia Management Services, Inc. from July 2004 to April 2010; Managing Director, Columbia Management Distributors, Inc. from August 2007 to April 2010. |
36
Board Consideration and Approval of Amendment to Investment Management Services Agreement
In September 2010, the Board (the “Board”) of Columbia Funds Series Trust (the “Trust”) unanimously approved an amendment to the Investment Management Services Agreement (the “IMS Agreement”) between Columbia Management Investment Advisers, LLC (“CMIA”) and the Trust, on behalf of Columbia Convertible Securities Fund, Columbia Large Cap Core Fund, Columbia Large Cap Enhanced Core Fund, Columbia Large Cap Value Fund, Columbia Mid Cap Value Fund, Columbia Multi-Advisor International Equity Fund and Columbia Small Cap Value Fund II (each, a “Fund” and together, the “Funds”). As detailed below, the Contracts Review Committee and/or the Board held numerous meetings and discussions with CMIA and reviewed and considered extensive materials in connection with the approval of the changes to the fee rates payable by each Fund before determining to approve the amendment to the IMS Agreement.
Prior to approving the proposed changes to the fee rates payable by the Funds, the trustees (the “Trustees”) of the Board were presented with, and requested, received and evaluated, materials about the current IMS Agreement, the proposed changes to the fee rates and fee structures and related matters from CMIA. The Trustees also reviewed reports prepared by an independent provider of investment company data, which included information comparing the Funds’ current fees and expense ratios with a group of comparable funds that were selected by the independent provider. Included in these reports were comparisons of contractual and actual investment advisory fee rates and total operating expenses.
In addition, the Trustees considered that the proposed amendment was part of a larger group of proposals, designed to achieve consistent investment management service and fee structures across the family of funds. In this regard, the Board recognized that many of the funds in the fund family were organized at different times by many different sponsors, and as a result, their fees and expenses did not reflect a common overall design.
The Board and its Contract Review Committee also reviewed and considered information that they had previously received, addressing the services CMIA provides and fund performance, among other things, in connection with their most recent consideration and approval of the IMS Agreement. The Trustees also consulted with the non-interested Trustees’ independent legal counsel, who advised on applicable legal standards, and otherwise assisted the Trustees in their deliberations.
At the conclusion of its review of the materials discussed above and of the discussions among the Trustees leading up to and during the September 20, 2010 meetings, the Board, on behalf of the Funds, agreed that it had been furnished with sufficient information to make an informed business decision with respect to approval of the amendment to the IMS Agreement.
In making its decision to approve the proposed amendment to the IMS Agreement for each Fund, the Board considered factors bearing on the nature, extent and quality of the services provided to such Fund, and the costs for those services, with a view toward reaching a business judgment as to whether the proposed amendment to the IMS Agreement is, under the circumstances, in the best interest of such Fund and its shareholders. The factors that the Trustees considered included, principally, the following:
| n | | The expected benefits of continuing to retain CMIA as the Funds’ investment manager; |
| n | | The nature, extent and quality of investment management services provided by CMIA to each Fund; |
| n | | The recent evaluation of the historical performance of CMIA in managing the Funds, recognizing that no assurances can be given that a Fund would achieve any level of performance in the future; |
| n | | The recent evaluation of each Fund’s potential to realize economies of scale through operations of CMIA; |
| n | | The indirect benefits, such as from soft dollar arrangements, that CMIA has obtained and will continue to obtain, from managing the Funds; |
| n | | The expected benefits to shareholders of further integrating the legacy Columbia branded funds (the “Columbia Funds Complex”) and the legacy RiverSource-, Seligman- and Threadneedle-branded funds (the “Columbia RiverSource Funds Complex” and, collectively with the Columbia Funds Complex, the “Combined Fund Complex”) by: |
| | n | | Standardizing investment advisory fee rates and total management fee rates (i.e., the investment advisory fee rates and the administration/administrative fee rates), to the extent practicable, across funds in the Combined Fund Complex that are in the same investment category to promote uniformity of pricing among similar funds; | |
| | n | | Implementing contractual expense limitations that will generally cap total annual operating expense ratios for each fund in the Combined Fund Complex at levels that are at or below the median net operating expense ratio of funds in the respective fund’s peer group (as determined annually after the initial term by an independent third-party data provider); and | |
37
| | n | | Correlating investment advisory and administration/administrative fee rates across the Combined Fund Complex commensurate with the level of services being provided. | |
In making its decision to approve the amendment to the IMS Agreement that included the increase of the investment advisory fee rates payable by each of the Funds at all or most asset levels, the factors that the trustees considered and the conclusions that they reached included, principally, the following:
| n | | The impact of the proposed changes in investment advisory fee rates on the gross and net expense ratios of each Fund, including the contemporaneous reduction in the rates payable by each Fund under its administration services agreement contingent on shareholder approval of the amendment to the IMS Agreement, and the willingness of CMIA to contractually agree to limit total operating expenses for such Fund for a certain period of time; |
| n | | Current and projected profits to CMIA from providing investment management and other services to the Fund, both under the current investment advisory fee rates and the proposed investment advisory fee rates; and |
| n | | That the proposed investment advisory fee rates are designed to be competitive and to fairly compensate CMIA for services performed for the Funds. |
Nature, Extent and Quality of Services
The Trustees considered the nature, extent and quality of services provided to the Funds by CMIA under the IMS Agreement, and the resources dedicated to the Funds by CMIA and its affiliates. The Trustees considered, among other things, the ability of CMIA to attract, motivate and retain highly qualified research, advisory and supervisory investment professionals (including CMIA’s personnel and other resources, compensation programs for personnel involved in fund management, reputation and other attributes), the portfolio management services provided by those investment professionals, the trade execution services provided on behalf of the Funds and the quality of CMIA’s investment research capabilities and the other resources that it devotes to each Fund. The Trustees also considered the potential benefits to shareholders of investing in a mutual fund that is part of a fund complex offering exposure to a variety of asset classes and investment disciplines and providing a variety of fund and shareholder services. The Trustees also considered that the nature, extent and quality of services proposed to be provided under the amended IMS Agreement were not expected to change. After reviewing these and related factors, the Trustees concluded, within the context of their overall conclusions, that the nature, extent and quality of the services to be provided to each Fund under the amended IMS Agreement supported the approval of the amended IMS Agreement.
Investment Performance
The Trustees reviewed information about the performance of each Fund over various time periods, including information prepared by an independent third-party data provider that compared the performance of each Fund to the performance of those Funds’ peer groups of mutual funds and performance benchmarks. The Trustees also reviewed a description of the third party’s methodology for identifying each Fund’s peer group for purposes of performance and expense comparisons. In the case of each Fund whose performance lagged that of a relevant peer group for certain (although not necessarily all) periods, the Trustees concluded that other factors relevant to performance were sufficient, in light of other considerations, to warrant approval of the amendment to such Fund’s IMS Agreement. Those factors varied from Fund to Fund, but included one or more of the following: (i) that the Fund’s performance, although lagging in certain recent periods, was stronger over the longer term; (ii) that the underperformance was attributable, to a significant extent, to investment decisions that were reasonable and consistent with the Fund’s investment strategy and policies and that the Fund was performing within a reasonable range of expectations, given those investment decisions, market conditions and the Fund’s investment strategy; (iii) that the Fund’s performance was competitive when compared to other performance benchmarks or peer groups; and (iv) that CMIA had taken or was considering steps designed to help improve the Fund’s investment performance, including, but not limited to, replacing portfolio managers, enhancing the resources supporting the portfolio managers, or modifying investment strategies.
After reviewing these and related factors, the Trustees concluded, within the context of their overall conclusions regarding the proposed amendment to the IMS Agreement, that the performance of each Fund and CMIA was sufficient to warrant the approval of the amendment to the IMS Agreement pertaining to that Fund.
Investment Advisory Fee Rates and Other Expenses
The Trustees considered that the proposed amendment to the IMS Agreement would increase the contractual investment advisory fee rates payable by each Fund at all or certain assets levels, and would be otherwise identical to each Fund’s current IMS Agreement. In addition, the Trustees considered that, with the proposed fee
38
reductions under the administration services agreement, the combined contractual fee rates under the IMS Agreement and the proposed administration services agreement would be lower than the current combined contractual fee rates under those agreements, at most asset levels, for all of the Funds except Columbia Large Cap Enhanced Core Fund. For the Columbia Large Cap Enhanced Core Fund, the Trustees considered CMIA’s proposal to implement a contractual expense limitation that would mitigate the effect of such Fund’s investment advisory fee rate increase by gradually phasing in the increase over a five-year period.
After reviewing these and related factors, the Trustees concluded, within the context of their overall conclusions, that the investment advisory fee rates under the amended IMS Agreement and anticipated total expenses of each Fund supported the approval of the amendment to the IMS Agreement.
Costs of Services Provided and Profitability
The Trustees considered information about the investment advisory fee rates charged by CMIA to comparable institutional accounts. In considering the fees charged to those accounts, the Trustees took into account, among other things, CMIA’s representations about the differences between managing mutual funds as compared to other types of accounts, including differences in the services provided, differences in the risk profile of such business for CMIA, and the additional resources required to manage mutual funds effectively. In evaluating each Fund’s proposed advisory fee rates, the Trustees also took into account the demands, complexity and quality of the investment management of the Fund.
The Trustees also considered the compensation directly or indirectly received by CMIA and its affiliates in connection with their relationships with the Funds. The Trustees reviewed information provided by management as to the current and projected profitability to CMIA and its affiliates of their relationships with each Fund, and information about the allocation of expenses used to calculate profitability.
After reviewing those and related factors, the Trustees concluded, within the context of their overall conclusions, that the proposed changes to the advisory fee rates, and the related profitability to CMIA and its affiliates of their relationships with the Fund, supported the approval of the amendment to the IMS Agreement.
Economies of Scale
The Trustees considered the existence of any economies of scale in the provision by CMIA of services to each Fund, to groups of related funds and to CMIA’s investment advisory clients as a whole, and the extent to which those economies of scale would be shared with the Funds through breakpoints in the proposed investment advisory fee rates or other means, such as expense limitation arrangements and additional investments by CMIA in investment, trading and compliance resources. The Trustees noted that all of the Funds were expected to benefit from breakpoints and/or expense limitation arrangements.
In considering those issues, the Trustees also took note of the costs of the services to be provided (both on an absolute and relative basis) and the projected profitability to CMIA and its affiliates of their relationships with the Funds, as discussed above. The Trustees also noted the expected expense synergies and other anticipated benefits to CMIA and fund shareholders of both the rationalization of fees and expenses and the proposed mergers of certain Funds. After reviewing these and related factors, the Trustees determined, within the context of their overall conclusions, that the extent to which economies of scale were expected to be shared with the Funds supported the approval of the amendment to the IMS Agreement.
Other Benefits to CMIA
The Trustees received and considered information regarding any expected “fall-out” or ancillary benefits to be received by CMIA and its affiliates as a result of their relationships with the Funds, such as the provision by CMIA of administration services to the Funds and the provision by CMIA’s affiliates of distribution and transfer agency services to the Funds, and how the proposed rationalization of fees and expenses might affect such benefits, including the fact that to the extent expenses payable by the affected Funds decrease, and the expenses of such Funds were subject to a contractual limit or cap, CMIA may pay less in expense reimbursements. The Trustees considered that the Funds’ distributor, an affiliate of CMIA, retains a portion of the distribution fees from the Funds and receives a portion of the sales charges on sales or redemptions of certain classes of shares of the Funds, and that other affiliates of CMIA receive various forms of compensation in connection with their sale of shares of the Funds.
The Trustees also considered the benefits of research made available to CMIA by reason of brokerage commissions generated by the Funds’ securities transactions, and reviewed information about CMIA’s practices with respect to allocating portfolio brokerage and the use of “soft” commission dollars to pay for research. The Trustees considered the possible conflicts of interest associated with certain fall-out or other ancillary benefits and the reporting, disclosure and other processes that would be in place to disclose and
39
to monitor such possible conflicts of interest. The Trustees recognized that CMIA’s profitability would be somewhat lower without these benefits.
In their deliberations, the Trustees did not identify any single item that was paramount or controlling and individual Trustees may have attributed different weights to various factors. The Trustees also evaluated all information available to them on a fund-by-fund basis, and their determinations were made separately in respect of each Fund.
Based on the foregoing, the Trustees concluded that the proposed investment advisory fee rates for each Fund are acceptable and competitive, including when compared to similar funds in the industry. Accordingly, the Board unanimously approved the amendment to the IMS Agreement with respect to the Funds.
40
Summary of Management Fee Evaluation by Independent Fee Consultant
REPORT OF INDEPENDENT FEE CONSULTANT TO THE FUNDS SUPERVISED BY THE COLUMBIA NATIONS BOARD
Prepared Pursuant to the February 9, 2005 Assurance of Discontinuance among the Office of Attorney General of New York State, Columbia Management Advisors, LLC, and Columbia Management Distributors, Inc. September 21, 2010
I. Overview
On February 9, 2005, Columbia Management Advisors, LLC (“CMA”) and Columbia Management Distributors, Inc.1 (“CMD”) agreed to the New York Attorney General’s Assurance of Discontinuance (“AOD”). Among other things, the AOD stipulates that CMA may manage or advise a Columbia Fund (“Columbia Fund” and, together with some or all of such funds, the “Columbia Funds”) only if the Independent Members of the Columbia Fund’s Board of Trustees appoint a Senior Officer or retain an Independent Fee Consultant (“IFC”) who is to manage the process by which proposed management fees are negotiated. The AOD further stipulates that the Senior Officer or IFC is to prepare a written annual evaluation of the fee negotiation process.
With effect from January 1, 2007, the Independent Members of the Board of Trustees for certain Columbia Funds known collectively as the “Nations Funds” (together with the other members of that Board, the “Trustees”) retained me as IFC for the Nations Funds.2 In this capacity, I have prepared this written evaluation of the fee negotiation process. As has been the case with my previous reports, my immediate predecessor as IFC, John Rea, provided invaluable assistance in the preparation of this report.
On September 29, 2009, Ameriprise entered into an asset purchase agreement with Bank of America, N.A. and its parent, Bank of America Corporation (together, the “Bank”) pursuant to which the Bank agreed to sell certain CMG assets relating to Columbia’s long-term asset management business, including management of the Nations Funds (the “Transaction”). The Transaction, which closed on April 30, 2010,3 resulted in the termination of the existing Investment Management Agreements with CMA. Prior to the closing of the Transaction, the Trustees and shareholders of the Funds approved new Advisory and Administrative Agreements with an Ameriprise subsidiary now called Columbia Management Investment Advisers, LLC (“CMIA”). Those Agreements did not change the rates paid by the Funds from the levels specified in the former agreements with CMA.
CMIA serves as the adviser of funds supervised by three different Boards of Trustees: the Atlantic, Nations, and RiverSource Boards, and a subsidiary of CMIA serves as adviser to funds overseen by a fourth Board, Columbia/Wanger. After reviewing the range of funds overseen by all four Boards, CMIA proposed a series of changes intended, among other things, to rationalize its mutual fund product offerings (by for example proposing to merge funds with similar investment strategies) and the fees charged to the funds by CMIA and its affiliates. These proposals included (1) changes to the advisory fees paid by certain funds, (2) changes to administrative and similar fees paid by certain funds, (3) changes to the transfer agency, subtransfer agency, custody, and pricing/bookkeeping fees paid by the funds, and (4) mergers involving more than 60 funds. CMIA asked the Trustees to consider these proposals together. This report, consistent with and (to the extent applicable) in fulfillment of the terms of the AOD, will focus on changes to advisory and aggregate management fees and discuss other proposals insofar as they affect total fund expenses, which may be a relevant factor in considering the appropriate level of advisory and management fees (defined for purposes of this report as advisory plus administrative fees).
A. Role of the Independent Fee Consultant
The AOD charges the IFC with “managing the process by which proposed management fees … to be charged the Columbia Fund are negotiated so that they are negotiated in a manner which is at arms’ length and reasonable and consistent with this Assurance of Discontinuance.” The AOD also provides that CMA “may manage or advise a Columbia Fund only if the reasonableness of the proposed management fees is determined by the Board of Trustees … using … an annual independent written evaluation prepared by or under the direction of … the Independent Fee Consultant.”
| 1 | CMA and CMD are subsidiaries of Columbia Management Group, LLC (“CMG”), and are the successors to the entities named in the AOD. |
| 2 | I have no material relationship with Bank of America, CMG or Ameriprise Financial, Inc. (“Ameriprise”), aside from serving as IFC, and I am aware of no material relationship with any of their affiliates. I retained John Rea, an independent economic consultant, to assist me with this report. Unless otherwise stated or required by the context, this report covers only the Nations Funds. |
| 3Tab | 1, CMIA, Supplemental Materials Prepared for the Nations Board, June 16, 2010 (“June Supplemental Materials”) at p. 1. |
41
Therefore, the AOD makes clear that the IFC does not supplant the Trustees in negotiating management fees, nor does the IFC substitute his or her judgment for that of the Trustees with respect to the reasonableness of proposed fees or any other matter that is committed to the business judgment of the Trustees.
B. Elements Involved in Managing the Fee Negotiation Process
In preparing the report required by the AOD, the IFC must consider at least the following six factors set forth in the AOD:
| 1. | The nature and quality of the adviser’s services, including the Fund’s performance; |
| 2. | Management fees (including any components thereof) charged by other mutual fund companies for like services; |
| 3. | Possible economies of scale as the Fund grows larger; |
| 4. | Management fees (including any components thereof) charged to institutional and other clients of the adviser for like services; |
| 5. | Costs to the adviser and its affiliates of supplying services pursuant to the management fee agreements, excluding any intra-corporate profit; and |
| 6. | Profit margins of the adviser and its affiliates from supplying such services. |
II. Finding
| 1. | Based upon my examination of the information supplied by CMG and Ameriprise in the light of the six factors set forth in the AOD, I conclude that the Trustees have the relevant information necessary to evaluate the reasonableness of the proposed management fee changes for each affected Nations Fund (each a “Fee Change Fund”). |
| 2. | In my view, the process by which the proposed management fees of each Fee Change Fund have been negotiated with CMIA thus far has been, to the extent practicable, at arm’s length and reasonable and consistent with the AOD. |
| 3. | CMIA has proposed an increase either in contractual advisory or total management fees for 10 Funds (each a “Fee Increase Fund”). All 10 would have higher advisory fees and lower administrative fees. For three Funds, the increase in proposed contractual advisory fees outweighs the decrease in contractual administrative fees, leading to a proposed increase in contractual management fees. Proposed contractual management fees would decline for six Funds and remain unchanged for one. |
| 4. | The projected actual management fee, computed on the basis of assets as of October 31, 2009, would increase for only one of the 10 Funds, Large Cap Enhanced Core, after application of CMIA’s proposed expense limitation program and consummation of proposed mergers. For eight Funds, actual management fees are projected to decline, reflecting the interaction of changes in contractual management fees, gross expenses, and expense limitations at October 31, 2009 asset levels. No change is projected in the actual management fee of the remaining Fee Increase Fund. |
| 5. | CMIA’s fee rationalization and merger proposals would have little effect on the quintile rankings of the actual management fees of the Fee Increase Funds. The ranking would change for only one Fund, while remaining unchanged from the current level for the other nine Funds. On a post-rationalization, post-merger basis, half the actual management fees would be in the fourth or fifth quintiles. |
| 6. | Half of the Fee Increase Funds have had median or betterthan-median investment performance. None of the Funds would be designated a Review Fund based solely on performance. |
| 7. | CMIA proposed that the Funds (except sub-advised Funds) and most other mutual funds it or its affiliates advise or sponsor (together, the “CMIA Funds”) be subject to an expense limitation calculated by reference to the median of the relevant fund’s Lipper expense group. As a result, all of the Fee Increase Funds are projected to have median or better total expenses after full implementation of the proposed fee changes, expense limitations, and mergers. Some Funds would have higher-than-median actual management fees under this program notwithstanding the newly-established expense limitations. The expense limitation would be recalculated every year based on updated Lipper data. Based upon an analysis of median expenses of Fund peer groups for the 2008-2010 period, it is likely that some Funds would experience sizable changes in their expense limits from year-to-year. |
| 8. | CMIA reviewed the differences between management of retail mutual funds and advising institutional accounts and supplied charts plotting contractual and actual institutional and fund fees against assets in various investment categories. The data showed that mutual fund fees are often lower at small asset levels reflecting CMIA’s reimbursement of fund expenses. At higher asset levels, mutual fund fees typically exceed institutional fees. |
| 9. | CMIA provided fund-by-fund projected profitability data. Due to the significant changes in the operations of the Funds (including |
42
| | the change of the Funds’ investment adviser), historical profitability data was judged to have little relevance. |
| 10. | CMIA provided data comparing the cumulative benefit to CMIA Fund shareholders of all aspects of its proposals (including proposed mergers) with a projection of synergies in the form of decreased expenses that would benefit CMIA and its parent, Ameriprise. |
43
Shareholder Meeting Results
At a Joint Special Meeting of Shareholders held on February 15, 2011, shareholders of the Fund considered the proposals described below.
Proposal 1. Shareholders of the Fund approved a proposed amendment to the Investment Management Services Agreement with Columbia Management Investment Advisers, LLC, as follows:
| | | | | | |
| | | | | | | |
| Votes For | | Votes Against | | Abstentions | | Broker Non-Votes |
| 32,986,027 | | 56,540 | | 57,184 | | 348,937 |
Proposal 2. Shareholders of Columbia Funds Series Trust elected each of the nominees for trustees to the Board of Trustees of Columbia Funds Series Trust, each to hold office for an indefinite term, as follows:
| | | | | | |
| | | | | | | |
| Trustee | | Votes For | | Votes Withheld | | Abstentions |
| Kathleen Blatz | | 2,145,636,122 | | 248,012,438 | | 0 |
| Edward J. Boudreau, Jr. | | 2,145,430,114 | | 248,218,446 | | 0 |
| Pamela G. Carlton | | 2,145,515,949 | | 248,132,612 | | 0 |
| William P. Carmichael | | 2,145,038,695 | | 248,609,866 | | 0 |
| Patricia M. Flynn | | 2,145,843,563 | | 247,804,997 | | 0 |
| William A. Hawkins | | 2,145,359,401 | | 248,289,160 | | 0 |
| R. Glenn Hilliard | | 2,145,079,400 | | 248,569,161 | | 0 |
| Stephen R. Lewis, Jr. | | 2,145,092,209 | | 248,556,351 | | 0 |
| John F. Maher | | 2,145,621,338 | | 248,027,223 | | 0 |
| John J. Nagorniak | | 2,145,337,494 | | 248,311,067 | | 0 |
| Catherine James Paglia | | 2,145,615,254 | | 248,033,306 | | 0 |
| Leroy C. Richie | | 2,145,042,120 | | 248,606,441 | | 0 |
| Anthony M. Santomero | | 2,145,088,174 | | 248,560,386 | | 0 |
| Minor M. Shaw | | 2,145,430,762 | | 248,217,798 | | 0 |
| Alison Taunton-Rigby | | 2,145,393,384 | | 248,255,177 | | 0 |
| William F. Truscott | | 2,144,907,223 | | 248,741,338 | | 0 |
44
Important Information About This Report
The fund mails one shareholder report to each shareholder address. If you would like more than one report, please call shareholder services at 1-800-345-6611 and additional reports will be sent to you. This report has been prepared for shareholders of Columbia Large Cap Enhanced Core Fund.
A description of the policies and procedures that the fund uses to determine how to vote proxies and a copy of the fund’s voting records are available (i) at www.columbiamanagement.com, (ii) on the Securities and Exchange Commission’s website at www.sec.gov, and (iii) without charge, upon request, by calling 1-800-368-0346. Information regarding how the fund voted proxies relating to portfolio securities during the 12-month period ended June 30 is available from the SEC’s website. Information regarding how the fund voted proxies relating to portfolio securities is also available from the fund’s website, www.columbiamanagement.com.
The fund files a complete schedule of portfolio holdings with the SEC for the first and third quarters of each fiscal year on Form N-Q. The fund’s Form N-Q is available on the SEC’s website at www.sec.gov and may be reviewed and copied at the SEC’s Public Reference Room in Washington, D.C. Information on the operation of the Public Reference Room may be obtained by calling
1-800-SEC-0330.
Transfer Agent
Columbia Management Investment Services Corp.
P.O. Box 8081
Boston, MA 02266-8081
1-800-345-6611
Distributor
Columbia Management Investment
Distributors, Inc.
225 Franklin Street
Boston, MA 02110
Investment Manager
Columbia Management Investment Advisers, LLC
225 Franklin Street
Boston, MA 02110
45

Columbia Large Cap Enhanced Core Fund
P.O. Box 8081
Boston, MA 02266-8081
columbiamanagement.com
This information is for use with concurrent or prior delivery of a fund prospectus. Investors should consider the investment objectives, risks, charges and expenses of a mutual fund carefully before investing. For a free prospectus, which contains this and other important information about the funds, visit columbiamanagement.com. Read the prospectus carefully before investing. The Fund is distributed by Columbia Management Investment Distributors, Inc., member FINRA, and managed by Columbia Management Investment Advisers, LLC.
©2011 Columbia Management Investment Advisers, LLC. All rights reserved.
C-1701 A (04/11)

Columbia Small Cap Index Fund
Annual Report for the Period Ended February 28, 2011
Table of Contents
The views expressed in this report reflect the current views of the respective parties. These views are not guarantees of future performance and involve certain risks, uncertainties and assumptions that are difficult to predict, so actual outcomes and results may differ significantly from the views expressed. These views are subject to change at any time based upon economic, market or other conditions and the respective parties disclaim any responsibility to update such views. These views may not be relied on as investment advice and, because investment decisions for a Columbia Fund are based on numerous factors, may not be relied on as an indication of trading intent on behalf of any particular Columbia Fund. References to specific securities should not be construed as a recommendation or investment advice.
President’s Message

Dear Shareholder:
The Columbia Management story began over 100 years ago, and today, we are one of the nation’s largest dedicated asset managers. The recent acquisition by Ameriprise Financial, Inc. brings together the talents, resources and capabilities of Columbia Management with those of RiverSource Investments, Threadneedle (acquired by Ameriprise in 2003) and Seligman Investments (acquired by Ameriprise in 2008) to build a best-in-class asset management business that we believe is truly greater than its parts.
RiverSource Investments traces its roots to 1894 when its then newly-founded predecessor, Investors Syndicate, offered a face-amount savings certificate that gave small investors the opportunity to build a safe and secure fund for retirement, education or other special needs. A mutual fund pioneer, Investors Syndicate launched Investors Mutual Fund in 1940. In the decades that followed, its mutual fund products and services lineup grew to include a full spectrum of styles and specialties. More than 110 years later, RiverSource continues to be a trusted financial products leader.
Threadneedle, a leader in global asset management and one of Europe’s largest asset managers, offers sophisticated international experience from a dedicated U.K. management team. Headquartered in London, it is named for Threadneedle Street in the heart of the city’s financial district, where British investors pioneered international and global investing. Threadneedle was acquired in 2003 and today operates as an affiliate of Columbia Management.
Seligman Investments’ beginnings date back to the establishment of the investment firm J. & W. Seligman & Co. in 1864. In the years that followed, Seligman played a major role in the geographical expansion and industrial development of the United States. In 1874, President Ulysses S. Grant named Seligman as fiscal agent for the U.S. Navy — an appointment that would last through World War I. Seligman helped finance the westward path of the railroads and the building of the Panama Canal. The firm organized its first investment company in 1929 and began managing its first mutual fund in 1930. In 2008, J. & W. Seligman & Co. Incorporated was acquired and Seligman Investments became an offering brand of RiverSource Investments, LLC.
We are proud of the rich and distinctive history of these firms, the strength and breadth of products and services they offer, and the combined cultures of pioneering spirit and forward thinking. Together we are committed to providing more for our shareholders than ever before.
| n | | A singular focus on our shareholders. Our business is asset management, so investors are our first priority. We dedicate our resources to identifying timely investment opportunities and provide a comprehensive choice of equity, fixed-income and alternative investments to help meet your individual needs. |
| n | | First-class research and thought leadership. We are dedicated to helping you take advantage of today’s opportunities and anticipate tomorrow’s. We stay abreast of the latest investment trends and ideas, using our collective insight to evaluate events and transform them into solutions you can use. |
| n | | A disciplined investment approach. We aren’t distracted by passing fads. Our teams adhere to a rigorous investment process that helps ensure the integrity of our products and enables you and your financial advisor to match our solutions to your objectives with confidence. |
When you choose Columbia Management, you can be confident that we will take the time to understand your needs and help you and your financial advisor identify the solutions that are right for you. Because at Columbia Management, we don’t consider ourselves successful unless you are.
Sincerely,

J. Kevin Connaughton
President, Columbia Funds
Investors should consider the investment objectives, risks, charges and expenses of a mutual fund carefully before investing. For a free prospectus, which contains this and other important information about the funds, visit www.columbiamanagement.com. The prospectus should be read carefully before investing.
Columbia Funds are distributed by Columbia Management Investment Distributors, Inc., member FINRA, and managed by Columbia Management Investment Advisers, LLC.
© 2011 Columbia Management Investment Advisers, LLC. All rights reserved.
Fund Profile – Columbia Small Cap Index Fund
Performance data quoted represents past performance and current performance may be lower or higher. Past performance is no guarantee of future results. The investment return and principal value will fluctuate so that shares, when redeemed, may be worth more or less than the original cost. Please visit www.columbiamanagement.com for daily and most recent month-end performance updates.
Summary
1-year return as of 02/28/11
| | |
| |
 | | +30.55% Class A shares |
| |
| | +31.07% S&P SmallCap 600 Index |
Morningstar Style BoxTM
Equity Style
The Morningstar Style BoxTM is based on the fund’s portfolio holdings. For equity funds, vertical axis shows the market capitalization of the stocks owned, and the horizontal axis shows investment style (value, blend, or growth). Information shown is based on the most recent data provided by Morningstar.
©2011 Morningstar, Inc. All rights reserved. The Morningstar information contained herein: (1) is proprietary to Morningstar and/or its content providers; (2) may not be copied or distributed; and (3) is not warranted to be accurate, complete or timely. Neither Morningstar nor its content providers are responsible for any damages or losses arising from any use of this information.
Summary
| n | | For the 12-month period that ended February 28, 2011, the fund’s Class A shares returned 30.55% without sales charge. |
| n | | The fund performed generally in line with its benchmark, the S&P SmallCap 600 Index,1 and the average return of the funds in its peer group, the Lipper Small-Cap Core Funds Classification.2 |
| n | | Despite a rocky period in the summer of 2010, stock prices climbed for the second consecutive year, buoyed by sectors that are sensitive to economic growth. |
Portfolio Management
Alfred F. Alley III has manged or co-managed the fund since July 2009 and has been associated with Columbia Management Investment Advisers, LLC (the Investment Manager) since May 2010. Prior to joining the Investment Manager, Mr. Alley was associated with the fund’s previous advisor or its predecessors since 2005.
| 1 | The Standard and Poor’s (S&P) SmallCap 600 Index tracks the performance of 600 domestic companies traded on the New York Stock Exchange, the NYSE AMEX and the NASDAQ stock market. The S&P Small Cap 600 is heavily weighted with the stocks of companies with small market capitalizations. |
| 2 | Lipper Inc., a widely respected data provider in the industry, calculates an average total return (assuming reinvestment of distributions) for mutual funds with investment objectives similar to those of the fund. Lipper makes no adjustment for the effect of sales loads. |
Indices are not available for investment, are not professionally managed and do not reflect sales charges, fees, brokerage commissions, taxes or other expenses of investing. Securities in the fund may not match those in an index.
1
Economic Update – Columbia Small Cap Index Fund
Summary
For the 12-month period that ended February 28, 2011
| | n | | The U.S. stock market, as measured by the S&P 500 Index, delivered solid returns, despite a summer 2010 correction. Foreign stock market returns were generally in line with the U.S. market, as measured by the MSCI EAFE Index (Net). | |
| | |
| S&P Index | | MSCI Index |
| |

| |
|
22.57% | | 20.00% |
| | n | | Strengthening economic growth and rising interest rates kept a lid on most bond market sectors. The Barclays Capital Aggregate Bond Index delivered modest results. However, high-yield bonds were strong performers, as measured by the JPMorgan Developed BB High Yield Index. | |
| | |
| Barclays Aggregate Index | | JPMorgan Index |
| |
| |
|
4.93% | | 14.74% |
The U.S. economy continued to expand at a modest pace over the past 12 months, as measured by gross domestic product (GDP). After a strong first quarter in 2010, GDP growth dropped to 1.7% in the second quarter and fear spread that the economy would lapse into recession. However, the pace picked up in the third quarter, and growth was strong enough to inspire confidence among consumers, businesses and investors. GDP expanded by 2.6% in the third quarter and 2.8% in the fourth quarter. With the Federal Reserve Board (the Fed) providing additional monetary stimulus to shore up economic growth and the extension of key tax cuts for the next two years, 2011 expectations are for continued growth. Consumer confidence is on the mend, even though job growth has not met expectations. Business spending also tracked higher over the period.
Consumer spending on cars, clothing and other goods generally trended higher throughout the year. Holiday spending rose 5.5% between November 5, 2010 and December 24, 2010, in all retail categories, excluding automobiles, compared with the same period in 2009, according to MasterCard Advisors’ SpendingPulse, which tracks spending on all transactions including cash. Analysts say that an increase in personal savings and a decline in consumer debt gave consumers confidence to spend a little more on the 2010 holidays. The personal savings rate edged higher, ending January 2011, the last month for which data was available, at 5.8%. Personal income also increased during the year, surging in January 2011, as payroll tax cuts kicked in.
News on the job front was mostly positive over the 12-month period. A good portion of the jobs added in March, April and May of 2010 were temporary, government-sponsored census positions, which began to unwind in June, July and August of 2010. However, private sector payroll employment began to trend higher in the third quarter, massive layoffs declined and job growth turned solidly positive, with the addition of 255,000 new jobs in the first two months of 2011.
Despite some glimmers of improvement early in 2010, the housing market remained troublesome throughout the period. Both new and existing home sales fell after a federal tax credit for new and repeat homebuyers expired. Distressed properties pressured prices and foreclosures continued — another drag on prices. The inventory of unsold homes ended the period just about where it started, at 7.6 months for both new and existing homes, according to the National Association of Realtors and a joint release from the U.S. Census Bureau and the U.S. Department of Housing and Urban Development. The new year brought a bit of good news: Existing home sales increased in January 2011, raising the level of sales above where it was one year ago. According to the National Association of Realtors, it was the first time in seven months that year-over-year sales activity compared favorably.
Reports from the business side of the economy were generally positive. A key measure of the nation’s manufacturing situation — the Institute for Supply Management’s Index — took a somewhat surprising turn higher in the final months of the period. Technology spending rose 12% in 2010, according to the NPD Group, a national marketing research firm. Purchases of computers, networking and software returned to prerecession levels. Industrial production was disappointingly flat at year end, per the report issued by the Fed, and it slipped further in January 2011. The amount of manufacturing capacity utilized, per the report issued by the Fed, — a key measure of the health of the manufacturing sector — continued to inch higher.
2
Economic Update (continued) – Columbia Small Cap Index Fund
Stocks moved higher despite summer 2010 setback
Against a strengthening economic backdrop, a stock market rally that began early in 2009 continued into 2010 despite a summer setback linked to a debt crisis brewing in Europe, which raised concerns among U.S. investors. These fears were short-lived and stocks regained their footing in September 2010, moving higher through the end of the period. The S&P 500 Index1 returned 22.57% for the 12 months through February 28, 2011. Outside the United States, stock market returns seesawed but ended just short of U.S. market returns. The MSCI EAFE Index (Net),2 a broad gauge of stock market performance in foreign developed markets, returned 20.00% (in U.S. dollars) for the 12-month period, as concerns about the impact of a bailout for weak euro zone economies abated. Emerging stock markets were similarly strong. The MSCI Emerging Markets Index (Net)3 returned 20.91% (in U.S. dollars) for the 12-month period.
Bonds delivered modest returns
As the economy strengthened and interest rates edged higher, most bond sectors delivered modest returns. The Barclays Capital Aggregate Bond Index4 returned 4.93%. High-yield bonds led the fixed-income markets. For the 12 months covered by this report, the JPMorgan Developed BB High Yield Index5 returned 14.74%. Despite rising yields in the second half of the period, the Treasury market was also positive. The Barclays Capital U.S. Treasury Index6 returned 3.71%. However, municipal bonds struggled in the final months of the period, as interest rates inched higher and issue supply surged ahead of the expiration of the Build America Bonds program. The Barclays Capital Municipal Bond Index7 gained 1.72% for the period. Despite positive economic activity, the Fed kept a key short-term interest rate — the federal funds rate — close to zero.
Past performance is no guarantee of future results.
| 1 | The Standard & Poor’s (S&P) 500 Index tracks the performance of 500 widely held, large-capitalization U.S. stocks. |
| 2 | The Morgan Stanley Capital International Europe, Australasia, Far East (MSCI EAFE) Index (Net) is a free float-adjusted market capitalization index that is designed to measure the equity market performance of developed markets, excluding the U.S. & Canada. As of May 27, 2010, the MSCI EAFE Index (Net) consisted of the following 22 developed market country indices: Australia, Austria, Belgium, Denmark, Finland, France, Germany, Greece, Hong Kong, Ireland, Israel, Italy, Japan, the Netherlands, New Zealand, Norway, Portugal, Singapore, Spain, Sweden, Switzerland and the United Kingdom. |
| 3 | The Morgan Stanley Capital International Emerging Markets (MSCI EM) Index (Net) is a free float-adjusted market capitalization index that is designed to measure equity market performance of emerging markets. As of May 27, 2010, the MSCI EM Index (Net) consisted of the following 21 emerging market country indices: Brazil, Chile, China, Colombia, Czech Republic, Egypt, Hungary, India, Indonesia, Korea, Malaysia, Mexico, Morocco, Peru, Philippines, Poland, Russia, South Africa, Taiwan, Thailand and Turkey. |
| 4 | The Barclays Capital Aggregate Bond Index is a market value-weighted index that tracks the daily price, coupon, pay-downs and total return performance of fixed-rate, publicly placed, dollar-denominated and non-convertible investment grade debt issues with at least $250 million par amount outstanding and with at least one year to final maturity. |
| 5 | The JPMorgan Developed BB High Yield Index is an unmanaged index designed to mirror the investable universe of the U.S. dollar developed, BB-rated, high yield corporate debt market. |
| 6 | The Barclays Capital U.S. Treasury Index includes public obligations of the U.S. Treasury. Treasury bills are excluded by the maturity constraint. In addition, certain special issues, such as state and local government series bonds (SLGs), as well as U.S. Treasury TIPS, are excluded. STRIPS are excluded from the index because their inclusion would result in double-counting. |
| 7 | The Barclays Capital Municipal Bond Index is considered representative of the broad market for investment-grade, tax-exempt bonds with a maturity of at least one year. |
Indices are not available for investment, are not professionally managed and do not reflect sales charges, fees, brokerage commissions, taxes or other expenses of investing. Securities in the fund may not match those in an index.
3
Performance Information – Columbia Small Cap Index Fund
Performance data quoted represents past performance and current performance may be lower or higher. Past performance is no guarantee of future results. The investment return and principal value will fluctuate so that shares, when redeemed, may be worth more or less than the original cost. Please visit www.columbiamanagement.com for daily and most recent month-end performance updates.
| | | | |
| Net asset value per share | |
| |
as of 02/28/11 ($) | | | | |
Class A | | | 18.01 | |
Class Z | | | 18.06 | |
| Distribution declared per share | |
| |
03/01/10 – 02/28/11 ($) | | | | |
Class A | | | 0.22 | |
Class Z | | | 0.25 | |
|
| Performance of a $10,000 investment 03/01/01 – 02/28/11 |
The chart above shows the change in value of a hypothetical $10,000 investment in Class A shares of Columbia Small Cap Index Fund during the stated time period, and does not reflect the deduction of taxes that a shareholder may pay on fund distributions or on the redemption of fund shares.
| | | | |
| Performance of a $10,000 investment 03/01/01 – 02/28/11 ($) | |
Class A | | | 21,302 | |
Class Z | | | 21,875 | |
| | | | | | | | |
| Average annual total return as of 02/28/11 (%) | |
| | |
| Share class | | A | | | Z | |
| Inception | | 10/15/96 | | | 10/15/96 | |
1-year | | | 30.55 | | | | 30.81 | |
5-year | | | 3.75 | | | | 4.01 | |
10-year | | | 7.86 | | | | 8.14 | |
Performance results reflect any fee waivers or reimbursements of fund expenses by the Investment Manager and/or any of its affiliates. Absent these fee waivers or expense reimbursement arrangements, performance results would have been lower.
All results shown assume reinvestment of distributions. Class A shares are sold at net asset value. Class Z shares are sold at net asset value with no distribution and service (Rule 12b-1) fees. Class Z shares have limited eligibility and the investment minimum requirements may vary. Please see the fund’s prospectus for details. Performance for different share classes will vary based on differences in sales charges and fees associated with each class.
The tables do not reflect the deduction of taxes that a shareholder may pay on fund distributions or on the redemption of fund shares.
4
Understanding Your Expenses – Columbia Small Cap Index Fund
As a fund shareholder, you incur two types of costs. There are transaction costs and ongoing costs, which generally include investment advisory fees, distribution and service (Rule 12b-1) fees and other fund expenses. The information on this page is intended to help you understand the ongoing costs of investing in the fund and to compare these costs with the ongoing costs of investing in other mutual funds.
Analyzing your fund’s expenses by share class
To illustrate these ongoing costs, we have provided an example and calculated the expenses paid by investors in each share class during the period. The information in the following table is based on an initial investment of $1,000, which is invested at the beginning of the period and held for the entire period. Expense information is calculated two ways and each method provides you with different information. The amount listed in the “Actual” column is calculated using the fund’s actual operating expenses and total return for the period. The amount listed in the “Hypothetical” column for each share class assumes that the return each year is 5% before expenses and is calculated based on the fund’s actual operating expenses. You should not use the hypothetical account values and expenses to estimate either your actual account balance at the end of the period or the expenses you paid during this period.
Compare with other funds
Since all mutual funds are required to include the same hypothetical calculations about expenses in shareholder reports, you can use this information to compare the ongoing costs of investing in the fund with other funds. To do so, compare the 5% hypothetical example with the 5% hypothetical examples that appear in the shareholder reports of other funds. As you compare hypothetical examples of other funds, it is important to note that hypothetical examples are meant to highlight the ongoing costs of investing in a fund and do not reflect any transaction costs, such as sales charges, redemption fees or exchange fees.
Estimating your actual expenses
To estimate the expenses that you paid over the period, first you will need your account balance at the end of the period:
| | n | | For shareholders who receive their account statements from Columbia Management Investment Services Corp., your account balance is available online at www.columbiamanagement.com or by calling Shareholder Services at 800.345.6611. | |
| | n | | For shareholders who receive their account statements from their financial intermediary, contact your financial intermediary to obtain your account balance. | |
| | 1. | Divide your ending account balance by $1,000. For example, if an account balance was $8,600 at the end of the period, the result would be 8.6. | |
| | 2. | In the section of the table below titled “Expenses paid during the period,” locate the amount for your share class. You will find this number in the column labeled “Actual.” Multiply this number by the result from step 1. Your answer is an estimate of the expenses you paid on your account during the period. | |
If the value of your account falls below the minimum initial investment requirement applicable to you, your account may be subject to a $20 annual fee. This fee is not included in the accompanying table. If you are subject to the fee, keep it in mind when you are estimating the ongoing expenses of investing in the fund and when comparing the expenses of this fund with other funds.
| | | | | | | | | | | | | | | | | | | | | | | | | | | | |
09/01/10 – 02/28/11 | |
| | | | |
| | | Account value at the
beginning of the period ($) | | | Account value at the
end of the period ($) | | | Expenses paid
during the period ($) | | | Fund’s annualized
expense ratio (%) | |
| | | Actual | | | Hypothetical | | | Actual | | | Hypothetical | | | Actual | | | Hypothetical | | | Actual | |
Class A | | | 1,000.00 | | | | 1,000.00 | | | | 1,352.00 | | | | 1,022.56 | | | | 2.62 | | | | 2.26 | | | | 0.45 | |
Class Z | | | 1,000.00 | | | | 1,000.00 | | | | 1,353.10 | | | | 1,023.80 | | | | 1.17 | | | | 1.00 | | | | 0.20 | |
Expenses paid during the period are equal to the annualized expense ratio for the share class, multiplied by the average account value over the period, then multiplied by the number of days in the fund’s most recent fiscal half-year and divided by 365.
Had the Investment Manager and/or any of its affiliates not waived fees or reimbursed a portion of expenses, account value at the end of the period would have been reduced.
It is important to note that the expense amounts shown in the table are meant to highlight only ongoing costs of investing in the fund and do not reflect any transaction costs, such as sales charges, redemption fees or exchange fees. Therefore, the hypothetical examples provided may not help you determine the relative total costs of owning shares of different funds. If these transaction costs were included, your costs would have been higher.
5
Portfolio Manager’s Report – Columbia Small Cap Index Fund
Performance data quoted represents past performance and current performance may be lower or higher. Past performance is no guarantee of future results. The investment return and principal value will fluctuate so that shares, when redeemed, may be worth more or less than the original cost. Please visit www.columbiamanagement.com for daily and most recent month-end performance updates.
| | | | |
| Top 10 holdings | |
| |
as of 02/28/11 (%) | | | | |
Oil States International, Inc. | | | 0.7 | |
Varian Semiconductor Equipment Associates, Inc. | | | 0.7 | |
World Fuel Services Corp. | | | 0.6 | |
AMERIGROUP Corp. | | | 0.5 | |
Cooper Companies, Inc. | | | 0.5 | |
Regeneron Pharmaceuticals, Inc. | | | 0.5 | |
Stifel Financial Corp. | | | 0.5 | |
Holly Corp. | | | 0.5 | |
BioMed Realty Trust, Inc. | | | 0.5 | |
CARBO Ceramics, Inc. | | | 0.5 | |
Holdings are calculated as a percentage of net assets.
| | | | |
| Top 5 sectors | |
| |
as of 02/28/11 (%) | | | | |
Information Technology | | | 19.0 | |
Financials | | | 18.4 | |
Industrials | | | 15.6 | |
Consumer Discretionary | | | 13.8 | |
Health Care | | | 12.5 | |
Sector Breakdown is calculated as a percentage of net assets.
Portfolio Manager’s Report
For the 12-month period that ended February 28, 2011, the fund’s Class A shares returned 30.55% without sales charge. The S&P SmallCap 600 Index returned 31.07%. The average return of the funds in its peer group, the Lipper Small-Cap Core Funds Classification, was 30.71%. The fund seeks to replicate the benchmark weights of securities, industries and sectors represented in the S&P SmallCap 600 Index. As such, its return was in line with the return of the index, after fees and expenses, which the index does not incur.
Energy, information technology and industrials were market leaders
In a period that was strong for stocks, in general, and for small-cap stocks in particular, the energy, information technology and industrials sectors were the best performers within the index. Energy stocks got a boost from strengthening economic activity and rising commodity prices. Three of the top five top stocks in the fund were from the energy sector: SM Energy, which was removed from the index as it got bigger, as measured by market capitalization; Oil States International and Holly (0.7% and 0.5% of net assets, respectively). The information technology sector benefited from higher business spending. Within technology, Cypress Semiconductor was one of the top contributors to the fund’s return. Cypress was removed from the index as it grew beyond its market capitalization limits.
Even weaker sectors were strong performers
All ten sectors in the index generated positive returns for the period, and even the weakest performers were strong. Financials, telecommunication services and utilities underperformed the index average, but they gained 22.5%, 23.5% and 24.3%, respectively. The worst-performing stocks for the fund came from the health care, technology, energy and consumer discretionary sectors. Within health care, Amedisys (0.2% of net assets) was the period’s weakest performer. Within technology Tekelec and DG FastChannel (0.1% and 0.2% of net assets, respectively) generated sharp negative returns. Penn Virginia (0.1% of net assets) bucked the positive trend within the energy sector and was sharply down for the period. Capella Education (0.2% of net assets), in the consumer discretionary sector, declined as on-line colleges as a group came under pressure.
6
Portfolio Manager’s Report (continued) – Columbia Small Cap Index Fund
Portfolio changes
During the 12-month period, there were 58 additions and deletions to the S&P SmallCap 600 Index. Because the fund is mandated to track the underlying index by fully replicating its holdings, all changes made to the portfolio matched changes to the index.
Looking ahead
Even after two years of strong returns, we believe the U.S. equity market remains attractive. Valuations seem quite reasonable because earnings growth has kept pace with rising stock prices. And while earnings growth will inevitably slow from the pace it set in the early stages of this economic recovery, it is likely to remain quite healthy. Of course, no one can predict what will happen to stocks in any one year. However, historically equities have been the strongest asset class over the long term and investors who have learned to ride out periods of weakness and volatility have been rewarded.
Portfolio characteristics and holdings are subject to change periodically and may not be representative of current characteristics and holdings. The outlook for the fund may differ from those presented for other Columbia Funds.
Equity securities are subject to stock market fluctuations that occur in response to economic and business developments.
Stocks of small-cap companies pose special risks, including possible illiquidity and greater price volatility than stocks of larger, more established companies.
7
Investment Portfolio – Columbia Small Cap Index Fund
February 28, 2011
Common Stocks – 97.2%
| | | | | | | | |
| | | Shares | | | Value ($) | |
| Consumer Discretionary – 13.8% | | | | | | | | |
| Auto Components – 0.3% | �� | | | | | | | |
Drew Industries, Inc. | | | 68,750 | | | | 1,590,188 | |
Spartan Motors, Inc. | | | 117,275 | | | | 744,696 | |
Standard Motor Products, Inc. | | | 70,075 | | | | 814,972 | |
Superior Industries International, Inc. | | | 83,650 | | | | 1,662,962 | |
| | | | | | | | |
Auto Components Total | | | | | | | 4,812,818 | |
| | |
| Automobiles – 0.1% | | | | | | | | |
Winnebago Industries, Inc. (a) | | | 104,725 | | | | 1,514,324 | |
| | | | | | | | |
Automobiles Total | | | | | | | 1,514,324 | |
| | |
| Distributors – 0.3% | | | | | | | | |
Audiovox Corp., Class A (a) | | | 66,825 | | | | 553,311 | |
Pool Corp. | | | 178,800 | | | | 4,462,848 | |
| | | | | | | | |
Distributors Total | | | | | | | 5,016,159 | |
| |
| Diversified Consumer Services – 1.1% | | | | | |
American Public Education, Inc. (a) | | | 64,600 | | | | 2,740,332 | |
Capella Education Co. (a) | | | 59,500 | | | | 3,431,365 | |
Coinstar, Inc. (a) | | | 113,925 | | | | 4,862,319 | |
Corinthian Colleges, Inc. (a) | | | 303,600 | | | | 1,590,864 | |
Hillenbrand, Inc. | | | 224,075 | | | | 4,873,631 | |
Pre-Paid Legal Services, Inc. (a) | | | 35,100 | | | | 2,314,494 | |
Universal Technical Institute, Inc. | | | 75,125 | | | | 1,382,300 | |
| | | | | | | | |
Diversified Consumer Services Total | | | | | | | 21,195,305 | |
| |
| Hotels, Restaurants & Leisure – 2.8% | | | | | |
Biglari Holdings, Inc. (a) | | | 5,205 | | | | 2,226,491 | |
BJ’s Restaurants, Inc. (a) | | | 81,275 | | | | 2,921,836 | |
Buffalo Wild Wings, Inc. (a) | | | 65,425 | | | | 3,466,871 | |
California Pizza Kitchen, Inc. (a) | | | 88,425 | | | | 1,489,077 | |
CEC Entertainment, Inc. (a) | | | 73,850 | | | | 2,857,256 | |
Cracker Barrel Old Country Store, Inc. | | | 83,950 | | | | 4,184,068 | |
DineEquity, Inc. (a) | | | 55,750 | | | | 3,189,457 | |
Interval Leisure Group, Inc. (a) | | | 145,750 | | | | 2,464,632 | |
Jack in the Box, Inc. (a) | | | 190,350 | | | | 4,187,700 | |
Marcus Corp. | | | 77,750 | | | | 1,012,305 | |
Monarch Casino & Resort, Inc. (a) | | | 40,650 | | | | 424,793 | |
Multimedia Games, Inc. (a) | | | 99,350 | | | | 546,425 | |
O’Charleys, Inc. (a) | | | 68,125 | | | | 432,594 | |
P.F. Chang’s China Bistro, Inc. | | | 82,625 | | | | 3,837,105 | |
Papa John’s International, Inc. (a) | | | 72,325 | | | | 2,110,444 | |
Peet’s Coffee & Tea, Inc. (a) | | | 46,100 | | | | 1,971,236 | |
Pinnacle Entertainment, Inc. (a) | | | 220,925 | | | | 2,900,745 | |
Red Robin Gourmet Burgers, Inc. (a) | | | 56,150 | | | | 1,339,739 | |
Ruby Tuesday, Inc. (a) | | | 233,350 | | | | 3,117,556 | |
Ruth’s Hospitality Group, Inc. (a) | | | 111,283 | | | | 557,528 | |
Shuffle Master, Inc. (a) | | | 192,925 | | | | 1,815,424 | |
Sonic Corp. (a) | | | 221,775 | | | | 1,969,362 | |
Texas Roadhouse, Inc., Class A (a) | | | 209,100 | | | | 3,550,518 | |
| | | | | | | | |
Hotels, Restaurants & Leisure Total | | | | | | | 52,573,162 | |
| | | | | | | | |
| | | Shares | | | Value ($) | |
| Household Durables – 0.8% | | | | | | | | |
Blyth, Inc. | | | 19,550 | | | | 671,934 | |
Ethan Allen Interiors, Inc. | | | 103,350 | | | | 2,278,867 | |
Helen of Troy Ltd. (a) | | | 110,250 | | | | 3,079,282 | |
Kid Brands, Inc. (a) | | | 77,475 | | | | 725,166 | |
La-Z-Boy, Inc. (a) | | | 186,600 | | | | 1,873,464 | |
M/I Homes, Inc. (a) | | | 66,650 | | | | 889,778 | |
Meritage Home Corp. (a) | | | 115,550 | | | | 2,982,345 | |
Skyline Corp. | | | 24,800 | | | | 498,232 | |
Standard Pacific Corp. (a) | | | 357,375 | | | | 1,429,500 | |
Universal Electronics, Inc. (a) | | | 53,375 | | | | 1,454,469 | |
| | | | | | | | |
Household Durables Total | | | | | | | 15,883,037 | |
| | |
| Internet & Catalog Retail – 0.5% | | | | | | | | |
Blue Nile, Inc. (a) | | | 51,800 | | | | 2,961,924 | |
HSN, Inc. (a) | | | 139,250 | | | | 4,522,840 | |
NutriSystem, Inc. | | | 96,150 | | | | 1,272,064 | |
PetMed Express, Inc. | | | 81,950 | | | | 1,220,236 | |
| | | | | | | | |
Internet & Catalog Retail Total | | | | | | | 9,977,064 | |
|
| Leisure Equipment & Products – 0.8% | |
Arctic Cat, Inc. (a) | | | 43,975 | | | | 558,922 | |
Brunswick Corp. | | | 318,925 | | | | 7,344,843 | |
Callaway Golf Co. | | | 231,725 | | | | 1,793,551 | |
Jakks Pacific, Inc. (a) | | | 99,300 | | | | 1,850,952 | |
RC2 Corp. (a) | | | 77,850 | | | | 1,690,124 | |
Sturm Ruger & Co., Inc. | | | 67,675 | | | | 1,222,211 | |
| | | | | | | | |
Leisure Equipment & Products Total | | | | | | | 14,460,603 | |
| | |
| Media – 0.6% | | | | | | | | |
Arbitron, Inc. | | | 96,950 | | | | 3,859,579 | |
EW Scripps Co., Class A (a) | | | 110,450 | | | | 1,057,007 | |
Live Nation Entertainment, Inc. (a) | | | 537,035 | | | | 5,708,682 | |
| | | | | | | | |
Media Total | | | | | | | 10,625,268 | |
| | |
| Multiline Retail – 0.1% | | | | | | | | |
Fred’s, Inc., Class A | | | 141,100 | | | | 1,944,358 | |
Tuesday Morning Corp. (a) | | | 131,575 | | | | 614,455 | |
| | | | | | | | |
Multiline Retail Total | | | | | | | 2,558,813 | |
| | |
| Specialty Retail – 4.1% | | | | | | | | |
Big 5 Sporting Goods Corp. | | | 78,500 | | | | 1,094,290 | |
Brown Shoe Co., Inc. | | | 157,775 | | | | 2,445,512 | |
Buckle, Inc. | | | 93,900 | | | | 3,670,551 | |
Cabela’s, Inc. (a) | | | 144,100 | | | | 3,909,433 | |
Cato Corp., Class A | | | 106,050 | | | | 2,571,712 | |
Children’s Place Retail Stores, Inc. (a) | | | 93,425 | | | | 4,269,522 | |
Christopher & Banks Corp. | | | 128,950 | | | | 787,885 | |
Coldwater Creek, Inc. (a) | | | 216,100 | | | | 639,656 | |
Finish Line, Inc., Class A | | | 191,774 | | | | 3,348,374 | |
Genesco, Inc. (a) | | | 86,525 | | | | 3,419,468 | |
Group 1 Automotive, Inc. | | | 85,400 | | | | 3,608,150 | |
See Accompanying Notes to Financial Statements.
8
Columbia Small Cap Index Fund
February 28, 2011
Common Stocks (continued)
| | | | | | | | |
| | | Shares | | | Value ($) | |
| Consumer Discretionary (continued) | | | | | |
Haverty Furniture Companies, Inc. | | | 66,800 | | | | 888,440 | |
Hibbett Sports, Inc. (a) | | | 100,600 | | | | 3,159,846 | |
HOT Topic, Inc. | | | 160,425 | | | | 858,274 | |
Jo-Ann Stores, Inc. (a) | | | 94,775 | | | | 5,752,842 | |
Jos. A. Bank Clothiers, Inc. (a) | | | 99,387 | | | | 4,582,735 | |
Kirkland’s, Inc. (a) | | | 56,550 | | | | 864,084 | |
Lithia Motors, Inc., Class A | | | 78,150 | | | | 1,183,191 | |
Lumber Liquidators Holdings, Inc. (a) | | | 83,900 | | | | 1,953,192 | |
MarineMax, Inc. (a) | | | 79,700 | | | | 719,691 | |
Men’s Wearhouse, Inc. | | | 189,500 | | | | 5,059,650 | |
Midas, Inc. (a) | | | 51,075 | | | | 394,810 | |
Monro Muffler Brake, Inc. | | | 108,637 | | | | 3,550,257 | |
OfficeMax, Inc. (a) | | | 305,900 | | | | 4,203,066 | |
Pep Boys-Manny, Moe & Jack | | | 188,925 | | | | 2,367,230 | |
Sonic Automotive, Inc., Class A | | | 127,125 | | | | 1,828,058 | |
Stage Stores, Inc. | | | 131,700 | | | | 2,296,848 | |
Stein Mart, Inc. | | | 96,900 | | | | 793,611 | |
Vitamin Shoppe, Inc. (a) | | | 89,400 | | | | 3,110,226 | |
Zale Corp. (a) | | | 83,150 | | | | 342,578 | |
Zumiez, Inc. (a) | | | 74,850 | | | | 1,951,340 | |
| | | | | | | | |
Specialty Retail Total | | | | | | | 75,624,522 | |
| |
| Textiles, Apparel & Luxury Goods – 2.3% | | | | | |
Carter’s, Inc. (a) | | | 206,875 | | | | 5,929,037 | |
CROCS, Inc. (a) | | | 313,925 | | | | 5,540,776 | |
Iconix Brand Group, Inc. (a) | | | 260,900 | | | | 5,765,890 | |
K-Swiss, Inc., Class A (a) | | | 97,650 | | | | 977,477 | |
Liz Claiborne, Inc. (a) | | | 339,850 | | | | 1,746,829 | |
Maidenform Brands, Inc. (a) | | | 84,025 | | | | 2,280,439 | |
Movado Group, Inc. (a) | | | 62,275 | | | | 876,209 | |
Oxford Industries, Inc. | | | 50,000 | | | | 1,206,000 | |
Perry Ellis International, Inc. (a) | | | 36,025 | | | | 1,046,166 | |
Quiksilver, Inc. (a) | | | 465,975 | | | | 2,008,352 | |
Skechers U.S.A., Inc., Class A (a) | | | 121,700 | | | | 2,528,926 | |
Steven Madden Ltd. (a) | | | 82,825 | | | | 3,573,071 | |
True Religion Apparel, Inc. (a) | | | 91,600 | | | | 2,177,332 | |
Volcom, Inc. | | | 61,450 | | | | 1,099,955 | |
Wolverine World Wide, Inc. | | | 175,700 | | | | 6,458,732 | |
| | | | | | | | |
Textiles, Apparel & Luxury Goods Total | | | | 43,215,191 | |
| | | | | | | | |
Consumer Discretionary Total | | | | | | | 257,456,266 | |
| | | | | | | | |
| Consumer Staples – 3.4% | | | | | | | | |
| Beverages – 0.1% | | | | | | | | |
Boston Beer Co., Inc., Class A (a) | | | 32,775 | | | | 3,042,176 | |
| | | | | | | | |
Beverages Total | | | | | | | 3,042,176 | |
| | |
| Food & Staples Retailing – 1.0% | | | | | | | | |
Andersons, Inc. | | | 66,225 | | | | 3,181,449 | |
Casey’s General Stores, Inc. | | | 136,150 | | | | 5,591,680 | |
| | | | | | | | |
| | | Shares | | | Value ($) | |
Nash Finch Co. | | | 43,750 | | | | 1,766,188 | |
Spartan Stores, Inc. | | | 81,375 | | | | 1,226,321 | |
United Natural Foods, Inc. (a) | | | 173,325 | | | | 7,357,646 | |
| | | | | | | | |
Food & Staples Retailing Total | | | | | | | 19,123,284 | |
| | |
| Food Products – 1.9% | | | | | | | | |
B&G Foods, Inc. | | | 171,300 | | | | 2,569,500 | |
Cal-Maine Foods, Inc. | | | 48,100 | | | | 1,388,647 | |
Calavo Growers, Inc. | | | 43,250 | | | | 1,004,265 | |
Darling International, Inc. (a) | | | 419,675 | | | | 5,829,286 | |
Diamond Foods, Inc. | | | 79,075 | | | | 4,028,871 | |
Hain Celestial Group, Inc. (a) | | | 154,200 | | | | 4,598,244 | |
J & J Snack Foods Corp. | | | 51,325 | | | | 2,256,760 | |
Sanderson Farms, Inc. | | | 69,500 | | | | 2,873,825 | |
Seneca Foods Corp., Class A (a) | | | 32,900 | | | | 925,477 | |
Snyders-Lance, Inc. | | | 166,300 | | | | 3,029,986 | |
TreeHouse Foods, Inc. (a) | | | 127,350 | | | | 6,643,850 | |
| | | | | | | | |
Food Products Total | | | | | | | 35,148,711 | |
| | |
| Household Products – 0.2% | | | | | | | | |
Central Garden & Pet Co., Class A (a) | | | 197,525 | | | | 1,819,205 | |
WD-40 Co. | | | 60,150 | | | | 2,445,699 | |
| | | | | | | | |
Household Products Total | | | | | | | 4,264,904 | |
| | |
| Personal Products – 0.1% | | | | | | | | |
Medifast, Inc. (a) | | | 48,300 | | | | 1,117,662 | |
| | | | | | | | |
Personal Products Total | | | | | | | 1,117,662 | |
| | |
| Tobacco – 0.1% | | | | | | | | |
Alliance One International, Inc. (a) | | | 313,300 | | | | 1,137,279 | |
| | | | | | | | |
Tobacco Total | | | | | | | 1,137,279 | |
| | | | | | | | |
Consumer Staples Total | | | | | | | 63,834,016 | |
| | | | | | | | |
| Energy – 6.0% | | | | | | | | |
| Energy Equipment & Services – 3.4% | | | | | |
Basic Energy Services, Inc. (a) | | | 83,125 | | | | 1,594,338 | |
Bristow Group, Inc. (a) | | | 130,325 | | | | 6,245,174 | |
CARBO Ceramics, Inc. | | | 68,200 | | | | 8,454,754 | |
Gulf Island Fabrication, Inc. | | | 51,500 | | | | 1,594,955 | |
Hornbeck Offshore Services, Inc. (a) | | | 83,750 | | | | 2,379,338 | |
ION Geophysical Corp. (a) | | | 548,425 | | | | 7,030,808 | |
Lufkin Industries, Inc. | | | 108,100 | | | | 8,448,015 | |
Matrix Service Co. (a) | | | 94,950 | | | | 1,325,502 | |
Oil States International, Inc. (a) | | | 181,850 | | | | 13,236,861 | |
Pioneer Drilling Co. (a) | | | 194,900 | | | | 2,206,268 | |
SEACOR Holdings, Inc. | | | 76,450 | | | | 7,245,166 | |
TETRA Technologies, Inc. (a) | | | 274,050 | | | | 3,784,631 | |
| | | | | | | | |
Energy Equipment & Services Total | | | | | | | 63,545,810 | |
See Accompanying Notes to Financial Statements.
9
Columbia Small Cap Index Fund
February 28, 2011
Common Stocks (continued)
| | | | | | | | |
| | | Shares | | | Value ($) | |
| Energy (continued) | | | | | | | | |
| Oil, Gas & Consumable Fuels – 2.6% | | | | | |
Contango Oil & Gas Co. (a) | | | 46,200 | | | | 2,831,136 | |
Georesources, Inc. (a) | | | 63,600 | | | | 2,001,492 | |
Gulfport Energy Corp. (a) | | | 113,900 | | | | 3,370,301 | |
Holly Corp. | | | 158,900 | | | | 9,079,546 | |
Penn Virginia Corp. | | | 163,875 | | | | 2,666,246 | |
Petroleum Development Corp. (a) | | | 84,225 | | | | 3,952,679 | |
Petroquest Energy, Inc. (a) | | | 200,000 | | | | 1,724,000 | |
Stone Energy Corp. (a) | | | 174,625 | | | | 5,287,645 | |
Swift Energy Co. (a) | | | 149,750 | | | | 6,431,763 | |
World Fuel Services Corp. | | | 248,625 | | | | 10,303,020 | |
| | | | | | | | |
Oil, Gas & Consumable Fuels Total | | | | | | | 47,647,828 | |
| | | | | | | | |
Energy Total | | | | | | | 111,193,638 | |
| | | | | | | | |
| Financials – 18.4% | | | | | | | | |
| Capital Markets – 1.0% | | | | | | | | |
Investment Technology Group, Inc. (a) | | | 150,600 | | | | 2,883,990 | |
LaBranche & Co., Inc. (a) | | | 129,600 | | | | 544,320 | |
optionsXpress Holdings, Inc. | | | 152,925 | | | | 2,478,914 | |
Piper Jaffray Companies, Inc. (a) | | | 57,475 | | | | 2,365,096 | |
Stifel Financial Corp. (a) | | | 126,600 | | | | 9,082,284 | |
SWS Group, Inc. | | | 105,300 | | | | 567,567 | |
TradeStation Group, Inc. (a) | | | 143,850 | | | | 968,111 | |
| | | | | | | | |
Capital Markets Total | | | | | | | 18,890,282 | |
| | |
| Commercial Banks – 5.5% | | | | | | | | |
Bank of the Ozarks, Inc. | | | 47,075 | | | | 2,026,579 | |
Boston Private Financial Holdings, Inc. | | | 275,125 | | | | 1,950,636 | |
City Holding Co. | | | 55,725 | | | | 1,908,581 | |
Columbia Banking System, Inc. | | | 141,475 | | | | 2,806,864 | |
Community Bank System, Inc. | | | 119,325 | | | | 3,002,217 | |
First BanCorp Puerto Rico (a) | | | 76,671 | | | | 355,753 | |
First Commonwealth Financial Corp. | | | 339,400 | | | | 2,223,070 | |
First Financial Bancorp | | | 208,850 | | | | 3,535,830 | |
First Financial Bankshares, Inc. | | | 75,000 | | | | 3,765,000 | |
First Midwest Bancorp, Inc. | | | 266,375 | | | | 3,215,146 | |
Glacier Bancorp, Inc. | | | 258,682 | | | | 4,043,200 | |
Hancock Holding Co. | | | 106,150 | | | | 3,680,220 | |
Hanmi Financial Corp. (a) | | | 543,900 | | | | 679,875 | |
Home Bancshares, Inc. | | | 78,750 | | | | 1,774,238 | |
Independent Bank Corp. MA | | | 76,300 | | | | 2,074,597 | |
Nara Bancorp, Inc. (a) | | | 136,625 | | | | 1,431,830 | |
National Penn Bancshares, Inc. | | | 439,700 | | | | 3,491,218 | |
NBT Bancorp, Inc. | | | 123,975 | | | | 2,758,444 | |
Old National Bancorp | | | 340,875 | | | | 3,817,800 | |
Pinnacle Financial Partners, Inc. (a) | | | 121,075 | | | | 1,931,146 | |
PrivateBancorp, Inc. | | | 210,625 | | | | 3,016,150 | |
| | | | | | | | |
| | | Shares | | | Value ($) | |
S&T Bancorp, Inc. | | | 89,150 | | | | 1,988,045 | |
Signature Bank (a) | | | 146,025 | | | | 7,577,237 | |
Simmons First National Corp., Class A | | | 62,025 | | | | 1,785,080 | |
Sterling Bancorp NY | | | 96,550 | | | | 969,362 | |
Sterling Bancshares, Inc. | | | 366,750 | | | | 3,319,088 | |
Susquehanna Bancshares, Inc. | | | 466,925 | | | | 4,463,803 | |
Texas Capital Bancshares, Inc. (a) | | | 132,300 | | | | 3,339,252 | |
Tompkins Financial Corp. | | | 29,715 | | | | 1,218,315 | |
UMB Financial Corp. | | | 107,575 | | | | 4,290,091 | |
Umpqua Holdings Corp. | | | 412,075 | | | | 4,714,138 | |
United Bankshares, Inc. | | | 138,075 | | | | 3,954,468 | |
United Community Banks, Inc. (a) | | | 339,997 | | | | 465,796 | |
Whitney Holding Corp. | | | 347,700 | | | | 4,930,386 | |
Wilmington Trust Corp. | | | 329,100 | | | | 1,477,659 | |
Wilshire Bancorp, Inc. | | | 70,050 | | | | 463,031 | |
Wintrust Financial Corp. | | | 123,650 | | | | 4,152,167 | |
| | | | | | | | |
Commercial Banks Total | | | | | | | 102,596,312 | |
| | |
| Consumer Finance – 0.9% | | | | | | | | |
Cash America International, Inc. | | | 106,350 | | | | 4,542,208 | |
EZCORP, Inc., Class A (a) | | | 179,175 | | | | 5,138,739 | |
First Cash Financial Services, Inc. (a) | | | 108,975 | | | | 3,567,842 | |
World Acceptance Corp. (a) | | | 53,500 | | | | 3,199,835 | |
| | | | | | | | |
Consumer Finance Total | | | | | | | 16,448,624 | |
| |
| Diversified Financial Services – 0.4% | | | | | |
Interactive Brokers Group, Inc., Class A | | | 151,875 | | | | 2,346,469 | |
Portfolio Recovery Associates, Inc. (a) | | | 61,350 | | | | 5,113,522 | |
| | | | | | | | |
Diversified Financial Services Total | | | | | | | 7,459,991 | |
| | |
| Insurance – 2.4% | | | | | | | | |
Amerisafe, Inc. (a) | | | 66,350 | | | | 1,324,346 | |
Delphi Financial Group, Inc., Class A | | | 195,400 | | | | 6,049,584 | |
eHealth, Inc. (a) | | | 79,800 | | | | 1,000,692 | |
Employers Holdings, Inc. | | | 143,300 | | | | 2,883,196 | |
Horace Mann Educators Corp. | | | 142,050 | | | | 2,407,747 | |
Infinity Property & Casualty Corp. | | | 45,000 | | | | 2,731,950 | |
National Financial Partners Corp. (a) | | | 157,125 | | | | 2,221,747 | |
Navigators Group, Inc. (a) | | | 44,800 | | | | 2,350,208 | |
Presidential Life Corp. | | | 76,625 | | | | 767,783 | |
ProAssurance Corp. (a) | | | 110,500 | | | | 6,997,965 | |
RLI Corp. | | | 59,575 | | | | 3,420,201 | |
Safety Insurance Group, Inc. | | | 54,075 | | | | 2,602,089 | |
Selective Insurance Group, Inc. | | | 192,500 | | | | 3,499,650 | |
Stewart Information Services Corp. | | | 66,125 | | | | 737,294 | |
Tower Group, Inc. | | | 149,375 | | | | 4,060,012 | |
United Fire & Casualty Co. | | | 76,400 | | | | 1,580,716 | |
| | | | | | | | |
Insurance Total | | | | | | | 44,635,180 | |
See Accompanying Notes to Financial Statements.
10
Columbia Small Cap Index Fund
February 28, 2011
Common Stocks (continued)
| | | | | | | | |
| | | Shares | | | Value ($) | |
| Financials (continued) | | | | | | | | |
| Real Estate Investment Trusts (REITs) – 7.6% | |
Acadia Realty Trust | | | 144,782 | | | | 2,866,684 | |
BioMed Realty Trust, Inc. | | | 470,688 | | | | 8,542,987 | |
Cedar Shopping Centers, Inc. | | | 169,150 | | | | 1,025,049 | |
Colonial Properties Trust | | | 302,175 | | | | 5,955,869 | |
DiamondRock Hospitality Co. (a) | | | 595,627 | | | | 7,004,574 | |
EastGroup Properties, Inc. | | | 97,100 | | | | 4,420,963 | |
Entertainment Properties Trust | | | 167,375 | | | | 7,978,766 | |
Extra Space Storage, Inc. | | | 314,925 | | | | 6,219,769 | |
Franklin Street Properties Corp. | | | 249,925 | | | | 3,756,373 | |
Getty Realty Corp. | | | 90,100 | | | | 2,650,742 | |
Healthcare Realty Trust, Inc. | | | 231,725 | | | | 5,399,192 | |
Home Properties, Inc. | | | 135,425 | | | | 7,979,241 | |
Inland Real Estate Corp. | | | 272,575 | | | | 2,567,657 | |
Kilroy Realty Corp. | | | 188,375 | | | | 7,299,531 | |
Kite Realty Group Trust | | | 226,775 | | | | 1,279,011 | |
LaSalle Hotel Properties | | | 262,825 | | | | 7,414,293 | |
Lexington Realty Trust | | | 447,501 | | | | 4,237,834 | |
LTC Properties, Inc. | | | 94,400 | | | | 2,758,368 | |
Medical Properties Trust, Inc. | | | 400,275 | | | | 4,695,226 | |
Mid-America Apartment Communities, Inc. | | | 123,000 | | | | 7,991,310 | |
National Retail Properties, Inc. | | | 300,325 | | | | 7,715,349 | |
Parkway Properties, Inc. | | | 78,850 | | | | 1,278,159 | |
Pennsylvania Real Estate Investment Trust | | | 199,200 | | | | 2,876,448 | |
Post Properties, Inc. | | | 175,475 | | | | 6,843,525 | |
PS Business Parks, Inc. | | | 67,350 | | | | 4,245,744 | |
Saul Centers, Inc. | | | 41,200 | | | | 1,895,200 | |
Sovran Self Storage, Inc. | | | 99,425 | | | | 3,857,690 | |
Tanger Factory Outlet Centers | | | 291,350 | | | | 7,764,477 | |
Universal Health Realty Income Trust | | | 44,900 | | | | 1,785,673 | |
Urstadt Biddle Properties, Inc., Class A | | | 83,200 | | | | 1,613,248 | |
| | | | | | | | |
Real Estate Investment Trusts (REITs) Total | | | | 141,918,952 | |
|
| Real Estate Management & Development – 0.1% | |
Forestar Group Inc. (a) | | | 127,475 | | | | 2,455,169 | |
| | | | | | | | |
Real Estate Management & Development Total | | | | 2,455,169 | |
| | |
| Thrifts & Mortgage Finance – 0.5% | | | | | | | | |
Bank Mutual Corp. | | | 164,600 | | | | 760,452 | |
Brookline Bancorp, Inc. | | | 212,500 | | | | 2,207,875 | |
Dime Community Bancshares | | | 99,575 | | | | 1,545,404 | |
Provident Financial Services, Inc. | | | 186,700 | | | | 2,765,027 | |
TrustCo Bank Corp. NY | | | 277,525 | | | | 1,673,476 | |
| | | | | | | | |
Thrifts & Mortgage Finance Total | | | | | | | 8,952,234 | |
| | | | | | | | |
Financials Total | | | | | | | 343,356,744 | |
| | | | | | | | |
| | | | | | | | |
| | | Shares | | | Value ($) | |
| Health Care – 12.5% | | | | | | | | |
| Biotechnology – 1.0% | | | | | | | | |
ArQule, Inc. (a) | | | 155,125 | | | | 988,146 | |
Cubist Pharmaceuticals, Inc. (a) | | | 213,325 | | | | 4,678,217 | |
Emergent Biosolutions, Inc. (a) | | | 77,475 | | | | 1,630,074 | |
Regeneron Pharmaceuticals, Inc. (a) | | | 261,425 | | | | 9,481,885 | |
Savient Pharmaceuticals, Inc. (a) | | | 252,750 | | | | 2,436,510 | |
| | | | | | | | |
Biotechnology Total | | | | | | | 19,214,832 | |
| |
| Health Care Equipment & Supplies – 3.8% | | | | | |
Abaxis, Inc. (a) | | | 80,425 | | | | 2,132,871 | |
Align Technology, Inc. (a) | | | 244,375 | | | | 5,095,219 | |
American Medical Systems Holdings, Inc. (a) | | | 275,125 | | | | 6,027,989 | |
Analogic Corp. | | | 46,100 | | | | 2,498,620 | |
Cantel Medical Corp. | | | 45,975 | | | | 1,004,554 | |
CONMED Corp. (a) | | | 101,125 | | | | 2,677,790 | |
Cooper Companies, Inc. | | | 164,250 | | | | 10,153,935 | |
CryoLife, Inc. (a) | | | 101,225 | | | | 546,615 | |
Cyberonics, Inc. (a) | | | 86,700 | | | | 2,863,701 | |
Greatbatch, Inc. (a) | | | 83,700 | | | | 2,082,456 | |
Haemonetics Corp. (a) | | | 89,050 | | | | 5,489,932 | |
ICU Medical, Inc. (a) | | | 42,550 | | | | 1,786,674 | |
Integra LifeSciences Holdings Corp. (a) | | | 73,200 | | | | 3,670,980 | |
Invacare Corp. | | | 116,600 | | | | 3,447,862 | |
Kensey Nash Corp. (a) | | | 30,525 | | | | 801,587 | |
Meridian Bioscience, Inc. | | | 146,375 | | | | 3,157,309 | |
Merit Medical Systems, Inc. (a) | | | 101,850 | | | | 1,739,598 | |
Natus Medical, Inc. (a) | | | 104,050 | | | | 1,650,233 | |
Neogen Corp. (a) | | | 81,650 | | | | 3,052,893 | |
Palomar Medical Technologies, Inc. (a) | | | 66,850 | | | | 1,068,263 | |
SurModics, Inc. (a) | | | 62,650 | | | | 816,956 | |
Symmetry Medical, Inc. (a) | | | 129,350 | | | | 1,169,324 | |
West Pharmaceutical Services, Inc. | | | 119,825 | | | | 4,926,006 | |
Zoll Medical Corp. (a) | | | 77,350 | | | | 3,579,758 | |
| | | | | | | | |
Health Care Equipment & Supplies Total | | | | 71,441,125 | |
| |
| Health Care Providers & Services – 5.2% | | | | | |
Air Methods Corp. (a) | | | 40,100 | | | | 2,327,404 | |
Almost Family, Inc. (a) | | | 29,600 | | | | 1,154,400 | |
Amedisys, Inc. (a) | | | 104,424 | | | | 3,750,910 | |
AMERIGROUP Corp. (a) | | | 178,325 | | | | 10,226,939 | |
AMN Healthcare Services, Inc. (a) | | | 140,675 | | | | 1,050,842 | |
AmSurg Corp. (a) | | | 111,275 | | | | 2,629,428 | |
Bio-Reference Labs, Inc. (a) | | | 88,125 | | | | 1,843,575 | |
Catalyst Health Solutions, Inc. (a) | | | 140,525 | | | | 6,353,135 | |
Centene Corp. (a) | | | 177,200 | | | | 5,399,284 | |
Chemed Corp. | | | 82,025 | | | | 5,367,716 | |
Corvel Corp. (a) | | | 23,600 | | | | 1,168,200 | |
Cross Country Healthcare, Inc. (a) | | | 111,850 | | | | 930,592 | |
See Accompanying Notes to Financial Statements.
11
Columbia Small Cap Index Fund
February 28, 2011
Common Stocks (continued)
| | | | | | | | |
| | | Shares | | | Value ($) | |
| Health Care (continued) | | | | | | | | |
Ensign Group, Inc. | | | 47,050 | | | | 1,430,791 | |
Genoptix, Inc. (a) | | | 63,350 | | | | 1,583,117 | |
Gentiva Health Services, Inc. (a) | | | 107,500 | | | | 3,034,725 | |
Hanger Orthopedic Group, Inc. (a) | | | 116,825 | | | | 3,142,592 | |
Healthspring, Inc. (a) | | | 205,950 | | | | 7,751,958 | |
Healthways, Inc. (a) | | | 123,475 | | | | 1,724,946 | |
HMS Holdings Corp. (a) | | | 99,200 | | | | 7,495,552 | |
IPC The Hospitalist Co., Inc. (a) | | | 58,525 | | | | 2,387,820 | |
Landauer, Inc. | | | 33,800 | | | | 2,126,020 | |
LCA-Vision, Inc. (a) | | | 67,275 | | | | 475,634 | |
LHC Group, Inc. (a) | | | 56,425 | | | | 1,684,851 | |
Magellan Health Services, Inc. (a) | | | 120,700 | | | | 5,791,186 | |
Medcath Corp. (a) | | | 73,675 | | | | 1,047,659 | |
Molina Healthcare, Inc. (a) | | | 60,950 | | | | 2,135,078 | |
MWI Veterinary Supply, Inc. (a) | | | 44,825 | | | | 3,102,786 | |
PharMerica Corp. (a) | | | 105,450 | | | | 1,239,038 | |
PSS World Medical, Inc. (a) | | | 198,775 | | | | 5,172,125 | |
RehabCare Group, Inc. (a) | | | 89,725 | | | | 3,333,284 | |
| | | | | | | | |
Health Care Providers & Services Total | | | | 96,861,587 | |
| |
| Health Care Technology – 0.5% | | | | | |
Computer Programs & Systems, Inc. | | | 39,425 | | | | 2,129,344 | |
Omnicell, Inc. (a) | | | 118,625 | | | | 1,594,320 | |
Quality Systems, Inc. | | | 68,750 | | | | 5,493,125 | |
| | | | | | | | |
Health Care Technology Total | | | | | | | 9,216,789 | |
| |
| Life Sciences Tools & Services – 0.9% | | | | | |
Affymetrix, Inc. (a) | | | 254,125 | | | | 1,247,754 | |
Cambrex Corp. (a) | | | 105,850 | | | | 580,058 | |
Dionex Corp. (a) | | | 62,700 | | | | 7,387,314 | |
Enzo Biochem, Inc. (a) | | | 123,345 | | | | 531,617 | |
eResearchTechnology, Inc. (a) | | | 155,300 | | | | 986,155 | |
Kendle International, Inc. (a) | | | 53,700 | | | | 639,030 | |
PAREXEL International Corp. (a) | | | 209,225 | | | | 4,910,510 | |
| | | | | | | | |
Life Sciences Tools & Services Total | | | | | | | 16,282,438 | |
| | |
| Pharmaceuticals – 1.1% | | | | | | | | |
Hi-Tech Pharmacal Co., Inc. (a) | | | 36,675 | | | | 846,826 | |
Par Pharmaceutical Companies, Inc. (a) | | | 128,100 | | | | 3,955,728 | |
Questcor Pharmaceuticals, Inc. (a) | | | 223,600 | | | | 2,897,856 | |
Salix Pharmaceuticals Ltd. (a) | | | 208,425 | | | | 6,948,889 | |
Viropharma, Inc. (a) | | | 280,575 | | | | 5,030,710 | |
| | | | | | | | |
Pharmaceuticals Total | | | | | | | 19,680,009 | |
| | | | | | | | |
Health Care Total | | | | | | | 232,696,780 | |
| | | | | | | | |
| Industrials – 15.6% | | | | | | | | |
| Aerospace & Defense – 3.0% | | | | | |
AAR Corp. (a) | | | 141,225 | | | | 3,854,030 | |
Aerovironment, Inc. (a) | | | 54,025 | | | | 1,567,265 | |
| | | | | | | | |
| | | Shares | | | Value ($) | |
American Science & Engineering, Inc. | | | 32,350 | | | | 3,040,900 | |
Ceradyne, Inc. (a) | | | 89,550 | | | | 3,423,497 | |
Cubic Corp. | | | 56,775 | | | | 2,856,350 | |
Curtiss-Wright Corp. | | | 165,825 | | | | 6,118,943 | |
Esterline Technologies Corp. (a) | | | 108,200 | | | | 7,743,874 | |
GenCorp, Inc. (a) | | | 212,300 | | | | 1,101,837 | |
Moog, Inc., Class A (a) | | | 163,375 | | | | 7,418,859 | |
National Presto Industries, Inc. | | | 18,800 | | | | 2,378,952 | |
Orbital Sciences Corp. (a) | | | 208,700 | | | | 3,712,773 | |
Teledyne Technologies, Inc. (a) | | | 130,625 | | | | 6,840,831 | |
Triumph Group, Inc. | | | 59,175 | | | | 5,123,963 | |
| | | | | | | | |
Aerospace & Defense Total | | | | | | | 55,182,074 | |
| | |
| Air Freight & Logistics – 0.4% | | | | | | | | |
Forward Air Corp. | | | 104,375 | | | | 3,092,631 | |
HUB Group, Inc., Class A (a) | | | 134,275 | | | | 4,694,254 | |
| | | | | | | | |
Air Freight & Logistics Total | | | | | | | 7,786,885 | |
| | |
| Airlines – 0.3% | | | | | | | | |
Allegiant Travel Co. | | | 54,025 | | | | 2,229,612 | |
Skywest, Inc. | | | 198,000 | | | | 3,267,000 | |
| | | | | | | | |
Airlines Total | | | | | | | 5,496,612 | |
| | |
| Building Products – 1.1% | | | | | | | | |
A.O. Smith Corp. | | | 120,300 | | | | 4,860,120 | |
AAON, Inc. | | | 42,800 | | | | 1,313,960 | |
Apogee Enterprises, Inc. | | | 101,100 | | | | 1,382,037 | |
Gibraltar Industries, Inc. (a) | | | 108,950 | | | | 1,179,929 | |
Griffon Corp. (a) | | | 167,650 | | | | 2,021,859 | |
NCI Building Systems, Inc. (a) | | | 60,565 | | | | 855,784 | |
Quanex Building Products Corp. | | | 135,325 | | | | 2,556,289 | |
Simpson Manufacturing Co., Inc. | | | 142,225 | | | | 4,114,569 | |
Universal Forest Products, Inc. | | | 69,400 | | | | 2,366,540 | |
| | | | | | | | |
Building Products Total | | | | | | | 20,651,087 | |
| |
| Commercial Services & Supplies – 2.4% | | | | | |
ABM Industries, Inc. | | | 169,100 | | | | 4,503,133 | |
Consolidated Graphics, Inc. (a) | | | 36,600 | | | | 1,996,164 | |
G&K Services, Inc., Class A | | | 67,250 | | | | 2,180,245 | |
Geo Group, Inc. (a) | | | 231,850 | | | | 5,895,945 | |
Healthcare Services Group, Inc. | | | 237,075 | | | | 4,212,823 | |
Interface, Inc., Class A | | | 231,225 | | | | 3,854,521 | |
Mobile Mini, Inc. (a) | | | 131,050 | | | | 2,980,077 | |
Standard Register Co. | | | 45,850 | | | | 157,724 | |
Sykes Enterprises, Inc. (a) | | | 146,625 | | | | 2,727,225 | |
Tetra Tech, Inc. (a) | | | 222,150 | | | | 5,220,525 | |
Unifirst Corp. | | | 52,800 | | | | 2,977,920 | |
United Stationers, Inc. (a) | | | 83,300 | | | | 5,616,086 | |
Viad Corp. | | | 72,650 | | | | 1,665,138 | |
| | | | | | | | |
Commercial Services & Supplies Total | | | | | | | 43,987,526 | |
See Accompanying Notes to Financial Statements.
12
Columbia Small Cap Index Fund
February 28, 2011
Common Stocks (continued)
| | | | | | | | |
| | | Shares | | | Value ($) | |
| Industrials (continued) | | | | | | | | |
| Construction & Engineering – 0.9% | | | | | | | | |
Comfort Systems USA, Inc. | | | 136,225 | | | | 1,807,706 | |
Dycom Industries, Inc. (a) | | | 126,400 | | | | 2,181,664 | |
EMCOR Group, Inc. (a) | | | 239,050 | | | | 7,616,133 | |
Insituform Technologies, Inc., Class A (a) | | | 141,075 | | | | 3,645,378 | |
Orion Marine Group, Inc. (a) | | | 96,750 | | | | 1,194,862 | |
| | | | | | | | |
Construction & Engineering Total | | | | | | | 16,445,743 | |
| | |
| Electrical Equipment – 1.3% | | | | | | | | |
AZZ, Inc. | | | 44,925 | | | | 1,916,501 | |
Belden, Inc. | | | 168,850 | | | | 6,184,976 | |
Brady Corp., Class A | | | 189,125 | | | | 6,759,327 | |
Encore Wire Corp. | | | 68,500 | | | | 1,607,010 | |
II-VI, Inc. (a) | | | 91,375 | | | | 4,677,486 | |
Powell Industries, Inc. (a) | | | 31,875 | | | | 1,191,806 | |
Vicor Corp. | | | 70,500 | | | | 1,073,715 | |
| | | | | | | | |
Electrical Equipment Total | | | | | | | 23,410,821 | |
| | |
| Industrial Conglomerates – 0.2% | | | | | | | | |
Standex International Corp. | | | 45,200 | | | | 1,549,004 | |
Tredegar Corp. | | | 82,475 | | | | 1,609,912 | |
| | | | | | | | |
Industrial Conglomerates Total | | | | | | | 3,158,916 | |
| | |
| Machinery – 3.9% | | | | | | | | |
Actuant Corp., Class A | | | 245,175 | | | | 6,938,452 | |
Albany International Corp., Class A | | | 99,725 | | | | 2,429,301 | |
Astec Industries, Inc. (a) | | | 71,575 | | | | 2,457,170 | |
Badger Meter, Inc. | | | 54,075 | | | | 2,125,688 | |
Barnes Group, Inc. | | | 163,350 | | | | 3,476,088 | |
Briggs & Stratton Corp. | | | 181,075 | | | | 3,645,040 | |
Cascade Corp. | | | 33,150 | | | | 1,619,709 | |
CIRCOR International, Inc. | | | 61,475 | | | | 2,437,484 | |
CLARCOR, Inc. | | | 181,325 | | | | 7,459,710 | |
EnPro Industries, Inc. (a) | | | 74,100 | | | | 2,940,288 | |
ESCO Technologies, Inc. | | | 95,525 | | | | 3,657,652 | |
Federal Signal Corp. | | | 223,825 | | | | 1,448,148 | |
John Bean Technologies Corp. | | | 101,550 | | | | 1,926,404 | |
Kaydon Corp. | | | 120,325 | | | | 4,721,553 | |
Lindsay Corp. | | | 45,025 | | | | 3,179,215 | |
Lydall, Inc. (a) | | | 61,425 | | | | 549,140 | |
Mueller Industries, Inc. | | | 136,075 | | | | 4,623,828 | |
Robbins & Myers, Inc. | | | 161,500 | | | | 6,884,745 | |
Toro Co. | | | 112,625 | | | | 7,027,800 | |
Watts Water Technologies, Inc., Class A | | | 105,200 | | | | 4,114,372 | |
| | | | | | | | |
Machinery Total | | | | | | | 73,661,787 | |
| | |
| Professional Services – 1.0% | | | | | | | | |
Administaff, Inc. | | | 80,375 | | | | 2,405,624 | |
CDI Corp. | | | 46,600 | | | | 693,408 | |
| | | | | | | | |
| | | Shares | | | Value ($) | |
Dolan Co. (a) | | | 109,725 | | | | 1,371,563 | |
Exponent, Inc. (a) | | | 49,875 | | | | 1,962,581 | |
Heidrick & Struggles International, Inc. | | | 63,125 | | | | 1,718,894 | |
Kelly Services, Inc., Class A (a) | | | 101,675 | | | | 2,137,209 | |
Navigant Consulting, Inc. (a) | | | 180,900 | | | | 1,698,651 | |
On Assignment, Inc. (a) | | | 131,550 | | | | 1,381,275 | |
School Specialty, Inc. (a) | | | 57,675 | | | | 885,311 | |
SFN Group, Inc. (a) | | | 190,350 | | | | 2,632,540 | |
TrueBlue, Inc. (a) | | | 158,500 | | | | 2,559,775 | |
| | | | | | | | |
Professional Services Total | | | | | | | 19,446,831 | |
| | |
| Road & Rail – 0.7% | | | | | | | | |
Arkansas Best Corp. | | | 91,050 | | | | 2,159,706 | |
Heartland Express, Inc. | | | 182,718 | | | | 3,031,292 | |
Knight Transportation, Inc. | | | 222,700 | | | | 4,144,447 | |
Old Dominion Freight Line, Inc. (a) | | | 150,925 | | | | 4,645,471 | |
| | | | | | | | |
Road & Rail Total | | | | | | | 13,980,916 | |
| |
| Trading Companies & Distributors – 0.4% | | | | | |
Applied Industrial Technologies, Inc. | | | 135,900 | | | | 4,354,236 | |
Kaman Corp. | | | 93,500 | | | | 2,979,845 | |
Lawson Products, Inc. | | | 14,375 | | | | 346,006 | |
| | | | | | | | |
Trading Companies & Distributors Total | | | | 7,680,087 | |
| | | | | | | | |
Industrials Total | | | | | | | 290,889,285 | |
| | | | | | | | |
| Information Technology – 19.0% | | | | | | | | |
| Communications Equipment – 2.2% | | | | | | | | |
Arris Group, Inc. (a) | | | 444,500 | | | | 5,867,400 | |
Bel Fuse, Inc., Class B | | | 42,075 | | | | 921,443 | |
Black Box Corp. | | | 63,600 | | | | 2,428,884 | |
Blue Coat Systems, Inc. (a) | | | 155,400 | | | | 4,372,956 | |
Comtech Telecommunications Corp. | | | 99,475 | | | | 2,690,799 | |
DG FastChannel, Inc. (a) | | | 87,325 | | | | 2,891,331 | |
Digi International, Inc. (a) | | | 90,350 | | | | 1,000,174 | |
EMS Technologies, Inc. (a) | | | 55,050 | | | | 1,070,172 | |
Harmonic, Inc. (a) | | | 350,400 | | | | 3,367,344 | |
NETGEAR, Inc. (a) | | | 128,950 | | | | 4,229,560 | |
Network Equipment Technologies, Inc. (a) | | | 108,175 | | | | 393,757 | |
Oplink Communications, Inc. (a) | | | 70,400 | | | | 1,915,584 | |
PC-Tel, Inc. (a) | | | 66,450 | | | | 497,711 | |
Symmetricom, Inc. (a) | | | 156,000 | | | | 882,960 | |
Tekelec (a) | | | 246,775 | | | | 1,892,764 | |
Tollgrade Communications, Inc. (a) | | | 37,675 | | | | 376,373 | |
ViaSat, Inc. (a) | | | 147,750 | | | | 6,147,877 | |
| | | | | | | | |
Communications Equipment Total | | | | | | | 40,947,089 | |
| |
| Computers & Peripherals – 0.8% | | | | | |
Avid Technology, Inc. (a) | | | 104,275 | | | | 2,300,306 | |
Hutchinson Technology, Inc. (a) | | | 84,075 | | | | 263,996 | |
See Accompanying Notes to Financial Statements.
13
Columbia Small Cap Index Fund
February 28, 2011
Common Stocks (continued)
| | | | | | | | |
| | | Shares | | | Value ($) | |
| Information Technology (continued) | | | | | | | | |
Intermec, Inc. (a) | | | 173,075 | | | | 1,943,632 | |
Intevac, Inc. (a) | | | 80,700 | | | | 1,030,539 | |
Novatel Wireless, Inc. (a) | | | 113,850 | | | | 673,992 | |
Stratasys, Inc. (a) | | | 74,300 | | | | 3,371,734 | |
Super Micro Computer, Inc. (a) | | | 90,300 | | | | 1,349,985 | |
Synaptics, Inc. (a) | | | 122,700 | | | | 3,619,650 | |
| | | | | | | | |
Computers & Peripherals Total | | | | | | | 14,553,834 | |
|
| Electronic Equipment, Instruments & Components – 4.0% | |
Agilysys, Inc. (a) | | | 70,500 | | | | 353,910 | |
Anixter International, Inc. | | | 101,375 | | | | 7,260,477 | |
Benchmark Electronics, Inc. (a) | | | 219,125 | | | | 4,132,697 | |
Brightpoint, Inc. (a) | | | 242,640 | | | | 3,057,264 | |
Checkpoint Systems, Inc. (a) | | | 142,600 | | | | 3,105,828 | |
Cognex Corp. | | | 144,025 | | | | 4,019,738 | |
CTS Corp. | | | 122,925 | | | | 1,457,891 | |
Daktronics, Inc. | | | 126,775 | | | | 1,451,574 | |
DTS, Inc. (a) | | | 61,625 | | | | 2,794,694 | |
Electro Scientific Industries, Inc. (a) | | | 85,900 | | | | 1,309,116 | |
FARO Technologies, Inc. (a) | | | 58,175 | | | | 2,073,939 | |
Gerber Scientific, Inc. (a) | | | 90,400 | | | | 745,800 | |
Insight Enterprises, Inc. (a) | | | 166,500 | | | | 3,045,285 | |
Littelfuse, Inc. | | | 80,000 | | | | 4,226,400 | |
LoJack Corp. (a) | | | 65,800 | | | | 393,484 | |
Mercury Computer Systems, Inc. (a) | | | 105,025 | | | | 1,993,374 | |
Methode Electronics, Inc. | | | 132,375 | | | | 1,548,788 | |
MTS Systems Corp. | | | 55,000 | | | | 2,547,050 | |
Newport Corp. (a) | | | 132,175 | | | | 2,200,714 | |
OSI Systems, Inc. (a) | | | 67,150 | | | | 2,526,183 | |
Park Electrochemical Corp. | | | 74,250 | | | | 2,361,150 | |
Plexus Corp. (a) | | | 145,650 | | | | 4,577,779 | |
Pulse Electronics Corp. | | | 149,250 | | | | 901,470 | |
RadiSys Corp. (a) | | | 87,350 | | | | 727,626 | |
Rofin-Sinar Technologies, Inc. (a) | | | 102,200 | | | | 3,963,316 | |
Rogers Corp. (a) | | | 56,925 | | | | 2,684,583 | |
ScanSource, Inc. (a) | | | 96,125 | | | | 3,511,446 | |
SYNNEX Corp. (a) | | | 84,925 | | | | 2,996,154 | |
TTM Technologies, Inc. (a) | | | 155,525 | | | | 2,727,908 | |
| | | | | | | | |
Electronic Equipment, Instruments & Components Total | | | | 74,695,638 | |
| |
| Internet Software & Services – 1.2% | | | | | |
comScore, Inc. (a) | | | 91,600 | | | | 2,521,748 | |
DealerTrack Holdings, Inc. (a) | | | 146,100 | | | | 2,948,298 | |
InfoSpace, Inc. (a) | | | 130,025 | | | | 1,048,002 | |
j2 Global Communications, Inc. (a) | | | 164,025 | | | | 4,771,487 | |
Knot, Inc. (a) | | | 110,075 | | | | 1,104,052 | |
Liquidity Services, Inc. (a) | | | 61,800 | | | | 993,126 | |
LogMeIn, Inc. (a) | | | 58,800 | | | | 2,110,332 | |
Perficient, Inc. (a) | | | 106,950 | | | | 1,329,389 | |
| | | | | | | | |
| | | Shares | | | Value ($) | |
RightNow Technologies, Inc. (a) | | | 84,900 | | | | 2,265,981 | |
Stamps.com, Inc. | | | 42,850 | | | | 575,904 | |
United Online, Inc. | | | 309,250 | | | | 1,858,592 | |
| | | | | | | | |
Internet Software & Services Total | | | | | | | 21,526,911 | |
| | |
| IT Services – 1.8% | | | | | | | | |
CACI International, Inc., Class A (a) | | | 109,075 | | | | 6,470,329 | |
Cardtronics, Inc. (a) | | | 108,600 | | | | 2,057,970 | |
CIBER, Inc. (a) | | | 251,025 | | | | 1,172,287 | |
CSG Systems International, Inc. (a) | | | 122,625 | | | | 2,397,319 | |
Forrester Research, Inc. | | | 52,475 | | | | 1,898,545 | |
Heartland Payment Systems, Inc. | | | 137,550 | | | | 2,693,229 | |
iGate Corp. | | | 104,500 | | | | 1,891,450 | |
Integral Systems, Inc. (a) | | | 63,200 | | | | 773,568 | |
MAXIMUS, Inc. | | | 61,950 | | | | 4,584,300 | |
NCI, Inc., Class A (a) | | | 28,225 | | | | 646,353 | |
Startek, Inc. (a) | | | 42,950 | | | | 238,802 | |
TeleTech Holdings, Inc. (a) | | | 104,200 | | | | 2,373,676 | |
Wright Express Corp. (a) | | | 137,750 | | | | 7,025,250 | |
| | | | | | | | |
IT Services Total | | | | | | | 34,223,078 | |
|
| Semiconductors & Semiconductor Equipment – 5.4% | |
Advanced Energy Industries, Inc. (a) | | | 138,650 | | | | 2,235,038 | |
ATMI, Inc. (a) | | | 112,925 | | | | 2,059,752 | |
Brooks Automation, Inc. (a) | | | 234,830 | | | | 2,947,117 | |
Cabot Microelectronics Corp. (a) | | | 82,500 | | | | 4,027,650 | |
Ceva, Inc. (a) | | | 79,200 | | | | 1,805,760 | |
Cohu, Inc. | | | 85,850 | | | | 1,263,712 | |
Cymer, Inc. (a) | | | 106,475 | | | | 5,387,635 | |
Diodes, Inc. (a) | | | 129,349 | | | | 3,745,947 | |
DSP Group, Inc. (a) | | | 84,025 | | | | 662,957 | |
Exar Corp. (a) | | | 159,275 | | | | 1,030,509 | |
FEI Co. (a) | | | 137,550 | | | | 4,612,052 | |
Hittite Microwave Corp. (a) | | | 88,725 | | | | 5,445,940 | |
Kopin Corp. (a) | | | 233,325 | | | | 1,024,297 | |
Kulicke & Soffa Industries, Inc. (a) | | | 253,400 | | | | 2,430,106 | |
Micrel, Inc. | | | 178,725 | | | | 2,402,064 | |
Microsemi Corp. (a) | | | 300,500 | | | | 6,620,015 | |
MKS Instruments, Inc. | | | 181,125 | | | | 5,437,372 | |
Monolithic Power Systems, Inc. (a) | | | 128,900 | | | | 1,991,505 | |
Pericom Semiconductor Corp. (a) | | | 89,575 | | | | 901,125 | |
Power Integrations, Inc. | | | 100,500 | | | | 4,003,920 | |
Rudolph Technologies, Inc. (a) | | | 113,000 | | | | 1,252,040 | |
Sigma Designs, Inc. (a) | | | 99,300 | | | | 1,358,424 | |
Standard Microsystems Corp. (a) | | | 81,425 | | | | 2,160,205 | |
Supertex, Inc. (a) | | | 46,875 | | | | 1,071,563 | |
Tessera Technologies, Inc. (a) | | | 181,550 | | | | 3,160,786 | |
TriQuint Semiconductor, Inc. (a) | | | 572,200 | | | | 8,153,850 | |
Ultratech, Inc. (a) | | | 87,850 | | | | 2,171,652 | |
Varian Semiconductor Equipment Associates, Inc. (a) | | | 266,275 | | | | 12,703,980 | |
See Accompanying Notes to Financial Statements.
14
Columbia Small Cap Index Fund
February 28, 2011
Common Stocks (continued)
| | | | | | | | |
| | | Shares | | | Value ($) | |
| Information Technology (continued) | | | | | | | | |
Veeco Instruments, Inc. (a) | | | 143,575 | | | | 6,831,298 | |
Volterra Semiconductor Corp. (a) | | | 96,675 | | | | 2,439,110 | |
| | | | | | | | |
Semiconductors & Semiconductor Equipment Total | | | | 101,337,381 | |
| | |
| Software – 3.6% | | | | | | | | |
Blackbaud, Inc. | | | 157,900 | | | | 4,201,719 | |
Bottomline Technologies, Inc. (a) | | | 116,200 | | | | 2,569,182 | |
CommVault Systems, Inc. (a) | | | 154,875 | | | | 5,657,584 | |
Ebix, Inc. (a) | | | 137,225 | | | | 3,614,506 | |
Epicor Software Corp. (a) | | | 166,400 | | | | 1,713,920 | |
EPIQ Systems, Inc. | | | 117,475 | | | | 1,622,330 | |
Interactive Intelligence, Inc. (a) | | | 48,050 | | | | 1,653,401 | |
JDA Software Group, Inc. (a) | | | 157,450 | | | | 4,644,775 | |
Manhattan Associates, Inc. (a) | | | 78,875 | | | | 2,539,775 | |
MicroStrategy, Inc., Class A (a) | | | 30,225 | | | | 3,592,241 | |
Netscout Systems, Inc. (a) | | | 125,775 | | | | 3,143,117 | |
Progress Software Corp. (a) | | | 233,575 | | | | 6,857,762 | |
Radiant Systems, Inc. (a) | | | 119,300 | | | | 2,045,995 | |
Smith Micro Software, Inc. (a) | | | 108,475 | | | | 1,016,411 | |
Sourcefire, Inc. (a) | | | 100,725 | | | | 2,729,648 | |
Synchronoss Technologies, Inc. (a) | | | 86,300 | | | | 2,956,638 | |
Take-Two Interactive Software, Inc. (a) | | | 305,675 | | | | 4,912,197 | |
Taleo Corp., Class A (a) | | | 145,550 | | | | 4,699,809 | |
THQ, Inc. (a) | | | 244,475 | | | | 1,408,176 | |
Tyler Technologies, Inc. (a) | | | 90,525 | | | | 2,002,413 | |
Websense, Inc. (a) | | | 150,200 | | | | 3,217,284 | |
| | | | | | | | |
Software Total | | | | | | | 66,798,883 | |
| | | | | | | | |
Information Technology Total | | | | | | | 354,082,814 | |
| | | | | | | | |
| Materials – 4.3% | | | | | | | | |
| Chemicals – 1.8% | | | | | | | | |
A. Schulman, Inc. | | | 113,300 | | | | 2,522,058 | |
American Vanguard Corp. | | | 77,000 | | | | 633,710 | |
Arch Chemicals, Inc. | | | 90,375 | | | | 3,248,981 | |
Balchem Corp. | | | 102,600 | | | | 3,693,600 | |
Calgon Carbon Corp. (a) | | | 202,600 | | | | 2,844,504 | |
H.B. Fuller Co. | | | 176,200 | | | | 3,797,110 | |
LSB Industries, Inc. (a) | | | 58,475 | | | | 1,770,623 | |
OM Group, Inc. (a) | | | 111,000 | | | | 3,906,090 | |
PolyOne Corp. (a) | | | 336,550 | | | | 4,671,314 | |
Quaker Chemical Corp. | | | 40,950 | | | | 1,585,993 | |
Stepan Co. | | | 27,825 | | | | 1,953,037 | |
STR Holdings, Inc. (a) | | | 148,800 | | | | 2,694,768 | |
Zep, Inc. | | | 78,275 | | | | 1,228,135 | |
| | | | | | | | |
Chemicals Total | | | | | | | 34,549,923 | |
| | | | | | | | |
| | | Shares | | | Value ($) | |
| Construction Materials – 0.6% | | | | | | | | |
Eagle Materials, Inc. | | | 158,900 | | | | 5,135,648 | |
Headwaters, Inc. (a) | | | 217,575 | | | | 1,103,105 | |
Texas Industries, Inc. | | | 100,025 | | | | 4,079,020 | |
| | | | | | | | |
Construction Materials Total | | | | | | | 10,317,773 | |
| | |
| Containers & Packaging – 0.1% | | | | | | | | |
Myers Industries, Inc. | | | 127,075 | | | | 1,285,999 | |
| | | | | | | | |
Containers & Packaging Total | | | | | | | 1,285,999 | |
| | |
| Metals & Mining – 0.9% | | | | | | | | |
A.M. Castle & Co. (a) | | | 60,325 | | | | 1,040,003 | |
AMCOL International Corp. | | | 90,675 | | | | 2,829,967 | |
Brush Engineered Materials, Inc. (a) | | | 72,700 | | | | 3,182,079 | |
Century Aluminum Co. (a) | | | 203,475 | | | | 3,448,901 | |
Kaiser Aluminum Corp. | | | 53,200 | | | | 2,688,196 | |
Olympic Steel, Inc. | | | 32,950 | | | | 886,026 | |
RTI International Metals, Inc. (a) | | | 108,325 | | | | 3,087,262 | |
| | | | | | | | |
Metals & Mining Total | | | | | | | 17,162,434 | |
| |
| Paper & Forest Products – 0.9% | | | | | |
Buckeye Technologies, Inc. | | | 142,075 | | | | 3,722,365 | |
Clearwater Paper Corp. (a) | | | 41,300 | | | | 3,275,090 | |
Deltic Timber Corp. | | | 38,600 | | | | 2,345,722 | |
KapStone Paper and Packaging Corp. (a) | | | 137,400 | | | | 2,356,410 | |
Neenah Paper, Inc. | | | 53,100 | | | | 1,033,857 | |
Schweitzer-Mauduit International, Inc. | | | 64,800 | | | | 3,552,984 | |
Wausau Paper Corp. | | | 176,400 | | | | 1,416,492 | |
| | | | | | | | |
Paper & Forest Products Total | | | | | | | 17,702,920 | |
| | | | | | | | |
Materials Total | | | | | | | 81,019,049 | |
| | | | | | | | |
| Telecommunication Services – 0.6% | |
| Diversified Telecommunication Services – 0.4% | |
Atlantic Tele-Network, Inc. | | | 32,600 | | | | 1,271,074 | |
Cbeyond, Inc. (a) | | | 110,925 | | | | 1,550,731 | |
Cincinnati Bell, Inc. (a) | | | 725,900 | | | | 1,916,376 | |
General Communication, Inc., Class A (a) | | | 140,175 | | | | 1,694,716 | |
Neutral Tandem, Inc. (a) | | | 119,150 | | | | 2,049,380 | |
| | | | | | | | |
Diversified Telecommunication Services Total | | | | 8,482,277 | |
|
| Wireless Telecommunication Services – 0.2% | |
NTELOS Holdings Corp. | | | 106,600 | | | | 2,070,172 | |
USA Mobility, Inc. | | | 79,350 | | | | 1,183,902 | |
| | | | | | | | |
Wireless Telecommunication Services Total | | | | 3,254,074 | |
| | | | | | | | |
Telecommunication Services Total | | | | 11,736,351 | |
| | | | | | | | |
See Accompanying Notes to Financial Statements.
15
Columbia Small Cap Index Fund
February 28, 2011
Common Stocks (continued)
| | | | | | | | |
| | | Shares | | | Value ($) | |
| Utilities – 3.6% | | | | | | | | |
| Electric Utilities – 1.1% | | | | | | | | |
ALLETE, Inc. | | | 112,000 | | | | 4,233,600 | |
Central Vermont Public Service Corp. | | | 47,125 | | | | 1,001,878 | |
El Paso Electric Co. (a) | | | 153,325 | | | | 4,308,432 | |
UIL Holdings Corp. | | | 181,408 | | | | 5,576,482 | |
Unisource Energy Corp. | | | 131,075 | | | | 4,778,994 | |
| | | | | | | | |
Electric Utilities Total | | | | | | | 19,899,386 | |
| | |
| Gas Utilities – 1.8% | | | | | | | | |
Laclede Group, Inc. | | | 80,225 | | | | 3,119,950 | |
New Jersey Resources Corp. | | | 148,400 | | | | 6,207,572 | |
Northwest Natural Gas Co. | | | 95,850 | | | | 4,504,950 | |
Piedmont Natural Gas Co. | | | 259,450 | | | | 7,601,885 | |
South Jersey Industries, Inc. | | | 107,500 | | | | 5,897,450 | |
Southwest Gas Corp. | | | 163,875 | | | | 6,369,822 | |
| | | | | | | | |
Gas Utilities Total | | | | | | | 33,701,629 | |
| | |
| Multi-Utilities – 0.6% | | | | | | | | |
Avista Corp. | | | 203,525 | | | | 4,542,678 | |
CH Energy Group, Inc. | | | 56,925 | | | | 2,792,741 | |
NorthWestern Corp. | | | 130,250 | | | | 3,869,727 | |
| | | | | | | | |
Multi-Utilities Total | | | | | | | 11,205,146 | |
| | |
| Water Utilities – 0.1% | | | | | | | | |
American States Water Co. | | | 67,000 | | | | 2,247,180 | |
| | | | | | | | |
Water Utilities Total | | | | | | | 2,247,180 | |
| | | | | | | | |
Utilities Total | | | | | | | 67,053,341 | |
| | | | | | | | |
Total Common Stocks
(cost of $1,387,212,268) | | | | 1,813,318,284 | |
| |
Investment Companies – 0.4% | | | | | |
iShares S&P SmallCap 600 Index Fund | | | 59,725 | | | | 4,275,713 | |
Prospect Capital Corp. | | | 300,100 | | | | 3,643,214 | |
| | | | | | | | |
Total Investment Companies
(cost of $5,949,494) | | | | 7,918,927 | |
Short-Term Obligation – 1.4%
| | | | | | | | |
| | | Par ($) | | | Value ($) | |
Repurchase agreement with Fixed Income Clearing Corp., dated 02/28/11, due 03/01/11 at 0.090%, collateralized by a U.S. Government Agency obligation maturing 01/15/14, market value $25,908,638 (repurchase proceeds $25,400,064) | | | 25,400,000 | | | | 25,400,000 | |
| | | | | | | | |
Total Short-Term Obligation
(cost of $25,400,000) | | | | 25,400,000 | |
| | | | | | | | |
Total Investments – 99.0%
(cost of $1,418,561,762) (b) | | | | 1,846,637,211 | |
| | | | | | | | |
Other Assets & Liabilities, Net – 1.0% | | | | 18,093,389 | |
| | | | | | | | |
Net Assets – 100.0% | | | | | | | 1,864,730,600 | |
Notes to Investment Portfolio:
| (a) | Non-income producing security. |
| (b) | Cost for federal income tax purposes is $1,442,956,500. |
Generally accepted accounting principles (GAAP) require disclosure regarding the inputs and valuation techniques used to measure fair value and any changes in valuation inputs or techniques. In addition, investments shall be disclosed by major category.
The Fund categorizes its fair value measurements according to a three-level hierarchy that maximizes the use of observable inputs and minimizes the use of unobservable inputs by prioritizing that the most observable input be used when available. Observable inputs are those that market participants would use in pricing an investment based on market data obtained from sources independent of the reporting entity. Unobservable inputs are those that reflect the Fund’s assumptions about the information market participants would use in pricing an investment. An investment’s level within the fair value hierarchy is based on the lowest level of any input that is deemed significant to the asset or liability’s fair value measurement. The input levels are not necessarily an indication of the risk or liquidity associated with investments at that level. For example, certain U.S. government securities are generally high quality and liquid, however, they are reflected as Level 2 because the inputs used to determine fair value may not always be quoted prices in an active market.
Fair value inputs are summarized in the three broad levels listed below:
| • | | Level 1 — Valuations based on quoted prices for investments in active markets that the Fund has the ability to access at the measurement date (including NAV for open-end mutual funds). Valuation adjustments are not applied to Level 1 investments. |
| • | | Level 2 — Valuations based on other significant observable inputs (including quoted prices for similar securities, interest rates, prepayment speeds, credit risks, etc.). |
| • | | Level 3 — Valuations based on significant unobservable inputs (including the Fund’s own assumptions and judgment in determining the fair value of investments). |
See Accompanying Notes to Financial Statements.
16
Columbia Small Cap Index Fund
February 28, 2011
Inputs that are used in determining fair value of an investment may include price information, credit data, volatility statistics, and other factors. These inputs can be either observable or unobservable. The availability of observable inputs can vary between investments, and is affected by various factors such as the type of investment, and the volume and level of activity for that investment or similar investments in the marketplace. The inputs will be considered by the Investment Manager Administrator, along with any other relevant factors in the calculation of an investment’s fair value. The Fund uses prices and inputs that are current as of the measurement date, which may include periods of market dislocations. During these periods, the availability of prices and inputs may be reduced for many investments. This condition could cause an investment to be reclassified between the various levels within the hierarchy. Non-U.S. equity securities actively traded in foreign markets may be reflected in Level 2 despite the availability of closing prices, because the Fund evaluates and determines whether those closing prices reflect fair value at the close of the New York Stock Exchange (NYSE) or require adjustment, as described in Note 2 to the financial statements — Security Valuation.
Investments falling into the Level 3 category are primarily supported by quoted prices from brokers and dealers participating in the market for those investments. However, these may be classified as Level 3 investments due to lack of market transparency and corroboration to support these quoted prices. Additionally, valuation models may be used as the pricing source for any remaining investments classified as Level 3. These models rely on one or more significant unobservable inputs and/or significant assumptions by the Investment Manager. Inputs used in valuations may include, but are not limited to, financial statement analysis, capital account balances, discount rates and estimated cash flows, and comparable company data.
The following table is a summary of the inputs used to value the Fund’s investments as of February 28, 2011:
| | | | | | | | | | | | | | | | |
Description | | Quoted Prices
(Level 1) | | | Other
Significant
Observable
Inputs
(Level 2) | | | Significant
Unobservable
Inputs
(Level 3) | | | Total | |
Total Common Stocks | | $ | 1,813,318,284 | | | $ | — | | | $ | — | | | $ | 1,813,318,284 | |
Total Investment Companies | | | 7,918,927 | | | | — | | | | — | | | | 7,918,927 | |
Total Short-Term Obligation | | | — | | | | 25,400,000 | | | | — | | | | 25,400,000 | |
| | | | | | | | | | | | | | | | |
Total Investments | | | 1,821,237,211 | | | | 25,400,000 | | | | — | | | | 1,846,637,211 | |
| | | | | | | | | | | | | | | | |
Unrealized Appreciation of Futures Contracts | | | 780,151 | | | | — | | | | — | | | | 780,151 | |
| | | | | | | | | | | | | | | | |
Total | | $ | 1,822,017,362 | | | $ | 25,400,000 | | | $ | — | | | $ | 1,847,417,362 | |
| | | | | | | | | | | | | | | | |
The Fund’s assets assigned to the Level 2 input category represent certain short-term obligations which are valued using amortized cost, an income approach which converts future cash flows to a present value based upon the discount or premium at purchase.
There were no significant transfers of financial assets between Levels 1 and 2 during the period.
The following table reconciles asset balances for the year ended February 28, 2011, in which significant unobservable inputs (Level 3) were used in determining value:
| | | | | | | | | | | | | | | | |
Investments in Securities | | Balance
as of
February 28,
2010 | | Realized
Gain/
(Loss) | | Change in
Unrealized
Appreciation
(Depreciation) | | Net
Purchases | | Net
Sales | | Net
Transfers
into
Level 3 | | Net
Transfers
out of
Level 3 | | Balance
as of
February 28,
2011 |
Common Stocks
Other | | $— | | $— | | $— | | $— | | $— | | $— | | $— | | $— |
The information in the above reconciliation represents fiscal year to date activity for any securities identified as using Level 3 inputs at either the beginning or the end of the current fiscal period.
At February 28, 2011, the Fund held the following open long futures contracts:
| | | | | | | | | | | | | | | | | | | | |
Risk
Exposure/
Type | | Number of
Contracts | | | Value | | | Aggregate
Face Value | | | Expiration
Date | | | Unrealized
Appreciation | |
Equity Risk | | | | | | | | | | | | | | | | | | | | |
Russell 2000 Mini Index | | | 536 | | | $ | 44,107,440 | | | $ | 43,327,289 | | | | March-2011 | | | $ | 780,151 | |
| | | | | | | | | | | | | | | | | | | | |
On February 28, 2011, cash of $3,200,000 was pledged as collateral for open futures contracts and was being held at the broker of the futures contracts.
At February 28, 2011, the Fund held investments in the following sectors:
| | | | |
Sector (Unaudited) | | % of
Net Assets | |
Information Technology | | | 19.0 | |
Financials | | | 18.4 | |
Industrials | | | 15.6 | |
Consumer Discretionary | | | 13.8 | |
Health Care | | | 12.5 | |
Energy | | | 6.0 | |
Materials | | | 4.3 | |
Utilities | | | 3.6 | |
Consumer Staples | | | 3.4 | |
Telecommunication Services | | | 0.6 | |
| | | | |
| | | 97.2 | |
Investment Companies | | | 0.4 | |
Short-Term Obligation | | | 1.4 | |
Other Asset & Liabilities, Net | | | 1.0 | |
| | | | |
| | | 100.0 | |
| | | | |
See Accompanying Notes to Financial Statements.
17
Statement of Assets and Liabilities – Columbia Small Cap Index Fund
February 28, 2011
| | | | | | |
| | | | | ($) | |
| Assets | | Total investments, at identified cost | | | 1,418,561,762 | |
| | | | | | |
| | Total investments, at value | | | 1,846,637,211 | |
| | Cash | | | 588 | |
| | Cash collateral for open futures contracts | | | 3,200,000 | |
| | Receivable for: | | | | |
| | Investments sold | | | 16,818,007 | |
| | Fund shares sold | | | 3,700,866 | |
| | Dividends | | | 880,958 | |
| | Interest | | | 64 | |
| | Futures variation margin | | | 61,893 | |
| | Expense reimbursement due from Investment Manager | | | 18,669 | |
| | Trustees’ deferred compensation plan | | | 6,492 | |
| | | | | | |
| | Total Assets | | | 1,871,324,748 | |
| | |
| Liabilities | | Payable for: | | | | |
| | Investments purchased | | | 3,811,626 | |
| | Fund shares repurchased | | | 2,385,024 | |
| | Investment advisory fee | | | 141,889 | |
| | Administration fee | | | 141,889 | |
| | Trustees’ fees | | | 71,057 | |
| | Distribution and service fees | | | 34,990 | |
| | Trustees’ deferred compensation plan | | | 6,492 | |
| | Other liabilities | | | 1,181 | |
| | | | | | |
| | Total Liabilities | | | 6,594,148 | |
| | |
| | | | | | |
| | Net Assets | | | 1,864,730,600 | |
| | |
| Net Assets Consist of | | Paid-in capital | | | 1,414,572,881 | |
| | Overdistributed net investment income | | | (6,315 | ) |
| | Accumulated net realized gain | | | 21,308,434 | |
| | Net unrealized appreciation (depreciation) on: | | | | |
| | Investments | | | 428,075,449 | |
| | Futures contracts | | | 780,151 | |
| | | | | | |
| | Net Assets | | | 1,864,730,600 | |
| | |
| Class A | | Net assets | | $ | 183,578,118 | |
| | Shares outstanding | | | 10,194,116 | |
| | Net asset value and offering price per share | | $ | 18.01 | |
| | |
| Class Z | | Net assets | | $ | 1,681,152,482 | |
| | Shares outstanding | | | 93,087,811 | |
| | Net asset value and offering price per share | | $ | 18.06 | |
See Accompanying Notes to Financial Statements.
18
Statement of Operations – Columbia Small Cap Index Fund
For the Year Ended February 28, 2011
| | | | | | |
| | | | | ($) | |
| Investment Income | | Dividends | | | 18,421,076 | |
| | Interest | | | 35,304 | |
| | | | | | |
| | Total Investment Income | | | 18,456,380 | |
| | |
| Expenses | | Investment advisory fee | | | 1,576,195 | |
| | Administration fee | | | 1,576,195 | |
| | Distribution and service fees: | | | | |
| | Class A | | | 334,291 | |
| | Trustees’ fees | | | 49,157 | |
| | Other expenses | | | 7,092 | |
| | | | | | |
| | Total Expenses | | | 3,542,930 | |
| | |
| | Fees waived or expenses reimbursed by Investment Manager | | | (58,108 | ) |
| | | | | | |
| | Net Expenses | | | 3,484,822 | |
| | |
| | | | | | |
| | Net Investment Income | | | 14,971,558 | |
| | |
| Net Realized and Unrealized Gain (Loss) on Investments and Futures Contracts | | Net realized gain on: | | | | |
| | Investments | | | 90,166,852 | |
| | Futures contracts | | | 4,995,562 | |
| | | | | | |
| | Net realized gain | | | 95,162,414 | |
| | |
| | Net change in unrealized appreciation (depreciation) on: | | | | |
| | Investments | | | 321,093,878 | |
| | Futures contracts | | | 323,004 | |
| | | | | | |
| | Net change in unrealized appreciation (depreciation) | | | 321,416,882 | |
| | | | | | |
| | Net Gain | | | 416,579,296 | |
| | |
| | | | | | |
| | Net Increase Resulting from Operations | | | 431,550,854 | |
See Accompanying Notes to Financial Statements.
19
Statement of Changes in Net Assets – Columbia Small Cap Index Fund
| | | | | | | | | | |
| | | | | Year Ended February 28 | |
| Increase (Decrease) in Net Assets | | | | 2011 ($) | | | 2010 ($) | |
| Operations | | Net investment income | | | 14,971,558 | | | | 10,909,786 | |
| | Net realized gain on investments and futures contracts | | | 95,162,414 | | | | 17,580,423 | |
| | Net change in unrealized appreciation (depreciation) on investments and futures contracts | | | 321,416,882 | | | | 479,873,892 | |
| | | | | | | | | | |
| | Net increase resulting from operations | | | 431,550,854 | | | | 508,364,101 | |
| | | |
| Distributions to Shareholders | | From net investment income: | | | | | | | | |
| | Class A | | | (1,129,698 | ) | | | (531,824 | ) |
| | Class Z | | | (14,228,716 | ) | | | (10,500,067 | ) |
| | From net realized gains: | | | | | | | | |
| | Class A | | | (896,978 | ) | | | — | |
| | Class Z | | | (8,701,851 | ) | | | — | |
| | | | | | | | | | |
| | Total distributions to shareholders | | | (24,957,243 | ) | | | (11,031,891 | ) |
| | | |
| | Net Capital Stock Transactions | | | 51,910,164 | | | | 215,556,889 | |
| | Increase from Regulatory Settlements | | | — | | | | 6,338 | |
| | | | | | | | | | |
| | Total increase in net assets | | | 458,503,775 | | | | 712,895,437 | |
| | | |
| Net Assets | | Beginning of period | | | 1,406,226,825 | | | | 693,331,388 | |
| | End of period | | | 1,864,730,600 | | | | 1,406,226,825 | |
| | Overdistributed net investment income at end of period | | | (6,315 | ) | | | (28,438 | ) |
See Accompanying Notes to Financial Statements.
20
Statement of Changes in Net Assets (continued) – Columbia Small Cap Index Fund
| | | | | | | | | | | | | | | | |
| | | Capital Stock Activity | |
| | | Year Ended
February 28, 2011 | | | Year Ended
February 28, 2010 | |
| | | Shares | | | Dollars ($) | | | Shares | | | Dollars ($) | |
Class A | | | | | | | | | | | | | | | | |
Subscriptions | | | 6,068,664 | | | | 95,108,606 | | | | 5,177,725 | | | | 63,525,376 | |
Distributions reinvested | | | 113,006 | | | | 1,927,875 | | | | 39,416 | | | | 515,540 | |
Redemptions | | | (2,874,865 | ) | | | (45,040,444 | ) | | | (2,208,500 | ) | | | (26,847,443 | ) |
| | | | | | | | | | | | | | | | |
Net increase | | | 3,306,805 | | | | 51,996,037 | | | | 3,008,641 | | | | 37,193,473 | |
| | | | |
Class Z | | | | | | | | | | | | | | | | |
Subscriptions | | | 14,971,394 | | | | 238,197,658 | | | | 32,115,817 | | | | 364,778,523 | |
Distributions reinvested | | | 873,176 | | | | 14,893,636 | | | | 489,875 | | | | 6,383,176 | |
Redemptions | | | (16,277,274 | ) | | | (253,177,167 | ) | | | (15,864,879 | ) | | | (192,798,283 | ) |
| | | | | | | | | | | | | | | | |
Net increase (decrease) | | | (432,704 | ) | | | (85,873 | ) | | | 16,740,813 | | | | 178,363,416 | |
See Accompanying Notes to Financial Statements.
21
Financial Highlights – Columbia Small Cap Index Fund
Selected data for a share outstanding throughout each period is as follows:
| | | | | | | | | | | | | | | | | | | | | | | | |
| | | Year Ended February 28, | | | Year Ended
February 29, | | | Period Ended
February 28, | | | Year Ended
March 31, | |
| Class A Shares | | 2011 | | | 2010 | | | 2009 | | | 2008 | | | 2007 (a) | | | 2006 (b) | |
Net Asset Value, Beginning of
Period | | $ | 13.97 | | | $ | 8.58 | | | $ | 17.70 | | | $ | 22.19 | | | $ | 23.24 | | | $ | 19.16 | |
| | | | | | |
Income from Investment
Operations: | | | | | | | | | | | | | | | | | | | | | | | | |
Net investment income (c) | | | 0.12 | | | | 0.08 | | | | 0.17 | | | | 0.18 | | | | 0.10 | | | | 0.13 | |
Net realized and unrealized gain (loss)
on investments and futures contracts | | | 4.14 | | | | 5.40 | | | | (7.25 | ) | | | (2.05 | ) | | | 0.48 | | | | 4.32 | |
| | | | | | | | | | | | | | | | | | | | | | | | |
Total from investment operations | | | 4.26 | | | | 5.48 | | | | (7.08 | ) | | | (1.87 | ) | | | 0.58 | | | | 4.45 | |
| | | | | | |
Less Distributions to
Shareholders: | | | | | | | | | | | | | | | | | | | | | | | | |
From net investment income | | | (0.12 | ) | | | (0.09 | ) | | | (0.17 | ) | | | (0.17 | ) | | | (0.09 | ) | | | (0.09 | ) |
From net realized gains | | | (0.10 | ) | | | — | | | | (1.87 | ) | | | (2.45 | ) | | | (1.54 | ) | | | (0.28 | ) |
| | | | | | | | | | | | | | | | | | | | | | | | |
Total distributions to shareholders | | | (0.22 | ) | | | (0.09 | ) | | | (2.04 | ) | | | (2.62 | ) | | | (1.63 | ) | | | (0.37 | ) |
| | | | | | |
Increase from Regulatory
Settlements | | | — | | | | — | (d) | | | — | | | | — | | | | — | | | | — | |
| | | | | | |
Net Asset Value, End of Period | | $ | 18.01 | | | $ | 13.97 | | | $ | 8.58 | | | $ | 17.70 | | | $ | 22.19 | | | $ | 23.24 | |
Total return (e) | | | 30.55 | %(f) | | | 63.90 | %(f) | | | (42.43 | )% | | | (9.74 | )% | | | 3.09 | %(f)(g)(h) | | | 23.46 | %(f) |
| | | | | | |
Ratios to Average Net Assets/
Supplemental Data: | | | | | | | | | | | | | | | | | | | | | | | | |
Net expenses before interest expense | | | 0.45 | % | | | 0.45 | % | | | 0.45 | %(i) | | | 0.45 | %(i) | | | 0.45 | %(i)(j) | | | 0.46 | %(i) |
Interest expense | | | — | | | | — | | | | — | %(k) | | | — | %(k) | | | — | %(j)(k) | | | — | %(k) |
Net expenses | | | 0.45 | % | | | 0.45 | % | | | 0.45 | %(i) | | | 0.45 | %(i) | | | 0.45 | %(i)(j) | | | 0.46 | %(i) |
Waiver/Reimbursement | | | — | %(k) | | | — | %(k) | | | — | | | | — | | | | — | %(j)(k) | | | 0.07 | %(l) |
Net investment income | | | 0.73 | % | | | 0.68 | % | | | 1.15 | %(i) | | | 0.81 | %(i) | | | 0.51 | %(i)(j) | | | 0.62 | %(i) |
Portfolio turnover rate | | | 14 | % | | | 14 | % | | | 35 | % | | | 24 | % | | | 15 | %(g) | | | 20 | % |
Net assets, end of period (000s) | | $ | 183,578 | | | $ | 96,238 | | | $ | 33,273 | | | $ | 46,078 | | | $ | 51,681 | | | $ | 45,365 | |
| (a) | The Fund changed its fiscal year end from March 31 to February 28. Per share data and total return reflect activity from April 1, 2006 through February 28, 2007. |
| (b) | On August 22, 2005, the existing Investor A shares were renamed Class A shares. |
| (c) | Per share data was calculated using the average shares outstanding during the period. |
| (d) | Rounds to less than $0.01 per share. |
| (e) | Total return at net asset value assuming all distributions reinvested. |
| (f) | Had the Investment Manager and/or any of its affiliates not waived fees or reimbursed a portion of expenses, total return would have been reduced. |
| (h) | Total return includes a voluntary reimbursement by the Investment Manager for a realized investment loss due to trading errors. This reimbursement had an impact of less than 0.01% on total return. |
| (i) | The benefits derived from expense reductions had an impact of less than 0.01%. |
| (k) | Rounds to less than 0.01%. |
| (l) | Bank of America Corporation assumed certain non-recurring costs. Absent these non-recurring costs, the waiver/reimbursement ratio would have been 0.01%. |
See Accompanying Notes to Financial Statements.
22
Financial Highlights – Columbia Small Cap Index Fund
Selected data for a share outstanding throughout each period is as follows:
| | | | | | | | | | | | | | | | | | | | | | | | |
| | | Year Ended February 28, | | | Year Ended
February 29, | | | Period Ended
February 28, | | | Year Ended
March 31, | |
| Class Z Shares | | 2011 | | | 2010 | | | 2009 | | | 2008 | | | 2007 (a) | | | 2006 (b) | |
Net Asset Value, Beginning of Period | | $ | 14.01 | | | $ | 8.60 | | | $ | 17.76 | | | $ | 22.27 | | | $ | 23.35 | | | $ | 19.24 | |
| | | | | | |
Income from Investment Operations: | | | | | | | | | | | | | | | | | | | | | | | | |
Net investment income (c) | | | 0.15 | | | | 0.12 | | | | 0.21 | | | | 0.23 | | | | 0.15 | | | | 0.18 | |
Net realized and unrealized gain (loss) on investments and futures contracts | | | 4.15 | | | | 5.40 | | | | (7.27 | ) | | | (2.05 | ) | | | 0.48 | | | | 4.35 | |
| | | | | | | | | | | | | | | | | | | | | | | | |
Total from investment operations | | | 4.30 | | | | 5.52 | | | | (7.06 | ) | | | (1.82 | ) | | | 0.63 | | | | 4.53 | |
| | | | | | |
Less Distributions to Shareholders: | | | | | | | | | | | | | | | | | | | | | | | | |
From net investment income | | | (0.15 | ) | | | (0.11 | ) | | | (0.23 | ) | | | (0.24 | ) | | | (0.17 | ) | | | (0.14 | ) |
From net realized gains | | | (0.10 | ) | | | — | | | | (1.87 | ) | | | (2.45 | ) | | | (1.54 | ) | | | (0.28 | ) |
| | | | | | | | | | | | | | | | | | | | | | | | |
Total distributions to shareholders | | | (0.25 | ) | | | (0.11 | ) | | | (2.10 | ) | | | (2.69 | ) | | | (1.71 | ) | | | (0.42 | ) |
| | | | | | |
Increase from Regulatory Settlements | | | — | | | | — | (d) | | | — | | | | — | | | | — | | | | — | |
| | | | | | |
Net Asset Value, End of Period | | $ | 18.06 | | | $ | 14.01 | | | $ | 8.60 | | | $ | 17.76 | | | $ | 22.27 | | | $ | 23.35 | |
Total return (e) | | | 30.81 | %(f) | | | 64.34 | %(f) | | | (42.28 | )% | | | (9.52 | )% | | | 3.34 | %(f)(g)(h) | | | 23.80 | %(f) |
| | | | | | |
Ratios to Average Net Assets/
Supplemental Data: | | | | | | | | | | | | | | | | | | | | | | | | |
Net expenses before interest expense | | | 0.20 | % | | | 0.20 | % | | | 0.20 | %(i) | | | 0.20 | %(i) | | | 0.20 | %(i)(j) | | | 0.21 | %(i) |
Interest expense | | | — | | | | — | | | | — | %(k) | | | — | %(k) | | | — | %(j)(k) | | | — | %(k) |
Net expenses | | | 0.20 | % | | | 0.20 | % | | | 0.20 | %(i) | | | 0.20 | %(i) | | | 0.20 | %(i)(j) | | | 0.21 | %(i) |
Waiver/Reimbursement | | | — | %(k) | | | — | %(k) | | | — | | | | — | | | | — | %(j)(k) | | | 0.07 | %(l) |
Net investment income | | | 0.97 | % | | | 0.95 | % | | | 1.39 | %(i) | | | 1.06 | %(i) | | | 0.76 | %(i)(j) | | | 0.87 | %(i) |
Portfolio turnover rate | | | 14 | % | | | 14 | % | | | 35 | % | | | 24 | % | | | 15 | %(g) | | | 20 | % |
Net assets, end of period (000s) | | $ | 1,681,152 | | | $ | 1,309,989 | | | $ | 660,059 | | | $ | 1,244,382 | | | $ | 1,521,291 | | | $ | 1,606,958 | |
| (a) | The Fund changed its fiscal year end from March 31 to February 28. Per share data and total return reflect activity from April 1, 2006 through February 28, 2007. |
| (b) | On August 22, 2005, the existing Primary A shares were renamed Class Z shares. |
| (c) | Per share data was calculated using the average shares outstanding during the period. |
| (d) | Rounds to less than $0.01 per share. |
| (e) | Total return at net asset value assuming all distributions reinvested. |
| (f) | Had the Investment Manager and/or any of its affiliates not waived fees or reimbursed a portion of expenses, total return would have been reduced. |
| (h) | Total return includes a voluntary reimbursement by the Investment Manager for a realized investment loss due to trading errors. This reimbursement had an impact of less than 0.01% on total return. |
| (i) | The benefits derived from expense reductions had an impact of less than 0.01%. |
| (k) | Rounds to less than 0.01%. |
| (l) | Bank of America Corporation assumed certain non-recurring costs. Absent these non-recurring costs, the waiver/reimbursement ratio would have been 0.01%. |
See Accompanying Notes to Financial Statements.
23
Notes to Financial Statements – Columbia Small Cap Index Fund
February 28, 2011
Note 1. Organization
Columbia Small Cap Index Fund (the Fund), a series of Columbia Funds Series Trust (the Trust), is a diversified fund. The Trust is registered under the Investment Company Act of 1940, as amended (the 1940 Act), as an open-end management investment company organized as a Delaware statutory trust.
Investment Objective
The Fund seeks total return before fees and expenses that corresponds to the total return of the Standard & Poor’s SmallCap 600 Index.
Fund Shares
The Trust has unlimited authorized shares of beneficial interest. The Fund offers Class A and Class Z shares. All share classes have identical voting, dividend and liquidation rights. Each share class has its own expense structure and sales charges, as applicable.
Class A shares are not subject to sales charges.
Class Z shares are not subject to sales charges and are available only to certain investors, as described in the Fund’s prospectus.
Note 2. Summary of Significant Accounting Policies
The preparation of financial statements in accordance with U.S. generally accepted accounting principles (GAAP) requires the Investment Manager to make certain estimates and assumptions that affect the reported amounts of assets and liabilities, the disclosure of contingent assets and liabilities at the date of the financial statements and the reported amounts of revenue and expenses during the reporting period. Actual results could differ from those estimates.
The following is a summary of significant accounting policies consistently followed by the Fund in the preparation of its financial statements.
Security Valuation
Equity securities, exchange-traded funds and securities of certain investment companies are valued at the last sale price on the principal exchange on which they trade, except for securities traded on the NASDAQ, which are valued at the NASDAQ official close price. Unlisted securities or listed securities for which there were no sales during the day are valued at the closing bid price on such exchanges or over-the-counter markets.
Short-term investments maturing in 60 days or less are valued at amortized cost, which approximates market value.
Futures contracts are valued at the settlement price established each day by the board of trade or exchange on which they are traded.
Investments for which market quotations are not readily available, or that have quotations which the Investment Manager believes are not reliable, are valued at fair value as determined in good faith under consistently applied procedures established by and under the general supervision of the Board of Trustees. If a security is valued at fair value, such value is likely to be different from the last quoted market price for the security. The determination of fair value often requires significant judgment. To determine fair value, the Investment Manager may use assumptions including but not limited to future cash flows and estimated risk premiums. Multiple inputs from various sources may be used to determine value.
Derivative Instruments
The Fund may use derivative instruments including futures contracts in order to meet its investment objectives. The Fund employs strategies in differing combinations to permit it to increase, decrease or change the level of exposure to market risk factors. The achievement of any strategy relating to derivatives depends on an analysis of various risk factors, and if the strategies for the use of derivatives do not work as intended, the Fund may not achieve its investment objectives.
In pursuit of its investment objectives, the Fund is exposed to the following market risk, among others:
Equity Risk: Equity risk relates to change in value of equity securities such as common stocks due to general market conditions such as real or perceived adverse economic conditions, changes in the general outlook for corporate earnings, or adverse investor sentiment. Equity securities generally have greater price volatility than fixed income securities.
The following notes provides more detailed information about the derivative type held by the Fund:
Futures Contracts: The Fund entered into equity index futures contracts to equitize cash in order to maintain appropriate equity market exposure while keeping sufficient cash to accommodate daily redemptions.
The use of futures contracts involves certain risks, which include, among others: (1) imperfect correlation between the price movement of the instruments and the underlying securities, (2) inability to close
24
Columbia Small Cap Index Fund
February 28, 2011
out positions due to differing trading hours, or the temporary absence of a liquid market, for either the instruments or the underlying securities, and (3) an inaccurate prediction of the future direction of interest rates by the Fund’s Investment Manager. In addition, upon entering into index futures contracts, the Fund bears risks which may include securities’ prices moving unexpectedly, in which case, the Fund may not achieve the anticipated benefits of the futures contracts and may realize a loss.
Upon entering into a futures contract, the Fund identifies within its portfolio of investments cash or securities in an amount sufficient to meet the initial margin requirement. Subsequent payments are made or received by the Fund equal to the daily change in the contract value and are recorded as variation margin receivable or payable and offset in unrealized gains or losses. The Fund recognizes a realized gain or loss when the contract is closed or expires.
Futures contracts involve, to varying degrees, risk of loss in excess of the variation margin disclosed on the Statement of Assets and Liabilities.
During the year ended February 28, 2011, the Fund entered into 4,969 futures contracts.
Effects of Derivative Transactions in the Financial Statements
The following table is a summary of the value of the Fund’s derivative instruments as of February 28, 2011:
| | | | | | |
| Fair Value of Derivative Instruments |
| Statement of Assets and Liabilities |
| Assets | | Fair Value* | | Liabilities | | Fair Value* |
Futures
Variation
Margin | | $61,893 | | — | | $— |
| * | Includes only current day’s variation margin |
The effect of derivative instruments on the Statement of Operations for the year ended February 28, 2011:
| | | | | | |
| | | | | | |
| | | Amount of Realized Gain or (Loss) and
Change in Unrealized Appreciation
(Depreciation) on Derivatives
Recognized in Income | |
| Equity Risk | | Net Realized
Gain | | Change
in Unrealized
Appreciation | |
| Futures Contracts | | $4,995,562 | | $ | 323,004 | |
Repurchase Agreements
The Fund may engage in repurchase agreement transactions with institutions that the Investment Manager has determined are creditworthy. The Fund, through the custodian, receives delivery of the underlying securities collateralizing a repurchase agreement. The Investment Manager is responsible for determining that the collateral is at least equal, at all times, to the value of the repurchase obligation including interest. A repurchase agreement transaction involves certain risks in the event of default or insolvency of the counterparty. These risks include possible delays in or restrictions on the Fund’s ability to dispose of the underlying securities and a possible decline in the value of the underlying securities during the period while the Fund seeks to assert its rights.
Security Transactions
Security transactions are accounted for on the trade date. Cost is determined and gains (losses) are based upon the specific identification method for both financial statement and federal income tax purposes.
Income Recognition
Interest income is recorded on the accrual basis.
Corporate actions and dividend income are recorded net of any non-reclaimable tax withholdings, on the ex-dividend date or upon receipt of ex-dividend notification in the case of certain foreign securities.
Awards from class action litigation are recorded as a reduction of cost if the Fund still owns the applicable securities on the payment date. If the Fund no longer owns the applicable securities, the proceeds are recorded as realized gains.
The Fund receives information regarding the character of distributions received from real estate investment trusts (REITs) on an annual basis. Distributions received from REITs are allocated among dividend income, capital gain and return of capital based upon such information or based on management’s estimates if actual information has not yet been reported. Management’s estimates are subsequently adjusted when the actual character of the distributions are disclosed by the REITs which could result in a proportionate increase in returns of capital to shareholders.
Distributions received from real estate investment trusts (REITs) in excess of their income are recorded as a reduction of the cost of the related investments. If the Fund no longer owns the applicable securities, any distributions received in excess of income are recorded as realized gains.
25
Columbia Small Cap Index Fund
February 28, 2011
Expenses
General expenses of the Trust are allocated to the Fund and other series of the Trust based upon relative net assets or other expense allocation methodologies determined by the nature of the expense. Expenses directly attributable to a specific class of shares are charged to that share class. Expenses directly attributable to the Fund are charged to the Fund.
Determination of Class Net Asset Value
All income, expenses (other than class-specific expenses which are charged directly to a share class, as shown in the Statement of Operations) and realized and unrealized gains (losses) are allocated to each class of the Fund on a daily basis, based on the relative net assets of each class, for purposes of determining the net asset value of each class.
Federal Income Tax Status
The Fund intends to qualify each year as a “regulated investment company” under Subchapter M of the Internal Revenue Code, as amended, and will distribute substantially all of its taxable income, if any, for its tax year, and as such will not be subject to federal income taxes. In addition, the Fund intends to distribute in each calendar year substantially all of its net investment income, capital gains and certain other amounts, if any, such that the Fund should not be subject to federal excise tax. Therefore, no federal income or excise tax provision is recorded.
Distributions to Shareholders
Distributions from net investment income, if any, are declared and paid semi-annually. Net realized capital gains, if any, are distributed at least annually. Income distributions and capital gain distributions are determined in accordance with federal income tax regulations which differ from GAAP.
Indemnification
In the normal course of business, the Fund enters into contracts that contain a variety of representations and warranties and which provide general indemnities. The Fund’s maximum exposure under these arrangements is unknown because this would involve future claims against the Fund. Also, under the Trust’s organizational documents and by contract, the Trustees and officers of the Trust are indemnified against certain liabilities that may arise out of actions relating to their duties to the Trust. However, based on experience, the Fund expects the risk of loss due to these representations, warranties and indemnities to be minimal.
Note 3. Fees and Compensation Paid to Affiliates
Investment Management Services Fee
After the close of business on April 30, 2010, Ameriprise Financial, Inc. (Ameriprise Financial) acquired a portion of the asset management business of Columbia Management Group, LLC (the Transaction), including the business of managing the Fund. In connection with the closing of the Transaction (the Closing), RiverSource Investments, LLC, a wholly owned subsidiary of Ameriprise Financial, became the investment manager of the Fund and changed its name to Columbia Management Investment Advisers, LLC (the Investment Manager). The Investment Manager determines which securities will be purchased, held or sold. The management fee is based on the annual rate of 0.10% of the Fund’s average daily net assets.
Prior to the Closing, Columbia Management Advisors, LLC (Columbia), an indirect, wholly owned subsidiary of Bank of America Corporation (BOA), provided investment management services to the Fund under the same fee structure.
Administration Fee
Effective upon the Closing, the Investment Manager became the administrator of the Fund and provides administrative and other services to the Fund, including services previously performed under the Pricing and Bookkeeping Oversight and Services Agreement discussed below. The administration fee is based on the annual rate of 0.10% of the Fund’s average daily net assets.
The Investment Manager, from the administration fee it receives from the Fund, pays all operating expenses of the Fund, with the exception of brokerage fees and commissions, interest, fees and expenses of Trustees who are not officers, directors or employees of the Investment Manager or its affiliates, distribution (Rule 12b-1) and/or shareholder servicing fees and any extraordinary non-recurring expenses that may arise, including litigation.
Prior to the Closing, Columbia provided administrative services to the Fund under the same fee structure.
Pricing and Bookkeeping Fees
Prior to the Closing, the Fund entered into a Financial Reporting Services Agreement (the Financial Reporting Services Agreement) with State Street Bank and Trust Company (State Street) and Columbia pursuant to which State Street provides financial reporting services to the Fund. The Fund also entered into an Accounting
26
Columbia Small Cap Index Fund
February 28, 2011
Services Agreement (collectively with the Financial Reporting Services Agreement, the State Street Agreements) with State Street and Columbia pursuant to which State Street provides accounting services to the Fund. Upon the Closing, Columbia assigned and delegated its rights and obligations under the State Street Agreements to the Investment Manager. The pricing and bookkeeping fees for the Fund are paid by the Investment Manager. Effective March 28, 2011, these services are now provided under the Administrative Services Agreement discussed above.
Also prior to the Closing, the Fund entered into a Pricing and Bookkeeping Oversight and Services Agreement (the Services Agreement) with Columbia. Under the Services Agreement, Columbia provided services related to Fund expenses and the requirements of the Sarbanes-Oxley Act of 2002, and provided oversight of the accounting and financial reporting services provided by State Street. These services are now provided under the Administration Fee note discussed above.
Transfer Agent Fee
In connection with the Closing, RiverSource Service Corporation, a wholly owned subsidiary of Ameriprise Financial, became the transfer agent of the Fund and changed its name to Columbia Management Investment Services Corp. (the New Transfer Agent). The New Transfer Agent has contracted with Boston Financial Data Services (BFDS) to serve as sub-transfer agent. The transfer agent fees for the Fund are payable by the Investment Manager. The New Transfer Agent pays the fees of BFDS for services as sub-transfer agent and is not entitled to reimbursement for such fees from the Fund.
The New Transfer Agent receives reimbursement for certain out-of-pocket expenses and may also receive compensation for various shareholder services.
Prior to the Closing, Columbia Management Services, Inc., an affiliate of Columbia and an indirect, wholly owned subsidiary of BOA, provided shareholder services to the Fund and contracted with BFDS to serve as sub-transfer agent, under the same fee structure.
An annual minimum account balance fee of $20 may apply to certain accounts with a value below the Fund’s initial minimum investment requirements. The amount collected through the assessment of this fee will be paid directly to the Fund. These minimum account balance fees are recorded as part of expense reductions on the Statement of Operations. For the year ended February 28, 2011, no minimum account balance fees were charged by the Fund.
Underwriting Discounts, Distribution and Shareholder Servicing Fees
In connection with the Closing, RiverSource Fund Distributors, Inc., an indirect wholly owned subsidiary of Ameriprise Financial, became the distributor of the Fund and changed its name to Columbia Management Investment Distributors, Inc. (the New Distributor).
The Trust has adopted a combined distribution and shareholder servicing plan for the Class A shares of the Fund at a maximum annual rate of 0.25% of the Class A shares average daily net assets. The shareholder servicing plan permits the Fund to compensate or reimburse servicing agents for the shareholder services they have provided. The distribution plan, adopted pursuant to Rule 12b-1 under the 1940 Act, permits the Fund to compensate or reimburse the New Distributor and/or selling agents for activities or expenses primarily intended to result in the sale of the Class A shares of the Fund. Payments are made at an annual rate and paid monthly, as a percentage of average daily net assets, set from time to time by the Board of Trustees, and are charged as expenses of the Fund directly to the Class A shares. A substantial portion of the expenses incurred pursuant to this plan is paid to affiliates of the New Distributor.
Prior to the Closing, Columbia Management Distributors, Inc, an affiliate of Columbia and an indirect, wholly owned subsidiary of BOA, was the principal underwriter of the Fund’s shares. There were no changes to the underwriting discount structure of the Fund or the service or distribution fee rates paid by the Fund as a result of the Transaction.
Expense Limits and Fee Waivers
Effective May 1, 2010, the Investment Manager has voluntarily agreed to reimburse a portion of the Fund’s expenses so that the Fund’s ordinary operating expenses (excluding any distribution and service fees, brokerage commissions, interest, taxes and extraordinary expenses, but including custodian charges relating to overdrafts, if any), after giving effect to any balance credits from the Fund’s custodian, do not exceed 0.20% annually of the Fund’s average daily net assets. Prior to May 1, 2010, Columbia voluntarily reimbursed a portion of the Fund’s expenses in the same manner.
Effective April 30, 2011, the Investment Manager and certain affiliates have contractually agreed to waive fees or reimburse expenses through June 30, 2012, so that the Fund’s ordinary operating expenses (excluding certain expenses, such as transaction costs and brokerage commissions, interest, taxes, acquired fund fees
27
Columbia Small Cap Index Fund
February 28, 2011
and expenses, and extraordinary expenses, if any), after giving effect to any balance credits or overdraft charges from the Fund’s custodian, do not exceed the annual rates of 0.45% and 0.20% of the Fund’s average daily net assets attributable to Class A and Class Z shares, respectively. This expense arrangement is made pursuant to a fee waiver and expense cap agreement that my be modified or amended only with the approval from all parties to such arrangements, including the Fund and the Investment Manager.
The Investment Manager is entitled to recover from the Fund any fees waived and/or expenses reimbursed for a three year period following the date of such fee waiver and/or reimbursement if such recovery does not cause the Fund’s expenses to exceed the expense limitations in effect at the time of recovery. Prior to May 1, 2010, Columbia was entitled to recover fees waived and/or expenses reimbursed from the Fund in the same manner.
At February 28, 2011, the amounts potentially recoverable by the Investment Manager pursuant to this arrangement were as follows:
| | | | | | | | | | | | | | | | |
Amount of potential recovery
expiring: | | | Total
potential | | | Amount Expired | | | Amount
recovered
during
the year
ended | |
| 2/28/2014 | | 2/28/2013 | | | recovery | | | 02/28/11 | | | 02/28/11 | |
| $58,108 | | $ | 43,874 | | | $ | 101,982 | | | $ | — | | | $ | — | |
Fees Paid to Officers and Trustees
Upon the Closing, all officers of the Fund are employees of the Investment Manager or its affiliates and, with the exception of the Fund’s Chief Compliance Officer, receive no compensation from the Fund. The Board of Trustees has appointed a Chief Compliance Officer to the Fund in accordance with federal securities regulations. The Fund, along with other affiliated funds, pays its pro-rata share of the expenses associated with the Chief Compliance Officer. The Fund’s expenses for the Chief Compliance Officer will not exceed $15,000 per year. Prior to the Closing, all officers of the Fund were employees of Columbia or its affiliates and the Fund paid its pro-rata share of the expenses for the Chief Compliance Officer under the same fee structure.
Trustees are compensated for their services to the Fund, as set forth on the Statement of Operations. The Trust’s eligible Trustees may participate in a non-qualified deferred compensation plan which may be terminated at any time. Any payments to plan participants are paid solely out of the Fund’s assets. Income earned on the plan participant’s deferral account is based on the rate of return of the eligible mutual funds selected by the participant or, if no funds are selected, on the rate of return of Columbia Money Market Fund (formerly known as RiverSource Cash Management Fund). Prior to the Closing, if no funds were selected, income earned on the plan participant’s deferral account was based on the rate of return of BofA Treasury Reserves. Trustees’ fees deferred during the current period as well as any gains or losses on the trustees’ deferred compensation balances as a result of market fluctuations are included in “Trustees’ fees” on the Statement of Operations. Liabilities under the deferred compensation plan are included in “Trustees’ fees” on the Statement of Assets and Liabilities.
As a result of a fund merger, the Fund assumed the liabilities of the deferred compensation plan of the acquired fund, which are included in “Trustees’ fee” on the Statement of Assets and Liabilities. The deferred compensation plan may be terminated at any time. Any payments to plan participants are paid solely out of the Fund’s assets.
Note 4. Custody Credits
The Fund has an agreement with its custodian bank under which custody fees may be reduced by balance credits. These credits are recorded as a reduction of total expenses on the Statement of Operations. The Fund could have invested a portion of the assets utilized in connection with the expense offset arrangement in an income-producing asset if it had not entered into such an agreement.
Note 5. Portfolio Information
The cost of purchases and proceeds from sales of securities, excluding short-term obligations, aggregated $278,366,559 and $211,820,607, respectively, for the year ended February 28, 2011.
Note 6. Regulatory Settlements
During the year ended February 28, 2010, the Fund received payments totaling $6,338 resulting from certain regulatory settlements with third parties in which the Fund had participated. The payments have been included in “Increase from regulatory settlements” on the Statement of Changes in Net Assets.
Note 7. Shareholder Concentration
As of February 28, 2011, two shareholder accounts owned 46.9% of the outstanding shares of the Fund. Purchase and redemption activity of these accounts may have a significant effect on the operations of the Fund.
Note 8. Line of Credit
The Fund and other affiliated funds participate in a $280,000,000 committed, unsecured revolving line of credit provided by State Street.
28
Columbia Small Cap Index Fund
February 28, 2011
The maximum amount that may be borrowed by any fund is limited to the lesser of $200,000,000 and the Fund’s borrowing limit set forth in the Fund’s registration statement. Borrowings are available for short-term liquidity or temporary or emergency purposes.
Effective October 14, 2010, interest is charged to each participating fund based on the fund’s borrowings at a rate per annum equal to the greater of the Federal Funds Rate plus 1.25% or the overnight LIBOR Rate plus 1.25%. In addition, a commitment fee of 0.125% per annum is accrued and apportioned among the participating funds pro rata based on their relative net assets.
Prior to October 14, 2010, interest was charged to each participating fund at the same rates. In addition, a commitment fee of 0.15% per annum was accrued and apportioned among the participating funds pro rata based on their relative net assets.
For the year ended February 28, 2011, the Fund did not borrow under these arrangements.
Note 9. Federal Tax Information
The timing and character of income and capital gain distributions are determined in accordance with income tax regulations, which may differ from GAAP. Reclassifications are made to the Fund’s capital accounts for permanent tax differences to reflect income and gains available for distribution (or available capital loss carryforwards) under income tax regulations.
For the year ended February 28, 2011, permanent book and tax basis differences resulting primarily from differing treatments for distribution reclasses were identified and reclassified among the components of the Fund’s net assets as follows:
| | | | |
| | | | | |
Undistributed Net Investment
Income | | Accumulated Net Realized
Gain | | Paid-In Capital |
| $408,979 | | $(121,092) | | $(287,887) |
Net investment income and net realized gains (losses), as disclosed on the Statement of Operations, and net assets were not affected by this reclassification.
The tax character of distributions paid during the years ended February 28, 2011 and February 28, 2010 was as follows:
| | | | | | | | |
| | | February 28, 2011 | | | February 28, 2010 | |
| Distributions paid from: | | | | |
Ordinary Income* | | $ | 15,358,414 | | | $ | 11,031,891 | |
Long-Term Capital Gains | | $ | 9,598,829 | | | | — | |
| * | For tax purposes short-term capital gain distributions, if any, are considered ordinary income distributions. |
As of February 28, 2011, the components of distributable earnings on a tax basis were as follows:
| | | | |
| | | | | |
Undistributed
Ordinary Income | | Undistributed Long-Term Capital Gains | | Net
Unrealized Appreciation* |
| $3,761,499 | | $42,721,824 | | $403,680,711 |
| * | The differences between book-basis and tax-basis net unrealized depreciation are primarily due to deferral of losses from wash sales. |
Unrealized appreciation and depreciation at February 28, 2011, based on cost of investments for federal income tax purposes were:
| | | | |
| | | | |
Unrealized appreciation | | $ | 560,715,516 | |
Unrealized depreciation | | | (157,034,805 | ) |
| | | | |
Net unrealized appreciation | | $ | 403,680,711 | |
Capital loss carryforwards of $36,774,231 were utilized during the year ended February 28, 2011.
Management is required to determine whether a tax position of the Fund is more likely than not to be sustained upon examination by the applicable taxing authority, including resolution of any related appeals or litigation processes, based on the technical merits of the position. The tax benefit to be recognized by the Fund is measured as the largest amount of benefit that is greater than fifty percent likely of being realized upon ultimate settlement. Management is not aware of any tax positions for which it is reasonably possible that the total amounts of unrecognized tax benefits will significantly change in the next twelve months. However, management’s conclusions may be subject to review and adjustment at a later date based on factors including, but not limited to, new tax laws, regulations, and administrative interpretations (including relevant court decisions). The Fund’s federal tax returns for the prior three fiscal years remain subject to examination by the Internal Revenue Service.
Note 10. Subsequent Events
Management has evaluated the events and transactions that have occurred through the date the financial statements were issued. Other than as noted below, there were no items requiring adjustment of the financial statements or additional disclosure.
Effective on March 28, 2011, the Fund has entered into a revolving credit facility with a syndicate of banks led by JPMorgan Chase Bank, N.A. (the Administrative Agent). This credit facility replaced
29
Columbia Small Cap Index Fund
February 28, 2011
the credit facility provided by State Street. The credit facility agreement, which is a collective agreement between the Fund and certain other funds managed by the Investment Manager, severally and not jointly, permits collective borrowings up to $300 million. The borrowers shall have the right, upon written notice to the Administrative Agent, to request an increase of up to $200 million in the aggregate amount of the credit facility from new or existing lenders, provided that the aggregate amount of the credit facility shall at no time exceed $500 million. Participation in such increase by any existing lender shall be at such lender’s sole discretion. Interest is charged to each fund based on its borrowings at a rate equal to the sum of the federal funds rate plus (i) 1.25% per annum plus (ii) if one-month LIBOR exceeds the federal funds rate, the amount of such excess. Each borrowing under the credit facility matures no later than 60 days after the date of borrowing. The Fund also pays a commitment fee equal to its pro rata share of the amount of the credit facility at a rate of 0.10% per annum.
Note 11. Information Regarding Pending and Settled Legal Proceedings
In June 2004, an action captioned John E. Gallus et al. v. American Express Financial Corp. and American Express Financial Advisors Inc. was filed in the United States District Court for the District of Arizona. The plaintiffs allege that they are investors in several American Express Company (now known as RiverSource) mutual funds and they purport to bring the action derivatively on behalf of those funds under the Investment Company Act of 1940. The plaintiffs allege that fees allegedly paid to the defendants by the funds for investment advisory and administrative services are excessive. The plaintiffs seek remedies including restitution and rescission of investment advisory and distribution agreements. The plaintiffs voluntarily agreed to transfer this case to the United States District Court for the District of Minnesota (the District Court). In response to defendants’ motion to dismiss the complaint, the District Court dismissed one of plaintiffs’ four claims and granted plaintiffs limited discovery. Defendants moved for summary judgment in April 2007. Summary judgment was granted in the defendants’ favor on July 9, 2007. The plaintiffs filed a notice of appeal with the Eighth Circuit Court of Appeals (the Eighth Circuit) on August 8, 2007. On April 8, 2009, the Eighth Circuit reversed summary judgment and remanded to the District Court for further proceedings. On August 6, 2009, defendants filed a writ of certiorari with the U.S. Supreme Court (the Supreme Court), asking the Supreme Court to stay the District Court proceedings while the Supreme Court considers and rules in a case captioned Jones v. Harris Associates, which involves issues of law similar to those presented in the Gallus case. On March 30, 2010, the Supreme Court issued its ruling in Jones v. Harris Associates, and on April 5, 2010, the Supreme Court vacated the Eighth Circuit’s decision in the Gallus case and remanded the case to the Eighth Circuit for further consideration in light of the Supreme Court’s decision in Jones v. Harris Associates. On June 4, 2010, the Eighth Circuit remanded the Gallus case to the District Court for further consideration in light of the Supreme Court’s decision in Jones v. Harris Associates. On December 9, 2010, the District Court reinstated its July 9, 2007 summary judgment order in favor of the defendants. On January 10, 2011, plaintiffs filed a notice of appeal with the Eighth Circuit.
In December 2005, without admitting or denying the allegations, American Express Financial Corporation (AEFC, which is now known as Ameriprise Financial, Inc. (Ameriprise Financial)), entered into settlement agreements with the Securities and Exchange Commission (SEC) and Minnesota Department of Commerce (MDOC) related to market timing activities. As a result, AEFC was censured and ordered to cease and desist from committing or causing any violations of certain provisions of the Investment Advisers Act of 1940, the Investment Company Act of 1940, and various Minnesota laws. AEFC agreed to pay disgorgement of $10 million and civil money penalties of $7 million. AEFC also agreed to retain an independent distribution consultant to assist in developing a plan for distribution of all disgorgement and civil penalties ordered by the SEC in accordance with various undertakings detailed at http://www.sec.gov/litigation/admin/ia-2451.pdf. Ameriprise Financial and its affiliates have cooperated with the SEC and the MDOC in these legal proceedings, and have made regular reports to the funds’ Boards of Directors/Trustees.
Ameriprise Financial and certain of its affiliates have historically been involved in a number of legal, arbitration and regulatory proceedings, including routine litigation, class actions, and governmental actions, concerning matters arising in connection with the conduct of their business activities. Ameriprise Financial believes that the Funds are not currently the subject of, and that neither Ameriprise Financial nor any of its affiliates are the subject of, any pending legal, arbitration or regulatory proceedings that are likely to have a material adverse effect on the Funds or the ability of Ameriprise Financial or its affiliates to perform under their contracts with the Funds. Ameriprise Financial is required to make 10-Q, 10-K and, as necessary, 8-K filings with the Securities and Exchange Commission on legal and regulatory matters that relate to Ameriprise Financial and its affiliates. Copies of these filings may be obtained by accessing the SEC website at www.sec.gov.
30
Columbia Small Cap Index Fund
February 28, 2011
There can be no assurance that these matters, or the adverse publicity associated with them, will not result in increased fund redemptions, reduced sale of fund shares or other adverse consequences to the Funds. Further, although we believe proceedings are not likely to have a material adverse effect on the Funds or the ability of Ameriprise Financial or its affiliates to perform under their contracts with the Funds, these proceedings are subject to uncertainties and, as such, we are unable to estimate the possible loss or range of loss that may result. An adverse outcome in one or more of these proceedings could result in adverse judgments, settlements, fines, penalties or other relief that could have a material adverse effect on the consolidated financial condition or results of operations of Ameriprise Financial.
31
Report of Independent Registered Public Accounting Firm
To the Trustees of Columbia Funds Series Trust and the Shareholders of Columbia Small Cap Index Fund
In our opinion, the accompanying statement of assets and liabilities, including the investment portfolio, and the related statements of operations and of changes in net assets and the financial highlights present fairly, in all material respects, the financial position of Columbia Small Cap Index Fund (the “Fund”) (a series of Columbia Funds Series Trust) at February 28, 2011, the results of its operations for the year then ended, the changes in its net assets for each of the two years in the period then ended, and the financial highlights for each of the five years in the period then ended, in conformity with accounting principles generally accepted in the United States of America. These financial statements and financial highlights (hereafter referred to as “financial statements”) are the responsibility of the Fund’s management. Our responsibility is to express an opinion on these financial statements based on our audits. We conducted our audits of these financial statements in accordance with the standards of the Public Company Accounting Oversight Board (United States). Those standards require that we plan and perform the audit to obtain reasonable assurance about whether the financial statements are free of material misstatement. An audit includes examining, on a test basis, evidence supporting the amounts and disclosures in the financial statements, assessing the accounting principles used and significant estimates made by management, and evaluating the overall financial statement presentation. We believe that our audits, which included confirmation of securities at February 28, 2011 by correspondence with the custodian and brokers, provide a reasonable basis for our opinion.
PricewaterhouseCoopers LLP
Boston, Massachusetts
April 21, 2011
32
Federal Income Tax Information (Unaudited) – Columbia Small Cap Index Fund
The Fund hereby designates as a capital gain dividend with respect to the fiscal year ended February 28, 2011, $54,936,686, or, if subsequently determined to be different, the net capital gain of such year.
83.05% of the ordinary income distributed by the Fund for the fiscal year ended February 28, 2011, qualifies for the corporate dividends received deduction.
For non-corporate shareholders 84.00%, or the maximum amount allowable under the Jobs and Growth Tax Relief Reconciliation Act of 2003, of ordinary income distributed by the Fund for the fiscal year ended February 28, 2011 may represent qualified dividend income.
The Fund will notify shareholders in January 2012 of amounts for use in preparing 2011 income tax returns.
33
Fund Governance
The Trustees serve terms of indefinite duration. The names, addresses and ages of the Trustees and officers of the Funds of Columbia Funds Series Trust, the year each was first elected or appointed to office, their principal business occupations during at least the last five years, the number of Funds overseen by each Trustee and other directorships they hold are shown below. Each officer listed below serves as an officer of each Fund in the Columbia Funds Series Trust.
Independent Trustees
| | |
Name, Address and Age, Position
with Funds, Year First Elected or
Appointed to Office | | Principal Occupation(s) During Past Five Years, Number of Funds in the Columbia
Funds Complex Overseen by Trustee, Other Directorships Held |
| |
| Edward J. Boudreau (Born 1944) | | |
c/o Columbia Management Investment Advisers, LLC 225 Franklin Street Boston, MA 02110 Trustee (since 2005) | | Managing Director–E.J. Boudreau & Associates (consulting), from 2000 through current; oversees 44; Trustee–BofA Funds Series Trust. |
| |
| William P. Carmichael (Born 1943) | | |
c/o Columbia Management Investment Advisers, LLC 225 Franklin Street Boston, MA 02110 Trustee (since 1999) | | Retired. Oversees 44; Director–Cobra Electronics Corporation (electronic equipment manufacturer); Director–McMoRan Exploration Company (oil and gas exploration and development); Director–The Finish Line (athletic shoes and apparel); Trustee–BofA Funds Series Trust; Former Director–Simmons Company (bedding). |
| |
| William A. Hawkins (Born 1942) | | |
c/o Columbia Management Investment Advisers, LLC 225 Franklin Street Boston, MA 02110 Trustee (since 2005) | | Managing Director–Overton Partners (financial consulting), August 2010 to present; President and Chief Executive Officer–California General Bank, N.A., from January 2008 through August 2010; oversees 44; Trustee–BofA Funds Series Trust. |
| |
| R. Glenn Hilliard (Born 1943) | | |
c/o Columbia Management Investment Advisers, LLC 225 Franklin Street Boston, MA 02110 Trustee (since 2005) | | Chairman and Chief Executive Officer–Hilliard Group LLC (investing and consulting), from April 2003 through current; Non-Executive Director & Chairman–CNO Financial Inc. (formerly Conseco Inc.) (insurance), September 2003 through current; Executive Chairman–Conseco, Inc. (insurance), August 2004 through September 2005; oversees 44; Trustee–BofA Funds Series Trust. |
| |
| John J. Nagorniak (Born 1944) | | |
c/o Columbia Management Investment Advisers, LLC 225 Franklin Street Boston, MA 02110 Trustee (since 2008) | | Retired. President and Director–Foxstone Financial, Inc. (consulting), 2000 through December 2007; Director–Mellon Financial Corporation affiliates (investing), 2000 through 2007; Chairman–Franklin Portfolio Associates (investing–Mellon affiliate), 1982 through 2007; oversees 44; Director–MIT Investment Company; Trustee–MIT 401k Plan. |
| |
| Minor M. Shaw (Born 1947) | | |
c/o Columbia Management Investment Advisers, LLC 225 Franklin Street Boston, MA 02110 Trustee (since 2003) | | President–Micco Corporation and Mickel Investment Group; oversees 44; Board Member–Piedmont Natural Gas; Trustee–BofA Funds Series Trust. |
34
Fund Governance (continued)
Interested Trustee
| | |
Name, Address and Age, Position
with Funds, Year First Elected or
Appointed to Office | | Principal Occupation(s) During Past Five Years, Number of Funds in the Columbia
Funds Complex Overseen by Trustee, Other Directorships Held |
|
| Anthony M. Santomero1 (Born 1946) |
c/o Columbia Management Investment Advisers, LLC 225 Franklin Street Boston, MA 02110 Trustee (since 2008) | | Richard K. Mellon Professor Emeritus of Finance, The Wharton School, University of Pennsylvania, from 2002 through current; Senior Advisor–McKinsey & Company (consulting), July 2006 through January 2008; President and Chief Executive Officer–Federal Reserve Bank of Philadelphia, July 2000 through April 2006; oversees 44; Director–Renaissance Reinsurance Ltd; Trustee–Penn Mutual Life Insurance Company; Director–Citigroup, Inc.; Citibank, N.A.; Trustee–BofA Funds Series Trust. |
| 1 | Dr. Santomero is currently deemed by the Columbia Funds to be an “interested person” (as defined in the 1940 Act) of the Funds because he serves as a Director of Citigroup, Inc. and Citibank, N.A., companies that may directly or through subsidiaries and affiliates engage from time-to-time in brokerage execution, principal transactions and lending relationships with the Columbia Funds or other funds or accounts advised/managed by the Advisor. |
The Statement of Additional Information includes additional information about the Trustees of the Funds and is available, without charge, upon request by calling 800-345-6611.
35
Fund Governance (continued)
Officers
| | |
| Name, Year of Birth and Address | | Principal Occupation(s) During Past Five Years |
| |
| J. Kevin Connaughton (Born 1964) | | |
225 Franklin Street Boston, MA 02110 President (since 2009) | | Senior Vice President and General Manager–Mutual Fund Products, Columbia Management Investment Advisers, LLC since May 2010; President, Columbia Funds, since 2009, and RiverSource Funds, since May 2010 (previously Senior Vice President and Chief Financial Officer, Columbia Funds, from June 2008 to January 2009, Treasurer, Columbia Funds, from October 2003 to May 2008, and senior officer of various other affiliated funds since 2000); Managing Director, Columbia Management Advisors, LLC from December 2004 to April 2010. |
| |
| Michael G. Clarke (Born 1969) | | |
225 Franklin Street Boston, MA 02110 Senior Vice President and Chief Financial Officer
(since 2009) | | Vice President, Columbia Management Investment Advisers, LLC since May 2010; Managing Director of Fund Administration, Columbia Management Advisors, LLC, from September 2004 to April 2010; senior officer of Columbia Funds and affiliated funds since 2002. |
| |
| Scott R. Plummer (Born 1959) | | |
5228 Ameriprise Financial Center Minneapolis, MN 55474 Senior Vice President, Secretary and Chief Legal Officer (since 2010) | | Chief Legal Officer and Assistant Secretary, Columbia Management Investment Advisers, LLC since June 2005; Vice President and Lead Chief Counsel–Asset Management, Ameriprise Financial, Inc. since May 2010 (previously Vice President and Chief Counsel–Asset Management, from 2005 to April 2010, and Vice President–Asset Management Compliance from 2004 to 2005); Vice President, Chief Counsel and Assistant Secretary, Columbia Management Investment Distributors, Inc. since 2008; Vice President, General Counsel and Secretary, Ameriprise Certificate Company since 2005; Chief Counsel, RiverSource Distributors, Inc. since 2006; Vice President, General Counsel and Secretary, RiverSource Funds, since December 2006; Senior Vice President, Secretary and Chief Legal Officer, Columbia Funds, since May 2010. |
| |
| Linda J. Wondrack (Born 1964) | | |
225 Franklin Street Boston, MA 02110 Senior Vice President and Chief Compliance Officer (since 2007) | | Vice President and Chief Compliance Officer, Columbia Management Investment Advisers, LLC since May 2010; Chief Compliance Officer, Columbia Funds, since 2007, and RiverSource Funds, since May 2010; Director (Columbia Management Group, LLC and Investment Product Group Compliance), Bank of America, from June 2005 to April 2010. |
| |
| William F. Truscott (Born 1960) | | |
53600 Ameriprise Financial Center Minneapolis, MN 55474 Senior Vice President (since 2010) | | Chairman of the Board, Columbia Management Investment Advisers, LLC since May 2010 (previously President, Chairman of the Board and Chief Investment Officer, from 2001 to April 2010); Chief Executive Officer, U.S. Asset Management & President, Annuities, Ameriprise Financial, Inc. since May 2010 (previously President–U.S. Asset Management and Chief Investment Officer from 2005 to April 2010, and Senior Vice President–Chief Investment Officer, from 2001 to 2005); Director, President and Chief Executive Officer, Ameriprise Certificate Company since 2006; Director, Columbia Management Investment Distributors, Inc. since May 2010 (previously Chairman of the Board and Chief Executive Officer from 2008 to April 2010); Chairman of the Board and Chief Executive Officer, RiverSource Distributors, Inc. since 2006. |
36
Fund Governance (continued)
Officers (continued)
| | |
| Name, Year of Birth and Address | | Principal Occupation(s) During Past Five Years |
| |
| Colin Moore (Born 1958) | | |
225 Franklin Street Boston, MA 02110 Senior Vice President (since 2010) | | Director and Chief Investment Officer, Columbia Management Investment Advisers, LLC since May 2010; Manager, Managing Director and Chief Investment Officer of Columbia Management Advisors, LLC from 2007 to April 2010; Head of Equities, Columbia Management Advisors, LLC from 2002 to 2007. |
| |
| Michael A. Jones ( Born 1959) | | |
225 Franklin Street Boston, MA 02110 Senior Vice President (since 2010) | | President and Director, Columbia Management Investment Advisers, LLC since May 2010; President and Director, Columbia Management Investment Distributors, Inc. since May 2010; Manager, Chairman, Chief Executive Officer and President, Columbia Management Advisors, LLC from 2007 to April 2010; Chief Executive Officer, President and Director, Columbia Management Distributors, Inc. from November 2006 to April 2010; previously, co-president and senior managing director at Robeco Investment Management. |
| |
| Amy Johnson (Born 1965) | | |
5228 Ameriprise Financial Center Minneapolis, MN 55474 Senior Vice President (since 2010) | | Senior Vice President and Chief Operating Officer, Columbia Management Investment Advisers, LLC since May 2010 (previously Chief Administrative Officer, from 2009 until April 2010, Vice President–Asset Management and Trust Company Services, from 2006 to 2009, and Vice President–Operations and Compliance from 2004 to 2006). |
| |
| Joseph F. DiMaria (Born 1968) | | |
225 Franklin Street Boston, MA 02110 Treasurer (since 2010) and Chief Accounting Officer (since 2008) | | Vice President, Mutual Fund Administration, Columbia Management Investment Advisers, LLC, since May 2010; Director of Fund Administration, Columbia Management Advisors, LLC from January 2006 to April 2010; Head of Tax/Compliance and Assistant Treasurer, Columbia Management Advisors, LLC, from November 2004 to December 2005. |
| |
| Marybeth Pilat (Born 1968) | | |
225 Franklin Street Boston, MA 02110 Deputy Treasurer (since 2010) | | Vice President, Mutual Fund Administration, Columbia Management Investment Advisers, LLC, since May 2010; Vice President, Investment Operations, Bank of America, from October 2008 to April 2010; Finance Manager, Boston Children’s Hospital from August 2008 to October 2008; Director, Mutual Fund Administration, Columbia Management Advisors, LLC, from May 2007 to July 2008; Vice President, Mutual Fund Valuation, Columbia Management Advisors, LLC, from January 2006 to May 2007; Vice President, Mutual Fund Accounting Oversight, Columbia Management Advisors, LLC from January 2005 to January 2006. |
| |
| Jullan Quero (Born 1967) | | |
225 Franklin Street Boston, MA 02110 Deputy Treasurer (since 2008) | | Vice President, Mutual Fund Administration, Columbia Management Investment Advisers, LLC since May 2010; Director of Fund Administration, Columbia Management Advisors, LLC, from August 2008 to April 2010; Senior Tax Manager, Columbia Management Advisors, LLC from August 2006 to July 2008; Senior Compliance Manager, Columbia Management Advisors, LLC from April 2002 to August 2006. |
| |
| Stephen T. Welsh (Born 1957) | | |
225 Franklin Street Boston, MA 02110 Vice President (since 2006) | | President, Columbia Management Investment Services, Corp. since May 2010; President and Director, Columbia Management Services, Inc. from July 2004 to April 2010, Managing Director, Columbia Management Distributors, Inc. from August 2007 to April 2010. |
37
Shareholder Meeting Results
At a Joint Special Meeting of Shareholders held on February 15, 2011, shareholders of the series of Columbia Funds Series Trust, including the Fund, elected each of the nominees for trustees to the Board of Trustees of Columbia Funds Series Trust, each to hold office for an indefinite term, as follows:
| | | | | | |
| | | | | | | |
Trustee | | Votes For | | Votes Withheld | | Abstentions |
Kathleen Blatz | | 2,145,636,122 | | 248,012,438 | | 0 |
Edward J. Boudreau, Jr. | | 2,145,430,114 | | 248,218,446 | | 0 |
Pamela G. Carlton | | 2,145,515,949 | | 248,132,612 | | 0 |
William P. Carmichael | | 2,145,038,695 | | 248,609,866 | | 0 |
Patricia M. Flynn | | 2,145,843,563 | | 247,804,997 | | 0 |
William A. Hawkins | | 2,145,359,401 | | 248,289,160 | | 0 |
R. Glenn Hilliard | | 2,145,079,400 | | 248,569,161 | | 0 |
Stephen R. Lewis, Jr. | | 2,145,092,209 | | 248,556,351 | | 0 |
John F. Maher | | 2,145,621,338 | | 248,027,223 | | 0 |
John J. Nagorniak | | 2,145,337,494 | | 248,311,067 | | 0 |
Catherine James Paglia | | 2,145,615,254 | | 248,033,306 | | 0 |
Leroy C. Richie | | 2,145,042,120 | | 248,606,441 | | 0 |
Anthony M. Santomero | | 2,145,088,174 | | 248,560,386 | | 0 |
Minor M. Shaw | | 2,145,430,762 | | 248,217,798 | | 0 |
Alison Taunton-Rigby | | 2,145,393,384 | | 248,255,177 | | 0 |
William F. Truscott | | 2,144,907,223 | | 248,741,338 | | 0 |
38
[THIS PAGE INTENTIONALLY LEFT BLANK]
39
[THIS PAGE INTENTIONALLY LEFT BLANK]
40
Important Information About This Report
The fund mails one shareholder report to each shareholder address. If you would like more than one report, please call shareholder services at 1-800-345-6611 and additional reports will be sent to you. This report has been prepared for shareholders of Columbia Small Cap Index Fund.
A description of the policies and procedures that the fund uses to determine how to vote proxies and a copy of the fund’s voting records are available (i) at www.columbiamanagement.com, (ii) on the Securities and Exchange Commission’s website at www.sec.gov, and (iii) without charge, upon request, by calling 1-800-368-0346. Information regarding how the fund voted proxies relating to portfolio securities during the 12-month period ended June 30 is available from the SEC’s website. Information regarding how the fund voted proxies relating to portfolio securities is also available from the fund’s website, www.columbiamanagement.com.
The fund files a complete schedule of portfolio holdings with the SEC for the first and third quarters of each fiscal year on Form N-Q. The fund’s Form N-Q is available on the SEC’s website at www.sec.gov and may be reviewed and copied at the SEC’s Public Reference Room in Washington, D.C. Information on the operation of the Public Reference Room may be obtained by calling
1-800-SEC-0330.
Transfer Agent
Columbia Management Investment Services Corp.
P.O. Box 8081
Boston, MA 02266-8081
1-800-345-6611
Distributor
Columbia Management Investment
Distributors, Inc.
225 Franklin Street
Boston, MA 02110
Investment Manager
Columbia Management Investment Advisers, LLC
225 Franklin Street
Boston, MA 02110
41

Columbia Small Cap Index Fund
P.O. Box 8081
Boston, MA 02266-8081
columbiamanagement.com
This information is for use with concurrent or prior delivery of a fund prospectus. Investors should consider the investment objectives, risks, charges and expenses of a mutual fund carefully before investing. For a free prospectus, which contains this and other important information about the funds, visit columbiamanagement.com. Read the prospectus carefully before investing. The Fund is distributed by Columbia Management Investment Distributors, Inc., member FINRA, and managed by Columbia Management Investment Advisers, LLC.
©2011 Columbia Management Investment Advisers, LLC. All rights reserved.
C-1696 A (04/11)

Columbia Mid Cap Index Fund
Annual Report for the Period Ended February 28, 2011
Table of Contents
The views expressed in this report reflect the current views of the respective parties. These views are not guarantees of future performance and involve certain risks, uncertainties and assumptions that are difficult to predict, so actual outcomes and results may differ significantly from the views expressed. These views are subject to change at any time based upon economic, market or other conditions and the respective parties disclaim any responsibility to update such views. These views may not be relied on as investment advice and, because investment decisions for a Columbia Fund are based on numerous factors, may not be relied on as an indication of trading intent on behalf of any particular Columbia Fund. References to specific securities should not be construed as a recommendation or investment advice.
President’s Message

Dear Shareholder:
The Columbia Management story began over 100 years ago, and today, we are one of the nation’s largest dedicated asset managers. The recent acquisition by Ameriprise Financial, Inc. brings together the talents, resources and capabilities of Columbia Management with those of RiverSource Investments, Threadneedle (acquired by Ameriprise in 2003) and Seligman Investments (acquired by Ameriprise in 2008) to build a best-in-class asset management business that we believe is truly greater than its parts.
RiverSource Investments traces its roots to 1894 when its then newly-founded predecessor, Investors Syndicate, offered a face-amount savings certificate that gave small investors the opportunity to build a safe and secure fund for retirement, education or other special needs. A mutual fund pioneer, Investors Syndicate launched Investors Mutual Fund in 1940. In the decades that followed, its mutual fund products and services lineup grew to include a full spectrum of styles and specialties. More than 110 years later, RiverSource continues to be a trusted financial products leader.
Threadneedle, a leader in global asset management and one of Europe’s largest asset managers, offers sophisticated international experience from a dedicated U.K. management team. Headquartered in London, it is named for Threadneedle Street in the heart of the city’s financial district, where British investors pioneered international and global investing. Threadneedle was acquired in 2003 and today operates as an affiliate of Columbia Management.
Seligman Investments’ beginnings date back to the establishment of the investment firm J. & W. Seligman & Co. in 1864. In the years that followed, Seligman played a major role in the geographical expansion and industrial development of the United States. In 1874, President Ulysses S. Grant named Seligman as fiscal agent for the U.S. Navy — an appointment that would last through World War I. Seligman helped finance the westward path of the railroads and the building of the Panama Canal. The firm organized its first investment company in 1929 and began managing its first mutual fund in 1930. In 2008, J. & W. Seligman & Co. Incorporated was acquired and Seligman Investments became an offering brand of RiverSource Investments, LLC.
We are proud of the rich and distinctive history of these firms, the strength and breadth of products and services they offer, and the combined cultures of pioneering spirit and forward thinking. Together we are committed to providing more for our shareholders than ever before.
| n | | A singular focus on our shareholders. Our business is asset management, so investors are our first priority. We dedicate our resources to identifying timely investment opportunities and provide a comprehensive choice of equity, fixed-income and alternative investments to help meet your individual needs. |
| n | | First-class research and thought leadership. We are dedicated to helping you take advantage of today’s opportunities and anticipate tomorrow’s. We stay abreast of the latest investment trends and ideas, using our collective insight to evaluate events and transform them into solutions you can use. |
| n | | A disciplined investment approach. We aren’t distracted by passing fads. Our teams adhere to a rigorous investment process that helps ensure the integrity of our products and enables you and your financial advisor to match our solutions to your objectives with confidence. |
When you choose Columbia Management, you can be confident that we will take the time to understand your needs and help you and your financial advisor identify the solutions that are right for you. Because at Columbia Management, we don’t consider ourselves successful unless you are.
Sincerely,

J. Kevin Connaughton
President, Columbia Funds
Investors should consider the investment objectives, risks, charges and expenses of a mutual fund carefully before investing. For a free prospectus, which contains this and other important information about the funds, visit www.columbiamanagement.com. The prospectus should be read carefully before investing.
Columbia Funds are distributed by Columbia Management Investment Distributors, Inc., member FINRA, and managed by Columbia Management Investment Advisers, LLC.
© 2011 Columbia Management Investment Advisers, LLC. All rights reserved.
Fund Profile – Columbia Mid Cap Index Fund
Summary
| n | | For the 12-month period that ended February 28, 2011, the fund’s Class A shares returned 32.16% without sales charge. |
| n | | The fund performed in line with its primary benchmark, the S&P MidCap 400 Index1, after accounting for fees and expenses. Its return was higher than the average return of the funds in its peer group, the Lipper Mid-Cap Core Funds Classification.2 |
| n | | Despite a rocky period in the summer of 2010, stock prices climbed for the second consecutive year, buoyed by sectors that are sensitive to economic growth. |
Portfolio Management
Alfred F. Alley III has managed or co-managed the fund since July 2009 and has been associated with Columbia Management Investment Advisers, LLC (the Investment Manager) since May 2010. Prior to joining the Investment Manager, Mr. Alley was associated with the fund’s previous advisor or its predecessors since 2005.
| 1 | The Standard & Poor’s (S&P) MidCap 400 Index is a market value-weighted index that tracks the performance of 400 mid-cap U.S. companies. |
| 2 | Lipper Inc., a widely respected data provider in the industry, calculates an average total return (assuming reinvestment of distributions) for mutual funds with investment objectives similar to those of the fund. Lipper makes no adjustment for the effect of sales loads. |
Indices are not available for investment, are not professionally managed and do not reflect sales charges, fees, brokerage commissions, taxes or other expenses of investing. Securities in the fund may not match those in an index.
Performance data quoted represents past performance and current performance may be lower or higher. Past performance is no guarantee of future results. The investment return and principal value will fluctuate so that shares, when redeemed, may be worth more or less than the original cost. Please visit www.columbiamanagement.com for daily and most recent month-end performance updates.
Summary
1-year return as of 02/28/11
| | |
| |
 | | +32.16% Class A shares |
| |
| | +32.76% S&P MidCap 400 Index |
Morningstar Style BoxTM
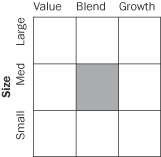
The Morningstar Style BoxTM is based on the fund’s portfolio holdings. For equity funds, vertical axis shows the market capitalization of the stocks owned, and the horizontal axis shows investment style (value, blend, or growth). Information shown is based on the most recent data provided by Morningstar.
© 2011 Morningstar, Inc. All rights reserved. The Morningstar information contained herein: (1) is proprietary to Morningstar and/or its content providers; (2) may not be copied or distributed; and (3) is not warranted to be accurate, complete or timely. Neither Morningstar nor its content providers are responsible for any damages or losses arising from any use of this information.
1
Economic Update – Columbia Mid Cap Index Fund
Summary
For the 12-month period that ended February 28, 2011
| | n | | The U.S. stock market, as measured by the S&P 500 Index, delivered solid returns, despite a summer 2010 correction. Foreign stock market returns were generally in line with the U.S. market, as measured by the MSCI EAFE Index (Net). | |
| | |
| S&P Index | | MSCI Index |
| |

| |
|
22.57% | | 20.00% |
| | n | | Strengthening economic growth and rising interest rates kept a lid on most bond market sectors. The Barclays Capital Aggregate Bond Index delivered modest results. However, high-yield bonds were strong performers, as measured by the JPMorgan Developed BB High Yield Index. | |
| | |
| Barclays Aggregate Index | | JPMorgan
Index |
| | |
| | |
| |
| |
|
4.93% | | 14.74% |
The U.S. economy continued to expand at a modest pace over the past 12 months, as measured by gross domestic product (GDP). After a strong first quarter in 2010, GDP growth dropped to 1.7% in the second quarter and fear spread that the economy would lapse into recession. However, the pace picked up in the third quarter, and growth was strong enough to inspire confidence among consumers, businesses and investors. GDP expanded by 2.6% in the third quarter and 2.8% in the fourth quarter. With the Federal Reserve Board (the Fed) providing additional monetary stimulus to shore up economic growth and the extension of key tax cuts for the next two years, 2011 expectations are for continued growth. Consumer confidence is on the mend, even though job growth has not met expectations. Business spending also tracked higher over the period.
Consumer spending on cars, clothing and other goods generally trended higher throughout the year. Holiday spending rose 5.5% between November 5, 2010 and December 24, 2010, in all retail categories, excluding automobiles, compared with the same period in 2009, according to MasterCard Advisors’ SpendingPulse, which tracks spending on all transactions including cash. Analysts say that an increase in personal savings and a decline in consumer debt gave consumers confidence to spend a little more on the 2010 holidays. The personal savings rate edged higher, ending January 2011, the last month for which data was available, at 5.8%. Personal income also increased during the year, surging in January 2011, as payroll tax cuts kicked in.
News on the job front was mostly positive over the 12-month period. A good portion of the jobs added in March, April and May of 2010 were temporary, government-sponsored census positions, which began to unwind in June, July and August of 2010. However, private sector payroll employment began to trend higher in the third quarter, massive layoffs declined and job growth turned solidly positive, with the addition of 255,000 new jobs in the first two months of 2011.
Despite some glimmers of improvement early in 2010, the housing market remained troublesome throughout the period. Both new and existing home sales fell after a federal tax credit for new and repeat homebuyers expired. Distressed properties pressured prices and foreclosures continued — another drag on prices. The inventory of unsold homes ended the period just about where it started, at 7.6 months for both new and existing homes, according to the National Association of Realtors and a joint release from the U.S. Census Bureau and the U.S. Department of Housing and Urban Development. The new year brought a bit of good news: Existing home sales increased in January 2011, raising the level of sales above where it was one year ago. According to the National Association of Realtors, it was the first time in seven months that year-over-year sales activity compared favorably.
Reports from the business side of the economy were generally positive. A key measure of the nation’s manufacturing situation — the Institute for Supply Management’s Index — took a somewhat surprising turn higher in the final months of the period. Technology spending rose 12% in 2010, according to the NPD Group, a national marketing research firm. Purchases of computers, networking and software returned to prerecession levels. Industrial production was disappointingly flat at year end, per the report issued by the Fed, and it slipped further in January 2011. The amount of manufacturing capacity utilized, per the report issued by the Fed, — a key measure of the health of the manufacturing sector — continued to inch higher.
2
Economic Update (continued) – Columbia Mid Cap Index Fund
Stocks moved higher despite summer 2010 setback
Against a strengthening economic backdrop, a stock market rally that began early in 2009 continued into 2010 despite a summer setback linked to a debt crisis brewing in Europe, which raised concerns among U.S. investors. These fears were short-lived and stocks regained their footing in September 2010, moving higher through the end of the period. The S&P 500 Index1 returned 22.57% for the 12 months through February 28, 2011. Outside the United States, stock market returns seesawed but ended just short of U.S. market returns. The MSCI EAFE Index (Net),2 a broad gauge of stock market performance in foreign developed markets, returned 20.00% (in U.S. dollars) for the 12-month period, as concerns about the impact of a bailout for weak euro zone economies abated. Emerging stock markets were similarly strong. The MSCI Emerging Markets Index (Net)3 returned 20.91% (in U.S. dollars) for the 12-month period.
Bonds delivered modest returns
As the economy strengthened and interest rates edged higher, most bond sectors delivered modest returns. The Barclays Capital Aggregate Bond Index4 returned 4.93%. High-yield bonds led the fixed-income markets. For the 12 months covered by this report, the JPMorgan Developed BB High Yield Index5 returned 14.74%. Despite rising yields in the second half of the period, the Treasury market was also positive. The Barclays Capital U.S. Treasury Index6 returned 3.71%. However, municipal bonds struggled in the final months of the period, as interest rates inched higher and issue supply surged ahead of the expiration of the Build America Bonds program. The Barclays Capital Municipal Bond Index7 gained 1.72% for the period. Despite positive economic activity, the Fed kept a key short-term interest rate — the federal funds rate — close to zero.
Past performance is no guarantee of future results.
| 1 | The Standard & Poor’s (S&P) 500 Index tracks the performance of 500 widely held, large-capitalization U.S. stocks. |
| 2 | The Morgan Stanley Capital International Europe, Australasia, Far East (MSCI EAFE) Index (Net) is a free float-adjusted market capitalization index that is designed to measure the equity market performance of developed markets, excluding the U.S. & Canada. As of May 27, 2010, the MSCI EAFE Index (Net) consisted of the following 22 developed market country indices: Australia, Austria, Belgium, Denmark, Finland, France, Germany, Greece, Hong Kong, Ireland, Israel, Italy, Japan, the Netherlands, New Zealand, Norway, Portugal, Singapore, Spain, Sweden, Switzerland and the United Kingdom. |
| 3 | The Morgan Stanley Capital International Emerging Markets (MSCI EM) Index (Net) is a free float-adjusted market capitalization index that is designed to measure equity market performance of emerging markets. As of May 27, 2010, the MSCI EM Index (Net) consisted of the following 21 emerging market country indices: Brazil, Chile, China, Colombia, Czech Republic, Egypt, Hungary, India, Indonesia, Korea, Malaysia, Mexico, Morocco, Peru, Philippines, Poland, Russia, South Africa, Taiwan, Thailand and Turkey. |
| 4 | The Barclays Capital Aggregate Bond Index is a market value-weighted index that tracks the daily price, coupon, pay-downs and total return performance of fixed-rate, publicly placed, dollar-denominated and non-convertible investment grade debt issues with at least $250 million par amount outstanding and with at least one year to final maturity. |
| 5 | The JPMorgan Developed BB High Yield Index is an unmanaged index designed to mirror the investable universe of the U.S. dollar developed, BB-rated, high yield corporate debt market. |
| 6 | The Barclays Capital U.S. Treasury Index includes public obligations of the U.S. Treasury. Treasury bills are excluded by the maturity constraint. In addition, certain special issues, such as state and local government series bonds (SLGs), as well as U.S. Treasury TIPS, are excluded. STRIPS are excluded from the index because their inclusion would result in double-counting. |
| 7 | The Barclays Capital Municipal Bond Index is considered representative of the broad market for investment-grade, tax-exempt bonds with a maturity of at least one year. |
Indices are not available for investment, are not professionally managed and do not reflect sales charges, fees, brokerage commissions, taxes or other expenses of investing. Securities in the fund may not match those in an index.
3
Performance Information – Columbia Mid Cap Index Fund
Performance data quoted represents past performance and current performance may be lower or higher. Past performance is no guarantee of future results. The investment return and principal value will fluctuate so that shares, when redeemed, may be worth more or less than the original cost. Please visit www.columbiamanagement.com for daily and most recent month-end performance updates.
| | | | |
| Net asset value per share | |
| |
as of 02/28/11 ($) | | | | |
Class A | | | 12.33 | |
Class I | | | 12.29 | |
Class Z | | | 12.29 | |
| | | | |
| Distribution declared per share | |
| |
03/01/10 – 02/28/11 ($) | | | | |
Class A | | | 0.14 | |
Class I | | | 0.16 | |
Class Z | | | 0.16 | |
|
| Performance of a $10,000 investment 03/01/01 – 02/28/11 |
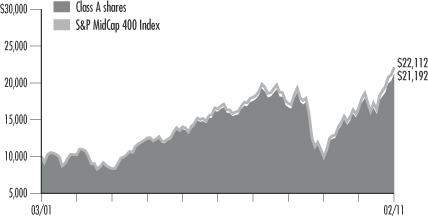
The chart above shows the change in value of a hypothetical $10,000 investment in Class A shares of Columbia Mid Cap Index Fund during the stated time period, and does not reflect the deduction of taxes that a shareholder may pay on fund distributions or on the redemption of fund shares.
| | | | |
| Performance of a $10,000 investment 03/1/01 – 02/28/11 ($) | |
Class A | | | 21,192 | |
Class I | | | n/a | |
Class Z | | | 21,724 | |
| | | | | | | | | | | | |
| Average annual total return as of 2/28/11 (%) | | | | | | | |
| | | |
| Share class | | A | | | I | | | Z | |
| Inception | | 05/31/00 | | | 9/27/10 | | | 3/31/00 | |
1-year | | | 32.16 | | | | n/a | | | | 32.45 | |
5-year | | | 5.73 | | | | n/a | | | | 6.00 | |
10-year/Life | | | 7.80 | | | | 22.27 | | | | 8.07 | |
Performance results reflect any fee waivers or reimbursements of fund expenses by the Investment Manager and/or any of its affiliates. Absent these fee waivers or expense reimbursement arrangements, performance results would have been lower.
Class I shares were initially offered by the Fund on September 27, 2010.
All results shown assume reinvestment of distributions. Class A shares are sold at net asset value. Class I shares and Class Z shares are sold at net asset value with no distribution and service (Rule 12b-1) fees. Class I shares and Class Z shares have limited eligibility and the investment minimum requirements may vary. Please see the fund’s prospectus for details. Performance for different share classes will vary based on differences in sales charges and fees associated with each class.
The tables do not reflect the deduction of taxes that a shareholder may pay on fund distributions or on the redemption of fund shares.
4
Understanding Your Expenses – Columbia Mid Cap Index Fund
Estimating your actual expenses
To estimate the expenses that you paid over the period, first you will need your account balance at the end of the period:
| | n | | For shareholders who receive their account statements from Columbia Management Investment Services Corp., your account balance is available online at www.columbiamanagement.com or by calling Shareholder Services at 800.345.6611. | |
| | n | | For shareholders who receive their account statements from their financial intermediary, contact your financial intermediary to obtain your account balance. | |
| | 1. | Divide your ending account balance by $1,000. For example, if an account balance was $8,600 at the end of the period, the result would be 8.6. | |
| | 2. | In the section of the table below titled “Expenses paid during the period,” locate the amount for your share class. You will find this number in the column labeled “Actual.” Multiply this number by the result from step 1. Your answer is an estimate of the expenses you paid on your account during the period. | |
If the value of your account falls below the minimum initial investment requirement applicable to you, your account may be subject to a $20 annual fee. This fee is not included in the accompanying table. If you are subject to the fee, keep it in mind when you are estimating the ongoing expenses of investing in the fund and when comparing the expenses of this fund with other funds.
As a fund shareholder, you incur two types of costs. There are transaction costs and ongoing costs, which generally include investment advisory fees, distribution and service (Rule 12b-1) fees and other fund expenses. The information on this page is intended to help you understand the ongoing costs of investing in the fund and to compare these costs with the ongoing costs of investing in other mutual funds.
Analyzing your fund’s expenses by share class
To illustrate these ongoing costs, we have provided an example and calculated the expenses paid by investors in each share class during the period. The information in the following table is based on an initial investment of $1,000, which is invested at the beginning of the period and held for the entire period. Expense information is calculated two ways and each method provides you with different information. The amount listed in the “Actual” column is calculated using the fund’s actual operating expenses and total return for the period. The amount listed in the “Hypothetical” column for each share class assumes that the return each year is 5% before expenses and is calculated based on the fund’s actual operating expenses. You should not use the hypothetical account values and expenses to estimate either your actual account balance at the end of the period or the expenses you paid during this period.
Compare with other funds
Since all mutual funds are required to include the same hypothetical calculations about expenses in shareholder reports, you can use this information to compare the ongoing costs of investing in the fund with other funds. To do so, compare the 5% hypothetical example with the 5% hypothetical examples that appear in the shareholder reports of other funds. As you compare hypothetical examples of other funds, it is important to note that hypothetical examples are meant to highlight the ongoing costs of investing in a fund and do not reflect any transaction costs, such as sales charges, redemption fees or exchange fees.
| | | | | | | | | | | | | | | | | | | | | | | | | | | | |
| 09/01/10 – 02/28/11 | | | | | | | | | | | | | | | | | | | | | |
| | | Account value at the
beginning of the period ($) | | | Account value at the end of the period ($) | | | Expenses paid during the period ($) | | | Fund's annualized
expense ratio (%) | |
| | | Actual | | | Hypothetical | | | Actual | | | Hypothetical | | | Actual | | | Hypothetical | | | Actual | |
Class A | | | 1,000.00 | | | | 1,000.00 | | | | 1,345.80 | | | | 1,022.56 | | | | 2.62 | | | | 2.26 | | | | 0.45 | |
Class I | | | 1,000.00 | | | | 1,000.00 | | | | 1,066.80 | * | | | 1,023.85 | | | | 0.83 | * | | | 0.95 | | | | 0.19 | |
Class Z | | | 1,000.00 | | | | 1,000.00 | | | | 1,346.90 | | | | 1,023.80 | | | | 1.16 | | | | 1.00 | | | | 0.20 | |
Expenses paid during the period are equal to the annualized expense ratio for the share class, multiplied by the average account value over the period, then multiplied by the number of days in the fund’s most recent fiscal half-year and divided by 365.
Had the Investment Manager and/or any of its affiliates not waived fees or reimbursed a portion of expenses, account value at the end of the period would have been reduced.
It is important to note that the expense amounts shown in the table are meant to highlight only ongoing costs of investing in the fund and do not reflect any transaction costs, such as sales charges, redemption fees or exchange fees. Therefore, the hypothetical examples provided may not help you determine the relative total costs of owning shares of different funds. If these transaction costs were included, your costs would have been higher.
| * | For the period September 27, 2010 through February 28, 2011. Class I shares commenced operations on September 27, 2010. |
5
Portfolio Manager’s Report – Columbia Mid Cap Index Fund
Performance data quoted represents past performance and current performance may be lower or higher. Past performance is no guarantee of future results. The investment return and principal value will fluctuate so that shares, when redeemed, may be worth more or less than the original cost. Please visit www.columbiamanagement.com for daily and most recent month-end performance updates.
| | | | |
| Top 10 holdings | | | |
| |
as of 02/28/11 (%) | | | | |
Cimarex Energy Co. | | | 0.8 | |
Edwards Lifesciences Corp. | | | 0.8 | |
Vertex Pharmaceuticals, Inc. | | | 0.8 | |
BorgWarner, Inc. | | | 0.7 | |
New York Community Bancorp, Inc. | | | 0.7 | |
Chipotle Mexican Grill, Inc. | | | 0.6 | |
Bucyrus International, Inc. | | | 0.6 | |
Pride International, Inc. | | | 0.6 | |
Lubrizol Corp. | | | 0.6 | |
Lam Research Corp. | | | 0.6 | |
Top 10 holdings are calculated as a percentage of net assets.
| | | | |
| Top 5 sectors | | | |
| |
as of 02/28/11 (%) | | | | |
Financials | | | 19.4 | |
Information Technology | | | 15.7 | |
Industrials | | | 14.5 | |
Consumer Discretionary | | | 13.6 | |
Health Care | | | 11.0 | |
Sector Breakdown is calculated as a percentage of net assets.
For the 12-month period that ended February 28, 2011, the fund’s Class A shares returned 32.16% without sales charge. The fund’s benchmark, the S&P MidCap 400 Index, returned 32.76%. The average return of funds in its peer group, the Lipper Mid-Cap Core Funds Classification, was 28.81%. The fund seeks to approximate the benchmark weights of securities, industries and sectors represented in the S&P MidCap 400 Index. As such, its return was in line with the return of the index, after fees and expenses, which the index does not incur. Its return was higher than the average return of funds in its peer group.
Energy, information technology and industrials were market leaders
As the economy strengthened over the 12-month period, all ten sectors in the index generated solid gains, led by energy, information technology and industrials. Energy stocks benefited from an uptick in economic growth and rising commodity prices. Within energy, Cimarex and Frontier Oil (0.8% and 0.2% of net assets, respectively) delivered outsized gains for the period. The information technology sector got a significant boost from higher business spending. Within technology, F5 Networks and Atmel (0.6% of net assets) were top contributors to the fund’s return. Industrials also benefited from improvement in economic activity, both here and abroad. Joy Global, a worldwide leader in mining equipment and services, was the top contributor to fund return from the industrials sector. Neither F5 Networks nor Joy Global were in the index at the end of the period.
Even weaker sectors were strong performers
In a period that was generally strong for stocks, even the weakest performing sectors generated strong returns. Telecommunication services, financials and consumer staples lagged the index average but returned 22.9%, 23.5% and 24.0%, respectively. On a stock-by-stock basis, Cree (0.5% of net assets), a technology company that makes light emitting diode (LED) fixtures, bulbs, chips and devices for wireless and power applications, was the fund’s worst performer, losing more than 20% for the period. Four of the five weakest stocks during the period were concentrated in the consumer discretionary sector. Strayer Education, ITT Educational Services (0.2% and 0.2% of net assets, respectively) and Corinthian Colleges (removed from the index) experienced significant losses as the for-profit education sector came under pressure. Dreamworks Animation (0.2% of net assets) also lost considerable ground.
Portfolio changes
There were 37 additions and deletions to the S&P MidCap 400 Index during the annual period. Because the fund is mandated to track the underlying benchmark by fully replicating its positions, all of these changes were made to the portfolio. Familiar names added to the index included Eastman Kodak and the New York Times, which moved down from the S&P 500 to the S&P MidCap 400 as the market capitalization of both companies contracted. Familiar names removed from the index included Burger King. Joy Global, Netflix and F5 Networks moved out of the index and up to the S&P 500 Index as the market capitalization of all three companies rose.
6
Portfolio Manager’s Report (continued) – Columbia Mid Cap Index Fund
Looking ahead
Even after two years of strong returns, we believe the U.S. equity market remains attractive. Valuations seem quite reasonable because earnings growth has kept pace with rising stock prices. And while earnings growth will inevitably slow from the pace it set in the early stages of this economic recovery, it is likely to remain quite healthy. Of course, no one can predict what will happen to stocks in any one year. However, historically equities have been the strongest asset class over the long term, and investors who have learned to ride out periods of weakness and volatility have been rewarded.
Portfolio characteristics and holdings are subject to change periodically and may not be representative of current characteristics and holdings. The outlook for the fund may differ from those presented for other Columbia Funds.
Equity securities are subject to stock market fluctuations that occur in response to economic and business developments.
Stocks of mid-cap companies pose special risks, including possible illiquidity and greater price volatility than stocks of larger, more established companies.
7
Investment Portfolio – Columbia Mid Cap Index Fund
February 28, 2011
Common Stocks – 96.7%
| | | | | | | | |
| | | Shares | | | Value ($) | |
| Consumer Discretionary – 13.6% | | | | | | | | |
| Auto Components – 1.1% | | | | | | | | |
BorgWarner, Inc. (a) | | | 263,050 | | | | 20,415,311 | |
Gentex Corp. | | | 324,525 | | | | 9,826,617 | |
| | | | | | | | |
Auto Components Total | | | | | | | 30,241,928 | |
| | |
Automobiles – 0.1% | | | | | | | | |
Thor Industries, Inc. | | | 98,100 | | | | 3,260,844 | |
| | | | | | | | |
Automobiles Total | | | | | | | 3,260,844 | |
| | |
Distributors – 0.3% | | | | | | | | |
LKQ Corp. (a) | | | 333,950 | | | | 7,934,652 | |
| | | | | | | | |
Distributors Total | | | | | | | 7,934,652 | |
| |
Diversified Consumer Services – 1.1% | | | | | |
Career Education Corp. (a) | | | 152,175 | | | | 3,668,939 | |
ITT Educational Services, Inc. (a) | | | 60,500 | | | | 4,588,925 | |
Matthews International Corp., Class A | | | 68,200 | | | | 2,533,630 | |
Regis Corp. | | | 133,225 | | | | 2,335,434 | |
Service Corp. International | | | 565,225 | | | | 6,160,953 | |
Sotheby’s | | | 155,100 | | | | 7,634,022 | |
Strayer Education, Inc. | | | 31,300 | | | | 4,301,872 | |
| | | | | | | | |
Diversified Consumer Services Total | | | | | | | 31,223,775 | |
| |
Hotels, Restaurants & Leisure – 2.1% | | | | | |
Bally Technologies, Inc. (a) | | | 123,975 | | | | 4,789,154 | |
Bob Evans Farms, Inc. | | | 70,250 | | | | 2,201,635 | |
Boyd Gaming Corp. (a) | | | 129,600 | | | | 1,385,424 | |
Brinker International, Inc. | | | 213,512 | | | | 5,047,424 | |
Cheesecake Factory, Inc. (a) | | | 137,075 | | | | 3,980,658 | |
Chipotle Mexican Grill, Inc. (a) | | | 71,525 | | | | 17,523,625 | |
International Speedway Corp., Class A | | | 67,750 | | | | 1,878,030 | |
Life Time Fitness, Inc. (a) | | | 96,850 | | | | 3,714,198 | |
Panera Bread Co., Class A (a) | | | 70,150 | | | | 8,190,012 | |
Scientific Games Corp., Class A (a) | | | 146,150 | | | | 1,309,504 | |
Wendy’s/Arby’s Group, Inc., Class A | | | 744,225 | | | | 3,542,511 | |
WMS Industries, Inc. (a) | | | 133,600 | | | | 5,315,944 | |
| | | | | | | | |
Hotels, Restaurants & Leisure Total | | | | | | | 58,878,119 | |
| | |
Household Durables – 1.4% | | | | | | | | |
American Greetings Corp., Class A | | | 92,700 | | | | 2,006,955 | |
KB Home | | | 166,975 | | | | 2,212,419 | |
M.D.C. Holdings, Inc. | | | 87,225 | | | | 2,289,656 | |
Mohawk Industries, Inc. (a) | | | 130,050 | | | | 7,557,205 | |
NVR, Inc. (a) | | | 13,042 | | | | 9,492,750 | |
Ryland Group, Inc. | | | 101,975 | | | | 1,770,286 | |
Toll Brothers, Inc. (a) | | | 333,700 | | | | 7,094,462 | |
Tupperware Brands Corp. | | | 145,975 | | | | 7,831,559 | |
| | | | | | | | |
Household Durables Total | | | | 40,255,292 | |
| |
| Leisure Equipment & Products – 0.3% | | | | | |
Eastman Kodak Co. (a) | | | 621,700 | | | | 2,113,780 | |
| | | | | | | | |
| | | Shares | | | Value ($) | |
Polaris Industries, Inc. | | | 78,400 | | | | 5,915,280 | |
| | | | | | | | |
Leisure Equipment & Products Total | | | | 8,029,060 | |
| |
| Media – 0.8% | | | | | |
DreamWorks Animation SKG, Inc., Class A (a) | | | 165,600 | | | | 4,573,872 | |
Harte-Hanks, Inc. | | | 89,750 | | | | 1,138,928 | |
John Wiley & Sons, Inc., Class A | | | 107,325 | | | | 5,131,208 | |
Lamar Advertising Co., Class A (a) | | | 132,575 | | | | 5,139,933 | |
Meredith Corp. | | | 84,300 | | | | 2,972,418 | |
New York Times Co., Class A (a) | | | 273,300 | | | | 2,842,320 | |
Scholastic Corp. | | | 54,925 | | | | 1,724,645 | |
| | | | | | | | |
Media Total | | | | 23,523,324 | |
| |
| Multiline Retail – 0.7% | | | | | |
99 Cents Only Stores (a) | | | 108,326 | | | | 1,802,545 | |
Dollar Tree, Inc. (a) | | | 289,575 | | | | 14,571,414 | |
Saks, Inc. (a) | | | 372,050 | | | | 4,557,612 | |
| | | | | | | | |
Multiline Retail Total | | | | 20,931,571 | |
| |
| Specialty Retail – 4.0% | | | | | |
Aaron’s, Inc. | | | 168,725 | | | | 3,971,787 | |
Advance Auto Parts, Inc. | | | 194,400 | | | | 12,184,992 | |
Aeropostale, Inc. (a) | | | 213,787 | | | | 5,545,635 | |
American Eagle Outfitters, Inc. | | | 452,524 | | | | 6,946,243 | |
AnnTaylor Stores Corp. (a) | | | 134,075 | | | | 3,111,881 | |
Ascena Retail Group, Inc. (a) | | | 160,225 | | | | 5,005,429 | |
Barnes & Noble, Inc. | | | 90,550 | | | | 1,212,465 | |
Chico’s FAS, Inc. | | | 410,650 | | | | 5,642,331 | |
Collective Brands, Inc. (a) | | | 148,900 | | | | 3,394,920 | |
Dick’s Sporting Goods, Inc. (a) | | | 204,950 | | | | 7,611,843 | |
Foot Locker, Inc. | | | 359,950 | | | | 7,152,206 | |
Guess?, Inc. | | | 146,825 | | | | 6,649,704 | |
J Crew Group, Inc. (a) | | | 147,800 | | | | 6,373,136 | |
Office Depot, Inc. (a) | | | 640,700 | | | | 3,402,117 | |
PETsMART, Inc. | | | 271,900 | | | | 11,112,553 | |
Rent-A-Center, Inc. | | | 148,425 | | | | 4,906,930 | |
Tractor Supply Co. | | | 168,575 | | | | 8,777,700 | |
Williams-Sonoma, Inc. | | | 245,475 | | | | 8,859,193 | |
| | | | | | | | |
Specialty Retail Total | | | | | | | 111,861,065 | |
|
Textiles, Apparel & Luxury Goods – 1.7% | |
Deckers Outdoor Corp. (a) | | | 89,100 | | | | 7,860,402 | |
Fossil, Inc. (a) | | | 118,775 | | | | 9,114,793 | |
Hanesbrands, Inc. (a) | | | 221,425 | | | | 5,737,122 | |
Phillips-Van Heusen Corp. | | | 153,450 | | | | 9,208,534 | |
Timberland Co., Class A (a) | | | 89,225 | | | | 3,295,972 | |
Under Armour, Inc., Class A (a) | | | 81,350 | | | | 5,387,811 | |
Warnaco Group, Inc. (a) | | | 102,950 | | | | 6,044,194 | |
| | | | | | | | |
Textiles, Apparel & Luxury Goods Total | | | | 46,648,828 | |
| | | | | | | | |
Consumer Discretionary Total | | | | | | | 382,788,458 | |
| | | | | | | | |
See Accompanying Notes to Financial Statements.
8
Columbia Mid Cap Index Fund
February 28, 2011
Common Stocks (continued)
| | | | | | | | |
| | | Shares | | | Value ($) | |
| Consumer Staples – 3.4% | | | | | | | | |
| Beverages – 0.3% | | | | | | | | |
Hansen Natural Corp. (a) | | | 159,750 | | | | 9,193,613 | |
| | | | | | | | |
Beverages Total | | | | | | | 9,193,613 | |
| | |
Food & Staples Retailing – 0.3% | | | | | | | | |
BJ’s Wholesale Club, Inc. (a) | | | 126,275 | | | | 6,114,235 | |
Ruddick Corp. | | | 98,850 | | | | 3,627,795 | |
| | | | | | | | |
Food & Staples Retailing Total | | | | | | | 9,742,030 | |
| | |
Food Products – 1.6% | | | | | | | | |
Corn Products International, Inc. | | | 174,900 | | | | 8,538,618 | |
Flowers Foods, Inc. | | | 175,175 | | | | 4,659,655 | |
Green Mountain Coffee Roasters, Inc. (a) | | | 268,050 | | | | 10,931,079 | |
Lancaster Colony Corp. | | | 44,450 | | | | 2,565,654 | |
Ralcorp Holdings, Inc. (a) | | | 127,000 | | | | 8,235,950 | |
Smithfield Foods, Inc. (a) | | | 383,850 | | | | 8,886,127 | |
Tootsie Roll Industries, Inc. | | | 56,566 | | | | 1,617,788 | |
| | | | | | | | |
Food Products Total | | | | | | | 45,434,871 | |
| | |
Household Products – 0.8% | | | | | | | | |
Church & Dwight Co., Inc. | | | 164,475 | | | | 12,407,994 | |
Energizer Holdings, Inc. (a) | | | 163,175 | | | | 10,904,985 | |
| | | | | | | | |
Household Products Total | | | | | | | 23,312,979 | |
| | |
Personal Products – 0.3% | | | | | | | | |
Alberto-Culver Co. | | | 198,425 | | | | 7,389,347 | |
| | | | | | | | |
Personal Products Total | | | | | | | 7,389,347 | |
| |
| Tobacco – 0.1% | | | | | |
Universal Corp. | | | 55,050 | | | | 2,302,191 | |
| | | | | | | | |
Tobacco Total | | | | 2,302,191 | |
| | | | | | | | |
Consumer Staples Total | | | | 97,375,031 | |
| | | | | | | | |
| Energy – 6.4% | | | | | |
| Energy Equipment & Services – 2.7% | | | | | |
Atwood Oceanics, Inc. (a) | | | 129,725 | | | | 5,905,082 | |
Dril-Quip, Inc. (a) | | | 79,300 | | | | 6,082,310 | |
Exterran Holdings, Inc. (a) | | | 146,224 | | | | 3,319,285 | |
Helix Energy Solutions Group, Inc. (a) | | | 243,900 | | | | 3,756,060 | |
Oceaneering International, Inc. (a) | | | 125,125 | | | | 10,464,204 | |
Patterson-UTI Energy, Inc. | | | 356,375 | | | | 9,743,292 | |
Pride International, Inc. (a) | | | 406,300 | | | | 16,865,513 | |
Superior Energy Services, Inc. (a) | | | 182,275 | | | | 6,982,955 | |
Tidewater, Inc. | | | 118,900 | | | | 7,396,769 | |
Unit Corp. (a) | | | 91,900 | | | | 5,468,050 | |
| | | | | | | | |
Energy Equipment & Services Total | | | | 75,983,520 | |
| | | | | | | | |
| | | Shares | | | Value ($) | |
| Oil, Gas & Consumable Fuels – 3.7% | | | | | |
Arch Coal, Inc. | | | 375,675 | | | | 12,596,383 | |
Bill Barrett Corp. (a) | | | 107,275 | | | | 4,170,852 | |
Cimarex Energy Co. | | | 195,825 | | | | 22,741,157 | |
Comstock Resources, Inc. (a) | | | 109,425 | | | | 2,905,234 | |
Forest Oil Corp. (a) | | | 262,225 | | | | 9,306,365 | |
Frontier Oil Corp. (a) | | | 244,425 | | | | 6,819,458 | |
Northern Oil & Gas, Inc. (a) | | | 120,900 | | | | 3,840,993 | |
Overseas Shipholding Group, Inc. | | | 61,900 | | | | 2,089,744 | |
Patriot Coal Corp. (a) | | | 210,350 | | | | 4,964,260 | |
Plains Exploration & Production Co. (a) | | | 323,925 | | | | 12,688,142 | |
Quicksilver Resources, Inc. (a) | | | 271,700 | | | | 4,208,633 | |
SM Energy Co. | | | 145,800 | | | | 10,566,126 | |
Southern Union Co. | | | 287,925 | | | | 8,211,621 | |
| | | | | | | | |
Oil, Gas & Consumable Fuels Total | | | | 105,108,968 | |
| | | | | | | | |
Energy Total | | | | 181,092,488 | |
| | | | | | | | |
| Financials – 19.4% | | | | | |
| Capital Markets – 2.2% | | | | | |
Affiliated Managers Group, Inc. (a) | | | 119,225 | | | | 12,727,269 | |
Apollo Investment Corp. | | | 451,025 | | | | 5,579,179 | |
Eaton Vance Corp. | | | 273,575 | | | | 8,562,897 | |
Greenhill & Co., Inc. | | | 58,375 | | | | 4,193,076 | |
Jefferies Group, Inc. | | | 286,125 | | | | 6,884,168 | |
Raymond James Financial, Inc. | | | 231,080 | | | | 8,854,986 | |
SEI Investments Co. | | | 337,325 | | | | 7,761,848 | |
Waddell & Reed Financial, Inc., Class A | | | 197,475 | | | | 7,974,041 | |
| | | | | | | | |
Capital Markets Total | | | | | | | 62,537,464 | |
| | |
| Commercial Banks – 3.4% | | | | | | | | |
Associated Banc Corp. | | | 400,137 | | | | 5,789,982 | |
Bancorpsouth, Inc. | | | 169,875 | | | | 2,707,808 | |
Bank of Hawaii Corp. | | | 111,525 | | | | 5,259,519 | |
Cathay General Bancorp | | | 181,575 | | | | 3,217,509 | |
City National Corp. | | | 107,250 | | | | 6,318,097 | |
Commerce Bancshares, Inc. | | | 179,317 | | | | 7,201,371 | |
Cullen/Frost Bankers, Inc. | | | 140,875 | | | | 8,249,640 | |
East West Bancorp, Inc. | | | 342,200 | | | | 7,945,884 | |
FirstMerit Corp. | | | 251,549 | | | | 4,288,910 | |
Fulton Financial Corp. | | | 460,050 | | | | 5,009,945 | |
International Bancshares Corp. | | | 122,075 | | | | 2,330,412 | |
PacWest Bancorp | | | 72,775 | | | | 1,507,170 | |
Prosperity Bancshares, Inc. | | | 107,925 | | | | 4,405,499 | |
SVB Financial Group (a) | | | 97,125 | | | | 5,262,233 | |
Synovus Financial Corp. | | | 1,815,475 | | | | 4,629,461 | |
TCF Financial Corp. | | | 293,525 | | | | 4,763,911 | |
Trustmark Corp. | | | 131,500 | | | | 3,083,675 | |
See Accompanying Notes to Financial Statements.
9
Columbia Mid Cap Index Fund
February 28, 2011
Common Stocks (continued)
| | | | | | | | |
| | | Shares | | | Value ($) | |
| Financials (continued) | | | | | |
Valley National Bancorp | | | 372,999 | | | | 5,083,976 | |
Webster Financial Corp. | | | 169,400 | | | | 3,926,692 | |
Westamerica Bancorporation | | | 67,300 | | | | 3,471,334 | |
| | | | | | | | |
Commercial Banks Total | | | | | | | 94,453,028 | |
| |
Diversified Financial Services – 0.4% | | | | | |
MSCI, Inc., Class A (a) | | | 274,650 | | | | 9,750,075 | |
| | | | | | | | |
Diversified Financial Services Total | | | | | | | 9,750,075 | |
| | |
Insurance – 4.0% | | | | | | | | |
American Financial Group, Inc. | | | 181,900 | | | | 6,299,197 | |
Arthur J. Gallagher & Co. | | | 245,075 | | | | 7,695,355 | |
Aspen Insurance Holdings Ltd. | | | 177,300 | | | | 5,239,215 | |
Brown & Brown, Inc. | | | 270,475 | | | | 7,070,216 | |
Everest Re Group Ltd. | | | 126,525 | | | | 11,216,441 | |
Fidelity National Financial, Inc., Class A | | | 524,825 | | | | 7,268,826 | |
First American Financial Corp. | | | 241,050 | | | | 3,798,948 | |
Hanover Insurance Group, Inc. | | | 104,350 | | | | 4,849,145 | |
HCC Insurance Holdings, Inc. | | | 266,625 | | | | 8,302,702 | |
Mercury General Corp. | | | 82,325 | | | | 3,386,851 | |
Old Republic International Corp. | | | 588,583 | | | | 7,357,287 | |
Protective Life Corp. | | | 198,050 | | | | 5,630,562 | |
Reinsurance Group of America, Inc. | | | 169,300 | | | | 10,224,027 | |
Stancorp Financial Group, Inc. | | | 106,350 | | | | 4,892,100 | |
Transatlantic Holdings, Inc. | | | 146,225 | | | | 7,447,239 | |
Unitrin, Inc. | | | 115,075 | | | | 3,370,547 | |
W.R. Berkley Corp. | | | 275,045 | | | | 8,237,598 | |
| | | | | | | | |
Insurance Total | | | | | | | 112,286,256 | |
|
Real Estate Investment Trusts (REITs) –7.8% | |
Alexandria Real Estate Equities, Inc. | | | 127,925 | | | | 10,259,585 | |
AMB Property Corp. | | | 389,325 | | | | 14,163,643 | |
BRE Properties, Inc. | | | 148,250 | | | | 7,043,358 | |
Camden Property Trust | | | 158,825 | | | | 9,397,675 | |
Corporate Office Properties Trust | | | 154,725 | | | | 5,549,986 | |
Cousins Properties, Inc. | | | 239,123 | | | | 2,027,763 | |
Duke Realty Corp. | | | 582,975 | | | | 8,202,458 | |
Equity One, Inc. | | | 106,625 | | | | 2,040,803 | |
Essex Property Trust, Inc. | | | 72,425 | | | | 8,964,766 | |
Federal Realty Investment Trust | | | 142,300 | | | | 11,978,814 | |
Highwoods Properties, Inc. | | | 165,700 | | | | 5,622,201 | |
Hospitality Properties Trust | | | 285,425 | | | | 6,564,775 | |
Liberty Property Trust | | | 264,050 | | | | 8,916,968 | |
Macerich Co. | | | 300,865 | | | | 15,235,804 | |
Mack-Cali Realty Corp. | | | 198,300 | | | | 6,730,302 | |
Nationwide Health Properties, Inc. | | | 291,925 | | | | 12,476,874 | |
OMEGA Healthcare Investors, Inc. | | | 227,775 | | | | 5,459,767 | |
Potlatch Corp. | | | 92,531 | | | | 3,553,190 | |
Rayonier, Inc. | | | 186,285 | | | | 11,424,859 | |
| | | | | | | | |
| | | Shares | | | Value ($) | |
Realty Income Corp. | | | 270,725 | | | | 9,737,978 | |
Regency Centers Corp. | | | 189,300 | | | | 8,565,825 | |
Senior Housing Properties Trust | | | 323,675 | | | | 7,942,985 | |
SL Green Realty Corp. | | | 181,000 | | | | 13,707,130 | |
Taubman Centers, Inc. | | | 126,400 | | | | 7,012,672 | |
UDR, Inc. | | | 421,215 | | | | 10,243,949 | |
Weingarten Realty Investors | | | 278,425 | | | | 7,202,855 | |
| | | | | | | | |
Real Estate Investment Trusts (REITs) Total | | | | | | | 220,026,985 | |
|
| Real Estate Management & Development – 0.3% | |
Jones Lang LaSalle, Inc. | | | 98,650 | | | | 9,709,133 | |
| | | | | | | | |
Real Estate Management & Development Total | | | | 9,709,133 | |
| |
| Thrifts & Mortgage Finance – 1.3% | | | | | |
Astoria Financial Corp. | | | 190,100 | | | | 2,665,202 | |
First Niagara Financial Group, Inc. | | | 483,463 | | | | 7,000,544 | |
New York Community Bancorp, Inc. | | | 1,007,278 | | | | 18,795,808 | |
NewAlliance Bancshares, Inc. | | | 243,000 | | | | 3,800,520 | |
Washington Federal, Inc. | | | 260,152 | | | | 4,622,901 | |
| | | | | | | | |
Thrifts & Mortgage Finance Total | | | | 36,884,975 | |
| | | | | | | | |
Financials Total | | | | 545,647,916 | |
| | | | | | | | |
| Health Care – 11.0% | | | | | |
| Biotechnology – 1.1% | | | | | |
United Therapeutics Corp. (a) | | | 115,825 | | | | 7,810,080 | |
Vertex Pharmaceuticals, Inc. (a) | | | 469,825 | | | | 21,926,733 | |
| | | | | | | | |
Biotechnology Total | | | | 29,736,813 | |
| |
| Health Care Equipment & Supplies – 3.9% | | | | | |
Beckman Coulter, Inc. | | | 160,100 | | | | 13,309,113 | |
Edwards Lifesciences Corp. (a) | | | 263,975 | | | | 22,448,434 | |
Gen-Probe, Inc. (a) | | | 111,425 | | | | 7,006,404 | |
Hill-Rom Holdings, Inc. | | | 145,775 | | | | 5,549,654 | |
Hologic, Inc. (a) | | | 600,925 | | | | 12,126,666 | |
IDEXX Laboratories, Inc. (a) | | | 132,950 | | | | 10,330,215 | |
Immucor, Inc. (a) | | | 161,900 | | | | 3,152,193 | |
Kinetic Concepts, Inc. (a) | | | 144,800 | | | | 7,090,856 | |
Masimo Corp. | | | 136,200 | | | | 4,105,068 | |
ResMed, Inc. (a) | | | 349,575 | | | | 11,046,570 | |
STERIS Corp. | | | 136,750 | | | | 4,628,988 | |
Teleflex, Inc. | | | 92,500 | | | | 5,401,075 | |
Thoratec Corp. (a) | | | 135,200 | | | | 3,769,376 | |
| | | | | | | | |
Health Care Equipment & Supplies Total | | | | 109,964,612 | |
| |
| Health Care Providers & Services – 3.1% | | | | | |
Community Health Systems, Inc. (a) | | | 214,025 | | | | 8,747,202 | |
Health Management Associates, Inc., Class A (a) | | | 579,500 | | | | 5,795,000 | |
Health Net, Inc. (a) | | | 221,000 | | | | 6,501,820 | |
See Accompanying Notes to Financial Statements.
10
Columbia Mid Cap Index Fund
February 28, 2011
Common Stocks (continued)
| | | | | | | | |
| | | Shares | | | Value ($) | |
| Health Care (continued) | | | | | |
Henry Schein, Inc. (a) | | | 213,325 | | | | 14,715,158 | |
Kindred Healthcare, Inc. (a) | | | 91,325 | | | | 2,275,819 | |
LifePoint Hospitals, Inc. (a) | | | 121,900 | | | | 4,751,662 | |
Lincare Holdings, Inc. | | | 225,750 | | | | 6,623,505 | |
Mednax, Inc. (a) | | | 110,250 | | | | 7,158,532 | |
Omnicare, Inc. | | | 268,050 | | | | 7,674,271 | |
Owens & Minor, Inc. | | | 146,425 | | | | 4,568,460 | |
Universal Health Services, Inc., Class B | | | 224,925 | | | | 10,281,322 | |
VCA Antech, Inc. (a) | | | 199,250 | | | | 4,989,220 | |
WellCare Health Plans, Inc. (a) | | | 98,350 | | | | 3,693,043 | |
| | | | | | | | |
Health Care Providers & Services Total | | | | 87,775,014 | |
| | |
Health Care Technology – 0.3% | | | | | | | | |
Allscripts-Misys Healthcare Solutions, Inc. (a) | | | 432,650 | | | | 9,237,078 | |
| | | | | | | | |
Health Care Technology Total | | | | | | | 9,237,078 | |
| |
Life Sciences Tools & Services – 1.6% | | | | | |
Bio-Rad Laboratories, Inc., Class A (a) | | | 44,950 | | | | 5,131,492 | |
Charles River Laboratories International, Inc. (a) | | | 133,450 | | | | 4,862,918 | |
Covance, Inc. (a) | | | 149,950 | | | | 8,461,678 | |
Mettler-Toledo International, Inc. (a) | | | 75,875 | | | | 13,002,699 | |
Pharmaceutical Product Development, Inc. | | | 274,875 | | | | 7,550,816 | |
Techne Corp. | | | 85,775 | | | | 6,149,210 | |
| | | | | | | | |
Life Sciences Tools & Services Total | | | | | | | 45,158,813 | |
| | |
Pharmaceuticals – 1.0% | | | | | | | | |
Endo Pharmaceuticals Holdings, Inc. (a) | | | 267,300 | | | | 9,494,496 | |
Medicis Pharmaceutical Corp., Class A | | | 140,175 | | | | 4,498,216 | |
Perrigo Co. | | | 191,950 | | | | 14,670,738 | |
| | | | | | | | |
Pharmaceuticals Total | | | | | | | 28,663,450 | |
| | | | | | | | |
Health Care Total | | | | | | | 310,535,780 | |
| | | | | | | | |
| Industrials – 14.5% | | | | | | | | |
| Aerospace & Defense – 0.5% | | | | | | | | |
Alliant Techsystems, Inc. | | | 77,025 | | | | 5,558,894 | |
BE Aerospace, Inc. (a) | | | 236,500 | | | | 7,974,780 | |
| | | | | | | | |
Aerospace & Defense Total | | | | | | | 13,533,674 | |
| | |
Airlines – 0.3% | | | | | | | | |
AirTran Holdings, Inc. (a) | | | 313,250 | | | | 2,286,725 | |
Alaska Air Group, Inc. (a) | | | 85,175 | | | | 5,063,654 | |
JetBlue Airways Corp. (a) | | | 466,280 | | | | 2,657,796 | |
| | | | | | | | |
Airlines Total | | | | | | | 10,008,175 | |
| | | | | | | | |
| | | Shares | | | Value ($) | |
| | |
Building Products – 0.2% | | | | | | | | |
Lennox International, Inc. | | | 103,750 | | | | 5,031,875 | |
| | | | | | | | |
Building Products Total | | | | | | | 5,031,875 | |
| |
Commercial Services & Supplies – 1.5% | | | | | |
Brink’s Co. | | | 107,250 | | | | 3,310,808 | |
Clean Harbors, Inc. (a) | | | 53,000 | | | | 4,869,640 | |
Copart, Inc. (a) | | | 137,650 | | | | 5,782,676 | |
Corrections Corp. of America (a) | | | 254,975 | | | | 6,333,579 | |
Deluxe Corp. | | | 118,650 | | | | 3,031,508 | |
Herman Miller, Inc. | | | 132,025 | | | | 3,556,754 | |
HNI Corp. | | | 103,625 | | | | 3,288,021 | |
Mine Safety Appliances Co. | | | 71,425 | | | | 2,580,585 | |
Rollins, Inc. | | | 146,315 | | | | 2,870,700 | |
Waste Connections, Inc. | | | 266,262 | | | | 7,718,935 | |
| | | | | | | | |
Commercial Services & Supplies Total | | | | 43,343,206 | |
| | |
Construction & Engineering – 1.3% | | | | | | | | |
AECOM Technology Corp. (a) | | | 274,100 | | | | 7,850,224 | |
Granite Construction, Inc. | | | 78,950 | | | | 2,250,075 | |
KBR, Inc. | | | 349,050 | | | | 11,448,840 | |
Shaw Group, Inc. (a) | | | 196,500 | | | | 7,804,980 | |
URS Corp. (a) | | | 191,325 | | | | 8,902,352 | |
| | | | | | | | |
Construction & Engineering Total | | | | | | | 38,256,471 | |
| | |
Electrical Equipment – 1.7% | | | | | | | | |
Acuity Brands, Inc. | | | 99,550 | | | | 5,626,566 | |
AMETEK, Inc. | | | 370,125 | | | | 15,526,744 | |
Hubbell, Inc., Class B | | | 138,800 | | | | 9,370,388 | |
Regal-Beloit Corp. | | | 89,300 | | | | 6,514,435 | |
Thomas & Betts Corp. (a) | | | 119,800 | | | | 6,635,722 | |
Woodward Governor Co. | | | 137,050 | | | | 4,507,574 | |
| | | | | | | | |
Electrical Equipment Total | | | | | | | 48,181,429 | |
| | |
Industrial Conglomerates – 0.2% | | | | | | | | |
Carlisle Companies, Inc. | | | 141,050 | | | | 6,066,561 | |
| | | | | | | | |
Industrial Conglomerates Total | | | | | | | 6,066,561 | |
| | |
Machinery – 5.5% | | | | | | | | |
AGCO Corp. (a) | | | 215,150 | | | | 11,785,917 | |
Bucyrus International, Inc. | | | 187,350 | | | | 17,060,091 | |
Crane Co. | | | 106,725 | | | | 5,041,689 | |
Donaldson Co., Inc. | | | 176,925 | | | | 9,960,877 | |
Gardner Denver, Inc. | | | 121,375 | | | | 8,877,367 | |
Graco, Inc. | | | 138,437 | | | | 5,635,770 | |
Harsco Corp. | | | 186,150 | | | | 6,360,746 | |
IDEX Corp. | | | 189,325 | | | | 7,807,763 | |
Kennametal, Inc. | | | 189,800 | | | | 7,299,708 | |
Lincoln Electric Holdings, Inc. | | | 97,700 | | | | 6,973,826 | |
Nordson Corp. | | | 78,475 | | | | 8,546,712 | |
Oshkosh Corp. (a) | | | 209,750 | | | | 7,481,783 | |
Pentair, Inc. | | | 228,200 | | | | 8,461,656 | |
See Accompanying Notes to Financial Statements.
11
Columbia Mid Cap Index Fund
February 28, 2011
Common Stocks (continued)
| | | | | | | | |
| | | Shares | | | Value ($) | |
| Industrials (continued) | | | | | | | | |
SPX Corp. | | | 116,100 | | | | 9,260,136 | |
Terex Corp. (a) | | | 251,850 | | | | 8,499,938 | |
Timken Co. | | | 186,375 | | | | 9,080,190 | |
Trinity Industries, Inc. | | | 184,375 | | | | 5,743,281 | |
Valmont Industries, Inc. | | | 49,350 | | | | 5,037,648 | |
Wabtec Corp. | | | 110,875 | | | | 6,293,265 | |
| | | | | | | | |
Machinery Total | | | | | | | 155,208,363 | |
| | |
| Marine – 0.4% | | | | | | | | |
Alexander & Baldwin, Inc. | | | 95,450 | | | | 4,003,173 | |
Kirby Corp. (a) | | | 123,800 | | | | 6,851,092 | |
| | | | | | | | |
Marine Total | | | | | | | 10,854,265 | |
| | |
Professional Services – 1.0% | | | | | | | | |
Corporate Executive Board Co. | | | 79,275 | | | | 3,176,549 | |
FTI Consulting, Inc. (a) | | | 107,425 | | | | 3,543,951 | |
Korn/Ferry International (a) | | | 107,075 | | | | 2,447,735 | |
Manpower, Inc. | | | 188,625 | | | | 11,977,687 | |
Towers Watson & Co., Class A | | | 104,725 | | | | 6,157,830 | |
| | | | | | | | |
Professional Services Total | | | | | | | 27,303,752 | |
| | |
Road & Rail – 1.2% | | | | | | | | |
Con-way, Inc. | | | 126,675 | | | | 4,124,538 | |
J.B. Hunt Transport Services, Inc. | | | 205,200 | | | | 8,538,372 | |
Kansas City Southern (a) | | | 237,250 | | | | 12,773,540 | |
Landstar System, Inc. | | | 113,575 | | | | 5,050,681 | |
Werner Enterprises, Inc. | | | 102,493 | | | | 2,413,710 | |
| | | | | | | | |
Road & Rail Total | | | | | | | 32,900,841 | |
| |
Trading Companies & Distributors – 0.7% | | | | | |
GATX Corp. | | | 107,100 | | | | 3,715,299 | |
MSC Industrial Direct Co., Class A | | | 103,025 | | | | 6,510,150 | |
United Rentals, Inc. (a) | | | 139,950 | | | | 4,335,651 | |
Watsco, Inc. | | | 64,400 | | | | 4,158,952 | |
| | | | | | | | |
Trading Companies & Distributors Total | | | | 18,720,052 | |
| | | | | | | | |
Industrials Total | | | | | | | 409,408,664 | |
| | | | | | | | |
| Information Technology – 15.7% | | | | | | | | |
| Communications Equipment – 1.4% | | | | | | | | |
Adtran, Inc. | | | 145,850 | | | | 6,633,258 | |
Ciena Corp. (a) | | | 216,325 | | | | 5,964,080 | |
Plantronics, Inc. | | | 110,100 | | | | 3,841,389 | |
Polycom, Inc. (a) | | | 197,500 | | | | 9,440,500 | |
Riverbed Technology, Inc. (a) | | | 339,900 | | | | 14,034,471 | |
| | | | | | | | |
Communications Equipment Total | | | | 39,913,698 | |
| Computers & Peripherals – 0.6% | | | | | |
Diebold, Inc. | | | 151,900 | | | | 5,340,804 | |
NCR Corp. (a) | | | 368,350 | | | | 7,035,485 | |
| | | | | | | | |
| | | Shares | | | Value ($) | |
QLogic Corp. (a) | | | 244,200 | | | | 4,410,252 | |
| | | | | | | | |
Computers & Peripherals Total | | | | 16,786,541 | |
| |
| Electronic Equipment, Instruments & Components – 2.4% | | | | | |
Arrow Electronics, Inc. (a) | | | 267,775 | | | | 10,496,780 | |
Avnet, Inc. (a) | | | 351,425 | | | | 12,022,249 | |
Ingram Micro, Inc., Class A (a) | | | 362,575 | | | | 7,226,120 | |
Itron, Inc. (a) | | | 93,475 | | | | 5,300,967 | |
National Instruments Corp. | | | 203,418 | | | | 6,332,402 | |
Tech Data Corp. (a) | | | 107,775 | | | | 5,343,485 | |
Trimble Navigation Ltd. (a) | | | 277,725 | | | | 13,650,184 | |
Vishay Intertechnology, Inc. (a) | | | 381,375 | | | | 6,654,994 | |
| | | | | | | | |
Electronic Equipment, Instruments & Components Total | | | | 67,027,181 | |
| |
| Internet Software & Services – 1.0% | | | | | |
AOL, Inc. (a) | | | 246,850 | | | | 5,151,759 | |
Digital River, Inc. (a) | | | 91,775 | | | | 3,081,805 | |
Equinix, Inc. (a) | | | 106,350 | | | | 9,192,894 | |
Rackspace Hosting, Inc. (a) | | | 224,600 | | | | 8,289,986 | |
ValueClick, Inc. (a) | | | 186,700 | | | | 2,787,431 | |
| | | | | | | | |
Internet Software & Services Total | | | | 28,503,875 | |
| |
| IT Services – 2.5% | | | | | |
Acxiom Corp. (a) | | | 185,450 | | | | 3,178,613 | |
Alliance Data Systems Corp. (a) | | | 120,200 | | | | 9,464,548 | |
Broadridge Financial Solutions, Inc. | | | 289,075 | | | | 6,625,599 | |
Convergys Corp. (a) | | | 281,725 | | | | 3,963,871 | |
CoreLogic, Inc. | | | 240,825 | | | | 4,491,386 | |
DST Systems, Inc. | | | 82,350 | | | | 4,199,850 | |
Gartner, Inc. (a) | | | 197,700 | | | | 7,457,244 | |
Global Payments, Inc. | | | 184,200 | | | | 8,839,758 | |
Jack Henry & Associates, Inc. | | | 198,000 | | | | 6,318,180 | |
Lender Processing Services, Inc. | | | 211,150 | | | | 7,193,881 | |
Mantech International Corp., Class A (a) | | | 52,200 | | | | 2,255,040 | |
NeuStar, Inc., Class A (a) | | | 170,600 | | | | 4,307,650 | |
SRA International, Inc., Class A (a) | | | 99,075 | | | | 2,697,812 | |
| | | | | | | | |
IT Services Total | | | | | | | 70,993,432 | |
| | |
Office Electronics – 0.2% | | | | | | | | |
Zebra Technologies Corp., Class A (a) | | | 130,700 | | | | 4,877,724 | |
| | | | | | | | |
Office Electronics Total | | | | | | | 4,877,724 | |
|
Semiconductors & Semiconductor Equipment – 3.5% | |
Atmel Corp. (a) | | | 1,059,750 | | | | 15,557,130 | |
Cree, Inc. (a) | | | 250,750 | | | | 13,207,002 | |
Cypress Semiconductor Corp. (a) | | | 385,200 | | | | 8,073,792 | |
Fairchild Semiconductor International, Inc. (a) | | | 286,350 | | | | 5,042,624 | |
See Accompanying Notes to Financial Statements.
12
Columbia Mid Cap Index Fund
February 28, 2011
Common Stocks (continued)
| | | | | | | | |
| | | Shares | | | Value ($) | |
| Information Technology (continued) | | | | | | | | |
Integrated Device Technology, Inc. (a) | | | 354,992 | | | | 2,751,188 | |
International Rectifier Corp. (a) | | | 160,475 | | | | 5,157,667 | |
Intersil Corp., Class A | | | 287,575 | | | | 3,678,084 | |
Lam Research Corp. (a) | | | 284,350 | | | | 15,610,815 | |
RF Micro Devices, Inc. (a) | | | 635,550 | | | | 4,766,625 | |
Semtech Corp. (a) | | | 144,200 | | | | 3,414,656 | |
Silicon Laboratories, Inc. (a) | | | 101,125 | | | | 4,591,075 | |
Skyworks Solutions, Inc. (a) | | | 423,875 | | | | 15,234,067 | |
| | | | | | | | |
Semiconductors & Semiconductor Equipment Total | | | | 97,084,725 | |
| | |
Software – 4.1% | | | | | | | | |
ACI Worldwide, Inc. (a) | | | 76,775 | | | | 2,403,825 | |
Advent Software, Inc. (a) | | | 73,850 | | | | 2,141,650 | |
ANSYS, Inc. (a) | | | 210,450 | | | | 11,852,544 | |
Cadence Design Systems, Inc. (a) | | | 617,900 | | | | 6,148,105 | |
Concur Technologies, Inc. (a) | | | 105,400 | | | | 5,483,962 | |
FactSet Research Systems, Inc. | | | 107,250 | | | | 11,248,380 | |
Fair Isaac Corp. | | | 92,225 | | | | 2,577,689 | |
Informatica Corp. (a) | | | 216,975 | | | | 10,199,995 | |
Mentor Graphics Corp. (a) | | | 253,625 | | | | 4,032,638 | |
Micros Systems, Inc. (a) | | | 186,350 | | | | 8,877,714 | |
Parametric Technology Corp. (a) | | | 272,475 | | | | 6,457,658 | |
Quest Software, Inc. (a) | | | 139,075 | | | | 3,725,819 | |
Rovi Corp. (a) | | | 255,775 | | | | 14,175,050 | |
Solera Holdings, Inc. | | | 162,400 | | | | 8,295,392 | |
Synopsys, Inc. (a) | | | 343,525 | | | | 9,522,513 | |
TIBCO Software, Inc. (a) | | | 386,075 | | | | 9,505,166 | |
| | | | | | | | |
Software Total | | | | | | | 116,648,100 | |
| | | | | | | | |
Information Technology Total | | | | 441,835,276 | |
| | | | | | | | |
| Materials – 6.5% | | | | | | | | |
| Chemicals – 3.2% | | | | | | | | |
Albemarle Corp. | | | 211,725 | | | | 12,186,891 | |
Ashland, Inc. | | | 182,325 | | | | 10,264,897 | |
Cabot Corp. | | | 151,200 | | | | 6,540,912 | |
Cytec Industries, Inc. | | | 114,150 | | | | 6,487,144 | |
Intrepid Potash, Inc. (a) | | | 102,425 | | | | 3,953,605 | |
Lubrizol Corp. | | | 151,775 | | | | 16,523,744 | |
Minerals Technologies, Inc. | | | 42,775 | | | | 2,775,242 | |
NewMarket Corp. | | | 22,800 | | | | 2,920,908 | |
Olin Corp. | | | 183,950 | | | | 3,423,310 | |
RPM International, Inc. | | | 298,100 | | | | 6,847,357 | |
Scotts Miracle-Gro Co., Class A | | | 106,275 | | | | 5,969,467 | |
Sensient Technologies Corp. | | | 114,875 | | | | 3,834,528 | |
Valspar Corp. | | | 227,700 | | | | 8,657,154 | |
| | | | | | | | |
Chemicals Total | | | | | | | 90,385,159 | |
| | | | | | | | |
| | | Shares | | | Value ($) | |
| | |
Construction Materials – 0.3% | | | | | | | | |
Martin Marietta Materials, Inc. | | | 105,300 | | | | 9,356,958 | |
| | | | | | | | |
Construction Materials Total | | | | | | | 9,356,958 | |
| | |
Containers & Packaging – 1.6% | | | | | | | | |
AptarGroup, Inc. | | | 155,075 | | | | 7,469,962 | |
Greif, Inc., Class A | | | 71,950 | | | | 4,652,287 | |
Packaging Corp. of America | | | 237,100 | | | | 6,826,109 | |
Rock-Tenn Co., Class A | | | 89,975 | | | | 6,176,784 | |
Silgan Holdings, Inc. | | | 116,100 | | | | 4,235,328 | |
Sonoco Products Co. | | | 237,900 | | | | 8,583,432 | |
Temple-Inland, Inc. | | | 249,300 | | | | 5,831,127 | |
| | | | | | | | |
Containers & Packaging Total | | | | | | | 43,775,029 | |
| | |
Metals & Mining – 1.3% | | | | | | | | |
Carpenter Technology Corp. | | | 101,675 | | | | 4,227,647 | |
Commercial Metals Co. | | | 264,475 | | | | 4,408,798 | |
Compass Minerals International, Inc. | | | 75,700 | | | | 7,075,679 | |
Reliance Steel & Aluminum Co. | | | 172,525 | | | | 9,545,808 | |
Steel Dynamics, Inc. | | | 501,875 | | | | 9,264,613 | |
Worthington Industries, Inc. | | | 128,400 | | | | 2,485,824 | |
| | | | | | | | |
Metals & Mining Total | | | | | | | 37,008,369 | |
| | |
Paper & Forest Products – 0.1% | | | | | | | | |
Louisiana-Pacific Corp. (a) | | | 305,125 | | | | 3,148,890 | |
| | | | | | | | |
Paper & Forest Products Total | | | | | | | 3,148,890 | |
| | | | | | | | |
Materials Total | | | | | | | 183,674,405 | |
| | | | | | | | |
| Telecommunication Services – 0.5% | | | | | |
| Diversified Telecommunication Services – 0.2% | |
tw telecom, Inc. (a) | | | 349,825 | | | | 6,506,745 | |
| | | | | | | | |
Diversified Telecommunication Services Total | | | | 6,506,745 | |
|
Wireless Telecommunication Services – 0.3% | |
Telephone & Data Systems, Inc. | | | 212,491 | | | | 7,150,322 | |
| | | | | | | | |
Wireless Telecommunication Services Total | | | | 7,150,322 | |
| | | | | | | | |
Telecommunication Services Total | | | | 13,657,067 | |
| | | | | | | | |
| Utilities – 5.7% | | | | | | | | |
| Electric Utilities – 1.6% | | | | | | | | |
Cleco Corp. | | | 140,500 | | | | 4,545,175 | |
DPL, Inc. | | | 275,050 | | | | 7,156,801 | |
Great Plains Energy, Inc. | | | 313,654 | | | | 6,022,157 | |
Hawaiian Electric Industries, Inc. | | | 217,675 | | | | 5,256,851 | |
IDACORP, Inc. | | | 113,550 | | | | 4,285,377 | |
NV Energy, Inc. | | | 543,825 | | | | 7,988,790 | |
PNM Resources, Inc. | | | 200,375 | | | | 2,666,991 | |
Westar Energy, Inc. | | | 257,550 | | | | 6,696,300 | |
| | | | | | | | |
Electric Utilities Total | | | | | | | 44,618,442 | |
See Accompanying Notes to Financial Statements.
13
Columbia Mid Cap Index Fund
February 28, 2011
Common Stocks (continued)
| | | | | | | | |
| | | Shares | | | Value ($) | |
| Utilities (continued) | | | | | | | | |
Gas Utilities – 2.1% | | | | | | | | |
AGL Resources, Inc. | | | 180,475 | | | | 6,859,855 | |
Atmos Energy Corp. | | | 209,125 | | | | 7,072,608 | |
Energen Corp. | | | 166,275 | | | | 10,159,402 | |
National Fuel Gas Co. | | | 190,050 | | | | 13,854,645 | |
Questar Corp. | | | 403,825 | | | | 7,216,353 | |
UGI Corp. | | | 255,400 | | | | 8,144,706 | |
WGL Holdings, Inc. | | | 118,100 | | | | 4,487,800 | |
| | | | | | | | |
Gas Utilities Total | | | | | | | 57,795,369 | |
|
Independent Power Producers & Energy Traders – 0.0% | |
Dynegy, Inc. (a) | | | 237,665 | | | | 1,376,080 | |
| | | | | | | | |
Independent Power Producers & Energy Traders Total | | | | 1,376,080 | |
| | |
Multi-Utilities – 1.7% | | | | | | | | |
Alliant Energy Corp. | | | 256,375 | | | | 10,096,048 | |
Black Hills Corp. | | | 90,800 | | | | 2,798,456 | |
MDU Resources Group, Inc. | | | 435,305 | | | | 9,345,998 | |
NSTAR | | | 239,525 | | | | 10,814,554 | |
OGE Energy Corp. | | | 225,375 | | �� | | 10,840,537 | |
Vectren Corp. | | | 188,800 | | | | 4,969,216 | |
| | | | | | | | |
Multi-Utilities Total | | | | | | | 48,864,809 | |
| | |
| Water Utilities – 0.3% | | | | | | | | |
Aqua America, Inc. | | | 317,999 | | | | 7,161,337 | |
| | | | | | | | |
Water Utilities Total | | | | | | | 7,161,337 | |
| | | | | | | | |
Utilities Total | | | | | | | 159,816,037 | |
| | | | | | | | |
Total Common Stocks (cost of $2,051,122,328) | | | | | | | 2,725,831,122 | |
| | |
Short-Term Obligation – 2.5% | | | | | | | | |
| | | Par ($) | | | | |
Repurchase agreement with Fixed Income Clearing Corp., dated 02/28/11, due 03/01/11 at 0.090%, collateralized by a U.S. Government Agency obligation maturing 01/15/14, market value $71,536,900 (repurchase proceeds $70,132,175) | | | 70,132,000 | | | | 70,132,000 | |
| | | | | | | | |
Total Short-Term Obligation (cost of $70,132,000) | | | | | | | 70,132,000 | |
| | | | | | | | |
Total Investments – 99.2% (cost of $2,121,254,328) (b) | | | | 2,795,963,122 | |
| | | | | | | | |
Other Assets & Liabilities, Net – 0.8% | | | | 23,218,842 | |
| | | | | | | | |
Net Assets – 100.0% | | | | | | | 2,819,181,964 | |
Notes to Investment Portfolio:
| (a) | Non-income producing security. |
| (b) | Cost for federal income tax purposes is $2,138,650,343. |
Generally accepted accounting principles (GAAP) require disclosure regarding the inputs and valuation techniques used to measure fair value and any changes in valuation inputs or techniques. In addition, investments shall be disclosed by major category.
The Fund categorizes its fair value measurements according to a three-level hierarchy that maximizes the use of observable inputs and minimizes the use of unobservable inputs by prioritizing that the most observable input be used when available. Observable inputs are those that market participants would use in pricing an investment based on market data obtained from sources independent of the reporting entity. Unobservable inputs are those that reflect the Fund’s assumptions about the information market participants would use in pricing an investment. An investment’s level within the fair value hierarchy is based on the lowest level of any input that is deemed significant to the asset or liability’s fair value measurement. The input levels are not necessarily an indication of the risk or liquidity associated with investments at that level. For example, certain U.S. government securities are generally high quality and liquid, however, they are reflected as Level 2 because the inputs used to determine fair value may not always be quoted prices in an active market.
Fair value inputs are summarized in the three broad levels listed below:
| • | | Level 1 — Valuations based on quoted prices for investments in active markets that the Fund has the ability to access at the measurement date (including NAV for open-end mutual funds). Valuation adjustments are not applied to Level 1 investments. |
| • | | Level 2 — Valuations based on other significant observable inputs (including quoted prices for similar securities, interest rates, prepayment speeds, credit risks, etc.). |
| • | | Level 3 — Valuations based on significant unobservable inputs (including the Fund’s own assumptions and judgment in determining the fair value of investments). |
Inputs that are used in determining fair value of an investment may include price information, credit data, volatility statistics, and other factors. These inputs can be either observable or unobservable. The availability of observable inputs can vary between investments, and is affected by various factors such as the type of investment, and the volume and level of activity for that investment or similar investments in the marketplace. The inputs will be considered by the Investment Manager, along with any other relevant factors in the calculation of an investment’s fair value. The Fund uses prices and inputs that are current as of the measurement date, which may include periods of market dislocations. During these periods, the availability of prices and inputs may be reduced for many investments. This condition could cause an investment to be reclassified between the various levels within the hierarchy. Non-U.S. equity securities actively traded in foreign markets may be reflected in Level 2 despite the availability of closing prices, because the Fund evaluates and determines whether those closing prices reflect fair value at the close of the New York Stock Exchange (NYSE) or require adjustment, as described in Note 2 to the financial statements — Security Valuation.
Investments falling into the Level 3 category are primarily supported by quoted prices from brokers and dealers participating in the market for those investments. However, these may be classified as Level 3 investments due to lack of market transparency and corroboration to support these quoted prices. Additionally, valuation models may be used as the pricing source for any remaining investments classified as Level 3. These models rely on one or more significant unobservable inputs and/or significant assumptions by the Investment Manager. Inputs used in valuations may include, but are not limited to, financial statement analysis, capital account balances, discount rates and estimated cash flows, and comparable company data.
See Accompanying Notes to Financial Statements.
14
Columbia Mid Cap Index Fund
February 28, 2011
The following table summarizes the inputs used, as of February 28, 2011, in valuing the Fund’s assets:
| | | | | | | | | | | | | | | | |
Description | | Quoted Prices
(Level 1) | | | Other
Significant
Observable
Inputs
(Level 2) | | | Significant
Unobservable
Inputs
(Level 3) | | | Total | |
Total Common Stocks | | $ | 2,725,831,122 | | | $ | — | | | $ | — | | | $ | 2,725,831,122 | |
Total Short-Term Obligation | | | — | | | | 70,132,000 | | | | — | | | | 70,132,000 | |
| | | | | | | | | | | | | | | | |
Total Investments | | | 2,725,831,122 | | | | 70,132,000 | | | | — | | | | 2,795,963,122 | |
| | | | | | | | | | | | | | | | |
Unrealized Appreciation on Futures Contracts | | | 2,079,973 | | | | — | | | | — | | | | 2,079,973 | |
| | | | | | | | | | | | | | | | |
Total | | $ | 2,727,911,095 | | | $ | 70,132,000 | | | $ | — | | | $ | 2,798,043,095 | |
| | | | | | | | | | | | | | | | |
The Fund’s assets assigned to the Level 2 input category represent certain short-term obligations which are valued using amortized cost, an income approach which converts future cash flows to a present value based upon the discount or premium at purchase.
There were no significant transfers of financial assets between Levels 1 and 2 during the period.
At February 28, 2011, the Fund held the following open long futures contracts:
| | | | | | | | | | | | | | | | | | | | |
Risk Exposure/
Type | | Number of
Contracts | | | Value | | | Aggregate
Face Value | | | Expiration
Date | | | Unrealized
Appreciation | |
Equity Risk | | | | | | | | | | | | | | | | | | | | |
S&P Mid Cap 400 Index | | | 961 | | | $ | 92,822,990 | | | $ | 90,743,017 | | | | Mar-2011 | | | $ | 2,079,973 | |
| | | | | | | | | | | | | | | | | | | | |
On February 28, 2011, cash of $7,415,000 was pledged as collateral for open futures contracts and was being held at the broker of the futures contracts.
At February 28, 2011, the Fund held investments in the following sectors:
| | | | |
Sector (Unaudited) | | % of
Net Assets | |
Financials | | | 19.4 | |
Information Technology | | | 15.7 | |
Industrials | | | 14.5 | |
Consumer Discretionary | | | 13.6 | |
Health Care | | | 11.0 | |
Materials | | | 6.5 | |
Energy | | | 6.4 | |
Utilities | | | 5.7 | |
Consumer Staples | | | 3.4 | |
Telecommunication Services | | | 0.5 | |
| | | | |
| | | 96.7 | |
Short-Term Obligation | | | 2.5 | |
Other Assets & Liabilities | | | 0.8 | |
| | | | |
| | | 100.0 | |
| | | | |
See Accompanying Notes to Financial Statements.
15
Statement of Assets and Liabilities – Columbia Mid Cap Index Fund
February 28, 2011
| | | | | | |
| | | | | ($) | |
| Assets | | Investments, at identified cost | | | 2,121,254,328 | |
| | | | | | |
| | Investments, at value | | | 2,795,963,122 | |
| | Cash | | | 312 | |
| | Cash collateral for open futures contracts | | | 7,415,000 | |
| | Receivable for: | | | | |
| | Investments sold | | | 23,548,589 | |
| | Fund shares sold | | | 6,117,134 | |
| | Dividends | | | 2,486,155 | |
| | Interest | | | 175 | |
| | Futures variation margin | | | 266,518 | |
| | Expense reimbursement due from Investment Manager | | | 414,795 | |
| | Prepaid expenses | | | 7,684 | |
| | | | | | |
| | Total Assets | | | 2,836,219,484 | |
| | |
| Liabilities | | Payable for: | | | | |
| | Investments purchased | | | 12,236,498 | |
| | Fund shares repurchased | | | 3,958,118 | |
| | Investment advisory fee | | | 213,614 | |
| | Administration fee | | | 201,946 | |
| | Pricing and bookkeeping fees | | | 12,463 | |
| | Transfer agent fee | | | 160,428 | |
| | Trustees’ fees | | | 57,501 | |
| | Custody fee | | | 15,368 | |
| | Reports to shareholders | | | 56,956 | |
| | Distribution and service fees | | | 63,596 | |
| | Chief compliance officer expenses | | | 547 | |
| | Other liabilities | | | 60,485 | |
| | | | | | |
| | Total Liabilities | | | 17,037,520 | |
| | |
| | | | | | |
| | Net Assets | | | 2,819,181,964 | |
| | |
| Net Assets Consist of | | Paid-in capital | | | 2,094,374,635 | |
| | Undistributed net investment income | | | 901,715 | |
| | Accumulated net realized gain | | | 47,116,847 | |
| | Net unrealized appreciation (depreciation) on: | | | | |
| | Investments | | | 674,708,794 | |
| | Futures contracts | | | 2,079,973 | |
| | | | | | |
| | Net Assets | | | 2,819,181,964 | |
See Accompanying Notes to Financial Statements.
16
Statement of Assets and Liabilities (continued) – Columbia Mid Cap Index Fund
February 28, 2011
| | | | | | |
| | | | | ($) | |
| | |
| Class A | | Net assets | | $ | 339,724,280 | |
| | Shares outstanding | | | 27,560,050 | |
| | Net asset value and offering price per share | | $ | 12.33 | |
| | |
| Class I (a) | | Net assets | | $ | 3,015 | |
| | Shares outstanding | | | 245 | |
| | Net asset value and offering price per share | | $ | 12.29 | (b) |
| | |
| Class Z | | Net assets | | $ | 2,479,454,669 | |
| | Shares outstanding | | | 201,750,129 | |
| | Net asset value and offering price per share | | $ | 12.29 | |
| (a) | Class I shares commenced operations on September 27, 2010. |
| (b) | Net asset value rounds to $12.29 per share due to fractional shares outstanding. |
See Accompanying Notes to Financial Statements.
17
Statement of Operations – Columbia Mid Cap Index Fund
For the Year Ended February 28, 2011
| | | | | | |
| | | | | ($) | |
Investment Income | | Dividends | | | 29,127,223 | |
| | Interest | | | 59,428 | |
| | | | | | |
| | Total Investment Income | | | 29,186,651 | |
| | |
Expenses | | Investment advisory fee | | | 2,282,121 | |
| | Administration fee | | | 2,142,120 | |
| | Distribution and service fees: | | | | |
| | Class A | | | 587,990 | |
| | Transfer agent fee: | | | | |
| | Class A and Class Z | | | 497,129 | |
| | Pricing and bookkeeping fees | | | 145,325 | |
| | Trustees’ fees | | | 55,590 | |
| | Custody fee | | | 67,152 | |
| | Chief compliance officer expenses | | | 3,154 | |
| | Other expenses | | | 510,963 | |
| | | | | | |
| | Total Expenses | | | 6,291,544 | |
| | |
| | Fees waived or expenses reimbursed by Investment Manager | | | (1,141,790 | ) |
| | Expense reductions | | | (148 | ) |
| | | | | | |
| | Net Expenses | | | 5,149,606 | |
| | |
| | | | | | |
| | Net Investment Income | | | 24,037,045 | |
| | |
Net Realized and Unrealized Gain (Loss) on Investments and Futures Contracts | | Net realized gain on: | | | | |
| | Investments | | | 102,452,311 | |
| | Futures contracts | | | 7,578,141 | |
| | | | | | |
| | Net realized gain | | | 110,030,452 | |
| | |
| | Net change in unrealized appreciation (depreciation) on: | | | | |
| | Investments | | | 529,588,229 | |
| | Futures contracts | | | 1,401,465 | |
| | | | | | |
| | Net change in unrealized appreciation (depreciation) | | | 530,989,694 | |
| | | | | | |
| | Net Gain | | | 641,020,146 | |
| | |
| | | | | | |
| | Net Increase Resulting from Operations | | | 665,057,191 | |
See Accompanying Notes to Financial Statements.
18
Statement of Changes in Net Assets – Columbia Mid Cap Index Fund
| | | | | | | | | | |
| | | | | Year Ended February 28, | |
| Increase (Decrease) in Net Assets | | | | 2011 ($)(a)(b) | | | 2010 ($) | |
| Operations | | Net investment income | | | 24,037,045 | | | | 21,504,888 | |
| | Net realized gain on investments and futures contracts | | | 110,030,452 | | | | 37,595,197 | |
| | Net change in unrealized appreciation (depreciation) on investments and futures contracts | | | 530,989,694 | | | | 681,132,574 | |
| | | | | | | | | | |
| | Net increase resulting from operations | | | 665,057,191 | | | | 740,232,659 | |
| | | |
Distributions to Shareholders | | From net investment income: | | | | | | | | |
| | Class A | | | (2,107,030 | ) | | | (1,420,519 | ) |
| | Class I | | | (26 | ) | | | — | |
| | Class Z | | | (21,678,975 | ) | | | (19,433,668 | ) |
| | From net realized gains: | | | | | | | | |
| | Class A | | | (1,223,725 | ) | | | — | |
| | Class I | | | (12 | ) | | | — | |
| | Class Z | | | (9,765,119 | ) | | | — | |
| | | | | | | | | | |
| | Total distributions to shareholders | | | (34,774,887 | ) | | | (20,854,187 | ) |
| | | |
| | Net Capital Stock Transactions | | | 229,495,259 | | | | 209,114,341 | |
| | | | | | | | | | |
| | Total increase in net assets | | | 859,777,563 | | | | 928,492,813 | |
| | | |
| Net Assets | | Beginning of period | | | 1,959,404,401 | | | | 1,030,911,588 | |
| | End of period | | | 2,819,181,964 | | | | 1,959,404,401 | |
| | Undistributed net investment income at end of period | | | 901,715 | | | | 650,701 | |
| (a) | Class I shares commenced operations on September 27, 2010. |
| (b) | Class I shares reflect activity for the period September 27, 2010 through February 28, 2011. |
See Accompanying Notes to Financial Statements.
19
Statement of Changes in Net Assets (continued) – Columbia Mid Cap Index Fund
| | | | | | | | | | | | | | | | |
| | | Capital Stock Activity | |
| | | Year Ended
February 28, 2011 (a)(b) | | | Year Ended
February 28, 2010 | |
| | | Shares | | | Dollars ($) | | | Shares | | | Dollars ($) | |
Class A | | | | | | | | | | | | | | | | |
Subscriptions | | | 17,066,820 | | | | 180,579,120 | | | | 12,078,503 | | | | 97,893,567 | |
Distributions reinvested | | | 284,194 | | | | 3,250,276 | | | | 157,418 | | | | 1,407,319 | |
Redemptions | | | (7,622,051 | ) | | | (80,137,504 | ) | | | (4,762,299 | ) | | | (38,843,152 | ) |
| | | | | | | | | | | | | | | | |
Net increase | | | 9,728,963 | | | | 103,691,892 | | | | 7,473,622 | | | | 60,457,734 | |
| | | | |
Class I | | | | | | | | | | | | | | | | |
Subscriptions | | | 245 | | | | 2,500 | | | | — | | | | — | |
| | | | | | | | | | | | | | | | |
Net increase | | | 245 | | | | 2,500 | | | | — | | | | — | |
| | | | |
Class Z | | | | | | | | | | | | | | | | |
Subscriptions | | | 47,413,396 | | | | 499,135,492 | | | | 55,867,583 | | | | 430,622,558 | |
Distributions reinvested | | | 1,768,997 | | | | 20,094,343 | | | | 1,281,976 | | | | 11,409,592 | |
Redemptions | | | (37,856,190 | ) | | | (393,428,968 | ) | | | (36,866,052 | ) | | | (293,375,543 | ) |
| | | | | | | | | | | | | | | | |
Net increase | | | 11,326,203 | | | | 125,800,867 | | | | 20,283,507 | | | | 148,656,607 | |
| (a) | Class I shares commenced operations on September 27, 2010. |
| (b) | Class I shares reflect activity for the period September 27, 2010 through February 28, 2011. |
See Accompanying Notes to Financial Statements.
20
Financial Highlights – Columbia Mid Cap Index Fund
Selected data for a share outstanding throughout each period is as follows:
| | | | | | | | | | | | | | | | | | | | | | | | |
| | | Year Ended February 28, | | | Year Ended
February 29, | | | Period Ended
February 28, | | | Year Ended
March 31, | |
| Class A Shares | | 2011 | | | 2010 | | | 2009 | | | 2008 | | | 2007 (a) | | | 2006 (b) | |
Net Asset Value, Beginning of Period | | $ | 9.44 | | | $ | 5.73 | | | $ | 10.86 | | | $ | 12.61 | | | $ | 12.49 | | | $ | 10.92 | |
| | | | | | |
Income from Investment Operations: | | | | | | | | | | | | | | | | | | | | | | | | |
Net investment income (c) | | | 0.09 | | | | 0.09 | | | | 0.12 | | | | 0.14 | | | | 0.12 | | | | 0.12 | |
Net realized and unrealized gain (loss) on investments and futures contracts | | | 2.94 | | | | 3.71 | | | | (4.55 | ) | | | (0.64 | ) | | | 0.64 | | | | 2.15 | |
| | | | | | | | | | | | | | | | | | | | | | | | |
Total from investment operations | | | 3.03 | | | | 3.80 | | | | (4.43 | ) | | | (0.50 | ) | | | 0.76 | | | | 2.27 | |
| | | | | | |
Less Distributions to Shareholders: | | | | | | | | | | | | | | | | | | | | | | | | |
From net investment income | | | (0.09 | ) | | | (0.09 | ) | | | (0.14 | ) | | | (0.12 | ) | | | (0.10 | ) | | | (0.12 | ) |
From net realized gains | | | (0.05 | ) | | | — | | | | (0.56 | ) | | | (1.13 | ) | | | (0.54 | ) | | | (0.58 | ) |
| | | | | | | | | | | | | | | | | | | | | | | | |
Total distributions to shareholders | | | (0.14 | ) | | | (0.09 | ) | | | (0.70 | ) | | | (1.25 | ) | | | (0.64 | ) | | | (0.70 | ) |
| | | | | | |
Net Asset Value, End of Period | | $ | 12.33 | | | $ | 9.44 | | | $ | 5.73 | | | $ | 10.86 | | | $ | 12.61 | | | $ | 12.49 | |
Total return (d)(e) | | | 32.16 | % | | | 66.35 | % | | | (42.11 | )% | | | (4.94 | )% | | | 6.61 | %(f)(g) | | | 21.37 | % |
| | | | | | |
Ratios to Average Net Assets/Supplemental Data: | | | | | | | | | | | | | | | | | | | | | | | | |
Net expenses before interest expense (h) | | | 0.45 | % | | | 0.43 | % | | | 0.39 | % | | | 0.39 | % | | | 0.39 | %(i) | | | 0.39 | % |
Interest expense | | | — | | | | — | | | | — | %(j) | | | — | | | | — | | | | — | %(j) |
Net expenses (h) | | | 0.45 | % | | | 0.43 | % | | | 0.39 | % | | | 0.39 | % | | | 0.39 | %(i) | | | 0.39 | % |
Waiver/Reimbursement | | | 0.05 | % | | | 0.06 | % | | | 0.10 | % | | | 0.08 | % | | | 0.09 | %(i) | | | 0.15 | %(k) |
Net investment income (h) | | | 0.83 | % | | | 1.10 | % | | | 1.36 | % | | | 1.13 | % | | | 1.08 | %(i) | | | 1.00 | % |
Portfolio turnover rate | | | 10 | % | | | 15 | % | | | 28 | % | | | 26 | % | | | 18 | %(f) | | | 24 | % |
Net assets, end of period (000s) | | $ | 339,724 | | | $ | 168,264 | | | $ | 59,374 | | | $ | 72,095 | | | $ | 49,555 | | | $ | 18,115 | |
| (a) | The Fund changed its fiscal year end from March 31 to February 28. Per share data and total return reflect activity from April 1, 2006 through February 28, 2007. |
| (b) | On August 22, 2005, the existing Investor A shares were renamed Class A shares. |
| (c) | Per share data was calculated using the average shares outstanding during the period. |
| (d) | Total return at net asset value assuming all distributions reinvested. |
| (e) | Had the Investment Manager and/or any of its affiliates not waived fees or reimbursed a portion of expenses, total return would have been reduced. |
| (g) | Total return includes a voluntary reimbursement by the Investment Manager for a realized investment loss due to a trading error. This reimbursement had an impact less than 0.01% on total return. |
| (h) | The benefits derived from expense reductions had an impact of less than 0.01%. |
| (j) | Rounds to less than 0.01%. |
| (k) | Bank of America Corporation assumed certain non-recurring costs. Absent these non-recurring costs, the waiver/reimbursement ratio would have been 0.09% for the year ended March 31, 2006. |
21
Financial Highlights – Columbia Mid Cap Index Fund
Selected data for a share outstanding throughout the period is as follows:
| | | | |
| Class I Shares | | Period Ended
February 28, 2011 (a) | |
Net Asset Value, Beginning of Period | | $ | 10.19 | |
| |
Income from Investment Operations: | | | | |
Net investment income (b) | | | 0.04 | |
Net realized and unrealized gain on investments and futures contracts | | | 2.22 | |
| | | | |
Total from investment operations | | | 2.26 | |
| |
Less Distributions to Shareholders: | | | | |
From net investment income | | | (0.11 | ) |
From net realized gains | | | (0.05 | ) |
| | | | |
Total distributions to shareholders | | | (0.16 | ) |
| |
Net Asset Value, End of Period | | $ | 12.29 | |
Total return (c)(d)(e) | | | 22.27 | % |
| |
Ratios to Average Net Assets/Supplemental Data: | | | | |
Net expenses (f)(g) | | | 0.19 | % |
Waiver/Reimbursement (g) | | | 0.04 | % |
Net investment income (f)(g) | | | 0.92 | % |
Portfolio turnover rate (e) | | | 10 | % |
Net assets, end of period (000s) | | $ | 3 | |
(a) Class I shares commenced operations on September 27, 2010. Per share data and total return reflect activity from that date.
| (b) | Per share data was calculated using the average shares outstanding during the period. |
| (c) | Total return at net asset value assuming all distributions reinvested. |
| (d) | Had the Investment Manager and/or any of its affiliates not waived fees or reimbursed a portion of expenses, total return would have been reduced. |
| (f) | The benefits derived from expense reductions had an impact of less than 0.01%. |
See Accompanying Notes to Financial Statements.
22
Financial Highlights – Columbia Mid Cap Index Fund
Selected data for a share outstanding throughout each period is as follows:
| | | | | | | | | | | | | | | | | | | | | | | | |
| | | Year Ended February 28, | | | Year Ended
February 29, | | | Period Ended
February 28, | | | Year Ended
March 31, | |
| Class Z Shares | | 2011 | | | 2010 | | | 2009 | | | 2008 | | | 2007 (a) | | | 2006 (b) | |
Net Asset Value, Beginning of Period | | $ | 9.41 | | | $ | 5.71 | | | $ | 10.84 | | | $ | 12.61 | | | $ | 12.52 | | | $ | 10.94 | |
| | | | | | |
Income from Investment Operations: | | | | | | | | | | | | | | | | | | | | | | | | |
Net investment income (c) | | | 0.11 | | | | 0.11 | | | | 0.15 | | | | 0.17 | | | | 0.14 | | | | 0.14 | |
Net realized and unrealized gain (loss) on investments and futures contracts | | | 2.93 | | | | 3.69 | | | | (4.55 | ) | | | (0.64 | ) | | | 0.64 | | | | 2.17 | |
| | | | | | | | | | | | | | | | | | | | | | | | |
Total from investment operations | | | 3.04 | | | | 3.80 | | | | (4.40 | ) | | | (0.47 | ) | | | 0.78 | | | | 2.31 | |
| | | | | | |
Less Distributions to Shareholders: | | | | | | | | | | | | | | | | | | | | | | | | |
From net investment income | | | (0.11 | ) | | | (0.10 | ) | | | (0.17 | ) | | | (0.17 | ) | | | (0.15 | ) | | | (0.15 | ) |
From net realized gains | | | (0.05 | ) | | | — | | | | (0.56 | ) | | | (1.13 | ) | | | (0.54 | ) | | | (0.58 | ) |
| | | | | | | | | | | | | | | | | | | | | | | | |
Total distributions to shareholders | | | (0.16 | ) | | | (0.10 | ) | | | (0.73 | ) | | | (1.30 | ) | | | (0.69 | ) | | | (0.73 | ) |
| | | | | | |
Net Asset Value, End of Period | | $ | 12.29 | | | $ | 9.41 | | | $ | 5.71 | | | $ | 10.84 | | | $ | 12.61 | | | $ | 12.52 | |
Total return (d)(e) | | | 32.45 | % | | | 66.71 | % | | | (41.92 | )% | | | (4.75 | )% | | | 6.82 | %(f)(g) | | | 21.71 | % |
| | | | | | |
Ratios to Average Net Assets/Supplemental Data: | | | | | | | | | | | | | | | | | | | | | | | | |
Net expenses before interest expense (h) | | | 0.20 | % | | | 0.18 | % | | | 0.14 | % | | | 0.14 | % | | | 0.14 | %(i) | | | 0.14 | % |
Interest expense | | | — | | | | — | | | | — | %(j) | | | — | | | | — | | | | — | %(j) |
Net expenses (h) | | | 0.20 | % | | | 0.18 | % | | | 0.14 | % | | | 0.14 | % | | | 0.14 | %(i) | | | 0.14 | % |
Waiver/Reimbursement | | | 0.05 | % | | | 0.06 | % | | | 0.10 | % | | | 0.08 | % | | | 0.09 | %(i) | | | 0.15 | %(k) |
Net investment income (h) | | | 1.08 | % | | | 1.36 | % | | | 1.59 | % | | | 1.38 | % | | | 1.30 | %(i) | | | 1.25 | % |
Portfolio turnover rate | | | 10 | % | | | 15 | % | | | 28 | % | | | 26 | % | | | 18 | %(g) | | | 24 | % |
Net assets, end of period (000s) | | $ | 2,479,455 | | | $ | 1,791,140 | | | $ | 971,538 | | | $ | 1,875,184 | | | $ | 2,033,709 | | | $ | 1,996,247 | |
| (a) | The Fund changed its fiscal year end from March 31 to February 28. Per share data and total return reflect activity from April 1, 2006 through February 28, 2007. |
| (b) | On August 22, 2005, the existing Primary A shares were renamed Class Z shares. |
| (c) | Per share data was calculated using the average shares outstanding during the period. |
| (d) | Total return at net asset value assuming all distributions reinvested. |
| (e) | Had the Investment Manager and/or any of its affiliates not waived fees or reimbursed a portion of expenses, total return would have been reduced. |
| (f) | Total return includes a voluntary reimbursement by the Investment Manager for a realized investment loss due to a trading error. This reimbursement had an impact of less than 0.01% on total return. |
| (h) | The benefits derived from expense reductions had an impact of less than 0.01%. |
| (j) | Rounds to less than 0.01%. |
| (k) | Bank of America Corporation assumed certain non-recurring costs. Absent these non-recurring costs, the waiver/reimbursement ratio would have been 0.09% for the year ended March 31, 2006. |
See Accompanying Notes to Financial Statements.
23
Notes to Financial Statements – Columbia Mid Cap Index Fund
February 28, 2011
Note 1. Organization
Columbia Mid Cap Index Fund (the Fund), a series of Columbia Funds Series Trust (the Trust), is a diversified fund. The Trust is registered under the Investment Company Act of 1940, as amended (the 1940 Act), as an open-end management investment company organized as a Delaware statutory trust.
Investment Objective
The Fund seeks total return before fees and expenses that corresponds to the total return of the Standard & Poor’s MidCap 400 Index.
Fund Shares
The Trust has unlimited authorized shares of beneficial interest. The Fund offers Class A, Class I and Class Z shares. All share classes have identical voting, dividend and liquidation rights. Each share class has its own expense structure and sales charges, as applicable.
Class A shares are not subject to sales charges.
Class I shares are not subject to sales charges and are available only to the Columbia Family of Funds. Class I shares became effective September 27, 2010.
Class Z shares are not subject to sales charges and are available only to certain investors, as described in the Fund’s prospectus.
Note 2. Summary of Significant Accounting Policies
The preparation of financial statements in accordance with U.S. generally accepted accounting principles (GAAP) requires the Investment Manager to make certain estimates and assumptions that affect the reported amounts of assets and liabilities, the disclosure of contingent assets and liabilities at the date of the financial statements and the reported amounts of revenue and expenses during the reporting period. Actual results could differ from those estimates.
The following is a summary of significant accounting policies consistently followed by the Fund in the preparation of its financial statements.
Security Valuation
Equity securities, exchange-traded funds and securities of certain investment companies are valued at the last sale price on the principal exchange on which they trade, except for securities traded on the NASDAQ, which are valued at the NASDAQ official close price. Unlisted securities or listed securities for which there were no sales during the day are valued at the closing bid price on such exchanges or over-the-counter markets.
Short-term investments maturing in 60 days or less are valued at amortized cost, which approximates market value.
Futures contracts are valued at the settlement price established each day by the board of trade or exchange on which they are traded.
Investments for which market quotations are not readily available, or that have quotations which the Investment Manager believes are not reliable, are valued at fair value as determined in good faith under consistently applied procedures established by and under the general supervision of the Board of Trustees. If a security is valued at fair value, such value is likely to be different from the last quoted market price for the security. The determination of fair value often requires significant judgment. To determine fair value, the Investment Manager may use assumptions including but not limited to future cash flows and estimated risk premiums. Multiple inputs from various sources may be used to determine value.
Derivative Instruments
The Fund may use derivative instruments including futures contracts in order to meet its investment objectives. The Fund employs strategies in differing combinations to permit it to increase, decrease or change the level of exposure to market risk factors. The achievement of any strategy relating to derivatives depends on an analysis of various risk factors, and if the strategies for the use of derivatives do not work as intended, the Fund may not achieve its investment objectives.
In pursuit of its investment objectives, the Fund is exposed to the following market risk, among others:
Equity Risk: Equity risk relates to change in value of equity securities such as common stocks due to general market conditions such as real or perceived adverse economic conditions, changes in the general outlook for corporate earnings, or adverse investor sentiment. Equity securities generally have greater price volatility than fixed income securities.
The following notes provides more detailed information about the derivative type held by the Fund:
Futures Contracts: The Fund entered into equity index futures contracts to equitize cash in order to maintain appropriate equity market exposure while keeping sufficient cash to accommodate daily redemptions.
24
Columbia Mid Cap Index Fund
February 28, 2011
The use of futures contracts involves certain risks, which include, among others: (1) imperfect correlation between the price movement of the instruments and the underlying securities, (2) inability to close out positions due to differing trading hours, or the temporary absence of a liquid market, for either the instruments or the underlying securities, and (3) an inaccurate prediction of the future direction of interest rates by the Fund’s Investment Manager. In addition, upon entering into index futures contracts, the Fund bears risks which may include securities prices moving unexpectedly, in which case, the Fund may not achieve the anticipated benefits of the futures contracts and may realize a loss.
Upon entering into a futures contract, the Fund identifies within its portfolio of investments cash or securities in an amount sufficient to meet the initial margin requirement. Subsequent payments are made or received by the Fund equal to the daily change in the contract value and are recorded as variation margin receivable or payable and offset in unrealized gains or losses. The Fund recognizes a realized gain or loss when the contract is closed or expires.
Futures contracts involve, to varying degrees, risk of loss in excess of the variation margin disclosed on the Statement of Assets and Liabilities.
During the year ended February 28, 2011, the Fund entered into 7,746 futures contracts.
Effect of Derivative Transactions in the Financial Statements
The following table is a summary of the value of the Fund’s derivative instruments as of February 28, 2011:
| | | | | | |
| Fair Value of Derivative Instruments |
| Statement of Assets and Liabilities |
| Assets | | Fair Value* | | Liabilities | | Fair Value* |
Futures
Variation
Margin | | $266,518 | | — | | $— |
| * | Includes the current day’s variation margin. |
The effect of derivative instruments on the Statement of Operations for the year ended February 28, 2011:
| | | | | | |
| | | | | | |
| | | Amount of Realized Gain and
Change in Unrealized Appreciation
(Depreciation) on Derivatives
Recognized in Income | |
Equity Risk | | Net
Realized
Gain | | Change in
Unrealized
Appreciation | |
Futures
Contracts | | $7,578,141 | | $ | 1,401,465 | |
Repurchase Agreements
The Fund may engage in repurchase agreement transactions with institutions that the Investment Manager has determined are creditworthy. The Fund, through the custodian, receives delivery of the underlying securities collateralizing a repurchase agreement. The Investment Manager is responsible for determining that the collateral is at least equal, at all times, to the value of the repurchase obligation including interest. A repurchase agreement transaction involves certain risks in the event of default or insolvency of the counterparty. These risks include possible delays in or restrictions on the Fund’s ability to dispose of the underlying securities and a possible decline in the value of the underlying securities during the period while the Fund seeks to assert its rights.
Security Transactions
Security transactions are accounted for on the trade date. Cost is determined and gains (losses) are based upon the specific identification method for both financial statement and federal income tax purposes.
Income Recognition
Interest income is recorded on the accrual basis.
Corporate actions and dividend income are recorded net of any non-reclaimable tax withholdings, on the ex-dividend date or upon receipt of ex-dividend notification in the case of certain foreign securities.
Awards from class action litigation are recorded as a reduction of cost if the Fund still owns the applicable securities on the payment date. If the Fund no longer owns the applicable securities, the proceeds are recorded as realized gains.
25
Columbia Mid Cap Index Fund
February 28, 2011
The Fund receives information regarding the character of distributions received from real estate investment trusts (REITs) on an annual basis. Distributions received from REITs are allocated among dividend income, capital gain and return of capital based upon such information or based on management’s estimates if actual information has not yet been reported. Management’s estimates are subsequently adjusted when the actual character of the distributions are disclosed by the REITs which could result in a proportionate increase in returns of capital to shareholders.
Distributions received from real estate investment trusts (REITs) in excess of their income are recorded as a reduction of the cost of the related investments. If the Fund no longer owns the applicable securities, any distributions received in excess of income are recorded as realized gains.
Expenses
General expenses of the Trust are allocated to the Fund and other series of the Trust based upon relative net assets or other expense allocation methodologies determined by the nature of the expense. Expenses directly attributable to a specific class of shares are charged to that share class. Expenses directly attributable to the Fund are charged to the Fund.
Determination of Class Net Asset Value
All income, expenses (other than class-specific expenses which are charged directly to a share class, as shown in the Statement of Operations) and realized and unrealized gains (losses) are allocated to each class of the Fund on a daily basis, based on the relative net assets of each class, for purposes of determining the net asset value of each class.
Federal Income Tax Status
The Fund intends to qualify each year as a regulated investment company under Subchapter M of the Internal Revenue Code, as amended, and will distribute substantially all of its taxable income, if any, for its tax year, and as such will not be subject to federal income taxes. In addition, the Fund intends to distribute in each calendar year substantially all of its net investment income, capital gains and certain other amounts, if any, such that the Fund should not be subject to federal excise tax. Therefore, no federal income or excise tax provision is recorded.
Distributions to Shareholders
Distributions from net investment income, if any, are declared and paid semi-annually. Net realized capital gains, if any, are distributed at least annually. Income distributions and capital gain distributions are determined in accordance with federal income tax regulations which differ from GAAP.
Indemnification
In the normal course of business, the Fund enters into contracts that contain a variety of representations and warranties and which provide general indemnities. The Fund’s maximum exposure under these arrangements is unknown because this would involve future claims against the Fund. Also, under the Trust’s organizational documents and by contract, the Trustees and officers of the Trust are indemnified against certain liabilities that may arise out of actions relating to their duties to the Trust. However, based on experience, the Fund expects the risk of loss due to these representations, warranties and indemnities to be minimal.
Note 3. Fees and Compensation Paid to Affiliates
Investment Management Services Fee
After the close of business on April 30, 2010, Ameriprise Financial, Inc. (Ameriprise Financial) acquired a portion of the asset management business of Columbia Management Group, LLC (the Transaction), including the business of managing the Fund. In connection with the closing of the Transaction (the Closing), RiverSource Investments, LLC, a wholly owned subsidiary of Ameriprise Financial, became the investment manager of the Fund and changed its name to Columbia Management Investment Advisers, LLC (the Investment Manager). The Investment Manager determines which securities will be purchased, held or sold. The management fee is based on the annual rate of 0.10% of the Fund’s average daily net assets.
Prior to the Closing, Columbia Management Advisors, LLC (Columbia), an indirect, wholly owned subsidiary of Bank of America Corporation (BOA), provided investment management services to the Fund under the same fee structure.
Administration Fee
Effective upon the Closing, the Investment Manager became the administrator of the Fund and provides administrative and other services to the Fund, including services previously performed under the Pricing and Bookkeeping Oversight and Services Agreement discussed below. The administration fee is based on the annual rate of 0.10% of the Fund’s average daily net assets, less the fees payable by the Fund as described under the Pricing and Bookkeeping Fees
26
Columbia Mid Cap Index Fund
February 28, 2011
note below. Prior to the Closing, Columbia provided administrative services to the Fund at the same fee rate.
Pricing and Bookkeeping Fees
Prior to the Closing, the Fund entered into a Financial Reporting Services Agreement (the Financial Reporting Services Agreement) with State Street Bank and Trust Company (State Street) and Columbia pursuant to which State Street provides financial reporting services to the Fund. The Fund also entered into an Accounting Services Agreement (collectively with the Financial Reporting Services Agreement, the State Street Agreements) with State Street and Columbia pursuant to which State Street provides accounting services to the Fund. Upon the Closing, Columbia assigned and delegated its rights and obligations under the State Street Agreements to the Investment Manager. Under the State Street Agreements, the Fund pays State Street an annual fee of $38,000 paid monthly plus an additional monthly fee based on an annualized percentage rate of average daily net assets of the Fund for the month. The aggregate fee will not exceed $140,000 per year (exclusive of out-of-pocket expenses and charges). The Fund also reimburses State Street for certain out-of-pocket expenses and charges.
Also prior to the Closing, the Fund entered into a Pricing and Bookkeeping Oversight and Services Agreement (the Services Agreement) with Columbia. Under the Services Agreement, Columbia provided services related to Fund expenses and the requirements of the Sarbanes-Oxley Act of 2002, and provided oversight of the accounting and financial reporting services provided by State Street. Under the Services Agreement, the Fund reimbursed Columbia for out-of-pocket expenses and charges, including fees payable to third parties, such as for pricing the Fund’s portfolio securities, incurred by Columbia in the performance of services under the Services Agreement. The Services Agreement was terminated upon the Closing. These services are now provided under the Administration Fee note discussed above.
Transfer Agent Fee
In connection with the Closing, RiverSource Service Corporation, a wholly owned subsidiary of Ameriprise Financial, became the transfer agent of the Fund and changed its name to Columbia Management Investment Services Corp. (the New Transfer Agent). The New Transfer Agent has contracted with Boston Financial Data Services (BFDS) to serve as sub-transfer agent. The New Transfer Agent receives monthly account-based service fees that vary by class and are based on the number of open accounts and asset-based fees, calculated based on assets held in omnibus accounts, which are intended to reimburse the New Transfer Agent for certain sub-transfer agent fees (exclusive of BFDS fees). The New Transfer Agent pays the fees of BFDS for services as sub-transfer agent and is not entitled to reimbursement for such fees from the Fund.
The New Transfer Agent receives reimbursement for certain out-of-pocket expenses and may also receive compensation for various shareholder services.
Prior to the Closing, Columbia Management Services, Inc., an affiliate of Columbia and an indirect, wholly owned subsidiary of BOA, provided shareholder services to the Fund and contracted with BFDS to serve as sub-transfer agent, under the same fee structure.
Class I shares do not pay transfer agent fees. For the year ended February 28, 2011, the Fund’s effective transfer agent fee rate for each class, with the exception of Class I shares, was 0.02% of the Fund’s average daily net assets.
An annual minimum account balance fee of $20 may apply to certain accounts with a value below the Fund’s initial minimum investment requirements to reduce the impact of small accounts on transfer agent fees. These minimum account balance fees are recorded as part of expense reductions on the Statement of Operations. For the year ended February 28, 2011, no minimum account balance fees were charged by the Fund.
Underwriting Discounts, Distribution and Shareholder Servicing Fees
In connection with the Closing, RiverSource Fund Distributors, Inc., an indirect wholly owned subsidiary of Ameriprise Financial, became the distributor of the Fund and changed its name to Columbia Management Investment Distributors, Inc. (the New Distributor).
The Trust has adopted a combined distribution and shareholder servicing plan for the Class A shares of the Fund at a maximum annual rate of 0.25% of the average daily net assets attributable to Class A shares of the Fund. The shareholder servicing plan permits the Fund to compensate or reimburse servicing agents for the shareholder services they have provided. The distribution plan, adopted pursuant to Rule 12b-1 under the 1940 Act, permits the Fund to compensate or reimburse the New Distributor and/or selling agents for activities or expenses primarily intended to result in the sale of the Class A shares of the Fund. Payments are made at an annual rate and paid monthly, as a percentage of average daily net assets, set from time to time by the Board of Trustees, and are
27
Columbia Mid Cap Index Fund
February 28, 2011
charged as expenses of the Fund directly to the Class A shares. A substantial portion of the expenses incurred pursuant to this plan is paid to affiliates of the New Distributor.
Prior to the Closing, Columbia Management Distributors, Inc, an affiliate of Columbia and an indirect, wholly owned subsidiary of BOA, was the principal underwriter of the Fund’s shares. There were no changes to the underwriting discount structure of the Fund or the service or distribution fee rates paid by the Fund as a result of the Transaction.
Expense Limits and Fee Waivers
Effective September 27, 2010, the Investment Manager has voluntarily agreed to reimburse a portion of the Fund’s expenses so that the Fund’s ordinary operating expenses (excluding any brokerage commissions, interest, taxes and extraordinary expenses, but including custodian charges relating to overdrafts, if any), after giving effect to any balance credits from the Fund’s custodian, do not exceed the annual rates of 0.45%, 0.19% and 0.20% of the Fund’s average daily net assets attributable to Class A, Class I and Class Z shares, respectively. This arrangement may be modified or terminated by the Investment Manager at any time.
For the period May 1, 2010 through September 26, 2010, the Investment Manager voluntarily agreed to reimburse a portion of the Fund’s expenses so that the Fund’s ordinary operating expenses (excluding any distribution and service fees, brokerage commissions, interest, taxes and extraordinary expenses, but including custodian charges relating to overdrafts, if any), after giving effect to any balance credits from the Fund’s custodian, did not exceed 0.20% annually of the Fund’s average daily net assets. Prior to May 1, 2010, Columbia voluntarily reimbursed a portion of the Fund’s expenses in the same manner.
Fees Paid to Officers and Trustees
Upon the Closing, all officers of the Fund are employees of the Investment Manager or its affiliates and, with the exception of the Fund’s Chief Compliance Officer, receive no compensation from the Fund. The Board of Trustees has appointed a Chief Compliance Officer to the Fund in accordance with federal securities regulations. The Fund, along with other affiliated funds, pays its pro-rata share of the expenses associated with the Chief Compliance Officer. The Fund’s expenses for the Chief Compliance Officer will not exceed $15,000 per year. Prior to the Closing, all officers of the Fund were employees of Columbia or its affiliates and the Fund paid its pro-rata share of the expenses for the Chief Compliance Officer under the same fee structure.
Trustees are compensated for their services to the Fund, as set forth on the Statement of Operations. The Trust’s eligible Trustees may participate in a non-qualified deferred compensation plan which may be terminated at any time. Any payments to plan participants are paid solely out of the Fund’s assets. Income earned on the plan participant’s deferral account is based on the rate of return of the eligible mutual funds selected by the participant or, if no funds are selected, on the rate of return of Columbia Money Market Fund (formerly known as RiverSource Cash Management Fund). Prior to the Closing, if no funds were selected, income earned on the plan participant’s deferral account was based on the rate of return of BofA Treasury Reserves. Trustees’ fees deferred during the current period as well as any gains or losses on the trustees’ deferred compensation balances as a result of market fluctuations are included in “Trustees’ fees” on the Statement of Operations. Liabilities under the deferred compensation plan are included in “Trustees’ fees” on the Statement of Assets and Liabilities.
Note 4. Custody Credits
The Fund has an agreement with its custodian bank under which custody fees may be reduced by balance credits. These credits are recorded as part of expense reductions on the Statement of Operations. The Fund could have invested a portion of the assets utilized in connection with the expense offset arrangement in an income-producing asset if it had not entered into such an agreement. For the year ended February 28, 2011, these custody credits reduced total expenses by $148 for the Fund.
Note 5. Portfolio Information
The cost of purchases and proceeds from sales of securities, excluding short-term obligations, aggregated $453,544,891 and $266,116,681, respectively, for the year ended February 28, 2011.
Note 6. Shareholder Concentration
As of February 28, 2011, three shareholder accounts owned 58.4% of the outstanding shares of the Fund. Purchase and redemption activity of these accounts may have a significant effect on the operations of the Fund.
Note 7. Line of Credit
The Fund and other affiliated funds participate in a $280,000,000 committed, unsecured revolving line of credit provided by State Street. The maximum amount that may be borrowed by any fund is limited to the lesser of $200,000,000 and the Fund’s borrowing limit set forth in the Fund’s registration statement. Borrowings are
28
Columbia Mid Cap Index Fund
February 28, 2011
available for short-term liquidity or temporary or emergency purposes.
Effective October 14, 2010, interest is charged to each participating fund based on the fund’s borrowings at a rate per annum equal to the greater of the Federal Funds Rate plus 1.25% or the overnight LIBOR Rate plus 1.25%. In addition, a commitment fee of 0.125% per annum is accrued and apportioned among the participating funds pro rata based on their relative net assets.
Prior to October 14, 2010, interest was charged to each participating fund at the same rates. In addition, a commitment fee of 0.15% per annum was accrued and apportioned among the participating funds pro rata based on their relative net assets.
For the year ended February 28, 2011, the Fund did not borrow under these arrangements.
Note 8. Federal Tax Information
The timing and character of income and capital gain distributions are determined in accordance with income tax regulations, which may differ from GAAP. Reclassifications are made to the Fund’s capital accounts for permanent tax differences to reflect income and gains available for distribution (or available capital loss carryforwards) under income tax regulations.
The tax character of distributions paid during the years ended February 28, 2011 and February 28, 2010 was as follows:
| | | | | | | | |
| | | February 28,
2011 | | | February 28,
2010 | |
| Distributions paid from: | | | | | | |
Ordinary Income* | | $ | 23,786,031 | | | $ | 20,854,187 | |
Long-Term Capital Gains | | | 10,988,856 | | | | — | |
| * | For tax purposes short-term capital gain distributions, if any, are considered ordinary income distributions. |
As of February 28, 2011, the components of distributable earnings on a tax basis were as follows:
| | | | |
| | | | | |
Undistributed
Ordinary Income | | Undistributed Long-Term Capital Gains | | Net Unrealized Appreciation* |
| $9,773,661 | | $57,720,889 | | $657,312,779 |
| * | The differences between book-basis and tax-basis net unrealized appreciation are primarily due to deferral of losses from wash sales. |
Unrealized appreciation and depreciation at February 28, 2011, based on cost of investments for federal income tax purposes were:
| | | | |
| | | | |
Unrealized appreciation | | $ | 813,453,937 | |
Unrealized depreciation | | | (156,141,158 | ) |
| | | | |
Net unrealized appreciation | | $ | 657,312,779 | |
Capital loss carryforwards of $31,857,274 were utilized during the year ended February 28, 2011.
Management is required to determine whether a tax position of the Fund is more likely than not to be sustained upon examination by the applicable taxing authority, including resolution of any related appeals or litigation processes, based on the technical merits of the position. The tax benefit to be recognized by the Fund is measured as the largest amount of benefit that is greater than fifty percent likely of being realized upon ultimate settlement. Management is not aware of any tax positions for which it is reasonably possible that the total amounts of unrecognized tax benefits will significantly change in the next twelve months. However, management’s conclusions may be subject to review and adjustment at a later date based on factors including, but not limited to, new tax laws, regulations, and administrative interpretations (including relevant court decisions). The Fund’s federal tax returns for the prior three fiscal years remain subject to examination by the Internal Revenue Service.
Note 9. Subsequent Events
Management has evaluated the events and transactions that have occurred through the date the financial statements were issued and noted no items requiring adjustment of the financial statements or additional disclosure.
Note 10. Information Regarding Pending and Settled Legal Proceedings
In June 2004, an action captioned John E. Gallus et al. v. American Express Financial Corp. and American Express Financial Advisors Inc. was filed in the United States District Court for the District of Arizona. The plaintiffs allege that they are investors in several American Express Company (now known as RiverSource) mutual funds and they purport to bring the action derivatively on behalf of those funds under the Investment Company Act of 1940. The plaintiffs allege that fees allegedly paid to the defendants by the funds for investment advisory and administrative services are excessive. The plaintiffs seek remedies including restitution and rescission of investment advisory and distribution agreements. The
29
Columbia Mid Cap Index Fund
February 28, 2011
plaintiffs voluntarily agreed to transfer this case to the United States District Court for the District of Minnesota (the District Court). In response to defendants’ motion to dismiss the complaint, the District Court dismissed one of plaintiffs’ four claims and granted plaintiffs limited discovery. Defendants moved for summary judgment in April 2007. Summary judgment was granted in the defendants’ favor on July 9, 2007. The plaintiffs filed a notice of appeal with the Eighth Circuit Court of Appeals (the Eighth Circuit) on August 8, 2007. On April 8, 2009, the Eighth Circuit reversed summary judgment and remanded to the District Court for further proceedings. On August 6, 2009, defendants filed a writ of certiorari with the U.S. Supreme Court (the Supreme Court), asking the Supreme Court to stay the District Court proceedings while the Supreme Court considers and rules in a case captioned Jones v. Harris Associates, which involves issues of law similar to those presented in the Gallus case. On March 30, 2010, the Supreme Court issued its ruling in Jones v. Harris Associates, and on April 5, 2010, the Supreme Court vacated the Eighth Circuit’s decision in the Gallus case and remanded the case to the Eighth Circuit for further consideration in light of the Supreme Court’s decision in Jones v. Harris Associates. On June 4, 2010, the Eighth Circuit remanded the Gallus case to the District Court for further consideration in light of the Supreme Court’s decision in Jones v. Harris Associates. On December 9, 2010, the District Court reinstated its July 9, 2007 summary judgment order in favor of the defendants. On January 10, 2011, plaintiffs filed a notice of appeal with the Eighth Circuit.
In December 2005, without admitting or denying the allegations, American Express Financial Corporation (AEFC, which is now known as Ameriprise Financial, Inc. (Ameriprise Financial)), entered into settlement agreements with the Securities and Exchange Commission (SEC) and Minnesota Department of Commerce (MDOC) related to market timing activities. As a result, AEFC was censured and ordered to cease and desist from committing or causing any violations of certain provisions of the Investment Advisers Act of 1940, the Investment Company Act of 1940, and various Minnesota laws. AEFC agreed to pay disgorgement of $10 million and civil money penalties of $7 million. AEFC also agreed to retain an independent distribution consultant to assist in developing a plan for distribution of all disgorgement and civil penalties ordered by the SEC in accordance with various undertakings detailed at http://www.sec.gov/litigation/admin/ia-2451.pdf. Ameriprise Financial and its affiliates have cooperated with the SEC and the MDOC in these legal proceedings, and have made regular reports to funds’ Boards of Directors/Trustees.
Ameriprise Financial and certain of its affiliates have historically been involved in a number of legal, arbitration and regulatory proceedings, including routine litigation, class actions, and governmental actions, concerning matters arising in connection with the conduct of their business activities. Ameriprise Financial believes that the Funds are not currently the subject of, and that neither Ameriprise Financial nor any of its affiliates are the subject of, any pending legal, arbitration or regulatory proceedings that are likely to have a material adverse effect on the Funds or the ability of Ameriprise Financial or its affiliates to perform under their contracts with the Funds. Ameriprise Financial is required to make 10-Q, 10-K and, as necessary, 8-K filings with the Securities and Exchange Commission on legal and regulatory matters that relate to Ameriprise Financial and its affiliates. Copies of these filings may be obtained by accessing the SEC website at www.sec.gov.
There can be no assurance that these matters, or the adverse publicity associated with them, will not result in increased fund redemptions, reduced sale of fund shares or other adverse consequences to the Funds. Further, although we believe proceedings are not likely to have a material adverse effect on the Funds or the ability of Ameriprise Financial or its affiliates to perform under their contracts with the Funds, these proceedings are subject to uncertainties and, as such, we are unable to estimate the possible loss or range of loss that may result. An adverse outcome in one or more of these proceedings could result in adverse judgments, settlements, fines, penalties or other relief that could have a material adverse effect on the consolidated financial condition or results of operations of Ameriprise Financial.
30
Report of Independent Registered Public Accounting Firm
To the Trustees of Columbia Funds Series Trust and the Shareholders of Columbia Mid Cap Index Fund
In our opinion, the accompanying statement of assets and liabilities, including the investment portfolio, and the related statements of operations and of changes in net assets and the financial highlights present fairly, in all material respects, the financial position of Columbia Mid Cap Index Fund (the “Fund”) (a series of Columbia Funds Series Trust) at February 28, 2011, the results of its operations for the year then ended, the changes in its net assets for each of the two years in the period then ended, and the financial highlights for each of the periods indicated, in conformity with accounting principles generally accepted in the United States of America. These financial statements and financial highlights (hereafter referred to as “financial statements”) are the responsibility of the Fund’s management. Our responsibility is to express an opinion on these financial statements based on our audits. We conducted our audits of these financial statements in accordance with the standards of the Public Company Accounting Oversight Board (United States). Those standards require that we plan and perform the audit to obtain reasonable assurance about whether the financial statements are free of material misstatement. An audit includes examining, on a test basis, evidence supporting the amounts and disclosures in the financial statements, assessing the accounting principles used and significant estimates made by management, and evaluating the overall financial statement presentation. We believe that our audits, which included confirmation of securities at February 28, 2011 by correspondence with the custodian and brokers, provide a reasonable basis for our opinion.
PricewaterhouseCoopers LLP
Boston, Massachusetts
April 21, 2011
31
Federal Income Tax Information (Unaudited) – Columbia Mid Cap Index Fund
February 28, 2011
The Fund hereby designates as a capital gain dividend with respect to the fiscal year ended February 28, 2011, $72,145,232, or, if subsequently determined to be different, the net capital gain of such year.
74.01% of the ordinary income distributed by the Fund for the fiscal year ended February 28, 2011, qualifies for the corporate dividends received deduction.
For non-corporate shareholders 74.03%, or the maximum amount allowable under the Jobs and Growth Tax Relief Reconciliation Act of 2003, of ordinary income distributed by the Fund for the fiscal year ended February 28, 2011 may represent qualified dividend income.
The Fund will notify shareholders in January 2012 of amounts for use in preparing 2011 income tax returns.
32
Fund Governance
The Trustees serve terms of indefinite duration. The names, addresses and ages of the Trustees and officers of the Funds of Columbia Funds Series Trust, the year each was first elected or appointed to office, their principal business occupations during at least the last five years, the number of Funds overseen by each Trustee and other directorships they hold are shown below. Each officer listed below serves as an officer of each Fund in the Columbia Funds Series Trust.
Independent Trustees
| | |
Name, Address and Age, Position
with Funds, Year First Elected or
Appointed to Office | | Principal Occupation(s) During Past Five Years, Number of Funds in the Columbia
Funds Complex Overseen by Trustee, Other Directorships Held |
| |
| Edward J. Boudreau (Born 1944) | | |
c/o Columbia Management Investment Advisers, LLC 225 Franklin Street Boston, MA 02110 Trustee (since 2005) | | Managing Director–E.J. Boudreau & Associates (consulting), from 2000 through current; oversees 44; Trustee–BofA Funds Series Trust. |
| |
| William P. Carmichael (Born 1943) | | |
c/o Columbia Management Investment Advisers, LLC 225 Franklin Street Boston, MA 02110 Trustee (since 1999) | | Retired. Oversees 44; Director–Cobra Electronics Corporation (electronic equipment manufacturer); Director–McMoRan Exploration Company (oil and gas exploration and development); Director–The Finish Line (athletic shoes and apparel); Trustee–BofA Funds Series Trust; Former Director–Simmons Company (bedding). |
| |
| William A. Hawkins (Born 1942) | | |
c/o Columbia Management Investment Advisers, LLC 225 Franklin Street Boston, MA 02110 Trustee (since 2005) | | Managing Director—Overton Partners (financial consulting), August 2010 to present; President and Chief Executive Officer—California General Bank, N.A., from January 2008 through August 2010; oversees 44; Trustee—BofA Funds Series Trust. |
| |
| R. Glenn Hilliard (Born 1943) | | |
c/o Columbia Management Investment Advisers, LLC 225 Franklin Street Boston, MA 02110 Trustee (since 2005) | | Chairman and Chief Executive Officer–Hilliard Group LLC (investing and consulting), from April 2003 through current; Non-Executive Director & Chairman–CNO Financial Inc. (formerly Conseco Inc.) (insurance), September 2003 through current; Executive Chairman–Conseco, Inc. (insurance), August 2004 through September 2005; oversees 44; Trustee–BofA Funds Series Trust. |
| |
| John J. Nagorniak (Born 1944) | | |
c/o Columbia Management Investment Advisers, LLC 225 Franklin Street Boston, MA 02110 Trustee (since 2008) | | Retired. President and Director–Foxstone Financial, Inc. (consulting), 2000 through December 2007; Director–Mellon Financial Corporation affiliates (investing), 2000 through 2007; Chairman–Franklin Portfolio Associates (investing–Mellon affiliate), 1982 through 2007; oversees 44; Director–MIT Investment Company; Trustee–MIT 401k Plan. |
| |
| Minor M. Shaw (Born 1947) | | |
c/o Columbia Management Investment Advisers, LLC 225 Franklin Street Boston, MA 02110 Trustee (since 2003) | | President–Micco Corporation and Mickel Investment Group; oversees 44; Board Member–Piedmont Natural Gas; Trustee–BofA Funds Series Trust. |
33
Fund Governance (continued)
Interested Trustee (continued)
| | |
Name, Address and Age, Position
with Funds, Year First Elected or
Appointed to Office | | Principal Occupation(s) During Past Five Years, Number of Funds in the Columbia
Funds Complex Overseen by Trustee, Other Directorships Held |
|
| Anthony M. Santomero1 (Born 1946) |
c/o Columbia Management Investment Advisers, LLC 225 Franklin Street Boston, MA 02110 Trustee (since 2008) | | Richard K. Mellon Professor Emeritus of Finance, The Wharton School, University of Pennsylvania, from 2002 through current; Senior Advisor–McKinsey & Company (consulting), July 2006 through January 2008; President and Chief Executive Officer–Federal Reserve Bank of Philadelphia, July 2000 through April 2006; oversees 44; Director–Renaissance Reinsurance Ltd; Trustee–Penn Mutual Life Insurance Company; Director–Citigroup, Inc.; Citibank, N.A.; Trustee–BofA Funds Series Trust. |
| 1 | Dr. Santomero is currently deemed by the Columbia Funds to be an “interested person” (as defined in the 1940 Act) of the Funds because he serves as a Director of Citigroup, Inc. and Citibank, N.A., companies that may directly or through its subsidiaries and affiliates may engage from time-to-time in brokerage execution, principal transactions and lending relationships with the Columbia Funds or other funds or accounts advised/managed by the Advisor. |
The Statement of Additional Information includes additional information about the Trustees of the Funds and is available, without charge, upon request by calling 800-345-6611.
34
Fund Governance (continued)
Officers
| | |
| Name, Year of Birth and Address | | Principal Occupation(s) During Past Five Years |
| |
| J. Kevin Connaughton (Born 1964) | | |
225 Franklin Street Boston, MA 02110 President (since 2009) | | Senior Vice President and General Manager–Mutual Fund Products, Columbia Management Investment Advisers, LLC since May 2010; President, Columbia Funds, since 2009, and RiverSource Funds, since May 2010 (previously Senior Vice President and Chief Financial Officer, Columbia Funds, from June 2008 to January 2009, Treasurer, Columbia Funds, from October 2003 to May 2008, and senior officer of various other affiliated funds since 2000); Managing Director, Columbia Management Advisors, LLC from December 2004 to April 2010. |
| |
| Michael G. Clarke (Born 1969) | | |
225 Franklin Street Boston, MA 02110 Senior Vice President and Chief Financial Officer
(since 2009) | | Vice President, Columbia Management Investment Advisers, LLC since May 2010; Managing Director of Fund Administration, Columbia Management Advisors, LLC, from September 2004 to April 2010; senior officer of Columbia Funds and affiliated funds since 2002. |
| |
| Scott R. Plummer (Born 1959) | | |
5228 Ameriprise Financial Center Minneapolis, MN 55474 Senior Vice President, Secretary and Chief Legal Officer (since 2010) | | Chief Legal Officer and Assistant Secretary, Columbia Management Investment Advisers, LLC since June 2005; Vice President and Lead Chief Counsel–Asset Management, Ameriprise Financial, Inc. since May 2010 (previously Vice President and Chief Counsel–Asset Management, from 2005 to April 2010, and Vice President–Asset Management Compliance from 2004 to 2005); Vice President, Chief Counsel and Assistant Secretary, Columbia Management Investment Distributors, Inc. since 2008; Vice President, General Counsel and Secretary, Ameriprise Certificate Company since 2005; Chief Counsel, RiverSource Distributors, Inc. since 2006; Vice President, General Counsel and Secretary, RiverSource Funds, since December 2006; Senior Vice President, Secretary and Chief Legal Officer, Columbia Funds, since May 2010. |
| |
| Linda J. Wondrack (Born 1964) | | |
225 Franklin Street Boston, MA 02110 Senior Vice President and Chief Compliance Officer (since 2007) | | Vice President and Chief Compliance Officer, Columbia Management Investment Advisers, LLC since May 2010; Chief Compliance Officer, Columbia Funds, since 2007, and RiverSource Funds, since May 2010; Director (Columbia Management Group, LLC and Investment Product Group Compliance), Bank of America, from June 2005 to April 2010. |
| |
| William F. Truscott (Born 1960) | | |
53600 Ameriprise Financial Center Minneapolis, MN 55474 Senior Vice President (since 2010) | | Chairman of the Board, Columbia Management Investment Advisers, LLC since May 2010 (previously President, Chairman of the Board and Chief Investment Officer, from 2001 to April 2010); Chief Executive Officer, U.S. Asset Management & President, Annuities, Ameriprise Financial, Inc. since May 2010 (previously President–U.S. Asset Management and Chief Investment Officer from 2005 to April 2010, and Senior Vice President–Chief Investment Officer, from 2001 to 2005); Director, President and Chief Executive Officer, Ameriprise Certificate Company since 2006; Director, Columbia Management Investment Distributors, Inc. since May 2010 (previously Chairman of the Board and Chief Executive Officer from 2008 to April 2010); Chairman of the Board and Chief Executive Officer, RiverSource Distributors, Inc. since 2006. |
| |
| Colin Moore (Born 1958) | | |
225 Franklin Street Boston, MA 02110 Senior Vice President (since 2010) | | Director and Chief Investment Officer, Columbia Management Investment Advisers, LLC since May 2010; Manager, Managing Director and Chief Investment Officer of Columbia Management Advisors, LLC from 2007 to April 2010; Head of Equities, Columbia Management Advisors, LLC from 2002 to 2007. |
35
Fund Governance (continued)
Officers (continued)
| | |
| Name, Year of Birth and Address | | Principal Occupation(s) During Past Five Years |
| |
| Michael A. Jones ( Born 1959) | | |
225 Franklin Street Boston, MA 02110 Senior Vice President (since 2010) | | President and Director, Columbia Management Investment Advisers, LLC since May 2010; President and Director, Columbia Management Investment Distributors, Inc. since May 2010; Manager, Chairman, Chief Executive Officer and President, Columbia Management Advisors, LLC from 2007 to April 2010; Chief Executive Officer, President and Director, Columbia Management Distributors, Inc. from November 2006 to April 2010; previously, co-president and senior managing director at Robeco Investment Management. |
| |
| Amy Johnson (Born 1965) | | |
5228 Ameriprise Financial Center Minneapolis, MN 55474 Senior Vice President (since 2010) | | Senior Vice President and Chief Operating Officer, Columbia Management Investment Advisers, LLC since May 2010 (previously Chief Administrative Officer, from 2009 until April 2010, Vice President–Asset Management and Trust Company Services, from 2006 to 2009, and Vice President–Operations and Compliance from 2004 to 2006). |
| |
| Joseph F. DiMaria (Born 1968) | | |
225 Franklin Street Boston, MA 02110 Treasurer (since 2010) and Chief Accounting Officer (since 2008) | | Vice President, Mutual Fund Administration, Columbia Management Investment Advisers, LLC, since May 2010; Director of Fund Administration, Columbia Management Advisors, LLC from January 2006 to April 2010; Head of Tax/Compliance and Assistant Treasurer, Columbia Management Advisors, LLC, from November 2004 to December 2005. |
| |
| Marybeth Pilat (Born 1968) | | |
225 Franklin Street Boston, MA 02110 Deputy Treasurer (since 2010) | | Vice President, Mutual Fund Administration, Columbia Management Investment Advisers, LLC, since May 2010; Vice President, Investment Operations, Bank of America, from October 2008 to April 2010; Finance Manager, Boston Children’s Hospital from August 2008 to October 2008; Director, Mutual Fund Administration, Columbia Management Advisors, LLC, from May 2007 to July 2008; Vice President, Mutual Fund Valuation, Columbia Management Advisors, LLC, from January 2006 to May 2007; Vice President, Mutual Fund Accounting Oversight, Columbia Management Advisors, LLC from January 2005 to January 2006. |
| |
| Jullan Quero (Born 1967) | | |
225 Franklin Street Boston, MA 02110 Deputy Treasurer (since 2008) | | Vice President, Mutual Fund Administration, Columbia Management Investment Advisers, LLC since May 2010; Director of Fund Administration, Columbia Management Advisors, LLC, from August 2008 to April 2010; Senior Tax Manager, Columbia Management Advisors, LLC from August 2006 to July 2008; Senior Compliance Manager, Columbia Management Advisors, LLC from April 2002 to August 2006. |
| |
| Stephen T. Welsh (Born 1957) | | |
225 Franklin Street Boston, MA 02110 Vice President (since 2006) | | President, Columbia Management Investment Services Corp. since May 2010; President and Director, Columbia Management Services, Inc. from July 2004 to April 2010; Managing Director, Columbia Management Distributors, Inc. from August 2007 to April 2010. |
36
Shareholder Meeting Results
At a Joint Special Meeting of Shareholders held on February 15, 2011, shareholders of the series of Columbia Funds Series Trust, including the Fund, elected each of the nominees for trustees to the Board of Trustees of Columbia Funds Series Trust, each to hold office for an indefinite term, as follows:
| | | | | | |
| | | | | | | |
| Trustee | | Votes For | | Votes Withheld | | Abstentions |
| Kathleen Blatz | | 2,145,636,122 | | 248,012,438 | | 0 |
| Edward J. Boudreau, Jr. | | 2,145,430,114 | | 248,218,446 | | 0 |
| Pamela G. Carlton | | 2,145,515,949 | | 248,132,612 | | 0 |
| William P. Carmichael | | 2,145,038,695 | | 248,609,866 | | 0 |
| Patricia M. Flynn | | 2,145,843,563 | | 247,804,997 | | 0 |
| William A. Hawkins | | 2,145,359,401 | | 248,289,160 | | 0 |
| R. Glenn Hilliard | | 2,145,079,400 | | 248,569,161 | | 0 |
| Stephen R. Lewis, Jr. | | 2,145,092,209 | | 248,556,351 | | 0 |
| John F. Maher | | 2,145,621,338 | | 248,027,223 | | 0 |
| John J. Nagorniak | | 2,145,337,494 | | 248,311,067 | | 0 |
| Catherine James Paglia | | 2,145,615,254 | | 248,033,306 | | 0 |
| Leroy C. Richie | | 2,145,042,120 | | 248,606,441 | | 0 |
| Anthony M. Santomero | | 2,145,088,174 | | 248,560,386 | | 0 |
| Minor M. Shaw | | 2,145,430,762 | | 248,217,798 | | 0 |
| Alison Taunton-Rigby | | 2,145,393,384 | | 248,255,177 | | 0 |
| William F. Truscott | | 2,144,907,223 | | 248,741,338 | | 0 |
37
[THIS PAGE INTENTIONALLY LEFT BLANK]
38
[THIS PAGE INTENTIONALLY LEFT BLANK]
39
[THIS PAGE INTENTIONALLY LEFT BLANK]
40
Important Information About This Report
The fund mails one shareholder report to each shareholder address. If you would like more than one report, please call shareholder services at 1-800-345-6611 and additional reports will be sent to you. This report has been prepared for shareholders of Columbia Mid Cap Index Fund.
A description of the policies and procedures that the fund uses to determine how to vote proxies and a copy of the fund’s voting records are available (i) at www.columbiamanagement.com, (ii) on the Securities and Exchange Commission’s website at www.sec.gov, and (iii) without charge, upon request, by calling 1-800-368-0346. Information regarding how the fund voted proxies relating to portfolio securities during the 12-month period ended June 30 is available from the SEC’s website. Information regarding how the fund voted proxies relating to portfolio securities is also available from the fund’s website, www.columbiamanagement.com.
The fund files a complete schedule of portfolio holdings with the SEC for the first and third quarters of each fiscal year on Form N-Q. The fund’s Form N-Q is available on the SEC’s website at www.sec.gov and may be reviewed and copied at the SEC’s Public Reference Room in Washington, D.C. Information on the operation of the Public Reference Room may be obtained by calling
1-800-SEC-0330.
Transfer Agent
Columbia Management Investment Services Corp.
P.O. Box 8081
Boston, MA 02266-8081
1-800-345-6611
Distributor
Columbia Management Investment
Distributors, Inc.
225 Franklin Street
Boston, MA 02110
Investment Manager
Columbia Management Investment Advisers, LLC
225 Franklin Street
Boston, MA 02110
41

Columbia Mid Cap Index Fund
P.O. Box 8081
Boston, MA 02266-8081
columbiamanagement.com
This information is for use with concurrent or prior delivery of a fund prospectus. Investors should consider the investment objectives, risks, charges and expenses of a mutual fund carefully before investing. For a free prospectus, which contains this and other important information about the funds, visit columbiamanagement.com. Read the prospectus carefully before investing. The Fund is distributed by Columbia Management Investment Distributors, Inc., member FINRA, and managed by Columbia Management Investment Advisers, LLC.
©2011 Columbia Management Investment Advisers, LLC. All rights reserved.
C-1691 A (04/11)
Item 2. Code of Ethics.
(a) The registrant has adopted a code of ethics that applies to the registrant’s principal executive officer, principal financial officer, principal accounting officer or controller, or persons performing similar functions, regardless of whether these individuals are employed by the registrant or a third party.
(b) During the period covered by this report, there were not any amendments to a provision of the code of ethics adopted in 2(a) above.
(c) During the period covered by this report, there were no waivers, including any implicit waivers, from a provision of the code of ethics described in 2(a) above that relates to one or more of the items set forth in paragraph (b) of this item’s instructions.
Item 3. Audit Committee Financial Expert.
The registrant’s Board of Trustees has determined that William P. Carmichael qualifies as an audit committee financial expert, as defined in Item 3 of Form N-CSR and is “independent” (as defined in Item 3 of Form N-CSR).
Item 4. Principal Accountant Fees and Services.
Fee information below is disclosed for the nineteen series of the registrant whose report to stockholders are included in this annual filing.
(a) Audit Fees. Aggregate Audit Fees billed by the principal accountant for professional services rendered during the fiscal years ended February 28, 2011 and February 28, 2010 are approximately as follows:
2011 | | 2010 | |
$ | 588,600 | | $ | 646,500 | |
| | | | | |
Audit Fees include amounts related to the audit of the registrant’s annual financial statements or services that are normally provided by the accountant in connection with statutory and regulatory filings or engagements for those fiscal years. Fiscal year 2011 and 2010 also include audit fees for the review and provision of consent in connection with filing Form N-1A for new share classes.
(b) Audit-Related Fees. Aggregate Audit-Related Fees billed to the registrant by the principal accountant for professional services rendered during the fiscal years ended February 28, 2011 and February 28, 2010 are approximately as follows:
2011 | | 2010 | |
$ | 121,700 | | $ | 87,400 | |
| | | | | |
Audit-Related Fees include amounts for assurance and related services by the principal accountant that are reasonably related to the performance of the audit of the registrant’s financial statements and are not reported in Audit Fees above. In both fiscal years 2011 and 2010, Audit-Related Fees consist of agreed-upon procedures performed for semi-annual shareholder reports. Fiscal year 2011 also includes Audit-Related Fees for agreed- upon procedures related to fund mergers.
During the fiscal years ended February 28, 2011 and February 28, 2010, there were no Audit-Related Fees billed by the registrant’s principal accountant to the registrant’s investment adviser (not including any sub-adviser whose role is primarily portfolio management and is subcontracted with or overseen by another investment adviser) and any entity controlling, controlled by, or under common control with the adviser that provides ongoing services to the registrant for an engagement that related directly to the operations and financial reporting of the registrant.
(c) Tax Fees. Aggregate Tax Fees billed by the principal accountant to the registrant for professional services rendered during the fiscal years ended February 28, 2011 and February 28, 2010 are approximately as follows:
2011 | | 2010 | |
$ | 85,200 | | $ | 83,300 | |
| | | | | |
Tax Fees include amounts for the review of annual tax returns, the review of required shareholder distribution calculations and typically include amounts for professional services by the principal accountant for tax compliance, tax advice and tax planning. In fiscal year 2010, Tax Fees also include the review of foreign tax filings.
During the fiscal years ended February 28, 2011 and February 28, 2010, there were no Tax Fees billed by the registrant’s principal accountant to the registrant’s investment adviser (not including any sub-adviser whose role is primarily portfolio management and is subcontracted with or overseen by another investment adviser) and any entity controlling, controlled by, or under common control with the adviser that provides ongoing services to the registrant for an engagement that related directly to the operations and financial reporting of the registrant.
(d) All Other Fees. Aggregate All Other Fees billed by the principal accountant to the registrant for professional services rendered during the fiscal years ended February 28, 2011 and February 28, 2010 are approximately as follows:
All Other Fees include amounts for products and services provided by the principal accountant, other than the services reported in paragraphs (a) through (c) above.
Aggregate All Other Fees billed by the registrant’s principal accountant to the registrant’s investment adviser (not including any sub-adviser whose role is primarily portfolio management and is subcontracted with or overseen by another investment adviser) and any entity controlling, controlled by, or under common control with the adviser that provides ongoing services to the registrant for an engagement that related directly to the operations and financial reporting of the registrant during the fiscal years ended February 28, 2011 and February 28, 2010 are approximately as follows:
2011 | | 2010 | |
$ | 875,300 | | $ | 1,119,400 | |
| | | | | |
In both fiscal years 2011 and 2010, All Other Fees consist of fees billed for internal control examinations of the registrant’s transfer agent and investment advisor. Fiscal year 2010 also includes fees for agreed upon procedures related to the sale of the long-term asset management business. Fiscal year 2011 also includes fees related to the review of revenue modeling schedules.
(e)(1) Audit Committee Pre-Approval Policies and Procedures
The registrant’s Audit Committee is required to pre-approve the engagement of the registrant’s independent accountants to provide audit and non-audit services to the registrant and non-audit services to its investment adviser (not including any sub-adviser whose role is primarily portfolio management and is subcontracted with or overseen by another investment adviser) or any entity controlling, controlled by or under common control with such investment adviser that provides ongoing services to the registrant (“Adviser Affiliates”), if the engagement relates directly to the operations and financial reporting of the registrant.
The Audit Committee has adopted a Policy for Engagement of Independent Accountants for Audit and Non-Audit Services (“Policy”). The Policy sets forth the understanding of the Audit Committee regarding the engagement of the registrant’s independent accountants to provide (i) audit and permissible audit-related, tax and other services to the registrant (collectively “Fund Services”); (ii) non-audit services to the registrant’s investment adviser (not including any sub-adviser whose role is primarily portfolio management and is subcontracted with or overseen by another investment adviser) and Adviser Affiliates, if the engagement relates directly to the operations or financial reporting of a Fund (collectively “Fund-related Adviser Services”); and (iii) certain other audit and non-audit services to the registrant’s investment adviser (not including any sub-adviser whose role is primarily portfolio management and is
subcontracted with or overseen by another investment adviser) and Adviser Affiliates. Unless a type of service receives general pre-approval under the Policy, it requires specific pre-approval by the Audit Committee if it is to be provided by the independent accountants. Pre-approval of non-audit services to the registrant, the registrant’s investment adviser (not including any sub-adviser whose role is primarily portfolio management and is subcontracted with or overseen by another investment adviser) and Adviser Affiliates may be waived provided that the “de minimis” requirements set forth under paragraph (c)(7)(i)(C) of Rule 2-01 of Regulation S-X are met.
Under the Policy, the Audit Committee may delegate pre-approval authority to any pre-designated member or members who are Independent Trustees/Directors. The member(s) to whom such authority is delegated must report, for informational purposes only, any pre-approval decisions to the Audit Committee at its next regular meeting. The Audit Committee’s responsibilities with respect to the pre-approval of services performed by the independent accountants may not be delegated to management.
The Policy requires the Fund Treasurer and/or Director of Board Administration to submit to the Audit Committee, on an annual basis, a schedule of the types of services that are subject to general pre-approval. The schedule(s) provide a description of each type of service that is subject to general pre-approval and, where possible, will provide estimated fee caps for each instance of providing each service. The Audit Committees will review and approve the types of services and review the projected fees for the next fiscal year and may add to, or subtract from, the list of general pre-approved services from time to time based on subsequent determinations. That approval acknowledges that the Audit Committee is in agreement with the specific types of services that the independent accountants will be permitted to perform.
The Fund Treasurer and/or Director of Board Administration shall report to the Audit Committee at each of its regular meetings regarding all Fund Services or Fund-related Adviser Services initiated since the last such report was rendered, including a general description of the services, actual billed and projected fees, and the means by which such Fund Services or Fund-related Adviser Services were pre-approved by the Audit Committee.
*****
(e)(2) The percentage of services described in paragraphs (b) through (d) of this Item approved pursuant to the “de minimis” exception under paragraph (c)(7)(i)(C) of Rule 2-01 of Regulation S-X during both fiscal years ended February 28, 2011 and February 28, 2010 was zero.
(f) Not applicable.
(g) The aggregate non-audit fees billed by the registrant’s accountant for services rendered to the registrant, and rendered to the registrant’s investment adviser (not including any sub-adviser whose role is primarily portfolio management and is
subcontracted with or overseen by another investment adviser), and any entity controlling, controlled by, or under common control with the adviser that provides ongoing services to the registrant for the fiscal years ended February 28, 2011 and February 28, 2010 are approximately as follows:
2011 | | 2010 | |
$ | 1,082,200 | | $ | 1,290,100 | |
| | | | | |
(h) The registrant’s Audit Committee of the Board of Directors has considered whether the provision of non-audit services that were rendered to the registrant’s adviser (not including any sub-adviser whose role is primarily portfolio management and is subcontracted with or overseen by another investment adviser), and any entity controlling, controlled by, or under common control with the investment adviser that provides ongoing services to the registrant that were not pre-approved pursuant to paragraph (c)(7)(ii) of Rule 2-01 of Regulation S-X, is compatible with maintaining the principal accountant’s independence.
Item 5. Audit Committee of Listed Registrants.
Not applicable.
Item 6. Investments
(a) The registrant’s “Schedule I — Investments in securities of unaffiliated issuers” (as set forth in 17 CFR 210.12-12) is included in Item 1 of this Form N-CSR.
(b) Not applicable.
Item 7. Disclosure of Proxy Voting Policies and Procedures for Closed-End Management Investment Companies.
Not applicable.
Item 8. Portfolio Managers of Closed-End Management Investment Companies.
Not applicable.
Item 9. Purchases of Equity Securities by Closed-End Management Investment Company and Affiliated Purchasers.
Not applicable.
Item 10. Submission of Matters to a Vote of Security Holders.
There were no material changes to the procedures by which shareholders may recommend nominees to the registrant’s board of directors.
Item 11. Controls and Procedures.
(a) The registrant’s principal executive officer and principal financial officers, based on their evaluation of the registrant’s disclosure controls and procedures as of a date within 90 days of the filing of this report, have concluded that such controls and procedures are adequately designed to ensure that material information required to be disclosed by the registrant in Form N-CSR is accumulated and communicated to the registrant’s management, including the principal executive officer and principal financial officer, or persons performing similar functions, as appropriate to allow timely decisions regarding required disclosure.
(b) There was no change in the registrant’s internal control over financial reporting that occurred during the registrant’s second fiscal quarter of the period covered by this report that has materially affected, or is reasonably likely to materially affect, the registrant’s internal control over financial reporting.
Item 12. Exhibits.
(a)(1) Code of ethics required to be disclosed under Item 2 of Form N-CSR attached hereto as Exhibit 99.CODE ETH.
(a)(2) Certifications pursuant to Rule 30a-2(a) under the Investment Company Act of 1940 (17 CFR 270.30a-2(a)) attached hereto as Exhibit 99.CERT.
(a)(3) Not applicable.
(b) Certification pursuant to Rule 30a-2(b) under the Investment Company Act of 1940 (17 CFR 270.30a-2(b)) attached hereto as Exhibit 99.906CERT.
SIGNATURES
Pursuant to the requirements of the Securities Exchange Act of 1934 and the Investment Company Act of 1940, the registrant has duly caused this report to be signed on its behalf by the undersigned, thereunto duly authorized.
(registrant) | | Columbia Funds Series Trust | |
| | |
| | |
By (Signature and Title) | /s/ J. Kevin Connaughton | |
| J. Kevin Connaughton, President | |
| | |
| | |
Date | | April 21, 2011 | |
| | | | |
Pursuant to the requirements of the Securities Exchange Act of 1934 and the Investment Company Act of 1940, this report has been signed below by the following persons on behalf of the registrant and in the capacities and on the dates indicated.
By (Signature and Title) | /s/ J. Kevin Connaughton | |
| J. Kevin Connaughton, President | |
| | |
| | |
Date | | April 21, 2011 | |
| | |
| | |
By (Signature and Title) | /s/ Michael G. Clarke | |
| Michael G. Clarke, Chief Financial Officer | |
| | |
| | |
Date | | April 21, 2011 | |